Table of Contents
UNITED STATES SECURITIES AND EXCHANGE COMMISSION
WASHINGTON, D.C. 20549
FORM 10-K
x | xANNUAL REPORT PURSUANT TO SECTION 13 OR 15(d) OF THE SECURITIES EXCHANGE ACT OF 1934
|
For the fiscal year ended December 31, 20062008
OR
o | oTRANSITION REPORT PURSUANT TO SECTION 13 OR 15(d) OF THE SECURITIES EXCHANGE ACT OF 1934
|
For the transition period from to
Commission File Number | | Registrant, State of Incorporation,
Address and Telephone Number | | I.R.S. Employer Identification No. |
| | | | |
1-9052 |
| DPL INC. |
| 31-1163136 |
| | (An Ohio Corporation) | | |
| | 1065 Woodman Drive Dayton, Ohio 45432 |
|
|
| | 937-224-6000 | | |
| | 1065 Woodman Drive
| | |
1-2385 | | Dayton, Ohio 45432
| | |
| | 937-224-6000
| | |
1-2385
|
| THE DAYTON POWER AND LIGHT COMPANY |
| 31-0258470 |
| | (An Ohio Corporation) |
|
|
| | 1065 Woodman Drive Dayton, Ohio 45432 |
|
|
| | 1065 Woodman Drive
| | |
| | Dayton, Ohio 45432
| | |
| | 937-224-6000 | | |
Each of the following classes or series of securities registered pursuant to Section 12 (b) of the Act is registered on the New York Stock Exchange:
Registrant | | Description |
DPL Inc. | | Common Stock, $0.01 par value and Preferred Share Purchase Rights |
|
|
|
The Dayton Power and Light Company | | None |
Securities registered pursuant to Section 12(g) of the Act: None
Indicate by check mark if each registrant is a well-known seasoned issuer, as defined in Rule 405 of the Securities Act.
DPL Inc. | | Yes x | No o |
The Dayton Power and Light Company | | Yes o | No x |
Indicate by check mark if each registrant is not required to file reports pursuant to Section 13 or Section 15(d) of the Exchange Act.
DPL IncInc. | | Yes o | No x |
The Dayton Power and Light Company | | Yes o | No x |
Indicate by check mark whether each registrant (1) has filed all reports required to be filed by Section 13 or 15(d) of the Securities Exchange Act of 1934 during the preceding 12 months (or for such shorter period that the registrant was required to file such reports), and (2) has been subject to such filing requirements for the past 90 days.
DPL Inc. | | Yes x | No o |
The Dayton Power and Light Company | | Yes x | No o |
Indicate by check mark if disclosure of delinquent filers pursuant to Item 405 of Regulation S-K is not contained herein, and will not be contained, to the best of each registrant’s knowledge, in definitive proxy or information statements incorporated by reference in Part III of this Form 10-K or any amendment to this Form 10-K.
DPL Inc. | | xo
|
The Dayton Power and Light Company | | xo
|
Indicate by check mark whether the registrant is a large accelerated filer, an accelerated filer, or a non-accelerated filer. See definition of “accelerated filer and large accelerated filer” in Rule 12b-2 of the Exchange Act.
| | Large acceleratedAccelerated filer | | Accelerated filer | Non-acceleratedNon-Accelerated filer
| Smaller reporting company |
DPL Inc. | | x | o | o | o |
The Dayton Power and Light Company | | o | | o | x | o |
Indicate by check mark whether each registrant is a shell company (as defined in Rule 12b-2 of the Exchange Act).
DPL Inc. | | Yes o | No x |
The Dayton Power and Light Company | | Yes o | No x |
The aggregate market value of DPL Inc.’s common stock held by non-affiliates of DPL Inc. as of June 30, 20062008 was approximately $3.1$3.0 billion based on a closing sale price of $26.80$26.38 on that date as reported on the New York Stock Exchange. All of the common stock of The Dayton Power and Light Company is owned by DPL Inc. As of February 22, 2007,24, 2009, each registrant had the following shares of common stock outstanding:
Registrant | | Description | | Shares Outstanding |
DPL Inc. | | Common Stock, $0.01 par value and Preferred Share Purchase Rights | | 113,101,211115,962,529
|
|
|
|
|
|
The Dayton Power and Light Company | | Common Stock, $0.01 par value | | 41,172,173 |
This combined Form 10-K is separately filed by DPL Inc. and The Dayton Power and Light Company. Information contained herein relating to any individual registrant is filed by such registrant on its own behalf. Each registrant makes no representation as to information relating to a registrant other than itself.
DOCUMENTS INCORPORATED BY REFERENCE
Portions of DPL’s definitive proxy statement for its 20072009 Annual Meeting of Shareholders are incorporated by reference in Part III of this Form 10-K.
Table of Contents
DPL Inc. and The Dayton Power and Light Company
Index to Annual Report on Form 10-K
Fiscal Year Ended December 31, 20062008
2
Table of Contents
PART I
Item 1 —- Business
This report includes the combined filing of DPL Inc. (DPL) and The Dayton Power and Light Company (DP&L). DP&L is the principal subsidiary of DPL providing approximately 99%98% of DPL’s total consolidated revenue and approximately 86%93% of DPL’s total consolidated asset base. Throughout this report the terms we, us, our and ours are used to refer to both DPL and DP&L, respectively and altogether, unless the context indicates otherwise. Discussions or areas of this report that apply only to DPL or DP&Lwill clearly be clearly noted in the section. Historically, DPL and DP&L have filed separate SEC filings. Beginning with this report and in the future, DPL Inc. and The Dayton Power and Light Company will file combined SEC reports on an interium and annual basis.
WEBSITE ACCESS TO REPORTS
DPL Inc. and The Dayton Power and Light CompanyDP&L file current, annual and quarterly reports proxy statement and other information required by the Securities Exchange Act of 1934, as amended, with the Securities and Exchange Commission (SEC). You may read and copy any document we file at the SEC’s public reference room located at 100 F Street N.E., Washington, D.C. 20549, USA. Please call the SEC at (800) SEC-0330 for further information on the public reference rooms. Our SEC filings are also available to the public from the SEC’s web sitewebsite at http://www.sec.gov.
Our public internet site is http://www.dplinc.com. We make available, free of charge, through our internet site, our annual reports on Form 10-K, quarterly reports on Form 10-Q, current reports on Form 8-K, and Forms 3, 4 and 5 filed on behalf of our directors and executive officers and amendments to those reports filed or furnished pursuant to the Securities Exchange Act of 1934, as amended, as soon as reasonably practicable after we electronically file such material with, or furnish it to, the SEC.
In addition, our public internet site includes other items related to corporate governance matters, including, among other things, our governance guidelines, charters of various committees of the Board of Directors and our code of business conduct and ethics applicable to all employees, officers and directors. You may obtain copies of these documents, free of charge, by sending a request, in writing, to DPL Investor Relations, 1065 Woodman Drive, Dayton, Ohio 45432.
ORGANIZATION
DPL Inc. (DPL)is a diversified regional energy company organized in 1985 under the laws of Ohio. Our executive offices are located at 1065 Woodman Drive, Dayton, Ohio 45432 -— telephone (937) 224-6000.
DPL’s principal subsidiary is The Dayton Power and Light Company (DP&L)DP&L. DP&L is a public utility incorporated in 1911 under the laws of Ohio. DP&L sells electricity to residential, commercial, industrial, and governmental customers in a 6,000 square mile area of West Central Ohio. Electricity for DP&L’s 24 county service area is primarily generated at eight coal-fired power plants and is distributed to more than 500,000515,000 retail customers.DP&L also purchases retail peak load requirements from DPL Energy, LLC (DPLE, one of DPL’s wholly-owned subsidiaries). Principal industries served include automotive, food processing, paper, plastic, manufacturing and defense. DP&L’s sales reflect the general economic conditions and seasonal weather patterns of the area. DP&L sells any excess energy and capacity into the wholesale market.DP&L also sells electricity to DPL Energy Resources, Inc. (DPLER), an affiliate, to satisfy the electric requirements of its retail customers.
DPL’s other significant subsidiaries (all of which are wholly-owned) include DPLE,include: DPL Energy, LLC (DPLE), which engages in the operation of peaking generating facilities; DPL Energy Resources, Inc. (DPLER),facilities and sells power in wholesale markets; DPLER, which sells retail electric energy under contract to major industrial and commercial customers in West Central Ohio; MVE, Inc., which was primarily responsible for the management of our financial asset portfolio; and Miami Valley Insurance Company (MVIC), which is our captive insurance company that provides insurance sources to us and our subsidiaries.
3
DP&L Table of Contentshas one significant subsidiary, DPL Finance Company, Inc., which is wholly-owned and provides financing to DPL, DP&L and other affiliated companies.
DPL and DP&L conduct their principal business in one business segment -— Electric.
Under the recently enacted Public Utility Holding Company Act of 2005, the Federal Energy Regulatory Commission (FERC) requires that utility holding companies comply with certain accounting, record retention and filing requirements. DPL believes it is exempt from these requirements because DP&L’s operations are confined to a single state. On January 31, 2006, DPL filed a FERC 65B Waiver Notification with the FERC, requesting that the FERC approve DPL’s waiver and avoid FERC regulation.
DPL, DP&L, and its subsidiaries employed 1,4521,588 persons as of January 31, 2007,30, 2009, of which 1,2031,365 were full-time employees and 249223 were part-time employees. Approximately 54% of our employees are under a collective bargaining agreement. During 2008, we negotiated a new three-year collective bargaining agreement with the covered employees. See Collective Bargaining Agreement below.
SIGNIFICANT DEVELOPMENTS
Credit Rating Upgrades
In early 2007 and during 2006, our
The rating agencies upgradedmaintained our corporatedebt credit and debt ratings.ratings but revised the outlook to positive. The following table outlines the rating and outlook of each company and the date of the upgrade:each outlook was revised:
| | DPL | | DP&L | | DateOutlook
|
| Effective |
| | | | | | | | |
Fitch Ratings | | BBBBBB+
| | AA+
| | Positive | | April 20062008 |
Moody’s Investors Service | | Baa3Baa2
| | A3A2
| | June 2006Positive
| | July 2008 |
Standard & Poor’s Corp. | | BBB- | | BBB+A-
| | February 2007Positive
| | April 2008 |
Peaking Unit Sales
In connection with DPLE’s (subsidiary of DPL) decision to sell the Greenville Station and Darby Station electric peaking generation facilities, DPL concluded that an impairment charge for the Greenville Station and Darby Station assets was required. During the fourth quarter of 2006, DPL recorded a $71.0 million impairment charge to record the write-down of the assets to fair market value and other associated costs related to the sales.
Pollution Control Bonds
On September 13, 2006, theNovember 15, 2007, The Ohio Air Quality Development Authority (OAQDA) issued $100$90 million of 4.80% fixed interestcollateralized, variable rate OAQDA Revenue Bonds, 20062007 Series A due SeptemberNovember 1, 2036.2040. In turn, DP&L then borrowed these funds from the OAQDA. The payment of principal and interest on the bonds when due was insured by an insurance policy issued by Financial Guaranty Insurance Company (FGIC). During the first quarter of 2008, all three credit rating agencies downgraded FGIC. These downgrades, as well as the downgrades of our major bond insurers, resulted in auction rate security bonds carrying substantially higher interest rates in succeeding auctions and incurring failed auctions. On April 4, 2008, DP&L converted the 2007 Series A Bonds from Auction Rate Securities to Variable Rate Demand Notes. At that time, DP&L purchased these notes out of the market and placed them with the Trustee to be held until the capital markets corrected. These notes were redeemed in December 2008 (see below).
On December 4, 2008, the OAQDA issued $100 million of collateralized, variable rate Revenue Refunding Bonds Series A and B due November 1, 2040. In turn, DP&L borrowed these funds from the OAQDA. The payment of principal and interest on the bonds when due is backed by a standby letter of credit issued by a syndicated bank group credit facility. DP&L is using the proceeds from this borrowing$10 million of these bonds to assist in financingfinance its portion of the costs of acquiring, constructing and installing certain solid waste disposal and air quality facilities at Miami Fort, Killen and Stuart Generating Stations.the Conesville generating station. The remaining $90 million was used to redeem the 2007 Series A Bonds. The above transactions are further discussed in Note 7 of Notes to Consolidated Financial Statements.
Share RepurchaseLong-Term Debt Redemption
DPL redeemed the $100 million 6.25% Senior Notes on their maturity date of DPL’s Common StockMay 15, 2008.
Ohio Senate Bill 221
On May 1, 2008, substitute Senate Bill 221 (SB 221), an Ohio electric energy bill, was signed by the Governor and went into effect July 31, 2008. Among other requirements, this new law contains annual targets relating to advanced energy portfolio standards, renewable energy, demand reduction, and energy efficiency standards. The bill is further discussed under Ohio Retail Rates in Item 1 — COMPETITION AND REGULATION below.
4
Table of Contents
Income Tax Settlement
On June 27, 2008, we entered into a $42 million settlement agreement with the Ohio Department of Taxation (ODT) resolving all outstanding audit issues and appeals, including uncertain tax positions for tax years 1998 through 2006. The $42 million payment was made to the ODT in July 2008. Due to this settlement agreement, the balance of our unrecognized state tax liabilities recorded at December 31, 2007, in the amount of $56.3 million, was reversed resulting in a recorded income tax benefit of $8.5 million, net of federal tax impact, in 2008. See Note 8 of Notes to Consolidated Financial Statements.
Clean Air Interstate Rule (CAIR) decision by the U.S. Court of Appeals for the District of Columbia Circuit
On July 27,11, 2008, the United States Court of Appeals for the District of Columbia Circuit issued a decision that vacated the U.S. Environmental Protection Agency’s (USEPA’s) Clean Air Interstate Rule (CAIR) and its associated Federal Implementation Plan. This decision remanded these issues back to the USEPA. The USEPA issued CAIR on March 10, 2005 to regulate certain upwind states with respect to fine particulate matter and ozone. CAIR created interstate trading programs for annual nitrogen oxide (NOX) emission allowances and made modifications to an existing trading program for sulfur dioxide (SO2) that were to take effect in 2010. The court’s decision, in part, invalidated the new NOx annual emission allowance trading program and the modifications to the SO2 emission trading program and created uncertainty regarding future NOx and SO2 emission reduction requirements and their timing. On December 23, 2008, the court reversed part of its decision that vacated CAIR. Thus, CAIR currently remains in effect, but the USEPA remains subject to the court’s order to revise the program.
DPL’sFGD Project Implementation
Installation and testing of flue gas desulfurization (FGD) equipment on all four units at the Stuart station was successfully completed by August 2008. This FGD equipment is currently in service.
Storm Costs
On September 14, 2008, the Midwest region was severely affected by hurricane-force winds which resulted in significant property damage and disruptions to the supply of electric energy to retail customers. Through December 31, 2008, we deferred approximately $13 million of incremental operation and maintenance costs associated with storm restoration efforts for that storm and other major storms in 2008. On December 31, 2008, DP&L Board authorizedfiled a request for an accounting order with the repurchasePublic Utilities Commission of upOhio (PUCO) seeking to $400defer these incremental costs. On January 14, 2009, the PUCO granted that authority.
Collective Bargaining Agreement
In August 2008, we began negotiations with employees covered under our collective bargaining agreement which expired October 31, 2008. On October 24, 2008, we reached an agreement with these employees on a new three-year labor agreement. This agreement was ratified by the covered employees on November 12, 2008.
Sales of Coal and Excess Emission Allowances
During 2008, DP&L sold coal and excess emission allowances to various counterparties realizing a total net gain of $118.2 million. This gain is recorded as a component of DP&L’s fuel costs and reflected in operating income.
Warrants Exercised
On September 18, 2008, Lehman Brothers Inc. exercised 12 millionDPL warrants under a cashless exercise transaction. Each warrant was exercisable for one share of DPL common stock, subject to anti-dilution adjustments (e.g., stock split, stock dividend) at an exercise price of $21.00 per common share. This exercise resulted in the issuance of 2.3 million shares of common stock from time to timeDPL’s shares held in the open market or through private transactions. DPL completed this share repurchase program through a series of open market purchases on August 21, 2006. This resulted in 14.9 million shares being repurchased at an average price of $26.91 per share and a total cost of $400 million. These shares are currently held as treasury shares at DPLInc.treasury.
Increase in Dividends on DPL’s Common Stock
On February 1, 2007,December 10, 2008, DPL’s Board of Directors announced that it had raisedauthorized a quarterly dividend rate increase of approximately 4%, increasing the quarterly dividend per DPL common share from $.275 to $0.26 per share payable March 1, 2007 to common shareholders of record on February 14, 2007. This$.285. If this increase results in anwere maintained, the annualized dividend rate of $1.04would increase from $1.10 per share or a 4% increase.to $1.14 per share.
5
Table of Contents
ELECTRIC SALES AND REVENUES
| | DPL Inc. | | DP&L (a) | |
| | 2006 | | 2005 | | 2004 | | 2006 | | 2005 | | 2004 | |
Electric Sales (millions in kWh) | | | | | | | | | | | | | |
Residential | | 5,218 | | 5,520 | | 5,140 | | 5,218 | | 5,520 | | 5,140 | |
Commercial | | 3,835 | | 3,901 | | 3,777 | | 3,835 | | 3,901 | | 3,777 | |
Industrial | | 4,286 | | 4,332 | | 4,393 | | 4,286 | | 4,332 | | 4,393 | |
Other retail | | 1,428 | | 1,437 | | 1,407 | | 1,428 | | 1,437 | | 1,407 | |
Total Retail | | 14,767 | | 15,190 | | 14,717 | | 14,767 | | 15,190 | | 14,717 | |
| | | | | | | | | | | | | |
Wholesale | | 3,651 | | 2,716 | | 3,748 | | 3,651 | | 2,716 | | 3,748 | |
| | | | | | | | | | | | | |
Total | | 18,418 | | 17,906 | | 18,465 | | 18,418 | | 17,906 | | 18,465 | |
| | | | | | | | | | | | | |
Operating Revenues ($ in thousands) | | | | | | | | | | | | | |
Residential | | $ | 490,514 | | $ | 478,226 | | $ | 449,411 | | $ | 490,514 | | $ | 478,226 | | $ | 449,411 | |
Commercial | | 300,908 | | 276,157 | | 267,831 | | 278,082 | | 247,912 | | 239,952 | |
Industrial | | 240,450 | | 220,453 | | 223,335 | | 130,119 | | 126,506 | | 128,059 | |
Other retail | | 88,307 | | 81,716 | | 80,370 | | 88,203 | | 81,877 | | 80,623 | |
Other miscellaneous revenues | | 11,174 | | 10,069 | | 15,863 | | 11,215 | | 10,317 | | 15,914 | |
Total Retail | | 1,131,353 | | 1,066,621 | | 1,036,810 | | 998,133 | | 944,838 | | 913,959 | |
| | | | | | | | | | | | | |
Wholesale | | 174,114 | | 133,283 | | 135,219 | | 309,885 | | 257,632 | | 260,341 | |
| | | | | | | | | | | | | |
RTO ancillary revenues | | 77,231 | | 74,419 | | 17,905 | | 77,231 | | 74,419 | | 17,905 | |
| | | | | | | | | | | | | |
Other revenues, net of fuel costs | | 10,821 | | 10,586 | | 10,054 | | — | | — | | — | |
| | | | | | | | | | | | | |
Total | | $ | 1,393,519 | | $ | 1,284,909 | | $ | 1,199,988 | | $ | 1,385,249 | | $ | 1,276,889 | | $ | 1,192,205 | |
| | | | | | | | | | | | | |
Electric Customers at End of Period | | | | | | | | | | | | | |
Residential | | 457,054 | | 456,146 | | 453,653 | | 457,054 | | 456,146 | | 453,653 | |
Commercial | | 49,284 | | 48,853 | | 48,172 | | 49,284 | | 48,853 | | 48,172 | |
Industrial | | 1,822 | | 1,837 | | 1,851 | | 1,822 | | 1,837 | | 1,851 | |
Other | | 6,349 | | 6,304 | | 6,337 | | 6,349 | | 6,304 | | 6,337 | |
| | | | | | | | | | | | | |
Total | | 514,509 | | 513,140 | | 510,013 | | 514,509 | | 513,140 | | 510,013 | |
| | DPL Inc. | | DP&L (a) | |
| | 2008 | | 2007 | | 2006 | | 2008 | | 2007 | | 2006 | |
Electric sales (millions of kWh) | | | | | | | | | | | | | |
Residential | | 5,533 | | 5,535 | | 5,218 | | 5,533 | | 5,535 | | 5,218 | |
Commercial | | 3,959 | | 3,990 | | 3,835 | | 3,959 | | 3,990 | | 3,835 | |
Industrial | | 3,986 | | 4,241 | | 4,286 | | 3,986 | | 4,241 | | 4,286 | |
Other retail | | 1,454 | | 1,468 | | 1,428 | | 1,454 | | 1,468 | | 1,428 | |
Total Retail | | 14,932 | | 15,234 | | 14,767 | | 14,932 | | 15,234 | | 14,767 | |
| | | | | | | | | | | | | |
Wholesale | | 2,240 | | 3,364 | | 3,651 | | 2,173 | | 3,364 | | 3,651 | |
| | | | | | | | | | | | | |
Total | | 17,172 | | 18,598 | | 18,418 | | 17,105 | | 18,598 | | 18,418 | |
| | | | | | | | | | | | | |
Operating revenues ($ in thousands) | | | | | | | | | | | | | |
Residential | | $ | 544,561 | | $ | 532,956 | | $ | 490,514 | | $ | 544,561 | | $ | 532,956 | | $ | 490,514 | |
Commercial | | 332,010 | | 321,051 | | 300,908 | | 308,934 | | 301,455 | | 278,082 | |
Industrial | | 240,041 | | 244,260 | | 240,450 | | 133,832 | | 132,359 | | 130,119 | |
Other retail | | 97,592 | | 94,568 | | 88,307 | | 78,905 | | 77,184 | | 88,203 | |
Other miscellaneous revenues | | 9,042 | | 13,340 | | 11,174 | | 9,046 | | 13,387 | | 11,215 | |
Total retail | | 1,223,246 | | 1,206,175 | | 1,131,353 | | 1,075,278 | | 1,057,341 | | 998,133 | |
| | | | | | | | | | | | | |
Wholesale | | 149,874 | | 180,254 | | 174,114 | | 293,500 | | 331,722 | | 309,885 | |
| | | | | | | | | | | | | |
RTO revenues | | 217,357 | | 118,389 | | 77,231 | | 204,074 | | 118,389 | | 77,231 | |
| | | | | | | | | | | | | |
Other revenues, net of fuel costs | | 11,080 | | 10,911 | | 10,821 | | — | | — | | — | |
| | | | | | | | | | | | | |
Total | | $ | 1,601,557 | | $ | 1,515,729 | | $ | 1,393,519 | | $ | 1,572,852 | | $ | 1,507,452 | | $ | 1,385,249 | |
| | | | | | | | | | | | | |
Electric customers at end of period | | | | | | | | | | | | | |
Residential | | 456,770 | | 456,989 | | 457,054 | | 456,770 | | 456,989 | | 457,054 | |
Commercial | | 50,190 | | 49,875 | | 49,284 | | 50,190 | | 49,875 | | 49,284 | |
Industrial | | 1,797 | | 1,818 | | 1,822 | | 1,797 | | 1,818 | | 1,822 | |
Other | | 6,517 | | 6,443 | | 6,349 | | 6,517 | | 6,443 | | 6,349 | |
| | | | | | | | | | | | | |
Total | | 515,274 | | 515,125 | | 514,509 | | 515,274 | | 515,125 | | 514,509 | |
(a)DP&L sells power to DPLER (a subsidiary of DPL)DPL). These sales are classified as wholesale on sales for DP&L’s financial statements &L and retail salesfor DPL.DPL. The kWh volumes contain all volumes distributed on the DP&L system which include the retail sales by DPLER. The sales for resale volumes are omitted to avoid duplicate reporting.
ELECTRIC OPERATIONS AND FUEL SUPPLY
| | 2006 Summer Generating Capacity | |
| | | | | | | |
(Amounts in MWs) | | Coal Fired | | Peaking Units | | Total | |
| | | | | | | |
DPL | | 2,860 | | 1,549 | (a) | 4,409 | |
| | | | | | | |
DP&L | | 2,860 | | 435 | | 3,295 | |
| | | | | | | |
| | 2008 Summer Generating Capacity | |
| | | | | | | |
(Amounts in MWs) | | Coal Fired | | Peaking Units | | Total | |
| | | | | | | |
DPL | | 2,778 | | 919 | | 3,697 | |
| | | | | | | |
DP&L | | 2,778 | | 435 | | 3,213 | |
| | | | | | | |
(a) Amounts include 630 MW of peaking capacity relating to the Darby and Greenville stations
that DPL entered into agreements to sell during the fourth quarter of 2006.
DPL’s present summer generating capacity, including Peaking Units,peaking units, is approximately 4,4093,697 MW. Of this capacity, approximately 2,8602,778 MW, or 65%75%, is derived from coal-fired steam generating stations and the balance of approximately 1,549919 MW, or 35%25%, consists of combustion turbine and diesel peaking units.
DP&L’s present summer generating capacity, including Peaking Units,peaking units, is approximately 3,2953,213 MW. Of this capacity, approximately 2,8602,778 MW, or 87%86%, is derived from coal-fired steam generating stations and the balance of approximately 435 MW, or 13%14%, consists of combustion turbine and diesel peaking units.
Combustion turbine output is dependent on ambient conditions and is higher in the winter than in the summer. Our all-time net peak load was 3,2433,270 MW, occurring July 25, 2005.August 8, 2007.
6
Table of Contents
Approximately 87%89% of the existing steam generating capacity is provided by certain generating units owned as tenants in common with (Duke Energy)Duke Energy-Ohio (or its subsidiaries The Cincinnati Gas & Electric Company (CG&E)[CG&E], or its subsidiary, Union Heat, Light & Power,Power) and (AEP)AEP (or its subsidiary Columbus Southern Power Company (CSP)[CSP]). As tenants in common, each company owns a specified undivided share of each of these units, is entitled to its share of capacity and energy output, and has a capital and operating cost responsibility proportionate to its ownership share. DP&L’s remaining steam generating capacity (approximately 365301 MW) is derived from a generating station owned solely by DP&L. Additionally, DP&L, CG&E and CSP own, as tenants in common, 884 circuit miles of 345,000-volt transmission lines. DP&L has several interconnections with other companies for the purchase, sale and interchange of electricity.
In 2006,2008, we generated 99%99.4% of our electric output from coal-fired units and 1%0.6% from oil and natural gas-fired units.
The following table sets forth DP&L’s and DPLE’s generating stations and, where indicated, those stations which DP&L owns as tenants in common.
| | | | | | | | Approximate Summer | |
| | | | | | | | MW Rating | |
Station | | Ownership* | | Operating
Company | | Location | | DPL
Portion | | Total | |
Coal Units | | | | | | | | | | | |
Hutchings | | W | | DP&L | | Miamisburg, OH | | 365 | | 365 | |
Killen | | C | | DP&L | | Wrightsville, OH | | 412 | | 615 | |
Stuart | | C | | DP&L | | Aberdeen, OH | | 836 | | 2,388 | |
Conesville-Unit 4 | | C | | CSP | | Conesville, OH | | 129 | | 780 | |
Beckjord-Unit 6 | | C | | CG&E | | New Richmond, OH | | 207 | | 414 | |
Miami Fort-Units 7 & 8 | | C | | CG&E | | North Bend, OH | | 360 | | 1,000 | |
East Bend-Unit 2 | | C | | CG&E | | Rabbit Hash, KY | | 186 | | 600 | |
Zimmer | | C | | CG&E | | Moscow, OH | | 365 | | 1,300 | |
| | | | | | | | | | | |
Combustion Turbines or Diesel | | | | | | | | | | | |
Hutchings | | W | | DP&L | | Miamisburg, OH | | 23 | | 23 | |
Yankee Street | | W | | DP&L | | Centerville, OH | | 107 | | 107 | |
Monument | | W | | DP&L | | Dayton, OH | | 12 | | 12 | |
Tait Diesels | | W | | DP&L | | Dayton, OH | | 10 | | 10 | |
Sidney | | W | | DP&L | | Sidney, OH | | 12 | | 12 | |
Tait Units 1-3 | | W | | DP&L | | Moraine, OH | | 256 | | 256 | |
Killen | | C | | DP&L | | Wrightsville, OH | | 12 | | 18 | |
Stuart | | C | | DP&L | | Aberdeen, OH | | 3 | | 10 | |
Greenville Units 1-4 (a) | | W | | DPLE | | Greenville, OH | | 192 | | 192 | |
Darby Station Units 1-6 (a) | | W | | DPLE | | Darby, OH | | 438 | | 438 | |
Montpelier Units 1-4 | | W | | DPLE | | Montpelier, IN | | 192 | | 192 | |
Tait Units 4-7 | | W | | DPLE | | Moraine, OH | | 292 | | 292 | |
Total approximate summer generating capacity | | | | | | | | 4,409 | | 9,024 | |
| | | | | | | | Approximate Summer | |
| | | | | | | | MW Rating | |
Station | | Ownership* | | Operating Company | | Location | | DPL Portion | | Total | |
Coal Units | | | | | | | | | | | |
Hutchings | | W | | DP&L | | Miamisburg, OH | | 301 | | 301 | |
Killen | | C | | DP&L | | Wrightsville, OH | | 402 | | 600 | |
Stuart | | C | | DP&L | | Aberdeen, OH | | 820 | | 2,340 | |
Conesville-Unit 4 | | C | | CSP | | Conesville, OH | | 129 | | 780 | |
Beckjord-Unit 6 | | C | | CG&E | | New Richmond, OH | | 207 | | 414 | |
Miami Fort-Units 7 & 8 | | C | | CG&E | | North Bend, OH | | 368 | | 1,020 | |
East Bend-Unit 2 | | C | | CG&E | | Rabbit Hash, KY | | 186 | | 600 | |
Zimmer | | C | | CG&E | | Moscow, OH | | 365 | | 1,300 | |
| | | | | | | | | | | |
Combustion Turbines or Diesel | | | | | | | | | | | |
Hutchings | | W | | DP&L | | Miamisburg, OH | | 23 | | 23 | |
Yankee Street | | W | | DP&L | | Centerville, OH | �� | 107 | | 107 | |
Monument | | W | | DP&L | | Dayton, OH | | 12 | | 12 | |
Tait Diesels | | W | | DP&L | | Dayton, OH | | 10 | | 10 | |
Sidney | | W | | DP&L | | Sidney, OH | | 12 | | 12 | |
Tait Units 1-3 | | W | | DP&L | | Moraine, OH | | 256 | | 256 | |
Killen | | C | | DP&L | | Wrightsville, OH | | 12 | | 18 | |
Stuart | | C | | DP&L | | Aberdeen, OH | | 3 | | 10 | |
Montpelier Units 1-4 | | W | | DPLE | | Montpelier, IN | | 192 | | 192 | |
Tait Units 4-7 | | W | | DPLE | | Moraine, OH | | 292 | | 292 | |
Total approximate summer generating capacity | | | | | | | | 3,697 | | 8,287 | |
*W | = Wholly-Owned |
C | = Commonly-Owned |
C = Commonly-Owned
(a) Amounts include 630 MW of peaking capacity relatingIn addition to the Darbyabove, DP&L also owns a 4.9% equity ownership interest in Ohio Valley Electric Corporation (OVEC), an electric generating company. OVEC has two plants in Cheshire, Ohio and Greenville stations
that Madison, Indiana with a combined generation capacity of approximately 2,265 MW. DP&L’s share of this generation capacity is approximately 111 MW.
DPL entered into agreements to sell during the fourth quarter of 2006.
We havehas substantially all of the total expected coal volume needed to meet ourits retail and firm wholesale sales requirements for 20072009 under contract. The majority of ourthe contracted coal is purchased at fixed prices. Some contracts provide for periodic adjustments and some are priced based on market indices. Substantially all contracts have features that limit price escalations in any given year. Fuel costs are impacted by changes in volume and price and are driven by a number of variables including weather, the wholesale market price of power, certain provisions in coal contracts related to government imposed costs, counterparty performance and credit, scheduled outages, and generation plant mix. Based on higher volume and price, fuel costs excluding gains from the sale of emission allowances are forecasted to be 25% to 35% higher in 2009 compared to 2008.
7
Table of Contents
Our sulfur dioxide (SO2)emission allowance consumption will bewas reduced in 20072008 due to the installation of flue gas desulfurization equipment (scrubbers) at the Killen and J.M. Stuart electric generating stations. Due to the installation of this emission control equipment at a portion ofand barring any changes in the Companies’ generation facilities. We do notregulatory environment in which we operate, we expect to purchase SO2 allowances for 2007. The exact consumption of SO2 allowances will depend on market prices for power, availabilityhave emission allowance inventory in excess of our generating units, the timing of FGD (flu gas desulfurization) completionneeds, which we plan to sell during 2009 and the actual sulfur content of the coal burned.in future periods. We did not purchase SO2 allowances or NOX allowances during 2008, nor do notwe plan to purchase any nitrogen oxide (NOxin 2009.) allowances for 2007.
The gross average cost of fuel usedconsumed per kilowatt-hour (kWh) was as follows:
| | Average Cost of Fuel Used (¢/kWh) | | |
| | | | | | | | | Average Cost of Fuel Consumed (¢/kWh) |
| | 2006 | | 2005 | | 2004 | | | 2008 | | 2007 | | 2006 |
| | | | | | | | | | | | | |
DPL | | 2.00 | | 1.93 | | 1.56 | | | 2.28 | | 1.97 | | 2.00 |
| | | | | | | | | | | | | |
DP&L | | 1.94 | | 1.84 | | 1.53 | | | 2.22 | | 1.91 | | 1.94 |
| | | | | | | | |
SEASONALITY
The power generation and delivery business is seasonal and weather patterns have a material impact on operating performance. In the region served by our subsidiaries,we serve, demand for electricity is generally greater in the summer months associated with cooling and in the winter months associated with heating as compared to other times of the year. Historically, theour power generation and delivery operations of our subsidiaries have generated less revenue and income when weather conditions are warmer in the winter and cooler in the summer.
RATE REGULATION AND GOVERNMENT LEGISLATION
DP&L’s sales to retail customers are subject to rate regulation by the Public Utilities Commission of Ohio (PUCO).PUCO. DP&L’s transmission rates and wholesale electric rates to municipal corporations, rural electric co-operatives and other distributors of electric energy are subject to regulation by the Federal Energy Regulatory Commission (FERC) under the Federal Power Act.
Ohio law establishes the process for determining retail rates charged by public utilities. Regulation of retail rates encompasses the timing of applications, the effective date of rate increases, the costrecoverable costs basis upon which the rates are based and other related matters. Ohio law also established the Office of the Ohio Consumers’ Counsel (OCC), which has the authority to represent residential consumers in state and federal judicial and administrative rate proceedings.
Ohio legislation extends the jurisdiction of the PUCO to the records and accounts of certain public utility holding company systems, including DPL. The legislation extends the PUCO’s supervisory powers to a holding company system’s general condition and capitalization, among other matters, to the extent that they relate to the costs associated with the provision of public utility service. Based on existing PUCO and FERC authorization, regulatory assets and liabilities are recorded on the Consolidated Balance Sheets.consolidated balance sheets. See Note 3 of Notes to Consolidated Financial Statements.
COMPETITION AND REGULATION
Ohio Matters
Ohio Retail Rates
Since January 2001, DP&L’s electric customers have been permitted to choose their retail electric generation supplier. DP&L continues to have the exclusive right to provide delivery service in its state certified territory.territory and the obligation to supply retail generation service to customers that do not choose an alternative supplier. The PUCO maintains jurisdiction over DP&L’s delivery of electricity, standard service offer, and other retail electric services.
8
Table of Contents
On May 1, 2008, substitute Senate Bill 221 (SB 221), an Ohio electric energy bill, was signed by the Governor and went into effect July 31, 2008. This new law states that all Ohio distribution utilities must file either an electric security plan or a market rate option to be in effect January 1, 2009. Under the market rate option, a periodic competitive bid process will set the retail generation price after the utility demonstrates that it can meet certain market criteria and bid requirements set out in the bill. Also, under this option, utilities that still own generation in the state are required to phase in the market rate option over a period of not less than five years. An electric security plan may allow for adjustments to the standard offer supplyfor costs associated with environmental compliance; fuel and purchased power; construction of new or investment in specified generating facilities; and the provision of standby and default service, operating, maintenance, or other costs including taxes. As part of its electric security plan, the utility is permitted to file an infrastructure improvement plan that customers receive if theywill specify the initiatives the utility will take to rebuild, upgrade, or replace its electric distribution system, including cost recovery mechanisms. Both the market rate option and electric security plan option involve a “substantially excessive earnings” test based on the earnings of other companies with similar business and financial risks. The PUCO issued three sets of rules related to implementation of the new law. These rules address topics such as the information that must be included in an electric security plan as well as a market rate option, the significantly excessive earnings test requirements, corporate separation revisions, rules relating to the recovery of transmission and ancillary service costs, electric service and safety standards dealing with the statewide line extension policy, and rules relating to advanced energy portfolio standards, renewable energy, demand reduction and energy efficiency standards.
SB 221 and the implementation rules contain targets relating to advanced energy portfolio standards, renewable energy, demand reduction, and energy efficiency standards. The standards require that, by the year 2025, 25% of the total number of kilowatt hours of electricity sold by the utility to retail electric consumers must come from alternative energy resources, which include “advanced energy resources” such as distributed generation, clean coal, advanced nuclear, energy efficiency, and fuel cell technology; and “renewable energy resources” such as solar, hydro, wind, geothermal, and biomass. At least half of the 25% must be generated from renewable energy resources, including 0.5% from solar energy. The advanced energy portfolio and energy efficiency standards begin in 2009 with increases in required percentages each year. SB 221 and the implementation rules do not chooseinclude interim annual targets for energy efficiency and peak demand reductions, but require that energy efficiency programs save 22.3% compared to a baseline energy usage by 2025 and that peak demand reductions reach 7.75% by 2018. If any targets are not met, compliance penalties will apply.
DP&L provided comments on the rules as did many other interested parties. While the overall financial impact of this bill will not be known for some time, implementation of the bill and compliance with its requirements could have a material impact on our financial condition.
In compliance with SB 221, DP&L filed its electric security plan at the PUCO on October 10, 2008. This plan contained three parts: 1) a standard offer plan; 2) a customer conservation and energy management plan; and 3) an alternative retail electricity supplier,energy plan. The standard offer plan stated that DP&L intends to maintain its current rate plan through December 31, 2010, and over otheraddressed compliance issues related to the PUCO rules.
On February 24, 2009, DP&L filed a Stipulation and Recommendation (the Stipulation) signed by the Staff of the PUCO, the Office of the Ohio Consumers’ Counsel and various intervening parties. The material terms agreed to under the Stipulation include the following:
·DP&L’s current rate plan will be extended through 2012.
·DP&L will be permitted to implement a fuel and purchased power recovery mechanism beginning January 1, 2010 which will track and adjust fuel and purchased power costs on a quarterly basis.
· The rate stabilization surcharge remains a non-bypassable provider of last resort charge at its current rate amount, but may be bypassable by customers served by a government aggregator beginning 2011.
· The last phase of the environmental investment rider increase will occur in 2010 as previously approved by the PUCO and thereafter will remain at that level through 2012.
·DP&L’s base distribution and generation rates and chargeswill be frozen through 2012.
·DP&L may seek recovery of certain cost increases such as storm damage expenses, regulatory or tax changes, costs associated with new climate change or carbon regulations, certain costs associated with the market development period that began January 2001.operation of the Hutchings station, costs associated with transmission cost recovery rider (TCRR), and Regional Transmission Organization costs not covered by the TCRR.
In 2003,· The significantly excessive earnings test will not apply to DP&L until 2012.
·DP&L will be permitted to begin its energy efficiency and demand response programs immediately with recovery scheduled to begin in 2009, with a two year reconciliation. DP&L’s smart grid deployment initiative will be revised and resubmitted to the PUCO for approval by September 2009 with the anticipation that the plans and recovery will begin January 1, 2010 also with a two year reconciliation.
·DP&L’s proposed alternative energy plans will be approved aand recovery of these costs will begin in 2009 with an annual reconciliation.
· Mercantile (large use) customers can obtain exemption from the energy efficiency rider if self-directed energy and demand programs generate reductions equal to or greater than DP&L’s energy and demand reduction benchmarks.
The Stipulation executedmay be approved, modified or rejected by DP&L and other parties that extended the market development period throughPUCO. A final decision from the PUCO regarding the Stipulation is expected by the end of 2005,the second quarter of 2009.
As a member of PJM, DP&L is subject to charges and included provisions that generation rates may be modified as of January 1, 2006, by up to 11% of generation rates to reflect increased costs associated with fuel, environmental compliance, taxes, regulatory changes,PJM operations as approved by the FERC. FERC Orders issued in 2007 regarding the allocation of costs of large transmission facilities within PJM, could result in additional costs being allocated to DP&L of approximately $12 million or more annually by 2012. DP&L filed a notice of appeal to the U.S. Court of Appeals, D.C. Circuit on March 18, 2008. The appeal has been consolidated with other appeals taken by other interested parties of the same FERC Orders and security measures. In 2006, the Ohio Supreme Court affirmedconsolidated cases have been assigned to the PUCO’s Order approving7th Circuit. The Company cannot predict the Stipulation.
outcome or timing of a decision on the appeals. On April 4, 2005,November 7, 2008, DP&L filed a request at the PUCO for authority to implement a new rate stabilization surcharge effective January 1, 2006 to recover cost increases associated with environmental capital, related operations and maintenance costs and fuel expenses. On November 3, 2005, DP&L entered into a settlement agreement that extended DP&L’s rate stabilization period through December 31, 2010. During this time, DP&L will continue to provide retail electric service at fixed rates with the ability to recover increased fuel and environmental costs through surcharges and riders. Specifically, the agreement provides for:
· A rate stabilization surcharge equal to 11% of generation rates beginning January 1, 2006 and continuing through December 2010. Based on 2004 sales, this rider is expected to result in approximately $65 million in net revenues per year.
· A new environmental investment rider to begin January 1, 2007 equal to 5.4% of generation rates, with incremental increases equal to 5.4% each year through 2010. Based on 2004 sales, this rider is expected to result in approximately $35 million in annual net revenues beginning January 2007, growing to approximately $140 million by 2010.
· An increase to the residential generation discount from January 1, 2006 through December 31, 2008, which is expected to result in a revenue decrease of approximately $7 million per year for three years, based on 2004 sales. The residential discount is accounted for in the $65 million net revenue stated above will expire on December 31, 2008.
On December 28, 2005, the PUCO adopted the settlement with certain modifications (RSS Stipulation). The PUCO ruled that the environmental rider will be bypassable by all customers who take service from alternate generation suppliers. Thus, future additional revenues are dependent upon actual sales and levels of customer switching. Applications for rehearing were denied and the case was appealed to the Ohio Supreme Court by the Ohio Consumers’ Counsel on April 21, 2006. The Company cannot predict whether the Ohio Supreme Court will affirm the PUCO’s approval of the RSS Stipulation, affirm it in part subject to modifications, or reject it. An oral argument has been set for April 17, 2007.
Consistent with the RSS Stipulation approved by the PUCO and prior orders, DP&L made a tariff filing to implement the environmental investment rider beginning January 1, 2007, which was approved by the PUCO in November 2006.
In 2005, DP&L made a tariff filing to recover previously deferreddefer costs associated with administrative fees charged totransmission, capacity, ancillary service and other PJM related charges incurred as a member of PJM. DP&L under PJM’s FERC-approved tariffs. In January 2006, the PUCO approved the recovery, effective February 1, 2006, which should result in approximately $8.5 million in additional revenue per year for three years and $6.0 million per year thereafter.
In March 2006, the PUCO approved thesought deferral until such time as it files to seek recovery of these costs and carrying costs associated with billing system changes made to permit DP&L to provide billing services to Competitive Retail Electric Service (CRES) providers. These costs had previously been deferred for later recovery under a settlement approved in 2004. In separate orders issued in September and December 2006, the Ohio Supreme Court affirmed the PUCO orders approving the settlement and approving the recovery of costs. This will result in approximately $7 million in additional annual revenue beginning March 2006 through 2010.
from retail ratepayers. On September 1, 2005, DP&L requested the PUCO authority to recover distribution costs associated with storm restoration efforts for ice storms that took place in December 2004 and January 2005. In February 2006, DP&L
filed updated schedules in support of its application. On July 12, 2006,19, 2009, the PUCO approved DP&L’s request to defer these costs. DP&L anticipates filing allowinga request with the CompanyPUCO before the end of April 2009 seeking to recover approximately $8.6 million in additional revenues over a two-year period. See Note 3 of Notes to Consolidated Financial Statements.these costs.
Ohio Competitive Considerations and Proceedings
As of December 31, 2006,2008, four unaffiliated marketers were registered as CRESCompetitive Retail Electric Service (CRES) providers in DP&L’s service territory. While there has been some customer switching to date,associated with unaffiliated marketers, it representsrepresented less than 0.15 percent0.12% of sales in 2006.2008. DPLER, an affiliated company, is also a registered CRES provider and accounted for 99.8%99.4% of the total kWh supplied by CRES providers within DP&L’s service territory in 2006.2008. In addition, several communities in DP&L’s service area have passed ordinances allowing the communities to become government aggregators for the purpose of offering alternative electric generation supplies to their citizens. To date, none of these communities have aggregated their generation load.
DP&L agreed to implement a Voluntary Enrollment Program (VEP) that would provide customers with an option to choose a competitive supplier to provide their retail generation service should switching not reach 20% in each customer class. The 20% threshold has never been reached. In both 2005 and 2006, customers who elected to participate in the program were grouped together and collectively bid out to CRES providers. No bids were received in either year resulting in zero customer switching under the program. DP&L is required to execute the same process again in 2007. Future period effects cannot be determined at this time.
9
In AugustTable of 2006, an electric supply contract with Wright Patterson Air Force Base (WPAFB) expired. WPAFB is DP&L’s single largest retail customer and represents approximately 1% of its annual revenues. In November 2006, WPAFB signed a long-term agreement to allow DPLER to supply competitive generation service to WPAFB through 2010.Contents
On February 20, 2003, the PUCO requested comments from interested stakeholders on the proposed rules for the conduct of a competitive bidding process that will take place at the end of the rate stabilization period. DP&L submitted comments in March 2003. The PUCO issued final rules on December 23, 2003. Under DP&L’s RSS Stipulation discussed above, these rules will not affect DP&L until January 1, 2011. However, the PUCO retains the authority to, at any time, require an Ohio electric utility to conduct a competitive bidding process to measure the market price of competitive retail generation.
Other State Regulatory Proceedings
On August 28, 2006, the Staff of the PUCO issued a report relating to compliance with the Federal Energy Policy of 2005. In that report the Staff makes recommendations to the Commission to implement new rules and procedures relating to net metering, customer generator interconnection, stand by power, time-of-use rates, and renewable energy portfolio standards. DP&L, among others, filed comments on September 18, 2006, and reply comments on October 2, 2006. If adopted by the Commission, the Staff’s recommendations may result in new regulatory requirements for Ohio investor owned utilities related to renewable energy standards, fuel sources, automated meter infrastructure and time differentiated rate options for customers. DP&L cannot predict the outcome of this proceeding nor the potential cost that may be associated with any new regulations that may be adopted.
Federal Matters
Like other electric utilities and energy marketers, DP&L and DPLE may sell or purchase electric products on the wholesale market. DP&L and DPLE compete with other generators, power marketers, privately and municipally-owned electric utilities and rural electric cooperatives when selling electricity. The ability of DP&L and DPLE to sell this electricity will depend on how DP&L’s and DPLE’s price, terms and conditions compare to those of other suppliers.
As part of Ohio’s electric deregulation law, all of the state’s investor-owned utilities are required to join a Regional Transmission Organization (RTO). In October 2004, DP&L successfully integrated its 1,000 miles of high-voltage transmission into the PJM Interconnection, L.L.C. (PJM) RTO. The role of the RTO is to administer an electric marketplace and ensure reliability of the transmission grid. PJM ensures the reliability of the high-voltage electric power system serving 51 million people in all or parts of Delaware, Illinois, Indiana, Kentucky, Maryland, Michigan, New Jersey, North Carolina, Ohio, Pennsylvania, Tennessee, Virginia, West Virginia and the District of Columbia. PJM coordinates and directs the operation of the region’s transmission grid, administers the world’s
largest competitive wholesale electricity market and plans regional transmission expansion improvements to maintain grid reliability and relieve congestion.
As a member of PJM, DP&L is subject to charges and costs associated with PJM operations as approved by the FERC. As discussed above in connection with the recovery of such costs in retail rates, these include significant administrative charges. Additionally, PJM’s role in administering the regional transmission grid and planning regional transmission expansion improvements results in periodic proposals by PJM and other stakeholder members of PJM to the FERC to allocate and charge costs associated with the transmission system to various entities operating within PJM including DP&L. DP&L and other interested parties have the right to intervene and offer counter-proposals. The FERC is currently considering how to allocate costs associated with new planned transmission facilities. None of these costs were allocated to DP&L under PJM’s original filing in the case, but other parties have proposed modified allocation methods that could result in allocations to DP&L. The FERC is also considering the justness and reasonableness of PJM’s transmission rate design for existing facilities. DP&L, along with ten other transmission owners, filed in support of PJM’s existing rate design, but other participants have proposed rate designs that would shift significant costs to DP&L. Due to complexity of the issues and the number of competing proposals under consideration, DP&L cannot determine what effect the final outcome of this proceeding may have on its costs or the extent to which it may be able to recover such costs.
PJAs a member of PJM,M, the value of DPL’sDP&L’s generation capacity will beis affected by changes in and the clearing results of the PJM capacity construct.market. The new construct introducesmarket utilizes a new Reliability Pricing Model (RPM) that will changechanges the way generation capacity is priced and planned for by PJM. In September 2006, DP&L, along with mostPJM held a series of capacity auctions, the results of which have not had a material impact on our results of operations, financial position or cash flows. The FERC decisions establishing RPM have been appealed by various entities to a Federal appeals court. RPM remains in effect pending the outcome of the parties relating to the case, entered into a settlement agreement that generally retains the RPM concept as proposed by PJM, with certain modifications. The settlement was approved by the FERC on December 21, 2006. The economic effects of the new capacity market will vary depending on present and projected market conditions.appeal.
In connection with DP&L and other utilities joining PJM, the FERC ordered utilities to eliminate certain charges to implement transitional payments, known as Seams Elimination Charge Adjustment (SECA), effective December 1, 2004 through March 31, 2006, subject to refund. Through this proceeding, DP&L was obligated to pay SECA charges to other utilities, but received a net benefit from these transitional payments. Several parties have sought rehearing has intervened in support of the FERC orders, which are still pending. The hearing was held in decisions. On March 19, 2008, a large coalition of consumers filed a motion to request a FERC Technical Conference to evaluate whether the RPM market is performing as expected, and proposed that the RPM market structure should be modified or replaced. In a related but separate action, many of the same group of consumers filed a complaint, on May 2006 and an initial decision was issued on August 10, 200630, 2008, alleging that if upheld by the Commission, would reduce the amount of SECA charges DP&Lbidding approaches and other actions taken by unspecified market participants have resulted in unjust and unreasonable allocation of costs of $26 billion across PJM. On September 18, 2008, FERC dismissed the complaint, but directed PJM and its stakeholders to evaluate the design of the RPM with the intention of making changes on a prospective basis. After numerous stakeholder meetings failed to result in a consensus, PJM filed on December 12, 2008 to modify certain RPM rules and requested FERC to initiate a formal settlement proceeding. FERC held four settlement conferences in January 2009; however, on January 15, 2009, the settlement judge recommended the process be terminated as the parties are permitted to recover. DP&L, among others, have taken exceptionhad reached an impasse. Certain parties, including PJM, may make partial or contested settlement proposals. A FERC ruling on PJM’s latest tariff filing proposing changes to the initial decision. A final Commission order on this issueRPM rules remains pending. DP&L is still pending. We have entered into a significant number of bi-lateral settlement agreements with certain partiesunable to resolve the matter, which by design will be unaffected by the Commission’s decision to affirm, modify or reject the initial decision. DP&L management believes that appropriate reserves have been establishedpredict any potential changes in the eventPJM capacity market that SECA collections not resolved by settlement are required to be refunded. The ultimate outcome of the proceeding establishing SECA rates is uncertain at this time. However, based on the amount of reserves established for this item, the results of this proceeding are not expected to have a material adverse effect on DP&L’s results of operations.may result from these proceedings.
On August 8, 2005, the Energy Policy Act of 2005 (the 2005 Act) was enacted. This new law encompasses several areas including, but not limited to: electric reliability, repeal of the Public Utility Holding Company Act of 1935, promotion of energy infrastructure, preservation of a diverse fuel supply for electricity generation and energy efficiency. Also in response to the Energy Policy Act of 2005, the FERC issued a Notice of Proposed Rulemaking to amend its regulations to incorporate the criteria any entity must satisfy to qualify to be an Electric Reliability Organization (ERO) that will propose and enforce reliability standards subject to FERC approval. The proposed rule also included related matters on delegating ERO authority, the creation of advisory bodies and reporting requirements. In October 2006, the FERC also approved new mandatory reliability standards to be effective mid-2007, with requirements applying to certain assets and activities of DP&L and DPL. The new regulations include potential penalties for failure to comply with these standards. DPL is currently assessing the compliance plans in place to comply with similar, but voluntary, reliability standards administered by the North American Electric Reliability Council and believes that it will be in full compliance with the new mandatory standards when they become effective.
DP&L provides transmission and wholesale electric service to twelve municipal customers in its service territory, which in turn distribute electricity principally within their incorporated limits. DP&L also maintains an interconnection agreement with one municipality that has the capability to generate a portion of its own energy requirements. Approximately 1%one percent of total electricity sales in 20062008 represented sales to these municipalities.
10
Table of Contents
In April 2008, DPL was notified that the IRS would audit its 2005 and 2006 federal income tax returns. That IRS audit has commenced and, at this time, DPL cannot determine the outcome of the audit.
We have been informed that we will be subject to a routine audit beginning in June 2009 by the North American Electric Reliability Corporation (NERC). NERC is the FERC-certified electric reliability organization responsible for developing and enforcing mandatory reliability standards.
ENVIRONMENTAL CONSIDERATIONS
DPL, DP&L and our subsidiaries’ facilities and operations are subject to a wide range of environmental regulations and laws.laws by federal, state and local authorities. The environmental issues that may impact us include:
· The Federal Clean Air Act (CAA) and state laws and regulations (including State Implementation Plans) which require compliance, obtaining permits and reporting as to air emissions.
· Litigation with federal and certain state governments and certain special interest groups regarding whether modifications to or maintenance of certain coal-fired generating plants require additional permitting or pollution control technology, and/or whether emissions from coal-fired generating plants cause or contribute to global climate changes.
· Rules issued by the United States Environmental Protection Agency (USEPA) and Ohio Environmental Protection Agency (Ohio EPA) that require substantial reductions in SO2, particulates, mercury and NOX emissions. DPL is installing (and has installed) emission control technology and is taking other measures to comply with required reductions.
· The Federal Clean Water Act (FCWA), which prohibits the discharge of pollutants into waters of the United States except pursuant to appropriate permits. In July 2004, the USEPA adopted a new Clean Water Act rule to reduce the number of fish and other aquatic organisms affected by cooling water intakes at power plants.
· Solid and hazardous waste laws and regulations, which govern the management and disposal of certain waste. The majority of solid waste created from the combustion of coal and fossil fuels is fly ash and other coal combustion by-products, which the EPA has determined are not hazardous waste subject to the Resource Conservation and Recovery Act (RCRA).
As well as imposing continuing compliance obligations, these laws and regulations authorize the imposition of substantial penalties for noncompliance, including fines, injunctive relief and other sanctions. In the normal course of business, we have investigatory and remedial activities underway at these facilities to comply, or to determine compliance, with such regulations. We record liabilities for probable estimated loss in accordance with Statement of Financial Accounting Standards No. 5 (SFAS 5), “Accounting for Contingencies.Contingencies,” To the extent a probable loss can only be estimated by referenceas discussed in Note 1 of Notes to a range of equally probable outcomes, and no amount within the range appears to be a better estimate than any other amount, we accrue for the low end of the range. Because of uncertainties related to these matters, accruals are based on the best information available at the time.Consolidated Financial Statements. DPL,through its wholly-owned captive insurance subsidiary MVIC, has an actuarialactuarially calculated reserve for environmental matters. Weevaluate the potential liability related to probable losses quarterly and may revise our estimates. Such revisions in the estimates of the potential liabilities could have a material effect on our results of operations, financial position or cash flows.
11
DP&L’s Table of Contentscoal-fired units are subject
In addition to the acid rain provisionsrequirements related to emissions of the Clean Air ActSO2, particulates, mercury, and NOX noted above, there is a growing concern nationally and internationally about global climate change and the NOcontribution of emissions of greenhouse gases, including most significantly, carbon dioxide (COx2). This concern has led to increased interest in legislation at the federal level and Ozone Transport rule. All ofactions at the SO2 and NOx state level as well as litigation relating to greenhouse gas emissions, data submittedincluding a recent U.S. Supreme Court decision holding that the USEPA has the authority to regulate carbon dioxide emissions from motor vehicles under the United States Environmental Protection Agency (USEPA) pursuant to these provisionsCAA. Increased pressure for 2005carbon dioxide emissions reduction also is coming from investor organizations and the first quarter 2006 were recordedinternational community. Environmental advocacy groups are also focusing considerable attention on carbon dioxide emissions from power generation facilities and reportedtheir potential role in compliance with USEPA regulations. Subsequently climate change. Although several bills have been introduced in Congress that would compel CO2 emission reductions, no bills have passed to date. Future changes in environmental regulations governing these pollutants could make some of our electric generating units uneconomical to maintain or operate. In addition, any legal obligation would require extensive mitigation efforts and, in the case of CO2 legislation, would raise uncertainty about the future viability of fossil fuels, particularly coal, as an energy source for new and existing electric generation facilities. If legislation or regulations are passed at the federal or state levels imposing mandatory reductions of carbon dioxide and other greenhouse gases on generation facilities, the cost to DPL andDP&L detected a malfunction with its emission monitoring system at one of its generation stations and ultimately determined its SO2 and NOx emissions data were under reported. DP&L has petitioned the USEPA to accept an alternative methodology for calculating actual emissions for 2005 and the first quarter 2006. DP&L has sufficient allowances in its general account to cover the understatement and is working with the USEPA to resolve the matter. Management does not believe the ultimate resolution of this matter will have a material impact on operating results or financial position.such reductions could be material.
Environmental Regulation and Litigation Related to Air Quality
Regulation Proceedings — Air
In 1990, the federal government amended the Clean Air Act (CAA)CAA to further regulate air pollution. Under the law, the USEPA sets limits on how much of a pollutant can be in the air anywhere in the United States. The CAA allows individual states to have stronger pollution controls, but states are not allowed to have weaker pollution controls than those set for the whole country. The CAA has a material effect on our operations and such effects are detailed below with respect to certain programs under the CAA.
On October 27, 2003, the USEPA published final rules regarding the equipment replacement provision (ERP) of the routine maintenance, repair and replacement (RMRR) exclusion of the CAA. Subsequently, on December 24, 2003, the United States Court of Appeals for the D.C. Circuit stayed the effective date of the rule pending its decision on the merits of the lawsuits filed by numerous states and environmental organizations challenging the final rules. As a result of the stay, the Ohio Environmental Protection Agency (Ohio EPA)EPA delayed its previously announced intent to adopt the RMRR rule. On October 20, 2005, USEPA proposed to revise the emissions test for existing electric generating units. At this time, we are unable to determine the impact of the ERP appeal or the outcome of the proposed emissions test.
In a regulation proceeding relating to the same issue pending beforedecided by the U.S. Supreme Court in the Duke Energy case discussed below, the USEPA issued a proposed rule in October 2005 concerning the test for measuring whether modifications to electric generating units should trigger application of New Source Review (NSR) standards under the CAA. The proposed rule seeks comments on two different hourly emissions test options as well as the USEPA’s current method of measuring previous actual emission levels to projected actual emission levels after the modification. A third option that tests emissions increase based upon emissions per unit of energy output is also available for comment. We cannot predict the outcome of this rulemaking or its impact on current environmental litigation.
On December 17, 2003, the USEPA proposed the Interstate Air Quality Rule (IAQR) designed to reduce and permanently cap SO2 and NOxNOX emissions from electric utilities. The proposed IAQR focused on states, including Ohio, whose power plant emissions are believed to be significantly contributing to fine particle and ozone pollution in other downwind states in the eastern United States. On June 10, 2004, the USEPA issued a supplemental proposal to the IAQR, now renamed as the Clean Air Interstate Rule (CAIR). The final rules were signed on March 10, 2005 and were published on May 12, 2005. CAIR created an interstate trading program for annual NOX emission allowances and made modifications to an existing trading program for SO2. On August 24, 2005, the USEPA proposed additional revisions to the CAIR. On July 11, 2008, the U.S. Court of Appeals for the District of Columbia Circuit issued a decision to vacate the USEPA’s CAIR and initiatedits associated Federal Implementation Plan and remanded to the USEPA with instructions to issue new regulations that conformed with the procedural and substantive requirements of the Clean Air Act. The Court’s decision, in part, invalidated the new NOX annual emission allowance trading program and the modifications to the SO2 emission trading program established by the March 10, 2005 rules, and created uncertainty regarding future NOX and SO2 emission reduction requirements and their timing. The USEPA and a group representing utilities filed a request for a rehearing en banc on September 24, 2008. On December 23, 2008, the U.S. Court of Appeals issued an order on reconsideration on one issue. Although wethat permits CAIR to remain in effect until the USEPA issues new regulations that would conform to the Clean Air Act requirements and the Court’s July 11, 2008 decision.
12
Table of Contents
We cannot predict the
timing or the outcome of the reconsideration proceedings, the petitions or the pending litigation,any new regulations relating to CAIR. CAIR has had and will continue to have a material effect on our operations. Phase IIn 2007, the Ohio EPA revised their State Implementation Plan (SIP) to incorporate a CAIR program consistent with the IAQR. The Ohio EPA had been awaiting approval from the USEPA when the U.S. Court of Appeals issued its July 11, 2008 decision. As a result of the December 23, 2008 order, the Ohio EPA continues to expect to receive that approval.
In the fourth quarter of 2007, DP&L began a program for selling excess emission allowances, including annual NOx emission allowances and SO2 emission allowances that were the subject of CAIR incentivizestrading programs. In subsequent quarters, DP&L recognized gains from the installationsale of flue gas desulfurizationexcess emission allowances to third parties. The court’s CAIR decision affected the trading market for excess allowances and impacted DP&L’s program for selling additional excess allowances in 2008. The long-term impact of the court’s decision, and of the actions the USEPA or others will take in response to this decision, on DPL and DP&L is not fully known at this time and could have an adverse effect on us. In January 2009, we resumed selling excess allowances due to the revival of the trading market.
The regulations as promulgated tended to promote decisions to install Flue Gas Desulfurization (FGD) equipment and continual operationcontinuous operations of the currently installed Selective Catalytic Reduction (SCR) equipment. As a result, DP&L is proceeding withhas installed FGD and SCR equipment on the installation of FGD equipmentsingle unit at variousthe Killen generating units.station and on all four units at the Stuart generating station.
On January 30, 2004, the USEPA published its proposal to restrict mercury and other air toxicstoxins from coal-fired and oil-fired utility plants. The USEPA “de-listed” mercury as a hazardous air pollutant from coal-fired and oil-fired utility plants and, instead, proposed a cap-and-trade approach to regulate the total amount of mercury emissions allowed from such sources. The final Clean Air Mercury Rule (CAMR) was signed March 15, 2005 and was published on May 18, 2005. The final rules will have a material effect on our operations. We anticipate that the FGD equipment being installed to meet the requirements of CAIR may be adequate to meet the Phase I requirements of CAMR effective January 1, 2010. We expect that additional controls will be needed to meet the Phase II requirements of CAMR that go into effect January 1, 2018. On March 29, 2005, nine states sued USEPA, opposing the cap-and-trade regulatory approach taken by USEPA. In 2007, the Ohio EPA adopted rules implementing the CAMR program. On March 31, 2005, various groups requested that USEPA stay implementation of CAMR. On August 4, 2005,February 8, 2008, the United States Court of Appeals struck down the USEPA regulations, finding that the USEPA had not complied with statutory requirements applicable to “de-listing” a hazardous air pollutant and that a cap-and-trade approach was not authorized by law for “listed” hazardous air pollutants. A request for rehearing before the entire Court of Appeals was denied and a petition for a writ of certiorari was filed with the U.S. Supreme Court on September 17, 2008. If the petition is not accepted by the Supreme Court, or if the Supreme Court grants certiorari and upholds the D.C. Circuit Court’s decision, USEPA will have to move forward to set Maximum Available Control Technology (MACT) standards for coal- and oil-fired electric generating units. We anticipate that it will take a few years for the District of Columbia deniedUSEPA to gather new data to promulgate updated MACT standards and for the motion for stay. USEPAregulations to become effective. At this time, DP&L is expectedunable to initiate reconsideration proceedings on one or more issues. We cannot predictdetermine the outcomeimpact of the reconsideration proceedingspromulgation of new MACT standards on its financial position or pending litigation.results of operations.
Under
If the CAIR and CAMR cap and trade programs for SO2, NOx and mercury, we estimate we will spend more than $225 million from 2007 through 2009 to install the necessary pollution controls. If CAMR litigation results in plant specific mercury controls, our costs may be higher. Due to the ongoing uncertainties associated with the litigationU.S. Court of the CAMR,Appeals’ ruling is not reversed, we cannot project the final costs at this time.we may incur to comply with any resulting mercury restriction regulations.
On July 15, 2003, the Ohio EPA submitted to the USEPA its recommendations for eight-hour ozone non-attainment boundaries for the metropolitan areas within Ohio. On April 15, 2004, the USEPA issued its list of ozone non-attainment designations. DP&L owns and/or operates a number of facilities in countiesSince these initial designations, the Ohio EPA has recommended that nine areas designated non-attainment be designated as non-attainment with the ozone national ambient air quality standard. DP&L does not know at this time what future regulations may be imposed on its facilities and will closely monitor the regulatory process. Ohio EPA will have until April 15, 2007 to develop regulations to attain and maintain compliance withattainment. Currently USEPA has redesignated eight of those areas as attainment for the eight-hour ozone national ambient air quality standard. Numerous parties have filed petitionsstandards, including counties where DP&L owns and/or operates a number of facilities. In redesignating these counties as attainment, the Ohio EPA submitted and USEPA approved amendments to the SIP that include maintenance plans for review.these areas. In June 2007, the Ohio EPA submitted a plan to USEPA for attaining the eight-hour ozone standard for the Cincinnati-Hamilton area in which DP&Lowns a number of facilities. DP&L cannot predictdetermine the outcome of USEPA’s reconsideration petitions.this redesignation effort at this time.
On January 5, 2005, the USEPA published its final non-attainment designations for the national ambient air quality standard for Fine Particulate Matter 2.5 (PM 2.5). These designations included counties and partial counties in which DP&L operates and/or owns generating facilities. On March 4, 2005, DP&L and other Ohio electric utilities and electric generators filed a petition for review in the D.C. Circuit Court of Appeals, challenging the final rule creating these designations. On November 30, 2005, the court ordered USEPA to decide on all petitions for reconsideration by January 20, 2006. On January 20, 2006, USEPA denied the petitions for reconsideration. The Ohio EPAPetitioners submitted their principal briefs in February 2008, their reply briefs in August 2008, and their final briefs in September 2008. Oral argument had been scheduled but, on December 19, 2008, the D.C. Circuit on its own motion indicated it will have three years to develop regulations to attain and maintain compliance with the PM 2.5 national ambient air quality standard.reschedule oral argument at a later date. DP&L cannot determine the outcome of the petition for review or the effect such Ohio EPA regulations will have on its operations.
13
Table of Contents
On May 5, 2004, the USEPA issued its proposed regional haze rule, which addresses how states should determine the best available retrofit technologyBest Available Retrofit Technology (BART) for sources covered under the regional haze rule. Final rules were published July 6, 2005, providing states with several options for determining whether sources in the state should be subject to BART. In the final rule, USEPA made the determination that CAIR achieves greater progress than BART and may be used by states as a BART substitute. Numerous units owned and operated by us will be impacted by BART. We cannot determine the extent of the impact until Ohio determines how BART will be implemented.
Sierra Club Litigation
Pending before the U.S. Supreme Court is a proceeding, Environmental Defense v. Duke Energy (Duke Energy) that does not involve the Company as a party but may have a significant effect on the outcome of litigation described below that involves allegations of violations of the CAA. A key issue in that litigation that may be dispositive with respect to other pending cases is what test to apply for measuring whether modifications to electric generating units should trigger application of New Source Review (NSR) standards under the CAA. In general terms, the dispute is whether to measure pre- and post-modification emissions based on the rate of emissions per hour of operation or based on total emissions over time. The latter test, if applied, could trigger NSR requirements for equipment replacements that result in a plant running more often because it is more economical or dependable, even if the emissions rate per hour of operation does not change. A ruling is expected in the first or second quarter of 2007. The Company cannot predict the outcome of the Duke Energy
case. Moreover, in each of the cases identified below, there may be case-specific facts and allegations that may cause a judge to find that the U.S. Supreme Court’s ruling is based on different facts and allegations and is therefore not controlling in the case before the judge.
In September 2004, the Sierra Club filed a lawsuit against the Company DP&L and the other owners of the Stuart Generating Stationgenerating station in the United StatesU.S. District Court for the Southern District of Ohio for alleged violations of the Clean Air Act (CAA) and the station’s operating permit. On August 7, 2008, a consent decree was filed in the U.S. District Court in full settlement of these CAA including issuesclaims. Under the terms of the consent decree, DP&L and the other owners of the Stuart generating station agreed to: (i) certain emission targets related to NOx, SO2 and particulate matter; (ii) make energy efficiency and renewable energy commitments that may be decidedare conditioned on receiving PUCO approval for the recovery of costs; (iii) forfeit 5,500 sulfur dioxide allowances; and (iv) provide funding to a third party non-profit organization to establish a solar water heater rebate program. DP&L and the other owners of the station also entered into an attorneys’ fee agreement to pay a portion of the Sierra Club’s attorney and expert witness fees. The parties to the lawsuit filed a joint motion on October 22, 2008, seeking an order by the SupremeU.S. District Court inapproving the Duke Energy case and other issues relating to alleged violationsconsent decree with funding for the third party non-profit organization set at $300,000. On October 23, 2008, the U.S. District Court approved the consent decree. We have determined that the terms of opacity limitations. DP&L,the consent decree will not have a material impact on behalfour overall results of all co-owners, is leading the defense of this matter. A sizable amount of discovery has taken place and expert reports are scheduled to be filed at various times from May through September, 2007. Dispositive motions are to be filed in January 2008. No trial date has been set yet.operations, financial position, or cash flows.
Litigation Involving Co-Owned Plants
In March 2000, as amended in June 2004, the United StatesU.S. Department of Justice filed a complaint in an Indiana federal court against Cinergy CorporationCorp. (now part of Duke Energy) and two Cinergy subsidiaries for alleged violations of the CAA at various generation units operated by PSI Energy, Inc. and CG&E, including generation units co-owned by DP&L (Beckjord Unit 6 and Miami Fort Unit 7). Prior to trial, plaintiffs chose not to pursue allegations that had been made with respect to Miami Fort 7. On May 22, 2008, the jury rendered a verdict in favor of Cinergy with respect to the allegations made involving projects at Beckjord Unit 6. The jury found for the plaintiffs with respect to units at one of Duke Energy’s wholly-owned facilities. In August 2006,mid-December 2008, the Seventh Circuit upheldjudge ordered a retrial after hearing arguments regarding the district court’s 2005 rulingpotential prejudicial effect of Duke’s failure to disclose that an increase in annual emissions could triggercertain of its witnesses were paid for their time and expertise. No date has been established for retrying the permitting requirements of the CAA even if there were no increase in hourly emissions per hour of operations.
In November 2004, the State of New Yorkcase and seven other states filed suit against the American Electric Power Corporation (AEP) and various subsidiaries, alleging various CAA violations at a number of AEP electric generating facilities, including Conesville Unit 4 (co-owned by CG&E, DP&L and Columbus Southern Power (CSP)). AEP, on behalfis unable to predict the outcome or timing of all co-owners, is leading the defense of this matter. During 2006, a number of procedural and discovery-related disputes were resolved by the Southern District Court of Ohio. Discovery is ongoing.any retrial.
In July 2004 and November 2004, various residents of the Village of Moscow, Ohio notifiedsued CG&E, as the operator of Zimmer generating station (co-owned by CG&E, DP&L and CSP), of their intent to sue for alleged violations of the CAA and air pollution nuisances. CG&E, on behalf of all co-owners, is leading the defense of this matter. One lawsuit was dismissed on procedural grounds. Several counts
Notices of Violation Involving Co-Owned Plants
On March 13, 2008, Duke Energy Ohio Inc., the operator of the remaining suit have been dismissed because they were basedZimmer generating station, received a Notice of Violation (NOV) and a Finding of Violation from the USEPA alleging violations of the CAA, the Ohio State Implementation Program (SIP) and permits for the Station in areas including SO2, opacity and increased heat input. DP&L is a co-owner of the Zimmer generating station and could be affected by the eventual resolution of this matter. Duke Energy Ohio Inc. is expected to act on activity outsidebehalf of itself and the statuteco-owners with respect to this matter. At this time, DP&L is unable to predict the outcome of limitations.this matter.
In June 2000, the USEPA issued a Notice of Violation (NOV)NOV to the DP&L operated-operated Stuart Generating Stationgenerating station (co-owned by DP&L, CG&E, and CSP) for alleged violations of the CAA. The NOV contained allegations consistent with NOVs and complaints that the USEPA had recently brought against numerous other coal-fired utilities in the Midwest. The NOV indicated the USEPA maymay: (1) issue an order requiring compliance with the requirements of the Ohio State Implementation Plan (SIP)SIP; or (2) bring a civil action seeking injunctive relief and civil penalties of up to $27,500 per day for each violation. To date, neither action has been taken.
In November 1999, the USEPA filed civil complaints and NOVs against operators and owners of certain generation facilities for alleged violations of the CAA. Generation units operated by CG&E (Beckjord Unit 6) and CSP (Conesville Unit 4) and co-owned by DP&L were referenced in these actions. Numerous northeast states have filed complaints or have indicated that they will be joining the USEPA’s action against CG&E and CSP. DP&L was not identified in the NOVs, civil complaints or state actions.
14
Table of Contents
In December 2007, the Ohio EPA issued a NOV to the DP&L-operated Killen generating station (co-owned by DP&L and CG&E) for alleged violations of the CAA. The NOVs alleged deficiencies in the continuous monitoring of opacity. A compliance plan has been submitted to the Ohio EPA. To date, no further actions have been taken by the Ohio EPA.
Other Issues Involving Co-Owned Plants
In 2006, DP&L detected a malfunction with its emission monitoring system at the DP&L-operated Killen generating station (co-owned by DP&L and CG&E) and ultimately determined its SO2 and NOx emissions data were under reported. DP&L has petitioned the USEPA to accept an alternative methodology for calculating actual emissions for 2005 and the first quarter 2006. DP&L has sufficient allowances in its general account to cover the understatement and is working with the USEPA to resolve the matter. Management does not believe the ultimate resolution of this matter will have a material impact on results of operations, financial position or cash flows.
Notices of Violation Involving Wholly-Owned Plants
In 2007, the Ohio EPA and the USEPA issued NOVs to DP&L for alleged violations of the CAA at the O.H. Hutchings station. The NOVs alleged deficiencies relate to stack opacity and particulate emissions. Discussions are under way with the USEPA, the U.S. Department of Justice and Ohio EPA. DP&L has provided data to those agencies regarding its maintenance expenses and operating results. On December 15, 2008, DP&L received a request from the USEPA for additional documentation with respect to those issues and other Clean Air Act issues including issues relating to capital expenses and any changes in capacity or output of the units at the O.H. Hutchings station. DP&L is complying with that request. DP&L is unable to determine the timing, costs, or method by which the issues may be resolved.
Environmental Regulation and Litigation Related to Water Quality
On July 9, 2004, the USEPA issued final rules pursuant to the Clean Water Act governing existing facilities that have cooling water intake structures. The rules require an assessment of impingement and/or entrainment of organisms as a result of cooling water withdrawal. A number of parties appealed the rules to the federalFederal Court of Appeals for the Second Circuit in New York and the Court issued an opinion on January 25, 2007 remanding several aspects of the rule to USEPA for reconsideration. We are undertaking studies at two facilities but cannot predictSeveral parties petitioned the impact such studies may have on future operations or the outcomeU.S. Supreme Court for review of the remanded rulemaking.lower court decision. On April 14, 2008, the Supreme Court elected to review the lower court decision on the issue of whether USEPA can compare costs with benefits in determining the best technology available for minimizing adverse environmental impact at cooling water intake structures. Briefs were submitted to the Court last summer and oral arguments were held in December 2008.
InOn May 4, 2004, the Ohio EPA issued a final National Pollutant Discharge Elimination System permit (the Permit) for J.M. Stuart Station that continued our authority to discharge water from the station’s 316(a) variance which exempts DP&L from having to meet the temperature Standards instation into the Ohio River. During the three-year term of the permit, DP&LPermit, we conducted a thermal discharge
study to evaluate the technical feasibility and economic reasonableness of water cooling methods other than cooling towers. In December 2006, we submitted an application for the renewal of the Permit that was due to expire on June 30, 2007. In July 2007 we received a draft permit proposing to continue our authority to discharge water from the station into the Ohio River. On February 5, 2008 we received a letter from Ohio EPA indicating that they intended to impose a compliance schedule as part of the final Permit, that requires us to implement one of two diffuser options for the discharge of water from the station into the Ohio River as identified in the thermal discharge study. On March 6, 2008, representatives from DP&L met with Ohio EPA to discuss the issue and reiterate our position that diffusers were not cost-effective. We cannot predictagreed to explore other potential solutions and share findings with Ohio EPA. On June 6, 2008, DP&L sent a letter to Ohio EPA stating that we would be willing to restrict public access to the impactthermal discharge during the warmest months of the year. On August 22, 2008, we received word from Ohio EPA that this issueoption would be acceptable and would be incorporated in the NPDES permit, which was received in draft form on future operations.November 12, 2008, subject to comment and the review of the USEPA. In December 2008, the USEPA requested that the Ohio EPA provide additional information regarding the draft permit and the timing for issuance of a final permit is uncertain.
15
Table of Contents
Environmental Regulation and Litigation Related to Land Use and Solid Waste Disposal
DP&L has been identified, either by a government agency or by a private party seeking contribution to site clean-up costs, as a potentially responsible partyPotentially Responsible Party (PRP) at a sitetwo sites pursuant to state and federal laws.
In September 2002, DP&L and other parties received a special notice that the USEPA considers us to be PRPs for the clean-up of hazardous substances at the South Dayton Dump landfill site. In August 2005, DP&L and other parties received a general notice regarding the performance of a Remedial Investigation and Feasibility Study (RI/FS) under a Superfund Alternative approach.Approach. In October 2005, DP&L received a special notice letter inviting it to enter into negotiations with USEPA to conduct the RI/FS. Although the informationInformation available to DP&L does not demonstrate that it contributed hazardous substances to the site, DP&L will seek from USEPA a de minimis settlement at the site. Should USEPA pursue a civil action, DP&L will vigorously challenge it.
In December 2003, DP&L and other parties received a special notice that the USEPA considers us to be PRPs for the clean-up of hazardous substances at the Tremont City landfill site. Information available to DP&L does not demonstrate that it contributed hazardous substances to the site.
In November 2007, a PRP group contacted DP&L seeking our financial participation in a settlement that the group had reached with the federal government with respect to the clean-up of an industrial site once owned by Carolina Transformer, Inc. DP&L’s business records clearly show we did not conduct business with Carolina Transformer that would require our participation in any clean-up of the site. DP&L has declined to participate in the clean-up of this site.
In August 2006, Ohio EPA issued draft rules for interested party comment related to the disposal of industrial waste. DP&L, through the Ohio Electric Utility Institute, submitted comments on the draft rules. WeDP&L cannot predict the impact of the draft rules on future operations.
CONSTRUCTION ADDITIONSCapital Expenditures for Environmental Matters
| | Actual | | Projected | |
$ in millions | | 2006 | | 2005 | | 2004 | | 2007 | | 2008 | | 2009 | |
| | | | | | | | | | | | | |
DPL Inc. | | $ | 352 | | $ | 180 | | $ | 98 | | $ | 310 | | $ | 165 | | $ | 130 | |
| | | | | | | | | | | | | |
DP&L | | $ | 349 | | $ | 178 | | $ | 93 | | $ | 310 | | $ | 165 | | $ | 130 | |
Test operations of the flue gas desulfurization (FGD) equipment on all four units at the Stuart generating station were completed during 2008. The equipment is currently in service.
DPL’s construction additions were approximately $228 million, $347 million and $352 million $180 millionin 2008, 2007 and $98 million in 2006, 2005 and 2004, respectively, and are expected to approximate $310$150 million in 2007.
for 2009. DP&L’s construction additions were approximately $225 million, $344 million and $349 million $178 millionin 2008, 2007 and $93 million in 2006, 2005 and 2004, respectively, andrespectively. Planned construction additions of DP&L for 2009 are expected to approximate $310$147 million in 2007. Planned construction additions for 2007and relate to DP&L’s environmental compliance program, power plant equipment, and its transmission and distribution system.
Capital projects are subject to continuing review and are revised in light of changes in financial and economic conditions, load forecasts, legislative and regulatory developments and changing All environmental standards, among other factors. Overadditions made during the nextpast three years DPL, through its subsidiarypertain to DP&L, is projecting to spend an estimated $605 and approximate $90 million, $206 million and $246 million in capital projects, approximately 40%2008, 2007 and 2006, respectively.
16
Table of which is to meet changing environmental standards. Our ability to complete capital projects and the reliability of future service will be affected by our financial condition, the availability of internal funds and the reasonable cost of external funds. We expect to finance our construction additions in 2007 with a combination of cash on hand, short-term financing, tax-exempt debt and cash flows from operations.Contents
Item 1a —1A - Risk Factors
This annual report and other documents that we file with the SEC and other regulatory agencies, as well as other oral or written statements we may make from time to time, contain information based on management’s beliefs and include forward-looking statements (within the meaning of the Private Securities Litigation Reform Act of 1995) that involve a number of known and unknown risks, uncertainties and assumptions. These forward-looking statements are not guarantees of future performance and there are a number of factors including, but not limited to, those listed below, which could cause actual outcomes and results to differ materially from the results contemplated by such forward-looking statements. We do not undertake any obligation to publicly update
or revise any forward-looking statements, whether as a result of new information, future events or otherwise. These forward-looking statements are identified by terms and phrases such as “anticipate”, “believe”, “intend”, “estimate”, “expect”, “continue”, “should”, “could”, “may”, “plan”, “project”, “predict”,“anticipate,” “believe,” “intend,” “estimate,” “expect,” “continue,” “should,” “could,” “may,” “plan,” “project,” “predict,” “will”, and similar expressions.
Future operating results are subject to fluctuations based on a variety of factors, including but not limited to: unusual weather conditions; catastrophic weather-related damage; unscheduled generation outages; unusual maintenance or repairs; changes in fuel and purchased power costs, emissions allowance costs, or availability constraints; environmental compliance; and electric transmission system constraints.
The following is a listing of risk factors that weDPL and DP&L consider to be the most significant to your decision to invest in our stock. If any of these events occurs,occur, our business, results of operations, financial position or results of operationcash flows could be materially affected.
The electricSenate Bill 221
We operate in a rapidly changing industry with evolving industry standards and regulations. In recent years a number of federal and state developments aimed at promoting competition triggered industry restructuring. Regulatory factors such as changes in Ohio is partially deregulatedthe policies and procedures that set rates; changes in tax laws, tax rates and environmental laws and regulations; changes in DP&L’s ability to recover expenditures for environmental compliance, fuel and purchased power costs and investments made under traditional regulation through rates; and changes to the frequency and timing of rate increases could affect our results of operations, financial condition or cash flows. Additionally, financial or regulatory accounting principles or policies imposed by governing bodies can increase our operational, monitoring and information technology costs affecting our results of operations and financial condition.
Before 2001, Ohio electric utilities provided electric generation, transmission and distribution services as a single product to retail customers at prices set by the PUCO. In 1999, Ohio enacted legislation effective January 1, 2001, that partially deregulated utility service, effective January 1, 2001, making retail generation service a competitive service. Customers may choose to take generation service from CRES providers that register with the PUCO but are otherwise unregulated. In connection with this deregulation of the electric industry in Ohio, electric utilities have had to restructure their service and their rates to accommodate competition.
Many of the requirements of the Ohio deregulation law were premised on the assumption that the wholesale generation market and, in turn, the retail generation market, would fully develop by the end of 2005, and that the price for generation for even those customers who choose to continue to purchase the service from the regulated utility would be set purely by the market. That did not occur. As a result, the CommissionPUCO and the utilities, including DP&L, put rate stabilization plans in place to provide standard offer service to customers at tariffed rates. DP&L’s plan was the only one to continue through 2010.
On May 1, 2008, substitute Senate Bill 221, an Ohio electric energy bill, was signed by the Governor and became effective July 31, 2008. This new law states that all Ohio distribution utilities must file either an electric security plan or a market rate option to be in effect January 1, 2009. An electric security plan may allow for adjustments to the standard offer for costs associated with environmental compliance; fuel and purchased power; construction of new or investment in specified generating facilities; the provision of standby and default service, operating, maintenance, or other costs including taxes. As part of its electric security plan, the utility is permitted to file an infrastructure improvement plan that will specify the initiatives the utility will take to rebuild, upgrade, or replace its electric distribution system, including cost recovery mechanisms. Both the market rate option and the electric security plan option involve a “substantially excessive earnings” test based on the earnings of other companies with similar business and financial risks.
17
Table of Contents
The new law also contains annual targets relating to advanced energy portfolio standards, renewable energy, and energy efficiency standards. The standards require that, by 2025, 12.5% of the generation used to supply standard offer generation service by the utility must come from advanced energy resources, which may include distributed generation, cogeneration, clean coal technology, nuclear technology or energy efficiency. By 2025, another 12.5% of the generation used to supply standard offer generation service by the utility must come from renewable energy resources, of which 0.5% must come from solar energy resources. In addition, the proposed bill requires annual energy efficiency reductions that reach 22.3% by 2025 and peak demand reduction requirements that reach 7.75% by 2018. The advanced energy portfolio and energy efficiency standards begin in 2009, with increases in required percentages each year. If any targets are not met, compliance penalties will apply.
In compliance with substitute Senate Bill 221, DP&L filed its electric security plan on October 10, 2008. On February 24, 2009, DP&L filed a Stipulation and Recommendation (the Stipulation) signed by the Staff of the PUCO, the Office of the Ohio Consumers’ Counsel and various intervening parties. The PUCO has the authority to approve, modify or reject the Stipulation. The Stipulation is further discussed under Ohio Retail Rates in Item 1 — COMPETITION AND REGULATION. While the overall impact of Senate Bill 221 is not known, implementation of the bill and compliance with its requirements could have worked outa material impact on us. The outcome of this proceeding should be known by the end of the second quarter of 2009.
Clean Air Interstate Rule (CAIR) decision by the U.S. Court of Appeals for the District of Columbia Circuit
On July 11, 2008, the United States Court of Appeals for the District of Columbia Circuit issued a decision that vacated the U.S. Environmental Protection Agency’s (USEPA’s) Clean Air Interstate Rule (CAIR) and its associated Federal Implementation Plan. This decision remanded these issues back to the USEPA. The USEPA issued CAIR on March 10, 2005 to regulate certain upwind states with respect to fine particulate matter and ozone. CAIR created interstate trading programs for annual NOx emission allowances and made modifications to an existing trading program for SO2 that were to take effect in 2010. The court’s decision, in part, invalidated the new NOx annual emission allowance trading program and the modifications to the SO2 emission trading program and created uncertainty regarding future NOx and SO2 emission reduction requirements and their timing. On December 23, 2008, the court reversed part of its decision that vacated CAIR. Thus, CAIR currently remains in effect, but the USEPA remains subject to the court’s order to revise the program.
In the fourth quarter of 2007, DP&L began a program for selling excess emission allowances, including annual NOx emission allowances and SO2 emission allowances that were the subject of CAIR trading programs. In subsequent quarters, DP&L recognized gains from the sale of excess emission allowances to third parties. The court’s CAIR decision has affected the trading market for excess allowances and impacted DP&L’s program for selling additional excess allowances in 2008. The long-term impact of the court’s decision, and of the actions the USEPA or others will take in response to this decision, on DPL and DP&L is not fully known at this time and could have an adverse effect on us. In January 2009, we resumed selling excess allowances due to the revival of the trading market.
Credit Market
The current global credit crisis may adversely affect our business and financial results. Since mid-2007, and particularly during the second half of 2008, the financial services industry and the securities markets generally were materially and adversely affected by significant declines in the values of nearly all asset classes and by a serious lack of liquidity. This was initially triggered by declines in the values of subprime mortgages, but spread to all mortgage and real estate asset classes, to leveraged bank loans and to nearly all asset classes, including equities. Liquidity and credit concerns were further exacerbated in September 2008 with Lehman Brothers’ bankruptcy filing, the sale of Merrill Lynch to Bank of America, the U.S. government conservatorship of Fannie Mae and Freddie Mac, and the U.S. government loan to AIG. Because of this, the ability of corporations to obtain funds through the issuance of debt was negatively impacted. Disruptions in the credit markets make it harder and more expensive to obtain funding for our business. We issue debt to cover the costs of certain of our operations and expenditures and the inability to issue such debt on reasonable terms, or at all, could negatively affect our business and financial results. If our available funding is limited or we are forced to fund our operations at a higher cost, these conditions may require us to curtail our business activities and increase our cost of funding, both of which could reduce our profitability.
18
Table of Contents
Market performance and other changes may decrease the value of benefit plan assets, which could require significant additional funding.
The performance of the capital markets affects the values of the assets that are held in trust to satisfy future obligations under DPL’s and DP&L’s pension and postretirement benefit plans. These assets are subject to market fluctuations and will yield uncertain returns, which may fall below our projected return rates. A decline in the market value of the pension and postretirement benefit plan assets, as was experienced in 2008, will increase the funding requirements under our pension and postretirement benefit plans if the actual asset returns do not recover these declines in value in the foreseeable future. Future pension funding requirements, and the timing of funding payments, may also be subject to changes in legislation. The Pension Protection Act, enacted in August 2006, requires underfunded pension plans to provide market-based pricingimprove their funding ratios within prescribed intervals based on the level of their underfunding. As a result, our required contributions to these plans may increase in the future. In addition, our pension and postretirement benefit plan liabilities are sensitive to changes in interest rates. As interest rates decrease, the liabilities increase, potentially increasing benefit expense and funding requirements. Further, changes in demographics, including increased numbers of retirements or changes in life expectancy assumptions, may also increase the funding requirements of the obligations related to the pension and other postretirement benefit plans. If market conditions continue to be unfavorable, our results of operations, financial position or cash flows could be adversely impacted.
Fuel and Commodity Prices
Recently, the coal market has experienced significant price volatility. We are now in a global market for generation service, but alsocoal in which our domestic price is increasingly affected by international supply disruptions and demand balance. Coal exports from the U.S. have increased significantly in recent years. In addition, domestic issues like government-imposed direct costs and permitting issues are affecting mining costs and supply availability. Our approach is to stabilize those rateshedge the fuel costs for several years. Whatour anticipated electric sales. For the years ending December 31, 2009 and 2010, we have hedged our coal requirements with coal mine operators and financial institutions to meet our committed sales. However, we may not be able to hedge the entire exposure of our operations from commodity price volatility. To the extent our suppliers do not meet their contractual commitments, we cannot secure adequate coal supplies in a timely or cost-effective manner or we are not hedged against price volatility, our results of operations, financial position or cash flows could be materially affected. As part of its electric security plan filing, DP&L may proposerequested regulatory authority to defer fuel and whatfuel related costs that exceed the amount that is in current rates. On February 24, 2009, DP&L filed a Stipulation and Recommendation (the Stipulation) signed by the Staff of the PUCO, will approve in the future regarding pricing and cost recovery will depend on the degree to which the wholesale and retail electric generation markets have developed.
Moreover, the uncertaintyOffice of the futureOhio Consumers’ Counsel and various intervening parties. The Stipulation includes the implementation of a fuel and purchased power recovery mechanism beginning January 1, 2010 which will track and adjust fuel costs on a quarterly basis. The PUCO has the authority to approve, modify or reject the Stipulation. The Stipulation is further discussed under Ohio Retail Rates in Item 1 — COMPETITION AND REGULATION. A final decision from the PUCO regarding the Stipulation is expected by the end of the wholesale and retail markets could cause the Ohio General Assembly to revisit the issuesecond quarter of competition and customer choice.2009.
Customer Switching by DP&L’s customers to unaffiliated CRES providers could occur in the future, despite insignificant activity to date.
Changes in our customer base, including government aggregation, could lead to the entrance of competitors in our marketplace, affecting our results of operations, financial condition or cash flows. Although retail generation service has been a competitive service since January 1, 2001, the competitive generation market has not developed in DP&L’s service territory to any significant degree. The following are factors that could result in increased switching by customers to CRES providers in the future:
·Voluntary Enrollment Program
As part of a settlement in a PUCO proceeding, DP&L initiated, in November 2004, a VEP to encourage customers to change electric suppliers. Although the VEP did not result in a significant increase in the number of customers switching to CRES providers in 2005 or 2006, the VEP will be initiated again in 2007 and could produce different results.
· DP&L’s Standard Service Offer
The RSS Stipulation discussed above, permits customersCustomers that take service from a CRES provider are able to bypass the environmental investment riderEnvironmental Investment Rider (EIR). Because this charge increases each year through 2010, the price that a CRES provider can offer to save customers money changes each year. Depending on the development of the wholesale market and the level of wholesale prices, CRES providers could become more active in DP&L’sservice territory.
· CRES Supplier Initiatives
Customers can elect to take generation service from a CRES provider offering services to customers in DP&L’s service territory. As of December 31, 2006,2008, five CRES providers have been certified by the PUCO to provide generation service to DP&L customers. One of those five, DPL Energy Resources, Inc. (DPLER), is ana wholly-owned affiliate of DP&L.DPL. Although DPLER supplied 99.8%99.4% of the total kWh consumed by customers served by CRES providers in DP&L’s service territory in 2006, at the end of 2006 there was a slight increase in unaffiliated CRES provider activity. There has been zero residential customer switching to date.2008. Depending on the development of the wholesale market and the level of wholesale prices, CRES providers could become more active in DP&L’s service territory and may begin to offer
prices lower than DP&L’s standard offer. This could result in more switching by DP&L’s customers and a further loss of revenues by DP&L.
19
Table of Contents
· Governmental Aggregation Programs
Another way in which DP&L could also experience customer switching is through “governmental aggregation.” Under this program, municipalities may contract with a CRES provider to provide generation service to the customers located within the municipal boundaries. Several communities in DP&L’s service territory have passed ordinances allowing them to become government aggregators. Although none has yet implemented an aggregation program has not yet been implemented, that too could change providedif CRES providers offer prices below DP&L’s standard offer.
DP&L has agreed to provide service at pre-determined rates through December 31, 2010, which limits its ability to pass through its costs to customers. Risks Associated with Our Pre-determined Rates
DP&L has provided service at rates governed by the PUCO-approved transition, market development and rate stabilization plans. Those rates have included a statutorily-required 5% rate reduction in the generation component of its residential rates, a further 2.5% reduction to the residential generation rate through 2008, fixed generation rates through December 31, 2010, and frozen distribution rates through December 31, 2008. The protection afforded by retail fuel clause recovery mechanisms was eliminated effective January 1, 2001 by the implementation of customer choice in Ohio. Likewise, through the RSS Stipulation, DP&L extended its commitment to maintain pre-determined rates for generation through December 31, 2010, and in exchange is permitted to charge two new rate riders to offset increases in fuel and environmental costs. Beginning January 1, 2006, a new Rate Stabilization SurchargeRSS was implemented that recovered approximately $65 million additional revenue in 2006, net of customer discounts and considering less than a full twelve months recovery due to the timing of the PUCO order.discounts. The new environmental investment riderEIR could result in approximately $35 million additional revenue in 2007,each year, net of customer discounts and assuming insignificant levels of customer switching. The PUCO ruled this rider will be bypassable by all customers who take service from alternative generation suppliers. Accordingly, the rates DP&L is allowed to charge may or may not match its expenses at any given time. Therefore, during this period (or possibly earlier by order of the PUCO), while DP&L will be subject to prevailing market prices for electricity, it would not necessarily be able to charge rates that produce timely or full recovery of its expenses. DP&L has historically maintained its rates at consistent levels since 1994 when the final phase of DP&L’s last traditional rate case was implemented. However, as DP&L operates under its PUCO-approved RSS Stipulation, there can be no assurance that DP&L wouldwill be able to timely or fully recover unanticipated levels of expenses, including but not limited to those relating to fuel, coal and purchased power, compliance with environmental regulation, reliability initiatives and capital expenditures for the maintenance or repair of its plants or other properties. Furthermore, the RSS Stipulation is currently subject to an appeal to the Ohio Supreme Court, the result of which cannot be determined.
There are uncertainties relating to the operation and continued development of Regional Transmission Organizations (RTOs). DP&L has turned over operational control of its high voltage transmission functions to PJM and much of its generation is subject to dispatch by PJM and is therefore subject to PJM’s market rules.Organizational Risks
On October 1, 2004, in compliance with Ohio law, DP&L turned over control of its transmission functions and fully integrated into PJM. The price at whichDPL and DP&L can sell its generation capacity and energy is now more dependent upon the overall operation of the PJM market. While DP&L can continue to make bi-lateral transactions to sell its generation through a willing-buyer and willing-seller relationship, any transactions that are not pre-arranged are subject to market conditions at PJM. The rules governing the various regional power markets also change from time to time which could affect DP&L’s costcosts and revenues. DP&L incurs fees and costs to participate in the Regional Transmission Organization (RTO).RTO. We may be limited with respect to the price at which power may be sold from certain generating units and we may be required to expand our transmission system according to decisions made by the RTO rather than our internal planning process. While RTO transmission rates were initially designed to be revenue neutral, various proposals and proceedings currently taking place at FERC may cause transmission rates to change from time to time. In addition, developing rules associated with the allocation and methodology of assigning costs associated with improved transmission reliability, reduced transmission congestion and firm transmission rights may have a financial impact on DP&L. Likewise, in December 2006, FERC approved PJM’s new Reliability Pricing Model (RPM). RPM will bebecame effective in mid-2007,2007 and will provideprovides forward and locational pricing for generation capacity. The financial impact of RPM on DP&L will depend on a variety of factors, including the market behavior of various participants, and as such is unknown atparticipants. At this time.time, the RPM auction results are expected to have no material financial impact to DPL. Because the RTO market rules are continuing to evolve, we
cannot fully assess the impact that these power markets or other ongoing RTO developments may have on DPL.DP&L. On February 19, 2009, the PUCO approved DP&L’s request to defer costs associated with transmission, capacity, ancillary service and other PJM related charges incurred as a member of PJM. DP&L anticipates filing a request with the PUCO before the end of April 2009 seeking to recover these costs. Also, on February 24, 2009, DP&L filed a Stipulation and Recommendation (the Stipulation) signed by the Staff of the PUCO, the Office of the Ohio Consumers’ Counsel and various intervening parties. The Stipulation states that DP&L may seek recovery of RTO costs which are not covered by other recovery mechanisms. The PUCO has the authority to approve, modify or reject the Stipulation. The Stipulation is further discussed under Ohio Retail Rates in Item 1 — COMPETITION AND REGULATION. A final decision from the PUCO regarding the Stipulation is expected by the end of the second quarter of 2009. If in the future we are unable to defer or recover these costs, it could have a material adverse effect on us.
As a member of PJM, DP&L and DPLE are subject to certain additional risks including those associated with the allocation among PJM members of losses caused by unreimbursed defaults of other participants in PJM markets and those associated with complaint cases filed against PJM that may seek refunds of revenues previously earned by PJM members including DP&L and DPLE.
20
Table of Contents
We rely principally on coal as the fuel to operate virtually all of the power plants that serve our customers daily. PJM Infrastructure Risks
SomeAnnually, PJM performs a review of the capital additions required to provide reliable electric transmission services throughout its territory. PJM traditionally allocated the costs of constructing these facilities to those entities that benefited directly from the additions. On April 19, 2007, the FERC issued an order that modified the traditional method of allocating costs associated with new high voltage planned transmission facilities. FERC ordered that the cost of new high-voltage facilities be socialized across the PJM region. The costs of the new facilities at lower voltages will continue to be assigned to the load centers that benefit from the new facilities. In a companion order also issued on April 19, 2007, FERC did not change the existing allocation of costs associated with existing transmission facilities, upholding the existing PJM rate design. The overall impact of FERC’s orders cannot be definitively assessed at this time because not all new planned construction is likely to happen. The additional costs allocated to DP&L for new large transmission approved projects were immaterial in 2008 and are not expected to be material in 2009, but could rise to approximately $12 million or more annually by 2012. As a result, in 2008 DP&L sought and obtained PUCO authority to defer costs associated with these new high-voltage transmission projects for future recovery through retail rates. If in the future we are unable to defer or recover these costs, it could have a material adverse effect on us.
Reliance on Third Parties
We rely on many suppliers for the purchase and delivery of inventory, including coal and equipment components, to operate our energy production, transmission and distribution functions. Unanticipated changes in our purchasing processes, delays and supplier availability may affect our business and operating results. In addition, we rely on others to provide professional services, such as, but not limited to, actuarial calculations, internal audit services, payroll processing and various consulting services.
Historically, some of our coal suppliers have not performed their contracts as promised and have failed to timely deliver all coal as specified under their contracts. Such failure could significantly reduce DP&L’s inventory of coal and may cause DP&L to purchase higher priced coal on the spot market. When the failure is for a short period of time, DP&L can absorb the irregularity due to existing inventory levels. If we are required to purchase a substantial amount of coal on the spot market for a significant period of time, it may affectmaterially impact our cost of operations.
DP&L is a co-owner in certain generation facilities where it is a non-operating partner. DP&L does not procure the fuel for these facilities, but is responsible for its proportionate share of the cost of fuel procured at these facilities. Partner operated facilities do not always have realized coal costs that are equal to our co-owners’ projections.projections, and we are responsible for our proportionate share of any increase in coal costs.
Greenhouse Gas EmissionsGases
GreenhouseThe rules issued by the USEPA and Ohio Environmental Protection Agency (Ohio EPA) that require substantial reductions in SO2, NOx and mercury emissions may impact our business and operations. We are installing (and have installed) emission control technology and are taking other measures to comply with required reductions.
In addition to the requirements related to emissions of SO2, NOx and mercury noted above, there is a growing concern nationally and internationally about global climate change and the contribution of emissions of greenhouse gasses, including most significantly, CO2. This concern has led to increased interest in legislation at the federal level and actions at the state level, as well as litigation relating to greenhouse gas (GHG) emissions, consisting primarily ofincluding a recent U.S. Supreme Court decision holding that the USEPA has the authority to regulate CO2 emissions from motor vehicles under the Clean Air Act (CAA). Increased pressure for carbon dioxide emissions reduction is also coming from investor organizations and the international community. There are presently unregulated. Numerous bills have been introducedalso indications that the new government administration formed in Congress2009 is likely to regulate GHGpursue aggressive policies to limit greenhouse gas emissions and that legislation is likely to be passed in the future. If legislation or regulations are passed at the federal or state levels imposing mandatory reductions of CO2 and other greenhouse gasses on generation facilities, the cost of achieving such reduction could be material to us.
21
Table of Contents
Environmental Compliance
Our facilities (both wholly-owned and co-owned with others) are subject to continuing federal and state environmental laws and regulations. We own a non-controlling, minority interest in several generating stations operated by CG&E or its affiliate, Union Heat, Light & Power, and CSP. These parties will take steps to ensure that these stations remain in compliance with applicable environmental laws and regulations. As a non-controlling owner in these generating stations, we will be responsible for our pro rata share of these expenditures based upon our ownership interest.
During 2008, a major spill occurred at an ash pond owned by the Tennessee Valley Authority (TVA) as a result of a dike failure and generated a significant amount of national news coverage. DP&L has ash ponds at the Killen and J.M. Stuart stations which it operates, and also at other generating stations operated by others but in which DP&L has an ownership interest. We frequently inspect our ash ponds and do not anticipate any failures like that which occurred at TVA. It is widely expected that the federal government will consider imposing additional monitoring, testing, or construction standards with respect to date none have passed. Future regulationash ponds. DP&L is unable to assess the timing or impact of GHG emissions is uncertain. However,any such regulationgovernmental response that may occur or whether it would be expected to impose costs on our operations. Such costs could include measures as advanced by various constituencies, including a carbon tax; investments in energy efficiency; installation of CO2 emissions control technology,limited to the extent such technology exists; purchasetype of emission allowances, should a trading mechanism be developed;ash pond operated by TVA or the use of higher-cost, lower CO2applied more broadly. emitting fuels. We will continue to make prudent investments in energy efficiency that reduces our GHG emissions intensity.
Flue Gas Desulfurization Project
We are currently constructinghave constructed and placed into service flue gas desulfurization (FGD) facilities at five units located at our Killen and J. M. Stuart and Killen Electric Generating Stations. Constructionelectric generating stations. The operation of this FGD equipment is required for the FGD facilities at each unit is scheduled to be completed in phases commencing mid-year 2007 through 2009.achievement of certain emission targets. We are also co-owners of electric generating stations operated by other investor-owned utilities, who are in various stages of constructing FGD facilities at these generating stations. SignificantIn the event that we experience significant FGD equipment operational failure or significant construction delays could adversely affect our ability to operate or may substantially increase our cost to operate these electric generating stations under federal environmental laws and regulations that become effective in 2010. Forat those electric generating stations where we are co-owners but do not operate, significant construction delaysthe operators, we may substantiallynot meet certain emission targets that could result in a substantial increase in our pro rata share of the costoperating costs to operate thosethese facilities beginning in 2010.2009.
PJM Infrastructure Risks
Annually, PJM, the regional transmission organization that provides transmission services for a large portion of the Midwest United States, performs a review of the capital additions required to provide reliable electric transmission services throughout its territory. PJM allocates the costs of constructing these facilities to the applicable entity that will benefit from the new construction. FERC is authorized to provide rate recovery to utilities for the costs they incur to construct these transmission facilities. To date, we have not been required to construct any new facilities nor have we been assigned any costs as a result of PJM’s annual review, but there is no guarantee that we will not be assigned some costs or be required to construct facilities in the future.
Our stock price may fluctuateStock Price May Fluctuate
The market price of DPL’s common stock has fluctuated over a wide range. In addition, the stock market in recent years has experienced significant price and volume variations that have often been unrelated to our operating performance. Over the past three years, the market price of our common stock has fluctuated with a low of $17.21$19.16 and a high of $28.72.$31.91. The global markets in recent years have experienced significant price and volume variations that have often been unrelated to our operating performance. Over the previous year, the global markets have increasingly been characterized by substantially increased volatility and short-selling and an overall loss of investor confidence, initially in financial institutions but, more recently, in companies in a number of other industries and in the broader markets. The market price of our common stock may continue to significantly fluctuate in the future and may be affected adversely by factors such as actual or anticipated changeschange in our operating results, acquisition activity, changes in financial estimates by securities analysts, general market conditions, rumors and other factors.
The following are additional factors, including, but not limited to, regulationwhich factors may increase price volatility and competition, economic conditions, reliance on third parties, operating results fluctuations, regulatory uncertainties and litigation, warrant exercise, internal controls and environmental compliance, that may affect our future results.
Regulation and Competition
We operate in a rapidly changing industry with evolving industry standards and regulations. In recent years a number of federal and state developments aimed at promoting competition triggered industry restructuring. Regulatory factors, such as changesbe exacerbated by continued disruption in the policies and procedures that set rates; changes in tax laws, tax rates, and environmental laws and regulations; changes in DP&L’s ability to recover expenditures for environmental compliance, fuel and purchased power costs and investments made under traditional regulation through rates; and changes to the frequency and timing of rate increases could affect our results of operations and financial condition. Changes in our customer base, including municipal customer aggregation, could lead to the entrance of competitors in our marketplace, affecting our results of operations and financial condition. Additionally, financial or regulatory accounting principles or policies imposed by governing bodies can increase our operational and monitoring costs affecting our results of operations and financial condition.global markets at large.
Economic Conditions
Economic pressures, as well as changing market conditions and other factors related to physical energy and financial trading activities, which include price, credit, liquidity, volatility, capacity, transmission and interest rates can have a significant effect on our operations and the operations of our retail, industrial and commercial customers.
During the past few years, the merchant energy industry in many parts The direction and relative strength of the United Statesglobal economy has suffered from oversupply of merchant generationrecently been increasingly uncertain due to softness in the residential real estate and a decline in trading and marketing activity. As a result of these market conditions, we continue to evaluate the carrying values of certain long-lived generation assets.
Reliance on Third Parties
We rely on many suppliers for the purchase and delivery of inventory, including coal and equipment components, to operate our energy production, transmission and distribution functions. Unanticipated changes in our purchasing processes, delays and supplier availability may affect our business and operating results. In addition, we rely on others to provide professional services, such as, but not limited to, actuarial calculations, internal audit services, payroll processing and various consulting services.
Operating Results Fluctuations
Future operating results are subject to fluctuations based on a variety of factors, including but not limited to: unusual weather conditions; catastrophic weather-related damage; unscheduled generation outages; unusual maintenance or repairs; changesmortgage markets, volatility in fuel and purchased powerother energy costs, emissions allowance costs,difficulties in the financial services sector and credit markets, and other factors. Many of these factors have disproportionately impacted Ohio, which is the only state in which DPL and DP&L sell electricity.
DPL and DP&L’s results of operations may be negatively affected by sustained downturns or availability constraints; environmental compliance;a sluggish economy, all of which are beyond our control. Sustained downturns, recession or a sluggish economy generally affect the markets in which DP&L operates and electric transmission system constraints.negatively influences DP&L’s energy operations. A falling, slow or sluggish economy could reduce the demand for energy in areas in which we are doing business. Our commercial and industrial customers use our energy in the production of their products. During economic downturns, these customers may see a decrease in demand for their products, which in turn may lead to a decrease in the amount of energy they require for production.
22
Table of Contents
Regulatory Uncertainties and Litigation
In the normal course of business, we are subject to various lawsuits, actions, proceedings, claims and other matters asserted under laws and regulations. Additionally, we are subject to diverse and complex laws and regulations, including those relating to corporate governance, public disclosure and reporting, and taxation, which are rapidly changing and subject to additional changes in the future. As further described in Item 3-“Legal3 - “Legal Proceedings,” we are also currently involved in various pieces of litigation in which the outcome is uncertain. Compliance with these rapid changes may substantially increase costs to our organization and could affect our future operating results.
Warrant Exercise
DPL’s warrant holders could exercise their 31,560,000 warrants to purchase 19.6 million shares of common stock at their discretion until March 12, 2012. As a result, DPL could be required to issue up to 31,560,00019.6 million common shares in exchange for the receipt of the exercise price of $21.00 per share or pursuant to a cashless exercise process. The exercise of all warrants would have a dilutive effect on us and would increase the number of common shares outstanding and increase our common share of dividend costs, thus affecting any existing guidance on EPSearnings per share and affect our cash flows.
Internal Controls
Our internal controls, accounting policies and practices, and internal information systems are designed to enable us to capture and process transactions in a timely and accurate manner in compliance with generally accepted accounting principles (GAAP) in the United States of America, laws and regulations, taxation requirements and federal securities laws and regulations. We implemented corporate governance, internal control and accounting rules issued in connection with the Sarbanes-Oxley Act of 2002.2002 (the “Act”). Our internal controls
and policies have been and continue to be closely monitored by management and our Board of Directors to ensure continued compliance with Section 404 of the Act. While we believe these controls, policies, practices and systems are adequate to verify data integrity, unanticipated and unauthorized actions of employees, temporary lapses in internal controls due to shortfalls in oversight or resource constraints could lead to improprieties and undetected errors that could impact our results of operations, financial condition or cash flows or results of operations.flows.
Environmental ComplianceCollective Bargaining Agreements
Our facilities (both wholly-owned and co-owned with others) are subject to continuing federal and state environmental laws and regulations. We believe that we currently comply with all existing federal and state environmental laws and regulations. We own a non-controlling, minority interest in several generating stations operated by The Cincinnati Gas & Electric Company (CG&E) or its affiliate, Union Heat, Light & Power, and Columbus Southern Power Company (CSP). Either or both of these parties are likely to take steps to ensure that these stations remain in compliance with applicable environmental laws and regulations. As a non-controlling owner in these generating stations, we will be responsible for our pro rata share of these expenditures based upon our ownership interest.
Climate Change
Recently we have seen a growing interest in considering legislation or regulation in response to greenhouse gases generated by numerous sources, vehicles, manufacturing and the electric utility industry. Although, DPL,DP&L and its subsidiaries have operated facilities in compliance with state and federal environmental laws and regulations and is currently engaged in significant capital improvements of five units at the Stuart and Killen Generating Stations for the reduction of SO2, Congress could approve legislation that in the long term may impact operations of the units we and our partners manage or increase the cost for us to do so.
Employees
ManyApproximately 54% of our employees are under a collective bargaining agreement.agreement which is in effect until October 31, 2011. If we are unable to negotiate future collective bargaining agreements expire before new agreements are reached, we would attempt to persuade our employees to continue working while negotiations continue. We believe that we maintain a satisfactory relationship with our employees; however, it is possible that labor disruptions affecting some or all of our operations could experience work stoppages whichoccur during the period of the bargaining agreement or at the expiration of collective bargaining agreements before new agreements are negotiated. Lengthy strikes by our employees would have an adverse effect on our operations and financial condition.
Cyber Security and Terrorism
Man-made problems such as computer viruses or terrorism may affect its businessdisrupt our operations and harm our operating results. We operate in a highly regulated industry that requires the continued operation of sophisticated information technology systems and network infrastructure. Despite our implementation of security measures, all of our technology systems are vulnerable to disability or failures due to hacking, viruses, acts of war or terrorism, and other causes. If our technology systems were to fail and we were unable to recover in a timely way, we would be unable to fulfill critical business functions, which could have a material adverse effect on our business, operating results, and financial condition. In addition, our generation plants, fuel storage facilities, transmission and distribution facilities may be targets of terrorist activities that could disrupt our ability to produce or distribute some portion of our energy products. Any such disruption could result in a material decrease in revenues and significant additional costs to repair and insure our assets, which could have a material adverse effect on our business, operating results, and financial condition. The continued threat of terrorism and heightened security and military action in response to this threat, or any future acts of terrorism, may cause further disruptions to the economies of the United States and other countries and create further uncertainties or otherwise materially harm our business, operating results, and financial condition.
23
Table of Contents
Item 1b —1B - Unresolved Staff Comments
None
ElectricItem 2 - Properties
Information relating to our properties is contained in Item 1 — CONSTRUCTION ADDITIONS, and ELECTRIC OPERATIONS AND FUEL SUPPLY and Note 104 of Notes to Consolidated Financial Statements.
Substantially all property and plantplants of DP&L isare subject to the lien of the mortgage securing DP&L’s First and Refunding Mortgage, dated as of October 1, 1935 with the Bank of New York, as Trustee (Mortgage).
Item 3 - Legal Proceedings
Item 3 - Legal Proceedings |
In the normal course of business, we are subject to various lawsuits, actions, proceedings, claims and other matters asserted under laws and regulations. We are also from time to time involved in other reviews, investigations and proceedings by governmental and regulatory agencies regarding our business, certain of which may result in adverse judgments, settlements, fines, penalties, injunctions or other relief. We believe the amounts provided in our consolidated financial statements, as prescribed by GAAP, for these matters are adequate in light of the probable and estimable contingencies. However, there can be no assurances that the actual amounts required to satisfy alleged liabilities from various legal proceedings, claims and other matters discussed below,(including those matters noted below), and to comply with applicable laws and regulations will not exceed the amounts reflected in our Consolidated Financial Statements.consolidated financial statements. As such, costs, if any, that may be incurred in excess of those amounts provided as of December 31, 2006,2008, cannot be reasonably determined.
Former Executive Litigation
On August 24, 2004, DPL, and its subsidiaries DP&L and MVE, filed a Complaint (and subsequently, amended complaints) against Mr. Forster, Ms. Muhlenkamp and Mr. Koziar (the Defendants) in the Court of Common Pleas of Montgomery County, Ohio asserting legal claims against them relating to the termination of the Valley Partners Agreements, challenging the validity of the purported amendments to the deferred compensation plans and to the employment and consulting agreements, including MVE incentives, with the Defendants, and the propriety of the distributions from the plans to the Defendants, and alleging that the Defendants breached their fiduciary duties and breached their consulting and employment contracts. DPL, DP&L and MVE seek, among
other things, damages in excess of $25,000, disgorgement of all amounts improperly withdrawn by the Defendants from the plans and a court order declaring that DPL, DP&L and MVE have no further obligations under the consulting and employment contracts due to those breaches.
The Defendants have filed their answers (and subsequently, amended answers) denying liability and filed counterclaims (and subsequently, amended counterclaims) against DPL, DP&L, MVE, various compensation plans (the Plans), and current and former employees and current and former members of our Board of Directors. These counterclaims, as amended, allege generally that DPL, DP&L, MVE, the Plans and the individual defendants breached the terms of the employment and consulting contracts of the Defendants and the terms of the Plans. They further allege theories of breach of fiduciary duty, breach of contract, promissory estoppel, tortious interference, conversion, replevin and violations of ERISA under which they seek distribution of deferred compensation balances, conversion of stock incentive units, exercise of options and payment of amounts allegedly owed under the contracts and the Plans. Defendants’ counterclaims also demand payment of attorneys’ fees.
On March 15, 2005, Mr. Forster and Ms. Muhlenkamp filed a lawsuit in New York state court against the purchasers of the private equity investments in the financial asset portfolio and against outside counsel to DPL and DP&L concerning purported entitlements in connection with the purchase of those investments. DPL, DP&L and MVE are not defendants in that case; however, DPL, DP&L and MVE are parties to an indemnification agreement with respect to the purchaser defendants. On August 18, 2005, the Ohio court issued a preliminary injunction against Mr. Forster and Ms. Muhlenkamp that precludes them from pursuing certain key issues raised by Mr. Forster and Ms. Muhlenkamp in their New York lawsuit that are identical to the issues raised in the pending Ohio lawsuit in the New York court or any other forum other than the Ohio litigation. In addition, the New York court has stayed the New York litigation pending the outcome of the Ohio litigation. Mr. Forster and Ms. Muhlenkamp have appealed the preliminary injunction and the appeal is pending at the Ohio Supreme Court.
The trial commencement date for this case is set for April 30, 2007.
Cumulatively through December 31, 2006, we have accrued for accounting purposes, obligations of approximately $56 million to reflect claims regarding deferred compensation, estimated MVE incentives and/or legal fees that Defendants assert are payable per contracts. We dispute Defendants’ entitlement to any of those sums and any other sums the Defendants assert are due to them and, as noted above, we are pursuing litigation against them contesting all such claims.
On or about June 24, 2004, the SEC commenced a formal investigation into the issues raised by the Memorandum (see Note 17 of the Notes to the Consolidated Financial Statements). Although the SEC has not taken any significant action in furtherance of their investigation during 2006, we stand ready to cooperate with their investigation.
On May 28, 2004, the U.S. Attorney’s Office for the Southern District of Ohio, assisted by the Federal Bureau of Investigation, notified us that it has initiated an inquiry involving the subject matters covered by our internal investigation. Although the U.S. Attorney’s office and the FBI have not taken any significant action in furtherance of their investigation during 2006, we stand ready to cooperate with their investigation.
On June 24, 2004, the Internal Revenue Service (IRS) began an audit of tax years 1998 through 2003 and issued a series of data requests to us including issues raised in the Memorandum. The staff of the IRS requested that we provide certain documents, including but not limited to, matters concerning executive/director deferred compensation plans, management stock incentive plans and MVE financial statements. On September 1, 2005, the IRS issued an audit report for tax years 1998 through 2003 that showed proposed changes to our federal income tax liability for each of those years. The proposed changes resulted in a total tax deficiency, penalties and interest of approximately $23.9 million as of December 31, 2005. On November 4, 2005, we filed a written protest to one of the proposed changes. On April 3, 2006, the IRS conceded the proposed changes that we filed a written protest to and issued a revised audit report for tax years 1998 through 2003. The revised audit report resulted in a total tax deficiency, penalties and interest of approximately $1.2 million. We had previously made a deposit with the IRS of approximately $1.3 million that we requested on April 14, 2006 be applied to offset the $1.2 million tax deficiency, penalties and interest for tax years 1998 through 2003. The Joint Committee on Taxation completed its review of the revised audit report for tax years 1998 through 2003 and sent us a letter dated June 16, 2006 stating that it took no exception to the revised audit report.
20
Insurance Recovery Claim
On January 13, 2006, weMay 16, 2007, DPL filed a claim against one of our insurers, Associated Electric & Gaswith Energy Insurance Services (AEGIS), under a fiduciary liability policyMutual (EIM) to recoup legal feesexpenses associated with our litigation against three former executives. An arbitration of this matter was held on August 4, 2006. The arbitration panel ruled on or about September 12, 2006 that the AEGIS policy does not require an advance of defense expenses to us. Rather, the arbitration panel stated that we are required to file a written undertaking as a condition precedent to repay expenses finally established not to be insured. We have filed a written undertaking with AEGIS and will continue to pursue resolution of theThat claim through mediation and arbitration in 2007.is pending.
State Income Tax Audit Reviews
On February 13, 2006, we received correspondence from the Ohio Department of Taxation (ODT) notifying us that ODT has completed their examination and review of our Ohio Corporation Franchise Tax Returns for tax years 2002 through 2004 and that the final proposed audit adjustments result in a balance due of $90.8 million before interest and penalties. We have reviewed the proposed audit adjustments and are vigorously contesting the ODT findings and notice of assessment through all administrative and judicial means available. On March 29, 2006,June 27, 2008, we filed petitions for reassessmententered into a $42.0 million settlement agreement with the ODT to protest each assessment as well as request corrected assessments for eachresolving all outstanding audit issues and appeals, including uncertain tax year. On October 12, 2006, we signed a Memorandum of Understanding with the ODT that stated if the ODT’s positions are ultimately sustained in judicial proceedings, the total additional tax liability that we would be subject to for tax years 2002 through 2004 would be no more than $50.7 million before interest as opposed to the $90.8 million stated in the ODT’s correspondence of February 13, 2006. We believe we have recorded adequate tax reserves related to the proposed adjustments; however, we cannot predict the outcome, which could be material to our results of operations and cash flows.
We are also under audit review by various state agencies for tax years 2002 through 2004. We have also filed an appeal to the Ohio Board of Tax Appeals for tax years 1998 through 2001. Depending upon2006. The $42.0 million was paid to the outcome of these audits and the appeal, we may be required to increase our tax provision if actual amounts ultimately determined exceed recorded reserves. We believe we have adequate reservesODT in each tax jurisdiction but cannot predict the outcome of these audits.July 2008.
Labor Relations Unasserted ClaimSierra Club
In September 2006, we became aware of an unasserted claim under the Fair Labor Standards Act concerning the calculation of overtime rates for our unionized workforce. By agreement of Local #175 and DP&L, we jointly submitted the claim to a neutral third party who ruled in favor of DP&L’s position. As a result of this decision, Local #175 has decided not to pursue any claim against DP&L.
Environmental
Pending before the U.S. Supreme Court is a proceeding, Environmental Defense v. Duke Energy (Duke Energy) that does not involve DP&L as a party but may have a significant effect on the outcome of litigation described below that involves allegations of violations of the CAA. A key issue in that litigation that may be dispositive with respect to other pending cases is what test to apply for measuring whether modifications to electric generating units should trigger application of New Source Review (NSR) standards under the CAA. In general terms, the dispute is whether to measure pre- and post-modification emissions based on the rate of emissions per hour of operation or based on total emissions over time. The latter test, if applied, could trigger NSR requirements for equipment replacements that result in a plant running more often because it is more economical or dependable, even if the emissions rate per hour of operation does not change. A ruling is expected in the first or second quarter of 2007. DP&L cannot predict the outcome of the Duke Energy case. Moreover, in each of the cases identified below, there may be case-specific facts and allegations that may cause a judge to find that the U.S. Supreme Court’s ruling is based on different facts and allegations and is therefore not controlling in the case before the judge.
In September 2004, the Sierra Club filed a lawsuit against DP&Land the other owners of the Stuart Generating Stationgenerating station in the United States District Court for the Southern District of Ohio for alleged violations of the Clean Air Act (CAA) and the station’s operating permit. On August 7, 2008, a consent decree was filed in the United States District Court in full settlement of these CAA includingclaims. Under the terms of the consent decree, the co-owners of the Stuart generating station agreed to: (i) certain emission targets related to NOx, SO2 and particulate matter; (ii) make energy efficiency and renewable energy commitments that are conditioned on receiving Public Utilities Commission of Ohio approval for the recovery of costs; (iii) forfeit 5,500 sulfur dioxide allowances; and (iv) provide funding to a third party non-profit organization to establish a solar water heater rebate program. DP&L and the other owners of the station also entered into an attorney fee agreement to pay a portion of the Sierra Club’s attorney and expert witness fees. On October 23, 2008, the United States District Court approved the consent decree with funding for the third party non-profit organization set at $300,000. We have determined that the terms of the consent decree will not have a material impact on our overall results of operations, financial position or cash flows.
24
Table of Contents
Governmental and Regulatory Inquiries
On March 10, 2004, DPL’s and DP&L’s Corporate Controller, sent a memorandum (the Memorandum) to the Chairman of the Audit Committee of our Board of Directors. The Memorandum expressed the Corporate Controller’s “concerns, perspectives and viewpoints” regarding financial reporting and governance issues that may be decidedwithin DPL and DP&L. In response the Board initiated an internal investigation whose findings and recommendations led to corrective action taken regarding internal controls, process issues and the tone at the top.
On May 28, 2004, the U.S. Attorney’s Office for the Southern District of Ohio, assisted by the Supreme Court in the Duke Energy caseFederal Bureau of Investigation, notified DPL and other issues relating to alleged violations of opacity limitations. DP&L, on behalf of all co-owners, is leading that it had initiated an inquiry involving matters connected to our internal investigation. This inquiry remains pending.
On or about June 24, 2004, the defense of this matter. A sizable amount of discovery has taken place and expert reports are scheduled to be filed at various times from May through September, 2007. Dispositive motions are to be filed in January 2008. No trial date has been set yet.SEC commenced a formal investigation into the issues raised by the Memorandum. This investigation remains pending.
Additional information relating to legal proceedings involving DPLand DP&Lis contained in Item 1 —- ENVIRONMENTAL CONSIDERATIONS, Item 1 — COMPETITION AND REGULATION, and Item 8 — Note 1518 of Notes to Consolidated Financial Statements.Statements and is incorporated by reference into this Item.
Item 4 - Submission of Matters to a Vote of Security Holders
NONE
25
Table of Contents
PART II
Item 5 -Market for Registrant’s Common Equity, Related Stockholder Matters, and Issuer Purchases of Equity Securities
As of December 31, 2006,February 24, 2009, there were 24,43421,534 holders of record of DPL common equity, excluding individual participants in security position listings. The following table presents the high and low per share sales prices for DPL common stock as reported by the New York Stock Exchange for each quarter of 20062008 and 2005:2007:
| | 2006 | | 2005 | |
| | High | | Low | | High | | Low | |
First Quarter | | $ | 27.58 | | $ | 25.11 | | $ | 26.77 | | $ | 24.27 | |
Second Quarter | | $ | 27.82 | | $ | 26.25 | | $ | 27.67 | | $ | 24.08 | |
Third Quarter | | $ | 27.93 | | $ | 26.74 | | $ | 28.12 | | $ | 26.70 | |
Fourth Quarter | | $ | 28.72 | | $ | 27.16 | | $ | 28.01 | | $ | 24.55 | |
| | 2008 | | 2007 | |
| | High | | Low | | High | | Low | |
First Quarter | | $ | 30.18 | | $ | 24.58 | | $ | 31.44 | | $ | 27.56 | |
Second Quarter | | $ | 28.70 | | $ | 26.10 | | $ | 31.91 | | $ | 28.08 | |
Third Quarter | | $ | 26.76 | | $ | 23.00 | | $ | 29.36 | | $ | 26.04 | |
Fourth Quarter | | $ | 24.59 | | $ | 19.16 | | $ | 30.83 | | $ | 26.05 | |
DP&L’s common stock is held solely by DPL and, as a result, is not listed for trading on any stock exchange.
As long as DP&L preferred stock is outstanding, DP&L’s Amended Articles of Incorporation contain provisions restricting the payment of cash dividends on any of its common stock if, after giving effect to such dividend, the aggregate of all such dividends distributed subsequent to December 31, 1946 exceeds the net income of DP&L available for dividends on its Common Stock subsequent to December 31, 1946, plus $1.2 million. As of year-end,December 31, 2008, all earnings reinvested in the business of DP&L were available for DP&L common stock dividends. We expect all 20062008 earnings reinvested in the business of DP&L to be available for DP&L common stock dividends, payable to DPL.
On February 1, 2006, ourDecember 10, 2008, DPL’s Board of Directors authorized a 4%quarterly dividend rate increase onof approximately 4%, increasing the quarterly dividend per DPL’sDPL common stock, raisingshare from $.275 to $.285. If this increase were maintained, the annualannualized dividend on common sharesrate would increase from $0.96$1.10 per share to $1.00$1.14 per share. These dividends were paid in each quarter of 2006.
On February 1, 2007, our Board of Directors authorized a 4% dividend increase on DPL’s common stock, raising the annual dividend on common shares from $1.00 per share to $1.04 per share. These dividends will be paid each quarter during 2007.
Additional information concerning dividends paid on DPL common stock is set forth under Selected Quarterly Information in Item 8 — Financial Statements and Supplementary Data.
Information regarding our DPL’s equity compensation plans as of December 31, 2006,2008 is disclosed in Item 12 — Security Ownership of Certain Beneficial Owners and Management and Related Stockholder Matters, which incorporates such information by reference to ourfrom DPL’s proxy statement for the 20072009 Annual Meeting of Shareholders.
26
Table of Contents
The following graph compares the cumulative 5-year total return to shareholders on DPL Inc.’s common stock relative to the cumulative total returns of the Dow Jones US Industrial Average index, the S&P Utilities index, and the S&P Electric Utilities index. An investment of $1,000 (with reinvestment of all dividends) is assumed to have been made in the company’s common stock and in each index on December 31, 2003 and its relative performance is tracked through December 31, 2008.

Among DPL Inc., The Dow Jones US Industrial Average Index,
The S&P Electric Utilities Index And The S&P Utilities Index
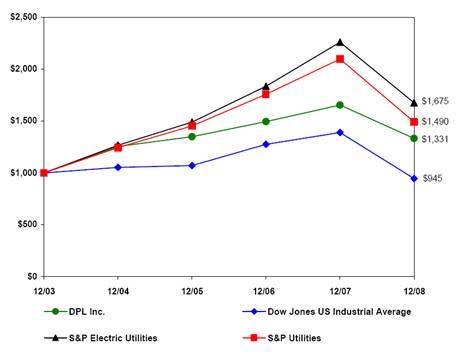
* $1000 invested on 12/31/03 in stock or index-including reinvestment of dividends.
Fiscal year ending December 31.
Copyright © 2009, Standard & Poor’s, a division of The McGraw-Hill Companies, Inc. All rights reserved.
www.researchdatagroup.com/S&P.htm
In U.S. Dollars | | 12/03 | | 12/04 | | 12/05 | | 12/06 | | 12/07 | | 12/08 | |
| | | | | | | | | | | | | |
DPL Inc. | | 1,000 | | 1,255 | | 1, 348 | | 1,495 | | 1,653 | | 1,331 | |
Dow Jones US Industrial Average | | 1,000 | | 1,053 | | 1,071 | | 1,275 | | 1,389 | | 945 | |
S&P Electric Utilities | | 1,000 | | 1,266 | | 1,489 | | 1,835 | | 2,259 | | 1,675 | |
S&P Utilities | | 1,000 | | 1,243 | | 1,452 | | 1,757 | | 2,097 | | 1,490 | |
The stock price performance included in this graph is not necessarily indicative of future stock price performance.
27
Table of Contents
Item 6 - Selected Financial Data
| | For years ended December 31, | |
($ in millions except per share amounts or as indicated) | | 2006 | | 2005 | | 2004 | | 2003 | | 2002 | |
DPL Inc. | | | | | | | | | | | |
Basic earnings (loss) per share of common stock: | | | | | | | | | | | |
Continuing operations (d) | | $ | 1.12 | | $ | 1.03 | | $ | 1.01 | | $ | 0.96 | | $ | 1.48 | |
Discontinued operations | | $ | 0.12 | | $ | 0.44 | | $ | 0.80 | | $ | 0.14 | | $ | (0.72 | ) |
Cumulative effect of accounting change (a) | | $ | — | | $ | (0.03 | ) | $ | — | | $ | 0.14 | | $ | — | |
Total basic earnings per common share | | $ | 1.24 | | $ | 1.44 | | $ | 1.81 | | $ | 1.24 | | $ | 0.76 | |
| | | | | | | | | | | |
Diluted earnings (loss) per share of common stock: | | | | | | | | | | | |
Continuing operations (d) | | $ | 1.03 | | $ | 0.97 | | $ | 1.00 | | $ | 0.94 | | $ | 1.42 | |
Discontinued operations | | $ | 0.12 | | $ | 0.41 | | $ | 0.78 | | $ | 0.14 | | $ | (0.69 | ) |
Cumulative effect of accounting change (a) | | $ | — | | $ | (0.03 | ) | $ | — | | $ | 0.14 | | $ | — | |
Total dilutive earnings per common share | | $ | 1.15 | | $ | 1.35 | | $ | 1.78 | | $ | 1.22 | | $ | 0.73 | |
| | | | | | | | | | | |
Dividends paid per share | | $ | 1.00 | | $ | 0.96 | | $ | 0.96 | | $ | 0.94 | | $ | 0.94 | |
Dividends payout ratio | | 80.7 | % | 66.7 | % | 53.0 | % | 75.8 | % | 123.7 | % |
| | | | | | | | | | | |
Total Electric sales (millions of kWh) | | 18,418 | | 17,906 | | 18,465 | | 19,345 | | 19,247 | |
| | | | | | | | | | | |
Results of Operations: | | | | | | | | | | | |
Revenues | | $ | 1,393.5 | | $ | 1,284.9 | | $ | 1,199.9 | | $ | 1,191.0 | | $ | 1,186.4 | |
Earnings from continuing operations, net of tax (d) | | $ | 125.6 | | $ | 124.7 | | $ | 121.5 | | $ | 114.9 | | $ | 177.6 | |
Earnings (loss) from discontinued operations, net of tax | | $ | 14.0 | | $ | 52.9 | | $ | 95.8 | | $ | 16.6 | | $ | (86.5 | ) |
Cumulative effect of accounting change, net of tax | | $ | — | | $ | (3.2 | ) | $ | — | | $ | 17.0 | | $ | — | |
Net Income | | $ | 139.6 | | $ | 174.4 | | $ | 217.3 | | $ | 148.5 | | $ | 91.1 | |
| | | | | | | | | | | |
Financial Position items at December 31, : | | | | | | | | | | | |
Total Assets | | $ | 3,612.2 | | $ | 3,791.7 | | $ | 4,165.5 | | $ | 4,444.7 | | $ | 4,277.7 | |
Long-term Debt (b) | | $ | 1,551.8 | | $ | 1,677.1 | | $ | 2,117.3 | | $ | 1,954.7 | | $ | 2,142.3 | |
Trust preferred securities (b) | | $ | — | | $ | — | | $ | — | | $ | — | | $ | 292.6 | |
Total construction additions | | $ | 351.6 | | $ | 179.7 | | $ | 98.0 | | $ | 102.2 | | $ | 165.9 | |
| | | | | | | | | | | |
Senior unsecured debt ratings at December 31, : (c) | | | | | | | | | | | |
Fitch Ratings | | BBB | | BBB- | | BB | | BBB | | BBB | |
Moody’s Investors Service | | Baa3 | | Ba1 | | Ba3 | | Ba1 | | Baa2 | |
Standard & Poor’s Corporation | | BB | | BB- | | B+ | | BB- | | BBB- | |
| | | | | | | | | | | |
Number of Shareholders - Common Stock | | 24,434 | | 26,601 | | 28,079 | | 30,366 | | 31,856 | |
| | | | | | | | | | | |
| |
The Dayton Power and Light Company | | | | | | | | | | | |
| | | | | | | | | | | |
Total Electric sales (millions of kWh) | | 18,418 | | 17,906 | | 18,465 | | 19,345 | | 19,247 | |
| | | | | | | | | | | |
Results of Operations: | | | | | | | | | | | |
Revenues | | $ | 1,385.2 | | $ | 1,276.9 | | $ | 1,192.2 | | $ | 1,183.4 | | $ | 1,175.8 | |
Earnings on Common Stock (d) | | $ | 241.6 | | $ | 210.9 | | $ | 208.1 | | $ | 238.5 | | $ | 244.7 | |
| | | | | | | | | | | |
Financial Position items at December 31, : | | | | | | | | | | | |
Total Assets | | $ | 3,090.3 | | $ | 2,738.6 | | $ | 2,641.4 | | $ | 2,660.1 | | $ | 2,757.3 | |
Long-term Debt (b) | | $ | 785.2 | | $ | 685.9 | | $ | 686.6 | | $ | 687.3 | | $ | 665.5 | |
| | | | | | | | | | | |
Senior secured debt ratings at December 31, : (c) | | | | | | | | | | | |
Fitch Ratings | | A | | A- | | BBB | | A | | A | |
Moody’s Investors Service | | A3 | | Baa1 | | Baa3 | | Baa1 | | A2 | |
Standard & Poor’s Corporation | | BBB | | BBB- | | BBB- | | BBB- | | BBB | |
| | | | | | | | | | | |
Number of Shareholders - Preferred Stock | | 290 | | 329 | | 357 | | 402 | | 426 | |
| | For years ended December 31, | |
($ in millions except per share amounts or as indicated) | | 2008 | | 2007 | | 2006 | | 2005 | | 2004 | |
| | | | | | | | | | | |
DPL Inc. | | | | | | | | | | | |
| | | | | | | | | | | |
Basic earnings (loss) per share of common stock: | | | | | | | | | | | |
Continuing operations (c) | | $ | 2.22 | | $ | 1.97 | | $ | 1.12 | | $ | 1.03 | | $ | 1.01 | |
Discontinued operations | | $ | — | | $ | 0.09 | | $ | 0.12 | | $ | 0.44 | | $ | 0.80 | |
Cumulative effect of accounting change (a) | | $ | — | | $ | — | | $ | — | | $ | (0.03 | ) | $ | — | |
Total basic earnings per common share | | $ | 2.22 | | $ | 2.06 | | $ | 1.24 | | $ | 1.44 | | $ | 1.81 | |
| | | | | | | | | | | |
Diluted earnings (loss) per share of common stock: | | | | | | | | | | | |
Continuing operations (c) | | $ | 2.12 | | $ | 1.80 | | $ | 1.03 | | $ | 0.97 | | $ | 1.00 | |
Discontinued operations | | $ | — | | $ | 0.08 | | $ | 0.12 | | $ | 0.41 | | $ | 0.78 | |
Cumulative effect of accounting change (a) | | $ | — | | $ | — | | $ | — | | $ | (0.03 | ) | $ | — | |
Total dilutive earnings per common share | | $ | 2.12 | | $ | 1.88 | | $ | 1.15 | | $ | 1.35 | | $ | 1.78 | |
| | | | | | | | | | | |
Dividends declared per share | | $ | 1.10 | | $ | 1.04 | | $ | 1.00 | | $ | 0.96 | | $ | 0.96 | |
Dividend payout ratio | | 49.5 | % | 50.5 | % | 80.7 | % | 66.7 | % | 53.0 | % |
| | | | | | | | | | | |
Total Electric sales (millions of kWh) | | 17,172 | | 18,598 | | 18,418 | | 17,906 | | 18,465 | |
| | | | | | | | | | | |
Results of Operations: | | | | | | | | | | | |
Revenues | | $ | 1,601.6 | | $ | 1,515.7 | | $ | 1,393.5 | | $ | 1,284.9 | | $ | 1,199.9 | |
Earnings from continuing operations, net of tax (c) | | $ | 244.5 | | $ | 211.8 | | $ | 125.6 | | $ | 124.7 | | $ | 121.5 | |
Earnings (loss) from discontinued operations, net of tax | | $ | — | | $ | 10.0 | | $ | 14.0 | | $ | 52.9 | | $ | 95.8 | |
Cumulative effect of accounting change, net of tax | | $ | — | | $ | — | | $ | — | | $ | (3.2 | ) | $ | — | |
Net Income | | $ | 244.5 | | $ | 221.8 | | $ | 139.6 | | $ | 174.4 | | $ | 217.3 | |
| | | | | | | | | | | |
Financial Position items at December 31, : | | | | | | | | | | | |
Total Assets | | $ | 3,675.1 | | $ | 3,566.6 | | $ | 3,612.2 | | $ | 3,791.7 | | $ | 4,165.5 | |
Long-term Debt (b) | | $ | 1,376.1 | | $ | 1,541.5 | | $ | 1,551.8 | | $ | 1,677.1 | | $ | 2,117.3 | |
Total construction additions | | $ | 227.8 | | $ | 346.7 | | $ | 351.6 | | $ | 179.7 | | $ | 98.0 | |
| | | | | | | | | | | |
Senior unsecured debt ratings at December 31, : | | | | | | | | | | | |
Fitch Ratings | | BBB+ | | BBB+ | | BBB | | BBB- | | BB | |
Moody’s Investors Service | | Baa2 | | Baa2 | | Baa3 | | Ba1 | | Ba3 | |
Standard & Poor’s Corporation | | BBB- | | BBB- | | BB | | BB- | | B+ | |
| | | | | | | | | | | |
Number of Shareholders - Common Stock | | 21,628 | | 22,771 | | 24,434 | | 26,601 | | 28,079 | |
| | | | | | | | | | | |
The Dayton Power and Light Company | | | | | | | | | | | |
| | | | | | | | | | | |
Total Electric sales (millions of kWh) | | 17,105 | | 18,598 | | 18,418 | | 17,906 | | 18,465 | |
| | | | | | | | | | | |
Results of Operations: | | | | | | | | | | | |
Revenues | | $ | 1,572.9 | | $ | 1,507.4 | | $ | 1,385.2 | | $ | 1,276.9 | | $ | 1,192.2 | |
Earnings on Common Stock (c) | | $ | 284.9 | | $ | 270.7 | | $ | 241.6 | | $ | 210.9 | | $ | 208.1 | |
| | | | | | | | | | | |
Financial Position items at December 31, : | | | | | | | | | | | |
Total Assets | | $ | 3,435.8 | | $ | 3,276.7 | | $ | 3,090.3 | | $ | 2,738.6 | | $ | 2,641.4 | |
Long-term Debt (b) | | $ | 884.0 | | $ | 874.6 | | $ | 785.2 | | $ | 685.9 | | $ | 686.6 | |
| | | | | | | | | | | |
Senior secured debt ratings at December 31,: | | | | | | | | | | | |
Fitch Ratings | | A+ | | A+ | | A | | A- | | BBB | |
Moody’s Investors Service | | A2 | | A2 | | A3 | | Baa1 | | Baa3 | |
Standard & Poor’s Corporation | | A- | | BBB+ | | BBB | | BBB- | | BBB- | |
| | | | | | | | | | | |
Number of Shareholders - Preferred Stock | | 256 | | 281 | | 290 | | 329 | | 357 | |
(a) In 2003,2005, we recorded a cumulative effect of an accounting change related to the adoption of SFAS 143 “Accounting for Asset Retirement Obligations”. In 2005, we recorded an additional obligation in response to FASB Interpretation Number (FIN) 47, “Accounting for Conditional Asset Retirement Obligations, an interpretation of FASB Statement No. 143.” See Item 7 - Management’s Discussion and Analysis of Financial Condition and Results of Operations.
(b) Excludes current maturities of long-term debt. Upon adoption of FASB Interpretation Number 46R “Consolidation of Variable Interest Entities (Revised December 2003) an interpretation of ARB No. 51” at December 31, 2003, DPL deconsolidated the DPL Capital Trust II.
(c) During 2006, our rating agencies upgraded our corporate credit and debt ratings. In February 2007, S&P upgraded the corporate credit rating and debt rating from BB to BBB- for DPL and from BBB to BBB+ for DP&L.
(d)In the fourth quarter of 2006, DPL entered into agreements to sell two of its peaking facilities resulting in a $44.2 million ($71 million pre-tax)impairment charge. The sale was finalized in April 2007. During 2006, DPL recorded a $37.3 million ($61.2 million pre-tax) charge for early redemption of debt. DP&L recordeda $2.5 million ($4.1 million pre-tax) charge for early redemption of debt.debt in 2006. In May 2007, DPL settled the litigation with the former executives resulting in a $19.7 million ($31 million pre-tax) gain. In April 2007, DPL also recouped legal costs associated with the litigation with the former executives from one of its insurers resulting in a $9.2 million ($14.5 million pre-tax) gain. In 2008, DPL sold coal and excess emission allowances to various counterparties, realizing net gains of $58.2 million ($83.4 million pre-tax) and $24.3 million ($34.8 million pre-tax), respectively. Also, in June 2008, DPL entered into a $42 million tax settlement with Ohio Department of Taxation resulting in a recorded income tax benefit of $8.5 million.
2428
Table of Contents
Item 7 - Management’s Discussion and Analysis of Financial Condition and Results of Operations
This report includes the combined filing of DPL Inc. (DPL) and The Dayton Power and Light Company(DP&L). DP&L is the principal subsidiary of DPL providing approximately 98% of DPL’s total consolidated revenue and approximately 93% of DPL’s total consolidated asset base. Throughout this report the terms we, us, our and ours are used to refer to both DPL and DP&L, respectively and altogether, unless the context indicates otherwise. Discussions or areas of this report that apply only to DPL or DP&L will clearly be noted in the section.
Certain statements contained in this discussion are “forward-looking statements” within the meaning of the Private Securities Litigation Reform Act of 1995. Matters discussed in this report that relate to events or developments that are expected to occur in the future, including management’s expectations, strategic objectives, business prospects, anticipated economic performance and financial condition and other similar matters constitute forward-looking statements. Forward-looking statements are based on management’s beliefs, assumptions and expectations of our future economic performance, taking into account the information currently available to management. These statements are not statements of historical fact.fact and are typically identified by terms and phrases such as “anticipate,” “believe,” “intend,” “estimate,” “expect,” “continue,” “should,” “could,” “may,” “plan,” “project,” “predict,” “will” and similar expressions. Such forward-looking statements are subject to risks and uncertainties, and investors are cautioned that outcomes and results may vary materially from those projected due to various factors beyond our control, including but not limited to: abnormal or severe weather;weather and catastrophic weather-related damage; unusual maintenance or repair requirements; changes in fuel costs and purchased power, coal, environmental emissions, natural gas and other commodity prices; volatility and changes in markets for electricity and other energy-related commodities; performance of our suppliers; increased competition;competition and deregulation in the electric utility industry; increased competition in the retail generation market; changes in interest rates; state, federal and foreign legislative and regulatory initiatives that affect cost and investment recovery, emission levels, rate structures or tax laws; changes in federal and/or state environmental laws and decisions;regulations to which DPL and its subsidiaries are subject; the development and operation of Regional Transmission Organizations (RTOs), including PJM Interconnection, L.L.C. (PJM) to which DPL’s operating subsidiary (DP&L) has given control of its transmission functions; changes in our purchasing processes, pricing, delays, contractor and supplier performance and availability; significant delays associated with large construction projects; growth in our service territory and changes in demand and demographic patterns; changes in accounting rules;rules and the effect of accounting pronouncements issued periodically by accounting standard-setting bodies; financial market conditions; the outcomes of litigation and regulatory investigations, proceedings or inquiries; general economic conditions.conditions; and the risks and other factors discussed in this report and other DPL and DP&L filings with the Securities and Exchange Commission.
Forward-looking statements speak only as of the date of the document in which they are made. These forward-looking statements are identified by terms and phrases such as “anticipate”, “believe”, “intend”, “estimate”, “expect”, “continue”, “should”, “could”, “may”, “plan”, “project”, “predict”, “will”, and similar expressions. We disclaim any obligation or undertaking to provide any updates or revisions to any forward-looking statement to reflect any change in our expectations or any change in events, conditions or circumstances on which the forward-looking statement is based.
The following discussion should be read in conjunction with the accompanying financials and related footnotes included in Item 8 — Financial Statements and Supplementary Data.
BUSINESS OVERVIEW
This report includes the combined filing of DPL Inc. (DPL) and The Dayton Power and Light Company(DP&L). DP&L is the principal subsidiary of DPL providing approximately 99% of DPL’s total consolidated revenue and approximately 86% of DPL’s total consolidated asset base. Throughout this report the terms we, us, our and ours are used to refer to both DPL and DP&L, respectively and altogether, unless the context indicates otherwise. Discussions or areas of this report that apply only to DPL or DP&L will clearly be noted in the section. Historically, DPL and DP&L have filed separate SEC filings. Beginning with this report and in the future, DPL Inc. and The Dayton Power and Light Company will file combined SEC reports on an interium and annual basis.
DPL is a regional electric energy and utility company and through its principal subsidiary, DP&L,, is primarily engaged in the generation, transmission and distribution of electricity in West Central Ohio. DPL and DP&L strive to achieve disciplined growth in energy margins while limiting volatility in both cash flows and earnings and to achieve stable, long-term growth through efficient operations and strong customer and regulatory relations. More specifically, DPLandDP&L’s strategy is to match energy supply with load or customer demand, maximizing profits while effectively managing exposure to movements in energy and fuel prices and utilizing the transmission and distribution assets that transfer electricity at the most efficient cost while maintaining the highest level of customer service and reliability.
We operate and manage generation assets and are exposed to a number of risks through this management.risks. These risks include but are not limited to electricity wholesale price risk, fuel supply and price risk and power plant performance. We attempt to manage these risks through various means. For instance, we operate a portfolio of wholly ownedwholly-owned and jointly ownedjointly-owned generation assets that is diversified as to fuelcoal source, cost structure and operating characteristics. We are focused on the operating efficiency of these power plants and maintaining their availability.
29
Table of Contents
We operate and manage transmission and distribution assets in a rate-regulated environment. Accordingly, this subjects us to regulatory risk in terms of the costs that theywe may recover and the investment returns that theywe may collect in customer rates. We are focused on delivering electricity and to maintainmaintaining high standards of customer service and reliability in a cost-effective manner.
We operate in a regulated and deregulated environment. The electric utility industry has historically operated in a regulated environment. However, in recent years,
As we look forward, there have beenare a number of federalissues that we believe may have a significant impact on our business and state regulatoryoperations described above. The following issues mentioned below are not meant to be exhaustive but to provide insight to matters that have or are likely to have an effect on our industry and legislative decisions aimedbusiness:
CREDIT MARKETS
The current global credit crisis may adversely affect our business and financial results. Since mid-2007, and particularly during the second half of 2008, the financial services industry and the securities markets generally were materially and adversely affected by significant declines in the values of nearly all asset classes and by a serious lack of liquidity. This was initially triggered by declines in the values of subprime mortgages, but spread to all mortgage and real estate asset classes, to leveraged bank loans and to nearly all asset classes, including equities. Liquidity and credit concerns were further exacerbated in September 2008 with Lehman Brothers’ bankruptcy filing, the sale of Merrill Lynch to Bank of America, the U.S. government conservatorship of Fannie Mae and Freddie Mac, and the U.S. government loan to AIG. Because of this, the ability of corporations to obtain funds through the issuance of debt was negatively impacted. Disruptions in the credit markets make it harder and more expensive to obtain funding for our business. We issue debt to cover the costs of certain of our operations and expenditures and the inability to issue such debt on reasonable terms, or at promoting competitionall, could negatively affect our business and providingfinancial results. If our available funding is limited or we are forced to fund our operations at a higher cost, these conditions may require us to curtail our business activities and increase our cost of funding, both of which could reduce our profitability.
REGULATORY ENVIRONMENT
·Clean Air Interstate Rule (CAIR) decision by the U.S. Court of Appeals for the District of Columbia Circuit
On July 11, 2008, the United States Court of Appeals for the District of Columbia Circuit issued a decision that vacated the United States Environmental Protection Agency’s (USEPA) CAIR and its associated Federal Implementation Plan. This decision remanded these issues back to the USEPA. The USEPA issued CAIR on March 10, 2005 to regulate certain upwind states with respect to fine particulate matter and ozone. CAIR created interstate trading programs for annual nitrogen oxide (NOx) emission allowances and made modifications to an existing trading program for sulfur dioxide (SO2) that were to take effect in 2010. The court’s decision, in part, invalidated the new NOx annual emission allowance trading program and the modifications to the SO2 emission trading program, and created uncertainty regarding future NOx and SO2 emission reduction requirements and their timing. On December 23, 2008, the court reversed part of its decision that vacated CAIR. Thus, CAIR currently remains in effect, but the USEPA remains subject to the court’s order to revise the program.
In the fourth quarter of 2007, DP&L began a program for selling excess emission allowances, including annual NOx emission allowances and SO2 emission allowances that were the subject of CAIR trading programs. In subsequent quarters, DP&L recognized gains from the sale of excess emission allowances to third parties. The court’s CAIR decision has affected the trading market for excess allowances and impacted DP&L’s program for selling additional excess allowances. The overall impact of the court’s decision, and of the actions the USEPA or others will take in response to this decision, on DPL and DP&L is not fully known at this time and could have an adverse effect on us. In January 2009, we resumed selling excess allowances due to the revival of the trading market.
·Senate Bill 221 and ESP filing
On May 1, 2008, substitute Senate Bill 221, an Ohio electric energy bill, was signed by the Governor and went into effect July 31, 2008. In compliance with SB 221, DP&L filed its electric security plan at the PUCO on October 10, 2008. This plan contained three parts: 1) a standard offer plan; 2) a customer choice. Market participantsconservation and energy management plan; and 3) an alternative energy plan. The standard offer plan stated that DP&L intends to maintain its current rate plan through December 31, 2010, and addressed compliance issues related to the PUCO rules. On February 24, 2009, DP&L filed a Stipulation and Recommendation (the Stipulation) signed by the Staff of the PUCO, the Office of the Ohio Consumers’ Counsel and various intervening parties. The PUCO has the authority to approve, modify or reject the Stipulation. The Stipulation is further discussed under Ohio Retail Rates in Item 1 — COMPETITION AND REGULATION. A final decision from the PUCO regarding the Stipulation is expected by the end of the second quarter of 2009.
30
Table of Contents
·Greenhouse Gases
The rules issued by the United States Environmental Protection Agency (USEPA) and Ohio Environmental Protection Agency ( Ohio EPA) that require substantial reductions in SO2, mercury and NOX emissions may impact our business and operations. We are installing (and have therefore created new business modelsinstalled) emission control technology and are taking other measures to exploit opportunities. The marketplace is now comprised of independent power producers, energy marketers and traders, energy merchants, transmission andcomply with required reductions.
distribution providers and retail energy suppliers. There have also been new market entrants and activity among the traditional participants, such as mergers, acquisitions, asset sales and spin-offs of lines of business.
In addition transmission systemsto the requirements related to emissions of SO2, NOX and mercury noted above, there is a growing concern nationally and internationally about global climate change and the contribution of emissions of greenhouse gases, including most significantly, carbon dioxide (CO2). This concern has led to increased interest in legislation at the federal level and actions at the state level as well as litigation relating to greenhouse gas emissions, including a recent U.S. Supreme Court decision holding that the USEPA has the authority to regulate CO2 emissions from motor vehicles under the Clean Air Act (CAA). Increased pressure for carbon dioxide emissions reduction is also coming from investor organizations and the international community. If legislation or regulations are being operated by Regional Transmission Organizations (RTOs).
As partpassed at the federal or state levels imposing mandatory reductions of Ohio’s electric deregulation law, all ofCO2 and other greenhouse gases on generation facilities, the state’s investor-owned utilities were requiredcost to join an RTO. DPL and DP&L successfully integrated its 1,000 miles of high-voltage transmission intosuch reductions could be material.
·Storm Costs
On September 14, 2008, the Midwest region was severely affected by hurricane-force winds which resulted in significant property damage and disruptions to the supply of electric energy to retail customers. Through December 31, 2008, we deferred approximately $13 million of incremental operation and maintenance costs associated with storm restoration efforts related to this storm and other major storms in 2008. On December 31, 2008, DP&L filed a request for an accounting order with the PUCO seeking to defer these incremental costs. On January 14, 2009 the PUCO granted that authority.
·Transmission, Ancillary Service and Capacity Costs
As a member of PJM Interconnection, L.L.C. (PJM) RTO, DP&L is subject to charges associated with PJM operations as approved by the Federal Energy Regulatory Commission (FERC). On November 7, 2008, DP&L filed a request at the PUCO for authority to defer costs associated with transmission, capacity, ancillary service and other PJM related charges incurred as a member of PJM. DP&L sought deferral until such time as it files to seek recovery of these costs from retail ratepayers. On February 19, 2009, the PUCO approved DP&L’s request to defer these costs. DP&L anticipates filing a request with the PUCO before the end of April 2009 seeking to recover these costs.
FUEL AND RELATED COSTS
·Fuel and Commodity Prices
Recently, the coal market has experienced significant price volatility. We are now in October 2004. As an RTO, PJM’s rolea global market for coal in which our domestic price is increasingly affected by international supply disruptions and demand balance. Coal exports from the U.S. have increased significantly in recent years. In addition, domestic issues like government-imposed direct costs and permitting issues are affecting mining costs and supply availability. Our approach is to administer anhedge the fuel costs for our anticipated electric marketplacesales. For the years ending December 31, 2009 and ensure2010, we have hedged our coal requirements with coal mine operators and financial institutions to meet our committed sales. We may not be able to hedge the reliabilityentire exposure of our operations from commodity price volatility. To the extent our suppliers do not meet their contractual commitments or we are not hedged against price volatility, our results of operations, financial position or cash flows could be materially affected. As part of its electric security plan filing, DP&L requested regulatory authority to defer fuel and fuel related costs that exceed the amount that is in current rates. On February 24, 2009, DP&L filed a Stipulation and Recommendation (the Stipulation) signed by the Staff of the high-voltage electric power system serving 51 million people in all or parts of Delaware, Illinois, Indiana, Kentucky, Maryland, Michigan, New Jersey, North Carolina, Ohio, Pennsylvania, Tennessee, Virginia, West Virginia andPUCO, the District of Columbia. PJM coordinates and directs the operationOffice of the region’s transmission grid; administersOhio Consumers’ Counsel and various intervening parties. The Stipulation is further discussed under Ohio Retail Rates in Item 1 — COMPETITION AND REGULATION. The Stipulation includes the world’s largest competitive wholesale electricityimplementation of a fuel and purchased power recovery mechanism beginning January 1, 2010 which will track and adjust fuel costs on a quarterly basis. The PUCO has the authority to approve, modify or reject the Stipulation. A final decision from the PUCO regarding the Stipulation is expected by the end of the second quarter of 2009.
31
Table of Contents
·Sales of Coal and Excess Emission Allowances
During 2008, DP&L sold coal and excess emission allowances to various counterparties realizing total net gains of $83.4 million and $34.8 million, respectively. These gains are recorded as a component of DP&L’s fuel costs and reflected in operating income. Coal sales are impacted by a range of factors but can be largely attributed to the following: variation in power demand, the market price of power compared to the cost to produce power; as well as optimization opportunities in the coal market. Sales of excess emission allowances are impacted, among other factors, by: general economic conditions; fluctuations in market demand and plans regional transmission expansion improvementspricing; availability of excess inventory available for sale; and changes to maintain grid reliabilitythe regulatory environment in which we operate. The combined impact of these factors on our ability to sell coal and relieve congestion.emission allowances in 2009 and beyond is not fully known at this time and could materially impact the amount of gains that will be recognized in the future.
2006 FINANCIAL OVERVIEW
As more fully discussed in later sections of this MD&A, the following were the significant themes and events for 2006:2008:
· For the year ended December 31, 2008, DPL’s basic and diluted earnings per share (EPS) of $2.22 and $2.12, respectively, increased over the basic and dilutive EPS for the same period in 2007 by $0.16 and $0.24, respectively.
· Revenues for DPL and DP&L increased by 6% and 4%, respectively, over 2007 primarily due to increased RTO capacity and other RTO revenues, and increased retail prices, partially offset by decreased retail and wholesale sales volume.
· Fuel costs for both DPL and DP&L, excluding the gains from the sale of emission allowances discussed below, decreased by 16% over 2007 mainly due to decreased generation output and gains from the sale of coal (see below).
· During the year ended December 31, 2008, DP&L sold excess emission allowances to various counterparties realizing total net gains of $34.8 million compared to net gains of $1.2 million realized in 2007.
· During 2008, DP&L also realized total net gains of $83.4 million from coal sales to various counterparties related to both DP&L and partner-operated generating facilities. In 2007, the net gains realized from similar sales amounted to $0.6 million.
Net gains realized from both emission allowance and coal sales are recorded as a component of fuel costs and reflected in operating income.
· Purchased power costs for DPL and DP&L increased by 31% and 27%, respectively, over 2007 mainly due to increased RTO capacity and other RTO charges, partially offset by reduced purchased power volumes.
· DPL’sDPL revenues increased 8% over 2005 resulting fromredeemed the rate stabilization surcharge and other regulated asset recovery riders improving gross margin and profitability. DPL’s fuel, purchased power costs, and operation and maintenance increased over 2005 by 4%, 19% and 21%, respectively. DPL’s cash flow from operations of $308.7$100 million was in line with the cash flow from operations of $314.7 million in 2005.6.25% Senior Notes on their May 15, 2008 maturity date.
· On June 27, 2008, DP&L’sDPL revenues increased 8% over 2005 resulting fromentered into a $42.0 million settlement agreement with the rate stabilization surchargeOhio Department of Taxation (ODT) resolving all outstanding audit issues and other regulated asset recovery riders improving gross margin and profitability. DP&L’s fuel, purchased power costs, and operation and maintenance increased over 2005 by 5%, 17% and 17%, respectively. DP&L’s cash flow from operationsappeals, including uncertain tax positions for tax years 1998 through 2006. The $42.0 million payment was made to the ODT in July 2008. Due to this settlement agreement, the balance of $365.7the unrecognized state tax liabilities recorded at March 31, 2008, in the amount of $56.3 million, was reversed, resulting in line with the cash flow from operationsa recorded income tax benefit in 2008 of $366.8$8.5 million, in 2005.net of federal tax impact.
· In connection with DPLE’s decision to sell the Greenville Station and Darby Station electric peaking generation facilities,On September 18, 2008, Lehman Brothers Inc. exercised 12 million DPL concluded thatwarrants under a cashless exercise transaction. Each warrant was exercisable for one common share, subject to anti-dilution adjustments (e.g., stock split, stock dividend) at an impairment charge forexercise price of $21.00 per common share. This exercise resulted in the Greenville Station and Darby Station assets was required. During the fourth quarterissuance of 2006,2.3 million shares of DPL recorded a $71.0 million impairment charge to record the fair market write-downcommon stock from DPL’s shares held in treasury.
32
Table of the assets and other associated costs related to the sale.Contents
· On September 13, 2006, theNovember 15, 2007, The Ohio Air Quality Development Authority (OAQDA) issued $100$90 million of 4.80% fixed interestcollateralized, variable rate OAQDA Revenue Bonds, 20062007 Series A due SeptemberNovember 1, 2036.2040. In turn, DP&L then borrowed these funds from the OAQDA. The payment of principal and interest on the bonds when due was insured by an insurance policy issued by Financial Guaranty Insurance Company (FGIC). During the first quarter of 2008, all three credit rating agencies downgraded FGIC. These downgrades, as well as the downgrades of our major bond insurers, resulted in auction rate security bonds carrying substantially higher interest rates in succeeding auctions and incurring failed auctions. On April 4, 2008, DP&L converted the 2007 Series A Bonds from Auction Rate Securities to Variable Rate Demand Notes. At that time, DP&L purchased these notes out of the market and placed them with the Trustee to be held until the capital markets corrected. These notes were redeemed in December 2008 as discussed in the following paragraph.
On December 4, 2008, the OAQDA issued $100 million of collateralized, variable rate Revenue Refunding Bonds Series A and B due November 1, 2040. In turn, DP&L borrowed these funds from the OAQDA. The payment of principal and interest on the bonds when due is backed by a standby letter of credit issued by a syndicated bank group credit facility. DP&L is using the proceeds from$10 million of these borrowingsbonds to assist in financingfinance its portion of the costs of acquiring, constructing and installing certain solid waste disposal and air quality facilities at Miami Fort, Killen and Stuart Generating Stations.the Conesville generation station. The remaining $90 million was used to redeem the 2007 Series A Bonds. The above transactions are further discussed in Note 7 of Notes to Consolidated Financial Statements.
· On July 27, 2005,December 10, 2008, DPL’s Board of Directors authorized a quarterly dividend rate increase of approximately 4%, increasing the repurchase of upquarterly dividend per DPL common share from $.275 to $400 million of common stock$.285. If this increase were maintained, the annualized dividend rate would increase from time$1.10 per share to time in the open market or through private transactions. DPL completed this share repurchase program on August 21, 2006. These Board-authorized repurchase transactions resulted in 14.9 million shares being repurchased, or 11.7% of the outstanding stock at December 31, 2005 at an average price of $26.91$1.14 per share. These shares
· The four FGD units were completed, tested and are currently held as treasury sharesfully operational at DPL.the Stuart station. The increased operating costs and depreciation in 2008 are mainly associated with these units.
33
Table of Contents
RESULTS OF OPERATIONS — DPL Inc.
DPL’s results of operations include the results of its subsidiaries, including the consolidated results of its principal subsidiary The Dayton Power and Light Company (DP&L)&L and all of DP&L’s consolidated subsidiaries. DP&L provides approximately 99%98% of the total revenues of DPL. All material intercompany accounts and transactions have been eliminated in consolidation. A separate specific discussion of the results of operations for DP&L is presented elsewhere in this report.
FinancialIncome Statement Highlights -— DPL
$ in millions | | 2006 | | 2005 | | 2004 | |
| | | | | | | |
Revenues: | | | | | | | |
Retail | | $ | 1,131.4 | | $ | 1,066.6 | | $ | 1,036.8 | |
Wholesale | | 174.1 | | 133.3 | | 135.1 | |
RTO ancillary | | 77.2 | | 74.4 | | 17.9 | |
Other revenues, net of fuel costs | | 10.8 | | 10.6 | | 10.1 | |
Total Revenues | | $ | 1,393.5 | | $ | 1,284.9 | | $ | 1,199.9 | |
| | | | | | | |
Less: Fuel | | 349.1 | | 336.9 | | 263.1 | |
Purchased power (a) | | 159.0 | | 133.3 | | 113.1 | |
Gross margins (b) | | $ | 885.4 | | $ | 814.7 | | $ | 823.7 | |
| | | | | | | |
Gross margins as a percentage of revenues | | 63.5 | % | 63.4 | % | 68.6 | % |
| | | | | | | |
Operating Income | | $ | 281.0 | | $ | 339.1 | | $ | 336.5 | |
| | | | | | | |
Earnings per share: | | | | | | | |
Continuing Operations | | $ | 1.12 | | $ | 1.03 | | $ | 1.01 | |
Discontinued Operations | | 0.12 | | 0.44 | | 0.80 | |
Cumulative effect of accounting change | | — | | (0.03 | ) | — | |
Net Income | | $ | 1.24 | | $ | 1.44 | | $ | 1.81 | |
$ in millions | | 2008 | | 2007 | | 2006 | |
| | | | | | | |
Revenues: | | | | | | | |
Retail | | $ | 1,223.3 | | $ | 1,206.2 | | $ | 1,131.4 | |
Wholesale | | 149.9 | | 180.3 | | 174.1 | |
RTO revenues | | 110.4 | | 87.4 | | 77.2 | |
RTO capacity revenues | | 106.9 | | 30.9 | | — | |
Other revenues | | 11.1 | | 10.9 | | 10.8 | |
Total revenues | | $ | 1,601.6 | | $ | 1,515.7 | | $ | 1,393.5 | |
| | | | | | | |
Cost of revenues: | | | | | | | |
Fuel costs | | $ | 361.2 | | $ | 330.0 | | $ | 349.1 | |
Gains from sale of coal | | (83.4 | ) | (0.6 | ) | — | |
Gains from sale of emission allowances | | (34.8 | ) | (1.2 | ) | — | |
Net fuel | | 243.0 | | 328.2 | | 349.1 | |
| | | | | | | |
Purchased power | | 148.7 | | 156.9 | | 109.6 | |
RTO charges | | 127.8 | | 101.9 | | 49.4 | |
RTO capacity charges | | 100.9 | | 28.4 | | — | |
Total purchased power | | 377.4 | | 287.2 | | 159.0 | |
| | | | | | | |
Total cost of revenues | | $ | 620.4 | | $ | 615.4 | | $ | 508.1 | |
| | | | | | | |
Gross margins (a) | | $ | 981.2 | | $ | 900.3 | | $ | 885.4 | |
| | | | | | | |
Gross margin as a percentage of revenues | | 61.3 | % | 59.4 | % | 63.5 | % |
| | | | | | | |
Operating income | | $ | 435.5 | | $ | 370.1 | | $ | 281.0 | |
| | | | | | | |
Basic earnings per share: | | | | | | | |
Continuing operations | | $ | 2.22 | | $ | 1.97 | | $ | 1.12 | |
Discontinued operations | | — | | 0.09 | | 0.12 | |
Total basic | | $ | 2.22 | | $ | 2.06 | | $ | 1.24 | |
| | | | | | | |
Diluted earnings per share: | | | | | | | |
Continuing operations | | $ | 2.12 | | $ | 1.80 | | $ | 1.03 | |
Discontinued operations | | — | | 0.08 | | 0.12 | |
Total diluted | | $ | 2.12 | | $ | 1.88 | | $ | 1.15 | |
(a)Purchased power includes ancillary charges from PJM of $49.4 million, $48.5 million and $12.3 million for 2006, 2005 and 2004 respectively.
(b) For purposes of discussing operating results, we present and discuss gross margins. This format is useful to investors because it allows analysis and comparability of operating trends and includes the same information that is used by management to make decisions regarding our financial performance.
DPL Inc. - - 2006 Compared to 2005
For the year ended December 31, 2006, basic earnings per share34
Table of $1.24 decreased $0.20 from the same period in 2005. The decline was primarily due to a $0.32 per share decrease in Earnings from Discontinued Operations reflecting lower investment income and lower gains on the sale of investments. Most of the investments were sold during 2005. Basic earnings per share for Earnings from Continuing Operations were $0.09 higher in 2006 compared to 2005. This increase is the result of higher revenues relating to the impact of the rate stabilization plan and lower interest expense, partially offset by a $71.0 million impairment charge for the peaking units, higher fuel and purchased power costs and higher operation and maintenance expenses.
DPL Inc. - - 2005 Compared to 2004
For the year ended December 31, 2005, basic earnings per share of $1.44 decreased $0.37 from the same period in 2004. The decline was primarily due to a $0.36 per share decrease in Earnings from Discontinued Operations reflecting lower investment income, partially offset by the gain on the sale of investments (In February 2005, DPL agreed to sell its respective interests in forty-six private equity funds). Basic earnings per share for Earnings from Continuing Operations were $0.02 higher in 2005 compared to 2004. This increase is the result of higher revenues relating to higher retail sales volume and ancillary revenues associated with the participation in PJM. Also contributing to this increase were lower operation and maintenance expenses driven by lower corporate costs, higher investment income and lower interest expense related to debt refinancing in 2004. These increases were partially offset by higher fuel and purchased power costs and a $61.2 million charge for the early redemption of debt.Contents
For 2005, basic earnings per share includes a $0.03 after-tax charge related to the cumulative effect of a change in accounting for asset retirement obligations at certain power generating stations.
DPL Inc. — Revenues
Retail customers, especially residential and commercial customers, consume more electricity on warmer and colder days. Therefore, DPL’s retail sales volume is impacted by the number of heating and cooling degree days occurring during a year. Since DPL plans to utilize its internal generating capacity to supply its retail customers’ needs first, increases in retail demand will decrease the volume of internal generation available to be sold in the wholesale market and vice versa.
The wholesale market covers a multi-state area and settles on an hourly basis throughout the year. Factors impacting DPL’s wholesale sales volume each hour of the year include wholesale market prices; DPL’s retail demand; retail demand elsewhere throughout the entire wholesale market area; and DPL and non-DPL plants’ availability to sell into the wholesale market and weather conditions across the multi-state region. DPL’s plan is to make wholesale sales when market prices allow for the economic operation of its generation facilities not being utilized to meet its retail demand.
The following table provides a summary of changes in revenues from prior periods:
$ in millions | | 2008 vs. 2007 | | 2007 vs. 2006 | |
| | | | | |
Retail | | | | | |
Rate | | $ | 45.1 | | $ | 38.4 | |
Volume | | (23.7 | ) | 34.1 | |
Other miscellaneous | | (4.3 | ) | 2.3 | |
Total retail change | | $ | 17.1 | | $ | 74.8 | |
| | | | | |
Wholesale | | | | | |
Rate | | $ | 29.8 | | $ | 19.8 | |
Volume | | (60.2 | ) | (13.6 | ) |
Total wholesale change | | $ | (30.4 | ) | $ | 6.2 | |
| | | | | |
RTO capacity and other | | | | | |
RTO capacity and other revenues | | $ | 99.2 | | $ | 41.2 | |
| | | | | |
Total revenues change | | $ | 85.9 | | $ | 122.2 | |
For the year ended December 31, 2006,2008, revenues increased $108.6$85.9 million, or 8% to $1,393.5 from $1,284.9 for6%, over the same period in the prior year. This increase was primarily the result of higher average rates for retail rates and higher wholesale sales volume,and an increase in RTO capacity and other RTO revenues, partially offset by lower retail and wholesale sales volume and lower average rates for wholesale revenues. Retailvolume.
· The net increase in retail revenues increased $64.8 millionresults primarily resulting from ana 4% increase in average retail rates relateddue largely to the Rate Stabilization Plan surcharge and other regulated asset recovery riders resulting in a $93.0 million price variance, partially offset by lower retail sales volume resulting in a $29.4 million volume variance. Sales volume declined 3% in 2006 from 2005 due to milder weather which resulted in lower heating and cooling degree days. Heating degree days declined 11% and cooling degree days declined 20%. Wholesale revenue increased $40.8 million primarily related to a 34% increase in sales volume (935 GWh) resulting in a $45.8 million volume variance,second phase of an environmental investment rider, partially offset by a 2% decrease in sales volume.
· The decrease in retail sales volume is primarily a result of milder weather which caused cooling degree days to decrease 26% and a 6% decrease in volume of sales to industrial customers. The lower sales to industrial customers is largely a direct result of the downturn in the economy which has severely affected the automotive and other related industries in the region resulting in plant closures and reduced production. These decreases were partially offset by an increase in heating degree days of 9%.
· The net decrease in wholesale revenues is primarily a result of a 33% decrease in sales volume due largely to unplanned outages, partially offset by a 25% increase in wholesale average rates resulting in a $5.0 million price variance. For 2006, therates.
· RTO ancillarycapacity and other RTO revenues, increased $2.8 million or 4% to $77.2 million from $74.4 million in 2005. RTO ancillary revenuesconsisting primarily consist of compensation for use of DP&L’s transmission assets, regulation services, reactive supply and operating reserves.reserves, and capacity payments under the RPM construct, increased $99.2 million over the same period of the prior year. This increase primarily resulted from additional income realized from the PJM capacity auction and other RTO revenues.
35
Table of Contents
For the year ended December 31, 2005,2007, revenues of $1,284.9 million increased $85$122.2 million, or 7% from $1,199.9 million for9%, over the same period in 2004.the prior year. This increase was primarily the result of increased retail sales volume, higher average rates for retail and wholesale revenues,sales, higher retail sales volume and ancillaryan increase in RTO capacity and other RTO revenues, associated with participation in PJM that was partially offset by lower wholesale sales volume. Retail
· The net increase in retail revenues increased $29.8 million,results primarily resulting from increaseda 3% increase in weather driven sales volume as total degree days increased 9%, and a 3% increase in average retail rates primarily relating to the environmental investment and storm recovery riders.
· The net increase in wholesale revenues is primarily a result of $32.8 million and $2.8 milliona 12% increase in higherwholesale average rates, partially offset by $5.8an 8% decrease in sales volume.
· RTO capacity and other RTO revenues, consisting primarily of compensation for use of DP&L’s transmission assets, regulation services, reactive supply and operating reserves and capacity payments under the RPM construct, increased $41.2 million over the same period in lower miscellaneous retail revenues reflecting2006. This increase primarily resulted from additional income realized from the PJM capacity auction, the PJM transmission services providedlosses and congestion credits, and from other RTO revenues.
DPL Inc. — Cost of Revenues
For the year ended December 31, 2008:
· Fuel costs, which include coal (net of sales), gas, oil, and emission allowance sales and costs, decreased $85.2 million, or 26%, compared to the same period in 2004 that2007, primarily due to increases in net gains of $33.6 million from the sale of DP&L’s excess emission allowances and $82.8 million realized from the sale of DP&L’s coal combined with a decrease in the usage of fuel due mainly to a 6% decrease in generation output largely attributable to unplanned outages. These decreases were partially offset by increased fuel prices. The successful installation of FGD equipment at Miami Fort, Killen and Stuart stations has allowed us the ability to burn coal with a wide range of sulfur content and, accordingly, we purchase and sell coal as we seek to achieve optimum levels of production efficiency. Gains or losses from sales of coal and emission allowances are now provided through PJM. Residential customers comprisedrecorded as components of fuel costs.
· Purchased power costs increased $90.2 million, or 31%, compared to the bulk of thesame period in 2007. The increase in sales volume reflecting greater weather extremes experiencedpurchased power primarily results from a $15.3 million increase relating to higher average market rates and a $98.4 million increase in 2005 compared to 2004 as cooling degree days were up 39% to 1,075 in 2005 compared to 771 in 2004RTO capacity and heating degree days were up 4% to 5,702 in 2005 compared to 5,500 in 2004. Wholesale revenue decreased $1.8 million, primarily related to a $37.2 million decline in sales volume that was nearlyother RTO charges, partially offset by a $35.4$23.5 million decrease relating to lower volumes of purchased power. We purchase power to satisfy retail sales volume when generating facilities are not available due to planned and unplanned outages, or when market prices are below the marginal costs associated with our generating facilities.
For the year ended December 31, 2007:
· Fuel costs decreased by $20.9 million, or 6%, in 2007 compared to the same period in 2006 primarily due to a decrease in the usage of fuel due mainly to a 4% decrease in generation output resulting from scheduled and unscheduled plant outages, as well as a 2% decrease in average fuel prices.
· Purchased power costs increased $128.2 million in 2007 compared to the same period in 2006. The increase in purchased power primarily resulted from a $57.6 million increase related to higher purchased power volume and a $80.9 million increase in RTO capacity and other RTO charges, partially offset by a $10.4 million decrease related to lower average market rates. For 2005, ancillary revenues from RTOs were $74.4 million comparedWe purchase power to $17.9 million for 2004, as we didsatisfy retail sales volume when generating facilities are not participate in PJM until October 2004.available due to planned and unplanned outages, or when market prices are below the marginal costs associated with our generating facilities.
DPL Inc. -— Gross Margins Fuel and Purchased Power
For 2006,During 2008, gross margin of $885.4$981.2 million increased $70.7$80.9 million, or 9%, from $814.7$900.3 million in 2005.2007. As a percentage of total revenues, gross margin remained flatincreased to 61% in 2006 at 63.5%2008 compared to 63.4%59% in 2005. This result reflects the favorable impact of the rate stabilization plan on revenues offsetting the increasing fuel and purchase power costs. In prior years, rising fuel and purchase power costs had eroded gross margin. Fuel costs, which include coal, gas, oil and emission allowance costs, increased by $12.2 million, or 4%, in 2006 compared to the same period in 2005 primarily due to increased fuel prices. Purchased power increased $25.7 million, or 19% in 2006 compared to the same period in 2005 primarily resulting from increased charges of $30.8 million relating to higher purchased power volume and an increase of $0.9 million in RTO ancillary costs. These increases were partially offset by lower average market rates reducing purchased power costs by $6.0 million. The increase in purchase power volume resulted from our decision to purchase power at lower average market rates instead of running our higher cost generating facilities. In addition, from time to time, we purchased power when our generating facilities were not available due to scheduled maintenance and forced outages.2007.
For 2005,
During 2007, gross margin of $814.7$900.3 million decreased by $9.0increased $14.9 million, or 2%, from $823.7$885.4 million for 2004.in 2006. As a percentage of total revenues, gross margin decreased by 5.2 percentage points to 63.4% from 68.6%. This decline is primarily59% in 2007 as compared to 64% in 2006.
These gross margin results reflect the resultimpact of increased fuel and purchased power costs, partially offset by an increase in revenues, principally from RTO ancillary revenues and higher average wholesale rates. Fuel costs, which include coal, gas, oil and emission allowance costs, increased by $73.8 million or 28% for 2005 compared to the same period in 2004 primarily resulting from higher average fuel pricescost of $64.1 million as well as increased generationrevenues discussed above.
36
Table of $9.7 million. Purchased power costs increased by $20.2 million for 2005 compared to 2004 primarily resulting from increased charges of $36.2 million associated with operating in PJM (we did not participate in PJM until October 2004) and $28.2 million related to higher average market prices, partially offset by $44.2 million related to lower purchased power volume.Contents
DPL Inc. - - Operation and Maintenance
$ in millions | | 2006 vs. 2005 | |
Legal costs | | $ | 13.5 | |
Power production costs | | 10.4 | |
RTO administrative fees | | 5.5 | |
Low-Income Assistance Program | | 5.1 | |
Lump sum bonus and retirement payments | | 3.7 | |
Line clearance | | 2.7 | |
Mark-to-market adjustments and forfeitures of restricted stock units (RSUs) | | 2.6 | |
Long-term incentive compensation | | 2.1 | |
Pension and benefits | | 1.0 | |
Directors’ and Officers’ liability insurance | | (3.2 | ) |
Sarbanes-Oxley compliance fees | | (1.1 | ) |
Other, net | | 4.1 | |
Total operation and maintenance expense | | $ | 46.4 | |
$ in millions | | 2008 vs. 2007 | |
Legal costs | | $ | (17.6 | ) |
Deferred compensation (primarily mark-to-market adjustments) | | (8.1 | ) |
Employee stock ownership plan (ESOP) expenses | | (7.1 | ) |
Pension | | (2.4 | ) |
Insurance settlement | | 14.5 | |
Generating facilities operating expenses | | 11.1 | |
Gain on sale of corporate aircraft | | 6.0 | |
Turbine maintenance costs | | 4.1 | |
Boiler maintenance costs | | 1.0 | |
Other, net | | (1.8 | ) |
Total operation and maintenance expense | | $ | (0.3 | ) |
For 2006,During the year ended December 31, 2008, operation and maintenance expense decreased $0.3 million, or less than 1%, as compared to 2007. This variance was primarily due to:
·a decrease in legal costs due largely to the litigation settlement with three of our former executives in May 2007,
·a decrease in deferred compensation costs (primarily mark-to-market adjustments) associated to a large degree with deferred compensation liabilities for the former executives,
·a decrease in employee compensation expense associated with the ESOP due mainly to the additional shares that were released from the ESOP in 2007, and
·lower pension costs primarily due to the plan funding made in November 2007.
These decreases were partially offset by:
·the 2007 insurance settlement which reimbursed us for legal fees relating to the litigation with three former executives,
·an increase in operating expenses largely due to the operation of flue gas desulfurization (FGD) and Selective Catalytic Reduction (SCR) equipment, and related gypsum disposal,
·the gain on sale of the corporate aircraft realized in 2007, and
·an increase in turbine maintenance costs incurred due to an unplanned outage at a jointly-owned production unit.
37
Table of Contents
$ in millions | | 2007 vs. 2006 | |
Boiler maintenance costs | | $ | 17.7 | |
Generating facilities operating expenses | | 9.4 | |
Employee stock ownership plan (ESOP) expenses | | 4.4 | |
Turbine maintenance costs | | 3.5 | |
Overhead line and substation maintenance costs | | 3.0 | |
Insurance settlement | | (14.5 | ) |
Gain on sale of corporate aircraft | | (6.0 | ) |
Legal costs | | (4.2 | ) |
Employee benefits including pension | | (0.4 | ) |
Other, net | | (5.5 | ) |
Total operation and maintenance expense | | $ | 7.4 | |
During the year ended December 31, 2007, operation and maintenance expense increased $46.4$7.4 million, or 21%3%, as compared to 2005 year2006. This variance was primarily resulting from a $13.5 milliondue to:
· an increase in boiler maintenance costs largely attributable to timing of scheduled outages,
· an increase in operating expenses largely due to the operation of the FGD and SCR equipment, and related gypsum disposal,
· an increase in employee compensation expense associated with the ESOP due mainly to additional shares being released from the ESOP, and
· increases in turbine maintenance costs as well as overhead line and substation maintenance costs.
These increases were partially offset by:
· an insurance settlement reimbursing us for legal fees primarily relatedrelating to the litigation with former executives; a $10.4 million increase in power production costs consisting of $4.1 million of coal brokering credits received in 2005 that were not received in 2006 and increased operating and maintenance expenses of $3.1 million which related to cost of removal and peaker engine repairs; $5.5 million in PJM administrative fees, including $2.5 million deferred in 2005 by PUCO authority (rate relief was granted in February 2006); $5.1 million increase in the low-income assistance program costs; $3.7 million of lump sum bonus and retirement payments to former executives (not related to our ongoing litigation with the three former executives); $2.7executives,
· a gain on the sale of the corporate aircraft,
· a decrease in legal costs primarily resulting from the settlement of the litigation with the former executives, and
· a decrease in employee benefits costs resulting from a $5.2 million of line clearance; a $2.6 million increase in mark-to-market adjustments and forfeitures of restricted stock units; $2.1 million in long-term incentive compensation relating to performance and restricted shares compensation; and a $1.0 million increasereduction in pension and benefits expenses. These increases wereexpense, partially offset by a $3.2 million decrease in Directors’ and Officers’ liability insurance premiums and a $1.1 million decrease in Sarbanes-Oxley compliance fees.
$ in millions | | 2005 vs 2004 | |
Directors’ & Officers’ liability insurance | | $ | (8.3 | ) |
Legal and special investigations | | (5.8 | ) |
Executive and management compensation | | (5.8 | ) |
Sarbanes-Oxley compliance and external/internal audit fees | | (3.5 | ) |
Low-Income Assistance Program | | (2.3 | ) |
Pension and benefits | | (0.7 | ) |
Electric production, transmission and distribution costs | | 4.5 | |
Other, net | | 3.8 | |
Total operation and maintenance expense | | $ | (18.1 | ) |
For 2005, operation and maintenance expense decreased $18.1 million or 8% compared to 2004 as a result of lower corporate costs that were partially offset by increased electric production, transmission and distribution expenses. Corporate costs declined from the prior year primarily resulting from a decrease of $8.3 million in Directors’ and Officers’ liability insurance premiums; approximately $5.8 million related to the decreased level of activity regarding various internal and governmental investigations as well as the securities litigation; $5.8 million in lower executive and management compensation costs; $3.5 million in reduced Sarbanes-Oxley 404 compliance costs and external/internal audit fees; $2.3 million in decreased Low Income Assistance Program costs; and $0.7 million of lower benefits costs (a decrease of $2.8 million for a 2004 adjustment in disability reserves was nearly offset by an increase in pension costs of $2.1 million). These decreases were partially offset by a $4.5$4.8 million increase in electric production, transmission, and distribution costs, primarily related to generation operations costs for lime used for pollution control and electric production boiler maintenance costs as well as higher costs related to electric distribution operation and maintenance.employee benefits.
DPL Inc. — Impairment of Peaking Stations
In connection with DPLE’s decision to sell the Greenville Station and Darby Station electric peaking generation facilities, DPL concluded that an impairment charge for the Greenville Station and Darby Station assets was required. Greenville Station consists of four natural gas peaking units with a net book value of approximately $66 million. Darby Station consists of six natural gas peaking units with a net book value of approximately $156 million. DPLE plans to sell the Greenville and Darby Station assets for $49 million and $102 million, respectively. These sales are expected to take place during the first half of 2007.
During the fourth quarter of 2006, DPL recorded a $71.0 million impairment charge to record the fair market write-down of the assets and other associated costs related to the sale. These assets are now held for sale and are no longer being depreciated. There was no such activity in 2005. See Note 14 of the Notes to the Consolidated Financial Statements.
DPL Inc. — Depreciation and Amortization
For 2006,
During 2008, depreciation and amortization expense increased $4.5$2.9 million from 2005 relatingas compared to completed projects in both2007. This increase was primarily a result of higher plant balances due largely to installation of the distribution and production areas increasing our overall plant base.FGD equipment, partially offset by the impact of lower depreciation rates for generation property which were put into effect on August 1, 2007.
Depreciation
During 2007, depreciation and amortization expense was $3.2decreased $17.0 million higher in 2005 as compared to 20042006, primarily due to:
·the absence of depreciation for the peaking units sold in April 2007 which reduced the expense by $10.0 million, and
·the impact of lower depreciation rates for generation property which were put into effect on August 1, 2007, reducing the expense by $9.5 million.
This decrease was partially offset by a $2.4 million increase to the expense related to increased plant balances primarily resulting from the installation of pollution control equipment.
DPL Inc. — General Taxes
During 2008, general taxes increased $13.7 million as compared to 2007, primarily as a result of completed projectshigher property taxes due mainly to capital improvements which have led to higher assessed property values, combined with increased tax rates.
There were no significant fluctuations in the distribution area (including new services, line transformers, poles, station equipment and overhead and underground conductor) andgeneral taxes in the production area (mainly due2007 as compared to the SCRs for Stuart, Killen and Zimmer) that were put into service in the second quarter of 2004.2006.
DPL Inc. -— Amortization of Regulatory Assets
There were no significant fluctuations in the amortization of regulatory assets in 2008 as compared to 2007.
38
For 2006, Table of Contents
During 2007, amortization of regulatory assets increased $5.6$3.2 million to $7.6 millionas compared to the same period in 2005. The increase in amortization of regulatory assets reflects $2.6 million for the amortization of costs incurred to accommodate unbundled rates and electric choice bills in the customer billing system; $1.3 million for the amortization of PJM administrative fees deferred for the period October 2004 through January 2006; $1.2 million for2006, primarily reflecting the amortization of incremental 2004/2005 severe storm costs; $0.3 million for the amortization of costs incurred to integrate DP&L into the PJM system; and $0.2 million for the amortization of the Rate Stabilization Surcharge rate case expenses.that began on August 1, 2006.
For 2005, amortization of regulatory assets increased $1.3 million to $2.0 million compared to the same period in 2004 primarily resulting from PJM start-up costs amortization of $1.1 million and PJM integration costs amortization of $0.2 million reflecting DP&L’s entrance into the PJM market on October 1, 2004.
DPL Inc. -— Investment Income
For 2006,During 2008, investment income decreased $33.1$7.7 million as compared to $17.82007. This decrease was primarily the result of:
· $3.2 million of gains realized in 2007 from $50.9 millionthe sale of financial assets held in DP&L’s Master Trust Plan for deferred compensation which were used for the same periodsettlement payment to the three former executives, and
· lower cash and short-term investment balances combined with overall lower market yields on investments in 2005.2008 compared to 2007.
During 2007, investment income decreased $6.5 million as compared to 2006. This decrease was primarily the result of a $23.4 millionlower interest income relating to lower cash and short-term investment balances in 2007 compared to 2006. This decrease in gains on public and income investments realized in 2005, a $4.6was partially offset by $3.2 million in foreign currency translationrealized gains realized in 2005 for the liquidation of investments denominated in Euros, and a $4.8 million decrease in interest income resulting from lower cash balances in 2006 compared to 2005.
For 2005, investment income increased by $43.0 million compared to 2004 primarily resulting from a net gain on the disposal of public equity and income investments of $23.5 million and from $18.5 million in interest income, principally from new short-term investments relating to a cash surplus from the sale of financial assets held in DP&L’s Master Trust Plan for deferred compensation used for the private equity portfolio.settlement payment to the three former executives.
DPL Inc. -— Net Gain on Settlement of Executive Litigation
On May 21, 2007, we settled litigation with three former executives. In exchange for our payment of $25 million, the three former executives relinquished and dismissed all of their claims, including those related to deferred compensation, restricted stock units (RSUs), MVE incentives, stock options and legal fees. As a result of this settlement, during 2007, DPL realized a net pre-tax gain in continuing operations of approximately $31.0 million. See Note 15 of Notes to Consolidated Financial Statements.
DPL Inc. — Interest Expense
During 2008, interest expense increased $9.7 million, or 12%, as compared to 2007 primarily as a result of:
· $12.9 million of lower capitalized interest due to the completion of the FGD projects at Miami Fort, Killen, and Stuart stations,
· the write-off of unamortized debt issuance costs amounting to $1.6 million relating to pollution control bonds following their repurchase from the bondholders on April 4, 2008 (See Note 7 of Notes to Consolidated Financial Statements) and
· $0.9 million of additional interest expense associated with DP&L’s
For 2006, $90 million variable rate pollution control bonds issued November 15, 2007 and repurchased on April 4, 2008.These increases were partially offset by a $7.0 million interest expense reduction due to the redemption of the $225 million 8.25% Senior Notes in March 2007 and the $100 million 6.25% Senior Notes in May 2008.
During 2007, interest expense decreased $35.5$21.2 million, or 26%21%, as compared to the same period in 2005 resulting from2006 primarily as a result of:
· $15.5 million less interest associated with the redemption of DPLdebt reduction that occurred in 2004($225 million, 8.25% Senior Notes) and 2005 and a higher
· $9.1 million of greater capitalized interest primarily related to increased pollution control capital expenditures.
These decreases were partially offset by an additional $3.4 million of $10.9 million in 2006 compared to 2005interest expense associated with our major construction projects.
For 2005, interest expense decreased $22.5DP&L’s $100 million, or 14%, compared to 2004 due to the debt reduction of $462.6 million and a full year impact of the $500 million debt retirement completed in 2004 (partially financed with a $175 million note).4.8% Series pollution control bonds issued September 13, 2006.
DPL Inc. - Charge for Early Redemption of Debt
In 2005, DPL recorded $61.2 million in charges resulting from premiums paid for the early redemption of debt, including write-offs of unamortized debt expense and debt discounts.
DPL Inc. - — Other Income (deductions)(Deductions)
For 2006,
During 2008, other deductions of $1.0 million changed from other income (deductions)of $2.9 million recorded in 2007. The change from other income to other deductions primarily resulted from the recognition in 2007 of a $2.1 million deferred credit related to a litigation settlement (which was $14.7not part of the executive litigation settlement).
During 2007, other income of $2.9 million less thanincreased $4.1 million from other deductions of $1.2 million recorded for the same period in 2005of the prior year. The increase primarily due to gains of $12.3 million realized in 2005resulted from the salerecognition of pollution control emission allowances. There were no sales of pollution control emission allowances during 2006.
For 2005, other incomea $2.1 million deferred credit related to a litigation settlement (which was $9.7 million greater than 2004 primarily reflecting $3.5 million of additional gains realized in 2005 over 2004 resulting from sales of pollution control emission allowances; $1.6 million of lower fees resulting from the 2004 cancellation and replacement of DP&L’s revolving credit facility and our term loan termination and $1.5 million from the 2004 write-offnot part of the remaining term loan debt expense resulting from our term loan termination.executive litigation settlement).
39
Table of Contents
DPL Inc. -— Income Tax Expense
During 2008, income taxes decreased $19.6 million, or 16%, as compared to 2007, primarily due to a decrease in the effective tax rate reflecting:
For 2006,· the phase-out of the Ohio Franchise Tax (see below), and
· the settlement of the Ohio Franchise Tax issue which resulted in a recorded benefit of $8.5 million in 2008.
During 2007, income taxes from continuing operations decreased $10.1increased $52.7 million, or 13%76%, as compared to 20052006 primarily due to a decreaseto:
· an increase in pre-tax book income,
· a decrease in the effective tax rate primarily reflectingresulting from the phase-out of the Ohio Franchise Tax (see below), and
· adjustments recorded in 2005 and 2006 to true-up book tax expense to the tax return.
For 2005, income tax expense from continuing operations increased $13.4 million compared to 2004 resulting from higher income, increased accrual for open tax years and lower state tax coal credits.
On June 30, 2005, Governor Taft signed House Bill 66 into law which significantly changed the tax structure in Ohio. The major provisions of the bill included phasing-out the Ohio Franchise Tax, phasing-out the Ohio Personal Property Tax for non-utility taxpayers and phasing-in a Commercial Activities Tax. The Ohio Franchise Tax phase-out required second quarter 2005 adjustments to income tax expense. Income taxes from continuing operations were reduced by $1.5 million while income taxes from discontinued operations were increased by $1.3 millionis complete as a result of the tax law change. Other applicable provisions of House Bill 66 have been reflected in the consolidated financial statements.
DPL Inc. - - Discontinued Operations, Net of Tax
On February 13, 2005, our subsidiaries, MVE and MVIC, entered into an agreement to sell their respective interests in forty-six private equity funds to AlpInvest/Lexington 2005, LLC, a joint venture of AlpInvest Partners and Lexington Partners, Inc. Sales proceeds and any related gains or losses were recognized as the sale of each fund closed. Among other closing conditions, each fund required the transaction to be approved by the respective general partner of each fund. During 2005, MVE and MVIC completed the sale of their interests in forty-three and a portion of one of those private equity funds resulting in a $46.6 million pre-tax gain ($53.1 million less $6.5 million professional fees) from discontinued operations and provided approximately $796 million in net proceeds, including approximately $52 million in net distributions from funds while held for sale. As part of this pre-tax gain, DPL realized $30 million that was previously recorded as an unrealized gain as part of other comprehensive income.
During 2005, MVE entered into alternative closing arrangements with AlpInvest/Lexington 2005, LLC for funds where legal title to said funds could not be transferred until a later time. Pursuant to these arrangements, MVE transferred the economic aspects of the remaining private equity funds, consisting of two funds and a portion of another fund, to AlpInvest/Lexington 2005, LLC without a change in ownership of the interests. The terms of the alternative arrangements do not meet the criteria for recording a sale. We are obligated to remit to AlpInvest/Lexington 2005, LLC any distributions MVE receives from these funds, and AlpInvest/Lexington 2005,
LLC is obligated to provide funds to us to pay any contribution notice, capital call or other payment notice or bill for which MVE receives notice with respect to such funds. The alternative arrangements resulted in a deferred gain of $27.1 million until such terms of a sale can be completed (contingent upon receipt of general partner approvals of the transfer) and in 2005 provided approximately $72 million in net proceeds on these funds. DPL recorded an impairment loss of $5.6 million in the second quarter of 2005 to write down assets transferred pursuant to the alternative arrangements to estimated fair value. Ownership of these funds transfer after the general partners of each of the separate funds consent to the transfer.
On MarchDecember 31, 2006, MVE completed the sale of the remaining portion of one private equity fund, for which MVE had previously entered into an alternative closing arrangement resulting in the recognition of $13.2 million of the deferred gain. On August 31, 2006, MVE completed the sale of a portion of one of the two remaining private equity funds, resulting in recognition of $5.7 million of the deferred gain. The sale of the residual portion of this private equity fund will be completed during the first quarter of 2007, resulting in the recognition of approximately $8.2 million of the deferred gain. The transfer of the remaining fund is expected to be completed in 2008.
| | For the years ended | |
| | December 31, | |
$ in millions | | 2006 | | 2005 | | 2004 | |
| | | | | | | |
Earnings from discontinued operations: | | | | | | | |
Investment income | | $ | — | | $ | 41.3 | | $ | 178.5 | |
Investment expenses | | (1.3 | ) | (9.5 | ) | (23.6 | ) |
Income from discontinued operations | | (1.3 | ) | 31.8 | | 154.9 | |
| | | | | | | |
Gain realized from sale | | 18.9 | | 53.1 | | — | |
Broker fees and other expenses | | — | | (6.5 | ) | — | |
Loss recorded | | — | | (5.6 | ) | — | |
Net gain on sale | | 18.9 | | 41.0 | | — | |
| | | | | | | |
Earnings before income taxes | | 17.6 | | 72.8 | | 154.9 | |
Income tax expense | | (3.6 | ) | (19.9 | ) | (59.1 | ) |
Earnings from discontinued operations, net | | $ | 14.0 | | $ | 52.9 | | $ | 95.8 | |
| | | | | | | |
Cash Flow: | | | | | | | |
Net proceeds from sale of portfolio | | $ | — | | $ | 744.2 | | $ | — | |
Net proceeds from transfer | | — | | 72.3 | | — | |
Net distributions from funds | | — | | 51.9 | | 203.9 | |
Total cash flow from discontinued operations | | $ | — | | $ | 868.4 | | $ | 203.9 | |
40
There was no investment income from discontinued operations during 2006, however there was $1.3 millionTable of legal costs associated with the ongoing litigation (see Note 11 of Notes to Consolidated Financial Statements). Income from discontinued operations (pre-tax) for the year ended December 31, 2005 of $31.8 million is comprised of $41.3 million of investment income less $9.5 million of associated management fees and other expenses.Contents
For the year ended December 31, 2006, we recognized $18.9 million of the deferred gain from the sale of the remaining private equity funds described above. For the year ended December 31, 2005, we recognized a $46.6 million pre-tax gain ($53.1 million less $6.5 million of professional fees), recorded a $5.6 million impairment loss, deferred gains of $27.1 million on transferred funds from discontinued operations, and provided approximately $868 million in net proceeds, including approximately $52 million in net distributions from funds held for sale. We will continue to incur minor amounts of fees in the near term.
DPL Inc. - Cumulative Effect of Accounting Change, Net of Tax
In 2005, the cumulative effect of an accounting change resulted in a charge of $3.2 million related to the adoption of the provisions of FASB Interpretation No. 47, “Accounting for Conditional Asset Retirement Obligations an interpretation of FASB Statement No. 143” (FIN 47). (See Note 1 of Notes to Consolidated Financial Statements.)
32
RESULTS OF OPERATIONS — The Dayton Power and Light Company (DP&L)
Income Statement Highlights — DP&L
$ in millions | | 2006 | | 2005 | | 2004 | | | 2008 | | 2007 | | 2006 | |
| | | | | | | | | | | | | | |
Revenues: | | | | | | | | | | | | | | |
Retail | | $ | 998.1 | | $ | 944.9 | | $ | 914.0 | | | $ | 1,075.3 | | $ | 1,057.4 | | $ | 998.1 | |
Wholesale | | 309.9 | | 257.6 | | 260.3 | | | 293.5 | | 331.7 | | 309.9 | |
RTO ancillary | | 77.2 | | 74.4 | | 17.9 | | |
Total Revenues | | $ | 1,385.2 | | $ | 1,276.9 | | $ | 1,192.2 | | |
RTO revenues | | | 108.3 | | 87.4 | | 77.2 | |
RTO capacity revenues | | | 95.8 | | 30.9 | | — | |
Total revenues | | | $ | 1,572.9 | | $ | 1,507.4 | | $ | 1,385.2 | |
| | | | | | | | | | | | | | |
Less: Fuel | | 335.2 | | 317.9 | | 257.0 | | |
Purchased power (a) | | 171.9 | | 147.1 | | 116.4 | | |
Gross margins (b) | | $ | 878.1 | | $ | 811.9 | | $ | 818.8 | | |
Cost of revenues: | | | | | | | | |
Fuel costs | | | $ | 349.6 | | $ | 317.2 | | $ | 335.2 | |
Gains from sale of coal | | | (83.4 | ) | (0.6 | ) | — | |
Gains from sale of emission allowances | | | (34.8 | ) | (1.2 | ) | — | |
Net fuel | | | 231.4 | | 315.4 | | 335.2 | |
| | | | | | | | |
Purchased power | | | 152.4 | | 170.0 | | 122.5 | |
RTO charges | | | 126.6 | | 101.9 | | 49.4 | |
Capacity charges | | | 100.9 | | 28.4 | | — | |
Total purchased power | | | 379.9 | | 300.3 | | 171.9 | |
| | | | | | | | |
Total cost of revenues | | | $ | 611.3 | | $ | 615.7 | | $ | 507.1 | |
| | | | | | | | |
Gross margins (a) | | | $ | 961.6 | | $ | 891.7 | | $ | 878.1 | |
| | | | | | | | | | | | | | |
Gross margins as a percentage of revenues | | 63.4 | % | 63.6 | % | 68.7 | % | | 61.1 | % | 59.2 | % | 63.4 | % |
| | | | | | | | | | | | | | |
Operating Income | | $ | 402.5 | | $ | 382.6 | | $ | 369.4 | | | $ | 436.6 | | $ | 375.1 | | $ | 402.5 | |
(a) Purchased power includes ancillary charges from PJM of $49.4 million, $48.5 million and $12.3 million for 2006, 2005 and 2004 respectively.
(b)For purposes of discussing operating results, we present and discuss gross margins. This format is useful to investors because it allows analysis and comparability of operating trends and includes the same information that is used by management to make decisions regarding our financial performance.
41
Table of Contents
DP&L — Revenues
Retail customers, especially residential and commercial customers, consume more electricity on warmer and colder days. Therefore, DP&L’s retail sales volume is impacted by the number of heating and cooling degree days occurring during a year. Since DP&L plans to utilize its internal generating capacity to supply its retail customers’ needs first, increases in retail demand will decrease the volume of internal generation available to be sold in the wholesale market and vice versa.
The wholesale market covers a multi-state area and settles on an hourly basis throughout the year. Factors impacting DP&L’s wholesale sales volume each hour of the year include wholesale market prices; DP&L’s retail demand, retail demand elsewhere throughout the entire wholesale market area; DP&L and non-DP&L plants’ availability to sell into the wholesale market and weather conditions across the multi-state region. DP&L’s plan is to make wholesale sales when market prices allow for the economic operation of its generation facilities that are not being utilized to meet its retail demand.
The following table provides a summary of changes in revenues from prior periods:
$ in millions | | 2008 vs. 2007 | | 2007 vs. 2006 | |
| | | | | |
Retail | | | | | |
Rate | | $ | 43.0 | | $ | 25.8 | |
Volume | | (20.8 | ) | 31.2 | |
Other miscellaneous | | (4.3 | ) | 2.3 | |
Total retail change | | $ | 17.9 | | $ | 59.3 | |
| | | | | |
Wholesale | | | | | |
Rate | | $ | 79.2 | | $ | 46.2 | |
Volume | | (117.4 | ) | (24.4 | ) |
Total wholesale change | | $ | (38.2 | ) | $ | 21.8 | |
| | | | | |
RTO capacity and other | | | | | |
RTO capacity and other revenues | | $ | 85.8 | | $ | 41.1 | |
| | | | | |
Total revenues change | | $ | 65.5 | | $ | 122.2 | |
For 2006,the year ended December 31, 2008, revenues increased 8% to $1,385.2$65.5 million, compared to $1,276.9 millionor 4%, over the same period in 2005, reflecting an increase of $108.3 million.the prior year. This increase was primarily the result of higher average rates for retail sales, greaterand wholesale sales, volume and increased ancillaryan increase in RTO capacity and other RTO revenues, associated with participation in a RTO. These increases were partially offset by lower retail and wholesale sales volume and lower average rates for wholesale sales. Retailvolume.
·The net increase in retail revenues increased $53.2 million,results primarily resulting from a $78.3 million increase relating to higher average rates and increased miscellaneous revenues of $0.9 million, partially offset by decreased sales volume of $26.0 million resulting from milder weather experienced in 2006 compared to 2005. The higher average rates were primarily the result of the rate stabilization plan surcharge, and regulated asset recovery riders implemented throughout 2006. Wholesale revenues increased $52.3 million, primarily related to a $88.6 million4% increase in sales volume,average retail rates due largely to the second phase of an environmental investment rider, partially offset by a $36.3 million2% decrease in average market rates. During 2006, RTO ancillary revenues increased $2.8 million to $77.2 million from $74.4 millionsales volume.
·The decrease in 2005. Heating degree days were down 11% to 5,076 in 2006 compared to 5,702 in 2005. In addition,retail sales volume is primarily a result of milder weather which caused cooling degree days were down 20% to 855decrease 26% and a 6% decrease in 2006 comparedvolume of sales to 1,075 in 2005.
For 2005, revenues increased 7%industrial customers. The lower sales to $1,276.9 million compared to $1,192.2 million in 2004, reflecting an increase of $84.7 million. This increase was primarily theindustrial customers is largely a direct result of increased retail sales volume, higher average rates for wholesalethe downturn in the economy which has severely affected the automotive and retail revenues,other related industries in the region resulting in plant closures and ancillary revenues associated with participation in PJM that wasreduced production. These decreases were partially offset by loweran increase in heating degree days of 9%.
·The net decrease in wholesale sales volume. Retail revenues increased $30.9 million,is primarily resulting from increaseda result of a 35% decrease in sales volume of $28.9 million and $7.6 million in higher average rates,due largely to unplanned outages, partially offset by $5.6 million in lower miscellaneous retail revenues reflecting transmission services provided in 2004 that are now provided through PJM. Residential customers comprised the bulk of thea 37% increase in sales volume reflecting greater weather extremes experienced in 2005 compared to 2004 as cooling degree days were up 39% to 1,075 in 2005 compared to 771 in 2004wholesale average rates.
·RTO capacity and heating degree days were up 4% to 5,702 in 2005 compared to 5,500 in 2004. Wholesale revenue decreased $2.7 million,other RTO revenues, consisting primarily related to a $71.6 million decline in sales volume that was nearly offset by a $68.9 million increase related to higher average market rates. For 2005, ancillary revenues from RTOs were $74.4 million compared to $17.9 million for 2004, as we did not participate in PJM until October 2004. RTO ancillary revenues primarily consist of compensation for use of ourDP&L’s transmission assets, regulation services, reactive supply and operating reserves.reserves, and capacity payments under the RPM construct, increased $85.8 million over the same period of the prior year. This increase resulted from additional income realized from the PJM capacity auction and other RTO revenues.
42
Table of Contents
For the year ended December 31, 2007, revenues increased $122.2 million, or 9%, over the same period in the prior year. This increase was primarily the result of higher average rates for retail and wholesale sales, higher retail sales volume and an increase in RTO capacity and other RTO revenues. These increases were partially offset by lower wholesale sales volume.
·The net increase in retail revenues results primarily from a 3% increase in weather driven sales volume as total degree days increased 9%, and a 3% increase in the average retail rates primarily relating to the environmental investment and storm recovery riders.
·The net increase in wholesale revenues is primarily a result of a 15% increase in wholesale average rates, partially offset by an 8% decrease in sales volume.
·RTO capacity and other RTO revenues, consisting primarily of compensation for use of DP&L’s transmission assets, regulation services, reactive supply and operating reserves and capacity payments under the RPM construct, increased $41.1 million over the same period in 2006. This increase primarily resulted from additional income realized from the PJM capacity auction, the PJM transmission losses and congestion credits and from other RTO revenues.
DP&L - Margins, Fuel and Purchased Power— Cost of Revenues
For the year ended December 31, 2008:
·Fuel costs, which include coal (net of sales), gas, oil, and emission allowance sales and costs, decreased $84.0 million, or 27%, compared to the same period in 2007, primarily due to increases in net gains of $33.6 million from the sale of DP&L’s excess emission allowances and $82.8 million realized from the sale of DP&L’s coal combined with a decrease in the usage of fuel due mainly to a 6% decrease in generation output largely attributable to unplanned outages. These decreases were partially offset by increased fuel prices. The successful installation of FGD equipment at Miami Fort, Killen and Stuart stations has allowed us the ability to burn coal with a wide range of sulfur content and, accordingly, we purchase and sell coal as we seek to achieve optimum levels of production efficiency. Gains or losses from sales of coal and emission allowances are recorded as components of fuel costs.
·Purchased power costs increased $79.6 million, or 27%, compared to the same period in 2007. The increase in purchased power primarily results from a $11.8 million increase relating to higher average market rates and a $97.2 million increase in RTO capacity and other RTO charges, partially offset by a $29.3 million decrease relating to lower volumes of purchased power. We purchase power to satisfy retail sales volume when generating facilities are not available due to planned and unplanned outages, or when market prices are below the marginal costs associated with our generating facilities.
For the year ended December 31, 2007:
·Fuel costs decreased by $19.8 million, or 6%, in 2007 compared to the same period in 2006 primarily due to a decrease in the usage of fuel due mainly to a 4% decrease in generation output resulting from scheduled and unscheduled plant outages, as well as a 2% decrease in average fuel prices.
·Purchased power costs increased $128.4 million in 2007 compared to the same period in 2006. The increase in purchased power primarily resulted from a $59.5 million increase related to higher purchased power volume and a $80.9 million increase in RTO capacity and other RTO charges, partially offset by a $12.1 million decrease related to lower average market rates. We purchase power to satisfy retail sales volume when generating facilities are not available due to planned and unplanned outages, or when market prices are below the marginal costs associated with our generating facilities.
DP&L — Gross Margins
During 2008, gross margin of $961.6 million increased $66.2$69.9 million, to $878.1 millionor 8%, from $811.9$891.7 million in 2005.2007. As a percentage of total revenues, gross margin remained relatively flatincreased to 61% in 2006 at 63.4%2008 as compared to 63.6%59% in 2005. This result reflects the favorable impact2007.
During 2007, gross margin of the rate stabilization plan on revenues offsetting the increasing fuel and purchased power costs. In prior years, rising fuel and purchased power costs had eroded gross margin. Fuel costs, which include coal, gas, oil and emission allowance costs,$891.7 million increased by $17.3$13.6 million, or 5% in 2006 as a result of higher market prices. Purchased power costs increased by $24.8 million or 17% in 2006 compared to 2005 primarily resulting2%, from higher volumes of power purchased. The increase in purchased power volume resulted from our decision to purchase power at lower average market rates instead of running our higher cost generating facilities. In addition, from time to time, we had to purchase power to source power sales when our generating facilities were not available due to scheduled maintenance and forced outages.
For 2005, gross margin decreased by $6.9 million to $811.9 million from $818.8$878.1 million in 2004.2006. As a percentage of total revenues, gross margin decreased by 5.1 percentage points to 63.6% from 68.7%. This decline is primarily the result of a $91.6 million increase59% in fuel and purchased power costs, offset by an $84.7 million increase in revenues (see discussion of revenue variance above). Fuel costs increased by $60.9 million for 20052007 compared to 63% in 2006.
These gross margin results reflect the same period in 2004 primarily resulting from higher average fuel prices as well as an increased volumeimpact of electric generation. Purchased power costs increased by $30.7 million for 2005 compared to the same period in 2004 primarily resulting from increased ancillary chargesrevenues and cost of $36.2 million associated with moving power across PJM (we did not participate in PJM until October 2004) as well as increases related to higher average market prices, partially offset by lower purchased power volume.revenues discussed above.
43
Table of Contents
DP&L - -— Operation and Maintenance
$ in millions | | 2006 vs. 2005 | |
| | | |
Power production costs | | $ | 10.4 | |
Low-Income Assistance Program | | 5.6 | |
RTO administration fees | | 5.5 | |
Lump sum bonus and retirement payments | | 3.7 | |
Line clearance | | 2.7 | |
Long-term incentive compensation | | 1.9 | |
Reserves for insurance, injuries/damages/environmental | | 1.9 | |
Pension and benefits | | 0.9 | |
Mark-to-market adjustments and forfeitures of restricted stock units (RSUs) | | 0.9 | |
Directors’ and Officers’ liability insurance | | (1.2 | ) |
Sarbanes-Oxley compliance fees | | (1.1 | ) |
Other, net | | 2.2 | |
Total operation and maintenance expense | | $ | 33.4 | |
$ in millions | | 2008 vs. 2007 | |
Employee stock ownership plan (ESOP) expense | | $ | (7.0 | ) |
Deferred compensation (primarily mark-to-market adjustments) | | (5.8 | ) |
Legal costs | | (3.9 | ) |
Pension | | (2.4 | ) |
Generating facilities operating expenses | | 11.1 | |
Turbine maintenance costs | | 4.1 | |
Boiler maintenance costs | | 1.0 | |
Other, net | | (5.1 | ) |
Total operation and maintenance expense | | $ | (8.0 | ) |
For 2006,During the year ended December 31, 2008, operation and maintenance expense decreased $8.0 million as compared to 2007. This variance was primarily due to:
·a decrease in employee compensation expense associated with the ESOP due mainly to the additional shares that were released from the ESOP in 2007,
·a decrease in deferred compensation costs (primarily mark-to-market adjustments) associated to a large degree with deferred compensation liabilities for the former executives,
·a decrease in legal fees, and
·lower pension costs primarily due to the plan funding made in November 2007.
These decreases were partially offset by:
·an increase in operating expenses at our generating facilities largely due to the operation of the FGD and SCR equipment, and related gypsum disposal, and
·an increase in turbine maintenance costs incurred due to an unplanned outage at a jointly-owned production unit.
$ in millions | | 2007 vs. 2006 | |
Boiler maintenance costs | | $ | 17.7 | |
Generating facilities operating expenses | | 9.4 | |
Employee stock ownership plan (ESOP) expense | | 4.4 | |
Turbine maintenance costs | | 3.5 | |
Overhead line and substation maintenance costs | | 3.0 | |
Employee benefits including pension | | (0.3 | ) |
Other, net | | 1.6 | |
Total operation and maintenance expense | | $ | 39.3 | |
During the year ended December 31, 2007, operation and maintenance expense increased $33.4$39.3 million, or 17%, as compared to 20052006. This variance was primarily resulting from a $10.4 milliondue to:
·an increase in power productionboiler maintenance costs consistinglargely attributable to timing of $4.1 million of coal brokering credits received in 2005 that were not received in 2006 and increased operating and maintenance expenses of $3.1 million which related to cost of removal and peaker engine repairs; a $5.6 millionscheduled outages,
·an increase in operating expenses largely due to the Low-Income Assistance Program costs; $5.5 millionoperation of the FGD and SCR equipment, and related gypsum disposal,
·an increase in PJM administrative fees, including $2.5 million deferred in 2005 by PUCO authority (rate relief was granted in February 2006); $3.7 million of lump sum bonus and retirement payments for former executives (not related to our ongoing litigationemployee compensation expense associated with the three former executives); $2.7 million relatedESOP due mainly to additional shares being released from the ESOP, and
·increases in turbine maintenance costs as well as overhead line clearance; $1.9 million increase in long-term incentive costs; a $1.9 million increase in reserves for insurance, injuries and damages; a $0.9 million increase in pension and benefits expenses; and a $0.9 million increase in mark-to-market adjustments and forfeitures of restricted stock units. substation maintenance costs.
These increases were partially offset by a $1.2$0.3 million decrease in Directors’ and Officers’ liability insurance premiums and a $1.1 million decrease in Sarbanes-Oxley compliance fees.
$ in millions | | 2005 vs 2004 | |
| | | |
Directors’ and Officers’ liability insurance | | (14.8 | ) |
Executive and management compensation | | (10.2 | ) |
Sarbanes-Oxley compliance and external/internal audit fees | | (3.5 | ) |
RTO administrative fees | | (1.6 | ) |
Reduction in capitalized insurance and claims costs | | (0.3 | ) |
Pension and benefits | | 0.6 | |
Electric production, transmission and distribution costs | | $ | 4.1 | |
Other, net | | (0.4 | ) |
Total operation and maintenance expense | | $ | (26.1 | ) |
For 2005, operation and maintenance expense decreased $26.1 million or 12% compared to same period in 2004 as a result of lower corporateemployee benefits costs that were partially offset by increased electric production, transmission and distribution expenses. Corporate costs declined from the prior year primarily resulting from a decrease of $14.8$5.1 million reduction in Directors’ and Officers’ liability insurance premiums; $10.2 million in lower executive and management compensation costs; $3.5 million in reduced Sarbanes-Oxley 404 compliance costs and external / internal audit fees; and $1.6 million in lower PJM administrative fees resulting from a PUCO order to defer these costs until they can be recovered through rates starting in February 2006. These decreases werepension expense, partially offset by a $4.1$4.8 million increase in electric production, transmission and distribution costs, primarily related to generation operations costs for lime used for pollution control and electric production boiler maintenance costs as well as higher costs related to electric distribution, operation and maintenance. In addition, pension and benefits costs rose by $0.6 million reflecting an increase in pension costsemployee benefits.
44
Table of $2.0 million that was nearly offset by a $1.4 million decrease for other post employment benefits, principally a 2004 adjustment in disability reserves.Contents
DP&L -— Depreciation and Amortization
Depreciation
During 2008, depreciation and amortization expense increased $6.1$3.3 million in 2006 compared to 2005 primarily reflecting a higher plant base.
Depreciation and amortization increased $2.8 million in 2005 as compared to 20042007. This increase was primarily a result of higher plant balances due largely to the installation of FGD equipment, partially offset by the impact of lower depreciation rates for generation property which were put into effect on August 1, 2007.
During 2007, depreciation and amortization expense decreased $5.5 million as compared to 2006, primarily reflecting the impact of lower depreciation rates for generation property which were put into effect on August 1, 2007, reducing the expense by $9.5 million. This decrease was partially offset by an increase to the expense related to increased plant balances primarily resulting from the installation of pollution control equipment.
DP&L — General Taxes
During 2008, general taxes increased $13.9 million as compared to 2007, primarily as a result of completed projectshigher property taxes due mainly to capital improvements which have led to higher assessed property values, combined with increased tax rates.
There were no significant fluctuations in the distribution area (including new services, line transformers, poles, station equipment, and overhead and underground conductor) andgeneral taxes in the production area (mainly due2007 as compared to the SCRs for Stuart, Killen and Zimmer) that were put into service in the second quarter of 2004.2006.
DP&L -— Amortization of Regulatory Assets
There were no significant fluctuations in the amortization of regulatory assets in 2008 as compared to 2007.
For 2006, During 2007, amortization of regulatory assets increased $5.6$3.2 million to $7.6 millionas compared to the same period in 2005. The increase in amortization of regulatory assets reflects $2.6 million for the amortization of costs incurred to accommodate unbundled rates and electric choice bills in the customer billing system; $1.3 million for the amortization of PJM administrative fees deferred for the period October 2004 through January 2006; $1.2 million for2006, primarily reflecting the amortization of incremental 2004/2005 severe storm costs; $0.3costs that began on August 1, 2006.
DP&L — Investment Income
During 2008, investment income decreased $16.7 million as compared to 2007. This decrease was primarily the result of:
·$14.8 million of gains realized in 2007 on the transfer of DPL common stock to the DP&L Retirement Income Plan Trust (Pension) and
·$3.2 million of gains realized in 2007 from the sale of financial assets held in DP&L’s Master Trust Plan for deferred compensation which were used for the amortizationsettlement payment to the three former executives.
During 2007, investment income increased $17.0 million as compared to 2006. This increase was primarily the result of:
·a realized gain of costs incurred$14.8 million on the transfer of DPL common stock to integratethe DP&L intoRetirement Income Plan Trust (Pension) and
·$3.2 million in realized gains from the PJM system; and $0.2 millionsale of financial assets held in DP&L’s Master Trust Plan for deferred compensation used for the amortizationsettlement payment to the three former executives.
DP&L — Net Gain on Settlement of Executive Litigation
On May 21, 2007, we settled the Rate Stabilization Surcharge rate case expenses.litigation with the three former executives. In exchange for our payment of $25 million, the three former executives relinquished and dismissed all of their claims including those related to deferred compensation, RSUs, MVE incentives, stock options and legal fees. As a result of this settlement, during the second quarter ended June 30, 2007, DP&L realized a net pre-tax gain in continuing operations of $35.3 million. See Note 15 of Notes to Consolidated Financial Statements.
45
For 2005, amortizationTable of regulatory assetsContents
DP&L — Interest Expense
During 2008, interest expense increased $1.3$14.2 million to $2.0 millionas compared to the same period in 20042007 primarily resulting from PJM start-up costs amortization of $1.1 million and PJM integration costs amortization of $0.2 million reflecting DP&L’s entrance into the PJM market on October 1, 2004.from:
DP&L - - Interest Expense
Interest expense decreased $14.7 million or 39% in 2006 compared to 2005, primarily relating to $10.9 million of increased capitalized interest resulting from higher pollution control capital expenditures at the generating plants and $5.3·$12.9 million of lower capitalized interest expense reflectingdue to the refinancingcompletion of the FGD projects at Miami Fort, Killen, and Stuart stations,
·The write-off of unamortized debt issuance costs amounting to $1.6 million relating to pollution control bonds at reduced interest rates in 2005, lower debt service charges associated with DPL’s early retirement of ESOP debt, and the elimination of the interest penalty resultingfollowing their repurchase from the delayed exchange offerbondholders on April 4, 2008 (See Note 7 of the $470Notes to Consolidated Financial Statements), and
·$0.9 million 5.125% Series First Mortgage Bonds. These decreases were slightly offset by $1.4 million of additional interest expense associated with DP&L&L’s ’s new$90 million variable rate pollution control bonds issued November 15, 2007 and repurchased on April 4, 2008.
During 2007, interest expense decreased $1.1 million, or 5%, as compared to 2006 primarily as a result of $9.1 million of greater capitalized interest primarily related to increased pollution control capital expenditures. This decrease was partially offset by
·$3.4 million of additional interest expense associated with DP&L’s $100 million, 4.8% Series pollution control bonds issued September 13, 2006.2006 and
Interest expense
·$2.8 million in additional interest on a short-term loan from DPL.
DP&L — Other Income (Deductions)
During 2008, other deductions of $1.1 million changed from other income of $2.9 million recorded in 2007. The change from other income to other deductions primarily resulted from the recognition in 2007 of a $2.1 million deferred credit related to a litigation settlement (which was not part of the executive litigation settlement).
During 2007, other income of $2.9 million increased $4.1 million from other deductions of $1.2 million recorded for the same period of the prior year. The increase primarily resulted from the recognition of a $2.1 million deferred credit related to a litigation settlement (which was not part of the executive litigation settlement).
DP&L —Income Tax Expense
During 2008, income taxes decreased $5.4$22.9 million, or 12% in 2005 compared to 2004, primarily from $2.6 million of lower debt service charges associated with our early retirement of ESOP debt; lower amortization of $1.1 million
associated with reacquired debt; $1.0 million from the elimination of the interest penalty on the $470 million 5.125% Series First Mortgage Bonds resulting from the delayed exchange offer registration of those securities; and $0.2 million of greater capitalized interest in 200516%, as compared to 2004.2007, primarily due to a decrease in the effective tax rate reflecting:
DP&L - - Charge for Early Redemption of Debt
In 2005, DP&L·the phase-out of the Ohio Franchise Tax (see below), and
·the settlement of the Ohio Franchise Tax issue which resulted in a recorded $4.1benefit of $8.5 million in charges resulting2008.
During 2007, income taxes from premiums paid for the early redemption of debt, including write-offs of unamortized debt expense and debt discounts.
DP&L - Other Income
For 2006, other income (deductions) decreased $7.8continuing operations increased $0.9 million compared to 2006 due to:
·an increase in pre-tax book income,
·a decrease in the same period in 2005. This decrease is primarily attributable to $12.3 million in gains recognized on the sale of pollution control emission allowances during 2005, partially offset by $7.0 million in reduced investment management fees.
For 2005, other income was $7.7 million greater than 2004effective tax rate primarily reflecting $3.5 millionthe phase-out of additional gainsthe Ohio Franchise Tax (see below) and
·adjustments recorded in 2005 over 2004 from sales of pollution control emission allowance.
DP&L - Income Tax Expense
For 2006 incometo true-up book tax expense increased $4.1 million compared to the same period in 2006 primarily resulting from higher income.tax return.
For 2005, income tax expense increased $17.3 million compared to the same period in 2004 resulting from higher income, increased accrual for open tax years and lower state coal tax credits.
On June 30, 2005, Governor Taft signed House Bill 66 into law which significantly changed the tax structure in Ohio. The major provisions of the bill includeincluded phasing-out the Ohio Franchise Tax, phasing-out the Ohio Personal Property Tax for non-utility taxpayers and phasing-in a Commercial Activities Tax. As a resultThe Ohio Franchise Tax phase-out is complete as of House Bill 66, income taxes were reduced by $1.6 million. Other applicable provisionsDecember 31, 2008.
46
Table of House Bill 66 have been reflected in the consolidated financial statements.Contents
DP&L - Cumulative Effect of Accounting Change, Net of Tax
In 2005, the cumulative effect of an accounting change resulted in a charge of $3.2 million related to the adoption of the provisions of FASB Interpretation No. 47, “Accounting for Conditional Asset Retirement Obligations an interpretation of FASB Statement No. 143” (FIN 47). See Note 1 of Notes to Consolidated Financial Statements.
FINANCIAL CONDITION, LIQUIDITY AND CAPITAL REQUIREMENTS
DPL’s financial condition, liquidity and capital requirements, includes the consolidated results of its principal subsidiary The Dayton Power and Light Company DP&L and all of DP&L’s consolidated subsidiaries. All material intercompany accounts and transactions have been eliminated in consolidation.
On July 27, 2005, DPL’s Board authorized the repurchase of up to $400 million of common stock from time to time in the open market or through private transactions. DPL completed this share repurchase program through a series of open market purchases on August 21, 2006. This resulted in 14.9 million shares being repurchased at an average price of $26.91 per share and at a total cost of $400 million. These shares are currently held as treasury shares at DPLInc. No shares were repurchased during 2007 or 2008.
The following details the repurchase activity and options exercised during 2006 affecting treasury shares:
| | Number of
Treasury
Shares Held | | Settlement
Dollar Amount
($ in millions) | | |
Balance at December 31, 2005 | | 36,197,807 | | | | |
| | | | | | |
Activity: | | | | | | |
January | | 406,000 | | $ | 10.6 | | |
February | | 564,000 | | 15.2 | | |
March | | 4,765,700 | | 129.5 | | |
April | | 214,700 | | 5.9 | | |
May | | 2,163,000 | | 57.9 | | |
June | | 4,848,300 | | 129.1 | | |
July | | 417,400 | | 11.1 | | |
August | | 1,483,332 | | 40.7 | | |
Total repurchased at December 31, 2006 | | 14,862,432 | | $ | 400.0 | | |
Options exercised first quarter of 2006 | | (10,000 | ) | | | |
Options exercised fourth quarter of 2006 | | (345,000 | ) | | | |
Net activity | | 14,507,432 | | | | |
Balance at December 31, 2006 | | 50,705,239 | | | | |
DPL’s Cash Position
DPL’s cash and cash equivalents totaled $262.2$62.5 million at December 31, 2006,2008, compared to $595.8$134.9 million at December 31, 2005,2007, a decrease of $333.6$72.4 million. In addition, DPL had no short-term investments available for sale at December 31, 2006 in comparison to $125.8 million at December 31, 2005. The decrease in cash and cash equivalents and short-term investments available for sale was primarily attributed to $357.5$243.6 million in capital expenditures, $400.0$190.0 million used for the purchase of treasury sharesto retire long-term debt and $112.4pollution control bonds, and $120.5 million in dividends paid on common stock, partially offset by $308.7$363.2 million in cash generated from operating activities, $98.4 million in net proceeds from the issuance of pollution control bonds, and $89.9net withdrawals of $22.5 million from restricted fund drawsfunds to fundpay for pollution control capital expenditures. At December 31, 2006,2008, DPL had $10.1$14.5 million restricted funds held in trust relating to the issuance of the $100 million pollution control bonds. These fundsthat will be used to fund the pollution control capital expenditures.
In 2005, DPL began investing in Auction Rate Securities (ARS). ARS are variable rate state and municipal bonds that trade at par value. Interest rates on ARS are reset every seven, twenty-eight or thirty-five days through a modified Dutch auction. DPL had the option to hold at market, re-bid or sell each ARS on the interest reset date. Although ARS are issued and rated as long-term bonds, they are priced and traded as short-term securities available for resale because of the market liquidity provided through the interest rate reset mechanism. Each ARS purchased by DPL was tax-exempt, AAA rated and insured by a third-party insurance company. As of June 30, 2006, all of DPL’s ARS were sold.
DP&L’s Cash Position
DP&L’s cash and cash equivalents totaled $46.1$20.8 million at December 31, 2006, remained relatively unchanged when2008, compared to $46.2$13.2 million at December 31, 2005.2007, an increase of $7.6 million. The increase in cash and cash equivalents was primarily attributed to $394.6 million in cash generated from operating activities and net withdrawals of $22.5 million from restricted funds to pay for pollution control capital expenditures, partially offset by $242.0 million in capital expenditures and $155.0 million in dividends paid on common stock to the parent. At December 31, 2006,2008, DP&L had $10.1$14.5 million restricted funds held in trust relating to the issuance of the $100 million pollution control bonds. These fundsthat will be used to fund the pollution control capital expenditures.
Operating Activities
For the years ended December 31, 2006, 20052008, 2007 and 2004,2006, cash flows from operations were as follows:
Net Cash provided by Operating Activities
| | 2006 | | 2005 | | 2004 | | |
$ in millions | | | 2008 | | 2007 | | 2006 | |
| | | | | | | | | | | | | | |
DPL | | $ | 308.7 | | $ | 314.1 | | $ | 132.7 | | | $ | 363.2 | | $ | 318.1 | | $ | 286.8 | |
| | | | | | | | | | | | | | |
DP&L | | $ | 365.7 | | $ | 366.8 | | $ | 381.2 | | | $ | 394.6 | | $ | 353.0 | | $ | 343.8 | |
| | | | | | | | |
The tariff-based revenue from our energy business continues to be the principal source of cash from operating activities. Management believes that the diversified retail customer mix of residential, commercial and industrial classes coupled with the rate relief approved by the PUCO for 2006 and beyondthrough 2010 provides us with a reasonably predictable gross cash flow from operations.
DPL’s Cash provided by Operating Activities
DPL generated net cash from operating activities of $308.7 million, $314.1 million and $132.7 million in 2006, 2005 and 2004, respectively. The net cash provided by operating activities in 2006 was primarily the result of operating profitability, partially offset by an increase in cash used for working capital, specifically payments for taxes and inventories.
The net cash provided by operating activities for 20052008 was primarily the result of cash received from utility customers and from the sales of coal and excess emission allowances, partially offset by the $42 million payment made to the Ohio Department of Taxation (ODT) upon settlement of outstanding tax issues. For 2007 and 2006, net cash provided by operating profitability,activities was primarily the result of cash received from utility customers. These cash receipts were partially offset by cash used for fuel, purchased power, operating expenditures, interest and taxes. The year-to-year fluctuations in working capital specifically accounts payableresult from the sale of coal and inventories. The net cash provided by operating activitiesexcess emission allowances in 2004 was primarily2008 and from the resulttiming of operating profitability, partially offset by cash used for the shareholder litigation settlementpayments made and cash used for working capital, specifically payments for taxes and inventories.receipts from our utility customers.
47
Table of Contents
DP&L’s Cash provided by Operating Activities
DP&L generated net cash from operating activities of $365.7 million, $366.8 million and $381.2 million in 2006, 2005 and 2004, respectively.
The net cash provided by operating activities for 20062008 was primarily the result of cash received from utility customers and from the sales of coal and excess emission allowances, partially offset by the $42 million payment made to the ODT upon settlement of outstanding tax issues. For 2007 and 2006, net cash provided by operating profitability,activities was primarily the result of cash received from utility customers. These cash receipts were partially offset by cash used for fuel, purchased power, operating expenditures, interest and taxes. The year-to-year fluctuations in working capital specifically for accounts payableresult from the sale of coal and inventories. The net cash provided by operating activities for 2005 was primarily the result of operating profitability, partially offset by cash used for working capital, specifically for accounts payable, inventoriesexcess emission allowances in 2008 and from the timing of tax payments. The net cash provided by operating activities in 2004 was primarily the result of operating profitability,payments made and cash providedreceipts from working capital, specifically the timing of tax payments, offset by the rising cost of coal inventories.our utility customers.
Investing Activities
For the years ended December 31, 2006, 20052008, 2007 and 2004,2006, cash flows fromused for investing activities were as follows:
Net Cash (used for)/provided byused for Investing Activities
| | 2006 | | 2005 | | 2004 | | |
$ in millions | | | 2008 | | 2007 | | 2006 | |
| | | | | | | | | | | | | | |
DPL | | $ | (229.5 | ) | $ | 689.6 | | $ | 182.3 | | | $ | (248.5 | ) | $ | (187.8 | ) | $ | (207.6 | ) |
| | | | | | | | | | | | | | |
DP&L | | $ | (354.8 | ) | $ | (178.4 | ) | $ | (79.9 | ) | | $ | (242.0 | ) | $ | (343.2 | ) | $ | (332.9 | ) |
DPL’s Cash (used for) / provided byused for Investing Activities
DPL’s net
Net cash flows used for investing activities was $229.5 million in 2006 compared2008 were primarily related to DPL’s netcapital expenditures. Net cash flows provided byused for investing activities in 2007 were for capital expenditures, partially offset by the sale of $689.6 millionpeakers and $182.3 million in 2005 and 2004, respectively.aircraft. Net cash flows used for investing activities in 2006 were related to capital expenditures and the purchases of short-term investments and securities, partially offset by the sale of short-term investments and securities. Net cash flows provided by investing activities for 2005 were related to the proceeds from the sale of the private equity securities which are classified as discontinued operations and the sale of short-term investments and public securities unrelated to discontinued operations, partially offset by capital expenditures and purchases of short-term investments and securities. Net cash flows provided by investing activities for 2004 were related to the proceeds from the sale of the private equity securities which are classified as discontinued operations, proceeds from the sale of property and the sale of short-term investments and public securities unrelated to discontinued operations. These cash inflows were partially offset by capital expenditures and purchases of short-term investments and securities.
DP&L’s Cash (used for)used for Investing Activities
DP&L’s net cash flows used for investing activities were $354.8 million, $178.4 million and $79.9 million in 2006, 2005 and 2004, respectively.
Net cash flows used for investing activities for 20062008, 2007 and 20052006 were due to capital expenditures. Net cash flows used for investing activities for 2004 were due to capital expenditures, offset by the proceeds from the sale of property.
Financing Activities
For the years ended December 31, 2006, 20052008, 2007 and 2004,2006, cash flows fromused for financing activities were as follows:
Net Cash (used for)used for Financing Activities
| | 2006 | | 2005 | | 2004 | | |
$ in millions | | | 2008 | | 2007 | | 2006 | |
| | | | | | | | | | | | | | |
DPL | | $ | (412.8 | ) | $ | (610.0 | ) | $ | (450.5 | ) | | $ | (187.1 | ) | $ | (257.6 | ) | $ | (412.8 | ) |
| | | | | | | | | | | | | | |
DP&L | | $ | (11.0 | ) | $ | (159.4 | ) | $ | (301.3 | ) | | $ | (145.0 | ) | $ | (42.7 | ) | $ | (11.0 | ) |
DPL’s Cash (used for)used for Financing Activities
DPL’s net
Net cash flows used for financing activities in 2008 were $412.8primarily the result of cash used to redeem the $100.0 million $610.06.25% Senior Notes on May 15, 2008 and the $90.0 million OAQDA Revenue Bonds, 2007 Series A on December 4, 2008. Also, $120.5 million was used to pay dividends to common stockholders. These uses of cash were partially offset by net proceeds of $98.4 million related to the issuance of $100 million variable rate Revenue Refunding Bonds Series A and $450.5B, on December 4, 2008, as well as net withdrawals of $22.5 million from the trust set up as a result of issuing pollution control bonds. Net cash flows used for financing activities in 2006, 20052007 were primarily the result of cash used to redeem the $225.0 million 8.25% Senior Notes on March 1, 2007, and 2004, respectively.to pay dividends to common stockholders of $111.7 million. These uses of cash were partially offset by $63.2 million of withdrawals from the trust set up as a result of issuing pollution control bonds. Net cash flows used for financing activities in 2006 were the result of cash used to repurchase $400.0 million of common stock and pay dividends to common stockholders of $112.4 million. These uses of cash were partially offset by $89.9 million of withdrawals from the trust set up as a result of issuing the pollution control bonds and cash received relatingbonds.
48
Table of Contents
On December 10, 2008, DPL’s Board of Directors raised the quarterly dividend on DPL’s common stock to $0.285 per share effective with the exercisenext dividend declaration date. This increase, if maintained, results in a current annualized dividend rate of stock options$1.14 per DPL common share.
49
Table of $7.8 million. Contents
DP&L’s Cash used for Financing Activities
Net cash flows used for financing activities for 2005in 2008 were primarily the result of cash used to retire $462.6redeem the $90.0 million OAQDA Revenue Bonds, 2007 Series A on December 4, 2008, to pay common stock dividends of long-term debt, pay premiums on the early redemption$155.0 million to our parent DPL, and to repay a short-term loan to DPL of debt of $54.7 million and pay dividends to common stockholders of $115.3$20.0 million. These uses of cash were partially offset by cash received relatingnet proceeds of $98.4 million related to the exerciseissuance of stock options$100 million variable rate Revenue Refunding Bonds Series A and B on December 4, 2008, as well as net withdrawals of $22.7 million.$22.5 million from the trust set up as a result of issuing pollution control bonds. Net cash flows used for financing activities for 20042007 were primarily the result of fundscash used for the retirementto pay common stock dividends to DPL of $500$125.0 million, of the 6.82% Series Senior Notes and dividends paid to common stockholders, partially offset by $63.2 million of withdrawals from the trust set up as a result of issuing pollution control bonds and net cash received from the issuance of $175 million unsecured 8% Series Senior Notes used to provide partial funding for the retirement of the $500 million 6.82% Series Senior Notes. Annual dividends declared increased to $0.96 per share in 2004 from $0.94 per share in 2003.
On February 1, 2006, our Board of Directors announced that it had raised the quarterly dividend to $0.25 per share payable March 1, 2006 to DPL’s common shareholders of record on February 14, 2006. This increase resulted in an annualized dividend rate of $1.00 per share, or a 4% increase during 2006. On February 1, 2007, our Board of Directors announced that it had raised the quarterly dividend to $0.26 per share payable March 1, 2007 to common shareholders of record on February 14, 2007. This increase results in an annualized dividend rate of $1.04 per share, or a 4% increase that will be paid during 2007.
DP&L’s Cash (used for) Financing Activities
DP&L’s net cash flows used for financing activities were $11.0 million, $159.4 million and $301.3 million in 2006, 2005 and 2004, respectively.short-term debt. Net cash flows used for financing activities for 2006 were primarily the result of cash used to pay common stock dividends to DPL of $100.0 million, partially offset by $89.9 million of withdrawals
from the trust set up as a result of issuing the pollution control bonds. Net cash flows used
Future Liquidity Requirements
In addition to its working capital requirements for financing activities for 2005 were primarily the result of cash used to retire $218.9 million of long-term debt and pay common stock dividends to2009, DPL is projecting to spend approximately $150 million on capital expenditures relating primarily to its transmission and distribution system, plant and equipment and its environmental compliance program. Also, DPL’s $175 million 8.00% Senior Notes become due in March 2009. We expect to fund these liquidity requirements using a combination of $150.0 million. These usesprojected cash from operations, cash on hand and short-term borrowings. In reviewing our future liquidity requirements, we considered the following:
·DPL has a $220 million unsecured revolving credit facility expiring in November 2011 and this facility may be increased by an additional $50 million at any time at the option of cash were partially offset by the net cash received from the issuanceDPL. We had no outstanding borrowings under this credit facility at December 31, 2008. Three banks participate in this facility.
· Our future capital expenditures are expected to decrease relative to prior years and are projected to approximate a total of long-term debt. Net cash flows used for financing activities for 2004 were$475 million for the payment of commonthree-year period 2009, 2010 and preferred dividends and the retirement of long-term debt.2011.
DPL· and DP&L have obligations to make future payments for capital expenditures, debt agreements, lease agreements and other long-term purchase obligations, and have certain contingent commitments such as guarantees. We believe our cash Cash flows generated from operations the credit facilities (existing or future arrangements), the senior notes, and other short- and long-term debt financing, will be sufficientare expected to satisfy our future working capital, capital expenditures and other financing requirements forremain strong in the foreseeable future. Our ability to generate positive cash flows from operations is dependent on general economic conditions, competitive pressures, and other business and risk factors described in Item 1a1A of this Form 10-K. IfWe have not seen any material increase in our provision for bad debts or in our customer disconnections for non-payment of electric services.
Despite the unprecedented turmoil in the credit markets during recent months, we are unablebelieve that our existing sources of liquidity will be sufficient to generate sufficientmeet our future cash flows from operations, or otherwise comply with the termsobligations and those of our credit facilities and the senior notes, we may be required to refinance all or a portion of our existing debt or seek additional financing alternatives.subsidiaries. A discussion of each of our critical liquidity commitments is outlined below.
Capital Requirements
CONSTRUCTION ADDITIONS
| | Actual | | Projected | |
$ in millions | | 2006 | | 2005 | | 2004 | | 2007 | | 2008 | | 2009 | |
| | | | | | | | | | | | | |
DPL Inc. | | $ | 352 | | $ | 180 | | $ | 98 | | $ | 310 | | $ | 165 | | $ | 130 | |
| | | | �� | | | | | | | | | |
DP&L | | $ | 349 | | $ | 178 | | $ | 93 | | $ | 310 | | $ | 165 | | $ | 130 | |
| | Actual | | Projected | |
$ in millions | | 2008 | | 2007 | | 2006 | | 2009 | | 2010 | | 2011 | |
| | | | | | | | | | | | | |
DPL Inc. | | $ | 228 | | $ | 347 | | $ | 352 | | $ | 150 | | $ | 150 | | $ | 175 | |
| | | | | | | | | | | | | |
DP&L | | $ | 225 | | $ | 344 | | $ | 349 | | $ | 147 | | $ | 148 | | $ | 173 | |
DPL’s construction additions were $228 million, $347 million and $352 million $180 millionin 2008, 2007 and $98 million in 2006, 2005 and 2004, respectively, and are expected to approximate $310$150 million in 2007.
DP&L’s construction additions were $349 million, $178 million and $93 million in 2006, 2005 and 2004, respectively, and are expected to approximate $310 million in 2007.2009. Planned construction additions for 20072009 relate to DP&L’s environmental compliance program, power plant equipment and its transmission and distribution system.
DP&L’s construction additions were $225 million, $344 million and $349 million in 2008, 2007 and 2006, respectively, and are expected to approximate $147 million in 2009. Planned construction additions for 2009 relate to DP&L’s environmental compliance program, power plant equipment and its transmission and distribution system.
50
Table of Contents
Capital projects are subject to continuing review and are revised in light of changes in financial and economic conditions, load forecasts, legislative and regulatory developments and changing environmental standards, among other factors. Over the next three years, DPL,, through its subsidiary DP&L, is projecting to spend an estimated $605$475 million in capital projects approximately 40% of which is to meet changing environmental standards.for the period 2009 through 2011. Our ability to complete capital projects and the reliability of future service will be affected by our financial condition, the availability of internal funds and the reasonable cost of external funds. We expect to finance our construction additions in 2007 with a combination of cash on hand, short-term financing, tax-exemptlong-term debt and cash flows from operations.
Debt and Debt Covenants
On March 25, 2004, DPL completed a $175 million private placement of unsecured 8%8.00% Series Senior Notes due March 2009. The Senior Notes will not be redeemable prior to maturity except that DPL has the right to redeem the notes for a make-whole payment at the adjusted treasury rate plus 0.25%. The 8% Series Senior Notes were issued pursuant to its indenture dated as of March 1, 2000, and pursuant to authority granted in the Board resolutions dated March 25, 2004. The notes impose a limitation on the incurrence of liens on the capital stock of any of DPL’s significant subsidiaries and require DPL and its subsidiaries to meet a consolidated coverage ratio of 2 to 1 prior to incurring additional indebtedness. The limitation on the incurrence of additional indebtedness does not apply to (i) indebtedness incurred to refinance existing indebtedness, (ii) subordinated indebtedness and (iii) up to $150 million of additional indebtedness. In addition to the events of default specified in the indenture, an event of default under the notes includes a payment default or acceleration of indebtedness under any other indebtedness of DPL or any of its subsidiaries which aggregates $25 million or more. The
purchasers were granted registration rights in connection with the private placement under an Exchange and Registration Rights Agreement. Pursuant to this agreement, DPL was obligated to file an exchange offer registration statement by July 22, 2004, have the registration statement declared effective by September 20, 2004 and consummate the exchange offer by October 20, 2004. DPL failedfailed: (1) to have a registration statement declared effectiveeffective; and (2) to complete the exchange offer according to this timeline. As a result, DPL had been accruing additional interest at a rate of 0.5% per year for each of these two violations, up to an additional interest rate not to exceed in the aggregate 1.0% per year. As each violation was cured, the additional interest rate decreased by 0.5% per annum. DPL’s exchange offer registration statement for these securities was declared effective by the SECU.S. Securities and Exchange Commission on June 27, 2006. As a result, on June 27, 2006, DPL ceased accruing 0.5% of the additional interest. On July 31, 2006, DPL ceased accruing the other 0.5% of additional interest when the exchange of registered notes for the unregistered notes was completed. By completing the exchange, DPL reduced the annual interest expense by $1.8 million.
During the first quarter 2006, the Ohio Department of Development (ODOD) awarded DP&L the ability to issue, over the next three years, up to $200 million of qualified tax-exempt financing from the ODOD’s 2005 volume cap carryforward. The financing iswas to be used to partially fund the ongoing flue gas desulfurization capital projects. The PUCO approved DP&L’s application for this additional financing on July 26, 2006.
On September 13, 2006, theNovember 15, 2007, The Ohio Air Quality Development Authority (OAQDA) issued $100$90 million of 4.80% fixed interestcollateralized, variable rate OAQDA Revenue bonds 2006Bonds, 2007 Series A due SeptemberNovember 1, 2036.2040. In turn, DP&L borrowed these funds from the OAQDA. The payment of principal and interest on the Bondsbonds when due iswas insured by an insurance policy issued by Financial Guaranty Insurance Company.Company (FGIC). During the first quarter of 2008, all three credit rating agencies downgraded FGIC. These downgrades, as well as the downgrades of our major bond insurers, resulted in auction rate security bonds carrying substantially higher interest rates in succeeding auctions and incurring failed auctions. On April 4, 2008, DP&L converted the 2007 Series A Bonds from Auction Rate Securities to Variable Rate Demand Notes. At that time, DP&L purchased these notes out of the market and placed them with the Trustee to be held until the capital markets corrected. These notes were redeemed in December 2008 as discussed in the following paragraph.
On December 4, 2008, the OAQDA issued $100 million of collateralized, variable rate Revenue Refunding Bonds Series A and B due November 1, 2040. In turn, DP&L borrowed these funds from the OAQDA. The payment of principal and interest on the bonds when due is backed by a standby letter of credit issued by a syndicated bank group credit facility. DP&L is using the proceeds from$10 million of these borrowingsbonds to assist in financingfinance its portion of the costs of acquiring, constructing and installing certain solid waste disposal and air quality facilities at Miami Fort, Killen and Stuart Generating Stations. These facilitiesthe Conesville generation station. The remaining $90 million was used to redeem the 2007 Series A Bonds. The above transactions are currently under construction and the proceeds from the borrowing have been placedfurther discussed in escrow with the trustee (the BankNote 7 of New York) and are being drawn upon only as facilities are built and qualified costs are incurred. In the event anyNotes to Consolidated Financial Statements.
51
Table of the proceeds are not drawn, DP&L would eventually be required to return the unused proceeds to bondholders. DP&L expects to draw down the remaining available funds from this borrowing during the first quarter of 2007.Contents
DP&L expects to use the remaining $100 million of volume cap carryforward prior to the end of 2008. DP&L is planning to issue in conjunction with the OAQDA this $100 million of tax-exempt bonds to finance the remaining solid waste disposal facilities at Miami Fort, Killen, Stuart and Conesville Generating Stations.
On November 21, 2006, DP&L entered into a new $220 million unsecured revolving credit agreement replacing its $100 million facility. This new agreement hashad a five yearfive-year term that expires on November 21, 2011 and that provides DP&L with the ability to increase the size of the facility by an additional $50 million at any time. The facility contains one financial covenant:covenant; DP&L’s total debt to total capitalization ratio is not to exceed 0.65 to 1.00. This covenant is currently met.met with a ratio of 0.39 to 1.00. DP&L had no outstanding borrowings under this credit facility at December 31, 2006.2008. Fees associated with this credit facility are approximately $0.2 million per year. Changes in credit ratings, however, may affect fees and the applicable interest. This revolving credit agreement also contains a $50 million letter of credit sublimit. As of December 31, 2006, DP&L had no outstanding letters of credit against the facility.
On February 24, 2005, DP&L entered into an amendment to extend the term of its Master Letter of Credit Agreement with a financial lending institution for one year and to reduce the maximum dollar volume of letters of credit to $10 million. On February 17, 2006, DP&L renewed its $10 million agreement for one year. This agreement supports performance assurance needs in the ordinary course of business. This agreement was not renewed in 2007.sub-limit. DP&L has certain contractual agreements for the sale and purchase of power, fuel and related energy services that contain credit rating related clauses allowing the counter parties to seek additional surety under certain conditions. As of December 31, 2006,2008, DP&L had twono outstanding letters of credit foragainst the facility.
During the second quarter ended June 30, 2007, DPL provided a totalshort-term loan to DP&L in the amount of $2.2$105 million.
Issuance of additional amounts of first mortgage bonds by DP&L is limited bypaid down $15 million of this loan during the provisions of its mortgage; however, management believes that DP&L continues to have sufficient capacity to issuethird quarter ended September 30, 2007, an additional $70 million during the fourth quarter ended December 31, 2007, and the final $20 million during the first mortgage bonds to satisfy its requirements in connection with its current refinancing and construction programs. The amounts and timing of future financings will depend upon market and other conditions, rate increases, levels of sales and construction plans.
quarter ended March 31, 2008. This short-term loan does not affect our debt covenants. There are no other inter-company debt collateralizations or debt guarantees between DPL, DP&L and itstheir subsidiaries. None of the debt obligations of DPL or DP&L are guaranteed or secured by affiliates and no cross-collateralization exists between any subsidiaries.
41
Credit Ratings
Currently, DPL’s senior unsecured and DP&L’s senior secured debt credit ratings are as follows:
| | DPL Inc. | | DP&L | | Outlook | | Effective |
| | | | | | | | |
Fitch Ratings | | BBBBBB+
| | AA+
| | StablePositive
| | April 20062008 |
Moody’s Investors Service | | Baa3Baa2
| | A3A2
| | Positive | | June 2006July 2008
|
Standard & Poor’s Corp. | | BBB- | | BBB+A-
| | StablePositive
| | February 2007April 2008
|
Off-Balance Sheet Arrangements
DPL Inc. - Guarantees
In the normal course of business, DPL enters into various agreements with its wholly-owned generating subsidiary DPLE providing financial or performance assurance to third parties. These agreements are entered into primarily to support or enhance the creditworthiness otherwise attributed to DPLE on a stand-alone basis, thereby facilitating the extension of sufficient credit to accomplish DPLE’s intended commercial purposes. Such agreements fall outside the scope of FASB Interpretation No. 45, “Guarantor’s Accounting and Disclosure Requirements for Guarantees, Including Indirect Guarantees of Indebtedness of Others.”
At December 31, 2008, DPL had $35.3 million of guarantees to third parties for future financial or performance assurance under such agreements, on behalf of DPLE. The guarantee arrangements entered into by DPL with these third parties cover all present and future obligations of DPLE to such beneficiaries and are terminable at any time by DPL upon written notice to the beneficiaries. The carrying amount of obligations for commercial transactions covered by these guarantees and recorded in our consolidated balance sheets was $1.6 million at December 31, 2008 and $0.5 million at December 31, 2007.
In two separate transactions in November and December 2006, DPL also agreed to be a guarantor of the obligations of DPLE regarding the sale in April 2007 of the Darby Electric Peaking Station to American Electric Power and the sale of the Greenville Electric Peaking Station to Buckeye Electric Power, Inc. In both cases, DPL agreed to guarantee the obligations of DPLE over a multiple year period as follows:
$ in millions | | 2008 | | 2009 | | 2010 | |
Darby | | $ | 23.0 | | $ | 15.3 | | $ | 7.7 | |
| | | | | | | |
Greenville | | $ | 11.1 | | $ | 7.4 | | $ | 3.7 | |
In 2008, neither DPL nor DP&L incurred any losses related to the guarantees of DPLE’s obligations and we believe it is unlikely that either DPL or DP&L would be required to perform or incur any losses in the future associated with any of the above guarantees of DPLE’s obligations.
52
Table of Contents
DP&L — Equity Ownership Interest
DP&L owns a 4.9% equity ownership interest in an electric generation company. As of December 31, 2008, DP&L could be responsible for the repayment of 4.9%, or $51.2 million, of a $1,045 million debt obligation that matures in 2026. This would only happen if this electric generation company defaulted on its debt payments.
Other than the guarantees discussed above, DPL and DP&L do not have any other off-balance sheet arrangements that have or are reasonably likely to have a current or future material effect on our financial condition, revenues or expenses, results of operations, liquidity, capital expendituresfinancial condition, or capital resources that are material to investors.cash flows.
Contractual Obligations and Commercial Commitments
We enter into various contractual obligations and other commercial commitments that may affect the liquidity of our operations. At December 31, 2006,2008, these include:
Contractual Obligations
| | | | Payment Year | |
$ in millions | | Total | | 2009 | | 2010-2011 | | 2012-2013 | | Thereafter | |
DPL Inc. | | | | | | | | | | | |
| | | | | | | | | | | |
Long-term debt | | $ | 1,551.8 | | $ | 175.0 | | $ | 297.4 | | $ | 470.0 | | $ | 609.4 | |
Interest payments | | 937.1 | | 79.7 | | 145.7 | | 105.6 | | 606.1 | |
Pension and postretirement payments | | 244.9 | | 22.8 | | 46.7 | | 48.6 | | 126.8 | |
Capital leases | | 1.3 | | 0.7 | | 0.6 | | — | | — | |
Operating leases | | 0.8 | | 0.4 | | 0.3 | | 0.1 | | — | |
Coal contracts (a) | | 1,675.1 | | 514.2 | | 539.8 | | 168.4 | | 452.7 | |
Limestone contracts | | 52.2 | | 4.7 | | 10.8 | | 11.5 | | 25.2 | |
Reserve for uncertain tax positions | | 1.9 | | — | | 1.9 | | — | | — | |
Other contractual obligations | | 97.3 | | 40.5 | | 46.9 | | 8.5 | | 1.4 | |
Total contractual obligations | | $ | 4,562.4 | | $ | 838.0 | | $ | 1,090.1 | | $ | 812.7 | | $ | 1,821.6 | |
| | | | Payment Year | | |
| | | | Less Than | | 2 - 3 | | 4 - 5 | | More Than | | |
$ in millions | | Total | | 1 Year | | Years | | Years | | 5 Years | | |
DPL Inc. | | | | | | | | | | | | |
| | | | | | | | | | | | |
Long-term debt | | $ | 1,774.8 | | $ | 225.0 | | $ | 275.0 | | $ | 297.4 | | $ | 977.4 | | |
Interest payments | | 1,101.8 | | 98.8 | | 171.2 | | 144.0 | | 687.8 | | |
Pension and postretirement payments | | 235.6 | | 22.0 | | 45.2 | | 46.5 | | 121.9 | | |
Capital leases | | 2.9 | | 0.9 | | 1.4 | | 0.6 | | — | | |
Operating leases | | 0.7 | | 0.3 | | 0.3 | | 0.1 | | — | | |
Coal contracts (a) | | 554.6 | | 324.4 | | 118.4 | | 111.8 | | — | | |
Limestone contracts | | 58.7 | | 1.7 | | 9.5 | | 10.8 | | 36.7 | | |
Other contractual obligations | | 391.7 | | 328.5 | | 53.7 | | 9.5 | | — | | |
Total contractual obligations | | $ | 4,120.8 | | $ | 1,001.6 | | $ | 674.7 | | $ | 620.7 | | $ | 1,823.8 | | |
| | | | | | | | | | | | |
DP&L | | | | | | | | | | | | | | | | | | | | | | |
| | | | | | | | | | | | | | | | | | | | | | |
Long-term debt | | $ | 783.2 | | $ | — | | $ | — | | $ | — | | $ | 783.2 | | | $ | 884.4 | | $ | — | | $ | — | | $ | 470.0 | | $ | 414.4 | |
Interest payments | | 571.9 | | 39.1 | | 78.3 | | 78.3 | | 376.2 | | | 519.9 | | 40.0 | | 79.9 | | 73.9 | | 326.1 | |
Pension and postretirement payments | | 235.6 | | 22.0 | | 45.2 | | 46.5 | | 121.9 | | | 244.9 | | 22.8 | | 46.7 | | 48.6 | | 126.8 | |
Capital leases | | 2.9 | | 0.9 | | 1.4 | | 0.6 | | — | | | 1.3 | | 0.7 | | 0.6 | | — | | — | |
Operating leases | | 0.7 | | 0.3 | | 0.3 | | 0.1 | | — | | | 0.8 | | 0.4 | | 0.3 | | 0.1 | | — | |
Coal contracts (a) | | 554.6 | | 324.4 | | 118.4 | | 111.8 | | — | | | 1,675.1 | | 514.2 | | 539.8 | | 168.4 | | 452.7 | |
Limestone contracts | | 58.7 | | 1.7 | | 9.5 | | 10.8 | | 36.7 | | | 52.2 | | 4.7 | | 10.8 | | 11.5 | | 25.2 | |
Reserve for uncertain tax positions | | | 1.9 | | — | | 1.9 | | — | | — | |
Other contractual obligations | | 391.5 | | 328.4 | | 53.6 | | 9.5 | | — | | | 99.5 | | 41.6 | | 48.0 | | 8.5 | | 1.4 | |
Total contractual obligations | | $ | 2,599.1 | | $ | 716.8 | | $ | 306.7 | | $ | 257.6 | | $ | 1,318.0 | | | $ | 3,480.0 | | $ | 624.4 | | $ | 728.0 | | $ | 781.0 | | $ | 1,346.6 | |
(a) Total at DP&L-&Loperated-operated units
53
Table of Contents
Long-term debt:
DPL’s long-term debt as of December 31, 2006,2008, consists of DP&L’s first mortgage bonds, tax-exempt pollution control bonds and DPL unsecured notes and includessenior notes. These long-term debt figures include current maturities and unamortized debt discounts. During 2006,2008, the OAQDA issued $100 million of tax-exempt pollution control bonds which mature in 2040. In turn, DP&L entered intoborrowed the proceeds of the bonds and issued $100 million of long-term tax-exempt debt.its First Mortgage Bonds to secure its payment obligations.
DP&L’s long-term debt as of December 31, 2006,2008, consists of first mortgage bonds and tax-exempt pollution control bonds. These long-term debt figures include current maturities and unamortized debt discounts. During 2008, the OAQDA issued $100 million of tax-exempt pollution control bonds which mature in 2040. In turn, DP&L borrowed the proceeds of the bonds and includes an unamortized debt discount.issued $100 million of its First Mortgage Bonds to secure its payment obligations.
See Note 87 of Notes to Consolidated Financial Statements.
Interest payments:
Interest payments associated with the Long-termlong-term debt described above.
Pension and postretirement payments:
As of December 31, 2006,2008, DPL, through its principal subsidiary, DP&L, had estimated future benefit payments as outlined in Note 59 of Notes to Consolidated Financial Statements. These estimated future benefit payments are projected through 2015.2018.
Capital leases:
As of December 31, 2006,2008, DPL, through its principal subsidiary, DP&L, had twoone capital leaseslease that expireexpires in November 2007 and September 2010.
Operating leases:
As of December 31, 2006,2008, DPL and, through its principal subsidiary, DP&L, had several operating leases with various terms and expiration dates. Not included in this total is approximately $88,000 per year related to right of way agreements that are assumed to have no definite expiration dates.
Coal contracts:
DPL, through its principal subsidiary, DP&L, has entered into various long-term coal contracts to supply portions of itsthe coal requirements for itsthe generating plants.plants it operates. Contract prices are subject to periodic adjustment and have features that limit price escalation in any given year.
Limestone contracts:
DPL, through its principal subsidiary, DP&L, has entered into various limestone contracts to supply limestone for its generating facilities.
Reserve for uncertain tax positions:
On January 1, 2007, we adopted Financial Accounting Standards Board (FASB) Interpretation No. 48, “Accounting for Uncertainty in Income Taxes” (FIN 48). As of December 31, 2008, our total reserve for uncertain tax positions is $1.9 million. See Note 1 of Notes to Consolidated Financial Statements.
Other contractual obligations:
As of December 31, 2006,2008, DPL and DP&L had various other contractual obligations including non-cancelable contracts to purchase goods and services with various terms and expiration dates.
We enter into various
At December 31, 2008, the commercial commitments whichthat may affect the liquidity of our operations. At December 31, 2006, theseoperations include:
Credit facilities:
In November 2006, DP&L replaced its previous $100 million revolving credit agreement with a $220 million five year facility that expires on November 21, 2011. At December 31, 2006,2008, there were no borrowings outstanding under this credit agreement. DP&L has the ability to increase the size of the facility by an additional $50 million at any time.
Guarantees:
54
DP&L owns a 4.9% equity ownership interest in an electric generation company. AsTable of December 31, 2006, DP&L could be responsible for the repayment of 4.9%, or $21.8 million, of a $445 million debt obligation that matures in 2026.
In two separate transactions in November and December 2006, DPL agreed to be a guarantor of the obligations of its wholly-owned subsidiary, DPL Energy, LLC (DPLE) regarding the pending sale of the Darby Electric Peaking Station to American Electric Power and the sale of the Greenville Electric Peaking Station to Buckeye Electric Power, Inc. In both cases, DPL has agreed to guarantee the obligations of DPLE over a multiple year period as follows:Contents
| | 2007 | | 2008 | | 2009 | | 2010 | |
Darby | | $ | 30.6 | | $ | 23.0 | | $ | 15.3 | | $ | 7.7 | |
| | | | | | | | | |
Greenville | | $ | 14.8 | | $ | 11.1 | | $ | 7.4 | | $ | 3.7 | |
MARKET RISK
As a result
During the conduct of its operating, investing and financing activities,our business, we are subject to certain market risks including, but not limited to, changes in commodity prices for electricity, coal, environmental emissions and gas, and fluctuations in interest rates. Commodity pricing exposure includes the impacts of weather, market demand, increased competition and other economic conditions. For purposes of potential risk analysis, we use sensitivity analysis to quantify potential impacts of market rate changes on the results of operations. The sensitivity analysis represents hypothetical changes in market values that may or may not occur in the future.
Our Risk Management Committee (RMC) is responsible for establishing risk management policies and the monitoring and reporting of risk exposures. The RMC meets on a regular basis with the objective of identifying, assessing and quantifying material risk issues and developing strategies to manage these risks.
Commodity Pricing Risk
Recently, the coal market has experienced unprecedented price volatility. We are now in a market for coal that clears on international, rather than solely domestic supply and consumption. Our domestic price is increasingly affected by international supply disruptions and demand balance. Exports from the U.S. have increased in recent years and domestic issues like government-imposed direct costs and permitting issues are affecting mining costs and supply availability. We have responded to increases in the price of coal by entering into contracts to hedge our exposure to fuel requirements and other energy-related commodities. We may not be able to hedge the entire exposure of our operations from commodity price volatility. To the extent we are not able to hedge against price volatility, our results of operations, financial position or cash flows could be materially affected.
Approximately 12.5%16% of DPL’s and 22%25% of DP&L’s 20062008 electric revenues were from sales of excess energy and capacity in the wholesale market. Energy and capacity in excess of the needs of existing retail customers are sold in the wholesale market when we can identify opportunities with positive margins. As of December 31, 2006,2008, a hypothetical increase or decrease of 10% in DPL’s annual wholesale revenues could result in approximately an $11 million increase or decrease to net income, assuming no increases in fuel and purchased power costs. As of December 31, 2006,2008, a hypothetical increase or decrease of 10% in DP&L’s annual wholesale revenues could result in approximately a $20$21 million increase or decrease to net income, assuming no increases in fuel and purchased power costs.
DPL’s fuel (including coal, gas, oil and emission allowances) and purchased power costs as a percent of total operating costs in 20062008 and 20052007 were 46%33% and 50%42%, respectively. DP&L’s fuel (including coal, gas, oil and emission allowances) and purchased power costs as a percent of total operating costs was 52% in both 20062008 and 2005.2007 were 34% and 43%, respectively. We have substantially all of the total expected coal volume needed to meet our retail and firm wholesale sales requirements for 20072009 under contract. The majority of our contracted coal is purchased at fixed prices. Some contracts provide for periodic adjustment and some are priced based on market indices. Substantially all contracts have features that limit price escalations in any given year. Our consumption of SO2 allowances should decline in 20072009 due to planned emission control upgrades. We do not expect to purchase SO2 allowances for 2007.2009. The exact consumption of SO2 allowances will depend on market prices for power, availability of our generation units, the timing of emission control equipment upgrade completion and the actual sulfur content of the coal burned. DP&L does not plan to purchase NOxX allowances for 2007.2009. Fuel costs are impacted by changes in volume and price and are driven by a number of variables including weather, reliability of coal deliveries, scheduled outages and generation plant mix. Based on weather normalized saleshigher volume and our co-owners’ projections,price, fuel costs excluding gains from the sale of emission allowances are forecasted to be flat25% to 35% higher in 20072009 compared to 2006.2008.
Purchased power costs depend, in part, upon the timing and extent of planned and unplanned outages of our generating capacity. We will purchase power on a discretionary basis when wholesale market conditions provide opportunities to obtain power at a cost below our internal production costs. As of December 31, 2006,2008, a hypothetical increase or decrease of 10% in DPL’s annual fuel and purchased power costs could result in approximately a $30 million increase or decrease to net income. As of December 31, 2006,2008, a hypothetical increase or decrease of 10% in DP&L’s annual fuel and purchased power costs could result in approximately a $29 million increase or decrease to net income.
55
Table of Contents
Interest Rate Risk
As a result of our normal borrowinginvesting and leasingborrowing activities, our financial results are exposed to fluctuations in interest rates, which we manage through our regular financing activities. We maintain both cash on deposit and investments in cash equivalents that may be affected by adverse interest rate fluctuations. OurDPL has fixed-rate long-term debt representsand DP&L has both fixed and variable-rate long-term debt. DP&L’s variable-rate debt is comprised of publicly held pollution control bonds. The variable-rate bonds bear interest based on a prevailing rate that is reset weekly based on a comparable market index. Market indexes can be affected by market demand, supply, market interest rates and privatelyother economic conditions.
On November 15, 2007, The Ohio Air Quality Development Authority (OAQDA) issued $90 million of collateralized, variable rate OAQDA Revenue Bonds, 2007 Series A due November 1, 2040. In turn, DP&L borrowed these funds from the OAQDA. The payment of principal and interest on the bonds when due was insured by an insurance policy issued by Financial Guaranty Insurance Company (FGIC). During the first quarter of 2008, all three credit rating agencies downgraded FGIC. These downgrades, as well as the downgrades of our major bond insurers, resulted in auction rate security bonds carrying substantially higher interest rates in succeeding auctions and incurring failed auctions. On April 4, 2008, DP&L converted the 2007 Series A Bonds from Auction Rate Securities to Variable Rate Demand Notes. At that time, DP&L purchased these notes out of the market and placed them with the Trustee to be held secureduntil the capital markets corrected. These notes were redeemed in December 2008 (see below).
On December 4, 2008, the OAQDA issued $100 million of collateralized, variable rate Revenue Refunding Bonds Series A and unsecured notesB due November 1, 2040. In turn, DP&L borrowed these funds from the OAQDA. The payment of principal and debentures with fixed interest rates. At December 31, 2006, we had no short-term borrowings.on the bonds when due is backed by a standby letter of credit issued by a syndicated bank group credit facility. DP&L is using $10 million of these bonds to finance its portion of the costs of acquiring, constructing and installing certain solid waste disposal and air quality facilities at the Conesville generating station. The remaining $90 million was used to redeem the 2007 Series A Bonds. The above transactions are further discussed in Note 7 of Notes to Consolidated Financial Statements.
The carrying value of DPL’s debt was $1,777.7$1,551.8 million at December 31, 2006,2008, consisting of DP&L’s first mortgage bonds, DP&L’s tax-exempt pollution control bonds, our DPL’s unsecured notes and DP&L’s capital leases.lease. The fair value of this debt was $1,798.5$1,470.5 million, based on current market prices or discounted cash flows using current rates for similar issues with similar terms and remaining maturities. The principal cash repaymentsfollowing table provides information about DPL’s debt obligations that are sensitive to interest rate changes:
Principal Payments and related weighted average interest ratesInterest Rate Detail by maturity date for long-term, fixed-rate debt at December 31, 2006, are as follows:Contractual Maturity Date
| | DPL’s Long-term Debt |
| | Amount | | |
Expected MaturityDate | | ($ in millions) | | Average Rate |
| | | | |
2007 | | $ | 225.9 | | 8.2% |
2008 | | 100.7 | | 6.3% |
2009 | | 175.7 | | 8.0% |
2010 | | 0.6 | | 6.9% |
2011 | | 297.4 | | 6.9% |
Thereafter | | 977.4 | | 5.6% |
Total | | $ | 1,777.7 | | 6.4% |
| | | | |
Fair Value | | $ | 1,798.5 | | |
DPL Inc
| | | | | | | | | | | | | | Carrying value at | | Fair value at | |
| | | | | | | | | | | | | | December 31, | | December 31, | |
$ in millions | | 2009 | | 2010 | | 2011 | | 2012 | | 2013 | | Thereafter | | 2008 | | 2008 | |
Long-term debt | | | | | | | | | | | | | | | | | |
| | | | | | | | | | | | | | | | | |
Variable-rate debt | | $ | — | | $ | — | | $ | — | | $ | — | | $ | — | | $ | 100.0 | | $ | 100.0 | | $ | 100.0 | |
Average interest rate | | N/A | | N/A | | N/A | | N/A | | N/A | | 0.8 | % | 0.8 | % | | |
| | | | | | | | | | | | | | | | | |
Fixed-rate debt | | $ | 175.7 | | $ | 0.6 | | $ | 297.4 | | $ | — | | $ | 470.0 | | $ | 508.1 | | $ | 1,451.8 | | $ | 1,370.5 | |
Average interest rate | | 8.0 | % | 2.0 | % | 6.9 | % | N/A | | 5.1 | % | 6.1 | % | 6.2 | % | | |
| | | | | | | | | | | | | | | | | |
Total | | | | | | | | | | | | | | $ | 1,551.8 | | $ | 1,470.5 | |
The carrying value of DP&L’s debt was $786.1$884.7 million at December 31, 2006,2008, consisting of our first mortgage bonds, our tax-exempt pollution control bonds and oura capital leases.lease. The fair value of this debt was $785.8$815.7 million, based on current market prices or discounted cash flows using current rates for similar issues with similar terms and remaining maturities. The principal cash repayments and related weighted averagefollowing table provides information about DP&L’s debt obligations that are sensitive to interest rates by maturity date for long-term, fixed-rate debt at December 31, 2006, are as follows:rate changes:
56
| | DP&L’s Long-term Debt |
| | Amount | | |
Expected MaturityDate | | ($ in millions) | | Average Rate |
| | | | |
2007 | | $ | 0.9 | | 6.2% |
2008 | | 0.7 | | 6.9% |
2009 | | 0.7 | | 6.9% |
2010 | | 0.6 | | 6.9% |
2011 | | — | | — |
Thereafter | | 783.2 | | 5.0% |
Total | | $ | 786.1 | | 5.0% |
| | | | |
Fair Value | | $ | 785.8 | | |
Table of Contents
Principal Payments and Interest Rate Detail by Contractual Maturity Date
DP&L
| | | | | | | | | | | | | | Carrying value at | | Fair value at | |
| | | | | | | | | | | | | | December 31, | | December 31, | |
$ in millions | | 2009 | | 2010 | | 2011 | | 2012 | | 2013 | | Thereafter | | 2008 | | 2008 | |
Long-term debt | | | | | | | | | | | | | | | | | |
| | | | | | | | | | | | | | | | | |
Variable-rate debt | | $ | — | | $ | — | | $ | — | | $ | — | | $ | — | | $ | 100.0 | | $ | 100.0 | | $ | 100.0 | |
Average interest rate | | N/A | | N/A | | N/A | | N/A | | N/A | | 0.8 | % | 0.8 | % | | |
| | | | | | | | | | | | | | | | | |
Fixed-rate debt | | $ | 0.7 | | $ | 0.6 | | $ | — | | $ | — | | $ | 470.0 | | $ | 313.4 | | $ | 784.7 | | $ | 715.7 | |
Average interest rate | | 2.0 | % | 2.0 | % | N/A | | N/A | | 5.1 | % | 4.8 | % | 5.0 | % | | |
| | | | | | | | | | | | | | | | | |
Total | | | | | | | | | | | | | | $ | 884.7 | | $ | 815.7 | |
Debt maturities for DPL and DP&L in 2007 are expected to be financed with a combination of tax-exempt pollution control bonds and internal funds.
Debt retirements occurring in 20062009 are discussed under FINANCIAL CONDITION, LIQUIDITY AND CAPITAL REQUIREMENTS.
CRITICAL ACCOUNTING ESTIMATES
DPL’s and DP&L’s consolidated financial statements are prepared in accordance with US GAAP. In connection with the preparation of these financial statements, our management is required to make assumptions, estimates and judgments that affect the reported amounts of assets, liabilities, revenues, expenses and the related disclosure of contingent liabilities. These assumptions, estimates and judgments are based on our historical experience and assumptions that we believed to be reasonable at the time. However, because future events and their effects cannot be determined with certainty, the determination of estimates requires the exercise of judgment. Our critical accounting estimates are those which require assumptions to be made about matters that are highly uncertain.
Different estimates could have a material effect on our financial results. Judgments and uncertainties affecting the application of these policies and estimates may result in materially different amounts being reported under different conditions or circumstances. Historically, however, recorded estimates have not differed materially from actual results. Significant items subject to such judgments include: the carrying value of property, plant and equipment; revenue recognition including unbilled revenues; income taxes; valuation of regulatory assets and liabilities; the valuation of asset retirement obligations; the valuation of insurance and claims costs; valuation allowances for receivables and deferred income taxes; the valuation of reserves related to current litigation; and assets and liabilities related to employee benefits.benefits; and the valuation of contingent and other obligations.
Long-Lived Assets:Impairments and Assets Held for Sale: In accordance with Statement of Financial Accounting Standards No. 144 “Accounting for the Impairment or Disposal of Long-Lived Assets” (SFAS 144), long-lived assets to be held and used are reviewed for impairment whenever events or circumstances indicate that the carrying amount may not be recoverable. When required, impairment losses on assets to be held and used are recognized based on the fair value of the asset. We determine the fair value of these assets based upon estimates of future cash flows, market value of similar assets, if available or independent appraisals, if required. In analyzing the fair value and recoverability using future cash flows, we make projections based on a number of assumptions and estimates of growth rates, future economic conditions, assignment of discount rates and estimates of terminal values. An impairment loss is recognized if the carrying amount of the long-lived asset is not recoverable from its undiscounted cash flows. The measurement of impairment loss is the difference between the carrying amount and fair value of the asset. Long-lived assets to be disposed of and/or held for sale are reported at the lower of carrying amount or fair value less cost to sell. We determine the fair value of these assets in the same manner as described for assets held and used.
57
Table of Contents
Revenue Recognition (including Unbilled Revenue): We consider revenue realized, or realizable, and earned when persuasive evidence of an arrangement exists, the products or services have been provided to the customer, the sales price is fixed or determinable, and collectibilitycollection is reasonably assured. Werecord electric revenues when deliveredThe determination of the energy sales to customers. Customers are billedcustomers is based on the reading of their meters, which occurs on a systematic basis throughout the month as electric meters are read.month. We recognize revenues using an accrual method for retail and other energy sales that have not yet been billed, but where electricity has been consumed. This is termed “unbilled revenues” and is a widely recognized and accepted practice for utilities. Our estimates of unbilled revenues use systems that consider various factors to calculate retail customer consumption atAt the end of each month. These estimatesmonth, unbilled revenues are based ondetermined by the volumeestimation of unbilled energy delivered, historical usage and growth byprovided to customers since the date of the last meter reading, projected line losses, the assignment of unbilled energy provided to customer class,classes and the effect of weather variations on usage patterns.average rate per customer class. Given the use of these systemsour estimation method and the fact that customers are billed monthly, we believe it is unlikely that materially different results will occur in future periods when these amounts are subsequently billed.
Additionally, DP&L is subject to regulatory orders addressing the justness and reasonableness of the PJM and Midwest Independent Transmission System Operator (MISO) rates and related revenue distribution protocols. DP&L’s management is required to make assumptions, estimates and judgments relating to the possibility of refund of these revenues. These assumptions, estimates and judgments are based on management’s experience and are believed to be reasonable at the time. As a result of these assumptions, estimates and judgments, DP&L is deferring a portion of these revenues for which management believes is subject to refund. The deferred amount recorded was $18.7 million and $20.5 million at December 31, 2006 and December 31, 2005, respectively. The above amount collected under the Seams Elimination Charge Adjustment (SECA) rates are subject to refund, and the ultimate outcome of the proceeding establishing SECA rates is uncertain at this time. However, based on the amount of reserves established for this item, the results of this proceeding are not expected to have a material adverse effect on our financial condition, results of operations or cash flows.
Income Taxes: We apply Judgment and the provisionsuse of FASB Statementestimates are required in developing the provision for income taxes and reporting of tax-related assets and liabilities. The interpretation of tax laws involves uncertainty, since taxing authorities may interpret them differently. Ultimate resolution of income tax matters may result in favorable or unfavorable impacts to net income and cash flows and adjustments to tax-related assets and liabilities could be material. Effective January 1, 2007, we adopted Financial Accounting Standards Board Interpretation No. 109, “Accounting48 (FIN 48), “Accounting for Uncertainty in Income Taxes” (SFAS 109)Taxes. SFAS 109 requires an asset” Taking into consideration the uncertainty and liability approach for financial accountingjudgment involved in the determination and reportingfiling of income taxes, with tax effectsFIN 48 establishes standards for recognition and measurement, in financial statements, of differences, basedpositions taken, or expected to be taken, by an entity on currently enactedits income tax ratesreturns. Positions taken by an entity on its income tax returns that are recognized in the financial statements must satisfy a more-likely-than-not recognition threshold, assuming that the position will be examined by taxing authorities with full knowledge of all relevant information.
Deferred income tax assets and liabilities are provided, representing future effects on income taxes for temporary differences between the bases of assets and liabilities for financial reporting and tax basispurposes. We evaluate quarterly the probability of accounting reported as Deferred Taxes inrealizing deferred tax assets by reviewing a forecast of future taxable income and the availability of tax planning strategies that can be implemented, if necessary, to realize deferred tax assets. Failure to achieve forecasted taxable income or successfully implement tax planning strategies may affect the realization of deferred tax assets.
Consolidated Balance Sheets. Deferred Tax Assets are recognized for deductible temporary differences. Valuation reserves are provided unless it is more likely than not that the asset will be realized.
Investment tax credits, which have been used to reduce federal income taxes payable, have been deferred for financial reporting purposes. These deferred investment tax credits are amortized over the useful lives of the property to which they are related. For rate-regulated operations, additional deferred income taxes and offsetting regulatory assets or liabilities are recorded to recognize that the income taxes will be recoverable / refundable through future revenues.
We file a consolidated U.S. federal income tax return in conjunction with our subsidiaries. The consolidated tax liability is allocated to each subsidiary as specified in our tax allocation agreement which provides a consistent, systematic and rational approach. See Note 4 of Notes to Consolidated Financial Statements.
Regulatory Assets and Liabilities:Application of FASB Statement of Financial Accounting Standards No. 71, “Accounting for the Effects of Certain Types of Regulation” (SFAS 71) depends onrequires us to reflect the effect of rate regulation in our abilityConsolidated Financial Statements. For regulated businesses subject to collect cost-based ratesfederal or state cost-of-service rate regulation, regulatory practices that assign costs to accounting periods may differ from customers. The recognition of regulatory assets requires a continued assessment ofaccounting methods generally applied by nonregulated companies. When it is probable that regulators will permit the recovery of current costs through future rates charged to customers, we defer these costs as regulatory assets that otherwise would be expensed by nonregulated companies. Likewise, we recognize regulatory liabilities when it is probable that regulators will require customer refunds through future rates and when revenue is collected from customers for expenditures that are not yet incurred. Regulatory assets are amortized into expense and regulatory liabilities are amortized into income over the costsrecovery period authorized by the regulator.
We evaluate whether or not recovery of our regulatory assets through future rates is probable and make various assumptions in our analyses. The expectations of future recovery are generally based on actionsorders issued by regulatory commissions or historical experience, as well as discussions with applicable regulatory authorities. If recovery of a regulatory asset is determined to be less than probable, it will be written off in the regulators.period the assessment is made. We capitalize incurred costs as deferredcurrently believe the recovery of our regulatory assets when there is a probable expectation that the costs incurred will be recovered in future revenues as a result of the regulatory process. Regulatory liabilities represent current recovery of expected future costs. When applicable we apply judgment in the use of these principles and these estimates are based on expected usage by a customer class over the designated recovery period.probable. See Note 3 of Notes to Consolidated Financial Statements for further disclosure of regulatory amounts.Statements.
Asset Retirement Obligations: In accordance with FASB Statement of Financial Accounting Standards No.143, “Accounting for Asset Retirement Obligations” (SFAS 143) and FASB Interpretation No. 47 (FIN No. 47), “Accounting for Conditional Asset Retirement Obligations, an interpretation of FASB Statement No. 143,” legal obligations associated with the retirement of long-lived assets are required to be recognized at their fair value at the time those obligations are incurred. Upon initial recognition of a legal liability, costs are capitalized as part of the related long-lived asset and allocated to expense over the useful life of the asset. SFAS 143 also requires that components of previously recorded depreciation related to the cost of removal of assets upon retirement, whether legal asset retirement obligations or not, must be removed from a company’s accumulated depreciation reserve. We make assumptions, estimates and judgments that affect the reported amounts of assets, liabilities and expenses as they relate to asset retirement obligations. These assumptions and estimates are based on historical experience and assumptions that we believe to be reasonable at the time.
58
Table of Contents
Insurance and Claims Costs:In addition to insurance provided through third-party providers, our wholly-owned captive subsidiary (MVIC) provides insurance coverage solely to us and to our subsidiaries. Insurance and Claims Costs on the Consolidated Balance Sheetsconsolidated balance sheets includes insurance reserves of approximately $22$17.6 million and $24$20.0 million for 20062008 and 2005,2007, respectively, based on actuarial methods and loss experience data. Such reserves are actuarially determined, in the aggregate, based on a reasonable estimation of insured events occurring. There is uncertainty associated with the loss estimates, and actual results may differ from the estimates. Modification of these loss estimates, based on experience and changed circumstances, is reflected in the period in which the estimate is re-evaluated.
Pension and Postretirement BenefitsBenefits:
We account and disclose pension and postretirement benefits in accordance with the provisions of Statement of Financial Accounting Standards No. 158, “Employers’ Accounting for Defined Benefit Pensions and other Postretirement Plans, an amendment to FASB Statements 87, 88, 106 and 132R.” This Standard132R” (SFAS 158). SFAS 158 requires the use of assumptions, such as the discount rate and long-term rate of return on assets, in determining the obligations, annual cost, and funding requirements of the plans.
In 2007,
For 2009, we are maintaining our long-term rate of return assumptions of 8.50% for pension and 6.75%6.00% for other postretirement benefits assets that reflect the effect of recent trends on our long-term view. We are also maintaininghave increased our assumed discount rate of 5.75%to 6.25% for pension and postretirement benefits expense to reflect current interest rate conditions. Changes in other components used in the determination of pension and postretirement benefits costs will result in approximately the same levelan increase of expense in 2007 as in 2006 ($5.5 million),pension costs of $5.5 million, excluding any special adjustments required under SFAS 88. We do not anticipate any special adjustments to expense in 2007.2009.
In future periods, differences in the actual return on pension plan assets and assumed return, or changes in the discount rate, will affect the timing of contributions to the pension plan, if any. We provide postretirement healthcare benefits to employees who retired prior to 1987. A one percentage point change in the assumed healthcare trend rate would affect postretirement benefit costs by approximately $0.1 million.
Contingent and Other Obligations: During the conduct of our business, we are subject to a number of federal and state laws and regulations, as well as other factors and conditions that potentially subject us to environmental, litigation, insurance and other risks. We periodically evaluate our exposure to such risks and record reserves for those matters where a loss is considered probable and reasonably estimable in accordance with generally accepted accounting principles. In recording such reserves, we may make assumptions, estimates and judgments that affect the reported amounts of assets, liabilities and expenses as they relate to contingent and other obligations. These assumptions and estimates are based on historical experience and assumptions and may be subject to change. We, however, believe such estimates and assumptions are reasonable.
LEGAL AND OTHER MATTERS
A discussion of LEGAL AND OTHER MATTERS is described in Note 1518 of Notes to Consolidated Financial Statements and in Item 3 - LEGAL PROCEEDINGS. A discussion of environmental matters affecting both DPL and DP&L is described in Item 1 — ENVIRONMENTAL CONSIDERATIONS. Such discussions are incorporated by reference in this Management’s Discussion and Analysis of Financial Condition and Results of Operations and made a part hereof.
Recently Issued Accounting Pronouncements
A discussion of recently issued accounting pronouncements is described in Note 1 of Notes to Consolidated Financial Statements and such discussion is incorporated by reference in this Management’s Discussion and Analysis of Financial Condition and Results of Operations and made a part hereof.
Item 7A —- Quantitative and Qualitative Disclosures about Market Risk
The information required by this item of Form 10-K is set forth in the MARKET RISK section under Item 7 - - Management’s Discussion and Analysis of Financial Condition and Results of Operations.
59
Table of Contents
Item 8 —- Financial Statements and Supplementary Data
This report includes the combined filing of DPL Inc. Inc. (DPL) and The Dayton Power and Light Company (DP&L). DP&L is the principal subsidiary of DPL providing approximately 99%98% of DPL’s total consolidated revenue and approximately 86% of DPL’s total consolidated asset base. Throughout this report the terms we, us, our and ours are used to refer to both DPL and DP&L, respectively and altogether, unless the context indicates otherwise. Discussions or areas of this report that apply only to DPL or DP&L will clearly be noted in the section. Historically, DPL and DP&L have filed separate SEC filings. Beginning with this report and in the future, DPL Inc. and The Dayton Power and Light Company will file combined SEC reports on an interium and annual basis.
48
DPL INC.
CONSOLIDATED STATEMENTS OF RESULTS OF OPERATIONS
| | For the years ended December 31, | |
$ in millions except per share amounts | | 2006 | | 2005 | | 2004 | |
Revenues | | $ | 1,393.5 | | $ | 1,284.9 | | $ | 1,199.9 | |
| | | | | | | |
Cost of revenues: | | | | | | | |
Fuel | | 349.1 | | 336.9 | | 263.1 | |
Purchased power | | 159.0 | | 133.3 | | 113.1 | |
Total cost of revenues | | 508.1 | | 470.2 | | 376.2 | |
| | | | | | | |
Gross margin | | 885.4 | | 814.7 | | 823.7 | |
| | | | | | | |
Operating expenses: | | | | | | | |
Operation and maintenance | | 265.4 | | 219.0 | | 237.1 | |
Impairment of peaking stations | | 71.0 | | — | | — | |
Depreciation and amortization | | 151.8 | | 147.3 | | 144.1 | |
General taxes | | 108.6 | | 107.3 | | 105.3 | |
Amortization of regulatory assets | | 7.6 | | 2.0 | | 0.7 | |
Total operating expenses | | 604.4 | | 475.6 | | 487.2 | |
| | | | | | | |
Operating income | | 281.0 | | 339.1 | | 336.5 | |
| | | | | | | |
Investment income | | 17.8 | | 50.9 | | 7.9 | |
Interest expense | | (102.2 | ) | (137.7 | ) | (160.2 | ) |
Charge for early redemption of debt | | — | | (61.2 | ) | — | |
Other income (deductions) | | (1.2 | ) | 13.5 | | 3.8 | |
Earnings from continuing operations before income tax | | 195.4 | | 204.6 | | 188.0 | |
| | | | | | | |
Income tax expense | | 69.8 | | 79.9 | | 66.5 | |
Earnings from continuing operations | | 125.6 | | 124.7 | | 121.5 | |
Earnings from discontinued operations, net of tax | | 14.0 | | 52.9 | | 95.8 | |
Cumulative effect of accounting change, net of tax | | — | | (3.2 | ) | — | |
Net Income | | $ | 139.6 | | $ | 174.4 | | $ | 217.3 | |
| | | | | | | |
Average number of common shares outstanding (millions) | | | | | | | |
Basic | | 112.3 | | 121.0 | | 120.1 | |
Diluted | | 121.9 | | 129.1 | | 122.1 | |
| | | | | | | |
Earnings per share of common stock | | | | | | | |
Basic: | | | | | | | |
Earnings from continuing operations | | $ | 1.12 | | $ | 1.03 | | $ | 1.01 | |
Earnings from discontinued operations | | 0.12 | | 0.44 | | 0.80 | |
Cumulative effect of accounting change | | — | | (0.03 | ) | — | |
Total Basic | | $ | 1.24 | | $ | 1.44 | | $ | 1.81 | |
| | | | | | | |
Diluted: | | | | | | | |
Earnings from continuing operations | | $ | 1.03 | | $ | 0.97 | | $ | 1.00 | |
Earnings from discontinued operations | | 0.12 | | 0.41 | | 0.78 | |
Cumulative effect of accounting change | | — | | (0.03 | ) | — | |
Total Diluted | | $ | 1.15 | | $ | 1.35 | | $ | 1.78 | |
| | | | | | | |
Dividends paid per share of common stock | | $ | 1.00 | | $ | 0.96 | | $ | 0.96 | |
See Notes to Consolidated Financial Statements.
DPL INC.
CONSOLIDATED STATEMENTS OF CASH FLOWS
| | For the years ended December 31, | |
$ in millions | | 2006 | | 2005 | | 2004 | |
Cash flows from operating activities: | | | | | | | |
Net income | | $ | 139.6 | | $ | 174.4 | | $ | 217.3 | |
Less: Income from discontinued operations | | (14.0 | ) | (52.9 | ) | (95.8 | ) |
Income from continuing operations | | 125.6 | | 121.5 | | 121.5 | |
| | | | | | | |
Adjustments to reconcile net income to net cash provided by operating activities: | | | | | | | |
Depreciation and amortization | | 151.8 | | 147.3 | | 144.1 | |
Impairment of peaking stations | | 71.0 | | — | | — | |
Amortization of regulatory assets | | 7.6 | | 2.0 | | 0.7 | |
Charge for early redemption of debt | | — | | 61.2 | | — | |
Cumulative effect of accounting change, net of tax | | — | | 3.2 | | — | |
Shareholder litigation | | — | | — | | (70.0 | ) |
Deferred income taxes | | (32.7 | ) | (7.1 | ) | 22.2 | |
Captive insurance provision | | (2.4 | ) | (0.6 | ) | (1.1 | ) |
Gain on sale of other investments | | (2.2 | ) | (28.8 | ) | (3.3 | ) |
Gain on sale of property | | — | | — | | (1.8 | ) |
Changes in certain assets and liabilities: | | | | | | | |
Accounts receivable | | (36.4 | ) | (12.5 | ) | 7.1 | |
Accounts payable | | 41.8 | | (11.7 | ) | (12.9 | ) |
Accrued taxes payable | | (12.7 | ) | 15.0 | | (62.8 | ) |
Accrued interest payable | | 4.9 | | (13.2 | ) | (8.0 | ) |
Prepayments | | 5.4 | | 2.2 | | 0.4 | |
Inventories | | (5.2 | ) | (8.0 | ) | (20.0 | ) |
Deferred compensation assets | | 0.4 | | 4.4 | | 12.6 | |
Deferred compensation obligations | | 2.3 | | 7.4 | | 5.2 | |
Other | | (10.5 | ) | 31.8 | | (1.2 | ) |
Net cash provided by operating activities | | 308.7 | | 314.1 | | 132.7 | |
| | | | | | | |
Cash flows from investing activities: | | | | | | | |
Capital expenditures | | (357.5 | ) | (180.1 | ) | (87.7 | ) |
Purchases of short-term investments and securities | | (856.0 | ) | (641.2 | ) | (26.1 | ) |
Sales of short-term investments and securities | | 984.0 | | 642.5 | | 89.9 | |
Proceeds from the sale of property | | — | | — | | 2.3 | |
Cash flow from discontinued operations | | — | | 868.4 | | 203.9 | |
Net cash (used for)/provided by investing activities | | (229.5 | ) | 689.6 | | 182.3 | |
| | | | | | | |
Cash flows from financing activities: | | | | | | | |
Issuance of long-term debt, net | | — | | 211.2 | | 174.7 | |
Exercise of stock options | | 7.8 | | 22.7 | | — | |
Tax impact related to exercise of stock options | | 1.9 | | — | | — | |
Retirement of long-term debt | | — | | (673.8 | ) | (510.4 | ) |
Premiums paid for early redemption of debt | | — | | (54.7 | ) | — | |
Retirement of preferred securities | | — | | (0.1 | ) | — | |
Issuance of pollution control bonds | | 100.0 | | — | | — | |
Pollution control bond proceeds held in trust | | (100.0 | ) | — | | — | |
Withdrawal of restricted funds held in trust | | 89.9 | | — | | — | |
Dividends paid on common stock | | (112.4 | ) | (115.3 | ) | (114.8 | ) |
Purchase of Company’s common stock | | (400.0 | ) | — | | — | |
Net cash (used for) financing activities | | (412.8 | ) | (610.0 | ) | (450.5 | ) |
| | | | | | | |
Cash and cash equivalents: | | | | | | | |
Net change | | (333.6 | ) | 393.7 | | (135.5 | ) |
Balance at beginning of period | | 595.8 | | 202.1 | | 337.6 | |
Cash and cash equivalents at end of period | | $ | 262.2 | | $ | 595.8 | | $ | 202.1 | |
| | | | | | | |
Supplemental cash flow information: | | | | | | | |
Interest paid, net of amounts capitalized | | $ | 91.4 | | $ | 146.1 | | $ | 162.1 | |
Income taxes paid, net | | $ | 113.6 | | $ | 71.2 | | $ | 107.9 | |
Non-cash financing and investing activities: | | | | | | | |
Restricted funds held in trust (see Note 8 of Notes to Consolidated Financial Statements) | | $ | 10.1 | | $ | — | | $ | — | |
See Notes to Consolidated Financial Statements.
DPL INC.
CONSOLIDATED BALANCE SHEETS
| | At December 31, | |
$ in millions | | 2006 | | 2005 | |
| | | | | |
ASSETS | | | | | |
| | | | | |
Current assets: | | | | | |
Cash and cash equivalents | | $ | 262.2 | | $ | 595.8 | |
Short-term investments available for sale | | — | | 125.8 | |
Restricted funds held in trust | | 10.1 | | — | |
Accounts receivable, less provision for uncollectible accounts of $1.4 and $1.0, respectively | | 225.0 | | 194.9 | |
Inventories, at average cost | | 85.4 | | 80.2 | |
Taxes applicable to subsequent years | | 48.0 | | 45.9 | |
Other current assets | | 37.7 | | 20.2 | |
Total current assets | | 668.4 | | 1,062.8 | |
| | | | | |
Property: | | | | | |
Held and used: | | | | | |
Property, plant and equipment | | 4,718.5 | | 4,667.7 | |
Less: Accumulated depreciation and amortization | | (2,159.2 | ) | (2,094.8 | ) |
Total net property held and used | | 2,559.3 | | 2,572.9 | |
| | | | | |
Assets held for sale (Note 14): | | | | | |
Property, plant and equipment | | 283.5 | | — | |
Less: Accumulated depreciation and amortization | | (132.3 | ) | — | |
Total net property held for sale | | 151.2 | | — | |
| | | | | |
Other noncurrent assets: | | | | | |
Regulatory assets (Note 3) | | 148.6 | | 83.8 | |
Other assets | | 84.7 | | 72.2 | |
Total other noncurrent assets | | 233.3 | | 156.0 | |
| | | | | |
Total Assets | | $ | 3,612.2 | | $ | 3,791.7 | |
See Notes to Consolidated Financial Statements.
DPL INC.
CONSOLIDATED BALANCE SHEETS
| | | | | | At December 31, | |
$ in millions | | | | | | 2006 | | 2005 | |
| | | | | | | | | |
LIABILITIES AND SHAREHOLDERS’ EQUITY | | | | | | | | | |
| | | | | | | | | |
Current liabilities: | | | | | | | | | |
Current portion - long-term debt | | | | | | $ | 225.9 | | $ | 0.9 | |
Accounts payable | | | | | | 169.4 | | 130.2 | |
Accrued taxes | | | | | | 155.2 | | 178.5 | |
Accrued interest | | | | | | 35.2 | | 28.9 | |
Other current liabilities | | | | | | 38.3 | | 31.1 | |
Total current liabilities | | | | | | 624.0 | | 369.6 | |
| | | | | | | | | |
Noncurrent liabilities: | | | | | | | | | |
Long-term debt | | | | | | 1,551.8 | | 1,677.1 | |
Deferred taxes | | | | | | 355.2 | | 327.0 | |
Unamortized investment tax credit | | | | | | 43.6 | | 46.4 | |
Insurance and claims costs | | | | | | 21.9 | | 24.3 | |
Other deferred credits | | | | | | 280.7 | | 286.3 | |
Total noncurrent liabilites | | | | | | 2,253.2 | | 2,361.1 | |
| | | | | | | | | |
Cumulative preferred stock not subject to mandatory redemption | | | | | | 22.9 | | 22.9 | |
| | | | | | | | | |
Commitments and contingencies (Note 15) | | | | | | | | | |
| | | | | | | | | |
Common shareholders’ equity: | | | | | | | | | |
Common stock, at par value of $0.01 per share: | | | | | | | | | |
| | | | | | | | | | | |
| | December 2006 | | December 2005 | | | | | |
Shares authorized | | 250,000,000 | | 250,000,000 | | | | | |
Shares issued | | 163,724,211 | | 163,724,211 | | | | | |
Shares outstanding | | 113,018,972 | | 127,526,404 | | 1.1 | | 1.3 | |
Other paid-in capital, net of treasury stock | | | | | | — | | 25.1 | |
Warrants | | | | | | 50.0 | | 50.0 | |
Common stock held by employee plans | | | | | | (69.0 | ) | (86.1 | ) |
Accumulated other comprehensive loss | | | | | | (6.5 | ) | (14.2 | ) |
Retained earnings | | | | | | 736.5 | | 1,062.0 | |
Total common shareholders’ equity | | | | | | 712.1 | | 1,038.1 | |
| | | | | | | | | |
Total Liabilities and Shareholders’ Equity | | | | | | $ | 3,612.2 | | $ | 3,791.7 | |
| | | | | | | | | | | |
See Notes to Consolidated Financial Statements.
52
DPL Inc.
Consolidated Statement of Shareholders’ Equity
| | | | | | | | | | Common | | | | | | | |
| | | | | | | | | | Stock | | Accumulated | | | | | |
| | Common Stock (a) | | Other | | | | Held by | | Other | | | | | |
| | Outstanding | | | | Paid-in | | | | Employee | | Comprehensive | | Retained | | | |
$ in millions | | Shares | | Amount | | Capital | | Warrants | | Plans | | Income | | Earnings | | Total | |
| | | | | | | | | | | | | | | | | |
Beginning balance | | 126,501,404 | | $ | 1.3 | | $ | 12.0 | | $ | 50.0 | | $ | (84.4 | ) | $ | 57.7 | | $ | 865.7 | | $ | 902.3 | |
| | | | | | | | | | | | | | | | | |
2004: | | | | | | | | | | | | | | | | | |
Net income | | | | | | | | | | | | | | 217.3 | | | |
Net change in unrealized gains on financial instruments, net of reclassification adjustments | | | | | | | | | | | | 9.3 | | | | | |
Net change in unrealzed gains on foreign currency translation adjustments | | | | | | | | | | | | 6.2 | | | | | |
Net change in deferred gains on cash flow hedges | | | | | | | | | | | | (1.5 | ) | | | | |
Minimum pension liability | | | | | | | | | | | | (0.4 | ) | | | | |
Deferred income taxes related unrealized gains (losses) | | | | | | | | | | | | (5.8 | ) | | | | |
Total comprehensive income | | | | | | | | | | | | | | | | 225.1 | |
Common stock dividends (b) | | | | | | | | | | | | | | (86.2 | ) | (86.2 | ) |
Employee / Director stock plans | | | | | | 4.1 | | | | (1.3 | ) | | | 0.4 | | 3.2 | |
Other | | | | | | (0.3 | ) | | | | | | | (0.1 | ) | (0.4 | ) |
Ending balance | | 126,501,404 | | $ | 1.3 | | $ | 15.8 | | $ | 50.0 | | $ | (85.7 | ) | $ | 65.5 | | $ | 997.1 | | $ | 1,044.0 | |
| | | | | | | | | | | | | | | | | |
2005: | | | | | | | | | | | | | | | | | |
Net income | | | | | | | | | | | | | | 174.4 | | | |
Net change in unrealized (losses) on financial instruments, net of reclassification adjustments | | | | | | | | | | | | (15.3 | ) | | | | |
Net change in unrealzed (losses) on foreign currency translation adjustments | | | | | | | | | | | | (46.3 | ) | | | | |
Net change in deferred gains on cash flow hedges | | | | | | | | | | | | (3.4 | ) | | | | |
Minimum pension liability | | | | | | | | | | | | (63.0 | ) | | | | |
Deferred income taxes related unrealized gains (losses) | | | | | | | | | | | | 48.2 | | | | | |
Total comprehensive income | | | | | | | | | | | | | | | | 94.6 | |
Common stock dividends (b) | | | | | | | | | | | | | | (115.3 | ) | (115.3 | ) |
Treasury shares purchased (c) | | — | | | | (10.6 | ) | | | | | | | — | | (10.6 | ) |
Treasury stock reissued | | 1,025,000 | | | | 16.9 | | | | | | | | 5.8 | | 22.7 | |
Employee / Director stock plans | | | | | | 3.0 | | | | (0.4 | ) | | | | | 2.6 | |
Other | | | | | | | | | | | | 0.1 | | | | 0.1 | |
Ending balance | | 127,526,404 | | $ | 1.3 | | $ | 25.1 | | $ | 50.0 | | $ | (86.1 | ) | $ | (14.2 | ) | $ | 1,062.0 | | $ | 1,038.1 | |
| | | | | | | | | | | | | | | | | |
2006: | | | | | | | | | | | | | | | | | |
| | | | | | | | | | | | | | | | | |
Net income | | | | | | | | | | | | | | 139.6 | | | |
Net change in unrealized gains on financial instruments, net of reclassification adjustments | | | | | | | | | | | | 1.6 | | | | | |
Net change in deferred gains on cash flow hedges | | | | | | | | | | | | 0.7 | | | | | |
Minimum pension liability | | | | | | | | | | | | 11.8 | | | | | |
Deferred income taxes related unrealized gains (losses) | | | | | | | | | | | | (29.9 | ) | | | | |
Total comprehensive income | | | | | | | | | | | | | | | | 123.8 | |
Common stock dividends (b) | | | | | | | | | | | | | | (112.4 | ) | (112.4 | ) |
Treasury shares purchased (c) | | (14,862,432 | ) | (0.1 | ) | (389.3 | ) | | | | | | | | | (389.4 | ) |
Treasury stock reissued | | 355,000 | | | | 360.4 | | | | | | | | (352.6 | ) | 7.8 | |
Tax effects to equity | | | | | | 1.8 | | | | | | | | | | 1.8 | |
Employee / Director stock plans | | | | | | 1.8 | | | | 17.1 | | | | (0.1 | ) | 18.8 | |
Other | | | | (0.1 | ) | 0.2 | | | | | | | | — | | 0.1 | |
FAS 158 adjustmenet | | | | | | | | | | | | 23.5 | | | | 23.5 | |
Ending balance | | 113,018,972 | | $ | 1.1 | | $ | (0.0 | ) | $ | 50.0 | | $ | (69.0 | ) | $ | (6.5 | ) | $ | 736.5 | | $ | 712.1 | |
(a) $0.01 par value, 250,000,000 shares authorized.
(b) Common stock dividends were $0.96 per share in 2004 and 2005, respectively, and $1.00 in 2006.
(c) Number of shares outstanding at December 31, 2005 were not affected by the December 30, 2005 transaction to purchase 406,000 shares as the share repurchase was settled in early January 2006. DPL completed the share repurchase program in August 2006.
See Notes to Consolidated Financial Statements
THE DAYTON POWER AND LIGHT COMPANY
CONSOLIDATED STATEMENTS OF RESULTS OF OPERATIONS
| | For the years ended December 31, | |
$ in millions except per share amounts | | 2006 | | 2005 | | 2004 | |
Revenues | | $ | 1,385.2 | | $ | 1,276.9 | | $ | 1,192.2 | |
| | | | | | | |
Cost of revenues: | | | | | | | |
Fuel | | 335.2 | | 317.9 | | 257.0 | |
Purchased power | | 171.9 | | 147.1 | | 116.4 | |
Total cost of revenues | | 507.1 | | 465.0 | | 373.4 | |
| | | | | | | |
Gross margin | | 878.1 | | 811.9 | | 818.8 | |
| | | | | | | |
Operating expenses: | | | | | | | |
Operation and maintenance | | 231.7 | | 198.3 | | 224.4 | |
Depreciation and amortization | | 130.0 | | 123.9 | | 121.1 | |
General taxes | | 106.3 | | 105.1 | | 103.2 | |
Amortization of regulatory assets | | 7.6 | | 2.0 | | 0.7 | |
Total operating expenses | | 475.6 | | 429.3 | | 449.4 | |
| | | | | | | |
Operating income | | 402.5 | | 382.6 | | 369.4 | |
| | | | | | | |
Investment income | | 6.7 | | 6.1 | | 5.0 | |
Interest expense | | (23.4 | ) | (38.1 | ) | (43.5 | ) |
Charge for early redemption of debt | | — | | (4.1 | ) | — | |
Other income (deductions) | | (1.2 | ) | 6.6 | | (1.1 | ) |
| | | | | | | |
Earnings Before Income Tax and Cumulative Effect of Accounting Change | | 384.6 | | 353.1 | | 329.8 | |
| | | | | | | |
Income tax expense | | 142.2 | | 138.1 | | 120.8 | |
| | | | | | | |
Earnings before Cumulative Effect of Accounting Change | | 242.4 | | 215.0 | | 209.0 | |
| | | | | | | |
Cumulative effect of accounting change, net of tax | | — | | (3.2 | ) | — | |
| | | | | | | |
Net Income | | $ | 242.4 | | $ | 211.8 | | $ | 209.0 | |
| | | | | | | |
Preferred dividends | | 0.8 | | 0.9 | | 0.9 | |
| | | | | | | |
Earnings on common stock | | $ | 241.6 | | $ | 210.9 | | $ | 208.1 | |
See Notes to Consolidated Financial Statements.
THE DAYTON POWER AND LIGHT COMPANY
CONSOLIDATED STATEMENTS OF CASH FLOWS
| | For the years ended December 31, | |
$ in millions | | 2006 | | 2005 | | 2004 | |
Cash flows from operating activities: | | | | | | | |
Net income | | $ | 242.4 | | $ | 211.8 | | $ | 209.0 | |
Adjustments: | | | | | | | |
Depreciation and amortization | | 130.0 | | 123.9 | | 121.1 | |
Amortization of regulatory assets | | 7.6 | | 2.0 | | 0.7 | |
Deferred income taxes | | (16.3 | ) | (13.3 | ) | (16.2 | ) |
Charge for early redemption of debt | | — | | 4.1 | | — | |
Cumulative effect of accounting change, net of tax | | — | | 3.2 | | — | |
Gain on sale of property | | — | | — | | (1.8 | ) |
Changes in certain assets and liabilities: | | | | | | | |
Accounts receivable | | (29.0 | ) | (17.1 | ) | 6.6 | |
Accounts payable | | 43.3 | | 6.5 | | 11.5 | |
Net intercompany receivables from parent | | 0.5 | | (0.1 | ) | (0.2 | ) |
Accrued taxes payable | | 0.5 | | 31.5 | | 58.4 | |
Accrued interest payable | | 1.3 | | (0.9 | ) | 0.5 | |
Prepayments | | 5.5 | | 2.3 | | 0.6 | |
Inventories | | (5.2 | ) | (7.9 | ) | (20.2 | ) |
Deferred compensation assets | | 2.5 | | 0.7 | | 8.8 | |
Deferred compensation obligations | | 0.1 | | 6.7 | | 5.2 | |
Other | | (17.5 | ) | 13.4 | | (2.8 | ) |
Net cash provided by operating activities | | 365.7 | | 366.8 | | 381.2 | |
| | | | | | | |
Cash flows from investing activities: | | | | | | | |
Capital expenditures | | (354.8 | ) | (178.4 | ) | (82.2 | ) |
Proceeds from the sale of property | | — | | — | | 2.3 | |
Net cash (used for) investing activities | | (354.8 | ) | (178.4 | ) | (79.9 | ) |
| | | | | | | |
Cash flows from financing activities: | | | | | | | |
Issuance of long-term debt, net | | — | | 210.4 | | — | |
Issuance of pollution control bonds | | 100.0 | | — | | — | |
Pollution control bond proceeds held in trust | | (100.0 | ) | — | | — | |
Withdrawal of restricted funds held in trust | | 89.9 | | — | | — | |
Retirement of long-term debt | | — | | (218.9 | ) | (0.4 | ) |
Dividends paid on preferred stock | | (0.9 | ) | (0.9 | ) | (0.9 | ) |
Dividends paid on common stock | | (100.0 | ) | (150.0 | ) | (300.0 | ) |
Net cash (used for) financing activities | | (11.0 | ) | (159.4 | ) | (301.3 | ) |
| | | | | | | |
Cash and cash equivalents: | | | | | | | |
Net change | | (0.1 | ) | 29.0 | | — | |
Balance at beginning of period | | 46.2 | | 17.2 | | 17.2 | |
Cash and cash equivalents at end of period | | $ | 46.1 | | $ | 46.2 | | $ | 17.2 | |
| | | | | | | |
Supplemental cash flow information: | | | | | | | |
Interest paid, net of amounts capitalized | | $ | 77.9 | | $ | 36.5 | | $ | 39.5 | |
Income taxes paid, net | | $ | 158.1 | | $ | 119.0 | | $ | 79.9 | |
Non-cash financing activities: Restricted funds held in trust | | $ | 10.1 | | $ | — | | $ | — | |
See Notes to Consolidated Financial Statements.
THE DAYTON POWER AND LIGHT COMPANY
CONSOLIDATED BALANCE SHEETS
| | At December 31, | |
$ in millions | | 2006 | | 2005 | |
| | | | | |
ASSETS | | | | | |
| | | | | |
Current assets: | | | | | |
Cash and cash equivalents | | $ | 46.1 | | $ | 46.2 | |
Restricted funds held in trust | | 10.1 | | — | |
Accounts receivable, less provision for uncollectible accounts of $1.4 and $1.0, respectively | | 205.6 | | 182.7 | |
Inventories, at average cost | | 83.0 | | 77.7 | |
Taxes applicable to subsequent years | | 48.0 | | 45.9 | |
Other current assets | | 38.2 | | 19.3 | |
Total current assets | | 431.0 | | 371.8 | |
| | | | | |
Property: | | | | | |
Property, plant and equipment | | 4,450.6 | | 4,118.0 | |
Less: Accumulated depreciation and amortization | | (2,079.0 | ) | (1,973.3 | ) |
Net property | | 2,371.6 | | 2,144.7 | |
| | | | | |
Other noncurrent assets: | | | | | |
Regulatory assets | | 148.6 | | 83.8 | |
Other assets | | 139.1 | | 138.3 | |
Total other noncurrent assets | | 287.7 | | 222.1 | |
| | | | | |
Total Assets | | $ | 3,090.3 | | $ | 2,738.6 | |
See Notes to Consolidated Financial Statements.
56
THE DAYTON POWER AND LIGHT COMPANY
CONSOLIDATED BALANCE SHEETS
| | At December 31, | |
$ in millions | | 2006 | | 2005 | |
| | | | | |
LIABILITIES AND SHAREHOLDERS’ EQUITY | | | | | |
| | | | | |
Current liabilities: | | | | | |
Accounts payable | | 166.2 | | 116.2 | |
Accrued taxes | | 159.6 | | 167.7 | |
Accrued interest | | 12.6 | | 9.8 | |
Other current liabilities | | 36.3 | | 28.4 | |
Total current liabilities | | 374.7 | | 322.1 | |
| | | | | |
Noncurrent liabilities: | | | | | |
Long-term debt | | 785.2 | | 685.9 | |
Deferred taxes | | 360.2 | | 323.2 | |
Unamortized investment tax credit | | 43.6 | | 46.4 | |
Other deferred credits | | 272.5 | | 258.7 | |
Total noncurrent liabilities | | 1,461.5 | | 1,314.2 | |
| | | | | |
Cumulative preferred stock not subject to mandatory redemption | | 22.9 | | 22.9 | |
| | | | | |
Commitments and contingencies (Note 15) | | | | | |
| | | | | |
Common shareholders’ equity: | | | | | |
Common stock, at par value of $0.01 per share: | | 0.4 | | 0.4 | |
Other paid-in capital | | 783.7 | | 783.4 | |
Accumulated other comprehensive income | | 15.1 | | 5.1 | |
Retained earnings | | 432.0 | | 290.5 | |
| | | | | |
Total common shareholders’ equity | | 1,231.2 | | 1,079.4 | |
| | | | | |
Total Liabilities and Shareholders’ Equity | | $ | 3,090.3 | | $ | 2,738.6 | |
| | | | | | | |
See Notes to Consolidated Financial Statements.
THE DAYTON POWER AND LIGHT COMPANY
CONSOLIDATED STATEMENT OF SHAREHOLDERS’ EQUITY
| | | | | | | | Accumulated | | | | | |
| | Common Stock (a) | | Other | | Other | | | | | |
| | Outstanding | | | | Paid-in | | Comprehensive | | Retained | | | |
$ in millions | | Shares | | Amount | | Capital | | Income | | Earnings | | Total | |
| | | | | | | | | | | | | |
Beginning balance | | 41,172,173 | | $ | 0.4 | | $ | 780.5 | | $ | 38.2 | | $ | 321.7 | | $ | 1,140.8 | |
| | | | | | | | | | | | | |
2004: | | | | | | | | | | | | | |
Net income | | | | | | | | | | 209.0 | | | |
Net change in unrealized gains (loses) on financial instruments, net of reclassification adjustments | | | | | | | | 12.6 | | | | | |
Net change in deferred gains on cash flow hedges | | | | | | | | (1.5 | ) | | | | |
Minimum pension liability | | | | | | | | (0.4 | ) | | | | |
Deferred income taxes related unrealized gains (losses) | | | | | | | | (5.8 | ) | | | | |
Total comprehensive income | | | | | | | | | | | | 213.9 | |
Common stock dividends | | | | | | | | | | (300.0 | ) | (300.0 | ) |
Preferred stock dividend | | | | | | | | | | (0.9 | ) | (0.9 | ) |
Employee / Director stock plans | | | | | | 2.3 | | | | | | 2.3 | |
Other | | | | | | 0.1 | | | | (0.1 | ) | — | |
Ending balance | | 41,172,173 | | $ | 0.4 | | $ | 782.9 | | $ | 43.1 | | $ | 229.7 | | $ | 1,056.1 | |
| | | | | | | | | | | | | |
2005: | | | | | | | | | | | | | |
Net income | | | | | | | | | | 211.8 | | | |
Net change in unrealized gains (loses) on financial instruments, net of reclassification adjustments | | | | | | | | 1.9 | | | | | |
Net change in deferred gains on cash flow hedges | | | | | | | | (3.4 | ) | | | | |
Minimum pension liability | | | | | | | | (63.0 | ) | | | | |
Deferred income taxes related unrealized gains (losses) | | | | | | | | 26.4 | | | | | |
Total comprehensive income | | | | | | | | | | | | 173.7 | |
Common stock dividends | | | | | | | | | | (150.0 | ) | (150.0 | ) |
Preferred stock dividend | | | | | | | | | | (0.9 | ) | (0.9 | ) |
Employee / Director stock plans | | | | | | 0.5 | | | | | | 0.5 | |
Other | | | | | | | | 0.1 | | (0.1 | ) | — | |
Ending balance | | 41,172,173 | | $ | 0.4 | | $ | 783.4 | | $ | 5.1 | | $ | 290.5 | | $ | 1,079.4 | |
| | | | | | | | | | | | | |
2006: | | | | | | | | | | | | | |
Net income | | | | | | | | | | 242.4 | | | |
Net change in unrealized gains (loses) on financial instruments, net of reclassification adjustments | | | | | | | | 3.9 | | | | | |
Net change in deferred gains on cash flow hedges | | | | | | | | 0.7 | | | | | |
Minimum pension liability | | | | | | | | 11.8 | | | | | |
Deferred income taxes related unrealized gains (losses) | | | | | | | | (30.2 | ) | | | | |
Total comprehensive income | | | | | | | | | | | | 228.6 | |
Common stock dividends | | | | | | | | | | (100.0 | ) | (100.0 | ) |
Preferred stock dividends | | | | | | | | | | (0.8 | ) | (0.8 | ) |
Tax effects to equity | | | | | | 1.8 | | | | | | 1.8 | |
Employee / Director stock plans | | | | | | (1.6 | ) | | | | | (1.6 | ) |
Other | | | | | | 0.1 | | | | (0.1 | ) | — | |
FAS 158 adjustment | | | | | | | | 23.8 | | | | 23.8 | |
Ending balance | | 41,172,173 | | $ | 0.4 | | $ | 783.7 | | $ | 15.1 | | $ | 432.0 | | $ | 1,231.2 | |
(a) 50,000,000 shares authorized.
See Notes to Consolidated Financial Statements.
58
Notes to Consolidated Finanial Statements
This report includes the combined filing of DPL Inc. (DPL) and The Dayton Power and Light Company(DP&L). DP&L is the principal subsidiary of DPL providing approximately 99% of DPL’s total consolidated revenue and approximately 86%93% of DPL’s total consolidated asset base. Throughout this report the terms we, us, our and ours are used to refer to both DPL and DP&L, respectively and altogether, unless the context indicates otherwise. Discussions or areas of this report that apply only to DPL or DP&L will clearly be noted in the section. Historically,
DPL INC.
CONSOLIDATED STATEMENTS OF RESULTS OF OPERATIONS
| | For the years ended December 31, | |
$ in millions except per share amounts | | 2008 | | 2007 | | 2006 | |
| | | | | | | |
Revenues | | $ | 1,601.6 | | $ | 1,515.7 | | $ | 1,393.5 | |
| | | | | | | |
Cost of revenues: | | | | | | | |
Fuel | | 243.0 | | 328.2 | | 349.1 | |
Purchased power | | 377.4 | | 287.2 | | 159.0 | |
Total cost of revenues | | 620.4 | | 615.4 | | 508.1 | |
| | | | | | | |
Gross margin | | 981.2 | | 900.3 | | 885.4 | |
| | | | | | | |
Operating expenses: | | | | | | | |
Operation and maintenance | | 272.5 | | 272.8 | | 265.4 | |
Impairment of peaking stations | | — | | — | | 71.0 | |
Depreciation and amortization | | 137.7 | | 134.8 | | 151.8 | |
General taxes | | 125.5 | | 111.8 | | 108.6 | |
Amortization of regulatory assets | | 10.0 | | 10.8 | | 7.6 | |
Total operating expenses | | 545.7 | | 530.2 | | 604.4 | |
| | | | | | | |
Operating income | | 435.5 | | 370.1 | | 281.0 | |
| | | | | | | |
Other income / (expense), net | | | | | | | |
Investment income | | 3.6 | | 11.3 | | 17.8 | |
Net gain on settlement of executive litigation | | — | | 31.0 | | — | |
Interest expense | | (90.7 | ) | (81.0 | ) | (102.2 | ) |
Other income (deductions) | | (1.0 | ) | 2.9 | | (1.2 | ) |
Total other income / (expense), net | | (88.1 | ) | (35.8 | ) | (85.6 | ) |
| | | | | | | |
Earnings from continuing operations before income tax | | 347.4 | | 334.3 | | 195.4 | |
| | | | | | | |
Income tax expense | | 102.9 | | 122.5 | | 69.8 | |
Earnings from continuing operations | | 244.5 | | 211.8 | | 125.6 | |
Earnings from discontinued operations, net of tax | | — | | 10.0 | | 14.0 | |
Net Income | | $ | 244.5 | | $ | 221.8 | | $ | 139.6 | |
| | | | | | | |
Average number of common shares outstanding (millions) | | | | | | | |
Basic | | 110.2 | | 107.9 | | 112.3 | |
Diluted | | 115.4 | | 117.8 | | 121.9 | |
| | | | | | | |
Earnings per share of common stock | | | | | | | |
Basic: | | | | | | | |
Earnings from continuing operations | | $ | 2.22 | | $ | 1.97 | | $ | 1.12 | |
Earnings from discontinued operations | | — | | 0.09 | | 0.12 | |
Total Basic | | $ | 2.22 | | $ | 2.06 | | $ | 1.24 | |
| | | | | | | |
Diluted: | | | | | | | |
Earnings from continuing operations | | $ | 2.12 | | $ | 1.80 | | $ | 1.03 | |
Earnings from discontinued operations | | — | | 0.08 | | 0.12 | |
Total Diluted | | $ | 2.12 | | $ | 1.88 | | $ | 1.15 | |
| | | | | | | |
Dividends paid per share of common stock | | $ | 1.10 | | $ | 1.04 | | $ | 1.00 | |
See Notes to Consolidated Financial Statements.
60
Table of Contents
DPL INC.
CONSOLIDATED STATEMENTS OF CASH FLOWS
| | For the years ended December 31, | |
$ in millions | | 2008 | | 2007 | | 2006 | |
Cash flows from operating activities: | | | | | | | |
Net income | | $ | 244.5 | | $ | 221.8 | | $ | 139.6 | |
Less: Income from discontinued operations | | — | | (10.0 | ) | (14.0 | ) |
Income from continuing operations | | 244.5 | | 211.8 | | 125.6 | |
| | | | | | | |
Adjustments to reconcile net income to net cash provided by operating activities: | | | | | | | |
Depreciation and amortization | | 137.7 | | 134.8 | | 151.8 | |
Impairment of peaking stations | | — | | — | | 71.0 | |
Amortization of regulatory assets | | 10.0 | | 10.8 | | 7.6 | |
Net gain on settlement of executive litigation | | — | | (31.0 | ) | — | |
Net gain on sale of aircraft | | — | | (6.0 | ) | — | |
Deferred income taxes | | 40.3 | | 0.3 | | (32.7 | ) |
Changes in certain assets and liabilities: | | | | | | | |
Accounts receivable | | (9.1 | ) | (19.1 | ) | (36.4 | ) |
Deposits and other advances | | (8.9 | ) | 16.4 | | (8.5 | ) |
Accounts payable | | 27.0 | | (0.5 | ) | 19.9 | |
Accrued taxes payable | | (65.4 | ) | 21.3 | | (12.7 | ) |
Accrued interest payable | | (0.8 | ) | (9.4 | ) | 4.9 | |
Prepayments | | (1.1 | ) | (0.9 | ) | 5.4 | |
Inventories | | (0.2 | ) | (19.6 | ) | (5.2 | ) |
Deferred compensation assets | | (4.4 | ) | 3.3 | | 0.4 | |
Deferred compensation obligations | | (8.4 | ) | 1.1 | | 2.3 | |
Other | | 2.0 | | 4.8 | | (6.6 | ) |
Net cash provided by operating activities | | 363.2 | | 318.1 | | 286.8 | |
| | | | | | | |
Cash flows from investing activities: | | | | | | | |
Capital expenditures | | (243.6 | ) | (346.2 | ) | (335.6 | ) |
Proceeds from sale of property - peakers | | — | | 151.0 | | — | |
Proceeds from sale of property - aircraft | | — | | 7.4 | | — | |
Purchases of short-term investments and securities | | (4.9 | ) | — | | (856.0 | ) |
Sales of short-term investments and securities | | — | | — | | 984.0 | |
Net cash used for investing activities | | (248.5 | ) | (187.8 | ) | (207.6 | ) |
| | | | | | | |
Cash flows from financing activities: | | | | | | | |
Exercise of stock options | | 2.2 | | 14.6 | | 7.8 | |
Tax impact related to exercise of stock options | | 0.3 | | 1.3 | | 1.9 | |
Retirement of long-term debt | | (100.0 | ) | (225.0 | ) | — | |
Retirement of pollution control bonds | | (90.0 | ) | — | | — | |
Issuance of pollution control bonds, net | | 98.4 | | 90.0 | | 100.0 | |
Pollution control bond proceeds held in trust | | (10.0 | ) | (90.0 | ) | (100.0 | ) |
Withdrawal of restricted funds held in trust, net | | 32.5 | | 63.2 | | 89.9 | |
Dividends paid on common stock | | (120.5 | ) | (111.7 | ) | (112.4 | ) |
Withdrawals from revolving credit facility | | 115.0 | | 95.0 | | — | |
Repayment of borrowings from revolving credit facility | | (115.0 | ) | (95.0 | ) | — | |
Purchase of Company’s common stock | | — | | — | | (400.0 | ) |
Net cash used for financing activities | | (187.1 | ) | (257.6 | ) | (412.8 | ) |
| | | | | | | |
Cash and cash equivalents: | | | | | | | |
Net change | | (72.4 | ) | (127.3 | ) | (333.6 | ) |
Balance at beginning of period | | 134.9 | | 262.2 | | 595.8 | |
Cash and cash equivalents at end of period | | $ | 62.5 | | $ | 134.9 | | $ | 262.2 | |
| | | | | | | |
Supplemental cash flow information: | | | | | | | |
Interest paid, net of amounts capitalized | | $ | 86.8 | | $ | 87.8 | | $ | 91.4 | |
Income taxes paid, net | | $ | 127.3 | | $ | 115.6 | | $ | 113.6 | |
Non-cash financing and investing activities: | | | | | | | |
Restricted funds held in trust | | $ | 14.5 | | $ | 37.0 | | $ | 10.1 | |
Accruals for capital expenditures | | $ | 34.1 | | $ | 45.6 | | $ | 43.0 | |
See Notes to Consolidated Financial Statements.
61
Table of Contents
DPL INC.
CONSOLIDATED BALANCE SHEETS
| | At December 31, | |
$ in millions | | 2008 | | 2007 | |
| | | | | |
ASSETS | | | | | |
| | | | | |
Current assets: | | | | | |
Cash and cash equivalents | | $ | 62.5 | | $ | 134.9 | |
Restricted funds held in trust | | 14.5 | | 37.0 | |
Accounts receivable, less provision for uncollectible accounts of $1.1 and $1.5, respectively | | 259.9 | | 241.2 | |
Inventories, at average cost | | 105.1 | | 105.0 | |
Taxes applicable to subsequent years | | 58.0 | | 48.0 | |
Other current assets | | 27.0 | | 11.8 | |
Total current assets | | 527.0 | | 577.9 | |
| | | | | |
Property: | | | | | |
Property, plant and equipment | | 5,227.0 | | 5,011.6 | |
Less: Accumulated depreciation and amortization | | (2,350.6 | ) | (2,234.6 | ) |
Total net property | | 2,876.4 | | 2,777.0 | |
| | | | | |
Other noncurrent assets: | | | | | |
Regulatory assets (Note 3) | | 233.7 | | 165.2 | |
Other assets | | 38.0 | | 46.5 | |
Total other noncurrent assets | | 271.7 | | 211.7 | |
| | | | | |
Total Assets | | $ | 3,675.1 | | $ | 3,566.6 | |
See Notes to Consolidated Financial Statements.
62
Table of Contents
DPL INC.
CONSOLIDATED BALANCE SHEETS
| | At December 31, | |
$ in millions | | 2008 | | 2007 | |
| | | | | |
LIABILITIES AND SHAREHOLDERS’ EQUITY | | | | | |
| | | | | |
Current liabilities: | | | | | |
Current portion - long-term debt | | $ | 175.7 | | $ | 100.7 | |
Accounts payable | | 178.3 | | 163.1 | |
Accrued taxes | | 130.4 | | 110.8 | |
Accrued interest | | 25.0 | | 25.8 | |
Other current liabilities | | 34.5 | | 27.2 | |
Total current liabilities | | 543.9 | | 427.6 | |
| | | | | |
Noncurrent liabilities: | | | | | |
Long-term debt | | 1,376.1 | | 1,541.5 | |
Deferred taxes | | 433.7 | | 374.9 | |
Unamortized investment tax credit | | 38.0 | | 40.7 | |
Insurance and claims costs | | 17.6 | | 20.0 | |
Other deferred credits | | 267.3 | | 266.3 | |
Total noncurrent liabilities | | 2,132.7 | | 2,243.4 | |
| | | | | |
Cumulative preferred stock not subject to mandatory redemption | | 22.9 | | 22.9 | |
| | | | | |
Commitments and contingencies (Note 17) | | | | | |
| | | | | |
Common shareholders’ equity: | | | | | |
Common stock, at par value of $0.01 per share: | | | | | |
| December 2008 | | December 2007 | | | | | |
Shares authorized | 250,000,000 | | 250,000,000 | | | | | |
Shares issued | 163,724,211 | | 163,724,211 | | | | | |
Shares outstanding | 115,961,880 | | 113,558,444 | | 1.2 | | 1.1 | |
Warrants | | 31.0 | | 50.0 | |
Common stock held by employee plans | | (27.6 | ) | (39.7 | ) |
Accumulated other comprehensive loss | | (44.6 | ) | (9.2 | ) |
Retained earnings | | 1,015.6 | | 870.5 | |
Total common shareholders’ equity | | 975.6 | | 872.7 | |
| | | | | |
Total Liabilities and Shareholders’ Equity | | $ | 3,675.1 | | $ | 3,566.6 | |
See Notes to Consolidated Financial Statements.
63
Table of Contents
DPL INC.
CONSOLIDATED STATEMENTS OF SHAREHOLDERS’ EQUITY
| | | | | | | | | | Common | | | | | | | |
| | | | | | | | | | Stock | | Accumulated | | | | | |
| | Common Stock (a) | | Other | | | | Held by | | Other | | | | | |
| | Outstanding | | | | Paid-in | | | | Employee | | Comprehensive | | Retained | | | |
$ in millions | | Shares | | Amount | | Capital | | Warrants | | Plans | | Income/(Loss) | | Earnings | | Total | |
| | | | | | | | | | | | | | | | | |
Beginning balance | | 127,526,404 | | $ | 1.3 | | $ | 25.1 | | $ | 50.0 | | $ | (86.1 | ) | $ | (14.2 | ) | $ | 1,062.0 | | $ | 1,038.1 | |
| | | | | | | | | | | | | | | | | |
2006: | | | | | | | | | | | | | | | | | |
Net income | | | | | | | | | | | | | | 139.6 | | | |
Net change in unrealized gains (losses) on financial instruments | | | | | | | | | | | | 1.6 | | | | | |
Net change in deferred gains (losses) on cash flow hedges | | | | | | | | | | | | 0.7 | | | | | |
Minimum pension liability | | | | | | | | | | | | 11.8 | | | | | |
Deferred income taxes related to unrealized gains (losses) | | | | | | | | | | | | (29.9 | ) | | | | |
Total comprehensive income | | | | | | | | | | | | | | | | 123.8 | |
Common stock dividends (b) | | | | | | | | | | | | | | (112.4 | ) | (112.4 | ) |
Treasury shares purchased (c) | | (14,862,432 | ) | (0.1 | ) | (389.3 | ) | | | | | | | | | (389.4 | ) |
Treasury stock reissued | | 355,000 | | | | 360.4 | | | | | | | | (352.6 | ) | 7.8 | |
Tax effects to equity | | | | | | 1.8 | | | | | | | | | | 1.8 | |
Employee / Director stock plans | | | | | | 1.8 | | | | 17.1 | | | | (0.1 | ) | 18.8 | |
Other | | | | (0.1 | ) | 0.2 | | | | | | | | | | 0.1 | |
FAS 158 adjustment | | | | | | | | | | | | 23.5 | | | | 23.5 | |
Ending balance | | 113,018,972 | | $ | 1.1 | | $ | (0.0 | ) | $ | 50.0 | | $ | (69.0 | ) | $ | (6.5 | ) | $ | 736.5 | | $ | 712.1 | |
| | | | | | | | | | | | | | | | | |
2007: | | | | | | | | | | | | | | | | | |
Net income | | | | | | | | | | | | | | 221.8 | | | |
Net change in unrealized gains (losses) on financial instruments | | | | | | | | | | | | (1.4 | ) | | | | |
Net change in deferred gains (losses) on cash flow hedges | | | | | | | | | | | | (7.2 | ) | | | | |
Net change in unrealized gains (losses) on pension and postretirement benefits | | | | | | | | | | | | 3.4 | | | | | |
Deferred income taxes related to unrealized gains (losses) | | | | | | | | | | | | 2.5 | | | | | |
Total comprehensive income | | | | | | | | | | | | | | | | 219.1 | |
Common stock dividends (b) | | | | | | | | | | | | | | (111.7 | ) | (111.7 | ) |
Treasury stock reissued | | 539,472 | | | | (8.0 | ) | | | | | | | 24.0 | | 16.0 | |
Tax effects to equity | | | | | | 1.3 | | | | | | | | | | 1.3 | |
Employee / Director stock plans | | | | | | 6.6 | | | | 29.2 | | | | (0.1 | ) | 35.7 | |
Other | | | | | | 0.1 | | | | 0.1 | | | | | | 0.2 | |
Ending balance | | 113,558,444 | | $ | 1.1 | | $ | (0.0 | ) | $ | 50.0 | | $ | (39.7 | ) | $ | (9.2 | ) | $ | 870.5 | | $ | 872.7 | |
| | | | | | | | | | | | | | | | | |
2008: | | | | | | | | | | | | | | | | | |
Net income | | | | | | | | | | | | | | 244.5 | | | |
Net change in unrealized gains (losses) on financial instruments | | | | | | | | | | | | (0.8 | ) | | | | |
Net change in deferred gains (losses) on cash flow hedges | | | | | | | | | | | | (1.3 | ) | | | | |
Net change in unrealized gains (losses) on pension and postretirement benefits | | | | | | | | | | | | (33.1 | ) | | | | |
Deferred income taxes related to unrealized gains (losses) | | | | | | | | | | | | (0.2 | ) | | | | |
Total comprehensive income | | | | | | | | | | | | | | | | 209.1 | |
Common stock dividends (b) | | | | | | | | | | | | | | (120.5 | ) | (120.5 | ) |
Treasury stock reissued | | 2,403,436 | | 0.1 | | (0.2 | ) | (19.0 | ) | | | | | 21.4 | | 2.3 | |
Tax effects to equity | | | | | | 0.3 | | | | | | | | | | 0.3 | |
Employee / Director stock plans | | | | | | (0.2 | ) | | | 12.1 | | | | (0.1 | ) | 11.8 | |
Other | | | | | | 0.1 | | | | | | | | (0.2 | ) | (0.1 | ) |
Ending balance | | 115,961,880 | | $ | 1.2 | | $ | (0.0 | ) | $ | 31.0 | | $ | (27.6 | ) | $ | (44.6 | ) | $ | 1,015.6 | | $ | 975.6 | |
(a)$0.01 par value, 250,000,000 shares authorized.
(b)Common stock dividends per share were $1.00 in 2006, $1.04 in 2007, and $1.10 in 2008.
(c)Number of shares outstanding at December 31, 2005 were not affected by the December 30, 2005 transaction to purchase 406,000 shares as the share repurchase was settled in early January 2006. DPL completed the share repurchase program in August 2006.
See Notes to Consolidated Financial Statements.
64
Table of Contents
THE DAYTON POWER AND LIGHT COMPANY
CONSOLIDATED STATEMENTS OF RESULTS OF OPERATIONS
| | For the years ended December 31, | |
$ in millions | | 2008 | | 2007 | | 2006 | |
| | | | | | | |
Revenues | | $ | 1,572.9 | | $ | 1,507.4 | | $ | 1,385.2 | |
| | | | | | | |
Cost of revenues: | | | | | | | |
Fuel | | 231.4 | | 315.4 | | 335.2 | |
Purchased power | | 379.9 | | 300.3 | | 171.9 | |
Total cost of revenues | | 611.3 | | 615.7 | | 507.1 | |
| | | | | | | |
Gross margin | | 961.6 | | 891.7 | | 878.1 | |
| | | | | | | |
Operating expenses: | | | | | | | |
Operation and maintenance | | 263.0 | | 271.0 | | 231.7 | |
Depreciation and amortization | | 127.8 | | 124.5 | | 130.0 | |
General taxes | | 124.2 | | 110.3 | | 106.3 | |
Amortization of regulatory assets | | 10.0 | | 10.8 | | 7.6 | |
Total operating expenses | | 525.0 | | 516.6 | | 475.6 | |
| | | | | | | |
Operating income | | 436.6 | | 375.1 | | 402.5 | |
| | | | | | | |
Other income / (expense), net | | | | | | | |
Investment income | | 7.0 | | 23.7 | | 6.7 | |
Net gain on settlement of executive litigation | | — | | 35.3 | | — | |
Interest expense | | (36.5 | ) | (22.3 | ) | (23.4 | ) |
Other income (deductions) | | (1.1 | ) | 2.9 | | (1.2 | ) |
Total other income / (expense), net | | (30.6 | ) | 39.6 | | (17.9 | ) |
| | | | | | | |
Earnings before income tax | | 406.0 | | 414.7 | | 384.6 | |
| | | | | | | |
Income tax expense | | 120.2 | | 143.1 | | 142.2 | |
| | | | | | | |
Net Income | | 285.8 | | 271.6 | | 242.4 | |
| | | | | | | |
Preferred dividends | | 0.9 | | 0.9 | | 0.8 | |
| | | | | | | |
Earnings on common stock | | $ | 284.9 | | $ | 270.7 | | $ | 241.6 | |
See Notes to Consolidated Financial Statements.
65
Table of Contents
THE DAYTON POWER AND LIGHT COMPANY
CONSOLIDATED STATEMENTS OF CASH FLOWS
| | For the years ended December 31, | |
$ in millions | | 2008 | | 2007 | | 2006 | |
Cash flows from operating activities: | | | | | | | |
Net income | | $ | 285.8 | | $ | 271.6 | | $ | 242.4 | |
Adjustments to reconcile net income to net cash provided by operating activities: | | | | | | | |
Depreciation and amortization | | 127.8 | | 124.5 | | 130.0 | |
Net gain on settlement of executive litigation | | — | | (35.3 | ) | — | |
Gain on transfer of assets to pension | | — | | (14.8 | ) | — | |
Amortization of regulatory assets | | 10.0 | | 10.8 | | 7.6 | |
Deferred income taxes | | 38.1 | | (3.0 | ) | (16.3 | ) |
Changes in certain assets and liabilities: | | | | | | | |
Accounts receivable | | (6.6 | ) | (18.9 | ) | (29.0 | ) |
Deposits and other advances | | (9.2 | ) | 15.8 | | (11.0 | ) |
Accounts payable | | 26.9 | | 1.9 | | 21.4 | |
Accrued taxes payable | | (56.5 | ) | 19.6 | | 0.5 | |
Accrued interest payable | | — | | 0.3 | | 1.3 | |
Prepayments | | (1.3 | ) | — | | 5.5 | |
Inventories | | (0.2 | ) | (20.6 | ) | (5.2 | ) |
Deferred compensation assets | | 0.7 | | 3.4 | | 2.5 | |
Deferred compensation obligations | | (8.4 | ) | 1.1 | | 0.1 | |
Other | | (12.5 | ) | (3.4 | ) | (6.0 | ) |
Net cash provided by operating activities | | 394.6 | | 353.0 | | 343.8 | |
| | | | | | | |
Cash flows from investing activities: | | | | | | | |
Capital expenditures | | (242.0 | ) | (343.2 | ) | (332.9 | ) |
Net cash used for investing activities | | (242.0 | ) | (343.2 | ) | (332.9 | ) |
| | | | | | | |
Cash flows from financing activities: | | | | | | | |
Issuance of short-term debt | | — | | 105.0 | | — | |
Payment of short-term debt | | (20.0 | ) | (85.0 | ) | — | |
Issuance of pollution control bonds, net | | 98.4 | | 90.0 | | 100.0 | |
Pollution control bond proceeds held in trust | | (10.0 | ) | (90.0 | ) | (100.0 | ) |
Retirement of pollution control bonds | | (90.0 | ) | — | | — | |
Withdrawal of restricted funds held in trust, net | | 32.5 | | 63.2 | | 89.9 | |
Withdrawals from revolving credit facility | | 115.0 | | — | | — | |
Repayment of borrowings from revolving credit facility | | (115.0 | ) | — | | — | |
Dividends paid on preferred stock | | (0.9 | ) | (0.9 | ) | (0.9 | ) |
Dividends paid on common stock to parent | | (155.0 | ) | (125.0 | ) | (100.0 | ) |
Net cash used for financing activities | | (145.0 | ) | (42.7 | ) | (11.0 | ) |
| | | | | | | |
Cash and cash equivalents: | | | | | | | |
Net change | | 7.6 | | (32.9 | ) | (0.1 | ) |
Balance at beginning of period | | 13.2 | | 46.1 | | 46.2 | |
Cash and cash equivalents at end of period | | $ | 20.8 | | $ | 13.2 | | $ | 46.1 | |
| | | | | | | |
Supplemental cash flow information: | | | | | | | |
Interest paid, net of amounts capitalized | | $ | 33.4 | | $ | 18.5 | | $ | 77.9 | |
Income taxes paid, net | | $ | 127.0 | | $ | 114.7 | | $ | 158.1 | |
Non-cash financing and investing activities: | | | | | | | |
Restricted funds held in trust | | $ | 14.5 | | $ | 37.0 | | $ | 10.1 | |
Accruals for capital expenditures | | $ | 34.1 | | $ | 45.6 | | $ | 43.0 | |
See Notes to Consolidated Financial Statements.
66
Table of Contents
THE DAYTON POWER AND LIGHT COMPANY
CONSOLIDATED BALANCE SHEETS
| | At December 31, | |
$ in millions | | 2008 | | 2007 | |
| | | | | |
ASSETS | | | | | |
| | | | | |
Current assets: | | | | | |
Cash and cash equivalents | | $ | 20.8 | | $ | 13.2 | |
Restricted funds held in trust | | 14.5 | | 37.0 | |
Accounts receivable, less provision for uncollectible accounts of $1.1 and $1.5, respectively | | 225.4 | | 221.8 | |
Inventories, at average cost | | 103.8 | | 103.6 | |
Taxes applicable to subsequent years | | 57.9 | | 48.0 | |
Other current assets | | 24.1 | | 13.4 | |
| | | | | |
Total current assets | | 446.5 | | 437.0 | |
| | | | | |
Property: | | | | | |
Property, plant and equipment | | 4,970.9 | | 4,757.0 | |
Less: Accumulated depreciation and amortization | | (2,265.5 | ) | (2,159.1 | ) |
| | | | | |
Net property | | 2,705.4 | | 2,597.9 | |
| | | | | |
Other noncurrent assets: | | | | | |
Regulatory assets | | 233.7 | | 165.2 | |
Other assets | | 50.2 | | 76.6 | |
| | | | | |
Total other noncurrent assets | | 283.9 | | 241.8 | |
| | | | | |
Total Assets | | $ | 3,435.8 | | $ | 3,276.7 | |
See Notes to Consolidated Financial Statements.
67
Table of Contents
THE DAYTON POWER AND LIGHT COMPANY
CONSOLIDATED BALANCE SHEETS
| | At December 31, | |
$ in millions | | 2008 | | 2007 | |
| | | | | |
LIABILITIES AND SHAREHOLDER’S EQUITY | | | | | |
| | | | | |
Current liabilities: | | | | | |
Current portion - long-term debt | | $ | 0.7 | | $ | 0.7 | |
Accounts payable | | 176.6 | | 161.9 | |
Accrued taxes | | 128.0 | | 112.7 | |
Accrued interest | | 12.9 | | 12.9 | |
Short-term debt owed to parent | | — | | 20.9 | |
Other current liabilities | | 34.0 | | 26.9 | |
Total current liabilities | | 352.2 | | 336.0 | |
| | | | | |
Noncurrent liabilities: | | | | | |
Long-term debt | | 884.0 | | 874.6 | |
Deferred taxes | | 417.8 | | 367.0 | |
Unamortized investment tax credit | | 38.0 | | 40.7 | |
Other deferred credits | | 267.4 | | 266.2 | |
Total noncurrent liabilities | | 1,607.2 | | 1,548.5 | |
| | | | | |
Cumulative preferred stock not subject to mandatory redemption | | 22.9 | | 22.9 | |
| | | | | |
Commitments and contingencies (Note 17) | | | | | |
| | | | | |
Common shareholder’s equity: | | | | | |
Common stock, at par value of $0.01 per share | | 0.4 | | 0.4 | |
Other paid-in capital | | 783.1 | | 784.8 | |
Accumulated other comprehensive (loss) / income | | (37.5 | ) | 6.5 | |
Retained earnings | | 707.5 | | 577.6 | |
Total common shareholder’s equity | | 1,453.5 | | 1,369.3 | |
| | | | | |
Total Liabilities and Shareholder’s Equity | | $ | 3,435.8 | | $ | 3,276.7 | |
See Notes to Consolidated Financial Statements.
68
Table of Contents
THE DAYTON POWER AND LIGHT COMPANY
CONSOLIDATED STATEMENTS OF SHAREHOLDER’S EQUITY
| | | | | | | | Accumulated | | | | | |
| | Common Stock (a) | | Other | | Other | | | | | |
| | Outstanding | | | | Paid-in | | Comprehensive | | Retained | | | |
$ in millions | | Shares | | Amount | | Capital | | Income/(Loss) | | Earnings | | Total | |
| | | | | | | | | | | | | |
Beginning balance | | 41,172,173 | | $ | 0.4 | | $ | 783.4 | | $ | 5.1 | | $ | 290.5 | | $ | 1,079.4 | |
| | | | | | | | | | | | | |
2006: | | | | | | | | | | | | | |
Net income | | | | | | | | | | 242.4 | | | |
Net change in unrealized gains (losses) on financial instruments | | | | | | | | 3.9 | | | | | |
Net change in deferred gains (losses) on cash flow hedges | | | | | | | | 0.7 | | | | | |
Minimum pension liability | | | | | | | | 11.8 | | | | | |
Deferred income taxes related to unrealized gains (losses) | | | | | | | | (30.2 | ) | | | | |
Total comprehensive income | | | | | | | | | | | | 228.6 | |
Common stock dividends | | | | | | | | | | (100.0 | ) | (100.0 | ) |
Preferred stock dividends | | | | | | | | | | (0.8 | ) | (0.8 | ) |
Tax effects to equity | | | | | | 1.8 | | | | | | 1.8 | |
Employee / Director stock plans | | | | | | (1.6 | ) | | | | | (1.6 | ) |
Other | | | | | | 0.1 | | | | (0.1 | ) | — | |
FAS 158 adjustment | | | | | | | | 23.8 | | | | 23.8 | |
Ending balance | | 41,172,173 | | $ | 0.4 | | $ | 783.7 | | $ | 15.1 | | $ | 432.0 | | $ | 1,231.2 | |
| | | | | | | | | | | | | |
2007: | | | | | | | | | | | | | |
Net income | | | | | | | | | | 271.6 | | | |
Net change in unrealized gains (losses) on financial instruments | | | | | | | | (11.9 | ) | | | | |
Net change in deferred gains (losses) on cash flow hedges | | | | | | | | (7.2 | ) | | | | |
Net change in unrealized gains (losses) on pension and postretirement benefits | | | | | | | | 3.5 | | | | | |
Deferred income taxes related to unrealized gains (losses) | | | | | | | | 7.1 | | | | | |
Total comprehensive income | | | | | | | | | | | | 263.1 | |
Common stock dividends | | | | | | | | | | (125.0 | ) | (125.0 | ) |
Preferred stock dividends | | | | | | | | | | (0.9 | ) | (0.9 | ) |
Tax effects to equity | | | | | | 1.3 | | | | | | 1.3 | |
Employee / Director stock plans | | | | | | (0.3 | ) | | | | | (0.3 | ) |
Other | | | | | | 0.1 | | (0.1 | ) | (0.1 | ) | (0.1 | ) |
Ending balance | | 41,172,173 | | $ | 0.4 | | $ | 784.8 | | $ | 6.5 | | $ | 577.6 | | $ | 1,369.3 | |
| | | | | | | | | | | | | |
2008: | | | | | | | | | | | | | |
Net income | | | | | | | | | | 285.8 | | | |
Net change in unrealized gains (losses) on financial instruments | | | | | | | | (15.0 | ) | | | | |
Net change in deferred gains (losses) on cash flow hedges | | | | | | | | (1.2 | ) | | | | |
Net change in unrealized gains (losses) on pension and postretirement benefits | | | | | | | | (33.4 | ) | | | | |
Deferred income taxes related to unrealized gains (losses) | | | | | | | | 5.6 | | | | | |
Total comprehensive income | | | | | | | | | | | | 241.8 | |
Common stock dividends | | | | | | | | | | (155.0 | ) | (155.0 | ) |
Preferred stock dividends | | | | | | | | | | (0.9 | ) | (0.9 | ) |
Tax effects to equity | | | | | | 0.3 | | | | | | 0.3 | |
Employee / Director stock plans | | | | | | (2.0 | ) | | | | | (2.0 | ) |
Ending balance | | 41,172,173 | | $ | 0.4 | | $ | 783.1 | | $ | (37.5 | ) | $ | 707.5 | | $ | 1,453.5 | |
(a) 50,000,000 shares authorized.
See Notes to Consolidated Financial Statements.
69
Table of Contents
Notes to Consolidated Financial Statements
This report includes the combined filing of DPL and DP&L. DP&L is the principal subsidiary of DPL providing approximately 98% of DPL’s total consolidated revenue and approximately 93% of DPL’s total consolidated asset base. Throughout this report the terms we, us, our and ours are used to refer to both DPL and DP&L have filed separate SEC filings. Beginning with, respectively and altogether, unless the context indicates otherwise. Discussions or areas of this report andthat apply only to DPL or DP&L will clearly be noted in the future, DPL Inc. and The Dayton Power and Light Company will file combined SEC reports on an interim and annual basis.section.
DPL’s results of operations, financial position and cash flows, includesinclude the consolidated results of its subsidiaries, including its principal subsidiary DP&L and all of its consolidated subsidiaries. All material intercompany accounts and transactions have been eliminated in consolidation. Some of the Notes presented in this report are only applicable to DPL or DP&L as indicated. The other Notes apply to both registrants and the financial information presented is segregated by registrant.
1. Summary of Significant Accounting Policies and Overview
Description of Business
DPL is a diversified regional energy company organized in 1985 under the laws of Ohio. DPL’s principal subsidiary is The Dayton Power and Light Company (DP&L). DP&L is a public utility incorporated in 1911 under the laws of Ohio. DP&L sells electricity to residential, commercial, industrial and governmental customers in a 6,000 square mile area of West Central Ohio. Electricity for DP&L’s 24 county service area is primarily generated at eight coal-fired power plants and is distributed to more than 500,000515,000 retail customers. DP&L also purchases retail peak load requirements fromsells electricity to DPL Energy LLC (DPLE, oneResources, Inc. (DPLER), an affiliate, to satisfy the electric requirements of our wholly-owned subsidiaries).its retail customers. Principal industries served include automotive, food processing, paper, plastic manufacturing and defense. DP&L’s sales reflect the general economic conditions and seasonal weather patterns of the area. DP&L sells any excess energy and capacity into the wholesale market.
DPL’s other significant subsidiaries (all of which are wholly-owned) include DPLE,DPL Energy LLC (DPLE), which engages in the operation of peaking generating facilities; DPL Energy Resources, Inc. (DPLER),DPLER, which sells retail electric energy under contract to major industrial and commercial customers in West Central Ohio; MVE, Inc., which was primarily responsible for the management of our financial asset portfolio; and Miami Valley Insurance Company (MVIC), our captive insurance company that provides insurance sources to us and our subsidiaries. DP&L has one significant subsidiary, DPL Finance Company, Inc., which is wholly-owned and provides financing to DPL, DP&L and other affiliated companies.
DPL and DP&L conduct their principal business in one business segment -— Electric.
Basis of Consolidation
Weprepare consolidated financial statements in accordance with generally accepted accounting principles (GAAP) in the United States of America. The consolidated financial statements include the accounts of DPL and DP&L and their majority-owned subsidiaries. Investments that are not majority owned are accounted for using the equity method when our investment allows us the ability to exert significant influence, as defined by GAAP. Undivided interests in jointly-owned generation facilities are consolidated on a pro rata basis. All material intercompany accounts and transactions are eliminated in consolidation.
Estimates Judgments and ReclassificationsJudgments
The preparation of financial statements in conformity with GAAP requires us to make estimates and judgments that affect the reported amounts of assets and liabilities, the disclosure of contingent assets and liabilities at the date of the financial statements and the revenue and expenses of the period reported. Different estimates could haveWe record liabilities for probable estimated losses in accordance with Statement of Financial Accounting Standards No. 5 (SFAS 5), “Accounting for Contingencies.” To the extent a material effectprobable loss can only be estimated by reference to a range of equally probable outcomes and no amount within the range appears to be a better estimate than any other amount, we accrue for the low end of the range. Because of uncertainties related to these matters, accruals are based on the best information available at the time. We evaluate the potential liability related to probable losses quarterly and may revise our financial results.estimates. Judgments and uncertainties affecting the application of these policies and estimates may result in materially different amounts being reported under different conditions or circumstances.circumstances that may affect our financial position and results of operations. Significant items subject to such estimates and judgments includeinclude: the carrying value of property, plant and equipment; unbilled revenues; the valuation of derivative instruments; the valuation of insurance and claims costs; the valuation allowances for receivables and deferred income taxes; regulatory assets and liabilities; reserves recorded for income tax exposures; litigation; contingencies and assets and liabilities related to employee benefits. Actual results may differ
70
Table of Contents
Reclassifications
During the fourth quarter of 2007, we identified immaterial changes in certain accounts payable balances that had not been correctly presented in our 2006 cash flow statements. Changes in accounts payable balances representing capital expenditures had previously been classified with cash flows from those estimates. Certain amounts from prior periodsoperating activities and should have been classified with capital expenditures as part of investing activities. Accordingly, the DPL and DP&L consolidated statements of cash flows for 2006 were reclassified to conform to the current reporting presentation. In 2005, As a result of these reclassifications, cash provided by operating activities for DPL has separately disclosed decreased by $21.9 million from $308.7 million to $286.8 million for the year ended December 31, 2006. This same adjustment also decreased cash used for capital expenditures within investing activities to $335.6 million from $357.5 million in 2006. Cash provided by operating activities for DP&L decreased by $21.9 million from $365.7 million to $343.8 million for the year ended December 31, 2006. This same adjustment also decreased cash used for capital expenditures within investing activities to $332.9 million from $354.8 million in 2006. These reclassifications did not impact operating income or net income, working capital, any earnings from discontinued operations,per share measures or net of income taxes, whichchange in prior periods were reported with elements
of continued operations. In 2005, DPL also separately disclosed the investing portions of the cash flows attributable to its discontinued operations (there was no impact on the operating or investing portions of theand cash flows), which in prior periods were reported on a combined basisequivalents as a single amount.previously reported.
Revenues
We recordconsider revenue realized, or realizable, and earned when persuasive evidence of an arrangement exists, the products or services have been provided to the customer, the sales price is fixed or determinable, and collection is reasonably assured. The determination of the energy sales to customers is based on the reading of their meters, which occurs on a systematic basis throughout the month. We recognize revenues using an accrual method for services provided butretail and other energy sales that have not yet been billed, but where electricity has been consumed. This is termed “unbilled revenues” and is a widely recognized and accepted practice for utilities. At the end of each month, unbilled revenues are determined by the estimation of unbilled energy provided to more closely match revenues with expenses. Accounts receivable on DPL’s Consolidated Balance Sheets includecustomers since the date of the last meter reading, projected line losses, the assignment of unbilled revenue of $68.7 millionenergy provided to customer classes and $63.6 million in 2006 and 2005, respectively. Accounts receivable on DP&L’s Consolidated Balance Sheets include unbilled revenue of $61.0 million and $57.5 million in 2006 and 2005, respectively.the average rate per customer class. Also included in revenues are amounts charged to customers through a surcharge for recovery of uncollected amounts from certain eligible low-income households. These charges for both DPL and DP&L were $12.1 million for 2008, $13.1 million for 2007, and $11.9 million for 2006, $6.2 million for 2005, and $8.3 million for 2004.2006.
Allowance for Uncollectible Accounts
We establish provisions for uncollectible accounts using both historical average credit loss percentages of accounts receivable balances to project future losses and specific provisions for known credit issues.
Property, Plant and Equipment
We record our ownership share of our undivided interest in jointly-held plants as an asset in property, plant and equipment. Property, plant and equipment are stated at cost. For regulated property, cost includes direct labor and material, allocable overhead costs and an allowance for funds used during construction (AFUDC). AFUDC represents the cost of borrowed funds and equity used to finance regulated construction projects. Capitalization of AFUDC ceases at either project completion or as of the date specified by regulators. AFUDC capitalized related to borrowed funds was $50 thousand in 2006, and zero in 2005 and 2004. AFUDC capitalized for equity funds was $0.4 million in 2006, zero in 2005, and $0.5 million in 2004.
For unregulated property, cost includes direct labor, material and overhead costs and interest capitalized during construction using FASB Statement of Accounting Standard No. 34, Capitalization of Interest Cost. Capitalized interest was $12.9 million in 2006, $2.6 million in 2005 and $1.8 million in 2004.
For substantially all depreciable property, when a unit of property is retired, the original cost of that property less any salvage value is charged to Accumulated Depreciation and Amortization.
Property is evaluated for impairment when events or changes in circumstances indicate that its carrying amount may not be recoverable.
Depreciation
Depreciation expense is calculated using the straight-line method, which depreciates the cost of property over its estimated useful life. For DPL’s generation, transmission, and distribution assets, straight-line depreciation is applied on an average annual composite basis using group rates that approximated 3.3% in 2006, 3.3% in 2005 and 3.4% in 2004. DPL’s depreciation expense was $151.8 million in 2006, $147.3 million in 2005 and $144.1 million in 2004.
The following is a summary of DPL’s property, plant and equipment with corresponding composite depreciation rates at December 31, 2006 and 2005:
DPL
| | | | Composite | | | | Composite | |
$ in millions | | 2006 | | Rate | | 2005 | | Rate | |
Regulated: | | | | | | | | | |
Transmission | | $ | 343.5 | | 2.4 | % | $ | 341.8 | | 2.6 | % |
Distribution | | 1,050.8 | | 3.8 | % | 968.9 | | 3.4 | % |
General | | 66.0 | | 7.5 | % | 63.1 | | 9.5 | % |
Non-depreciable | | 54.2 | | 0.0 | % | 54.0 | | 0.0 | % |
Total regulated | | $ | 1,514.5 | | | | $ | 1,427.8 | | | |
| | | | | | | | | |
Unregulated: | | | | | | | | | |
Production (a) | | $ | 3,048.0 | | 3.2 | % | $ | 3,008.3 | | 3.2 | % |
Other | | 44.9 | | 7.0 | % | 45.2 | | 7.6 | % |
Non-depreciable | | 18.6 | | 0.0 | % | 18.4 | | 0.0 | % |
Total unregulated | | $ | 3,111.5 | | | | $ | 3,071.9 | | | |
| | | | | | | | | |
Total property in service | | $ | 4,626.0 | | 3.3 | % | $ | 4,499.7 | | 3.3 | % |
Construction work in process | | 376.0 | | 0.0 | % | 168.0 | | 0.0 | % |
| | | | | | | | | |
Total property, plant and equipment | | $ | 5,002.0 | | | | $ | 4,667.7 | | | |
(a)During 2006, DPL entered into agreements to sell 630 MW of its peaking capacity relating to the Darbyand Greenville stations of which $283.5 million of the assets presented in this table are held for sale at December 31, 2006.
For DP&L’s generation, transmission, and distribution assets, straight-line depreciation is applied on an average annual composite basis using group rates that approximated 3.2% in 2006, 3.2% in 2005, and 3.3% in 2004. DP&L’s depreciation expense was $130.0 million in 2006, $123.9 million in 2005, and $121.1 million in 2004.
The following is a summary of DP&L’s property, plant and equipment with corresponding composite depreciation rates at December 31, 2006 and 2005:
DP&L
| | | | Composite | | | | Composite | |
$ in millions | | 2006 | | Rate | | 2005 | | Rate | |
Regulated: | | | | | | | | | |
Transmission | | $ | 343.5 | | 2.4 | % | $ | 341.8 | | 2.6 | % |
Distribution | | 1,050.8 | | 3.8 | % | 968.9 | | 3.4 | % |
General | | 66.0 | | 7.5 | % | 63.1 | | 9.5 | % |
Non-depreciable | | 54.2 | | 0.0 | % | 54.0 | | 0.0 | % |
Total regulated | | $ | 1,514.5 | | | | $ | 1,427.8 | | | |
| | | | | | | | | |
Unregulated: | | | | | | | | | |
Production | | $ | 2,545.6 | | 3.0 | % | $ | 2,509.8 | | 3.0 | % |
Non-depreciable | | 15.3 | | 0.0 | % | 15.3 | | 0.0 | % |
Total unregulated | | $ | 2,560.9 | | | | $ | 2,525.1 | | | |
| | | | | | | | | |
Total property in service | | $ | 4,075.4 | | 3.2 | % | $ | 3,952.9 | | 3.2 | % |
Construction work in process | | 375.2 | | 0.0 | % | 165.1 | | 0.0 | % |
| | | | | | | | | |
Total property, plant and equipment | | $ | 4,450.6 | | | | $ | 4,118.0 | | | |
Asset Retirement Obligations
We adopted the provisions of the Financial Accounting Standards Board (FASB) Statement of Financial Accounting Standards No. 143, “Accounting for Asset Retirement Obligations” (SFAS 143) during 2003. SFAS 143 requires legal obligations associated with the retirement of long-lived assets to be recognized at their fair value at the time those obligations are incurred. Upon initial recognition of a legal liability, costs are capitalized as part of the related long-lived asset and allocated to expense over the useful life of the asset. SFAS 143 also requires that components of previously recorded depreciation related to the cost of removal of assets upon retirement, whether legal asset retirement obligations or not, must be removed from a company’s accumulated depreciation reserve. Our legal obligations associated with the retirement of our long-lived assets under SFAS 143 consisted primarily of river intake and discharge structures, coal unloading facilities, loading docks, ice breakers and ash disposal facilities. Estimating the amount and timing of future expenditures of this type requires significant judgment. Management routinely updates this estimating as additional information becomes available.
In March of 2005, the FASB issued FASB Interpretation No. 47 (FIN No. 47), “Accounting for Conditional Asset Retirement Obligations, an interpretation of FASB Statement No. 143.” We implemented FIN No. 47 in the fourth quarter of 2005 effective January 1, 2005 for certain asset retirement obligations, primarily the removal of asbestos, at some of our generation stations. Application of FIN No. 47 resulted in an increase in our net property, plant and equipment of $1.8 million and an increase in our asset retirement obligation of $7.2 million. The difference of $5.3 million represents the before tax ($3.2 million after tax) cumulative effect of the adoption of FIN No. 47, as of January 1, 2005. The before tax impact on 2005 net income was $0.9 million ($0.5 million after tax) which consisted of $0.6 million of accretion expense and $0.3 million depreciation expense
If FIN No. 47 had been applied as of January 1, 2003, our asset retirement obligation would have increased by $9.4 million and $10.3 million at January 1, 2004 and December 31, 2004, respectively. Our asset retirement obligation was $13.2 million at December 31, 2005, which consisted of $5.4 million related to the adoption of SFAS 143 in 2003 and $7.8 million related to the adoption of FIN No. 47 in 2005. Our asset retirement obligation was $11.7 million at December 31, 2006, which consisted of $5.4 million related to the adoption of SFAS 143 in 2003 and $7.8 million related to the adoption of FIN No. 47 in 2005.
Changes in the Liability for Asset Obligations
$ in millions | | 2006 | | 2005 | |
Balance at December 31, 2005 | | $ | 13.2 | | $ | 5.1 | |
Accretion expense | | 0.3 | | 0.9 | |
Additions | | — | | 7.2 | |
Settlements | | (0.4 | ) | — | |
Estimated cashflow revisions | | (1.4 | ) | — | |
Balance at December 31, 2006 | | $ | 11.7 | | $ | 13.2 | |
We continue to record cost of removal for our regulated transmission and distribution assets through our depreciation rates and recover those amounts in rates charged to our customers. There are no known legal asset retirement obligations associated with these assets. We have recorded $86.2 million and $81.7 million in estimated costs of removal at December 31, 2006 and 2005, respectively as regulatory liabilities for our transmission and distribution property. See Note 3 of Notes to Consolidated Financial Statements.
Changes in the Liability for Asset Obligations
$ in millions | | 2006 | | 2005 | |
Balance at December 31, 2005 | | $ | 81.7 | | $ | 77.5 | |
Accretion expense | | — | | — | |
Additions | | 7.8 | | 6.9 | |
Settlements | | (3.3 | ) | — | |
Estimated cashflow revisions | | — | | (2.7 | ) |
Balance at December 31, 2006 | | $ | (86.2 | ) | $ | (81.7 | ) |
Regulatory Accounting
We apply the provisions of FASB Statement of Financial Accounting Standards No. 71, (SFAS 71) “Accounting for the Effects of Certain Types of Regulation” to the transmission and distribution portion of our business. In accordance with SFAS 71, regulatory assets and liabilities are recorded in the Consolidated Balance Sheets. Regulatory assets are the deferral of costs expected to be recovered in future customer rates and regulatory liabilities represent current recovery of expected future costs.
We evaluate our regulatory assets each period and believe recovery of these assets is probable. We have received or requested a return on certain regulatory assets for which we are currently recovering or seeking recovery through rates. See Note 3 of Notes to Consolidated Financial Statements.
We evaluate our regulatory assets each period and believe recovery of these is probable. We have received or requested a return on certain regulatory assets for which we are currently recovering or seeking recovery through rates. If we were required to terminate application of SFAS 71 for all of our regulated operations, we would have to record the amounts of all regulatory assets and liabilities in the Consolidated Statement of Results of Operations at that time. See Note 3 of Notes to Consolidated Financial Statements.
Accounts Receivable
Our accounts receivable includes utility customer receivables, amounts due from our partners for jointly-owned property, wholesale and subsidiary customer receivables, and electric unbilled revenue. At December 31, 2008 and 2007, DPL’s accounts receivable include unbilled revenue of $82.5 million and $68.4 million, respectively. DP&L’s accounts receivable include unbilled revenue of $74.7 million and $60.5 million at December 31, 2008 and 2007, respectively. We also include miscellaneous accounts receivables such as refundable Franchise taxes. The amount is presented net of a provision for uncollectible accounts onin the accompanying consolidated balance sheets.
Allowance for Uncollectible Accounts
We establish provisions for uncollectible accounts using both historical average credit loss percentages of accounts receivable balances to project future losses and specific provisions for known credit issues.
Property, Plant and Equipment
We record our ownership share of our undivided interest in jointly-held plants as an asset in property, plant and equipment. Property, plant and equipment are stated at cost. For regulated property, cost includes direct labor and material, allocable overhead expenses and an allowance for funds used during construction (AFUDC). AFUDC represents the cost of borrowed funds and equity used to finance regulated construction projects. Capitalization of AFUDC ceases at either project completion or at the date specified by regulators. AFUDC capitalized in 2008, 2007 and 2006 was not material.
For unregulated property, cost includes direct labor, material and overhead expenses and interest capitalized during construction using FASB Statement of Accounting Standard No. 34, “Capitalization of Interest Cost.” Capitalized interest was $8.9 million in 2008, $21.8 million in 2007 and $12.9 million in 2006.
For substantially all depreciable property, when a unit of property is retired, the original cost of that property less any salvage value is charged to Accumulated Depreciation and Amortization.
Property is evaluated for impairment when events or changes in circumstances indicate that its carrying amount may not be recoverable.
71
Table of Contents
Depreciation
Depreciation expense is calculated using the straight-line method, which allocates the cost of property over its estimated useful life. For DPL’s generation, transmission, and distribution assets, straight-line depreciation is applied on an average annual composite basis using group rates that approximated 2.7% in 2008, 2.9% in 2007 and 3.3% in 2006. In July 2007, DPL completed a depreciation rate study for non-regulated generation property based on its property, plant and equipment balances during 2007. The results of the depreciation study concluded that DPL’s depreciation rates should be reduced due to projected asset lives beyond previously estimated useful lives. DPL adjusted the depreciation rates for its non-regulated generation property, effective August 1, 2007. For the period from August 1, 2007 to December 31, 2007, the reduction in depreciation expense increased income from continuing operations by approximately $9.5 million, increased net income by approximately $6.0 million, and increased basic EPS by approximately $0.06 per share. DPL’s depreciation expense was $137.7 million in 2008, $134.8 million in 2007, and $151.8 million in 2006.
The following is a summary of DPL’s property, plant and equipment with corresponding composite depreciation rates at December 31, 2008 and 2007:
DPL | | | | | | | | | | |
| | | | Composite | | | | | Composite | |
$ in millions | | 2008 | | Rate | | | 2007 | | Rate | |
Regulated: | | | | | | | | | | |
Transmission | | $ | 350.2 | | 2.4 | % | | $ | 348.2 | | 2.4 | % |
Distribution | | 1,146.1 | | 3.7 | % | | 1,104.2 | | 3.6 | % |
General | | 66.7 | | 7.2 | % | | 65.0 | | 8.9 | % |
Non-depreciable | | 56.9 | | N/A | | | 56.3 | | N/A | |
Total regulated | | $ | 1,619.9 | | | | | $ | 1,573.7 | | | |
| | | | | | | | | | |
Unregulated: | | | | | | | | | | |
Production | | $ | 3,403.0 | | 2.4 | % | | $ | 3,024.4 | | 2.6 | % |
Other | | 31.8 | | 3.5 | % | | 31.0 | | 4.7 | % |
Non-depreciable | | 18.7 | | N/A | | | 18.0 | | N/A | |
Total unregulated | | $ | 3,453.5 | | | | | $ | 3,073.4 | | | |
| | | | | | | | | | |
Total property in service | | $ | 5,073.4 | | 2.7 | % | | $ | 4,647.1 | | 2.9 | % |
Construction work in process | | 153.6 | | N/A | | | 364.5 | | N/A | |
| | | | | | | | | | |
Total property, plant and equipment | | $ | 5,227.0 | | | | | $ | 5,011.6 | | | |
For DP&L’s generation, transmission, and distribution assets, straight-line depreciation is applied on an average annual composite basis using group rates that approximated 2.6% in 2008, 2.8% in 2007 and 3.2% in 2006. DP&L’s depreciation expense was $127.8 million in 2008, $124.5 million in 2007 and $130.0 million in 2006.
72
Table of Contents
The following is a summary of DP&L’s property, plant and equipment with corresponding composite depreciation rates at December 31, 2008 and 2007:
DP&L | | | | | | | | | | |
| | | | Composite | | | | | Composite | |
$ in millions | | 2008 | | Rate | | | 2007 | | Rate | |
Regulated: | | | | | | | | | | |
Transmission | | $ | 350.2 | | 2.4 | % | | $ | 348.2 | | 2.4 | % |
Distribution | | 1,146.2 | | 3.7 | % | | 1,104.2 | | 3.6 | % |
General | | 66.7 | | 7.2 | % | | 65.0 | | 8.9 | % |
Non-depreciable | | 56.9 | | N/A | | | 56.3 | | N/A | |
Total regulated | | $ | 1,620.0 | | | | | $ | 1,573.7 | | | |
| | | | | | | | | | |
Unregulated: | | | | | | | | | | |
Production | | $ | 3,182.6 | | 2.3 | % | | $ | 2,804.2 | | 2.5 | % |
Non-depreciable | | 15.3 | | N/A | | | 15.3 | | N/A | |
Total unregulated | | $ | 3,197.9 | | | | | $ | 2,819.5 | | | |
| | | | | | | | | | |
Total property in service | | $ | 4,817.9 | | 2.6 | % | | $ | 4,393.2 | | 2.8 | % |
Construction work in process | | 153.0 | | N/A | | | 363.8 | | N/A | |
| | | | | | | | | | |
Total property, plant and equipment | | $ | 4,970.9 | | | | | $ | 4,757.0 | | | |
Asset Retirement Obligations
We recognize asset retirement obligations (AROs) in accordance with Financial Accounting Standards Board (FASB) Statement of Financial Accounting Standards No. 143, “Accounting for Asset Retirement Obligations” (SFAS 143) and FASB Interpretation No. 47, “Accounting for Conditional Asset Retirement Obligations — an interpretation of FASB Statement No. 143” (FIN 47). Both SFAS 143 and FIN 47 require legal obligations associated with the retirement of long-lived assets to be recognized at their fair value at the time those obligations are incurred. Upon initial recognition of a legal liability, costs are capitalized as part of the related long-lived asset and depreciated over the useful life of the related asset. SFAS 143 and FIN 47 also require that components of previously recorded depreciation related to the cost of removal of assets upon retirement, whether legal AROs or not, be removed from a company’s accumulated depreciation reserve. Our legal obligations associated with the retirement of our long-lived assets consisted primarily of river intake and discharge structures, coal unloading facilities, loading docks, ice breakers and ash disposal facilities.
Estimating the amount and timing of future expenditures of this type requires significant judgment. Management routinely updates these estimates as additional information becomes available.
Changes in the Liability for Generation Asset Retirement Obligations
$ in millions | | 2008 | | 2007 | |
Balance at January 1 | | $ | 12.5 | | $ | 11.7 | |
Accretion expense | | 0.7 | | 0.2 | |
Additions | | — | | 0.3 | |
Settlements | | (1.0 | ) | (0.6 | ) |
Estimated cash flow revisions | | 1.0 | | 0.9 | |
Balance at December 31 | | $ | 13.2 | | $ | 12.5 | |
We continue to record cost of removal for our regulated transmission and distribution assets through our depreciation rates and recover those amounts in rates charged to our customers. There are no known legal asset retirement obligations associated with these assets. We have recorded $96.0 million and $91.5 million in estimated costs of removal at December 31, 2008 and 2007, respectively, as regulatory liabilities for our transmission and distribution property. These amounts represent the excess of the cumulative removal costs recorded through depreciation rates versus the cumulative removal expenditures actually incurred. See Note 3 of Notes to Consolidated Financial Statements.
73
Table of Contents
Changes in the Liability for Transmission and Distribution Asset Retirement Obligations
$ in millions | | 2008 | | 2007 | |
Balance at January 1 | | $ | 91.5 | | $ | 86.2 | |
Additions | | 8.3 | | 8.0 | |
Settlements | | (3.8 | ) | (2.7 | ) |
Balance at December 31 | | $ | 96.0 | | $ | 91.5 | |
Regulatory Accounting
We apply the provisions of FASB Statement of Financial Accounting Standards No. 71, (SFAS 71) “Accounting for the Effects of Certain Types of Regulation,” to the transmission and distribution portion of our business. In accordance with SFAS 71, regulatory assets and liabilities are recorded in the consolidated balance sheets. Regulatory assets are the deferral of costs expected to be recovered in future customer rates and regulatory liabilities represent current recovery of expected future costs.
We evaluate our regulatory assets each period and believe recovery of these assets is probable. We have received or requested a return on certain regulatory assets for which we are currently recovering or seeking recovery through rates. If we were required to terminate application of SFAS 71 for all of our regulated operations, we would have to write off the amounts of all regulatory assets and liabilities to the consolidated statement of results of operations at that time. See Note 3 of Notes to Consolidated Financial Statements.
Inventory
Inventories, carried at average cost, include coal, emission allowances, limestone, oil and gas used for electric generation, and materials and supplies for utility operations.
Emission Allowances
We account for our emission allowances as inventory, and record emission allowance inventory at historicalweighted average cost. We calculate the weighted average cost by each vintage (year) for which emission allowances can be used and charge to fuel costs the weighted average cost of emission allowances used each quarter. Emission allowances
By the end of August 2008, we had successfully installed and placed into service flue gas desulfurization (FGD) equipment at our Killen and J.M. Stuart stations and are added to inventory when the EPA issues us emission allowances at no cost or when we purchase emission allowances. Purchased emission allowances are recorded in inventory at the purchase price, including any related transaction fees. Emission allowances are deducted from inventory when used in the productionprocess of electricity or when we sell excess emission allowances. Emission allowances used during the production of electricity are charged to fuel costsinstalling similar equipment at the weighted average cost for that vintage.partner-operated facilities. The excess / (shortfall)installation of the sales price over the weighted average costFGD equipment is expected to significantly reduce our future emissions resulting in emission allowance inventory in excess of our needs. Accordingly, we plan for any emissionand manage our excess allowances sold, less related fees, is recorded as a gain / (loss) in other income (deductions). Emission allowances received as part of an exchangeour operations and record the net gains or losses from sales of emissionthese excess allowances are recorded at the carrying costas a component of the emission allowances given up, with no gain or loss recorded.our fuel costs and reflect these in operating income.
Repairs and Maintenance
Costs associated with all planned work and maintenance activities, primarily power plant outages, are recognized at the time the work is performed. These costs, which include labor, materials and supplies, and outside services required to maintain equipment and facilities, are either capitalized or expensed based on defined units of property as required by the Federal Energy Regulatory Commission (FERC).
Income Taxes
We apply the provisions of FASB Statement of Financial Accounting Standards No. 109, “Accounting for Income Taxes” (SFAS 109). SFAS 109 requires an asset and liability approach for financial accounting and reporting of income taxes with tax effects of differences, based on currently enacted income tax rates between the financial reporting and tax basis of accounting reported as Deferred Taxesdeferred tax assets or liabilities in the Consolidated Balance Sheets.consolidated balance sheets. Deferred tax assets are recognized for deductible temporary differences. Valuation reservesallowances are provided against deferred tax assets unless it is more likely than not that the asset will be realized.
Investment tax credits, which have been used to reduce federal income taxes payable, have been deferred for financial reporting purposes. These deferred investment tax credits are amortized over the useful lives of the property to which they are related. For rate-regulated operations, additional deferred income taxes and offsetting regulatory assets or liabilities are recorded to recognize that the income taxes will be recoverable /or refundable through future revenues.
We file a consolidated U.S. federal income tax return in conjunction with our subsidiaries. The consolidated tax liability is allocated to each subsidiary asbased on the separate return method which is specified in our tax allocation agreement and which provides a consistent, systematic and rational approach. See Note 48 of Notes to Consolidated Financial Statements.
74
Table of Contents
Cash and Cash EquivalentsAccounting for Uncertainty in Income Taxes
Cash
On January 1, 2007, we adopted FASB Interpretation No. 48, “Accounting for Uncertainty in Income Taxes” (FIN 48). There was no material impact to our overall results of operations, cash flows or financial position. A reconciliation of the beginning and cash equivalents are stated at cost, which approximates fair value. All highly liquid short-term investments with original maturitiesending amount of three months or less are considered cash equivalents. DPL’s cash and cash equivalents were $262.2 million atunrecognized tax benefit is as follows:
| | ($ in millions) | |
Balance as of January 1, 2008 | | $ | 56.3 | |
Tax positions taken during prior periods | | — | |
Tax positions taken during current period | | 1.9 | |
Settlement with taxing authorities | | (56.3 | ) |
Lapse of applicable statute of limitations | | — | |
Balance as of December 31, 2008 | | $ | 1.9 | |
Of the December 31, 20062008 balance of unrecognized tax benefits, $1.3 million is due to uncertainty in the timing of deductibility.
We recognize interest and $595.8 million atpenalties related to unrecognized tax benefits in income taxes. During 2008, as a result of the settlement of several uncertain tax positions, we reversed all interest related to unrecognized tax benefits. No interest or penalties have been accrued as of December 31, 2005. DP&L’s cash and cash equivalents were $46.1 million at December 31, 2006 and $46.2 million at December 31, 2005. At December 31, 2006, we had $10.1 million restricted funds held2008.
Taxes for calendar years 2005 through 2007 remain open to examination by the jurisdictions in trust relating to the issuance of the $100 million pollution control bonds. These funds will be used to fund the pollution control capital expenditures.
Financial Instruments
We apply the provision of FASB Statement of Financial Accounting Standards No. 115, “Accounting for Certain Investments in Debt and Equity Securities” (SFAS 115), for our investments in debt and equity financial instruments of publicly traded entities and classify the securities into different categories: held-to-maturity and available-for-sale. Available-for-sale securities are carried at fair value and unrealized gains and losses on those securities, net of deferred income taxes, are presented as a separate component of shareholders’ equity. Other-than-temporary declines in value are recognized currently in earnings. Financial instruments classified as held-to-maturity are carried at amortized cost. The valuation of public equity security investments is based upon market quotations. The cost basis for public equity security and fixed maturity investments is average cost and amortized cost, respectively.
Captive Insurance Subsidiary
In addition to insurance provided through third-party providers, a wholly-owned captive subsidiary of DPL provides insurance coverage solely to us and to our subsidiaries. Insurance and Claims Costs on the Consolidated Balance Sheets includes insurance reserves of approximately $22 million and $24 million for 2006 and 2005, respectively, based on actuarial methods and loss experience data. Such reserves are actuarially determined, in the aggregate, based on a reasonable estimation of insured events occurring. There is uncertainty associated with the loss estimates, and actual results may differ from the estimates. Modification of these loss estimates based on experience and changed circumstances is reflected in the period in which the estimate is re-evaluated.
Financial Derivatives
We follow FASB Statement of Financial Accounting Standards No. 133, “Accounting for Derivative Instruments and Hedging Activity” (SFAS 133), as amended. SFAS 133 requires that all derivatives be recognized as either assets or liabilities in the Consolidated Balance Sheets and be measured at fair value, and changes in the fair value be recorded in earnings, unless they are designated as a cash flow hedge of a forecasted transaction or qualify for the normal purchases and sales exception as discussed below.
The FASB issued Statement of Financial Accounting Standards No. 149, “Amendment of Statement 133 on Derivative Instruments and Hedging Activities” (SFAS 149). SFAS 149 amends and clarifies financial accounting and reporting for derivative instruments, including those embedded in other contracts, and for hedging activities and is effective for contracts entered into or modified after June 30, 2003.
We use forward contracts and options to reduce our exposure to changes in energy and commodity prices and as a hedge against the risk of changes in cash flows associated with expected electricity purchases. These purchases are required to meet full load requirements during times of peak demand or during planned and unplanned generation facility outages. We also hold forward sales contracts that hedge against the risk of changes in cash flows associated with power sales during periods of projected generation facility availability. The FASB concluded that electric utilities could apply the normal purchases and sales exception for option-type contracts and forward contracts in electricity subject to specific criteria for the power buyers and sellers under capacity contracts. Accordingly, we apply the normal purchases and sales exception as defined in SFAS 133 and account for these contracts upon settlement.
Pension and Postretirement Benefits
We account and disclose pension and postretirement benefits in accordance with the provisions of Statement of Financial Accounting Standards No. 158, “Employers’ Accounting for Defined Benefit Pensions and other Postretirement Plans, an amendment to FASB Statements 87, 88, 106 and 132R.” This Standard requires the use of assumptions, such as the discount rate and long-term rate of return on assets, in determining the obligations, annual cost and funding requirements of the plans.
Legal, Environmental and Regulatory Contingencies
In the normal course of business, we are subject to various lawsuits, actions, proceedings, claimstaxation. None of the unrecognized tax benefits are expected to significantly increase or decrease within the next twelve months.
Accounting for Taxes Collected from Customers and other matters asserted under lawsRemitted to Governmental Authorities
In January 2007, we adopted Emerging Issues Task Force (EITF) No. 6-03 “How Taxes Collected from Customers and regulations. We believeRemitted to Governmental Authorities Should Be Presented in the amounts providedIncome Statement” (EITF No. 6-03). EITF No. 6-03 requires a registrant to disclose how taxes collected from customers are presented in our consolidatedthe financial statements, i.e., gross or net. DP&L collects certain excise taxes levied by state or local governments from its customers. DP&L’s excise taxes are accounted for on a gross basis and recorded as prescribed by GAAP, adequately reflect probablerevenues and estimable contingencies. We record liabilities for probable estimated lossgeneral taxes in accordance with Statementthe accompanying Consolidated Statements of Financial Accounting Standards No. 5 (SFAS 5), “Accounting for Contingencies.” To the extentResults of a probable loss can only be estimated by reference to a range of equally probable outcomes, and no amount within the range appears to be a better estimate than any other amount, we accrueOperations for the low end of the range. However, there can be no assurances that the actual amounts required to satisfy alleged liabilities from various legal proceedings, claims,twelve months ended December 31, 2008, December 31, 2007 and other matters, and to comply with applicable laws and regulations, will not exceed the amounts reflected in our consolidated financial statements or will not have a material adverse effect on our consolidated results of operations, financial condition or cash flows. As such, costs, if any, that may be incurred in excess of those amounts provided as of December 31, 2006 cannot currently be reasonably determined.as follows:
Recently Issued Accounting Standards
| | Twelve Months Ended | |
| | December 31, | |
$ in millions | | 2008 | | 2007 | | 2006 | |
State/Local excise taxes | | $ | 52.3 | | $ | 53.2 | | $ | 51.3 | |
| | | | | | | | | | |
Stock-Based Compensation
In December 2004, the Financial Accounting Standards Board (FASB)FASB issued Statement of Financial Accounting Standard No. 123 (revised 2004), “Share-Based Payment” (SFAS 123R). SFAS 123R replaces SFAS 123, ��Accounting for Stock-Based Compensation,” and supersedes Accounting Principles Board (APB) Opinion No. 25 (Opinion 25), “Accounting for Stock Issued to Employees.” SFAS 123R requires a public entity to measure the cost of employee services received and paid with equity instruments to be based on the fair-value of such equity on the grant date. This cost is recognized in results of operations over the period in which employees are required to provide service. Liabilities initially incurred are based on the fair-value of equity instruments and are to be re-measured at each subsequent reporting date until the liability is ultimately settled. The fair-value for employee share options and other similar instruments at the grant date are estimated using option-pricing models and any excess tax benefits are recognized as an addition to paid-in capital. Cash retained from the excess tax benefits is presented in the statement of cash flows as financing cash inflows. The provisions of this Statementstatement became effective as of January 1, 2006. OurSee Note 11 of Notes to Consolidated Financial Statements.
75
Table of Contents
Cash and Cash Equivalents
Cash and cash equivalents are stated at cost, which approximates fair value. All highly liquid short-term investments with original maturities of three months or less are considered cash equivalents. DPL’s cash and cash equivalents were $62.5 million at December 31, 2006 year-to-date pre-tax results2008 and $134.9 million at December 31, 2007. DP&L’s cash and cash equivalents were $20.8 million at December 31, 2008 and $13.2 million at December 31, 2007. At December 31, 2008, we had $14.5 million restricted funds held in trust relating to the issuance of operations were increased by approximately $0.7the $100 million pollution control bonds. See Note 7 of Notes to Consolidated Financial Statements. These restricted funds will be used to fund future pollution control capital expenditures.
Financial Instruments
We apply the provision of FASB Statement of Financial Accounting Standards No. 115, “Accounting for Certain Investments in Debt and Equity Securities”(SFAS 115), for our investments in debt and equity financial instruments of publicly traded entities and classify the securities into different categories: held-to-maturity and available-for-sale. Available-for-sale securities are carried at fair value and unrealized gains and losses on those securities, net of deferred income taxes, are presented as a resultseparate component of shareholders’ equity. Other-than-temporary declines in value are recognized currently in earnings. Financial instruments classified as held-to-maturity are carried at amortized cost. The valuation of public equity security investments is based upon market quotations. The cost basis for public equity security and fixed maturity investments is average cost and amortized cost, respectively.
Financial Derivatives
We follow FASB Statement of Financial Accounting Standards No. 133, “Accounting for Derivative Instruments and Hedging Activity” (SFAS 133), as amended. SFAS 133 requires that all derivatives be recognized as either assets or liabilities in the consolidated balance sheets and be measured at fair value. Changes in the fair value are recorded in earnings unless they are designated as a cash flow hedge of a forecasted transaction or qualify for the normal purchases and sales exception as discussed below.
We use forward contracts and options to reduce our exposure to changes in energy and commodity prices and as a hedge against the risk of changes in cash flows associated with expected electricity purchases. These purchases are required to meet full load requirements during times of peak demand or during planned and unplanned generation facility outages. We also hold forward sales contracts that hedge against the risk of changes in cash flows associated with power sales during periods of projected generation facility availability. We use cash flow accounting under SFAS 133 guidance when the hedge is deemed to be effective and mark to market accounting when the hedge is not effective. See Note 10 of Notes to Consolidated Financial Statements.
Captive Insurance Subsidiary
In addition to insurance provided through third-party providers, a wholly-owned captive subsidiary of DPL provides insurance coverage solely to us and to our subsidiaries. Insurance and Claims Costs on the consolidated balance sheets includes insurance reserves of approximately $17.6 million and $20.0 million for 2008 and 2007, respectively. Such reserves are actuarially determined, in the aggregate, based on a reasonable estimation of insured events occurring. There is uncertainty associated with the loss estimates, and actual results may differ from the estimates. Modification of these loss estimates based on experience and changed circumstances is reflected in the period in which the estimate is re-evaluated.
Pension and Postretirement Benefits
In September 2006, the FASB issued Financial Accounting Standards No. 158, “Employers’ Accounting for Defined Benefit Pension and Other Postretirement Plans, an amendment of FASB Statements No. 87, 88, 106 and 132(R)”(SFAS 158). This Statement requires an employer that is a business entity and sponsors one or more single-employer defined benefit plans to: recognize the funded status of a benefit plan; recognize as a component of other comprehensive income (OCI), net of tax, the gains or losses and prior service costs or credits that arise during the period but are not recognized as components of net periodic benefit cost; measure defined benefit plan assets and obligations as of the adoptiondate of the employer’s fiscal year end statement of financial position; and disclose in the notes to financial statements additional information about certain effects on net periodic benefit costs for the next fiscal year that arise from delayed recognition of the gains or losses, prior service costs or credits, and transition assets or obligations. SFAS 158 was effective for fiscal years ending after December 15, 2006, except for the measuring of plan assets at the employer’s fiscal year end, which is effective for fiscal years ending after December 15, 2008. We adopted SFAS 158 effective December 31, 2006. We account and disclose pension and postretirement benefits in accordance with the provisions of SFAS 123R.158. See Note 9 of Notes to Consolidated Financial Statements.
76
Table of Contents
How Taxes Collected from Customers and Remitted to Governmental Authorities Should be Presented in the Income StatementContingencies
In June 2006, the FASB ratifiednormal course of business, we are subject to various lawsuits, actions, proceedings, claims and other matters asserted under laws and regulations. We believe the consensusamounts provided in our consolidated financial statements, as prescribed by GAAP, are adequate in light of Emerging Issues Task Force (EITF) Issue No. 06-3, “How Taxes Collected from Customersthe probable and Remitted to Governmental Authorities Shouldestimable contingencies. However, there can be Presented in the Income Statement (That Is, Gross versus Net Presentation)” (EITF 06-3). EITF 06-3 indicatesno assurances that the income statement presentation on either a gross basis or a net basisactual amounts required to satisfy alleged liabilities from various legal proceedings, claims, tax examinations and other matters discussed below, and to comply with applicable laws and regulations, will not exceed the amounts reflected in our consolidated financial statements. As such, costs, if any, that may be incurred in excess of the taxes within the scopethose amounts provided as of the issue is an accounting policy decision. The consensus is this issue shouldDecember 31, 2008, cannot be applied to interim and annual reporting periods beginning after December 15, 2006. We are in the process of evaluating EITF 06-3 and have not determined the impact to our overall results of operations, financial position or cash flows.reasonably determined.
Recently Adopted Accounting for Uncertainty in Income TaxesStandards
In July 2006, the FASB issued Interpretation No. 48, “Accounting for Uncertainty in Income Taxes” (FIN 48), effective for fiscal years beginning after December 15, 2006. FIN 48 requires a two-step approach to determine how to recognize tax benefits in the financial statements where recognition and measurement of a tax benefit must be evaluated separately. A tax benefit will be recognized only if it meets a “more-likely-than-not” recognition threshold. For tax positions that meet this threshold, the tax benefit recognized is based on the largest amount of tax benefit that is greater than 50 percent likely of being realized upon ultimate settlement with the taxing authority. We have evaluated the requirements of FIN 48 and the adoption of this interpretation and we do not believe at this time that the impact will be significant to our overall results of operations, cash flows or financial position.
Accounting for Fair Value Measurements
In September 2006, the FASB issued
We adopted Statement of Financial Accounting Standards No. 157, “Fair Value Measurements,” (SFAS 157) effective for fiscal years beginning after November 15, 2007. This Standard, on January 1, 2008. SFAS 157 applies whenever other standards require (or permit) assets or liabilities to be measured at fair value. The StandardSFAS 157 clarifies the principle that fair value should be based on the assumptions market participants would use when pricing the asset or liability. In support of this principle, the StandardSFAS 157 establishes a fair value hierarchy that prioritizes the information used to develop those standards. The fair value hierarchy gives the highest priority to quoted prices in active markets and the lowest priority to unobservable data, for example, the reporting entity’s own data. Under the Standard,SFAS 157, fair value measurements would be separately disclosed by level within the fair value hierarchy. The StandardSFAS 157 does not expand the use of fair value in any new
circumstances. We are currently evaluating the impact of adopting SFAS 157 anddid not have not yet determined the significance of this new rule toa material effect on our overall results of operations, financial position or cash flows.
Employers’ Accounting for Defined Benefit Pension and Other Postretirement Plans
In September 2006, the FASB issued Financial Accounting Standards No. 158, “Employers’ Accounting for Defined Benefit Pension and Other Postretirement Plans, an amendment of FASB Statements No. 87, 88, 106 and 132(R)”(SFAS158). This Statement requires an employer that is a business entity and sponsors one or more single-employer defined benefit plans to: a.) recognize the funded status of a benefit plan; b.) recognize as a component of other comprehensive income, net of tax, the gains or losses and prior service costs or credits that arise during the period but are not recognized as components of net periodic benefit cost; c.) measure defined benefit plan assets and obligations as of the date of the employer’s fiscal year-end statement of financial position; d.) disclose in the notes to financial statements additional information about certain effects on net periodic benefit cost for the next fiscal year that arise from delayed recognition of the gains or losses, prior service costs or credits, and transition asset or obligation. This Statement is effective for fiscal years ending after December 15, 2006 except for the measuring of plan assets at the employer’s fiscal year end which is effective for fiscal years ending after December 15, 2008. We have adopted FAS 158 effective December 31, 2006. See Note 510 of theNotes to Consolidated Financial Statements.
Considering the EffectsAmendment of Prior Year Misstatements when Quantifying Misstatements in Current Year Financial StatementsFASB Interpretation No. 39 “Offsetting of Amounts Related to Certain Contracts”
In September 2006,
We adopted Staff Position FIN 39-1, “Amendment of FASB Interpretation 39” (FSP FIN 39-1), on January 1, 2008. FSP FIN 39-1 amends paragraph 10 of FIN 39 to “permit a reporting entity to offset fair value amounts recognized for the Securities and Exchange Commission (SEC) issued Staff Accounting Bulletin No. 108 (Topic 1N): “Consideringright to reclaim cash collateral (a receivable) or the Effects of Prior Year Misstatements when Quantifying Misstatementsobligation to return cash collateral (a payable) against fair value amounts recognized for derivative instruments executed with the same counterparty under the same master netting arrangement that have been offset in Current Year Financial Statements” (SAB 108). The SEC believesaccordance with that a registrant should quantify a current year misstatement using both the iron curtain approach and the rollover approach. If the over/understatement of current year expense is material to the current year, after all of the relevant quantitative and qualitative factors are considered, the prior year financial statements should be corrected. Correcting prior year financial statements for immaterial errors wouldparagraph.” FSP FIN 39-1 did not require previously filed reports to be amended. We have evaluated our accounts and determined that SAB 108 does not impact our reported results.
Accounting for Planned Major Maintenance Activity
In September 2006, the FASB posted Financial Statement of Position AUG AIR-1 — “Accounting for Planned Major Maintenance Activity” (FSP AUG AIR-1). Previous guidance for planned major maintenance, such as repairing or replacing a boiler, allowed four different methods for accruing for these major repairs. These included direct expense, built-in overhaul, deferral and accrue-in-advance. The FASB has decided that the accrue-in-advance method is no longer valid because it allows a liability to accrue for future charges that may or may not happen. We use the direct expense method for major planned maintenance which calls for expensing the charges as incurred. Since we do not use the accrue-in-advance method, this FSP will have noan effect on our overall results of operations, financial position or cash flows.
66
Accounting for Income Tax Benefits of Dividends on Share-Based Payment Awards
We adopted EITF Issue No. 06-11, “Accounting for Income Tax Benefits of Dividends on Share-Based Payment Awards” (EITF 06-11), on January 1, 2008. The FASB ratified the EITF consensus that a realized income tax benefit from dividends that are charged to retained earnings, and are paid to employees for equity classified non-vested equity shares, should be recognized as an increase in additional paid-in-capital and should be included in the pool of excess tax benefits available to absorb potential future tax deficiencies on share-based payment awards. EITF 06-11 did not have a material effect on our overall results of operations, financial position or cash flows.
Determining Fair Value in an Inactive Market
We adopted FASB Staff Position SFAS 157-3, “Determining the Fair Value of a Financial Asset when the Market for That Asset is not Active” (FSP SFAS 157-3), on its issuance date of October 10, 2008. FSP SFAS 157-3 clarifies the application of SFAS 157 in a market that is not active and provides an example to illustrate key points. FSP SFAS 157-3 did not have a material impact on our overall results of operations, financial position or cash flows.
Recently Issued Accounting Standards
Disclosures about Derivative Instruments and Hedging Activities
In March 2008, the FASB issued Statement of Financial Accounting Standards No. 161, “Disclosures about Derivative Instruments and Hedging Activities — an amendment to FASB Statement No. 133” (SFAS 161), effective for fiscal years beginning after November 15, 2008. We will adopt SFAS 161 on January 1, 2009. SFAS 161 requires an entity to provide enhanced disclosures about: (a) how and why an entity uses derivative instruments; (b) how derivative instruments and related hedged items are accounted for under SFAS 133 and its related interpretations; and (c) how derivative instruments and related hedged items affect an entity’s financial position, financial performance and cash flows. We have evaluated the impact of adopting SFAS 161 and do not expect these new rules to have a material impact on our overall results of operations, financial position or cash flows.
77
Table of Contents
Participating Securities and Earnings per Share (EPS)
In June 2008, the FASB issued Staff Position EITF 03-6-1, “Determining Whether Instruments Granted in Share-Based Payment Transactions Are Participating Securities” (FSP EITF 03-6-1), effective for fiscal years beginning after December 15, 2008. We will adopt FSP EITF 03-6-1 on January 1, 2009. FSP EITF 03-6-1 clarifies that unvested share-based awards that contain non-forfeitable rights to dividends or dividend equivalents (whether paid or unpaid) are participating securities and must be included in the computation of EPS pursuant to the two-class method. We have evaluated the impact of adopting FSP EITF 03-6-1 and do not expect these new rules to have a material impact on our overall results of operations, financial position or cash flows.
Meaning of “Indexed to a Company’s Own Stock”
In June 2008, the FASB approved the consensus of the Emerging Issues Task Force (EITF) on “Determining Whether an Instrument (or Embedded Feature) is Indexed to an Entity’s Own Stock” (EITF 07-5), effective for fiscal years beginning after December 15, 2008. We will adopt EITF 07-5 on January 1, 2009. EITF 07-5 gives guidance on when a financial instrument is considered to be indexed to a company’s own stock to meet the criteria for paragraph 11(a) of FASB Statement No. 133, “Accounting for Derivative Financial Instruments.” We have evaluated the impact of adopting EITF 07-5 and do not expect these new rules to have a material impact on our overall results of operations, financial position or cash flows.
Disclosures about Pensions and Other Postretirement Benefits
In December 2008, the FASB issued Staff Position SFAS 132(R)-1, “Employers’ Disclosures about Postretirement Benefit Plan Assets” [FSP SFAS 132(R)-1], effective for fiscal years ending after December 15, 2009. FSP SFAS 132(R)-1 requires disclosures about benefit plan assets similar to the disclosure required in SFAS 157, “Fair Value Measurements.” It also requires discussions on investment allocation decisions, major categories of plan assets, and significant concentrations of risk in plan assets for the period. We are currently evaluating FSP SFAS 132(R)-1 and do not expect these new rules to have a material impact on our overall results of operations, financial position or cash flows.
78
Table of Contents
2. Supplemental Financial Information
DPL Inc.
| | At December 31, | | | At December 31, | |
$ in millions | | 2006 | | 2005 | | | 2008 | | 2007 | |
| | | | | | | | | | |
Accounts receivable, net: | | | | | | | | | | |
Unbilled revenue | | $ | 68.7 | | $ | 63.6 | | | $ | 82.5 | | $ | 68.4 | |
Retail customers | | 65.0 | | 60.8 | | | 70.8 | | 71.7 | |
Partners in commonly-owned plants | | 51.5 | | 37.7 | | | 28.0 | | 56.7 | |
PJM including financial transmission rights | | | 27.0 | | 23.2 | |
Coal sales | | | 25.6 | | 1.9 | |
Refundable taxes | | | 14.9 | | 5.2 | |
Wholesale and subsidiary customers | | 15.8 | | 6.0 | | | 9.7 | | 12.7 | |
PJM including financial transmission rights | | 13.1 | | 11.0 | | |
Other | | 7.1 | | 2.5 | | | 2.5 | | 2.9 | |
Refundable franchise tax | | 5.2 | | 14.3 | | |
Provision for uncollectible accounts | | (1.4 | ) | (1.0 | ) | | (1.1 | ) | (1.5 | ) |
Total accounts receivable, net | | $ | 225.0 | | $ | 194.9 | | | $ | 259.9 | | $ | 241.2 | |
| | | | | | | | | | |
Inventories, at average cost: | | | | | | | | | | |
Fuel and emission allowances | | $ | 52.4 | | $ | 48.6 | | | $ | 68.7 | | $ | 70.5 | |
Plant materials and supplies | | 32.6 | | 31.4 | | | 36.3 | | 34.1 | |
Other | | 0.4 | | 0.2 | | | 0.1 | | 0.4 | |
Total inventories, at average cost | | $ | 85.4 | | $ | 80.2 | | | $ | 105.1 | | $ | 105.0 | |
| | | | | | | | | | |
Other current assets: | | | | | | | | | | |
Deposits and other advances | | $ | 17.8 | | $ | 9.2 | | | $ | 10.5 | | $ | 1.1 | |
Prepayments | | 13.3 | | 5.1 | | | 7.1 | | 5.9 | |
Derivatives | | 3.2 | | — | | |
Short-term investments | | | 5.0 | | — | |
Current deferred income taxes | | 2.0 | | 5.4 | | | 2.2 | | 2.1 | |
Other | | 1.4 | | 0.5 | | | 2.2 | | 2.7 | |
Total other current assets | | $ | 37.7 | | $ | 20.2 | | | $ | 27.0 | | $ | 11.8 | |
| | | | | | | | | | |
Property, plant and equipment: | | | | | | | | | | |
Construction work in process | | $ | 376.0 | | $ | 168.0 | | | $ | 153.6 | | $ | 364.5 | |
Property, plant and equipment | | 4,626.0 | | 4,499.7 | | | 5,073.4 | | 4,647.1 | |
Total property, plant and equipment (a) | | $ | 5,002.0 | | $ | 4,667.7 | | |
Total property, plant and equipment | | | $ | 5,227.0 | | $ | 5,011.6 | |
| | | | | | | | | | |
Other deferred assets: | | | | | | | | | | |
Master Trust assets | | $ | 39.4 | | $ | 32.0 | | | $ | 13.3 | | $ | 9.6 | |
Unamortized loss on reacquired debt | | 20.4 | | 22.0 | | |
Unamortized debt expense | | 10.6 | | 10.2 | | | 9.3 | | 10.9 | |
Investments | | | 8.0 | | 8.8 | |
Commercial activities tax benefit | | 6.8 | | — | | | 6.8 | | 6.8 | |
Investments | | 7.0 | | 7.2 | | |
Prepaid pension | | | — | | 9.9 | |
Other | | 0.5 | | 0.8 | | | 0.6 | | 0.5 | |
Total other deferred assets | | $ | 84.7 | | $ | 72.2 | | | $ | 38.0 | | $ | 46.5 | |
| | | | | | | | | | |
Accounts Payable: | | | | | | |
Accounts payable: | | | | | | |
Trade payables | | $ | 75.7 | | $ | 26.1 | | | $ | 68.7 | | $ | 65.6 | |
Fuel accruals | | 37.3 | | 39.5 | | | 51.9 | | 34.4 | |
Other | | 56.4 | | 64.6 | | | 57.7 | | 63.1 | |
Total accounts payable | | $ | 169.4 | | $ | 130.2 | | | $ | 178.3 | | $ | 163.1 | |
| | | | | | | | | | |
Other current liabilities: | | | | | | | | | | |
Customer security deposits | | $ | 19.4 | | $ | 19.2 | | | $ | 19.8 | | $ | 19.2 | |
Low income service plan | | | 2.4 | | 2.2 | |
Pension and retiree benefits payable | | 5.8 | | — | | | 0.8 | | 0.8 | |
Financial transmission rights — future proceeds | | 2.7 | | — | | |
Payroll taxes payable | | 0.1 | | 2.3 | | |
Other | | 10.3 | | 9.6 | | | 11.5 | | 5.0 | |
Total other current liabilities | | $ | 38.3 | | $ | 31.1 | | | $ | 34.5 | | $ | 27.2 | |
| | | | | | | | | | |
Other deferred credits: | | | | | | | | | | |
Asset retirement obligations — regulated property | | $ | 86.3 | | $ | 81.7 | | |
Trust obligations | | 76.2 | | 74.5 | | |
Pension liabilities | | 37.7 | | 23.7 | | |
Retiree health and life benefits | | 28.5 | | 32.9 | | |
Pension and retiree benefits | | | $ | 100.5 | | $ | 40.6 | |
Asset retirement obligations - regulated property | | | 96.0 | | 91.5 | |
SECA net revenue subject to refund | | 18.7 | | 20.5 | | | 20.1 | | 20.1 | |
Asset retirement obligations — generation property | | 11.7 | | 13.2 | | |
Deferred gain on sale of portfolio | | 8.2 | | 27.1 | | |
Legal reserves | | 3.4 | | 3.0 | | |
Deferred compensation obligations | | | 14.0 | | 20.4 | |
Asset retirement obligations - generation property | | | 13.2 | | 12.5 | |
Taxes payable | | | 9.8 | | 65.3 | |
Litigation and claims reserve | | | 2.1 | | 4.3 | |
Employee benefit reserves | | | 4.4 | | 4.3 | |
Customer advances in aid of construction | | | 3.4 | | 3.5 | |
Environmental reserves | | 0.1 | | 0.1 | | | — | | 0.1 | |
Other | | 9.9 | | 9.6 | | | 3.8 | | 3.7 | |
Total other deferred credits | | $ | 280.7 | | $ | 286.3 | | | $ | 267.3 | | $ | 266.3 | |
79
(a) $283.5Table of the assets presented in this table are held for sale.Contents
DP&L
| | At December 31, | |
$ in millions | | 2006 | | 2005 | |
| | | | | |
Accounts receivable, net: | | | | | |
Retail customers | | $ | 65.0 | | $ | 60.7 | |
Partners in commonly-owned plants | | 51.5 | | 37.7 | |
Unbilled revenue | | 61.0 | | 57.5 | |
PJM including financial transmission rights | | 13.9 | | 11.0 | |
Wholesale and subsidiary customers | | 8.3 | | 2.7 | |
Refundable franchise tax | | 3.1 | | 11.8 | |
Other | | 4.2 | | 2.3 | |
Provision for uncollectible accounts | | (1.4 | ) | (1.0 | ) |
Total accounts receivable, net | | $ | 205.6 | | $ | 182.7 | |
| | | | | |
Inventories, at average cost: | | | | | |
Fuel and emission allowances | | $ | 52.4 | | $ | 48.6 | |
Plant materials and supplies | | 30.2 | | 29.0 | |
Other | | 0.4 | | 0.1 | |
Total inventories, at average cost | | $ | 83.0 | | $ | 77.7 | |
| | | | | |
Other current assets: | | | | | |
Deposits and other advances | | $ | 17.0 | | $ | 5.8 | |
Prepayments | | 15.8 | | 7.7 | |
Derivatives | | 3.2 | | — | |
Current deferred income taxes | | 0.7 | | 4.9 | |
Other | | 1.5 | | 0.9 | |
Total other current assets | | $ | 38.2 | | $ | 19.3 | |
| | | | | |
Property, plant and equipment: | | | | | |
Construction work in process | | $ | 375.2 | | $ | 165.1 | |
Property, plant and equipent | | 4,075.4 | | 3,952.9 | |
Total property, plant and equipment | | $ | 4,450.6 | | $ | 4,118.0 | |
| | | | | |
Other deferred assets: | | | | | |
Master Trust assets | | $ | 109.0 | | $ | 107.7 | |
Unamortized loss on reacquired debt | | 20.4 | | 22.0 | |
Unamortized debt expense | | 8.6 | | 7.4 | |
Investments | | 0.6 | | 0.6 | |
Other | | 0.5 | | 0.6 | |
Total other deferred assets | | $ | 139.1 | | $ | 138.3 | |
| | | | | |
Accounts Payable: | | | | | |
Trade payables | | $ | 74.7 | | $ | 25.6 | |
Fuel accruals | | 36.7 | | 38.1 | |
Other | | 54.8 | | 52.5 | |
Total accounts payable | | $ | 166.2 | | $ | 116.2 | |
| | | | | |
Other current liabilities: | | | | | |
Customer security deposits | | $ | 19.4 | | $ | 19.2 | |
Financial transmission rights — future proceeds | | 2.7 | | — | |
Current portion long-term debt | | 0.9 | | 0.9 | |
Payroll taxes payable | | 0.2 | | 2.3 | |
Pension and retiree benefits payable | | 5.8 | | — | |
Other | | 7.3 | | 6.0 | |
Total other current liabilities | | $ | 36.3 | | $ | 28.4 | |
| | | | | |
Other deferred credits: | | | | | |
Asset retirement obligations — regulated property | | $ | 86.3 | | $ | 81.7 | |
Trust obligations | | 76.2 | | 74.5 | |
Retiree health and life benefits | | 28.5 | | 32.9 | |
Pension liabilities | | 37.7 | | 23.7 | |
SECA net revenue subject to refund | | 18.7 | | 20.5 | |
Asset retirement obligations — generation property | | 11.7 | | 13.2 | |
Legal reserves | | 3.4 | | 3.0 | |
Environmental reserves | | 0.1 | | 0.1 | |
Other | | 9.9 | | 9.1 | |
Total other deferred credits | | $ | 272.5 | | $ | 258.7 | |
| | At December 31, | |
$ in millions | | 2008 | | 2007 | |
| | | | | |
Accounts receivable, net: | | | | | |
Unbilled revenue | | $ | 74.7 | | $ | 60.5 | |
Retail customers | | 70.8 | | 71.7 | |
Partners in commonly-owned plants | | 28.0 | | 56.7 | |
Coal sales | | 25.6 | | 1.9 | |
PJM including financial transmission rights | | 23.3 | | 23.1 | |
Wholesale and subsidiary customers | | 2.6 | | 3.5 | |
Refundable franchise tax | | — | | 3.1 | |
Other | | 1.5 | | 2.8 | |
Provision for uncollectible accounts | | (1.1 | ) | (1.5 | ) |
Total accounts receivable, net | | $ | 225.4 | | $ | 221.8 | |
| | | | | |
Inventories, at average cost: | | | | | |
Fuel and emission allowances | | $ | 68.7 | | $ | 70.5 | |
Plant materials and supplies | | 35.0 | | 32.7 | |
Other | | 0.1 | | 0.4 | |
Total inventories, at average cost | | $ | 103.8 | | $ | 103.6 | |
| | | | | |
Other current assets: | | | | | |
Deposits and other advances | | $ | 10.5 | | $ | 0.9 | |
Prepayments | | 8.9 | | 7.5 | |
Current deferred income taxes | | 2.3 | | 2.1 | |
Other | | 2.4 | | 2.9 | |
Total other current assets | | $ | 24.1 | | $ | 13.4 | |
| | | | | |
Property, plant and equipment: | | | | | |
Construction work in process | | $ | 153.0 | | $ | 363.8 | |
Property, plant and equipent | | 4,817.9 | | 4,393.2 | |
Total property, plant and equipment | | $ | 4,970.9 | | $ | 4,757.0 | |
| | | | | |
Other deferred assets: | | | | | |
Master Trust assets | | $ | 40.4 | | $ | 56.0 | |
Unamortized debt expense | | 8.6 | | 9.6 | |
Prepaid pension | | — | | 9.9 | |
Other | | 1.2 | | 1.1 | |
Total other deferred assets | | $ | 50.2 | | $ | 76.6 | |
| | | | | |
Accounts payable: | | | | | |
Trade payables | | $ | 68.6 | | $ | 64.8 | |
Fuel accruals | | 50.4 | | 34.1 | |
Other | | 57.6 | | 63.0 | |
Total accounts payable | | $ | 176.6 | | $ | 161.9 | |
| | | | | |
Other current liabilities: | | | | | |
Customer security deposits | | $ | 19.8 | | $ | 19.2 | |
Low income service plan | | 2.4 | | 2.2 | |
Pension and retiree benefits payable | | 0.8 | | 0.8 | |
Other | | 11.0 | | 4.7 | |
Total other current liabilities | | $ | 34.0 | | $ | 26.9 | |
| | | | | |
Other deferred credits: | | | | | |
Pension and retiree benefits | | $ | 100.5 | | $ | 40.5 | |
Asset retirement obligations - regulated property | | 96.0 | | 91.5 | |
SECA net revenue subject to refund | | 20.1 | | 20.1 | |
Deferred compensation obligations | | 14.0 | | 20.4 | |
Asset retirement obligations - generation property | | 13.2 | | 12.5 | |
Taxes payable | | 9.8 | | 65.3 | |
Employee benefit reserves | | 4.4 | | 4.3 | |
Litigation and claims reserve | | 2.1 | | 4.3 | |
Customer advances in aid of construction | | 3.4 | | 3.5 | |
Other | | 3.9 | | 3.8 | |
Total other deferred credits | | $ | 267.4 | | $ | 266.2 | |
80
DPL Inc.Table of Contents
| | For the years ended | |
$ in millions | | 2006 | | 2005 | |
| | | | | |
Cash flows - Other: | | | | | |
Payroll taxes payable | | $ | (2.1 | ) | $ | 2.3 | |
Deferred management fees | | — | | 7.9 | |
Deposits and other advances | | (8.5 | ) | (0.9 | ) |
Deferred storm costs | | (0.1 | ) | (5.5 | ) |
FERC transitional payment deferral | | (1.8 | ) | 20.5 | |
Other | | 2.0 | | 7.5 | |
Total cash flows - Other | | $ | (10.5 | ) | $ | 31.8 | |
DP&L
| | For the years ended | |
$ in millions | | 2006 | | 2005 | |
| | | | | |
Cash flows - other: | | | | | |
Payroll taxes payable | | $ | (2.1 | ) | $ | 2.3 | |
Deposits and other advances | | (11.0 | ) | (2.1 | ) |
Deferred storm costs | | (0.1 | ) | (5.5 | ) |
FERC transitional payment deferral | | (1.8 | ) | 20.5 | |
Other | | (2.5 | ) | (1.8 | ) |
Total cash flows - other | | $ | (17.5 | ) | $ | 13.4 | |
3. Regulatory Matters
We apply the provisions of SFAS 71 to our regulated operations. This accounting standard defines regulatory assets as the deferral of costs expected to be recovered in future customer rates and regulatory liabilities as current cost recovery of expected future expenditures.
Regulatory liabilities are reflected on the Consolidated Balance Sheetsconsolidated balance sheets under the caption entitled “Other Deferred Credits”. Regulatory assets and liabilities on the Consolidated Balance Sheetsconsolidated balance sheets include:
| | Type of | | Amortization | | At December 31, | |
$ in millions | | Recovery (a) | | Through | | 2006 | | 2005 | |
Regulatory Assets: | | | | | | | | | |
Deferred recoverable income taxes | | C/B | | Ongoing | | $ | 53.1 | | $ | 28.8 | |
Pension and postretirement benefits | | C | | Ongoing | | 47.1 | | — | |
Electric Choice systems costs | | F | | 2010 | | 13.5 | | 16.7 | |
Regional transmission organization costs | | C | | 2014 | | 11.4 | | 12.9 | |
Deferred storm costs | | C | | 2008 | | 5.4 | | 6.5 | |
PJM administrative costs | | F | | 2009 | | 4.6 | | 5.6 | |
Power plant emission fees | | C | | Ongoing | | 4.5 | | 3.8 | |
Rate case expenses | | F | | 2010 | | 3.5 | | 3.5 | |
Retail settlement system costs | | | | | | 3.1 | | 3.1 | |
PJM integration costs | | F | | 2015 | | 1.4 | | 1.9 | |
Other costs | | | | | | 1.0 | | 1.0 | |
Total regulatory assets | | | | | | $ | 148.6 | | $ | 83.8 | |
| | | | | | | | | |
Regulatory Liabilities: | | | | | | | | | |
Asset retirement obligations - regulated property | | | | | | $ | 86.3 | | $ | 81.7 | |
Postretirement benefits | | | | | | 7.6 | | — | |
SECA net revenue subject to refund | | | | | | 18.7 | | 20.5 | |
Total regulatory liabilities | | | | | | $ | 112.6 | | $ | 102.2 | |
| | Type of | | Amortization | | At December 31, | |
$ in millions | | Recovery (a) | | Through | | 2008 | | 2007 | |
Regulatory Assets: | | | | | | | | | |
Deferred recoverable income taxes | | C/B | | Ongoing | | $ | 81.2 | | $ | 65.8 | |
Pension and postretirement benefits | | C | | Ongoing | | 83.3 | | 41.5 | |
Unamortized loss on reacquired debt | | C | | Ongoing | | 17.2 | | 18.8 | |
Electric Choice systems costs | | F | | 2010 | | 7.1 | | 10.2 | |
Regional transmission organization costs | | C | | 2014 | | 8.5 | | 9.9 | |
Deferred storm costs - 2004/2005 | | F | | 2008 | | — | | 1.9 | |
Deferred storm costs - 2008 | | D | | | | 13.1 | | — | |
PJM administrative costs | | F | | 2009 | | 0.5 | | 3.0 | |
Power plant emission fees | | C | | Ongoing | | 6.3 | | 4.7 | |
Rate case expenses | | F | | 2010 | | 0.5 | | 0.8 | |
Settlement system costs | | D | | | | 3.1 | | 3.1 | |
Customer conservation and energy management costs | | D | | | | 8.3 | | 1.3 | |
PJM integration costs | | F | | 2015 | | 0.7 | | 1.1 | |
Other costs | | | | | | 3.9 | | 3.1 | |
Total regulatory assets | | | | | | $ | 233.7 | | $ | 165.2 | |
| | | | | | | | | |
Regulatory Liabilities: | | | | | | | | | |
Asset retirement obligations - regulated property | | | | | | $ | 96.0 | | $ | 91.5 | |
Postretirement benefits | | | | | | 5.8 | | 6.8 | |
SECA net revenue subject to refund | | | | | | 20.1 | | 20.1 | |
Total regulatory liabilities | | | | | | $ | 121.9 | | $ | 118.4 | |
(a)
| F –(a)F — Recovery of incurred costs plus rate of return. C — Recovery of incurred costs only. B — Balance has an offsetting liability resulting in no impact on rate base. D — Recovery not yet determined.
|
| C – Recovery of incurred costs only.
|
| B – Balance has an offsetting liability resulting in no impact on rate base.
|
Regulatory Assets
We evaluate our regulatory assets each period and believe recovery of these assets is probable. We have received or requested a return on certain regulatory assets for which we are currently recovering or seeking recovery through rates.
Deferred recoverable income taxes represent deferred income tax assets recognized from the normalization of flow-through items as the result of amounts previously provided to customers. Since currently existing temporary differences between the financial statements and the related tax basis of assets will reverse in subsequent periods, deferred recoverable income taxes are amortized.
Pension and postretirement benefits represent the unfunded benefit obligation related to the transmission and distribution areas of our electric business. We have historically recorded these costs on the accrual basis and this is how these costs have been historically recovered through rates. This factor, combined with the historical precedents from the PUCO and the FERC, makemakes these costs probable of future rate recovery.
Unamortized loss on reacquired debt represents costs associated with the redemption of a series of bonds financed by another issue. These costs are being amortized over the life of the original issue.
Electric Choice systems costs represent costs incurred to modify the customer billing system for unbundled rates and electric choice bills relative to other generation suppliers and information reports provided to the state administrator of the low-income electric program. In February 2005, the PUCO approved a stipulation allowing us to recover certain costs incurred for modifications to its billing system from all customers in its service territory. We filed a subsequent case to implement the PUCO’s order to begin charging customers for billing costs. On March 1, 2006, the PUCO issued an order that approved our tariff as filed. We began collecting this rider immediately, and expect to recover all costs over five years.
81
Table of Contents
Regional transmission organization costs represent costs incurred to join a Regional Transmission Organization (RTO) that controls the receiptsreceipt and delivery of bulk power within the service area. These costs are being amortized over a 10-year period that commenced in October 2004.
69
Deferred storm costs in 2007 include costs incurred by us to repair damage from December 2004 and January 2005 ice storms. We filedThese costs were fully recovered by July 2008. The costs recorded in 2008 relate to recoverthe reparation of damage caused by hurricane force winds in September 2008, as well as other major 2008 storms. On January 14, 2009, the PUCO granted DP&L the authority to defer these costs from retail ratepayers overwith a two year period. On July 12, 2006, the PUCO approved our tariff as proposed and we began recoveringreturn until such time that DP&L seeks recovery in a future rate proceeding. We have yet to file for recovery of these deferred costs over a two-year period beginning August 1, 2006.2008 costs.
PJM Interconnection, LLC (PJM) administrative costs contain the administrative fees billed by PJM to us as a member of the PJM Interconnection, LLC Regional Transmission Organization (RTO).RTO. Pursuant to a PUCO order issued on January 25, 2006, these deferred costs will be recovered over a 3-year period from retail ratepayers beginning February 2006.
Power plant emission fees represent costs paid to the State of Ohio for environmental monitoring that are or will be recovered over various periods under a PUCO rate rider from customers.
Retail settlementSettlement system costs represent costs to implement a retail settlement system that reconciles the amount of energy a competitive retail electric service (CRES) supplier delivers to its customers and what its customers actually use. Based on case precedent in other utilities’ cases, the cost of this system is recoverable through DP&L’s next transmission rate case that will be filed at the FERC. The timing of this case is uncertain at this time.
PJM integration costs include infrastructure costs and other related expenses incurred by PJM and reimbursed by DP&L to integrate us into the RTO. Pursuant to a FERC order, the costs are being recovered over a 10-year period beginning May 2005 from wholesale customers within PJM.
Rate case expenses represent costs incurred in connection with the Rate Stabilization Surcharge that was approved by the PUCO and implemented in January 2006. These costs are being amortized over a five-year period.
PJM transmission expansion costs represent costs incurred as a result of PJM Regional Transmission Expansion Plan (RTEP) cost assignments. On December 21, 2007, DP&L filed seeking PUCO authority to defer these costs for future recovery and was granted that authority by the PUCO on August 8, 2008. These costs are included within Other costs.
Customer conservation and energy management costs represent costs incurred as a result of studying and developing distribution system upgrades and implementation of advanced metering infrastructure, as well as DSM program development and various new customer programs. The portion of these costs related to energy efficiency will be recovered as part of the Stipulation Agreement beginning in 2009. DP&L intends to file a request for the recovery of the remaining costs related to the advanced metering and smart grid portions of the case later in 2009.
Other costs include consumer education advertising regarding electric deregulation and costs pertaining to a recent rate case and are, or will be, recovered over various periods.
Regulatory Liabilities
Asset retirement obligations —- regulated property reflect an estimate of amounts recovered in rates that are expected to be expended to remove existing transmission and distribution property from service upon retirement.
Postretirement benefitsreflect a regulatory liability that was recorded for the portion of the unrealized gain on our postretirement trust assets related to the transmission and distribution areas of our electric business. The company hasWe have historically recorded these transactions on the accrual basis and this is how these costs have historically been recovered through rates. This factor, combined with the historical precedents from the PUCO and the FERC, make it probable that these amounts will be reflected in future rates.
SECA (Seams Elimination Charge Adjustment) net revenue subject to refund represents our estimatedeferral of probable refunds for net revenuerevenues collected in 2005 and 2006. SECA revenue and expenses represent FERC-ordered transitional payments for the use of transmission lines within PJM. A hearing was held in early 2006 to determine if these transitional payments are subject to refund, but no ruling has been issued. We began receiving and paying these transitional payments in May 2005.
82
Table of Contents
4. Ownership of Facilities
We and other Ohio utilities have undivided ownership interests in seven electric generating facilities and numerous transmission facilities. Certain expenses, primarily fuel costs for the generating units, are allocated to the owners based on their energy usage. The remaining expenses (as well as investments in fuel inventory, plant materials and operating supplies) and capital additions are allocated to the owners in accordance with their respective ownership interests. As of December 31, 2008, we had $109.0 million of construction work in progress at such facilities. Our share of the operating cost of such facilities is included in the consolidated statement of results of operations and our share of the investment in the facilities is included in the consolidated balance sheets.
Our undivided ownership interest in such facilities at December 31, 2008, is as follows:
| | DP&L Share | | DP&L Investment | |
| | Ownership (%) | | Production
Capacity (MW) | | Gross Plant
In Service
($ in millions) | | Accumulated
Depreciation
($ in millions) | | Construction
Work in Progress
($ in millions) | |
Production Units: | | | | | | | | | | | |
Beckjord Unit 6 | | 50.0 | | 210 | | $ | 77 | | $ | 54 | | $ | 1 | |
Conesville Unit 4 | | 16.5 | | 129 | | 37 | | 28 | | 68 | |
East Bend Station | | 31.0 | | 186 | | 197 | | 127 | | 1 | |
Killen Station | | 67.0 | | 402 | | 604 | | 264 | | 2 | |
Miami Fort Units 7&8 | | 36.0 | | 368 | | 347 | | 115 | | 6 | |
Stuart Station | | 35.0 | | 820 | | 661 | | 225 | | 25 | |
Zimmer Station | | 28.1 | | 365 | | 1,056 | | 585 | | 6 | |
Transmission (at varying percentages) | | | | | | 90 | | 52 | | — | |
Total | | | | 2,480 | | $ | 3,069 | | $ | 1,450 | | $ | 109 | |
DPL’s share of operating costs associated with the jointly-owned generating facilities are included within the corresponding line in consolidated statements of results of operations.
5. Assets Sales
Peaker Sales
During 2006, in connection with DPLE’s (wholly-owned subsidiary of DPL) decision to sell the Greenville Station and Darby Station electric peaking generation facilities, DPL concluded that the related assets were impaired. Greenville Station consisted of four natural gas peaking units with a net book value of approximately $66 million. Darby Station consisted of six natural gas peaking units with a net book value of approximately $156 million. During the fourth quarter of 2006, DPL recorded a $71.0 million impairment charge to write-down the assets to their fair value. The Greenville Station and Darby Station assets were sold by DPLE in April 2007 for $49.2 million and $102.0 million, respectively, in two separate transactions.
Aircraft Sale
On June 7, 2007, Miami Valley CTC, Inc. (indirect, wholly-owned subsidiary of DPL), sold its corporate aircraft and associated inventory and parts for $7.4 million. The net book value of the assets sold was approximately $1.0 million, and severance and other costs of approximately $0.4 million were accrued. Miami Valley CTC, Inc. recorded a net gain on the sale of approximately $6.0 million during the second quarter ending June 30, 2007, which is included in DPL’s operation and maintenance expense.
83
Table of Contents
6. Discontinued Operations
On February 13, 2005, DPL’s subsidiaries, MVE, Inc. (MVE) and MVIC, entered into an agreement to sell their respective interests in forty-six private equity funds to AlpInvest/Lexington 2005, LLC, a joint venture of AlpInvest Partners and Lexington Partners, Inc. During 2005, MVE and MVIC completed the sale of their interests in forty-three funds and a portion of another of those private equity funds. During 2005, MVE entered into alternative closing arrangements with AlpInvest/Lexington 2005, LLC for funds where legal title to said funds could not be transferred until a later time. Pursuant to these arrangements, MVE transferred the economic aspects of the remaining private equity funds, consisting of two funds and a portion of one fund, to AlpInvest/Lexington 2005, LLC without a change in ownership of the interests. The ownership interest in these funds was transferred in 2006 and 2007, at which time DPL recognized previously deferred gains. DPL recognized $18.9 million of these previously deferred gains in 2006 and the remaining balance of these gains in the amount of $7.9 million, net of associated expenses ($4.9 million after tax), were recognized in 2007. This transaction was recorded in discontinued operations for each period presented.
As a result of the May 21, 2007 settlement of the litigation with three former executives (see Note 15 of Notes to Consolidated Financial Statements), the three former executives relinquished all of their rights to certain deferred compensation, restricted stock units, MVE incentives, stock options and reimbursement of legal fees. The reversal of accruals related to the performance of the financial asset portfolio was recorded in discontinued operations. Additionally, a portion of the $25 million settlement expense was allocated to discontinued operations. These transactions resulted in a net gain of $8.1 million, net of associated expenses ($5.1 million after tax), on the settlement of litigation being recorded in discontinued operations in 2007.
There were no discontinued operations recorded in 2008.
84
Table of Contents
7. Long-term Debt
DPL Inc.
| | At December 31, | |
$ in millions | | 2008 | | 2007 | |
DP&L - | First mortgage bonds maturing | | | | | |
| 2013 - 5.125% | | $ | 470.0 | | $ | 470.0 | |
DP&L - | Pollution control series maturing | | | | | |
| 2036 - 4.80% | | 100.0 | | 100.0 | |
DP&L - | Pollution control series maturing | | | | | |
| 2040 - variable rates: 3.85% - 7.81% (b) | | — | | 90.0 | |
DP&L - | Pollution control series maturing | | | | | |
| 2040 - variable rates: 0.80% - 1.25% (b) | | 100.0 | | — | |
DP&L - | Pollution control series maturing | | | | | |
| through 2034 - 4.78% (a) | | 214.4 | | 214.4 | |
| | 884.4 | | 874.4 | |
| | | | | |
DPL Inc. - Note to Capital Trust II 8.125% due 2031 | | 195.0 | | 195.0 | |
DPL Inc. - Senior Notes 6.875% Series due 2011 | | 297.4 | | 297.4 | |
DPL Inc. - Senior Notes 8.00% Series due 2009 | | — | | 175.0 | |
DP&L - Obligations for capital leases | | 0.6 | | 1.3 | |
Unamortized debt discount | | (1.3 | ) | (1.6 | ) |
Total | | $ | 1,376.1 | | $ | 1,541.5 | |
(a) Weighted average interest rate for 2008 and 2007.
(b) Range of interest rates for 2008 and 2007.
DP&L
| | At December 31, | |
$ in millions | | 2008 | | 2007 | |
DP&L - | First mortgage bonds maturing | | | | | |
| 2013 - 5.125% | | $ | 470.0 | | $ | 470.0 | |
DP&L - | Pollution control series maturing | | | | | |
| 2036 - 4.80% | | 100.0 | | 100.0 | |
DP&L - | Pollution control series maturing | | | | | |
| 2040 - variable rates: 3.85% - 7.81% (b) | | — | | 90.0 | |
DP&L - | Pollution control series maturing | | | | | |
| 2040 - variable rates: 0.80% - 1.25% (b) | | 100.0 | | — | |
DP&L - | Pollution control series maturing | | | | | |
| through 2034 - 4.78% (a) | | 214.4 | | 214.4 | |
| | 884.4 | | 874.4 | |
| | | | | |
DP&L - Obligations for capital leases | | 0.6 | | 1.3 | |
Unamortized debt discount | | (1.0 | ) | (1.1 | ) |
Total | | $ | 884.0 | | $ | 874.6 | |
(a) Weighted average interest rate for 2008 and 2007.
(b) Range of interest rates for 2008 and 2007.
85
Table of Contents
At December 31, 2008, DPL’s scheduled maturities of long-term debt, including capital lease obligations, over the next five years are $175.7 million in 2009, $0.6 million in 2010, $297.4 million in 2011, $0 in 2012, and $470.0 million in 2013.
At December 31, 2008, DP&L’s scheduled maturities of long-term debt, including capital lease obligations, over the next five years are $0.7 million in 2009, $0.6 million in 2010, $0 in 2011 and 2012, and $470 million in 2013. Substantially all property of DP&L is subject to the mortgage lien securing the first mortgage bonds.
On March 1, 2007, pursuant to the Company’s strategy of reducing its long-term debt, DPL redeemed $225 million of 8.25% Senior Notes when they became due. DPL also redeemed $100 million of 6.25% Senior Notes when they became due on May 15, 2008.
Debt and Debt Covenants
On March 25, 2004, DPL completed a $175 million private placement of unsecured 8.00% Series Senior Notes due March 2009. The purchasers were granted registration rights in connection with the private placement under an Exchange and Registration Rights Agreement. Pursuant to this agreement, DPL was obligated to file an exchange offer registration statement by July 22, 2004, have the registration statement declared effective by September 20, 2004 and consummate the exchange offer by October 20, 2004. DPL failed: (1) to have a registration statement declared effective; and (2) to complete the exchange offer according to this timeline. As a result, DPL had been accruing additional interest at a rate of 0.5% per year for each of these two violations, up to an additional interest rate not to exceed in the aggregate 1.0% per year. As each violation was cured, the additional interest rate decreased by 0.5% per annum. DPL’s exchange offer registration statement for these securities was declared effective by the U.S. Securities and Exchange Commission on June 27, 2006. As a result, on June 27, 2006, DPL ceased accruing 0.5% of the additional interest. On July 31, 2006, DPL ceased accruing the other 0.5% of additional interest when the exchange of registered notes for the unregistered notes was completed.
During the first quarter of 2006, the Ohio Department of Development (ODOD) awarded DP&L the ability to have issued, over the next three years, up to $200 million of qualified tax-exempt financing from the ODOD’s 2005 volume cap carryforward. The financing is to be used to partially fund the ongoing flue gas desulfurization capital projects. The PUCO approved DP&L’s application for this additional financing on July 26, 2006.
On November 21, 2006, DP&L entered into a $220 million unsecured revolving credit agreement replacing its $100 million facility. This agreement had a five-year term that expires on November 21, 2011 and that provides DP&L with the ability to increase the size of the facility by an additional $50 million at any time. The facility contains one financial covenant: DP&L’s total debt to total capitalization ratio is not to exceed 0.65 to 1.00. This covenant is currently met with a ratio of 0.39 to 1.00. DP&L had no outstanding borrowings under this credit facility at December 31, 2008. Fees associated with this credit facility are approximately $0.2 million per year. Changes in credit ratings, however, may affect fees and the applicable interest. This revolving credit agreement also contains a $50 million letter of credit sub-limit. DP&L has certain contractual agreements for the sale and purchase of power, fuel and related energy services that contain credit rating related clauses allowing the counter parties to seek additional surety under certain conditions. As of December 31, 2008, DP&L had no outstanding letters of credit against the facility.
During the second quarter ended June 30, 2007, DPL entered into a short-term loan to DP&L for $105 million. DP&L paid down $15 million of this loan during the third quarter ended September 30, 2007, an additional $70 million during the fourth quarter ended December 31, 2007, and the final $20 million during the first quarter ended March 31, 2008. This short-term loan does not affect our debt covenants. There are no other inter-company debt collateralizations or debt guarantees between DPL, DP&L and their subsidiaries. None of the debt obligations of DPL or DP&L are guaranteed or secured by affiliates and no cross-collateralization exists between any subsidiaries.
86
Table of Contents
On November 15, 2007, The Ohio Air Quality Development Authority (OAQDA) issued $90 million of collateralized, variable rate OAQDA Revenue Bonds, 2007 Series A due November 1, 2040. In turn, DP&L borrowed these funds from the OAQDA. The payment of principal and interest on the bonds when due was insured by an insurance policy issued by Financial Guaranty Insurance Company (FGIC). During the first quarter of 2008, all three credit rating agencies downgraded FGIC. These downgrades, as well as the downgrades of our major bond insurers, resulted in auction rate security bonds carrying substantially higher interest rates in succeeding auctions and incurring failed auctions. On April 4, 2008, DP&L converted the 2007 Series A Bonds from Auction Rate Securities to Variable Rate Demand Notes. At that time, DP&L purchased these notes out of the market and placed them with the Trustee to be held until the capital markets corrected. These notes were redeemed in December 2008 as discussed in the following paragraph.
On December 4, 2008, the OAQDA issued $100 million of collateralized, variable rate Revenue Refunding Bonds Series A and B due November 1, 2040. In turn, DP&L borrowed these funds from the OAQDA. The payment of principal and interest on the bonds when due is backed by a standby letter of credit issued by a syndicated bank group credit facility. DP&L is using $10 million of these bonds to finance its portion of the costs of acquiring, constructing and installing certain solid waste disposal and air quality facilities at the Conesville generation station. The remaining $90 million was used to redeem the 2007 Series A Bonds.
8. Income Taxes
On February 13, 2006, we received correspondence from the Ohio Department of Taxation (ODT) notifying us that ODT has completed their examination and review of our Ohio Corporation Franchise Tax Returns for tax years 2002 through 2004 and that the final proposed audit adjustments result in a balance due of $90.8 million before interest and penalties. On June 27, 2008, we entered into a $42.0 million settlement agreement with the ODT resolving all outstanding audit issues and appeals, including uncertain tax positions for tax years 1998 through 2006. The $42 million payment was made to the ODT in July 2008. Due to this settlement agreement, the balance of our unrecognized state tax liabilities recorded at December 31, 2007, in the amount of $56.3 million, was reversed resulting in a recorded income tax benefit of $8.5 million, net of federal tax impact, in 2008.
87
Table of Contents
For the years ended December 31, 2006, 20052008, 2007 and 2004,2006, DPL’s components of income tax were as follows:
DPL Inc.
| | For the years ended | | |
| | December 31, | | | For the years ended
December 31, | |
$ in millions | | 2006 | | 2005 | | 2004 | | | 2008 | | 2007 | | 2006 | |
Computation of Tax Expense | | | | | | | | | | | | | | |
Federal income tax (a) | | $ | 68.7 | | $ | 71.9 | | $ | 66.3 | | | $ | 121.9 | | $ | 117.3 | | $ | 68.7 | |
| | | | | | | | | | | | | | |
Increases (decreases) in tax resulting from — | | | | | | | | |
Increases (decreases) in tax resulting from - | | | | | | | | |
State income taxes, net of federal effect (b) | | (4.0 | ) | 1.2 | | 1.2 | | | 4.1 | | 11.6 | | (4.0 | ) |
Depreciation | | (3.1 | ) | (1.3 | ) | (4.0 | ) | | (4.3 | ) | (4.8 | ) | (3.1 | ) |
Investment tax credit amortized | | (2.9 | ) | (2.9 | ) | (2.9 | ) | | (2.8 | ) | (2.8 | ) | (2.9 | ) |
Non-deductible compensation | | 0.2 | | 0.2 | | — | | | — | | — | | 0.2 | |
Section 199 — domestic production deduction | | (0.8 | ) | (1.6 | ) | — | | |
Accrual for open tax years (c) | | 5.1 | | 11.2 | | 5.3 | | |
Other, net | | 6.6 | | 1.2 | | 0.6 | | |
Total tax expense (d) | | $ | 69.8 | | $ | 79.9 | | $ | 66.5 | | |
Section 199 - domestic production deduction | | | (4.2 | ) | (2.0 | ) | (0.8 | ) |
Accrual (settlement) for open tax years (c) | | | (7.2 | ) | 2.7 | | 5.1 | |
Other, net (d) | | | (4.6 | ) | 0.5 | | 6.6 | |
Total tax expense (e) | | | $ | 102.9 | | $ | 122.5 | | $ | 69.8 | |
| | | | | | | | | | | | | | |
Components of Tax Expense | | | | | | | | | | | | | | |
Taxes currently payable (b) | | $ | 109.3 | | $ | 85.0 | | $ | 44.3 | | | $ | 62.7 | | $ | 100.8 | | $ | 109.3 | |
Deferred taxes — | | | | | | | | |
Deferred taxes - | | | | | | | | |
Depreciation and amortization | | (37.9 | ) | (11.7 | ) | (3.3 | ) | | 12.9 | | 4.6 | | (37.9 | ) |
Shareholder litigation | | — | | — | | 23.2 | | |
Investment loss | | | — | | — | | 6.6 | |
Compensation | | | 2.7 | | 16.6 | | — | |
Employee benefits | | | — | | 6.3 | | (3.4 | ) |
Accrual for open tax years (f) | | | 21.5 | | — | | — | |
Other | | 1.3 | | 9.5 | | 5.2 | | | 5.9 | | (3.0 | ) | (1.9 | ) |
Deferred investment tax credit, net | | (2.9 | ) | (2.9 | ) | (2.9 | ) | | (2.8 | ) | (2.8 | ) | (2.9 | ) |
Total tax expense (d) | | $ | 69.8 | | $ | 79.9 | | $ | 66.5 | | |
Total tax expense (e) | | | $ | 102.9 | | $ | 122.5 | | $ | 69.8 | |
Components of Deferred Tax Assets and Liabilities
| | At December 31, | |
$ in millions | | 2006 | | 2005 | |
Net Non-Current Assets (Liabilities) | | | | | |
Depreciation/property basis | | $ | (380.3 | ) | $ | (402.2 | ) |
Income taxes recoverable | | (18.6 | ) | (10.1 | ) |
Regulatory assets | | (9.7 | ) | (9.4 | ) |
Investment tax credit | | 15.2 | | 16.3 | |
Investment loss | | 2.9 | | 9.6 | |
Compensation and employee benefits | | 39.2 | | 38.7 | |
Insurance | | 1.6 | | 1.8 | |
Other (e) | | (5.5 | ) | 28.3 | |
Net non-current (liabilities) | | $ | (355.2 | ) | $ | (327.0 | ) |
| | | | | |
Net Current Assets | | | | | |
Other | | $ | 2.0 | | $ | 5.4 | |
Net current assets | | $ | 2.0 | | $ | 5.4 | |
| | At December 31, | |
$ in millions | | 2008 | | 2007 | |
Net Non-Current Assets (Liabilities) | | | | | |
Depreciation/property basis | | $ | (416.7 | ) | $ | (395.2 | ) |
Income taxes recoverable | | (28.4 | ) | (23.0 | ) |
Regulatory assets | | (7.7 | ) | (9.6 | ) |
Investment tax credit | | 13.3 | | 14.3 | |
Investment loss | | 0.1 | | 0.1 | |
Compensation and employee benefits | | 12.7 | | 15.5 | |
Insurance | | 0.8 | | 1.1 | |
Other (g) | | (7.8 | ) | 21.9 | |
Net non-current (liabilities) | | $ | (433.7 | ) | $ | (374.9 | ) |
| | | | | |
Net Current Assets (h) | | | | | |
Other | | $ | 2.2 | | $ | 2.1 | |
Net current assets | | $ | 2.2 | | $ | 2.1 | |
(a) The statutory tax rate of 35% was applied to pre-tax income from continuing operations before preferred dividends.
|
(b) We have recorded $0.2 million, $0.5 million and $10.4 million, ($2.1) million and $11.7 million in 2008, 2007 and 2006, 2005 and 2004, respectively, for state tax credits available related to the consumption of coal mined in Ohio. In addition, ($0.5) million in 2008, $0.9 million in 2007 and $1.0 million in 2006 was recorded as a result of the phase out of the Ohio Franchise Tax. |
(c) We have recorded $5.1 million, $11.2 million and $5.3 million in 2006, 2005 and 2004, respectively, of tax provision for tax deduction or income positions taken in prior tax returns that we believe were properly treated on such tax returns but for which it is possible that these positions may be contested.
|
(d) Excludes ($2.1) million in 2005 of income taxed reported as cumulative effect of accounting change, net of income taxes. Also excludes $3.6 million in 2006, $19.9 million in 2005 and $59.1 million in 2004 of income taxes reported as discontinued operations.
|
(e) The Other non-current liabilities caption includes deferred tax assets related to state tax net operating loss carryforwards, net of related valuation allowances of $10.1 million in 2006 and $6.8 million in 2005. The majority of these net operating losses are Ohio franchise tax loss carryforwards that expire after the phase-out of the Ohio franchise tax is completed in 2008. Remaining Ohio franchise tax loss carryforwards after 2008 can be used to offset the Ohio Commercial Activity Tax liability and do not expire until after 2029.
|
(c) We have recorded ($40.7) million, $2.7 million and $5.1 million in 2008, 2007 and 2006, respectively, of tax provisions for tax deduction or income positions taken in prior tax returns that we believe were properly treated on such tax returns but for which it is possible that these positions may be contested. The 2008 amount relates to the ODT settlement discussed above.
(d) Includes ($3.8) million in 2008 and $5.0 million in 2006 of income tax expense related to adjustments from prior years.
(e) Excludes $6.0 million in 2007 and $3.6 million in 2006 of income taxes reported as discontinued operations.
(f) We recorded $21.5 million in 2008 related to federal tax impacts on the ODT settlement discussed above.
(g) The Other non-current liabilities caption includes deferred tax assets related to state tax net operating loss carryforwards, net of related valuation allowances of $10.7 million in 2008 and $12.4 million in 2007. As of December 31, 2008, all deferred tax assets related to net operating losses were either written off or valued at zero.
(h) Amounts are included within other current assets in the consolidated balance sheets.
88
Table of Contents
For the years ended December 31, 2006, 20052008, 2007 and 2004,2006, DP&L’s components of income tax were as follows:
DP&L
| | For the years ended | | |
| | December 31, | | | For the years ended
December 31, | |
$ in millions | | 2006 | | 2005 | | 2004 | | | 2008 | | 2007 | | 2006 | |
Computation of Tax Expense | | | | | | | | | | | | | | |
Federal income tax (a) | | $ | 134.6 | | $ | 123.6 | | $ | 115.4 | | | $ | 142.1 | | $ | 145.1 | | $ | 134.6 | |
| | | | | | | | | | | | | | |
Increases (decreases) in tax resulting from — | | | | | | | | |
Increases (decreases) in tax resulting from - | | | | | | | | |
State income taxes, net of federal effect (b) | | 2.4 | | 7.4 | | 7.0 | | | 2.6 | | 9.6 | | 2.4 | |
Depreciation | | (3.1 | ) | (1.3 | ) | (3.9 | ) | | (4.3 | ) | (4.7 | ) | (3.1 | ) |
Investment tax credit amortized | | (2.9 | ) | (2.9 | ) | (2.9 | ) | | (2.8 | ) | (2.8 | ) | (2.9 | ) |
Non-deductible compensation | | 0.1 | | 0.2 | | — | | | — | | — | | 0.1 | |
Section 199 — domestic production deduction | | (0.8 | ) | (1.6 | ) | — | | |
Accrual for open tax years (c) | | 5.1 | | 11.2 | | 5.3 | | |
Other, net | | 6.8 | | 1.5 | | (0.1 | ) | |
Total tax expense (d) | | $ | 142.2 | | $ | 138.1 | | $ | 120.8 | | |
Section 199 - domestic production deduction | | | (4.2 | ) | (2.0 | ) | (0.8 | ) |
Accrual (settlement) for open tax years (c) | | | (7.2 | ) | 2.7 | | 5.1 | |
Other, net (d) | | | (6.0 | ) | (4.8 | ) | 6.8 | |
Total tax expense | | | $ | 120.2 | | $ | 143.1 | | $ | 142.2 | |
| | | | | | | | | | | | | | |
Components of Tax Expense | | | | | | | | | | | | | | |
Taxes currently payable (b) | | $ | 158.5 | | $ | 149.4 | | $ | 136.8 | | | $ | 82.1 | | $ | 124.7 | | $ | 158.5 | |
Deferred taxes — | | | | | | | | |
Deferred taxes - | | | | | | | | |
Depreciation and amortization | | (17.1 | ) | (16.4 | ) | (10.0 | ) | | 11.3 | | 1.7 | | (17.1 | ) |
Compensation | | | 2.7 | | 19.5 | | — | |
Employee benefits | | | — | | 6.3 | | (3.4 | ) |
Accrual for open tax years (e) | | | 21.5 | | — | | — | |
Other | | 3.7 | | 8.0 | | (3.1 | ) | | 5.4 | | (6.3 | ) | 7.1 | |
Deferred investment tax credit, net | | (2.9 | ) | (2.9 | ) | (2.9 | ) | | (2.8 | ) | (2.8 | ) | (2.9 | ) |
Total tax expense (d) | | $ | 142.2 | | $ | 138.1 | | $ | 120.8 | | |
Total tax expense | | | $ | 120.2 | | $ | 143.1 | | $ | 142.2 | |
Components of Deferred Tax Assets and Liabilities
| | At December 31, | |
$ in millions | | 2006 | | 2005 | |
Net Non-Current Assets (Liabilities) | | | | | |
Depreciation/property basis | | $ | (368.1 | ) | $ | (367.6 | ) |
Income taxes recoverable | | (18.6 | ) | (10.1 | ) |
Regulatory assets | | (9.7 | ) | (9.4 | ) |
Investment tax credit | | 15.3 | | 16.3 | |
Compensation and employee benefits | | 39.2 | | 38.7 | |
Other (e) | | (18.3 | ) | 8.9 | |
Net non-current (liabilities) | | $ | (360.2 | ) | $ | (323.2 | ) |
| | | | | |
Net Current Assets | | | | | |
Other | | $ | 0.7 | | $ | 4.9 | |
Net current assets | | $ | 0.7 | | $ | 4.9 | |
(a) The statutory tax rate of 35% was applied to pre-tax income from continuing operations before preferred dividends.
|
(b) We have recorded $10.4 million, ($2.1) million and $11.7 million in 2006, 2005 and 2004, respectively, for state tax credits available related to the consumption of coal mined in Ohio.
|
(c) We have recorded $5.1 million, $11.2 million and $5.3 million in 2006, 2005 and 2004, respectively, of tax provision for tax deduction or income positions taken in prior tax returns that we believe were properly treated on such tax returns but for which it is possible that these positions may be contested.
|
(d) Excludes ($2.1) million in 2005 of income taxed reported as cumulative effect of accounting change, net of income taxes.
|
(e) The Other non-current liabilities caption includes deferred tax assets related to state tax net operating loss carryforwards, net of related valuation allowances of $0.3 million in 2006 and zero in 2005. The majority of these net operating losses are Ohio franchise tax loss carryforwards that expire after the phase-out of the Ohio franchise tax is completed in 2008. Remaining Ohio franchise tax loss carryforwards after 2008 can be used to offset the Ohio Commercial Activity Tax liability and do not expire until after 2029.
|
| | At December 31, | |
$ in millions | | 2008 | | 2007 | |
Net Non-Current Assets (Liabilities) | | | | | |
Depreciation/property basis | | $ | (398.6 | ) | $ | (378.5 | ) |
Income taxes recoverable | | (28.4 | ) | (23.0 | ) |
Regulatory assets | | (13.3 | ) | (9.6 | ) |
Investment tax credit | | 13.3 | | 14.3 | |
Compensation and employee benefits | | 12.7 | | 15.5 | |
Other (f) | | (3.5 | ) | 14.3 | |
Net non-current (liabilities) | | $ | (417.8 | ) | $ | (367.0 | ) |
| | | | | |
Net Current Assets (g) | | | | | |
Other | | $ | 2.3 | | $ | 2.1 | |
Net current assets | | $ | 2.3 | | $ | 2.1 | |
5.(a) The statutory tax rate of 35% was applied to pre-tax income from continuing operations before preferred dividends.
(b) We have recorded $0.2 million, $0.5 million and $10.4 million in 2008, 2007 and 2006, respectively, for state tax credits available related to the consumption of coal mined in Ohio. In addition, ($0.9) million in 2008,($0.5) million in 2007 and $3.1 million in 2006 was recorded as a result of the phase out of the Ohio Franchise Tax.
(c) We have recorded ($40.7) million, $2.7 million and $5.1 million in 2008, 2007 and 2006, respectively, of tax provisions for tax deduction or income positions taken in prior tax returns that we believe were properly treated on such tax returns but for which it is possible that these positions may be contested. The 2008 amount relates to the ODT settlement discussed above.
(d) Includes ($3.5) million in 2008 and $5.0 million in 2006 of income tax expense related to adjustments from prior years.
(e) We recorded $21.5 million in 2008 related to federal tax impacts on the ODT settlement discussed above.
(f) The Other non-current liabilities caption includes deferred tax assets related to state tax net operating losscarryforwards, net of related valuation allowances of $0.3 million in 2007. At December 31, 2008, there were no deferred tax assets or valuation allowances related to net operating losses on our books.
(g) Amounts are included within other current assets in the consolidated balance sheets.
89
Table of Contents
9. Pension and Postretirement Benefits
We sponsor a defined benefit plan for substantially all employees. For collective bargaining employees, the defined benefits are based on a specific dollar amount per year of service. For all other employees, the defined benefit plan is based primarily on compensation and years of service. We fund pension plan benefits as accrued in accordance with the minimum funding requirements of the Employee Retirement Income Security Act of 1974 (ERISA). In addition, we have a Supplemental Executive Retirement Plan (SERP) for certain active and retired key executives. Benefits under this SERP have been frozen and no additional benefits can be earned. Wealso have unfunded liabilities related to retirement benefits for certain active, terminated and retired key executives (not related to our ongoing litigation with three former executives).executives. These liabilities totaled approximately $0.5$1.0 million at December 31, 2006.2008.
On February 23, 2006, DPL’s Board of Directors approved a new compensation and benefits program that includes The DPL Inc. Supplemental Executive Defined Contribution Retirement Plan (New SERP)(SEDCRP) which replaces the Company’sour Supplemental Executive Retirement Plan (SERP) that was terminated as to new participationsparticipants in 2000. The Compensation Committee of the Board of Directors will designatedesignates the eligible employees. Pursuant to the New SERP,SEDCRP, we will provide a supplemental retirement benefit to participants by crediting an account established for each participant in accordance with the Plan requirements. We shall designate as hypothetical investment funds under the New SERPSEDCRP one or more of the investment funds provided under The Dayton Power and Light Company Employee Savings Plan. Each participant may change his or her hypothetical investment fund selection at specified times. If a participant does not elect a hypothetical investment fund(s), then we shall select the hypothetical investment fund(s) for such participant.
A participant shall become 100% vested in all amounts credited to his or her account upon the completion of five vesting years, as defined in The Dayton Power and Light Company Retirement Income Plan, or upon a change of control or the participant’s death or disability. If a participant’s employment is terminated, other than by death or disability, prior to such participant becoming 100% vested in his or her account, the account shall be forfeited as of the date of termination.
Qualified employees who retired prior to 1987 and their dependents are eligible for health care and life insurance benefits, while qualified employees who retired after 1987 are eligible for life insurance benefits. We have funded the union-eligible health benefit using a Voluntary Employee Beneficiary Association Trust.
We adopted SFAS 158 “Employers’ Accounting for Defined Benefit Pension and Other Postretirement Plans, an amendment of FASB Statements No. 87, 88, 106 and 132(R)” for the year ended December 31, 2006. Certain disclosures in regard to prior service costs, transition costs and net gains/losses are not available for 2006 because SFAS 158 was adoptedrequires that an entity’s funded status of its pension and other postretirement benefit obligations be recognized on a prospective basis. The incremental effectsthe face of adopting FAS 158 are set outthe financial statements and not just in the following table:
Incremental Effect of Applying FASB Statement No. 158 on Individual Line Items in the Consolidated Balance
Sheet for Pension and Postretirement Benefits
December 31, 2006
(in millions)footnotes.
| | Before Application
of Statement 158 | | Adjustments | | After Application
of Statement 158 | |
debit/(credit) | | December 31, 2006 | | Pension | | Post-Retirement | | December 31, 2006 | |
Other current liabilities | | — | | (0.4 | ) | (0.5 | ) | (0.9 | ) |
Other deferred credits | | (32.3 | ) | (25.9 | ) | 10.8 | | (47.4 | ) |
Deferred income taxes | | 8.0 | | 12.5 | | (3.6 | ) | 16.9 | |
| | | | | | | | | |
Regulatory asset | | — | | 47.0 | | 0.1 | | 47.1 | |
Deferred income taxes | | — | | (16.4 | ) | (0.1 | ) | (16.5 | ) |
| | | | | | | | | |
Regulatory liability—Other deferred credits | | — | | — | | (7.6 | ) | (7.6 | ) |
Deferred income taxes | | — | | — | | 2.7 | | 2.7 | |
| | | | | | | | | |
Accumulated other comprehensive (gain)/loss (before tax) | | 55.1 | | (20.6 | ) | (2.9 | ) | 31.6 | |
Deferred income taxes | | (19.3 | ) | 7.2 | | 1.0 | | (11.1 | ) |
Accumulated other comprehensive (gain)/loss (after tax) | | 35.8 | | (13.4 | ) | (1.9 | ) | 20.5 | |
A regulatory asset wasRegulatory assets and liabilities are recorded for the portion of the unfunded obligationunder- or over-funded obligations related to the transmission and distribution areas of our electric business. We have historically recorded these costs on the accrual basis and this is how these costs have been historically recovered. This factor, combined with the historical precedents from the PUCO and FERC, make these costs probable of future rate recovery.
74
The following tables set forth our pension and postretirement benefit plansplans’ obligations assets and amountsassets recorded on the Consolidated Balance Sheetsconsolidated balance sheets as of December 31. The amounts presented in the following tables for pension include both the defined benefit pension plan and the Supplemental Executive Retirement Plan in the aggregate.aggregate, and use a measurement date of December 31, 2008. The amounts presented for post-retirement include both health and life insurance benefits and use a measurement date of December 31, 2008.
| | Pension | | Postretirement | |
$ in millions | | 2006 | | 2005 | | 2006 | | 2005 | |
Change in Benefit Obligation During Year | | | | | | | | | |
Benefit obligation at January 1 | | $ | 299.1 | | $ | 280.5 | | $ | 31.1 | | $ | 32.0 | |
Service cost | | 4.2 | | 3.9 | | — | | — | |
Interest cost | | 16.7 | | 15.7 | | 1.5 | | 1.8 | |
Plan amendments | | — | | 9.3 | | — | | — | |
Actuarial (gain) loss | | 0.3 | | 8.2 | | (2.6 | ) | 0.4 | |
Benefits paid | | (25.8 | ) | (18.5 | ) | (2.9 | ) | (3.1 | ) |
Benefit obligation at December 31 | | $ | 294.5 | | $ | 299.1 | | $ | 27.1 | | $ | 31.1 | |
| | | | | | | | | |
Change in Plan Assets During Year | | | | | | | | | |
Fair value of plan assets at January 1 | | $ | 260.0 | | $ | 265.9 | | $ | 7.9 | | $ | 8.9 | |
Actual return on plan assets | | 26.8 | | 12.2 | | 0.2 | | 0.1 | |
Contributions to plan assets | | 5.4 | | 0.4 | | 1.8 | | 2.0 | |
Benefits paid | | (25.8 | ) | (18.5 | ) | (2.9 | ) | (3.1 | ) |
Fair value of plan assets at December 31 | | $ | 266.4 | | $ | 260.0 | | $ | 7.0 | | $ | 7.9 | |
| | | | | | | | | |
Funded Status of Plan | | $ | (28.1 | ) | $ | (39.1 | ) | $ | (20.1 | ) | $ | (23.2 | ) |
| | | | | | | | | |
Amounts Recognized in the Consolidated Balance Sheets at December 31 (a) | | | | | | | | | |
Current liabilities | | $ | (0.4 | ) | N/A | | $ | (0.4 | ) | N/A | |
Non-current liabilities | | (27.7 | ) | N/A | | (19.7 | ) | N/A | |
Net asset/(liability) at December 31 | | $ | (28.1 | ) | N/A | | $ | (20.1 | ) | N/A | |
| | | | | | | | | |
Amounts Recognized in Accumulated Other Comprehensive Income, Regulatory Assets and Regulatory Liabilities (a) | | | | | | | | | |
Net transition obligation (asset) | | $ | — | | N/A | | $ | 0.2 | | N/A | |
Prior service cost (credit) | | 14.6 | | N/A | | — | | N/A | |
Net actuarial loss (gain) | | 66.8 | | N/A | | (10.6 | ) | N/A | |
Accumulated other comprehensive income, regulatory assets and regulatory liabilities, pre-tax | | $ | 81.4 | | N/A | | $ | (10.4 | ) | N/A | |
90
(a) The requirementsTable of SFAS 158 are not applied retrospectively and do not apply to disclosures for 2005.Contents
$ in millions | | Pension | | Postretirement | |
| | 2008 | | 2007 | | 2008 | | 2007 | |
Change in Benefit Obligation During Year | | | | | | | | | |
Benefit obligation at January 1 | | $ | 285.0 | | $ | 294.5 | | $ | 26.4 | | $ | 27.1 | |
Service cost | | 3.3 | | 3.2 | | — | | — | |
Interest cost | | 16.7 | | 16.2 | | 1.4 | | 1.5 | |
Plan amendments | | 6.9 | | — | | — | | — | |
Actuarial (gain) loss | | 2.0 | | (9.6 | ) | (0.1 | ) | 0.6 | |
Benefits paid | | (19.3 | ) | (19.3 | ) | (2.5 | ) | (2.8 | ) |
Benefit obligation at December 31 | | $ | 294.6 | | $ | 285.0 | | $ | 25.2 | | $ | 26.4 | |
| | | | | | | | | |
Change in Plan Assets During Year | | | | | | | | | |
Fair value of plan assets at January 1 | | $ | 291.0 | | $ | 266.4 | | $ | 6.5 | | $ | 7.0 | |
Actual return on plan assets | | (46.7 | ) | 16.1 | | 0.2 | | 0.3 | |
Contributions to plan assets | | 0.4 | | 27.8 | | 2.1 | | 2.0 | |
Benefits paid | | (19.3 | ) | (19.3 | ) | (2.7 | ) | (2.9 | ) |
Medical reimbursements | | — | | — | | 0.1 | | 0.1 | |
Fair value of plan assets at December 31 | | $ | 225.4 | | $ | 291.0 | | $ | 6.2 | | $ | 6.5 | |
| | | | | | | | | |
Funded Status of Plan | | $ | (69.2 | ) | $ | 6.0 | | $ | (19.0 | ) | $ | (19.9 | ) |
| | | | | | | | | |
Amounts Recognized in the | | | | | | | | | |
Consolidated Balance Sheets at December 31 | | | | | | | | | |
Non-current assets | | $ | — | | $ | 9.9 | | $ | — | | $ | — | |
Current liabilities | | (0.4 | ) | (0.3 | ) | (0.4 | ) | (0.5 | ) |
Non-current liabilities | | (68.8 | ) | (3.6 | ) | (18.6 | ) | (19.4 | ) |
Net asset/(liability) at December 31 | | $ | (69.2 | ) | $ | 6.0 | | $ | (19.0 | ) | $ | (19.9 | ) |
| | | | | | | | | |
Amounts Recognized in Accumulated Other | | | | | | | | | |
Comprehensive Income, Regulatory Assets and | | | | | | | | | |
Regulatory Liabilities | | | | | | | | | |
Net transition obligation (asset) | | $ | — | | $ | — | | $ | — | | $ | — | |
Prior service cost (credit) | | 16.7 | | 12.2 | | — | | — | |
Net actuarial loss (gain) | | 129.9 | | 59.7 | | (7.8 | ) | (8.9 | ) |
Accumulated other comprehensive income, regulatory assets and regulatory liabilities, pre-tax | | $ | 146.6 | | $ | 71.9 | | $ | (7.8 | ) | $ | (8.9 | ) |
The accumulated benefit obligation for our defined benefit pension plans was $282.7$283.3 million and $287.6$274.6 million at December 31, 20062008 and 2005,2007, respectively.
91
Table of Contents
The net periodic benefit cost (income) of the pension and postretirement benefit plans at December 31 were:
Net Periodic Benefit Cost (Income) | | Pension | | Postretirement | |
$ in millions | | 2006 | | 2005 | | 2004 | | 2006 | | 2005 | | 2004 | |
Service cost | | $ | 4.2 | | $ | 3.9 | | $ | 3.5 | | $ | — | | $ | — | | $ | — | |
Interest cost | | 16.6 | | 15.7 | | 16.0 | | 1.5 | | 1.8 | | 1.9 | |
Expected return on assets (a) | | (21.7 | ) | (21.5 | ) | (21.7 | ) | (0.5 | ) | (0.5 | ) | (0.6 | ) |
Amortization of unrecognized: | | | | | | | | | | | | | |
Actuarial (gain) loss | | 3.9 | | 3.8 | | 2.0 | | (1.3 | ) | (0.8 | ) | (1.1 | ) |
Prior service cost | | 2.6 | | 2.3 | | 2.7 | | — | | — | | — | |
Transition obligation (asset) | | — | | — | | — | | 0.2 | | 0.2 | | 0.2 | |
Net benefit cost (income) before adjustments | | 5.6 | | 4.2 | | 2.5 | | (0.1 | ) | 0.7 | | 0.4 | |
| | | | | | | | | | | | | |
Settlement costs (b) | | 2.6 | | — | | — | | — | | — | | — | |
Special termination benefit cost (c) | | 0.3 | | 0.2 | | — | | — | | — | | — | |
Curtailment cost (d) | | — | | 0.1 | | — | | — | | — | | — | |
Net benefit cost (income) after adjustments | | $ | 8.5 | | $ | 4.5 | | $ | 2.5 | | $ | (0.1 | ) | $ | 0.7 | | $ | 0.4 | |
Net Periodic Benefit Cost (Income) | | Pension | | Postretirement | |
$ in millions | | 2008 | | 2007 | | 2006 | | 2008 | | 2007 | | 2006 | |
Service cost | | $ | 3.2 | | $ | 3.2 | | $ | 4.2 | | $ | — | | $ | — | | $ | — | |
Interest cost | | 16.7 | | 16.2 | | 16.6 | | 1.4 | | 1.5 | | 1.5 | |
Expected return on assets (a) | | (24.1 | ) | (22.0 | ) | (21.7 | ) | (0.4 | ) | (0.5 | ) | (0.5 | ) |
Amortization of unrecognized: | | | | | | | | | | | | | |
Actuarial (gain) loss | | 2.6 | | 3.4 | | 3.9 | | (0.9 | ) | (0.9 | ) | (1.3 | ) |
Prior service cost | | 2.4 | | 2.4 | | 2.6 | | — | | — | | — | |
Transition obligation | | — | | — | | — | | — | | 0.2 | | 0.2 | |
Net benefit cost (income) before adjustments | | 0.8 | | 3.2 | | 5.6 | | 0.1 | | 0.3 | | (0.1 | ) |
| | | | | | | | | | | | | |
Settlement costs (b) | | — | | — | | 2.6 | | — | | — | | — | |
Special termination benefit costs (c) | | — | | — | | 0.3 | | — | | — | | — | |
Net benefit cost (income) after adjustments | | $ | 0.8 | | $ | 3.2 | | $ | 8.5 | | $ | 0.1 | | $ | 0.3 | | $ | (0.1 | ) |
(a) The market-related value of assets is equal to the fair value of assets at implementation with subsequent asset gains and losses recognized in the market-related value systematically over a three-year period.
(b) The settlement cost relatesrelated to a former officer (not related to our ongoing litigation with three former executives) who has elected to receive a lump sum distribution in 2007 from the Supplemental Executive Retirement Plan.
(c) In 2006 and 2005, special termination benefit costs were recognized as a result of 32 employees who participated in a voluntary early retirement program. 16 employees retired at various dates during 2005 and 16 additional employees retired at various dates during 2006; this program was completed as of April 1, 2006.
(d)Other Changes in Plan Assets and Benefit Obligation Recognized in Accumulated Other Comprehensive Income In 2005, a curtailment
| | Pension | | Postretirement | |
$ in millions | | 2008 | | 2007 | | 2008 | | 2007 | |
Net actuarial (gain)/loss | | $ | 72.8 | | $ | (3.7 | ) | $ | 0.2 | | $ | 0.7 | |
Prior service cost/(credit) | | 6.9 | | — | | — | | — | |
Reversal of amortization item: | | | | | | | | | |
Net actuarial (gain)/loss | | (2.6 | ) | (3.4 | ) | 0.9 | | 0.9 | |
Prior service cost/(credit) | | (2.4 | ) | (2.4 | ) | — | | — | |
Transition (asset)/obligation | | — | | — | | — | | (0.2 | ) |
| | | | | | | | | |
Total recognized in accumulated other comprehensive income | | $ | 74.7 | | $ | (9.5 | ) | $ | 1.1 | | $ | 1.4 | |
| | | | | | | | | |
Total recognized in net periodic benefit cost and accumulated other comprehensive income | | $ | 75.5 | | $ | (6.3 | ) | $ | 1.2 | | $ | 1.7 | |
Estimated amounts that will be amortized from accumulated other comprehensive income into net periodic benefit cost was recognized as a resultduring 2009 are:
$ in millions | | Pension | | Postretirement | |
Net actuarial (gain)/loss | | $ | 4.5 | | $ | (0.2 | ) |
Prior service cost/(credit) | | 3.0 | | — | |
| | | | | | | |
92
Table of a freeze in benefits for the remaining active employee participating in the Supplemental Executive Retirement Plan.Contents
DP&L’s pension and postretirement plan assets were comprised of the following asset categories at December 31:
| | Pension | | Postretirement | |
Asset Category | | 2006 | | 2005 | | 2006 | | 2005 | |
Equity securities | | 59 | % | 51 | % | 0 | % | 0 | % |
Debt secruities | | 38 | % | 48 | % | 100 | % | 100 | % |
Real estate | | 0 | % | 0 | % | 0 | % | 0 | % |
Other | | 3 | % | 1 | % | 0 | % | 0 | % |
Total | | 100 | % | 100 | % | 100 | % | 100 | % |
| | Pension | | Postretirement | |
Asset Category | | 2008 | | 2007 | | 2008 | | 2007 | |
Equity securities | | 39 | % | 56 | % | 0 | % | 0 | % |
Debt securities | | 45 | % | 33 | % | 100 | % | 100 | % |
Other | | 16 | % | 11 | % | 0 | % | 0 | % |
Total | | 100 | % | 100 | % | 100 | % | 100 | % |
Plan assets are invested using a total return investment approach whereby a mix of equity securities, debt securities and other investments are used to preserve asset values, diversify risk and achieve our target investment return benchmark. Investment strategies and asset allocations are based on careful consideration of plan liabilities, the plan’s funded status and our financial condition. Investment performance and asset allocation are measured and monitored on an ongoing basis. At December 31, 2006, there were no shares of
On November 26, 2007, DP&L contributed $27.4 million in DPL common stock heldfrom its Master Trust assets to the Retirement Income Plan to fully fund the pension liability as of December 31, 2007. DPL common stock is now 9% of plan assets.
Our expected return on plan asset assumptions, used to determine benefit obligations, are based on historical long-term rates of return on investment, which use the widely accepted capital market principle that assets with higher volatility generate a greater return over the long run. Current market factors, such as inflation and interest rates, as well as asset diversification and portfolio rebalancing, are evaluated when long-term capital market assumptions are determined. Peer data and historical returns are reviewed to verify reasonability and appropriateness.
Our overall expected long-term rate of return on assets is approximately 8.50% for pension plan assets and approximately 6.75%6.00% for retiree welfarebenefit plan assets. This expected return is based exclusively on historical returns, without adjustments. There can be no assurance of our ability to generate that rate of return in the future.
Our overall discount rate was evaluated in relation to the December 31, 20062008 Hewitt Yield Curve. The Hewitt Yield Curve which represents a portfolio of top-quartile AA-rated bonds used to settle pension obligations and supported a weighted average discount rate of 5.75% at December 31, 2006.obligations. Peer data and historical returns were also reviewed to verify the reasonabilityreasonableness and appropriateness of our discount rate used in the calculation of benefit obligations and expense.
The weighted average assumptions used to determine benefit obligations for the years ended December 31 were:
| | Pension | | Postretirement | |
Benefit Obligation Assumptions | | 2006 | | 2005 | | 2006 | | 2005 | |
Discount rate for obligations | | 5.75 | % | 5.75 | % | 5.75 | % | 5.75 | % |
Rate of compensation increases | | 4.00 | % | 4.00 | % | N/A | | N/A | |
| | Pension | | Postretirement | |
Benefit Obligation Assumptions | | 2008 | | 2007 | | 2008 | | 2007 | |
Discount rate for obligations | | 6.25 | % | 6.00 | % | 6.25 | % | 6.00 | % |
Rate of compensation increases | | 5.44 | % | 5.44 | % | N/A | | N/A | |
The weighted-average assumptions used to determine net periodic benefit cost (income) for the years ended December 31 were:
| | Pension | | Postretirement | |
Net Periodic Benefit Cost (Income) Assumptions | | 2006 | | 2005 | | 2004 | | 2006 | | 2005 | | 2004 | |
Discount rate | | 5.75 | % | 5.75 | % | 6.25 | % | 5.75 | % | 5.75 | % | 6.25 | % |
Expected rate of return on plan assets | | 8.50 | % | 8.50 | % | 8.50 | % | 6.75 | % | 6.75 | % | 6.75 | % |
Rate of compensation increases | | 4.00 | % | 4.00 | % | 4.00 | % | N/A | | N/A | | N/A | |
Net Periodic Benefit | | Pension | | Postretirement | |
Cost (Income) Assumptions | | 2008 | | 2007 | | 2006 | | 2008 | | 2007 | | 2006 | |
Discount rate | | 6.00 | % | 5.75 | % | 5.75 | % | 6.00 | % | 5.75 | % | 5.75 | % |
Expected rate of return on plan assets | | 8.50 | % | 8.50 | % | 8.50 | % | 6.00 | % | 6.75 | % | 6.75 | % |
Rate of compensation increases | | 5.44 | % | 5.44 | % | 5.44 | % | N/A | | N/A | | N/A | |
93
Table of Contents
The assumed health care cost trend rates at December 31 are as follows:
| | Expense | | Benefit Obligations | |
Health Care Cost Assumptions | | 2006 | | 2005 | | 2006 | | 2005 | |
Current health care cost trend rate | | 10.00 | % | 10.00 | % | 10.00 | % | 10.00 | % |
Ultimate health care cost trend rate | | 5.00 | % | 5.00 | % | 5.00 | % | 5.00 | % |
Ultimate health care cost trend rate - year | | 2011 | | 2010 | | 2012 | | 2011 | |
| | Expense | | Benefit Obligations | |
Health Care Cost Assumptions | | 2008 | | 2007 | | 2008 | | 2007 | |
Current health care cost trend rate | | 10.00 | % | 10.00 | % | 9.50 | % | 10.00 | % |
Ultimate health care cost trend rate | | 5.00 | % | 5.00 | % | 5.00 | % | 5.00 | % |
Ultimate health care cost trend rate - year | | 2013 | | 2012 | | 2014 | | 2013 | |
The assumed health care cost trend rates have a significant effect on the amounts reported for the health care plans. A one-percentage point change in assumed health care cost trend rates would have the following effects on the net periodic postretirement benefit cost and the accumulated postretirement benefit obligation:
Effect of Change in Health Care Cost Trend Rate ($ in millions) | | Increase 1% | | Decrease 1% | |
Service cost plus interest cost | | $ | 0.1 | | $ | (0.1) | |
Benefit obligation | | $ | 1.5 | | $ | (1.3) | |
Effect of Change in Health | | | | | |
Care Cost Trend Rate ($ in millions) | | Increase 1% | | Decrease 1% | |
| | | | | |
Service cost plus interest cost | | $ | 0.1 | | $ | (0.1 | ) |
Benefit obligation | | $ | 1.5 | | $ | (1.4 | ) |
The following benefit payments, which reflect future service, are expected to be paid as follows:
Estimated Future Benefit Payments | | | | | |
$ in millions | | Pension | | Postretirement | |
| | | | | |
2007 | | $ | 19.4 | | $ | 2.6 | |
2008 | | $ | 19.8 | | $ | 2.6 | |
2009 | | $ | 20.2 | | $ | 2.6 | |
2010 | | $ | 20.7 | | $ | 2.5 | |
2011 | | $ | 20.9 | | $ | 2.4 | |
2012 - 2016 | | $ | 111.9 | | $ | 10.0 | |
Estimated Future Benefit Payments | | | | | |
$ in millions | | Pension | | Postretirement | |
| | | | | |
2009 | | $ | 20.1 | | $ | 2.7 | |
2010 | | $ | 20.5 | | $ | 2.7 | |
2011 | | $ | 20.9 | | $ | 2.6 | |
2012 | | $ | 21.5 | | $ | 2.5 | |
2013 | | $ | 22.2 | | $ | 2.4 | |
2014 - 2018 | | $ | 117.1 | | $ | 9.7 | |
We expect to contribute $0.4 million to itsour pension planplans and $2.6$2.7 million to itsour other postretirement benefit plans in 2009.
The Pension Protection Act (the Act) of 2006 contained new requirements for our single employer defined benefit pension plans. In addition to establishing a 100% funding target for plan years beginning after December 31, 2008, the Act also limits some benefits if the funded status of pension plans drops below certain thresholds. Among other restrictions under the Act, if the funded status of a plan falls below a predetermined ratio which will increase to 80%, lump-sum payments to new retirees are limited to 50% of amounts that otherwise would have been paid and new benefit improvements may not go into effect. This 80% funding threshold will be phased-in through 2011 with 65% being the applicable ratio for 2008. For the 2008 plan year, the funded status of our defined benefit pension plan as calculated under the requirements of the Act was 83% and is estimated to be 80% for the 2009 plan year. The Worker, Retiree, and Employer Recovery Act of 2008 (WRERA), which was signed into law on December 23, 2008, grants plan sponsors certain relief from funding requirements and benefit restrictions of the Act. DPL and DP&L are in 2007.the process of evaluating the impact of this legislation on the funding requirements and benefits restrictions of the Act. We do not expect the requirements of the Act to have a material impact on our overall results of operations, financial position or cash flows.
6.10. Financial Instruments
In the normal course of business, DPL and DP&L enter into various financial instruments, including derivative financial instruments. A description of these financial instruments is as follows:
Derivatives
We use derivatives principally to manage the risk of changes in market prices for commodities. The derivatives that we use to hedge these risks are governed by our risk management policies for forward contracts, futures, options, and swaps. Our net positions are continually assessed within our structured hedging programs to determine whether new or offsetting transactions are required. The objective of the hedging program is generally to mitigate financial risks while ensuring that sufficient volumes are available to meet our requirements. We monitor and value derivative positions monthly as part of our risk management processes.
94
Table of Contents
We use published sources for pricing when possible to mark positions to market. We rely on modeled valuations only when no other method exists.
Cash Flow Hedges
Our risk management processes identify the relationships between hedging instruments and hedged items, as well as the risk management objective and strategy for undertaking various hedge transactions. The mark-to-market value of cash flow hedges as determined by current public market prices will continue to fluctuate with changes in market prices up to contract expiration. The effective portion of the hedging transaction is recognized in Other Comprehensive Income (OCI) and transferred to earnings when the hedged forecasted transaction takes place or when the hedged forecasted transaction is no longer probable of occurring. The ineffective portion of the cash flow hedge is recognized in earnings in the current period.
These instruments are used to hedge the risk of price changes for sales and purchases of power. All risk components were taken into account to determine the hedge effectiveness of the cash flow hedges. Power hedges are usually transacted over a 1 to 3 month period. We recognized unrealized losses on our forward power cash flow hedges of $0.3 million and $1.5 million in OCI in 2008 and 2007, respectively. Approximately $0.3 million of accumulated losses in OCI related to the above mentioned power hedges are expected to be reclassified to earnings over the next twelve months.
Changes in interest rates expose DPL and DP&L to risk as a result of the issuance of corporate bonds. In 2003 we entered into an interest rate hedge to manage this risk. The balance of the remaining deferred gain from the interest rate hedge in OCI was $17.2 million and $19.7 million in 2008 and 2007 respectively. Approximately $2.5 million of accumulated gains in OCI related to the above referenced interest rate hedge are expected to be reclassified to earnings over the next twelve months.
The following table provides information concerning gains or losses recognized in OCI for the cash flow hedges:
| | December 31, | | December 31, | | December 31, | |
| | 2008 | | 2007 | | 2006 | |
| | Power and | | Interest Rate | | Power and | | Interest Rate | | Power and | | Interest Rate | |
$ in millions | | Capacity | | Hedge | | Capacity | | Hedge | | Capacity | | Hedge | |
| | | | | | | | | | | | | |
Beginning accumulated
derivative (gain) / loss in OCI | | $ | 1.5 | | $ | (19.7 | ) | $ | (3.2 | ) | $ | (22.1 | ) | $ | 0.3 | | $ | (24.6 | ) |
| | | | | | | | | | | | | |
Net change associated with current
period hedging transactions | | (7.4 | ) | — | | 0.5 | | — | | (9.4 | ) | — | |
| | | | | | | | | | | | | |
Net amount of any reclassifications
into earnings | | 6.2 | | 2.5 | | 4.2 | | 2.4 | | 5.9 | | 2.5 | |
| | | | | | | | | | | | | |
Ending accumulated
derivative (gain) / loss in OCI | | $ | 0.3 | | $ | (17.2 | ) | $ | 1.5 | | $ | (19.7 | ) | $ | (3.2 | ) | $ | (22.1 | ) |
Mark to Market
Certain derivative contracts are entered into on a regular basis as part of our risk management program but do not qualify for hedge accounting or the normal purchase and sales exceptions under SFAS No. 133, “Accounting for Derivative Instruments and Hedging Activities,” as amended. Accordingly, such contracts are recorded at fair value with changes in the fair value charged or credited to the income statement in the period in which the change occurred. Contracts we enter into as part of our risk management program may be settled financially, by physical delivery, or net settled with the counterparty.
Master Trust Assets
DP&L established a Master Trust to hold assets for the benefit of employees participating in DP&L’s Deferred Compensation Plan and other employee benefit purposes and these assets are not used for general operating purposes. These assets are primarily comprised of mutual funds and DPL common stock. The DPL common stock held by the Master Trust in DP&L’s consolidated balance sheet is eliminated in consolidation and is not reflected in DPL’s consolidated balance sheet. These assets are valued using current public market prices on a quarterly basis. Any unrealized gains or losses are recognized in Other Comprehensive Income until the securities are sold.
95
Table of Contents
DPL recognized $6.2 million of unrealized gains on the Master Trust assets in OCI in both 2008 and 2007 and $6.6 million and $5.9 million of unrealized losses in OCI in 2008 and 2007, respectively. DP&L recognized $17.0 million and $31.2 million of unrealized gains and $6.6 million and $5.9 million of unrealized losses in OCI in 2008 and 2007, respectively. No unrealized gains or losses are expected to be transferred to earnings in 2009.
Transfer of Master Trust Assets to Pension
On October 26, 2007, the Board of Directors approved a resolution permitting the transfer of 925,000 shares of DPL Inc. common stock from the DP&L Master Trust to The Dayton Power and Light Company Retirement Income Plan Trust (Pension). This transaction was completed on November 26, 2007, contributing shares of common stock with a fair value of $27.4 million to the Pension and resulting in a fully funded status at December 31, 2007.
Long-term Debt
Long-term debt is fair valued based on current public market prices for disclosure purposes only. Unrealized gains or losses are not recognized in the financial statements, as long-term debt is presented at amortized cost in the financial statements. The long-term debt amounts include the current portion payable in the next twelve months and have maturities that range from 2009 to 2040.
The fair values of our financial instruments and debt are based on market quotes of similar instruments and represent estimates of possible value that may not be realized in the future. The table below presents the fair value and cost of these instruments at December 31, 2008 and 2007.
| | At December 31, | |
| | 2008 | | 2007 | |
$ in millions | | Cost | | Fair Value | | Cost | | Fair Value | |
DPL Inc. | | | | | | | | | |
Assets | | | | | | | | | |
Master Trust Assets | | $ | 13.6 | | $ | 13.1 | | $ | 9.2 | | $ | 9.6 | |
Derivative Assets | | — | | — | | 0.4 | | 0.4 | |
Total Assets | | $ | 13.6 | | $ | 13.1 | | $ | 9.6 | | $ | 10.0 | |
| | | | | | | | | |
Liabilities | | | | | | | | | |
Debt | | $ | 1,551.8 | | $ | 1,470.5 | | $ | 1,642.2 | | $ | 1,664.3 | |
Derivative Liabilities | | — | | 6.6 | | — | | 1.5 | |
Total Liabilities | | $ | 1,551.8 | | $ | 1,477.1 | | $ | 1,642.2 | | $ | 1,665.8 | |
| | | | | | | | | |
DP&L | | | | | | | | | |
Assets | | | | | | | | | |
Master Trust Assets | | $ | 29.9 | | $ | 40.2 | | $ | 30.5 | | $ | 56.0 | |
Derivative Assets | | — | | — | | 0.4 | | 0.4 | |
Total Assets | | $ | 29.9 | | $ | 40.2 | | $ | 30.9 | | $ | 56.4 | |
| | | | | | | | | |
Liabilities | | | | | | | | | |
Debt | | $ | 884.7 | | $ | 815.7 | | $ | 875.3 | | $ | 871.5 | |
Derivative Liabilities | | — | | 6.6 | | — | | 1.5 | |
Total Liabilities | | $ | 884.7 | | $ | 822.3 | | $ | 875.3 | | $ | 873.0 | |
Effective January 1, 2008, we adopted Statement of Financial Accounting Standards No.157, “Fair Value Measurements” (SFAS 157), which provides a framework for measuring fair value under GAAP. SFAS 157 requires that the impact of this change in accounting for fair valued assets and liabilities be recorded as an adjustment to beginning retained earnings in the period of adoption. We did not have any adjustments to beginning retained earnings at adoption.
FSP SFAS 157-2 allows for a deferral from the SFAS 157 disclosures for non-financial assets or liabilities until fiscal years beginning after November 15, 2008. We did not elect this deferral and have disclosed additional layers to several asset retirement obligations.
SFAS 157 defines fair value as the exchange price that would be received for an asset or paid to transfer a liability (an exit price) in the principal or most advantageous market for the asset or liability in an orderly transaction between market participants on the measurement date. SFAS 157 also establishes a fair value hierarchy that requires an entity to maximize the use of observable inputs and minimize the use of unobservable inputs when measuring fair value. The standard describes three levels of inputs that may be used to measure fair value:
96
Table of Contents
Level 1
Level 1 inputs are defined as quoted prices in active markets for identical assets or liabilities. Our Level 1 assets and liabilities include equity securities held in various deferred compensation trusts and futures contracts that are traded in an active exchange market.
Level 2
Level 2 inputs are observable inputs other than Level 1 prices such as quoted prices for similar assets or liabilities, quoted prices in markets that are not active, or other inputs that are observable or can be corroborated by observable market data for substantially the full term of the assets or liabilities. Our Level 2 assets and liabilities include open-ended investment funds and forward contracts with quoted prices from over-the-counter (OTC) markets or direct broker quotes that are traded less frequently than exchange-traded instruments.
Level 3
Level 3 inputs are unobservable inputs that are supported by little or no market activity and that are significant to the fair value of the assets or liabilities. Our Level 3 assets and liabilities include asset retirement obligations that are initially recognized at fair value.
Valuations of assets and liabilities reflect the value of the instrument including the values associated with counterparty risk and performance risk. With the issuance of SFAS 157, the accounting industry clarified that these values must also take into account our own credit standing.
The fair value of assets and liabilities measured on a recurring basis was determined as follows:
| | Assets and Liabilities Measured at Fair Value on a Recurring Basis | |
| | | | Level 1 | | Level 2 | | Level 3 | |
| | | | Based on Quoted | | Based on | | | |
| | Fair Value at | | Prices in Active | | Other Observable | | Unobservable | |
| | December 31, 2008 | | Market | | Inputs | | Inputs | |
$ in millions | | DPL | | DP&L (a) | | DPL | | DP&L (a) | | DPL | | DP&L | | DPL | | DP&L | |
Assets | | | | | | | | | | | | | | | | | |
Master Trust Assets | | $ | 13.1 | | $ | 40.2 | | $ | — | | $ | 27.1 | | $ | 13.1 | | $ | 13.1 | | $ | — | | $ | — | |
Derivative Assets | | — | | — | | — | | — | | — | | — | | — | | — | |
Total | | $ | 13.1 | | $ | 40.2 | | $ | — | | $ | 27.1 | | $ | 13.1 | | $ | 13.1 | | $ | — | | $ | — | |
| | | | | | | | | | | | | | | | | |
Liabilities | | | | | | | | | | | | | | | | | |
Derivative Liabilities | | $ | 6.6 | | $ | 6.6 | | $ | 6.3 | | $ | 6.3 | | $ | 0.3 | | $ | 0.3 | | $ | — | | $ | — | |
Total | | $ | 6.6 | | $ | 6.6 | | $ | 6.3 | | $ | 6.3 | | $ | 0.3 | | $ | 0.3 | | $ | — | | $ | — | |
(a) DP&L holds DPL stock in the Master Trust that is eliminated in consolidation.
Generally, for financial assets held by the Master Trust and for heating oil futures, fair value is determined by reference to quoted market prices and other relevant information generated by market transactions. Level 2 inputs are used to value derivatives such as financial transmission rights where the quoted prices are from a relatively inactive market; forward power contracts which are valued using prices on the New York Mercantile Exchange (NYMEX) for similar contracts on the OTC market; and open-ended funds that are valued using the end of day Net Asset Value (NAV).
The fair value of assets and liabilities measured on a non-recurring basis was determined as follows:
97
Table of Contents
| | Assets and Liabilities Measured at Fair Value on a Non-Recurring Basis | |
| | | | Level 1 | | Level 2 | | Level 3 | |
| | | | Based on Quoted | | Based on | | | |
| | Fair Value at | | Prices in Active | | Other Observable | | Unobservable | |
| | December 31, 2008 | | Market | | Inputs | | Inputs | |
$ in millions | | DPL | | DP&L | | DPL | | DP&L | | DPL | | DP&L | | DPL | | DP&L | |
Asset retirement | | | | | | | | | | | | | | | | | |
obligations recorded | | | | | | | | | | | | | | | | | |
during period | | $ | 0.6 | | $ | 0.6 | | $ | — | | $ | — | | $ | — | | $ | — | | $ | 0.6 | | $ | 0.6 | |
| | | | | | | | | | | | | | | | | | | | | | | | | |
The fair value of an asset retirement obligation (ARO) is estimated by discounting expected cash outflows to their present value. Cash outflows are based on the approximate future disposal cost as determined by market information, historical information or management judgment. During the three months ended December 31, 2008, DP&L added an additional layer to several asbestos removal and ash landfill AROs in the amount of $0.6 million due to changes in the cost and timing estimates for asbestos removal and ash landfill closures and the acceleration of the removal of some asbestos.
At December 31, 2008, DPL had $15.0 million in money market mutual funds classified as cash and cash equivalents in its consolidated balance sheet.
98
Table of Contents
11. Stock-Based Compensation
The following table summarizes share-based compensation expense:
| | Twelve Months Ended | |
| | December 31, | |
$ in millions | | 2008 | | 2007 | | 2006 | |
Stock options | | $ | — | | $ | — | | $ | 1.3 | |
Restricted stock units | | (0.1 | ) | — | | 3.0 | |
Performance shares | | 0.9 | | 1.5 | | 2.0 | |
Restricted shares | | 0.3 | | 0.3 | | — | |
Non-employee directors’ RSUs | | 0.5 | | 0.3 | | — | |
Management performance shares | | 0.3 | | — | | — | |
Share-based compensation included in operations and maintenance expense | | 1.9 | | 2.1 | | 6.3 | |
Income tax expense | | (0.7 | ) | (0.7 | ) | (2.2 | ) |
Total share-based compensation, net of tax | | $ | 1.2 | | $ | 1.4 | | $ | 4.1 | |
Share-based awards issued in DPL’s common stock will be distributed from treasury stock. DPL has sufficient treasury stock to satisfy all outstanding share-based awards.
Determining Fair Value
Valuation and Amortization Method — We estimate the fair value of stock options and RSUs using a Black-Scholes-Merton model; performance shares are valued using a Monte Carlo simulation; restricted shares are valued at the closing market price on the day of grant and the Directors’ RSUs are valued at the closing market price on the day prior to the grant date. We amortize the fair value of all awards on a straight-line basis over the requisite service periods, which are generally the vesting periods.
Expected Volatility — Our expected volatility assumptions are based on the historical volatility of DPL stock. The volatility range captures the high and low volatility values for each award granted based on its specific terms.
Expected Life — The expected life assumption represents the estimated period of time from grant until exercise and reflects historical employee exercise patterns.
Risk-Free Interest Rate — The risk-free interest rate for the expected term of the award is based on the corresponding yield curve in effect at the time of the valuation for U.S. Treasury bonds having the same term as the expected life of the award, i.e., a five year bond rate is used for valuing an award with a five year expected life.
Expected Dividend Yield — The expected dividend yield is based on DPL’s current dividend rate, adjusted as necessary to capture anticipated dividend changes and the 12 month average DPL stock price.
Expected Forfeitures — The forfeiture rate used to calculate compensation expense is based on DPL’s historical experience, adjusted as necessary to reflect special circumstances.
Stock Options
In 2000, DPL’s Board of Directors adopted and DPL’s shareholders approved The DPL Inc. Stock Option Plan. On April 26, 2006, DPL’s shareholders approved The DPL Inc. 2006 Equity and Performance Incentive Plan (EPIP). With the approval of the EPIP, no new awards will be granted under The DPL Inc. Stock Option Plan, but shares relating to awards that are forfeited or terminated under The DPL Inc. Stock Option Plan may be granted under the EPIP. As of December 31, 2008, there were no unvested stock options.
99
Table of Contents
Summarized stock option activity was as follows:
| | Twelve Months Ended | |
| | December 31, | |
| | 2008 | | 2007 | | 2006 | |
Options: | | | | | | | |
Outstanding at beginning of year | | 946,500 | | 5,091,500 | | 5,486,500 | |
Granted | | — | | — | | — | |
Exercised | | (110,000 | ) | (525,000 | ) | (355,000 | ) |
Forfeited (a) | | — | | (3,620,000 | ) | (40,000 | ) |
Outstanding at year-end | | 836,500 | | 946,500 | | 5,091,500 | |
Exercisable at year-end | | 836,500 | | 946,500 | | 5,081,500 | |
| | | | | | | |
Weighted average option prices per share: | | | | | | | |
Outstanding at beginning of year | | $ | 24.09 | | $ | 21.95 | | $ | 21.86 | |
Granted | | $ | — | | $ | — | | $ | — | |
Exercised | | $ | 18.56 | | $ | 26.79 | | $ | 21.00 | |
Forfeited | | $ | — | | $ | 20.38 | | $ | 15.88 | |
Outstanding at year-end | | $ | 24.64 | | $ | 24.09 | | $ | 21.95 | |
Exercisable at year-end | | $ | 24.64 | | $ | 24.09 | | $ | 21.94 | |
(a)As a result of the settlement of the former executive litigation on May 21, 2007, 3.6 million outstanding options shown above were forfeited in the second quarter of 2007 and another approximately one million disputed options not shown above were also forfeited.
The following table reflects information about stock options outstanding at December 31, 2008:
| | | | Options Outstanding | | Options Exercisable | |
| | | | Weighted- | | Weighted- | | | | Weighted- | |
| | | | Average | | Average | | | | Average | |
Range of Exercise | | | | Contractual | | Exercise | | | | Exercise | |
Prices | | Outstanding | | Life | | Price | | Exercisable | | Price | |
| | | | | | | | | | | |
$14.95 - $21.00 | | 510,000 | | 1.6 years | | $ | 20.98 | | 510,000 | | $ | 20.98 | |
$21.01 - $29.63 | | 326,500 | | 2.6 years | | $ | 28.82 | | 326,500 | | $ | 28.82 | |
The following table reflects information about stock option activity during the period:
| | Twelve Months Ended | |
| | December 31, | |
$ in millions | | 2008 | | 2007 | | 2006 | |
Weighted-average grant date fair value of options granted during the period | | $ | — | | $ | — | | $ | — | |
Intrinsic value of options exercised during the period | | $ | 1.0 | | $ | 2.3 | | $ | 2.5 | |
Proceeds from stock options exercised during the period | | $ | 2.2 | | $ | 14.6 | | $ | 7.8 | |
Excess tax benefit from proceeds of stock options exercised | | $ | 0.3 | | $ | 1.3 | | $ | 1.9 | |
Fair value of shares that vested during the period | | $ | — | | $ | — | | $ | 1.3 | |
Unrecognized compensation expense | | $ | — | | $ | — | | $ | 0.1 | |
Weighted average period to recognize compensation expense (in years) | | — | | — | | 1.0 | |
No options were granted during 2006, 2007 or 2008.
100
Table of Contents
Restricted Stock Units (RSUs)
RSUs were granted to certain key employees prior to 2001. As a result of the settlement of the former executive litigation, all disputed RSUs were forfeited by the three former executives. There were 10,120 RSUs outstanding as of December 31, 2008, none of which has vested. The non-vested RSUs will be paid in cash upon vesting and will vest as follows: 6,809 in 2009 and 3,311 in 2010. Non-vested RSUs are valued quarterly at fair value using the Black-Scholes-Merton model to determine the amount of compensation expense to be recognized. Non-vested RSUs do not earn dividends.
| | | | Weighted-Avg. | |
| | Number of | | Grant Date | |
$ in millions | | RSUs | | Fair Value | |
Non-vested at January 1, 2008 | | 22,976 | | $ | 0.5 | |
Granted in 2008 | | — | | $ | — | |
Vested in 2008 | | (11,253 | ) | $ | (0.2 | ) |
Forfeited in 2008 | | (1,603 | ) | $ | — | |
Non-vested at December 31, 2008 | | 10,120 | | $ | 0.3 | |
Summarized RSU activity was as follows:
| | Twelve Months Ended | |
| | December 31, | |
| | 2008 | | 2007 | | 2006 | |
RSUs: | | | | | | | |
Outstanding at beginning of year | | 22,976 | | 1,334,339 | | 1,319,399 | |
Granted | | — | | — | | — | |
Dividends | | — | | 11,656 | | 46,434 | |
Exercised | | (11,253 | ) | (20,097 | ) | (22,516 | ) |
Forfeited | | (1,603 | ) | (1,302,922 | ) | (8,978 | ) |
Outstanding at period end | | 10,120 | | 22,976 | | 1,334,339 | |
Exercisable at period end | | — | | — | | — | |
Compensation expense is recognized each quarter based on the change in the market price of DPL common shares.
As of December 31, 2008, 2007 and 2006, liabilities recorded for outstanding RSUs were $0.2 million, $0.6 million and $36.9 million, respectively, which are included in “Other deferred credits” on the consolidated balance sheets. The decrease in the liability between 2006 and 2007 is due to the executive litigation settlement and the forfeiture of 1.3 million RSUs. See Note 15 of Notes to Consolidated Financial Statements.
The following table shows the assumptions used in the Black-Scholes-Merton model to calculate the fair value of the non-vested RSUs during the respective periods:
| | Twelve Months Ended | |
| | December 31, | |
| | 2008 | | 2007 | | 2006 | |
Expected volatility | | 24.8% - 28.1% | | 6.1% - 15.3% | | 9.5% - 17.3% | |
Weighted-average expected volatility | | 26.0% | | 13.0% | | 14.6% | |
Expected life (years) | | 1.0 - 2.0 | | 1.0 - 3.0 | | 1.0 - 4.0 | |
Expected dividends | | 4.5% | | 3.8% | | 3.7% | |
Weighted-average expected dividends | | 4.5% | | 3.8% | | 3.7% | |
Risk-free interest rate | | 0.2% - 0.4% | | 3.0% - 3.3% | | 4.7% - 4.9% | |
101
Table of Contents
Performance Shares
Under the EPIP, the Board adopted a Long-Term Incentive Plan (LTIP) under which DPL will grant a targeted number of performance shares of common stock to executives. Grants under the LTIP will be awarded based on a Total Shareholder Return Relative to Peers performance. No performance shares will be earned in a performance period if the three-year Total Shareholder Return Relative to Peers is below the threshold of the 40th percentile. Further, the LTIP awards will be capped at 200% of the target number of performance shares, if the Total Shareholder Return Relative to Peers is at or above the threshold of the 90th percentile. The Total Shareholder Return Relative to Peers is considered a market condition under FAS 123R. There is a three year requisite service period for each portion of the performance shares.
The schedule of non-vested performance share activity for the twelve months ended December 31, 2008 follows:
| | Number of | | Weighted-Avg. | |
| | Performance | | Grant Date | |
$ in millions | | Shares | | Fair Value | |
Non-vested at January 1, 2008 | | 104,682 | | $ | 3.1 | |
Granted in 2008 | | 93,298 | | $ | 2.2 | |
Vested in 2008 | | (36,445 | ) | $ | (0.8 | ) |
Forfeited in 2008 | | (41,680 | ) | $ | (1.2 | ) |
Non-vested at December 31, 2008 | | 119,855 | | $ | 3.3 | |
| | Twelve Months Ended | |
| | December 31, | |
| | 2008 | | 2007 | | 2006 | |
Performance shares: | | | | | | | |
Outstanding at beginning of year | | 142,108 | | 154,768 | | — | |
Granted | | 93,298 | | 78,559 | | 244,423 | |
Exercised | | — | | (22,462 | ) | — | |
Expired | | (37,426 | ) | (21,583 | ) | — | |
Forfeited | | (41,680 | ) | (47,174 | ) | (89,655 | ) |
Outstanding at period end | | 156,300 | | 142,108 | | 154,768 | |
Exercisable at period end | | 36,445 | | 37,426 | | 44,045 | |
The following table reflects information about performance share activity during the period:
| | Twelve Months Ended | |
| | December 31, | |
$ in millions | | 2008 | | 2007 | | 2006 | |
Weighted-average grant date fair value of performance shares granted during the period | | $ | 2.2 | | $ | 2.6 | | $ | 6.3 | |
Intrinsic value of performance shares exercised during the period | | $ | — | | $ | 0.6 | | $ | — | |
Proceeds from performance shares exercised during the period | | $ | — | | $ | — | | $ | — | |
Excess tax benefit from proceeds of performance shares exercised | | $ | — | | $ | — | | $ | — | |
Fair value of performance shares that vested during the period | | $ | 0.8 | | $ | 0.8 | | $ | 1.3 | |
Unrecognized compensation expense | | $ | 1.6 | | $ | 1.9 | | $ | 1.5 | |
Weighted average period to recognize compensation expense (in years) | | 1.6 | | 1.7 | | 1.6 | |
102
Table of Contents
The following table shows the assumptions used in the Monte Carlo Simulation to calculate the fair value of the performance shares granted during the period:
| | Twelve Months Ended | |
| | December 31, | |
| | 2008 | | 2007 | | 2006 | |
Expected volatility | | 15.0% - 15.7% | | 15.8% - 17.3% | | 17.9% - 20.3% | |
Weighted-average expected volatility | | 15.1% | | 16.6% | | 20.1% | |
Expected life (years) | | 3.0 | | 3.0 | | 3.0 | |
Expected dividends | | 3.5% - 4.1% | | 3.3% - 3.9% | | 3.7% | |
Weighted-average expected dividends | | 4.1% | | 3.4% | | 3.7% | |
Risk-free interest rate | | 2.2% - 3.2% | | 4.5% - 4.9% | | 4.6% - 4.7% | |
Restricted Shares
Under the EPIP, the Board granted shares of DPL Restricted Shares to various executives. The Restricted Shares are registered in the executive’s name, carry full voting privileges, receive dividends as declared and paid on all DPL common stock and vest after a specified service period.
On July 23, 2008, the Board of Directors granted compensation awards to a select group of management employees. A total of 10,347 restricted shares was granted. The management restricted stock awards have a three-year requisite service period from July 23, 2008 to July 23, 2011, carry full voting privileges and receive dividends as declared and paid on all DPL common stock. The management restricted stock can only be awarded in DPL common shares.
| | Number of | | Weighted-Avg. | |
| | Restricted | | Grant Date | |
$ in millions | | Shares | | Fair Value | |
Non-vested at January 1, 2008 | | 42,200 | | $ | 1.2 | |
Granted in 2008 | | 39,347 | | $ | 1.1 | |
Vested in 2008 | | (1,000 | ) | $ | — | |
Forfeited in 2008 | | (11,400 | ) | $ | (0.4 | ) |
Non-vested at December 31, 2008 | | 69,147 | | $ | 1.9 | |
| | Twelve Months Ended | |
| | December 31, | |
| | 2008 | | 2007 | | 2006 | |
Restricted shares: | | | | | | | |
Outstanding at beginning of year | | 42,200 | | 19,000 | | — | |
Granted | | 39,347 | | 23,200 | | 19,000 | |
Exercised | | (1,000 | ) | — | | — | |
Forfeited | | (11,400 | ) | — | | — | |
Outstanding at period end | | 69,147 | | 42,200 | | 19,000 | |
Exercisable at period end | | — | | — | | — | |
The following table reflects information about restricted share activity during the period:
| | Twelve Months Ended | |
| | December 31, | |
$ in millions | | 2008 | | 2007 | | 2006 | |
Weighted-average grant date fair value of restricted shares granted during the period | | $ | 1.1 | | $ | 0.7 | | $ | 0.5 | |
Intrinsic value of restricted shares exercised during the period | | $ | — | | $ | — | | $ | — | |
Proceeds from restricted shares exercised during the period | | $ | — | | $ | — | | $ | — | |
Excess tax benefit from proceeds of restricted shares exercised | | $ | — | | $ | — | | $ | — | |
Fair value of restricted shares that vested during the period | | $ | — | | $ | — | | $ | — | |
Unrecognized compensation expense | | $ | 1.3 | | $ | 0.9 | | $ | 0.5 | |
Weighted average period to recognize compensation expense (in years) | | 2.7 | | 2.8 | | 4.1 | |
103
Table of Contents
Non-Employee Director Restricted Stock Units
Under the EPIP, as part of their annual compensation for service to DPL and DP&L, each non-employee Director receives a $54,000 retainer in RSUs on the date of the annual meeting. The RSUs will become non-forfeitable on April 15 of the following year. All of the RSUs become non-forfeitable in the event of death, disability, or change in control but if the Director resigns or retires prior to the April 15 vesting date, the vested shares will be distributed on a pro rata basis. The RSUs accrue quarterly dividends in the form of additional RSUs. Upon vesting, the RSUs will become exercisable and will be distributed in DPL common shares, unless the Director chooses to defer receipt of the shares until a later date. The RSUs are valued at the closing stock price on the day prior to the grant and the compensation expense is recognized evenly over the vesting period.
| | Number of | | Weighted-Avg. | |
| | Director | | Grant Date | |
$ in millions | | RSUs | | Fair Value | |
Non-vested at January 1, 2008* | | 13,573 | | $ | 0.4 | |
Granted in 2008 | | 17,022 | | $ | 0.5 | |
Dividends accrued in 2008 | | 931 | | $ | — | |
Vested in 2008 | | (14,831 | ) | $ | (0.5 | ) |
Forfeited in 2008 | | (1,149 | ) | $ | — | |
Non-vested at December 31, 2008 | | 15,546 | | $ | 0.4 | |
*2007 incorrectly stated vested shares as (10,238) when it should have been (142).
The non-vested at 1/1/2008 reflects this correction.
| | Twelve Months Ended | |
| | December 31, | |
| | 2008 | | 2007 | | 2006* | |
Restricted stock units: | | | | | | | |
Outstanding at beginning of year | | 13,573 | | — | | — | |
Granted | | 17,022 | | 14,920 | | — | |
Dividends accrued | | 931 | | 348 | | — | |
Exercised and issued | | (7,910 | ) | (142 | ) | — | |
Exercised and deferred | | (6,921 | ) | — | | — | |
Forfeited | | (1,149 | ) | (1,553 | ) | — | |
Outstanding at period end | | 15,546 | | 13,573 | | — | |
Exercisable at period end | | — | | — | | — | |
*Director RSUs were not issued in 2006.
The following table reflects information about non-employee director RSU activity during the period:
| | Twelve Months Ended | |
| | December 31, | |
$ in millions | | 2008 | | 2007 | | 2006* | |
Weighted-average grant date fair value of non-employee director RSUs granted during the period | | $ | 0.5 | | $ | 0.5 | | $ | — | |
Intrinsic value of non-employee director RSUs exercised during the period | | $ | 0.4 | | $ | — | | $ | — | |
Proceeds from non-employee director RSUs exercised during the period | | $ | — | | $ | — | | $ | — | |
Excess tax benefit from proceeds of non-employee director RSUs exercised | | $ | — | | $ | — | | $ | — | |
Fair value of non-employee director RSUs that vested during the period | | $ | 0.5 | | $ | 0.3 | | $ | — | |
Unrecognized compensation expense | | $ | 0.1 | | $ | 0.1 | | $ | — | |
Weighted average period to recognize compensation expense (in years) | | 0.3 | | 0.3 | | — | |
*Director RSUs were not issued in 2006.
104
Table of Contents
Management Performance Shares
On May 28, 2008, the Board of Directors granted compensation awards for select management employees. A total of 39,144 management performance shares were granted. The grants have a three year requisite service period from January 1, 2008 to December 31, 2010 and certain performance conditions during the performance period. The management performance shares can only be awarded in DPL common shares.
| | Number of | | Weighted-Avg. | |
| | Mgt. Performance | | Grant Date | |
$ in millions | | Shares | | Fair Value | |
Non-vested at January 1, 2008 | | — | | $ | — | |
Granted in 2008 | | 39,144 | | $ | 1.1 | |
Vested in 2008 | | — | | $ | — | |
Forfeited in 2008 | | — | | $ | — | |
Non-vested at December 31, 2008 | | 39,144 | | $ | 1.1 | |
|
| Twelve Months Ended |
|
|
| December 31, |
|
|
| 2008 |
| 2007* |
| 2006* |
|
Management Performance Shares: | | | | | | | |
Outstanding at beginning of year |
| — | | — | | — | |
Granted |
| 39,144 | | — | | — | |
Exercised |
| — | | — | | — | |
Forfeited |
| — | | — | | — | |
Outstanding at period end |
| 39,144 | | — | | — | |
Exercisable at period end |
| — | | — | | — | |
*Management performance shares were not issued in 2007 or 2006.
The following table shows the assumptions used in the Monte Carlo Simulation to calculate the fair value of the management performance shares granted during the period:
| | Twelve Months Ended | |
| | December 31, | |
| | 2008 | | 2007* | | 2006* | |
Expected volatility | | 14.9% | | 0.0% | | 0.0% | |
Weighted-average expected volatility | | 14.9% | | 0.0% | | 0.0% | |
Expected life (years) | | 3.0 | | — | | — | |
Expected dividends | | 3.9% | | 0.0% | | 0.0% | |
Weighted-average expected dividends | | 3.9% | | 0.0% | | 0.0% | |
Risk-free interest rate | | 2.9% | | 0.0% | | 0.0% | |
*Management performance shares were not issued in 2007 or 2006.
The following table reflects information about management performance share activity during the period:
| | Twelve Months Ended | |
| | December 31, | |
$ in millions | | 2008 | | 2007* | | 2006* | |
Weighted-average grant date fair value of management perfomance shares granted during the period | | $ | 1.1 | | $ | — | | $ | — | |
Intrinsic value of management performance shares exercised during the period | | $ | — | | $ | — | | $ | — | |
Proceeds from management performance shares exercised during the period | | $ | — | | $ | — | | $ | — | |
Excess tax benefit from proceeds of management performance shares exercised | | $ | — | | $ | — | | $ | — | |
Fair value of management performance shares that vested during the period | | $ | — | | $ | — | | $ | — | |
Unrecognized compensation expense | | $ | 0.8 | | $ | — | | $ | — | |
Weighted average period to recognize compensation expense (in years) | | 2.0 | | — | | — | |
* Management performance shares were not issued in 2007 or 2006.
105
Table of Contents
As a result of the May 21, 2007 settlement of the litigation with three former executives (see Note 15 of Notes to Consolidated Financial Statements), the three former executives relinquished all of their rights to certain deferred compensation, RSUs, MVE incentives, stock options and reimbursement of legal fees. A portion of this settlement included the forfeitures and cancellations of Restricted Stock Units (RSUs) and stock options of 1.3 million and 3.6 million, respectively.
12. Preferred Stock
DP&L:$25 par value, 4,000,000 shares authorized, no shares outstanding; and $100 par value, 4,000,000 shares authorized, 228,508 shares without mandatory redemption provisions outstanding.
| | | | | | Current Shares | | Par Value at | | Par Value at | |
| | Preferred | | Current | | Outstanding at | | December 31, | | December 31, | |
| | Stock | | Redemption | | December 31, | | 2008 | | 2007 | |
| | Rate | | Price | | 2008 | | ($ in millions) | | ($ in millions) | |
DP&L Series A | | 3.75 | % | $ | 102.50 | | 93,280 | | 9.3 | | 9.3 | |
DP&L Series B | | 3.75 | % | $ | 103.00 | | 69,398 | | 7.0 | | 7.0 | |
DP&L Series C | | 3.90 | % | $ | 101.00 | | 65,830 | | 6.6 | | 6.6 | |
Total | | | | | | 228,508 | | $ | 22.9 | | $ | 22.9 | |
| | | | | | | | | | | | | | |
The DP&L preferred stock may be redeemed at DPL’s option at the per-share prices indicated, plus cumulative accrued dividends.
As long as any DP&L preferred stock is outstanding, DP&L’s Amended Articles of Incorporation contain provisions restricting the payment of cash dividends on any of its Common Stock if, after giving effect to such dividend, the aggregate of all such dividends distributed subsequent to December 31, 1946 exceeds the net income of DP&L available for dividends on its Common Stock subsequent to December 31, 1946, plus $1.2 million. As of year-end, all earnings reinvested in the business of DP&L were available for Common Stock dividends. DPL records dividends on preferred stock of DP&L as part of interest expense. We expect all 2008 earnings reinvested in the business of DP&L to be available for DP&L common stock dividends, payable to DPL.
13. Common Shareholders’ Equity
DPL has 250,000,000 authorized common shares, of which 113,018,972115,961,880 are outstanding at December 31, 2006.2008. DPL had 902,490 authorized but unissued shares reserved for its dividend reinvestment plan at December 31, 2005.2008. The plan provides that either original issue shares or shares purchased on the open market may be used to satisfy plan requirements.
On July 27, 2005, DPL’s Board authorized the repurchase of up to $400$400.0 million of common stock from time to time in the open market or through private transactions. DPL completed this share repurchase program on August 21, 2006. In total, 14.9 million shares were repurchased at a cost of $400.0 million. These Board-authorized repurchase transactions resulted in an 11.7% reduction of the outstanding stock of December 31, 2005 at an average price of $26.91 per share. These shares are currently held as treasury shares. There were no other repurchases during 20062008, 2007 and 2005.2006.
In September 2001, DPL’sDPL’s Board of Directors renewed its Shareholder Rights Plan, attaching one right to each common share outstanding at the close of business on December 13, 2001. The rights separate from the common shares and become exercisable at the exercise price of $130 per right in the event of certain attempted business combinations. The renewed plan expires on December 31, 2011.
106
Table of Contents
In February 2000, DPL entered into a series of recapitalization transactions including the issuance of $550 million of a combination of voting preferred and trust preferred securities and warrants to an affiliate of investment company Kohlberg Kravis Roberts & Co. (KKR). As part of this recapitalization transaction, 31.6 million warrants were issued. These warrants were sold for an aggregate purchase price of $50 million. The warrants are exercisable, in whole or in part, for common shares at any time during the twelve-year period commencing on March 13, 2000. Each warrant is exercisable for one common share, subject to anti-dilution adjustments (i.e., stock split, stock dividend). The exercise price of the warrants is $21.00 per common share, subject to anti-dilution adjustments.
In addition, in the event of a declaration, issuance or consummation of any dividend, spin-off or other distribution or similar transaction by DPL of the capital stock of any of its subsidiaries, additional warrants of such subsidiary will be issued to the warrant holder so that after the transaction, the warrant holder will have the same interest in the fully diluted number of common shares of such subsidiary the warrant holder had in DPL immediately prior to such transaction.
Pursuant to the warrant agreement, DPL has reserved authorized common shares sufficient to provide for the exercise in full of all outstanding warrants.
During December 2004 and January 2005, Dayton Ventures, LLC requested that we transfer all of Dayton Ventures, LLC’s warrants toOn September 18, 2008, Lehman Brothers, Inc. (Lehman) exercised 12.0 million warrants under a cashless exercise transaction resulting in four transactions. Lehman has subsequently transferred a large number of these warrants to unaffiliated third parties. During one of these transactions in 2005, Dayton Ventures, LLC agreed to sell back tothe issuance by DPL at par all of the outstanding 6,600,000 voting preferred shares. As a result2.3 million shares of the reduction of Dayton Ventures, Inc.’s warrant ownership below 12,640,000, Dayton Ventures, LLC wascommon stock. Such shares were issued from treasury stock. Lehman no longer eligible to receive an annual $1 million management, consulting and financial services fee and it no longer had the right to designate one person to serve as a director of theholds any DPL and DP&L and no longer hadwarrants.
During October 1992, our Board of Directors approved the right to designate one person to serve asformation of a non-voting observer of DPL and DP&L. Currently, Dayton Ventures, LLC does not have any ownership interest in DPL or DP&L.
DPL has a leveragedCompany-sponsored Employee Stock Ownership Plan (ESOP) to fund matching contributions to DP&L’s 401(k) retirement savings plan and certain other payments to eligible full-time employees. Common shareholders’ equityThis leveraged ESOP is reduced for the cost of 3.8 million unallocated shares heldfunded by the trust and for 2.7 million shares related to other employee plans, ofan exempt loan, which a total of 6.5 million shares reduce the number of common shares used in the calculation of earnings per share.
Dividends receivedis secured by the ESOP for unallocated shares were used to repay the principal and interest on an ESOP loan to DPL.shares. As debt service payments wereare made on the loan, shares are released on a pro-ratapro rata basis. ESOP shares used to fund matching contributions to DP&L’s 401(k) vest after three years of service; other compensation shares awarded vest immediately.
In general, participants are eligible for lump sum payments upon termination of their employment and the submission and subsequent approval of an application for benefits. Earlier distributions can occur for Qualified Domestic Relations Order and for death. Otherwise, distribution must occur within 60 days after the plan year in which the later of one of the following events occur: 65th birthday, 10th anniversary of participation, or termination of employment. Participants are allowed to take distributions during employment if older than 59½ and/or for a hardship as defined in the Plan document. Distributions are made in cash unless the participant requests the distribution be made in stock. A repurchase obligation exists for vested shares held by the ESOP if they cannot be sold in the open market. The fair value of shares subject to the repurchase obligation at December 31, 2008 and 2007 was approximately $42.4 million and $52.5 million, respectively.
In 1992, the Plan entered into a $90 million loan agreement with DPL in order to purchase shares of DPL common stock in the open market. The term loan agreement provided for principal and interest on the loan to be paid prior to October 9, 2007, with the right to extend the loan for an additional ten years. In 2007, the maturity date was extended to October 7, 2017. The loan bears interest at a fixed rate of 7.625%, payable annually. Dividends received by the ESOP for unallocated shares are used to repay the principal and interest on the ESOP loan to DPL. Dividends on the allocated shares are charged to retained earnings.
The ESOP cumulativeused the full amount of the loan to purchase 4.7 million shares allocatedof our common stock in the open market. As a result of the 1997 stock split, the ESOP held 7.1 million shares of our common stock. The cost of shares held by the ESOP and not yet released is reported as a reduction of shareholders’ equity. At December 31, 2008, common shareholders’ equity reflects the cost of 3.1 million unreleased shares held in suspense by the trust. The fair value of the 3.1 million ESOP shares held in suspense at December 31, 2008 was $70.2 million. When shares are committed to employees and outstanding forbe released from the calculationESOP, compensation expense is recorded based on the fair value of earnings per share were 3.4 million in 2006, 3.2 million in 2005, and 3.0 million in 2004.the shares committed to be released, with a corresponding credit to our equity. Compensation expense associated with
the ESOP, which is based on the fair value of the shares allocated,committed to be released for allocation, amounted to $3.7$1.5 million in 2006, $3.12008, $9.0 million in 2005,2007 and $2.5$4.1 million in 2004.2006.
107
Table of Contents
For purposes of earnings per share (EPS) computations and in accordance with SOP 93-6, we treat ESOP shares as outstanding if they have been allocated to participants, released or committed to be released. As of December 31, 2008, the ESOP has 3.9 million shares allocated to participants with an additional 0.1 million shares which have been released but unallocated to participants. ESOP cumulative shares outstanding for the calculation of earnings per share were 4.0 million in 2008, 3.9 million in 2007 and 3.4 million in 2006.
In April 2006, DPL’s Shareholdersshareholders approved The DPL Inc. Equity and Performance Incentive Plan (the EPIP) which became immediately effective and will remain in effect for a term of ten years, unless sooner terminated in accordance with its terms. The Compensation Committee of the Board of Directors will designate the employees and directors eligible to participate in the EPIP and the times and types of awards to be granted. Under the EPIP, the Compensation Committee may grant equity-based compensation in the form of stock options, stock appreciation rights, restricted stock, restricted stock units, performance shares and units, and other stock-based awards. Awards may be subject to the achievement of certain management objectives. In addition, the EPIP provides, upon recommendation of the Chief Executive Officer and Chairman of the Board, for a grant of a special equity award to recognize outstanding performance. A total of 4,500,000 shares of the Company’s common stock were reserved for issuance under the EPIP.
7. Preferred Stock
DPL:
| | Series B, no par value, 8,000,000 shares authorized; no shares outstanding as of December 31, 2006
| |
| | | |
DP&L:
| | $25 par value, 4,000,000 shares authorized, no shares outstanding; and $100 par value, 4,000,000 shares authorized, 228,508 shares without mandatory redemption provisions outstanding.
| |
| | | | | | Current Shares | | Par Value at | | Par Value at | |
| | | | Current | | Outstanding at | | December 31, | | December 31, | |
| | | | Redemption | | December 31, | | 2006 | | 2005 | |
Preferred Stock Rate | | | | Price | | 2006 | | ($ in millions) | | ($ in millions) | |
DPL Series B (a) | | 0.00 | % | $ | 0.01 | | — | | $ | — | | $ | — | |
DP&L Series A | | 3.75 | % | $ | 102.50 | | 93,280 | | 9.3 | | 9.3 | |
DP&L Series B | | 3.75 | % | $ | 103.00 | | 69,398 | | 7.0 | | 7.0 | |
DP&L Series C | | 3.90 | % | $ | 101.00 | | 65,830 | | 6.6 | | 6.6 | |
Total | | | | | | 228,508 | | $ | 22.9 | | $ | 22.9 | |
(a) DPL purchased all of its outstanding Series B shares during 2005.
In February 2000, DPL entered into a series of recapitalization transactions including the issuance of $550 million of a combination of voting preferred and trust preferred securities and warrants to an affiliate of investment company KKR. As part of DPL’s 2000 recapitalization transaction, trust preferred securities sold to KKR had an aggregate face amount of $550 million, and were issued at an initial discounted aggregate price of $500 million, with a maturity of 30 years (subject to acceleration six months after the exercise of the warrants), and distributions at a rate of 8.5% of the aggregate face amount per year. DPL recognized the entire trust preferred securities original issue discount of $50 million upon issuance.
In August 2001, DPL issued $300 million of trust preferred securities to institutional investors at 8.125% and $400 million of senior unsecured notes at 6.875%. The August 2001 trust preferred securities have a term of 30 years and the senior unsecured notes have a term of 10 years. In the fourth quarter of 2003, DPL adopted FIN46R and deconsolidated the DPL Capital Trust II, which resulted in transferring the August 2001 trust preferred securities to the DPL Capital Trust II and establishing a note to Capital Trust II for $300 million at 8.125%. In August 2005, DPL redeemed $105 million of these Capital Securities, leaving $195 million outstanding.
The voting preferred shares (DPL Series B) were not redeemable, except at the option of the holder. DPL agreed to redeem such number so that at no time would the holder and its affiliates maintain an ownership interest of greater than 4.9% of the voting rights of DPL. DPL’s Series B preferred shares may only be transferred or otherwise disposed of together with a corresponding number of warrants, unless the holder and its affiliates hold a greater number of warrants than DPL’s Series B preferred shares, in which case the holder may transfer any such excess warrants without transferring DPL’s Series B preferred shares. If the holder of a warrant wishes to exercise warrants that are not excess warrants, DPL will redeem simultaneously with the exercise of such warrants an equal number of DPL’s Series B preferred shares held by such holder. DPL repurchased 6,600,000
DPL Series B preferred shares on January 12, 2005 at par for an aggregate purchase price of $66,000. There are currently no Series B preferred shares outstanding.
The DP&L preferred stock may be redeemed at DPL’s option at the per-share prices indicated, plus cumulative accrued dividends.
As long as any DP&L preferred stock is outstanding, DP&L’s Amended Articles of Incorporation contain provisions restricting the payment of cash dividends on any of its Common Stock if, after giving effect to such dividend, the aggregate of all such dividends distributed subsequent to December 31, 1946 exceeds the net income of DP&L available for dividends on its Common Stock subsequent to December 31, 1946, plus $1.2 million. As of year-end, all earnings reinvested in the business of DP&L were available for Common Stock dividends. DPL records dividends on preferred stock of DP&L as part of interest expense. We expect all 2006 earnings reinvested in the business of DP&L to be available for DP&L common stock dividends, payable to DPL.
80
8. Long-term Debt
DPL Inc. | | At December 31, | |
$ in millions | | 2006 | | 2005 | |
DP&L — | | First mortgage bonds maturing 2013 - 5.125% | | $ | 470.0 | | $ | 470.0 | |
DP&L — | | Pollution control series maturing 2036 - 4.80% | | 100.0 | | — | |
DP&L — | | Pollution control series maturing through 2034 - 4.78% (a) | | 214.4 | | 214.4 | |
| | | | 784.4 | | 684.4 | |
| | | | | | | |
DPL Inc. — | | Note to Capital Trust II 8.125% due 2031 | | 195.0 | | 195.0 | |
DPL Inc. — | | Senior Notes 6.875% Series due 2011 | | 297.4 | | 297.4 | |
DPL Inc. — | | Senior Notes 6.25% Series due 2008 | | 100.0 | | 100.0 | |
DPL Inc. — | | Senior Notes 8.25% Series due 2007 | | — | | 225.0 | |
DPL Inc. — | | Senior Notes 8.00% Series due 2009 | | 175.0 | | 175.0 | |
DP&L — | | Obligations for capital leases | | 2.0 | | 3.0 | |
Unamortized debt discount (b) | | (2.0 | ) | (2.7 | ) |
Total | | $ | 1,551.8 | | $ | 1,677.1 | |
(a) Weighted average interest rate for 2006 and 2005.
(b) DP&L’s unamortized debt discount was $(1.2) million and $(1.5) million for December 31, 2006 and 2005, respectively.
DP&L | | At December 31, | |
$ in millions | | 2006 | | 2005 | |
First mortgage bonds maturing 2013 - 5.125% | | $ | 470.0 | | $ | 470.0 | |
Pollution control series maturing 2036 - 4.80% | | 100.0 | | — | |
Pollution control series maturing through 2034 - 4.78% (a) | | 214.4 | | 214.4 | |
| | 784.4 | | 684.4 | |
| | | | | |
Obligations for capital leases | | 2.0 | | 3.0 | |
Unamortized debt discount | | (1.2 | ) | (1.5 | ) |
Total | | $ | 785.2 | | $ | 685.9 | |
(a) Weighted average interest rate for 2006 and 2005.
At December 31, 2006, DPL’s scheduled maturities of long-term debt, including capital lease obligations, over the next five years are $225.9 million in 2007, $100.7 million in 2008, $175.7 million in 2009, $0.6 million in 2010 and $297.4 million in 2011.
At December 31, 2006, DP&L’s scheduled maturities of long-term debt, including capital lease obligations, over the next five years are $0.9 million in 2007, $0.7 million in 2008, $0.7 million in 2009, $0.6 million in 2010 and none in 2011. Substantially all property of DP&L is subject to the mortgage lien securing the first mortgage bonds.
On March 25, 2004, DPL completed a $175 million private placement of unsecured 8% Series Senior Notes due March 2009. The Senior Notes will not be redeemable prior to maturity except that DPL has the right to redeem the notes for a make-whole payment at the adjusted treasury rate plus 0.25%. The 8% Series Senior Notes were issued pursuant to its indenture dated as of March 1, 2000, and pursuant to authority granted in Board resolutions dated March 25, 2004. The notes impose a limitation on the incurrence of liens on the capital stock of any of DPL’s significant subsidiaries and require DPL and its subsidiaries to meet a consolidated coverage ratio of 2 to 1 prior to incurring additional indebtedness. The limitation on the incurrence of additional indebtedness does not apply to (i) indebtedness incurred to refinance existing indebtedness, (ii) subordinated indebtedness and (iii) up to $150 million of additional indebtedness. In addition to the events of default specified in the indenture, an event of default under the notes includes a payment default or acceleration of indebtedness under any other indebtedness of DPL or any of its subsidiaries which aggregates $25 million or more. The purchasers were granted registration rights in connection with the private placement under an Exchange and Registration Rights Agreement. Pursuant to this agreement, DPL was obligated to file an exchange offer registration statement by July 22, 2004, have the registration statement declared effective by September 20, 2004 and consummate the exchange offer by October 20, 2004. DPL failed (1) to have a registration statement declared effective and (2) to complete the exchange offer according to this timeline. As a result, DPL had been accruing additional interest at a rate of 0.5% per year for each of these two violations, up to an additional interest rate not to exceed in the aggregate 1.0% per year. As each violation was cured, the additional interest rate decreased by 0.5% per annum. DPL’s exchange offer registration statement for these securities was declared effective by the SEC on June 27, 2006. As a result, on June 27, 2006, DPL ceased accruing 0.5% of the additional interest. On July 31, 2006, DPL ceased accruing the other 0.5% of additional interest when the exchange of registered notes for the unregistered notes was completed. By completing the exchange, DPL reduced the annual interest expense by $1.8 million.
During the first quarter of 2006, the Ohio Department of Development (ODOD) awarded DP&L the ability to issue over the next three years up to $200 million of qualified tax-exempt financing from the ODOD’s 2005 volume cap carryforward. The financing is to be used to partially fund the ongoing flue gas desulfurization (FGD) capital projects. The PUCO approved DP&L’s application for this additional financing on July 26, 2006.
On September 13, 2006, the Ohio Air Quality Development Authority (OAQDA) issued $100 million of 4.80% fixed interest rate OAQDA Revenue Bonds 2006 Series A due September 1, 2036. In turn, DP&L borrowed these funds from the OAQDA. The payment of principal and interest on the Bonds when due is insured by an insurance policy issued by Financial Guaranty Insurance Company. DP&L is using the proceeds from these borrowings to assist in financing its portion of the costs of acquiring, constructing and installing certain solid waste disposal and air quality facilities at Miami Fort, Killen and Stuart Generating Stations. These facilities are currently under construction and the proceeds from the borrowing have been placed in escrow with a trustee (the Bank of New York) and are being drawn upon only as facilities are built and qualified costs are incurred. In the event any of the proceeds are not drawn, DP&L would eventually be required to return the unused proceeds to bondholders. DP&L expects to draw down the remaining available funds from this borrowing by the end of the second quarter 2007.
DP&L expects to use the remaining $100 million of volume cap carryforward prior to the end of 2008. DP&L is planning to issue in conjunction with the OAQDA another $100 million of tax-exempt bonds to finance the remaining solid waste disposal facilities at Miami Fort, Killen, Stuart and Conesville Generating Stations.
On November 21, 2006, DP&L entered into a new $220 million unsecured revolving credit agreement replacing its $100 million facility. This new agreement has a five-year term that expires November 21, 2011 and provides DP&L with the ability to increase the size of the facility by an additional $50 million at any time. The facility contains one financial covenant: DP&L’s total debt to total capitalization ratio is not to exceed 0.65 to 1.00. This covenant is currently met. DP&L had no outstanding borrowings under this credit facility at December 31, 2006. Fees associated with this credit facility are approximately $0.2 million per year. Changes in credit ratings, however, may affect fees and the applicable interest rate. This revolving credit agreement also contains a $50 million letter of credit sublimit. As of December 31, 2006, DP&L had no outstanding letters of credit against the facility.
On February 24, 2005, DP&L entered into an amendment to extend the term of its Master Letter of Credit Agreement with a financial lending institution for one year and to reduce the maximum dollar volume of letters of credit to $10 million. On February 17, 2006, DP&L renewed its $10 million agreement for one year. This agreement supports performance assurance needs in the ordinary course of business. This agreement was not renewed in 2007. DP&L has certain contractual agreements for the sale and purchase of power, fuel and related energy services that contain credit rating related clauses allowing the counter parties to seek additional surety under certain conditions. As of December 31, 2006, DP&L had two outstanding letters of credit for a total of $2.2 million.
There are no inter-company debt collateralizations or debt guarantees between DPL, DP&L and their subsidiaries. None of the debt obligations of DPL or DP&L are guaranteed or secured by affiliates and no cross-collateralization exists between any subsidiaries.
9. Stock-Based Compensation
We adopted SFAS 123R on January 1, 2006 using the modified prospective approach for stock options and restricted stock units (RSUs). As a result of the adoption of SFAS 123R, we recognized $0.7 million less compensation expense for the year ended December 31, 2006, as compared to what we would have recognized under SFAS 123.
In 2000, DPL’s Board of Directors adopted and DPL’s shareholders approved The DPL Inc. Stock Option Plan. The plan provides that “no single Participant shall receive Options with respect to more than 2,500,000 shares.” Options granted in 2000, 2001 and 2002 were fully vested as of December 31, 2005 and expire ten years from the grant date. In 2003, 100,000 options were granted which vest equitably over five years and expire ten years from the grant date. In 2004, 200,000 options were granted that vested over nineteen months and expire approximately 6.5 years from the grant date; 100,000 of these options vested in May 2005 and the remaining 100,000 vested in May 2006. Another 20,000 options were granted in 2004 that vested in five months and expire ten years from the grant date. In December 2004, 30,000 options were granted that vest equitably over three years and expire ten years from the grant date. In 2005, 350,000 options were granted that vested in June 2006 and expire three years from the grant date. At December 31, 2006, there were 1,528,500 options available for grant. On April 26, 2006, DPL’s shareholders approved The DPL Inc. 2006 Equity and Performance Incentive Plan (EPIP). With the approval of EPIP, no new awards will be granted under The DPL Inc. Stock Option Plan, but shares relating to awards that are forfeited or terminated under The DPL Inc. Stock Option Plan may be granted.
The schedule of option activity for the twelve months ended December 31, 2006 was as follows:
| | | | Weighted-Avg. | |
| | Number of | | Grant Date | |
$ in millions | | Options | | Fair Value | |
Non-vested at January 1, 2006 | | 510,000 | | $ | 2.2 | |
Granted in 2006 | | — | | $ | — | |
Vested in 2006 | | (460,000 | ) | $ | (2.0 | ) |
Forfeited in 2006 | | (40,000 | ) | $ | (0.1 | ) |
Non-vested at December 31, 2006 | | 10,000 | | $ | 0.1 | |
Summarized stock option activity was as follows:
| | For year ended | | For year ended | |
| | December 31, | | December 31, | |
| | 2006 | | 2005 | |
Options: | | | | | |
Outstanding at beginning of year | | 5,486,500 | | 6,165,500 | |
Granted | | — | | 350,000 | |
Exercised | | (355,000 | ) | (1,025,000 | ) |
Forfeited | | (40,000 | ) | (4,000 | ) |
Outstanding at year-end (a) | | 5,091,500 | | 5,486,500 | |
Exercisable at year-end | | 5,081,500 | | 4,100,000 | |
| | | | | |
Weighted average option prices per share: | | | | | |
Outstanding at beginning of year | | $ | 21.86 | | $ | 21.39 | |
Granted | | $ | — | | $ | 26.82 | |
Exercised | | $ | 21.00 | | $ | 21.18 | |
Forfeited | | $ | 15.88 | | $ | 29.63 | |
Outstanding at year-end | | $ | 21.95 | | $ | 21.86 | |
Exercisable at year-end | | $ | 21.94 | | $ | 20.98 | |
(a) In dispute with certain former executives, among other things, are approximately 1 million forfeited options not included above and 3.6 million outstanding options that are included above. See Note 15 of Notes to Consolidated Financial Statements.
No stock options were granted in 2006. The weighted-average fair value of options granted was $3.80 per share in 2005. The fair values of the options were estimated as of the dates of grant using a Black-Scholes option pricing model.
There were 355,000 stock options exercised during 2006. The market value of options that were vested at December 31, 2006 was approximately $32 million. Shares issued upon share option exercise are issued from treasury stock. DPL has sufficient treasury stock to satisfy outstanding options.
The following table reflects information about stock options outstanding at December 31, 2006:
| | | | Options Outstanding | | Options Exercisable | |
| | | | Weighted- | | Weighted- | | | | Weighted- | |
| | | | Average | | Average | | | | Average | |
| | | | Contractual | | Exercise | | | | Exercise | |
Range of Exercise Prices | | Outstanding | | Life | | Price | | Exercisable | | Price | |
| | | | | | | | | | | |
$14.95 - $21.00 | | 4,305,000 | | 3.5 years | | $ | 20.42 | | 4,305,000 | | $ | 20.42 | |
$21.01 - $29.63 | | 786,500 | | 2.7 years | | $ | 28.01 | | 776,000 | | $ | 28.05 | |
As of December 31, 2006, there was $0.1 million of total unrecognized compensation cost related to non-vested stock options granted under the Plan. We expect to recognize $0.1 million of this cost in 2007.
In addition, RSUs were granted to certain key employees prior to 2001. There were 1.3 million RSUs outstanding as of December 31, 2006, of which 1.3 million were vested. Substantially all of the vested RSUs are in dispute as part of our ongoing litigation with Peter H. Forster, formerly DPL’s Chairman; Caroline E. Muhlenkamp, formerly DPL’s Group Vice President and Interim Chief Financial Officer; and Stephen F. Koziar, formerly DPL’s Chief Executive Officer and President. The remaining 0.1 million non-vested RSUs will be paid in cash upon vesting and will vest as follows: 20,097 in 2007; 14,688 in 2008; 10,205 in 2009; and 5,008 in 2010. Vested RSUs are marked to market each quarter and any adjustment to compensation expense is recognized at that time. Non-vested RSUs are valued quarterly at fair value using the Black-Scholes model to determine the amount of compensation expense to be recognized. Non-vested RSUs do not earn dividends.
The following management assumptions were used in the Black-Scholes model to calculate the fair value of the non-vested stock options and RSUs:
|
|
|
|
Volatility
|
| 9.5 - 26.1
| %
|
Expected life (years)
|
| 0.6 - 3.6
|
|
Dividend yield rate
|
| 3.7 - 4.7
| %
|
Risk-free interest rate
|
| 4.3 - 4.9
| %
|
At the 2006 Annual Shareholder’s Meeting, DPL’s shareholders approved The DPL Inc. 2006 Equity and Performance Incentive Plan. Under the EPIP, the Board adopted a Long-Term Incentive Plan (LTIP) under which DPL will award a targeted number of performance shares of common stock to executives. Awards under the LTIP will be awarded based on a Total Shareholder Return Relative to Peers performance. No performance shares will be earned in a performance period if the three-year Total Shareholder Return Relative to Peers is below the threshold of the 40th percentile. Further, the LTIP awards will be capped at 200% of the target number of performance shares, if the Total Shareholder Return Relative to Peers is at or above the threshold of the 90th percentile. The Total Shareholder Return Relative to Peers is considered a performance condition under FAS 123R. The requisite performance period for each tranche of the Performance Shares is:
Tranche 1
| | January 1, 2004 to December 31, 2006
|
Tranche 2
| | January 1, 2005 to December 31, 2007
|
Tranche 3
| | January 1, 2006 to December 31, 2008
|
The schedule of non-vested performance share activity for the twelve months ended December 31, 2006 follows:
| | Number of | | Weighted-Avg. | |
| | Performance | | Grant Date | |
$ in millions | | Shares | | Fair Value | |
Non-vested at January 1, 2006 | | — | | $ | — | |
Granted in 2006 | | 244,423 | | $ | 6.3 | |
Vested in 2006 | | (44,045 | ) | $ | (1.2 | ) |
Forfeited in 2006 | | (89,655 | ) | $ | (2.4 | ) |
Non-vested at December 31, 2006 | | 110,723 | | $ | 2.7 | |
|
| December 31,
|
|
|
| 2006
|
|
Performance Shares:
| | | |
Outstanding at beginning of year
|
| —
|
|
Granted
|
| 244,423
|
|
Exercised
|
| —
|
|
Forfeited
|
| (89,655
| )
|
Outstanding at end of period
|
| 154,768
|
|
Exercisable at end of period
|
| 44,045
|
|
Performance shares do not have an exercise price.
As of December 31, 2006, there was $1.9 million of total unrecognized compensation cost related to non-vested performance shares granted under the LTIP. We expect to recognize $1.5 million of this cost in 2007 and $0.4 million in 2008. A forfeiture rate of 20% was estimated in calculating the compensation expense.
Shares issued upon achievement of the required performance condition will be issued from treasury stock. DPL believes it has sufficient treasury stock to satisfy outstanding performance shares.
85
The following management assumptions were used in the Monte Carlo simulation calculated by an actuarial consultant to estimate the fair value of the performance shares:
Volatility
|
|
|
| 17.9% - 20.3%
| |
Expected life (years)
|
|
|
| 3.0
| |
Dividend yield rate
|
|
|
| 3.7%
| |
Risk-free interest rate
|
|
|
| 4.6% - 4.7%
| |
On October 2, 2006, Paul M. Barbas (President and Chief Executive Officer) was granted 19,000 shares of DPL Inc. Restricted Stock (Restricted Shares), granted under the 2006 Equity and Performance Incentive Plan. The Restricted Shares are to be registered in Mr. Barbas’ name, receive dividends as declared and paid on all DPL common stock and will vest in two tranches. A total of 9,000 Restricted Shares shall become non-forfeitable on December 31, 2009 if Mr. Barbas remains in the continuous employ of the Company until such date. The remaining 10,000 Restricted Shares will become non-forfeitable on December 31, 2011 if Mr. Barbas remains a Company employee.
| | Number of | | Weighted-Avg. | |
| | Performance | | Grant Date | |
$ in millions | | Shares | | Fair Value | |
Non-vested at January 1, 2006 | | — | | $ | — | |
Granted in 2006 | | 19,000 | | $ | 0.5 | |
Vested in 2006 | | — | | $ | — | |
Forfeited in 2006 | | — | | $ | — | |
Non-vested at December 31, 2006 | | 19,000 | | $ | 0.5 | |
|
| December 31,
|
|
|
| 2006
|
|
Restricted Shares:
| | | |
Outstanding at beginning of year
| | —
| |
Granted
| | 19,000
| |
Exercised
| | —
| |
Forfeited
| | —
| |
Outstanding at end of period
| | 19,000
| |
Exercisable at end of period
| | —
| |
Restricted shares do not have an exercise price.
As of December 31, 2006, there was $0.5 million of total unrecognized compensation cost related to non-vested restricted shares granted under the EPIP. We expect to recognize $0.1 million of this cost annually over the next five years.
Restricted shares will be issued from treasury stock. DPL believes it has sufficient treasury stock to satisfy outstanding restricted shares.
For the quarter ended December 31, 2006, total compensation expense was $1.7 million with an associated tax benefit of $0.7 million. Compensation expense for the year ended December 31, 2006 was $5.8 million for all share-based compensation (stock options, RSUs, restricted shares and performance shares) and the tax benefit associated with these expenses was $2.1 million.
For the year ended December 31, 2006, operating income was $0.7 million higher under SFAS 123R than under SFAS 123, while the impact to net income was $0.5 million due to a decrease in the tax benefit of $0.2 million. There was no impact on basic or diluted earnings per share.
10. Ownership of Facilities
We and other Ohio utilities have undivided ownership interests in seven electric generating facilities and numerous transmission facilities. Certain expenses, primarily fuel costs for the generating units, are allocated to the owners based on their energy usage. The remaining expenses, as well as investments in fuel inventory, plant materials and operating supplies, and capital additions, are allocated to the owners in accordance with their respective ownership interests. As of December 31, 2006, we had $359 million of construction in progress at such facilities. Our share of the operating cost of such facilities is included in the Consolidated Statement of Results of Operations, and its share of the investment in the facilities is included in the Consolidated Balance Sheets.
Our undivided ownership interest in such facilities at December 31, 2006, is as follows:
| | | | | | DP&L | |
| | DP&L Share | | Investment | |
| | | | Production | | Gross Plant | |
| | Ownership | | Capacity | | In Service | |
| | (%) | | (MW) | | ($ in millions) | |
Production Units: | | | | | | | |
Beckjord Unit 6 | | 50.0 | | 210 | | $ | 62 | |
Conesville Unit 4 | | 16.5 | | 129 | | 34 | |
East Bend Station | | 31.0 | | 186 | | 198 | |
Killen Station | | 67.0 | | 428 | | 427 | |
Miami Fort Units 7 & 8 | | 36.0 | | 360 | | 195 | |
Stuart Station | | 35.0 | | 839 | | 383 | |
Zimmer Station | | 28.1 | | 365 | | 1,045 | |
| | | | | | | |
Transmission (at varying percentages) | | | | | | 89 | |
| | | | | | | | |
11. Discontinued Operations
| | For the years ended | |
| | December 31, | |
$ in millions | | 2006 | | 2005 | | 2004 | |
Investment income | | $ | — | | $ | 41.3 | | $ | 178.5 | |
Investment expenses | | (1.3 | ) | (9.5 | ) | (23.6 | ) |
Income from discontinued operations | | (1.3 | ) | 31.8 | | 154.9 | |
| | | | | | | |
Gain realized from sale | | 18.9 | | 53.1 | | — | |
Broker fees and other expenses | | — | | (6.5 | ) | — | |
Loss recorded | | — | | (5.6 | ) | — | |
Net gain on sale | | 18.9 | | 41.0 | | — | |
| | | | | | | |
Earnings before income taxes | | 17.6 | | 72.8 | | 154.9 | |
Income tax expense | | (3.6 | ) | (19.9 | ) | (59.1 | ) |
Earnings from discontinued operations, net | | $ | 14.0 | | $ | 52.9 | | $ | 95.8 | |
On February 13, 2005, DPL’s subsidiaries, MVE and MVIC, entered into an agreement to sell their respective interests in forty-six private equity funds to AlpInvest/Lexington 2005, LLC, a joint venture of AlpInvest Partners and Lexington Partners, Inc. Sales proceeds and any related gains or losses were recognized as the sale of each fund closed. Among other closing conditions, each fund required the transaction to be approved by the respective general partner of each fund. During 2005, MVE and MVIC completed the sale of their interests in forty-three and a portion of one of those private equity funds resulting in a $46.6 million pre-tax gain ($53.1 million less $6.5 million professional fees) from discontinued operations and provided approximately $796 million in net proceeds, including approximately $52 million in net distributions from funds
while held for sale. As part of this pre-tax gain, we realized $30 million that was previously recorded as an unrealized gain in other comprehensive income.
During 2005, MVE entered into alternative closing arrangements with AlpInvest/Lexington 2005, LLC for funds where legal title to said funds could not be transferred until a later time. Pursuant to these arrangements, MVE transferred the economic aspects of the remaining private equity funds, consisting of two funds and a portion of one fund, to AlpInvest/Lexington 2005, LLC without a change in ownership of the interests. The terms of the alternative arrangements do not meet the criteria for recording a sale. DPL is obligated to remit to AlpInvest/Lexington 2005, LLC any distributions MVE receives from these funds, and AlpInvest/Lexington 2005, LLC is obligated to provide funds to DPL to pay any contribution notice, capital call or other payment notice or bill for which MVE receives notice with respect to such funds. The alternative arrangements resulted in a 2005 deferred gain of $27.1 million until such terms of a sale can be completed (contingent upon receipt of general partner approvals of the transfer) and in 2005 provided approximately $72 million in net proceeds on these funds. We recorded an impairment loss of $5.6 million in the second quarter of 2005 to write down assets transferred pursuant to the alternative arrangements to estimated fair value. Ownership of these funds will transfer after the general partners of each of the separate funds consent to the transfer.
On March 31, 2006, MVE completed the sale of the remaining portion of one private equity fund, for which MVE had previously entered into an alternative closing arrangement resulting in the recognition of $13.2 million of the deferred gain. On August 31, 2006, MVE completed the sale of a portion of one of the two remaining private equity funds, resulting in recognition of $5.7 million of the deferred gain. The sale of the residual portion of this private equity fund was completed during the first quarter of 2007, resulting in the recognition of approximately $8.2 million of the deferred gain. The transfer of the one remaining fund is expected to be completed in 2008.
DPL did not have any income from discontinued operations in 2006 due to the sale of the portfolio, but there were $1.3 million in legal fees directly relating to the ongoing litigation related to the asset portfolio. DPL’s income from discontinued operations (pre-tax) for the year ended December 31, 2005 of $31.8 million is comprised of $41.3 million of investment income less $9.5 million of associated management fees and other expenses. Income from discontinued operations (pre-tax) for the year ended December 31, 2004 of $154.9 million is comprised of $178.5 million of investment income less $23.6 million of associated management fees and other expenses.
For the year ended December 31, 2006, DPL recognized $18.9 million of the gain deferred in 2005 from the sale of the portfolio. For the year ended December 31, 2005, DPL recognized a $41.0 million pre-tax gain ($53.1 million less $6.5 million of professional fees and $5.6 million impairment loss), deferred gains of $27.1 million on transferred funds from discontinued operations, and provided approximately $868.4 million in net proceeds, including approximately $52 million in net distributions from funds held for sale. DPL will continue to incur minor amounts of fees in the near term.
In 2006 and 2005, DPL has separately disclosed the earnings from discontinued operations, net of income taxes, which in prior periods were reported with elements of continued operations. Also in 2006 and 2005, we have separately disclosed the investing portions of the cash flows attributable to its discontinued operations (there was no impact on the operating or investing portions of the cash flows), which in prior periods were reported on a combined basis as a single amount.
12. Financial Instruments
The fair value of financial instruments is based on current public market prices, discounted cash flows using current rates for similar issues with similar terms and remaining maturities or independent party valuations, which are believed to approximate market. The basis on which the cost of a security sold or the amount reclassified out of accumulated other comprehensive income was determined by specific identification. The table below presents the fair value, unrealized gains and losses, and cost of these instruments at December 31, 2006 and 2005.
| | At December 31, | |
| | 2006 | | 2005 | |
| | | | Gross Unrealized | | | | | | Gross Unrealized | | | |
| | | | | | Losses | | | | | | | | Losses | | | |
| | | | | | less | | more | | | | | | | | less | | more | | | |
| | | | | | than 12 | | than 12 | | | | | | | | than 12 | | than 12 | | | |
$ in millions | | Fair Value | | Gains | | months | | months | | Cost | | Fair Value | | Gains | | months | | months | | Cost | |
DPL Inc. | | | | | | | | | | | | | | | | | | | | | |
Assets | | | | | | | | | | | | | | | | | | | | | |
Public Securities | | | | | | | | | | | | | | | | | | | | | |
Available-for-sale Securities | | $ | 39.9 | | $ | 5.5 | | $ | (0.7 | ) | $ | (3.1 | ) | $ | 38.2 | | $ | 24.8 | | $ | 3.5 | | $ | (0.2 | ) | $ | (2.9 | ) | $ | 24.4 | |
Hold-to-maturity Debt securities (a) | | — | | — | | — | | — | | — | | 7.9 | | — | | (0.2 | ) | — | | 8.1 | |
Derivatives | | 3.2 | | 3.2 | | — | | — | | — | | — | | — | | — | | — | | — | |
Total assets | | $ | 43.1 | | $ | 8.7 | | $ | (0.7 | ) | $ | (3.1 | ) | $ | 38.2 | | $ | 32.7 | | $ | 3.5 | | $ | (0.4 | ) | $ | (2.9 | ) | $ | 32.5 | |
| | | | | | | | | | | | | | | | | | | | | |
Liabilities | | | | | | | | | | | | | | | | | | | | | |
Long-term debt (b) | | $ | 1,798.5 | | | | | | | | $ | 1,777.7 | | $ | 1,717.5 | | | | | | | | $ | 1,678.0 | |
| | | | | | | | | | | | | | | | | | | | | |
Capitalization | | | �� | | | | | | | | | | | | | | | | | | |
Unallocated shares in ESOP | | $ | 101.1 | | | | | | | | $ | 44.1 | | $ | 100.1 | | | | | | | | $ | 49.3 | |
| | | | | | | | | | | | | | | | | | | | | |
DP&L | | | | | | | | | | | | | | | | | | | | | |
Assets | | | | | | | | | | | | | | | | | | | | | |
Public Securities | | | | | | | | | | | | | | | | | | | | | |
Available-for-sale Securities | | $ | 109.5 | | $ | 41.1 | | $ | (0.7 | ) | (3.1 | ) | $ | 72.2 | | $ | 100.4 | | $ | 36.7 | | $ | (0.2 | ) | $ | (2.9 | ) | $ | 66.8 | |
Hold-to-maturity Debt securities (a) | | | | | | | | | | | | 7.9 | | — | | (0.2 | ) | — | | 8.1 | |
Derivatives | | 3.2 | | 3.2 | | — | | — | | — | | — | | — | | — | | — | | — | |
Total assets | | $ | 112.7 | | $ | 44.3 | | $ | (0.7 | ) | $ | (3.1 | ) | $ | 72.2 | | $ | 108.3 | | $ | 36.7 | | $ | (0.4 | ) | $ | (2.9 | ) | $ | 74.9 | |
| | | | | | | | | | | | | | | | | | | | | |
Liabilities | | | | | | | | | | | | | | | | | | | | | |
Long-term debt (b) | | $ | 785.8 | | | | | | | | $ | 786.1 | | $ | 685.2 | | | | | | | | $ | 686.8 | |
(a) Maturities range from 2006 to 2035.
(b) Includes current maturities.
In the normal course of business, we enter into various financial instruments, including derivative financial instruments. These instruments consist of forward contracts that are used to reduce our exposure to changes in energy and commodity prices. These financial instruments are designated at inception as highly effective cash-flow hedges and are measured for effectiveness both at inception and on an ongoing basis, with gains or losses deferred in Accumulated Other Comprehensive Income until the underlying hedged transaction is realized, canceled or otherwise terminated. The forward contracts generally mature within twelve months.
13.14. Earnings per Share
Basic earnings per share (EPS) are based on the weighted-average number of DPLcommon shares outstanding during the year. Diluted earnings per shareEPS are based on the weighted-average number of DPL common and common equivalent shares outstanding during the year, except in periods where the inclusion of such common equivalent shares is anti-dilutive. Excluded from outstanding shares for this weighted-average computation are shares held by DP&L’s Master Trust Plan for deferred compensation and by theunreleased shares held in ESOP.
For the years 2006, 2005, and 2004, respectively, approximately 0.4 million, 0.5 million, and 28.0 million warrants and stock options were
The following table represents common equivalent shares excluded from the computationcalculation of diluted earnings per shareEPS because they were anti-dilutive. These warrants and stock options couldshares may be dilutive in the future.
In millions | | 2008 | | 2007 | | 2006 | |
| | | | | | | |
Common equivalent shares | | 0.3 | | 0.1 | | 0.4 | |
The following illustrates the reconciliation of the numerators and denominators of the basic and diluted earnings per shareEPS computations for income after discontinued operations and cumulative effect of accounting change:
| | | | | | | | | | | | | | | | | | | |
| | 2006 | | 2005 | | | 2004 | |
$ in millions except per | | (a) | | | | Per | | (a) | | | | Per | | (a) | | | | Per | |
share amounts | | Income | | Shares | | Share | | Income | | Shares | | Share | | Income | | Shares | | Share | |
Basic EPS | | $ | 139.6 | | 112.3 | | $ | 1.24 | | $ | 174.4 | | 121.0 | | $ | 1.44 | | $ | 217.3 | | 120.1 | | $ | 1.81 | |
| | | | | | | | | | | | | | | | | | | |
Effect of Dilutive Securities: | | | | | | | | | | | | | | | | | | | |
Stock Incentive Units | | | | 1.3 | | | | | | 1.2 | | | | | | 1.2 | | | |
Warrants | | | | 7.1 | | | | | | 6.1 | | | | | | 0.6 | | | |
Stock options, performance and restricted shares | | | | 1.2 | | | | | | 0.8 | | | | | | 0.2 | | | |
| | | | | | | | | | | | | | | | | | | |
Diluted EPS | | $ | 139.6 | | 121.9 | | $ | 1.15 | | $ | 174.4 | | 129.1 | | $ | 1.35 | | $ | 217.3 | | 122.1 | | $ | 1.78 | |
$ and shares in millions except per share amounts
| | 2008 | | 2007 | | 2006 | |
| | Income | | Shares | | Per
Share | | (a)
Income | | Shares | | Per
Share | | (a)
Income | | Shares | | Per
Share | |
Basic EPS | | $ | 244.5 | | 110.2 | | $ | 2.22 | | $ | 221.8 | | 107.9 | | $ | 2.06 | | $ | 139.6 | | 112.3 | | $ | 1.24 | |
| | | | | | | | | | | | | | | | | | | |
Effect of Dilutive Securities: | | | | | | | | | | | | | | | | | | | |
Stock Incentive Units | | | | — | | | | | | 0.5 | | | | | | 1.3 | | | |
Warrants (b) | | | | 5.0 | | | | | | 8.6 | | | | | | 7.1 | | | |
Stock options, performance and restricted shares | | | | 0.2 | | | | | | 0.8 | | | | | | 1.2 | | | |
| | | | | | | | | | | | | | | | | | | |
Diluted EPS | | $ | 244.5 | | 115.4 | | $ | 2.12 | | $ | 221.8 | | 117.8 | | $ | 1.88 | | $ | 139.6 | | 121.9 | | $ | 1.15 | |
(a) Income after discontinued operations and cumulative effect of accounting change.
14. Assets Held for Saleoperations.
(b) On September 18, 2008, Lehman Brothers Inc. exercised 12 million warrants under a cashless exerciseIn connection with DPLE’s (significant subsidiary of DPL) decision to selltransaction resulting in the Greenville Station and Darby Station electric peaking generation facilities,issuance by DPL concluded that an impairment charge for the Greenville Station and Darby Station assets was required. Greenville Station consists of four natural gas peaking units with a net book value2.3 million shares of approximately $66 million. Darby Station consistscommon stock. See Note 13 of six natural gas peaking units with a net book valueNotes to Consolidated Financial Statements.
108
Table of approximately $156 million. DPLE plans to sell the Greenville Station and Darby Station assets for $49 million and $102 million, respectively, in two separate transactions. These sales are expected to take place during the first half of 2007.Contents
During the fourth quarter of 2006, DPL recorded a $71.0 million impairment charge to record the fair market write-down of the assets and other associated costs related to the sale.
These assets are no longer being depreciated. The assets and liabilities held for sale in the Consolidated Balance Sheet are as follows:
($ in millions) | | | |
Current Assets: | | | |
Inventories | | $ | 0.2 | |
| | | |
Property: | | | |
Property, plant and equipment | | $ | 283.5 | |
Less: Accumulated depreciation and amortization | | (132.3 | ) |
Net Property, plant and equipment | | $ | 151.2 | |
| | | |
Current Liabilities: | | | |
Accounts payable and accrued expenses | | $ | 0.2 | |
15. Executive Litigation
On May 21, 2007, we settled the litigation with three former executives. As part of this settlement, the three former executives relinquished and dismissed all their claims including those related to certain deferred compensation, RSUs, MVE incentives, stock options and legal fees. The RSUs and stock options relinquished and forfeited were 1.3 million and 3.6 million, respectively. Prior to the settlement date, we had accrued obligations of $64.2 million. Included in these amounts was $3.1 million associated with the forfeiture of stock options. In exchange for our payment of $25 million and the relinquishment by the former executives of certain contested compensation discussed above, all of these claims by all parties were settled and released.
DPL
As a result of this settlement, during 2007, DPL realized a net pre-tax gain in continuing and discontinued operations of approximately $31.0 million and $8.2 million, respectively. The net gain is comprised of the reversal of the $64.2 million of accrued obligations less the $25 million settlement. The obligations related to the discontinued operations were associated with the management of DPL’s financial asset portfolio, which was conducted in our MVE subsidiary. The MVE operations were discontinued in 2005 with the sale of the financial asset portfolio. The $25 million settlement expense was allocated between continuing and discontinued operations based on the proportionate share of continuing and discontinued obligations.
DP&L
As a result of this settlement during 2007, DP&L realized a net pre-tax gain in continuing operations of $35.3 million. Accrued obligations associated with the former executives’ litigation were recorded by DP&L since the obligations were associated with our non-qualified benefit plans. DP&L had no ownership of DPL’s discontinued financial asset portfolio business, therefore these liabilities were reversed and DP&L’s net pre-tax gain was recorded within continuing operations.
The $25 million settlement was funded from the sale of financial assets held in DP&L’s Master Trust Plan for deferred compensation. As part of this transaction, during the second quarter ended June 30, 2007, DPL and DP&L recorded a $3.2 million realized gain which was reflected in investment income.
16. Insurance Recovery
On April 30, 2007, DP&L executed a settlement agreement for $14.5 million with one of our insurers, Associated Electric & Gas Insurance Services (AEGIS), under a fiduciary liability policy to recoup a portion of legal fees associated with our litigation against three former executives. This was recorded as a reduction to operation and maintenance expense during 2007.
On May 16, 2007, DPL filed an insurance claim with Energy Insurance Mutual (EIM) to recoup legal expenses associated with our litigation against three of our former executives. The litigation against the former executives was settled on May 21, 2007. Mediation with EIM on this claim occurred on May 29, 2008, at which time the parties did not reach agreement. DPL and EIM are currently engaged in an arbitration process regarding this insurance claim.
109
Table of Contents
17. Contractual Obligations, Commercial Commitments and Contingencies
DPL Inc. - Guarantees
In the normal course of business, DPL enters into various agreements with its wholly-owned generating subsidiary DPLE providing financial or performance assurance to third parties. These agreements are entered into primarily to support or enhance the creditworthiness otherwise attributed to DPLE on a stand-alone basis, thereby facilitating the extension of sufficient credit to accomplish DPLE’s intended commercial purposes. Such agreements fall outside the scope of FASB Interpretation No. 45, “Guarantor’s Accounting and Disclosure Requirements for Guarantees, Including Indirect Guarantees of Indebtedness of Others.”
At December 31, 2008, DPL had $35.3 million of guarantees to third parties for future financial or performance assurance under such agreements, on behalf of DPLE. The guarantee arrangements entered into by DPL with these third parties cover all present and future obligations of DPLE to such beneficiaries and are terminable at any time by DPL upon written notice to the beneficiaries. The carrying amount of obligations for commercial transactions covered by these guarantees and recorded in our consolidated balance sheets was $1.6 million at December 31, 2008.
In two separate transactions in November and December 2006, DPL also agreed to be a guarantor of the obligations of DPLE regarding the sale, in April 2007, of the Darby Electric Peaking Station to American Electric Power and the sale of the Greenville Electric Peaking Station to Buckeye Electric Power, Inc. In both cases, DPL agreed to guarantee the obligations of DPLE over a multiple year period as follows:
$ in millions | | 2008 | | 2009 | | 2010 | |
Darby | | $ | 23.0 | | $ | 15.3 | | $ | 7.7 | |
| | | | | | | |
Greenville | | $ | 11.1 | | $ | 7.4 | | $ | 3.7 | |
In 2008, neither DPL nor DP&L incurred any losses related to the guarantees of DPLE’s obligations and we believe it is unlikely that either DPL or DP&L would be required to perform or incur any losses in the future associated with any of the above guarantees of DPLE’s obligations.
DP&L - Equity Ownership Interest
DP&L owns a 4.9% equity ownership interest in an electric generation company. As of December 31, 2008, DP&L could be responsible for the repayment of 4.9%, or $51.2 million, of a $1,045 million debt obligation that matures in 2026. This would only happen if this electric generation company defaulted on its debt payments.
Other than the guarantees discussed above, DPL and DP&L do not have any other off-balance sheet arrangements that have or are reasonably likely to have a current or future material effect on our financial condition, revenues or expenses, results of operations, liquidity, capital expenditures or capital resources.
110
Table of Contents
Contractual Obligations and Commercial Commitments
We enter into various contractual obligations and other commercial commitments that may affect the liquidity of our operations. At December 31, 2006,2008, these include:
| | | | Payment Year | |
$ in millions | | Total | | 2009 | | 2010-2011 | | 2012-2013 | | Thereafter | |
DPL | | | | | | | | | | | |
| | | | | | | | | | | |
Long-term debt | | $ | 1,551.8 | | $ | 175.0 | | $ | 297.4 | | $ | 470.0 | | $ | 609.4 | |
Interest payments | | 937.1 | | 79.7 | | 145.7 | | 105.6 | | 606.1 | |
Pension and postretirement payments | | 244.9 | | 22.8 | | 46.7 | | 48.6 | | 126.8 | |
Capital leases | | 1.3 | | 0.7 | | 0.6 | | — | | — | |
Operating leases | | 0.8 | | 0.4 | | 0.3 | | 0.1 | | — | |
Coal contracts (a) | | 1,675.1 | | 514.2 | | 539.8 | | 168.4 | | 452.7 | |
Limestone contracts | | 52.2 | | 4.7 | | 10.8 | | 11.5 | | 25.2 | |
Reserve for uncertain tax positions | | 1.9 | | — | | 1.9 | | — | | — | |
Other contractual obligations | | 97.3 | | 40.5 | | 46.9 | | 8.5 | | 1.4 | |
Total contractual obligations | | $ | 4,562.4 | | $ | 838.0 | | $ | 1,090.1 | | $ | 812.7 | | $ | 1,821.6 | |
| | | | | | | | | | | |
DP&L | | | | | | | | | | | |
| | | | | | | | | | | |
Long-term debt | | $ | 884.4 | | $ | — | | $ | — | | $ | 470.0 | | $ | 414.4 | |
Interest payments | | 519.9 | | 40.0 | | 79.9 | | 73.9 | | 326.1 | |
Pension and postretirement payments | | 244.9 | | 22.8 | | 46.7 | | 48.6 | | 126.8 | |
Capital leases | | 1.3 | | 0.7 | | 0.6 | | — | | — | |
Operating leases | | 0.8 | | 0.4 | | 0.3 | | 0.1 | | — | |
Coal contracts (a) | | 1,675.1 | | 514.2 | | 539.8 | | 168.4 | | 452.7 | |
Limestone contracts | | 52.2 | | 4.7 | | 10.8 | | 11.5 | | 25.2 | |
Reserve for uncertain tax positions | | 1.9 | | — | | 1.9 | | — | | — | |
Other contractual obligations | | 99.5 | | 41.6 | | 48.0 | | 8.5 | | 1.4 | |
Total contractual obligations | | $ | 3,480.0 | | $ | 624.4 | | $ | 728.0 | | $ | 781.0 | | $ | 1,346.6 | |
Contractual Obligations
| | | | Payment Year | |
| | | | Less Than | | 2 - 3 | | 4 - 5 | | More Than | |
$ in millions | | Total | | 1 Year | | Years | | Years | | 5 Years | |
DPL | | | | | | | | | | | |
| | | | | | | | | | | |
Long-term debt | | $ | 1,774.8 | | $ | 225.0 | | $ | 275.0 | | $ | 297.4 | | $ | 977.4 | |
Interest payments | | 1,101.8 | | 98.8 | | 171.2 | | 144.0 | | 687.8 | |
Pension and postretirement payments | | 235.6 | | 22.0 | | 45.2 | | 46.5 | | 121.9 | |
Capital leases | | 2.9 | | 0.9 | | 1.4 | | 0.6 | | — | |
Operating leases | | 0.7 | | 0.3 | | 0.3 | | 0.1 | | — | |
Coal contracts (a) | | 554.6 | | 324.4 | | 118.4 | | 111.8 | | — | |
Limestone contracts | | 58.7 | | 1.7 | | 9.5 | | 10.8 | | 36.7 | |
Other contractual obligations | | 391.7 | | 328.5 | | 53.7 | | 9.5 | | — | |
Total contractual obligations | | $ | 4,120.8 | | $ | 1,001.6 | | $ | 674.7 | | $ | 620.7 | | $ | 1,823.8 | |
| | | | | | | | | | | |
DP&L | | | | | | | | | | | |
| | | | | | | | | | | |
Long-term debt | | $ | 783.2 | | $ | — | | $ | — | | $ | — | | $ | 783.2 | |
Interest payments | | 571.9 | | 39.1 | | 78.3 | | 78.3 | | 376.2 | |
Pension and postretirement payments | | 235.6 | | 22.0 | | 45.2 | | 46.5 | | 121.9 | |
Capital leases | | 2.9 | | 0.9 | | 1.4 | | 0.6 | | — | |
Operating leases | | 0.7 | | 0.3 | | 0.3 | | 0.1 | | — | |
Coal contracts (a) | | 554.6 | | 324.4 | | 118.4 | | 111.8 | | — | |
Limestone contracts | | 58.7 | | 1.7 | | 9.5 | | 10.8 | | 36.7 | |
Other contractual obligations | | 391.5 | | 328.4 | | 53.6 | | 9.5 | | — | |
Total contractual obligations | | $ | 2,599.1 | | $ | 716.8 | | $ | 306.7 | | $ | 257.6 | | $ | 1,318.0 | |
(a) Total at DP&L-&Loperated-operated units
Long-term debt:
DPL’s long-term debt as of December 31, 2006,2008, consists of DP&L’s first mortgage bonds, tax-exempt pollution control bonds and DPL unsecured notes and includessenior notes. These long-term debt figures include current maturities and unamortized debt discounts. During 2006,2008, the OAQDA issued $100 million of tax-exempt pollution control bonds which mature in 2040. In turn, DP&L entered intoborrowed the proceeds of the bonds and issued $100 million of long-term tax-exempt debt.its First Mortgage Bonds to secure its payment obligations.
DP&L’s long-term debt as of December 31, 2006,2008, consists of first mortgage bonds and tax-exempt pollution control bonds. These long-term debt figures include current maturities and unamortized debt discounts. During 2008, the OAQDA issued $100 million of tax-exempt pollution control bonds which mature in 2040. In turn, DP&L borrowed the proceeds of the bonds and includes an unamortized debt discount.issued $100 million of its First Mortgage Bonds to secure its payment obligations.
See Note 87 of Notes to Consolidated Financial Statements.
Interest payments:
Interest payments associated with the Long-termlong-term debt described above.
Pension and postretirement payments:
As of December 31, 2006,2008, DP&L had estimated future benefit payments as outlined in Note 59 of Notes to Consolidated Financial Statements. These estimated future benefit payments are projected through 2015.2018.
Capital leases:
As of December 31, 2006,2008, DP&L had twoone capital leaseslease that expireexpires in November 2007 and September 2010.
Operating leases:
As of December 31, 2006,2008, DPLand DP&L had several operating leases with various terms and expiration dates. Not included in this total is approximately $88,000 per year related to right
111
Limestone contracts:
DP&L has entered into various limestone contracts to supply limestone for its generating facilities.
Reserve for uncertain tax positions:
On January 1, 2007, we adopted Financial Accounting Standards Board (FASB) Interpretation No. 48, “Accounting for Uncertainty in Income Taxes” (FIN 48). As of December 31, 2008, our total reserve for uncertain tax positions is $1.9 million. See Note 1 of Notes to Consolidated Financial Statements.
Other contractual obligations:
As of December 31, 2006,2008, DPL and DP&L had various other contractual obligations including non-cancelable contracts to purchase goods and services with various terms and expiration dates.
We enter into various
At December 31, 2008, the commercial commitments whichthat may affect the liquidity of our operations. At December 31, 2006, theseoperations include:
Credit facilities:
In November 2006, DP&L replaced its previous $100 million revolving credit agreement with a $220 million five year facility that expires on November 21, 2011. At December 31, 2006,2008, there were no borrowings outstanding under this credit agreement. DP&L has the ability to increase the size of the facility by an additional $50 million at any time.
Guarantees:
DP&L owns a 4.9% equity ownership interest in an electric generation company. As of December 31, 2006, DP&L could be responsible for the repayment of 4.9%, or $21.8 million, of a $445 million debt obligation that matures in 2026.
In two separate transactions in November and December 2006, DPL agreed to be a guarantor of the obligations of its wholly-owned subsidiary, DPL Energy, LLC (DPLE) regarding the pending sale of the Darby Electric Peaking Station to American Electric Power and the sale of the Greenville Electric Peaking Station to Buckeye Electric Power, Inc. In both cases, DPL has agreed to guarantee the obligations of DPLE over a multiple year period as follows:
| | 2007 | | 2008 | | 2009 | | 2010 | |
Darby | | $ | 30.6 | | $ | 23.0 | | $ | 15.3 | | $ | 7.7 | |
| | | | | | | | | |
Greenville | | $ | 14.8 | | $ | 11.1 | | $ | 7.4 | | $ | 3.7 | |
Contingencies
In the normal course of business, we are subject to various lawsuits, actions, proceedings, claims and other matters asserted under laws and regulations. We believe the amounts provided in our consolidated financial statements, as prescribed by GAAP, are adequate in light of the probable and estimable contingencies. (SeeSee Note 1 of Notes to Consolidated Financial Statements.) However, there can be no assurances that the actual amounts required to satisfy alleged liabilities from various legal proceedings, claims, tax examinations and other matters discussed below, and to comply with applicable laws and regulations, will not exceed the amounts reflected in our Consolidated Financial Statements.consolidated financial statements. As such, costs, if any, that may be incurred in excess of those amounts provided as of December 31, 2006,2008, cannot be reasonably determined.
Environmental Matters
DPL,DP&L and our subsidiaries’ facilities and operations are subject to a wide range of environmental regulations and law. In the normal course of business, we have investigatory and remedial activities underway at these facilities to comply, or to determine compliance, with such regulations. We have been identified, either by a government agency or by a private party seeking contribution to site clean-up costs, as a potentially responsible party (PRP) at two sites pursuant to state and federal laws. We record liabilities for
probable estimated loss in accordance with Statement of Financial Accounting Standards No. 5 (SFAS 5), “Accounting for Contingencies.” To the extent a probable loss can only be estimated by referenceContingencies” as discussed in Note 1 of Notes to a range of equally probable outcomes, and no amount within the range appears to be a better estimate than any other amount, we accrue for the low end of the range. Because of uncertainties related to these matters accruals are based on the best information available at the time.Consolidated Financial Statements. We evaluate the potential liability related to probable losses quarterly and may revise itsour estimates. Such revisions in the estimates of the potential liabilities could have a material effect on our results of operations and financial position.
112
Table of Contents
18. Legal Matters
Former Executive Litigation
On August 24, 2004, DPL, and its subsidiaries DP&L and MVE, filed a Complaint (and subsequently, amended complaints) against Mr. Forster, Ms. Muhlenkamp and Mr. Koziar (the Defendants) in the Court of Common Pleas of Montgomery County, Ohio asserting legal claims against them relating to the termination of the Valley Partners Agreements, challenging the validity of the purported amendments to the deferred compensation plans and to the employment and consulting agreements with the Defendants, and the propriety of the distributions from the plans to the Defendants, and alleging that the Defendants breached their fiduciary duties and breached their consulting and employment contracts. DPL, DP&L and MVE seek, among other things, damages in excess of $25,000, disgorgement of all amounts improperly withdrawn by the Defendants from the plans and a court order declaring that DPL, DP&L and MVE have no further obligations under the consulting and employment contracts due to those breaches.
The Defendants have filed their answers (and subsequently, amended answers) denying liability and filed counterclaims (and subsequently, amended counterclaims) against DPL, DP&L, MVE, various compensation plans (the Plans), and current and former employees and current and former members of our Board of Directors. These counterclaims, as amended, allege generally that DPL, DP&L, MVE, the Plans and the individual defendants breached the terms of the employment and consulting contracts of the Defendants, and the terms of the Plans. They further allege theories of breach of fiduciary duty, breach of contract, promissory estoppel, tortious interference, conversion, replevin and violations of ERISA under which they seek distribution of deferred compensation balances, conversion of stock incentive units, exercise of options and payment of amounts allegedly owed under the contracts and the Plans. Defendants’ counterclaims also demand payment of attorneys’ fees.
On March 15, 2005, Mr. Forster and Ms. Muhlenkamp filed a lawsuit in New York state court against the purchasers of the private equity investments in the financial asset portfolio and against outside counsel to DPL and DP&L concerning purported entitlements in connection with the purchase of those investments. DPL, DP&L and MVE are not defendants in that case; however, the three of us are parties to an indemnification agreement with respect to the purchaser defendants. On August 18, 2005, the Ohio court issued a preliminary injunction against Mr. Forster and Ms. Muhlenkamp that precludes them from pursuing certain key issues raised by Mr. Forster and Ms. Muhlenkamp in their New York lawsuit that are identical to the issues raised in the pending Ohio lawsuit in the New York court or any other forum other than the Ohio litigation. In addition, the New York court has stayed the New York litigation pending the outcome of the Ohio litigation. Mr. Forster and Ms. Muhlenkamp have appealed the preliminary injunction and the appeal is pending at the Ohio Supreme Court.
The trial commencement date for this case is set for April 30, 2007.
Cumulatively through December 31, 2006, we have accrued for accounting purposes, obligations of approximately $56 million to reflect claims regarding deferred compensation, estimated MVE incentives and/or legal fees that Defendants assert are payable per contracts. We dispute Defendants’ entitlement to any of those sums and, as noted above, are pursuing litigation against them contesting all such claims.
On or about June 24, 2004, the SEC commenced a formal investigation into the issues raised by the Memorandum (see Note 17 of the Notes to the Consolidated Financial Statements). Although the SEC has not taken any significant action in furtherance of their investigation during 2006, we stand ready to cooperate with their investigation.
On May 28, 2004, the U.S. Attorney’s Office for the Southern District of Ohio, assisted by the Federal Bureau of Investigation, notified us that it has initiated an inquiry involving the subject matters covered by our internal
investigation. Although the U.S. Attorney’s office and the FBI have not taken any significant action in furtherance of their investigation during 2006, we stand ready to cooperate with their investigation.
On June 24, 2004, the Internal Revenue Service (IRS) began an audit of tax years 1998 through 2003 and issued a series of data requests to us including issues raised in the Memorandum. The staff of the IRS requested that we provide certain documents, including but not limited to, matters concerning executive/director deferred compensation plans, management stock incentive plans and MVE financial statements. On September 1, 2005, the IRS issued an audit report for tax years 1998 through 2003 that showed proposed changes to our federal income tax liability for each of those years. The proposed changes resulted in a total tax deficiency, penalties and interest of approximately $23.9 million as of December 31, 2005. On November 4, 2005, we filed a written protest to one of the proposed changes. On April 3, 2006, the IRS conceded the proposed changes that we filed a written protest to and issued a revised audit report for tax years 1998 through 2003. The revised audit report resulted in a total tax deficiency, penalties and interest of approximately $1.2 million. We had previously made a deposit with the IRS of approximately $1.3 million that we requested on April 14, 2006 be applied to offset the $1.2 million tax deficiency, penalties and interest for tax years 1998 through 2003. The Joint Committee on Taxation completed its review of the revised audit report for tax years 1998 through 2003 and sent us a letter dated June 16, 2006 stating that it took no exception to the revised audit report.
Insurance Recovery Claim
On January 13, 2006, we filed a claim against one of our insurers, Associated Electric & Gas Insurance Services (AEGIS), under a fiduciary liability policy to recoup legal fees associated with our litigation against three former executives. An arbitration of this matter was held on August 4, 2006. The arbitration panel ruled on or about September 12, 2006 that the AEGIS policy does not require an advance of defense expenses to us. Rather, the arbitration panel stated that we are required to file a written undertaking as a condition precedent to repay expenses finally established not to be insured. We have filed a written undertaking with AEGIS and will continue to pursue resolution of the claim through mediation and arbitration in 2007.
State Income Tax Audit
On February 13, 2006, we received correspondence from the Ohio Department of Taxation (ODT) notifying us that ODT has completed their examination and review of our Ohio Corporation Franchise Tax Returns for tax years 2002 through 2004 and that the final proposed audit adjustments result in a balance due of $90.8 million before interest and penalties. We have reviewed the proposed audit adjustments and are vigorously contesting the ODT findings and notice of assessment through all administrative and judicial means available. On March 29, 2006,June 27, 2008, we filed petitions for reassessmententered into a $42.0 million settlement agreement with the ODT to protest each assessment as well as request corrected assessments for eachOhio Department of Taxation (ODT) resolving all outstanding audit issues and appeals, including uncertain tax year. On October 12, 2006, we signed a Memorandum of Understanding with the ODT that stated if the ODT’s positions are ultimately sustained in judicial proceedings, the total additional tax liability that we would be subject to for tax years 20021998 through 2004 would be no more than $50.72006. The $42.0 million before interest as opposedpayment was made to the $90.8 million statedODT in the ODT’s correspondence of February 13, 2006. We believe we have recorded adequate tax reserves related to the proposed adjustments; however, we cannot predict the outcome, which could be material to our results of operations and cash flows.July 2008.
We are also under audit review by various state agencies for tax years 2002 through 2004. We have also filed an appeal to the Ohio Board of Tax Appeals for tax years 1998 through 2001.2006. Depending upon the outcome of these audits and the appeal, we may be required to increase our tax provision if actual amounts ultimately determined exceed recorded reserves. We believe we have adequate reserves in each tax jurisdiction but cannot predict the outcome of these audits.
Labor Relations Unasserted ClaimSierra Club
In September 2006, DP&L became aware of an unasserted claim under the Fair Labor Standards Act concerning the calculation of overtime rates for its unionized workforce. By agreement of Local #175 and DP&L, we jointly submitted the claim to a neutral third party who ruled in favor of DP&L’s position. As a result of this decision, Local #175 has decided not to pursue any claim against DP&L.
Environmental
Pending before the U.S. Supreme Court is a proceeding, Environmental Defense v. Duke Energy that does not involve DP&L as a party but may have a significant effect on the outcome of litigation described below that involves allegations of violations of the CAA. A key issue in that litigation that may be dispositive with respect to other pending cases is what test to apply for measuring whether modifications to electric generating units should trigger application of New Source Review (NSR) standards under the CAA. In general terms, the dispute is whether to measure pre- and post-modification emissions based on the rate of
emissions per hour of operation or based on total emissions over time. The latter test, if applied, could trigger NSR requirements for equipment replacements that result in a plant running more often because it is more economical or dependable, even if the emissions rate per hour of operation does not change. A ruling is expected in the first or second quarter of 2007. DP&L cannot predict the outcome of the Duke Energy case. Moreover, in each of the cases identified below, there may be case-specific facts and allegations that may cause a judge to find that the U.S. Supreme Court’s ruling is based on different facts and allegations and is therefore not controlling in the case before the judge.
In September 2004, the Sierra Club filed a lawsuit against DP&Land the other owners of the Stuart Generating Stationgenerating station in the United States District Court for the Southern District of Ohio for alleged violations of the CAA, including issues that may be decided byClean Air Act (CAA) and the Supremestation’s operating permit. On August 7, 2008, a consent decree was filed in the United States District Court in full settlement of these CAA claims. Under the Duke Energy caseterms of the consent decree, the co-owners of the Stuart generating station agreed to: (i) certain emission targets related to nitrogen oxides (NOx), sulfur dioxide (SO2) and other issues relatingparticulate matter; (ii) make energy efficiency and renewable energy commitments that are conditioned on receiving Public Utilities Commission of Ohio approval for the recovery of costs; (iii) forfeit 5,500 sulfur dioxide allowances; and (iv) provide funding to alleged violations of opacity limitations.a third party non-profit organization to establish a solar water heater rebate program. DP&L, on behalf of all co-owners, is leadingand the defense of this matter. A sizable amount of discovery has taken place and expert reports are scheduled to be filed at various times from May through September, 2007. Dispositive motions are to be filed in January 2008. No trial date has been set yet.
16. Certain Relationships and Related Transactions
On March 13, 2000, Dayton Ventures, Inc. and Dayton Ventures, LLC, affiliates of Kohlberg Kravis Roberts & Co. LLC (KKR), purchased a combination of trust preferred securities issued by a trust established by DPL, DPL voting preferred shares and warrants to purchase DPL’s common shares for an aggregate of $550 million. The trust preferred securities were redeemed at par in 2001 with proceeds of a new issuance of trust preferred securities and DPL’s Senior Notes. The 6.6 million Series B voting preferred shares had voting power not exceeding 4.9%other owners of the total outstanding voting power of our voting securities and were purchased by Dayton Ventures, LLC for an aggregate purchase price of $68 thousand. The warrants to purchase approximately 31.6 million common shares (representing approximately 19.9% of the common shares then outstanding) have a term of 12 years, an exercise price of $21 per share, and were purchased by Dayton Ventures, LLC for an aggregate purchase price of $50 million. In connection with the March 13, 2000 transaction, DPL and KKRstation also entered into an attorney fee agreement under which we paid KKR an annual management, consulting and financial services fee of $1.0 million. The agreement also stated that we would provide KKR with an opportunity to provide investment banking services on such terms as the parties may agree and at such time as any such services may be required. We also agreed to reimburse KKR and their affiliates for all reasonable expenses incurred in connection with the services provided under this agreement, including travel expenses and expenses of its counsel. We and KKR terminated this agreement on January 12, 2005. During December 2004 through January 2005, KKR initiatedpay a series of agreements to transfer all of the warrants to an unaffiliated third party. This transferee subsequently transferred a large portion of the warrants to multiple unrelatedSierra Club’s attorney and expert witness fees. On October 23, 2008, the United States District Court approved the consent decree with funding for the third parties. In January 2005, as part of one of these transfers, KKR sold back to us allparty non-profit organization set at $300,000. We have accrued for our share of the outstanding Series B voting preferred shares$300,000 at par of $0.01 per share for $66 thousand.
UnderDecember 31, 2008. We have determined that the Securityholders and Registration Rights Agreement among DPL Inc., DPL Capital Trust I, Dayton Ventures, LLC and Dayton Ventures, Inc., KKR had the right to designate one person for election to, and one person to attend as a non-voting observer at all meetingsterms of the DPL and DP&L Boardsconsent decree will not have a material impact on our overall results of Directors for as long as Dayton Ventures, LLC and its affiliates continue to beneficially own at least 12.64 million of our common shares, including shares issuable upon exercise of warrants. Scott M. Stuart, a director during fiscal 2003, and George R. Roberts, a non-voting observer, were the KKR designees in 2003 pursuant to this agreement. Mr. Stuart resigned from the Board and Mr. Roberts ceased to be a non-voting observer of the Board as of April 2004. As a result of the transfer of warrants from KKR to an unaffiliated third party during December 2004 through January 2005, KKR no longer owned any warrantsoperations, financial position or common stock. Accordingly, KKR no longer had the right to appoint one member and one observer to both DPL and DP&L Boards of Directors and the Securityholders and Registration Rights Agreement was amended to delete these, and other rights.cash flows.
In 1996, DPL entered into a consulting contract pursuant to which Peter H. Forster agreed to (i) serve, in a non-employee capacity, as Chairman of the Board of Directors of DPL, DP&L and MVE, and as Chairman of the Executive Committee of our Board of Directors and (ii) provide advisory and strategic planning consulting services. That contract became the subject of litigation after Mr. Forster resigned on May 16, 2004. (See Note 15 of Notes to Consolidated Financial Statements.)
In June 2001, DPL’s subsidiaries, MVE, of which Mr. Forster was Chairman, Miami Valley Development Company (MVDC) and Miami Valley Insurance Company (MVIC), each entered into a management services agreement (the MSAs) with Valley Partners, Inc. (Valley) for the provision of ongoing oversight and management of each subsidiary’s financial asset holdings following a change of control of DPL or sale of the financial assets portfolio to an unaffiliated third party. Valley was a Florida corporation the sole stockholders, directors and officers of which were Mr. Forster and Ms. Muhlenkamp.
In October 2001, we entered into an Administrative Services Agreement (the ASA) with Valley and the individual trustees of certain master trusts which hold the assets of various executive and director compensation plans. The ASA engaged Valley to provide administrative and recordkeeping functions on behalf of the master trusts upon a change of control of DPL, as well as the provision of investment advice, in exchange for an administration fee in addition to the annual management fee payable to Valley.
In October 2001, DPL and DP&L also entered into a Trustee Fee Agreement (the TFA) with Richard Chernesky, Richard Broock and Frederick Caspar, attorneys at Chernesky, Heyman & Kress P.L.L. Upon a change of control of DPL or DP&L, Messrs. Chernesky, Broock and Caspar would become the sole trustees of the master trusts for an annual fee of $500,000 and would succeed to all of the duties of our Compensation Committee under the compensation plans funded through the master trusts.
The MSAs, ASA and TFA (Valley Partners Agreements) were terminated by an agreement executed in January 2004, but effective as of December 15, 2003. The financial assets were not sold or transferred prior to such termination and therefore the agreements never became effective and no compensation was ever paid under them. Copies of the Valley Partners Agreements were filed as exhibits to our 2003 Form 10-K.
On April 26, 2004, DPL entered into a New Trustee Fee Agreement (New TFA) with Messrs. Chernesky, Broock and Caspar that would have become effective upon a change of control of DPL or DP&L. If the New TFA became effective, it provided that Messrs. Chernesky, Broock and Caspar would serve as the sole trustees of the master trusts in exchange for an annual fee of $250,000 during the New TFA’s term. A copy of the New TFA was filed as an exhibit to our 2003 Form 10-K. On October 14, 2004, at the request of DPL and DP&L, Messrs. Chernesky, Broock and Caspar submitted their resignations to us and DP&L.
On February 2 and 3, 2004, Mr. Koziar sent letters to Mr. Forster and Ms. Muhlenkamp purporting to amend their consulting and employment agreements to provide change of control protections regarding their MVE payments. In addition, on February 2, 2004, Mr. Koziar sent Mr. Forster a letter purporting to amend his consulting agreement to provide additional terms and to increase his compensation. However, none of those purported amendments had been approved by our Compensation Committee. Mr. Forster and Ms. Muhlenkamp resigned and Mr. Koziar retired on May 16, 2004.
We have initiated legal proceedings asserting breach of fiduciary duty and breach of contract by Messrs. Forster and Koziar and Ms. Muhlenkamp, and challenging the propriety and/or validity of certain contract terminations, purported amendments and agreements. (See Note 15 of Notes to Consolidated Financial Statements.)
17. Other Matters
Audit Committee InvestigationGovernmental and Related MattersRegulatory Inquiries
On March 10, 2004, DPL’s and DP&L’s Corporate Controller sent a memorandum (the Memorandum) to the Chairman of the Audit Committee of our Board of Directors (the Audit Committee).Directors. The Memorandum expressed the Corporate Controller’s “concerns, perspectives and viewpoints” regarding financial reporting and governance issues within the Company.
On March 15, 2004, our Audit Committee retained the law firm of Taft, Stettinius & Hollister LLP (TS&H) to represent the Audit Committee in an independent review of each of the matters raised by the Memorandum. TS&H subsequently retained an accounting firm as a forensic accountant to assist in this review. On April 27, 2004, TS&H submitted a written report of its findings to the members of the Audit Committee (the Report). A copy of the Report was filed as an exhibit to our 2003 Form 10-K. While TS&H stated that it did not uncover and no person had indicated to it any uncorrected material inaccuracies in our books and records, it did, however, recommend further follow-up by the Audit Committee and improvements relating to disclosures, communication, access to information, internal controls and the culture of the Company in certain areas. Based upon information received after issuing the Report, TS&H revised its analysis and prepared a supplement to the
Report, dated May 25, 2004 (the Supplement). A copy of the Supplement was filed as an exhibit to our 2003 Form 10-K.
Our Audit Committee considered the Report and Supplement at a meeting held on May 16, 2004. After its review and consideration, the Audit Committee recommended that the full Board of Directors accept the Report and the Supplement. At a meeting held on May 16, 2004, our Board of Directors accepted the Report and Supplement, including the findings and recommendations set forth therein. Mr. Forster and Ms. Muhlenkamp resigned and Mr. Koziar retired on May 16, 2004, and subsequently DPL and DP&L have been involved in litigation with them (see Note 15 of Notes to Consolidated Financial Statements). In addition, in 2004response, the Board initiated an internal investigation whose findings and recommendations led to corrective action was taken with regard toregarding internal controls, process issues and the tone at the top as identified in the Report.top.
Governmental and Regulatory Inquiries
On May 20, 2004, the staff of the SEC notified DPL that it was conducting an inquiry covering our exempt status under the Public Utility Holding Company Act of 1935 (the ‘35 Act). The staff of the SEC requested DPL provide certain documents and information on a voluntary basis. On October 8, 2004, DPL received a notice from the SEC that a question existed as to whether such exemption from the Public Utility Holding Company Act was detrimental to the public interest or the interests of investors or consumers. On November 5, 2004, DPL filed a good faith application seeking an order of exemption from the SEC. In light of the repeal of the ‘35 Act, effective February 8, 2006, and based upon the information previously provided to the staff of the SEC, this inquiry is moot.
On May 28, 2004, the U.S. Attorney’s Office for the Southern District of Ohio, assisted by the Federal Bureau of Investigation, notified DPL and DP&L that it had initiated an inquiry involving matters connected to our internal investigation. We are cooperating with this investigation.This inquiry remains pending.
On or about June 24, 2004, the SEC commenced a formal investigation into the issues raised by the Memorandum. DPL and DP&L are cooperating with the investigation.This investigation remains pending.
113
Report of Independent Registered Public Accounting Firm
The Board of Directors and Shareholders of
DPLInc.:
We have audited the accompanying consolidatedbalance sheets of DPLInc. and subsidiaries (the Company) as of December 31, 20062008 and 2005,2007, and the related consolidated statementstatements of results of operations, consolidated statements of shareholders’ equity and consolidated statements of cash flows for each of the years in the three-year period ended December 31, 2006.2008. In connection with our audits of the consolidated financial statements, we have audited the consolidated financial statement schedule, “Schedule II -— Valuation and Qualifying Accounts” for eachAccounts.” We also have audited the Company’s internal control over financial reporting as of December 31, 2008, based on criteria established in Internal Control - Integrated Framework issued by the Committee of Sponsoring Organizations of the years in the three-year period ended December 31, 2006. TheseTreadway Commission (COSO). The Company’s management is responsible for these consolidated financial statements, for maintaining effective internal control over financial reporting, and the financial statement schedule are the responsibilityfor its assessment of the Company’s management.effectiveness of internal control over financial reporting, included in the accompanying Management’s Report on Internal Control Over Financial Reporting. Our responsibility is to express an opinion on these consolidated financial statements and an opinion on the Company’s internal control over financial reporting based on our audits.
We conducted our audits in accordance with the standards of the Public Company Accounting Oversight Board (United States). Those standards require that we plan and perform the auditaudits to obtain reasonable assurance about whether the financial statements are free of material misstatement. An audit includesmisstatement and whether effective internal control over financial reporting was maintained in all material respects. Our audits of the consolidated financial statements included examining, on a test basis, evidence supporting the amounts and disclosures in the financial statements. An audit also includesstatements, assessing the accounting principles used and significant estimates made by management, as well asand evaluating the overall financial statement presentation. We believe that our audits provide a reasonable basis for our opinion.
In our opinion, the consolidated financial statements referred to above present fairly, in all material respects, the financial position of the Company as of December 31, 2006 and 2005, and the consolidated results of their operations and their cash flows for each of the years in the three-year period ended December 31, 2006, in conformity with United States generally accepted accounting principles. Also, in our opinion, the related financial statement schedules when considered in relation to the basic consolidated financial statements taken as a whole, present fairly in all materials respects, the information set forth therein.
As discussed in Note 1 to the consolidated financial statements, effective January 1, 2006, the Company adopted FASB Statement of Financial Accounting Standard No. 123 (Revised), Share-Based Payment. Also discussed in Note 1 to the consolidated financial statements effective December 31, 2006 the Company adopted FASB Statement of Financial Accounting Standard No. 158, Employers’ Accounting for Defined Benefit Pension and Other Postretirement Plans, an amendment of FASB Statements No. 87, 88, 106 and 132(R).
We also have audited, in accordance with the standards of the Public Company Accounting Oversight Board (United States), the effectiveness of the Company’s internal controls over financial reporting as of December 31, 2006, based on criteria established in Internal Control — Integrated Framework issued by the Committee of Sponsoring Organizations of the Treadway Commission (COSO), and our report dated February 22, 2007 expressed an unqualified opinion on management’s assessment of, and the effective operationOur audit of internal control over financial reporting.
/s/ KPMG LLP
| | | |
| | | |
KPMG LLP
| | | |
Kansas City, Missouri
| | | |
February 22, 2007
| | | |
Report of Independent Registered Public Accounting Firm on Internal Controls
The Board of Directors
DPL Inc.:
We have audited management’s assessment, included in the Management’s Report on Internal Control Over Financial Reporting appearing under Item 9A, that DPL Inc. and subsidiaries (the Company) maintained effective internal control over financial reporting as of December 31, 2006, based on criteria established in Internal Control - Integrated Framework issued by theCommittee of Sponsoring Organizations of the Treadway Commission (COSO).The Company’s management is responsible for maintaining effective internal control over financial reporting and for its assessment of the effectiveness of internal control over financial reporting. Our responsibility is to express an opinion on management’s assessment and an opinion on the effectiveness of the Company’s internal control over financial reporting based on our audit.
We conducted our audit in accordance with the standards of the Public Company Accounting Oversight Board (United States). Those standards require that we plan and perform the audit to obtain reasonable assurance about whether effective internal control over financial reporting was maintained in all material respects. Our audit included obtaining an understanding of internal control over financial reporting, evaluating management’s assessment,assessing the risk that a material weakness exists, and testing and evaluating the design and operating effectiveness of internal control andbased on the assessed risk. Our audits also included performing such other procedures as we considered necessary in the circumstances. We believe that our audit providesaudits provide a reasonable basis for our opinion.opinions.
A company’s internal control over financial reporting is a process designed to provide reasonable assurance regarding the reliability of financial reporting and the preparation of financial statements for external purposes in accordance with generally accepted accounting principles. A company’s internal control over financial reporting includes those policies and procedures that (1) pertain to the maintenance of records that, in reasonable detail, accurately and fairly reflect the transactions and dispositions of the assets of the company; (2) provide reasonable assurance that transactions are recorded as necessary to permit preparation of financial statements in accordance with generally accepted accounting principles, and that receipts and expenditures of the company are being made only in accordance with authorizations of management and directors of the company; and (3) provide reasonable assurance regarding prevention or timely detection of unauthorized acquisition, use, or disposition of the company’s assets that could have a material effect on the financial statements.
Because of its inherent limitations, internal control over financial reporting may not prevent or detect misstatements. Also, projections of any evaluation of effectiveness to future periods are subject to the risk that controls may become inadequate because of changes in conditions, or that the degree of compliance with the policies or procedures may deteriorate.
114
Table of Contents
In our opinion, management’s assessment thatthe consolidated financial statements referred to above present fairly, in all material respects, the financial position of the Company maintained effective internal control over financial reporting as of December 31, 2006, is fairly stated, in all material respects, based on criteria established in Internal Control - Integrated Framework issued by2008 and 2007, and the Committeeresults of Sponsoring Organizationstheir operations and their cash flows for each of the Treadway Commission (COSO).years in the three-year period ended December 31, 2008, in conformity with accounting principles generally accepted in the United States of America. Also in our opinion, the Company maintained, in all material respects, effective internal controlscontrol over financial reporting as of December 31, 2006,2008, based on criteria established in Internal Control —- Integrated Framework issued by the Committee of Sponsoring Organizations of the Treadway Commission (COSO).
We also have audited, in accordance with the standards of the Public Company Accounting Oversight Board (United States), the consolidated balance sheets of the Company as of December 31, 2006 and 2005, and the related consolidated statements of results of operations, shareholders’ equity, and cash flows for each offinancial statement schedule when considered in relation to the years in the three-year period ended December 31, 2006, and our report dated February 22, 2007, expressed an unqualified opinion on thosebasic consolidated financial statements.statements taken as a whole, present fairly in all material respects, the information set forth therein.
/s/ KPMG LLP | | | |
| | | |
KPMG LLP
| | | |
Kansas City, Missouri
| | | |
February 22, 2007
| | | |
KPMG LLP
Philadelphia, Pennsylvania
February 26, 2009
115
Table of Contents
Report of Independent Registered Public Accounting Firm
The Board of Directors and Shareholder of
The Dayton Power and Light Company:
We have audited the accompanying consolidatedbalance sheets of The Dayton Power and Light Company (DP&L) and subsidiaries as of December 31, 20062008 and 2005,2007, and the related consolidated statements of results of operations, shareholders’consolidated statements of shareholder’s equity and consolidated statements of cash flows for each of the years in the three-year period ended December 31, 2006.2008. In connection with our audits of the consolidated financial statements, we have audited the consolidated financial statement schedule, “Schedule II — Valuation and Qualifying AccountsAccounts.” We also have audited DP&L’s internal control over financial reporting as of December 31, 2008, based on criteria established in ”Internal Control - Integrated Framework for eachissued by the Committee of Sponsoring Organizations of the years in the three-year period ended December 31, 2006. TheseTreadway Commission (COSO). DP&L’s management is responsible for these consolidated financial statements, for maintaining effective internal control over financial reporting, and for its assessment of the effectiveness of internal control over financial statement schedules arereporting, included in the responsibility of DP&L’s management.accompanying Management’s Report on Internal Control Over Financial Reporting. Our responsibility is to express an opinion on these consolidated financial statements and an opinion on DP&L’s internal control over financial reporting based on our audits.
We conducted our audits in accordance with the standards of the Public Company Accounting Oversight Board (United States). Those standards require that we plan and perform the auditaudits to obtain reasonable assurance about whether the financial statements are free of material misstatement. An audit includesmisstatement and whether effective internal control over financial reporting was maintained in all material respects. Our audits of the consolidated financial statements included examining, on a test basis, evidence supporting the amounts and disclosures in the financial statements. An audit also includesstatements, assessing the accounting principles used and significant estimates made by management, as well asand evaluating the overall financial statement presentation. We believe that our audits provide a reasonable basis for our opinion.
In our opinion, the consolidated financial statements referred to above present fairly, in all material respects, the financial position of DP&L as of December 31, 2006 and 2005, and the consolidated results of their operations and their cash flows for each of the years in the three-year period ended December 31, 2006, in conformity with United States generally accepted accounting principles. Also, in our opinion, the related financial statement schedules when considered in relation to the basic consolidated financial statements taken as a whole, present fairly in all material respects, the information set forth therein.
As discussed in Note 1 to the consolidated financial statements, effective January 1, 2006 the Company adopted FASB Statement of Financial Accounting Standard No. 123 (Revised), Share-Based Payment. Also discussed in Note 1 to the consolidated financial statements effective December 31, 2006 the Company adopted FASB Statement of Financial Accounting Standard No. 158, Employers’ Accounting for Defined Benefit Pension and Other Postretirement Plans, an amendment of FASB Statements No. 87, 88, 106 and 132(R).
We also have audited, in accordance with the standards of the Public Company Accounting Oversight Board (United States), the effectiveness of the Company’s internal controls over financial reporting as of December 31, 2006, based on criteria established in Internal Control – Integrated Framework issued by the Committee of Sponsoring Organizations of the Treadway Commission (COSO), and our report dated February 22, 2007 expressed an unqualified opinion on management’s assessment of, and the effective operationOur audit of internal control over financial reporting.
/s/ KPMG
| | | |
| | | |
KPMG
| | | |
Kansas City, Missouri
| | | |
February 22, 2007
| | | |
Report of Independent Registered Public Accounting Firm on Internal Controls
The Board of Directors and Shareholders of
The Dayton Power and Light Company:
We have audited management’s assessment, included in the Management’s Report on Internal Control Over Financial Reporting appearing under Item 9A, that The Dayton Power and Light Company (DP&L) and subsidiaries maintained effective internal control over financial reporting as of December 31, 2006, based on criteria established in Internal Control—Integrated Framework issued by the Committee of Sponsoring Organizations of the Treadway Commission (COSO). DP&L’s management is responsible for maintaining effective internal control over financial reporting and for its assessment of the effectiveness of internal control over financial reporting. Our responsibility is to express an opinion on management’s assessment and an opinion on the effectiveness of DP&L’s internal control over financial reporting based on our audit.
We conducted our audit in accordance with the standards of the Public Company Accounting Oversight Board (United States). Those standards require that we plan and perform the audit to obtain reasonable assurance about whether effective internal control over financial reporting was maintained in all material respects. Our audit included obtaining an understanding of internal control over financial reporting, evaluating management’s assessment,assessing the risk that a material weakness exists, and testing and evaluating the design and operating effectiveness of internal control andbased on the assessed risk. Our audits also included performing such other procedures as we considered necessary in the circumstances. We believe that our audit providesaudits provide a reasonable basis for our opinion.opinions.
A company’s internal control over financial reporting is a process designed to provide reasonable assurance regarding the reliability of financial reporting and the preparation of financial statements for external purposes in accordance with generally accepted accounting principles. A company’s internal control over financial reporting includes those policies and procedures that (1) pertain to the maintenance of records that, in reasonable detail, accurately and fairly reflect the transactions and dispositions of the assets of the company; (2) provide reasonable assurance that transactions are recorded as necessary to permit preparation of financial statements in accordance with generally accepted accounting principles, and that receipts and expenditures of the company are being made only in accordance with authorizations of management and directors of the company; and (3) provide reasonable assurance regarding prevention or timely detection of unauthorized acquisition, use, or disposition of the company’s assets that could have a material effect on the financial statements.
Because of its inherent limitations, internal control over financial reporting may not prevent or detect misstatements. Also, projections of any evaluation of effectiveness to future periods are subject to the risk that controls may become inadequate because of changes in conditions, or that the degree of compliance with the policies or procedures may deteriorate.
116
Table of Contents
In our opinion, management’s assessment thatthe consolidated financial statements referred to above present fairly, in all material respects, the financial position of DP&L maintained effective internal control over financial reporting as of December 31, 2006, is fairly stated, in all material respects, based on criteria established in Internal Control - Integrated Framework issued by2008 and 2007, and the Committeeresults of Sponsoring Organizationstheir operations and their cash flows for each of the Treadway Commission (COSO).years in the three-year period ended December 31, 2008, in conformity with accounting principles generally accepted in the United States of America. Also in our opinion, DP&L maintained, in all material respects, effective internal controlscontrol over financial reporting as of December 31, 2006,2008, based on criteria established in Internal Control —- Integrated Framework issued by the Committee of Sponsoring Organizations of the Treadway Commission (COSO).
We also have audited, in accordance with the standards of the Public Company Accounting Oversight Board (United States), the consolidated balance sheets of DP&L as of December 31, 2006 and 2005, and the related consolidated statements of results of operations, shareholders’ equity, and cash flows for each offinancial statement schedule when considered in relation to the years in the three-year period ended December 31, 2006, and our report dated February 22, 2007, expressed an unqualified opinion on thosebasic consolidated financial statements.statements taken as a whole, present fairly in all material respects, the information set forth therein.
/s/ KPMG | | LLP | |
| |
KPMG LLP | |
KPMG
| | | |
Kansas City, Missouri
| | Philadelphia, Pennsylvania | |
February 22, 2007 | | 26, 2009 | |
117
Table of Contents
DPL Inc. - Selected Quarterly Information (Unaudited)
| | For the three months ended | |
| | March 31, | | June 30, | | September 30, | | December 31, | |
$ in millions | | 2006 | | 2005 | | 2006 | | 2005 (a) | | 2006 | | 2005 (a) | | 2006 (b) | | 2005 | |
Revenues | | $ | 341.1 | | $ | 307.1 | | $ | 309.0 | | $ | 293.4 | | $ | 392.5 | | $ | 357.4 | | $ | 350.9 | | $ | 327.0 | |
Operating Income | | 103.2 | | 81.9 | | 55.9 | | 62.3 | | 98.5 | | 99.6 | | 23.4 | | 95.3 | |
| | | | | | | | | | | | | | | | | |
Earnings from continuing operations | | 51.3 | | 36.1 | | 22.6 | | 16.7 | | 47.4 | | 25.7 | | 4.3 | | 46.2 | |
| | | | | | | | | | | | | | | | | |
Earnings from discontinued operations, net of taxes | | 7.6 | | 37.6 | | — | | 5.2 | | 3.4 | | 0.2 | | 3.0 | | 9.9 | |
Cumulative effect of accounting change, net of taxes | | — | | — | | — | | — | | — | | — | | | | (3.2 | ) |
Net Income | | $ | 58.9 | | $ | 73.7 | | $ | 22.6 | | $ | 21.9 | | $ | 50.8 | | $ | 25.9 | | $ | 7.3 | | $ | 52.9 | |
| | | | | | | | | | | | | | | | | |
Basic earnings per share of common stock: | | | | | | | | | | | | | | | | | |
Continuing operations | | $ | 0.43 | | $ | 0.30 | | $ | 0.20 | | $ | 0.14 | | $ | 0.44 | | $ | 0.21 | | $ | 0.04 | | $ | 0.38 | |
Discontinued operations | | 0.06 | | 0.31 | | — | | 0.04 | | 0.03 | | — | | 0.03 | | 0.09 | |
Cumulative effect of accounting change | | — | | — | | — | | — | | — | | — | | — | | (0.03 | ) |
Total basic earnings per common share | | $ | 0.49 | | $ | 0.61 | | $ | 0.20 | | $ | 0.18 | | $ | 0.47 | | $ | 0.21 | | $ | 0.07 | | $ | 0.44 | |
| | | | | | | | | | | | | | | | | |
Diluted earnings per share of common stock: | | | | | | | | | | | | | | | | | |
Continuing operations | | $ | 0.40 | | $ | 0.28 | | $ | 0.18 | | $ | 0.13 | | $ | 0.40 | | $ | 0.20 | | $ | 0.04 | | $ | 0.36 | |
Discontinued operations | | 0.06 | | 0.30 | | — | | 0.04 | | 0.03 | | — | | 0.02 | | 0.08 | |
Cumulative effect of accounting change | | — | | — | | — | | — | | — | | — | | — | | (0.03 | ) |
Total diluted earnings per common share | | $ | 0.46 | | $ | 0.58 | | $ | 0.18 | | $ | 0.17 | | $ | 0.43 | | $ | 0.20 | | $ | 0.06 | | $ | 0.41 | |
| | | | | | | | | | | | | | | | | |
Dividends paid per share | | $ | 0.25 | | $ | 0.24 | | $ | 0.25 | | $ | 0.24 | | $ | 0.25 | | $ | 0.24 | | $ | 0.25 | | $ | 0.24 | |
| | | | | | | | | | | | | | | | | |
Common stock market price - High | | $ | 27.58 | | $ | 26.77 | | $ | 27.82 | | $ | 27.67 | | $ | 27.93 | | $ | 28.12 | | $ | 28.72 | | $ | 28.01 | |
— Low | | $ | 25.11 | | $ | 24.27 | | $ | 26.25 | | $ | 24.08 | | $ | 26.74 | | $ | 26.70 | | $ | 27.16 | | $ | 24.55 | |
| | | | | | | | | | | | | | | | | |
(a) Earnings from continuing operations in the second and third quarters of 2005 include charges of $2.1 million and $59.1 million, respectively, for the early redemption of debt.
| | For the three months ended | |
| | March 31, | | June 30, | | September 30, | | December 31, | |
$ in millions | | 2008 | | 2007 | | 2008 | | 2007 | | 2008 | | 2007 | | 2008 | | 2007 | |
Revenues | | $ | 416.1 | | $ | 379.7 | | $ | 378.8 | | $ | 343.1 | | $ | 414.5 | | $ | 422.0 | | $ | 392.2 | | $ | 370.9 | |
Operating Income | | 142.7 | | 103.5 | | 85.8 | | 69.4 | | 96.2 | | 110.8 | | 110.8 | | 86.4 | |
| | | | | | | | | | | | | | | | | |
Earnings from continuing operations | | 77.3 | | 51.2 | | 47.6 | | 53.6 | | 48.0 | | 60.7 | | 71.6 | | 46.3 | |
| | | | | | | | | | | | | | | | | |
Earnings from discontinued operations, net of taxes | | — | | 4.9 | | — | | 5.1 | | — | | — | | — | | — | |
Net Income | | $ | 77.3 | | $ | 56.1 | | $ | 47.6 | | $ | 58.7 | | $ | 48.0 | | $ | 60.7 | | $ | 71.6 | | $ | 46.3 | |
| | | | | | | | | | | | | | | | | |
Basic earnings per share of common stock: | | | | | | | | | | | | | | | | | |
Continuing operations | | $ | 0.71 | | $ | 0.48 | | $ | 0.43 | | $ | 0.50 | | $ | 0.44 | | $ | 0.56 | | $ | 0.64 | | $ | 0.43 | |
Discontinued operations | | — | | 0.04 | | — | | 0.04 | | — | | — | | — | | — | |
Total basic earnings per common share | | $ | 0.71 | | $ | 0.52 | | $ | 0.43 | | $ | 0.54 | | $ | 0.44 | | $ | 0.56 | | $ | 0.64 | | $ | 0.43 | |
| | | | | | | | | | | | | | | | | |
Diluted earnings per share of common stock: | | | | | | | | | | | | | | | | | |
Continuing operations | | $ | 0.66 | | $ | 0.43 | | $ | 0.41 | | $ | 0.45 | | $ | 0.42 | | $ | 0.53 | | $ | 0.63 | | $ | 0.40 | |
Discontinued operations | | — | | 0.04 | | — | | 0.04 | | — | | — | | — | | — | |
Total diluted earnings per common share | | $ | 0.66 | | $ | 0.47 | | $ | 0.41 | | $ | 0.49 | | $ | 0.42 | | $ | 0.53 | | $ | 0.63 | | $ | 0.40 | |
| | | | | | | | | | | | | | | | | |
Dividends paid per share | | $ | 0.275 | | $ | 0.260 | | $ | 0.275 | | $ | 0.260 | | $ | 0.275 | | $ | 0.260 | | $ | 0.275 | | $ | 0.260 | |
| | | | | | | | | | | | | | | | | |
Common stock market price | - High | | $ | 30.18 | | $ | 31.44 | | $ | 28.70 | | $ | 31.91 | | $ | 26.76 | | $ | 29.36 | | $ | 24.59 | | $ | 30.83 | |
| - Low | | $ | 24.58 | | $ | 27.56 | | $ | 26.10 | | $ | 28.08 | | $ | 23.00 | | $ | 26.04 | | $ | 19.16 | | $ | 26.05 | |
(b) Earnings from continuing operations in the fourth quarter of 2006 included a $44.2 million ($71 million pre-tax) impairment charge resulting from DPL’s decision to sell two of its peaking stations. See Note 14 of the Notes to the Consolidated Financial Statements.
DP&L - - Selected Quarterly Information (Unaudited)
| | For the three months ended | |
| | March 31, | | June 30, | | September 30 | | December 31, | |
$ in millions | | 2006 | | 2005 | | 2006 | | 2005 | | 2006 | | 2005 | | 2006 | | 2005 | |
Revenues | | $ | 339.1 | | $ | 305.1 | | $ | 306.7 | | $ | 291.4 | | $ | 390.3 | | $ | 355.5 | | $ | 349.1 | | $ | 324.9 | |
Operating Income | | 115.5 | | 91.4 | | 72.7 | | 76.0 | | 107.1 | | 112.1 | | 107.2 | | 103.1 | |
Income before income taxes and cumulative effect of accounting change | | 110.2 | | 87.9 | | 69.5 | | 65.1 | | 103.0 | | 100.8 | | 101.9 | | 99.3 | |
Income before cumulative effect of accounting change | | 66.9 | | 53.3 | | 44.0 | | 35.9 | | 64.0 | | 63.1 | | 67.5 | | 62.7 | |
Net Income | | 66.9 | | 53.3 | | 44.0 | | 35.9 | | 64.0 | | 63.1 | | 67.5 | | 59.5 | |
Earnings on common stock | | 66.7 | | 53.1 | | 43.8 | | 35.7 | | 63.8 | | 62.9 | | 67.3 | | 59.2 | |
Cash dividends paid | | $ | — | | $ | 75.0 | | $ | — | | $ | — | | $ | — | | $ | — | | $ | 100.0 | | $ | 75.0 | |
| | For the three months ended | |
| | March 31, | | June 30, | | September 30, | | December 31, | |
$ in millions | | 2008 | | 2007 | | 2008 | | 2007 | | 2008 | | 2007 | | 2008 | | 2007 | |
Revenues | | $ | 413.9 | | $ | 377.5 | | $ | 376.4 | | $ | 342.1 | | $ | 401.5 | | $ | 419.6 | | $ | 381.1 | | $ | 368.2 | |
Operating Income | | 146.4 | | 114.7 | | 90.5 | | 59.7 | | 93.5 | | 113.2 | | 106.2 | | 87.5 | |
Income before income taxes | | 140.6 | | 111.6 | | 83.6 | | 94.7 | | 84.8 | | 112.7 | | 97.0 | | 95.7 | |
Net Income | | 89.0 | | 69.8 | | 63.3 | | 59.1 | | 54.8 | | 70.6 | | 78.7 | | 72.1 | |
Earnings on common stock | | 88.8 | | 69.6 | | 63.1 | | 58.9 | | 54.6 | | 70.4 | | 78.4 | | 71.8 | |
Cash dividends paid | | $ | 80.0 | | $ | 125.0 | | $ | — | | $ | — | | $ | — | | $ | — | | $ | 75.0 | | $ | — | |
118
Table of Contents
Item 9 - Changes in and Disagreements with Accountants on Accounting and Financial Disclosure
None.
Item 9A - Controls and Procedures
Disclosure Controls and Procedures
Our Chief Executive Officer (CEO) and Chief Financial Officer (CFO) are responsible for establishing and maintaining our disclosure controls and procedures. These controls and procedures were designed to ensure that material information relating to us and our subsidiaries are communicated to the CEO and CFO. We evaluated these disclosure controls and procedures as of the end of the period covered by this report with the participation of our CEO and CFO. Based on this evaluation, our CEO and CFO concluded that our disclosure controls and procedures are effective: (i) to ensure that information required to be disclosed by us in the reports that we file or submit under the Exchange Act is recorded, processed, summarized and reported, within the time periods specified in the SEC’s rules and formsforms; and (ii) to ensure that information required to be disclosed by us in the reports that we submit under the Exchange Act is accumulated and communicated to our management, including our principal executive and principal financial officers, or persons performing similar functions, as appropriate, to allow timely decisions regarding required disclosure.
There was no change in our internal control over financial reporting during the most recently completed fiscal period that has materially affected, or is reasonably likely to materially affect, internal control over reporting.
The following report is our report on internal control over financial reporting as of December 31, 2006.2008.
Management’s Report on Internal Control Overover Financial Reporting
We are responsible for establishing and maintaining adequate internal control over financial reporting, as such term is defined in Exchange Act Rule 13a-15(f). Under the supervision and with the participation of management, including the CEO and CFO, we conducted an evaluation of the effectiveness of our internal control over financial reporting based on the framework in Internal Control - Integrated Framework issued by the Committee of Sponsoring Organizations of the Treadway Commission. Based on an evaluation under the framework in Internal Control - Integrated Framework, we concluded that our internal control over financial reporting was effective as of December 31, 2006.2008.
Our assessment of the effectiveness of our internal control over financial reporting as of December 31, 2006,2008, has been audited by KPMG LLP, the independent registered public accounting firm that audited the financial statements contained herein, as stated in their report which is included herein.
Item 9B - Other Information
None.
119
Table of Contents
PART III
Item 10 - - Directors and Executive Officers of DPL Inc.
The information required to be furnished pursuant to this item with respect to Directors of DPL Inc. Inc. will be set forth under captioned “Election of Directors” in DPL Inc.’s proxy statement (the Proxy Statement) to be furnished to shareholders in connection with the solicitation of proxies by our Board of Directors for use at the 20072009 Annual Meeting of Shareholders to be held on April 27, 200729, 2009 and is incorporated herein by reference.
The information required to be furnished pursuant to this item for DPL Inc. with respect to the identification of the Audit Committee, the Audit Committee financial expert and the registrant’s code of ethics will be set forth under the caption “Corporate Governance” in the Proxy Statement and is incorporated herein by reference.
Item 11 - - Executive Compensation
The information required to be furnished pursuant to this item for DPL Inc. Inc. will be set forth under the caption “Executive Compensation” in the Proxy Statement and is incorporated herein by reference.
Item 12 - Security Ownership of Certain Beneficial Owners and Management and Related Shareholder Matters
The information required to be furnished pursuant to this item for DPL Inc. Inc. will be set forth under the captions “Security Ownership of Certain Beneficial Owners,” “Security Ownership of Management” and “Equity Compensation Plan Information” in the Proxy Statement and is incorporated herein by reference.
Item 13 - Certain Relationships and Related Transactions
The information required to be furnished pursuant to this item for DPL Inc. Inc. will be set forth under the caption “Certain Relationships and Related Transactions” in the Proxy Statement and is incorporated herein by reference.
Item 14 - Principal Accountant Fees and Services
The information required to be furnished pursuant to this item for DPL Inc. Inc. will be set forth under the caption “Audit and Non-Audit Fees” in the Proxy Statement and is incorporated herein by reference.
DP&L Accountant Fees and Services
The following table presents the aggregate fees billed for professional services rendered to us by KPMG LLP for 2008 and PricewaterhouseCoopers LLP for 2006 and 2005.2007. Other than as set forth below, no professional services were rendered or fees billed by KPMG LLP during 20062008 and 2005.2007.
KPMG LLP | | Fees Invoiced 2006 | | Fees Invoiced 2005 | |
Audit Fees (1) | | $ | 1,762,728 | | $ | 2,511,912 | |
Audit-Related Fees (2) | | 147,030 | | 55,712 | |
Tax Fees (3) | | — | | 2,435 | |
All Other Fees (4) | | — | | — | |
Total | | $ | 1,909,758 | | $ | 2,570,059 | |
PricewaterhouseCoopers LLP | | | | | |
Audit Fees (1) | | $ | — | | $ | 96,350 | |
Audit-Related Fees (2) | | — | | 14,400 | |
Tax Fees (3) | | — | | — | |
All Other Fees (4) | | 1,500 | | — | |
Total | | $ | 1,500 | | $ | 110,750 | |
KPMG LLP | | Fees Invoiced 2008 | | Fees Invoiced 2007 (3) | |
Audit Fees (1) | | $ | 1,409,800 | | $ | 1,502,087 | |
Audit-Related Fees (2) | | 84,800 | | 147,679 | |
Tax Fees | | — | | — | |
All Other Fees | | — | | — | |
Total | | $ | 1,494,600 | | $ | 1,649,766 | |
(1) Audit fees relate to professional services rendered for the audit of our annual financial statements and the reviews of our quarterly financial statements.
(2) Audit-related fees relate to services rendered to us for assurance and related services.
(3) TaxIncludes $341,390 of audit and related fees relateinvoiced by, and paid to KPMG LLP in 2008 for services rendered to us for tax compliance, tax planning and advice.
(4) Other services performed include certain advisory services in connection with accounting research and do not include any fees forthe audit of our 2007 financial information systems design and implementation.statements.
105120
Table of Contents
PART IV
Item 15 -— Exhibits and Financial Statement Schedules
(a)
|
| Page No. |
(a)The following documents are filed as part of this report: |
| Page No
| 1.Financial Statements
| | | | | | 1. Financial Statements | | | | | | DPL Inc.Inc. - Consolidated Statements of Results of Operations for each of the three years in the period ended December 31, 20062008 | | 4960
|
| | | DPL Inc.Inc. - Consolidated Statements of Cash Flows for each of the three years in the period ended December 31, 20062008 | | 5061
|
| | | DPL Inc.Inc. - Consolidated Balance Sheets at December 31, 20062008 and 20052007 | | 5162
|
| | | DPL Inc.Inc. - Consolidated Statement of Shareholders’ Equity for each of the three years in the period ended December 31, 20062008 | | 5364
|
| | | DP&L - Consolidated Statements of Results of Operations for each of the three years in the period ended December 31, 20062008 | | 5465
|
| | | DP&L- Consolidated Statements of Cash Flows for each of the three years in the period ended December 31, 20062008 | | 5566
|
| | | DP&L - Consolidated Balance Sheets at December 31, 20062008 and 20052007 | | 5667
|
| | | DP&L - Consolidated Statement of Shareholders’Shareholder’s Equity for each of the three years in the period ended December 31, 20062008 | | 58
| Notes to Consolidated Financial Statements
| | 59
| DPL Inc. - Report of Independent Registered Public Accounting Firm
| | 99
| DPL Inc. - Report of Independent Registered Public Accounting Firm on Internal Controls
| | 100
| DP&L - Report of Independent Registered Public Accounting Firm
| | 101
| DP&L - Report of Independent Registered Public Accounting Firm on Internal Controls
| | 10269
| | | | Notes to Consolidated Financial Statements | | 70 |
| | | DPL Inc. - Report of Independent Registered Public Accounting Firm | | 114 |
| | | DP&L - Report of Independent Registered Public Accounting Firm | | 116 | | | | 2.Financial Statement Schedule |
|
| | | | For each of the three years in the period ended December 31, 2006:2008: | | | | | | | | 120
134 |
The information required to be submitted in Schedules I, III, IV and V is omitted as not applicable or not required under rules of Regulation S-X.
3. Exhibits
121
DPLTable of Contents and DP&L exhibits are incorporated by reference as described unless otherwise filed as set forth herein.
The exhibits filed as part of3. DPL’sExhibits and DP&L’s Annual Report on Form 10-K, respectively, are:
DPL Inc.and DP&L exhibits are incorporated by reference as described unless otherwise filed as | | set forth herein. | | | | | | | | | | | | | | | | | | The exhibits filed as part of DPL’s and DP&L’s Annual Report on Form 10-K, respectively, are: | | | | | | | | | | | |
DPL | | DP&L | | Exhibit
Number | | Exhibit | | Location(1) | X | | X | | 2(a) | | Copy of Asset Purchase Agreement, dated December 14, 1999, between The Dayton Power and Light Company, Indiana Energy, Inc., and Number-3CHK, Inc.
| | Exhibit 2 to Report on Form 10-Q for the quarter ended September 30, 2000 (File No. 1-9052) | | | | | | | | | | X | | | | 3(a) | | Copy of Amended Articles of Incorporation of DPL Inc. dated, as of September 25, 2001
| | Exhibit 3 to Report on Form 10-K/A for the year ended December 31, 2001 (File No. 1-2385)1-9052) | | | | | | | | | | X | | | | 3(b) | | Amended Regulations of DPL Inc., as of April 27, 2007 | | Exhibit 3(b) to Report on Form 8-K filed on May 3, 200410-K for the year ended December 31, 2007 (File No. 1-9052) | | | | | | | | | | | | X | | 3(c) | | Copy of Amended Articles of Incorporation of The Dayton Power and Light Company, datedas of January 4, 1991
| | Exhibit 3(b) to Report on Form 10-K/A for the year ended December 31, 1991 (File No. 1-2385) | | | | | | | | | | | | X | | 3(d) | | Regulations of The Dayton Power and Light Company, as of April 9, 1981 | | Exhibit 3(a) to Report on Form 8-K filed on April 30,May 3, 2004 (File No. 1-2385) | | | | | | | | | | X | | X | | 4(a) | | Copy of Composite Indenture dated as of October 1, 1935, between DP<he Dayton Power and The Bank of New York,Light Company and Irving Trust Company, Trustee with all amendments through the Twenty-Ninth Supplemental Indenture
| | Exhibit 4(a) to Report on Form 10-K for the year ended December 31, 1985 (File No. 1-2385) | | | | | | | | | | X | | X | | 4(b) | | Copy of Forty-First Supplemental Indenture dated as of February 1, 1999, between DP<he Dayton Power and Light Company and The Bank of New York, Trustee
| | Exhibit 4(m) to Report on Form 10-K for the year ended December 31, 1998 (File No. 1-2385) | | | | | | | | | | X | | X | | 4(c) | | Copy of Forty-Second Supplemental Indenture dated as of September 1, 2003, between DP<he Dayton Power and Light Company and The Bank of New York, Trustee
| | Exhibit 4(r) to Report on Form 10-K for the year ended December 31, 2003 (File No. 1-2385) | | | | | | | | | 1-9052) |
122
Table of Contents DPL Inc. |
| DP&L |
| Exhibit
Number |
| Exhibit |
| Location(1) | X | | X | | 4(d) | | Copy of Forty-Third Supplemental Indenture dated as of August 1, 2005, between DP<he Dayton Power and Light Company and The Bank of New York, Trustee
| | Exhibit 4.4 to Report on Form 8-K filed on August 24, 2005 (File No. 1-2385) | | | | | | | | | | X | | X | | 4(e) | | Copy of Rights Agreement dated September 25, 2001 between DPL Inc. and Equiserve Trust Company, N.A.
| | Exhibit 4 to Report on Form 8-K datedfiled September 25,28, 2001 (File No. 1-9052) | | | | | | | | | | X | | | | 4(f) | | Copy of Securities Purchase Agreement dated as of February 1, 2000 by and among DPL Inc., and DPL Capital Trust I, Dayton Ventures LLC and Dayton Ventures, Inc. and certain exhibits thereto
| | Exhibit 99(b) to Schedule TO-I datedfiled February 4, 2000 (File No. 1-9052) | | | | | | | | | | X | | | | 4(g) | | Amendment to Securities Purchase Agreement dated as of February 24, 2000 among DPL Inc., DPL Capital Trust I, Dayton Ventures LLC and Dayton Ventures, Inc. | | Exhibit 4(g) to Report on Form 10-K for the year ended December 31, 2005 (File No. 1-9052) | | | | | | | | | | X | | | | 4(h) | | CopyForm of Warrant Form initially issued asto Purchase Common Shares of February 1, 2000DPL Inc.
| | Exhibit 4(h) to Report on Form 10-K for the year ended December 31, 2005 (File No. 1-9052) | | | | | | | | | | X | | | | 4(i) | | Securityholders and Registration Rights Agreement dated as of February 1,March 13, 2000 among DPL Inc., DPL Capital Trust I, Dayton Ventures LLC and Dayton Ventures, Inc. | | Exhibit 4(i) to Report on Form 10-K for the year ended December 31, 2005 (File No. 1-9052) | | | | | | | | | | X | | | | 4(j) | | Amendment to Securityholders and Registration Rights Agreement, dated August 24, 2001 among DPL Inc., DPL Capital Trust I, Dayton Ventures LLC and Dayton Ventures, Inc. | | Exhibit 4(j) to Report on Form 10-K for the year ended December 31, 2005 (File No. 1-9052) | | | | | | | | | | X | | | | 4(k) | | Amendment to Securityholders and Registration Rights Agreement, dated December 6, 2004 among DPL Inc., DPL Capital Trust I, Dayton Ventures LLC and Dayton Ventures, Inc. | | Exhibit 4(k) to Report on Form 10-K for the year ended December 31, 2005 (File No. 1-9052) | | | | | | | | | | X | | | | 4(l) | | Amendment to Securityholders and Registration Rights Agreement, dated as of January 12, 2005 among DPL Inc., DPL Capital Trust I, Dayton Ventures LLC and Dayton Ventures, Inc | | Exhibit 4(j) to Report on Form 10-K for the year ended December 31, 2005 (File No. 1-9052) | | | | | | | | | |
108123
Table of Contents XDPL Inc.
|
| XDP&L
|
| 4(m)Exhibit
Number
|
| Copy of Credit Agreement dated as of June 1, 2004 between The Dayton Power and Light Company, KeyBank National Association (as administrative agent and lead arranger) and the lending institutions named thereinExhibit
|
| Exhibit 4(ee) to Report on Form 10-K for the year ended December 31, 2003 (File No. 1-2385)
| | | | | | | | | | X
| | X
| | 4(n)
| | Copy of Credit Agreement dated as of May 31, 2005 between The Dayton Power and Light Company, KeyBank National Association (as administrative agent and lead arranger) and the lending institutions named therein
| | Exhibit 10.1 to Form 8-K filed on June 28, 2005 (File No. 1-9052)
| | | | | | | | | Location(1) | X | | | | 4(o)4(m)
| | Officer’s Certificate of DPL Inc. establishing $175 million Senior Note due 2009, dated March 25, 2004 | | Exhibit 4.1 to Form 8-K, filed on March 29,30, 2004 (File No. 1-9052) | | | | | | | | | | X | | | | 4(p)4(n)
| | Exchange and Registration Rights Agreement dated as of March 25, 2004 between DPL Inc. and thecertain purchasers | | Exhibit 4.2 to Form 8-K, filed on March 29,30, 2004 (File No. 1-9052) | | | | | | | | | | X | | | | 4(q)4(o)
| | Indenture dated as of March 1, 2000 between DPL Inc. and Bank One Trust Company, National Association | | Exhibit 4(b) to Registration Statement No. 333-37972 | | | | | | | | | | X | | | | 4(r)4(p)
| | Officer’s Certificate of DPL Inc. establishing exchange notes, dated March 1, 2000 | | Exhibit 4(c) to Registration Statement No. 333-37972 | | | | | | | | | | X | | | | 4(s)4(q)
| | Exchange and Registration Rights Agreement dated as of August 24, 2001 between DPL Inc., Morgan Stanley & Co., Incorporated, Bank One Capital Markets, Inc., Fleet Securities, Inc. and NatCity Investments, Inc. | | Exhibit 4(a) to Registration Statement No. 333-74568 | | | | | | | | | | X | | | | 4(t)4(r)
| | Officer’s Certificate of DPL Inc. establishing exchange notes, dated August 31, 2001 | | Exhibit 4(c) to Registration Statement No. 333-74568 | | | | | | | | | | X | | | | 4(u)4(s)
| | Indenture dated as of August 31, 2001 between DPL Inc. and The Bank of New York, Trustee | | Exhibit 4(a) to Registration Statement No. 333-74630 | | | | | | | | | | X | | | | 4(v)4(t)
| | First Supplemental Indenture dated as of August 31, 2001 relating to the subordinated debentures between DPL Inc. and The Bank of New York, as Trustee | | Exhibit 4(b) to Registration Statement No. 333-74630 | | | | | | | | | |
X | | | | 4(w)4(u)
| | Amended and Restated Trust Agreement dated as of August 31, 2001 relating to DPL Capital Trust II, the Capital Securities and the Common Securities among DPL Inc., the depositor, The Bank of New York, as property trustee, The Bank of New York (Delaware), the administrative trustees named therein, and several Holders as defined therein | | Exhibit 4(c) to Registration Statement No. 333-74630 |
124
Table of Contents DPL Inc. |
| DP&L |
| Exhibit
Number |
| Exhibit |
| Location(1) | | | X | | 4(x)4(v)
| | Forty FourthForty-Fourth Supplemental Indenture to the First and Refunding Mortgage, dated as of September 1, 2006 between the Bank of New York, as trusteeTrustee and The Dayton Power and Light Company
| | Exhibit 4.2 to Form 8-K filed on September 19, 2006 (File No. 1-2385) | | | | | | | | | | X | | | | 4(y)4(w)
| | Exchange and Registration Rights Agreement dated as of August 24, 2001 among DPL Inc., DPL Capital Trust II and Morgan Stanley & Co., Incorporated | | Exhibit 4(d) to Registration Statement No. 333-74630 | | | | | | | | | | X | | X | | 4(x) | | Forty-Sixth Supplemental Indenture dated as of December 1, 2008 between The Bank of New York Mellon, Trustee and The Dayton Power and Light Company | | Filed herewith as Exhibit 4(x) | | | | | | | | | | X | | X | | 10(a)* | | Copy ofThe Dayton Power and Light Company Directors’ Deferred Stock Compensation Plan, as amended through December 31, 2000
| | Exhibit 10(a) to Report on Form 10-K for the year ended December 31, 2000 (File No. 1-9052) | | | | | | | | | | X | | X | | 10(b)* | | Copy of Directors’The Dayton Power and Light Company 1991 Amended Directors’ Deferred Compensation Plan, as amended and restated through December 31, 20002007
| | Exhibit 10(b) to Report on Form 10-K for the year ended December 31, 20002007 (File No. 1-9052) | | | | | | | | | | X | | X | | 10(c)* | | Amendment No. 1 to Directors’ 1991 Amended Deferred CompensationThe Dayton Power and Light Company Management Stock Incentive Plan as amended and restated through December 31, 2000 and dated as of December 7, 20042007
| | Exhibit 10(c) to Report on Form 10-K for the year ended December 31, 20052007 (File No. 1-9052) | | | | | | | | | | X | | X | | 10(d)* | | Copy of Management Stock IncentiveThe Dayton Power and Light Company Key Employees Deferred Compensation Plan, as amended through December 31, 2000
| | Exhibit 10(c)10(d) to Report on Form 10-K for the year ended December 31, 2000 (File No. 1-9052) | | | | | | | | | | X | | X | | 10(e)* | | Amendment No. 1 to Management Stock IncentiveThe Dayton Power and Light Company Key Employees Deferred Compensation Plan, as amended through December 31, 2000, and dated as of December 7, 2004 | | Exhibit 10(g) to Report on Form 10-K for the year ended December 31, 2005 (File No. 1-9052) |
125
Table of Contents DPL Inc. |
| DP&L |
| Exhibit
Number |
| Exhibit |
| Location(1) | X | | X | | 10(f)* | | The Dayton Power and Light Company Supplemental Executive Retirement Plan, as amended February 1, 2000 | | Exhibit 10(e) to Report on Form 10-K for the year ended December 31, 2005 (File No. 1-9052) | | | | | | | | | |
X
| | X
| | 10(f)*
| | Copy of Key Employees Deferred Compensation Plan amended December 31, 2000
| | Exhibit 10(d) to Report on Form 10-K for the year ended December 31, 20002003 (File No. 1-9052)
| | | | | | | | | | X | | X | | 10(g)* | | Amendment No. 1 to Key Employees Deferred Compensation Plan amended December 31, 2000The Dayton Power and dated as of December 7, 2004 | | Exhibit 10(g) to Report on Form 10-K for the year ended December 31, 2005 (File No. 1-9052)
| | | | | | | | | | X
| | X
| | 10(h)*
| | Copy ofLight Company Supplemental Executive Retirement Plan, as amended February 1, 2000
| | Exhibit 10(e) to Report on Form 10-K for the year ended December 31, 2003 (File No. 1-2385)
| | | | | | | | | | X
| | X
| | 10(i)*
| | Amendment No. 1 to Supplemental Executive Retirement Plan amendedthrough February 1, 2000 and dated as of December 7, 2004
| | Exhibit 10(i) to Report on Form 10-K for the year ended December 31, 2005 (File No. 1-9052) | | | | | | | | | | X | | X
| | 10(j)10(h)*
| | Copy ofDPL Inc. Stock Option Plan
| | Exhibit 10(f) to Report on Form 10-K for the year ended December 31, 2000 (File No. 1-9052) | | | | | | | | | | X | | X
| | 10(k)10(i)*
| | 2003 Long-Term Incentive Plan of DPL Inc. dated as of January 20, 2003 | | Exhibit 10(aa) to Report on Form 10-K for the year ended December 31,200331, 2003 (File No. 1-9052) | | | | | | | | | | X | | | | 10(l)*
| | Summary of Executive Life Insurance Plan
| | Exhibit 10(l) to Report on Form 10-K for the year ended December 31, 2005 (File No. 1-9052)
| | | | | | | | | | X | | | | 10(m)10(j)*
| | Summary of Executive Medical Insurance Plan | | Exhibit 10(m) to Report on Form 10-K for the year ended December 31, 2005 (File No. 1-9052) | | | | | | | | | | X | | X
| | 10(n)10(k)*
| | DPL Inc. Executive Incentive Compensation Plan, as amended and restated through December 31, 2007 | | Exhibit 10.110(l) to Report on Form 8-K/A filed on March 2, 200610-K for the year ended December 31, 2007 (File No. 1-9052) | | | | | | | | | | X | | | | 10(o)*
| | DPL Inc. Executive Incentive Compensation Plan and Schedule A as amended September 5, 2006
| | Exhibit 10.3 to Form 8-K filed on September 8, 2006 (File No. 1-9052)
|
111
X
| | X
| | 10(p)10(l)*
| | DPL Inc. 2006 Equity and Performance Incentive Plan as amended and restated through December 31, 2007 | | Exhibit 10.210(m) to Report on Form 8-K/A filed on March 2, 200610-K for the year ended December 31, 2007 (File No. 1-9052) | | | | | | | | | | X | | X
| | 10(q)10(m)*
| | Form of theDPL Inc. Amended and Restated Long-Term Incentive Plan - Performance Shares Agreement | | Exhibit 10.310(n) to Report on Form 8-K/A filed10-K for the year ended December 31, 2007 (File No. 1-9052) | | | | | | | | | | X | | | | 10(n)* | | DPL Inc. Severance Pay and Change of Control Plan, as amended and restated through December 31, 2007 | | Exhibit 10(o) to Report on March 2,Form 10-K for the year ended December 31, 2007 (File No. 1-9052) |
126
Table of Contents DPL Inc. |
| DP&L |
| Exhibit
Number |
| Exhibit |
| Location(1) | X | | | | 10(o)* | | DPL Inc. Supplemental Executive Defined Contribution Retirement Plan, as amended and restated through December 31, 2007 | | Exhibit 10(p) to Report on Form 10-K for the year ended December 31, 2007 (File No. 1-9052) | | | | | | | | | | X | | | | 10(p)* | | DPL Inc. 2006 Deferred Compensation Plan For Executives, as amended and restated through December 31, 2007 | | Exhibit 10(q) to Report on Form 10-K for the year ended December 31, 2007 (File No. 1-9052) | | | | | | | | | | X | | | | 10(q)* | | DPL Inc. Pension Restoration Plan, as amended and restated through December 31, 2007 | | Exhibit 10(r) to Report on Form 10-K for the year ended December 31, 2007 (File No. 1-9052) | | | | | | | | | | X | | X | | 10(r)* | | Participation Agreement dated August 2, 2007 among DPL Inc. Severance Pay, The Dayton Power and Change of Control PlanLight Company and Teresa F. Marrinan | | Exhibit 10.410(s) to Report on Form 8-K/A filed on March 2, 200610-K for the year ended December 31, 2007 (File No. 1-9052) | | | | | | | | | | X | | X | | 10(s)10 (s)*
| | Participation Agreement dated March 27, 2007 among DPL Inc. Supplemental Executive Defined Contribution Retirement Plan, The Dayton Power and Light Company and Scott J. Kelly | | Exhibit 10.510(t) to Report on Form 8-K/A filed on March 2, 200610-K for the year ended December 31, 2007 (File No. 1-9052) | | | | | | | | | | X | | X | | 10(t)* | | Participation Agreement and Waiver dated February 27, 2006 among DPL Inc. 2006 Deferred Compensation Plan For Executives, The Dayton Power and Light Company and Gary G. Stephenson | | Exhibit 10.210(u) to Report on Form 8-K filed on September 25, 200610-K for the year ended December 31, 2007 (File No. 1-9052) | | | | | | | | | | X | | X | | 10(u)* | | Participation Agreement and Waiver dated February 23, 2006 among DPL Inc. Pension Restoration Plan, The Dayton Power and Light Company and Miggie E. Cramblit | | Exhibit 10.310(v) to Report on Form 8-K filed on September 25, 200610-K for the year ended December 31, 2007 (File No. 1-9052) | | | | | | | | | | X | | X | | 10(v)* | | LetterParticipation Agreement and Waiver dated as of September 20, 2004 and Management Stock Option Agreement, as amended, dated as of October 5, 2004, betweenFebruary 24, 2006 among DPL Inc., The Dayton Power and Robert D. BiggsLight Company and Joseph R. Boni III
| | Exhibits 10.2 and 10.3Exhibit 10(w) to Report on Form 8-K filed on October 8, 200410-K for the year ended December 31, 2007 (File No. 1-9052)
| | | | | | | | | | X | | X | | 10(w)10 (w)*
| | Amended and Restated EmploymentParticipation Agreement Dated as of August 31, 2005 effective as ofdated January 1, 2005 between13, 2007 among DPL Inc., The Dayton Power and Light Company and Robert D. BiggsDaniel J. McCabe
| | Exhibit 10.110(x) to Report on Form 8-K filed on September 2, 200510-K for the year ended December 31, 2007 (File No. 1-9052) | | | | | | | | | | X | | X
| | 10(x)* | | Management Stock Option Agreement dated as of August 31, 2005 between DPL Inc. and Robert D. Biggs
| | Exhibit 10.2 to Report on Form 8-K filed on September 2, 2005 (File No. 1-9052)
| | | | | | | | | |
X
| | X
| | 10(y)*
| | Employment agreement dated as of January 3, 2003, between DPL Inc., The Dayton Power and Light Company and James V. Mahoney
| | Exhibit 10(j) to Report on Form 10-K for the year ended December 31, 2003 (File No. 1-9052)
| | | | | | | | | | X
| | X
| | 10(z)*
| | Change of Control Agreement dated as of January 3, 2003, between DPL Inc., The Dayton Power and Light Company and James V. Mahoney and Management Stock Option Agreement dated January 3, 2003 between DPL Inc. and James V. Mahoney
| | Exhibit 10(o) to Report on Form 10-K for the year ended December 31, 2003 (File No.1-9052)
| | | | | | | | | | X
| | X
| | 10(aa)*
| | Employment agreement dated as of December 21, 2004 between DPL Inc., The Dayton Power and Light Company and James V. Mahoney
| | Exhibit 10.1 to Form 8-K filed on December 28, 2004 (File No. 1-9052)
| | | | | | | | | | X
| | X
| | 10(bb)*
| | Participation Agreement and Waiver among DPL Inc., The Dayton Power and Light Company and James V. Mahoney, dated March 7, 2006
| | Exhibit 10.1 to Form 8-K filed on March 10, 2006 (File No. 1-9052)
| | | | | | | | | | X
| | X
| | 10(cc)*
| | Employment Agreement dated as of May 18, 2006 among DPL Inc., The Dayton Power and Light Company and James V. Mahoney
| | Exhibit 10.1 to Form 8-K filed on May 24, 2006 (File No. 1-9052)
| | | | | | | | | | X
| | X
| | 10(dd)*
| | Amendment of Employment Agreement dated as of July 31, 2006 between James V. Mahoney, DPL Inc. and The Dayton Power and Light Company
| | Exhibit 10.5 to Report on Form 10-Q filed August 1, 2006 (File No. 1-9052)
| | | | | | | | | | X
| | X
| | 10(ee)*
| | Employment agreement dated as of December 14, 2004 between DPL Inc., The Dayton Power and Light Company and John J. Gillen
| | Exhibit 10.2 to Form 8-K filed on December 28, 2004 (File No. 1-9052)
| | | | | | | | | | X
| | X
| | 10(ff)*
| | Management Stock Option Agreement dated as of December 29, 2004 between DPL Inc. and John J. Gillen | | Exhibit 10(u) to Report on Form 10-K for the year ended December 31, 20052007 (File No. 1-9052) |
127
Table of Contents DPL Inc. |
| DP&L |
| Exhibit
Number |
| Exhibit |
| Location(1) | X | | X | | 10(gg)10(y)*
| | Participation Agreement and Waiver dated June 29, 2006 betweenamong DPL Inc., The Dayton Power and Light Company and John J. Gillen | | Exhibit 10.2 to Form 8-K filed on July 3, 2006 (File No. 1-9052) | | | | | | | | | | X | | X | | 10(hh)10(z)*
| | Employment agreementParticipation Agreement and Waiver dated as of September 17, 2003, between DPL Inc. and W. Steven Wolff
| | Exhibit 10(k) to Report on Form 10-K for the year ended December 31, 2003 (File No.1-9052)
| | | | | | | | | | X
| | X
| | 10(ii)*
| | Change of Control Agreement dated as of September 10, 2004, betweenFebruary 24, 2006 among DPL Inc., The Dayton Power and Light Company and W. Steven Wolff
| | Exhibit 10(dd) to Report on Form 8-K filed September 23, 2004 (File No. 1-9052) | | | | | | | | | |
X
| | X
| | 10(jj)*
| | Participation Agreement and Waiver among DPL Inc., The Dayton Power and Light Company and W. Steven Wolff, dated February 24, 2006
| | Exhibit 10.7 to Form 8-K filed on March 2, 2006 (File No. 1-9052)
| | | | | | | | | | X | | X | | 10(kk)*
| | Employment Agreement dated as of December 17, 2003 between DPL Inc. and Patricia K. Swanke
| | Exhibit 10(l) to Report on Form 10-K for the year ended December 31, 2003 (File No.1-9052)
| | | | | | | | | | X
| | X
| | 10(ll)10(aa)*
| | Change of Control Agreement dated as of July 1, 2004 between DPL Inc., The Dayton Power and Light Company and Patricia K. Swanke and Management Stock Option Agreement dated as of January 1, 2001 between DPL Inc. and Patricia K. Swanke | | Exhibit 10(s) to Report on Form 10-K for the year ended December 31, 2004 (File No. 1-9052) | | | | | | | | | | X | | X | | 10(mm)10(bb)*
| | Participation Agreement and Waiver dated February 28, 2006 among DPL Inc., The Dayton Power and Light Company and Patricia K. Swanke dated February 28, 2006 | | Exhibit 10.6 to Form 8-K filed on March 2, 2006 (File No. 1-9052) | | | | | | | | | | X | | X
| | 10(nn)*
| | Employment Agreement and Change of Control Agreement dated as of September 17, 2004 between DPL Inc., The Dayton Power and Light Company and Gary Stephenson
| | Exhibit 10(ee) to Report on Form 8-K filed on September 23, 2004 (File No. 1-9052)
| | | | | | | | | | X
| | X
| | 10(oo)*
| | Employment agreement dated as of June 9, 2003, as amended by attached letter dated October 18, 2004, between DPL Inc., The Dayton Power and Light Company and Miggie E. Cramblit
| | Exhibit 10(gg) to Report on Form 10-K for the year ended December 31, 2003 (File No. 1-9052)
| | | | | | | | | | X
| | X
| | 10(pp)*
| | Change of Control Agreement dated as of December 15, 2000 between DPL Inc., The Dayton Power and Light Company and Arthur G. Meyer
| | Exhibit 10(bb) to Report on Form 10-K for the year ended December 31, 2005 (File No. 1-9052)
| | | | | | | | | | X
| | X
| | 10(qq)10(cc)*
| | Management Stock Option Agreement dated as of January 1, 2001 between DPL Inc. and Arthur G. Meyer | | Exhibit 10(cc) to Report on Form 10-K for the year ended December 31, 2005 (File No. 1-9052) | | | | | | | | | | X | | X | | 10(rr)10(dd)*
| | Participation Agreement and Waiver dated March 6, 2006 among DPL Inc., The Dayton Power and Light Company and Arthur G. Meyer, dated March 6, 2006 | | Exhibit 10.2 to Form 8-K filed on March 10, 2006 (File No. 1-9052) |
114
X
| | | | 10(ss)
| | | | | X | | X | | 10(ee)* | | Participation Agreement dated September 8, 2006 betweenamong DPL Inc., The Dayton Power and Light Company and Paul M. Barbas | | Exhibit 10.2 to Form 8-K filed on September 8, 2006 (File No. 1-9052) | | | | | | | | | | X | | X | | 10(tt)10(ff)*
| | Participation Agreement dated June 30, 2006 betweenamong DPL Inc., The Dayton Power and Light Company and Frederick J. Boyle | | Exhibit 10.1 to Form 8-K filed on July 3, 2006 (File No. 1-9052) | | | | | | | | | | X | | | | 10(uu)10(gg)*
| | Letter Agreement between DPL Inc. and Glenn E. Harder, dated as of June 20, 2006 | | Exhibit 10.1 to Form 8-K filed on June 20,21, 2006 (File No. 1-9052) |
128
Table of Contents DPL Inc. |
| DP&L |
| Exhibit
Number |
| Exhibit |
| Location(1) | X | | | | 10(vv)10(hh)
| | Purchase and Sale Agreement dated as of February 13, 2005 between MVE, Inc., and Miami Valley Insurance Company and AlpInvest/Lexington 2005, LLC | | Exhibit 10.1 to Form 8-K filed on February 18, 2005 (File No. 1-9052) | | | | | | | | | | X | | | | 10(ww)10(ii)
| | Asset Purchase Agreement dated as of December 21, 2006 between DPL Energy, LLC and Buckeye Power, Inc. | | Filed herewith as Exhibit 10(ww)10(w w) to Report on Form 10-K for the year ended December 31, 2006 (File No. 1-9052)
| | | | | | | | | | X | | | | 10(xx)10(jj)
| | Asset Purchase Agreement dated as of November 28, 2006 between DPL Energy, LLC and Columbus Southern Power Company | | Filed herewith as Exhibit 10(xx)
| | | | | | | | | | | | X
| | 10(yy)
| | Revolving Credit Agreement, dated as of November 21, to Report on Form 10-K for the year ended December 31, 2006 between KeyBank N.A., JPMorgan Chase, N.A., Fifth Third Bank and The Dayton Power and Light Company
| | Exhibit 10.1 to Form 8-K filed on November 28, 2006 (File No. 1-2385)
| | | | | | | | | | X
| | X
| | 10(zz)
| | Form of the Long-Term Incentive Plan — Performance Shares Agreement as amended February 20, 2007
| | Filed herewith as Exhibit 10(zz)
| | | | | | | | | | X
| | X
| | 18
| | Copy of preferability letter relating to change in accounting for unbilled revenues from Price Waterhouse LLP
| | Exhibit 10.1 to Form 8-K filed on February 18, 2005 (File No. 1-9052)
| | | | | | | | | | X | | X | | 10(kk) | | Credit Agreement, dated as of November 21, 2006 among The Dayton Power and Light Company, KeyBank National Association and certain lending institutions | | Exhibit 10.1 to Form 8-K filed November 28, 2006 (File No. 1-2385) | | | | | | | | | | X | | | | 10(ll)* | | Form of DPL Inc. Amended and Restated Non-Employee Director Restricted Stock Units Agreement | | Exhibit 10(uu) to Report on Form 10-K for the year ended December 31, 2007 (File No. 1-9052) | | | | | | | | | | X | | | | 10(mm)* | | DPL Inc. 2006 Deferred Compensation Plan for Non-Employee Directors, as amended and restated through December 31, 2007 | | Exhibit 10(v v) to Report on Form 10-K for the year ended December 31, 2007 (File No. 1-9052) | | | | | | | | | | X | | X | | 10(nn)* | | Participation Agreement dated January 3, 2008 among DPL Inc., The Dayton Power and Light Company and Douglas C. Taylor | | Exhibit 10(a) to Form 10-Q for the quarter ended March 31, 2008 (File No. 1-9052) | | | | | | | | | | X | | | | 10(oo)* | | Restricted Stock Agreement dated May 6, 2008 by and between DPL Inc. and Paul M. Barbas | | Exhibit 99.1 to Form 8-K filed May 8, 2008 (File No. 1-9052) | | | | | | | | | | X | | X | | 10(pp)* | | Separation Agreement dated as of November 30, 2008 between DPL Inc. and The Dayton Power and Light Company and John J. Gillen | | Filed herewith as Exhibit 10(qq) |
129
Table of Contents DPL Inc. |
| DP&L |
| Exhibit
Number |
| Exhibit |
| Location(1) | X | | X | | 21 | | List of Subsidiaries of DPL Inc. and The Dayton Power and Light Company | | Filed herewith as Exhibit 21 | | | | | | | | | | X | | | | 23(a) | | Consent of KPMG LLP | | Filed herewith as Exhibit 23(a) | | | | | | | | | | X | | X
| | 31(a) | | Certification of Chief Executive Officer pursuant to Section 302 of the Sarbanes-Oxley Act of 2002 | | Filed herewith as Exhibit 31(a) | | | | | | | | | |
X | | X
| | 31(b) | | Certification of Chief Financial Officer pursuant to Section 302 of the Sarbanes-Oxley Act of 2002 | | Filed herewith as Exhibit 31(b) | | | | | | | | | | | | X | | 31(c) | | Certification of Chief Executive Officer pursuant to Section 302 of the Sarbanes-Oxley Act of 2002 | | Filed herewith as Exhibit 31(c) | | | | | | | | | | | | X | | 31(d) | | Certification of Chief Financial Officer pursuant to Section 302 of the Sarbanes-Oxley Act of 2002 | | Filed herewith as Exhibit 31(d) | | | | | | | | | | X | | | | 32(a) | | Certification of Chief Executive Officer pursuant to Section 906 of the Sarbanes-Oxley Act of 2002 | | Filed herewith as Exhibit 32(a) | | | | | | | | | | X | | X
| | 32(b) | | Certification of Chief Financial Officer pursuant to Section 906 of the Sarbanes-Oxley Act of 2002 | | Filed herewith as Exhibit 32(b) | | | | | | | | | | X
| | X | | 99(a)32(c)
| | ReportCertification of Taft, Stettinius & Hollister LLP, dated April 26, 2004Chief Executive Officer pursuant to Section 906 of the Sarbanes-Oxley Act of 2002
| | Filed herewith as Exhibit 99(a) to Report on Form 10-K for the year ended December 31, 2003 (File No. 1-9052)32(c) | | | | | | | | | | | | X | | 32(d) | | Certification of Chief Financial Officer pursuant to Section 906 of the Sarbanes-Oxley Act of 2002 | | Filed herewith as Exhibit 32(d) |
* Management contract or compensatory plan (1) Exhibits referencing File No. 1-9052 have been filed by DPL Inc. and those referencing File No. 1-2385 have been filed by The Dayton Power and Light Company 130
Table of Contents DPL Inc. |
| DP&L |
| Exhibit
Number |
| Exhibit |
| Location(1) | X | | X | | 99(b) | | Supplement to the April 26, 2004 Report of Taft, Stettinius & Hollister LLP, dated May 15, 2004 | | Exhibit 99(b) to Report on Form 10-K for the year ended December 31, 2003 (File No. 1-9052) | | | | | | | | | | X | | X | | 99(c) | | Complaint filed in Montgomery County Court of Common Pleas, Montgomery County, Ohio — DPL Inc., The Dayton Power and Light Company and MVE, Inc. v. Peter H. Forster, Caroline E. Muhlenkamp and Stephen F. Koziar, Jr. | | Exhibit 99(d) to Report on Form 10-K for the year ended December 31, 2003 (File No. 1-9052) | | | | | | | | | |
* Management contract or compensatory plan (1) Exhibits referencing File No. 1-9052 have been filed by DPL Inc. and those referencing File No. 1-2385 have been filed by The Dayton Power and Light Company Pursuant to paragraph (b) (4) (iii) (A) of Item 601 of Regulation S-K, we have not filed as an exhibit to this Form 10-K certain instruments with respect to long-term debt if the total amount of securities authorized thereunder does not exceed 10% of the total assets of us and our subsidiaries on a consolidated basis, but we hereby agree to furnish to the SEC on request any such instruments. 116
131
Table of Contents SIGNATURES Pursuant to the requirements of Section 13 or 15(d) of the Securities Exchange Act of 1934, DPL Inc. Inc. and TheDayton Power and Light Company has duly caused this report to be signed on their behalf by the undersigned, thereunto duly authorized. |
| | DPL Inc. | | |
|
| | |
|
| | |
|
| February 22, 200726, 2009 | By: | | | | /s/ Paul M. Barbas | | | Paul M. Barbas
President and Chief Executive Officer
(principal executive officer) | | | |
|
| The Dayton Power and Light Company |
|
|
| February 26, 2009 | By: |
| | | /s/ Paul M. Barbas | | | Paul M. Barbas
President and Chief Executive Officer
(principal executive officer) |
132
| |
| The Dayton Power and Light Company
| | |
|
| | |
|
| | |
|
| February 22, 2007
| By:
| | /s/ Paul M. Barbas
| | | | Paul M. Barbas
President and Chief Executive Officer
(principal executive officer)
|
Pursuant to the requirements of the Securities Exchange Act of 1934, this report has been signed below by the following persons on behalf of DPL Inc. and The Dayton Power and Light Company and in the capacities and on the dates indicated. /s/ P.M. Barbas | | Director, President and Chief | | February 25, 2009 | (P.M. Barbas) | | Executive Officer (principal executive officer) | | | | | | | | /s/ R. D. Biggs | | Director | | February 22, 200725, 2009 | (R. D. Biggs) | | | | | | | | | | | | | | | /s/ P. R. Bishop | | Director and Vice-Chairman | | February 22, 200725, 2009 | (P. R. Bishop) | | | | | | | | | | /s/ F.F. Gallaher | | Director | | February 25, 2009 | (F.F. Gallaher) | | | | | | | | | | /s/ B. S. Graham | | Director | | February 22, 200725, 2009 | (B. S. Graham) | | | | | | | | | | | | | | | /s/ E. Green
| | Director
| | February 22, 2007
| (E. Green)
| | | | | | | | | | | | | | | /s/ G.E. Harder | | Director and Non-Executive Chairman | | February 22, 200725, 2009 | (G. E.G.E. Harder) | | | | | | | | | | | | | | | /s/ W A. Hillenbrand
| | Director and Vice-Chairman
| | February 22, 2007
| (W A. Hillenbrand)
| | | | | | | | | | | | | | | /s/ L.L. Lyles | | | | | (L. L. Lyles)
| | Director | | February 22, 200725, 2009 | (L.L. Lyles) | | | | | | | | | | /s/ P.M. BarbasP.B. Morris | | Director President and Chief | | February 22, 200725, 2009 | (P.M. Barbas) | | Executive Officer (principal executive officer)
| | | P.B. Morris) | | | | | | | | | | /s/ N.J. Sifferlen | | | | | (N.J. Sifferlen)
| | Director | | February 22, 2007 | | | | | | | | | | | /s/ J. J. Gillen
| | Senior Vice President and
| | February 22, 200725, 2009
| (J. J. Gillen) | | Chief Financial Officer (principal financial and principal accounting officer)
| | | N.J. Sifferlen) | | | | | | | | | | /s/ F.J. Boyle | | Corporate Controller andSenior Vice President,
| | February 22, 200725, 2009 | (F.J. Boyle) | | Chief AccountingFinancial Officer (principal financial and principal accounting officer), Treasurer and Controller | | |
133
Table of Contents Schedule II DPL Inc. VALUATION AND QUALIFYING ACCOUNTS For the years ended December 31, 2004-2006
$ in thousands | | | | | | | | | | Description | | Balance at
Beginning
of Period | | Additions | | Deductions
(1) | | Balance at
End of Period | | | | | | | | | | | | 2006: | | | | | | | | | | Deducted from accounts receivable— | | | | | | | | | | | | | | | | | | | | Provision for uncollectible accounts | | $ | 1,044 | | $ | 4,835 | | $ | 4,449 | | $ | 1,430 | | | | | | | | | | | | 2005: | | | | | | | | | | Deducted from accounts receivable— | | | | | | | | | | | | | | | | | | | | Provision for uncollectible accounts | | $ | 1,085 | | $ | 3,582 | | $ | 3,623 | | $ | 1,044 | | | | | | | | | | | | | | | | | | | | | | 2004: | | | | | | | | | | Deducted from accounts receivable— | | | | | | | | | | | | | | | | | | | | Provision for uncollectible accounts | | $ | 6,003 | | $ | 3,371 | | $ | 8,289 | | $ | 1,085 | |
(1) Amounts written off, net of recoveries of accounts previously written off.
The Dayton Power and Light Company
VALUATION AND QUALIFYING ACCOUNTS
For the years ended December 31, 2004-20062006 - 2008 $ in thousands | | | | | | | | | | Description | | Balance at
Beginning
of Period | | Additions | | Deductions
(1) | | Balance at
End of Period | | | | | | | | | | | | 2006: | | | | | | | | | | Deducted from accounts receivable— | | | | | | | | | | | | | | | | | | | | Provision for uncollectible accounts | | $ | 1,044 | | $ | 4,835 | | $ | 4,449 | | $ | 1,430 | | | | | | | | | | | | | | | | | | | | | | 2005: | | | | | | | | | | Deducted from accounts receivable— | | | | | | | | | | | | | | | | | | | | Provision for uncollectible accounts | | $ | 1,085 | | $ | 3,582 | | $ | 3,623 | | $ | 1,044 | | | | | | | | | | | | | | | | | | | | | | 2004: | | | | | | | | | | Deducted from accounts receivable— | | | | | | | | | | | | | | | | | | | | Provision for uncollectible accounts | | $ | 3,617 | | $ | 885 | | $ | 3,417 | | $ | 1,085 | | | | | | | | | | | |
$ in thousands | | | | | | | | | | Description | | Balance at
Beginning
of Period | | Additions | | Deductions
(1) | | Balance at
End of Period | | | | | | | | | | | | 2008: | | | | | | | | | | Deducted from accounts receivable — | | | | | | | | | | Provision for uncollectible accounts | | $ | 1,518 | | $ | 4,277 | | $ | 4,711 | | $ | 1,084 | | | | | | | | | | | | Deducted from deferred tax assets — | | | | | | | | | | Allowance for deferred tax assets | | $ | 12,429 | | $ | 1,482 | | $ | 3,226 | | $ | 10,685 | | | | | | | | | | | | 2007: | | | | | | | | | | Deducted from accounts receivable — | | | | | | | | | | Provision for uncollectible accounts | | $ | 1,430 | | $ | 5,678 | | $ | 5,590 | | $ | 1,518 | | | | | | | | | | | | Deducted from deferred tax assets — | | | | | | | | | | Allowance for deferred tax assets | | $ | 10,132 | | $ | 2,676 | | $ | 379 | | $ | 12,429 | | | | | | | | | | | | 2006: | | | | | | | | | | Deducted from accounts receivable — | | | | | | | | | | Provision for uncollectible accounts | | $ | 1,044 | | $ | 4,835 | | $ | 4,449 | | $ | 1,430 | | | | | | | | | | | | Deducted from deferred tax assets — | | | | | | | | | | Allowance for deferred tax assets | | $ | 6,776 | | $ | 3,356 | | $ | — | | $ | 10,132 | |
(1) Amounts written off, net of recoveries of accounts previously written off. 119
The Dayton Power and Light Company VALUATION AND QUALIFYING ACCOUNTS For the years ended December 31, 2006 - 2008 $ in thousands | | | | | | | | | | Description | | Balance at
Beginning
of Period | | Additions | | Deductions
(1) | | Balance at
End of Period | | | | | | | | | | | | 2008: | | | | | | | | | | Deducted from accounts receivable — | | | | | | | | | | Provision for uncollectible accounts | | $ | 1,518 | | $ | 4,277 | | $ | 4,711 | | $ | 1,084 | | | | | | | | | | | | Deducted from deferred tax assets — | | | | | | | | | | Allowance for deferred tax assets | | $ | 348 | | $ | — | | $ | 348 | | $ | — | | | | | | | | | | | | 2007: | | | | | | | | | | Deducted from accounts receivable — | | | | | | | | | | Provision for uncollectible accounts | | $ | 1,430 | | $ | 5,678 | | $ | 5,590 | | $ | 1,518 | | | | | | | | | | | | Deducted from deferred tax assets — | | | | | | | | | | Allowance for deferred tax assets | | $ | 277 | | $ | 71 | | $ | — | | $ | 348 | | | | | | | | | | | | 2006: | | | | | | | | | | Deducted from accounts receivable — | | | | | | | | | | Provision for uncollectible accounts | | $ | 1,044 | | $ | 4,835 | | $ | 4,449 | | $ | 1,430 | | | | | | | | | | | | Deducted from deferred tax assets — | | | | | | | | | | Allowance for deferred tax assets | | $ | — | | $ | 277 | | $ | — | | $ | 277 | |
(1) Amounts written off, net of recoveries of accounts previously written off. 134
|