
Use these links to rapidly review the document
TABLE OF CONTENTS
UNITED STATES
SECURITIES AND EXCHANGE COMMISSION
Washington, D.C. 20549
FORM 10-K
ANNUAL REPORT PURSUANT TO SECTION 13 OR 15(d) OF THE
SECURITIES EXCHANGE ACT OF 1934
For the Fiscal Year Ended December 31, 20062009
Commission File Number 1-4949
CUMMINS INC.
|
| |
Indiana | 35-0257090 |
500 Jackson Street
Box 3005
Columbus, Indiana 47202-3005
(Address of principal executive offices)
Telephone (812) 377-5000
Securities registered pursuant to Section 12(b) of the Act:
| Title of each class | Name of each exchange on which registered | |||
|---|---|---|---|---|
Common Stock, $2.50 par value | New York Stock Exchange |
Securities registered pursuant to Section 12(g) of the Act:None.
Indicate by check mark if the registrant is a well-known seasoned issuer, as defined in Rule 405 of the Securities Act. Yes ýx No o
Indicate by check mark if the registrant is not required to file reports pursuant to Section 13 or Section 15(d) of the Act. Yes o No ýx
Indicate by check mark whether the registrant: (1) has filed all reports required to be filed by Section 13 or 15(d) of the Securities Exchange Act of 1934 during the preceding 12 months (or for such shorter period that the registrant was required to file such reports), and (2) has been subject to such filing requirements for the past 90 days. Yes ýx No o
Indicate by check mark whether the registrant has submitted electronically and posted on its corporate Web site, if any, every Interactive Data File required to be submitted and posted pursuant to Rule 405 of Regulation S-T (§ 229.405 of this chapter) during the preceeding 12 months (or for such shorter period that the registrant was required to submit and post such files). Yes ý No o
Indicate by check mark if disclosure of delinquent filers pursuant to Item 405 of Regulation S-K is not contained herein, and will not be contained, to the best of registrant’sregistrant's knowledge, in definitive proxy or information statements incorporated by reference in Part III of this Form 10-K or any amendment to this Form 10-K. o
Indicate by check mark whether the registrant is a large accelerated filer, an accelerated filer, a non-accelerated filer, or a non-accelerated filer.smaller reporting company. See the definition of “accelerated"large accelerated filer," "accelerated filer" and large accelerated filer”"smaller reporting company" in Rule 12b-2 of the Exchange Act. (Check one):
| Large accelerated filer ý | Accelerated filer o | Non-accelerated filer o (Do not check if a smaller reporting company) | Smaller reporting company o |
Indicate by check mark whether the registrant is a shell company (as defined in Rule 12b-2 of the Exchange Act). Yes o No ýx
The aggregate market value of the voting stock held by non-affiliates was approximately $6.4$7 billion at July 2, 2006.June 28, 2009. This value includes all shares of the registrant's common stock, except for treasury shares.
As of February 4, 2007,January 29, 2010, there were 52,099,611201,359,036 shares outstanding of $2.50 par value common stock.
Documents Incorporated by Reference
Portions of the registrant’sregistrant's definitive Proxy Statement for its 2010 annual meeting of shareholders, which will be filed with the Securities and Exchange Commission pursuant to Regulationon Schedule 14A arewithin 120 days after the end of 2009, will be incorporated by reference in Part III of this Form 10-K.10-K to the extent indicated therein upon such filing.
TABLE OF CONTENTS Part Item Page 3 3 3 4 6 7 8 10 11 12 13 13 13 13 13 14 14 15 16 18 19 20 24 24 24 24 25 27 Management’s Discussion and Analysis of Financial Condition and Results of Operations 28 62 64 Changes in and Disagreements with Accountants on Accounting and Financial Disclosure 64 64 65 66 67 Security Ownership of Certain Beneficial Owners and Management and Related Stockholder Matters 67 67 67 67 67 126 127 Cautionary Statements Regarding Forward-Looking Information I Business Overview Operating Segments Engine Segment Power Generation Segment Components Segment Distribution Segment Joint Ventures, Alliances and Non-Wholly-Owned Subsidiaries Supply Patents and Trademarks Seasonality Largest Customers Backlog Research and Development Expense Environmental Compliance Employees Available Information Executive Officers of the Registrant Risk Factors Unresolved Staff Comments Properties Legal Proceedings Submission of Matters to a Vote of Security Holders II Market for Registrant's Common Equity, Related Stockholder Matters and Issuer Purchases of Equity Securities Selected Financial Data Management's Discussion and Analysis of Financial Condition and Results of Operations Quantitative and Qualitative Disclosures About Market Risk Financial Statements and Supplementary Data Changes in and Disagreements with Accountants on Accounting and Financial Disclosure Controls and Procedures Other Information III Directors, Executive Officers and Corporate Governance Executive Compensation Security Ownership of Certain Beneficial Owners and Management and Related Stockholder Matters Certain Relationships, Related Transactions and Director Independence Principal Accountant Fees and Services IV Exhibits and Financial Statement Schedules Index to Financial Statements Exhibit Index Signatures Cummins Inc. Certain parts of this annual report, particularly "Management's Discussion and Analysis of Financial Condition and Results of Operations", contain forward-looking statements intended to qualify for the safe harbors from liability established by the Private Securities Litigation Reform Act of 1995. Forward-looking statements include those that are based on current expectations, estimates and projections about the industries in which we operate and management's beliefs and assumptions. Forward-looking statements are generally accompanied by words such as "anticipates," "expects," "forecasts," "intends," "plans," "believes," "seeks," "estimates," "could," "should," or words of similar meaning. These statements are not guarantees of future performance and involve certain risks, uncertainties and assumptions, which we refer to as "future factors," which are difficult to predict. Therefore, actual outcomes and results may differ materially from what is expressed or forecasted in such forward-looking statements. Some future factors that could cause our results to differ materially from the results discussed in such forward-looking statements are discussed below and shareholders, potential investors and other readers are urged to consider these future factors carefully in evaluating forward-looking statements. Readers are cautioned not to place undue reliance on forward-looking statements, which speak only as of the date hereof. We undertake no obligation to update publicly any forward-looking statements, whether as a result of new information, future events or otherwise. Future factors that could affect the outcome of forward-looking statements include the following: In addition, such statements could be affected by general industry and market conditions and growth rates, general domestic and international economic conditions, including the price of crude oil (diesel fuel), interest rate and currency exchange rate fluctuations, commodity prices and other future factors. Cummins Inc. was founded in 1919 as a corporation in Columbus, Indiana, as one of the first diesel engine manufacturers. We are a global power leader that designs, manufactures, distributes and services diesel and natural gas engines, electric power generation systems and engine-related component products, including filtration, We Engine segment Percent of consolidated net sales(1) Percent of consolidated EBIT(1)(2) Our Engine segment manufactures and markets a broad range of diesel and natural Our Engine segment is provide diesel or natural gas engines for The principal customers of our In the markets served by our Engine segment, we compete with independent engine manufacturers as well as OEMs who manufacture engines for their own products. Our primary competitors in North America are Percent of consolidated net sales(1) Percent of consolidated EBIT(1)(2) Our Power Generation segment developing countries. In addition, utilities, independent power producers and large power customers for use as prime or peaking For revised sales data by product category for 2008 and 2007 see "Management's Discussion and Analysis of Financial Condition and Results of Operations." This Our customer base for power generation products is highly diversified, with customer groups varying based on their power needs. This operating segment competes with a variety of engine manufacturers and generator set assemblers across the world. Components segment sales and EBIT as a percentage of consolidated results were: Percent of consolidated net sales(1) Percent of consolidated EBIT(1)(2) Our Components segment Our Components segment Customers of our Components segment generally include our Engine and Distribution segments, truck manufacturers and other OEMs, Our Components segment competes with other manufacturers of filtration, Percent of consolidated net sales(1) Percent of consolidated EBIT(1)(2) Our Distribution segment consists of The Distribution segment is organized into four primary geographic regions: EMEA and Asia Pacific are composed of seven smaller regional distributor organizations (Greater Europe, Africa, the Middle East, India, China, Northeast/Southeast Asia and the South Pacific) which allow us to better manage these vast geographic territories. Our largest market, North and Central America, is mostly comprised of a network of partially-owned distributors. Internationally, our network consists of independent, partially-owned and wholly-owned distributors. Through this network, In addition to managing our investments in wholly-owned and partially-owned distributors, our Distribution segment is responsible for managing the performance and capabilities of our independent distributors. Our distributors collectively serve a highly diverse customer base with approximately Financial information about our distributors accounted for under the equity method are incorporated by reference from Note 1, "SUMMARY OF SIGNIFICANT ACCOUNTING POLICIES," and Note 2, "INVESTMENTS IN EQUITY INVESTEES," to ourConsolidated Financial Statements. During 2008, we purchased a majority interest in three previously independent North American distributors in order to increase our ownership interests in key portions of the distribution channel. The acquisitions were accounted for under the purchase method of accounting and resulted in an aggregate purchase price of $81 million which we funded with $54 million of borrowings and $27 million of cash. The assets of the acquired businesses were primarily accounts receivable, inventory and fixed assets. There was less than $1 million of goodwill generated from these transactions. Our distributors We have entered into a number of joint venture agreements and alliances with business partners around the world. Our joint ventures are either distribution or manufacturing entities. We also own a controlling interest in a non-wholly-owned manufacturing subsidiary. In the event of a change of control of either party to these joint ventures and other strategic alliances, certain consequences may result including automatic termination and liquidation of the venture, exercise of "put" or "call" rights of ownership by the non-acquired partner, termination or transfer of technology license rights to the non-acquired partner and increases in component transfer prices to the acquired partner. We will continue to evaluate joint venture and partnership opportunities in order to penetrate new markets, develop new products and generate manufacturing and operational efficiencies. Financial information about our Our equity income from these investees was as follows: Distribution Entities North American distributors Komatsu Cummins Chile, Ltda. All other distributors Manufacturing Entities Chongqing Cummins Engine Company, Ltd. Dongfeng Cummins Engine Company, Ltd. Valvoline Cummins, Ltd. Shanghai Fleetguard Filter Co., Ltd. Tata Cummins Ltd. Cummins MerCruiser Diesel Marine, LLC All other manufacturers Cummins share of net income(1) Distribution Entities Our licensing agreements with independent and partially-owned distributors generally have a three-year term and are restricted to specified territories. Our distributors develop and maintain a network of dealers with which we have no direct relationship. The distributors are permitted to sell other, noncompetitive products only with our consent. We license all of our distributors to use our name and logo in connection with the sale and service of our products, with no right to assign or sublicense the marks, except to authorized dealers, without our consent. Products are sold to the distributors at standard domestic or international distributor net prices, as applicable. Net prices are wholesale prices we establish to permit our distributors an adequate margin on their sales. Subject to local laws, we can refuse to renew these agreements at will and we may terminate them upon 90-day notice for inadequate sales, change in principal ownership and certain other reasons. Distributors also have the right to terminate the agreements upon 60-day notice without cause, or 30-day notice for cause. Upon termination or failure to renew, we Manufacturing Entities Manufacturing joint ventures are China. in automotive and industrial applications. Products include transmission fluids, hydraulic lubricants, automotive filters, cooling system products, greases and specialty products. Non-Wholly-Owned Manufacturing Subsidiary We have a controlling interest in Cummins We source our materials and manufactured components from leading suppliers both domestically and internationally. We machine and assemble some of the We own or control a significant number of patents and trademarks relating to the products we manufacture. These patents and trademarks have been granted and registered over a period of years. Although these patents and trademarks are generally considered beneficial to our operations, we do not believe any patent, group of patents, or trademark (other than our leading brand house trademarks) is considered significant to our business. While individual product lines may experience modest seasonal declines in production, there is no material effect on the demand for the majority of our products on a quarterly basis with the exception that our Power Generation segment normally experiences seasonal declines in the first quarter due to general declines in construction spending during this period and We have As a result of the current recessed economic conditions many of our order lead times have decreased significantly from lead times in prior years. While we have Our research and development program is focused on product improvements, innovations and cost reductions for our customers. We expense research and development expenditures, net of contract reimbursements, when incurred. Research and development expenses, net of contract reimbursements, were $362 million in 2009, $422 million in 2008 and $318 million in 2007. Contract reimbursements were $92 million in 2009, $61 million in 2008 and $52 million in 2007. For 2009 and 2008, approximately 42 percent, or $151 million, and approximately 27 percent, or $116 million, respectively, were directly related to compliance with 2010 EPA emissions standards. For 2007, 17 percent, or $55 million, was related to compliance with 2010 EPA emissions standards. In 2009, we reduced research, development and engineering expenses but continued to invest in critical technologies and products for 2010 and beyond. We will continue to Sustainability In 2009, we continued to be a leader in Product Environmental Compliance Our engines are subject to extensive statutory and regulatory requirements that directly or indirectly impose standards governing emissions and noise. Our products comply with all current emissions standards that the EPA Engine Certifications Federal and California regulations require manufacturers to report failures of emissions-related components to the EPA and CARB when the failure rate reaches a specified level. At higher failure rates, a product recall may be required. In Other Environmental Statutes and Regulations expected to be material in 2010. Except as follows, we believe we are in compliance in all material respects with laws and regulations applicable to our plants and operations. In the In addition, we have four other sites where we are working with governmental authorities on remediation projects. The costs for these remediation projects are not expected to be material. As of December 31, 2009, we employed approximately 34,900 persons worldwide. Approximately 13,200 of our employees worldwide are represented by various unions under collective bargaining agreements that expire between 2010 and 2014. For a discussion of the effects of our 2008 and 2009 restructuring actions on employment, see "Management's Discussion and Analysis of Financial Condition and Results of Operations" and Note 3, "RESTRUCTURING AND OTHER CHARGES," to ourConsolidated Financial Statements in this Form 10-K. We file annual, quarterly and current reports, proxy statements and other information electronically with the Securities and Exchange Commission (the "SEC"). You may read and copy any document we file with the SEC at the SEC's public reference room at 100 F Street, N.E., Washington, DC 20549. Please call the SEC at 1-800-SEC-0330 for information on the public reference room. The SEC maintains an internet site that contains annual, quarterly and current reports, proxy and information statements and other information that issuers (including Cummins) file electronically with the SEC. The SEC's internet site is www.sec.gov. Our internet site is www.cummins.com. You can access our Investors and Media webpage through our internet site, by clicking on the heading "Investors and Media." We make available, free of charge, on or through our Investors and Media webpage, our proxy statements, annual reports on Form 10-K, quarterly reports on Form 10-Q, current reports on Form 8-K and any amendments to those reports filed or furnished pursuant to the Securities Exchange Act of 1934 or the Securities Act of 1933, as amended, as soon as reasonably practicable after such material is electronically filed with, or furnished to, the SEC. We also have a Corporate Governance webpage. You can access our Governance Documents webpage through our internet site, www.cummins.com, by clicking on the heading "Investors and Media," followed by the "Investor Relations" link and then the topic heading of "Governance Documents" within the "Corporate Governance" heading. Code of Conduct, Committee Charters and other governance documents are included at this site. Cummins Code of Conduct applies to all employees, regardless of their position or the country in which they work. It also applies to the employees of any entity owned or controlled by us. We will post any amendments to the Code of Conduct and any waivers that are required to be disclosed by the rules of either the SEC or the New York Stock Exchange LLC (NYSE), on our internet site. The information on Cummins internet site is not incorporated by reference into this report. In accordance with NYSE Rules, on May 21, 2009, we filed the annual certification by our CEO that, as of the date of the certification, he was unaware of any violation by the company of the NYSE's corporate governance listing standards. Following are the names and ages of the executive officers of Cummins Inc., their positions with us as of January 31, 2010, and summaries of their backgrounds and business experience: Our Chairman and Chief Executive Officer is elected annually by our Board of Directors and holds office until the first meeting of the Board of Directors following the annual meeting of the shareholders. Other officers are appointed by the Chairman and Chief Executive Officer, are ratified by our Board of Directors and hold office for such period as the Chairman and Chief Executive Officer or the Board of Directors may prescribe. Item 1A. Risk Factors Set forth below and elsewhere in this Annual Report on Form 10-K are some of the principal risks and uncertainties that could cause our actual business results to differ materially from any forward-looking statements contained in this Although the global economy showed mild signs of recovery in late 2009, a further downturn could materially adversely affect our results of operations, financial condition and cash flows again Although we began to see some signs of improvement in late 2009, the global economy remains fragile. The global economic recession that began in late 2008 and continued through 2009 had a significant adverse impact on our business, customers and suppliers. If the global economy were to take another significant downturn, depending upon the length, duration and severity of such a so-called "double-dip" recession, our results of operations, financial condition and cash flow would almost certainly be materially adversely affected again. Specifically, our revenues would likely decrease, we may be forced to consider further restructuring actions, we may need to increase our allowance for doubtful accounts, our days sales outstanding may increase and we could experience impairments to assets of certain of our businesses. The discovery of any significant problems with our new EPA compliant engine platforms in North America could materially adversely impact our results of operations, financial condition and cash flows. We have received EPA and CARB certification for our heavy-duty ISX15 and mid-range ISB6.7, ISC8.3 and ISL9 engines which went into commercial production in early 2010. Certification of these engines confirms that our 2010 engine line-up for on-highway applications meets the near zero emissions levels required for all engines manufactured in 2010. The launch of these new platforms, which includes the introduction of SCR technology, will impact a number of our operating segments and is We may need to write off significant investments in our new light-duty diesel engine platforms if customer commitments further deteriorate. We began development of a new light-duty diesel engine platform in July 2006 to be used in a variety of on- and off-highway applications. Since that time, and as of December 31, 2009, we have capitalized investments of approximately $216 million. Market uncertainty due to the global recession has resulted in some customers delaying or cancelling their vehicle programs, while others remain on schedule. If customer expectations or volume projections further deteriorate from our current levels and we do not identify new customers, we may need to recognize an impairment charge and write the asset down to net realizable value. We are vulnerable to supply shortages from single-sourced suppliers. For 2009, we single sourced approximately 70 to 80 percent of the Government regulation could adversely affect our business. Our engines are subject to extensive statutory and regulatory requirements governing emissions and noise, including standards imposed by the EPA, the European Union, state regulatory agencies, such as the Greenhouse gas legislation or regulation could adversely affect our business. There is growing consensus that some form of U.S. federal legislation and/or regulation may be forthcoming with respect to regulating manufacturers' greenhouse gas emissions. Any mandate or standard. We are Our products are exposed to variability in material and commodity costs. Our businesses establish prices with our customers in accordance with contractual time frames; however, the We are subject to We We also face risks arising from the imposition of exchange controls and currency devaluations. Exchange controls may limit our ability to convert foreign currencies into U.S. dollars or to remit dividends and other payments by our foreign subsidiaries or businesses located in or conducted within a country imposing controls. Currency devaluations result in a diminished value of funds denominated in the currency of the country instituting the devaluation. Further deterioration in the North American and European automotive industries could adversely impact our business. industry conditions have also adversely affected our supply base. Lower production levels for some of Significant declines in We sponsor both funded and unfunded domestic and foreign defined benefit pension and other retirement plans. Our pension expense and the required contributions to our pension plans are directly affected by the value of plan assets, the projected and actual rates of return on plan assets and the actuarial assumptions we use to measure our defined benefit pension plan obligations, including the discount rate at which future projected and accumulated pension obligations are discounted to a present value. We could experience increased pension expense due to a combination of factors, including the decreased investment performance of pension plan assets, decreases in the discount rate and changes in our assumptions relating to the expected return on plan assets. Significant declines in future financial and stock market conditions could cause material losses in our pension plan assets, which could result in increased pension expense in future years and adverse changes to our financial condition. We may be legally required to make contributions to our U.S. pension plans in the future, and these contributions could be material. In addition, if local legal authorities increase the minimum funding requirements for our pension plans outside the U.S., we could be required to contribute more funds. As we continue to Our business We face an inherent business risk of exposure to product liability claims in the event that our Our products are subject to recall for performance-related issues. Our products may be subject to recall for performance-related or safety-related issues. Product recalls subject us to harm to our reputation, loss of current and future customers, reduced revenue and product recall costs. Product recall costs are incurred when we decide, either voluntarily or involuntarily, to recall a product through a formal campaign to solicit the return of specific products due to a known or suspected performance issue. Our truck manufacturers and OEM customers may not continue to outsource their engine supply needs. Several of our engine customers, including PACCAR Inc., Volvo AB and Chrysler, are truck manufacturers or OEMs that manufacture engines for some of their own products. Despite their engine manufacturing abilities, these customers have historically chosen to outsource certain types of engine production to us due to the quality of our engine products, our emissions capability, our systems integration, their customers' preferences, their desire for cost reductions, their desire for eliminating production risks and their desire to maintain company focus. However, there can be no assurance that these customers will continue to outsource, or outsource as much of, their engine production in the future. Increased levels of OEM vertical integration could result from a number of factors, such as shifts in our customers' business strategies, acquisition by a customer of another engine manufacturer, the inability of third-party suppliers to meet product specifications and the emergence of low-cost production opportunities in foreign countries. Any significant reduction in the level of engine production outsourcing from our truck manufacturer or OEM customers could have a material adverse effect upon us. Our operations are subject to extensive environmental laws and Our plants and operations are subject to increasingly stringent environmental laws and regulations in all of the countries in which we operate, including laws and regulations governing air emissions, We Our net income includes significant equity, royalty and interest income from investees that we do not directly control. For 2009, we recognized $214 million of equity, royalty and interest income from investees. The majority of our equity, royalty and interest income from investees comes from our 13 unconsolidated North American distributors, and from two of our joint ventures in China, Dongfeng Cummins Engine Company, Ltd. ("DCEC") and Chongqing Cummins Engine Company, Ltd. ("CCEC"). Our equity ownership interests in our unconsolidated North American distributors generally range from 30 percent to We face reputational and legal risk from affiliations with foreign joint venture partners. Several of our joint venture partners are domiciled in areas of the Unanticipated changes in our tax provisions, the adoption of new U.S. tax legislation or exposure to additional income tax liabilities could adversely affect our profitability. We are subject to ongoing tax audits in various U.S. and foreign jurisdictions. Tax authorities may disagree with certain tax reporting positions taken by us and, as a result, assess additional taxes against us. We regularly assess the likely outcomes of these audits in order to determine the appropriateness of our tax provision. However, there can be no assurance that we will accurately predict the outcomes of these audits, and the President Obama's administration has recently announced proposals for new U.S. tax legislation that, We may As of December 31, 2009, we employed approximately 34,900 persons worldwide. Approximately 13,200 of our employees worldwide are represented by various unions under collective bargaining agreements that expire between 2010 and 2014. While we have no reason to believe that we will be impacted by work stoppages and other labor matters, there can be no assurance that future issues with our We face significant competition in the markets we The markets in which we operate are highly competitive. We compete worldwide with a number of other manufacturers and distributors that produce and sell similar products. Our products primarily compete on the basis of price, performance, fuel economy, speed of delivery, quality and customer support. There can be no assurance that our products will be able to compete successfully with the products of these other companies. discussion of the competitive environment in which each of our segments operates, see Item 1B. Unresolved Staff Comments None. Our In addition, engines and engine components are manufactured by joint ventures or independent licensees at manufacturing plants in the U.K., The principal distribution facilities used by our Distribution segment are located in the following locations: Our Corporate Headquarters are located in Columbus, Indiana. Additional marketing and operational headquarters are in the following locations: We are In June 2008, four of our sites in Southern Indiana, including our Technical Center, experienced extensive flood damage. We have submitted a claim for $237 million to our insurance carriers, which includes a claim for business interruption. Our insurance carriers have disputed certain aspects of our claim and each party has filed suit against the other. Although we believe that we should be insured against the full amount of such claim, there can be no assurance that we will Item 4. Submission of Matters to a Vote of Security Holders There were no matters submitted to a vote of our PART II Item 5. Market for (a) Our common stock, par value $2.50 per share, is listed on the NYSE under the symbol (b) Use of proceeds—not applicable. (c) The following information is provided pursuant to Item 703 of Regulation S-K: ISSUER PURCHASES OF EQUITY SECURITIES Period (a) Total (b) Average (c) Total Number of (d) Maximum October 2 - October 29, 2006 — $ — — 1,879,600 October 30 - November 26, 2006 214,835 101.54 214,600 1,665,000 November 27 - December 31, 2006 165,239 119.86 165,000 1,500,000 Total 380,074 109.50 379,600 September 28 - November 1, 2009 November 2 - November 29, 2009 November 30 - December 31, 2009 Total In December 2007, our Board of Directors authorized us During the fourth quarter of The following Performance Graph and related information shall not be deemed The following graph compares the cumulative total shareholder return on ASSUMES $100 INVESTED ON JAN. 01, 2005 Item 6. Selected Financial Data The selected financial information presented below for each of the five For the years ended December 31, 2006 2005 2004 2003(1) 2002(2) Millions, except per share Consolidated Statements of Earnings Data Net sales $ 11,362 $ 9,918 $ 8,438 $ 6,296 $ 5,853 Gross margin 2,595 2,186 1,680 1,123 1,045 Investee equity, royalty and other income 140 131 120 74 29 Interest expense 96 109 111 90 61 Dividends on preferred securities of subsidiary trust — — — 11 21 Earnings before cumulative effect of change in accounting principles 715 550 350 54 79 Net earnings 715 550 350 50 82 Net earnings per share before cumulative effect of change in accounting principles: Basic $ 15.02 $ 12.43 $ 8.30 $ 1.37 $ 2.06 Diluted 14.21 11.01 7.39 1.36 2.06 Net earnings per share: Basic $ 15.02 $ 12.43 $ 8.30 $ 1.28 $ 2.13 Diluted 14.21 11.01 7.39 1.27 2.13 Dividends declared per share 1.32 1.20 1.20 1.20 1.20 Consolidated Balance Sheet Data Cash and cash equivalents $ 840 $ 779 $ 611 $ 108 $ 224 Total assets 7,465 6,885 6,510 5,126 4,837 Long-term debt 647 1,213 1,299 1,380 999 Mandatorily redeemable preferred securities — — — — 291 Shareholders’ equity 2,802 1,864 1,401 949 841 For the years ended December 31, Net sales U.S. percentage of sales Non-U.S. percentage of sales Gross margin Research, development and engineering expenses Equity, royalty and interest income from investees Interest expense Net income(1) Net income attributable to Cummins Inc.(1)(2) Net earnings per share attributable to Cummins Inc.(3) Basic Diluted Cash dividends declared per share Cash flows from operations Capital expenditures At December 31, Cash and cash equivalents Total assets Long-term debt Total equity(4) Item 7. The following Other Commercial Commitments EXECUTIVE SUMMARY AND FINANCIAL HIGHLIGHTS We are a global power leader that designs, manufactures, distributes and services diesel and natural gas engines, electric power generation systems and engine-related component products, including filtration, Our reportable operating segments consist of the following: Engine, Power Generation, Components and Distribution. This reporting structure is organized according to the products and markets each segment and Our financial performance depends, in large part, on varying conditions in the markets we serve, particularly the on-highway, construction and general industrial markets. Demand in these markets tends to fluctuate in response to overall economic conditions and is particularly sensitive to changes in interest rate generally result in The global economic downturn in 2009 extensively challenged most of our businesses and the markets in which While we expect overall demand for most of our products to be weak in the first half of 2010, with some improvements in demand in emerging markets, the actions that we initiated in late 2008 and throughout 2009 will continue to enable us to navigate through the challenging economic environment and will position us to respond to market conditions when and where they improve. Our short term priorities remain: Table of Net Net sales Cost of sales Gross margin Operating expenses and income Selling, general and administrative expenses Research, development and engineering expenses Equity, royalty and interest income from investees Restructuring and other charges Other operating (expense) income, net Operating income Interest income Interest expense Other (expense) income, net Income before income taxes Income tax expense Net income Less: Net income attributable to noncontrolling interests Net income attributable to Cummins Inc. Diluted earnings per share attributable to Cummins Inc. Percent of sales Gross margin Selling, general and administrative expenses Research, development and engineering expenses 2009 vs. 2008 Net Sales Net sales decreased in all segments A more detailed discussion of sales by segment is presented in the "OPERATING SEGMENT RESULTS" section. Gross Margin Years ended December 31, 2006 2005 2004 Millions, except earnings per share Consolidated Results Net sales $ 11,362 $ 9,918 $ 8,438 Gross margin 2,595 2,186 1,680 Investee equity, royalty and other income 140 131 120 Operating earnings 1,131 894 539 Net earnings 715 550 350 Diluted earnings per share $ 14.21 $ 11.01 $ 7.39 Volume/Mix Price Production costs Warranty expense Material Costs Currency Other Total Selling, general and administrative expenses decreased primarily due to a decrease of $74 million in discretionary spending, in order to conserve cash, and a decrease of $71 million in compensation and related expenses. Compensation and related expenses include salaries, fringe benefits and variable compensation. Salaries and fringe benefits decreased due to severance actions taken throughout 2009. Overall selling, general and administrative expenses as a percentage of sales increased to 11.5 percent in 2009 from 10.1 percent in 2008, primarily due to the Research, Development and Engineering Expenses Research, development and engineering expenses decreased primarily due to a decrease in the number of Equity, Royalty and Interest Income from Investees Equity, royalty and interest income from investees decreased primarily due to the following changes in equity income: Dongfeng Cummins Engine Company, Ltd. (DCEC) Cummins MerCruiser Diesel, LLC (MerCruiser) These decreases were primarily due to lower demand as a result of the Other operating (expense) income was as follows: Flood damage gain (loss)(1) Royalty income Royalty expense Amortization of other intangibles (Loss) gain on sale of fixed assets Other, net Total other operating (expense) income, net Interest Income Years ended December 31, Change 2006 2005 Amount Percent Millions Net sales $ 11,362 $ 9,918 $ 1,444 15 % Cost of sales 8,767 7,732 1,035 13 % Gross margin 2,595 2,186 409 19 % Operating expenses and income Selling and administrative expenses 1,283 1,145 138 12 % Research and engineering expenses 321 278 43 15 % Investee equity, royalty and other income (140 ) (131 ) (9 ) 7 % Other operating expenses, net — — — NM Operating earnings 1,131 894 237 27 % Interest income (47 ) (24 ) (23 ) 96 % Interest expense 96 109 (13 ) 12 % Other (income) expenses, net (1 ) 11 (12 ) NM Earnings before income taxes and minority interests 1,083 798 285 36 % Provision for income taxes 324 216 108 50 % Minority interests in earnings of consolidated subsidiaries 44 32 12 38 % Net earnings $ 715 $ 550 $ 165 30 % Interest Expense Interest expense decreased primarily due to Other (Expense) Income, Net Other (expense) income was as Foreign currency loss(1) Bank charges Change in cash surrender value of corporate owned life insurance(2) Dividend income Other, net Total other (expense) income, net Income Tax Expense Our income Our effective tax rate for We expect our Noncontrolling Interests Noncontrolling interests eliminate the income or loss attributable to non-Cummins ownership interests in our Net Income Attributable to Outlook Near-Term: Many of the Long-Term: While there is uncertainty in the near-term market as a Years ended December 31, Change 2005 2004 Amount Percent Millions Net sales $ 9,918 $ 8,438 $ 1,480 18 % Cost of sales 7,732 6,758 974 14 % Gross margin 2,186 1,680 506 30 % Operating expenses and income Selling and administrative expenses 1,145 1,015 130 13 % Research and engineering expenses 278 241 37 15 % Investee equity, royalty and other income (131 ) (120 ) (11 ) 9 % Other operating expenses, net — 5 (5 ) 100 % Operating earnings 894 539 355 66 % Interest income (24 ) (12 ) (12 ) 100 % Interest expense 109 111 (2 ) 2 % Other expenses, net 11 8 3 38 % Earnings before income taxes and minority 798 432 366 85 % Provision for income taxes 216 56 160 NM Minority interests in earnings of consolidated subsidiaries 32 26 6 23 % Net earnings $ 550 $ 350 $ 200 57 % Net Sales Net sales increased in all segments A detailed discussion of Gross Margin Significant drivers of the change in gross margin were as follows: Price Volume/Mix Production costs Currency Warranty expense Material costs Other Total Gross margin increased by $384 million, and A more detailed discussion of Selling, General and Administrative Expenses Selling, general and administrative expenses increased primarily due to Research, Development and Engineering Expenses Research, development and engineering expenses increased significantly, primarily due to higher spending on development programs for future products including increased headcount, compensation and related expenses. North American Distributors Dongfeng Cummins Engine Company, Ltd. (DCEC) Royalty and interest income Chongqing Cummins Engine Company, Ltd. (CCEC) Shanghai Fleetguard Filter Co., Ltd. Tata Cummins Ltd. (TCL) MerCruiser Results from our North American distributors Other Operating (Expense) Income, Net Other operating (expense) income was Royalty income Gain on sale of fixed assets(1) Flood damage loss Royalty expense Amortization of other intangibles(2) Other, net Total other operating (expense) income, net Interest Income Interest income decreased primarily due to lower average cash balances in 2008 compared to 2007. Interest Expense Interest expense decreased primarily due to declining short-term interest rates and a benefit from our interest rate swap. Other (Expense) Income, Net Other (expense) income was as follows: Change in cash surrender value of corporate owned life insurance(1) Bank charges Foreign currency (losses) gains(2) Dividend income Other, net Total other (expense) income, net Income Tax Expense Our income tax Net Income Attributable to Cummins Inc. and Diluted Earnings Per Share Attributable to Cummins Inc. Net income attributable to Cummins Inc. and diluted earnings per share attributable to Cummins Inc. increased primarily due to higher volumes, improved margins, higher equity income and a lower effective tax rate. These 2009 Restructuring Actions In 2009, we executed restructuring actions in response to a reduction in orders in most of our U.S. and foreign markets due to the continuing deterioration in the global economy. We reduced our global workforce by approximately 1,000 professional employees. In addition, we took numerous employee actions at many of our manufacturing locations, including approximately 3,200 hourly employees, significant downsizing at numerous facilities and complete closure of several facilities and branch distributor locations. Employee termination and severance costs were recorded based on approved plans developed by the businesses and corporate management which specified positions to be eliminated, benefits to be paid under existing severance plans, union contracts or statutory requirements and the expected timetable for We incurred $2 million of restructuring expenses for lease terminations and $5 million of restructuring expenses for asset impairments in response to closures and downsizing noted above. During 2009, we recorded a total pre-tax restructuring charge of $85 million, comprising $90 million of charges related to 2009 actions net of the $3 million favorable change in estimate related to 2008 actions and the $2 million favorable change in estimate related to earlier 2009 actions, in "Restructuring and other charges" in ourConsolidated Statements of Income. These restructuring actions included: Workforce reductions Exit activities Other Changes in estimate Total restructuring charges Curtailment loss Total restructuring and other charges In addition, as a result of the restructuring actions described above, we also recorded a $14 million curtailment loss in our pension and other postretirement plans. See Note 12, "PENSION AND OTHER POSTRETIREMENT BENEFITS," to ourConsolidated Financial Statements for additional detail. At December 31, 2009, of the approximately 4,200 employees affected by this plan, all terminations were substantially complete. If the 2009 restructuring actions are successfully implemented, we expect the annualized savings from the professional actions to be approximately $50 million. Our charge related to the professional actions was approximately $30 million. Approximately 40 percent of the The 2009 Restructuring charges Cash payments for 2009 actions Noncash items Changes in estimates Translation Balance at December 31, 2009 We do not include restructuring and other charges in our operating segment results. The pre-tax impact of allocating restructuring and other charges to the segment results would have been as follows: Engine Power Generation Components Distribution Total restructuring charges 2008 Restructuring Actions We executed restructuring actions primarily in the form of voluntary and involuntary separation programs in the fourth quarter of 2008. These actions were in response to the continued deterioration in our U.S. businesses and most key markets around the world in the second half of 2008, as well as a reduction in orders in most U.S. and global markets for 2009. We reduced our worldwide professional workforce by approximately 650 employees, or 4.5 percent. We offered a voluntary retirement package to certain active professional employees in the U.S. based on a clearly defined set of criteria. We also took voluntary and involuntary actions which included approximately 800 hourly employees, the majority of which received severance benefits. The compensation packages contained salary and continuation of benefits, including health care, life insurance and outplacement services. The voluntary retirement package was accepted by approximately 150 employees. The remaining professional reductions of 500 employees were involuntary. The expenses recorded during the year ended December 31, 2008, included severance costs related to both voluntary and involuntary terminations. During 2008, we incurred a pre-tax charge related to the professional and hourly restructuring initiatives of approximately $37 million. Employee termination and severance costs were recorded based on approved plans developed by the businesses and corporate management which specified positions to be eliminated, benefits to be paid under existing severance plans or statutory requirements and the expected timetable for completion of the At December 31, 2008, of the approximately 1,450 employees affected by this plan, 1,250 had been terminated. All terminations were substantially complete as of December 31, 2009. We expect the 2008 restructuring actions to yield approximately $45 million to $50 million in annual savings from professional actions. Approximately 41 percent of the savings from the restructuring actions will be realized in cost of sales, 44 percent in selling, general and administrative expenses, and 15 percent in research, development and engineering expenses. The table below summarizes the balance of accrued restructuring expenses for 2008 actions, which were included in the balance of "Other accrued expenses" in ourConsolidated Balance Sheets as of December 31, 2009 and 2008: 2008 Restructuring charges Cash payments for 2008 actions Balance at December 31, 2008 2009 Cash payments for 2008 actions Change in estimate Balance at December 31, 2009 We do not include restructuring charges in the segment results. The pre-tax impact of allocating restructuring charges for the year ended December 31, 2008, would have been as follows: Engine Power Generation Components Distribution Total restructuring charges There were no material changes to the estimated savings, or periods under which we expect to recognize the savings, for the 2008 actions. Our reportable operating segments consist of the following: Engine, Power Generation, Components, and Distribution. This reporting structure is organized according to the products and markets each segment We use segment EBIT (defined as earnings before interest expense, taxes and The accounting policies of our operating segments are the same as those applied in basis that is consistent with the manner in which we internally disaggregate financial information to assist in making internal operating decisions. We have allocated certain common costs and expenses, primarily corporate functions, among segments differently than we would for stand-alone financial information prepared in accordance with Engine Power Components Distribution Non-segment Total Millions 2006 Net sales $ 7,511 $ 2,416 $ 2,281 $ 1,385 $ (2,231 ) $ 11,362 Investee equity, royalty and other income 67 12 7 54 — 140 Segment EBIT 733 220 107 144 (25 ) 1,179 2005 Net sales $ 6,657 $ 1,999 $ 2,000 $ 1,191 $ (1,929 ) $ 9,918 Investee equity, royalty and other income 80 9 8 34 — 131 Segment EBIT 582 145 89 107 (16 ) 907 2004 Net sales $ 5,424 $ 1,842 $ 1,783 $ 973 $ (1,584 ) $ 8,438 Investee equity, royalty and other income 80 6 9 25 — 120 Segment EBIT 328 60 84 79 (8 ) 543 Financial Years ended December 31, 2006 2005 2004 Millions Segment EBIT $ 1,179 $ 907 $ 543 Less: Interest expense 96 109 111 Earnings before income taxes and minority interests $ 1,083 $ 798 $ 432 External sales Intersegment sales Total sales Depreciation and amortization Research, development and engineering expenses Equity, royalty and interest income from investees Interest income Segment EBIT Segment EBIT as a percentage of net sales (2.2) percentage points (1.1) percentage points Engine Power Components Distribution Non-segment Millions Increase (decrease) 2004 Net sales $ (76 ) $ (35 ) $ 299 $ 117 $ (305 ) Investee equity, royalty and other income (16 ) (7 ) — 23 — Segment EBIT (11 ) (9 ) — 28 (8 ) Net assets (193 ) (3 ) 108 88 — Years ended December 31, Change 2006 2005 Amount Percent Net sales $ 7,511 $ 6,657 $ 854 13 % Investee equity, royalty and other income 67 80 (13 ) (16 )% Segment EBIT 733 582 151 26 % Segment EBIT as a 9.8 % 8.7 % 1.1 percentage points A summary and discussion of Engine segment net sales by market Years ended December 31, Change 2006 2005 Amount Percent Heavy-duty truck $ 2,498 $ 2,139 $ 359 17 % Medium-duty truck and bus 971 904 67 7 % Light-duty automotive 1,261 1,178 83 7 % Total on-highway 4,730 4,221 509 12 % Industrial 2,063 1,791 272 15 % Stationary power 718 645 73 11 % Total net sales $ 7,511 $ 6,657 $ 854 13 % Heavy-duty truck Medium-duty truck and bus Light-duty automotive and RV Total on-highway Industrial Stationary power Total sales A summary of unit shipments by engine classification (including unit shipments to Power Generation) follows: Years ended Change 2006 2005 Amount Percent Midrange 459,900 419,200 40,700 10 % Heavy-duty 123,400 107,600 15,800 15 % High-horsepower 16,300 14,400 1,900 13 % Total unit shipments 599,600 541,200 58,400 11 % Mid-range Heavy-duty High-horsepower Total unit shipments 2009 vs. 2008 Engine segment sales experienced deterioration across all major markets, versus 2008, as a result of the global economic downturn. The Total on-highway-related sales were 61 percent of total Engine segment sales, compared to 53 percent in 2008. Segment EBIT Engine segment EBIT decreased primarily due to lower gross margin and equity, royalty and interest income from investees which were partially offset by decreased selling, general and administrative expenses and decreased research, development and engineering expenses. Changes in Engine segment EBIT and EBIT as a percentage of sales were as follows: Gross margin Selling, general and administrative expenses Research, development and engineering expenses Equity, royalty and interest income from investees The decrease in gross margin was primarily 2008 vs. 2007 Net Sales Engine segment sales increased compared to 2007. The following are the primary drivers by market. Years ended Change 2005 2004 Amount Percent Net sales $ 6,657 $ 5,424 $ 1,233 23 % Investee equity, royalty and other income 80 80 — — Segment EBIT 582 328 254 77 % Segment EBIT as a percentage of net sales 8.7 % 6.0 % 2.7 percentage points Years ended Change 2005 2004 Amount Percent Heavy-duty truck $ 2,139 $ 1,700 $ 439 26 % Medium-duty truck and bus 904 693 211 30 % Light-duty automotive 1,178 1,129 49 4 % Total on-highway 4,221 3,522 699 20 % Industrial 1,791 1,380 411 30 % Stationary power 645 522 123 24 % Total net sales $ 6,657 $ 5,424 $ 1,233 23 % Years ended Change 2005 2004 Amount Percent Midrange 419,200 368,700 50,500 14 % Heavy-duty 107,600 87,200 20,400 23 % High-horsepower 14,400 12,100 2,300 19 % Total unit shipments 541,200 468,000 73,200 16 % These increases were partially offset by a 50 percent decline in units sold to Table of Total on-highway-related sales were 53 percent of total Engine segment sales in Years ended Change 2006 2005 Amount Percent Net sales $ 2,416 $ 1,999 $ 417 21 % Investee equity, royalty and other income 12 9 3 33 % Segment EBIT 220 145 75 52 % Segment EBIT as a percentage of net sales 9.1 % 7.3 % 1.8 percentage points Years ended Change 2006 2005 Amount Percent Midrange 29,200 21,300 7,900 37 % Heavy-duty 6,800 7,200 (400 ) (6 )% High-horsepower 9,300 8,300 1,000 12 % Total unit shipments 45,300 36,800 8,500 23 % Years ended Change 2005 2004 Amount Percent Net sales $ 1,999 $ 1,842 $ 157 9 % Investee equity, royalty and other income 9 6 3 50 % Segment EBIT 145 60 85 NM Segment EBIT as a percentage of net sales 7.3 % 3.3 % 4.0 percentage points Years ended Change 2005 2004 Amount Percent Midrange 21,300 16,800 4,500 27 % Heavy-duty 7,200 6,700 500 7 % High-horsepower 8,300 7,400 900 12 % Total unit shipments 36,800 30,900 5,900 19 % Years ended Change 2006 2005 Amount Percent Net sales $ 2,281 $ 2,000 $ 281 14 % Investee equity, royalty and other income 7 8 (1 ) (13 )% Segment EBIT 107 89 18 20 % Segment EBIT as a percentage of net sales 4.7 % 4.5 % 0.2 percentage points Gross margin Selling, general and administrative expenses Research, development and engineering expenses The increase in research, development and engineering expenses was the result of increased Years ended Change 2005 2004 Amount Percent Net sales $ 2,000 $ 1,783 $ 217 12 % Investee equity, royalty and other income 8 9 (1 ) (11 )% Segment EBIT 89 84 5 6 % Segment EBIT as a percentage of net sales 4.5 % 4.7 % (0.2) percentage points Years ended Change 2006 2005 Amount Percent Net sales $ 1,385 $ 1,191 $ 194 16 % Investee equity, royalty and other income 54 34 20 59 % Segment EBIT 144 107 37 35 % Segment EBIT as a percentage of net sales 10.4 % 9.0 % 1.4 percentage points Financial data for the Power Generation segment was as follows: External sales Intersegment sales Total sales Depreciation and amortization Research, development and engineering expenses Equity, royalty and interest income from investees Interest income Segment EBIT Segment EBIT as a percentage of net sales (3.8) percentage points (0.2) percentage points In 2009, the Power Generation segment reorganized its reporting structure to include the following businesses: commercial products, alternators, commercial projects, power electronics and consumer. Sales for our Power Generation segment by business (including 2008 and 2007 revised balances) were as follows: Commercial products Alternator Commercial projects Consumer Power electronics Total sales A summary of unit shipments used in power generation equipment by engine classification follows: Mid-range Heavy-duty High-horsepower Total unit shipments 2009 vs. 2008 Net Sales Power Generation segment sales decreased in most businesses, versus 2008, as the result of the global economic downturn. The following are the primary drivers by business. Segment EBIT Power Generation segment EBIT decreased primarily due to a lower gross margin, which was partially offset by decreases in selling, general and administrative and research, development and engineering expenses. Gross margin Selling, general and administrative expenses Research, development and engineering expenses Equity, royalty and interest income from investees The decrease in Net Sales Power Generation segment sales increased compared to 2007 primarily due to the These increases were partially offset by a significant sales decrease in our consumer business, primarily due to the softening U.S. economy. Segment EBIT Power Generation segment EBIT Years ended Change 2005 2004 Amount Percent Net sales $ 1,191 $ 973 $ 218 22 % Investee equity, royalty and other income 34 25 9 36 % Segment EBIT 107 79 28 35 % Segment EBIT as a percentage of net sales 9.0 % 8.1 % 0.9 percentage points Gross margin Selling, general and administrative expenses Research, development and engineering expenses The increase in gross margin was primarily due to significant price realization, increased volume and favorable product mix which were partially offset by increased material costs, including increased engine and commodity prices. The increase in selling, general and administrative expenses was primarily due to higher payroll costs and increases in the number of segment employees. Financial data for the Components segment was as follows: External sales Intersegment sales Total sales Depreciation and amortization Research, development and engineering expenses Equity, royalty and interest income from investees Interest income Segment EBIT Segment EBIT as a percentage of net sales (1.4) percentage points 0.2 percentage points Our Components segment includes the following businesses: filtration, turbochargers, emissions solutions and fuel systems. Sales for our Components segment by business were as follows: Filtration Turbochargers Emissions solutions Fuel systems Total sales 2009 vs. 2008 Net Sales Components segment sales for the year ended 2009 decreased in all businesses versus 2008 as the result of the global economic downturn. The following are the primary drivers by business. Segment EBIT Components segment EBIT decreased versus 2008, primarily due to a lower gross margin which was partially offset by decreased selling, general and administrative and research, development and engineering expenses. Changes in Components segment EBIT and EBIT as a percentage of sales were as follows: Gross margin Selling, general and administrative expenses Research, development and engineering expenses The decrease in gross margin was due to lower volumes for most markets, partially offset by implementation of severance programs. The decrease in selling, general and administrative and research, development and engineering expenses was primarily due to implementation of severance programs, closing certain facilities, decreased discretionary spending and decreased research and development spending. 2008 vs. 2007 Net Sales Components segment sales increased compared to 2007 primarily due to the following drivers. These increases were Segment EBIT Components segment EBIT increased primarily due to higher gross margins general and Gross margin Selling, general and administrative expenses Research, development and engineering expenses The increase in gross margin was primarily due to higher volumes in most of our businesses, manufacturing efficiencies achieved in all of our businesses in 2008 and price realization exceeding increased commodity costs, which was partially offset by Financial data for the Distribution segment was as follows: External sales Intersegment sales Total sales Depreciation and amortization Equity, royalty and interest income from investees Interest income Segment EBIT Segment EBIT as a percentage of net sales Sales for our Distribution segment by region were as follows: Asia Pacific Europe, Middle East and Africa North & Central America South America Total sales 2009 vs. 2008 Net Sales Distribution segment sales for 2009 decreased versus 2008, primarily due to the decline in power generation equipment and engine sales as a result of the global economic downturn and unfavorable foreign currency translation. Excluding the unfavorable currency impact and the net benefit resulting from full-year 2009 consolidated income from distributor acquisitions Segment EBIT Distribution segment EBIT decreased primarily due to lower gross margin, partially offset by decreased selling, general and administrative expenses Gross margin Gross margin, excluding acquisition(1) Selling, general and administrative expenses Equity, royalty and interest income from investees The decrease in gross margin was primarily due to lower sales volumes as a result of the In January 2010, we purchased an additional 50 percent ownership interest in Cummins Western Canada, bringing our total ownership interest to 80 percent. A new owner purchased the other 20 percent interest from the previous owner. The total accounting purchase price of the business is expected to be approximately $105 million to $110 million. Western Canada recorded revenues of $226 million and we recorded equity earnings of $11 million for the year ended December 31, 2009. 2008 vs. 2007 Net Sales Distribution segment sales increased compared to 2007 as a result of strong organic growth in all regions, mainly in Europe, the South Pacific and the Middle East. We had higher sales of $260 million from the acquisition of a majority ownership interest in three previously independent distributors. We had a favorable impact from foreign currency translation. The higher sales were led by increased sales volumes in power generation, parts and engine volumes, followed by service. Segment EBIT Distribution segment EBIT increased primarily due to higher margins which were partially offset by increased selling, general and administrative expenses. Changes in Distribution segment EBIT and EBIT as a percentage of sales were as follows: Gross margin Gross margin, excluding acquisitions(1) Selling, general and administrative expenses Equity, royalty and interest income from investees The increase in gross margin was primarily due to the increase in The table below reconciles the Total segment EBIT Non-segment EBIT(1) Total EBIT Less: Interest expense Income before income taxes Management's Assessment of Liquidity We believe our financial condition and liquidity remain strong despite the We assess our liquidity in terms of Years ended December 31, 2006 2005 2004 United States $ 5,719 50 % $ 4,832 49 % $ 4,363 52 % Asia/Australia 1,794 16 % 1,682 17 % 1,474 17 % Europe/CIS 1,633 14 % 1,406 14 % 1,145 14 % Mexico/Latin America 886 8 % 819 8 % 567 7 % Canada 743 7 % 728 7 % 549 6 % Africa/Middle East 587 5 % 451 5 % 340 4 % Total international 5,643 50 % 5,086 51 % 4,075 48 % Total consolidated net sales $ 11,362 100 % $ 9,918 100 % $ 8,438 100 % financing activities. Cash provided by operations is 2006 2005 2004 Millions Total debt $ 811 $ 1,367 $ 1,626 Less: cash, cash equivalents and marketable securities (935 ) (840 ) (673 ) Net debt $ (124 ) $ 527 $ 953 The maturity schedule of our existing long-term debt does not require significant cash outflows in the While the impact of the continued market volatility cannot be predicted, we believe our liquidity will provide us with the financial flexibility needed to We have considered the impact of ongoing market instability and credit availability in At this time, we are comfortable that the currently unused $1.07 billion credit capacity under our revolving credit facility is available to us. This assertion is based upon the fact that we drew upon our revolving credit facility, throughout the year, with a 2006 Millions Revolving credit facility $ 542 International credit facilities accessible by local entities 84 International credit facilities accessible by corporate treasury 39 Accounts receivable sales program 200 Total available credit capacity $ 865 2006 2005 $ in millions Current assets $ 4,488 $ 3,916 Current liabilities 2,399 2,218 Working capital $ 2,089 $ 1,698 Current ratio 1.87 1.77 Days’ sales in receivables 52 49 Inventory turnover 6.6 7.0 foreign currencies. We manage our worldwide cash requirements considering available funds among the many subsidiaries through which we conduct our business and the cost effectiveness with which those funds can be accessed. The repatriation of cash balances from certain subsidiaries could have adverse tax consequences; however, those balances are generally available without legal restrictions to fund ordinary business operations at the local level. We have and will continue to transfer cash from these subsidiaries to us and to other international subsidiaries when it is cost effective to do so. We fund our working capital with cash from operations and short-term borrowings when necessary. Various assets and liabilities, including short-term debt, can fluctuate significantly from month to month depending on short-term liquidity needs. As a result, working capital is a prime focus of management attention. Cash and cash equivalents Accounts and notes receivable Inventories Other current assets Current assets Accounts and loans payable Current portion of accrued warranty Other accrued expenses Current liabilities Working capital Current ratio Days' sales in receivables Inventory turnover Current assets increased primarily due to an increase in cash and cash equivalents, caused by management's efforts to conserve cash, reduce inventories and limit discretionary spending during the global recession (see Cash Flows below) and an increase in receivables. The increase in receivables was due to higher sales in global engine markets, higher sales in the fourth quarter of 2009 than in the fourth quarter of 2008 as a result of a temporary increase in engine (and related component) demand prior to the 2010 emissions standards change and the significant decrease in sales in the fourth quarter of 2008 as a result of the onset of the economic recession. These increases were partially offset by a decrease in inventories as a result of our efforts to reduce our working capital. Current liabilities decreased primarily due to a decline in other accrued expenses and accounts payable as a result of reduced purchasing volume and controls around discretionary spending. Cash and cash equivalents increased $504 million during the year ended December 2006 2005 2004 Millions Net cash provided by operating activities $ 840 $ 760 $ 614 Net cash used in investing activities (277 ) (212 ) (181 ) Net cash (used in) provided by financing activities (508 ) (372 ) 66 Effect of exchange rate changes on cash 6 (8 ) 4 Net increase in cash and cash equivalents $ 61 $ 168 $ 503 Net income Depreciation Equity in income of investees, net of dividends Pension expense, net of contributions Changes in: Receivables Inventory Accounts payable Accrued expenses Other, net Net cash provided by operating activities Net cash provided by operating activities Pensions The funded status of our pension plans is dependent upon a variety of variables and assumptions including return on invested assets, market interest rates and levels of voluntary contributions to the plans. Net cash provided by operating activities increased for the year ended December 31, 2008, compared to 2007, primarily due to decreased pension funding, increased net income as the result of increased sales and increased equity in earnings net of dividends, which was partially offset by unfavorable working capital fluctuations. The unfavorable working capital fluctuation was primarily due to an increase in inventory, which was primarily to support strong business growth while the decreases in accounts payable and accounts receivable were more reflective of early shutdowns in many of our manufacturing facilities at the close of 2008, as demand softened throughout the fourth quarter. The increase in accrued expenses was primarily due to an increase in warranty expense. Capital expenditures Investments in and advances to equity investees Acquisitions of businesses, net of cash acquired Proceeds from the sale of businesses Investments in marketable securities, net Other, net Net cash used in investing activities 2009 vs. 2008 Net cash used in investing activities decreased for the year ended December 31, 2009, compared to 2008, primarily due to decreased capital expenditures and lower investments in the acquisition of businesses which were partially offset by increased cash paid for investments in marketable securities and lower cash proceeds from the sale of a business. These decreases primarily occurred as a result of management's decision to conserve cash and maintain liquidity during the recession. Capital expenditures decreased as management tightened capital spending substantially across all business by limiting expenditures to critical projects and investments in development of new products. Despite the expected challenges in some of our markets in 2010, our financial position allows us the flexibility to increase capital expenditures for 2010 to approximately $400 million. 2008 vs. 2007 Net cash used in investing activities increased Proceeds from borrowings Payments on borrowings and capital lease obligations Net (payments) borrowings under short-term credit agreements Dividend payments on common stock Proceeds from sale of common stock held by employee benefits trust Repurchases of common stock Other, net Net cash used in financing activities Net cash used in financing activities Our total debt was $704 million as of Net cash used in financing activities Total debt as a Revolving Credit Agreement On June 30, 2008, we entered into a three-year revolving credit agreement with a syndicate of lenders. The credit agreement provides us with a $1.1 billion senior unsecured revolving credit facility, the proceeds of The credit facility matures on June 30, 2011. Amounts payable under our revolving credit facility will rank pro rata with all of our other unsecured, unsubordinated indebtedness. Up to $100 million under our credit facility is available for swingline loans denominated in U.S. dollars. Advances under the The credit agreement includes various covenants, including, among others, maintaining a leverage ratio of no more than 3.0 to 1.0 and In July 2006, the Board of Directors authorized us to acquire up to In December 2007, the Board of Directors authorized the acquisition of up to We announced in February 2009 that we had temporarily suspended our stock repurchase program to conserve cash. In the Quarterly Dividends In July 2008, our Board of First quarter Second quarter Third quarter Fourth quarter Total dividends paid to common Contractual Cash Obligations 2007 2008-2009 2010-2011 After 2011 Total Millions Loans payable $ 37 $ — $ — $ — $ 37 Long-term debt and capital lease obligations(1) 203 261 144 1,564 2,172 Operating leases 39 54 33 23 149 Capital expenditures 103 1 — — 104 Purchase commitments for inventory 483 — — — 483 Other purchase commitments 68 15 5 1 89 Joint venture funding commitments 48 23 — — 71 Pension funding(2) 235 — — — 235 Other postretirement benefits 56 112 109 235 512 Total $ 1,272 $ 466 $ 291 $ 1,823 $ 3,852 Other Commercial Commitments 2007 2008-2009 2010-2011 After 2011 Total Millions Standby letters of credit under revolving credit agreement $ 102 $ 6 $ — $ — $ 108 International and other domestic letters of credit 30 5 — — 35 Performance and excise bonds 23 11 2 — 36 Other guarantees 3 2 — 2 7 Total $ 158 $ 24 $ 2 $ 2 $ 186 A number of our contractual obligations and financing agreements, such as our revolving credit facility and our equipment sale-leaseback agreements have restrictive covenants and/or pricing modifications that may be triggered in the event of downward revisions to our corporate credit rating. There were no downgrades of our credit ratings in 2009 that have On March 10, 2008, Standard & Poor's (S&P) upgraded our senior unsecured debt ratings from "BBB-" to "BBB" and revised our outlook to stable citing our improved operating performance over the past several years, including during the expected emissions-related downturn in heavy-duty truck demand in 2007, combined with significant on- and off-balance sheet debt reduction, and increased business diversification. On June 17, 2008, Fitch upgraded our senior unsecured debt ratings from "BBB" to "BBB+" citing our recent market share gains and improving credit profile, including improvement in our geographic and business diversification. In the second quarter of 2009, Moody's Investor Service, Inc. and Fitch reaffirmed our credit ratings. Credit ratings are not recommendations to buy and are subject to change, and each rating should be evaluated independently of any other rating. In addition, we undertake no obligation to update disclosures concerning our credit ratings, whether as a result of new information, future events or otherwise. Our Senior Long- Moody's Investors Service, Inc. Stable Stable Loans payable Long-term debt and capital lease obligations(1) Operating leases Capital expenditures Purchase commitments for inventory Other purchase commitments Pension funding(2) Other postretirement benefits Total The contractual obligations reported above exclude our unrecognized tax benefits of $56 million, all of which is non-current, as of December 31, 2009. We are not able to reasonably estimate the period in which cash outflows relating to uncertain tax contingencies could occur. See Note 4, "INCOME TAXES," to theConsolidated Financial Statements for further details. Standby letters of credit under revolving credit agreement International and other domestic letters of credit Performance and excise bonds Guarantees and other commitments Total Sale of Accounts Receivable In In accordance with the provisions of various joint venture agreements, we may purchase Part Item Page 3 1 4 4 4 4 5 6 8 9 11 11 12 12 12 12 13 14 14 15 1A 16 1B 22 2 23 3 24 4 25 5 26 6 28 7 29 7A 67 8 70 9 142 9A 142 9B 142 10 142 11 142 12 143 13 143 14 143 15 143 70 144
1462Item 1.Table of Contents Business(“Cummins,” “the Company,” “the registrant,” “we,” “our,”and its consolidated subsidiaries are sometimes referred to in this annual report as "Cummins," the "Company," "we," "our," or “us”)"us."
CAUTIONARY STATEMENTS REGARDING FORWARD-LOOKING INFORMATIONand emissions solutions,exhaust aftertreatment, fuel systems, controls and air handling systems. We were founded in 1919 as one of the first manufacturers of diesel engines and are headquartered in Columbus, Indiana. We sell our products to Original Equipment Manufacturersoriginal equipment manufacturers (OEMs), distributors and other customers worldwide. We have long-standing relationships with many of the leading manufacturers in the markets we serve, including DaimlerChryslerAG (DaimlerChrysler), PACCAR Inc., International Truck and Engine Corporation (Navistar International Corporation), Volvo AB, CNH Global N.V., Tata Motors Ltd., Ford, Volkswagen, Dongfeng Motor Company, Komatsu and Scania AB. We serve our customers through a network of more than 550500 company-owned and independent distributor locations and approximately 5,0005,200 dealer locations in more than 160190 countries and territories.Our financial performance depends, in large part, on varying conditions in the markets we serve, particularly the on-highway, construction and general industrial markets. Demand in these markets tends to fluctuate in response to overall economic conditions and is particularly sensitive to changes in interest rate levels. OEM inventory levels, production schedules, work stoppages and changes in emission standards also impact our sales. Economic downturns in the markets we serve generally result in reduced sales, which affect our profits and cash flow.
OPERATING SEGMENTSare also subject to substantial government regulation which requires us to make significant investments in capital and research that also impacts our profits and cash flow.Cummins files annual, quarterly and current reports, proxy statements and other information with the Securities and Exchange Commission (the “SEC”). You may read and copy any document we file with the SEC at the SEC’s public reference room at 450 Fifth Street, NW, Washington, DC 20549. Please call the SEC at 1-800-SEC-0330 for information on the public reference room. The SEC maintains an internet site that contains annual, quarterly and current reports, proxy and information statements and other information that issuers (including Cummins) file electronically with the SEC. The SEC’s internet site is www.sec.gov.Cummins internet site is www.cummins.com. You can access Cummins Investors and Media webpage through our internet site, by clicking on the heading “Investors and Media.” Cummins makes available free of charge, on or through our Investors and Media webpage, its proxy statements, annual reports on Form 10-K, quarterly reports on Form 10-Q, current reports on Form 8-K and any amendments to those reports filed or furnished pursuant to the Securities Exchange Act of 1934, as amended (the “Exchange Act”), as soon as reasonably practicable after such material is electronically filed with, or furnished to, the SEC. Cummins also makes available, through our Investors and Media webpage, under the heading of “SEC filings” within the “Financial Information” heading, statements of beneficial ownership of Cummins equity securities filed by its directors, officers, 10 percent or greater shareholders and others under Section 16 of the Exchange Act.Cummins also has a Corporate Governance webpage. You can access Cummins Corporate Governance webpage through our internet site, www.cummins.com, by clicking on the heading “Investors and Media” and then the topic heading of “Governance Documents” within the “Corporate Governance” heading. Cummins posts the following on its Corporate Governance webpage:· ISS Corporate Governance Rating,· Code of Conduct,· Corporate Governance Principles,· By-laws of Cummins Inc.,· Audit Committee Charter,· Governance and Nominating Committee Charter,· Compensation Committee Charter, and· Supplier Code of Conduct.Cummins Code of Conduct applies to all our employees, regardless of their position or the country in which they work. We will post any amendments to the Code of Conduct, and any waivers that are required to be disclosed by the rules of either the SEC or the New York Stock Exchange, Inc. (“NYSE”), on our internet site. The information on Cummins internet site is not incorporated by reference into this report.You may request a copy of these documents at no cost, by contacting Cummins Inc. Investor Relations at 500 Jackson Street, Mail Code 60115, Columbus, IN 47201 (812-377-3121) or by sending an email request to: investor_relations@cummins.com.In accordance with NYSE Rules, on May 22, 2006, we filed the annual certification by our CEO that, as of the date of the certification, he was unaware of any violation by the company of the NYSE’s corporate governance listing standards.We believe the following competitive strengths are instrumental to our success:·Leading Brands. Our product portfolio includes products and services marketed and branded under various trademarks, tradenames and trade dress configurations throughout the world, including each of the following brands, which holds a leading position in its respective market:· Cummins® engines, electric power generation systems, components and parts;· Onan® and Cummins®-Onan® generator sets;· Alternator products sold under the Stamford®, AvK® and Markon® brands;· Fleetguard® filtration systems and components;· Cummins® intake and exhaust systems and components;· KussTM automotive in-tank fuel filtration;· Universal Silencer® filtration systems and silencers;· Holset® turbochargers;· Cummins® Fuel SystemsTM offerings and components; and· Cummins® Emission SolutionsTM aftertreatment solutions and offerings.Our continual investment in and attention to furthering brand equity in our offerings and across our business units includes leveraging and creating brand identity, brand value and brand presence for our offerings in our markets of interest. In particular during 2006, we successfully rebranded our major operating business units to reflect the Cummins name and brand in furtherance of our overall branding strategy. In part, as a result of this investment and by seeking to aggregate brand strength in complementary markets, we also gain recognition in and across our markets for our offerings, continually seek new and innovative means to further develop and expand market share through our brand equity position, and strengthen customer relationships.While our portfolio of branded products and offerings contains a number of market leaders, we operate in a highly competitive sector and our branded offerings compete with the brands offered by other manufacturers and distributors that produce and sell similar offerings.·Customers and Partners. To maintain technology leadership and a global presence in a cost-effective manner, we have established strategic alliances with a number of our leading customers. These partnerships provide us with a knowledge and understanding of our customers’ technology and business needs, and enable us to develop products and services which better meet their requirements at lower costs. For example, we have both customer and supplier arrangements with Komatsu, Ltd., including manufacturing joint ventures and a product development joint venture through which we have partnered in the development of several engines. We are also the exclusive supplier of engines for Komatsu mining equipment. In addition, we have been the exclusive diesel engine supplier to DaimlerChrysler for its Dodge Ram truck since 1988, and in 2003 our exclusivity agreement was extended beyond model year 2007. We have long-term agreements with Volvo and International Truck and Engine Corporation for the supply of heavy-duty truck engines and PACCAR for the supply of both heavy-duty and medium-duty engines. These agreements afford us long-term price stability and eliminate certain dealer and end-user discounts as well as offer closer integration on product development. We also have multiple international joint ventures which manufacture heavy-duty and midrange engines, including partnerships with Tata Motors Ltd. which is the leading truck manufacturer in India, and Dongfeng Automotive Corporation, an engine supplier to the largest medium-duty truck manufacturer in China.·Global Presence. We have a strong global presence including a worldwide distribution system, manufacturing and engineering facilities around the world and a network of global supply sources. Our worldwide presence has enabled us to take advantage of growth opportunities in international markets, with sales outside the U.S. growing from 43 percent of total consolidated net sales in 2000 to 50 percent of total consolidated net sales in 2006. For over 70 years, we have developed a distribution and service network that includes more than 550 company-owned and independent distributor locations and 5,000 independent dealers located throughout 160 countries and territories. We also have manufacturing operations and product engineering centers around the world, with facilities in the United Kingdom (UK), Brazil, Mexico, Canada, France, Australia, China, India, South Africa, Japan and Singapore. In addition, we have developed a global network of high-quality, low-cost supply sources to support our manufacturing base.·Leading Technology. We have an established reputation for delivering high-quality, technologically advanced products. We continuously work with our customers to develop new products to improve the performance of their vehicles, equipment or systems at competitive cost levels. We are a leader in developing technologies to reduce diesel engine emissions, a key concern of our customers and regulators around the world. We were the first manufacturer to receive a Tier III Certificate of Conformity from the Environmental Protection Agency (EPA) for our QSM off-highway engine that met the January 2005 emissions standards. We were able to meet the EPA’s 2007 heavy-duty on-highway emissions standards that went into effect on January 1, 2007 and we announced in January 2007 that our Dodge Ram 6.7-liter Turbo Diesel engine meets the EPA’s 2010 emissionsstandards a full three years ahead of the requirements. We have also developed low-emission, high-performance natural gas engines as an alternative-fuel option for the on-highway, industrial and power generation markets. Our technology leadership in filtration, exhaust aftertreatment, air handling and fuel systems allows us to develop integrated product solutions for the on-highway, off-highway and power generation markets, allowing our customers to use a single high-performance, low-cost system as opposed to multiple components from different suppliers.The five key principles upon which we drive our business strategies are as follows:·Being a Low Cost Producer in as Many of our Markets as Possible. In many of our markets, product or system cost is a critical performance parameter for our customers. To achieve cost leadership, we will continue to leverage our innovative technology, economies of scale, global presence and customer partnerships. We have focused on reducing costs and lowering our breakeven point to maintain a competitive advantage and to deliver quality products to our customers. The following key initiatives are integral to this strategy:·Six Sigma. Since the program’s inception in 2000, we have not only applied Six Sigma to manufacturing processes and in the initial design of new products, but also expanded the program to include processes with customers, suppliers and distributors. Six Sigma yields not only significant cost savings and improved quality, it strengthens our relationships with these important stakeholders and contributes to developing long-term relationships.·Global Sourcing. Our cost reduction efforts in supply chain management include global procurement from less expensive international markets such as China, India, Eastern Europe and Brazil which has resulted in significantly reducing the cost of purchased materials and services during the last six years.·Technical Productivity. We have managed our research and development costs through a number of initiatives including a) using analysis-led design to eliminate capital-intensive prototypes through virtual computer modeling, b) performing significant analysis work at our technical center in India, c) applying engineering standards globally and d) with cost-sharing arrangements with OEM customers and joint venture partnerships. Cummins operates 17 technical centers around the world. In August 2006, we further strengthened our engine research and development capability by officially opening our first technical center in central China’s Wuhan City. These initiatives have helped us to continue to be a technology leader, while maintaining our research and engineering expense at approximately 2.8 percent of consolidated net sales for 2006.·Expanding into Related Markets. We will continue to focus growth initiatives in related businesses where we can use our existing investments in products or technology, leading brand name or market presence to establish a competitive advantage. That focus is particularly on ventures that complement our existing businesses by being less capital-intensive and less cyclical or counter-cyclical to our core businesses, for example, the production of light-duty diesel engines in an existing Cummins facility that will introduce us to a new consumer customer base. Furthermore, we will target related markets that offer higher rates of growth, attractive returns and more stable cash flows through product and end market diversity. Specific growth opportunities are outlined below.· Our Engine segment strategy includes the development of light-duty diesel engines for the SUV/light duty pick-up truck and industrial markets both in the U.S. and in China. In addition, our strategy includes the development of high horsepower engines for the growing oil and gas and marine markets.· Our Power Generation strategy is focused on attaining leadership positions in all major commercial generator set markets globally, including growth in market share in European, Middle Eastern and African markets and penetration gains in power electronics and controls, such as automatic transfer switches and switchgear. The business is also pursuing growth opportunities in adjacent markets for consumer generator sets, including towable trailers, portable generator sets, auxiliary power units and residential generator sets.· Our Components segment will leverage our filtration, exhaust, fuel systems, turbocharger and engine technologies to provide integrated solutions for its customers and meet increasingly stringent emissions requirements.· Our Distribution segment is growing through the expansion of the aftermarket parts and service business by capitalizing on its global customer base and fast growth markets in China, India and Russia as well as the Middle East. Our strategy also includes increasing our ownership interest in key portions of the distribution channel.·Creating Greater Shareholder Value. Return on equity is a primary measure of our consolidated financial performance. We report the performance of our operating segments based on segment EBIT. Segment EBIT is earnings before interest expense, taxes and minority interests.·Leveraging Complementary Businesses. Strong synergies and relationships exist between our operating segments in the following areas:·Shared Technology. In addition to common platforms of base product technology, our operating segments have technical capabilities which can be applied commercially to provide integrated solutions for our customers. The operating segments also realize synergies in the development and application of broader technology tools (such as information technology).·Common Channels and Distribution. All operating segments utilize a common distribution channel, which provides access to a full range of our products and also provides economies of scale.·Shared Customers and Partners. There is substantial commonality in customers and partners between operating segments, which allows us to build strong customer relationships and provides opportunity for expanded product offerings.·Corporate Brand and Image. All operating segments benefit from the established and respected corporate brand.·Creating the Right Environment for Success. We believe that creating the right environment for success means creating an inclusive learning environment, while reinforcing a performance ethic that attracts, develops and retains high-quality talent. We measure our success through skill and competency assessment, leadership development outcomes and participation in tailored individual development and training programs.We operate four complementary operating segments: Engine, Power Generation, Components and Distribution. These segments that share technology, customers, strategic partners, brandsbrand recognition and our distribution network to gain a competitive advantage in their respective markets. With our size and global presence, we provide world-class products, service and support to our customers in a cost-effective manner. In each of our operating segments, we compete worldwide with a number of other manufacturers and distributors that produce and sell similar products. Our products primarily compete on the basis of price, performance, fuel economy, speed of delivery, quality, customer support and customer support.We made certain leadership changes effective May 2, 2005, withinprice. Financial information about our management team. In connection with these changes, certain modifications were madeoperating segments, including geographic information, is incorporated by reference from Note 25, "OPERATING SEGMENTS," to our internal reporting. These modifications are summarized below:Consolidated Financial Statements.· The Filtration and Other segment was renamed the Components segment and now includes operating results of the fuel systems business which were previously included in the Engine segment. Historically, the fuel systems business transferred product within theSegmentat cost. Beginning in the third quartersales and EBIT as a percentage of 2005, those transfers began using a cost-plus based transfer price. As a result of this change, segment EBIT increased for the Components segmentconsolidated results were: Years ended December 31, 2009 2008 2007 49 % 50 % 52 % 34 % 41 % 47 % decreased for the Engine segment but there was no impact to consolidated earnings. Revenues of the Components segment were also increased to reflect transfers to the Engine segment and eliminations were increased by a corresponding amount.taxes· The North American distribution business was combined with the International Distribution segment and renamed the Distribution segment. Previously, the North American distribution business was reported in the Engine and Power Generation segments as investee equity and included the results of a partially-owned distributor that is consolidated. As a result, revenues of the Engine segment were increased to reflect sales to the consolidated distributor that were previously eliminated and decreased for the revenues of the consolidated distributor which are now included in the Distribution segment. In addition, this change also caused investee equity earnings in the Engine and Power Generation segments to decrease while investee equity earnings in the Distribution segment increased by a corresponding amount.gas-poweredgas powered engines under the Cummins brand name, as well as certain customer brand names, for the heavy-andheavy- and medium-duty truck, bus, recreational vehicle (RV), light-duty automotive, agricultural, construction, mining, marine, oil and gas, rail and governmental equipment markets. We offer a wide variety of engine products including:fromrange of 1.4 to 91 liters and horsepower ranging from 31 to 3,500. In addition, we provide a full range of new Theour largest operating segment, accountingorganized by engine displacement size and serves these end-user markets:approximately 55 percentschool buses, transit buses and shuttle buses worldwide, with key markets including North America, Latin America, Europe and Asia.total sales before intersegment eliminationsequipment in 2006.the construction, agricultural, mining, rail, government, oil and gas, power generation and commercial and recreational marine applications throughout the world. Across these markets we have major customers in North America, China, Europe/Middle East/Africa (EMEA), India, Latin America, Korea, Southeast Asia, Russia, Japan, South Pacific and Mexico.heavy-andheavy- and medium-duty truck engines include truck manufacturers, such as International Truck and Engine Corporation (Navistar International Corporation),PACCAR, Volvo Trucks North America, PACCARDaimler Trucks North America, Ford and Freightliner. CNH Komatsu, Hitachi, Ingersoll Rand and Brunswick representVolkswagen AG. We sell our industrial engines to manufacturers of construction, agricultural and marine equipment, to whom we sell our industrial engines.including Case New Holland, Komatsu, Hyundai, Hitachi, Ingersoll Rand, Brunswick and Terex. The principal customers of our light-duty on-highway engines are DaimlerChryslerChrysler and manufacturers of RVs.Caterpillar, Inc., Detroit Diesel Corporation, Volvo Trucks North America, Mack Trucks, Inc. andPowertrain, International Truck and Engine Corporation (Engine Division) and Caterpillar Inc. (CAT). Our primary competitors in international markets vary from country to country, with local manufacturers generally predominant in each geographic market. Other engine manufacturers in international markets include Mercedes Benz, Volvo, Renault Vehicules Industriels, Scania, Weichai Power Co. Ltd. and Nissan Diesel Motor, GE Jenbacher, MAN Nutzfahrzeuge AG (MAN), Tognum AG, GuangxiYuchai Group, Yanmar Co., Ltd.Our Engine segment organizes its engine, parts, Deutz AG and service businesses around the following end-user markets:CAT.We manufacture a complete line of diesel engines that range from 310 horsepower to 600 horsepower serving the worldwide heavy-duty truck market. We offer the ISM and ISX engines and in Australia, the Signature 620 series engines, which we believe comprise the most modern product engine line in our industry. Most major heavy-duty truck manufacturers in North America offer our diesel engines as standard or optional power. In 2006, we held a 27 percent share of the Group II engine market for NAFTA Class 8 heavy-duty trucks. We are also the market leader in Mexico and South Africa. Our largest customer for heavy-duty truck engines in 2006 was International Truck and Engine Corporation (Navistar International Corporation) with sales representing almost 9 percent of consolidated net sales.We have long-term supply agreements with three key customers to improve customer service and increase market share. We have a long-term agreement with Volvo Trucks North America, Inc. under which we act as its sole external engine supplier. We also have long-term supply agreements with PACCAR and International Truck and Engine Corporation (Navistar International Corporation) covering our heavy-duty engine product line. These supply agreements provide long-term, stable pricing for engines and eliminate certain dealer and end-user discounts, in order to provide our customers with full responsibility for total vehicle cost and pricing. In addition, these agreements provide for joint work on engine/vehicle integration with a focus on reducing product proliferation. These efforts are expected to reduce product cost while creating enhanced value for end-users through better product quality and performance. The joint sales and service efforts also will provide better customer support at a significantly reduced cost to the partners.Medium-Duty Truck and BusWe manufacture a product line of medium-duty diesel engines ranging from 200 horsepower to 400 horsepower serving medium-duty and inter-city delivery truck customers worldwide. We believe that our ISB, ISC and ISL series diesel engines comprise the most advanced product line in the industry. We sell our ISB and ISC series engines and engine components to medium-duty truck manufacturers in Asia, Europe and South America. For the year ended 2006 our market share for diesel powered medium-duty trucks in the North American medium-duty truck market had grown to approximately 16 percent. Freightliner LLC, (a division of DaimlerChrysler), PACCAR, Ford and Volkswagen AG are our major customers in this worldwide market.We also offer our ISB, ISC, and ISL diesel engines, and their alternative fueled counterparts, for school buses, transit buses and shuttle buses worldwide. Key markets include North America, Latin America, Europe, and Asia. The demand for alternative-fuel products continues to grow both domestically and internationally. Cummins Westport Inc., a joint venture formed in 2001 with Westport Innovations, Inc., markets low-emission, propane and natural gas engines in bus markets worldwide. Significant fleets are located in cities ranging from Los Angeles, Boston, Salt Lake City, Vancouver, BC and Beijing, China. We are the largest provider of diesel engines for hybrid bus applications in the United States.9Light-Duty Automotive and RVWe are the exclusive provider of diesel engines used by DaimlerChrysler in its Dodge Ram trucks. Our relationship with DaimlerChrysler extends nearly 20 years, and in 2006 we shipped over 162,000 engines for use in Dodge Ram trucks. In 2003, our selection as the exclusive diesel power provider for Dodge Ram truck models was extended to include the 2007 model year. The 6.7-liter Dodge Ram Turbo Diesel engine offers best in class 650 lb-ft of torque and 350 horsepower, and we expect this popular engine will continue to result in strong sales volumes with the availability of our engine in the new Dodge Ram Chassis Cab model.We are the leading manufacturer of diesel engines for use in the Class A motorhome market, with a market share representing approximately 58 percent of the diesel engines in retail Class A motorhome sales. The diesel segment of the Class A motorhome market has grown to approximately 48 percent in 2006, indicating a growing preference for diesel power for this application.IndustrialOur mid-range, heavy-duty and high-horsepower engines power a wide variety of equipment in the construction, agricultural, mining, rail, government, oil and gas, power generation, commercial and recreational marine applications throughout the world. Our major construction OEM customers are in North America, Europe, South Korea, Japan and China. These OEMs manufacture approximately one million pieces of equipment per year for a diverse set of applications and use engines from our complete product range. Agricultural OEM customers are primarily in North America, South America and Europe, serving end-use markets that span the globe. Our engines are sold to both recreational and commercial boat builders, primarily in North America, Europe and Asia. In the recreational marine markets, our joint venture, Cummins MerCruiser Diesel Marine, is the market share leader in the North American and South Pacific recreational boat segments for power ranges in which we participate. We offer a full product line of high-horsepower engines for mining applications that compete in all segments from small underground mining equipment to 400-ton haul trucks. We occupy a strong number two position in the mining market, where we offer the broadest engine line-up in the industry. This engine range extends from the A-series to the QSK78 allowing Cummins to penetrate the underground mining market with smaller engines up to the largest mining machines with the QSK60 and QSK78. In this market, we continue to be the exclusive or preferred supplier of engines to large construction and mining equipment OEM’s such as Komatsu, Hitachi, and Belaz. Our sales to the rail market are primarily to railcar builders in Europe and Asia, and we are a leader in the worldwide railcar market. With our QSK60 and QSK78 engines, we expect to move into a larger proportion of the locomotive and railcar markets outside North America and commercial marine markets worldwide. Government sales represent a small portion of the high-horsepower market and are primarily to defense contractors in North America and Europe. Our full line of diesel and natural gas engines, power generation products and global distribution and customer support capabilities have enabled us to achieve significant growth and penetration with oil and gas customers worldwide.The Power Generation segment represented 18 percentsales and EBIT as a percentage of our total salesconsolidated results were: Years ended December 31, 2009 2008 2007 19 % 20 % 19 % 22 % 28 % 26 % in 2006. This operatingis one of the most integrated providers of power solutions in the world, designing or manufacturingdesigns and manufactures most of the components that make up power generation systems, including engines, controls, alternators, transfer switches and switchgear. This operating segment is a global provider of power generation systems, components and services for a diversified customer base to meetand includes the needs for standby power, distributed generation power, as well as auxiliary power needs in specialty mobile applications. following:are provided tofor customers who rely on uninterrupted sources of power to meet the needs of their customers.are provided tofor customers with less reliable electrical power infrastructures, typically init providesour power solutions provide an alternative source of generating capacity located close to its point of use, which is purchased bypower and is located close to its point of use. power.drivedrivetrain power) for mobile applications.Our power generation products are marketed principally under the Cummins In 2009, our Power Generation segment reorganized its reporting structure and Onan brands and include diesel and alternative-fuel electrical generator setsnow reports the following businesses:institutionalapplications ranging from 5 kilowatts to 2.75 megawatts.consumer applications, such as office buildings, hospitals, factories, municipalities, utilities, universities, RVs, boats and homes. We are the worldwide leader in auxiliary generator sets for RVs, commercial vehicles and recreational marine applications. Our rental business provides power equipment on a rental basis for both standby and prime power purposes. Our energy solutions business provides full-service power solutions for customers including generating equipment, long-term maintenance contracts and turnkey power solutions.Cummins Generating Technologies (CGT) is a leader in the alternator industry and suppliessells its products internally as well as to other generator set assemblers. CGTOur products are sold under the Stamford, AVK and Markon brands and range in output from 0.6 kVA0.6kVA to 30,000 kVA.reciprocatingswitch gear and transfer switches to both internal and external customers. This business integrates well with commercial products to provide a complete solution to customers.drive engines across a large power range to other generator set assemblers.sets for use in RVs, commercial vehicles and recreational marine applications. operating segment continuously explores emerging technologies, such as microturbinesfuel cells, wind and fuel cells,hybrid solutions and provides integrated power generation products utilizing technologies other than reciprocating engines. We use our own research and development capabilities as well as leveragingleverage business partnerships to develop cost-effective and environmentally sound power solutions.China, India, the Middle East, Western Europe and BrazilEast Asia, are four of our largest geographic markets outside of North America.Caterpillar remainsCAT, Tognum (MTU) and Mitsubishi (MHI) remain our primary competitor as a result of its acquisition of MAK Americas Inc., Perkins Engines Inc. and FG Wilson Inc. Volvo and DaimlerChrysler, through its acquisition of Detroit Diesel Corporation, are other major engine manufacturers with a presence in the high-speed generation segment of the market. Wecompetitors, but we also compete with FG Wilson (Caterpillar group), Kohler, SDMO (Kohler group), Generac and othernumerous regional generator set assemblers. CGTOur Alternator business competes globally with Emerson Electric Co., Marathon Electric and Meccalte, among others. Years ended December 31, 2009 2008 2007 18 % 18 % 19 % 13 % 13 % 12 % produces filters, silencers andsupplies products which complement our Engine segment, including filtration products, turbochargers, aftertreatment systems, intake and exhaust systems and is the largest worldwide supplier of turbochargersfuel systems for commercial diesel applications. This segment manufacturesWe manufacture filtration and exhaust systems for on-andon- and off-highway heavy-duty and mid-range equipment, and iswe are a supplier of filtration products for industrial and passenger car applications, exhaust systems for small engine equipment and silencing systems for gas turbines.applications. In addition, we operate an emission solutions business through which we develop aftertreatment and exhaust systems to help our customers meet increasingly stringent emissions standards and a fuel systems business which to date hashave primarily supplied our Engine segment. In 2006,segment and our partner Scania.accounted for approximately 17 percent of our total sales before intersegment eliminations.We areis organized around the world’s leading supplier offollowing businesses:exhaust, coolant, and chemical products offeringbusiness offers over 30,00014,000 products including air, lube, fuel, hydraulic, coolant, diesel exhaust fluid/Adblue and fuel additives. Products are sold through Cummins Distribution, OEMs, OEM dealers, independent distributors, dealers and hydraulic filters, antifreezeend users. The globally recognized aftermarket brand Fleetguard is an industry leader in the key segments served. Cummins filtration supports a wide customer base including on-highway, off-highway, oil and coolant additives, catalysts, particulate filters, controllersgas, agriculture, marine, industrial and other filtration systems to OEMs, dealer/distributors and end-user markets. Itslight-duty automotive applications. These products are produced and sold in global markets, including North America, South America, Europe, Asia, Africa and Australia. across 160 countries at over 30,000 distribution points.Components segment also makes products for the automotivespecialty filtration market and the industrial filtration market through our Kuss subsidiary, located in Findlay, OH, and Universal Silencer, located in Stoughton, WI.Cummins Turbo Technologiesturbo technologies business designs, manufactures and markets turbochargers for commerciallight-duty, mid-range, heavy-duty and light-dutyhigh horsepower diesel applications with manufacturing facilities in five countries and sales and distribution worldwide. Cummins Turbo Technologiestechnologies provides critical technologies for engines, including variable geometry turbochargers, to meet challenging performance requirements and worldwide emissions standards. We primarily serve markets in North America, Europe and Asia.including variable geometry turbochargers,with production beginning in 2011 and is the market leader in turbochargers for heavy-duty equipment.The2012, respectively.applications. Our Engine segmentapplications and also remanufactures fuel systems and engine control modules. Scania and Komatsu are the primary customers for the fuel systems business.external customers. Scania is also our partner in two joint ventures within theour fuel systems business. The Cummins Scania HPICummins-Scania High Pressure Injection, LLC joint venture currently manufactures fuel systems that are used by both companies in current products. In August 2005,Cummins and Scania while the Cummins ScaniaCummins-Scania XPI joint venture was formed to design, develop and manufacture the next generation ofcurrently produces advanced technology fuel systems for use in 2007 and beyond.medium-and heavy-duty engines.thatmany of which are also customers of our Engine segment, such as PACCAR, CNH Global N.V., International Truck and Engine, Volvo, Iveco and other manufacturers that use Cumminsour filtration products in their product platforms. Our customer base for replacement filtration parts is highly fragmented and primarily consists of various end-users of filtration systems.on- and off-highway vehicles and equipment.systemsexhaust and componentsfuel systems and turbochargers. Our primary competitors in these markets include Donaldson Company, Inc., Clarcor Inc., Mann+Hummel Group, Tokyo Roki Co., Ltd., Borg-Warner, Bosch, Tenneco and Honeywell International.In 2006, Distribution segment sales accounted for 10 percentand EBIT as a percentage of our total salesconsolidated results were: Years ended December 31, 2009 2008 2007 14 % 12 % 10 % 31 % 18 % 15 % eliminations.eliminations1719 company-owned and 18 joint venture distributors that service and 12 joint ventures that distribute the full range of our products and services to end-users at approximately 270300 locations in over 90 countries andapproximately 70 distribution territories. InOur company-owned distributors are located in key markets, including India, China, Japan, Australia, Europe, the Middle East, South Africa, Brazil, North America this networkand Russia.our trained personnelwe provide parts and service to our customers, as well ascustomers. These full-service solutions includinginclude maintenance contracts, engineering services and integrated products, where we customize our products to cater to specific needs of end-users. Our company-owned distributors are located in key markets, including India, China, Japan, Australia, the U.K., the Middle East and South Africa. Our distributors also serve and develop dealers, predominantly OEM dealers, in their territories by providing technical support, tools, training, parts and product information.4044 percent of their 2009 revenues being generated from the wholesalesale of new power equipment (enginesengines and power generation equipment)equipment, compared to 50 percent in 2008, and the other portion consisting ofremaining revenue generated by parts and service repairs.revenue. that we own or operate compete with distributors or dealers that offer similar products. In many cases, these competing distributors or dealers are owned by, or affiliated with, the companies that are listed above as competitors of theour Engine, Power Generation or Components segments. These competitors vary by geographical location.SEGMENT FINANCIAL INFORMATION
JOINT VENTURES, ALLIANCES AND NON-WHOLLY-OWNED SUBSIDIARIESoperating segmentsinvestments in joint ventures and alliances is incorporated by reference from Note 211, "SUMMARY OF SIGNIFICANT ACCOUNTING POLICIES," Note 2, "INVESTMENTS IN EQUITY INVESTEES," and Note 23, "VARIABLE INTEREST ENTITIES," to theConsolidated Financial Statements. Years ended December 31, In millions 2009 2008 2007 $ 100 51 % $ 100 43 % $ 83 43 % 12 6 % 7 3 % 4 2 % 3 1 % 5 2 % 2 1 % 36 18 % 30 13 % 22 11 % 33 17 % 55 24 % 41 21 % 7 4 % 2 1 % 1 1 % 7 4 % 8 4 % 6 3 % 5 3 % 7 3 % 13 7 % (10 ) (5 )% 3 1 % 11 6 % 3 1 % 14 6 % 9 5 % $ 196 100 % $ 231 100 % $ 192 100 % SUPPLYThis total represents Cummins share of net income of our equity investees and is exclusive of royalties and interest income from our equity investees. To see how this amount reconciles to the "equity, royalty and interest income from investees" in theConsolidated Statements of Income, see Note 2, "INVESTMENTS IN EQUITY INVESTEES."We have developed and maintainTable of Contentsworld-class supply baseseparate legal entity, the business of each is the same as that of our wholly-owned distributors based in terms of technology, quality and cost. We source our materials and manufactured components from leading suppliers both domestically and internationally. We have adequate sources of supply of raw materials and components. We machine and assemble someother parts of the components used in our engines and power generation units, including blocks, heads, rods, turbochargers, camshafts, crankshafts, filters, exhaust systems, alternators and fuel systems. We also have arrangements with certain suppliers who are the sole source for specific products or supply items. Between 75 and 85 percentworld. All of our total raw material and component purchases in 2006 were purchased from suppliers who are the sole sourcedistributors, irrespective of supply for a particular supply item. Although we elect to source a relatively high proportion of our total raw materials and component requirements from sole suppliers, the majority of these supply items can be purchased from alternate suppliers with the appropriate lead-time and sourcing plan. In 2006, we established a process to annually review our sourcing strategies with a focus on the reduction of risk. We are also developing suppliers in many globaltheir legal structure or low-cost locations to serve our businesses across the globe and provide alternative sources in the event of disruption from existing suppliers. In addition, we maintain dual sourcing at a commodity level on many of our sole sourced part numbers. Our supply agreements vary according to the particular part number sourced. However, these agreements typically include standard terms relating to cost (including cost reduction targets), quality and delivery. Our supply agreements also typically include customary intellectual property provisions that contain prohibitions on the use of our intellectual property by the suppliers for any purpose other than their performance of the supply agreements, and indemnity covenants from suppliers for breach by them of intellectual property rights of third parties in performance of the agreements. The duration of our more important supply agreements varies but typically ranges between three and five years. Many of our supply agreements include early termination provisions related to failure to meet quality and delivery requirements.We own or control a significant number of patents and trademarks relating to the products we manufacture. These have been granted and registered over a period of years. Although these patents and trademarks are generally considered beneficial to our operations, we do not believe any patent, group of patents, or trademark (other than our leading brand house trademarks) is considered significant in relation to our business.While individual product lines may experience modest seasonal declines in production, there is no material effect on the demand for the majority of our products on a quarterly basis. However, our Power Generation segment normally experiences seasonal declines in the first quarter of the fiscal year due to general declines in construction spending and our Distribution segment normally experiences seasonal declines in first quarter business activity due to holiday periods in Asia and Australia.We have thousands of customers around the world and have developed long-standing business relationships with many of them. DaimlerChrysler is our largest customer, accounting for approximately 10 percent of our consolidated net sales in 2006, primarily relating to sales of our ISB engine for use inDodge Ram trucks and sales of our heavy- and medium-duty truck engines to the Freightliner division of DaimlerChrysler. While a significant number of our sales to DaimlerChrysler are under long-term supply agreements, these agreements provide for the supply of DaimlerChrysler’s engine requirements for particular vehicle models and not a specific volume of engines. The loss of this customer or a significant decline in the production level of DaimlerChrysler vehicles that use our engines would have an adverse effect on our business, results of operations and financial condition. We have been an engine supplier to DaimlerChrysler for nearly 20 years and to Freightliner for well over 50 years. A summary of principal customers for each operating segment is included in our segment discussion.In addition to our agreements with DaimlerChrysler, we have long-term heavy-duty engine supply agreements with International Truck and Engine Corporation, PACCAR and Volvo Trucks North America. Collectively, our net sales to these three customers was less than 19 percent of consolidated net sales in 2006 and individually, was less than 9 percent of consolidated net sales for each customer. As with DaimlerChrysler, these agreements contain standard purchase and sale agreement terms covering engine and engine parts pricing, quality and delivery commitments, as well as engineering product support obligations. The basic nature of our agreements with OEM customers is that they are long-term price and operations agreements that assure the availability of our products to each customer through the duration of the respective agreements. There are no guarantees or commitments by these customers of any kind regarding volumes or market shares, except in the case of DaimlerChrysler, which has committed that Cummins will be its exclusive diesel engine supplier for the Dodge Ram heavy-duty pickup truck. Agreements with OEMs contain bilateral termination provisions giving either party the right to terminate in the event of a material breach, change of control or insolvency or bankruptcy of the other party.Demand in many of our markets has grown rapidly in the last two years resulting in longer lead times. However, while we have supply agreements with some truck and off-highway equipment OEMs, most of our business is transacted through open purchase orders. These open orders are historically subject to month-to-month releases and are subject to cancellation on reasonable notice without cancellation charges and therefore are not considered firm.For over 70 years, we have been developing a distribution and service network that includes more than 550 independent distributor locations and 5,000 independent dealers in 160 countries and territories. In North America, this network is comprised of independent and partially-owned distributors. Internationally, our network consists of independent, partially-owned, and wholly-owned distributors. Most distributors sellownership, offer the full range of our products as well as complementaryand services to customers and end-users in their respective markets.services. Our Distribution segment operates within this network with 17 company-owned distributorsservices to customers and 12 joint venturesend-users in approximately 270 locations in over 90 countries and territories.the Chilean market.may be are required to purchase the distributor’sdistributor's current inventory, signage and special tools, and may, at our option purchase other assets of the distributor, but are under no obligation to do so.Our distribution capability is a key element See further discussion of our business strategy and competitive position, particularly in our efforts to increase customer access to aftermarket replacement parts and repair service. Theredistribution network under the Distribution segment section above.more than 5,000 locations in North America, primarily owned and operated by OEMs or their dealers, at which Cummins trained service personnel and parts are available to service, maintain and repair our engines. We also have parts distribution centers located strategically throughout the world in order to serve ourgenerally formed with customers and distributors.Financial information about wholly-owned distributors, partially-owned distributors consolidated under FASB Interpretation No. 46R, “Consolidation of Variable Interest Entities,” (FIN 46R), issued by the Financial Accounting Standards Board (FASB), and distributors accounted for under the equity method are incorporated by reference from Notes 1, 2 and 3 to the Consolidated Financial Statements.Our research and engineering program is focused on product improvements, innovations and cost reductions for our customers. In 2006, our research and engineering expenditures were $321 million compared to $278 million in 2005. Of this amount, approximately 19 percent, or $62 million, was directly related to the development of heavy-duty and medium-duty engines that are designed to comply with the 2007 emissions standards with approximately $10 million directly related to compliance with 2010 emissions standards.In the Engine segment, we continue to invest in system integration and in technologies to meet increasingly more stringent emissions standards. We have focused our engine technology development on four critical subsystems: combustion, air handling, electronic controls and exhaust aftertreatment. We were the first engine manufacturer to announce a low-cost combustion-only emission solution for Tier III industrial diesel engines that does not require exhaust gas recirculation nor exhaust aftertreatment. We were able to meet the EPA’s 2007 heavy-duty on-highway emissions standards that went into effect on January 1, 2007 and we announced in January 2007 that our 6.7-liter Dodge Ram Turbo Diesel engine meets the EPA’s 2010 emissions standards a full three years ahead of the requirements. In addition, we were the first company to demonstrate a prototype vehicle that meets EPA 2007 gasoline-equivalent “Tier II Bin 5” emission levels.In Power Generation, our product engineering focus is to develop products with the best performance at the lowest cost for our customers. Our power electronics technology development is aimed at applying digital electronics to eliminate multiple genset controllers and achieve higher levels of system integration and control. We meet the most advanced emission standards around the world, employing both combustion and exhaust aftertreatment technologies. Looking to future low-emission power generation technologies, we have a Department of Energy funded program to develop a solid oxide fuel cell system for vehicle auxiliary power generation and for smaller stationary power generation applications.In Components, we are building on our strengths in design integration to develop modules that integrate multiple filtration functions into a single engine subsystem component. We are developing new filter media and technologies that support low-emission engines, including exhaust aftertreatment, closed crankcase ventilation, fuel systems and centrifugal soot removal.In 2003, we established Cummins Research and Technology India Private Ltd. (CRTI). This partially-owned subsidiary provides analytical services such as structural dynamics, computational fluid dynamics, and design to all Cummins entities. CRTI is located in Pune, India. In August 2006, our first technical center in China was opened in Wuhan City. The East Asia Technical Center, a 55-45 joint venture between Cummins and Dongfeng Cummins Engine Company Limited (DCEC), provides engineering and technicaldevelopment services for the full range of Cummins products built in China, including diesel and natural gas engines, power generators, turbochargers and filtration products. A series of projects has already started in the technical center, including the development of a new 13-liter engine platform for the heavy-duty truck market served by DCEC.We have entered into a number of joint venture agreements and alliances with business partners and affiliates in various areas of the worldallow us to increase our market penetration expand our product lines,in geographic regions, reduce capital spending, streamline our supply chain management and develop new technologies with the primarytechnologies. Our largest manufacturing joint ventures beingare based in China and are included in the following:·Cummins India Ltd. Welist below. Our engine manufacturing joint ventures are supplied by our Components segment in the majority owner of Cummins India Ltd. (CIL), which is a publicly listed company on various exchangessame manner as they supply our wholly-owned Engine segment and Power Generation segment manufacturing facilities. Components segment joint ventures and wholly owned entities provide fuel system, filtration and turbocharger products that are used in India. This business entity developed from a partnership established in 1962 with the Kirloskar family. CIL produces midrange, heavy-duty and high-horsepowerour engines as well as generators for the Indian and export markets. CIL also produces compressed natural gas spark-ignited engines licensed from the Cummins Westport (CWI)some competitors' products. These joint venture. We consolidate the results of Cummins India Ltd.ventures are not included in ourConsolidated Financial Statements.·Consolidated DieselChongqing Cummins Engine Company, Ltd.. Consolidated Diesel—Chongqing Cummins Engine Company, located in the U.S.,Ltd. is a joint venture in China with CNH Global N.V.Chongqing Heavy Duty Vehicle Group that began with Case Corporation in 1980. This partnership produces Cummins B Series, C Seriesmanufactures several models of our heavy-duty and ISL Serieshigh-horsepower diesel engines, primarily serving the industrial and engine products for on-highway and industrialstationary power markets in North America and Europe. Effective March 28, 2004, we adopted the provisions of FIN 46R for this entity and its results are now consolidated in our Consolidated Financial Statements (see Note 2 to the Consolidated Financial Statements).·Cummins/Komatsu ArrangementsDongfeng Cummins Engine Company, Ltd.. We have formed a broad relationship with Komatsu Ltd., including four joint ventures and numerous exclusive supply arrangements. Two joint ventures were formed in 1992, one to manufacture Cummins B Series engines in Japan, the other to build high-horsepower Komatsu-designed engines in the U.S., Cummins Komatsu Engine Corporation (CKEC). In 1997, we established a third joint venture in Japan to design the next generation of industrial engines. Our fourth joint venture is a distributor joint venture in Chile. Effective March 28, 2004, we adopted the provisions of FIN 46R for CKEC and its results are now consolidated in our Consolidated Financial Statements (see Note 2 to the Consolidated Financial Statements).16·Cummins/Dongfeng Joint Ventures. In 1985, we licensed Dongfeng Motor Company (Dongfeng), the largest medium-duty truck manufacturer in China, to manufacture Cummins B Series engines. In 1993, Dongfeng established a subsidiary, Dongfeng Automotive Corporation (DFAC), which became the licensee. In 1995, we partnered with DFAC and formed a joint venture, —Dongfeng Cummins Engine Company, Ltd. (DCEC), for the production of our C Series engines. In 1998, we established is a wholly-owned subsidiary, Cummins (Xiangfan) Machining Company Ltd. (CXMC), in an adjacent facility to DCEC to manufacture B Series cylinder blocks and cylinder heads. In April 2003, the assets of DFAC’s B Series manufacturing entity and the assets of CXMC were invested into the existing joint venture DCEC. The expanded joint venture,in China with annual capacityDongfeng Automotive Corporation, a subsidiary of approximately 170,000 units,Dongfeng Motor Company (Dongfeng), one of the largest medium-duty truck manufacturers in China. DCEC produces Cummins B, C and L Series four-tofour- to nine-liter mechanical engines, and began producing full-electronic diesel engines, with a power range from 100 to 370 horsepower, in 2006. In 2004,and natural gas engines.invested a B Series connecting rod machining line into CXMC to supply DCEC. We also haveLtd.—Valvoline Cummins, Ltd. is a joint venture with Ashland Inc., USA. The joint venture manufactures and distributes lubricant—oil products in India which are usedsystems, Shanghai Fleetguard Filter Co., Ltd and in 2005 expanded the relationship to include exhaust systems. In 2003, Nissan Motor Co., Ltd. acquired 50 percent ownership of Dongfeng. In August 2006, our first technical center in China was opened in Wuhan City. The East Asia Technical Center, a 55-45 consolidated joint venture between Cummins and DCEC, provides engineering and technical development services for the full range of Cummins products built in China, including diesel and natural gas engines, power generators, turbochargers and filtration products. A series of projects has already started in the technical center, including the development of a new 13-liter engine platform for the heavy-duty truck market served by DCEC. In late 2005, the Cummins Westport (CWI) joint venture engaged DCEC to produce the CWI natural gas engines in China.·Group Joint VenturesCummins Ltd.. In 1992, we formed—Tata Cummins Ltd. is a joint venture in India with Tata Motors Ltd., the largest automotive company in India and a member of the Tata group of companies. TheThis joint venture Tata Cummins Limited, manufactures the Cummins B Series engineengines in India for use in trucks manufactured by Tata Motors, as well as for various Cummins industrial and power generation applications. Cummins Turbo Technologies Ltd., one of our wholly-owned subsidiaries, also formed a joint venture for the manufacture of turbochargers, Tata Holset Ltd.·Chongqing Cummins. In 1995, we formed a joint venture with China National Heavy-Duty Truck Corporation in Chongqing, China. The shares of this venture are now owned jointly by us and the Chongqing Heavy Duty Vehicle Group. The joint venture, Chongqing Cummins Engine Company Ltd. (CCEC), manufactures several models of our heavy-duty and high-horsepower diesel engines in China, serving primarily the industrial and stationary power markets in China.·Shaanxi/Cummins. In 2005, we formed the Xian Cummins Engine Company (XCEC) joint venture with Shaanxi Heavy Vehicle Group Co., and Shaanxi Heavy Duty Truck Co., Ltd. in Xian, China. The joint venture will begin to manufacture in 2007 the Cummins ISM heavy-duty diesel engine for use in Shaanxi trucks and for sale to outside customers.·The European Engine Alliance (EEA). The EEA was established in 1996 as a joint venture between our Company and two Fiat Group companies, Iveco N.V. (trucks and buses) and CNH Global (agricultural and construction equipment), to develop a new generation of 4, 5 and 6-liter engines based on our 4B and 6B Series engines.·Cummins/Scania Joint Ventures. In 1999, we formed a joint venture with Scania to produce fuel systems for heavy-duty diesel engines. We own 70 percent of this joint venture and its results are included in our Consolidated Financial Statements. In August 2005, we signed a joint venture agreement with Scania to produce the next generation fuel systems for heavy-duty on-highwaytrucks. This joint venture, Cummins-Scania XPI Manufacturing LLP, is a 50/50 joint venture that builds upon other Cummins-Scania partnerships.·Cummins/Westport Joint Venture. In 2001, we formed a joint venture with Westport Innovations Inc., located in British Columbia, Canada, to develop and market low-emissions, high-performance natural gas engines for on-highway, industrial and power generation markets. In 2003, the joint venture agreement was modified to focus the joint ventures’ efforts on the marketing and sale of automotive spark-ignited natural gas engines worldwide. The new agreement also provides for joint technology projects between Westport and Cummins on low-emission technologies of mutual interest.·Cummins MerCruiser Diesel Marine, LLC. LLC In 2002, we formed—Cummins MerCruiser Diesel Marine, LLC is a joint venture in the United States (U.S.) with Mercury Marine, a division of Brunswick Corporation, to develop, manufacture and sell recreational marine diesel products, including engines, sterndrive packages, inboard packages, instrument and controls, service systems and replacement and service parts and assemblies, complete integration systems and other related products.·ZAO Cummins Kama. In January 2006, we signed a joint venture agreement with KAMAZ Inc., the largest vehicle manufacturer in Russia, to produce B Series engines under the name ZAO Cummins Kama. The joint venture will build on the Cummins and KAMAZ relationship that dates back to the early 1980s. Among the customers of the new company are KAMAZ trucks and buses, as well as trucks, buses and agricultural equipment produced by other manufacturers in Russia, Belarus and the Ukraine.·Beijing Foton Cummins Engine Company. Co., Ltd.In October 2006, we signed an agreement with Beiqi—Beijing Foton Motor Company to formCummins Engine Co., Ltd. is a 50/50 joint venture in China with Beijing Foton Cummins Engine Company (BFCEC)Motor Co., Ltd., a commercial vehicle manufacturer, to produce two new families of Cummins light-duty, high performance light-duty, diesel engines in Beijing. The engines will be used in light-duty commercial trucks, pickup trucks, multipurpose and sport utility vehicles. Certain types of marine, small construction equipment and industrial applications will also be served by thisthese engine family.families.and Beiqi Foton will initially invest a combined $126 million into BFCEC,India Ltd. (CIL), which is scheduleda publicly listed company on various stock exchanges in India. CIL produces mid-range, heavy-duty and high-horsepower engines, as well as generators for the Indian and export markets. CIL also produces compressed natural gas spark-ignited engines licensed from another of our joint ventures. CIL's net income attributable to begin production in 2008. The parties are awaiting approvalCummins was $28 million, $36 million and $26 million for 2009, 2008 and 2007, respectively.joint venture bycomponents used in our engines and power generation units, including blocks, heads, turbochargers, connecting rods, camshafts, crankshafts, filters, exhaust systems, alternators and fuel systems. We single source approximately 70 to 80 percent of the Chinese government.In additiontotal types of parts in our product designs. We have long-term agreements with critical suppliers who are the sole source for specific products or supply items. Although we elect to these primary joint ventures and agreements, we also have equity interests in severalsource a relatively high proportion of our North American distributors who distributetotal raw materials and component requirements from sole suppliers, we have established a process to annually review our sourcing strategies with a focus on the full rangereduction of risk, which has led us to dual source critical components, where possible. We are also developing suppliers in many global or emerging markets to serve our businesses across the globe and provide alternative sources in the event of disruption from existing suppliers.servicesour Distribution segment normally experiences seasonal declines in first quarter business activity due to customersholiday periods in Asia and end-users.Australia.also entered into numerous joint venturesthousands of customers around the world where we provideand have developed long-standing business relationships with many of them. We have long-term heavy-duty engine components, suchsupply agreements with PACCAR and Volvo Trucks North America. We have mid-range supply agreements with PACCAR, as turbochargers, alternatorsits exclusive engine supplier, as well as with Daimler Trucks North America (formerly Freightliner LLC), Ford and filtration products. In Turkey,MAN (formerly Volkswagen). We also have an agreement with Chrysler, for supplying the engine for use in Dodge Ram trucks. Collectively, our net sales to these six customers was approximately 22 percent of consolidated net sales in 2009, compared to approximately 21 percent in 2008 and 27 percent in 2007 and individually was less than nine percent of consolidated net sales to any single customer in 2009, compared to less than eight percent in both 2008 and 2007. These agreements contain standard purchase and sale agreement terms covering engine and engine parts pricing, quality and delivery commitments, as well as engineering product support obligations. The basic nature of our agreements with OEM customers is that they are long-term price and operations agreements that assure the availability of our products to each customer through the duration of the respective agreements. Agreements with most OEMs contain bilateral termination provisions giving either party the right to terminate in the event of a material breach, change of control or insolvency or bankruptcy of the other party.a license agreementsupply agreements with BMC Sanayi that provides for the manufacturesome truck and saleoff-highway equipment OEMs, most of our Bbusiness is transacted through open purchase orders. These open orders are historically subject to month-to-month releases and C Series engines.are subject to cancellation on reasonable notice without cancellation charges and therefore are not considered firm.
RESEARCH AND DEVELOPMENT EXPENSEevaluate joint venturemake investments to improve our current technologies, to continue to meet the future emissions requirements around the world and partnership opportunitiesimprove fuel economy.order to penetrate new markets, developsustainable business development. We have invested significantly in new products and generate manufacturingtechnologies designed to further lower exhaust emissions from our products. We have increased our commitment to addressing the global impact of climate change and operational efficiencies.have introduced our first set of 10 climate change principles that address ways that we plan to become a greater part of the solution and also articulated our positions on key public policy issues surrounding climate change. For the fourth consecutive year, we were named to the Dow Jones World Sustainability index, which recognizes the top 10 percent of the world's largest 2,500 companies in economic, environmental and social leadership. Our sustainability report for 2009 is available on our website at www.cummins.com.Financial information about our investments in joint ventures and alliances is incorporated by reference from Notes 1, 2 and 3 to the Consolidated Financial Statements. Financial information about geographic areas is incorporated by reference from Note 21 to the Consolidated Financial Statements.As of December 31, 2006, we employed approximately 34,600 persons worldwide.EPA,Environmental Protection Agency (EPA), the California Air Resources Board (CARB) and other state and international regulatory agencies as well as other regulatory agencies around the world, have established for heavy-duty on-highway diesel and gas engines and off-highway engines produced through 2006.engines. Our ability to comply with these and future emissions standards is an essential element in maintaining our leadership position in regulated markets. We have made, and will continue to make significant capital and research expenditures to comply with these standards. Failure to comply with these standards could result in adverse effects on our future financial results.In the fourth quarter of 2002, we implemented new on-road The current on-highway emissions standards. These were implementedstandards came into effect in accordance with the terms of a 1998 consent decree that we and a number of other engine manufacturers entered into with the EPA, the U.S. Department of Justice (DOJ) and CARB. The consent decree also required us to pull forward by one year (toon January 1, 2005)2010. To meet the implementation of Tier III2010 U.S. EPA heavy-duty on-highway emissions standards, for off-road engines in the 300we are using an evolution of our proven 2007 technology solution to 749 horsepower range. Sales of these engines commenced January 1, 2005. The consent decree was in response to concerns raised by these agencies regarding the level of nitrogen oxide emissions from heavy-duty dieselmaintain power and torque with substantial fuel economy improvement and maintenance intervals comparable with our 2007 compliant engines. On December 15, 2006, we were notified by the EPA that the consent decree provisions relating to certificationWe will offer a complete lineup of on-highway engines have been terminated, indicating our successful completion of that portionto meet the near-zero emissions standards. Mid-range and heavy-duty engines for EPA 2010 require nitrogen oxide (NOx) aftertreatment. NOx reduction is achieved by an integrated technology solution comprised of the consent decree. Certain other requirementsXPI High Pressure Common Rail fuel system, selective catalytic reduction (SCR) technology, next-generation cooled exhaust gas recirculation (EGR), advanced electronic controls, proven air handling and the Cummins Particulate Filter. The EPA and CARB have certified that our engines meet the 2010 emission requirements. Emissions standards in international markets, including Europe, Japan, Mexico, Australia, Brazil, India and China are becoming more stringent. We believe that our experience in meeting U.S. emissions standards leaves us well positioned to take advantage of opportunities in these markets as the consent decree continue and are on course to terminate within deadlines.need for emissions control capability grows.2006,2009, we submitted 46three reports to the EPA relating to 24two different defects affecting EGR valves, turbochargersoxidation catalysts and a minor mathematical change tovehicle labels. The oxidation catalyst defect necessitated the calibration algorithm. None of these defects resulted in a campaign of a material nature.approximately 360 engines.Emissions standards in international markets, including Europe and Japan, are becoming more stringent. We believe that our experience in meeting U.S. emissions standards leaves us well positioned to take advantage of opportunities in these markets as the need for emissions control capability grows.New on-highway emissions standards came into effect in the U.S. on January 1, 2007. In December 2003, we announced that we would meet the 2007 U.S. EPA heavy-duty on-highway emissions standards by combining our existing cooled Exhaust Gas Recirculation (EGR) technology with particulate matter (PM) filters. Cooled EGR is the same technology that we have used since April 2002 and was selected after reviewing other aftertreatment technologies such as NOx adsorbers and selective catalytic reduction (SCR). Our experience with particulate filters and the availability of ultra-low-sulfur diesel fuel combine to give us the confidence in meeting these tough standards in the U.S. Additionally, while we believe the EGR/PM filter combination is the right solution for 2007 in the U.S., we have selected SCR as the right technology to meet on-highway Euro IV emissions standards and certain off-highway applications.We Expenditures for environmental control activities and environmental remediation projects at our facilities in the U.S. have not been a substantial portion of our annual capital outlays and are not Duringlast five years, expenditures for environmental control activities andenvironmental remediation projects at our facilities in the U.S. have not been a substantial portion of annual capital outlays and are not expected to be material in 2007.Pursuant, pursuant to notices received from federal and state agencies and/or defendant parties in site environmental contribution actions, we have been identified as a Potentially Responsible Party (PRP) under the Comprehensive Environmental Response, Compensation and Liability Act of 1980, as amended or similar state laws, at approximately 1719 waste disposal sites. Based upon our experiences at similar sites we believe that our aggregate future remediation costs will not be significant. We have established accruals that we believe are adequate for our expected future liability with respect to these sites.
EXECUTIVE OFFICERS OF THE REGISTRANTName and AgePresent Cummins Inc. position and
year appointed to positionPrincipal position during the past
five years other than Cummins Inc.
position currently heldTheodore M. Solso (62) Chairman of the Board of Directors and Chief Executive Officer (2000)
N. Thomas Linebarger (47)
President and Chief Operating Officer (2008)
Executive Vice President and President—Power Generation (2005-2008), Vice President and President Cummins Power Generation (2003-2005)
Pamela L. Carter (60)
Vice President and President—Distribution Business (2008)
President—Cummins Filtration (2006-2008), President—Fleetguard (2005-2006), Vice President—WW Sales, Marketing and Logistics—Fleetguard (2001-2005)
Steven M. Chapman (55)
Group Vice President—China and Russia (2009)
Vice President—Emerging Markets and Businesses (2005-2009), Vice President—International and President International Distributor Business (2002-2005)
Richard J. Freeland (52)
Vice President and President—Components Group (2008)
Vice President and President—Worldwide Distribution Business (2005-2008), Vice President and General Manager—PowerCare and Distribution (2004-2005)
Mark R. Gerstle (54)
Vice President—Corporate Quality and Chief Risk Officer (2005)
Vice President—Corporate/Cummins Business Services and Corporate Quality (2004-2005)
Richard E. Harris (57)
Vice President—Chief Investment Officer (2008)
Vice President—Treasurer (2003-2008)
Marsha L. Hunt (46)
Vice President—Corporate Controller (2003)
James D. Kelly (57)
Vice President and President—Engine Business (2005)
Vice President and General Manager—Mid-range and Heavy-Duty Engine Business (2004-2005)Name and AgePresent Cummins Inc. position and
year appointed to positionPrincipal position during the past
five years other than Cummins Inc.
position currently heldMarya M. Rose (47) Vice President—General Counsel and Corporate Secretary (2001)
Livingston L. Satterthwaite (49)
Vice President and President—Power Generation (2008)
Vice President—Generator Set Business (2003-2008)
John C. Wall (58)
Vice President—Chief Technical Officer (2000)
Patrick J. Ward (46)
Vice President—Chief Financial Officer (2008)
Vice President—Engine Business Controller (2005-2008), Executive Director—Power Generation Business Controller (2003-2005) Relating to Our BusinessReport.Report and could individually or combined have a material adverse effect on our results of operations, financial position and cash flows. In addition, future results could be materially affected by general industry and market conditions, changes in laws or accounting rules, general U.S. and non-U.S. economic and political conditions, including a global economic slow-down, fluctuation of interest rates or currency exchange rates, terrorism, political unrest or international conflicts, political instability, or major health concerns, natural disasters, commodity prices or other disruptions of expected economic and business conditions. These risk factors should be considered in addition to our cautionary comments concerning forward-looking statements in this Report, including statements related to markets for our products and trends in our business that involve a number of risks and uncertainties. Our separate section in Item 7 below, “Disclosure Regarding Forward-Looking Statements,”above, "CAUTIONARY STATEMENTS REGARDING FORWARD-LOOKING INFORMATION," should be considered in addition to the following statements.Our.affected bycrucial to our success in North America. Although these engine platforms have undergone extensive testing and we believe that they are ready for production, the cyclical naturediscovery of any significant problems in these platforms could result in delays in our product launches, recall campaigns, increased warranty costs, reputational risk and brand risk.markets we serve.total types of parts in our product designs. Any delay in our suppliers' deliveries may adversely affect our operations at multiple manufacturing locations, forcing us to seek alternative supply sources to avoid serious disruptions. Delays may be caused by factors affecting our suppliers, including capacity constraints, labor disputes, economic downturns, availability of credit, the impaired financial condition of a particular supplier, suppliers' allocations to other purchasers, weather emergencies or acts of war or terrorism. Any extended delay in receiving critical supplies could impair our ability to deliver products to our customers.Our financial performance depends, in large part, on varying conditions in the markets and geographies that we serve. Demand in these markets and geographies fluctuates in response to overall economic conditions and is particularly sensitive to changes in interest rate levels. Our sales are also impacted by OEM inventory levels and production schedules and stoppages. Economic downturns in the markets we serve generally result in reductions in sales and pricing of our products, which could reduce future earnings and cash flow.Our products are subject to substantial government regulation.CARB,California Air Resources Board ("CARB") and other regulatory agencies around the world. We have made, and will be required to continue to make, significant capital and research expenditures to comply with these regulatory standards. Developing engines to meet changing government regulatory requirements, with different implementation timelines and emissions requirements, makes developing engines efficiently for multiple markets complicated and could result in substantial additional costs that may be difficult to recover in certain markets. In some cases, we may be required to develop new products to comply with new regulations, particularly those relating to air emissions. For example, we were required to develop new engines to comply with stringent emissions standards in the U.S. by January 1, 2007.2010. While we were able to meet this deadline,and previous deadlines, our ability to comply with other existing and future regulatory standards will be essential for us to maintain our position in the engine markets we serve. Currently, we believe we are on schedule to meet all deadlines for known future regulatory standards.We have made, and will be required to continue to make, significant capital and research expenditures to comply with these regulatory standards. Further, the successful development and introduction of new and enhanced products in order to comply with new regulatory requirements are subject to other risks, such as delays in product development, cost over-runs and unanticipated technical and manufacturing difficulties.failure to comply with regulatory standards affecting our productssuch regulation could subjectresult in the imposition on us to fines of significant additional costs in the form of taxes, manufacturing restrictions and/or penalties, and could require us to cease productionemission allowances. The impact of any non-compliant engine future mandatory greenhouse gas legislative, regulatory and/or to recall any engines producedproduct standard requirements on our global businesses is dependent on the design, terms and sold in violationapplicability of the applicablestandards. See “Business—Environmental Compliance—Product Environmental Compliance” for a complete discussion of the environmental laws and regulations that affect our products.Our products are subject to recall for performance related issues.at risk for product recall costs. Product recall costs are incurred when we decide, either voluntarily or involuntarily,unable to recall a product through a formal campaign to solicit the return of specific products due to a known predict whether and/or suspected performance issue. Costs typically include the cost of the product, part or component being replaced, customer cost of the recall and labor to remove and replace the defective part or component. When a recall decision is made, we estimate the cost of the recall and record a charge to earnings in that period in accordance with FASB Statement of Financial Accounting Standards (SFAS) No. 5, “Accounting for Contingencies.” In making this estimate, judgment is required as to the quantity or volume to be recalled, the total cost of the recall campaign, the ultimate negotiated sharing of the cost between us and the customer and, in some cases, the extent to which any of these potential requirements will be enacted or imposed upon us.suppliertiming of market price increases may prevent us from passing these additional costs on to our customers through timely pricing actions. Additionally, higher material and commodity costs around the part or componentworld may offset our efforts to reduce our cost structure. While we customarily enter into financial transactions to address some of these risks, there can be no assurance that commodity price fluctuations will sharenot adversely affect our results of operations, financial condition and cash flows. In addition, while the use of commodity price hedging instruments may provide us with protection from adverse fluctuations in commodity prices, by utilizing these instruments we potentially forego the recall cost.benefits that might result from favorable fluctuations in price. As a result, higher material and commodity costs, as well as hedging these estimatescommodity costs during periods of decreasing prices, both could result in declining margins.change.currency exchange rate and other related risks.cannot assureconduct operations in many areas of the world involving transactions denominated in a variety of currencies. We are subject to currency exchange rate risk to the extent that our truck manufacturerscosts are denominated in currencies other than those in which we earn revenues. In addition, since our financial statements are denominated in U.S. dollars, changes in currency exchange rates between the U.S. dollar and OEM customersother currencies have had, and will continue to outsource their engine supply needs.have, an impact on our results of operations. While we customarily enter into financial transactions to address these risks, there can be no assurance that currency exchange rate fluctuations will not adversely affect our results of operations, financial condition and cash flows. In addition, while the use of currency hedging instruments may provide us with protection from adverse fluctuations in currency exchange rates, by utilizing these instruments we potentially forego the benefits that might result from favorable fluctuations in currency exchange rates.Several A number of companies in the global automotive industry continue to experience financial difficulties. In North America, General Motors Corporation ("GM"), Ford Motor Company and Chrysler Group, LLC ("Chrysler") have experienced declining markets; furthermore, GM and Chrysler have filed for, and then exited, bankruptcy under Chapter 11 of the U.S. bankruptcy code and have accepted substantial monetary infusions from the United States government. Automakers across Europe and Japan are also experiencing difficulties from a weakened economy and tightening credit markets. Because many of our engine customers, including Paccar, Navistar, Volvo and DaimlerChrysler, are truck manufacturers or OEMs that manufacture enginessuppliers also supply automotive industry participants, the difficult automotivetheir own products. Despite their engine manufacturing abilities, these customers have chosen to outsourceour key suppliers, increases in certain types of engine production to us due to the quality of our engine products, our emissions capability, systems integration, their customer’s preferenceraw material, commodity and in order to reduceenergy costs eliminate production risks and maintain company focus. However, we cannot assure that these customers will continue to outsource engine production in the future. Increased levels of OEM vertical integration could result from a number of factors, such as shifts in our customers’ business strategies, acquisition by a customer of another engine manufacturer, the inability of third-party suppliers to meet product specifications and the emergenceglobal credit market crisis have resulted in severe financial distress among many companies within the automotive supply base. The continuation of low-cost production opportunitiesfinancial distress within the automotive industry and our shared supply base and/or the subsequent bankruptcy of one or more additional automakers may lead to further supplier bankruptcies, commercial disputes, supply chain interruptions, supplier requests for company sponsored capital support or a collapse of the supply chain.foreign countries. Any significant reduction in the level of engine production outsourcing fromfuture financial and stock market conditions could diminish our truck manufacturer or OEM customers could significantlypension plan asset performance and adversely impact our revenues and, accordingly, have a material adverse affect on our business, results of operations, financial condition and cash flows.Our largest customer accounts forWe are exposed to political, economic and other risks that arise from operating a significant share of ourmultinational business.Sales to DaimlerChrysler accounted for approximately 10 Approximately 52 percent of our consolidated net sales for 2006, primarily relating2009 were attributable to salescustomers outside the U.S., compared to 59 percent in 2008. Accordingly, our business is subject to the political, economic and other risks that are inherent in operating in numerous countries. These risks include:our ISB engine for useenforcing agreements and collecting receivables through foreign legal systems;Dodge Ram truckU.S.;salesmanaging widespread operations and the application of our heavy-and medium-duty truck enginesforeign labor regulations;its Freightliner division. While a significant amount of our sales to DaimlerChrysler are under long-term supply agreements, these agreements provide for the supply of DaimlerChrysler’s engine requirements for particular models and not a specific number of engines. Accordingly, the loss of DaimlerChrysler as a customer or a significant decline in the production levels for the vehicles in which DaimlerChrysler uses our products would have an adverse effect onoperate our business results of operations and financial condition.Our manufacturing operations are dependent upon third-party suppliers, making us vulnerable to supply shortages.We obtain materials and manufactured components from third-party suppliers. A significant number ofglobally, our suppliers representing 75 to 85 percent of our total raw material and component purchaserssuccess will depend, in 2006 are the sole source for a particular supply item, although the majority of these materials and components can be obtained from other suppliers. Any delay in our suppliers’ abilities to provide us with necessary materials and components may affect our capabilities at a number of our manufacturing locations, or may require us to seek alternative supply sources. Delays in obtaining supplies may result from a number offactors affecting our suppliers including capacity constraints, labor disputes, the impaired financial condition of a particular supplier, suppliers’ allocations to other purchasers, weather emergencies or acts of war or terrorism. Any delay in receiving supplies could impairpart, on our ability to deliver productsanticipate and effectively manage these and other related risks. There can be no assurance that the consequences of these and other factors relating to our customers and, accordingly, couldmultinational operations will not have a material adverse effect on ourupon us.results of operations and financial condition.We may be adversely impacted by work stoppages and other labor matters.As of December 31, 2006, we employed approximately 34,600 persons worldwide. Approximately 13,500 of our employees worldwide are represented by various unions under collective bargaining agreements with various unions that expire between 2007 and 2011. While we have no reasonis exposed to believe that we will be impacted by work stoppages and other labor matters, we cannot assure that future issues with our labor unions will be resolved favorably or that we will not encounter future strikes, further unionization efforts or other types of conflicts with labor unions or our employees. Any of these factors may have an adverse effect on us or may limit our flexibility in dealing with our workforce. In addition, many of our customers have unionized work forces. Work stoppages or slow-downs experienced by our customers could result in slow-downs or closures at vehicle assembly plants where our engines are installed. If one or more of our customers experience a material work stoppage, it could have a material adverse effect on our business, results of operations and financial condition.Our products involve risks of exposure to product liability claims.claims.products’products' failure to perform to specificationsspecification results, or is alleged to result, in property damage, bodily injury and/or death. We may experience material product liability losses in the future. While we maintain insurance coverage with respect to certain product liability claims, we may not be able to obtain such insurance on acceptable terms in the future, if at all, and any such insurance may not provide adequate coverage against product liability claims. In addition, product liability claims can be expensive to defend and can divert the attention of management and other personnel for significant periods of time, regardless of the ultimate outcome. An unsuccessful defense of a significant product liability claim could have a material adverse affect on our business, results of operations and financial condition and cash flows.effect upon us. In addition, even if we are successful in defending against a claim relating to our products, claims of this nature could cause our customers to lose confidence in our products and us.regulations.regulations. to air, discharges to water and the generation, handling, storage, transportation, treatment and disposal of waste materials. While we believe that we are in compliance in all material respects with these environmental laws and regulations, we cannot assurethere can be no assurance that we will not be adversely impacted by costs, liabilities or claims with respect to existing or subsequently acquired operations, under either present laws and regulations or those that may be adopted or imposed in the future. We are also subject to laws requiring the cleanup of contaminated property. If a release of hazardous substances occurs at or from any of our current or former properties or at a landfill or another location where we have disposed of hazardous materials, we may be held liable for the contamination and the amount of such liability could be material.are exposedrely on income from investees that we do not directly control.political, economic and other risks that arise from operating a multinational business.Approximately50 percent. We have 50 percent equity ownership interests in DCEC and CCEC. As a result, although a significant percentage of our net sales for 2006 were attributableincome is derived from these unconsolidated entities, we do not unilaterally control their management or operations, which put a substantial portion of our net income at risk from the actions or inactions of these other entities. A significant reduction in the level of contribution by these entities to customers outsideour net income would likely have a material adverse effect upon us.United States. Accordingly, ourworld with laws, rules and business is subject to the political, economic and other riskspractices that are inherent in operating in numerous countries. These risks include:· the difficulty of enforcing agreements and collecting receivables through foreign legal systems;· trade protection measures and import or export licensing requirements;· tax rates in certain foreign countries that exceeddiffer from those in the United StatesU.S. Although we strive to select joint venture partners who share our values and understand our reporting requirements as a U.S. domiciled company and to ensure that an appropriate business culture exists within these ventures to minimize and mitigate our risk, we nonetheless face the reputational and legal risk that our joint venture partners will violate applicable laws, rules and business practices.impositionamounts ultimately paid upon resolution of withholding requirementsthese or subsequent tax audits could be materially different from the amounts previously included in our income tax expense and, therefore, could have a material impact on foreign earnings;our tax provision.· Our effective tax rate in the impositionfuture could be adversely affected by changes to our operating structure, changes in the mix of tariffs, exchange controls or other restrictions;· difficultyearnings in staffingcountries with differing statutory tax rates, changes in the valuation of deferred tax assets and managing widespread operationsliabilities, changes in tax laws and the applicationdiscovery of foreign labor regulations;· required compliance with a varietynew information in the course of foreign laws and regulations; and· changesour tax return preparation process. In particular, the carrying value of deferred tax assets, which are predominantly in general economic and political conditions in countries where we operate, particularly in emerging markets.As we continue to expand our business globally, our success will depend, in part,the U.S., is dependent on our ability to anticipate and effectively manage these and other risks. We cannot assuregenerate future taxable income in the U.S.these and other factors will not have a material adverseif adopted, could adversely affect on our international operations or on our business as a whole.We are subject to currency exchange rate and other related risks.We conduct operations in many areas of the world involving transactions denominated in a variety of currencies. We are subject to currency exchange rate risk to the extenttax rate. The proposed changes that our costs are denominated in currencies other than those in which we earn revenues. In addition, since our financial statements are denominated in U.S. dollars, changes in currency exchange rates between the U.S. dollar and other currencies have had, and will continue tocould have an impact oninclude the deferral of certain U.S. income tax deductions and foreign tax credit reform. Although the scope of the proposed changes is unclear, it is possible that these or other changes in the U.S. tax laws could increase our earnings. While we customarily enter into financial transactions to address these risks, we cannot assure that currency exchangeeffective tax rate fluctuations will notand adversely affect our results of operations and financial condition.profitability. In addition, whileas a result of the useeconomic recession, many states are considering new tax legislation to raise revenues and reduce their spending deficits. Implementation of currency hedging instrumentsany of these new tax laws could adversely affect us.provide us with protection from adverse fluctuations in currency exchange rates,be adversely impacted by utilizing these instruments we potentially forego the benefits that might result from favorable fluctuations in currency exchange rates.We also face risks arising from the imposition of exchange controls and currency devaluations. Exchange controls may limit our ability to convert foreign currencies into U.S. dollars or to remit dividendswork stoppages and other paymentslabor matters.foreign subsidiarieslabor unions will be resolved favorably or businesses located inthat we will not encounter future strikes, work stoppages, or conducted within a country imposing controls. Currency devaluations result in a diminished valueother types of funds denominated in the currencyconflicts with labor unions or our employees. Any of the country instituting the devaluation. Actions of this nature, if they occur or continue for significant periods of time, couldthese consequences may have an adverse effect on us or may limit our resultsflexibility in dealing with our workforce. In addition, many of operations and financial conditionour customers have unionized work forces. Work stoppages or slow-downs experienced by our customers could result in any given period.slow-downs or closures at vehicle assembly plants where our engines are installed. If one or more of our customers experience a material work stoppage, it could have a material adverse effect on our operations.serve.serve.Any failure by us to compete effectively in the markets we serve could have a material adverse effect on our business, results of operations and financial condition. For a more complete“Business—Our Operating Segments.”"Operating Segments" in "Item 1 Business."None.Table of Contentsworldwideprincipal manufacturing facilities occupy approximately 16 million square feet, including approximately nine million square feet in the U.S. Principal manufacturing facilities in the U.S. include our plants in Southern Indiana, Wisconsin, New York, Iowa, South Carolina, Tennessee, Georgia, Ohio and Minnesota, as well as an engine manufacturing facility in North Carolina, which is operated in partnership with CNH Global N. V.Manufacturing facilities outside ofused by the U.S. include facilities locatedfollowing segments in the U.K., Brazil, India, Mexico, France, China, South Africa, Germany, Romania and Australia.following locations:SegmentU.S. Facilities Facilities Outside the U.S. Engine Indiana: Columbus, Seymour Belgium: Mechelen Tennessee: Memphis Brazil: Sao Paulo New York: Lakewood India: Pune North Carolina: Whitakers Mexico: San Luis Potosi United Kingdom (U.K.): Darlington, Daventry Singapore: Singapore SG
Power Generation
Indiana: Elkhart
Brazil: Sao PauloMinnesota: Fridley China: Wuxi, Wuhan Germany: Karlshuld, Ingolstadt India: Pune, Daman, Ahmendnagar, Ranjangaon Mexico: San Luis Potosi Romania: Craiova Singapore: Singapore SG U.K.: Margate, Manston, Stamford
Components
Indiana: Columbus
Iowa: Lake Mills
Ohio: Findlay
South Carolina: Ladson, Charleston
Tennessee: Cookeville
Texas: El Paso
Wisconsin: Janesville, Mineral Point, Arcadia, Black River Falls, Viroqua
Australia: Scoresby, Kilsyth
Brazil: Sao Paulo
China: Beijing, Hubei Sheng, Shangai, Wuxi
France: Quimper
India: Pune, Daman, Dewas, Pithampur
Japan: Tokyo
Mexico: Ciudad Juarez, San Luis Potosi
Singapore: Singapore SG
South Africa: Pretoria, Johannesburg
U.K.: Darlington, HuddersfieldFrance, China, India, Japan, Pakistan, South Korea, Turkey and Indonesia.U.S. Facilities Facilities Outside the U.S. Connecticut: Rocky Hill Australia: Scoresby Maryland: Baltimore Belgium: Mechelen New Jersey: Newark China: Beijing, Shanghai New York: Bronx Germany: Gross Gerau Pennsylvania: Bristol, Harrisburg India: Pune Japan: Tokyo Russia: Moscow Singapore: Singapore SG South Africa: Johannesburg U.K.: Wellingborough United Arab Emirates: Dubai
Headquarters and Other OfficesU.S. Facilities Facilities Outside the U.S. Indiana: Columbus, Indianapolis China: Beijing, Shanghai Tennessee: Franklin, Nashville India: Pune Washington DC U.K.: Staines, Stockton at any one time, partysubject to a number ofnumerous lawsuits or subject toand claims arising out of the ordinary course of our business, including actions related to product liability,liability; personal injury; the use and performance of our products; warranty matters; patent, trademark or other intellectual property infringement,infringement; contractual liability,liability; the conduct of our business; tax reporting in foreign jurisdictions; distributor termination; workplace safetysafety; and environmental matters. We also have been identified as a potentially responsible party at multiple waste disposal sites under U.S. federal and related state environmental statutes and regulations and may have joint and several liability for any investigation and remediation costs incurred with respect to such sites, as more fully described in Item 1 of this Form 10-K under "Environmental Compliance-Other Environmental Statutes and Regulations." We have denied liability with respect to many of these lawsuits, claims and cases, someproceedings and are vigorously defending such lawsuits, claims and proceedings. We carry various forms of which involve claims for substantial damages. Wecommercial, property and our subsidiaries are currently defendants in a number of pending legal actions, including actions related to use and performance of our products. While we carrycasualty, product liability insurance covering significant claims for damages involving personal injury and property damage, we cannot assure thatother forms of insurance; however, such insurance would fullymay not be applicable or adequate to cover the costs associated with a judgment against us with respect to these claims.lawsuits, claims and proceedings. We also establish reserves for mattersdo not believe that these lawsuits are material individually or in which losses are probable and can be reasonably estimated. Wethe aggregate. While we believe we have also been identified as a PRP at 17 waste disposal sites under federal and state environmental statutes, three of which we expect could result in monetary sanctions, exclusive of interest and costs, of $100,000 or more based upon our estimated proportional volume of waste disposed at these sites. These sites and our estimated exposure are as follows: the Operating Industries, Inc. Site in Monterey Park, CA ($211,000), the Casmalia Site in Santa Barbara, CA ($150,000) and the Double Eagle Refinery Site in Oklahoma City, OK ($100,000). In addition to these three sites, we have been contacted as a possible PRP at 14 other sites. At several of these sites, we have had no follow-up contact from the relevant regulatory agencies since an initial communication in the early to mid-1990s. We believe our liability at these 14 other sites would be de minimis absent the imposition of liabilities that otherwise would be the responsibility of other PRPs. More information with respect to our environmental exposure can be found under “Environmental Compliance-Other Environmental Statutes and Regulations.” We deny liability with respect to many of these legal actions and environmental proceedings and are vigorously defending such actions or proceedings. While we have established adequate accruals that we believe are adequate for our expected future liability with respect to our pending legal actionslawsuits, claims and proceedings, we cannot assure that our liability with respect towhere the nature and extent of any such actionliability can be reasonably estimated based upon then presently available information, there can be no assurance that the final resolution of any existing or proceeding wouldfuture lawsuits, claims or proceedings will not exceed our established accruals. Further, we cannot assure that litigation havinghave a material adverse affecteffect on our business, results of operations, financial condition or cash flows.not arisebe successful in the future.pursuing these claims.security holdersshareholders during the last quarter of the year ended December 31, 2006.2009.24Registrant’sRegistrant's Common Equity, Related Stockholder Matters and Issuer Purchases of Equity Securities“CMI.”"CMI." For information about the quoted market prices of our common stock, information regarding dividend payments and the number of common stock shareholders, see Selected"Selected Quarterly Financial Data on page 125 ofData" in this report.report. For other matters related to our common stock and shareholders’shareholders' equity, see Notes 16 and 19Note 15, "CUMMINS INC. SHAREHOLDERS' EQUITY," to theConsolidated Financial Statements.Statements.
Number of
Shares
Purchased
Price Paid
per Share
Shares Purchased
as Part of Publicly
Announced
Plans or Programs
Number of Shares
that May Yet Be
Purchased Under the
Plans or ProgramsIn July 2006, ISSUER PURCHASES OF EQUITY SECURITIES Period (a) Total
Number of
Shares
Purchased(1) (b) Average
Price Paid
per Share (c) Total Number of
Shares Purchased
as Part of Publicly
Announced
Plans or Programs (d) Maximum
Number of Shares
that May Yet Be
Purchased Under the
Plans or Programs(2) — $ — — 320,635 475,995 46.63 435,000 281,197 21,942 46.46 — 256,791 497,937 $ 46.62 435,000 gavein 2007 does not limit the number of shares that may be purchased and was excluded from this column. authorization to acquire upan additional $500 million of our common stock. This authorization does not have an expiration date. In 2008, we acquired $128 million followed by a further $20 million in 2009, leaving $352 million available for purchase under this authorization at December 31, 2009. We announced in February 2009 that we temporarily suspended our stock repurchase program to two million shares of Cummins common stockconserve cash. We lifted the suspension in additionOctober 2009 and will from time to what has been acquired under previous authorizations.time repurchase stock.2006,2009, we repurchased 47462,937 shares of common stock from employees in connection with the Key Employee Stock Investment Plan which allows certain employees, other than officers, to purchase shares of common stock on an installment basis up to an established credit limit. Loans are issued for five-year terms at a fixed interest rate established at the date of purchase and may be refinanced after its initial five-year period for an additional five-year period. Participants must hold shares for a minimum of six months from date of purchase and after shares are sold must wait six months before another share purchase may be made. We hold participants' shares as security for the loans and would, in effect, repurchase shares if the participant defaulted in repayment of the loan. There is no maximum amount of shares that we may purchase under this plan.According to our bylaws, we are not subject to the provisionsTable of the Indiana Control Share Act. However, we are governed by certain other laws of the State of Indiana applicable to transactions involving a potential change of control of the company.Contents“soliciting material”"soliciting material" or to be “filed”"filed" with the Securities and Exchange Commission, nor shall such information be incorporated by reference into any future filing under the Securities Act of 1933 or Securities Exchange Act of 1934, each as amended, except to the extent that the Companywe specifically incorporatesincorporate it by reference into such filing.Cummins Inc.’s Common Stockour common stock for the last five fiscal years with the cumulative total return on the S&P 500 Index and an index of peer companies selected by us. Our peer group included ArvinMeritor Inc., Caterpillar, Inc., Deere & Company, Eaton Corporation, Ingersoll-Rand Company Ltd., Navistar International Corporation and PACCAR Inc. We have a unique business and selected peers that we believe are the most closely aligned with our business. Each of the three measures of cumulative total return assumes reinvestment of dividends. The comparisons in this table are required by the SEC and are not intended to forecast or be indicative of possible future performance of our stock.COMPARECOMPARISON OF 5-YEAR CUMULATIVE TOTAL RETURN
AMONG CUMMINS, ENGINE CO., INC.,
S&P 500 INDEX AND CUSTOM PEER GROUP INDEX
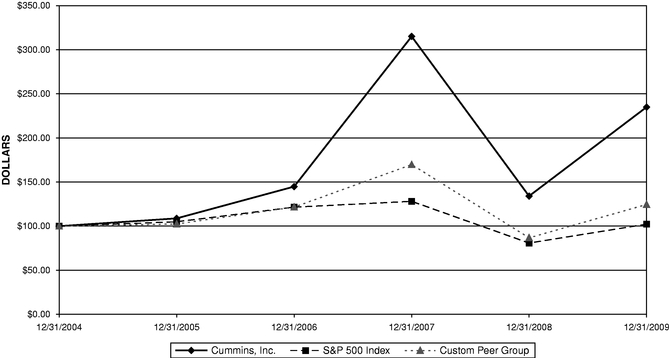
*ArvinMeritor Inc., Caterpillar, Inc., Dana Corporation, Deere & Company, Eaton Corporation, Ingersoll-Rand Company Ltd., Navistar International Corporation and Paccar Inc.
ASSUMES DIVIDEND REINVESTED
FISCAL YEAR ENDING DEC. 31, 2009year periodyears ended December 31, 2006,2009, was derived from ourConsolidated Financial Statements.Statements. This information should be read in conjunction with the ourConsolidated Financial Statements and related notes and Management’s"Management's Discussion and Analysis of Financial Condition and Results of Operations."In millions, except per share amounts 2009 2008 2007 2006 2005 $ 10,800 $ 14,342 $ 13,048 $ 11,362 $ 9,918
48
%
41
%
46
%
50
%
49
% 52 % 59 % 54 % 50 % 51 %
2,169
2,940
2,556
2,465
2,044 362 422 329 321 278 214 253 205 140 131 35 42 58 96 109 484 818 788 759 582 428 755 739 715 550 $ 2.17 $ 3.87 $ 3.72 $ 3.76 $ 3.11 2.16 3.84 3.70 3.55 2.75 0.70 0.60 0.43 0.33 0.30 $ 1,137 $ 987 $ 810 $ 840 $ 760 310 543 353 249 186 $ 930 $ 426 $ 577 $ 840 $ 779 8,816 8,519 8,195 7,465 6,885 637 629 555 647 1,213 4,020 3,480 3,702 3,056 2,089 Net earnings included$4gain of $12 million related to flood damage recoveries. For the year ended December 31, 2008, net income includes a $37 million restructuring charge, a $36 million decrease in cash surrender value in corporate owned life insurance and $5 million of tax chargelosses related to flood damage recoveries.cumulative effectimpact of a change intwo-for-one stock split on April 9, 2007 and an additional two-for-one stock split on January 2, 2008. principle related to the consolidation of a variable interest entity.(2) Net earnings included a $3 million, net of tax credit for the cumulative effect of a change in accounting principle related to moving the measurement date for defined benefit pension and other postretirement plans from September 30under accounting principles generally accepted in the United States of America (GAAP), which resulted in a $94 million non-cash charge to November 30.equity. In 2008, we recorded a $433 million non-cash charge to equity to reflect losses associated with the effect of market conditions on our pension plans. Management’s Management's Discussion and Analysis of Financial Condition and Results of OperationsCertain prior year amounts included in this section have been reclassified to conform to the current year presentation. All references to per share amounts are diluted per share amounts.Management’sManagement's Discussion and Analysis of Financial Condition and Results of Operations (“("MD&A”&A") was prepared to provide the reader with a view and perspective of our businesses through the eyes of management and should be read in conjunction with ourConsolidated Financial Statements and the accompanying notes to those financial statements. This overview summarizes theOur MD&A which includesis presented in the following sections:·Executive Summary and Financial Highlights—a brief discussion providing an overview of our Company, highlighting the significant events affecting our Company and a summary of our Company’s financial performance.·—an analysis of our consolidated results of operations for the three years presented in our Consolidated Financial Statements.· and Outlook—an analysis of the performance of each of our reportable operating segments for each of the three years presented in our Consolidated Financial Statements and an analysis of the business outlook for each of those segments for the upcoming year.·—an analysis of cash flows, sourcesuses of cash, off balance sheet arrangements and contractual obligations.·—a summary of our critical accounting estimates and our policies relating to the application of those estimates.·—a summary of newly adopted accounting pronouncements and their impact to our financial position, results of operations and cash flows.· �� Accounting Pronouncements Issued But Not Effective—A summary of recently issued accounting pronouncements which are not yet effective and we have not yet adopted.·Disclosure Regarding Forward-Looking Statements—cautionary information about forward-looking statements and a description of certain risks and uncertainties that could cause our actual results to differ materially from our historical results or our current expectations or projections.and emissions solutions,exhaust aftertreatment, fuel systems, controls and air handling systems. We sell our products to Original Equipment Manufacturersoriginal equipment manufacturers (OEMs), distributors and other customers worldwide. We have long-standing relationships with many of the leading manufacturers in the markets we serve, including DaimlerChryslerAG (DaimlerChrysler), PACCAR Inc., International Truck and Engine Corporation (Navistar International Corporation),Daimler Trucks North America, Chrysler Group, LLC, Volvo AB, CNH Global N.V., Tata Motors Ltd., Ford Volkswagen, Dongfeng Motor Company, Komatsu, MAN Nutzfahrzeuge AG (formerly Volkswagen) and Scania AB.Case New Holland. We serve our customers through a network of more than 550500 company-owned and independent distributor locations and approximately 5,0005,200 dealer locations in more than 160190 countries and territories.serves. This type of reporting structureserves and allows management to focus its efforts on providing enhanced service to a wide range of customers. The Engine segment produces engines and parts for sale to customers in on-highway and various industrial markets. The engines are used in trucks of all sizes, busesRVs,recreational vehicles, as well as various industrial applications including construction, mining, agriculture, marine, oil and gas, rail and military. The Power Generation segment is an integrated provider of power systems sellingwhich sells engines, generator sets and alternators and providing rental of power equipment for both standby and prime power uses.alternators. The Components segment includes sales ofsells filtration products, exhaust and aftertreatment systems, turbochargers and fuel systems. The Distribution segment includes wholly-owned and partially-owned distributorships engaged in wholesaling engines, generator sets and service parts, as well as performing service and repair activities on our products and maintaining relationships with various OEMs throughout the world.levels.levels and our customers' access to credit. Our sales may also be impacted by OEM inventory levels and production schedules and work stoppages also impact our sales.stoppages. Economic downturns in the markets we servereducedreductions in sales and pricing of our products. As a worldwide business, our operations are also affected by political, economic and regulatory matters, including environmental and emissions standards, in the countries we serve. At the same time, our geographic diversity and broad product and service offerings have helped limit the impact from a drop in demand in any one industry or customer and the economy of any single country on our consolidated results.affectthey operate. All of our profitsoperating segments incurred double digit declines in net sales and cash flow.three business units incurred a decrease in EBIT ranging from 44 percent to 56 percent. Our joint ventures throughout the world also experienced severe downturns in operating results causing income from equity investees to decline 15 percent. We experienced significant decreases in market demand for many of our products. The challenging worldwide economy impacted all of our business units in different ways. Our Power Generation and Distribution businesses, which have longer lead times, began to see declines in 2009 while our other businesses started to experience declines in the second half of 2008, especially in the fourth quarter. Demand in most of our markets around the world appears to have reached bottom and we believe those markets have stabilized at these lower levels. We are also subjectseeing improvements in emerging markets including China, India and Brazil. The economy in the United States (U.S.), while showing some signs of recovery, still remains fragile and unemployment continues to substantial government regulationremain high. In the second half of 2009, we experienced increased sales in our global engine markets and in North America, we experienced a temporary increase in engine (and related component) demand prior to the 2010 emissions standard change. The increased demand was consistent with sales trends we observed in prior emissions implementations and was the primary reason for sales to U.S. markets increasing to 48 percent of total net sales in 2009, compared with 41 percent of total net sales in 2008. Throughout the year, we took actions to align our businesses with reduced customer demand, particularly in the first nine months of 2009. These actions included global workforce reductions and closing certain manufacturing operations. Costs associated with these restructuring actions, in conjunction with significantly reduced demand and volumes, negatively impacted our operating results in 2009 compared to 2008 and 2007 results. At the same time, we took actions which requiresenabled us to make significant investmentsend the year with a stronger balance sheet. We closely monitored our receivables and customer relationships, reduced inventories 25 percent, reduced capital expenditures 43 percent and increased our cash and marketable securities by over $0.6 billion, generating over $1.1 billion in cash from operations. At the same time, we lowered our debt to capital ratio, maintained our credit ratings, improved our pension funding through increased contributions and research that also impactsstrong returns and our profits and cash flow.$1.1 billion line of credit remains unused.We continued our strong performances As a result of the past two years into 2006temporary increase in sales in the second half of 2009, and the challenging economy, we expect new Environmental Protection Agency (EPA) emission compliant engine and component demand will be weak in the first half of 2010. Excluding the emerging markets, we expect overall demand in most of our businesses to remain at relatively low levels for the first half of 2010.third straight yearsolid profit;record net sales and net earnings.Contentsearnings were $715income attributable to Cummins Inc. was $428 million, or $14.21$2.16 per diluted share, on sales of $11.4$10.8 billion, compared to 20052008 net earningsincome attributable to Cummins Inc. of $550$755 million, or $11.01$3.84 per diluted share, on sales of $9.9$14.3 billion. The earnings improvementdecrease in income was driven by a 1525 percent increasedecrease in net sales and a 1926 percent increasedecrease in gross margin, as we continue to benefit from improved economic conditions resulting in high levels ofwere impacted by lower demand across our businesses, as well as increased share in a number of markets and our focus on cost reduction. Allmost of our businesses. Focused cost reduction efforts helped mitigate the impact of lower volumes. Restructuring and other charges in 2009 were $99 million ($65 million after-tax, or $0.33 per diluted share). For a detailed discussion of restructuring see Note 3, "RESTRUCTURING AND OTHER CHARGES," to ourConsolidated Financial Statements. Favorable/(Unfavorable) Years ended December 31, 2009 vs. 2008 2008 vs. 2007 In millions, except per share amounts 2009 2008 2007 Amount Percent Amount Percent $ 10,800 $ 14,342 $ 13,048 $ (3,542 ) (25 )% $ 1,294 10 % 8,631 11,402 10,492 2,771 24 % (910 ) (9 )% 2,169 2,940 2,556 (771 ) (26 )% 384 15 % 1,239 1,450 1,296 211 15 % (154 ) (12 )% 362 422 329 60 14 % (93 ) (28 )% 214 253 205 (39 ) (15 )% 48 23 % 99 37 — (62 ) NM (37 ) NM (1 ) (12 ) 22 11 92 % (34 ) NM 682 1,272 1,158 (590 ) (46 )% 114 10 % 8 18 36 (10 ) (56 )% (18 ) (50 )% 35 42 58 7 17 % 16 28 % (15 ) (70 ) 33 55 79 % (103 ) NM 640 1,178 1,169 (538 ) (46 )% 9 1 % 156 360 381 204 57 % 21 6 % 484 818 788 (334 ) (41 )% 30 4 % 56 63 49 7 11 % (14 ) (29 )% $ 428 $ 755 $ 739 $ (327 ) (43 )% $ 16 2 % $ 2.16 $ 3.84 $ 3.70 $ (1.68 ) (44 )% $ 0.14 4 % 20.1 % 20.5 % 19.6 % (0.4 )% 0.9 % 11.5 % 10.1 % 9.9 % (1.4 )% (0.2 )% 3.4 % 2.9 % 2.5 % (0.5 )% (0.4 )% reportedprimarily due to lower demand as a result of the global economic downturn. The primary drivers were:increases for the year compareddeclined by 27 percent primarily due to a year ago, with particularly strong demand in the heavy-duty truck market and the Power Generation commercial market, whereindustrial sales increased 17decreasing by 40 percent and 27 percent, respectively. Overall, our Engine segment neton-highway sales were up $854 million, or 13decreasing by 16 percent. In addition, net sales increased at our (up $417 million, or 21 percent), sales declined by 31 percent due to declines in all lines of business led by the commercial products line of business.(up $281 million, or 14 percent)sales declined by 25 percent due to declines in all lines of business led by the filtration and turbochargers businesses.(up $194 million, or 16 percent) year-over-year.sales declined by 18 percent.During 2006, we continued our commitment to building a strong balance sheet, investing in profitable growth around the globe and returning value to our shareholders. SomeSignificant drivers of the transactions and events that highlight this arechange in gross margins were as follows:In millions 2009 vs. 2008
Increase (Decrease) $ (1,228 ) 252 132 46 13 8 6 $ (771 ) · In January 2006, we signed Gross margin decreased by $771 million, and as a joint venture agreement with KAMAZ Inc., the largest vehicle manufacturer in Russia, to produce B Series engines under the name ZAO Cummins Kama.percentage of sales decreased by 0.4 percentage points. The joint venture will build on the Cummins and KAMAZ relationship that dates back to the early 1980s. Among the customersdecrease was led by lower volumes which were partially offset by increased engine purchases ahead of the new company are KAMAZ for trucksJanuary 1, 2010, emissions standards change, improved pricing and buses, as well asother manufacturersdecreased production costs. The overall decrease in Russia, Belarus andvolumes was due to lower sales resulting from the Ukraine that produce trucks, buses and agricultural equipment.· After announcing a feasibility studyglobal economic downturn. Our warranty provision on sales in the spring, we signed an agreement in October 2006 with Beiqi Foton Motor Company (Beiqi Foton)2009 was 3.3 percent compared to form a 50/50 joint venture, Beijing Foton Cummins Engine Company (BFCEC), to produce two families of Cummins light-duty, high performance diesel engines in Beijing. The engines will be used in light-duty commercial trucks, pickup trucks, multipurpose and sport utility vehicles. Certain types of marine, small construction equipment and industrial applications will also be served by this engine family. Cummins and Beiqi Foton will initially invest a combined $126 million into BFCEC, which is scheduled to begin production2.9 percent in 2008. The parties are awaiting approval of the joint venture by the Chinese government.· In July 2006, we announced that we had reached agreement with a major automotive manufacturer serving the North American market to produce and market a light-duty, diesel-powered engine. In October 2006, we announced that we would use an existing facility for production of this new engine platform and that DaimlerChrysler was our significant customer. As a part of the agreement, we will develop and manufacture a family of high-performance, light-duty diesel engines for a variety of on-highway applications in vehicles below 8,500 pounds gross vehicle weight, including standard pickup trucks, like the Dodge Ram 1500, and sport utility vehicles, as well as industrial applications. The first vehicles with this engine are expected to be ready for market by the end of the decade.· In August 2006, our first technical center in China was opened in Wuhan City. The East Asia Technical Center, a 55/45 consolidated joint venture between Cummins and Dongfeng Cummins Engine Company Limited (DCEC), will provide engineering and technical development services for the full range of Cummins products built in China, including diesel and natural gas engines, power generators, turbochargers and filtration products. A series of projects has already started in the technical center, including the development of a new 13-liter engine platform for the heavy-duty truck market served by DCEC.· On September 22, 2006, we announced that we had reached an agreement to sell our SEG GmbH subsidiary (SEG) based in Kempen, Germany to Woodward Governor Company. The sale closedOur 2008 warranty expense included $117 million recorded in the fourth quarter for approximately $35 million and resulted in a pre-tax gain of approximately $9 million. SEG, which is a part of our Power Generation segment, specializesassociated with increases in the design and manufacturing of measurement, control and protectionestimated warranty liability primarily for certain mid-range engine products launched in 2007. The accrual rates in 2009 for power generation systems with an emphasis on the wind power generation segment. Total assets of SEGthese related engine products were approximately $42 million at the date of the transaction and $39 million at December 31, 2005, which is lesshigher than 1those recorded in 2008 before this change in estimate. As such, our warranty as a percent of our total assets at those dates. Total sales of SEG were approximately $51 million and $72 million, for the ten months ended October 31, 2006 and for the year ended December 31, 2005, respectively, which is less than 1 percent of our total net sales for these engine families is higher on products sold in 2009 than it was in 2008. Overall, our relative product mix also impacted the rate as a percent of sales when comparing these two periods.Financing Matters A more detailed discussion of margin by segment is presented in the "OPERATING SEGMENT RESULTS" section.·Selling, General and Administrative Expenses On May 8, 2006,Board25 percent decrease in net sales.Directors approved our planengineering projects to redeem allconserve cash while focusing on the development of critical technologies and new products and increased reimbursements from third parties for engineering projects. Overall, research, development and engineering expenses as a percentage of sales increased to 3.4 percent in 2009 from 2.9 percent in 2008, primarily due to the 25 percent decrease in net sales. Increase/(Decrease) In millions 2009 vs. 2008 $ (22 ) (13 ) 7% convertible quarterly income preferred securities that were issued in June 2001. On May 9, 2006, we gave the trustee our formal irrevocable notification of our intent to redeem the preferred securities. As a result, substantially allglobal economic conditions. The effects of the related $300 million of 7% convertible subordinated debentures outstandingglobal economic downturn were converted into shares of our common stock.partially offset by modest increases in some markets.·Other Operating (Expense) Income, Net During the second quarter of 2006, we completed our previously announced $100 million share repurchase program. In July 2006, the Board of Directors authorized us to acquire up to two million shares of Cummins common stock in addition to what has been acquired under previousauthorizations. During Years ended
December 31, In millions 2009 2008 $ 12 $ (5 ) 8 12 (7 ) (10 ) (7 ) (13 ) (8 ) 5 1 (1 ) $ (1 ) $ (12 ) we purchased 500,000 shares for approximately $59 million. In addition, the Board also votedof 2009 which more than offset flood related expenses recognized in July to increase the quarterly cash dividend per share by 20 percent to $0.36 per share.2008 and 2009.· Our level of debt at December 31, 2006, has Interest income decreased by $556 million since December 31, 2005 and our debt-to-capital ratio has improved to 22.4 percent at December 31, 2006, from 42.3 percent at December 31, 2005. As previously announced, we repaid our $250 million 9.5% notes in December 2006, the first call date for the debt. The notes were issued in 2002 and were repaid using cash generated from operations. We incurred additional costs of approximately $12 million associated with the early extinguishment of this debt, which is recorded in “Other (income) expenses” in our Consolidated Statements of Earnings.· During 2006 we made contributions of approximately $266 million to our pension plans. As of the end of 2006, our global pension funding was approximately 88.5 percent of our obligation.2006 vs. 2005Net SalesNet sales increased in all segments. Engine sales were up $854 million, or 13 percent, due to strong demand from heavy and medium-duty truck OEMs, higher engine volumes for industrial applications and increased shipments of light-duty engines. Engine and part sales to on-highway markets were 12 percent higher compared to last year with increased volumes in most market segments. Power Generation sales increased $417 million, or 21 percent, due to increased demand across all product lines. Components sales increased $281 million, or 14 percent, due to increased sales within all of our Components businesses. Distribution sales increased $194 million, or 16 percent, primarily due to increased demand for power generation products followed by increased parts, service and engine volumes. See our “Operating Segment Results” section for further details on sales by segment.Gross MarginGross margin improved primarily due to increased sales, the related absorption benefits on fixed manufacturing costs, and changeslower interest rates in sales mix, all of which increased gross margin by $395 million. In addition, $94 million in price realization, net of increased product costs, improved gross margin in the current year2009 compared to the prior year. These increases in margin were partially offset by increased warranty expenses of $53 million, primarily as a result of the increased volumes as well as increased spending of $43 million for new product introductions and ramp-up.2008.Warranty expense as a percent of sales increased slightly to 2.8 percent in 2006 compared to 2.7 percent in 2005.Selling and Administrative ExpensesSelling and administrative expenses increased primarily due to incremental staffing and higher compensation and related expenses of approximately $64 million, which included salaries, variable compensation and fringe benefits, as a result of our improved financial performance. Other factors affecting selling and administrative expenses included increased consulting fees and other outside services of $33 million, increased marketing and administrative expenses of $18 million and increased travel expenses of $16 million. The remaining change in selling and administrative expenses is due to a combination of increases in various other miscellaneous expenses, none of which were significant individually, partially offset by a favorable foreign currency impact. Overall selling and administrative expenses were 11.3 percent of sales in 2006 compared to 11.5 percent of sales in 2005.Research and Engineering ExpensesResearch and engineering expenses increased primarily due to increased compensation expense and consulting and outside services, as well as higher spending on development programs for future products. We had significant research and engineering expenses across the Engine and Components segments related to new product development for 2007 and beyond as well as research and engineering expenses for growth platforms across geographies. The Engine segment accounted for $24 million of the increase in research and engineering expenses along with an increase in the Components segment of $12 million. Fluctuations in other miscellaneous research and development expenses were not significant individually or in the aggregate.Investee Equity, Royalty and Other IncomeInvestee equity, royalty and other income increased slightly primarily due to an increase in earnings at several of our equity investees, led by an $18 million increase in earnings from our North American distributors, a $6 million increase in earnings from Tata Cummins Ltd. and a $3 million increase in earnings from CCEC. These increases were partially offset, by a $17 million decrease in earnings from Dongfeng Cummins Engine Company, Ltd. (DCEC), as a result of weakness in the medium-duty truck market, due to the continuous tonnage upgrade of China’s truck industry.Other Operating Expenses, NetThe major components of other operating expense are royalty income, amortization of intangible assets and gain or loss on sale of fixed assets. The 2006 results include a $9 million gain on the sale of SEG and a legal settlement of approximately $3 million. In addition, royalty income decreased by approximately $4 million in 2006. Fluctuations in other miscellaneous operating expenses and income, none of which were material, resulted in an additional $2 million of other operating expense.Interest IncomeInterest income increased primarily due to higher average cash balances in 2006 compared to 2005. The higher average cash balances are due to increased earnings and stronger cash flows from operations in 2006.lower debt balances in 2006declining short-term interest rates.compared to 2005. follows: Years ended December 31, In millions 2009 2008 $ (20 ) $ (46 ) (14 ) (12 ) (4 ) (36 ) 5 6 18 18 $ (15 ) $ (70 ) conversion of our $300 million 7% convertible subordinated debentures during the second quarter resulted in a reduction in interest expense of over $10 million for 2006.Other (Income) Expenses, NetThe major components of other (income) expense include foreign currency exchange gainslosses in 2009 and losses, bank charges and other miscellaneous income and expenses. The fluctuation in other income in 2006 compared to 2005 is2008 were due to a fluctuationunfavorable currency fluctuations, especially with the British Pound and the Brazilian Real in foreign currency exchange gains2009 and losses from a loss of approximately $6 millionthe British Pound, the Euro, the Australian Dollar and the Indian Rupee in 2005 to a gain of approximately $11 million in 2006. Partially offsetting the fluctuation in foreign currency gains and losses was a $12 million loss on the early extinguishment of debt incurred when we repaid our $250 million 9.5% notes in December 2006. In addition, there were several fluctuations2008.componentscash surrender value of miscellaneous othercorporate owned life insurance was due to market deterioration, especially in the fourth quarter of 2008, which included the write down of certain investments to zero. and expenses, none of which were individually significant.Provision for Income TaxesOur tax rates are generally less than the 35 percent U.S. income tax rate primarily because of lower taxes on foreign earnings export tax benefits and research tax credits.20062009 was 29.9 percent.24.4 percent compared to 30.6 percent for 2008. The decrease is due to tax on foreign earnings, which are subject to lower tax rates, and an increase in research tax credits. Our 2009 income tax provision for 2006 was impacted byalso includes a $12$29 million or $0.23 per share, increase in the first quarter for the effect of new Indiana tax legislation, and a $28 million, or $0.55 per share, reduction in the second quarter due to the favorable resolution of tax uncertainties related to prior years and by a $10 million, or $0.20 per share,(4.5 percent) reduction in the fourth quarter duerelated to the retroactive reinstatementadjustments to deferred tax accounts. We released $19 million (3.0 percent) of deferred tax liabilities on foreign earnings, now considered to be permanently reinvested outside the U.S. researchand recorded a deferred tax credit. Our effective tax rate for 2005 was 27.1 percent. Our 2005 provision was reduced by $16asset of $10 million for the tax benefits of foreign dividend distributions which qualified for a special 85 percent deduction under The American Jobs Creation Act of 2004 and by $8 million due(1.5 percent) related to the favorable resolution in the fourth quarter of 2005 of prior year tax positions which had been in dispute.period matters.20072010 effective tax rate to be 3332 percent excluding any discrete items that may arise. The Jobs Act phases outresearch tax credit expired December 31, 2009 and has not yet been renewed by Congress. If the exportresearch credit is extended, we would anticipate the 2010 effective tax benefits (reduced 20 percent for 2005, 40 percent for 2006 and repealed thereafter) that have been a key factorrate to drop to 30 percent.low tax rate. Export benefits are replaced withconsolidated entities. Noncontrolling interests decreased primarily due to lower income of $8 million at Cummins India Limited, a new U.S. manufacturer’s tax deduction which began phasingpublicly traded company at various exchanges in startingIndia, as a result of the decline in 2005. However, we do not expectdemand due to the manufacturer’s deductionglobal economic downturn. There were no other individual fluctuations in the subsidiaries that were significant.produce a comparable level of benefits.Cummins Inc. and Diluted Earnings Per Share Attributable to Cummins Inc.Minority Interests in Earnings of Consolidated SubsidiariesMinority interest is primarily Net income attributable to Cummins India Ltd. (CIL),Inc. and diluted earnings per share attributable to Cummins Inc. decreased primarily due to significantly lower volumes, restructuring and other charges and decreased equity income partially offset by a 51 percent owned subsidiary, Cummins Eastern Canada LLP (CEC), a 51 percent owned subsidiary, and Wuxi Holset Engineering Co. Ltd. (Wuxi), a 55 percent owned subsidiary. These three subsidiaries account for over 90 percentlower effective tax rate.total minority interestmarkets we serve have slowed significantly as a result of the credit crisis and the challenging global economic environment; however, demand in 2006. Earningsmost of our markets appears to have reached bottom and we are seeing signs that markets have stabilized at these three subsidiarieslevels. We are also seeing improvement in emerging markets including China, India and Brazil. Consistent with prior emissions standards implementation, the North American on-highway markets experienced increased this year resulting in a combined increase in minority interest of $7 million for 2006 compared to 2005. In addition, earnings at SEG GmbH & Co. KG, a 51 percent owned subsidiarydemand prior to its salethe implementation of the EPA's 2010 emissions standards. Based on our prior experience we expect EPA 2010 engine and component sales to on-highway OEM customers to be very weak in the fourth quarterfirst half of 2006, improved resulting2010. In most of our other markets we expect demand to remain stable with current levels for the first half of 2010, while we expect emerging markets to have sales comparable to 2008 levels.$3 million year-over-year increase in minority interests. The remainderresult of the consolidated partially-owned subsidiaries had a combination of immaterial increasescurrent economic conditions and decreasesmarket dynamics surrounding the EPA 2010 emissions standards change, we are confident that opportunities for long-term growth and profitability will continue in earnings.the future.3320052008 vs. 20042007
interestswith the primary driver being a $1,233 million, or 23 percent, increase in Engine sales due to strongthe following drivers.from heavy-especially internationally.OEMs, higherand bus markets.volumes for industrialmarkets increased, particularly the international construction and stationary power applicationscommercial marine markets.shipmentsdemand.light-duty engines. Enginesales by segment is presented in the "OPERATING SEGMENT RESULTS" section.In millions 2008 vs. 2007
Increase (Decrease) $ 402 227 47 47 (179 ) (173 ) 13 $ 384 part sales to on-highway markets were 20 percent higher compared to 2004 with increased volumes in all market segments. Power Generationas a percentage of sales increased $157 million, or 9 percent, due toby 0.9 percentage points. Benefits from increased demand for commercial generator sets, generator drives,pricing and alternators,a more favorable volume/mix of products sold were partially offset by a moderate decreasehigher material costs reflecting the increase in rental revenuecommodity prices during the year and a slight decreasehigher warranty expense. Our warranty expense reflected favorable warranty experience for some engine products and our provision related to sales in 2008 was 2.9 percent of sales, to the consumer market. Components sales increased $217 million, or 12down from 3.1 percent primarily reflecting increased demand from first-fit OEMs and the aftermarket channel. Distribution sales increased $218 million, or 22 percent, primarily due to increased demand for engines and power generation products internationally and sales growth from distributor acquisitions. See our “Operating Segment Results and Outlook” section for further details on sales by segment.Gross MarginGross margin improved primarily due to increased sales, the related absorption benefits on fixed manufacturing costs, and changes in sales mix, all of which increased gross margin by $453 million. In addition, pricing actions of $145 million in 2005 enabled us to2007. This result was more than offset by negative trends primarily in certain mid-range engine products launched in 2007 for which we recorded additional warranty liability of approximately $117 million in the increased material costsfourth quarter of steel and other commodities2008.$130 million. Other factors which impacted gross margin to a lesser extent were slightly increased warranty costs,by segment is presented in the favorable impact of currency exchange rates and other miscellaneous cost reductions. As a result of the foregoing, gross margin percentage increased to 22.0 percent in 2005 from 19.9 percent in 2004."OPERATING SEGMENT RESULTS" section.Warranty expense as a percent of sales decreased slightly to 2.7 percent in 2005 compared to 3.1 percent in 2004.higherincreased consulting expenses of $36 million, increased compensation and related expenses of approximately $72$34 million whichand the acquisition of a majority ownership interest in three previously independent North American distributors. Increased headcount and compensation and related expenses included salaries, variable compensation and fringe benefits across the business in support of higher volumes and business growth. Overall, selling, general and administrative expenses as a resultpercentage of our improved financial performance. In addition, incremental staffing addedsales increased to the10.1 percent in 2008 from 9.9 percent in 2007.ShippingCompensation and handling costs increased by approximately $11 million due to increased sales volumes. Other factors increasing sellingrelated expenses include salaries, variable compensation and administrative expenses to a lesser extent included marketing and administrative expenses, consulting fees andfringe benefits. Fluctuations in other outside services, which combined for $23 million of the increase. Overall selling and administrative expenses were 11.5 percent of sales in 2005 compared to 12.0 percent of sales in 2004.Research and Engineering ExpensesResearch and engineering expenses increased primarily due to increased compensation expense and consulting and outside services, as well as higher spending on prototype development programs for future products. The Engine segment accounted for $38 million of the increase in research and engineering expenses along with a slight increase in the Components segment, offset by a slight decrease in the Power Generation segment. Other miscellaneous research and development expenses increased as well, however they were not significant individually or in the aggregate. Overall, research, development and engineering expenses as a percentage of sales increased to 2.9 percent in 2008 from 2.5 percent in 2007.Investee Equity, Royalty and OtherInterest Income from InvesteesInvestee equity, Equity, royalty and otherinterest income increasedfrom investees decreased primarily due to improved earningsthe following: Increase/(Decrease) In millions 2008 vs. 2007 $ 17 14 9 8 2 (6 ) (8 ) of $8 million and improved earnings from CCEC of $7 million. These increases were partially offset by decreased earnings from DCEC of $7 million due to reduced demand in China’s truck market in response to regulatory changes.Other Operating Expenses, NetThe major components of other operating expenses are royalty income, amortization of intangible assets and loss on sale of fixed assets. The fluctuation from 2004 to 2005 was primarily due to a decrease in the loss on sale of fixed assets.Interest IncomeInterest income increased primarily due to higher average cash balancesincome from a joint venture which we formed in 2005 comparedthe fourth quarter of 2007. DCEC sales increased largely due to 2004. Theprebuy activity in the first half of 2008 prior to a mid-year emissions change. CCEC increased cash balances areprimarily due to increased earnings and stronger cash flows from operations in 2005.Interest ExpenseInterest expensesales volumes. TCL experienced decreased slightlysales volumes for the year while MerCruiser profits declined due to a combination of factors. Interest expense on debt in 2005 was lower due to the repayment of long-term debtsignificant deterioration in the first quarter. The lower interest expense on debtrecreational marine market and increased research, development and engineering expenses.partially offset by increased interest expense on capital leases related to power generation equipment due to the conversion of operating leases to capital leases in late 2004.as follows:Other Expenses, Net Years ended
December 31, In millions 2008 2007 $ 12 $ 7 5 22 (5 ) — (10 ) (4 ) (13 ) (1 ) (1 ) (2 ) $ (12 ) $ 22 major components of other expense include foreign currency exchange gains and losses, bank charges and other miscellaneous expenses. The increase in other expense in 2005 compared to 2004 is primarily due to an increase in foreign currency exchange losses and a decrease in the gain on sale of marketable securities. These increases to other expense were partially offset by write-downs of investments in 2004 that did not recur in 2005.Provision for Income TaxesThe higher 2005 tax provision of 27.1 percent reflects the increase in earnings before taxes. Our 2005 provisionfixed assets was reduced by $16 million for the tax benefits of foreign dividend distributions which qualified for a special 85 percent deduction under The American Jobs Creation Act of 2004 and by $8 millionprimarily due to the favorable resolution$10 million gain on the sale of Universal Silencer in 2007. Years ended
December 31, In millions 2008 2007 $ (36 ) $ — (12 ) (12 ) (46 ) 28 6 5 18 12 $ (70 ) $ 33 20052008, which included the write down of prior yearcertain investments to zero.positions which had been in dispute. Excluding these unusual or nonrecurring benefits, our 2005 effective tax rate was 30.1 percent. This rate was lowerrates are generally less than the 35 percent U.S. income tax rate primarily because of U.S. export tax benefits and research tax credits along with lower taxes on foreign earnings especiallyand research tax credits. Our effective tax rate for 2008 was 30.6 percent compared to 32.6 percent for 2007. The decrease is primarily due to greater foreign joint venture equity earnings recorded netin 2008, which are subject to lower tax rates. Our 2008 income tax provision also included a $10 million (0.8 percent) reduction in the fourth quarter due to the legislative reinstatement of foreign taxes.the U.S. research tax credit.MinorityNoncontrolling Interests in Earnings of Consolidated SubsidiariesThe increase in minority Noncontrolling interests was primarilyeliminate the income or loss attributable to non-Cummins ownership interests in our consolidated entities. Noncontrolling interests increased primarily due to higher earningsincome of $10 million at Cummins Eastern Canada LLP, a 51 percent-owned subsidiary and Cummins India Limited, a 51 percent-owned subsidiary.publicly traded company at various exchanges in India, due to the creation of a new export business in 2008 and favorable price adjustments for high horsepower products. There were no other individual fluctuations in the subsidiaries that were significant.two subsidiaries accountincreases were partially offset by warranty expense, restructuring charges and investment losses primarily occurring during the fourth quarter of 2008, in addition to unfavorable foreign currency effects.
RESTRUCTURING AND OTHER CHARGESover seventycompletion of the plan. Estimates of restructuring were made based on information available at the time charges were recorded. Due to the inherent uncertainty involved, actual amounts paid for such activities may differ from amounts initially recorded and we may need to revise previous estimates.In millions Year ended
December 31, 2009 $ 81 7 2 (5 ) 85 14 $ 99 total minority interestsavings from the restructuring actions will be realized in 2005.cost of sales, 45 percent in selling, general and administrative expenses and 15 percent in research, development and engineering expenses. We expect the accrual to be paid in cash which will be funded with cash generated from operations.remainderfollowing table summarizes the balance of accrued restructuring charges by expense type and the changes in the accrued amounts for the applicable periods. The restructuring related accruals were recorded in "Other accrued expenses" in ourConsolidated Balance Sheets.In millions Severance
Costs Exit
Activities Other Total $ 81 $ 7 $ 2 $ 90 (70 ) (1 ) — (71 ) — (5 ) (2 ) (7 ) (2 ) — — (2 ) 1 — — 1 $ 10 $ 1 $ — $ 11 In millions Year ended
December 31, 2009 $ 47 12 35 5 $ 99 increase in minority interests was attributable to a combinationplan. Estimates of immaterial increases and decreases in earningsrestructuring were made based on information available at the remaining consolidated subsidiaries.time charges were recorded. Due to the inherent uncertainty involved, actual amounts paid for such activities may differ from amounts initially recorded and we may need to revise previous estimates.In millions Severance Costs $ 37 (3 ) 34 (31 ) (3 ) $ — In millions $ 17 3 15 2 $ 37
OPERATING SEGMENT RESULTS AND OUTLOOKserves. This type of reporting structureserves and allows management to focus its efforts on providing enhanced service to a wide range of customers. The Engine segment produces engines and parts for sale to customers in on-highway and various industrial markets. The engines are used in trucks of all sizes, buses and RVs, as well as various industrial applications including construction, mining, agriculture, marine, oil and gas, rail and military. The Power Generation segment is an integrated provider of power systems sellingwhich sells engines, generator sets and alternators and providing rental of power equipment for both standby and prime power uses.alternators. The Components segment includes sales of filtration products, exhaust and aftertreatment systems, turbochargers and fuel systems. The Distribution segment includes wholly-owned and partially-owned distributorships engaged in wholesaling engines, generator sets, and service parts, as well as performing service and repair activities on our products and maintaining relationships with various OEMs.minoritynoncontrolling interests) as a primary basis for the chief operating decision-maker to evaluate the performance of each of our operating segments. Segment amounts exclude certain expenses not specifically identifiable to segments.the ourConsolidated Financial Statements. We prepared the financial results of our operating segments on aGAAP.accounting principles generally accepted in the United States of America (GAAP). These include certain costs and expenses of shared services, such as information technology, human resources, legal and finance. We also do not allocate debt-related items, actuarial gains or losses, prior service costs or credits, minimum pension liabilitiesrestructuring and other charges, investment gains or losses, flood damage gains or losses, or income taxes to individual segments. Segment EBIT may not be consistent with measures used by other companies.A summary of operating results by segment for the years ended December 31, is shown below:
Generation
items(1)(1) Includes intercompany eliminations and unallocated corporate expenses.The tables below reconcile the segment information to the corresponding amounts in the Consolidated
Engine Segment ResultsStatements:We made certain leadership changes effective May 2, 2005, within our management team. In connection with these changes, certain modifications were made to our internal reporting. These modifications are summarized below:· The Filtration and Other segment was renamed the Components segment and now includes operating results of the fuel systems business which were previously included in the Engine segment. Historically, the fuel systems business transferred product within the Engine segment at cost. Beginning in the third quarter of 2005, those transfers now use a cost-plus based transfer price. As a result of this change, segment EBIT increased for the Components segment and decreaseddata for the Engine segment but there was no impact to consolidated earnings. Revenues of the Components segment were also increased to reflect transfers to the Engine segment and eliminations were increased by a corresponding amount.· The North American distribution business was combined with the International Distribution segment and renamed the Distribution segment. Previously, the North American distribution business was reported in the Engine and Power Generation segments as equity from investees and included the results of a partially-owned distributor that is consolidated. As a result, revenues of the Engine segment were increased to reflect sales to the consolidated distributor that were previously eliminated and decreased for the revenues of the consolidated distributor which are now includedfollows: Favorable/(Unfavorable) Years ended
December 31, 2009 vs. 2008 2008 vs. 2007 In millions 2009 2008 2007 Amount Percent Amount Percent $ 5,582 $ 7,432 $ 7,129 $ (1,850 ) (25 )% $ 303 4 % 823 1,378 1,053 (555 ) (40 )% 325 31 % 6,405 8,810 8,182 (2,405 ) (27 )% 628 8 % 185 180 176 (5 ) (3 )% (4 ) (2 )% 241 286 222 45 16 % (64 ) (29 )% 54 99 92 (45 ) (45 )% 7 8 % 3 10 26 (7 ) (70 )% (16 ) (62 )% 252 535 589 (283 ) (53 )% (54 ) (9 )%
3.9
%
6.1
%
7.2
% in the Distribution segment. In addition, this change also caused earnings from equity investees in the Engine and Power Generation segments to decrease while earnings from equity investees in the Distribution segment increased by a corresponding amount.Due to the extent of intersegment sales activity and certain seasonality in inventory levels during the year, we have presented the elimination of intersegment profit in inventory resulting from intersegment transactions in the non-segment items column of our segment reporting (see Note 21 to the Consolidated Financial Statements). This presentation better aligns segment revenues with segment costs and presents segment EBIT as if each segment was an independent, stand-alone entity.The impact of the above changes on operating results and net assets by segment for 2004 is shown in the table below:
Generation
items(1)(1) Includes intercompany eliminations and unallocated expenses.2006 vs. 2005The net sales, investee income and segment EBIT for Engine were as follows (dollars in millions):
percentage of net salesThe increase in net sales for this segment was primarily due to strong demand across most markets, particularly the North American heavy-duty truck market and stationary power due to the strong performance of our Power Generation segment, along with strong industrial market sales. Total on-highway-related sales were 63 percent of Engine segment net sales during 2006 and 2005.The improvement in segment EBIT was primarily due to the higher engine volumes across all major markets, the accompanying gross margin benefits of higher absorption of fixed manufacturing costs, improved pricing and manufacturing efficiencies, all of which resulted in a nearly one percentage point improvement in gross margin percentage in 2006 compared to last year. Gross margin increased $221 million, or 18 percent, in 2006 compared to last year. Selling and administrative expenses increased $61 million, or 11 percent, however selling and administrative expenses as a percentage of net sales decreased slightly. Research and engineering expenses increased $24 million, or 12 percent, compared to 2005 and remained flat as a percentage of net sales compared to last year.In addition, earnings from joint ventures decreased $13 million compared with 2005, primarily due to a $17 million decrease in earnings at DCEC as a result of weakness in the medium-duty truck market, due to the continuous tonnage upgrade of China’s truck industry.follows (dollars in millions):follows: Favorable/(Unfavorable) Years ended December 31, 2009 vs. 2008 2008 vs. 2007 In millions 2009 2008 2007 Amount Percent Amount Percent $ 1,996 $ 2,308 $ 1,948 $ (312 ) (14 )% $ 360 18 % 1,232 1,550 1,284 (318 ) (21 )% 266 21 % 688 804 1,340 (116 ) (14 )% (536 ) (40 )% 3,916 4,662 4,572 (746 ) (16 )% 90 2 % 1,821 3,029 2,676 (1,208 ) (40 )% 353 13 % 668 1,119 934 (451 ) (40 )% 185 20 % $ 6,405 $ 8,810 $ 8,182 $ (2,405 ) (27 )% $ 628 8 %
December 31, Favorable/(Unfavorable) Years ended December 31, 2009 vs. 2008 2008 vs. 2007 2009 2008 2007 Amount Percent Amount Percent 269,200 418,300 486,800 (149,100 ) (36 )% (68,500 ) (14 )% 85,900 108,300 91,400 (22,400 ) (21 )% 16,900 18 % 13,400 20,600 18,500 (7,200 ) (35 )% 2,100 11 % 368,500 547,200 596,700 (178,700 ) (33 )% (49,500 ) (8 )% Heavy-Duty TruckNet Salesincreasefollowing are the primary drivers by market. Year ended December 31,
2009 vs. 2008
Favorable/(Unfavorable) Change In millions Amount Percent Percentage point
change as a
percent of sales $ (330 ) (24 )% 0.6 % 57 9 % (1.7 )% 45 16 % (0.6 )% (45 ) (45 )% NM drivendue to lower engine volumes in most markets as a result of the global economic downturn, which was partially offset by increased sales in the U.S. in the fourth quarter of 2009 ahead of the January 1, 2010, emissions standards change, price improvements and by cost reduction activities at our manufacturing plants. Equity, royalty and interest income from investees decreased due to significantly lower demand at DCEC, Komatsu-Cummins Engine Company (KCEC) and Cummins MerCruiser Diesel Marine LLC. The decrease in selling, general and administrative expenses and research, development and engineering expenses was primarily due to lower discretionary spending, higher recovery of engineering expenses from third parties and decreased payroll costs as the result of restructuring actions.market as OEMs workmarkets, increased Mexican heavy-duty truck sales in the first six months of 2008 resulting from the pre-buy activity ahead of Mexico's July 1, 2008, new emissions requirements and weaker demand in the first six months of 2007 resulting from the 2006 pre-buy to meet growing demand from truck fleets replacingreplace trucks ahead of the 2007 changeemissions standards change.emissions standards. Global unit shipments of heavy-dutycommercial marine and construction markets.engines were up 17 percentsales increased due to increased demand in 2006 comparedglobal medium-duty truck markets, primarily due to 2005, withour market share increases in the North American shipments up 18 percent and international shipments up 11 percent.Medium-Duty Truck and BusThe increase in medium-duty truck and bus revenues was duemarket, weaker demand in the first six months of 2007 resulting from the 2006 pre-buy to strong demandreplace trucks ahead of the 2007 change in emission standards and our growing market share position with North American OEMs in the medium duty truck and bus markets. Shipments of medium-duty truck engines were up 36 percent to North American OEMs and down 20 percent to international OEMs compared with 2005. Shipments to North American bus OEMs increased 56 percent in 2006 compared to 2005 while international shipments were down 10 percent. The increase in medium-duty truck and bus engine shipments in North America is due to our increased penetration in this market and an overall increase in demand ahead of the emission standard changes. The decrease in shipments to international medium-duty truck OEMs is primarily due to changes in emissions standards change and strong demand in Brazil to Euro III effective January 1, 2006. The decrease in international bus engine shipments year-over-year is due to a large purchase made in 2005 by a customer in China.39Light-Duty Automotive and RVSales of light-duty automotive engines increased as a result of higher volumes. Total light-duty automotive unit shipments were approximately 196,000 in 2006, an increase of 5 percent compared to 2005. The majority of the light-duty automotive and RV volumes was driven by demand from DaimlerChrysler with shipments of approximately 162,000 units, or a 1 percent increase compared to 2005. Engine shipments to recreational vehicle OEMs increased by nearly 33 percent in 2006 compared with 2005 due to new product introductions and growing penetration at key OEMs.IndustrialTotal sales were up in most industrial markets, primarily due to strong demand. Unit shipments increased 18 percent in 2006 compared to 2005. Approximately 52 percent of the shipments were to North American markets and 48 percent to international markets in 2006 compared to 56 percent and 44 percent, respectively, in 2005. The overall change in the geographic sales mix is due to the continued strength of the international construction market which is beingLatin America driven by strong demandeconomic conditions in the Middle East and Asia. Total shipments to the construction marketBrazil in 2008.20 percent largely because international shipments increased 31 percent. Other markets showing significant increases in shipments were the mining market and the oil and gas market with increases of 10 percent and 39 percent, respectively. The mining market demand is up as the strength in commodity prices has been driving investment in mining capacity. The shipments to the oil and gas market have increased as sustained oil and natural gas prices continue to drive activity and investments in new equipment. In addition, we continue to penetrate this market further with the release of more engine platforms to this application. Other industrial markets had modest increases in shipments compared to 2005.Stationary PowerThe increase in sales to stationary power markets is due to the increased netprimarily from intersegment sales to our Power Generation segment. These netsegment, especially internationally.are eliminated in our Consolidated Statements of Earnings. See the Power Generation Results and Outlook for a discussion of the increase in net sales.2005 vs. 2004The net sales, investee income and segment EBIT for Engine were as follows (dollars in millions):
December 31,The increase in net sales for this segment was primarilyincreased due to strong demand across all market sectors, particularly the light-duty automotive market with record engine sales to DaimlerChrysler, and the North American heavy-duty and medium-duty truck markets. Total on-highway-related engine sales were 63 percent of Engine segment net sales in 2005, compared with 65 percent in 2004.The improvement in segment EBIT was primarily due to the higher engine volumes across all major markets, the accompanying gross margin benefits of higher absorption of fixed manufacturing costs, pricing and favorable foreign exchange impacts, all of which resulted in a two percentage point improvement in gross margin percentage over 2004. Gross margin increased $344 million, or 38 percent, over 2004. Selling and administrative expenses increased $63 million, or 13 percent, over 2004, however selling andadministrative expenses as a percentage of net sales improved almost a full percentage point. Research and engineering expenses increased $38 million, or 24 percent, compared to 2004 and remained flat as a percentage of net sales compared to the prior period.In addition, earnings from joint ventures remained flat compared with 2004, due to higher earnings from several joint ventures, which were offset by a $7 million decrease in earnings at DCEC in reaction to changes in the regulatory environment.A summary and discussion of Engine net sales by market follows (dollars in millions):
December 31,A summary of unit shipments by engine classification (including unit shipments to Power Generation) follows:
December 31,Heavy-Duty TruckThe increase in sales to the heavy-duty truck market was primarily driven by the recoveryshare gains in the North American truck market as OEMs increased build ratesbus market.meet the growing demand from truck fleets replacing aging equipment and adding capacity. Unit shipments of heavy-duty truck engines were up 27 percent in 2005, compared to 2004, with North American shipments up 26 percent and international shipments up 33 percent.Medium-Duty Truck and BusThe increase in medium-duty truck and bus revenues isChrysler. This decline was due to increased shipments of medium-duty truck and bus enginesthe deteriorating demand for light duty trucks in North America as the result of the softening U.S. economy and internationally. Shipments of medium-duty truck engines were up 24 percent to North American OEMs and up 12 percent to international OEMs compared with 2004. The increase in medium-duty truck engine shipments was driven primarily by economic growth as demand in this market typically correlates with demandconcerns over fuel prices earlier in the heavy-duty market. Salesyear.bus engines and parts increasedContents20052008, compared to 2004 due to strong demand from North American OEMs with shipments up 53 percent and international shipments up 48 percent. International shipments were up due to strong demand in Asia and Latin America, slightly offset by lower volumes in Europe.Light-Duty AutomotiveSales of light-duty automotive engines increased as a result of higher volumes. Total unit shipments were 187,000 in 2005, an increase of 4 percent compared to 2004. Most of the increase in light-duty automotive sales was driven by continued demand from DaimlerChrysler with record shipments of 160,000 units, or a 4 percent increase compared to 2004. Engine shipments to RV OEMs remained flat in 2005 compared with 2004.IndustrialTotal sales were up in most industrial markets, primarily due to strong demand as the capital goods sector of the economy expanded. Unit shipments increased 24 percent year-over-year reflecting a slight change in sales mix to higher-priced engines. Approximately 56 percent of the shipments were to North American markets and 44 percent to international markets compared to 52 percent and 48 percent, respectively, in 2004. Both the construction and agricultural markets had increased sales of approximately 28 percent in 2005 over 2004, while sales for the mining and marine markets increased 34 percent and 43 percent, respectively, during the same time period. These markets make up over 90 percent of the total industrial market. The increased sales in these markets were seen both in North American and international markets with the exception of a slight decrease in sales to the international agriculture market.Stationary PowerThe increase in sales to stationary power markets is due to the increased net sales to our Power Generation segment. These net sales are eliminated in our Consolidated Statements of Earnings. See the Power Generation Results and Outlook for a discussion of the increase in net sales.Outlook for 2007Net sales for this segment are expected to be flat in 2007 with increased shipments in the off-highway and medium-duty truck and bus markets offsetting the decrease in the North American heavy-duty truck market. While North American heavy-duty class 8 truck sales will likely be down 30 to 40 percent in 2007, our year-over-year North American heavy-duty truck engine volumes could be down as much as 50 percent depending on the amount of 2006 engine inventory currently at the truck OEMs. The decline will be most severe in the first half of 2007, with industry shipments expected to improve in the second half of 2007. As a result, we expect our market share to drop in the first quarter, due to OEM’s carrying over more competitor 2006 engines to manage their vehicle model transition, and quickly recover in the second half of the year to 2006 levels or higher as we believe our new products will quickly gain widespread acceptance versus competitive engine technologies.We expect the Brazilian medium-duty truck market to remain flat in 2007, while our European medium-duty truck engine shipments will benefit from our new supply relationship with Nissan. These markets, together with significant market share gains in North America, are forecasted to drive global medium-duty truck and bus shipments up approximately 25 percent in 2007.We expect shipments to the global light-duty automotive and RV markets to increase nearly 5 percent in 2007 through new product offerings and increased availability of our product at key OEMs.Segment EBITAlthough some commodity prices have retreated at the end of 2006 from their historical highs, we expect to see sustained demand in 2007 for our engines in the oil and gas and mining equipment markets. Growth in these markets will be paced by our incremental 15 percent capacity expansion planned in our high-horsepower plants during the year. Global construction shipments are expected to show modest growth in 2007 with increased availability at OEMs in North America, India and Japan. We expectearnings for this segment to be the lowest in the first quarter in 2007 with expected improvements throughout the year as we increase operational efficiencies related to new product introduction. New product pricing is expected to be largely offset by new product cost. We anticipate full year EBIT margins will be slightly below or equal to the bottom end of the targeted range of 7 to 10 percent of sales.Power Generation Results and Outlook2006 vs. 2005The net sales, investee income and Engine segment EBIT for Power Generation were as follows (dollars in millions):
December 31,The increase in net sales in this segment wasdecreased primarily due to increased volumes as a result of strong demand in the commercial generator setresearch, development and alternator lines of businessengineering and improved pricing. Our commercial and alternator businesses are up in nearly all markets. Our consumer, power electronics, energy solutions and rental markets also saw modest increases. Partially offsetting the increased sales in these lines of business was the absence of sales from SEG as the business was sold in the fourth quarter.The improvement in segment EBIT was largely attributable to strong commercial generator set and alternator sales across geographic markets, except China, as well as improved mix and price realization. While material costs, particularly copper, have increased year-over-year, we have been able to more than absorb these costs through improved pricing. Gross margin improved $91 million, or 27 percent, in 2006 compared to 2005. Gross margin percentage improved nearly one percentage point compared to 2005. Sellingselling, general and administrative expenses increased $28 million, or 14 percent, over 2005, however selling and administrative expenses as a percentage of net sales improved by one half of a percentage point in 2006, compared to 2005. Research and engineering expenses increased $7 million, or 33 percent during 2006, compared to 2005 and as a percentage of net sales increased slightly compared to 2005.A summary of engine shipments used in power generation equipment by engine category follows:
December 31,2005 vs. 2004The net sales, investee income and segment EBIT for Power Generation were as follows (dollars in millions):
December 31,The increase in net sales in this segment was primarily due to increased volumes as a result of strong demand in the commercial generator set (genset) markets and alternator markets. Pricing actions also contributed to the increase in net sales.The improvement in segment EBIT was largely attributable to strong commercial generator set sales across all geographic markets, except China, and the related benefits of fixed cost absorption as well as price realization and cost reduction actions. These benefitswhich were partially offset by increased costs of materials, primarily copper. Gross margin improved $67 million, or 25 percent, over 2004. Gross margin percentage improved over two percentage points compared to the prior period. Selling and administrative expenses decreased $3 million, or 2 percent, over 2004 and selling and administrative expenses as a percentage of net sales improved one percentage point compared to the prior period. Research and engineering expenses decreased $8 million, or 28 percent, compared to 2004 and research and engineering expenses as a percentage of net sales improved by 0.5 of a percentage point compared to the prior period.A summary of engine shipments usedgross margin. Changes in power generation equipment by engine category follows:
December 31,Outlook for 2007We expect net sales to grow 10 to 12 percent in 2007, excluding the absence of net sales due to the disposal of SEG in 2006. We expect net sales of commercial generator sets and alternator equipment to continue to be robust in North America, the U.K., the Middle East, Eastern and Western Europe and India. Consumer sales are projected to increase as we ramp up production of portable gensets, introduce auxiliary power units for commercial trucks and expect greater penetration in the towable segment of the RV market. Price realization on new products, global sourcing initiatives and manufacturing efficiency gains are anticipated to produce steady improvement in margins throughout 2007. Earnings for this segment are expected to remain near or at the top end of its targeted range of 7 to 9 percent of sales.44Components Results and Outlook2006 vs. 2005The net sales, investee income andEngine segment EBIT for Components were as follows (dollars in millions):
December 31,Components net sales increased across all businesses and all geographic markets, but were primarily driven by strong demand in our turbocharger and fuel systems businesses. We had strong growth in North America and Europe with increases in both aftermarket volume and OEM volume.Segment EBIT improved during 2006 compared to 2005, primarily due to improved volume. In addition, EBIT as a percentage of net sales were as follows: Year ended December 31,
2008 vs. 2007
Favorable/(Unfavorable) Change In millions Amount Percent Percentage point
change as a
percent of sales $ 73 6 % (0.3 )% (30 ) (5 )% (0.1 )% (64 ) (29 )% (0.5 )% slightly. Gross marginspending on emissions related programs. The increased $56 million, or 17 percent, in 2006 compared to 2005, and gross margin percentage improved nearly one half of a percentage point compared to 2005, primarily due to improved volume and improved pricing. Sellingselling, general and administrative expenses increased $23 million, or 12 percent, compared to 2005, but decreased slightly as a percentage of net sales. Research and engineering expenses increased due to additional investment in the development of a number of new products and critical technologies that will be launched in 2007 and beyond. Research and engineering expenses increased $12 million, or 21 percent, compared to 2005 and increased slightly as a percentage of net sales.2005 vs. 2004The net sales, investee income and segment EBIT for Components were as follows (dollars in millions):
December 31,Components net sales increased across all geographic markets primarily due to strong demand in the U.S., Latin America, and Asia. Sales of our turbochargers increased due to higher aftermarket sales to OEMs, partially offset by lower demand in China.Segment EBIT improved slightly, compared with 2004, primarily due to improved volume, however EBIT as a percentage of net sales declined slightly due to a lower gross margin percentage resulting from higher steel prices used in exhaust products and manufacturing filters as well as production inefficiencies driven by capacity constraints. Gross margin increased $33 million, or 11 percent, over 2004, however gross margin percentage decreased slightly. In addition, higher selling and administrative expenses and increases in research and engineering expenses contributed to the reduction in segment EBIT as a percentage of net sales. Selling and administrative expenses increased $18 million, or 10 percent, over 2004, but remainedrelatively flat year-over-year as a percentage of net sales. Research and engineering expenses increased due to the development of a number of new products that were launched in 2006 and beyond. Research and engineering expenses increased $6 million, or 12 percent, compared to 2004 and remained flat year-over-year as a percentage of net sales.Outlook for 2007Net sales for this segment are forecasted to grow approximately 18 to 22 percent in 2007, primarily due to growth in our emission solutions and turbocharger businesses. The manufacturing improvements that we began to implement in the second half of 2006 are expected to correct operational issues in the emission solutions business in 2007. The material cost and operational issues in the turbocharger business are expected to yield a slower margin improvement as they ramp up new products. We expect to see sequential improvement in earnings from this segment after the first quarter and to achieve the lower end of the targeted range of 7 to 9 percent of net sales by the end of 2007.Distribution Results and Outlook2006 vs. 2005The net sales, investee income and segment EBIT for Distribution were as follows (dollars in millions):
December 31,Distribution net sales increased primarily due to strong overall demand in the Middle East, Europe and the South Pacific. The higher net sales were led by increases in power generation volume followed by parts, service and engine volume. The Middle East is the primary driver for the higher power generation volume accounting for over half of the increase. Parts and service and engine volumes were up throughout several geographic markets, most notably Europe, East Asia, and the Middle East.Segment EBIT increasedwas primarily due to higher payroll costs as the result of salary increases and an increase in the number of segment employees during the year. The increase in gross margins resulting from greater sales ofmargin was primarily due to price improvements, especially in industrial engines and parts, and power generation equipment. Gross marginfavorable product mix in 2006 improved $38 million, or 14 percent, over 2005, however gross margin percentage decreased slightly due to an unfavorable shift in mix from parts to engines and gensets.the on-highway market. The increase in gross margin was partially offset by increased warranty expense from the increased mix of newer emissions-driven products and higher repair costs on certain engines and increased material prices due to higher commodity prices during the year.
Power Generation Segment Results Favorable/(Unfavorable) Years ended December 31, 2009 vs. 2008 2008 vs. 2007 In millions 2009 2008 2007 Amount Percent Amount Percent $ 1,879 $ 2,601 $ 2,375 $ (722 ) (28 )% $ 226 10 % 538 899 685 (361 ) (40 )% 214 31 % 2,417 3,500 3,060 (1,083 ) (31 )% 440 14 % 49 41 42 (8 ) (20 )% 1 2 % 33 41 34 8 20 % (7 ) (21 )% 22 23 17 (1 ) (4 )% 6 35 % 3 3 6 — — % (3 ) (50 )% 167 376 334 (209 ) (56 )% 42 13 %
6.9
%
10.7
%
10.9
% Favorable/(Unfavorable) Years ended December 31, 2009 vs. 2008 2008 vs. 2007 In millions 2009 2008 2007 Amount Percent Amount Percent $ 1,456 $ 2,116 $ 1,761 $ (660 ) (31 )% $ 355 20 % 512 686 623 (174 ) (25 )% 63 10 % 177 328 219 (151 ) (46 )% 109 50 % 140 238 349 (98 ) (41 )% (111 ) (32 )% 132 132 108 — — % 24 22 % $ 2,417 $ 3,500 $ 3,060 $ (1,083 ) (31 )% $ 440 14 % Favorable/(Unfavorable) Years ended December 31, 2009 vs. 2008 2008 vs. 2007 2009 2008 2007 Amount Percent Amount Percent 23,700 33,400 31,700 (9,700 ) (29 )% 1,700 5 % 4,800 8,400 8,000 (3,600 ) (43 )% 400 5 % 8,000 11,500 10,500 (3,500 ) (30 )% 1,000 10 % 36,500 53,300 50,200 (16,800 ) (32 )% 3,100 6 % SellingChanges in Power Generation segment EBIT and administrative expenses increased $26 million, or 12 percent; however selling and administrative expenses decreased by over one half of a percentage pointEBIT as a percentage of net sales were as follows: Year ended December 31,
2009 vs. 2008
Favorable/(Unfavorable) Change In millions Amount Percent Percentage point
change as a
percent of sales $ (258 ) (39 )% (2.3 )% 57 21 % (1.2 )% 8 20 % (0.2 )% (1 ) (4 )% NM the same period.gross margin was primarily due to lower volumes, unfavorable sales mix and increased material and commodity costs which were partially offset by improved pricing and favorable foreign currency translation. The decrease in selling, general and administrative and research, development and engineering expenses was primarily due to favorable foreign currency translation, lower variable compensation costs, implementation of severance programs and decreased discretionary spending.Also contributing2008 vs. 2007increasefollowing drivers. year-over-year was a $20 million increase in investee equity earnings primarily attributable to an $18 million increase in earnings at our North American distributors.2005 vs. 2004The net sales, investee income and segment EBIT for Distribution were as follows (dollars in millions):
December 31,Distribution net sales increased primarily due to stronghigher gross margin partially offset by increases in selling, general and administrative and research, development and engineering expenses. Changes in Power Generation segment EBIT and EBIT as a percentage of sales were as follows: Year ended December 31,
2008 vs. 2007
Favorable/(Unfavorable) Change In millions Amount Percent Percentage point
change as a
percent of sales $ 83 15 % — % (20 ) (8 )% 0.5 % (7 ) (21 )% (0.1 )% Favorable/(Unfavorable) Years ended December 31, 2009 vs. 2008 2008 vs. 2007 In millions 2009 2008 2007 Amount Percent Amount Percent $ 1,562 $ 2,154 $ 2,007 $ (592 ) (27 )% $ 147 7 % 793 998 925 (205 ) (21 )% 73 8 % 2,355 3,152 2,932 (797 ) (25 )% 220 8 % 73 65 59 (8 ) (12 )% (6 ) (10 )% 88 95 73 7 7 % (22 ) (30 )% 13 14 4 (1 ) (7 )% 10 NM 1 3 3 (2 ) (67 )% — — % 95 169 153 (74 ) (44 )% 16 10 %
4.0
%
5.4
%
5.2
% Favorable/(Unfavorable) Years ended December 31, 2009 vs. 2008 2008 vs. 2007 In millions 2009 2008 2007 Amount Percent Amount Percent $ 851 $ 1,194 $ 1,215 $ (343 ) (29 )% $ (21 ) (2 )% 704 979 860 (275 ) (28 )% 119 14 % 495 553 448 (58 ) (10 )% 105 23 % 305 426 409 (121 ) (28 )% 17 4 % $ 2,355 $ 3,152 $ 2,932 $ (797 ) (25 )% $ 220 8 % Latin America, the South Pacific,and North America.the Middle East, whereEurope.at our Dubai distributorshipdecreased due to falling OEM demand across Europe and North America. These decreases were up 65 percent year-over-year, partially offset by the transfer of a portion of the filtration business into emissions solutions in 2009. Year ended December 31,
2009 vs. 2008
Favorable/(Unfavorable) Change In millions Amount Percent Percentage point
change as a
percent of sales $ (138 ) (28 )% (0.6 )% 43 19 % (0.6 )% 7 7 % (0.7 )% East Asia. In addition, netChina.favorably impactedpartially offset by foreign exchange rates.the sale of Universal Silencer and the discontinuance of a product line in 2007, which contributed a combined $75 million in sales in the year ended December 31, 2007.resulting fromwhich were partially offset by increased sales of engines, partsresearch, development and service, and power generation equipment,engineering expenses, as well as pricing actionsincreased selling,favorable exchange rates. Gross margin improved $69 million, or 33 percent, over 2004, while gross marginadministration expenses. Changes in Components segment EBIT and EBIT as a percentage increased almost two percentage points.of sales were as follows: Year ended December 31,
2008 vs. 2007
Favorable/(Unfavorable) Change In millions Amount Percent Percentage point
change as a
percent of sales $ 69 17 % 1.2 % (21 ) (10 )% (0.2 )% (22 ) (30 )% (0.5 )% higherincreased warranty expense. The increase in selling, general and administrative expenses was primarily due to higher payroll costs and increases in the number of segment employees. The increased research, development and engineering spending was focused on developing new products to meet future emissions standards for both developed and emerging markets. Favorable/(Unfavorable) Years ended December 31, 2009 vs. 2008 2008 vs. 2007 In millions 2009 2008 2007 Amount Percent Amount Percent $ 1,777 $ 2,155 $ 1,537 $ (378 ) (18 )% $ 618 40 % 7 9 3 (2 ) (22 )% 6 NM 1,784 2,164 1,540 (380 ) (18 )% 624 41 % 17 25 11 8 32 % (14 ) NM 125 117 92 8 7 % 25 27 % 1 2 1 (1 ) (50 )% 1 100 % 235 242 187 (7 ) (3 )% 55 29 %
13.2
%
11.2
%
12.1
%
2.0 percentage points
(0.9) percentage points Favorable/(Unfavorable) Years ended December 31, 2009 vs. 2008 2008 vs. 2007 In millions 2009 2008 2007 Amount Percent Amount Percent $ 755 $ 812 $ 673 $ (57 ) (7 )% $ 139 21 % 692 1,022 816 (330 ) (32 )% 206 25 % 278 260 — 18 7 % 260 NM 59 70 51 (11 ) (16 )% 19 37 % $ 1,784 $ 2,164 $ 1,540 $ (380 ) (18 )% $ 624 41 % new branch openingswith only partial-year 2008 income, sales were down $309 million, or 14 percent. Decreased sales were led by decreased sales volumes primarily in Power Generation and dealer development support. SellingEngines.increased $52 million, or 32 percent, and increased just over one percentage pointhigher equity, royalty and interest income from investees. Changes in Distribution segment EBIT and EBIT as a percentage of net sales were as follows: Year ended December 31,
2009 vs. 2008
Favorable/(Unfavorable) Change In millions Amount Percent Percentage point
change as a
percent of sales $ (86 ) (18 )% (0.2 )% (94 ) (20 )% (0.7 )% 54 16 % (0.3 )% 8 7 % NM same period.global economic downturn and unfavorable foreign currency translation. Selling, general and administrative expenses decreased primarily due to favorable foreign currency translation, lower sales volumes and decreased discretionary spending.Also contributingAcquisition of a business Year ended December 31,
2008 vs. 2007
Favorable/(Unfavorable) Change In millions Amount Percent Percentage point
change as a
percent of sales $ 145 45 % 0.7 % 88 27 % (1.9 )% (78 ) (31 )% 1.2 % 25 27 % NM segment EBIT year-over-year was a $9 millionsales volumes for power generation, parts and engines followed by service. These increases in gross margin were partially offset by unfavorable currency translation. The increase in investee equity earnings. This isselling, general and administrative expenses was primarily attributabledue to higher payroll costs as the result of 2008 salary increases and an $8 million increase in earnings at our North American distributors.Outlook for 2007We will no longer consolidate onethe number of oursegment employees including increased costs related to the acquisition of three new distributors and the North American joint ventures, beginning in 2007. See Note 2venture.
Reconciliation of Segment EBIT to the Consolidated Financial Statements regarding this joint venture. In addition, an independent distributor in Iraq will marketIncome Before Income Taxessales of power generation equipment in that country rather than through our company-owned distributor in Dubai. Excluding these changessegment information to the reportingcorresponding amounts in theConsolidated Statements of segment revenue, we expect net salesIncome: Years ended December 31, In millions 2009 2008 2007 $ 749 $ 1,322 $ 1,263 (74 ) (102 ) (36 ) $ 675 $ 1,220 $ 1,227 35 42 58 $ 640 $ 1,178 $ 1,169 increase between 7flood damage recoveries. For the year ended December 31, 2008, unallocated corporate expenses include $37 million of restructuring charges, a $36 million decrease in cash surrender value in corporate owned life insurance and 10 percent$5 million of losses related to flood damage recoveries. There were no significant unallocated corporate expenses in 2007. While we are adding two distributors in Europe early in 2007,
LIQUIDITY AND CAPITAL RESOURCESmajority of this growth will be organic from existing distributors. Non-residential construction spending outside of the U.S. is expected to continue to drive our revenue growth in power generation and the off-highway engine markets. We also announced the formation of joint ventures in Thailand and Nigeria and expect to finalize new joint ventures in Colombia, South America and the Carolinas heredifficult environment in the U.S. earlyand global economies. Our strong financial performance, particularly in 2007. Earnings for this segment are forecastedthe fourth quarter of 2009, enabled us to remain abovefinish the top endyear with minimal debt and sizable cash and marketable securities balances. This cash performance was driven primarily by improved inventory management, controls on capital and discretionary spending and lower repurchases of its targeted rangecommon stock.8our ability to 10 percent of sales.Salesgenerate adequate cash to international markets were 50 percent of total net sales in 2006, compared with 51 percent of total net sales in 2005fund our operating, investing and 48 percent of total net sales in 2004.A summary of net sales (dollar amount and percentage of total) by geographic territory follows (dollars in millions):LIQUIDITY AND CAPITAL RESOURCESthe primaryour principal source of funding our working capital requirements. At certain times, cash provided by operations is subject to seasonal fluctuations, and as a result, we may use periodic borrowings, primarily our revolving credit facility and our accounts receivable sales program, to fund our working capital requirements.liquidity. As of December 31, 2006, there were no amounts outstanding under our revolving credit facility or our receivable sales program.Cash and cash equivalents increased $61 million during 2006 to $840 million at the end2009, other sources of the year compared to $779 million at the beginning of the year. Cash and cash equivalents were higher in 2006 as a result of an increase in cash provided by operations generated primarily by higher net earnings. We have focused much of our efforts on improving our balance sheet through debt reduction and increasing our liquidity. We believe our net debt position is a strong indicator of how much progress we have made in these areas. This measure is not defined under U.S. GAAP and may not be computed the same as similarly titled measures used by other companies. Our net debt position is as follows:At December 31, 2006, we believe our liquidity with include:$840$930 million,$95$190 million, $542 million $200 $123facilities (seefacilities.table below under Available Credit Capacity) providesintermediate term. Required annual principal payments range from $17 million to $67 million over each of the next five years.satisfy future short-term funding requirements forfund working capital, debt service obligations, capital expenditures, projected pension funding,obligations, dividend payments, common stock repurchases dividend payments and expansiondebt service obligations.emerging markets.The Jobs Act provided forassessing the adequacy of our liquidity and capital resources and are monitoring the impact on our customers and suppliers. We have noticed an impact as reflected in our days sales in receivables, but have not seen a temporary 85-percent dividends received deductionsignificant impact on certain foreign earnings repatriated during a one-year period. The deduction resultedour results of operations, financial position or cash flows in an approximate 5.25% federal tax2009. We expect that general market conditions could impact the rate on the repatriated earnings. We repatriated $71 million under the Jobs Act in 2005. Foreign earnings repatriated under the Jobs Act increased liquidityat which we realize our receivables in the United States,future and could impact eligible receivables under our accounts receivable program, however, we expect to generate positive cash flow from operations in 2010. We will continue to diligently monitor our receivables for potential slowing in collections that could occur as a result of continued difficult economic conditions and our customer's access to credit. The overall decline in market valuations negatively impacted the current value of our pension trusts in 2008; however, pension assets produced strong positive returns in 2009.corresponding reduction of liquidity in our foreign subsidiaries.Our total debt was $811 million as of December 31, 2006, compared with $1,367 million at December 31, 2005. Total debt as a percent of our total capital, including total long-term debt, was 22.4 percent at December 31, 2006, comparedprompt repayment, to 42.3 percent at December 31, 2005. Included in long-term debt at December 31, 2006 and 2005, was $60 million and $71 million, respectively, attributable to consolidating a leasing entity underconfirm participation by the provisions of FIN 46R (see Notes 2 and 11 to the Consolidated Financial Statements). Alsobanks included in short-termthe facility. We successfully tested the facility again in February 2010. As a result, we believe our access to liquidity sources has not been materially impacted by the current credit environment and long-term debt at December 31, 2006, was $67 million from the consolidation of two joint ventures consolidated under the provisions of FIN 46R (see Note 2 to the Consolidated Financial Statements). The consolidation of these entities did not materially impact our 2006 or 2005 net earnings nor did it affect compliance with any of our debt covenants. Wewe do not expect that it will be materially impacted in the consolidationnear future. There can be no assurance, however, that the cost or availability of these entities to have a material impact on net earningsfuture borrowings, if any, in the debt markets or affect our compliance with debt covenants in future periods.credit facilities will not be materially impacted by the ongoing capital market disruptions.The table below provides the components of available credit capacity as of December 31:Working Capital SummaryThe following table summarizes the key elements A significant portion of our cash flows foris generated outside the yearsU.S. More than half of our cash and cash equivalents and most of our marketable securities at December 31, 2009, are denominated inIn millions 2009 2008 Change
2009 vs. 2008 $ 930 $ 426 $ 504 2,004 1,782 222 1,341 1,783 (442 ) 728 722 6 5,003 4,713 290
994
1,048
(54
) 428 434 (6 ) 1,010 1,157 (147 ) 2,432 2,639 (207 )
$
2,571
$
2,074
$
497 2.06 1.79 0.27 64 48 16 5.2 6.2 (1.0 ) 31:31, 2009, compared to a $151 million decrease in cash and cash equivalents during the year ended December 31, 2008. The change in cash and cash equivalents is as follows:492006 versus 2005 Change Years ended December 31, 2009 vs. 2008 2008 vs. 2007 In millions 2009 2008 2007 $ 484 $ 818 $ 788 $ (334 ) $ 30 326 314 290 12 24 23 (45 ) (75 ) 68 30 (36 ) (31 ) (152 ) (5 ) 121 (181 ) 88 (203 ) (269 ) 291 482 (251 ) (255 ) 733 4 (75 ) (174 ) 136 99 (310 ) (132 ) 124 217 (256 ) (93 ) 246 144 64 102 80 $ 1,137 $ 987 $ 810 $ 150 $ 177 Operating Activities.2009 vs. 2008improved $80 million in 2006increased for the year ended December 31, 2009, compared to 2005,2008, primarily due to $165 millionfavorable working capital fluctuations, primarily inventories, as a result of higher net earningsmanagement's response to the challenging global economy and an $82 million decrease in cash utilized for working capital,increased dividends from our equity investees which were partially offset by an increase in pension fundingdecreased income as the result of $115 milliondeclining sales. Management's priorities included reducing inventory, aligning our cost and a decrease incapacity with the real demand for our products and managing the business to generate positive cash providedflows by changes in long term liabilities of $65 million. Net changes inimproving our working capital utilized $226 million in cash during 2006 compared to utilizing $308 million in 2005, or a net decrease in cash utilized for working capital of $82 million year-over-year. Cash utilized for working capital tends to fluctuate from period to period based on various factors including, sales and production volumes as well as timing. Pension funding increased year-over-year, as we made additional contributions towards our goal of reaching 90 percent funded by the end of 2007. As of the end of 2006, our global pension funding was at approximately 88.5 percent of global pension benefit obligations.capital.DeclinesAs a result of the credit crisis and the related market recession, our pension assets experienced significant deterioration in long-term interest rates have had a negative impact on2008. The financial market distress of 2008 continued into early 2009 with the projecteddebt and accumulated obligation, however, better than expected investment returnsequity markets bottoming out in the first quarter. In the second half of 2009, the financial markets began to rebound. The recovery helped to improve our plan performance. Thus, for the year ended December 31, 2009, the return for our U.S. plan was above 18 percent while our U.K. plan return was above 16 percent. The most recent three-year average return for all of our pension invested assets was slightly above one percent. Approximately 94 percent of our pension plan assets are invested in highly liquid investments such as equity and additional voluntaryfixed income securities. The remaining six percent of our plan assets are invested in less liquid but market valued investments, including real estate and private equity. We made $129 million of pension contributions have improved the funded status of all plans, helping to minimize future required funding. During 2006in 2009 and we made cashanticipate making contributions of $266 million. We expect to contribute approximately $230$175 million to $240$185 million to our pension plans in 2010. Expected contributions to our defined benefit pension plans in 2007.2010 will meet or exceed the current funding requirements. Claims and premiums for other postretirement benefits are expected to approximate $53 million in 2010. The $129 million of pension contributions in 2009 included voluntary contributions of $108 million. These contributions and payments include payments from our funds either to increase pension plan assets or to make direct payments to participants.Investing Activities.2008 vs. 2007 Change Years ended December 31, 2009 vs. 2008 2008 vs. 2007 In millions 2009 2008 2007 $ (310 ) $ (543 ) $ (353 ) $ 233 $ (190 ) (3 ) (89 ) (66 ) 86 (23 ) (2 ) (142 ) (20 ) 140 (122 ) — 64 35 (64 ) 29 (96 ) 19 (10 ) (115 ) 29 (98 ) (157 ) (101 ) 59 (56 ) $ (509 ) $ (848 ) $ (515 ) $ 339 $ (333 ) $65 million in 2006for the year ended December 31, 2008, compared to 2005. The increase was2007, primarily due to higher capital expenditures of $76 million, which includes an increase in capital expenditures and higher investments in internal use softwarebusinesses related to the purchase of $13 million. Netthree previously independent distributors and the acquisition of Consolidated Diesel Corporation, a manufacturing facility (see Note 22, "ACQUISITIONS AND DIVESTITURES," to theConsolidated Financial Statements for additional information). These increases were partially offset by an increase in cash utilized for purchases ofgenerated from net investments in marketable securities in 2006 was $30 million as we increased our short term investment holdings as opposed to 2005 when we were in a net liquidation of securities position with net cash proceeds of $3 million. Significant sources of cash from investing activities year-over-year includes increasedand the proceeds from the disposal of equipment of $28 million as well as $24 million received related to the sale of SEG.a business.The majority of our capital spending in 2006 was primarily for new product introduction, capacity expansion, manufacturing equipment, and tooling for new products. Capital expenditures for the year ended December 31, 2008 increased 54 percent over 2007 will increase to support our growth, and will includeincluded investments to increase capacity and to fund development of our new products. Our investments in capacity improvement are focused, cutimprovements and development of new products accelerated across all of our businesses and designed for rapid return on investment. We continue to invest morebusinesses. Change Years ended December 31, 2009 vs. 2008 2008 vs. 2007 In millions 2009 2008 2007 $ 76 $ 76 $ 15 $ — $ 61 (97 ) (152 ) (144 ) 55 (8 ) (2 ) 33 (12 ) (35 ) 45 (141 ) (122 ) (89 ) (19 ) (33 ) 72 63 13 9 50 (20 ) (128 ) (335 ) 108 207 (29 ) (7 ) (24 ) (22 ) 17 $ (141 ) $ (237 ) $ (576 ) $ 96 $ 339 Financing Activities.2009 vs. 2008was $508 million in 2006decreased for the year ended December 31, 2009, compared to a use of cash of $372 million in 2005, or a net change in cash outflows of $136 million year-over-year. In 2006, we repaid our $250 million 9.5% notes while in 2005 we repaid our $225 million 6.45% notes. The other significant use of cash in financing activities when comparing 2006 to 2005 relates to repurchases of our common stock. In 2006 we completed our previously announced $100 million stock repurchase and we began repurchasing stock under a new repurchase plan that began in the third quarter of 2006. Year over year our stock repurchases increased $83 million. Also contributing2008, primarily due to the increase, to a lesser extent, was a decrease in the proceeds from the issuancerepurchases of common stock of $21 million and an increase in dividend payments due to the 20 percent increase in quarterly dividends that the board approved in July.2005 versus 2004Operating Activities.Net cash provided by operating activities improved $146 million in 2005 compared to 2004, primarily due to $200 million of higher net earnings, a $175 million increase in the deferred tax provision, a $101 million increase in long-term liabilities and a $35 million change in equity earnings of investees, partially offset by an increase in working capital of $378 million. Net changes inworking capital utilized $308 million in cash during 2005 compared to providing $70 million in 2004, or a net decrease in cash provided by working capital of $378 million year-over-year. The net increase of $378 million of cash used by changes in working capital compared to 2004 resulted primarily from lower accrued expenses of $148 million, higher accounts receivable of $146 million and lower accounts payable of $102 million, partially offset by lower inventory of $17 million and changes in other current assets of $1 million. Accounts receivable increased due to higher sales levels, a higher mix of international receivables, and the discontinuance of a major customer’s trade payables program that previously allowed for accelerated payment terms. The net reduction in accounts payablepayments on borrowings, which was due to a larger ramp-up in production during 2004 and the decrease in accrued expenses was driven by a lower increase in accrued warranty of $86 million and a lower increase in accrued payrolls of $63 million.Investing Activities.Net cash used in investing activities increased $31 million in 2005 compared to 2004. The increase was primarily due to higher capital expenditures of $41 million, which included investments in internal use software of $6 million and a decrease in cash inflows from net liquidations of marketable securities of $24 million, partially offset by a $16 million decrease in cash used for acquisition of businesses, investments in and advances to equity investees of $6 million, and an increase in proceeds from disposalsborrowings and higher dividend payments.$9 million.The majorityDecember 31, 2009, compared with $698 million at December 31, 2008. Total debt as a percent of our total capital, spending of $186 million in 2005including total long-term debt, was primarily for capacity increases, manufacturing equipment and tooling for new products.14.9 percent at December 31, 2009, compared to 16.7 percent at December 31, 2008.Financing Activities.2008 vs. 2007was $372 million in 2005decreased for the year ended December 31, 2008, compared to a $66 million source of cash in 2004, or a net change in cash outflows of $438 million year-over-year. The majority of the change year-over-year is2007, primarily due to the March 1, 2005, repaymentdecrease in repurchases of common stock, the $225increase in proceeds from borrowings, the increase in proceeds from sale of stock held by employee benefit trust and an increase in net borrowings under short-term credit arrangements. These fluctuations were partially offset by the increase in dividend payments. Our total debt as of December 31, 2008, was $698 million 6.45% notes,compared to $674 million as of December 31, 2007.significant decrease inpercent of our total capital, including long-term debt, was 16.7 percent at December 31, 2008, compared to 15.4 percent at December 31, 2007. The 2008 debt to capital ratio was negatively impacted by a $675 million ($433 after-tax) charge to Cummins Inc. shareholders' equity to recognize the funded status of our defined benefit pension and other postretirement plans.common stock issued fromwhich are to be used by us for working capital or other general corporate purposes.exercisefacility bear interest at (i) a base rate or (ii) a rate equal to LIBOR plus an applicable margin based on the credit ratings of stock optionsour outstanding senior unsecured long-term debt. Based on our current long-term debt ratings, the applicable margin on LIBOR loans was 0.75 percent per annum as of $118 million and $38 million in common stock repurchases in 2005.Cash dividends of $0.30 per common share were declared in the first and second quarter of 2006. In July 2006, the Board of Directors voted to increase the quarterly cash dividend per share by 20 percent, and as a result cash dividends of $0.36 per common share were declared in the third and fourth quarter of 2006. Cash dividends of $0.30 per common share were declared and paid in each quarter of 2005 and 2004. Dividends paid to common shareholders for the years ended December 31, 2006, 20052009. Advances under the facility may be prepaid without premium or penalty, subject to customary breakage costs.2004maintaining fixed charge coverage ratio of at least 1.5 to 1.0. As of December 31, 2009, we were $66 million, $56 millionin compliance with all such covenants, including our leverage ratio of 0.6 to 1.0 and $53 million, respectively. Declaration and paymentour fixed charge coverage ratio of dividends in the future depends upon our earnings and liquidity position, among other factors.22.5 to 1.0.ShareRepurchase of Common Stock Repurchasestwoeight million shares of Cummins common stock in addition to what has been acquired under previous authorizations. For the year ended December 31, 2006,stock. In 2007, we repurchased approximately $121$335 million of common stock, at an average cost of $55.76 per share, representing approximately 1.1six million shares. This included purchases under our $100 millionconcluded the share repurchase program introduced in September 2005, which was completed in the second quarter of 2006.On May 8, 2006,authorized by the Board of Directors approved our planin July 2006.redeem all$500 million of the 7% convertible quarterly income preferred securities that were issued in June 2001. On May 9, 2006, we gave the trustee our formal irrevocable notification of our intent to redeem the preferred securities. This notification provided the holders of the preferred securities 30 days in which to convert their securities into shares ofCummins common stock. Upon expirationWe began making purchases under the plan in March 2008 and purchased $128 million of stock during 2008 at an average cost of $55.49 per share.notification period, all remaining securities not converted were redeemed for cash at a premium above liquidation value. Substantially allfourth quarter of 2009, we lifted the $300suspension and will from time to time repurchase stock. We purchased $20 million 7%convertible subordinated debentures outstanding were converted into shares of our common stock during the secondfourth quarter at an average cost of 2006. As a result$46.52 per common share.the conversion, approximately 6.3 million shares ofDirectors voted to increase our quarterly cash dividend per share by 40 percent resulting in increasing our cash dividends from $0.125 per common stock were issued during the second quarter which resulted in an increase of approximately $15 millionshare to $0.175 per common share. Cash dividends per share paid to common stock outstanding and an increase of approximately $276 million to additional contributed capital. Since substantially all holders converted their preferred securitiesshareholders for the last three years were as follows: Quarterly Dividends 2009 2008 2007 $ 0.175 $ 0.125 $ 0.09 0.175 0.125 0.09 0.175 0.175 0.125 0.175 0.175 0.125 stock,shareholders in 2009, 2008 and 2007 were $141 million, $122 million, and $89 million, respectively. Declaration and payment of dividends in the loss on extinguishmentfuture depends upon income and liquidity position, among other factors, and is subject to declaration by our Board of this debt was insignificant.In September 2005, we announced our intentionDirectors, who meet quarterly to repayconsider the $250 million 9.5% notes in December 2006, the first call date for the debt. The notes were issued in November 2002 and were repaid in December 2006 usingdividend payment. We expect to fund dividend payments from cash generated from operations. We paid a premium of approximately $12 million due to the early retirement of this debt.Approximately $62 million of our $120 million 6.75% debentures were repaid on February 15, 2007, at the election of the holders. Such election and notification was required to be made between December 15, 2006 and January 15, 2007. At December 31, 2006, we have included the $62 million repaid on February 15, 2007, in short-term borrowings in our Consolidated Balance Sheet.In July 2006, we amended and extended the leaseCredit Rating Impact on our corporate headquarters facility to 2019. The total rental payments to be made over the revised lease term are approximately $59 million. As a result of this extension, we were required to re-evaluate the classification of this lease. Based on the terms of the extension, this lease is now classified as a capital lease. As a result, our long-term debt increased by approximately $40 million.Credit FacilitiesDuring the third quarter of 2006, we extended a lease relating to a portion of our rental business by six years. The lease was set to expire on September 30, 2006. Instead of paying a balloon payment of approximately $42 million on September 30, 2006, the amount has been financed over a six year term at a fixed rate. In addition to extending this lease, we reduced the interest rate by approximately 2 percentage points. During the fourth quarter of 2006, we refinanced a lease relating to another portion of our rental business. Under the terms of the agreement which is effective as of January 1, 2007, the new lease has a six year term and the interest rate is approximately 2 percentage points lower than the existing lease. The total amount refinanced was approximately $28 million. Both leases were treated as capital leases both before and after the changes. For more information regarding our rental business and related lease agreements, see Note 20 to the Consolidated Financial Statements.Contractual Obligations and Other Commercial CommitmentsA summary of payments due for our contractual obligations and commercial commitments, as of December 31, 2006, is shown in the tables below:(1) Includes principal payments and expected interest payments based on the terms of the obligations.(2) Our minimum required pension funding in the U.S. is zero and approximately $60 million to $65 million in the U.K. for 2007.Financial Covenants and Credit Ratingbeenimpacted these covenants or pricing modifications.in 2006 to impede our compliance with these covenants. current ratings and outlook as of December 31, 2009, from each of the credit rating agencies are shown in the table below.Credit Rating AgencyL-TTerm
Debt RatingShort-
Term Debt
RatingOutlook S-T DebtRatingOutlookStable Moody’s Investors Service, Inc.Standard & Poor'sBBB Baa3NR Non-PrimeStandard & Poor’sFitchBBB+ BBB-BBB+ NRFitchBBB-BBB-Positive
CONTRACTUAL OBLIGATIONS AND OTHER COMMERCIAL COMMITMENTS53 A summary of payments due for our contractual obligations and commercial commitments, as of December 31, 2009, is shown in the tables below:Contractual Cash Obligations 2010 2011-2012 2013-2014 After 2014 Total In millions $ 37 $ — $ — $ — $ 37 97 235 140 1,462 1,934 96 119 73 85 373 124 37 11 — 172 391 — — — 391 118 47 5 — 170 70 130 130 65 395 53 104 98 249 504 $ 986 $ 672 $ 457 $ 1,861 $ 3,976 Other Commercial Commitments 2010 2011-2012 2013-2014 After 2014 Total In millions $ 35 $ — $ — $ — $ 35 20 8 1 1 30 6 17 52 — 75 1 — — 74 75 $ 62 $ 25 $ 53 $ 75 $ 215 January 2004,July 2007, we entered into a three-year facilityamended our agreement with a financial institution to sell a designated pool of trade receivables to Cummins Trade Receivables, LLC (CTR), a wholly-owned special purpose subsidiary. In January 2007, thissubsidiary, to extend the facility was extended for one year.until July 2010, and raised the purchase limitation from $200 million to $400 million. The agreement also provides us with an option to increase the purchase limitation up to $500 million upon approval. As necessary, CTR may transfer a direct interest in its receivables, without recourse, to the financial institution. To maintain a balance in the designated pools of receivables sold, we sell new receivables to CTR as existing receivables are collected. Receivables sold to CTR in which an interest is not transferred to the financial institution are included in “Receivables, net”"Receivables, net" on ourConsolidated Balance Sheets. The maximum interest in sold receivables that can be outstanding at any point in time is limited to the lesser of $200$400 million or the amount of eligible receivables held by CTR. There are no provisions in this agreement that require us to maintain a minimum investment credit rating; however, the terms of the agreement contain the same financial covenants as our revolving credit facility. There was no interest in receivables sold under this program to the financial institution in 2006 or 2005 and the interest in receivables sold in 2004 was not significant. As of December 31, 20062009, the amount available under this program was $154 million. As of December 31, 2009 and 2005,2008, there were no amounts outstanding under this program.
Financing Arrangements for RelatedAffiliated Partiesproducts and components from the joint ventures,and/or sell products and components from/to the joint ventures and the joint ventures may sell products and components to unrelated parties. The transfer price of products purchased from the joint ventures may differ from normal selling prices. Certain joint venture agreements transfer product to us at cost, some transfer product to us on a cost-plus basis and other agreements provide for the transfer of products at market value.We purchase significant quantities of midrange diesel and natural gas engines, components and service parts from Consolidated Diesel Company (CDC), a general partnership that was formed in 1980 with J. I. Case (Case) to jointly fund engine development and manufacturing capacity. Cummins and Case (now CNH Global N.V.) are general partners and each partner shares 50 percent ownership in CDC. Under the terms of the agreement, CDC is obligated to make its entire production of diesel engines and related products available solely to the partners. Each partner is entitled to purchase up to one-half of CDC’s actual production and a partner may purchase in excess of one-half of actual production to the extent productive capacity is available beyond the other partner’s purchase requirement. The partners are each obligated, unconditionally and severally, to purchase annually at least one engine or engine kit produced by CDC, provided a minimum of one engine or engine kit is produced. The transfer price of CDC’s engines to the partners must be sufficient to cover its manufacturing cost in such annual accounting period, including interest and financing expenses, but excluding depreciation expense (other than Scheduled Depreciation Expense as defined in the agreement). In addition, each partner is obligated to contribute one-half of the capital investment required to maintain plant capacity and each partner has the right to invest unilaterally in plant capacity, which additional capacity is available to the other partner for a fee. To date, neither partner has made a unilateral investment in plant capacity at CDC.We are not a guarantor of any of CDC’s obligations or commitments. However, we are required as a partner, to provide up to 50 percent of CDC’s base working capital as defined by the agreement. The amount of base working capital is calculated each quarter and if supplemental funding greater than the base working capital amount is required, the amount is funded through third-party financing arranged by CDC, or we may elect to fund the requirement, although we are under no obligation to do so. To date, when supplemental funding is required above the base working capital amount, we have elected to provide that funding to CDC. If the amount of supplemental funding required is less than the base working capital amount, it is funded equally by the partners. Excess cash generated by CDC is remitted to Cummins untilCDC’s working capital amount is reduced to the base working capital amount. Any further cash remittances from CDC to the partners are shared equally by the partners.In the first quarter of 2004, we adopted certain provisions of FIN 46R. Under the provisions of FIN 46R, CDC and another engine manufacturing entity jointly owned and operated by us were considered VIEs and we were deemed the primary beneficiary of these VIEs by virtue of our pricing arrangements with them and substantial product purchases from them. As a result, we consolidated the assets and liabilities of CDC and the other engine manufacturer as of March 28, 2004. Previously, these joint ventures were accounted for under the equity method of accounting and included in our Consolidated Balance Sheets as “Investments in and advances to equity investees.” First quarter results for these entities were recorded as “Investee equity, royalty and other income” in our Consolidated Statements of Earnings and results for the rest of the year were consolidated in our Consolidated Statements of Earnings. For a further discussion of the impact of adopting FIN 46R, see Note 2 to the Consolidated Financial Statements.
APPLICATION OF CRITICAL ACCOUNTING ESTIMATES
A summary of our significant accounting policies is included in Note 1, "SUMMARY OF SIGNIFICANT ACCOUNTING POLICIES," to the ourConsolidated Financial Statements of this annual report which discusses accounting policies that we have selected from acceptable alternatives other than for the adoption of new accounting pronouncements as discussed in Note 1 to the alternatives.
OurConsolidated Financial Statements. There were no accounting policies adopted during 2006 that had a material impact on our financial condition or results of operations.
Our Consolidated Financial Statements are prepared in accordance with GAAP thatwhich often requirerequires management to make judgments, estimates and assumptions regarding uncertainties that affect the reported amounts presented and disclosed in the financial statements. Our management reviews these estimates and assumptions based on historical experience, changes in business conditions and other relevant factors they believe to be reasonable under the circumstances. In any given reporting period, our actual results may differ from the estimates and assumptions used in preparing ourConsolidated Financial Statements.Statements.
Critical accounting estimates are defined as follows: the estimate requires management to make assumptions about matters that were highly uncertain at the time the estimate was made; different estimates reasonably could have been used; or if changes in the estimate are reasonably likely to occur from period to period and the change would have a material impact on our financial condition or results of operations. Our senior management has discussed the development and selection of our accounting policies, related accounting estimates and the disclosures set forth below with the Audit Committee of our Board of Directors. We believe our critical accounting estimates include those addressing the recoverability of an investment related to new products, the estimation of liabilities for warranty programs, accounting for income taxes, pension benefits and annual assessment of recoverability of goodwill.
Recoverability of Investment Related to New Products
We have capitalized $216 million associated with the future launch of our light-duty diesel engine product. Market uncertainty due to the global recession has resulted in some customers delaying or cancelling their vehicle programs. We concluded that events and circumstances indicated that these assets should be reviewed for possible impairment at December 31, 2009. We used projections to assess whether future cash flows on an undiscounted basis related to the assets are likely to exceed the related carrying amount to determine if a write-down is appropriate. These projections require estimates about product volume and the size of the market for vehicles that are not yet developed. We used input from our customers in developing alternative cash flow scenarios. Our analysis indicated that the assets are recoverable at December 31, 2009. If customer expectations or projected volumes deteriorate and we do not identify alternative customers and/or product applications, we could be required to write-down these assets to net realizable value.
We estimate and record a liability for warranty programs, primarily base warranty and other than product recalls, at the time our products are sold. Our estimates are based on historical experience and reflect management’smanagement's best estimates of expected costs at the time products are sold and subsequent adjustment to those expected costs when actual costs differ. As a result of the uncertainty surrounding the nature and frequency of product recall programs, the liability for such programs is recorded when we commit to a recall action, which generally occurs when it is announced. Our warranty liability is generally affected by component failure rates, repair costs and the time of failure. Future events and circumstances related to these factors could materially change our estimates and require adjustments to our liability. New product launches require a greater use of judgment in developing estimates until historical experience becomes available. Product specific experience is typically available four or five quarters after product launch, with a
clear experience trend evident eight quarters after launch. We generally record warranty expense for new products upon shipment using a factor based upon historical experience only in the first year, a blend of actual product and historical experience in the second year and product specific experience thereafter. Note 1311, "PRODUCT WARRANTY LIABILITY," to the ourConsolidated Financial Statements contains a summary of the activity in our warranty liability account for 20062009 and 20052008 including adjustments to pre-existing warranties.
We determine our provision for income taxes using the asset and liability method. Under this method, deferred tax assets and liabilities are recognized for the future tax effects of temporary differences between the financial statement carrying amounts of existing assets and liabilities and their respective tax bases. Future tax benefits of tax loss and credit carryforwards are also recognized as deferred tax assets. We evaluate the realizabilityrecoverability of our deferred tax assets each quarter by assessing the likelihood of future profitability and available tax planning strategies that could be implemented to
realize our net deferred tax assets. At December 31, 2006,2009, we recorded net deferred tax assets of $696$729 million. These assets include $39included $151 million for the value of tax loss and credit carryforwards. A valuation allowance of $26$44 million has beenwas recorded to reduce the tax assets to the net value management believes isbelieved was more likely than not to be realized. In the event our operating performance deteriorates, future assessments could conclude that a larger valuation allowance will be needed to further reduce the deferred tax assets. In addition, we operate within multiple taxing jurisdictions and are subject to tax audits in these jurisdictions. These audits can involve complex issues, which may require an extended period of time to resolve. We reduce our net tax assets for the estimated additional tax and interest that may result from tax authorities disputing certainuncertain tax positions we have taken and we believe we have made adequate provision for income taxes for all years that are subject to audit based upon the latest information available. A more complete description of our income taxes and the future benefits of our tax loss and credit carryforwards areis disclosed in Note 94, "INCOME TAXES," to the ourConsolidated Financial Statements.
We sponsor a number of pension plans primarily in the U.S. and the U.K., and to a lesser degree in various other countries. In the U.S. and the U.K. we have several major defined benefit plans that are separately funded. We account for our pension programs in accordance with Statement of Financial Accounting Standards No. 87, “Employers’ Accountingemployers' accounting for Pensions,” (SFAS 87)defined benefit pension and SFAS No. 158, “Employers’ Accounting for Defined Benefit Pension and Other Postretirement Plans—an amendment of FASB Statements No. 87, 88, 106 and 132 (R) (SFAS 158). SFAS 87other postretirement plans under GAAP. GAAP requires that amounts recognized in financial statements be determined using an actuarial basis. As a result, our pension benefit programs are based on a number of statistical and judgmental assumptions that attempt to anticipate future events and are used in calculating the expense and liability related to our plans.plans each year at December 31. These assumptions include discount rates used to value liabilities, assumed rates of return on plan assets, future compensation increases, employee turnover rates, actuarial assumptions relating to retirement age, mortality rates and participant withdrawals. The actuarial assumptions we use may differ significantly from actual results due to changing economic conditions, participant life span and withdrawal rates. These differences may result in a material impact to the amount of net periodic pension expense to be recorded in ourConsolidated Financial Statements in the future. SFAS 158 requires an employer to recognize the overfunded or underfunded status of a defined benefit postretirement plan as an asset or liability in its statement of financial position and to recognize changes in that funded status in the year in which the changes occur through comprehensive income. The Statement also requires an employer to measure the funded status of a plan as of the date of its year-end statement of financial position. We adopted SFAS 158 as required on December 31, 2006. We did not adopt the measurement date change as it is not required until December 31, 2008.future.
The expected long-term return on plan assets is used in calculating the net periodic pension expense. We considered several factors in developing our expected rate of return on plan assets. The long-term rate of return considers historical returns and expected returns on current and projected asset allocations and is generally applied to a 5-year average market value of return. The long-term rate of return on plan assets represents an estimate of long-term returns on an investment portfolio consisting of a mixture of equities, fixed income, real estate and other miscellaneous investments. The differences between the actual return on plan assets and expected long-term return on plan assets are recognized in the asset value used to calculate net periodic expense over five years. The table below sets forth the expected rate of return on U.S. pension plan assetsassumptions used to develop our pension expense was 8.5 percent for each year ended December 31, 2006, 2005,the period 2007-2009 and 2004. Theour expected rate of return on non-U.S. pension plan assets was 7.24 percent, 7.56 percent, and 8.08 percent, respectively. In 2007, we plan to use an expected rate of return of 8.5 percent for U.S pension plan assets and 7.25 percent for non-U.S. pension plan assets.2010.
| | Long-Term Expected Return Assumptions | ||||||||||||
|---|---|---|---|---|---|---|---|---|---|---|---|---|---|
| | 2010 | 2009 | 2008 | 2007 | |||||||||
U.S. Plans | 8.00 | % | 8.25 | % | 8.25 | % | 8.50 | % | |||||
Non-U.S. Plans | 7.25 | % | 7.25 | % | 7.25 | % | 7.24 | % | |||||
A lower expected rate of return will increase our net periodic pension expense and reduce profitability.
The difference between the expected return and the actual return on plan assets is deferred from recognition in our results of operations and, under certain circumstances such as when the difference exceeds 10 percent of the market value of plan assets or the projected benefit obligation (PBO),
amortized over future years of service. This is also true of changes to actuarial assumptions. As of December 31, 2006,2009, we had net pension actuarial losses of $468$801 million and $358$364 million for the U.S. and non-U.S. pension plans, respectively. Under SFAS 158GAAP, the actuarial gains and losses are recognized and recorded in accumulated other comprehensive loss. As these amounts exceed 10 percent of our PBO, the excess is amortized over the average remaining service lives of participating employees.
Our The table below sets forth the net periodic pension expense was $120 million in 2006, $103 million in 2005,for the period 2007 through 2009 and $89 million in 2004. Our net periodic pensionour expected expense is expected to be approximately $97 million in 2007.for 2010.
| | Net Periodic Pension Expense | ||||||||||||
|---|---|---|---|---|---|---|---|---|---|---|---|---|---|
| In millions | 2010 | 2009 | 2008 | 2007 | |||||||||
Pension expense | $ | 71 | $ | 93 | $ | 71 | $ | 98 | |||||
The decreaseincrease in periodic pension expense isin 2009 was due to higher expectedlower than historical returns on assets driven by the significant pension contributions we made in 2006. In addition, our expense is expected to decline as the amortization of prior investment losses begins to be replaced with the amortization of prior investment gains.global economic recession. Another key assumption used in the development of the net periodic pension expense is the discount rate. The discount raterates used to develop our net periodic pension expense are set forth in the U.S. was 5.60 percent, 5.75 percent, and 6.25 percent for the years ended December 31, 2006, 2005, and 2004. The discount rate for our non-U.S. pension expense was 4.95 percent, 5.30 percent, and 5.66 percent. We will use 5.60 percent and 4.96 percent for U.S. and non-U.S. pension expense in 2007.table below.
| | Discount Rates | ||||||||||||
|---|---|---|---|---|---|---|---|---|---|---|---|---|---|
| | 2010 | 2009 | 2008 | 2007 | |||||||||
U.S. Plans | 5.60 | % | 6.20 | % | 6.10 | % | 5.60 | % | |||||
Non-U.S. Plans | 5.80 | % | 6.20 | % | 5.80 | % | 4.96 | % | |||||
Changes in the discount rate assumptions will impact the interest cost component of the net periodic pension expense calculation. Our funding strategy is to fund the plan approximately 90 percent on a PBO basis.
The discount rate enables us to state expected future cash payments for benefits as a present value on the measurement date. The guidelines for setting this rate are discussed in EITF D-36GAAP which suggests the use of a high-quality corporate bond rate. We used bond information provided by Standard & Poors for the U.S. and iBoxx for the U.K. All bonds used to develop our hypothetical portfolio in the U.S. and U.K. were high-quality, noncallablenon-callable bonds (AA(AA- or better) as of November 30, 2006.December 31, 2009. The average yield of this hypothetical bond portfolio was used as the benchmark for determining the discount rate to be used to value the obligations of the plans subject to SFAS 87 and SFAS No. 106, “Employer’s AccountingGAAP accounting for Postretirement Benefits Other Than Pensions.”postretirement benefits other than pensions.
Our model called for 60 years of benefit payments. For the U.S. plans, the sum of the cash flows from the 60 bonds matched the cash flow from the benefit payment stream upon completion of the process. The number of bonds purchased for each issue was used to determine the price of the entire portfolio. The discount rate benchmark was set to the internal rate of return needed to discount the cash flows to arrive at the portfolio price.
In developing the U.K. discount rate, excess cash flows resulted in the early years of the 60 year60-year period when the sum of the cash flow from the bonds maturing in later years exceeded the benefit payments in early years, thus no bonds maturing in early years are needed. As a result, the price of the entire portfolio of bonds was too high because all benefit payments were covered with excess cash flow remaining. We made no adjustment to the cash flow and the discount rate was determined as the internal rate of return needed to discount the cash flows to arrive at the portfolio price. Due to the flat shape of the yield curve,
this methodology choice impacted the discount rate by less than two basis percentage points. The discount rate would have been slightly higher had the cash flows been allowed to reinvest.
The table below sets forth the estimated impact on our 20072010 net periodic pension expense relative to a change in the discount rate and a change in the expected rate of return on plan assetsassets.
|
| Impact on |
| |||
|
| Millions |
| |||
Discount rate used to value liabilities: |
|
|
|
|
| |
0.25 percent increase |
|
| $ | (8.3 | ) |
|
0.25 percent decrease |
|
| 8.6 |
|
| |
Expected rate of return on assets: |
|
|
|
|
| |
1 percent increase |
|
| (25.9 | ) |
| |
1 percent decrease |
|
| 25.8 |
|
| |
| In millions | Impact on Pension Expense Increase (Decrease) | ||||
|---|---|---|---|---|---|
Discount rate used to value liabilities: | |||||
0.25 percent increase | $ | (5 | ) | ||
0.25 percent decrease | 5 | ||||
Expected rate of return on assets: | |||||
1 percent increase | (28 | ) | |||
1 percent decrease | 28 | ||||
The above sensitivities reflect the impact of changing one assumption at a time. A higher discount rate decreases the plan obligations and decreases our net periodic pension expense. A lower discount rate increases the plan obligations and increases our net periodic pension expense. It should be noted that economic factors and conditions often affect multiple assumptions simultaneously and the effects of changes in key assumptions are not necessarily linear.
Our investment policies in the U.S. and U.K. provide for the rebalancing of assets to maintain our long-term strategic asset allocation. We considered several factors in developingare committed to its long-term strategy and do not attempt to time the market given empirical evidence that asset allocation is more critical than individual asset or investment manager selection. Rebalancing of the assets has and continues to occur. The rebalancing is critical to having the proper weighting of assets to achieve the expected total portfolio returns.
For the U.S. qualified pension plans, our assumptions for the expected rate of return on plan assets including historicalwas 8.25 percent in 2009. Projected returns and input from our external advisors. The long-term rate of returnare based primarily on plan assets represents an estimate of long-term returns on an investment portfolio consisting of a mixture of equities,broad, publicly traded equity and fixed income real estateindices and other miscellaneous investments. Basedforward-looking estimates of active portfolio and investment management. As of December 31, 2009, based upon our target asset allocations it is anticipated that our U.S. investment policy will generate an average annual return over the 20-year projection period equal to or in excess of 7.737.50 percent approximately 5040 percent of the time while returns of 9.288.70 percent or greater are anticipated 25 percent of the time. Our three year average rateWe expect additional positive returns from active investment management. Except for the short-term adverse conditions in the equity markets in 2008, our recent three-year annual rates of return hashave all exceeded 8.5 percent in each of the last three years.8.50 percent. As a result, based on the historical returns and forward-looking return expectations, we believe an investment return assumption of 8.58.00 percent per year in 2010 for U.S. pension assets is reasonable. The methodology used to determine the rate of return on pension plan assets in the U.K. was based on establishing an equity-risk premium over current long-term bond yields adjusted based on target asset allocations. Our strategy with respect to our investments in pension plan assets is to be invested with a long-term outlook. Therefore, the risk and return balance of our asset portfolio should reflect a long-term horizon. Our pension plan asset allocation at December 31, 20062009 and 2005,2008 and target allocation for 20072010 are as follows:
|
| Target Allocation |
| Percentage of Plan |
| ||||||||||
Investment description |
|
|
| 2007 |
| 2006 |
| 2005 |
| ||||||
Equity securities |
|
| 60-80% |
|
|
| 62.7 | % |
|
| 64.1 | % |
| ||
Fixed income |
|
| 23-33% |
|
|
| 33.4 | % |
|
| 33.5 | % |
| ||
Real estate/Other |
|
| 3-7% |
|
|
| 3.9 | % |
|
| 2.4 | % |
| ||
Total |
|
|
|
|
|
| 100.0 | % |
|
| 100.0 | % |
| ||
| | | Percentage of Plan Assets at December 31, | |||||||||
|---|---|---|---|---|---|---|---|---|---|---|---|
| | Target Allocation 2010 | ||||||||||
Investment description | 2009 | 2008 | |||||||||
Equity securities | 55.0 | % | 59.1 | % | 56.0 | % | |||||
Fixed income | 33.6 | % | 34.6 | % | 39.6 | % | |||||
Real estate/Other | 11.4 | % | 6.3 | % | 4.4 | % | |||||
Total | 100.0 | % | 100.0 | % | 100.0 | % | |||||
Actual cash funding for our U.S. pension plans is governed by employee benefit and tax laws and the Pension Protection Act of 2006 (“("the Act”Act"). The Act extends the use of an average corporate bond rate for determining current liabilities for funding purposes. Among its many provisions, the Act establishes a 100 percent funding target for plan years beginning after December 31, 2007. We may voluntarily2007, which has now been extended to 2011 by the U.S. Congress due to the recession. Our funding strategy is to make contributions to achieve our various qualified plans in accordance with statutory funding strategy described above. During 2006requirements and 2005,any additional contributions we made cash
contributions todetermine are appropriate. The table below sets forth our pension planscontributions for the period 2008-2009 and our expected range of $266 million and $151 million, respectively, and we expect to make cash contributions of approximately $230 million to $240 million in 2007.for 2010.
| | Pension Contributions | |||||||||
|---|---|---|---|---|---|---|---|---|---|---|
| In millions | 2010 | 2009 | 2008 | |||||||
Contributions | $ | 175 - 185 | $ | 129 | $ | 102 | ||||
Contributions beyond 20072010 will depend on the funded status of our U.S. plans at that time in relation to the targeted funding established under the Act.Act and contractual obligations negotiated in the U.K.
The minimum Our pension liability was eliminated upon the adoption of SFAS 158. The estimated accumulated benefit obligation related toplans in the U.S., U.K. and several other smaller pension plans exceededoutside the fair value of the plan assets as ofU.S. were under-funded at December 31, 20062009, by a total of $522 million due to pension trust asset performance.
Under GAAP, the actuarial gains and 2005. Changeslosses and prior service costs (credits) are recognized and recorded in the minimum pension liability decreased our shareholders’ equity by $24 million, (after tax and minority interest), in 2005. Prior to adopting SFAS 158, additional minimum pension liabilities were reduced by $102 million (after tax and minority interest) through a direct credit to accumulated other comprehensive loss. Increases in actuarial losses reduced our shareholders' equity by $11 million (after-tax) in 2009. The reduction of these liabilitiesincreases resulted from stronglower discount rates and higher mortality assumptions partially offset by improved plan asset performance and significant pension contributions in 2005 and 2006.2009.
Note 12, "PENSION AND OTHER POSTRETIREMENT BENEFITS," to the ourConsolidated Financial Statements provides a summary of our pension benefit plan activity, the funded status of our plans and the amounts recognized in ourConsolidated Financial Statementsand the impacts of SFAS 158..
Annual Assessment for Recoverability of Goodwill
Under the provisions of SFAS No. 142, “GoodwillGAAP accounting for goodwill and Other Intangible Assets” (SFAS 142),other intangible assets, the carrying value of goodwill is reviewed annually. The fair value of each reporting unit was estimated by discounting the future cash flows less requirements for working capital and fixed asset additions. In accordance with GAAP, our reporting units are generally defined as one level below an operating segment. However, there were two situations where we have aggregated two or more components which share similar economic characteristics and thus are aggregated into a single reporting unit for testing purposes. These two situations are described further below. This analysis has resulted in the following reporting units for our goodwill testing:
No other reporting units have goodwill. Our valuation method requires us to make projections of revenue, operating expenses, working capital investment and fixed asset additions for the reporting units over a multi-year period. Additionally, management must estimate itsa weighted-average cost of capital, which reflects a market rate, for each reporting unit for use as a discount rate. The discounted cash flows are compared to the carrying value of the reporting unit and, if less than the carrying value, a separate valuation of the goodwill is required to determine if an impairment loss has occurred. In addition, we also perform a sensitivity analysis to determine how much our forecasts can fluctuate before the fair value of a reporting unit would be lower than its carrying amount. As of the end of the third quarter in 2006,2009, we performed the annual impairment assessment required by SFAS 142GAAP and determined that our goodwill was not impaired. At December 31, 2006,2009, our recorded goodwill was $356 million.$364 million, approximately 90 percent of which resided in the emissions solutions plus filtration reporting unit. For this reporting unit, a 10 percent reduction in our estimated future cash flows would not have impacted our assessment. Changes in our projections or estimates, a deterioration of our operating results and the related cash flow effect or a significant increase in the discount rate could decrease the estimated fair value of our reporting units and result in a future impairment of goodwill.
59
RECENTLY ADOPTED AND RECENTY ISSUED ACCOUNTING PRONOUNCEMENTS
Accounting Pronouncements Recently Adopted
In December 2004,2007, the Financial Accounting Standards Board (FASB) issued SFAS No. 123 (Revised 2004), “Share-Based Payment” (SFAS 123R). This standard requires financial statement recognition of compensation cost related to share-based payment transactions. Share-based payment transactions within the scope of SFAS 123R include stock options, restricted stock plans, performance-based awards, stock appreciation rights, and employee share purchase plans. We implemented the revised standard in the first quarter of 2006. Prior to January 1, 2006, we accountedamended its existing standards for stock-based employee awards issued after December 31, 2002, using the fair value method preferred by SFAS No. 123, “Accounting for Stock-Based Compensation.” SFAS 123R requires us to estimate forfeitures in calculating the expense relating to stock-based compensation as opposed to recognizing these forfeitures and the corresponding reduction in expense as they occur. SFAS 123R also requires prospective presentation of the “Tax benefit on share-based awards” as a financing activity rather than an operating activity in our Consolidated Statements of Cash Flows. See Note 19 to the Consolidated Financial Statements for the impact that the adoption of this standard had on our Consolidated Financial Statements.
In May 2005, the FASB issued SFAS No. 154, “Accounting Changes and Error Corrections—a replacement of Accounting Principles Board (APB) Opinion No. 20 and FASB Statement No. 3” (SFAS 154). This standard changes the requirements for the accounting for and reporting of a change in accounting principle and applies to all voluntary changes in accounting principle. It also applies to changes required by an accounting pronouncement in the unusual instance that the pronouncement does not include specific transition provisions. When a pronouncement includes specific transition provisions, those provisions should be followed. APB 20 required that most voluntary changes in accounting principle be recognized by including in net income of the period of the change the cumulative effect of changing to the new accounting principle. This standard requires retrospective application to prior period financial statements of changes in accounting principle, unless itbusiness combinations, which is impracticable to determine either the period-specific effects or the cumulative effect of the change. The provisions of SFAS 154 are effective for fiscal years beginning after December 15, 2005.2008. The adoptionamended standards make significant changes to both the accounting and disclosures related to the acquisition of a business and could materially impact how we account for future business combination transactions. Because the standard will only impact transactions entered into after January 1, 2009, the amended standards did not impact ourConsolidated Financial Statements upon adoption.
In December 2007, the FASB amended its existing standards for noncontrolling interests in consolidated financial statements, which was effective for interim and annual fiscal periods beginning after December 15, 2008. The new standard established accounting and reporting standards for the noncontrolling interest in a subsidiary and for the accounting for future ownership changes with respect to those subsidiaries. The new standard defined a noncontrolling interest, previously called a minority interest, as the portion of equity in a subsidiary not attributable, directly or indirectly, to a parent. The new standard required, among other items, that a noncontrolling interest be included in the consolidated balance sheet within equity, separate from the parent's equity; consolidated net income to be reported at amounts inclusive of both the parent's and noncontrolling interest's shares and, separately, the amounts of consolidated net income attributable to the parent and noncontrolling interest all on the consolidated statements of income; and if a subsidiary is deconsolidated, any retained noncontrolling equity investment in the former subsidiary be measured at fair value and a gain or loss be recognized in net income based on such fair value. We adopted the new standard effective January 1, 2009 and applied it retrospectively. As a result, we reclassified noncontrolling interests of $246 million, $292 million and $253 million, respectively, from the mezzanine section to equity in the December 31, 2008, 2007 and 2006 balance sheets. Certain reclassifications have been made to prior period amounts to conform to the presentation of the current period under the new standard.
In March 2008, the FASB amended its existing standards for disclosures about derivative instruments and hedging activities, which was effective for interim and annual fiscal periods beginning after November 15, 2008. The new standards require enhanced disclosures about a company's derivative and hedging activities. We adopted the new standard effective January 1, 2009 and applied it prospectively. The new disclosures required are included in Note 20, "DERIVATIVES," to ourConsolidated Financial Statements.
In June 2009, the FASB amended its existing standards for subsequent events, which was effective for interim and annual fiscal periods ending after June 15, 2009 and established general standards of accounting for and disclosure of events that occur after the balance sheet date but before financial statements are issued or are available to be issued. The new standard established the period after the balance sheet date during which we should evaluate events or transactions that may occur for potential recognition or disclosure in the financial statements, the circumstances under which we should recognize events or transactions occurring after the balance sheet date and the disclosures that should be made about events or transactions that occurred after the balance sheet date. In preparing ourConsolidated Financial Statements, we evaluated subsequent events through February 25, 2010, which is the date our annual report was filed with the Securities and Exchange Commission.
Accounting Pronouncements Issued But Not Yet Effective
In June 2009, the FASB amended its standards for accounting for transfers of financial assets, which is effective for interim and annual fiscal periods beginning after November 15, 2009. The new standard removes the concept of a qualifying special-purpose entity from GAAP. The new standard modifies the financial-components approach used in previous standards and limits the circumstances in which a financial asset, or portion of a financial asset, should be derecognized. The new standard also requires enhanced disclosure regarding transfers of financial interests and a transferor's continuing involvement with transferred assets. The new standard will require us to report any future activity under our sale of receivables program as secured borrowings as of January 1, 2010. As of December 31, 2009, we had no amounts outstanding under this program.
In June 2009, the FASB amended its existing standards related to the consolidation of variable interest entities, which is effective for interim and annual fiscal periods beginning after November 15, 2009. The new standard requires entities to analyze whether their variable interests give it a controlling financial interest of a variable interest entity (VIE) and outlines what defines a primary beneficiary. The new standard amends GAAP by: (a) changing certain rules for determining whether an entity is a VIE; (b) replacing the quantitative approach previously required for determining the primary beneficiary with a more qualitative approach; and (c) requiring entities to continuously analyze whether they are the primary beneficiary of a VIE among other amendments. The new standard also requires enhanced disclosures regarding an entity's involvement in a VIE. While we are still finalizing our evaluation of the impact of this standard didamendment on ourConsolidated Financial Statements, we believe the only impact will be the deconsolidation of Cummins Komatsu Engine Company (CKEC). This deconsolidation will not have a material impact on ourConsolidated Financial Statements.
In September 2006, the SEC staff issued Staff Accounting Bulletin (SAB) No. 108, “Considering the Effects of Prior Year Misstatements when Quantifying Misstatements Financial information about CKEC is included in Current Year Financial Statements (SAB 108). SAB 108 was issued in orderNote 23, "VARIABLE INTEREST ENTITIES," to eliminate the diversity of practice surrounding how public companies quantify financial statement misstatements. Traditionally, there have been two widely-recognized methods for quantifying the effects of financial statement misstatements: the “roll-over” method and the “iron curtain” method. The roll-over method focuses primarily on the impact of a misstatement on the income statement, including the reversing effect of prior year misstatements, but its use can lead to the accumulation of misstatements in the balance sheet. The iron curtain method, on the other hand, focuses primarily on the effect of correcting the period-end balance sheet with less emphasis on the reversing effects of prior years on the income statement. We currently use the iron curtain method for quantifying identified financial statement misstatements. In SAB 108, the SEC staff established an approach that requires quantification of financial statement misstatements based on the effects of the misstatements on each of the company’s financial statements and related financial statement disclosures. This model is commonly referred to as a “dual approach” because it requires quantification of errors under both the iron curtain and roll-over methods. We were required to apply the provisions of SAB 108 in connection with the preparation of ourConsolidated Financial Statements.
In October 2009, the FASB amended its rules regarding the accounting for multiple element revenue arrangements. The objective of the year ended December 31, 2006.amendment is to allow vendors to account for revenue for different deliverables separately as opposed to part of a combined unit when those deliverables are provided at different times. Specifically, this amendment addresses how to separate deliverables and simplifies the process of allocating revenue to the different deliverables when more than one deliverable exists. The applicationnew rules are effective for us beginning January 1, 2011. We are in the process of SAB 108 did notevaluating the impact that this amendment will have a material effect on ourConsolidated Financial Statements.
In September 2006, the FASB issued SFAS No. 158, “Employers’ Accounting for Defined Benefit Plans and Other Postretirement Plans—an amendment of FASB Statements No. 87, 88, 106, and 132(R)” (SFAS 158), which requires employers to fully recognize the obligations associated with single-employer defined benefit pension, retiree healthcare and other postretirement plans in their financial statements. In
addition, SFAS 158 requires companies to measure plan assets and liabilities as of the end of a fiscal year rather than a date within 90 days of the end of the fiscal year. We adopted SFAS 158 effective December 31, 2006, except for the change in measurement date provisions which are not effective until 2008. Total assets, total liabilities, minority interests and total shareholders’ equity were impacted in the following manner. Total assets increased by approximately $11 million, total liabilities increased by approximately $106 million, minority interests decreased by approximately $1 million and shareholders’ equity decreased by approximately $94 million. The adoption of SFAS 158 did not impact compliance with any of our financial covenants. See Note 12 to the Consolidated Financial Statements for further information regarding the impact that the adoption of this standard had on our Consolidated Financial Statements.
ACCOUNTING PRONOUNCEMENTS ISSUED BUT NOT YET EFFECTIVE
In February 2006, the FASB issued SFAS No. 155, “Accounting for Certain Hybrid Financial Instruments—an amendment of FASB Statements No. 133 and 140” (SFAS 155). SFAS 155 changes certain accounting requirements for certain hybrid financial instruments by permitting fair value remeasurement for any hybrid financial instrument that contains an embedded derivative that otherwise would require bifurcation. The new standard also changed certain accounting requirements for interest-only and principal-only strips and other aspects of accounting for securitized financial assets. We will adopt SFAS 155 effective January 1, 2007. We do not expect the adoption of SFAS 155 to have a material impact on our Consolidated Financial Statements.
In March 2006, the FASB issued SFAS No. 156, “Accounting for Servicing of Financial Assets—an amendment of FASB Statement No. 140” (SFAS 156), that provides guidance on accounting for separately recognized servicing assets and servicing liabilities. In accordance with the provisions of SFAS 156, separately recognized servicing assets and servicing liabilities must be initially measured at fair value, if practicable. Subsequent to initial recognition, the company may use either the amortization method or the fair value measurement method to account for servicing assets and servicing liabilities within the scope of this Statement. We will adopt SFAS 156 effective January 1, 2007. We do not expect the adoption of SFAS 156 to have a material effect on our Consolidated Financial Statements.
In July 2006, the FASB issued FASB Interpretation (FIN) No. 48, “Accounting for Uncertainty in Income Taxes—an interpretation of FASB Statement No. 109” (FIN 48), which prescribes a recognition threshold and measurement process for recording in the financial statements, uncertain tax positions taken or expected to be taken in a tax return. In addition, FIN 48 provides guidance on the derecognition, classification, accounting in interim periods and disclosure requirements for uncertain tax positions. We will adopt FIN 48 effective January 1, 2007. We do not expect the adoption of FIN 48 to have a material effect on our Consolidated Financial Statements.
In September 2006, the FASB issued SFAS No. 157, “Fair Value Measurements” (SFAS 157), which defines fair value, establishes a framework for measuring fair value and expands disclosures about fair value measurements. We will adopt SFAS 157 effective January 1, 2008. We are currently evaluating the impact, if any, that SFAS 157 will have on our Consolidated Financial Statements.
DISCLOSURE REGARDING FORWARD-LOOKING STATEMENTS
Certain parts of this annual report contain forward-looking statements that are based on current expectations, estimates and projections about the industries in which we operate and management’s beliefs and assumptions. Forward-looking statements are generally accompanied by words, such as “anticipates,” “expects,” “forecasts,” “intends,” “plans,” “believes,” “seeks,” “estimates” or similar expressions. These statements are not guarantees of future performance and involve certain risks, uncertainties and assumptions, which we refer to as “future factors,” which are difficult to predict. Therefore, actual
outcomes and results may differ materially from what is expressed or forecasted in such forward-looking statements. Future factors that could cause our results to differ materially from the results discussed in such forward-looking statements are discussed below. We undertake no obligation to update publicly any forward-looking statements, whether as a result of new information, future events or otherwise. Future factors that could affect the outcome of forward-looking statements include the following:
· price and product competition by foreign and domestic competitors, including new entrants;
· rapid technological developments of diesel engines;
· the ability to continue to introduce competitive new products in a timely, cost-effective basis;
· the sales mix of products;
· the achievement of lower costs and expenses;
· domestic and foreign governmental and public policy changes, including environmental regulations;
· protection and validity of patent and other intellectual property rights;
· reliance on large customers;
· technological, implementation and cost/financial risks in increasing use of large, multi-year contracts;
· the cyclical nature of our business;
· the outcome of pending and future litigation and governmental proceedings;
· continued availability of financing, financial instruments and financial resources in the amounts, at the times and on the terms required to support our future business; and
· other risk factors described in Part I of this report under the caption “RISK FACTORS RELATING TO OUR BUSINESS.’’
In addition, such statements could be affected by general industry and market conditions and growth rates, general domestic and international economic conditions, including the price of crude oil (diesel fuel), interest rate and currency exchange rate fluctuations and other future factors.
Item 7A. Quantitative and Qualitative Disclosures About Market Risk
We are exposed to financial risk resulting from volatility in foreign exchange rates, interest rates and commodity prices. This risk is closely monitored and managed through the use of financial derivative instruments including commodity forwardswap contracts, foreign currency forward contracts and interest rate swaps. As stated in our policies and procedures, financial instrumentsderivatives are used expressly for hedging purposes, and under no circumstances are they used for speculative purposes. Our hedging transactions are entered into with banking institutions that have strongWhen material,
we adjust the value of our derivative contracts for counter-party or our credit ratings, and thus the credit risk associated with these transactions is not considered significant.risk. The results and status of our hedging transactions are reported to senior management on a monthly and quarterly basis. Further information regarding financial instruments and risk management is contained in Note 1820, "DERIVATIVES," to the ourConsolidated Financial Statements.Statements.
The following describes our risk exposures and provides results of sensitivity analysesanalysis performed as of December 31, 2006.2009. The sensitivity analysis assumes instantaneous, parallel shifts in foreign currency exchange rates and commodity prices.
As a result of our international business presence, we are exposed to foreign currency exchange risk.risks. We transact business in foreign currencies and, have significant assets and liabilities denominated in foreign currencies. Asas a result our earnings experienceincome experiences some volatility related to movements in foreign currency exchange rates. In orderTo help manage our exposure to benefit from global diversification and after considering naturally offsetting currency positions,exchange rate volatility, we enter intouse foreign exchange forward contracts on a regular basis to minimize our existing exposures (recognized asset and liability) and hedge forecasted transactions.intercompany and third-party sales and purchases denominated in non-functional currencies. Our internal policy allows for managing anticipated foreign currency cash flow for up to one year. These foreign currency forward contracts are designated and qualify as foreign currency cash flow hedges under GAAP. The objectiveeffective portion of our hedging programthe unrealized gain or loss on the forward contract is to reducedeferred and reported as a component of "Accumulated other comprehensive loss" (AOCL). When the impacthedged forecasted transaction (sale or purchase) occurs, the unrealized gain or loss is reclassified into income in the same line item associated with the hedged transaction in the same period or periods during which the hedged transaction affects income. The ineffective portion of changesthe hedge, unrealized gain or loss, if any, is recognized in foreign exchange rates on earnings by essentially creating offsetting currency exposures.
current income during the period of change. As of December 31, 2006,2009, the amount expected to be reclassified to income over the next year is not material. For the years ended December 31, 2009, and 2008, there were no circumstances that would have resulted in the discontinuance of a cash flow hedge.
To minimize the income volatility resulting from the remeasurement of net monetary assets and payables denominated in a currency other than the functional currency, we enter into foreign currency forward contracts, which are considered economic hedges. The objective is to offset the gain or loss from remeasurement with the gain or loss from the fair market valuation of the forward contract. These derivative instruments are not designated as hedges under GAAP.
As of December 31, 2009, the potential gain or loss in the fair value of our outstanding foreign currency contracts, assuming a hypothetical 10 percent fluctuation in the currencies of such contracts, would be approximately $7$31 million. The sensitivity analysis of the effects of changes in foreign currency exchange rates assumes the notional value to remain constant for the next 12 months. The analysis ignores the impact of foreign exchange movements on our competitive position and potential changes in sales levels. It should be noted that any change in the value of the contracts, real or hypothetical, would be significantly offset by an inverse change in the value of the underlying hedged items (see Note 1820, "DERIVATIVES," to the ourConsolidated Financial Statements).
We are also exposed to interest ratemarket risk as a result of our indebtedness. Our objective in managing our exposure to changesfrom fluctuations in interest rates is to limit the effect of interest rate changes on earnings and cash flows and to lowerrates. We manage our overall cost of borrowing. To achieve this objective, we primarily use interest rate swap agreements to manage exposure to interest rate changes relatedfluctuations through the use of interest rate swaps. The objective of the swaps is to more effectively balance our borrowing arrangements.costs and interest rate risk.
In November 2005, we entered into an interest rate swap to effectively convert our $250 million debt, due in 2028, debt from a fixed rate of 7.125% to a floating rate based on a LIBOR spread. The terms of the swap mirror those of the debt, with interest paid semi-annually. This swap qualifies as a fair value hedge under SFAS No. 133, “Accounting for Derivative Instruments and Hedging Activities.”
In November 2002, we terminated an interest rate swap relating to our 6.45% notes that matured in 2005. The swap acted as a fair value hedge and converted $225 million notional amount from fixed rate debt into floating rate debt that matured in 2005. The termination of this swap resulted in a $12 million gain.GAAP. The gain was amortizedor loss on this derivative instrument as well as the offsetting gain
or loss on the hedged item attributable to earningsthe hedged risk are recognized in current income as a reduction of interest expense over"Interest expense." These gains and losses for the remaining life of the debt. The amount of gain recognized during 2005 and 2004 was $1 million and $5 million, respectively. As ofyear December 31, 2005, there was no longer any deferred gain remaining on our Consolidated Balance Sheets (see Note 18 to the Consolidated Financial Statements).2009, were as follows:
| | December 31, 2009 | ||||||
|---|---|---|---|---|---|---|---|
In millions Income Statement Classification | Gain/(Loss) on Swaps | Gain/(Loss) on Borrowings | |||||
Interest expense | $ | (54 | ) | $ | 54 | ||
We are also exposed to fluctuations in commodity prices through the purchase of raw materials as well asdue to contractual agreements with component suppliers. To reduce the effect of raw materialIn order to protect ourselves against future price changes for select commodities,volatility and, consequently, fluctuations in gross margins, we periodically enter into commodity forwardswap contracts with designated banks to hedge afix the cost of certain raw material purchases with the objective of minimizing changes in inventory cost due to market price fluctuations. The commodity swap contracts are derivative contracts that are designated as cash flow hedges under GAAP. The effective portion of our anticipated raw material purchases.
the unrealized gain or loss is deferred and reported as a component of AOCL. When the hedged forecasted transaction (purchase) occurs, the unrealized gain or loss is reclassified into income in the same line item associated with the hedged transaction in the same period or periods during which the hedged transaction affects income. The ineffective portion of the hedge, if any, is recognized in current income in the period in which the ineffectiveness occurs. As of December 31, 2006,2009, we expect to reclassify an unrealized net gain of $5 million from AOCL to income over the next year. For the year ended December 31, 2009, we discontinued hedge accounting on certain contracts where the forecasted transactions were no longer probable. The amount reclassified to income as a result of this action was a loss of $4 million. Our internal policy allows for managing these cash flow hedges for up to three years.
As of December 31, 2009, the potential gain or loss related to the outstanding commodity forwardswap contracts, assuming a hypothetical 10 percent fluctuation in the price of such commodities, was $13$10 million. The sensitivity analysis of the effects of changes in commodity prices assumes the notional value to remain constant for the next 12 months. The analysis ignores the impact of commodity price movements on our competitive position and potential changes in sales levels. It should be noted that any change in the value
of the forwardswap contracts, real or hypothetical, would be significantly offset by an inverse change in the value of the underlying hedged items (see Note 1820, "DERIVATIVES," to theConsolidated Financial Statements).
Item 8. Financial Statements and Supplementary Data
See Item 15 (a) for an index to the Consolidated Financial Statements.
Item 9. Changes In and Disagreements with Accountants on Accounting and Financial Disclosure.
None.
Item 9A. Controls and Procedures
Evaluation of Disclosure Controls and Procedures.
As of the end of the period covered by this Annual Report on Form 10-K, the Company carried out an evaluation under the supervision and with the participation of the Company’s management, including the Chief Executive Officer and Chief Financial Officer of the effectiveness of the design and operation of the Company’s disclosure controls and procedures as defined in Exchange Act Rules 13a-15(e) and 15d-15(e). Based upon that evaluation, the Chief Executive Officer and the Chief Financial Officer concluded that the Company’s disclosure controls and procedures were effective to ensure that the information required to be disclosed by the Company in the reports that it files or submits under the Securities Exchange Act of 1934 is (1) recorded, processed, summarized and reported within the time periods specified in the SEC’s rules and forms, and (2) accumulated and communicated to management, including the Chief Executive Officer and Chief Financial Officer, to allow timely decisions regarding required disclosure.
Changes in Internal Control over Financial Reporting
There has been no change in the Company’s internal control over financial reporting during the quarter ended December 31, 2006, that has materially affected, or is reasonably likely to materially affect, the Company’s internal control over financial reporting.
Management’s Report on Internal Control Over Financial Reporting
Management is responsible for establishing and maintaining adequate internal control over financial reporting. The Company’s internal control over financial reporting is a process designed to provide reasonable assurance regarding the reliability of financial reporting and preparation of the Company’s consolidated financial statements for external purposes in accordance with accounting principles generally accepted in the United States of America.
The Company’s internal control over financial reporting includes those policies and procedures that:
· pertain to the maintenance of records that, in reasonable detail, accurately and fairly reflect the transactions and dispositions of the assets of the Company;
· provide reasonable assurance that transactions are recorded as necessary to permit preparation of financial statements in accordance with generally accepted accounting principles, and that receipts and expenditures of the Company are being made only in accordance with authorizations of management and directors of the Company; and
· provide reasonable assurance regarding prevention or timely detection of unauthorized acquisition, use, or disposition of the Company’s assets that could have a material effect on the financial statements.
Internal control over financial reporting is a process that involves human diligence and compliance and is subject to lapses in judgment and breakdowns resulting from human failures. Internal control over financial reporting can be circumvented by collusion or improper management override. Because of such limitations, there is a risk that material misstatements may not be prevented or detected on a timely basis by internal control over financial reporting. However, these inherent limitations are known features of the financial reporting process. It is possible to design into the process safeguards to reduce, though not eliminate, the risk material misstatements may not be prevented or detected on a timely basis. Also, projections of any evaluation of effectiveness to future periods are subject to the risk that controls may become inadequate because of changes in conditions, or the degree of compliance with policies or procedures may deteriorate.
Management assessed the effectiveness of the Company’s internal control over financial reporting and concluded it was effective as of December 31, 2006. In making its assessment, management utilized the criteria set forth by the Committee of Sponsoring Organizations of the Treadway Commission in Internal Control—Integrated Framework.
Management’s assessment of the effectiveness of our internal control over financial reporting as of December 31, 2006, has been audited by PricewaterhouseCoopers LLP, an independent registered public accounting firm, as stated in their report which appears herewith in this Form 10-K.
None.
65
Item 10. Directors and Executive Officers of the Registrant
The information required by Item 10 relating to identification of directors is incorporated by reference from “Election of Directors” in our Proxy Statement. Except as otherwise specifically incorporated by reference, the Proxy Statement is not deemed to be filed as part of this report.
Following are the names and ages of the executive officers of Cummins Inc., their positions with us as of January 31, 2007, and summaries of their backgrounds and business experience:
|
|
| ||||
|
| |||||
|
|
| ||||
|
|
| ||||
|
|
| ||||
|
|
| ||||
|
|
| ||||
|
|
| ||||
|
|
| ||||
|
|
| ||||
|
|
| ||||
|
|
| ||
|
|
| ||
|
|
The Chairman and Chief Executive Officer is elected annually by the Board of Directors and holds office until the first meeting of the Board of Directors following the annual meeting of the shareholders. Other officers are appointed by the Chairman and Chief Executive Officer, are ratified by the Board of Directors and hold office for such period as the Chairman and Chief Executive Officer or the Board of Directors may prescribe.
Item 11. Executive Compensation
The information in the Proxy Statement under the caption “Executive Compensation” and “Summary Compensation Table” is incorporated by reference.
Item 12. Security Ownership of Certain Beneficial Owners and Management and Related Stockholder Matters
(a) The information on the security ownership of certain beneficial owners in the Proxy Statement under the caption “Principal Security Ownership” is incorporated by reference.
(b) The information on shares of common stock of Cummins Inc. beneficially owned by, and under option to (i) each director, (ii) certain named executive officers and (iii) the directors and officers as a group, contained in the Proxy Statement under the captions “Election of Directors” and “Security Ownership of Management” is incorporated by reference.
(c) Change in control—None.
Item 13. Certain Relationships and Related Transactions
The information in the Proxy Statement under the caption “The Board of Directors and Its Committees,” “Executive Compensation” and “Other Transactions and Agreements with Directors and Officers” is incorporated by reference.
Item 14. Principal Accountant Fees and Services
The information required by Item 14 is incorporated by reference from the information under the caption “Selection of Independent Public Accountants” in the Proxy Statement.
Item 15. Exhibits and Financial Statement Schedules
(a) The following documents are filed as part of this report:
(1) Index to Financial Statements
·
· for the years ended December 31, 2009, 2008 and 2007
| NOTE 1 | SUMMARY OF SIGNIFICANT ACCOUNTING POLICIES | |
| NOTE 2 | INVESTMENTS IN EQUITY INVESTEES | |
| NOTE 3 | RESTRUCTURING AND OTHER CHARGES | |
| NOTE 4 | INCOME TAXES | |
| NOTE 5 | MARKETABLE SECURITIES | |
| NOTE 6 | FAIR VALUE OF FINANCIAL INSTRUMENTS | |
| NOTE 7 | INVENTORIES | |
| NOTE 8 | PROPERTY, PLANT AND EQUIPMENT | |
| NOTE 9 | GOODWILL AND OTHER INTANGIBLE ASSETS | |
| NOTE 10 | DEBT | |
| NOTE 11 | PRODUCT WARRANTY LIABILITY | |
| NOTE 12 | PENSION AND OTHER POSTRETIREMENT BENEFITS | |
| NOTE 13 | OTHER LIABILITIES AND DEFERRED REVENUE | |
| NOTE 14 | COMMITMENTS AND CONTINGENCIES | |
| NOTE 15 | CUMMINS INC. SHAREHOLDERS' EQUITY | |
| NOTE 16 | OTHER COMPREHENSIVE INCOME (LOSS) | |
| NOTE 17 | STOCK INCENTIVE AND STOCK OPTION PLANS | |
| NOTE 18 | NONCONTROLLING INTERESTS | |
| NOTE 19 | EARNINGS PER SHARE | |
| NOTE 20 | DERIVATIVES | |
| NOTE 21 | SALES OF ACCOUNTS RECEIVABLE | |
| NOTE 22 | ACQUISITIONS AND DIVESTITURES | |
| NOTE 23 | VARIABLE INTEREST ENTITIES | |
| NOTE 24 | OTHER (EXPENSE) INCOME | |
| NOTE 25 | OPERATING SEGMENTS |
(b)Table of Contents Exhibit Index (pp. 127-128)
68
MANAGEMENT’SMANAGEMENT'S REPORT TO SHAREHOLDERS
Management’s Management's Report on Financial Statements and Practices
The accompanying consolidated financial statementsConsolidated Financial Statements of Cummins Inc, (the “Company”)our Company were prepared by management, which is responsible for their integrity and objectivity. The statements were prepared in accordance with generally accepted accounting principles and include amounts that are based on management’smanagement's best judgments and estimates. The other financial information included in the annual report is consistent with that in the financial statements.
Management also recognizes its responsibility for conducting the Company’sour affairs according to the highest standards of personal and corporate conduct. This responsibility is characterized and reflected in key policy statements issued from time to time regarding, among other things, conduct of its business activities within the laws of the host countries and thein which we operate, within The Foreign Corrupt Practices Act in which the Company operates and potentially conflicting interests of its employees. The Company maintainsWe maintain a systematic program to assess compliance with these policies.
To comply with the requirements of Section 404 of the Sarbanes-Oxley Act of 2002, the Companywe designed and implemented a structured and comprehensive compliance process to evaluate itsour internal control over financial reporting across the enterprise.
Management’sManagement's Report on Internal Control Over Financial Reporting
Management is responsible for establishing and maintaining adequate internal control over financial reporting. The Company’sCompany's internal control over financial reporting is a process designed to provide reasonable assurance regarding the reliability of financial reporting and preparation of the Company’s consolidated financial statementsCompany'sConsolidated Financial Statements for external purposes in accordance with accounting principles generally accepted in the United States of America.
The Company’s internal control over financial reporting includes those policies and procedures that:
· pertain to the maintenance of records that, in reasonable detail, accurately and fairly reflect the transactions and dispositions of the assets of the Company;
· provide reasonable assurance that transactions are recorded as necessary to permit preparation of financial statements in accordance with generally accepted accounting principles, and that receipts and expenditures of the Company are being made only in accordance with authorizations of management and directors of the Company; and
· provide reasonable assurance regarding prevention or timely detection of unauthorized acquisition, use, or disposition of the Company’s assets that could have a material effect on the financial statements.
Internal control over financial reporting is a process that involves human diligence and compliance and is subject to lapses in judgment and breakdowns resulting from human failures. Internal control over financial reporting can be circumvented by collusion or improper management override. Because of such limitations, there is a risk that material misstatements may not be prevented or detected on a timely basis by internal control over financial reporting. However, these inherent limitations are known features of the financial reporting process. It is possible to design into the process safeguards to reduce, though not eliminate, the risk material misstatements may not be prevented or detected on a timely basis. Also, projections of any evaluation of effectiveness to future periods are subject to the risk that controls may become inadequate because of changes in conditions, or the degree of compliance with policies or procedures may deteriorate.
Management assessed the effectiveness of the Company’sour internal control over financial reporting and concluded it was effective as of December 31, 2006.2009. In making its assessment, management utilized the criteria set forth by the Committee of Sponsoring Organizations of the Treadway Commission in Internal Control—Integrated Framework.
Management’s assessment The effectiveness of the effectiveness of ourCompany's internal control over financial reporting as of December 31, 2006,2009, has been audited by PricewaterhouseCoopers LLP, an independent registered public accounting firm, as stated in their report which appears herewith in this Form 10-K.herein.
Please refer to Exhibits 31(a) and 31(b) attached to this report for certifications required under Section 302 of the Sarbanes-Oxley Act of 2002.
| /s/ THEODORE M. SOLSO |
| |
Chairman and Chief Executive Officer | /s/ PATRICK J. WARD | |
Financial Officer |
70
REPORT OF INDEPENDENT REGISTERED PUBLIC ACCOUNTING FIRM
Report of Independent Registered Public Accounting Firm
Tothe Board of Directors and Shareholders of Cummins Inc.:
We have completed integrated audits of Cummins Inc.’s consolidated financial statements and of its internal control over financial reporting as of December 31, 2006, in accordance with the standards of the Public Company Accounting Oversight Board (United States). Our opinions, based on our audits, are presented below.
Consolidated financial statements
In our opinion, the accompanying consolidated financial statements listed in the index appearing under Item 15(a)(1) present fairly, in all material respects, the financial position of Cummins Inc. and its subsidiaries at December 31, 20062009 and 2005,2008, and the results of their operations and their cash flows for each of the three years in the period ended December 31, 20062009 in conformity with accounting principles generally accepted in the United States of America. TheseAlso, in our opinion, the Company maintained, in all material respects, effective internal control over financial reporting as of December 31, 2009, based on criteria established inInternal Control—Integrated Framework issued by the Committee of Sponsoring Organizations of the Treadway Commission (COSO). The Company's management is responsible for these financial statements, are the responsibilityfor maintaining effective internal control over financial reporting and for its assessment of the Company’s management.effectiveness of internal control over financial reporting, included in the accompanying "Management's Report on Internal Control over Financial Reporting". Our responsibility is to express an opinionopinions on these financial statements, and on the Company's internal control over financial reporting based on our integrated audits. We conducted our audits of these statements in accordance with the standards of the Public Company Accounting Oversight Board (United States). Those standards require that we plan and perform the auditaudits to obtain reasonable assurance about whether the financial statements are free of material misstatement. An auditmisstatement and whether effective internal control over financial reporting was maintained in all material respects. Our audits of the financial statements includesincluded examining, on a test basis, evidence supporting the amounts and disclosures in the financial statements, assessing the accounting principles used and significant estimates made by management, and evaluating the overall financial statement presentation. Our audit of internal control over financial reporting included obtaining an understanding of internal control over financial reporting, assessing the risk that a material weakness exists, and testing and evaluating the design and operating effectiveness of internal control based on the assessed risk. Our audits also included performing such other procedures as we considered necessary in the circumstances. We believe that our audits provide a reasonable basis for our opinion.opinions.
As described in Note 2, Variable Interest Entities, effective March 28, 2004, the Company adopted FASB Interpretation No. 46, “Consolidation of Variable Interest Entities (and its December 2003 revisions)” for its interest in certain variable interest entities. As described in Note 12, Pension and Other Postretirement Benefits, effective December 31, 2006, the Company adopted SFAS No. 158, “Employers’ Accounting for Defined Benefit Plans and Other Postretirement Plans—an amendment of FASB Statements No. 87, 88, 106 and 123(R).” As described in Note 19, Stock Incentive and Stock Option Plans, effective January 1, 2006, the Company adopted SFAS No. 123 (Revised 2004), Share-Based Payment.”
Internal control over financial reporting
Also, in our opinion, management’s assessment, included in “Management’s Report on Internal Control Over Financial Reporting” appearing under Item 9A, that the Company maintained effective internal control over financial reporting as of December 31, 2006 based on criteria established in Internal Control—Integrated Framework issued by the Committee of Sponsoring Organizations of the Treadway Commission (COSO), is fairly stated, in all material respects, based on those criteria. Furthermore, in our opinion, the Company maintained, in all material respects, effective internal control over financial reporting as of December 31, 2006, based on criteria established in Internal Control—Integrated Framework issued by COSO. The Company’s management is responsible for maintaining effective internal control over financial reporting and for its assessment of the effectiveness of internal control over financial reporting. Our responsibility is to express opinions on management’s assessment and on the effectiveness of the Company’s internal control over financial reporting based on our audit. We conducted our audit of internal control over financial reporting in accordance with the standards of the Public Company Accounting Oversight Board (United States). Those standards require that we plan and perform the audit to obtain reasonable assurance about whether effective internal control over financial reporting was maintained in all material respects. An audit of internal control over financial reporting includes obtaining an understanding of internal control over financial reporting, evaluating management’s assessment, testing and evaluating the design and operating effectiveness of internal control, and performing such other
procedures as we consider necessary in the circumstances. We believe that our audit provides a reasonable basis for our opinions.
A company’scompany's internal control over financial reporting is a process designed to provide reasonable assurance regarding the reliability of financial reporting and the preparation of financial statements for external purposes in accordance with generally accepted accounting principles. A company’scompany's internal control over financial reporting includes those policies and procedures that (i) pertain to the maintenance of records that, in reasonable detail, accurately and fairly reflect the transactions and dispositions of the assets of the company; (ii) provide reasonable assurance that transactions are recorded as necessary to permit preparation of financial statements in accordance with generally accepted accounting principles, and that receipts and expenditures of the company are being made only in accordance with authorizations of management and directors of the company; and (iii) provide reasonable assurance regarding prevention or timely detection of unauthorized acquisition, use, or disposition of the company’scompany's assets that could have a material effect on the financial statements.
Because of its inherent limitations, internal control over financial reporting may not prevent or detect misstatements. Also, projections of any evaluation of effectiveness to future periods are subject to the risk that controls may become inadequate because of changes in conditions, or that the degree of compliance with the policies or procedures may deteriorate.
/s/ PricewaterhouseCoopers LLP
Indianapolis, Indiana
February 25, 2010
| |
| |
| |
CUMMINS INC. AND Years ended December 31, 2006 2005 2004 Millions Net sales (includes related party sales of $1,431, $1,213 and $812, respectively) $ 11,362 $ 9,918 $ 8,438 Cost of sales (includes related party purchases of $272, $190 and $258, respectively) 8,767 7,732 6,758 Gross margin 2,595 2,186 1,680 Operating expenses and income Selling and administrative expenses 1,283 1,145 1,015 Research and engineering expenses 321 278 241 Investee equity, royalty and other income (Note 3) (140 ) (131 ) (120 ) Other operating expenses — — 5 Total operating expenses and income 1,464 1,292 1,141 Operating earnings 1,131 894 539 Interest income (47 ) (24 ) (12 ) Interest expense (Note 11) 96 109 111 Other expenses (income) (1 ) 11 8 Earnings before income taxes and minority interests 1,083 798 432 Provision for income taxes (Note 9) 324 216 56 Minority interests in earnings of consolidated subsidiaries 44 32 26 Net earnings $ 715 $ 550 $ 350 Earnings per common share (Note 17) Basic $ 15.02 $ 12.43 $ 8.30 Diluted $ 14.21 $ 11.01 $ 7.39 NET SALES(a) Cost of sales GROSS MARGIN OPERATING EXPENSES AND INCOME Selling, general and administrative expenses Research, development and engineering expenses Equity, royalty and interest income from investees (Note��2) Restructuring and other charges (Note 3) Other operating (expense) income, net OPERATING INCOME Interest income Interest expense (Note 10) Other (expense) income, net (Note 24) INCOME BEFORE INCOME TAXES Income tax expense (Note 4) NET INCOME Less: Net income attributable to noncontrolling interests NET INCOME ATTRIBUTABLE TO CUMMINS INC. EARNINGS PER COMMON SHARE ATTRIBUTABLE TO CUMMINS INC. (Note 19) Basic Diluted The accompanying notes are an integral part of CUMMINS INC. AND December 31, 2006 2005 Millions, ASSETS Current assets Cash and cash equivalents $ 840 $ 779 Marketable securities (Note 4) 95 61 Receivables, net (includes related party receivables of $180 and $109, respectively) 1,767 1,423 Inventories (Note 6) 1,393 1,174 Deferred income taxes (Note 9) 277 363 Prepaid expenses and other current assets 116 116 Total current assets 4,488 3,916 Long-term assets Property, plant and equipment, net (Note 7) 1,574 1,557 Investments in and advances to equity investees (Note 3) 345 278 Goodwill (Note 8) 356 358 Other intangible assets, net (Note 8) 128 100 Deferred income taxes (Note 9) 433 500 Other assets 141 176 Total assets $ 7,465 $ 6,885 LIABILITIES AND SHAREHOLDERS’ EQUITY Current liabilities Short-term borrowings (Note 11) $ 164 $ 154 Accounts payable 1,104 904 Other accrued expenses (Note 10) 1,131 1,160 Total current liabilities 2,399 2,218 Long-term liabilities Long-term debt (Note 11) 647 1,213 Pensions (Note 12) 367 396 Postretirement benefits other than pensions (Note 12) 523 554 Other liabilities and deferred revenue 473 415 Total liabilities 4,409 4,796 Commitments and contingencies (Note 14) — — Minority interests (Note 15) 254 225 Shareholders’ equity (Note 16) Common stock, $2.50 par value, 150 shares authorized, 55.0 and 48.5 shares issued 137 121 Additional contributed capital 1,500 1,201 Retained earnings 2,009 1,360 Accumulated other comprehensive loss Defined other postretirement benefits (3 ) — Defined benefit pension plans (508 ) — Minimum pension liability adjustment — (523 ) Foreign currency translation adjustments (25 ) (84 ) Unrealized gain on marketable securities 2 3 Unrealized gain on derivatives 8 1 Total accumulated other comprehensive loss (526 ) (603 ) Common stock in treasury, at cost, 2.9 and 2.0 shares (212 ) (101 ) Common stock held in trust for employee benefit plans, 1.9 and 2.0 shares (92 ) (97 ) Unearned compensation (14 ) (17 ) Total shareholders’ equity 2,802 1,864 Total liabilities and shareholders’ equity $ 7,465 $ 6,885 ASSETS Current assets Cash and cash equivalents Marketable securities (Note 5) Accounts and notes receivable, net Trade and other Nonconsolidated equity investees Inventories (Note 7) Deferred income taxes (Note 4) Prepaid expenses and other current assets Total current assets Long-term assets Property, plant and equipment, net (Note 8) Investments and advances related to equity method investees (Note 2) Goodwill (Note 9) Other intangible assets, net (Note 9) Deferred income taxes (Note 4) Other assets Total assets LIABILITIES Current liabilities Loans payable (Note 10) Accounts payable (principally trade) Current portion of accrued product warranty (Note 11) Accrued compensation, benefits and retirement costs Deferred revenue Taxes payable (including taxes on income) Other accrued expenses Total current liabilities Long-term liabilities Long-term debt (Note 10) Pensions (Note 12) Postretirement benefits other than pensions (Note 12) Other liabilities and deferred revenue (Note 13) Total liabilities Commitments and contingencies (Note 14) EQUITY Cummins Inc. shareholders' equity (Note 15) Common stock, $2.50 par value, 500 shares authorized, 222.0 and 221.7 shares issued Retained earnings Treasury stock, at cost, 20.7 and 20.4 shares Common stock held by employee benefits trust, at cost, 3.0 and 5.1 shares Unearned compensation Accumulated other comprehensive loss Defined benefit postretirement plans Other Total accumulated other comprehensive loss Total Cummins Inc. shareholders' equity Noncontrolling interests (Note 18) Total equity Total liabilities and equity The accompanying notes are an integral part of CUMMINS INC. AND Years ended December 31, 2006 2005 2004 Millions Cash flows from operating activities Net earnings $ 715 $ 550 $ 350 Adjustments to reconcile net earnings to net cash provided by operating activities: Depreciation and amortization 296 295 272 Loss on disposal of property, plant and equipment 5 4 11 Gain on disposal of a business (9 ) — — Deferred income tax provision (benefit) 139 124 (51 ) Investee equity, net of dividends (38 ) 7 (28 ) Minority interests in earnings of consolidated subsidiaries 44 32 26 Pension expense (Note 12) 120 103 89 Pension contributions (266 ) (151 ) (135 ) Stock-based compensation expense 18 16 16 Tax benefit on stock based awards — 7 27 Amortization of gain on terminated interest rate swaps — (1 ) (6 ) Translation and hedging activities (26 ) 11 (8 ) Changes in current assets and liabilities: Receivables (301 ) (309 ) (163 ) Inventories (158 ) (187 ) (204 ) Other current assets (4 ) (9 ) (10 ) Accounts payable 149 108 210 Accrued expenses 88 89 237 Changes in long-term liabilities 23 88 (13 ) Other, net 45 (17 ) (6 ) Net cash provided by operating activities 840 760 614 Cash flows from investing activities Capital expenditures (249 ) (186 ) (151 ) Investments in internal use software (52 ) (39 ) (33 ) Proceeds from disposals of property, plant and equipment 49 21 12 Investments in and advances to equity investees (18 ) (13 ) (19 ) Acquisitions of businesses, net of cash acquired (2 ) (2 ) (18 ) Proceeds from disposal of a business 24 — — Investments in marketable securities—acquisitions (303 ) (123 ) (122 ) Investments in marketable securities—liquidations 273 126 149 Other, net 1 4 1 Net cash used in investing activities (277 ) (212 ) (181 ) Cash flows from financing activities Proceeds from borrowings 94 84 13 Payments on borrowings and capital lease obligations (400 ) (378 ) (51 ) Net borrowings under short-term credit agreements (3 ) 2 20 Distributions to minority shareholders (20 ) (18 ) (8 ) Dividend payments on common stock (66 ) (56 ) (53 ) Proceeds from issuing common stock 9 30 148 Repurchases of common stock (121 ) (38 ) — Tax benefit on stock based awards 6 — — Other, net (7 ) 2 (3 ) Net cash (used in) provided by financing activities (508 ) (372 ) 66 Effect of exchange rate changes on cash and cash equivalents 6 (8 ) 4 Net increase in cash and cash equivalents 61 168 503 Cash and cash equivalents at beginning of year 779 611 108 Cash and cash equivalents at end of year $ 840 $ 779 $ 611 CASH FLOWS FROM OPERATING ACTIVITIES Net income Adjustments to reconcile net income to net cash provided by operating activities: Restructuring charges, net Depreciation and amortization Loss on investments Deferred income tax provision (benefit) Equity in income of investees, net of dividends Pension expense, net of pension contributions Other post-retirement benefits expense, net of cash payments Stock-based compensation expense Excess tax deficiencies (benefits) on stock-based awards Translation and hedging activities Changes in current assets and liabilities, net of acquisitions and dispositions (Note 1) Changes in long-term liabilities Other, net Net cash provided by operating activities CASH FLOWS FROM INVESTING ACTIVITIES Capital expenditures Investments in internal use software Proceeds from disposals of property, plant and equipment Investments in and advances to equity investees Acquisitions of businesses, net of cash acquired Proceeds from the sale of businesses Investments in marketable securities—acquisitions Investments in marketable securities—liquidations Cash flows from derivatives not designated as hedges Purchase of other investments Other, net Net cash used in investing activities CASH FLOWS FROM FINANCING ACTIVITIES Proceeds from borrowings Payments on borrowings and capital lease obligations Net (payments) borrowings under short-term credit agreements Distributions to noncontrolling interests Dividend payments on common stock Proceeds from sale of common stock held by employee benefits trust Repurchases of common stock Excess tax (deficiencies) benefits on stock-based awards Other, net Net cash used in financing activities EFFECT OF EXCHANGE RATE CHANGES ON CASH AND CASH EQUIVALENTS Net increase (decrease) in cash and cash equivalents Cash and cash equivalents at beginning of year CASH AND CASH EQUIVALENTS AT END OF YEAR The accompanying notes are an integral part of CUMMINS INC. AND Accumulated Common Additional Other Common Stock Total Common Contributed Retained Comprehensive Stock in Held in Unearned Shareholders’ Stock Capital Earnings (Loss) Earnings Treasury Trust Compensation Equity Millions Balance at December 31, 2003 $ 121 $ 1,113 $ 569 $ (492 ) $ (225 ) $ (113 ) $ (24 ) $ 949 Comprehensive income: Net earnings 350 350 Other comprehensive earnings (loss): Unrealized loss on marketable securities (4 ) (4 ) Unrealized gain on derivatives 1 1 Foreign currency translation adjustments 20 20 Minimum pension liability adjustments (65 ) (65 ) Total comprehensive income 302 Issuance of shares 4 137 141 Cash dividends on common stock (53 ) (53 ) Stock option exercises 37 37 Other shareholder transactions 13 9 3 25 Balance at December 31, 2004 121 1,167 866 (540 ) (88 ) (104 ) (21 ) 1,401 Comprehensive income: Net earnings 550 550 Other comprehensive earnings (loss): Unrealized gain on marketable securities 2 2 Unrealized loss on derivatives (2 ) (2 ) Foreign currency translation adjustments (39 ) (39 ) Minimum pension liability adjustments (24 ) (24 ) Total comprehensive income 487 Issuance of shares 9 25 34 Acquisition of shares (38 ) (38 ) Cash dividends on common stock (56 ) (56 ) Stock option exercises 12 12 Other shareholder transactions 13 7 4 24 Balance at December 31, 2005 121 1,201 1,360 (603 ) (101 ) (97 ) (17 ) 1,864 Comprehensive income: Net earnings 715 715 Other comprehensive earnings (loss): Unrealized loss on marketable securities (1 ) (1 ) Unrealized gain on derivatives 7 7 Foreign currency translation adjustments 63 63 Minimum pension liability adjustments 102 102 Total comprehensive income 886 Issuance of shares 1 10 10 21 Acquisition of shares (121 ) (121 ) Cash dividends on common stock (66 ) (66 ) Stock option exercises 1 1 Adjustment to initially apply SFAS No. 158 (94 ) (94 ) Debt conversion 15 276 291 Other shareholder transactions 12 5 3 20 Balance at December 31, 2006 $ 137 $ 1,500 $ 2,009 $ (526 ) $ (212 ) $ (92 ) $ (14 ) $ 2,802 BALANCE AT DECEMBER 31, 2006 Comprehensive income: Net income Other comprehensive income (loss): Unrealized gain on marketable securities Unrealized loss on derivatives Foreign currency translation adjustments Change in pensions and other postretirement defined benefit plans Total comprehensive income Issuance of shares Stock splits Employee benefits trust activity Acquisition of shares Reduction of noncontrolling interests Cash dividends on common stock Distributions to noncontrolling interests Stock option exercises Other shareholder transactions BALANCE AT DECEMBER 31, 2007 Comprehensive income: Net income Other comprehensive income (loss): Unrealized loss on marketable securities Unrealized loss on derivatives Foreign currency translation adjustments Change in pensions and other postretirement defined benefit plans Total comprehensive income Effect of changing pension plan measurement date Issuance of shares Employee benefits trust activity Acquisition of shares Reduction of noncontrolling interests Cash dividends on common stock Distributions to noncontrolling interests Stock option exercises Other shareholder transactions BALANCE AT DECEMBER 31, 2008 CUMMINS INC. AND SUBSIDIARIES BALANCE AT DECEMBER 31, 2008 Comprehensive income: Net income Other comprehensive income (loss): Unrealized gain on derivatives Foreign currency translation adjustments Change in pensions and other postretirement defined benefit plans Total comprehensive income Issuance of shares Employee benefits trust activity Acquisition of shares Cash dividends on common stock Distributions to noncontrolling interests Stock option exercises Conversion to capital lease (Note 14) Other shareholder transactions BALANCE AT DECEMBER 31, 2009 The accompanying notes are an integral part of CUMMINS INC. AND NOTE 1. SUMMARY OF SIGNIFICANT ACCOUNTING POLICIES Cummins Inc. OurConsolidated Financial Statements include the accounts of all wholly-owned and majority-owned domestic and foreign subsidiaries where our ownership is more than 50 percent of common stock except for majority-owned subsidiaries that are considered Variable Interest Entities (VIEs) where we are not deemed the primary beneficiary. In addition, we also consolidate, regardless of our ownership percentage, VIEs for which we are deemed to be the primary beneficiary. Intercompany balances and transactions are eliminated in Certain amounts for We use the equity method to account for our investments in joint ventures, affiliated companies and alliances in which we have the ability to exercise significant influence, generally represented by common stock ownership or partnership equity of at least 20 percent but not more than 50 percent. Generally, under the equity method, original investments in these entities are recorded at cost and subsequently adjusted by our share of equity in Our foreign equity investees are presented net of applicable foreign income taxes in ourConsolidated Statements of Income. The vast majority of our U.S. equity investees are partnerships NOTES TO CONSOLIDATED FINANCIAL STATEMENTS (Continued) NOTE 1. SUMMARY OF SIGNIFICANT ACCOUNTING POLICIES (Continued) (non-taxable), thus there is no difference between gross or net of tax presentation as the investees are not taxed. Preparation of financial statements in conformity with accounting principles generally accepted in the United States of America (GAAP) requires management to make estimates and assumptions that affect reported amounts presented and disclosed in ourConsolidated Financial Statements. Significant estimates and assumptions in theseConsolidated Financial Statements require the exercise of judgment and are used for, but not limited to, allowance for doubtful accounts, estimates of future cash flows and other assumptions associated with goodwill and long-lived asset impairment tests, useful lives for depreciation and amortization, warranty programs, determination of discount and other rate assumptions for pension and other postretirement benefit expenses, restructuring costs, income taxes and deferred tax valuation allowances, lease classification, and contingencies. Due to the inherent uncertainty involved in making estimates, actual results reported in future periods may be different from these estimates. We recognize revenue, net of estimated costs of returns, allowances and sales incentives, when it is realized or realizable, which generally occurs Products are generally sold on open account under credit terms customary to the geographic region of distribution. We perform ongoing credit evaluations of our customers and generally do not require collateral to secure our accounts receivable. For engines, service parts, service tools and other items sold to independent distributors and to partially-owned distributors accounted for under the equity method, revenues are recorded when title and risk of ownership transfers. This transfer is based on the agreement in effect with the respective distributor and in the United States (U.S.) and most international locations generally occurs We provide various sales incentives to both our distribution network and our OEM customers. These programs are designed to promote the sale of our product in the channel or encourage the usage of our products by OEM customers. Sales incentives primarily fall into three categories: NOTES TO CONSOLIDATED FINANCIAL STATEMENTS (Continued) NOTE 1. SUMMARY OF SIGNIFICANT ACCOUNTING POLICIES (Continued) For volume rebates, we provide certain customers with rebate opportunities for attaining specified volumes during a particular quarter or year. We accrue for the expected amount of these rebates at the time of the original sale and update our accruals quarterly based on our best estimate of the volume levels the customer will reach during the measurement period. For market share rebates, we provide certain customers with rebate opportunities based on the percentage of their production that utilizes a Cummins product. These rebates are typically measured either quarterly or annually and are accrued at the time of the original sale based on the current market shares, with adjustments made as the level changes. For aftermarket rebates we provide incentives to promote sales to certain dealers and end-markets. These rebates are typically paid on a quarterly, or more frequent, basis and estimates are made at the end of each quarter as to the amount yet to be paid. These estimates are based on historical experience with the particular program. The incentives are classified as a reduction in sales in ourConsolidated Statements of Income. Rights of return do not exist for a large portion of our sales, other than for quality issues. We do offer certain return rights in our aftermarket business, where some aftermarket customers are permitted to return small amounts of parts and filters each year and in our power generation business, which sells portable generators to retail customers. An estimate of future returns is accrued at the time of sale based on historical return rates. We translate assets and liabilities of foreign entities to U.S. dollars, where the local currency is the functional currency, at year-end exchange rates. We translate income and expenses to U.S. dollars using weighted-average exchange rates for the year. We record adjustments resulting from translation in a separate component of accumulated other comprehensive loss and include the adjustments in net Foreign currency transaction gains and losses are included in current net We make use of derivative instruments in foreign exchange, commodity price and interest rate hedging programs. Derivatives currently in use are foreign currency forward contracts, commodity NOTES TO CONSOLIDATED FINANCIAL STATEMENTS (Continued) NOTE 1. SUMMARY OF SIGNIFICANT ACCOUNTING POLICIES (Continued) We are exposed to fluctuations in commodity prices due to contractual agreements with component suppliers. In order to protect ourselves against future price volatility and, consequently, fluctuations in gross margins, we periodically enter into commodity We record all derivatives at fair value in our financial statements. Note We determine our income tax provision using the asset and liability method. Under this method, deferred tax assets and liabilities are recognized for the expected future tax consequences of temporary differences between the financial statement carrying amounts of existing assets and liabilities and their respective tax bases. We also recognize future tax benefits associated with tax loss and credit carryforwards as deferred tax assets. Our deferred tax assets are reduced by a valuation allowance when, in the opinion of management, it is more likely than not that some portion or all of the deferred tax assets will not be realized. We measure deferred tax assets and liabilities using enacted tax rates in effect for the year in which we expect to recover or settle the temporary differences. The effect of a change in tax rates on deferred taxes is recognized in the period that the change is enacted. We reduce our net tax assets for the estimated additional tax and interest that may result from tax authorities disputing Cash equivalents are defined as short-term, highly liquid investments with an original maturity of 90 days or less at the time of purchase. The carrying amounts reflected in ourConsolidated Balance Sheets for cash and cash equivalents approximate fair value due to the short-term maturity of these investments. CUMMINS INC. AND NOTES TO CONSOLIDATED FINANCIAL STATEMENTS (Continued) NOTE 1. SUMMARY OF SIGNIFICANT ACCOUNTING POLICIES (Continued) Changes in current assets and liabilities, net of acquisitions and dispositions, were as follows: Accounts and notes receivable Inventories Other current assets Accounts payable Accrued expenses Total Cash payments for income taxes, net of refunds Cash payments for interest, net of capitalized interest We account for marketable securities in accordance with GAAP standards for the Available-for-sale securities are carried at fair value with the unrealized gain or loss, net of tax, reported in other comprehensive income. Unrealized losses considered to be Trade accounts receivable are recorded at the invoiced amount, which approximates fair value, and generally do not bear interest. We have a trade receivables sales program, which is more fully discussed in Note NOTES TO CONSOLIDATED FINANCIAL STATEMENTS (Continued) NOTE 1. SUMMARY OF SIGNIFICANT ACCOUNTING POLICIES (Continued) which we determine that it is probable the receivable will not be recovered. The activity in our allowance for doubtful accounts is as follows: December 31, 2006 2005 2004 Millions Balance, beginning of year $ 16 $ 15 $ 12 Increase due to consolidation of VIEs — — 2 Provision for bad debts 3 8 3 Write-offs (8 ) (6 ) (3 ) Other — (1 ) 1 Balance, end of year $ 11 $ 16 $ 15 Balance, beginning of year Provision for bad debts Write-offs Other Balance, end of year Our inventories are stated at the lower of cost or net realizable value. At December 31, annual physical inventory results and for inventory cost changes under the LIFO cost method. Due to significant movements of partially-manufactured components and parts between manufacturing plants, we do not internally measure, nor do our accounting systems provide, a meaningful segregation between raw materials and work-in-process. We record property, plant and equipment, inclusive of assets under capital leases, at cost. We depreciate the cost of the majority of engine production equipment using a modified units-of-production method, which is based upon units produced subject to a minimum level. We depreciate the cost of all other equipment using the straight-line method with depreciable lives ranging from 20 to 40 years for buildings and three to 20 years for machinery, equipment and fixtures. Capital lease amortization is recorded in depreciation expense. We expense normal maintenance and repair costs as incurred. Depreciation expense totaled We review our long-lived assets for possible impairment whenever events or circumstances indicate that the carrying value of an asset or asset group may not be recoverable. We assess the recoverability of the carrying value of the long-lived assets at the lowest level for which identifiable cash flows are largely independent of the cash flows of other assets and liabilities. An impairment of a long-lived asset or asset group exists when the expected future pre-tax cash flows (undiscounted and without interest charges) estimated to be generated by the asset or asset group is less than its carrying value. If these cash flows are less than the carrying value of such asset or asset group, an impairment loss is measured based on the difference between the estimated fair value and carrying value of the asset or asset group. Assumptions and estimates used to estimate cash flows in the evaluation of impairment and the fair values used to determine the impairment are subject to a degree of judgment and complexity. Any NOTES TO CONSOLIDATED FINANCIAL STATEMENTS (Continued) NOTE 1. SUMMARY OF SIGNIFICANT ACCOUNTING POLICIES (Continued) changes to the assumptions and estimates resulting from changes in actual results or market conditions from those anticipated may affect the carrying value of long-lived assets and could result in No other reporting units have goodwill. Our valuation method requires us to make projections of revenue, operating expenses, working capital investment and fixed asset additions for the reporting units over a multi-year period. Additionally, management must estimate a weighted-average cost of capital, which reflects a market rate, for each reporting unit for use as a discount rate. The discounted cash flows are compared to the carrying value of the reporting unit and, if less than the carrying value, a separate valuation of the goodwill is required to determine if an impairment loss has occurred. In addition, we also perform a sensitivity analysis to determine how much our forecasts can fluctuate before the fair value of a reporting unit would be lower than its carrying amount. As of the end of the third quarter in 2009, we performed the annual impairment NOTES TO CONSOLIDATED FINANCIAL STATEMENTS (Continued) NOTE 1. SUMMARY OF SIGNIFICANT ACCOUNTING POLICIES (Continued) We capitalize certain costs for software that We charge the estimated costs of warranty programs, other than product recalls, to In addition, we sell extended warranty coverage on most of our engines. The revenue collected is initially deferred and is recognized as revenue Our research and Increase Millions Current assets $ 134 Long-term assets 133 Current liabilities (including short-term debt of $38) 166 Long-term debt 29 Millions Total assets $ 259 Total liabilities (including total debt of $63) 170 Revenues 663 Net earnings 51 December 31, Ownership % 2006 2005 Millions Dongfeng Cummins 50% $ 74 $ 51 European Engine Alliance 33% 59 58 Chongqing Cummins 50% 33 35 Tata Cummins 50% 30 25 Komatsu alliances 20% - 50% 26 22 Fleetguard Shanghai 50% 13 11 North American distributors and other Various 110 76 Total $ 345 $ 278 As of and for the years ended December 31, 2006 2005 2004 Millions Net sales $ 4,224 $ 3,216 $ 2,603 Gross margin 954 725 591 Net earnings 296 243 208 Cummins share of net earnings $ 119 $ 109 $ 99 Royalty and other income 21 22 21 Total investee equity, royalty and other income $ 140 $ 131 $ 120 Current assets $ 1,585 $ 1,137 Noncurrent assets 798 630 Current liabilities (1,177 ) (852 ) Noncurrent liabilities (407 ) (255 ) Net assets $ 799 $ 660 Cummins share of net assets $ 327 $ 242 In accordance with the provisions of various joint venture agreements, we may purchase products and components from the joint ventures, sell products and components to the joint ventures and the joint ventures may sell products and components to unrelated parties. Joint venture transfer prices to us may differ from normal selling prices. Certain joint venture agreements transfer product to us at cost, some transfer product to us on a cost-plus basis, and others transfer product to us at market NOTES TO CONSOLIDATED FINANCIAL STATEMENTS (Continued) value. Our related party sales are Accounting Pronouncements Recently Adopted In December 2007, the Financial Accounting Standards Board (FASB) amended its existing standards for business combinations, which is effective for fiscal years beginning after December 15, 2008. The amended standards make significant changes to both the accounting and disclosures related to the acquisition of a business and could materially impact how we account for future business combination transactions. Because the standard will only impact transactions entered into after January 1, 2009, the amended standards did not impact ourConsolidated Financial Statements upon adoption. In December 2007, the FASB amended its existing standards for noncontrolling interests in consolidated financial statements, which was effective for interim and annual fiscal periods beginning after December 15, 2008. The new standard established accounting and reporting standards for the noncontrolling interest in a subsidiary and for the accounting for future ownership changes with respect to those subsidiaries. The new standard defined a noncontrolling interest, previously called a minority interest, as the portion of equity in a subsidiary not attributable, directly or indirectly, to a parent. The new standard required, among other items, that a noncontrolling interest be included in Years ended December 31, 2006 2005 2004 Millions Engines, parts and components—CDC $ — $ — $ 107 Engines, parts and components—other JVs 272 190 151 Total $ 272 $ 190 $ 258 In March 2008, the FASB amended its existing standards for disclosures about derivative instruments and hedging activities, which was effective for interim and annual fiscal periods beginning after November 15, 2008. The new standards require enhanced disclosures about a company's derivative and hedging activities. We adopted the new standard effective January 1, 2009, and applied it prospectively. The new disclosures required are included in Note 20. In June 2009, the FASB amended its existing standards for subsequent events, which was effective for interim and annual fiscal periods ending after June 15, 2009, and established general standards of accounting for and disclosure of events that occur after the balance sheet date but before financial statements are issued or are available to be issued. The new standard established the period after the balance sheet date during which we should evaluate events or transactions that may occur for potential recognition or disclosure in the financial statements, the circumstances under which we should recognize events or transactions occurring after the balance sheet date and the disclosures that should be made about events or transactions that occurred after the balance sheet date. In preparing our NOTES TO CONSOLIDATED FINANCIAL STATEMENTS (Continued) Consolidated Financial Statements, we evaluated subsequent events through February 25, 2010, which is the date our annual report was filed with the Securities and Exchange Commission. In June 2009, the FASB amended its standards for accounting for transfers of In June 2009, the FASB amended its existing standards related to the consolidation of variable interest entities, which is effective for interim and annual fiscal periods beginning after November 15, 2009. The new standard requires entities to analyze whether their variable interests give it a controlling financial interest of a variable interest entity (VIE) and outlines what defines a primary beneficiary. The new standard amends GAAP by: (a) changing certain rules for determining whether an entity is a VIE; (b) replacing the quantitative approach previously required for determining the primary beneficiary with a more qualitative approach; and (c) requiring entities to continuously analyze whether they are the primary beneficiary of a VIE among other In October 2009, the Table of NOTES TO CONSOLIDATED FINANCIAL STATEMENTS (Continued) NOTE 2. INVESTMENTS IN EQUITY INVESTEES Investments in and advances to North American distributors Dongfeng Cummins Engine Company, Ltd. Beijing Foton Cummins Engine Co., Ltd. Cummins-Scania XPI Manufacturing, LLC Chongqing Cummins Engine Company Ltd. Komatsu alliances Tata Cummins Ltd. Shanghai Fleetguard Filter Co., Ltd. Other Total Equity, royalty and interest income from investees, net of applicable taxes, was as follows: Distribution Entities North American distributors Komatsu Cummins Chile, Ltda. All other distributors Manufacturing Entities Chongqing Cummins Engine Company, Ltd. Dongfeng Cummins Engine Company, Ltd. Valvoline Cummins, Ltd. Shanghai Fleetguard Filter Co., Ltd. Tata Cummins Ltd. Cummins MerCruiser Diesel Marine, LLC All other manufacturers Cummins share of net income Royalty and interest income Equity, royalty and interest income from investees We have an extensive worldwide distributor and dealer network through which we sell and distribute our products and services. Generally, our distributors are divided by geographic NOTES TO CONSOLIDATED FINANCIAL STATEMENTS (Continued) NOTE 2. INVESTMENTS IN EQUITY INVESTEES (Continued) North American Distributors Our distribution channel in North America includes 13 partially-owned distributors. Our equity interests in these nonconsolidated entities range from 30 percent to 50 percent. While each distributor is a separate legal entity, the business of each is the same as that of our wholly-owned distributors based in other parts of the world. All of our distributors, irrespective of their legal structure or ownership, offer the full range of our products and services to customers and end-users in their respective markets. Komatsu Cummins Chile, Ltda. Komatsu Cummins Chile, Ltda. is a joint venture with Komatsu America Corporation. The joint venture is a distributor that offers the full range of our products and services to customers and end-users in the Chilean market. We also have 50 percent equity interests in three other international distributors. We are contractually obligated to repurchase new engines, parts and components, special tools and signage from our North American distributors following an ownership transfer or termination of the distributor. In addition, in certain cases where we own a partial interest in a distributor, we are obligated to purchase the other equity Manufacturing ventures are formed with customers and allow us to increase market penetration in geographic regions, reduce capital spending, streamline our supply chain management and develop technologies. Our largest manufacturing ventures are based in China and are included in the list below. Our engine manufacturing joint ventures are supplied by our Components segment in the same manner as they supply our wholly-owned engine and power generation manufacturing facilities. Components segment joint ventures provide fuel system, filtration and turbocharger products that are used in our engines as well as some competitors' products. Chongqing Cummins Engine Company, Ltd. Chongqing Cummins Engine Company, Ltd. is a joint venture in China with Chongqing Heavy Duty Vehicle Group that manufactures several models of our heavy-duty and high-horsepower diesel engines, primarily serving the industrial and stationary power markets in China. Dongfeng Cummins Engine Company, Ltd. Dongfeng Cummins Engine Company, Ltd. (DCEC) is a joint venture in China with Dongfeng Automotive Corporation, a subsidiary of Dongfeng Motor Company (Dongfeng), one of the largest medium-duty truck manufacturers in China. DCEC produces Cummins four- to nine-liter mechanical engines, full-electronic diesel engines, with a power range from 100 to 370 horsepower, and natural gas engines. NOTES TO CONSOLIDATED FINANCIAL STATEMENTS (Continued) NOTE 2. INVESTMENTS IN EQUITY INVESTEES (Continued) Valvoline Cummins, Ltd. Valvoline Cummins, Ltd. is a joint venture with Ashland Inc., USA. The joint venture manufactures and distributes lubricant-oil products in India which are used in automotive and industrial applications. Products include transmission fluids, hydraulic lubricants, automotive filters, cooling system products, greases and specialty products. Shanghai Fleetguard Filter Co., Ltd. Shanghai Fleetguard Filter Co., Ltd. is a joint venture in China with Dongfeng that manufactures filtration and exhaust systems. Tata Cummins Ltd. Tata Cummins Ltd. is a joint venture in India with Tata Motors Ltd., the largest automotive company in India and a member of the Tata group of companies. This joint venture manufactures the engines in India for use in trucks manufactured by Tata Motors, as well as for various industrial and power generation applications. Cummins MerCruiser Diesel Marine, LLC Cummins MerCruiser Diesel Marine, LLC is a joint venture in the United States (U.S.) with Mercury Marine, a division of Brunswick Corporation, to develop, manufacture and sell recreational marine diesel products, including engines, sterndrive packages, inboard packages, instrument and controls, service systems and replacement and service parts and assemblies, complete integration systems and other related products. Beijing Foton Cummins Engine Co., Ltd. Beijing Foton Cummins Engine Co., Ltd. is a 50/50 joint venture in China with Beijing Foton Motor Co., Ltd., a commercial vehicle manufacturer, to produce two new families of Cummins high performance light-duty, diesel engines in Beijing. The engines will be used in light-duty commercial trucks, pickup trucks, multipurpose and sport utility vehicles. Certain types of marine, small construction equipment and industrial applications will also be served by these engine families. NOTES TO CONSOLIDATED FINANCIAL STATEMENTS (Continued) NOTE 2. INVESTMENTS IN EQUITY INVESTEES (Continued) We have approximately $261 million in our investment account at December 31, 2009, that represents cumulative undistributed income in our equity investees. Summary financial information for our equity investees is as follows: Net sales Gross margin Net income Cummins share of net income Royalty and interest income Total equity, royalty and interest income from investees Current assets Noncurrent assets Current liabilities Noncurrent liabilities Net assets Cummins share of net assets NOTE 3. RESTRUCTURING AND OTHER CHARGES 2009 Restructuring Actions In 2009, we executed restructuring actions in response to a reduction in orders in most of our U.S. and foreign markets due to the continuing deterioration in the global economy. We reduced our global workforce by approximately 1,000 professional employees. In addition, we took numerous employee actions at many of our manufacturing locations, including approximately 3,200 hourly employees, significant downsizing at numerous facilities and complete closure of several facilities and branch distributor locations. Employee termination and severance costs were recorded based on approved plans developed by the businesses and corporate management which specified positions to be eliminated, benefits to be paid under existing severance plans, union contracts or statutory requirements and the expected timetable for completion of the plan. Estimates of restructuring were made based on information available at the time charges were recorded. Due to the inherent uncertainty involved, actual amounts paid for such activities may differ from amounts initially recorded and we may need to revise previous estimates. We incurred $2 million of restructuring expenses for lease terminations and $5 million of restructuring expenses for asset impairments in response to closures and downsizing noted above. During 2009, we recorded a total pre-tax restructuring charge of $85 million, comprising $90 million of charges related to 2009 actions net of the $3 million favorable change in estimate related to 2008 actions and the $2 million favorable change in estimate related to earlier 2009 actions, in NOTES TO CONSOLIDATED FINANCIAL STATEMENTS (Continued) NOTE 3. RESTRUCTURING AND OTHER CHARGES (Continued) "Restructuring and other charges" in ourConsolidated Statements of Income. These restructuring actions included: Workforce reductions Exit activities Other Changes in estimate Total restructuring charges Curtailment loss Total restructuring and other charges In addition, as a result of the restructuring actions described above, we also recorded a $14 million curtailment loss in our pension and other postretirement plans. See Note 12 for additional detail. At December 31, 2009, of the approximately 4,200 employees affected by this plan, all terminations were substantially complete. The following table summarizes the balance of accrued restructuring charges by expense type and the changes in the accrued amounts for the applicable periods. The restructuring related accruals were recorded in "Other accrued expenses" in ourConsolidated Balance Sheets. 2009 Restructuring charges Cash payments for 2009 actions Noncash items Changes in estimates Translation Balance at December 31, 2009 We do not include restructuring and other charges in our operating segment results. The pre-tax impact of allocating restructuring and other charges to the segment results would have been as follows: Engine Power Generation Components Distribution Total restructuring charges NOTES TO CONSOLIDATED FINANCIAL STATEMENTS (Continued) NOTE 3. RESTRUCTURING AND OTHER CHARGES (Continued) 2008 Restructuring Actions We executed restructuring actions primarily in the form of voluntary and involuntary separation programs in the fourth quarter of 2008. These actions were in response to the continued deterioration in our U.S. businesses and most key markets around the world in the second half of 2008, as well as a reduction in orders in most U.S. and global markets for 2009. We reduced our worldwide professional workforce by approximately 650 employees, or 4.5 percent. We offered a voluntary retirement package to certain active professional employees in the U.S. based on a clearly defined set of criteria. We also took voluntary and involuntary actions which included approximately 800 hourly employees, the majority of which received severance benefits. The compensation packages contained salary and continuation of benefits, including health care, life insurance and outplacement services. The voluntary retirement package was accepted by approximately 150 employees. The remaining professional reductions of 500 employees were involuntary. The expenses recorded during the year ended December 31, 2008, included severance costs related to both voluntary and involuntary terminations. During 2008, we incurred a pre-tax charge related to the professional and hourly restructuring initiatives of approximately $37 million. Employee termination and severance costs were recorded based on approved plans developed by the businesses and corporate management which specified positions to be eliminated, benefits to be paid under existing severance plans or statutory requirements and the expected timetable for completion of the plan. Estimates of restructuring were made based on information available at the time charges were recorded. Due to the inherent uncertainty involved, actual amounts paid for such activities may differ from amounts initially recorded and we may need to revise previous estimates. At December 31, 2008, of the approximately 1,450 employees affected by this plan, 1,250 had been terminated. All terminations were substantially complete as of December 31, 2009. The table below summarizes the balance of accrued restructuring expenses for 2008 actions, which were included in the balance of "Other accrued expenses" in ourConsolidated Balance Sheets as of December 31, 2009 and 2008: 2008 Restructuring charges Cash payments for 2008 actions Balance at December 31, 2008 2009 Cash payments for 2008 actions Change in estimate Balance at December 31, 2009 NOTES TO CONSOLIDATED FINANCIAL STATEMENTS (Continued) NOTE 3. RESTRUCTURING AND OTHER CHARGES (Continued) We do not include restructuring charges in the segment results. The pre-tax impact of allocating restructuring charges for the year ended December 31, 2008, would have been as follows: Engine Power Generation Components Distribution Total restructuring charges NOTE 4. INCOME TAXES Income (loss) before income taxes: U.S. income Foreign income The provision (benefit) for income taxes consists of the following: Current: U.S. federal and state Foreign Total current Deferred: U.S. federal and state Foreign Total deferred Income tax expense NOTES TO CONSOLIDATED FINANCIAL STATEMENTS (Continued) NOTE 4. INCOME TAXES (Continued) A reconciliation of the income tax provision at the U.S. federal income tax rate of 35 percent to the actual effective tax rate is as follows: U.S. federal statutory rate State income tax, net of federal effect Research tax credits Differences in rates and taxability of foreign subsidiaries and joint ventures Settlement of tax audits Other, net Effective tax rate Except for the United Kingdom (U.K.) group, we provide for the additional taxes that would be due upon the dividend distribution of the income of our foreign subsidiaries and joint ventures assuming the full utilization of foreign tax credits. The unremitted income of the U.K. group is considered to be permanently reinvested and the determination of the deferred tax liability, if any, that might be due should that income be distributed is not practicable. During 2009, we released $19 million of deferred U.S. tax liabilities related to prior years unremitted income of the Singapore subsidiaries of our U.K. group now considered to also be permanently reinvested. Income before income taxes includes equity income of foreign joint ventures of $117 million, $140 million and $118 million for the years ended December 31, 2009, 2008 and 2007, respectively. This equity income is recorded net of foreign taxes. Additional U.S. income taxes of $31 million, $30 million and $18 million for the years ended December 31, 2009, 2008 and 2007, respectively, were provided for the additional U.S. taxes that will ultimately be due upon the distribution of the foreign joint venture equity income. NOTES TO CONSOLIDATED FINANCIAL STATEMENTS (Continued) NOTE 4. INCOME TAXES (Continued) Carryforward tax benefits and the tax effect of temporary differences between financial and tax reporting that give rise to net deferred tax assets are as follows: Deferred tax assets: U.S. federal and state carryforward benefits Foreign carryforward benefits Employee benefit plans Warranty and marketing expenses Deferred research and development expenses Other Gross deferred tax assets Valuation allowance Total deferred tax assets Deferred tax liabilities: Property, plant and equipment Unremitted income of foreign subsidiaries and joint ventures Other Total deferred tax liabilities Net deferred tax assets Our U.S. federal and state carryforward benefits include $65 million of foreign tax credit carryforward benefits that expire in 2019, $16 million of federal general business credit carryforward benefits that expire in 2029, and $50 million of state credit and net operating loss carryforward benefits that begin to expire in 2012. Our foreign carryforward benefits include $20 million of net operating loss carryforwards that begin to expire in 2013. A valuation allowance is recorded to reduce the gross deferred tax assets to an amount we believe is more likely than not to be realized. The valuation allowance increased in 2009 by a net $19 million and increased in 2008 by a net $1 million. The valuation allowance is primarily attributable to the uncertainty regarding the realization of a portion of the U.S. state and foreign net operating loss and tax credit carryforward benefits. NOTES TO CONSOLIDATED FINANCIAL STATEMENTS (Continued) NOTE 4. INCOME TAXES (Continued) On January 1, 2007, the FASB amended its existing accounting standards related to the accounting for uncertainty in income taxes. The amended standards prescribe a recognition threshold that a tax position is required to meet before being recognized in the financial statements and provide guidance on derecognition, measurement, classification, interest and penalties, accounting in interim periods, disclosure and transition rules. A reconciliation of the beginning and ending amount of unrecognized tax benefits is as follows: Balance at December 31, 2006 Additions based on tax positions related to the current year Reductions for tax positions of prior years Balance at December 31, 2007 Additions based on tax positions related to the current year Additions based on tax positions related to the prior years Reductions for tax positions relating to settlements with taxing authorities Balance at December 31, 2008 Additions based on tax positions related to the current year Additions based on tax positions related to the prior years Reductions for tax positions related to prior years Reductions for tax positions relating to settlements with taxing authorities Effects of foreign currency translations Balance at December 31, 2009 Included in the December 31, 2009 and 2008, balances are $33 million related to tax positions that, if recognized, would favorably affect the effective tax rate in future periods. Also, we had accrued interest expense related to the unrecognized tax benefits of $22 million, $14 million and $11 million as of December 31, 2009, 2008 and 2007, respectively. We recognize potential accrued interest and penalties related to unrecognized tax benefits in income tax expense. During the years ending December 31, 2009, 2008 and 2007, we recognized approximately $4 million, $2 million and $2 million in interest expense, respectively. As a result of our global operations, we file income tax returns in various jurisdictions including U.S. federal, U.S. state and foreign jurisdictions. We are routinely subject to examination by taxing authorities throughout the world, including Australia, Belgium, Brazil, Canada, China, France, India, Mexico, the U.K. and the U.S. Our U.S. federal income tax returns have been examined through 2004. With few exceptions, major U.S. state and foreign jurisdictions are no longer subject to income tax examinations for years before 2004. Various U.S. state and foreign tax audits are currently underway; however, we do not expect any significant change to our unrecognized tax benefits within the next year. NOTES TO CONSOLIDATED FINANCIAL STATEMENTS (Continued) A summary of marketable securities, all of which are classified as current, is as follows: December 31, 2006 2005 Cost Gross Estimated Cost Gross Estimated Millions Available-for-sale: Debt mutual funds $ 71 $ 1 $ 72 $ 35 $ — $ 35 Government debt securities—non-U.S. 14 (1 ) 13 15 — 15 Corporate debt securities 4 — 4 7 — 7 Equity securities and other 2 4 6 1 3 4 Total marketable securities $ 91 $ 4 $ 95 $ 58 $ 3 $ 61 Available-for-sale: Debt mutual funds Bank debentures Certificates of deposit Government debt securities—non-U.S. Corporate debt securities Equity securities and other Total marketable securities Proceeds from sales and maturities of At December 31, Maturity date Fair value Millions 1 year or less $ 3 1 - 5 years 8 5 - 10 years 2 After 10 years 4 Total $ 17 1 year or less 1 - 5 years 5 - 10 years After 10 years Total NOTE In Table of CUMMINS INC. AND NOTES TO CONSOLIDATED FINANCIAL STATEMENTS (Continued) standards do not require retroactive restatement of prior periods. The adoption did not materially impact ourConsolidated Financial Statements. As defined by the amended standards, fair value is the price that would be received to As of and for the years ended 2006 2005 2004 Millions Sold receivables servicing portfolio $ 719 $ 605 $ 416 Proceeds outstanding from receivable sales — — — Receivables sold to special purpose subsidiary 6,368 5,706 5,338 Collections reinvested in special purpose subsidiary 6,254 5,517 4,922 Servicing fees and interest 1 1 1 Level 1—Quoted prices are available in active markets for identical assets or liabilities as of the reporting date. Active markets are those in which transactions for the asset or liability occur in sufficient frequency and volume to provide pricing information on an ongoing basis. Level 1 primarily consists of financial instruments such as listed equities and publicly traded bonds. Level 2—Pricing inputs are other than quoted prices in active markets included in level 1, which are either directly or indirectly observable as of the reported date. Level 2 includes those financial instruments that are valued using models or other valuation methodologies. These models are primarily industry-standard models that consider various assumptions, including quoted forward prices for commodities, time value, volatility factors, and current market and contractual prices for the underlying instruments, as well as other relevant economic measures. Substantially all of these assumptions are observable in the marketplace throughout the full term of the instrument, can be derived from observable data or are supported by observable levels at which transactions are executed in the marketplace. Instruments in this category include non-exchange-traded derivatives such as over-the-counter forwards and options. Level 3—Pricing inputs include significant inputs that are generally less observable from objective sources. These inputs may be used with internally developed methodologies that result in management's best estimate of fair value. At each balance sheet date, the company performs an analysis of all instruments subject to fair value accounting under GAAP and includes, in level 3, all of those whose fair value is based on significant unobservable inputs. At December 31, 2009, we did not have any level 3 financial assets or liabilities, other than those in our pension plan (see Note 12). The majority of the assets and liabilities we carry at fair value are available-for-sale (AFS) securities and derivatives. AFS securities are derived from level 1 or level 2 inputs. The predominance of market inputs are actively quoted and can be validated through external sources, including brokers, market transactions and third-party pricing services. The fair value measurement of derivatives results primarily from level 2 inputs. Many of our derivative contracts are valued utilizing publicly available pricing data of contracts with similar terms. In NOTES TO CONSOLIDATED FINANCIAL STATEMENTS (Continued) NOTE 6. other cases, the contracts are valued using current spot market data adjusted for the appropriate current forward curves provided by external financial institutions. We participate in commodity swap contracts, currency forward contracts, and interest rate swaps. When material, we adjust the values of our derivative contracts for counter-party or our credit risk. The following tables summarize our financial instruments recorded at fair value in ourConsolidated Balance Sheets at December 31, 2009 and 2008: Available-for-sale securities Derivative assets Derivative liabilities Total Available-for-sale securities Derivative assets Derivative liabilities Total Based on borrowing rates currently available to us for bank loans with similar terms and average maturities, considering our risk premium, the fair value and carrying value of total debt, including current maturities, at December 31, 2009 and 2008, are set forth in the table below. The carrying values of all other receivables and liabilities approximated fair values. Fair value Carrying value NOTES TO CONSOLIDATED FINANCIAL STATEMENTS (Continued) NOTE 7. INVENTORIES Inventories include the following: December 31, 2006 2005 Millions Finished products $ 705 $ 636 Work-in-process and raw materials 761 607 Inventories at FIFO cost 1,466 1,243 Excess of FIFO over LIFO (73 ) (69 ) Total inventories $ 1,393 $ 1,174 Finished products Work-in-process and raw materials Inventories at FIFO cost Excess of FIFO over LIFO Total inventories NOTE Details of our property, plant and equipment balance are as follows: December 31, 2006 2005 Millions Land and buildings $ 779 $ 733 Machinery, equipment and fixtures 3,156 3,071 Construction in process 160 137 4,095 3,941 Less accumulated depreciation (2,521 ) (2,384 ) Property, plant and equipment, net $ 1,574 $ 1,557 Land and buildings Machinery, equipment and fixtures Construction in process Less: accumulated depreciation Property, plant and equipment, net NOTE The following table summarizes the changes in the carrying amount of goodwill for Components Power Engine Distribution Total Millions Goodwill at December 31, 2004 $ 332 $ 11 $ 7 $ 5 $ 355 Additions — 3 — 1 4 Translation and other — (1 ) — — (1 ) Goodwill at December 31, 2005 332 13 7 6 358 Dispositions — (3 ) — (1 ) (4 ) Translation and other — 2 — — 2 Goodwill at December 31, 2006 $ 332 $ 12 $ 7 $ 5 $ 356 Goodwill at December 31, 2007 Additions Dispositions Translation and other Goodwill at December 31, 2008 Additions Dispositions Translation and other Goodwill at December 31, 2009 NOTES TO CONSOLIDATED FINANCIAL STATEMENTS (Continued) NOTE 9. GOODWILL AND OTHER INTANGIBLE ASSETS (Continued) We have elected to perform the annual impairment test of our recorded goodwill as required by Intangible assets that have finite useful lives are amortized over their estimated useful lives. The following table summarizes our other intangible assets with finite useful lives that are subject to amortization: December 31, 2006 2005 Millions Software $ 222 $ 199 Accumulated amortization (101 ) (103 ) Net software 121 96 Trademarks, patents and other 10 6 Accumulated amortization (3 ) (2 ) Net trademarks, patents and other 7 4 Total $ 128 $ 100 Software Accumulated amortization Net software Trademarks, patents and other Accumulated amortization Net trademarks, patents and other Total Amortization expense for software and other intangibles totaled Projected amortization expense NOTE 10. DEBT Loans Payable Loans payable at December 31, 2009 and 2008 Years ended December 31, 2006 2005 2004 Millions Current: U.S. federal and state $ 73 $ 2 $ 16 Foreign 112 90 91 Total current 185 92 107 Deferred: U.S. federal and state 128 130 (53 ) Foreign 11 (6 ) 2 Total deferred 139 124 (51 ) Provision for income taxes $ 324 $ 216 $ 56 Years ended December 31, 2006 2005 2004 Millions Earnings before income taxes and minority interests: U.S. earnings $ 597 $ 424 $ 175 Foreign earnings 486 374 257 $ 1,083 $ 798 $ 432 U.S. federal statutory rate 35.0 % 35.0 % 35.0 % State income tax (benefit), net of federal effect 3.1 1.6 (5.1 ) Research tax credits (1.4 ) (1.7 ) (4.2 ) Export tax benefits (1.4 ) (2.5 ) (8.3 ) Differences in rates and taxability of foreign subsidiaries and joint ventures (2.4 ) (2.5 ) (6.7 ) Foreign repatriation tax incentive related to Jobs Act — (2.0 ) — Settlement of tax audits (2.6 ) (1.0 ) — All other, net (0.4 ) 0.2 2.3 Effective tax rate 29.9 % 27.1 % 13.0 % December 31, 2006 2005 Millions Deferred tax assets: U.S. federal carryforward benefits Foreign tax credits $ — $ 12 Research tax credits — 73 Minimum tax credits — 8 Total U.S. federal carryforward benefits — 93 U.S. state carryforward benefits 18 24 Foreign carryforward benefits 21 26 Employee benefit plans 389 443 Warranty and marketing expenses 219 206 Deferred research and development expenses 126 159 Other 70 60 Gross deferred tax assets 843 1,011 Valuation allowance (26 ) (31 ) Total deferred tax assets 817 980 Deferred tax liabilities: Property, plant and equipment (64 ) (90 ) Other (57 ) (37 ) Total deferred tax liabilities (121 ) (127 ) Net deferred tax assets $ 696 $ 853 December 31, 2006 2005 Millions Current assets $ 277 $ 363 Long-term assets 433 500 Other liabilities and deferred revenue (14 ) (10 ) $ 696 $ 853 December 31, 2006 2005 Millions Accrued warranty $ 273 $ 262 Accrued compensation 275 241 Accrued retirement obligations 60 224 Other 523 433 Total other accrued expenses $ 1,131 $ 1,160 December 31, 2006 2005 Millions Short-term borrowings: Loans payable $ 37 $ 40 Current maturities of long-term debt 127 114 Total short-term borrowings $ 164 $ 154 Weighted average interest rate NOTES TO CONSOLIDATED FINANCIAL STATEMENTS (Continued) NOTE 10. DEBT (Continued) For the years ended December 31, 2009, 2008 and 2007, total interest incurred was $41 million, $53 million and $63 million, respectively. For the same respective periods, interest capitalized was $6 million, $11 million and $5 million. Revolving Credit Facility On June 30, 2008, we entered into a three-year revolving credit agreement with a syndicate of lenders. The credit agreement provides us with a $1.1 billion senior unsecured revolving credit facility, the proceeds of which are to be used by us for working capital or other general corporate purposes. The credit facility matures on June 30, 2011. Amounts payable under our revolving credit facility will rank pro rata with all of our other unsecured, unsubordinated indebtedness. Up to $100 million under our credit facility is available for swingline loans denominated in U.S. dollars. Advances under the facility bear interest at (i) a base rate or (ii) a rate equal to LIBOR plus an applicable margin based on the credit ratings of our outstanding senior unsecured long-term debt. Based on our current long-term debt ratings, the applicable margin on LIBOR loans was 0.75 percent per annum as of December 31, 2009. Advances under the facility may be prepaid without premium or penalty, subject to customary breakage costs. The credit agreement includes various covenants, including, among others, maintaining a leverage ratio of no more than 3.0 to 1.0 and maintaining fixed charge coverage ratio of at least 1.5 to 1.0. As of December 31, The table below is a reconciliation of the maximum capacity of our revolver to the amount available Maximum credit capacity of the revolving credit facility Less: Letters of credit against revolving credit facility Amount available for borrowing under the revolving credit facility As of December 31, 2009, we also had $229 million available for borrowings under our international and other domestic short-term credit facilities. December 31, 2006 2005 Millions Long-term debt: Notes, 8.68%, due 2008 $ 60 $ 71 Term loan, 6.92%, due 2008 45 65 Senior notes, 9.5%, due 2010 — 250 Debentures, 6.75%, due 2027 120 120 Debentures, 7.125%, due 2028 250 250 Junior convertible subordinated debentures, redeemable in 2006, mandatory redemption in 2031 — 300 Debentures, 5.65%, due 2098 (effective interest rate 7.48%) 165 165 Other 9 34 649 1,255 Unamortized discount (38 ) (46 ) Capital leases 163 118 Total long-term debt 774 1,327 Less current maturities of long-term debt (127 ) (114 ) Long-term debt $ 647 $ 1,213 NOTES TO CONSOLIDATED FINANCIAL STATEMENTS (Continued) NOTE 10. DEBT (Continued) Long-term Debt Long-term debt: Export financing loan, 4.5%, due 2012 Debentures, 6.75%, due 2027 Debentures, 7.125%, due 2028 Debentures, 5.65%, due 2098 (effective interest rate 7.48%) Other Unamortized discount Fair value adjustment due to hedge on indebtedness Capital leases Total long-term debt Less current maturities of long-term debt Long-term debt Principal payments required on long-term debt during the next five years Payment Interest on the Interest on the $250 million 7.125% debentures and $165 million 5.65% debentures is payable on March 1 and September 1 of each year. The debentures are unsecured and are not subject to any sinking fund requirements. We can redeem the 7.125% debentures and the 5.65% debentures at any time prior to maturity at the greater of par plus accrued interest or an amount designed to ensure that the debenture holders are not penalized by the early redemption. Our debt agreements contain several restrictive covenants. The most restrictive of these covenants applies to our revolving credit facility which will, among other things, limit our ability to incur additional debt or issue preferred stock, enter into sale-leaseback transactions, pay dividends, sell or create liens on our assets, make investments and merge or consolidate with any other person. In addition, we are subject to various financial covenants including a maximum debt-to-EBITDA ratio and a minimum interest coverage ratio. As of December 31, NOTES TO CONSOLIDATED FINANCIAL STATEMENTS (Continued) A summary of the Balance, beginning of year Provision for warranties issued Deferred revenue on extended warranty contracts sold Payments Amortization of deferred revenue on extended warranty contracts Changes in estimates for pre-existing warranties Foreign currency translation Balance, end of year The current portion of NOTE 12. PENSION AND OTHER POSTRETIREMENT BENEFITS We sponsor several contributory and noncontributory pension plans covering substantially all employees. Generally, hourly employee pension benefits are earned based on years of service and compensation during active employment while future benefits for salaried employees are determined using a cash balance formula. The following tables present the changes in the benefit obligations and the various plan assets, the funded NOTES TO CONSOLIDATED FINANCIAL STATEMENTS (Continued) NOTE 12. PENSION AND OTHER POSTRETIREMENT BENEFITS (Continued) significant pension plans. Non-U.S. plans represent plans sponsored in the U.K. Benefit obligation balances presented below reflect the projected benefit obligation (PBO) Change in benefit obligation Benefit obligation at beginning of year Service cost Interest cost Plan participants' contributions Actuarial losses (gains) Benefits paid from fund Benefits paid directly by Company Exchange rate changes Curtailment loss (gain) Other Benefit obligation at end of year Change in plan assets Fair value of plan assets at beginning of year Actual return on plan assets Company contributions Plan participants' contributions Benefits paid Exchange rate changes Other Fair value of plan assets at end of year Funded status (including underfunded and nonfunded plans) at end of year Amounts recognized in consolidated balance sheets Accrued compensation, benefits and retirement costs—current liabilities Pensions—long-term liabilities Net amount recognized Amounts recognized in accumulated other comprehensive loss consist of: Net actuarial loss Prior service (credit) cost Net amount recognized In addition to the pension plans in the above table, we also maintain less significant defined benefit pension plans in 11 other countries outside the U.S. and the U.K. that comprise less than three NOTES TO CONSOLIDATED FINANCIAL STATEMENTS (Continued) NOTE 12. PENSION AND OTHER POSTRETIREMENT BENEFITS (Continued) percent of our pension plan assets and obligations. These plans are reflected in "Other liabilities and deferred revenue" on ourConsolidated Balance Sheets. The following table presents information regarding underfunded pension plans that are included in the preceding table: Total accumulated benefit obligation Plans with accumulated benefit obligation in excess of plan assets: Accumulated benefit obligation Fair value of plan assets Plans with projected benefit obligation in excess of plan assets: Projected benefit obligation Fair value of plan assets The following table presents the net periodic pension cost under our plans: Service cost Interest cost Expected return on plan assets Amortization of prior service cost (credit) Recognized net actuarial loss Other Net periodic pension cost before curtailments Curtailments Total net periodic pension cost NOTES TO CONSOLIDATED FINANCIAL STATEMENTS (Continued) NOTE 12. PENSION AND OTHER POSTRETIREMENT BENEFITS (Continued) Other changes in benefit obligations and plan assets recognized in other comprehensive income in 2009 are as follows: Amortization of prior service cost Curtailments Recognized actuarial loss Incurred actuarial loss Foreign exchange translation adjustments Total recognized in other comprehensive income Total recognized in net periodic pension cost and other comprehensive income The amounts in accumulated other comprehensive loss that are expected to be recognized as components of net periodic pension cost during the next fiscal year are as follows: Prior service cost Net actuarial loss As disclosed in Note 3, "RESTRUCTURING AND OTHER CHARGES," to ourConsolidated Financial Statements, we executed restructuring actions in 2009. As a result, our pension benefit plans were remeasured and we recognized curtailment losses, as prescribed under GAAP pension standards, due to the significant reduction in the expected aggregate years of future service of the employees affected by the The table below presents various assumptions used in determining the pension benefit obligation for each year and reflects weighted-average percentages for the various plans (Non-U.S. is the U.K.): Discount rate Compensation increase rate NOTES TO CONSOLIDATED FINANCIAL STATEMENTS (Continued) NOTE 12. PENSION AND OTHER POSTRETIREMENT BENEFITS (Continued) The table below presents various assumptions used in determining the net periodic pension cost and reflects weighted-average percentages for the various plans (Non-U.S. is the U.K.): Discount rate Expected return on plan assets Compensation increase rate Our investment policies in the U.S. and U.K. provide for the rebalancing of assets to maintain our long-term strategic asset allocation. We are committed to its long-term strategy and do not attempt to time the market given empirical evidence that asset allocation is more critical than individual asset or investment manager selection. Rebalancing of the assets has and continues to occur. The rebalancing is critical to having the proper weighting of assets to achieve the expected total portfolio returns. We believe that our portfolio is highly diversified and does not have any significant exposure to concentration risk. The plan assets for our defined benefit pension plans do not include any of our common stock. U.S. Plan Assets For the U.S. qualified pension plans, our assumption for the expected return on assets was 8.25 percent in 2009. Projected returns are based primarily on broad, publicly traded equity and fixed income indices and forward-looking estimates of active portfolio and investment management. As of December 31, 2009, based upon our target asset allocations it is anticipated that our U.S. investment policy will generate an average annual return over the 20-year projection period equal to or in excess of 7.50 percent, approximately 40 percent of the time, while returns of 8.70 percent or greater are anticipated 25 percent of the time. We expect additional positive returns from active investment management. As a result, based on the historical returns and forward-looking return expectations, we have elected to use an assumption of 8.00 percent per year in 2010. The primary investment objective is to exceed, on a net-of-fee basis, the rate of return of a policy portfolio comprised of the following: U.S. equities Non-U.S. equities Global equities Total equities Real estate Private equity Fixed-income Total The fixed income component is structured to represent a custom bond benchmark constructed to closely represent the monthly change in the value of Cummins' liabilities. This component is structured in such a way that its benchmark covers 50 percent of the plan's exposure to changes in its discount NOTES TO CONSOLIDATED FINANCIAL STATEMENTS (Continued) NOTE 12. PENSION AND OTHER POSTRETIREMENT BENEFITS (Continued) rate (AA corporate bond yields). In order to achieve a hedge on more than the targeted 30 percent of Plan assets invested in fixed income securities, the Committee may instruct the fixed income managers, other manager(s) or the custodian/trustee to utilize derivative securities in an overlay fashion, which would further reduce the Plan's risk of declining interest rates in what is referred to as a Liability Driven Investment strategy. However, all managers hired to manage assets for the trust are prohibited from using leverage unless specifically discussed with the Committee and allowed for in their guidelines. UK Plan Assets The methodology used to determine the rate of return on pension plan assets in the U.K. was based on establishing an equity-risk premium over current long-term bond yields adjusted based on target asset allocations. Our strategy with respect to our investments in these assets is to be invested in a suitable mixture of return-seeking assets (equities and property and liability matching assets (bonds) with a long-term outlook. Therefore, the risk and return balance of our U.K. asset portfolio should reflect a long-term horizon. To achieve these objectives we have established the following targets: UK equities Non-UK equities Total equities Real estate Private equity Government bonds Total As part of our strategy in the U.K. we have not prohibited the use of any financial instrument, including derivatives. NOTES TO CONSOLIDATED FINANCIAL STATEMENTS (Continued) NOTE 12. PENSION AND OTHER POSTRETIREMENT BENEFITS (Continued) Fair Value of U.S. Plan Assets The fair values of Cummins U.S. pension plan assets at December 31, 2009, by asset category are as follows: Equities U.S. Non-U.S. Fixed income Government debt Corporate debt U.S. Non-U.S. Asset/mortgaged backed securities Net cash equivalents(1) Derivative instruments(2) Private equity and real estate(3) Total Pending trade purchases/sales Accruals(4) Total NOTES TO CONSOLIDATED FINANCIAL STATEMENTS (Continued) NOTE 12. PENSION AND OTHER POSTRETIREMENT BENEFITS (Continued) The reconciliation of level 3 assets is as follows: Beginning balance at January 1, 2009 Actual return on plan assets: Unrealized losses on assets still held at the reporting date Purchases, sales and settlements Ending balance at December 31, 2009 Fair Value of U.K. Plan Assets The fair values of Cummins U.K. pension plan assets at December 31, 2009, by asset category are as follows: Equities U.S. Non-U.S. Fixed income Government debt Corporate debt U.S. Non-U.S. Asset/mortgaged backed securities Net cash equivalents(1) Private equity and real estate(2) Total Pending trade purchases/sales Accruals(3) Total NOTES TO CONSOLIDATED FINANCIAL STATEMENTS (Continued) NOTE 12. PENSION AND OTHER POSTRETIREMENT BENEFITS (Continued) The reconciliation of level 3 assets is as follows: Beginning balance at January 1, 2009 Actual return on plan assets: Unrealized losses on assets still held at the reporting date Purchases, sales and settlements Ending balance at December 31, 2009 The investments in private equity and real estate funds, for which quoted market prices are not available, are valued at their estimated fair value as determined by applicable investment managers or by quarterly financial statements of the funds. These financial statements are audited at least annually. The fair value of all real estate properties, held in the partnerships, are valued at least once per year by an independent professional real estate valuation firm. Fair value generally represents the fund's proportionate share of the net assets of the investment partnerships as reported by the general partners of the underlying partnerships. Some securities with no readily available market are initially valued at cost, utilizing independent professional valuation firms as well as market comparisons with subsequent adjustments to values which reflect either the basis of meaningful third-party transactions in the private market or the fair value deemed appropriate by the general partners of the underlying investment partnerships. In such instances, consideration is also given to the financial condition and operating results of the issuer, the amount that the investment partnerships can reasonably expect to realize upon the sale of the securities and any other factors deemed relevant. The estimated fair values are subject to uncertainty and therefore may differ from the values that would have been used had a ready market for such investments existed and such differences could be material. We plan to contribute approximately Expected benefit payments We also sponsor defined contribution plans for certain hourly and salaried employees. Our contributions to these plans were $42 million, $30 million, and $25 million for the years ended December 31, 2009, 2008 and 2007. CUMMINS INC. AND NOTES TO CONSOLIDATED FINANCIAL STATEMENTS (Continued) Our other postretirement benefit plans provide various health care and life insurance benefits to eligible employees, who retire and satisfy certain age and service requirements, and their dependents. The plans are contributory and contain cost-sharing features such as caps, deductibles, coinsurance and spousal contributions. Company contributions are limited by formulas in each plan. Retiree contributions for health care benefits are adjusted annually and we reserve the right to change benefits covered under these plans. There were no plan assets for the postretirement benefit plans as our policy is to fund benefits and expenses for these plans as claims and premiums are incurred. December 31, Adjustments AML SFAS 158 December 31, SFAS 158 Millions Prepaid expenses and other current assets $ 130 $ — $ (14 ) $ 116 Deferred income taxes 442 (51 ) 42 433 Other assets 177 (19 ) (17 ) 141 Total assets 7,524 (70 ) 11 7,465 Other accrued expenses 1,360 — (229 ) 1,131 Pensions 190 (155 ) 332 367 Postretirement benefits other than pensions 521 — 2 523 Other liabilities and deferred revenue 472 — 1 473 Total liabilities 4,458 (155 ) 106 4,409 Minority interests 251 4 (1 ) 254 Defined other postretirement benefits — — (3 ) (3 ) Defined benefit pension plans — — (508 ) (508 ) Minimum pension liability adjustment (523 ) 102 421 — Foreign currency translation adjustments — (21 ) (4 ) (25 ) Total accumulated other comprehensive loss (513 ) 81 (94 ) (526 ) Total shareholders’ equity 2,815 81 (94 ) 2,802 Total liabilities and shareholder’s equity $ 7,524 $ (70 ) $ 11 $ 7,465 Pension Other Total Millions Prior service cost (credit) $ 2 $ (10 ) $ (8 ) Net actuarial loss (gain) 58 (1 ) 57 Change in benefit obligation Benefit obligation at beginning of year Service cost Interest cost Plan participants' contributions Amendments Actuarial loss (gain) Benefits paid directly by Company Curtailments Benefit obligation at end of year Funded status at end of year Amounts recognized in consolidated balance sheets Accrued compensation, benefits and retirement costs—current liabilities Postretirement benefits other than pensions—long-term liabilities Net amount recognized Amounts recognized in accumulated other comprehensive loss consist of: Net actuarial loss Prior service credit Net amount recognized NOTES TO CONSOLIDATED FINANCIAL STATEMENTS (Continued) NOTE 12. PENSION AND OTHER POSTRETIREMENT BENEFITS (Continued) Pension Other Postretirement U.S. Plans Non-U.S. Plans Benefits December 31, 2006 2005 2006 2005 2006 2005 Millions Change in benefit obligations Benefit obligation at beginning of year $ 1,983 $ 1,911 $ 1,013 $ 1,017 $ 596 $ 694 Service cost 48 47 31 21 1 2 Interest cost 106 105 53 51 32 38 Plan participants’ contributions — 1 3 9 — — Amendments (20 ) — — — — (55 ) Actuarial losses (gains) 19 65 43 71 5 (20 ) Benefits paid from fund (141 ) (140 ) (37 ) (34 ) — — Benefits paid directly by Company (5 ) (5 ) (1 ) — (56 ) (59 ) Exchange rate changes — — 142 (109 ) — — Other — (1 ) 2 (13 ) (1 ) (4 ) Benefit obligations at end of year $ 1,990 $ 1,983 $ 1,249 $ 1,013 $ 577 $ 596 Change in plan assets Fair value of plan assets at beginning of year $ 1,606 $ 1,526 $ 737 $ 686 $ — $ — Actual return on plan assets 221 130 91 125 — — Company contributions 120 89 152 40 — — Plan participants’ contributions — 1 3 9 — — Benefits paid (141 ) (140 ) (37 ) (34 ) — — Exchange rate changes — — 114 (76 ) — — Other — — — (13 ) — — Fair value of plan assets at end of year $ 1,806 $ 1,606 $ 1,060 $ 737 $ — $ — Funded status Underfunded status $ (188 ) $ (377 ) $ (191 ) $ (276 ) $ (577 ) $ (596 ) Overfunded status 4 — 2 — — — Unrecognized actuarial loss — 581 — 329 — 45 Company contributions after measurement date 1 — 5 20 — — Unrecognized prior service cost (credit) — 11 — 22 — (59 ) Net amount recognized $ (183 ) $ 215 $ (184 ) $ 95 $ (577 ) $ (610 ) Amounts recognized in consolidated balance sheets Prepaid benefit cost $ 4 $ — $ 2 $ 6 $ — $ — Accrued benefit liability—current (5 ) (126 ) (1 ) (48 ) (54 ) (56 ) Accrued benefit liability—long-term (182 ) (231 ) (185 ) (165 ) (523 ) (554 ) Intangible asset — 15 — 22 — — Accumulated other comprehensive loss — 557 — 280 — — Net amount recognized $ (183 ) $ 215 $ (184 ) $ 95 $ (577 ) $ (610 ) Amounts recognized in accumulated other comprehensive loss consist of: Net actuarial loss $ 468 $ — $ 358 $ — $ 52 $ — Prior service (credit) cost (11 ) — 20 — (50 ) — Net amount recognized $ 457 $ — $ 378 $ — $ 2 $ — Pension U.S. Plans Non-U.S. Plans December 31, 2006 2005 2006 2005 Millions Total accumulated benefit obligation $ 1,969 $ 1,962 $ 1,161 $ 945 Plans with accumulated benefit obligation in excess of plan assets: Projected benefit obligation 1,930 1,983 1,202 974 Accumulated benefit obligation 1,908 1,962 1,120 911 Fair value of plan assets 1,742 1,606 1,011 699 Plans with projected benefit obligation in excess of plan assets: Projected benefit obligation 1,930 1,983 1,202 1,006 Accumulated benefit obligation 1,908 1,962 1,120 940 Fair value of plan assets 1,742 1,606 1,011 730 The following table presents the net periodic Pension Other U.S. Plans Non-U.S. Plans Postretirement Benefits Years ended December 31, 2006 2005 2004 2006 2005 2004 2006 2005 2004 Millions Service cost $ 48 $ 47 $ 39 $ 31 $ 21 $ 20 $ 1 $ 2 $ 4 Interest cost 106 105 108 53 51 49 32 38 43 Expected return on plan assets (127 ) (123 ) (121 ) (54 ) (53 ) (52 ) — — — Amortization of prior service cost (credit) 3 3 9 3 3 3 (10 ) (2 ) (2 ) Recognized net actuarial loss (gain) 38 34 22 19 15 12 (1 ) — 6 Other (1 ) — — 1 — — (1 ) — — Net periodic benefit cost $ 67 $ 66 $ 57 $ 53 $ 37 $ 32 $ 21 $ 38 $ 51 Service cost Interest cost Amortization of prior service credit Recognized net actuarial gain Other Net periodic other postretirement benefit cost before curtailments Curtailment loss Net periodic other postretirement benefit cost Other changes in benefit obligations recognized in other comprehensive income in 2009 are as follows: Amortization of prior service credit Incurred actuarial loss Other Total recognized in other comprehensive income Total recognized in net periodic other postretirement benefit cost and other comprehensive income The amount in accumulated other comprehensive loss that is expected to be recognized as a component of net periodic other postretirement benefit cost during the next fiscal year is a prior service credit of $8 million. As disclosed in Note 3, "RESTUCTURING AND OTHER CHARGES," to ourConsolidated Financial Statements, we executed restructuring actions in 2009. As a result, our U.S. postretirement benefit plans were remeasured and we recognized curtailment losses, as prescribed under GAAP other postretirement benefit standards, due to the significant reduction in the expected aggregate years of future service of the employees affected by the actions. In the third quarter of 2009, we recorded net curtailment losses of $6 million. The curtailment losses include recognition of the change in the APBO and a portion of the previously unrecognized prior service cost reflecting the reduction in expected future service. NOTES TO CONSOLIDATED FINANCIAL STATEMENTS (Continued) NOTE 12. PENSION AND OTHER POSTRETIREMENT BENEFITS (Continued) The table below presents assumptions used in determining the other postretirement benefit obligation for each year and reflects weighted-average percentages for our other postretirement plans: Discount rate The table below presents assumptions used in determining the net periodic other postretirement benefits cost and reflects weighted-average percentages for the various plans: Discount rate Our consolidated other postretirement benefit obligation is determined by application of the terms of health care and life insurance plans, together with relevant actuarial assumptions and health care cost trend rates. For measurement purposes, an 8.5 percent annual rate of increase in the per capita cost of covered health care benefits was assumed in 2010. The rate was assumed to decrease on a linear basis to 5.0 percent through 2017 and remain at that level thereafter. An increase in the health care cost trends of one percent would increase our APBO by $20 million as of December 31, 2009 and the net periodic other postretirement benefit expense for 2010 by $1 million. A decrease in the health care cost trends of 1 percent would decrease our APBO by $18 million as of December 31, 2009 and the net periodic other postretirement benefit expense for 2010 by $1 million. The Medicare Prescription Drug Improvement and Modernization Act of 2003 was reflected in the APBO beginning December 31, 2004, assuming we will continue to provide a prescription drug benefit to retirees that is at least actuarially equivalent to Medicare Part D and we will receive the federal subsidy. The table below presents Pension Other U.S. Plans Non Postretirement 2006 2005 2006 2005 2006 2005 Discount rate 5.60 % 5.60 % 4.96 % 4.95 % 5.60 % 5.60 % Compensation increase rate 4.00 % 4.00 % 4.02 % 3.75 % N/A N/A Expected benefit payments, net of Medicare Part D subsidy—postretirement Medicare Part D subsidy CUMMINS INC. AND NOTES TO CONSOLIDATED FINANCIAL STATEMENTS (Continued) Pension Other U.S. Plans Non-U.S. Plans Postretirement Benefits 2006 2005 2004 2006 2005 2004 2006 2005 2004 Discount rate 5.60 % 5.75 % 6.25 % 4.95 % 5.30 % 5.66 % 5.60 % 5.75 % 6.26 % Expected return on plan assets 8.50 % 8.50 % 8.50 % 7.24 % 7.56 % 8.08 % N/A N/A N/A Compensation increase rate 4.00 % 4.00 % 4.00 % 3.75 % 3.75 % 3.74 % N/A N/A N/A Target Percentage of Investment description 2007 2006 2005 Equity securities 60-80% 62.7 % 64.1 % Fixed income 23-33% 33.4 % 33.5 % Real estate/Other 3-7% 3.9 % 2.4 % Total 100.0 % 100.0 % 2007 2008 2009 2010 2011 2012-2016 Millions Expected benefit payments—pensions $ 202 $ 200 $ 204 $ 208 $ 211 $ 1,086 Expected benefit payments, net of Medicare Part D subsidy—postretirement 56 56 56 55 54 235 Medicare Part D subsidy 4 5 5 5 6 34 NOTE 13. December 31, 2006 2005 Millions Balance, beginning of year $ 581 $ 495 Provision for warranties issued 332 275 Deferred revenue on extended warranty contracts sold 75 68 Payments (292 ) (223 ) Amortization of deferred revenue on extended warranty contracts (37 ) (19 ) Changes in estimates for pre-existing warranties (14 ) (11 ) Foreign currency translation 7 (4 ) Balance, end of year $ 652 $ 581 Accrued warranty Deferred revenue Accrued compensation Other long-term liabilities Other liabilities and deferred revenue NOTE 14. COMMITMENTS AND CONTINGENCIES We are In June 2008, four of our sites in Southern Indiana, including our Technical Center, experienced extensive flood damage. We have submitted a claim for $237 million to our insurance carriers, which includes a claim for business interruption. Our insurance carriers have disputed certain aspects of our claim and each party has filed suit against the other. Although we believe that we should be insured against the full amount of such claim, there can be no assurance that we will be successful in pursuing these claims. NOTES TO CONSOLIDATED FINANCIAL STATEMENTS (Continued) NOTE 14. COMMITMENTS AND CONTINGENCIES (Continued) approximating fair market value, certain property, inventory and rental generator sets manufactured by Cummins that are secured by the In May 2009, the financing agreement with the financial institution was refinanced and Cummins did not make any new commitments, thereby relieving Cummins of responsibility to purchase any assets from the financial institution in event of default by the distributors. Our distribution agreements with independent and partially-owned distributors generally have a three-year term and are restricted to specified territories. Our distributors develop and maintain a network of dealers with which we have no direct relationship. The We have various residual value guarantees on equipment leased under operating leases. The total amount of these residual value guarantees at December 31, In addition to the guarantees discussed above, from time to time we enter into other guarantee arrangements, including guarantees of non-U.S. distributor financing and other miscellaneous guarantees of third-party obligations. We have arrangements with certain suppliers that require us to purchase minimum volumes or be subject to monetary penalties. The penalty amounts are less than our purchase commitments and essentially allow the supplier to recover their tooling NOTES TO CONSOLIDATED FINANCIAL STATEMENTS (Continued) NOTE 14. COMMITMENTS AND CONTINGENCIES (Continued) outstanding borrowings up to a maximum guarantee of $88 million (at current exchange rates). As of December 31, 2009, outstanding borrowings under this agreement were $148 million and our guarantee was $74 million (at current exchange rates). We recorded a liability for the fair value of this guarantee in accordance with guarantor's accounting and disclosure requirements for guarantees, including indirect guarantees of indebtedness of others. The amount of the liability was less than $1 million. The offset to this liability was an increase in our investment in the joint venture. We have guarantees with certain customers that require us to satisfactorily honor contractual or regulatory obligations, or compensate for monetary losses related to nonperformance. Performance bonds and other performance-related guarantees were $75 million and $32 million as of December 31, 2009 and 2008. We had a standby commitment with Irwin Financial Corporation (Irwin) to purchase up to $25 million of its common shares in connection with a potential rights offering being planned by Irwin. Our commitment was subject to the satisfaction of several conditions. On September 18, 2009, Irwin Union Bank and Trust Company, Columbus, Indiana, was placed into receivership by the Indiana Department of Financial Institutions and Irwin Union Bank, F.S.B., Louisville, Kentucky, was placed into receivership by the Office of Thrift Supervision. In light of these actions, Cummins terminated the Standby Purchase Agreement on September 21, 2009, and no further commitments to Irwin remain. Periodically, we enter into various contractual arrangements where we agree to indemnify a third-party against certain types of losses. Common types of indemnities, We regularly evaluate the probability of having to incur costs associated with these As of December 31, We lease certain manufacturing equipment, facilities, warehouses, office space and NOTES TO CONSOLIDATED FINANCIAL STATEMENTS (Continued) NOTE non-cancelable operating leases with fixed rental payments, expire over the next ten years and contain renewal provisions. Rent expense under these leases approximated: Rent expense Following is a summary of the future minimum lease payments due under capital and operating leases, including leases in our rental business discussed below, with terms of more than one year at December 31, 2009, together with the net present value of the minimum payments due under capital leases: 2010 2011 2012 2013 2014 After 2014 Total minimum lease payments Interest Present value of net minimum lease payments In addition, we have subleased certain of the facilities under operating lease to third parties. The future minimum lease payments due from lessees under those arrangements are $1 million per year for the years 2010 through 2014. NOTES TO CONSOLIDATED FINANCIAL STATEMENTS (Continued) NOTE 14. COMMITMENTS AND CONTINGENCIES (Continued) During 2001, we entered into a sale-leaseback transaction with a financial institution with regard to certain heavy-duty engine manufacturing equipment. The lease was classified as an operating lease with a lease term of 11.5 years, expiring June 28, 2013. The financial institution created a grantor trust to act as the lessor in the arrangement. The financial institution owns all of the equity in the trust. The grantor trust has no assets other than the equipment and its rights to the lease agreement with us. On the initial sale, we received $125 million from the financial institution which was financed with $99 million of non-recourse debt and $26 million of equity. Our obligations to the grantor trust consisted of the payments due under the lease and a $9 million guarantee of the residual value of the equipment. In addition, we had a fixed price purchase option that was exercisable on January 14, 2009, for approximately $35 million; however, we decided not to exercise this option. In December 2003, the grantor trust which acts as the lessor in the sale and leaseback transaction described above was consolidated In February 2009, we amended the lease agreement to extend the lease for an additional two years to June 2015 and we removed the residual value guarantee. As a result of removing the residual value guarantee, we are no longer required to consolidate the grantor trust and we deconsolidated the trust in the first quarter of 2009. With the deconsolidation, we are now required to account for the leasing arrangement with the trust which qualifies as a capital lease. The deconsolidation of the trust had minimal impact on ourConsolidated Financial Statements as the present value of the minimum lease payments (including the extension) approximated the amount that was reported as noncontrolling interest as of the date of the amendment. The reduction in noncontrolling interests and increase in our capital lease liabilities was $35 million. The future lease payments required under the amended lease are as follows: December 31, 2006 2005 Millions Cummins India Ltd. $ 121 $ 102 Consolidated Diesel Company 52 46 Wuxi Holset Engineering Co. Ltd. 19 16 All others 62 61 Total $ 254 $ 225 2010 2011 2012 2013 2014 Thereafter The lease agreement includes certain default provisions requiring us to make timely rent payments, maintain, service, repair and insure the equipment and maintain minimum debt ratings for our long-term senior unsecured debt obligations. NOTES TO CONSOLIDATED FINANCIAL STATEMENTS (Continued) NOTE Preferred and Preference Stock We are authorized to issue one million shares each of zero par value preferred and preference stock with preferred shares being senior to preference shares. We can determine the number of shares of each series, and the rights, preferences and limitations of each series. At December 31, 2009, there was no preferred or preference stock outstanding. During the second quarter of 2008, our shareholders ratified a proposal to increase our common stock authorization to 500 million shares. The Board of Directors authorized a pair of two-for-one splits of Cummins stock in 2007, which were distributed on April 9, 2007 and January 2, 2008, to shareholders of record as of March 26, 2007 and December 21, 2007, respectively. All share and per share amounts in this Form 10-K have been adjusted to reflect the two-for-one stock splits. Changes in shares of common stock, treasury stock and common stock held in trust for employee benefit plans are as follows: Common Common Common Millions Balance at December 31, 2003 48.3 5.6 2.3 Shares issued — (3.4 ) — Other shareholder transactions (0.1 ) — (0.1 ) Balance at December 31, 2004 48.2 2.2 2.2 Shares acquired — 0.4 — Shares issued 0.3 (0.6 ) — Other shareholder transactions — — (0.2 ) Balance at December 31, 2005 48.5 2.0 2.0 Shares acquired — 1.1 — Shares issued 6.6 (0.2 ) — Other shareholder transactions (0.1 ) — (0.1 ) Balance at December 31, 2006 55.0 2.9 1.9 Balance at December 31, 2006 Shares acquired Shares issued Employee benefits trust activity Other shareholder transactions Balance at December 31, 2007 Shares acquired Shares issued Employee benefits trust activity Other shareholder transactions Balance at December 31, 2008 Shares acquired Shares issued Employee benefits trust activity Other shareholder transactions Balance at December 31, 2009 NOTES TO CONSOLIDATED FINANCIAL STATEMENTS (Continued) NOTE 15. CUMMINS INC. SHAREHOLDERS' EQUITY (Continued) In July First quarter Second quarter Third quarter Fourth quarter Total dividends paid to common shareholders for the years ended December 31, 2009, 2008 and Shares of common stock repurchased by us are recorded at cost as treasury stock and result in a reduction of may be reissued as part of our stock-based compensation programs. When shares are reissued, we use the weighted-average cost method for determining cost. The Treasury stock activity for the three-year period ended December 31, NOTES TO CONSOLIDATED FINANCIAL STATEMENTS (Continued) NOTE 15. CUMMINS INC. SHAREHOLDERS' EQUITY (Continued) and $3 million, respectively. There were no contributions charged to income for the year ended December 31, 2007. EBT shares sold on open market Proceeds from sale(1) In 2007, we converted 0.8 million shares into treasury stock at its fair value and sold 0.3 million shares on the open market from the EBT and used the $66 million of proceeds to fund other non-qualified employee benefit plans. We have an ESOP Trust that was established in 1989 for certain domestic salaried and non-bargained employees participating in our Our annual cash contributions during plan year Dividends on unallocated ESOP shares Annual cash contributions, dividends received on unallocated shares and cash contributions from EBT Annual compensation expense Allocated shares to participants Unreleased and unallocated shares Shares committed to be allocated Total ESOP Trust shares CUMMINS INC. AND NOTES TO CONSOLIDATED FINANCIAL STATEMENTS (Continued) Following are the items included in other comprehensive Before Tax After Tax (Provision) Tax Amount Benefit Amount Millions Year ended December 31, 2006 Minimum pension liability adjustment $ 154 $ (52 ) $ 102 Foreign currency translation adjustments 72 (9 ) 63 Unrealized loss on marketable securities: Holding loss (2 ) 1 (1 ) Reclassification of realized loss to net earnings — — — Net unrealized loss (2 ) 1 (1 ) Unrealized gain on derivatives: Holding gain 36 (12 ) 24 Reclassification of realized gain to net earnings (25 ) 8 (17 ) Net unrealized gain 11 (4 ) 7 Total other comprehensive income $ 235 $ (64 ) $ 171 Year ended December 31, 2005 Minimum pension liability adjustment $ (39 ) $ 15 $ (24 ) Foreign currency translation adjustments (39 ) — (39 ) Unrealized gain on marketable securities: Holding gain 5 (2 ) 3 Reclassification of realized gain to net earnings (2 ) 1 (1 ) Net unrealized gain 3 (1 ) 2 Unrealized loss on derivatives: Holding loss (9 ) 3 (6 ) Reclassification of realized loss to net earnings 6 (2 ) 4 Net unrealized loss (3 ) 1 (2 ) Total other comprehensive loss $ (78 ) $ 15 $ (63 ) Year ended December 31, 2004 Minimum pension liability adjustment $ (104 ) $ 39 $ (65 ) Foreign currency translation adjustments 26 (6 ) 20 Unrealized gain (loss) on marketable securities: Holding gain (loss) — — — Reclassification of realized gain to net earnings (7 ) 3 (4 ) Net unrealized loss (7 ) 3 (4 ) Unrealized gain (loss) on derivatives: Holding loss (8 ) 3 (5 ) Reclassification of realized loss to net earnings 9 (3 ) 6 Net unrealized gain 1 — 1 Total other comprehensive loss $ (84 ) $ 36 $ (48 ) Year ended December 31, 2009 Change in pensions and other postretirement defined benefit plans Foreign currency translation adjustments Unrealized (loss) gain on marketable securities: Holding gain Reclassification of realized gain to net income Net unrealized (loss) gain Unrealized gain on derivatives: Holding gain Reclassification of realized loss to net income Net unrealized gain Other comprehensive income attributable to Cummins Inc. Noncontrolling interests Total other comprehensive income Year ended December 31, 2008 Change in pensions and other postretirement defined benefit plans Foreign currency translation adjustments Unrealized loss on marketable securities: Holding gain Reclassification of realized gain to net income Net unrealized loss Unrealized loss on derivatives: Holding loss Reclassification of realized gain to net income Net unrealized loss Other comprehensive loss attributable to Cummins Inc. Noncontrolling interests Total other comprehensive loss Year ended December 31, 2007 Change in pensions and other postretirement defined benefit plans Foreign currency translation adjustments Unrealized gain on marketable securities: Holding gain Reclassification of realized gain to net income Net unrealized gain Unrealized loss on derivatives: Holding gain Reclassification of realized gain to net income Net unrealized loss Other comprehensive income attributable to Cummins Inc. Noncontrolling interests Total other comprehensive income NOTES TO CONSOLIDATED FINANCIAL STATEMENTS (Continued) Years ended 2006 2005 2004 Millions Net earnings for basic EPS $ 715.4 $ 549.8 $ 350.4 Interest on junior convertible subordinated debentures, net of tax 5.9 12.9 13.0 Net earnings for diluted EPS $ 721.3 $ 562.7 $ 363.4 Weighted-average common shares outstanding: Basic 47,626,331 44,239,131 42,215,812 Dilutive effect of stock compensation awards 395,942 544,816 680,033 Dilutive effect of junior convertible subordinated debentures 2,754,447 6,310,761 6,311,400 Diluted 50,776,720 51,094,708 49,207,245 Earnings per common share: Basic $ 15.02 $ 12.43 $ 8.30 Diluted 14.21 11.01 7.39 December 31, 2006 2005 Notional Notional Amount Fair Value Amount Fair Value Millions Foreign currency: Forward contracts $ 72 $ 4 $ 440 $ 11 Commodity price: Forward contracts 114 11 46 8 Interest rate: Fixed-to-floating swap 250 (3 ) 250 5 $ 436 $ 12 $ 736 $ 24 In September 2003, our shareholders approved the 2003 Stock Incentive Plan (The Plan) Stock options are generally granted with a strike price equal to the fair market value of the stock on the date of grant, a life of 10 years and a two-year vesting period. Compensation expense is recorded on a straight-line basis over the vesting period beginning on the grant date. The compensation expense is based on the fair value of each option grant using the Black-Scholes option pricing model. Options granted to employees eligible for retirement under the Company's retirement plan are fully expensed as of the grant date. Stock options are also awarded through the Key Employee Stock Investment Plan (KESIP) which allows certain employees, other than officers, to purchase shares of common stock on an installment basis up to an established credit limit. Fifty stock options are granted for every even block of 100 KESIP shares purchased by the employee. The Performance shares are granted as target awards and are earned based on our return on equity (ROE) performance. A payout factor has been established ranging from zero to 200 percent of the target award based on the actual ROE performance during the two-year period. Any shares earned are then restricted for one additional year. Employees leaving the company prior to the end of the restriction period forfeit their shares. Compensation expense is recorded ratably over the period beginning on the grant date until the shares become unrestricted and is based on the amount of the award that is expected to be earned under the plan formula, adjusted each reporting period based on current information. Compensation expense (net of estimated forfeitures) related to our share-based plans for the year ended December 31, NOTES TO CONSOLIDATED FINANCIAL STATEMENTS (Continued) NOTE 17. STOCK INCENTIVE AND STOCK OPTION PLANS (Continued) The table below summarizes the activity in our stock option plans: Options Weighted-average Balance, December 31, 2003 4,493,375 $ 43.50 Granted 5,500 53.84 Reinstated grants 36,050 42.20 Exercised (3,427,345 ) 42.92 Forfeited (77,380 ) 43.92 Expired (10,210 ) 49.12 Balance, December 31, 2004 1,019,990 $ 45.39 Granted 2,900 70.24 Reinstated grants 3,100 38.85 Exercised (616,540 ) 46.06 Forfeited (5,550 ) 41.78 Expired (4,200 ) 41.15 Balance, December 31, 2005 399,700 $ 44.59 Granted 450 105.24 Exercised (190,560 ) 45.80 Forfeited — — Expired (1,650 ) 40.63 Balance, December 31, 2006 207,940 $ 43.64 Exercisable, December 31, 2004 511,555 $ 42.75 Exercisable, December 31, 2005 399,700 $ 44.59 Exercisable, December 31, 2006 207,940 $ 43.64 Balance, December 31, 2006 Granted Exercised Forfeited Expired Balance, December 31, 2007 Granted Exercised Forfeited Expired Balance, December 31, 2008 Granted Exercised Forfeited Expired Balance, December 31, 2009 Exercisable, December 31, 2007 Exercisable, December 31, 2008 Exercisable, December 31, 2009 The weighted-average grant date fair value of options granted during the years ended December 31, NOTES TO CONSOLIDATED FINANCIAL STATEMENTS (Continued) NOTE 17. STOCK INCENTIVE AND STOCK OPTION PLANS (Continued) The weighted-average grant date fair value of performance and restricted shares is as follows: Performance Weighted- Nonvested at December 31, 2003 278,000 $ 48.05 Granted 280,890 50.24 Vested — — Forfeited (31,340 ) 48.44 Nonvested at December 31, 2004 527,550 $ 49.19 Granted 200,340 74.87 Vested — — Forfeited (5,240 ) 58.39 Nonvested at December 31, 2005 722,650 $ 56.27 Granted 175,148 98.86 Vested (246,800 ) 48.05 Forfeited (14,703 ) 56.13 Nonvested at December 31, 2006 636,295 $ 71.19 Nonvested at December 31, 2006 Granted Vested Forfeited Nonvested at December 31, 2007 Granted Vested Forfeited Nonvested at December 31, 2008 Granted Vested Forfeited Nonvested at December 31, 2009 The total fair value of performance shares vested during the years ended December 31, 2009, 2008 and 2007 was $35 million, $16 million and $13 million, respectively. The total fair value of restricted shares vested during the years ended December 31, 2009 and 2008 was $2 million each and zero for the year ended December 31, 2007. Restricted Weighted- Nonvested at December 31, 2003 — $ — Granted — — Vested — — Forfeited — — Nonvested at December 31, 2004 — $ — Granted 1,000 74.87 Vested — — Forfeited — — Nonvested at December 31, 2005 1,000 $ 74.87 Granted 50,000 107.85 Vested — — Forfeited — — Nonvested at December 31, 2006 51,000 $ 107.20 The fair value of each option grant was estimated on the grant date using the Black-Scholes option pricing model with the following assumptions: Years ended December 31, 2006 2005 2004 Expected life (years) 7 7 7 Risk-free interest rate 4.9 % 4.1 % 3.8 % Expected volatility 26.4 % 38.7 % 41.0 % Dividend yield 1.8 % 2.5 % 3.2 % Expected life (years) Risk-free interest rate Expected volatility Dividend yield Expected Risk-free interest Expected Dividend Options Outstanding and Exercisable Exercise Price Range Number of Weighted-average Weighted-average Aggregate $23.95 - 35.92 650 1.7 $ 32.01 $ 56,009 $35.93 - 53.89 188,040 4.4 42.34 14,260,507 $53.90 - 107.44 19,250 1.5 56.69 1,183,668 207,940 4.1 $ 43.64 $ 15,500,184 Contents CUMMINS INC. AND NOTES TO CONSOLIDATED FINANCIAL STATEMENTS (Continued) Noncontrolling interests in the equity of consolidated subsidiaries are as follows: Cummins India Ltd. Wuxi Cummins Turbo Technologies Co. Ltd. Other Total NOTE 19. EARNINGS PER SHARE We calculate basic earnings per share (EPS) of common stock by dividing net income attributable to Cummins Inc. by the weighted-average number of common shares outstanding for the period. The calculation of diluted EPS assumes the issuance of common stock for all potentially dilutive share equivalents outstanding. We exclude shares of common stock held in the EBT (see Note 15) from the calculation of the Net income attributable to Cummins Inc. Weighted-average common shares outstanding: Basic Dilutive effect of stock compensation awards Diluted Earnings per common share attributable to Cummins Inc.: Basic Diluted The weighted-average diluted common shares outstanding for 2009 and 2008 excludes the effect of approximately 53,750 and 16,020 weighted-average shares, respectively, of common stock options, since such options had an exercise price in excess of the monthly average market value of our common stock during that year. NOTE 20. DERIVATIVES We are exposed to financial risk resulting from volatility in foreign exchange rates, commodity prices and interest rates. This risk is closely monitored and managed through the use of financial derivative instruments including Table of NOTES TO CONSOLIDATED FINANCIAL STATEMENTS (Continued) NOTE 20. DERIVATIVES (Continued) hedging purposes, and under no circumstances are they used for speculative purposes. When material, we adjust the Capital Leases Operating Leases Millions 2007 $ 36 $ 39 2008 36 30 2009 30 24 2010 25 19 2011 19 14 After 2011 50 23 Total minimum lease payments $ 196 $ 149 Interest (33 ) Present value of net minimum lease payments $ 163 our derivative contracts for counter-party or our credit risk. The results and status of our hedging transactions are reported to senior management on a monthly and quarterly basis. To minimize the income volatility resulting from the remeasurement of net monetary assets and payables denominated in a currency other than the functional currency, we enter into foreign currency forward contracts, which are considered economic hedges. The objective is to offset the gain or loss from remeasurement with the gain or loss from the fair market valuation of the forward contract. These derivative instruments are not designated as hedges under GAAP. The table below summarizes our outstanding foreign currency forward contracts. The currencies in this United States Dollar (USD) British Pound Sterling (GBP) Euro (EUR) Singapore Dollar (SGD) Indian Rupee (INR) Japanese Yen (JPY) Romanian Leu (RON) NOTES TO CONSOLIDATED FINANCIAL STATEMENTS (Continued) NOTE 20. DERIVATIVES (Continued) We are exposed to fluctuations in commodity prices due to contractual agreements with component suppliers. In order to protect ourselves against future price volatility and, consequently, fluctuations in gross margins, we periodically enter into commodity swap contracts with designated banks to fix the cost of certain raw material purchases with the objective of minimizing changes in inventory cost due to market price fluctuations. The commodity swap contracts are derivative contracts that are designated as cash flow hedges under GAAP. The effective portion of the unrealized gain or loss is deferred and reported as a component of AOCL. When the hedged forecasted transaction (purchase) occurs, the unrealized gain or loss is reclassified into income in the same line item associated with the hedged transaction in the same period or periods during which the hedged transaction affects income. The ineffective portion of the hedge, if any, is recognized in current income in the period in which the ineffectiveness occurs. As of December 31, 2009, we expect to reclassify an unrealized net gain of $5 million from AOCL to income over the next year. For the year ended December 31, 2009, we discontinued hedge accounting on certain contracts where the forecasted transactions were The following table summarizes our outstanding commodity swap contracts that were entered into to hedge the cost of certain raw material purchases: Copper Platinum Palladium We are exposed to market risk from fluctuations in interest rates. We manage our exposure to interest rate fluctuations through the use of interest rate swaps. The objective of the swaps is to more effectively balance our borrowing costs and interest rate risk. In November 2005, we entered into an interest rate swap to effectively convert our $250 million debt, due in 2028, from a fixed rate of 7.125% to a floating rate based on NOTES TO CONSOLIDATED FINANCIAL STATEMENTS (Continued) NOTE 20. DERIVATIVES (Continued) or loss on the hedged item attributable to the hedged risk are recognized in current income as "Interest expense." These gains and losses for the year ended December 31, 2009, were as follows: Interest expense The following table summarizes the location and amounts of gains and losses in ourConsolidated Statements of Income for derivative instruments classified as Foreign currency forward contracts Commodity swap contracts Total Foreign currency forward contracts Foreign currency forward contracts NOTES TO CONSOLIDATED FINANCIAL STATEMENTS (Continued) NOTE 20. DERIVATIVES (Continued) The following tables summarize the location and fair value of derivative instruments on ourConsolidated Balance Sheets: Derivatives Designated as Hedging Instruments Foreign currency forward contracts Commodity swap contracts Commodity swap contracts Interest rate contract Total Derivatives Designated as Hedging Instruments Total derivative assets Derivatives Designated as Hedging Instruments Foreign currency forward contracts Commodity swap contracts Total Derivatives Designated as Hedging Instruments Derivatives Not Designated as Hedging Instruments Foreign currency forward contracts Total Derivatives Not Designated as Hedging Instruments Total derivative liabilities NOTE 21. SALES OF ACCOUNTS RECEIVABLE In January 2004, we entered into a three-year facility agreement with a financial institution to sell a designated pool of trade receivables to Cummins Trade Receivables, LLC (CTR), a wholly-owned special purpose subsidiary. In July 2007, we amended the agreement to extend the facility until July 2010, and raised the purchase limitation from $200 million to $400 million. The agreement also provides us with an option to increase the purchase limitation up to $500 million upon approval. As NOTES TO CONSOLIDATED FINANCIAL STATEMENTS (Continued) NOTE 21. SALES OF ACCOUNTS RECEIVABLE (Continued) necessary, CTR may transfer a direct interest in its receivables, without recourse, to the financial institution. To maintain a balance in the designated pools of receivables sold, we sell new receivables to CTR as existing receivables are collected. Receivables sold to CTR in which an interest is No accounts receivable sold to CTR were written off during 2009, 2008 or 2007. The sold receivables servicing portfolio, which is included in receivables and the proceeds from the sale of receivables and other related cash flows are as follows: Sold receivables servicing portfolio Receivables sold to special purpose subsidiary Collections reinvested in special purpose subsidiary Servicing fees and interest NOTE 22. ACQUISITIONS AND DIVESTITURES During 2008, we purchased a majority interest in three previously independent North American distributors in order to increase our ownership interests in key portions of the distribution channel. The acquisitions were accounted for under the purchase method of accounting and resulted in an aggregate purchase price of $81 million which we funded with $54 million of borrowings and $27 million of cash. The assets of the acquired businesses were primarily accounts receivable, inventory and fixed assets. There was less than $1 million of goodwill generated from these transactions. During the first three months of 2007, we purchased the remaining interest in a manufacturing joint venture and acquired ownership of an international independent distributor for approximately $20 million. We recorded goodwill of $13 million for these two transactions. In July 2008, we entered into a transaction with two Fiat group companies to (1) sell our one-third interest in the European Engine Alliance (EEA) joint venture and simultaneously (2) purchase the remaining 50 percent interest in CDC. As a result, we now own 100 percent of CDC and no longer have an ownership interest in EEA. CDC was previously included in our consolidated results as we were considered the primary beneficiary under GAAP. We sold our remaining interest in EEA for $64 million and NOTES TO CONSOLIDATED FINANCIAL STATEMENTS (Continued) NOTE 23. VARIABLE INTEREST ENTITIES We consolidate certain VIEs if we are deemed to be the primary beneficiary, defined in FASB standards for consolidation of variable interest entities, as the entity that absorbs a majority of the VIEs' expected losses, receives a majority of the VIEs' expected residual returns, or both. We have variable interests in certain businesses accounted for under We had previously determined that the grantor trust is a VIE under GAAP and due primarily to the existence of the residual value guarantee, we determined that we were the primary beneficiary of the VIE. As a result, we began consolidating the grantor trust as of December 31, 2003, even though we do not own any of its equity. In April 2008, we made the final payment on the non-recourse debt. As further discussed in Note 14, we amended our lease agreement in January 2009 to remove the residual value guarantee and as a result, determined that we were no longer the primary beneficiary of the trust. Cummins Komatsu Engine Corporation (CKEC) is an engine manufacturing entity jointly owned and operated by us and our equity partner. We were deemed the primary beneficiary of this VIE due to the pricing arrangements of purchases and the substantial volume of purchases we made from the VIE. As of December 31, 2009, CKEC has no unsecured debt. Creditors of this entity have no recourse to our general credit. Conversely, our creditors have no recourse to the assets of CKEC. Results of CKEC for the year ended December 31, 2009, are included in ourConsolidated Statements of Income and a Current assets (Primarily receivables and inventory) Long-term assets Current liabilities We also have variable interests in two North American distributors that were deemed to be VIEs in accordance with GAAP, but we were not deemed to be the primary beneficiary since we do not absorb a NOTES TO CONSOLIDATED FINANCIAL STATEMENTS (Continued) The Total assets Total liabilities (including total debt of $34) Revenues Net income In January 2010, we purchased an additional 50 percent ownership interest in Cummins Western Canada, bringing our total ownership interest to 80 percent. Western Canada will cease to be a variable interest entity in 2010. CDC was NOTE 24. OTHER (EXPENSE) INCOME Other (expense) income included the following: Foreign currency (losses) gains Bank charges Change in cash surrender value of corporate owned life insurance(1) Dividend income Other, net Total other (expense) income, net NOTES TO CONSOLIDATED FINANCIAL STATEMENTS (Continued) NOTE Our reportable operating segments consist of the following: Engine, Power Generation, Components and Distribution. This reporting structure is organized according to the products and markets each segment We use segment EBIT (defined as earnings before interest expense, taxes and The accounting policies of our operating segments are the same as those applied in theConsolidated Financial Statements. We prepared the financial results of our operating segments on a basis that is consistent with the manner in which we internally disaggregate financial information to assist in making internal operating decisions. We have allocated certain common costs and expenses, primarily corporate functions, among segments differently than we would for stand-alone financial information prepared in accordance with GAAP. These include certain costs and expenses of shared services, such as information technology, human resources, legal and finance. We also do not allocate debt-related items, actuarial gains and losses, prior service costs or credits, NOTES TO CONSOLIDATED FINANCIAL STATEMENTS (Continued) NOTE 25. OPERATING SEGMENTS (Continued) Summarized financial information regarding our reportable operating segments at December 31, is shown in the table below: Engine Power Components Distribution Non-segment Total Millions 2006 Net sales $ 7,511 $ 2,416 $ 2,281 $ 1,385 $ (2,231 ) $ 11,362 Depreciation and amortization 192 36 57 11 — 296 Investee equity, royalty and other income 67 12 7 54 — 140 Interest income 36 7 2 2 — 47 Segment EBIT 733 220 107 144 (25 ) 1,179 Net assets 1,698 850 1,063 445 — 4,056 Investment in and advances to equity investees 213 23 40 69 — 345 Capital expenditures 125 45 70 9 — 249 2005 Net sales $ 6,657 $ 1,999 $ 2,000 $ 1,191 $ (1,929 ) $ 9,918 Depreciation and amortization 182 45 53 15 — 295 Investee equity, royalty and other income 80 9 8 34 — 131 Interest income 17 3 3 1 — 24 Segment EBIT 582 145 89 107 (16 ) 907 Net assets 1,518 718 944 299 — 3,479 Investment in and advances to equity investees 177 23 31 47 — 278 Capital expenditures 75 36 68 7 — 186 2004 Net sales $ 5,424 $ 1,842 $ 1,783 $ 973 $ (1,584 ) $ 8,438 Depreciation and amortization 177 39 49 7 — 272 Investee equity, royalty and other income 80 6 9 25 — 120 Interest income 5 4 2 1 — 12 Segment EBIT 328 60 84 79 (8 ) 543 Net assets 1,282 717 896 256 — 3,151 Investment in and advances to equity investees 216 18 19 33 — 286 Capital expenditures 68 34 43 6 — 151 2009 External sales Intersegment sales Total sales Depreciation and amortization(2) Research, development and engineering expenses Equity, royalty and interest income from investees Restructuring and other charges Interest income Segment EBIT Net assets Investment in and advances to equity investees Capital expenditures 2008 External sales Intersegment sales Total sales Depreciation and amortization(2) Research, development and engineering expenses Equity, royalty and interest income from investees Restructuring and other charges Interest income Segment EBIT Net assets Investment in and advances to equity investees Capital expenditures 2007 External sales Intersegment sales Total sales Depreciation and amortization(2) Research, development and engineering expenses Equity, royalty and interest income from investees Interest income Segment EBIT Net assets Investment in and advances to equity investees Capital expenditures NOTES TO CONSOLIDATED FINANCIAL STATEMENTS (Continued) NOTE 25. OPERATING SEGMENTS (Continued) A reconciliation of our segment information to the corresponding amounts in Years ended December 31, 2006 2005 2004 Millions Segment EBIT $ 1,179 $ 907 $ 543 Less: Interest expense 96 109 111 Earnings before income taxes and minority interests $ 1,083 $ 798 $ 432 Segment EBIT Less: Interest expense Income before income taxes Net assets for operating segments Liabilities deducted in arriving at net assets Pension and other postretirement benefit adjustments excluded from net assets Deferred tax assets not allocated to segments Debt-related costs not allocated to segments Total assets NOTES TO CONSOLIDATED FINANCIAL STATEMENTS (Continued) NOTE 25. OPERATING SEGMENTS (Continued) December 31, 2006 2005 Millions Net assets for operating segments $ 4,056 $ 3,479 Liabilities deducted in arriving at net assets 3,510 3,354 Minimum pension liability excluded from net assets — (837 ) Pension and other postretirement liabilities (837 ) — Deferred tax assets not allocated to segments 710 863 Debt-related costs not allocated to segments 26 26 Total assets $ 7,465 $ 6,885 The table below presents certain segment information by geographic area. Net sales attributed to geographic areas are based on the location of the customer. Years ended and as of December 31, 2006 2005 2004 Millions Net sales United States $ 5,719 $ 4,832 $ 4,363 United Kingdom 463 437 395 Canada 743 728 549 Other foreign countries 4,437 3,921 3,131 Total net sales $ 11,362 $ 9,918 $ 8,438 Long-lived assets United States $ 1,397 $ 1,387 United Kingdom 207 204 Other foreign countries 456 420 Total long-lived assets $ 2,060 $ 2,011 Net sales United States China Brazil India United Kingdom Canada Mexico Other foreign countries Total net sales Long-lived assets United States China United Kingdom India Brazil Mexico Canada Other foreign countries Total long-lived assets SELECTED QUARTERLY FINANCIAL DATA First Second Third Fourth 2006 Millions, except per share amounts Net sales $ 2,678 $ 2,842 $ 2,809 $ 3,033 Gross margin 599 672 654 670 Net earnings 135 220 171 189 Net earnings per share—basic(a) $ 3.04 $ 4.81 $ 3.40 $ 3.78 Net earnings per share—diluted(a) $ 2.70 $ 4.38 $ 3.37 $ 3.75 Dividends per share $ 0.30 $ 0.30 $ 0.36 $ 0.36 Stock price per share High $ 110.60 $ 122.75 $ 124.97 $ 139.20 Low $ 88.69 $ 100.25 $ 108.50 $ 117.55 Net sales Gross margin Net income attributable to Cummins Inc.(1)(2) Net earnings per share attributable to Cummins Inc.—basic(3) Net earnings per share attributable to Cummins Inc.—diluted Cash dividends per share Stock price per share High Low 2005 Net sales $ 2,208 $ 2,490 $ 2,467 $ 2,753 Gross margin 456 550 561 619 Net earnings 97 141 145 167 Net earnings per share—basic(a) $ 2.20 $ 3.20 $ 3.27 $ 3.75 Net earnings per share—diluted(a) $ 1.96 $ 2.83 $ 2.90 $ 3.31 Dividends per share $ 0.30 $ 0.30 $ 0.30 $ 0.30 Stock price per share High $ 84.60 $ 75.65 $ 93.88 $ 92.50 Low $ 70.16 $ 63.59 $ 72.27 $ 77.80 Net sales Gross margin Net income attributable to Cummins Inc.(1)(2) Net earnings per share attributable to Cummins Inc.—basic(3) Net earnings per share attributable to Cummins Inc.—diluted Cash dividends per share Stock price per share High Low At December 31, Item 9. Changes in and Disagreements with Accountants on Accounting and Financial Disclosure Item 9A. Controls and Procedures Evaluation of Disclosure Controls and Procedures As of the end of the period covered by this Annual Report on Form 10-K, our management evaluated, with the participation of our Chief Executive Officer and Chief Financial Officer, the effectiveness of the design and operation of our disclosure controls and procedures as defined in Exchange Act Rules 13a-15(e) and 15d-15(e). Based upon that evaluation, our Chief Executive Officer and our Chief Financial Officer concluded that our Company's disclosure controls and procedures were effective as of the end of the period covered by this Annual Report on Form 10-K. There has been no change in our internal control over financial reporting during the quarter ended December 31, 2009, that has materially affected, or is reasonably likely to materially affect, our internal control over financial reporting. The information required by Item 9A relating to Management's Annual Report on Internal Control Over Financial Reporting and Attestation Report of the Registered Public Accounting Firm is incorporated herein by reference to the information set forth under the captions "Management's Report on Internal Control Over Financial Reporting" and "Report of Independent Registered Public Accounting Firm," respectively, under Item 8. None. Item 10. Directors, Executive Officers and Corporate Governance The information required by Item 10 is incorporated by reference to the relevant information under the captions "Corporate Governance," "Election of Directors" and "Other Information—Section 16(a) Beneficial Ownership Reporting Compliance" in our 2010 Proxy Statement, which will be filed within 120 days after the end of 2009. Information regarding our executive officers may be found in Part 1 of this annual report under the caption "Executive Officers of the Registrant." Except as otherwise specifically incorporated by reference, our Proxy Statement is not deemed to be filed as part of this annual report. Item 11. Executive Compensation The information required by Item 11 is incorporated by reference to the relevant information under the caption "Executive Compensation" in our 2010 Proxy Statement, which will be filed within 120 days after the end of 2009. Item 12. Security Ownership of Certain Beneficial Owners and Management and Related Stockholder Matters Information concerning our equity compensation plans as of December 31, 2009, is as follows: Equity compensation plans approved by security holders Equity compensation plans not approved by security holders Total The remaining information required by Item 12 is incorporated by reference to the relevant information under the caption "Stock Ownership of Directors, Management and Others" in our 2010 Proxy Statement, which will be filed within 120 days after the end of 2009. Item 13. Certain Relationships, Related Transactions and Director Independence The information required by Item 13 is incorporated by reference to the relevant information under the captions "Corporate Governance" and "Other Information—Related Party Transactions" in our 2010 Proxy Statement, which will be filed within 120 days after the end of 2009. Item 14. Principal Accountant Fees and Services The information required by Item 14 is incorporated by reference to the relevant information under the caption "Selection of Independent Public Accountants" in our 2010 Proxy Statement, which will be filed within 120 days after the end of 2009. Item 15. Exhibits and Financial Statement Schedules #—A management contract or compensatory plan or arrangement. Pursuant to the requirements of Section 13 or 15(d) of the Securities Exchange Act of 1934, the registrant has duly caused this report to be signed on its behalf by the undersigned, thereunto duly authorized. Pursuant to the requirements of the Securities Exchange Act of 1934, this report has been signed below by or on behalf of the following persons on behalf of the registrant and in the capacities Chairman of the Board of Directors and Chief Executive Officer (Principal Executive Officer) * CONSOLIDATED SUBSIDIARIES
CONSOLIDATED STATEMENTS OF EARNINGSINCOME
(except per share amounts) Years ended December 31, In millions, except per share amounts 2009 2008 2007 $ 10,800 $ 14,342 $ 13,048 8,631 11,402 10,492 2,169 2,940 2,556 1,239 1,450 1,296 362 422 329 214 253 205 99 37 — (1 ) (12 ) 22 682 1,272 1,158
8
18
36 35 42 58 (15 ) (70 ) 33 640 1,178 1,169
156
360
381 484 818 788
56
63
49 $ 428 $ 755 $ 739 $ 2.17 $ 3.87 $ 3.72 $ 2.16 $ 3.84 $ 3.70 the consolidated financial statements.our Consolidated Financial Statements.CONSOLIDATED SUBSIDIARIES
CONSOLIDATED BALANCE SHEETS
(except par value) December 31, In millions 2009 2008 $ 930 $ 426 190 77 1,730 1,551 274 231 1,341 1,783 295 347 243 298 5,003 4,713 1,886 1,841 574 588 364 362 228 223 436 491 325 301 $ 8,816 $ 8,519 $ 37 $ 39 957 1,009 426 427 366 364 128 122 94 179 424 499 2,432 2,639 637 629 514 574 453 452 760 745 4,796 5,039 — — 1,861 1,793 3,575 3,288 (731 ) (715 ) (36 ) (61 ) (1 ) (5 ) (788 ) (798 ) (107 ) (268 ) (895 ) (1,066 ) 3,773 3,234 247 246 4,020 3,480 $ 8,816 $ 8,519 the consolidated financial statements.our Consolidated Financial Statements.CONSOLIDATED SUBSIDIARIES
CONSOLIDATED STATEMENTS OF CASH FLOWS Years ended December 31, In millions 2009 2008 2007 $ 484 $ 818 $ 788 16 34 — 326 314 290 — 45 — 5 (1 ) 60 23 (45 ) (75 ) (36 ) (31 ) (152 ) (24 ) (35 ) (28 ) 20 28 28 1 (13 ) (11 ) 41 (10 ) (24 ) 127 (267 ) (139 ) 155 109 95 (1 ) 41 (22 ) 1,137 987 810 (310 ) (543 ) (353 ) (35 ) (82 ) (67 ) 10 29 44 (3 ) (89 ) (66 ) (2 ) (142 ) (20 ) — 64 35 (431 ) (390 ) (405 ) 335 409 395 (18 ) (53 ) (14 ) (62 ) (62 ) (57 ) 7 11 (7 ) (509 ) (848 ) (515 ) 76 76 15 (97 ) (152 ) (144 ) (2 ) 33 (12 ) (34 ) (24 ) (18 ) (141 ) (122 ) (89 ) 72 63 13 (20 ) (128 ) (335 ) (1 ) 13 11 6 4 (17 ) (141 ) (237 ) (576 ) 17 (53 ) 18 504 (151 ) (263 ) 426 577 840 $ 930 $ 426 $ 577 the consolidated financial statements.our Consolidated Financial Statements.75 CONSOLIDATED SUBSIDIARIES
CONSOLIDATED STATEMENTS OF SHAREHOLDERSCHANGES IN EQUITYIn millions Common
Stock Additional
paid-in
Capital Retained
Earnings Accumulated
Other
Comprehensive
Loss Treasury
Stock Common
Stock
Held in
Trust Unearned
Compensation Total
Cummins Inc.
Shareholders'
Equity Noncontrolling
Interests Total
Equity $ 137 $ 1,500 $ 2,009 $ (525 ) $ (212 ) $ (92 ) $ (14 ) $ 2,803 $ 253 $ 3,056 739 739 49 788 1 1 3 4 (5 ) (5 ) — (5 ) 110 110 15 125 133 133 — 133 978 67 1,045 1 8 6 15 — 15 413 (413 ) — — — 52 (52 ) 13 13 — 13 (335 ) (335 ) — (335 ) — (11 ) (11 ) (89 ) (89 ) — (89 ) — (18 ) (18 ) 1 1 — 1 20 1 3 24 1 25 $ 551 $ 1,168 $ 2,660 $ (286 ) $ (593 ) $ (79 ) $ (11 ) $ 3,410 $ 292 $ 3,702 755 755 63 818 (1 ) (1 ) (2 ) (3 ) (70 ) (70 ) — (70 ) (289 ) (289 ) (34 ) (323 ) (418 ) (418 ) — (418 ) (23 ) 27 4 (5 ) (2 ) (7 ) — (7 ) 3 4 7 9 16 46 18 64 — 64 (128 ) (128 ) — (128 ) — (54 ) (54 ) (122 ) (122 ) — (122 ) — (24 ) (24 ) (1 ) 6 5 — 5 22 6 28 (4 ) 24 $ 554 $ 1,239 $ 3,288 $ (1,066 ) $ (715 ) $ (61 ) $ (5 ) $ 3,234 $ 246 $ 3,480
CONSOLIDATED STATEMENTS OF CHANGES IN EQUITY (Continued)In millions Common
Stock Additional
paid-in
Capital Retained
Earnings Accumulated
Other
Comprehensive
Loss Treasury
Stock Common
Stock
Held in
Trust Unearned
Compensation Total
Cummins Inc.
Shareholders'
Equity Noncontrolling
Interests Total
Equity $ 554 $ 1,239 $ 3,288 $ (1,066 ) $ (715 ) $ (61 ) $ (5 ) $ 3,234 $ 246 $ 3,480 428 428 56 484 75 75 — 75 86 86 14 100 10 10 — 10 599 70 669 1 6 7 — 7 61 25 86 — 86 (20 ) (20 ) — (20 ) (141 ) (141 ) — (141 ) — (34 ) (34 ) (2 ) 4 2 — 2 — (35 ) (35 ) 2 4 6 — 6 $ 555 $ 1,306 $ 3,575 $ (895) (1) $ (731 ) $ (36 ) $ (1 ) $ 3,773 $ 247 $ 4,020 the consolidated financial statements.our Consolidated Financial StatementsCONSOLIDATED SUBSIDIARIES
NOTES TO CONSOLIDATED FINANCIAL STATEMENTS(“Cummins,” “the(Cummins, the Company,” “the registrant,” “we,” “our,” we, our, or “us”)us) is a leading global power leaderprovider that designs, manufactures, distributes and services diesel and natural gas engines, electric power generation systems and engine-related component products, including filtration and emissions solutions, fuel systems, controls and air handling systems. We were founded in 1919 as one of the first manufacturers of diesel engines and are headquartered in Columbus, Indiana. We sell our products to Original Equipment Manufacturersoriginal equipment manufacturers (OEMs), distributors and other customers worldwide. We serve our customers through a network of more than 550500 company-owned and independent distributor locations and approximately 5,0005,200 dealer locations in more than 160190 countries and territories.consolidation. consolidation. Where our ownership interest is less than 100 percent, the minoritynoncontrolling ownership interests are reported in ourConsolidated Balance Sheets.Sheets. The minoritynoncontrolling ownership interest in our earnings,income, net of tax, is classified as “Minority interests"net income attributable to noncontrolling interests" in earnings of consolidated subsidiaries” in ourConsolidated Statements of Earnings.Income.20052008 and 20042007 have been reclassified to conform to the 2006current classifications. All share amounts and per share amounts have been adjusted for the impact of a two-for-one stock split on April 9, 2007 and an additional two-for-one stock split on January 2, 2008.
Investments in Equity Investeesearningsincome or losses after the date of acquisition. Investment amounts in excess of our share of an investee’sinvestee's assets are amortized over the life of the related asset creating the excess. If the excess is goodwill, then it is not amortized. Equity in earningsincome or losses of each investee is recorded according to our level of ownership; if losses accumulate, we record our share of losses until our investment has been fully depleted. If our investment has been fully depleted, we recognize additional losses only when we are the primary funding source. We eliminate (to the extent of our ownership percentage) in ourConsolidated Financial Statements the profit in inventory held by our equity method investees that has not yet been sold to a third-party. Our investments are classified as “Investments in"Investments and advances related to equity investees”method investees" in ourConsolidated Balance Sheets. Our share of the results from joint ventures, affiliated companies and alliances is reported in ourConsolidated Statements of EarningsIncome as “Investee equity,"Equity, royalty and other income.”interest income from investees," and is reported net of all applicable income taxes.
CUMMINS INC. AND SUBSIDIARIES
Use of Estimates in the Preparation of the Financial StatementsCUMMINS INC. AND CONSOLIDATED SUBSIDIARIESNOTES TO CONSOLIDATED FINANCIAL STATEMENTS (Continued)when when: generally when the products are shipped. To the extent of our ownership percentage, margins on sales to distributors accounted for under the equity method are deferred until the distributor sells the product to unrelated parties.
CUMMINS INC. AND SUBSIDIARIES
Foreign Currency Transactions and Translationearningsincome only upon sale or liquidation of the underlying foreign investment.earnings.income. For foreign entities where the U.S. dollar is the functional currency, including those operating in highly inflationary economies when applicable, we remeasure inventory, property, plant and equipment balances and the related earningsincome statement using historical exchange rates. We include in income the resulting gains and losses, including the effect of derivatives net of tax, in the ourConsolidated Statements of EarningsIncome, which combined with transaction gains and losses amounted to a net gainloss of $11$20 million in 2006,2009, a net loss of $6$46 million in 20052008 and a net gain of $1$28 million in 2004.2007.forwardswap contracts and an interest rate swap. These contracts are used strictly for hedging and not for speculative purposes.CUMMINS INC. AND CONSOLIDATED SUBSIDIARIESNOTES TO CONSOLIDATED FINANCIAL STATEMENTS (Continued)As a result of Due to our international business presence, we are exposed to foreign currency exchange risk. We transact in foreign currencies and have significant assets and liabilities denominated in foreign currencies. As a result,Consequently, our earnings experienceincome experiences some volatility related to movements in foreign currency exchange rates. In order to benefit from global diversification and after considering naturally offsetting currency positions, we enter into foreign currency forward contracts to minimize our existing exposures (recognized assets and liabilities) and hedge forecasted transactions.
CUMMINS INC. AND SUBSIDIARIESforwardswap contracts with designated banks to fix the cost of certain raw material purchases with the objective of minimizing changes in inventory cost due to market price fluctuations.1820 provides further information on our hedging strategy and accounting for derivative financial instruments.certainuncertain tax positions we have taken. During interim reporting periods our income tax provision is based upon the estimated annual effective tax rate of those taxable jurisdictions where we conduct business.StatementTable of Cash Flows—Supplemental DisclosuresContentsDuring 2006, 2005 and 2004 cash payments for income taxes, net of refunds, were $165 million, $95 million and $87 million, respectively. During 2006, 2005 and 2004 cash payments for interest, net of capitalized interest, were $100 million, $114 million and $113 million, respectively.During 2006, we incurred capital lease obligations of $58 million primarily due to the lease extension on the corporate headquarters building and computer equipment leases. During 2005, we incurred capital lease obligations of $32 million primarily due to equipment leases for a production line.CONSOLIDATED SUBSIDIARIES
Statements of Cash Flows—Supplemental Disclosures Years ended December 31, In millions 2009 2008 2007 $ (181 ) $ 88 $ (203 ) 482 (251 ) (255 ) 33 (54 ) (34 ) (75 ) (174 ) 136 (132 ) 124 217 $ 127 $ (267 ) $ (139 )
$
128
$
349
$
294 $ 31 $ 45 $ 57 provisions of Statement of Financial Accounting Standards (SFAS) No. 115, “Accountingaccounting for Certain Investmentscertain investments in Debtdebt and Equity Securities.”equity securities. We determine the appropriate classification of all marketable securities as “held-to-maturity, “available-for-sale”"held-to-maturity, "available-for-sale" or “trading”"trading" at the time of purchase, and re-evaluate such classifications at each balance sheet date. At December 31, 20062009 and 2005,2008, all of our investments were classified as available-for-sale.“other-than-temporary”"other-than-temporary" are recognized currently in earnings.income. The cost of securities sold is based on the specific identification method. The fair value of most investment securities is determined by currently available market prices. Where quoted market prices are not available, we use the market price of similar types of securities that are traded in the market to estimate fair value. See Note 45 for a detailed description of our investments in marketable securities.
Accounts Receivable and Allowance for Doubtful Accounts5,21, which allows us to sell, without recourse, an interest in a pool of our trade receivables to a financial institution as necessary. The allowance for doubtful accounts is our best estimate of the amount of probable credit losses in our existing accounts receivable. We determine the allowance based on our historical collection experience and by performing an analysis of our accounts receivable in light of the current economic environment. We review our allowance for doubtful accounts on a regular basis. In addition, when necessary, we provide an allowance for the full amount of specific accounts deemed to be uncollectible. Account balances are charged off against the allowance in the period in
CUMMINS INC. AND SUBSIDIARIES December 31, In millions 2009 2008 2007 $ 10 $ 12 $ 11 11 9 7 (9 ) (9 ) (7 ) 1 (2 ) 1 $ 13 $ 10 $ 12 20062009 and 2005,2008, approximately 2016 percent and 2218 percent, respectively, of our consolidated inventories (primarily heavy-duty and high-horsepower engines and parts) were valued using the last-in, first-out (LIFO) cost method. The cost of other inventories is generally valued using the first-in, first-out (FIFO) cost method. Our inventories at interim and year-end reporting dates include estimates for adjustments related toCUMMINS INC. AND CONSOLIDATED SUBSIDIARIESNOTES TO CONSOLIDATED FINANCIAL STATEMENTS (Continued)$266$269 million, $260$262 million and $235$256 million for the years ended December 31, 2006, 20052009, 2008 and 2004,2007, respectively.
CUMMINS INC. AND SUBSIDIARIESana future impairment charge.Goodwill represents Under GAAP accounting for goodwill and other intangible assets, the excess of purchase price paid over the faircarrying value of net assets acquired in a business combination accounted for as a purchase. As required by SFAS No. 142, “Goodwill and Other Intangibles” (SFAS 142), we no longer amortize goodwill but rather evaluate itmust be tested for impairment on an annual basis and between annual tests in certain circumstances where impairment may be indicated. The fair value of each reporting unit was estimated by discounting the future cash flows less requirements for working capital and fixed asset additions. In accordance with GAAP, our reporting units are generally defined as one level below an operating segment. However, there were two situations where we have aggregated two or more often if events or circumstances change that could cause goodwill to become impaired. We have allocated our goodwill tocomponents which share similar economic characteristics and thus are aggregated into a single reporting unit for testing purposes. These two situations are described further below. This analysis has resulted in the following reporting units for purposesour goodwill testing:performingour total goodwill balance at December 31, 2009.tests. See Note 8 forassessment required by GAAP and determined that our goodwill was not impaired. At December 31, 2009, our recorded goodwill was $364 million, approximately 90 percent of which resided in the emissions solutions plus filtration reporting unit. For this reporting unit, a further discussion about10 percent reduction in our estimated future cash flows would not have impacted our assessment. Changes in our projections or estimates, a deterioration of our operating results and the related cash flow effect or a significant increase in the discount rate could decrease the estimated fair value of our reporting units and result in a future impairment of goodwill.
CUMMINS INC. AND SUBSIDIARIESisare developed or obtained for internal use. Software costs are amortized on a straight-line basis over their estimated useful lives generally ranging from three to five years. Software assets are reviewed for impairment when events or circumstances indicate that the carrying value may not be recoverable over the remaining lives of the assets. Upgrades and enhancements are capitalized if they result in added functionality which enablessignificant modifications that enable the software to perform tasks it was previously incapable of performing. Software maintenance, training, data conversion and business process reengineering costs are expensed in the period in which they are incurred.CUMMINS INC. AND CONSOLIDATED SUBSIDIARIESNOTES TO CONSOLIDATED FINANCIAL STATEMENTS (Continued)earningsincome at the time products are shipped to customers. We use historical experience of warranty programs to estimate the remaining liability for our various warranty programs. As a result of the uncertainty surrounding the nature and frequency of product recall programs, the liability for such programs is recorded when we commit to a recall action, which generally occurs when it is announced. We review and assess the liability for these programs on a quarterly basis. We also assess our ability to recover certain costs from our suppliers and record a receivable from the supplier when we believe a recovery is probable. At December 31, 2006,2009, we had $23$10 million of receivables related to estimated supplier recoveries of which $16$5 million was included in “Receivables, net”"Trade and $7other receivables, net" and $5 million was included in “Other assets”"Other assets" on ourConsolidated Balance Sheets. At December 31, 2005,2008, we had $35$16 million of receivables related to estimated supplier recoveries of which $25$8 million was included in “Receivables, net”"Trade and $10other receivables, net" and $8 million was included in “Other assets”"Other assets" on ourConsolidated Balance Sheets.on a straight-line basisin proportion to the costs expected to be incurred in performing services over the contract period. We compare the remaining deferred revenue balance quarterly to the estimated amount of future claims under extended warranty programs and provide an additional accrual when the deferred revenue balance is less than expected future costs.Our shipping and handling costs are expensed as incurred. The majority of these costs are associated with operations of our inventory distribution centers and warehouse facilities and are classified as selling and administrative expenses in our Consolidated Statements of Earnings. For purposes of this disclosure, during 2006 we expanded our definition of what is disclosed as shipping and handling costs to include additional indirect shipping and handling costs and related support functions. For comparability purposes, we have adjusted the 2005 and 2004 amounts to include shipping and handling costs under this expanded definition. For the years ended December 31, 2006, 2005 and 2004, these costs were approximately $130 million, $142 million and $120 million, respectively.engineeringdevelopment program is focused on product improvements, innovations and cost reductions for our customers. We expense research and development expenditures, net of contract reimbursements, when incurred. The major components of research and development expenses are salaries, fringes and consulting fees. Research and development expenses, net of contract reimbursements, were $312$362 million in 2006, $2712009, $422 million in 20052008 and $229$318 million in 2004.2007. Contract reimbursements were $40$92 million in 2006, $552009, $61 million in 20052008 and $35$52 million in 2004.RECENTLY ADOPTED ACCOUNTING PRONOUNCEMENTSIn December 2004, the Financial Accounting Standards Board (FASB) issued SFAS No. 123 (Revised 2004), “Share-Based Payment” (SFAS 123R). This standard requires financial statement recognition of compensation cost related to share-based payment transactions. Share-based payment transactions within the scope of SFAS 123R include stock options, restricted stock plans, performance-based awards, stock appreciation rights, and employee share purchase plans. We implemented the revised standard in the first quarter of 2006. Prior to January 1, 2006, we accounted for stock-based employee awards issued afterCUMMINS INC. AND CONSOLIDATED SUBSIDIARIESNOTES TO CONSOLIDATED FINANCIAL STATEMENTS (Continued)2007.December 31, 2002, using the fair value method preferred by SFAS No. 123, “Accounting for Stock-Based Compensation.” SFAS 123R requires us to estimate forfeitures in calculating the expense relating to stock-based compensation as opposed to recognizing these forfeitures and the corresponding reduction in expense as they occur. SFAS 123R also requires prospective presentation of the “Tax benefit on share-based awards” as a financing activity rather than an operating activity in our Consolidated Statements of Cash Flows. See Note 19 for the impact that the adoption of this standard had on our Consolidated Financial Statements.In May 2005, the FASB issued SFAS No. 154, “Accounting Changes and Error Corrections—a replacement of Accounting Principles Board (APB) Opinion No. 20 and FASB Statement No. 3” (SFAS 154). This standard changes the requirements for the accounting for and reporting of a change in accounting principle and applies to all voluntary changes in accounting principle. It also applies to changes required by an accounting pronouncement in the unusual instance that the pronouncement does not include specific transition provisions. When a pronouncement includes specific transition provisions, those provisions should be followed. APB 20 required that most voluntary changes in accounting principle be recognized by including in net income of the period of the change the cumulative effect of changing to the new accounting principle. This standard requires retrospective application to prior period financial statements of changes in accounting principle, unless it is impracticable to determine either the period-specific effects or the cumulative effect of the change. The provisions of SFAS 154 are effective for fiscal years beginning after December 15, 2005. The adoption of this standard did not have a material impact on our Consolidated Financial Statements.In September 2006, the SEC staff issued Staff Accounting Bulletin (SAB) No. 108, “Considering the Effects of Prior Year Misstatements when Quantifying Misstatements in Current Year Financial Statements (SAB 108). SAB 108 was issued in order to eliminate the diversity of practice surrounding how public companies quantify financial statement misstatements. Traditionally, there have been two widely-recognized methods for quantifying the effects of financial statement misstatements: the “roll-over” method and the “iron curtain” method. The roll-over method focuses primarily on the impact of a misstatement on the income statement, including the reversing effect of prior year misstatements, but its use can lead to the accumulation of misstatements in the balance sheet. The iron curtain method, on the other hand, focuses primarily on the effect of correcting the period-end balance sheet with less emphasis on the reversing effects of prior years on the income statement. We currently use the iron curtain method for quantifying identified financial statement misstatements. In SAB 108, the SEC staff established an approach that requires quantification of financial statement misstatements based on the effects of the misstatements on each of the company’s financial statements and related financial statement disclosures. This model is commonly referred to as a “dual approach” because it requires quantification of errors under both the iron curtain and roll-over methods. We were required to apply the provisions of SAB 108 in connection with the preparation of our Consolidated Financial Statementsfor the year ended December 31, 2006. The application of SAB 108 did not have a material effect on our Consolidated Financial Statements.In September 2006, the FASB issued SFAS No. 158, “Employers’ Accounting for Defined Benefit Plans and Other Postretirement Plans—an amendment of FASB Statements No. 87, 88, 106, and 132(R)” (SFAS 158), which requires employers to fully recognize the obligations associated with single-employer defined benefit pension, retiree healthcare and other postretirement plans in their financial statements. In addition, SFAS 158 requires companies to measure plan assets and liabilities as of the end of a fiscal year rather than a date within 90 days of the end of the fiscal year. We adopted SFAS 158 effective December 31, 2006, except for the change in measurement date provisions which are not effective untilCUMMINS INC. AND CONSOLIDATED SUBSIDIARIESNOTES TO CONSOLIDATED FINANCIAL STATEMENTS (Continued)2008. Total assets, total liabilities, minority interests and total shareholders’ equity were impacted in the following manner. Total assets increased by approximately $11 million, total liabilities increased by approximately $106 million, minority interests decreased by approximately $1 million and shareholders’ equity decreased by approximately $94 million. The adoption of SFAS 158 did not impact compliance with any of our financial covenants. See Note 12 for further information regarding the impact that the adoption of this standard had on our Consolidated Financial Statements.ACCOUNTING PRONOUNCEMENTS ISSUED BUT NOT YET EFFECTIVEIn February 2006, the FASB issued SFAS No. 155, “Accounting for Certain Hybrid Financial Instruments—an amendment of FASB Statements No. 133 and 140” (SFAS 155). SFAS 155 changes certain accounting requirements for certain hybrid financial instruments by permitting fair value remeasurement for any hybrid financial instrument that contains an embedded derivative that otherwise would require bifurcation. The new standard also changed certain accounting requirements for interest-only and principal-only strips and other aspects of accounting for securitized financial assets. We will adopt SFAS 155 effective January 1, 2007. We do not expect the adoption of SFAS 155 to have a material impact on our Consolidated Financial Statements.In March 2006, the FASB issued SFAS No. 156, “Accounting for Servicing of Financial Assets—an amendment of FASB Statement No. 140” (SFAS 156), that provides guidance on accounting for separately recognized servicing assets and servicing liabilities. In accordance with the provisions of SFAS 156, separately recognized servicing assets and servicing liabilities must be initially measured at fair value, if practicable. Subsequent to initial recognition, the company may use either the amortization method or the fair value measurement method to account for servicing assets and servicing liabilities within the scope of this Statement. We will adopt SFAS 156 effective January 1, 2007. We do not expect the adoption of SFAS 156 to have a material effect on our Consolidated Financial Statements.In July 2006, the FASB issued FASB Interpretation (FIN) No. 48, “Accounting for Uncertainty in Income Taxes—an interpretation of FASB Statement No. 109” (FIN 48), which prescribes a recognition threshold and measurement process for recording in the financial statements, uncertain tax positions taken or expected to be taken in a tax return. In addition, FIN 48 provides guidance on the derecognition, classification, accounting in interim periods and disclosure requirements for uncertain tax positions. We will adopt FIN 48 effective January 1, 2007. We do not expect the adoption of FIN 48 to have a material effect on our Consolidated Financial Statements.In September 2006, the FASB issued SFAS No. 157, “Fair Value Measurements” (SFAS 157), which defines fair value, establishes a framework for measuring fair value and expands disclosures about fair value measurements. We will adopt SFAS 157 effective January 1, 2008. We are currently evaluating the impact, if any, that SFAS 157 will have on our Consolidated Financial Statements.NOTE 2. VARIABLE INTEREST ENTITIESWe consolidate certain VIEs if we are deemed to be the primary beneficiary, defined in FIN 46R as the entity that absorbs a majority of the VIEs’ expected losses, receives a majority of the VIEs’ expected residual returns, or both. We adopted FIN 46R as of December 31, 2003, for entities previously considered to be special purpose entities (SPEs) under GAAP and for new entities created on or after February 1, 2003. In addition, we have variable interests in other businesses including businesses accounted for under the equity method of accounting and certain North American distributors that are deemed VIEs and areCUMMINS INC. AND CONSOLIDATED SUBSIDIARIESNOTES TO CONSOLIDATED FINANCIAL STATEMENTS (Continued)subject to the provisions of FIN 46R. We adopted FIN 46R for these entities as of our first quarter ended March 28, 2004.During 2001, we entered into a sale-leaseback transaction with a financial institution with regard to certain heavy-duty engine manufacturing equipment. The accounting for the original sale-leaseback transaction is discussed in Note 20. The financial institution created a grantor trust to act as the lessor in the arrangement. The financial institution owns 100 percent of the equity in the trust. The grantor trust has no assets other than the equipment and its rights to the lease agreement with us. On the initial sale, we received $125 million from the financial institution which was financed with $99 million of non-recourse debt and $26 million of equity. Our obligations to the grantor trust consist of the payments due under the lease and a $9 million guarantee of the residual value of the equipment. In addition, we have a fixed price purchase option that is exercisable on January 14, 2009, for approximately $35 million. We have determined that the grantor trust is a VIE under FIN 46R and due primarily to the existence of the residual value guarantee, we determined that we are the primary beneficiary of the VIE. As a result, we began consolidating the grantor trust as of December 31, 2003, even though we own none of its equity. As of December 31, 2006, the non-recourse debt had an outstanding balance of $60 million, the assets serving as collateral on this debt had a carrying amount of $49 million and the related minority interest in the VIE was $32 million.In June 2001, Cummins Capital Trust I (the “Trust”), a Delaware business trust and our wholly-owned subsidiary, issued 6 million shares of 7 percent convertible quarterly income preferred securities (“preferred securities”). The total proceeds from the issuance of the preferred securities by the Trust were invested in $309 million aggregate principal amount of 7 percent convertible subordinated debentures (the “debentures”) that we issued. The debentures were the sole assets of the Trust. The Trust qualified as a VIE under FIN 46R. We were not the primary beneficiary of the Trust and thus reported the debentures rather than the preferred securities as an obligation. On May 8, 2006, the Board of Directors approved our plan to redeem all of the 7% convertible quarterly income preferred securities. As of December 31, 2005, the debentures were included in “Long-term Debt” in our Consolidated Balance Sheet. See Note 11 for information relating to this redemption.85CUMMINS INC. AND CONSOLIDATED SUBSIDIARIESNOTES TO CONSOLIDATED FINANCIAL STATEMENTS (Continued)Consolidated Diesel Corporation (CDC) and Cummins Komatsu Engine Corporation (CKEC), are engine manufacturing entities jointly owned and operated by us and our equity partners. We were deemed the primary beneficiary of these VIEs due to the pricing arrangements of purchases and the substantial volume of purchases we made from these VIEs. Our arrangements with CDC are more fully described in Note 3. As of December 31, 2006, CDC has approximately $45 million of debt which is collateralized by substantially all of its inventory and fixed assets with a current book value of $46 million and $153 million, respectively. CKEC has no unsecured debt as of December 31, 2006. Creditors of these entities have no recourse to the general credit of Cummins.AVK/SEG is a German holding company that directly owned shares of AVK and SEG and was jointly owned by Cummins (50 percent) and other equity partners. AVK manufactures alternators and SEG manufactures power electronic components. We were deemed the primary beneficiary of this VIE due to the existence of a call/guarantee arrangement on an additional 13 percent ownership interest in the entity and our guarantee on portions of the entity’s subordinated debt. During the second quarter of 2004, AVK/SEG was liquidated and its shares in AVK and SEG were distributed directly to Cummins and the other equity partners. As a result of the liquidation, Cummins owned 100 percent of AVK, 25 percent of SEG and our call/guarantee arrangement to obtain an additional ownership interest in SEG increased from 13 percent to 19 percent. This transaction was accounted for as an acquisition of a minority interest in AVK (via a nonmonetary exchange of shares) and was recorded at fair value, resulting in a nominal gain (less than $1 million after-tax). During 2005, Cummins exercised its call option to purchase an additional 19 percent ownership in SEG. In addition, SEG failed to timely repay certain intercompany loans due to Cummins which increased our ownership percentage by an additional 7 percent. As a result of these transactions, Cummins owned 51 percent of SEG. During the fourth quarter of 2006, we sold our interest in SEG, therefore they are no longer consolidated in our Consolidated Financial Statements. The sale resulted in a pre-tax gain of approximately $9 million. Total assets of SEG were approximately $42 million at the date of the transaction and $39 million at December 31, 2005, which is less than 1 percent of our total assets at those dates. Total sales of SEG were approximately $51 million and $72 million, for the ten months ended October 31, 2006 and for the year ended December 31, 2005, respectively, which is less than 1 percent of our total net sales for these periods.In April 2004, Cummins Eastern Canada (CEC), a distributor previously accounted for under the equity method, acquired another Cummins distributor in Canada. The acquisition price of the distributor was $19 million ($18 million, net of cash acquired), which was funded by the addition of $15 million of debt and an additional $4 million equity investment by Cummins. The additional equity contributed by Cummins increased our ownership percentage in CEC to 67 percent (50 percent prior to the acquisition.) At the same time, we reached an agreement to sell a 16 percent ownership interest in CEC to another equity holder. This sale was completed during the third quarter of 2004. As a result of this sale, our ownership percentage in CEC was reduced from 67 percent to 51 percent. We agreed to accept a note from the equity holder for its purchase of the 16 percent ownership interest. The note was to be repaid from distributions of future CEC earnings. Immediately upon repayment of the loan, the equity holder has an option agreement to purchase an additional 1 percent ownership share from Cummins. We also agreed with the other shareholders to maintain our voting interest at 50 percent. We do not have management or voting control over CEC. In accordance with FIN 46R, CEC is consolidated in our Consolidated Financial Statements due to our current 51 percent economic interest and deemed interest of 16 percent resulting from our financing of the other equity holder’s purchase. As of December 31, 2006, CEC has approximately $23 million of debt which is collateralized by various current and fixed assets with a currentCUMMINS INC. AND CONSOLIDATED SUBSIDIARIESNOTES TO CONSOLIDATED FINANCIAL STATEMENTS (Continued)book value of $62 million. Creditors of CEC have no recourse to the general credit of Cummins. On January 3, 2007, the equity holder repaid the balance due on the outstanding note of $3.3 million and exercised the purchase option on the additional 1 percent share for $0.3 million. The repayment of the loan and the exercise of the purchase option triggered a reassessment under FIN 46R, resulting in the deconsolidation of CEC. The results of CEC will no longer be consolidated in our Consolidated Financial Statements beginning with the results of the first quarter of 2007.Results of these entities for the year ended December 31, 2006, are consolidated in our Consolidated Statements of Earnings and a significant amount of their sales are eliminated in consolidation. The table below shows the increase in our assets and liabilities from consolidating these entities, after eliminating intercompany items, as of December 31, 2006, as follows:We also have variable interests in three North American distributors that were deemed to be VIEs in accordance with FIN 46R, but we were not deemed to be the primary beneficiarysince we do not absorb a majority of the entity’s expected losses. Our ownership percentage in these entities ranges from zero percent to 50 percent. For all three of the entities, our equity ownership represents our only variable interest in the entity and thus we would not be deemed the primary beneficiary.The principal business of the distributors is to sell Cummins engines and related service parts as well as provide repair and maintenance services on engines, including warranty repairs. Our maximum potential loss related to these three distributors as of December 31, 2006, consisted of our ownership interest totaling $14 million. Our involvement with these distributors as equity holders began in 2005, 2003 and 2002. Selected financial information for these distributors as of and for the year ended December 31, 2006, is as follows:CUMMINS INC. AND CONSOLIDATED SUBSIDIARIESNOTES TO CONSOLIDATED FINANCIAL STATEMENTS (Continued)NOTE 3. INVESTMENTS IN EQUITY INVESTEES AND RELATED PARTY TRANSACTIONSInvestments in and advances to equity investees and our ownership percentage is as follows:We have approximately $146 million in our investment account at December 31, 2006, that represents cumulative undistributed earnings in our equity investees. Summary financial information for our equity investees and alliances is as follows: value.We purchase significant quantities of midrange diesel and natural gas engines, components and service parts from CDC, a general partnership and a VIE (see Note 2) that we began to consolidate on
CUMMINS INC. AND CONSOLIDATED SUBSIDIARIESMarch 28, 2004.The partnership was formed in 1980 with J. I. Case (Case) to jointly fund engine development and manufacturing capacity. Cummins and Case (now CNH Global N.V.)NOTE 1. SUMMARY OF SIGNIFICANT ACCOUNTING POLICIES (Continued)general partners and each partner shares 50 percent ownership in CDC. Underpresented on the termsface of the agreement, CDC is obligated to make its entire production of diesel engines and related products available solely to the partners. Each partner is entitled to purchase up to one-half of CDC’s actual production; a partner may purchase in excess of one-half of actual production to the extent productive capacity is available beyond the other partner’s purchase requirement. The partners are each obligated, unconditionally and severally, to purchase annually at least one engine or engine kit produced by CDC, provided a minimum of one engine or kit is produced. The transfer price of CDC’s engines to the partners must be sufficient to cover its manufacturing cost in such annual accounting period, including interest and financing expenses, and excluding depreciation expense (other than Scheduled Depreciation Expense as defined in the agreement). In addition, each partner is obligated to contribute one-half of the capital investment required to maintain plant capacity and each partner has the right to invest unilaterally in plant capacity, which additional capacity can be utilized by the other partner for a fee. To date, neither partner has made a unilateral investment in plant capacity at CDC.ourWe are not a guarantor of any of CDC’s obligations or commitments; however, we are required to provide up to 50 percent of CDC’s base working capital as defined by the agreement. The amount of base working capital is calculated each quarter and if supplemental funding greater than the base working capital amount is required, the amount is funded through third-party financing arranged by CDC, or we may elect to fund the requirement although we are under no obligation to do so. To date, when supplemental funding is required above the base working capital amount, we have elected to provide that funding to CDC. If the amount of supplemental funding required is less than the base working capital amount, it is funded equally by the partners. Excess cash generated by CDC is remitted to Cummins until CDC’s working capital amount is reduced to the base working capital amount. Any further cash remittances from CDC to the partners are shared equally by the partners.All marketing, selling, warranty and research and development expenses related to CDC products are the responsibility of the partners and CDC does not incur any of these expenses. Cummins also provides purchasing and administrative procurement services to CDC for an annual fee shared by the partners.All of our engine purchases from CDC are shipped directly from CDC to our customers. Prior to March 28, 2004, purchases were recorded as “Cost of sales” in our Consolidated Statements of Earnings Incomeas CDC was accounted for under the equity method of accounting. Subsequent to March 28, 2004, all engine purchases from CDC were eliminated in consolidation.. Our engine purchases from CDC are recorded at CDC’s transfer price which is based upon total production costs of products shipped and an allocation of all other costs incurred during the reporting period, resulting in break-even operating results for CDC.The following table summarizes our related party purchases were not material to our financial position or results of operations.
RECENTLY ADOPTED AND RECENTY ISSUED ACCOUNTING PRONOUNCEMENTS“Costthe consolidated balance sheet within equity, separate from the parent's equity; consolidated net income to be reported at amounts inclusive of sales”both the parent's and noncontrolling interest's shares and, separately, the amounts of consolidated net income attributable to the parent and noncontrolling interest all on the consolidated statements of income; and if a subsidiary is deconsolidated, any retained noncontrolling equity investment in our Consolidated Statementsthe former subsidiary be measured at fair value and a gain or loss be recognized in net income based on such fair value. We adopted the new standard effective January 1, 2009, and applied it retrospectively. As a result, we reclassified noncontrolling interests of Earnings:$246 million, $292 million and $253 million, respectively, from the mezzanine section to equity in the December 31, 2008, 2007 and 2006 balance sheets. Certain reclassifications have been made to prior period amounts to conform to the presentation of the current period under the new standard.
CUMMINS INC. AND CONSOLIDATED SUBSIDIARIESThe NOTE 1. SUMMARY OF SIGNIFICANT ACCOUNTING POLICIES (Continued)
Accounting Pronouncements Issued But Not Yet EffectiveCash Flows includefinancial assets, which is effective for interim and annual fiscal periods beginning after November 15, 2009. The new standard removes the investee equity earningsconcept of a qualifying special-purpose entity from GAAP. The new standard modifies the financial-components approach used in previous standards and limits the circumstances in which a financial asset, or portion of a financial asset, should be derecognized. The new standard also requires enhanced disclosure regarding transfers of financial interests and a transferor's continuing involvement with transferred assets. The new standard will require us to report any future activity under our sale of receivables program as reported abovesecured borrowings as well asof January 1, 2010. As of December 31, 2009, we had no amounts outstanding under this program.non-cash adjustments.amendments. The most significant adjustmentnew standard also requires enhanced disclosures regarding an entity's involvement in a VIE. While we are still finalizing our evaluation of the impact of this amendment on ourConsolidated Financial Statements, we believe the only impact will be the deconsolidation of Cummins Komatsu Engine Company (CKEC). This deconsolidation will not have a material impact on ourConsolidated Financial Statements. Financial information about CKEC is included in Note 23.statementFASB amended its rules regarding the accounting for multiple element revenue arrangements. The objective of cash flowsthe amendment is depreciation recorded by CDC, which prior to FIN 46R was allocatedallow vendors to account for revenue for different deliverables separately as opposed to part of a combined unit when those deliverables are provided at different times. Specifically, this amendment addresses how to separate deliverables and simplifies the process of allocating revenue to the joint venture partners based on the amount of their purchases.different deliverables when more than one deliverable exists. The new rules are effective for us beginning January 1, 2011. We classified depreciation and other non-cash expenses related to CDC as “Cost of sales” and “Other (income) expense,” respectively,are in the process of evaluating the impact that this amendment will have on ourConsolidated Financial Statements.Earnings. The adjustments relatingContents
CUMMINS INC. AND SUBSIDIARIESCDC were $3 million in 2004.equity investees and our ownership percentage is as follows: December 31, In millions Ownership % 2009 2008 30% - 50% $ 112 $ 113 50% 85 106 50% 52 56 50% 52 55 50% 50 57 20% - 50% 48 41 50% 40 35 50% 19 18 Various 116 107 $ 574 $ 588 For the years ended
December 31, In millions 2009 2008 2007 $ 100 $ 100 $ 83 12 7 4 3 5 2 $ 36 $ 30 $ 22 33 55 41 7 2 1 7 8 6 5 7 13 (10 ) 3 11 3 14 9 196 231 192 18 22 13 $ 214 $ 253 $ 205 Distributorsregion. Someregion with some of our distributors arebeing wholly-owned by Cummins, some partially-owned and the majority are independently owned. We consolidate all wholly-owned distributors and partially-owned distributors where we are the primary beneficiary and account for other partially-owned distributors using the equity method of accounting (see Note 1).accounting.
CUMMINS INC. AND SUBSIDIARIESholders’holders' interests if certain events occur (such as the death of the distributor principal or a change in control of Cummins Inc.). The purchase price of the equity interests is determined based on the fair value of the distributor’sdistributor's assets. Outside of North America, repurchase obligations and practices vary by region. All distributors that are partially-owned are considered to be related parties in ourConsolidated Financial Statements.Statements.
CUMMINS INC. AND SUBSIDIARIES
CUMMINS INC. AND SUBSIDIARIES
Equity Investee Financial Summary As of and for the years ended
December 31, In millions 2009 2008 2007 $ 5,554 $ 6,610 $ 5,716 1,365 1,509 1,320 427 498 451 $ 196 $ 231 $ 192 18 22 13 $ 214 $ 253 $ 205 $ 2,005 $ 2,189 1,123 903 (1,406 ) (1,440 ) (390 ) (358 ) $ 1,332 $ 1,294 $ 587 $ 599
CUMMINS INC. AND SUBSIDIARIESIn millions Year ended
December 31, 2009 $ 81 7 2 (5 ) 85 14 $ 99 In millions Severance
Costs Exit
Activities Other Total $ 81 $ 7 $ 2 $ 90 (70 ) (1 ) — (71 ) — (5 ) (2 ) (7 ) (2 ) — — (2 ) 1 — — 1 $ 10 $ 1 $ — $ 11 In millions Year ended
December 31, 2009 $ 47 12 35 5 $ 99
CUMMINS INC. AND SUBSIDIARIESIn millions Severance Costs $ 37 (3 ) 34 (31 ) (3 ) $ —
CUMMINS INC. AND SUBSIDIARIESIn millions Year ended
December 31, 2008 $ 17 3 15 2 $ 37 Years ended December 31, In millions 2009 2008 2007 $ (47 ) $ (25 ) $ 391 687 1,203 778 $ 640 $ 1,178 $ 1,169 Years ended December 31, In millions 2009 2008 2007 $ 4 $ 16 $ 137 147 345 184 151 361 321 (38 ) (26 ) 1 43 25 59 5 (1 ) 60 $ 156 $ 360 $ 381
CUMMINS INC. AND SUBSIDIARIES Years ended
December 31, 2009 2008 2007 35.0 % 35.0 % 35.0 % (0.3 ) — 1.4 (2.4 ) (0.8 ) (1.3 ) (5.5 ) (4.3 ) (2.4 ) — (0.1 ) — (2.4 ) 0.8 (0.1 ) 24.4 % 30.6 % 32.6 %
CUMMINS INC. AND SUBSIDIARIES December 31, In millions 2009 2008 $ 131 $ 27 20 13 429 474 309 341 40 68 115 163 1,044 1,086 (44 ) (25 ) 1,000 1,061 (146 ) (98 ) (100 ) (94 ) (25 ) (34 ) (271 ) (226 ) $ 729 $ 835
CUMMINS INC. AND SUBSIDIARIESIn millions $ 49 4 (4 ) $ 49 5 5 (2 ) $ 57 1 4 (3 ) (5 ) 2 $ 56
CUMMINS INC. AND SUBSIDIARIES
unrealized
gains/
(losses)
fair value
unrealized
gains
fair value December 31, 2009 2008 In millions Cost Gross unrealized
gains/(losses) Estimated
fair value Cost Gross unrealized
gains/(losses) Estimated
fair value $ 123 $ — $ 123 $ 63 $ — $ 63 34 — 34 — — — 21 — 21 — — — 4 (1 ) 3 5 — 5 2 — 2 6 — 6 — 7 7 — 3 3 $ 184 $ 6 $ 190 $ 74 $ 3 $ 77 available-for-salemarketable securities were $273$335 million, $126$409 million and $149$395 million in 2006, 20052009, 2008 and 2004,2007, respectively. Gross realized gains from the sale of available-for-sale securities were $2 million in the year ended 2009 and $1 million $2 millionfor each of the years ended 2008 and $6 million in 2006, 2005 and 2004, respectively.2007. Gross realized losses from the sale of available-for-sale securities were less than $1 million in 2006, 20052009, 2008 and 2004.CUMMINS INC. AND CONSOLIDATED SUBSIDIARIESNOTES TO CONSOLIDATED FINANCIAL STATEMENTS (Continued)2007.2006,2009, the fair value of available-for-sale investments in debt securities by contractual maturity is as follows:Maturity date Fair value In millions $ 34 2 2 1 $ 39 5. SALES6. FAIR VALUE OF RECEIVABLESFINANCIAL INSTRUMENTSJanuary 2004, we entered intoSeptember 2006, the FASB amended its existing fair value standards, which defines fair value, establishes a three-year facility agreement withmarket-based framework for measuring fair value and expands disclosures about fair value measurements. The amended standards are applicable whenever another accounting pronouncement requires or permits assets and liabilities to be measured at fair value. The amended standards do not expand or require any new fair value measures. The standards are effective for financial assets and financial liabilities for fiscal years beginning after November 15, 2007. The FASB issued a financial institution to sell a designated pool of trade receivables to Cummins Trade Receivables, LLC (CTR), a wholly-owned, consolidated special purpose subsidiary. In January 2007, this facility was extended for one year. As necessary, CTR may transfer a direct interest in its receivables, without recourse, to the financial institution. To maintain a balance in the designated pools of receivables sold, we sell new receivables to CTR as existing receivables are collected. Receivables sold to CTR in which an interest is not transferred to the financial institution are included in “Receivables, net” on our Consolidated Balance Sheets. The maximum interest in sold receivables that can be outstanding at any point in time is limited to the lesser of $200 million or the amount of eligible receivables held by CTR. There are no provisions in this agreement that require us to maintain a minimum investment credit rating; however, the termspartial deferral of the agreement containeffective date of the same financial covenantsamended standards that deferred the effective date for most non-financial assets and non-financial liabilities to fiscal years beginning after November 15, 2008. We adopted the amended standards prospectively for our fiscal year beginning January 1, 2008, except for non-financial assets and non-financial liabilities as those described under our revolving credit facility (see Note 11). There was no interest in receivables sold under this program to the financial institution in 2006 and 2005, and the interest in receivables sold in 2004 was not significant. Asdeferred until January 1, 2009. The amendedDecember 31, 2006 and 2005, there were no amounts outstanding under this program.Contents91CONSOLIDATED SUBSIDIARIESNo accounts receivable soldNOTE 6. FAIR VALUE OF FINANCIAL INSTRUMENTS (Continued)either subsidiary were written off during 2006, 2005sell an asset or 2004. The weighted-average interest rate on repayments during 2004 was 2.6 percent. The sold receivables servicing portfolio, which is includedpaid to transfer a liability in receivablesan orderly transaction between market participants at the measurement date (exit price). We utilize market data or assumptions that market participants would use in pricing the asset or liability, including assumptions about risk and the proceeds fromrisks inherent in the saleinputs to the valuation technique. These inputs can be readily observable, market corroborated, or generally unobservable. We primarily apply the market approach for recurring fair value measurements and utilize the best available information. Accordingly, we utilize valuation techniques that maximize the use of receivablesobservable inputs and other related cash flowsminimize the use of unobservable inputs. The company is able to classify fair value balances based on the observability of those inputs. The amended standards establish a fair value hierarchy that prioritizes the inputs used to measure fair value. The hierarchy gives the highest priority to unadjusted quoted prices in active markets for identical assets or liabilities (level 1 measurement) and the lowest priority to unobservable inputs (level 3 measurement). The three levels of the fair value hierarchy defined by GAAP are as follows:
December 31,
CUMMINS INC. AND SUBSIDIARIESINVENTORIESFAIR VALUE OF FINANCIAL INSTRUMENTS (Continued) Fair Value Measurements as of December 31, 2009, Using In millions Quoted prices in active
markets for identical assets
(Level 1) Significant other
observable inputs
(Level 2) Significant
unobservable inputs
(Level 3) Total $ 127 $ 63 $ — $ 190 — 42 — 42 — (1 ) — (1 ) $ 127 $ 104 $ — $ 231 Fair Value Measurements as of December 31, 2008, Using In millions Quoted prices in active
markets for identical assets
(Level 1) Significant other
observable inputs
(Level 2) Significant
unobservable inputs
(Level 3) Total $ 59 $ 18 $ — $ 77 — 80 — 80 — (81 ) — (81 ) $ 59 $ 17 $ — $ 76
Fair Value of Other Financial Instruments December 31, In millions 2009 2008 $ 674 $ 567 703 698
CUMMINS INC. AND SUBSIDIARIES December 31, In millions 2009 2008 $ 785 $ 860 638 1,021 1,423 1,881 (82 ) (98 ) $ 1,341 $ 1,783 7.8. PROPERTY, PLANT AND EQUIPMENT December 31, In millions 2009 2008 $ 868 $ 799 3,494 3,265 403 (1) 475 4,765 4,539 (2,879 ) (2,698 ) $ 1,886 $ 1,841 CUMMINS INC. AND CONSOLIDATED SUBSIDIARIESNOTES TO CONSOLIDATED FINANCIAL STATEMENTS (Continued)8.9. GOODWILL AND OTHER INTANGIBLE ASSETS20062009 and 2005:2008:
GenerationIn millions Components Power
Generation Engine Distribution Total $ 339 $ 13 $ 6 $ 7 $ 365 — — — — — — — — — — (3 ) — — — (3 ) 336 13 6 7 362 — — — — — — — — — — 1 — — 1 2 $ 337 $ 13 $ 6 $ 8 $ 364
CUMMINS INC. AND SUBSIDIARIESSFAS 142GAAP as of the end of our third quarter. The results of this annual impairment test indicated that the fair value of each of our reporting units as of October 1, 2006September 27, 2009 and September 25, 2005,28, 2008, exceeded their carrying, or book value, including goodwill, and therefore our recorded goodwill was not subject to impairment. The fair value was determined utilizing the expected present value of future cash flows. December 31, In millions 2009 2008 $ 407 $ 343 (190 ) (138 ) 217 205 34 34 (23 ) (16 ) 11 18 $ 228 $ 223 $27$55 million, $31$50 million and $33$31 million for the years ended December 31, 2006, 20052009, 2008 and 2004,2007, respectively. Internal and external software costs (excluding those related to research, reengineeringre-engineering and training) and, trademarks and patents are amortized generally over a three to five-year period. The following table represents the projected amortization expense of our intangible assets, assuming no further acquisitions or dispositions, is approximately $36 million in 2007, $32 million indispositions. For the years ended In millions 2010 2011 2012 2013 2014 $ 68 $ 60 $ 49 $ 34 $ 13 $25 million in 2009, $19 million in 2010 and $10 million in 2011.CUMMINS INC. AND CONSOLIDATED SUBSIDIARIESNOTES TO CONSOLIDATED FINANCIAL STATEMENTS (Continued)The provision (benefit) for income taxes consists of the following:A reconciliation of the income tax provision at the U.S. federal income tax rate of 35 percent to the actual effective tax rate is as follows:Except for the U.K. group, we provide for the additional taxes that would be due upon the dividend distribution of the earnings of our foreign subsidiaries and joint ventures assuming the full utilization of foreign tax credits. The unremitted earnings of the U.K. group are considered to be permanently reinvested and the determination of the deferred tax liability, if any, that might be due should those earnings be distributed is not practicable. Earnings before income taxes include equity earnings of foreign joint ventures of $78 million, $75were $37 million and $74$39 million, for the years ended December 31, 2006, 2005,respectively, and 2004, respectively. These equity earnings are recorded net of foreign taxes. Additional U.S. income taxes of $13 million (1.2 percent), $7 million (0.9 percent) and $20 million (4.6 percent) for the years endedCUMMINS INC. AND CONSOLIDATED SUBSIDIARIESNOTES TO CONSOLIDATED FINANCIAL STATEMENTS (Continued)December 31, 2006, 2005 and 2004, respectively, were provided on the distributed equity earnings and for the estimated additional U.S. taxes that will ultimately be due upon the distribution of the remaining unremitted foreign joint venture equity earnings. The American Jobs Creation Act of 2004 (Jobs Act) included a special one-year 85-percent dividend deduction for qualifying dividends repatriated from foreign operations in 2005. The application of these rules to foreign joint venture dividend repatriations of $71 million reduced our 2005 income tax provision by $16 million (2.0 percent).The Jobs Act also repeals the U.S. export tax benefits beginning in 2007 and phases the benefits down to 80 percent of their value in 2005 and 60 percent in 2006. The export benefits are partially replaced with a new U.S. manufacturer’s tax deduction which phases in one-third in 2005-2006, two-thirds in 2007-2009 and 100 percent after 2009. The U.S. manufacturer’s tax benefit for 2006 and 2005 was $3 million (0.3 percent) and $2 million (0.3 percent), respectively.Our 2006 income tax provision includes a $28 million (2.6 percent) reduction in the second quarter due to the favorable resolution of tax uncertainties related to prior years, and a $10 million (0.9 percent) reduction in the fourth quarter due to the retroactive reinstatement of the U.S. research tax credit. The state income tax provision for 2006 includes a $12 million (1.1 percent) increase in the first quarter for the effect of new Indiana tax legislation.Our 2005 income tax provision includes an $8 million (1.0 percent) reduction due to the favorable resolution in the fourth quarter of 2005 of prior year tax positions which had been in dispute.The state income tax benefit for 2004 includes recognition of $16 million (3.7 percent) of state carryforward benefits that we determined, based on improved operating results, are more likely than not to be realized in the future. These benefits had previously been reserved with a valuation allowance. The state income tax benefit for 2004 also included a $9 million (2.1 percent) benefit to recognize a change in the average estimated state income tax rate which increased the net deferred state tax assets.Export tax benefits for 2004 include $11 million (2.5 percent) related to prior years. As a consequence of improved cash flow during 2004, we filed amended tax returns and claimed additional export tax benefits related to prior years which we previously had forgone to avoid the associated tax payments on non-exempt export income by our foreign sales corporation.During 2004, as a result of continued earnings improvement and improved outlook, we reassessed the treatment of our 2002 and 2003 foreign tax credits previously recognized as tax deductions and determined they could be used as full tax credits. The $25 million (5.8 percent) benefit from the more favorable treatment of these tax credits is included in “Differences in rates and taxability of foreign subsidiaries and joint ventures” in the above table.CUMMINS INC. AND CONSOLIDATED SUBSIDIARIESNOTES TO CONSOLIDATED FINANCIAL STATEMENTS (Continued)Carryforward tax benefits and the tax effect of temporary differences between financial and tax reporting that give rise to net deferred tax assets are as follows:A valuation allowance is recorded to reduce the gross deferred tax assets to an amount we believe is more likely than not to be realized. The valuation allowance decreased in 2006 by a net $5 million and in 2005 by a net $8 million. The valuation allowance is primarily attributable to the uncertainty regarding the realization of a portion of the U.S. state and foreign net operating loss and tax credit carryforward benefits.The deferred income tax balances are classified in the Consolidated Balance Sheets as follows:CUMMINS INC. AND CONSOLIDATED SUBSIDIARIESNOTES TO CONSOLIDATED FINANCIAL STATEMENTS (Continued)NOTE 10. OTHER ACCRUED EXPENSESOther accrued expenses included the following:NOTE 11. SHORT-TERM BORROWINGS AND LONG-TERM DEBTLoans payable consist primarily of notes payable to financial institutions. The weighted-average interest rate for notes payable, bank overdrafts and current maturities of long-term debt at December 31, 20062009, 2008 and 20052007, was 7.13 percent and 6.67 percent, respectively.as follows: December 31, 2009 2008 2007 5.61 7.03 7.43
CUMMINS INC. AND CONSOLIDATED SUBSIDIARIES2006,2009, we had $542 millionwere in compliance with all such covenants, including our leverage ratio of 0.6 to 1.0 and our fixed charge coverage ratio of 22.5 to 1.0.forunder the facility as of December 31, 2009 and 2008. There were no outstanding borrowings under our $650 million revolving creditthis facility and $123at December 31, 2009. Revolving Credit
Capacity
at December 31, In millions 2009 2008 $ 1,100 $ 1,100 35 39 $ 1,065 $ 1,061 The amountCommitments against the other domestic and international facilities were $37 million as of borrowings outstanding under our international short-term facilities at December 31, 2006, was $37 million.2009 and $39 million at the end of 2008.
CUMMINS INC. AND SUBSIDIARIES December 31, In millions 2009 2008 $ 49 $ — 58 58 250 250 165 165 39 44 561 517 (36 ) (37 ) 25 79 117 100 667 659 (30 ) (30 ) $ 637 $ 629 are $127 million in 2007, $103 million in 2008, $28 million in 2009, $21 million in 2010, and $17 million in 2011.are:Our revolving credit facility provides for aggregate borrowings of up to $650 million on an unsecured basis and matures in December 2009. Up to $200 million of the facility is available for total letters of credit; up to $60 million of the facility may be used for multi-currency borrowings or multi-currency letters of credit. Required principal payments In millions 2010 2011 2012 2013 2014 $ 30 $ 46 $ 67 $ 23 $ 17 facility varies based upon the London Interbank Offered Rate (LIBOR) or the Alternate Base Rate plus a spread depending upon our credit rating. We are required to pay a quarterly facilities fee on the unused commitments under this facility based on our credit rating. The fee was 0.25 percent at December 31, 2006. As of December 31, 2006 and 2005 we had $108 million and $110 million, respectively in letters of credit outstanding against this facility. There were no outstanding borrowings under this facility at December 31, 2006.Interest on the senior notes was6.75% debentures is payable on June 1February 15 and December 1August 15 each year. The senior notesdebentures were redeemable in whole or in part at any timeour option after December 1, 2006,February 15, 2007, at a premium equal to 104.75 percentredemption price of par declining to par in 2008,value plus accrued interest. On December 19, 2006, we redeemedinterest or an amount designed to ensure that the notes in whole for approximately $262 million, resulting in a loss on extinguishment of debt of approximately $12 million which as been recorded in “Other expenses (income)” on our Consolidated Statements Of Earnings.The 8.68% notes relate to a consolidated VIE (a grantor trust wholly-owned by a financial institution). Principal payments are made annually with a final payment due in April 2008. The consolidation of the VIE is discussed in Note 2. Interest payments are due on the notes quarterly. Principal and interest payments due on the notes coincide with the payments that are due to the grantor trust under our lease ofCUMMINS INC. AND CONSOLIDATED SUBSIDIARIESNOTES TO CONSOLIDATED FINANCIAL STATEMENTS (Continued)manufacturing equipment from the grantor trust. Principal payments due over the next five years are included in the amounts above. Our lease is described in Note 20. The notes are secureddebenture holders were not penalized by the assets of the grantor trust which include only the manufacturing equipment and the trust’s rights under the lease agreement with us.early redemption.Interest on In October 2009, our wholly-owned subsidiary, Cummins Brasil Ltda, entered into a loan agreement with the 6.75% debentures is payable on February 15 and August 15 each year. HoldersBrazil development bank, BNDES, for a loan in local currency in an amount equivalent to US $45 million, at drawdown, at a fixed rate of 4.5 percent to finance its exports over the next three years. The principal of the debentures could elect to be repaid on February 15, 2007, at par value together with accrued interest to February 15, 2007. Such election, was irrevocable, was required to be made between December 15, 2006loan has a two-year grace period and January 15, 2007. Approximately $62 million of the debentures were repaid on February 15, 2007, at the election of the holders. At December 31, 2006, we have included the $62 million repaid on February 15, 2007,will begin amortizing in short-term borrowings in our Consolidated Balance Sheet. The debentures are also redeemable at our option after February 15, 2007, at a redemption price of par value plus accrued interest or an amount designed to ensure that the debenture holders are not penalized by the early redemption.2011.2006,2009, we were in compliance with all of the covenants under our borrowing agreements.As discussed in Note 2, our total debt includes $68 million (of which $14 million is included in “Loans payable” in above table related to the consolidation of three joint ventures under FIN 46R, as of December 31, 2006. Included in this amount is a $45 million term loan at CDC with a financial institution. The loan is due in annual installments, with a final payment due in 2008. Interest is payable semi-annually at a rate of 6.92%. The note is collateralized by substantially all of CDC’s inventory and fixed assets with a current book value of $46 million and $153 million, respectively, as of December 31, 2006.As of December 31, 2006 and 2005, commitments outstanding for letters of credit under our revolving credit facility and our international and other domestic facilities were $108 million and $35 million, and $110 million and $34 million, respectively. Commitments outstanding related to performance bonds and other performance-related guarantees were $36 million and $28 million as of December 31, 2006 and 2005, respectively.Junior Convertible Subordinated DebenturesIn June 2001, Cummins Capital Trust I (the “Trust”), a Delaware business trust and our wholly-owned subsidiary, issued 6 million shares of 7% convertible quarterly income preferred securities (“preferred securities”), to qualified institutional buyers for net proceeds of $291 million. The preferred securities represent an undivided beneficial ownership interest in the assets of the Trust. The total proceeds from the issuance of the preferred securities by the Trust were invested in $309 million aggregate principal amount of 7% convertible subordinated debentures (the “debentures”) that we issued. The debentures were the
CUMMINS INC. AND CONSOLIDATED SUBSIDIARIESsole assetsNOTE 11. PRODUCT WARRANTY LIABILITYTrustactivity in our warranty liability account, which includes warranty provisions and payments, changes in accordanceour estimates for pre-existing warranties and changes in our deferred revenue balances associated with the provisionsextended warranty programs is as follows: December 31, In millions 2009 2008 $ 962 $ 749 364 413 109 103 (472 ) (383 ) (72 ) (64 ) 84 177 14 (33 ) $ 989 $ 962 FIN 46R (see Note 2) the trustour warranty balance is presented as "Current portion of accrued product warranty." The deferred revenue related to extended warranty programs at December 31, 2009 and 2008, was not consolidated.$262 million and $224 million, respectively. The debentures arecurrent portion of deferred revenue is included in “Long-term debt”"Deferred revenue" and the long-term portion is included in "Other liabilities and deferred revenue" in ourConsolidated Balance Sheets.On May 8, 2006, During 2008 and 2009, actual cost trends for certain midrange engine products, including product launched in 2007 and for which warranty periods can extend to five years, indicated higher per claim repair cost than the Boardproduct on which the initial accrual rate was developed. These products include more electronic parts than historical models contributing to the higher cost per claim. In addition, certain products introduced in 2003 and sold prior to 2007 for which the warranty period extended five years also demonstrated a higher cost per claim than that of Directors approvedpredecessor products. We increased our plan to redeem all of the 7% convertible quarterly income preferred securities. On May 9, 2006, we gave the trustee our formal irrevocable notification of our intent to redeem the preferred securities. This notification provided the holders of the preferred securities 30 daysliability in which to convert their securities into shares of common stock. Upon expiration of the notification period, all remaining securities not converted were redeemed for cash at a premium above liquidation value. Substantially all of the $300 million 7% convertible subordinated debentures outstanding were converted into shares of our common stock during the second quarter of 2006. As a result of the conversion, approximately 6.3 million shares of common stock were issued which resulted in an increase of approximately $15 million to common stock outstanding2008 and an increase of approximately $276 million to additional contributed capital. Since substantially all holders converted their preferred securities to common stock, the loss on extinguishment of this debt was not material.2009 as these experience trends became evident.TheHowever, the level of benefits and terms of vesting however, may vary among plans. Pension plan assets are administered by trustees and are principally invested in equity securities and fixed income securities. It is our policy to make contributions to theour various qualified plans in accordance with statutory and contractual funding requirements and any additional funding required to achieve 90 percentcontributions we determine are appropriate.
Obligations, Assets and Funded Statuson a globalstatus of the plans, and the amounts recognized in ourConsolidated Balance Sheets for our
CUMMINS INC. AND SUBSIDIARIESbasisfor our pension plans. U.S. Plans Non-U.S. Plans In millions 2009 2008 2009 2008 $ 1,949 $ 1,959 $ 861 $ 1,155 47 52 18 28 115 124 57 70 — — 1 1 120 (27 ) 108 (25 ) (176 ) (153 ) (58 ) (43 ) (8 ) (6 ) — — — — 99 (325 ) 5 — (10 ) — 1 — (1 ) — $ 2,053 $ 1,949 $ 1,075 $ 861 $ 1,484 $ 1,949 $ 745 $ 1,217 269 (383 ) 134 (175 ) 100 70 21 36 — — 1 1 (176 ) (153 ) (58 ) (43 ) — — 86 (291 ) — 1 — — $ 1,677 $ 1,484 $ 929 $ 745
$
(376
)
$
(465
)
$
(146
)
$
(116
) $ (8 ) $ (7 ) $ — $ — (368 ) (458 ) (146 ) (116 ) $ (376 ) $ (465 ) $ (146 ) $ (116 ) $ 801 $ 837 $ 364 $ 322 (6 ) (8 ) 6 8 $ 795 $ 829 $ 370 $ 330
CUMMINS INC. AND SUBSIDIARIES U.S. Plans Non-U.S. Plans December 31, In millions 2009 2008 2009 2008 $ 2,033 $ 1,931 $ 1,019 $ 810 2,033 1,931 1,019 810 1,677 1,484 929 745 2,053 1,949 1,075 861 1,677 1,484 929 745
Components of Net Periodic Pension Cost U.S. Plans Non-U.S. Plans In millions 2009 2008 2007 2009 2008 2007 $ 47 $ 48 $ 45 $ 18 $ 26 $ 33 115 115 107 57 65 63 (142 ) (150 ) (140 ) (60 ) (73 ) (71 ) (1 ) (1 ) (1 ) 3 3 4 29 20 33 21 19 26 — (1 ) — — — (1 ) $ 48 $ 31 $ 44 $ 39 $ 40 $ 54 5 — — 1 — — $ 53 $ 31 $ 44 $ 40 $ 40 $ 54
CUMMINS INC. AND SUBSIDIARIESIn millions 2009 $ (2 ) (1 ) (50 ) 17 42 $ 6 $ 99 In millions 2010 $ 2 52 endactions. In the third and fourth quarters of 2007.2009, we recorded net curtailment losses of $5 million and $1 million for U.S. and non-U.S. plans, respectively, and $2 million for our less significant plans in other countries outside the U.S. and the U.K. The curtailment losses include recognition of the change in the PBO and a portion of the previously unrecognized prior service cost reflecting the reduction in expected future service. U.S. Plans Non-U.S. Plans 2009 2008 2009 2008 5.60 % 6.20 % 5.80 % 6.20 % 4.00 % 4.00 % 4.50 % 4.25 %
CUMMINS INC. AND SUBSIDIARIES U.S. Plans Non-U.S. Plans 2009 2008 2007 2009 2008 2007 6.20 % 6.10 % 5.60 % 6.20 % 5.80 % 4.96 % 8.25 % 8.25 % 8.50 % 7.25 % 7.25 % 7.24 % 4.00 % 4.00 % 4.00 % 4.25 % 4.25 % 4.02 % Asset ClassTarget Range 31 % 26 - 36 % 8 % 4 - 12 % 16 % 12 - 20 % 55 % 50 - 60 % 7.5 % 0 - 10 % 7.5 % 0 - 10 % 30 % 25 - 35 % 100 %
CUMMINS INC. AND SUBSIDIARIESAsset ClassTarget Range 31 % +/- 2.5 % 22 % +/- 2.5 % 53 % +/- 2.5 % 5 % N/A 2 % N/A 40 % +/- 2.5 % 100 %
CUMMINS INC. AND SUBSIDIARIES Fair Value Measurements as of December 31, 2009 Using In millions Quoted prices in active
markets for identical
assets
(Level 1) Significant other
observable inputs
(Level 2) Significant
unobservable inputs
(Level 3) Total $ 157 $ 457 $ — $ 614 128 219 — 347 260 — — 260 298 — — 298 68 — — 68 14 — — 14 9 — — 9 — 3 — 3 — — 139 139 $ 934 $ 679 $ 139 $ 1,752 (87 ) 12 $ 1,677
CUMMINS INC. AND SUBSIDIARIES Fair Value Measurements as of
December 31, 2009
Using Significant Unobservable
Inputs (Level 3) In millions Private Equity Real Estate Total $ 97 $ 57 $ 154 (6 ) (21 ) (27 ) 13 (1 ) 12 $ 104 $ 35 $ 139 Fair Value Measurements as of December 31, 2009 Using In millions Quoted prices in active
markets for identical
assets
(Level 1) Significant other
observable inputs
(Level 2) Significant
unobservable inputs
(Level 3) Total $ — $ 106 $ — $ 106 — 434 — 434 96 91 — 187 23 15 — 38 60 69 — 129 16 — — 16 4 — — 4 — — 35 35 $ 199 $ 715 $ 35 $ 949 (21 ) 1 $ 929
CUMMINS INC. AND SUBSIDIARIES Fair Value Measurements as of
December 31, 2009
Using Significant Unobservable
Inputs (Level 3) In millions Private Equity Real Estate Total $ 5 $ 36 $ 41 (2 ) (8 ) (10 ) 1 3 4 $ 4 $ 31 $ 35
Estimated Future Contributions and Benefit Payments$230$175 million to $240$185 million to our defined benefit pension plans in 2010. The table below presents expected future benefit payments under our pension plans:In millions 2010 2011 2012 2013 2014 2015-2019 $ 200 $ 203 $ 207 $ 209 $ 214 $ 1,108 CONSOLIDATED SUBSIDIARIESOther Postretirement BenefitsNOTE 12. PENSION AND OTHER POSTRETIREMENT BENEFITS (Continued)We made several changes to our plan provisions that are reflected in our December 31, 2005, liability which included the elimination of retiree dental coverage, contribution rate changes
Obligations and changes in plan design to more effective providers.Adoption of SFAS 158Funded StatusOn September 29, 2006, SFAS No. 158, “Employers’ Accounting for Defined Benefit Pension and Other Postretirement Plans” was issued. SFAS 158 requires, among other things, the recognition of the funded status of each defined benefit pension plan, retiree health care and other postretirement benefit plans on the balance sheet. Each overfunded plan is recognized as an asset and each underfunded plan is recognized as a liability. The initial impact of the standard due to unrecognized prior service costs or credits and net unrecognized actuarial gains or losses as well as subsequent changes in the funded status is recognized as a component of accumulated other comprehensive loss in shareholder’s equity. Additional minimum pension liabilities (AML) and related intangible assets are also reversed upon adoption of the new standard. SFAS 158 requires initial application for fiscal years ending after December 15, 2006. We adopted SFAS 158 as of December 31, 2006, except for the provision requiring companies to measure plan assets and liabilities as of the end of a fiscal year which is not effective until 2008. The following table summarizes the effect of required changes in the AML as of December 31, 2006, prior to the adoption of SFAS 158 as well as the impact of the initial adoption of SFAS 158.CUMMINS INC. AND CONSOLIDATED SUBSIDIARIESNOTES TO CONSOLIDATED FINANCIAL STATEMENTS (Continued)
2006
Prior to
AML &
SFAS 158
Adjustments
Adjustments
2006 Post
AML &
AdjustmentsAs it relates to pension benefits, the AML was eliminated upon the adoption of SFAS 158. The estimated accumulated benefit obligation related to the U.S., U.K. and several other smaller pension plans exceeded the fair value of the plan assets as of December 31, 2006 and 2005. In 2005, the AML increased by $24 million (after tax and minority interest). Prior to adopting SFAS 158, a decrease in the AML resulted in a $102 million credit (after tax and minority interest) to shareholders’ equity in 2006. The net impact to shareholder’s equity, including foreign currency translation effects, was $81 million. The adoption of SFAS 158 resulted in a net charge to shareholders’ equity of $91 million, including $4 million of foreign currency translation effects. The net charge to shareholders’ equity at December 31, 2006, as a result of the decrease in the AML and the adoption of SFAS 158 is $10 million. For postretirement benefits, the adoption of SFAS 158 resulted in a charge to shareholders’ equity of $3 million.SFAS 158 provided guidance on current and non-current classifications for defined benefit pension plan liabilities. Specifically, if there is inadequate funding in the plan assets to cover the next 12 months of benefit payments, the shortfall must be classified as a current liability. If there is adequate funding the pension liability is classified as noncurrent. This methodology is applied on a plan by plan basis and cannot be applied retrospectively under SFAS 158. At December 31, 2006, we classified $6 million as a current pension liability in “Other accrued expenses” compared to $174 million at December 31, 2005.CUMMINS INC. AND CONSOLIDATED SUBSIDIARIESNOTES TO CONSOLIDATED FINANCIAL STATEMENTS (Continued)The amounts in accumulated other comprehensive loss that are expected to be recognized as components of net periodic benefit cost (credit) during the next fiscal year are as follows:
Postretirement
BenefitsWe use a November 30 measurement date for our U.S. and non-U.S. plans for both pension and other postretirement benefit plans. The following tables present the changes in the benefit obligations, and the various plan assets, the funded status of the plans and the amounts recognized in ourConsolidated Balance Sheetsfor both pensions andour significant other postretirement benefit plans. Benefit obligation balances presented below reflect the PBO for our pension plans and accumulated postretirement benefit obligations (APBO) for our other postretirement benefit plans.In millions 2009 2008 $ 503 $ 545 1 1 29 34 9 9 — (2 ) 17 (19 ) (60 ) (65 ) 5 — $ 504 $ 503
$
(504
)
$
(503
) $ (51 ) $ (51 ) (453 ) (452 ) $ (504 ) $ (503 ) $ 35 $ 20 (20 ) (30 ) $ 15 $ (10 )
CUMMINS INC. AND CONSOLIDATED SUBSIDIARIES
Components of Net Periodic Other Postretirement Benefits CostIn addition to the pension values in the above table, we also maintain defined benefit pension plans in nine other countries outside the United States that comprise less than one percent of our pension plan assets and obligations. Additional postretirement plans are maintained in three other countries outside the United States and also comprise less than one percent of our postretirement obligations.CUMMINS INC. AND CONSOLIDATED SUBSIDIARIESNOTES TO CONSOLIDATED FINANCIAL STATEMENTS (Continued)The following table presents information regarding underfunded pension plans that are included in the preceding table:pension and other postretirement benefits expensecost under our plans:In millions 2009 2008 2007 $ 1 $ 1 $ 1 29 31 31 (9 ) (10 ) (10 ) — (1 ) (1 ) (1 ) — (1 ) 20 21 20 6 — — $ 26 $ 21 $ 20 In millions 2009 $ 9 17 (1 ) 25 $ 51
CUMMINS INC. AND SUBSIDIARIES 2009 2008 5.60 % 6.20 % 2009 2008 2007 6.20 % 6.00 % 5.60 % The APBO at December 31, 2004, decreased by We received a subsidy of approximately $28 million due to the effect of the federal subsidy, and the net periodic postretirement benefit cost for 2005 and 2006 was reduced by approximately $4$5 million in both years.2009.Assumptions
Estimated Benefit Paymentsvarious assumptions used in determiningexpected benefit payments under our other postretirement benefit plans and also provides the benefit obligation for each year and reflects weighted-average percentages for the various plans (Non-U.S. is primarily the United Kingdom):Medicare subsidy receipts expected to be received:
U.S. Plans
BenefitsIn millions 2010 2011 2012 2013 2014 2015-2019 53 53 51 50 48 199 2 3 3 3 3 12 105CONSOLIDATED SUBSIDIARIESThe table below presents various assumptions used in determining the net periodic cost and reflects weighted-average percentages for the various plans (Non-U.S. is primarily the United Kingdom):Our consolidated postretirement benefit obligation is determined by application of the terms of health care and life insurance plans, together with relevant actuarial assumptions and health care cost trend rates. For measurement purposes, a 9 percent annual rate of increase in the per capita cost of covered health care benefits was assumed in 2006. The rate was assumed to decrease on a linear basis to 5 percent through 2010 and remain at that level thereafter. An increase in the health care cost trends of 1 percent would increase our APBO by $23 million as of December 31, 2006 and the net periodic postretirement benefit expense for 2006 by $1 million. A decrease in the health care cost trends of 1 percent would decrease our APBO by $20 million as of December 31, 2006 and the net periodic postretirement benefit expense for 2006 by $1 million.The plan assets for our defined benefit pension plans do not include any of our common stock. The table below presents our pension plan asset allocation at December 31, 2006, 2005 and target allocation for 2007:
Allocation
Plan
Assets at
December 31,The table below presents expected future benefit payments under our pension plans:We also sponsor defined contribution plans for certain hourly and salaried employees. During 2006, 2005 and 2004, expenses incurred related to our contributions to these plans were $27 million, $27 million and $25 million, respectively.CUMMINS INC. AND CONSOLIDATED SUBSIDIARIESNOTES TO CONSOLIDATED FINANCIAL STATEMENTS (Continued)PRODUCT WARRANTY LIABILITYOTHER LIABILITIES AND DEFERRED REVENUEA summary of the activity in our warranty liability account, which includes warranty provisions and payments, changes in our estimates for pre-existing warranties and changes in our deferred revenue balances associated with extended warranty programs is as follows:The current portion of our warranty balance is included in “Other accrued expenses” and the remaining balance is included in “Other Other liabilities and deferred revenue” on our Consolidated Balance Sheets. The amount of deferred revenue related to extended warranty programs at December 31, 2006 and 2005, was $166 million and $122 million, respectively.include the following: December 31, In millions 2009 2008 $ 301 $ 311 215 173 104 108 140 153 $ 760 $ 745 defendants in a numbersubject to numerous lawsuits and claims arising out of pending legal actions,the ordinary course of our business, including actions related to product liability; personal injury; the use and performance of our products. We carry product liability insurance covering significant claims for damages involving personal injuryproducts; warranty matters; patent, trademark or other intellectual property infringement; contractual liability; the conduct of our business; tax reporting in foreign jurisdictions; distributor termination; workplace safety; and property damage. We also establish reserves for these and other matters in which losses are probable and can be reasonably estimated. In the event we are determined to be liable for damages in connection with actions and proceedings, the unaccrued portion of such liability is not expected to be material.environmental matters. We also have been identified as a potentially responsible party at severalmultiple waste disposal sites under U.S. federal and related state environmental statutes and regulations and may have joint and several liability for any investigation and remediation costs incurred with respect to such sites.sites, as more fully described in Item 1 of this Form 10-K under "Environmental Compliance—Other Environmental Statutes and Regulations." We denyhave denied liability with respect to many of these legal actionslawsuits, claims and environmental proceedings and are vigorously defending such actions orlawsuits, claims and proceedings. We have established reservescarry various forms of commercial, property and casualty, product liability and other forms of insurance; however, such insurance may not be applicable or adequate to cover the costs associated with a judgment against us with respect to these lawsuits, claims and proceedings. We do not believe that these lawsuits are material individually or in the aggregate. While we believe arewe have also established adequate accruals for our expected future liability in such actionswith respect to pending lawsuits, claims and proceedings, where the nature and extent of any such liability can be reasonably estimated based upon then presently available information.information, there can be no assurance that the final resolution of any existing or future lawsuits, claims or proceedings will not have a material adverse effect on our business, results of operation, financial condition or cash flows.
U.S. Distributor GuaranteesCommitmentsSince 1997 we have We had an operating agreement with a financial institution that requires us to guarantee revolving loans, equipment term loans and leases, real property loans and letters of credit made by the financial institutionprovided financing to certain independent Cummins and OnanCummins Power Generation distributors in the United States,U.S., and to certain distributors in which we own an equity interest. In the first quarter of 2006, we amended, restated and simplified the terms of the operatingUnder this agreement, and removed the Cummins guarantee of distributor borrowings.CUMMINS INC. AND CONSOLIDATED SUBSIDIARIESNOTES TO CONSOLIDATED FINANCIAL STATEMENTS (Continued)Ifif any distributor defaultsdefaulted under its financing arrangement with the financial institution, and the maturity of amounts owed under the agreement iswere accelerated, then we arewere required to purchase from the financial institution, at amounts
CUMMINS INC. AND SUBSIDIARIESdistributor’sdistributor's financing agreement.operating agreement will continuedistributors are permitted to besell other, noncompetitive products only with our consent. We license all of our distributors to use our name and logo in effect until February 7, 2008connection with the sale and is subjectservice of our products, with no right to assign or sublicense the trademarks, except to authorized dealers, without our consent. Products are sold to the distributors at standard domestic or international distributor net prices, as applicable. Net prices are wholesale prices we establish to permit our distributors an automatic one year renewaladequate margin on their sales. Subject to local laws, we can generally refuse to renew these agreements upon expiration or terminate them upon written notice for inadequate sales, change in principal ownership and certain other reasons. Distributors also have the right to terminate the agreements upon 60-day notice without requiringcause, or 30-day notice for cause. Upon termination or failure to renew, we are required to purchase the actiondistributor's current inventory, signage and special tools, and may, at our option purchase other assets of either party.the distributor, but are under no obligation to do so.2006,2009, and 2008 was $8 million.
Other Guarantees and CommitmentsTheAs of December 31, 2009, the maximum potential loss related to these other guarantees is $7$75 million at December 31, 2006.($74 million of which relates to the Beijing Foton guarantee discussed below).costs.costs in most instances. At December 31, 2006,2009, if we were to stop purchasing from each of these suppliers, the amount of the penalty would be approximately $17 million. However, based$69 million, of which $62 million relates to a six year contract with an engine parts supplier that extends from 2008 to 2013. This arrangement enables us to secure critical components important to our growth. Based on current forecasts, we do not anticipate paying any penalties under these contracts.Indemnifications In July 2008, Beijing Foton Cummins Engine Company, a 50 percent owned entity accounted for under the equity method, entered into a line of credit agreement with a borrowing capacity of up to $176 million (at current exchange rates). The line is being used primarily to fund equipment purchases for a new manufacturing plant. As a part of this transaction, we guaranteed 50 percent of any
CUMMINS INC. AND SUBSIDIARIESindemnificationsindemnities include:·product liability and license, patent or trademark indemnifications,··indemnificationsindemnities and accrue for expected losses that are probable. Because the indemnificationsindemnities are not related to specified known liabilities and due to their uncertain nature, we are unable to estimate the maximum amount of the potential loss associated with these indemnifications.indemnities.2006,2009, we have committed to invest $71and fund $4 million into existing joint ventures in 2010.two joint ventures that will be formed in 2007. It is expected that the majorityequipment, aircraft and automobiles for varying periods under lease agreements. Most of the outlay will be funded in 2007.leases are
CUMMINS INC. AND CONSOLIDATED SUBSIDIARIES15. MINORITY INTERESTS14. COMMITMENTS AND CONTINGENCIES (Continued)In millions 2009 2008 2007 $ 130 $ 129 $ 113 In millions Capital Leases Operating Leases $ 32 $ 96 21 69 31 50 17 40 19 33 25 85 $ 145 $ 373 (28 ) $ 117 Minority shareholders’ interests A significant portion of the equipment in our rental business is financed under capital leases. During the third quarter of 2006, we extended a lease related to a portion of our rental business by six years. The lease was set to expire on September 30, 2006. Instead of paying a balloon payment of approximately $42 million on September 30, 2006, the amount was financed over a six-year term at a fixed rate. In addition to extending this lease, we reduced the interest rate by approximately 2 percentage points. During the fourth quarter of 2006, we refinanced a lease related to another portion of our rental business. Under the terms of the agreement which was effective January 1, 2007, the new lease has a six-year term with a fixed rate that is approximately 2 percentage points lower than the previous lease. The total amount refinanced was approximately $28 million. These two leases are with two different lessors. Under each lease we are permitted to prepay, subject to certain conditions, the outstanding balance under the lease for the principal amount outstanding plus a prepayment penalty. For each of these leases we have the option to purchase the equipment at the end of the lease term for one dollar. The equipment under these leases is capitalized and amortized over its estimated useful life. As of December 31, 2009 and 2008, we had outstanding capital leases under this program of $9 million and $43 million, respectively. Future lease payments, including repurchase obligations, under each lease are included in the table above.
CUMMINS INC. AND SUBSIDIARIES
Sale and Leaseback Transaction Amendment and Extensionsubsidiariesas a result of the adoption of new accounting standards for variable interest entities, due primarily to the existence of the residual value guarantee. As a result of the consolidation, the manufacturing equipment and the trust's obligations under its non-recourse debt arrangement was included in ourConsolidated Balance Sheets as property, plant and equipment and long-term debt, respectively. The equity in the trust held by the financial institution was reported as noncontrolling interest. In addition, ourConsolidated Statements of Income included interest expense on the lessor's debt obligations and depreciation expense on the manufacturing equipment rather than rent expense under the lease agreement. In April 2008, the trust made the final payment on the non-recourse debt.In millions
Due date Payment
amount $ — — 12 10 14 4
CUMMINS INC. AND SUBSIDIARIES16. SHAREHOLDERS’15. CUMMINS INC. SHAREHOLDERS' EQUITY
Stock
Stock
Held in
Treasury
Stock
Held in
Trust In millions Common
Stock Treasury
Stock Common Stock
Held in Trust 220.0 11.6 7.6 — 6.0 — 0.8 (0.2 ) — — 0.8 (1.1 ) (0.4 ) — — 220.4 18.2 6.5 — 2.3 — 1.6 (0.1 ) — — — (1.4 ) (0.3 ) — — 221.7 20.4 5.1 — 0.4 — 0.9 (0.1 ) — — — (2.1 ) (0.6 ) — — 222.0 20.7 3.0 Cash dividends In July 2008, the Board of $0.30Directors voted to increase the quarterly cash dividend per common share were declaredby 40 percent and increased cash dividends to $0.175 per common share in the firstthird and secondfourth quarters of 2006.2008.
CUMMINS INC. AND SUBSIDIARIES2006,2007, the Board of Directors voted to increase the quarterly cash dividend per share by 2039 percent to $0.36 per share, and as a resultincreased cash dividends of $0.36to $0.125 per common share were declared in the third and fourth quarterquarters of 2006. Cash dividends of $0.302007. Dividends per common share were declared and paid in each quarter of 2005 and 2004. Dividends paid to common shareholders for the years ended December 31, 2006, 2005were as follows: Quarterly Dividends 2009 2008 2007 $ 0.175 $ 0.125 $ 0.09 0.175 0.125 0.09 0.175 0.175 0.125 0.175 0.175 0.125 20042007 were $66$141 million, $56$122 million, and $53$89 million, respectively. Declaration and payment of dividends in the future depends upon earningsincome and liquidity position, among other factors.shareholders’shareholders' equity in ourConsolidated Balance Sheets. From time to time, treasury sharesCUMMINS INC. AND CONSOLIDATED SUBSIDIARIESNOTES TO CONSOLIDATED FINANCIAL STATEMENTS (Continued)differencegains between the cost of the shares and the issuance price isare added orto additional paid-in-capital. The losses are deducted from additional contributed capital.paid-in capital to the extent of the gains. Thereafter, the losses are deducted from retained earnings.2006,2009, consisting of shares issued and purchased is presented in the ourConsolidated Statements of Shareholders’Changes in Equity. During June of 2006, we completed the purchase of $100 million worth of common stock that began in September 2005. In July 2006, the Board of Directors authorized us to acquire up to two million shares of Cummins common stock in addition to what had been acquired under previous authorizations. For the year ended December 31, 2006,2007, we repurchased approximately $121$335 million of common stock, representing approximately 1.1 million shares. This included purchases under our $100 millionwhich concluded the share repurchase program introducedauthorized by the Board of Directors in September 2005, which was completedJuly 2006. In 2007, we also converted 0.8 million shares from our Employee Benefit Trust into treasury stock. These shares are not considered purchases under the Board authorized purchase plan. In December 2007, the Board of Directors authorized the acquisition of up to $500 million of Cummins common stock. For the years ended December 31, 2009 and December 31, 2008, we repurchased $20 million and $128 million, respectively, of common stock under the share repurchase program authorized by the Board of Directors in the second quarterDecember of 2006.2007.
Employee Stock Ownership PlanBenefits TrustWe have an In 1997, we established the Employee Benefits Trust (EBT) funded with common stock for use in meeting our future obligations under employee benefit and compensation plans. The primary sources of cash for the EBT are dividends received on unallocated shares of our common stock held by the EBT. In addition to shares of our common stock held in the Employee Stock Ownership Plan (ESOP), the EBT may be used to fund matching contributions to employee accounts in the 401(k) Retirement Savings Plan (RSP) made in proportion to employee contributions under the terms of the RSP. Contributions charged to income for the years ended December 31, 2009 and 2008 were $13 million
CUMMINS INC. AND SUBSIDIARIESIn millions 2009 2008 1.5 1.4 $ 72 $ 63 401(k) Retirement and Savings Plan (RSP).RSP. The ESOP has a note payable to us which will be funded through future Company contributions to the ESOP Trust.2006, 20052009, 2008 and 20042007 along with dividends received on unallocated shares of our common stock held by the ESOP Trust and cash contributions from the Employee Benefit TrustEBT were equal to the required principal and interest payments due under the ESOP notes and amounted to $9 million, $9 million and $8 million, respectively.notes. Dividends received on allocated ESOP shares are used to purchase shares of our common stock from the Employee Benefit Trust. Those shares are then allocated to the participant accounts. As the debt is repaid, shares are released from the ESOP and are allocated to participants in proportion to their contributions to the RSP. Compensation expense is recorded as shares are allocated to plan participants each year and reduced by the common stock dividends received by the ESOP Trust. Unearned compensation is included in shareholders’Cummins Inc. shareholders' equity and represents compensation expense wewhich will recordbe recorded in the future as the remaining shares are allocated to participants. All shares issued to the ESOP Trust are considered outstanding for purposes of computing earnings per share. Dividends on unallocated ESOP shares can be used to service a portion of the principal and interest due on the ESOP notes were $1 million for eachnotes.In millions 2009 2008 2007 $ — $ 1 $ 1 10 9 10 4 3 4 ESOP Trust Shares
December 31, 20092,645,514 109,058 61,104 2,815,676 In 1997, we established the Employee Benefits Trust funded with common stock for use in meeting our future obligations under employee benefit and compensation plans. The primary sources of cash for the Employee Benefit Trust are dividends received on unallocated shares of our common stock held by the Employee Benefit Trust. While the Employee Benefits Trust may be used to fund a number of these plans, the principal use, is in funding matching contributions to employee accounts in the RSP made in proportion to employee contributions under terms of the RSP after shares released from the ESOP are exhausted. We allocate shares to employee accounts as our matching contributions are made to the RSP. Contributions charged to earnings were $9 million in 2006, $10 million in 2005 and $9 million in 2004.110CONSOLIDATED SUBSIDIARIESOther Comprehensive LossNOTE 16. OTHER COMPREHENSIVE INCOME (LOSS)earningsincome (loss) and the related tax effects:In millions Before
Tax
Amount Tax
(Provision)
Benefit After
Tax
Amount $ 14 $ (4 ) $ 10 95 (9 ) 86 2 (1 ) 1 (2 ) 1 (1 ) — — — 81 (25 ) 56 25 (6 ) 19 106 (31 ) 75 215 (44 ) 171 14 — 14 $ 229 $ (44 ) $ 185 $ (643 ) $ 225 $ (418 ) (312 ) 23 (289 ) 1 — 1 (2 ) — (2 ) (1 ) — (1 ) (92 ) 25 (67 ) (5 ) 2 (3 ) (97 ) 27 (70 ) (1,053 ) 275 (778 ) (37 ) 1 (36 ) $ (1,090 ) $ 276 $ (814 ) $ 225 $ (92 ) $ 133 138 (28 ) 110 3 (1 ) 2 (1 ) — (1 ) 2 (1 ) 1 19 (7 ) 12 (26 ) 9 (17 ) (7 ) 2 (5 ) 358 (119 ) 239 19 (1 ) 18 $ 377 $ (120 ) $ 257
CUMMINS INC. AND CONSOLIDATED SUBSIDIARIESWe calculate basic earnings per share (EPS) of common stock by dividing net earnings by the weighted-average number of common shares outstanding for the period. The calculation of diluted EPS reflects the potential dilution that occurs if options or securities are exercised or debt is converted into common stock and the effect of the exercise or conversion reduces EPS. We exclude shares of common stock held in the Employee Benefits Trust (see Note 16) from the calculation of the weighted-average common shares outstanding until those shares are distributed from the Employee Benefits Trust to the RSP. Following is a reconciliation of net earnings and weighted-average common shares outstanding for purposes of calculating basic and diluted earnings per share:
December 31
(except shares and per share amounts)The weighted-average diluted common shares outstanding for 2004 excludes the effect of approximately 0.3 million common stock options since such options have an exercise price in excess of the average market value of our common stock during those years. In 2005 and 2006, the average market value of our common stock was greater than the exercise price of our common stock options and therefore no options were excluded from our calculation of the weighted-average diluted shares outstanding.CUMMINS INC. AND CONSOLIDATED SUBSIDIARIESNOTES TO CONSOLIDATED FINANCIAL STATEMENTS (Continued)NOTE 18. DERIVATIVES AND OTHER FINANCIAL INSTRUMENTSWe are exposed to financial risk resulting from volatility in foreign exchange rates, interest rates and commodity prices. This risk is closely monitored and managed through the use of financial derivative instruments including commodity forward contracts, currency forward contracts and interest rate swaps. As stated in our policies and procedures, financial derivatives are used expressly for hedging purposes, and under no circumstances are they used for speculation purposes. Our hedging transactions are entered into with banking institutions that have strong credit ratings, and thus the credit risk associated with these contracts is not considered significant. The results and status of our hedging transactions are reported to senior management on a monthly and quarterly basis. The following table summarizes our outstanding derivatives by risk category and instrument type:Foreign Currency Exchange Rate RisksAs a result of our international business presence, we are exposed to foreign currency exchange risks. We transact business in foreign currencies and, as a result, our earnings experience some volatility related to movements in foreign currency exchange rates. To help manage our exposure to exchange rate volatility, we use foreign exchange forward contracts on a regular basis to hedge forecasted intercompany and third-party sales and purchases denominated in non-functional currencies. These foreign currency forward contracts are designated and qualify as foreign currency cash flow hedges under SFAS No. 133, “Accounting for Derivative Instruments and Hedging Activities” (SFAS 133), and are recorded in the Consolidated Balance Sheets at fair value in “Other current assets” and “Other accrued expenses.” The effective portion of the unrealized gain or loss on the forward contract is deferred and reported as a component of “Accumulated other comprehensive loss.” When the hedged forecasted transaction (sale or purchase) occurs, the unrealized gain or loss is reclassified into earnings in the same line item associated with the hedged transaction in the same period or periods during which the hedged transaction affects earnings. For the year ended December 31, 2006, gains of $7 million were reclassified from “Accumulated other comprehensive loss” to earnings. The amount of gain reclassified for the year ended December 31, 2005, was $6 million. The ineffective portion of the hedge, unrealized gain or loss, if any, is recognized in current earnings during the period of change. As of December 31, 2006, $1 million of unrealized gains, net of tax, were included in “Accumulated other comprehensive loss” in the Consolidated Balance Sheets and are expected to be reclassified to earnings over the next twelve months. As of December 31, 2005, $4 million of deferred losses, net of tax, were included in “Accumulated other comprehensive loss” in the Consolidated Balance Sheets. For the years ended December 31, 2006 and 2005, there were no circumstances that would have resulted in the discontinuance of a cash flow hedge.CUMMINS INC. AND CONSOLIDATED SUBSIDIARIESNOTES TO CONSOLIDATED FINANCIAL STATEMENTS (Continued)Our internal policy allows for managing anticipated foreign currency cash flow for up to one year. As of December 31, 2006, approximately 99 percent of the notional amount of the forward contracts shown in the table above was attributable to five currencies, the British Pound (68 percent), the Indian Rupee (20 percent), the Mexican Peso (7 percent), the Euro (2 percent) and the Australian Dollar (2 percent). As of December 31, 2005, approximately 95 percent of the notional amount of the forward contracts shown in the table above was attributable to five currencies, the British Pound (41 percent), the Euro (19 percent), the Australian Dollar (16 percent), the Mexican Peso (13 percent) and the Indian Rupee (6 percent).To minimize the earnings volatility resulting from the remeasurement of receivables and payables denominated in foreign currency, we enter into foreign currency forward contracts. The objective is to offset the gain or loss from remeasurement with the fair market valuation of the forward contract. These derivative instruments are not designated as hedges under SFAS 133.We are exposed to market risk from fluctuations in interest rates. We manage our exposure to interest rate fluctuations through the use of interest rate swaps. The objective of the swaps is to more effectively balance our borrowing costs and interest rate risk. Currently, we have one interest rate swap outstanding.In November 2005, we entered into an interest rate swap to effectively convert our $250 million, due in 2028 debt from a fixed rate of 7.125% to a floating rate based on a LIBOR spread. The terms of the swap mirror those of the debt, with interest paid semi-annually. This swap qualifies as a fair value hedge under SFAS 133.In November 2002, we terminated an interest rate swap relating to our 6.45% notes that matured in 2005. The swap acted as a fair value hedge and converted $225 million notional amount from fixed rate debt into floating rate debt that matured in 2005. The termination of the swap resulted in a $12 million gain. The gain was amortized to earnings as a reduction of interest expense over the remaining life of the debt. The amount of gain recognized during 2005 and 2004 was $1 million and $5 million, respectively. As of December 31, 2005, there was no longer any deferred gain remaining on our Consolidated Balance Sheets.We have equity method investees, whose financial results are not consolidated, that have entered into floating-to-fixed interest rate swap agreements. The swaps have been designated and qualify as cash flow hedges under SFAS 133. We record our share of the gain or loss on these instruments in “Accumulated other comprehensive loss.” As of December 31, 2006, the gains and losses related to these swaps were not material.We are exposed to fluctuations in commodity prices due to contractual agreements with component suppliers. In order to protect ourselves against future price volatility and, consequently, fluctuations in gross margins, we periodically enter into commodity forward contracts with designated banks to fix the cost of certain raw material purchases with the objective of minimizing changes in inventory cost due to market price fluctuations. The forward contracts are derivative contracts that are designated as cash flow hedges under SFAS 133 and are recorded in the Consolidated Balance Sheets at fair value in “Other current assets”, “Other assets”, and “Other accrued expenses.” The effective portion of the unrealized gain or loss is deferred and reported as a component of “Accumulated other comprehensive loss.” When the hedged forecasted transaction (purchase) occurs, the unrealized gain or loss is reclassified into earnings in theCUMMINS INC. AND CONSOLIDATED SUBSIDIARIESNOTES TO CONSOLIDATED FINANCIAL STATEMENTS (Continued)same line item associated with the hedged transaction in the same period or periods during which the hedged transaction affects earnings. For the year ended December 31, 2006, gains of $18 million were reclassified from “Accumulated other comprehensive loss” to earnings. Amounts reclassified from “Accumulated other comprehensive loss” to earnings were not material for the year ended December 31, 2005. The ineffective portion of the hedge, if any, is recognized in current earnings in the period in which the ineffectiveness occurs. As of December 31, 2006 and 2005, unrealized gains, net of tax, related to commodity forward contracts were $7 million and $5 million, respectively. During 2007 we expect to reclassify net gains of $8 million from “Accumulated other comprehensive loss” to earnings.Our internal policy allows for managing these cash flow hedges for up to three years. For the year ended December 31, 2006, there were no circumstances that would have resulted in the discontinuance of a cash flow hedge.Fair Value of Financial InstrumentsBased on borrowing rates currently available to us for bank loans with similar terms and average maturities, the fair value of total debt, including current maturities, at December 31, 2006, was approximately $799 million. The carrying value at that date was $811 million. At December 31, 2005, the fair and carrying values of total debt, including current maturities, were $1,677 million and $1,367 million, respectively. The carrying values of all other receivables and liabilities approximated fair values.NOTE 19. STOCK INCENTIVE AND STOCK OPTION PLANS., which replaced and succeeded the 1993 Stock Incentive Plan. The Plan, as amended February 2009, allows for the granting of up to 2.5$13.5 million stock-based awards to executives and employees, of which one-half must be in the form of stock options. Awards available for grant under the plan include, but are not limited to, stock options, stock appreciation rights, performance shares, restricted stock and other stock awards.performanceoptions granted through the KESIP program are considered awards under The Plan and are vested immediately. Compensation expense for stock options granted through the KESIP program is recorded based on the fair value of each option grant using the Black-Scholes option pricing model.Under the stock incentive plan, restricted Restricted common stock is awarded from time to time at no cost to certain employees. Participants are entitled to cash dividends and voting rights. Restrictions limit the sale or transfer of the shares during a defined period. Generally, one-third of the shares are released after two years and one-third of the shares issued are released each year thereafter on the anniversary of the grant date, provided the participant remains an employee. Compensation expense is determined at the grant date and is recognized over the four-year restriction period on a straight-line basis.Prior to January 1, 2006, we accounted for stock-based employee awards granted on or after January 1, 2003, utilizing the fair value method preferred by SFAS No. 123, “Accounting for Stock-Based Compensation.” For awards granted prior to January 1, 2003, we applied the disclosure-only provisions of SFAS No. 123. In accordance with SFAS No. 123, we applied APB Opinion No. 25, “Accounting for StockCUMMINS INC. AND CONSOLIDATED SUBSIDIARIESNOTES TO CONSOLIDATED FINANCIAL STATEMENTS (Continued)Issued to Employees” and related interpretations in accounting for our plans prior to January 1, 2003 and accordingly, did not recognize compensation expense for these plans because we granted options at exercise prices equal to the market value of our stock on the grant date.Effective January 1, 2006, we adopted SFAS No. 123R, “Share-Based Payment,” which revised SFAS No. 123 and supercedes APB No. 25. We adopted this statement using the modified prospective transition method which does not require the restatement of prior periods. SFAS No. 123R requires the recognition of expense for share-based payments to be recorded in the consolidated financial statements based on the grant date fair value and to be recognized over their vesting periods. Under SFAS No. 123R, we are required to select a valuation technique or option-pricing model that meets the requirements of the standard. Allowable valuation models include a binomial model and the Black-Scholes model. At the present time, we are continuing to use the Black-Scholes model. Since we had previously accounted for our awards at fair value under SFAS No. 123, the impact of adopting SFAS No. 123R was not material to our Consolidated Financial Statements. The two most significant changes related to accounting for forfeitures and accounting for tax benefits of awards. SFAS No. 123R requires us to estimate forfeitures in calculating the expense relating to share-based compensation as opposed to recognizing these forfeitures and the corresponding reduction in expense as they occur. The cumulative adjustment we recorded upon the adoption of SFAS No. 123R for the estimated forfeitures on grants outstanding on the date of adoption was not material. Excess tax benefits related to share-based compensation are now classified as a financing activity in the statement of cash flows rather than an operating activity. For the year ended December 31, 2006, we had $6 million of excess tax benefits related to share-based compensation presented in our Consolidated Statement of Cash Flows as a financing activity.2006,2009, 2008 and 2007 was approximately $18 million. Compensation expense (net of actual forfeitures) related to our share-based plans for the years ended December 31, 2005$20 million, $28 million and 2004, was approximately $16$28 million, in each year.respectively. The excess tax deficiency/benefit associated with our share-based plans for the years ended December 31, 2006, 20052009, 2008 and 2004,2007, was $6$(1) million, $7$13 million and $27$11 million, respectively. The total unrecognized compensation expense (net of estimated forfeitures) related to nonvested awards was approximately $32$6 million at December 31, 20062009, and was expected to be recognized over a weighted-average period of 1.5 years.less than one year.
CUMMINS INC. AND CONSOLIDATED SUBSIDIARIES
Exercise Price Options Weighted-average
Exercise Price Weighted-average
Remaining
Contractual
Life
(in years) Aggregate
Intrinsic
Value 831,760 $ 10.91 21,000 49.42 (235,310 ) 11.73 (69,700 ) 10.11 (15,000 ) 13.25 532,750 $ 12.10 105,350 27.34 (188,120 ) 11.21 (5,400 ) 9.93 (4,500 ) 13.92 440,080 $ 16.14 598,510 25.31 (117,830 ) 14.66 (3,530 ) 25.05 (20,400 ) 10.63 896,830 $ 22.55 7.41 $ 21,520,928 532,750 $ 12.10 3.44 $ 27,480,505 440,080 $ 16.14 4.50 $ 5,529,723 376,450 $ 18.50 4.82 $ 10,709,436 2006, 20052009, 2008 and 2004,2007, was $105.24, $70.24$10.57, $12.38 and $53.84,$14.75, respectively. The total intrinsic value of options exercised during the years ended December 31, 2006, 20052009, 2008 and 2004,2007, was approximately $14$3 million, $34$9 million and $77$9 million, respectively.
CUMMINS INC. AND CONSOLIDATED SUBSIDIARIES
Shares
average
Fair Value Performance Shares Restricted Shares Shares Weighted-average
Fair Value Shares Weighted-average
Fair Value 2,545,180 $ 17.80 204,000 $ 26.80 597,240 38.21 4,800 42.61 (1,063,160 ) 12.56 — — (4,624 ) 27.10 — — 2,074,636 $ 26.34 208,800 $ 27.16 1,038,842 34.95 — — (842,300 ) 19.08 (70,670 ) 26.49 (64,692 ) 32.56 — — 2,206,486 $ 32.98 138,130 $ 27.51 440,168 31.67 — — (1,382,720 ) 25.34 (68,264 ) 27.33 (50,548 ) 47.40 — — 1,213,386 $ 40.63 69,866 $ 27.68
Shares
average
Fair Value118CUMMINS INC. AND CONSOLIDATED SUBSIDIARIESNOTES TO CONSOLIDATED FINANCIAL STATEMENTS (Continued) Years ended December 31, 2009 2008 2007 5 7 7 2.55 % 3.2 % 4.4 % 50.55 % 49.6 % 24.0 % 1.5 % 1.3 % 1.5 % life—life—The expected life of employee stock options represents the weighted-average period the stock options are expected to remain outstanding based upon our historical data.rate—rate—The risk-free interest rate assumption is based upon the observed U.S. treasury security rate appropriate for the expected life of our employee stock options.volatility—volatility—The expected volatility assumption is based upon the weighted-average historical daily price changes of our common stock over the most recent period equal to the expected option life of the grant, adjusted for activity which is not expected to occur in the future.yield—yield—The dividend yield assumption is based on our history and expectation of dividend payouts.The table below summarizes stock option information for options outstanding, allTable of which are currently exercisable at December 31, 2006:
Options
Remaining
Contractual Life
Exercise Price
Intrinsic ValueWe lease certain manufacturing equipment, facilities, warehouses, office space and equipment, aircraft and automobiles for varying periods under lease agreements. Most of the leases are non-cancelable operating leases with fixed rental payments, expire over the next ten years and contain renewal provisions. Rent expense under these leases approximated $98 million, $91 million and $79 million in 2006, 2005 and 2004, respectively.CONSOLIDATED SUBSIDIARIESFollowing is a summaryNOTE 18. NONCONTROLLING INTERESTS December 31, In millions 2009 2008 $ 185 $ 157 36 31 26 58 $ 247 $ 246 future minimum lease payments under capitalweighted-average common shares outstanding until those shares are distributed from the EBT to the RSP. Following are the computations for basic and operating leases,diluted earnings per share: Years ended December 31, Dollars in millions, except per share amounts 2009 2008 2007 $ 428 $ 755 $ 739 197,445,998 194,958,370 198,443,501 249,126 1,572,178 1,454,153 197,695,124 196,530,548 199,897,654 $ 2.17 $ 3.87 $ 3.72 2.16 3.84 3.70 leasesforeign currency forward contracts, commodity swap contracts and interest rate swaps. As stated in our rental business discussed below, with termspolicies and procedures, financial derivatives are used expressly formore than one year at December 31, 2006, together withContents
CUMMINS INC. AND SUBSIDIARIES net present value of the minimum payments under capital leases:In addition, we have subleased certain of the facilities under operating lease to third parties. The future minimum lease payments due from lessees under those arrangements are $1 million in 2007, $1 million in 2008, $1 million in 2009, $1 million in 2010 and zero in 2011.
Foreign Exchange RatesIn July 2006, we amended and extended the lease on our corporate headquarters facility to 2019. As a result of our international business presence, we are exposed to foreign currency exchange risks. We transact business in foreign currencies and, as a result our income experiences some volatility related to movements in foreign currency exchange rates. To help manage our exposure to exchange rate volatility, we use foreign exchange forward contracts on a regular basis to hedge forecasted intercompany and third-party sales and purchases denominated in non-functional currencies. Our internal policy allows for managing anticipated foreign currency cash flow for up to one year. These foreign currency forward contracts are designated and qualify as foreign currency cash flow hedges under GAAP. The effective portion of the unrealized gain or loss on the forward contract is deferred and reported as a component of "Accumulated other comprehensive loss" (AOCL). When the hedged forecasted transaction (sale or purchase) occurs, the unrealized gain or loss is reclassified into income in the same line item associated with the hedged transaction in the same period or periods during which the hedged transaction affects income. The ineffective portion of the hedge, unrealized gain or loss, if any, is recognized in current income during the period of change. As of December 31, 2009, the amount expected to be reclassified to income over the next year is not material. For the years ended December 31, 2009 and 2008, there were no circumstances that would have resulted in the discontinuance of a cash flow hedge.extension,table represent 93 percent of the notional amounts of contracts outstanding as of December 31, 2009.Currency Denomination In millions
CurrencyDecember 31, 2009 107 70 12 15 616 1,335 44
CUMMINS INC. AND SUBSIDIARIESrequiredno longer probable. The amount reclassified to re-evaluate the classificationincome as a result of this lease. Basedaction was a loss of $4 million. For the year ended December 31, 2008, there were no material circumstances that would have resulted in the discontinuance of a cash flow hedge. Our internal policy allows for managing these cash flow hedges for up to three years. December 31, 2009 Dollars in millions
Commodity Notional Amount Quantity $ 77 11,372 metric tons(1) 14 15,986 troy ounces(2) 1 3,161 troy ounces(2) thea LIBOR spread. The terms of the extension,swap mirror those of the debt, with interest paid semi-annually. This swap qualifies as a fair value hedge under GAAP. The gain or loss on this lease is nowderivative instrument as well as the offsetting gain
CUMMINS INC. AND SUBSIDIARIES December 31, 2009 In millions
Income Statement Classification Gain/(Loss)
on Swaps Gain/(Loss)
on Borrowings $ (54 ) $ 54 a capital lease.cash flow hedges for the year ended December 31, 2009. The tables do not include amounts related to ineffectiveness as it was not material for the periods presented. For the year ended December 31, 2009 In millions
Derivatives in Cash Flow Hedging
Relationships Amount of Gain/(Loss)
Recognized in AOCL on
Derivative (Effective
Portion) Amount of Gain/(Loss)
Reclassified from AOCL
into Income (Effective
Portion) Location of Gain/(Loss)
Reclassified into Income
(Effective Portion) $ 7 $ (1 ) Sales 74 (24 ) Cost of sales $ 81 $ (25 )
Derivatives Not Designated as Hedging InstrumentsA significant portion The following table summarizes the location and amounts of the equipmentgains and losses in our rental businessConsolidated Statements of Income for derivative instruments that are not classified as hedges for the year ended December 31, 2009.In millions
Derivatives Not Designated as Hedging
Instruments Location of Gain/(Loss) Recognized
in Income on Derivatives Amount of Gain/(Loss)
Recognized in
Income on Derivatives Cost of sales $ 2 Other (expense) income, net 12
CUMMINS INC. AND SUBSIDIARIES
Fair Value Amount and Location of Derivative Instruments Derivative assets Fair Value In millions December 31, 2009 Balance Sheet Location $ — 9 Prepaid expenses and other current assets 8 Other assets 25 Other assets $ 42
$
42 Derivative liabilities Fair Value In millions December 31, 2009 Balance Sheet Location $ 1 Other accrued expenses — $ 1 $ — $ —
$
1
CUMMINS INC. AND SUBSIDIARIESfinanced under capital leases. Duringnot transferred to the third quarterfinancial institution are included in "Receivables, net" on ourConsolidated Balance Sheets. The maximum interest in sold receivables that can be outstanding at any point in time is limited to the lesser of 2006, we extended a lease relating to a portion of our rental business by six years. The lease was set to expire on September 30, 2006. Instead of paying a balloon payment of approximately $42$400 million on September 30, 2006,or the amount has been financed overof eligible receivables held by CTR. There are no provisions in this agreement that require us to maintain a six year term at a fixed rate. In addition to extending this lease, we reduced the interest rate by approximately 2 percentage points. During the fourth quarter of 2006, we refinanced a lease relating to another portion of our rental business. Underminimum investment credit rating; however, the terms of the agreement which is effectivecontain the same financial covenants as of January 1, 2007, the new lease has a six year term with a fixed rate that is approximately 2 percentage points lower than the existing lease. The total amount refinanced was approximately $28 million. These two leases are with two different lessors. Under each lease we are permitted to prepay, subject to certain conditions, the outstanding balance under the lease for the principal amount outstanding plus a prepayment penalty. For each of these leases we have the option to purchase the equipment at the end of the lease term for one dollar. The equipment under these leases is capitalized and amortized over its estimated useful life.our revolving credit facility (see Note 10). As of December 31, 2006 and 2005, we had outstanding capital leases2009, the amount available under this program was $154 million. As of $69December 31, 2009 and 2008, there were no amounts outstanding under this program. As of and for the years ended
December 31, In millions 2009 2008 2007 $ 806 $ 652 $ 759 5,424 6,694 6,615 5,270 6,801 6,575 3 1 1 $82subsequently purchased the remaining interest in CDC for $61 million, respectively. Future lease payments, including repurchase obligations,however, because the transactions were entered into simultaneously with the same counterparty, it is considered a non-monetary exchange for accounting purposes. Thus, we accounted for the transactions at fair value in accordance with GAAP accounting for exchanges of nonmonetary assets. Because fair value and book value were reasonably close, there was no material gain or loss recorded on the sale of EEA. In addition, there were no significant adjustments from book value for any assets or liabilities of CDC recorded upon the acquisition of the remaining 50 percent interest.
CUMMINS INC. AND SUBSIDIARIESeach leasethe equity method of accounting that are included indeemed VIEs and are subject to the table above.provisions of GAAP accounting for variable interest entities.Sale and Leaseback TransactionsIn During 2001, we entered into a sale-leaseback agreement whereby we sold and leased backtransaction with a financial institution with regard to certain heavy-duty engine manufacturing equipment fromequipment. The accounting for the original sale-leaseback transaction is discussed in Note 14. The financial institution created a grantor trust wholly-ownedto act as the lessor in the arrangement. The financial institution owns 100 percent of the equity in the trust. The grantor trust has no assets other than the equipment and its rights to the lease agreement with us. On the initial sale, we received $125 million from the financial institution which was financed with $99 million of non-recourse debt and $26 million of equity. Our obligations to the grantor trust consist of the payments due under the lease and a $9 million guarantee of the residual value of the equipment. In addition, we had a fixed price purchase option that was exercisable on January 14, 2009, for approximately $35 million; however, we decided not to exercise this option as discussed in Note 14.financial institution.significant amount of their sales is eliminated in consolidation. The lease was classifiedtable below shows the amount of assets and liabilities from CKEC included in our consolidated results, after eliminating intercompany items, as an operating leaseof December 31, 2009:In millions $ 9 10 3 lease termmajority of 11.5 years, expiring June 28, 2013,the entity's expected losses. Our ownership percentage in these entities ranges from 30 percent to 36 percent. For both of these entities, our equity ownership represents our only variable interest in the entity and thus we would not be deemed the primary beneficiary.
CUMMINS INC. AND CONSOLIDATED SUBSIDIARIESincludes an early buyout purchase option on January 14, 2009.NOTE 23. VARIABLE INTEREST ENTITIES (Continued)early buyout option can be exercised for approximately $35 million, or 28 percentprincipal business of the equipment’s fair market value at the inception of the lease. If we do not exercise the option, we are obligateddistributors is to purchase insurance that insures the equipment’s residual value. At the end of the lease term, we are obligated to pay the difference, if any, between the equipment’s guaranteed residual valuesell Cummins engines and its fair market value.The lease agreement includes certain default provisions requiring us to make timely rent payments, maintain,related service parts as well as provide repair and insure the equipment, procure residualmaintenance services on engines, including warranty repairs. Our maximum potential loss related to these distributors as of December 31, 2009, consisted of our ownership interest totaling $21 million. In addition, under certain circumstances, we could be required to repurchase certain assets of these distributors at amounts approximating fair value insurance and maintain minimum debt ratings for our long-term senior unsecured debt obligations.In December 2003, the grantor trust which acts as the lessor in the sale and leaseback transaction described above was consolidated due to the adoption of FIN 46R. A description of the entity consolidated and the impact of adopting FIN 46R are described in Note 2. As a result of the consolidation, the manufacturing equipment and the trust’s obligations under its non-recourse debt arrangement are included in our Consolidated Balance Sheets as property, plant and equipment and long-term debt, respectively. The non-recourse debt arrangement is more fully discussed in Note 11. In addition, our Consolidated Statements of Earnings includes interest expense on the lessor’s debt obligations and depreciation expense on the manufacturing equipment rather than rent expense under the lease agreement. The amount of interest expense14. Our involvement with these distributors as equity holders began in 2006, 2005 and 20042003. Selected financial information for these distributors as of and for the year ended December 31, 2009, is as follows:In millions $ 154 79 378 43 $5 million, $6 millionan engine manufacturing entity jointly owned 50/50 by us and $7 million, respectively. The amountour equity partners. In 2006, 2007 and the first six months of depreciation expense2008, we consolidated this entity under GAAP due to the pricing arrangements on purchases from CDC and the substantial volume of purchases we made. In July 2008, we purchased the remaining 50 percent of CDC as discussed in 2006, 2005Note 22 and 2004 was $17 million, $14 million and $11 million, respectively.we now own 100 percent of the voting interest. As a result, variable interest entity accounting under GAAP no longer applies to this entity. Years ended
December 31, In millions 2009 2008 2007 $ (20 ) $ (46 ) $ 28 (14 ) (12 ) (12 ) (4 ) (36 ) — 5 6 5 18 18 12 $ (15 ) $ (70 ) $ 33
CUMMINS INC. AND SUBSIDIARIES21.25. OPERATING SEGMENTSSFAS No. 131, “Disclosures about Segments of an Enterprise and Related Information,” set standards for reporting information regarding operating segments in financial statements. Operating segments under GAAP are defined as components of an enterprise about which separate financial information is available that is evaluated regularly by the chief operating decision-maker, or decision makingdecision-making group, in deciding how to allocate resources and in assessing performance. Cummins chief operating decision-maker (CODM) is the Chief Executive Officer.serves. This type of reporting structureserves and allows management to focus its efforts on providing enhanced service to a wide range of customers. The Engine segment produces engines and parts for sale to customers in on-highway and various industrial markets. The engines are used in trucks of all sizes, buses and recreational vehicles, as well as various industrial applications including construction, mining, agriculture, marine, oil and gas, rail and military. The Power Generation segment is an integrated provider of power systems sellingwhich sells engines, generator sets and alternators and providing rental ofrents power equipment for both standby and prime power uses. The Components segment includes sales of filtration products, exhaust and aftertreatment systems, turbochargers and fuel systems. The Distribution segment includes wholly-owned and partially-owned distributorships engaged in wholesaling engines, generator sets, and service parts, as well as performing service and repair activities on our products and maintaining relationships with various original equipment manufacturers.minoritynoncontrolling interests) as a primary basis for the CODM to evaluate the performance of each of our operating segments. Segment amounts exclude certain expenses not specifically identifiable to segments.CUMMINS INC. AND CONSOLIDATED SUBSIDIARIESNOTES TO CONSOLIDATED FINANCIAL STATEMENTS (Continued)minimum pension liabilitiesrestructuring and other charges, investment gains or losses, flood damage gains or losses or income taxes to individual segments. Segment EBIT may not be consistent with measures used by other companies.We made certain leadership changes effective May 2, 2005, within our management team. In connection with these changes, certain modifications were made to our internal reporting. These modifications are summarized below:· The Filtration and Other segment was renamed the Components segment and now includes operating results of the fuel systems business which were previously included in the Engine segment. Historically, the fuel systems business transferred product within the Engine segment at cost. Beginning in the third quarter of 2005, those transfers now use a cost-plus based transfer price. As a result of this change, segment EBIT increased for the Components segment and decreased for the Engine segment but there was no impact to consolidated earnings. Revenues of the Components segment were also increased to reflect transfers to the Engine segment and eliminations were increased by a corresponding amount.· The North American distribution business was combined with the International Distribution segment and renamed the Distribution segment. Previously, the North American distribution business was reported in the Engine and Power Generation segments as equity from investees and included the results of a partially-owned distributor that is consolidated. As a result, revenues of the Engine segment were increased to reflect sales to the consolidated distributor that were previously eliminated and decreased for the revenues of the consolidated distributor which are now included in the Distribution segment. In addition, this change also caused earnings from equity investees in the Engine and Power Generation segments to decrease while earnings from equity investees in the Distribution segment increased by a corresponding amount.
CUMMINS INC. AND CONSOLIDATED SUBSIDIARIES
Generation
items(1)In millions Engine Power
Generation Components Distribution Non-segment
items(1) Total $ 5,582 $ 1,879 $ 1,562 $ 1,777 $ — $ 10,800 823 538 793 7 (2,161 ) — 6,405 2,417 2,355 1,784 (2,161 ) 10,800 185 49 73 17 — 324 241 33 88 — — 362 54 22 13 125 — 214 — — — — 99 99 3 3 1 1 — 8 252 167 95 235 (74 ) 675 2,136 1,114 1,286 686 — 5,222 261 50 91 172 — 574 207 34 59 10 — 310 $ 7,432 $ 2,601 $ 2,154 $ 2,155 $ — $ 14,342 1,378 899 998 9 (3,284 ) — 8,810 3,500 3,152 2,164 (3,284 ) 14,342 180 41 65 25 — 311 286 41 95 — — 422 99 23 14 117 — 253 — — — — 37 37 10 3 3 2 — 18 535 376 169 242 (102 ) 1,220 1,623 1,024 1,295 678 — 4,620 287 52 91 158 — 588 331 57 139 16 — 543 $ 7,129 $ 2,375 $ 2,007 $ 1,537 $ — $ 13,048 1,053 685 925 3 (2,666 ) — 8,182 3,060 2,932 1,540 (2,666 ) 13,048 176 42 59 11 — 288 222 34 73 — — 329 92 17 4 92 — 205 26 6 3 1 — 36 589 334 153 187 (36 ) 1,227 1,727 931 1,270 506 — 4,434 327 24 51 112 — 514 189 51 99 14 — 353
CUMMINS INC. AND SUBSIDIARIESthe ourConsolidated Financial Statements is shown in the table below: Years ended December 31, In millions 2009 2008 2007 $ 675 $ 1,220 $ 1,227 35 42 58 $ 640 $ 1,178 $ 1,169 December 31, In millions 2009 2008 2007 $ 5,222 $ 4,620 $ 4,434 4,018 4,186 3,759 (1,180 ) (1,150 ) (570 ) 731 838 546 25 25 26 $ 8,816 $ 8,519 $ 8,195
CUMMINS INC. AND CONSOLIDATED SUBSIDIARIES Years ended and as of
December 31, In millions 2009 2008 2007 $ 5,141 $ 5,817 $ 6,007 630 783 603 596 866 649 592 702 619 406 692 621 327 619 405 240 377 342 2,868 4,486 3,802 $ 10,800 $ 14,342 $ 13,048 $ 1,811 $ 1,764 $ 1,677 322 342 170 188 177 289 134 114 105 125 124 122 54 55 44 27 26 31 125 128 132 $ 2,786 $ 2,730 $ 2,570 Our largest customer is DaimlerChrysler. Worldwide sales to this customer were $1.2 billion in 2006, $1.2 billion in 2005 and $1.1 billion in 2004 representing 10 percent, 12 percent, and 13 percent, respectively,Table of consolidated net sales. No other customer accounted for more than 10 percent of consolidated net sales.Contents124
UNAUDITED
Quarter
Quarter
Quarter
Quarter First
Quarter Second
Quarter Third
Quarter Fourth
Quarter In millions, except per share amounts 2009 $ 2,439 $ 2,431 $ 2,530 $ 3,400 445 448 503 773 7 56 95 270 $ 0.04 $ 0.28 $ 0.48 $ 1.36 0.04 0.28 0.48 1.36 0.175 0.175 0.175 0.175 $ 31.77 $ 37.40 $ 48.71 $ 51.65 18.34 23.99 31.32 41.51 2008 $ 3,474 $ 3,887 $ 3,693 $ 3,288 707 879 820 534 190 293 229 43 $ 0.97 $ 1.50 $ 1.18 $ 0.22 0.97 1.49 1.17 0.22 0.125 0.125 0.175 0.175 $ 64.17 $ 75.09 $ 75.98 $ 45.63 38.11 46.10 44.05 17.70 (a)2006,2009, there were approximately 3,5083,850 holders of record of Cummins Inc.’s's $2.50 par value common stock.
Changes in Internal Control over Financial Reporting
Management's Report on Internal Control Over Financial ReportingPlan Category Number of securities to
be issued upon exercise
of outstanding options,
warrants and rights(1) Weighted-average
exercise price of
outstanding options,
warrants and rights(2) Number of securities remaining
available for future issuance
under equity compensation plans
(excluding securities reflected
in the first column)(3) 2,180,082 $ 22.55 5,932,475 — $ — — 2,180,082 $ 22.55 5,932,475 Exhibit No. Description of Exhibit 3(a) Restated Articles of Incorporation, as amended (incorporated by reference to Exhibit 3(a) to Cummins Inc.'s Quarterly Report on Form 10-Q for the quarter ended June 28, 2009).
3(b)
By-laws, as amended and restated effective as of July 14, 2009 (incorporated by reference to Exhibit 3.1 to Cummins Inc.'s Current Report on Form 8-K dated July 17, 2009).10(a) # 2003 Stock Incentive Plan (filed herewith). 10(b) # Target Bonus Plan (filed herewith). 10(c) # Deferred Compensation Plan (filed herewith). 10(d) # Supplemental Life Insurance and Deferred Income Plan (filed herewith).
10(e)
Three Year Revolving Credit Agreement, dated June 30, 2008, among Cummins Inc., Cummins Ltd., Cummins Power Generation Ltd., Cummins Generator Technologies Limited, certain subsidiaries referred to therein and the Lenders party thereto (incorporated by reference to Exhibit 10 to Cummins Inc.'s Quarterly Report on Form 10-Q for the quarter ended June 29, 2008).10(f) # Deferred Compensation Plan for Non-Employee Directors (filed herewith). 10(g) # Excess Benefit Retirement Plan (filed herewith). 10(h) # Employee Stock Purchase Plan (filed herewith). 10(i) # Longer Term Performance Plan (filed herewith). 10(j) # 2006 Executive Retention Plan (incorporated by reference to Exhibit 10(o) to Cummins Inc.'s Annual Report on Form 10-K for the year ended December 31, 2005). 10(k) # Senior Executive Target Bonus Plan (filed herewith). 10(l) # Senior Executive Longer Term Performance Plan (filed herewith). 10(m) # Form of Stock Option Agreement under the 2003 Stock Incentive Plan (filed herewith) 10(n) # Form of Performance Share Award Agreement under the 2003 Stock Incentive Plan (filed herewith).
12
Calculation of Ratio of Earnings to Fixed Charges (filed herewith).Exhibit No. Description of Exhibit
21
Subsidiaries of the Registrant (filed herewith).
23
Consent of PricewaterhouseCoopers LLP (filed herewith).
24
Powers of Attorney (filed herewith).
31(a)
Certification Pursuant to Section 302 of the Sarbanes-Oxley Act of 2002 (filed herewith).
31(b)
Certification Pursuant to Section 302 of the Sarbanes-Oxley Act of 2002 (filed herewith).
32
Certifications Pursuant to Section 906 of the Sarbanes-Oxley Act of 2002 (filed herewith).
101.INS XBRL
Instance Document
101.SCH XBRL
Taxonomy Extension Schema Document
101.CAL XBRL
Taxonomy Extension Calculation Linkbase Document
101.DEF XBRL
Taxonomy Extension Definition Linkbase Document
101.LAB XBRL
Taxonomy Extension Label Linkbase Document
101.PRE XBRL
Taxonomy Extension Presentation Linkbase DocumentCUMMINS INC.By:/s/ JEAN S. BLACKWELLBy:/s/ MARSHA L. HUNT
By:Jean S. BlackwellMarsha L. Hunt
/s/ PATRICK J. WARD
Patrick J. WardExecutive Vice President and
Chief Financial Officer
(Principal Financial Officer)
By:
/s/ MARSHA L. HUNT
Marsha L. Hunt
Vice President—Corporate Controller
(Principal Accounting Officer)
Date: February 25, 2010Date: February 26, 2007and on the dates indicated.as of this February 25, 2010.SignaturesTitleDate*
Theodore M. SolsoFebruary 26, 2007Theodore M. SolsoFebruary 25, 2010 *
/s/ PATRICK J. WARD
Patrick J. WardDirector,
Vice President and Chief Operating
February 26, 2007F. Joseph Loughrey
/s/ MARSHA L. HUNT
Marsha L. HuntOfficer
Vice President—Corporate Controller (Principal Accounting Officer)
February 25, 2010
*
Robert J. Bernhard
Director
February 26, 2007
*
Franklin R. Chang-Diaz
Director
February 25, 2010
*
Robert J. Darnall
Director
February 25, 2010
*
Robert K. Herdman
Director
February 26, 200725, 2010SignaturesTitleDateJohn M. DeutchDirectorFebruary 26, 2007Carl Ware*DirectorFebruary 26, 2007
Alexis M. HermanDirector February 25, 2010
*
N. Thomas Linebarger
Director
February 26, 2007
*
William I. Miller
Director
February 25, 2010
*DirectorFebruary 26, 2007
Georgia R. Nelson
Director
February 25, 2010
*
Carl Ware
Director
February 26, 2007J. Lawrence Wilson
By:By:
/s/ JEAN S. BLACKWELLJean S. BlackwellPatrick J. Ward
Attorney-in-factAttorney-in-fact126Exhibit No.Description of Exhibit3(a)Restated Articles of Incorporation of Cummins Inc., as amended (incorporated by reference to Quarterly Report on Form 10-Q for the quarter ended March 25, 2001, by reference to Quarterly Report on Form 10-Q for the quarter ended April 3, 1994, by reference to Quarterly Report on Form 10-Q for the quarter ended October 1, 1989 and by reference to Form 8-K dated July 26, 1990).3(b)By-laws of Cummins Inc., as amended and restated effective as of October 8, 2002 (incorporated by reference to Annual Report on Form 10-K for the year ended December 31, 2003, by reference to Form 8-K dated February 16, 2006, by reference to Form 8-K dated May 12, 2006, by reference to Form 8-K dated December 18, 2006).4(a)Credit Agreement, dated December 1, 2004, among Cummins Inc., Cummins Engine Co. Ltd., Cummins Power Generation Ltd. and Newage International Limited, as Borrowers, and JPMorgan Chase Bank, N.A., as Administrative Agent, Issuing Bank and Swingline Lender, Citicorp USA, Inc., as Syndication Agent, and Bank of America, N.A., The Bank of Nova Scotia and The Royal Bank of Scotland plc., as Co-Documentation Agents (incorporated by reference to Annual Report on Form 10-K for the year ended December 31, 2004).4(b)Guarantee and Security Agreement dated as of November 5, 2002 between Cummins, Inc., the Subsidiary Guarantors party thereto and JPMorgan Chase Bank as Collateral Agent Agents (incorporated by reference to Annual Report on Form 10-K for the year ended December 31, 2003).10(a)2003 Stock Incentive Plan, as amended (filed herewith)10(b)Target Bonus Plan (incorporated by reference to Annual Report on Form 10-K for the year ended December 31, 1996).10(c)Deferred Compensation Plan (incorporated by reference to Annual Report on Form 10-K for the year ended December 31, 1994).10(d)Key Employee Stock Investment Plan, as amended (incorporated by reference to Quarterly Report on Form 10-Q for the quarter ended July 3, 1994).10(e)Supplemental Life Insurance and Deferred Income Plan (incorporated by reference to Annual Report on Form 10-K for the year ended December 31, 1996).10(f)Financial Counseling Program (incorporated by reference to Quarterly Report on Form 10-Q for the quarter ended July 3, 1994).10(g)1986 Stock Option Plan (incorporated by reference to Quarterly Report on Form 10-Q for the quarter ended March 30, 1986, Exhibit 10(g)).10(h)Deferred Compensation Plan for Non-Employee Directors, as amended, effective as of April 15, 1994 (incorporated by reference to Annual Report on Form 10-K for the year ended December 31, 1994).10(i)Key Executive Compensation Protection Plan (incorporated by reference to Quarterly Report on Form 10-Q for the quarter ended October 2, 1994).10(j)Excess Benefit Retirement Plan (incorporated by reference to Quarterly Report on Form 10-Q for the quarter ended October 2, 1994).10(k)Employee Stock Purchase Plan (incorporated by reference to Annual Report on Form 10-K for the year ended December 31, 1998).10(l)Retirement Plan for Non-Employee Directors of Cummins Inc., as amended February 1997 (incorporated by reference to Quarterly Report on Form 10-Q for the quarter ended March 30, 1997).10(m)Three Year Performance Plan, as amended February 1997 (incorporated by reference to Quarterly Report on Form 10-Q for the quarter ended March 30, 1997).10(n)1992 Stock Incentive Plan (incorporated by reference to Annual Report on Form 10-K for the year ended December 31, 1995, Exhibit 10(s)).10(o)Restricted Stock Plan for Non-Employee Directors, as amended February 11, 1997 (incorporated by reference to Quarterly Report on Form 10-Q for the quarter ended March 30, 1997).10(p)2006 Executive Retention Plan (incorporated by reference to Annual Report on Form 10-K for the year ended December 31, 2005).10(q)Senior Executive Bonus Plan (incorporated by reference to Annual Report on Form 10-K for the year ended December 31, 1996).10(r)Senior Executive Three Year Performance Plan, as amended February 11, 1997 (incorporated by reference to Quarterly Report on Form 10-Q for the quarter ended March 30, 1997).10(s)Fifth Amendment of Cummins Inc. Supplemental Life Insurance and Deferred Income Plan (incorporated by reference to Annual Report on Form 10-K for the year ended December 31, 2005).12Calculation of Ratio of Earnings to Fixed Charges (filed herewith)21Subsidiaries of the Registrant (filed herewith).23Consent of PricewaterhouseCoopers LLP (filed herewith).24Powers of Attorney (filed herewith).31(a)Certification Pursuant to Section 302 of the Sarbanes-Oxley Act of 2002 (filed herewith).31(b)Certification Pursuant to Section 302 of the Sarbanes-Oxley Act of 2002 (filed herewith).32Certifications Pursuant to Section 906 of the Sarbanes-Oxley Act of 2002 (filed herewith).128