UNITED STATES
SECURITIES AND EXCHANGE COMMISSION
Washington D.C. 20549
FORM 10-K
x | ANNUAL REPORT PURSUANT TO SECTION 13 OR 15(d) OF THE SECURITIES EXCHANGE |
FOR THE FISCAL YEAR ENDED DECEMBER 31, 20062007
OR
o | TRANSITION REPORT PURSUANT TO SECTION 13 OR 15(d) OF THE SECURITIES |
For the transition period from to.to
Commission File Number: 000-51280
MORNINGSTAR, INC.
(Exact Name of Registrant as Specified in its Charter)
Illinois |
| 36-3297908 |
(State or Other Jurisdiction of | (I.R.S. Employer |
225 West Wacker Drive
Chicago, Illinois
60606-6303
(Address of Principal Executive Offices)
(312) 696-6000
(Registrant’s Telephone Number, Including Area Code)
Securities registered pursuant to Section 12(b) of the Act:
Title of Each Class | Name of Each Exchange on Which Registered | |
Common stock, no par value | The NASDAQ Stock Market LLC |
Securities registered pursuant to Section 12(g) of the Act: None
Indicate by check mark if the Registrant is a well-known seasoned issuer, as defined in Rule 405 of the Securities Act. Yes o No x
Indicate by check mark if the Registrant is not required to file reports pursuant to Section 13 or Section 15(d) of the Act. Yes o No x
Indicate by check mark whether the Registrant (1) has filed all reports required to be filed by Section 13 or 15(d) of the Securities Exchange Act of 1934 during the preceding 12 months (or for such shorter period that the Registrant was required to file such reports), and (2) has been subject to such filing requirements for the past 90 days. Yes x No o
Indicate by check mark if disclosure of delinquent filers pursuant to Item 405 of Regulation S-K is not contained herein, and will not be contained, to the best of Registrant’s knowledge, in definitive proxy or information statements incorporated by reference in Part III of this Form 10-K or any amendment to this Form 10-K. o
Indicate by check mark whether the Registrantregistrant is a large accelerated filer, an accelerated filer, a non-accelerated filer, or a non-accelerated filer.smaller reporting company. See definitionthe definitions of “large accelerated filer,” “accelerated filerfiler” and large accelerated filer”“smaller reporting company” in Rule 12b-2 of the Exchange Act. (Check one):
Large accelerated filer | o |
| Accelerated filer x |
| Non-accelerated filer o | Smaller reporting company o | ||
(Do not check if a smaller reporting company) |
| |||||||
Indicate by check mark whether the Registrant is a shell company (as defined in Rule 12b-2 of the Exchange Act). Yes o No xý
The aggregate market value of shares of common stock held by non-affiliates of the Registrant as of June 30, 20062007 was $442,359,063.$613,838,993.
As of March 1, 2007,February 29, 2008, there were 42,392,52645,375,260 shares of the Registrant’s common stock, no par value, outstanding.
DOCUMENTS INCORPORATED BY REFERENCE
Certain parts of the Registrant’s Definitive Proxy Statement for the 20072008 Annual Meeting of Shareholders are incorporated into Part III of this Form 10-K.
TABLE OF CONTENTS
1
Morningstar is a leading provider of independent investment research to investors around the world. Since our founding in 1984, our mission has been to create great products that help investors reach their financial goals. We offer an extensive line of Internet, software, and print-based products for individual investors, financial advisors, and institutional clients. Our company also provides asset management services for advisors, institutions, and retirement plan participants. In addition to our U.S.-based products and services, we offer local versions of our products designed for investors in Asia, Australia, Canada, Europe, and Europe.Japan. Morningstar serves more than 5.2approximately 6.1 million individual investors, 210,000240,000 financial advisors, and 1,7002,400 institutional clients. We have operations in 1518 countries and hold minority ownership positions in companies located in three other countries.
We maintain a series of comprehensive databases on 10 key types of investments, thatmost of which are widely used by investors globally. After building these databases, we add additional value and insight to the data by investing in our core skills of research, technology, and design. As of December 31, 2006,2007, we provided extensive data on more than:
•· 18,00021,000 mutual fund share classes in the United States;
•· 78,00089,000 mutual funds and similar vehicles in international markets;
•· 11,00012,000 stocks;
•· 6,0007,700 hedge funds;
•· 6,0007,300 separate accounts and collective investment trusts;
•· 62,00092,000 variable annuity/life subaccounts and policies;
•· 4,00024,000 insurance, pension, and life funds;
•· 7001,400 exchange-traded funds;
•· 7002,300 closed-end funds;
•· 80 state-sponsored college savings plans (commonly known as Section 529 College Savings Plans); and
•· 80 years of capital markets data capturing performance of 1819 market indexes.
Our business model is based on leveraging our investments in thethese databases we maintain. We earn returns on these investments by selling a wide variety of products in multiple media to three key market segments around the world.
Our data and proprietary analytical tools such as the Morningstar Rating for mutual funds, which rates past performance based on risk- and cost-adjusted returns, and the Morningstar Style Box, which provides a visual summary of a mutual fund’s underlying investment style, have become important tools that millions of investors and advisors use in making investment decisions. We’ve created other tools, such as the Ownership Zones, Sector Deltas, and Market Barometer, which allow investors to see how different investments work together to form a portfolio and to track its progress. We developed a Portfolio X-Ray tool that helps investors reduce risk and understand the key characteristics of their portfolios based on nine different factors.
More recently,In 2007, we completed a major initiative to develop data without survivorship bias. We’re now including “dead” funds (those that have merged or liquidated) in our category averages and percentile ranks to give investors a more accurate representation of fund performance. We’ve also enhanced our research to better reflect derivatives and short positions. Our portfolio statistics now reflect how these financial instruments and trading strategies affect a fund’s asset allocation and risk profile. In addition, we enhanced the methodology for our mutual fund Stewardship Grades.
Over the past several years, we’ve expanded our research efforts on individual stocks and have worked to popularize the concepts of economic moat, a measure of competitive advantage originally developed by Warren Buffett, and margin of safety, which reflects the size of the discount in a stock’s price relative to its estimated value. The Morningstar Rating for stocks is based on the stock’s current price relative to our analyst-generated fair value estimates, as well as the company’s level of business risk and economic moat. We offer a variety of qualitative measures such as Stewardship Grades, which help investors identify stockscompanies and funds that have demonstrated a high level of commitment to shareholders and stewardship of investors’ capital.
In 2006, we introduced the Morningstar Investor Return measure, which incorporates the impact of cash flows from purchases and sales as well as growth in fund assets to capture how the average investor fared in a fund over a period of time.
We’ve also developed in-depth advice on security selection and portfolio building to meet the needs of investors looking for integrated portfolio solutions. We believe many investors rely on these tools because they offer a useful framework for comparing potential investments and making decisions. Our independence and our history of innovation make us a trusted resource for investors.
2

![]()
We provide Morningstar Ratings on mutual funds, stocks, separate accounts, exchange-traded funds, hedge funds, and closed-end funds, as well as variable annuity/life portfolios and subaccounts. For managed investment products, the Morningstar Rating brings performance and risk together into one evaluation, with the top 10% of rated offerings receiving 5 stars and the bottom 10% receiving 1 star. The Morningstar Rating for stocks is based on the difference between a stock’s current market price and our analyst-generated fair value estimate. It also incorporates our assessment of the company’s level of business risk and economic moat, or competitive advantage.
The Morningstar Style Box
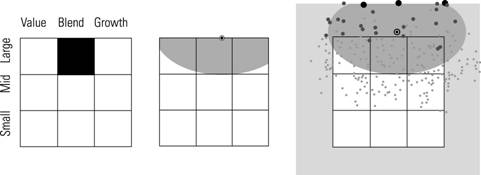
We provide three levels of detail for the Morningstar Style Box: a basic grid illustrating the overall style of a stock or fund, a basic Ownership Zone illustrating the area of the Style Box in which most of the fund’s holdings tend to fall, and a detailed Ownership Zone that plots precisely where the fund’s holdings fall within the Style Box. For the hypothetical mutual fund shown here, the first illustration shows that the funds overall style emphasizes large-capitalization stocks with a blend of value and growth characteristics.
The second illustration shows that most of the fund’s investments fall into the large-capitalization range and that the fund puts slightly more emphasis on growth stocks than value-oriented stocks.
The third illustration shows the complete distribution of the fund’s holdings. Because some individual holdings have extremely large market capitalizations, they land outside the traditional Style Box range.
3
Growth Strategies
We operate our business in three global segments: Individual, Advisor, and Institutional. Our mission is to create great products that help investors reach their financial goals. In keeping with our mission, we are pursuing four key growth strategies, which we describe below. We review our growth strategies on a regular basis and refine them as we monitor changes in the business. If you compare the growth strategies we outlined last year with what we describe below, you’ll see that we’re no longer including Morningstar Retirement Manager as one of our major Internet platforms. Instead, we are including all of our retirement advice solutions (including Morningstar Retirement Manager and Advice by Ibbotson) as part of our second growth strategy, which is to become a global leader in funds-of-funds investment management. Separately, we added retirement income tools as one of the core capabilities we plan to focus on for our third growth strategy, expanding the range of services we offer in each of our operating segments. We’ve maintained our fourth growth strategy, expanding our international brand presence, products, and services.
1. Enhance our position in each of our three operating segments by focusing on our three major Internet-based platforms.
We operate our business in three segments: Individual, Advisor, and Institutional. We believe that individual investors, financial advisors, and institutional clients increasingly want integrated solutions as opposed to using different research tools for different parts of their portfolios. To help meet the market need for integrated solutions, one of our key strategies is to focus our product offerings on our three major platforms:
•· Morningstar.com for individual investors;
•· Morningstar Advisor Workstation for financial advisors; and
•· Morningstar Direct for institutional investment research professionals.
These products all include integrated research and portfolio tools, allowing investors to use our proprietary information and analysis across multiple security types. We believe we can achieve deeper penetration of our current audiences with each of these platforms, as well as extend their reach to new customers. With Morningstar.com, we’re focusing on expanding beyond our core audience of mutual fund investors by addingattracting more stock investors and continuing to expand our reach with our core audience of experienced and engaged investors. Over the next several years, weWe plan to intensifycontinue intensifying and improveimproving the Morningstar.com customer experience by upgrading the site’s content, speed, and relevance to all users. With Advisor Workstation, we plan to build on our large installed base by continuing to add functionality, such as portfolio accounting, client management, and retirement income tools, which will help us reach more advisors around the world. With Morningstar Direct, we plan to continue an aggressive development program to provide data and analysis on securities and investments around the world. We’re focusing on expanding functionality, selling more licenses to existing clients, and expanding to reachreaching new clients.
2. Become a global leader in funds-of-funds investment management.
The large number of managed investment products available has made assembling them into well-constructed portfolios a difficult task for many investors. Consequently, funds-of-funds offerings have seen strong growth within the mutual fund, variable annuity, and hedge fund industries. Cerulli Associates estimates that global multimanager assets—including publicly offered funds that invest in other funds as well as investment vehicles managed by multiple subadvisors—totaled more than $1.3$1.9 trillion as of December 31, 2005.2007. We believe assembling and evaluating funds of funds is a natural extension of our expertise in understanding managed investment products.
Our investment management programs combine managed investment vehicles—typically mutual funds—in portfolios designed to help investors and financial advisors meet their financial goals. When we create portfolios made up of other funds, our goal is to simplify the investment process and help investors access portfolios that match their level of risk tolerance, time horizon, and long-term investment objectives. We draw on our extensive experience analyzing funds to combine quantitative research with a qualitative assessment of manager skill and investment style.
Morningstar Managed Portfolios which we introduced in 2001, is a fee-based discretionary asset management service that includes a series of mutual fund, and exchange-traded fund, and stock portfolios tailored to meet specific investment time horizons and risk levels. We also offer a managed account service as part ofThrough our Retirement Advice platform, which includes Morningstar Retirement Manager and Advice by Ibbotson.Ibbotson, we also offer managed account services. We offer these managed accounts for retirement plan participants who choose to delegate management of their portfolios to our investment professionals, whomanaged account programs, which select investment options and make retirement planning choices for the participants. We believe that retirement plan participants will continue to adopt managed accounts because of the complexity involved in retirement planning. In addition, the Pension Protection Act of 2006 may encourage plan sponsors to adopt managed accounts as a default investment option. For more information about the Pension Protection Act, see the Industry Overview section of Item 7—Management’s Discussion and Analysis of Financial Condition and Results of Operations.
4
In addition to the assets we manage directly, we had a total of $55.5$97.5 billion in assets under advisement in our Investment Consulting business as of December 31, 2006. 2007. We significantly expanded our assets under advisement in 2006, reflecting2007, with the majority of the growth in ourdriven by new asset flows to existing
4
business as well as new assets acquired client portfolios, both from Ibbotson Associates and Morningstar Associates. Our consulting business includes consultingfocuses on relationships and agreements where we act as a portfolio construction manager or asset allocation program designer for a mutual fund or variable annuity and receive a basis pointbasis-point fee. We see continued potential to develop this part of our business, including in markets outside the United States. We plan to continue building this business by focusing on performance and client support, building new relationships, and developing new portfolio strategies and products.
3. Expand the range of services we offer investors, financial advisors, and institutional clients.
We plan to expand our product offerings to better meet the needs of investors. We plan to continue building new databases for additional types of investments, including hedge funds, various types of funds outside the United States and other widely used investment products. We expect to continue expandingexpand our product offerings in threefive primary areas:
•· Enhance our expertise in 10 key investment databases and look for opportunities to develop new databases. We currently provide extensive data on mutual funds, stocks, hedge funds, separate accounts, variable annuities, pension and life funds, exchange-traded funds, closed-end funds, 529 plans, and capital markets. Our data is the foundation for all of the products and services we offer. When we build investment databases, we intend to own the data whenever possible and minimize license agreements with outside data providers. We also focus on proprietary, value-added data, such as our comprehensive data on current and historical portfolio holdings for mutual funds and variable annuities. Within each database, we continuously update our data to maintain timeliness and expand the depth and breadth of coverage. We expect to continue building out additional databases, focusing on investment products that are widely used by large numbers of investors. We also plan to continue our efforts to establish our databases as the pre-eminent choice for individual investors, financial advisors, and institutional clients in markets around the world.
·Expand and leverage our stock-research capabilities.capabilities in stocks. Our equity research complements our approach to mutual fund analysis, which has historically focusedwhere we focus on analyzing the individual stocks that make up each fund’s portfolio. Over the past several years, we’ve significantly expanded our equity research coverage. As of December 31, 2006,2007, we provided analyst research on more than 1,800 companies.2,100 companies, plus an additional 250 companies listed in Australia. We’ve continued to focusfocused on building both depth and breadth of coverage by adding additional coverage on foreign stocks, small-cap stocks, initial public offerings master limited partnerships, and other areas.
We currently have agreements withprovide research to six major investment banks to provide research under the terms of the Global Analyst Research Settlement, which covers the five-year period ending in July 2009. We’re continuingworking to pursue opportunities tosell and distribute our equity research through a variety of other channels, including through financial advisors, buy-side firms, and companies outside of the United States. We believe that investors’ increasing awareness of the value of independent research will strengthen our business over the long term;term.
•We’ve also expanded our proprietary stock database, which we view as an important complement to our analyst research. We currently have data coverage on approximately 12,000 companies based in the United States, Canada, and Australia. Following our acquisition of the Hemscott businesses (described in more detail below), we expect to expand the number of companies covered in the United Kingdom, Ireland, and Europe, as well as add more data history and management and director information on many of the companies already in our database. We expect that our combined equity database will include comprehensive data coverage on approximately 20,000 companies after integrating Hemscott’s data.
5
· Expand our capabilities in hedge fund research. We plan to continue expandingexpand our research and data on hedge funds with the goal of making the hedge fund industry more transparent to investors. Hedge funds worldwide held more than $1.4$1.9 trillion in investor assets as of December 31, 2006, according to a report published by Hennessee Group in March 2007.2007, based on data from Hedge Fund Research, Inc. Offering data on hedge funds is a natural extension of our work on other managed investment vehicles. We introduced our hedge fund database in early 2005 and provided data on about 3,000 hedge funds as of mid-2006. After adding the hedge fund data acquired from the InvestorForce database (described in more detail below), we now provide comprehensive data on more than 6,000about 7,700 hedge funds. We began offering hedge fund analyst reports on Morningstar.com and through Morningstar Direct in 2006 and have added hedge fund data to several of our products; and
•· BuildContinue developing retirement income capabilities. As the baby boom generation approaches retirement, we believe many investors will need more information to help them manage income during retirement. We believe these trends will lead to a greater need for information and tools focusing on retirement income planning and long-term savings strategies. In October 2006, we launchedWe currently offer Retirement Income Strategist, a Web-based financial planning tool that allows financial advisors to create comprehensive income analyses for clients who are in or approaching retirement. We currently offer Retirement Income Strategistretirement, as part of our Advisor Workstation platformplatform. We’ve developed several retirement income services for institutional clients within our Investment Consulting area, and we plan to incorporate additional retirement income tools and services in other products over the next several years.
·Continue expanding our index business. Over the past several years, we’ve developed a series of proprietary investment indexes. The Morningstar Indexes are rooted in our proprietary research, with each index vetted for appropriateness and investment value. They can be used for precise asset allocation and benchmarking and as tools for portfolio construction and market analysis. All of our indexes are based on transparent, rules-based methodologies that are back-tested and supported by original research papers. Each is backed by rigorous research to help investors understand, invest in, and monitor the capital markets. Consistent methodology and objective rules make the indexes well-suited for creating index-linked investment products, such as exchange-traded funds, mutual funds, and structured products. We plan to increase the number of indexes we offer, including in markets outside of the United States.
4. Expand our international brand presence, products, and services.
Over the past several years, we have expanded our product offerings outside the United States. In July 2006, we increased our presence in Australia when we acquiredOur recent acquisitions of several Hemscott businesses, the mutual fund data business from Standard & Poor’s, and Aspect Huntley which we describe(described in more detail below.below) all significantly expanded our operations outside of the United States. Our non-U.S. operations outside of the United States generated $44.3$89.7 million in revenue in 2006,2007, including $8.3$31.7 million from acquisitions, compared with $29.4$44.3 million in 2005.2006. We plan to continue expanding our non-U.S. operations to meet the increasing demand for wide-ranging, independent investment insight by investors around the globe. Because more than half of the world’s investable assets are located outside of the United States, we believe there are significant opportunities for us in non-U.S. markets. Our strategy is to focus our non-U.S. sales efforts on our major products, including Morningstar Advisor Workstation and Morningstar Direct. We also plan to increase our sales staff, build a larger analyst team outside the United States, and explore new markets, such as India, Latin America, and Latin America.South Africa.
Acquisitions
Historically, we have focused primarily onThe majority of our revenue has been driven by organic growth by introducingas we’ve introduced new products and services and expandingexpanded our marketing efforts for existing products. However, we have made and expect to continue making selective acquisitions that support our four key growth strategies. In reviewing potential acquisitions, we plan to focus on transactions that:
5
•· offer a good strategic fit with our mission of creating great products that help investors reach their financial goals;
•· help us build our proprietary investment databases, research capabilities, technical expertise, or customer base faster and more cost effectively than we could if we built them ourselves; and
•· offer a good cultural fit with our entrepreneurial spirit and brand leadership.
6
Institutional Hedge FundHemscott data, media, and Separate Accounts Database Division of InvestorForce, Inc.investor relations Web site businesses
In August 2006,January 2008, we acquired the institutional hedge fundHemscott data, media, and separate account database division of InvestorForce, Inc., a financial software and data integration company based in Wayne, Pennsylvania, for $10.1 million in cash.investor relations Web site businesses from Ipreo Holdings LLC. This acquisition includedfits our strategies of building a premier global equity database and expanding our presence outside the Altvest database, oneUnited States. The acquisition significantly strengthens our equity coverage and adds decades of the largest databases covering hedge funds, managers, andadditional data history to our existing stock data coverage, as well as InvestorForce’s extensive institutional separate account database. Itmanagement and director information for United States, United Kingdom, and Canadian companies. As part of the transaction we also included several online software applicationsacquired a sizable data operation in India, a leading investor Web site in the United Kingdom, and a UK-based investor relations Web site business that leverages our data and analytics for manager search, research, and reporting. Thisinvestor relations professionals. We paid $51.6 million in cash for the acquisition, allowed ussubject to strengthen and expand our proprietary investment data.working capital adjustments.
Aspect Huntley Pty LimitedMutual fund data business acquired from Standard & Poor’s
In July 2006,March 2007, we acquired Aspect Huntley Pty Limited, a leading provider of equity information, research, and financial trade publishing in Australia,the mutual fund data business from Standard & Poor’s for $23.4$57.8 million in cash. Thiscash including post-closing adjustments and transaction costs directly related to the acquisition, fit our growth strategy to expand ourless cash acquired. The mutual fund data business consists of data and products covering approximately 135,000 managed investment vehicles, including mutual funds, ETFs, hedge funds, and servicesoffshore funds. Approximately 80% of the mutual fund data business acquired from Standard & Poor’s is outside the United States and allowed us to combine Morningstar’s expertise in fund research and information with Aspect Huntley’s equity research, information, and financial media expertise in Australia.
Ibbotson Associates, Inc.
In March 2006, we acquired Ibbotson Associates, Inc., a firm specializing in asset allocation research and services, for $86.5 million in cash. Ibbotson’s key products and services include:
• a well-established investment consulting practice that provides asset allocation and fund research to institutions;
• a portfolio and asset management business that constructs actively managed funds-of-funds offerings for financial institutions;
• managed retirement accounts for participants in 401(k) and other defined contribution plans;
• the EnCorr software for investment management and strategic asset allocation;
• asset allocation, forecasting, and optimization software widely used in broker-dealer advisor platforms;
• a long-term database of capital market returns;
• training and educational services; and
• the Stocks, Bonds, Bills, and Inflation Yearbook annual reference guides.
The Ibbotson acquisition complemented our growth strategies in several key areas, including investment consulting, managed retirement accounts, and institutional and advisor software.States.
We have also made other acquisitions over the past several years. For more information, refer to Note 7 of the Notes to our Consolidated Financial Statements.
Business Segments, Products, and Services
We divide our business operations into three segments:
•· Individual, which focuses on products and services for individual investors;
•· Advisor, which focuses on products and services for financial advisors; and
•· Institutional, which focuses on products and services for institutional clients, including banks, brokerage firms, insurance companies, mutual fund companies, media outlets, and retirement plan providers and sponsors.
The table below shows our revenue by business segment for each of the past three years:
6
|
| 2006 |
| 2005 |
| 2004 |
|
| 2007 |
| 2006 |
| 2005 |
| ||||||||||||||||||||||||
Revenue by Segment ($000) |
| Amount |
| % |
| Amount |
| % |
| Amount |
| % |
|
| Amount |
| % |
| Amount |
| % |
| Amount |
| % |
| ||||||||||||
Individual |
| $ | 80,706 |
| 25.6 | % | $ | 63,448 |
| 27.9 | % | $ | 46,996 |
| 26.2 | % |
|
| $ | 97,299 |
|
| 22.4% |
|
| $ | 80,706 |
|
| 25.6% |
|
| $ | 63,448 |
|
| 27.9% |
|
Advisor |
| 94,694 |
| 30.0 |
| 72,689 |
| 32.0 |
| 60,880 |
| 33.9 |
|
|
| 115,739 |
|
| 26.6 |
|
| 94,694 |
|
| 30.0 |
|
| 72,689 |
|
| 32.0 |
| ||||||
Institutional |
| 146,085 |
| 46.4 |
| 95,947 |
| 42.2 |
| 78,402 |
| 43.6 |
|
|
| 230,329 |
|
| 52.9 |
|
| 146,085 |
|
| 46.4 |
|
| 95,947 |
|
| 42.2 |
| ||||||
Elimination of intersegment revenue |
| (6,310 | ) | (2.0 | ) | (4,970 | ) | (2.1 | ) | (6,620 | ) | (3.7 | ) |
|
| (8,260 | ) |
| (1.9) |
|
| (6,310 | ) |
| (2.0) |
|
| (4,970 | ) |
| (2.1) |
| ||||||
Consolidated revenue |
| $ | 315,175 |
| 100.0 | % | $ | 227,114 |
| 100.0 | % | $ | 179,658 |
| 100.0 | % |
|
| $ | 435,107 |
|
| 100.0% |
|
| $ | 315,175 |
|
| 100.0% |
|
| $ | 227,114 |
|
| 100.0% |
|
For information on segment operating income (loss), refer to Note 5 of the Notes to our Consolidated Financial Statements.
7
Individual Segment
For individual investors, our largest product based on revenue is our U.S.-based Web site, Morningstar.com, which includes our Premium Membership service and sales of Internet advertising space. MorningstarMorningstar.com is a leading provider of broad-based, innovative investment research, and Morningstar.com has received several positive reviews fromconsistently mentioned in major business publications such as one of the best investment sites on the WebBarron’s, Forbes, and The Wall Street Journal.. Our Individual business segment also includes Morningstar Equity Research, which we distribute through several channels. Investors can access our equity research through the Premium Membership service on Morningstar.com. Our independent equity research is currentlyalso distributed through six major investment banks to meet the requirement for independent research under the Global Analyst Research Settlement, which covers the five-year period ending in July 2009. In addition, we distribute our research to several other companies who provide our analyst reports and research to their affiliated financial advisors or to individual investors.
We also offer several print and online publications focusing on stocks, mutual funds, personal finance, and other investing topics. We sell several investment newsletters, including Morningstar FundInvestor and Morningstar StockInvestorStockInvestor; and annual reference guides, including the Morningstar Funds 500, the Morningstar Stocks 500, the Morningstar ETFs 150, and the Stocks, Bonds, Bills, and Inflation Yearbook. Since we acquired Aspect Huntley in July 2006, thisThis segment has also includedincludes several newsletters and other publications for Australian investors.investors in Australia. In 2006,2007, about 5%10% of Individual segment revenue was from outside of the United States.
We offer free local Web sites for individual investors in Australia, Austria, Belgium, Canada, Denmark, Finland, France, Germany, Hong Kong, Italy, Japan, Korea, the Netherlands, New Zealand, Norway, People’s Republic of China, Spain, Sweden, Switzerland, Thailand,Taiwan, and the United Kingdom. Our Web sites and publications for individual investor publicationsinvestors reach more than 5.2approximately 6.1 million investors worldwide.
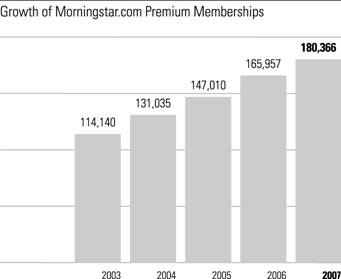
Within the Individual business segment, most of our products target experienced investors who are actively involved in the investing process and want to take charge of their own investment decisions. We also reach individuals who want to learn more about investing and investors who seek out third-party sources to validate the advice they receive from brokers or financial planners. Our client base in this segment consists of more than 260,000280,000 paying customers, including 165,957180,366 Premium members of Morningstar.com and 95,000approximately 100,000 subscribers who purchase our investment newsletters designed for individual investors. In addition to this customer base, approximatelyFollowing the Hemscott acquisition, we also have an additional 1,800 Premium subscribers for Hemscott.com in the United Kingdom. Approximately 3,800 public and private libraries in the United States subscribe to our services. We also offer a series of books and workbooks about investing, as well as formatted printable reports on individual securities.
We promote our individual investor products primarily through traditional direct mail, e-mail, promotions on our 2024 investor Web sites worldwide, public relations, and advertising on related Web sites.
Our strategy is to increase the number of investors who sign up for Morningstar.com Premium Membership by continuing to develop and promote Premium content such as analyst reports, Fund Analyst Picks and Pans, and value-added portfolio tools, which we market to registered users and other investors. AsWe use search marketing as a core marketing strategy for Morningstar.com, we use search marketing.Morningstar.com. This includes working to optimize our site’s ranking in the search results that appear when users search for information about investing and purchasing advertisements on third-party sites such as Yahoo! and Google based on key words that can bring investors to relevant content on Morningstar.com.
In ourthe Individual business segment, we compete with the personal finance Web sites of AOL Money & Finance, CNN Money, Google Finance, MarketWatch, MSN Money, The Motley Fool, SmartMoney.com, The Street.com, The Wall Street Journal Online, and Yahoo! Finance. Our print publications compete with Agora Publishing, Forbes, The Motley Fool, Phillips Investment Resources, and Value Line.Line in the United States and Australian Wealth Report, Fat Prophets, Intelligent Investor, and The Rivkin Report in Australia. Our Equity Research services compete with Standard & Poor’s, Value Line, Zacks Investment Research, and several smaller research firms.
We believe ourthe Individual segment has a modest amount of seasonality. The first quarter tends to show more sales activity for Premium Membership on Morningstar.com and other products such as our annual reference guides, including the Stocks, Bonds, Bills, and Inflation Yearbook. Sales in ourthe Individual segment tend to be slightly lower over the spring and summer months. However, our
7
diversified product base and recognizing revenue ratably over the term of each subscription moderates the impact of this seasonality.
Our largest customer in the Individual segment made up less than 10%approximately 6% of segment revenue in 2006.2007.
8
Morningstar.com
Our largest Web site for individual investors is Morningstar.com in the United States. As of December 31, 2006,2007, the free membership services offered through Morningstar.com had more than 5.15.8 million registered users worldwide, who have access to comprehensive data on individual stocks, mutual funds, exchange-traded funds, hedge funds, and other investments to help them conduct research and track performance. In addition, Morningstar.com features extensive market data, Morningstar articles, proprietary portfolio tools, and educational content to help investors of all levels access timely, relevant investment information. Morningstar.com also includes Portfolio X-Ray, which helps investors reduce risk and understand key characteristics of their portfolios, and a variety of other portfolio tools.
We use our free content as a gateway into paid Premium Membership, which includes access to written analyst reports on more than 1,8002,100 stocks, 2,000 mutual funds, and 140165 exchange-traded funds, as well as Analyst Picks and Pans, Stewardship Grades, and Premium Stock and Fund Screeners. We currently offer Premium Membership services only in the United States.States, China, and the United Kingdom.
To help draw investors deeper into Morningstar.com, in 20062007 we added more news, alerts,significantly expanded video content and video segments, mainly focusing on stocks.the number of articles published by our editorial staff. We overhauled the cover pages for the stock and fund areas of the site and improved the conversations area of the site to better highlight user-generated content. We also introducedcreated an Options Center that includes comprehensive equity option data, education, analysis, and a Personal Returns measure within Morningstar.com’s Portfolio Manager tool to give investors a more accurate picturefamily of their portfolios’ investment performance after taking into account all transactions and fees.proprietary option volatility indexes.
As of December 31, 2006,2007, we had 165,957180,366 paid Premium subscribers for Morningstar.com.Morningstar.com in the United States plus an additional 2,100 Premium subscribers in China. Following our January 2008 acquisition of the Hemscott businesses, we had 1,800 Premium subscribers to Hemscott.com in the United Kingdom. We currently charge $15.95$16.95 for a monthly subscription, $145$159 for an annual subscription, $245$269 for a two-year subscription, and $345$369 for a three-year subscription for Morningstar.com’s Premium service.service in the United States. We also sell advertising space on Morningstar.com.
Morningstar.com is one of our five largest products based on revenue and was our largest product in the Individual segment in 2006.2007. This product accounted for 9.9%8.6%, 11.2%9.9%, and 11.5%11.2% of our consolidated revenue in 2007, 2006, 2005, and 2004,2005, respectively.

9
Morningstar Equity Research
As of December 31, 2006,2007, we offered independent equity research on more than 1,800 companies.2,100 companies, plus an additional 250 companies based in Australia. Our approach to stock analysis focuses on long-term fundamentals. Our analysts evaluate companies by assessing each firm’s competitive advantage, analyzing the level of business risk, and completing an in-depth projection of future cash flows. For the companies we cover, we create an analyst-generatedour analysts prepare a fair value estimate, a Morningstar Rating for stocks, a rating for business risk, and an assessment of the company’s economic moat. Economic moat is a concept originally developed by Warren Buffett that describes a company’s competitive advantage relative to other companies. For the remaining 5,500 stocks included in our database, we offer quantitatively generatedquantitative grades for growth, profitability, and financial health, as well as an explanation of the company’s business operations. We currently deliver our equity research to individual investors as part of our Premium Membership service on Morningstar.com and to six major investment banks under the terms of the Global Analyst Research Settlement, as well as to several other companies who provide our research to their affiliated financial advisors or to individual investors.
We have significantly expanded our equity research coverage over the past several years. We currently provide analyst reports on virtually all of the most widely held stocks in the S&P 500 index. Our coverage list includes more than 99% of the market value of the common shares outstanding forindex, as well as numerous companies included in this market benchmark.other indexes. We continue to expand our analyst staff to support these research efforts and had 95112 stock analysts inaround the United Statesworld as of December 31, 2006,2007, compared with 87100 as of December 31, 2005.2006.
We continue to focus on building our competitive advantage by expanding the breadth and depth of our equity coverage. As part of this effort, in 20062007 we increased coverage of areas such as smaller-sized stocks, initial public offerings, non-U.S. stocks, and master limited partnerships. We also introduced a new discounted cash-flow (DCF) model for valuing banks in 2006. In addition, we established an analyst presence in Londonnow cover about 100 pre-IPO and Shenzhen and used this local expertise to begin covering companies based in Europe and China. We had 113 stock analysts worldwide as of December 31, 2006.newly public companies.
Pricing for Morningstar Equity Research that we deliver related to the Global Analyst Research Settlement or for other institutional clients varies based on the level of distribution, the number of securities covered, the amount of custom coverage required, and the
8
length of the contract term. Morningstar Equity Research, which primarily consists of researchrevenue related to the Global Analyst Research Settlement, was the second-largest product in the Individual segment based on revenue in 2006,2007, following Morningstar.com. The period covered by the Global Analyst Research Settlement will expire in July 2009. After the settlement period expires, the investment banks covered by it will no longer be required to provide independent investment research to their clients. For further discussion about this issue, see Item 1A — Risk Factors.
Morningstar Mutual FundsNewsletters and Other Publications
We offer a variety of print and electronic publications about investing. Some of these include Morningstar Mutual Funds, is a reference publication that features our signature one-page reports on approximately 1,600 mutual funds. These reports contain historical performance data, portfolio statistics, proprietary measurement tools, and analyst reports. Twice a month, subscribers receive updated reports for approximately 160 of the covered funds, along with news, analyst commentary, industry research, and summary performance data for all 1,600 funds. Subscribers can also access a Web-based version for the most current information. We charge $549 for a one-year subscription tofunds; Morningstar Mutual FundsFundInvestor, .
Morningstar FundInvestor
Morningstar FundInvestor is a monthly newsletter that provides information and insight on 500 of the most popular mutual funds. It also includesfunds and a list of 175 Analyst Picks—hand-selected funds that our analysts think are the most compelling for long-term investors. Each monthly issue contains extensive data, ideas on building better portfolios, news on current developments and changes within the fund industry, and proprietary research and ratings.Picks; Morningstar FundInvestorStockInvestor, also features three mutual fund portfolios constructed and updated by Morningstar’s senior analyst team. We charge $99 for a one-year subscription to Morningstar FundInvestor.
Morningstar StockInvestor
Morningstar StockInvestor is a monthly newsletter that focuses on companies with strong competitive positions and stock prices that we believe are low enough to provide investors with a margin of safety. Each issue includes updates on two model portfolios: a Tortoise portfolio designed for conservative investorssafety; and a Hare portfolio designed for more risk-tolerant investors. Other key features include articles on international investing ideas, notes from company visits, bull/bear debates on high-profile companies, and the Morningstar Bellwether 50, a watch list of 50 dominant companies with wide economic moats, or competitive advantages. Each issue also offers ideas about how investors can improve their stock selection and learn from leading portfolio managers. We charge $109 for a one-year subscription to Morningstar StockInvestor.
Stocks, Bonds, Bills, and Inflation Yearbook
The Stocks, Bonds, Bills, and Inflation Yearbook,is the definitive study of historical capital markets data in the United States. Used by advisors, financial planners, and brokers to analyze asset class performance, the yearbook contains total returns and index values dating back to 1926 for large and small company stocks, long-term corporate bonds, long- and intermediate-term government bonds, Treasury bills, and inflation. Optional reports supplement the yearbook on a monthly, quarterly, or semiannual basis. We charge $120 for the annual book, or higher amounts for the optional updates.
In addition, to the products described above, we offer several other investment newsletters and a series of books about investing in stocks, mutual funds, and mutualexchange-traded funds, which are available directly from us and in bookstores. In response to greater investor interest in exchange-traded funds,early 2008, we introduced apublished two new newsletter,investment books, Morningstar ETFInvestor,The Ultimate Dividend Playbook in 2006. We also introduced a new annual softcover reference guide on exchange-traded funds, theand Morningstar ETFs 100, The Little Book that Builds Wealth.which we’ve now expanded to become the Morningstar ETFs 150.
Following the Aspect Huntley acquisition, ourOur Individual segment also includes several publications for investors in Australia, including IFA Magazine, Australia’s leading magazine for independent financial advisors; Your Money Weekly, which focuses on the larger companies listed in Australia; and Smaller Companies Guide, a weekly newsletter with investment recommendations and portfolio ideas focusing on smaller-sized stocks.
Advisor Segment
For financial advisors, our largest products based on revenue are Morningstar Advisor Workstation, a comprehensive Web-based investment planning system, and Principia, our CD-ROM-based investment research and planning software. We also offer Morningstar Managed Portfolios, a fee-based discretionary asset management program distributed exclusively through financial advisors. Our advisor products are integrated into the daily operations and research processes of many financial advisors who use our research and tools to provide guidance for individual investors. According to a report published in January 2005 by the consulting firm Tiburon Strategic Advisors, Morningstar was ranked as the leading provider of investment research and data, financial planning software, and asset allocation software among approximately 1,500 independent financial advisors surveyed.
9
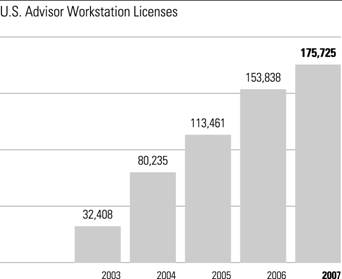
We sell our advisor-related products both directly to independent financial advisors and through enterprise licenses, which allow financial advisors associated with the licensing enterprise to use our products. Most of our license agreements in the Advisor segment have terms ranging from one to three years. As of December 31, 2006,2007, we had established relationships with more than 170,000approximately 240,000 financial advisors inaround the United States and approximately 40,000 financial advisors in international markets.world. Approximately 12%16% of our Advisor segment revenue was from international sales in 2006.2007. In addition to the U.S. versions of our Advisor products, we offer products for financial advisors in a variety of other countries. For example, we have versions of Advisor Workstation tailored to marketsfor use in Asia, Australia, Canada, and Europe, and we offer a product similar to Principia in Canada.
10
Our products for advisors are sold primarily through our sales force, with promotional support from direct mail, online and print advertising, public relations, and conference exhibits. We also use the annual Morningstar Investment Conference to promote our offerings for advisors. We believe that there are opportunities to increase Advisor Workstation sales by attracting additional brokerage firms and investment advisors and increasing revenue per license from existing clients by expanding the amount of functionality licensed. We also plan to continue expandingexpand our offerings for financial advisors outside the United States. Our primary competitors in the Advisor segment include Advisor Software, Inc. Advent Software, Interactive Advisory Software, MoneyGuide Pro, Schwab Portfolio Center, Standard & Poor’s, SunGard, and Thomson Financial Services. For Morningstar Managed Portfolios, our primary competitors are AssetMark, Brinker Capital, Curian, Envestnet PMC, Fundquest,FundQuest, Genworth, SEI Investments, and SEI Investments.Symmetry.
In the Advisor segment, sequentialwe typically have higher revenue growth tends to be higher in the second quarter because ourwe hold an annual investment conference is held in June. Sales for Financial Communications materials have also shown some seasonal patterns, with a relatively larger percentage of annual sales occurring in the first quarter. Other products in this segment generally have not shown marked seasonality.
Our largest customer in this segment accounted for less than 5%approximately 3% of segment revenue in 2006.

Morningstar Advisor Workstation
Morningstar Advisor Workstation, a Web-based investment planning system, provides financial advisors with a comprehensive set of tools for conducting their core business—including investment research, planning, and presentation.presentations. It allows advisors to build and maintain a client portfolio database that can be fully integrated with the firm’s back-office technology and resources. Moreover, it helps advisors create customized reports for client portfolios that combine mutual funds, stocks, separate accounts, variable annuity/life subaccounts, exchange-traded funds, hedge funds, and closed-end funds. As of December 31, 2006, nearly 154,0002007, more than 175,000 advisors in the United States were licensed to use Advisor Workstation, which is available in two editions: the Office Edition for independent financial advisors and the Enterprise Edition for financial advisors affiliated with larger firms. We generally charge $5,000 per year forAdvisor Workstation Enterprise Edition includes a variety of modules, including Retirement Income Strategist, Retirement Income Education Center, Portfolio Builder, Hypothetical Illustrator, and a variety of tools to measure the Office Edition.relative cost and portfolio fit of various types of investments. These modules can be purchased as stand-alone products or combined as part of a full Workstation license. Pricing for the Enterprise Edition varies based on the number of users, as well as the level of functionality offered, and generally ranges between $80 and $2,800 per licensed user. We generally charge $5,000 per user for an annual license for Office Edition.
In 2006,2007, we introducedbegan selling our Global Hypothetical Illustrator and Portfolio Builder tools in several new components foradditional countries, including Canada, Hong Kong, India, and various countries in Europe and Latin America. We launched a local version of Advisor Workstation Office Edition in the United Kingdom and added functionality allowing advisors to create investment policy statements. In addition, we incorporated Ibbotson’s wealth forecasting engine and other asset allocation methodologies into Advisor Workstation Enterprise Edition. These modules can be purchased as stand-alone products or combined as part ofWe also created a full Workstation license and include:
• Morningstar Retirement Income Strategist, a Web-based financial planning toolnew Site Builder module that helps advisors analyze retirement income for clients who are retired or nearing retirement. Retirement Income Strategist helps advisors analyze whether an individual’s savings will last during retirement and explore alternative scenarios for sustaining income during retirement;
• Retirement Income Education Center, ainvestment advisory firms build Web site offering educational content and tools about retirement income for financial advisors affiliated with institutions;sites.
• Morningstar Portfolio Builder, which provides advisors with a clearly defined step-by-step process for efficiently creating portfolio proposals to present to clients. Advisors can use Portfolio Builder to construct a portfolio with an appropriate investment mix based on preset asset allocation models and investments as well as a client’s current holdings, risk tolerance, and other information;
• A global version of our Hypothetical Illustrator tool, which helps advisors explain an investment or portfolio strategy to a client by analyzing past performance in relation to a benchmark or competing investment; and
• 529 Suitability Manager, which helps advisors create disclosure reports that communicate the fees and state tax benefits associated with 529 college savings plans.
In addition, we added portfolio accounting and reporting capabilities to Advisor Workstation Office Edition. The new system includes importing, portfolio tracking, performance reporting, and accounting functionality, and it allows financial advisors to easily merge client accounting reports with Morningstar’s investment data and portfolio analytics. We also added hedge fund and offshore fund data to Advisor Workstation in 2006.
10
Morningstar Advisor Workstation is one of our five largest products based on revenue and made up 13.7%12.6%, 12.9%13.7%, and 10.8%12.9% of our consolidated revenue in 2007, 2006, and 2005, and 2004, respectively.
11
Morningstar Principia
Principia is our CD-ROM-based investment research and planning software for financial planners and had 47,83548,900 subscriptions as of December 31, 2006.2007. The modules offered in Principia provide data on mutual funds, stocks, separate accounts, variable annuity/life subaccounts, exchange-traded funds, closed-end funds, and defined contribution plans.plans, asset allocation, and presentations and education. Each module is available separately or together in a CD-ROM format and features searching, screening, and ranking tools. Principia allows advisors to create integrated portfolios for clients and offers three-page Portfolio Snapshot reports that provide a comprehensive picture of the client’s portfolio. The Snapshot report shows overall style and sector weightings as well as the cumulative exposure to individual stocks. The Snapshot report is among those approved by the National Association of Securities Dealers for financial advisors to distribute and review with their clients. Principia prices generally range from approximately $635$675 per year for monthly updates on one investment database to $2,925$3,345 per year for monthly updates on the complete package spanning all investment universes.universes, or $5,335 for all investment universes plus additional modules for asset allocation and presentations and education. Pricing for Principia Enterprise licenses varies based on the investment universes selected, level of functionality, and number of users and generally starts at about $655$675 per user.
In 2006,2007, we added a Variable Annuity Advanced moduletwo new modules, Asset allocation and Presentations &Education, to the Principia product line, which provides additional policy-level information on each variable annuity contract in our database. This additional information became available through our acquisition of VARDS.line.
Principia is one of our five largest products based on revenue and accounted for 9.1%6.6%, 12.7%9.1%, and 16.3%12.7% of our consolidated revenue in 2007, 2006, 2005, and 2004,2005, respectively.
Morningstar Managed Portfolios
Morningstar Managed Portfolios is a fee-based discretionary asset management service that includes a series of mutual fund, and exchange-traded fund, and stock portfolios tailored to meet specific investment time horizons and risk levels. This program is only available through financial advisors. Our team of investment professionals uses a disciplined process for asset allocation, fund selection, and portfolio construction. They actively monitor the portfolios and make adjustments as needed. We complement these asset management services with online client-management functions such as risk profiling and access to client statements, transaction capabilities, and performance reports.
We introduced the Morningstar Managed Portfolios program in 2001 and had approximately $1.8$2.2 billion in assets under management as of December 31, 2006.2007. We charge asset-based fees for Morningstar Managed Portfolios. The management fee is based on a tiered schedule that depends on the client’s average daily portfolio balance and generally ranges from 0.20% to 0.40% of assets.
In 2007, we launched Managed Portfolios Select Stock Baskets, a managed account service consisting of individually customized stock portfolios based on Morningstar’s proprietary indexes and independent equity research. The Morningstar Indexes form the basis of each stock basket’s investment composition, and the stock basket is tailored to suit an investor’s specific parameters, including sector and industry exposure, stock restrictions, existing holdings, and personal tax situation. Our investment professionals then select stocks for the portfolio using Morningstar’s extensive data and research on the stocks within the index, giving more weight to higher-rated stocks and less weight to stocks with low Morningstar Ratings.
The Morningstar Managed Portfolios program is offered through Morningstar Investment Services, Inc., a registered investment advisor, registered broker-dealer, member of the National Association of Securities Dealers (NASD)Financial Industry Regulatory Authority, Inc. (FINRA), and wholly owned subsidiary of Morningstar, Inc.
In addition to the products described above, we offer a series of NASD-reviewedFINRA-reviewed Financial Communications materials that advisors can use to educate clients about asset allocation and demonstrate other key investment concepts. The materials include our SBBI Kit, which is a collection of presentation materials based on Ibbotson Associates’ Stocks, Bonds, Bills, and Inflation research. In addition, we offer free Web sites for advisors and introduced a new magazine, Morningstar Advisor, in 2007.
12
Institutional Segment
For institutional clients, our largest products and services based on revenue include:
•· Investment Consulting, which focuses on investment monitoring and asset allocation for funds of funds, including mutual funds and variable annuities;
•· Licensed Data, a set of investment data spanning 10 core databases, available through electronic data feeds;
•· Retirement Advice, including the Morningstar Retirement Manager and Advice by Ibbotson platforms;
•· Morningstar Direct, a Web-based institutional research platform that provides advanced research and tools on the complete range of securities in Morningstar’s global database;
·Morningstar Workstation for institutions (formerly S&P Micropal Workstation), a desktop resource for advanced analysis of fund performance;
·Licensed Tools and Content, a set of online tools and editorial content designed for institutions to use in their Web sites and software; and
•· Morningstar Direct, a Web-based institutional research platform that provides advanced research and tools on the complete range of securities in Morningstar’s global database;EnCorr, an asset allocation software package.
11
•The Institutional segment also includes Investment Profiles & Guides, which are designed for institutions to use in communicating investment information to individual investors; and
•Morningstar EnCorr, an asset allocation software package.
With the addition of Aspect Huntley, this segment now includesIndexes, a growing product line that currently covers U.S. equities (by style, capitalization, sector, and dividend), commodities, bonds, and equity focus index families; and financial information as well as otherand data feeds on Australian stocks, which we sell to stock brokers, information providers, and financial Web sites. The Institutional segment also includes the hedge fund and separate account database division we acquired from InvestorForce.
As of December 31, 2006,2007, we served approximately 1,7002,400 clients through our Institutional segment, including banks, brokerage firms, insurance companies, mutual fund companies, media outlets, and retirement plan sponsors and providers. We believe our institutional clients value our independence, breadth of information, and customized services; in addition, we believe our research, tools, and advice reach many individual investors through this channel. Across the Institutional segment, we’ve established relationships with many of the largest companies in the financial services industry, including Fidelity,AEGON/Transamerica, Prudential, ING, MetLife, Nationwide, and Prudential.Fidelity. Approximately 20%27% of our institutional sales are to clients locatedsegment revenue is from outside of the United States—primarily in Australia, Canada, and various countries in Europe. We typically sell our institutional products based on a contract term of one to three years.
We market our products for institutional clientsinstitutions almost exclusively through our sales team. We provide marketing support for our sales team in the form ofwith online and print advertising, public relations, direct mail, and conference exhibits. We also have data reselling agreements with third-party providers of investment tools and applications, allowing us to increase the distribution of our data with minimal additional cost.
For Licensed Data and Investment Profiles & Guides, our primary competitors are Bloomberg, FactSet Research Systems, Lipper, Standard & Poor’s, Thomson Financial, Eurekahedge, eVestment Alliance, and Thomson Financial.Hedge Fund Research, Inc. For Morningstar Direct, our primary competitors are Bloomberg, eVestment Alliance, FactSet Research Systems, Informa, Lipper, Mercer, MPI Stylus, PerTrac, Strategic Insight, Wilshire, and Zephyr Management. Our Investment Consulting business competes primarily with Lipper, Standard & Poor’s,Frank Russell, Mercer, and Wilshire, as well as some smaller competitorsfirms in the retirement consulting business. In the retirement advice market, we compete primarily with Financial Engines, Guided Choice, Mesirow Financial, and Promanage.ProManage.
Most products within our Institutional segment have not shown pronounced seasonality.
Our largest customer in the Institutional segment accounted for approximately 10%9% of segment revenue in 2006.2007.
13
Investment Consulting
Our Investment Consulting area provides a broad range of services, many of which involve emphasize investment monitoring and asset allocation for funds of funds, including mutual funds and variable annuities. We offer Investment Consulting services primarily through Morningstar Associates, LLC and Ibbotson Associates, Inc., which are registered investment advisors and wholly owned subsidiaries of Morningstar, Inc. In both areas, we emphasize contracts where we’re paid a percentage of assets under management for ongoing investment management and consulting, as opposed to one-time relationships where we’re paid a flat fee.
Morningstar Associates generally focuses on a small number of large relationships. We emphasize innovative solutions that improve the investor experience and help our clients build their businesses. We provide customized solutions that help clients differentiate their businesses.
Our investment professionals evaluate investment plans, recommend strategies, help set investment policies, develop asset allocation programs, construct portfolios, and monitor ongoing performance. We offer these consulting services to clients in the United States, Asia, Australia, Canada, and Europe, including insurance companies, investment management companies, mutual fund companies, and broker-dealers. We also provide services for retirement plan sponsors and providers, including developing plan lineups, creating investment policy statements, and monitoring investment performance.
Our team of investment consultants draws on both quantitative research tools and qualitative expertise to assess investment programs, provide detailed analysis of performance and portfolio characteristics, and make comprehensive recommendations for improvement. We also offer investment manager search services. Our staff combines the depth of Morningstar’s historical fundamental databases with detailed investment knowledge and investment experience to recommend qualified candidates for subadvisory firms, mutual fund managers, variable insurance trust managers, and separate account managers. Our investment monitoring services include analyst reports, customizable board reports, select lists, watch lists, and in-depth attribution analysis. Pricing for our consulting services is based on the scope of work and the level of service required. For agreements where we act as a portfolio construction manager for a mutual fund or variable annuity, we receive asset-based fees.
In 2006, we introduced a customized, discretionary portfolio management and oversight service for foundations and endowments. The new program is designed to serve mid-sized foundations and endowments with less than $1 billion in assets.
Also in 2006, we significantly expanded our Investment Consulting businessarea when we acquired Ibbotson.Ibbotson Associates, which has a well-established consulting business that began in 1977. Ibbotson’s Investment Consulting unit is a leading authority on asset allocation and draws on its knowledge of capital markets and portfolio building to construct portfolios from the top down, starting at the asset class level. Ibbotson develops customized asset allocation programs for mutual fund firms, banks, broker-dealers, and insurance companies.
Ibbotson provides a range of consulting services, including licensing its asset allocation models, providing consulting services, and acting as a portfolio sub-advisor. Ibbotson works with different types of investment options, including mutual funds, variable annuities, and exchange traded funds, and provides both strategic and dynamic asset allocation services. The group offers consulting services and funds-of-funds subadvisory services, as well as tailored model portfolios, fund classification schemes, and questionnaire design.
12
We offer our Investment ConsultingPricing for the consulting services primarilywe provide through both Morningstar Associates LLC and Ibbotson Associates Inc.,is based on the scope of work and the level of service required. In the majority of our contracts, we receive asset-based fees, reflecting our work as a portfolio construction manager or subadvisor for a mutual fund or variable annuity.
In 2007, we expanded the range of investment strategies on which are registered investment advisorswe provide advisory services and wholly owned subsidiariescontinued working to expand our consulting business outside of Morningstar, Inc.the United States.
Investment Consulting is currently our largest product based on revenue and accounted for 14.8%17.4%, 9.6%14.8%, and 7.7%9.6% of our consolidated revenue in 2007, 2006, and 2005, and 2004, respectively.
14
Licensed Data
Our Licensed Data service gives institutions access to a set of proprietary investment data spanning 10 core databases. The data packages we offer include proprietary statistics, such as the Morningstar Style Box and Morningstar Rating, and a wide range of other data, including information on investment performance, risk, portfolios, operations data, fees and expenses, cash flows, and ownership. Institutions can use Licensed Data in a variety of investor communications, including Web sites, print publications, and marketing fact sheets, as well as for internal research and product development. We deliver Licensed Data through electronic data feeds and provide daily updates to clients. Pricing for Licensed Data is based on the number of funds or other securities covered, the amount of information provided for each security, and the level of distribution.
In 2006,2007, we expanded ourintroduced data offerings to include prospectus summaries, the Morningstar Ownership Zone, pensionfeeds containing daily net asset values and lifeadded information covering hedge funds, based in the United Kingdom,global pricing feeds, and historical asset class returns from Ibbotson’s Stocks, Bonds, Bills, and Inflation database.returns-based style analysis.
Licensed Data is one of our five largest products based on revenue and accounted for 12.0%13.6%, 14.3%12.0%, and 15.1%14.3% of our consolidated revenue in 2007, 2006, 2005, and 2004,2005, respectively.
Retirement Advice
OurWe offer two Retirement Advice offering includes the Morningstar Retirement Manager and Advice by Ibbotson platforms, which both provide advice and guidance toofferings that help retirement plan participants plan and invest for retirement.retirement: Morningstar Retirement Manager, a service of Morningstar Associates, LLC, and Advice by Ibbotson, a service of Ibbotson Associates, Inc. Both companies are registered investment advisors and wholly owned subsidiaries of Morningstar, Inc.
Morningstar Retirement Manager is designed to help retirement plan participants determine how much to invest and which investments are most appropriate for their portfolios. It gives clear guidance explaining whether participants’ suggested plans are on target to meet their retirement goals. As part of this service, we deliver personalized recommendations for a target savings goal, a recommended contribution rate to help achieve that goal, a portfolio mix based on risk tolerance, and specific fund recommendations. Morningstar Retirement Manager includes a managed account service designed for plan participants who choose to delegate management of their portfolios to Morningstar’s investment professionals. We offer these services primarily through retirement plan providers—typically third-party asset management companies or companies that offer administrative services to retirement plans. These providers often offer proprietary mutual funds to retirement plan sponsors and their participants. As of December 31, 2006, more than 92007, approximately 8.8 million plan participants had access to Morningstar Retirement Manager through approximately 71,00075,000 plan sponsors and 2422 plan providers. Pricing for Morningstar Retirement Manager depends on the number of participants, as well as the level of service we provide.
Advice by Ibbotson offers a set of services and proprietary software to give retirement plan participants access to investment education, self-service advice, and managed retirement accounts. We offer these services mainly through retirement plan providers. The platform includes installed software advice solutions that can be co-branded by retirement plan sponsors and providers. Advice by Ibbotson combines asset allocation and patented human capital methodologies (patent pending) that help participants determine how to prepare for retirement based on their financial assets as well as their future earnings and savings power. Advice by Ibbotson’s customized software can be integrated with existing systems to help investors accumulate wealth, transition into retirement, and manage income during retirement. As of December 31, 2006, nearly 82007, approximately 6.6 million plan participants had access to Advice by Ibbotson through approximately 37,00060,000 plan sponsors and seveneight plan providers. Pricing for Advice by Ibbotson depends on the number of participants, as well as the level of service we provide.
Morningstar Workstation for institutions (formerly S&P Micropal Workstation)
With our acquisition of the mutual fund data business from Standard & Poor’s, Morningstar now offers Morningstar Workstation for institutions (formerly S&P Micropal Workstation), an all-inclusive desktop resource for advanced performance analysis of global funds. It provides a comprehensive toolkit for the calculation, benchmarking, and presentation of performance information. Investment professionals can assess global fund performance and suitability using more than 85 calculation options, 85 currencies, and 15,000 indexes. Users can define their own analysis parameters and incorporate private data into performance calculations. Morningstar Workstation includes both standard and customizable templates for data presentation and allows users to easily integrate tables and charts into documents, spreadsheets, and presentations.
Pricing for Morningstar Workstation is based on the number of users and database subscriptions.
15
Morningstar Direct
Morningstar Direct is a Web-based institutional research platform that provides advanced research on the complete range of securities in Morningstar’s global database. This comprehensive research platform allows research and marketing professionals to conduct advanced performance comparisons and in-depth analyses of a portfolio’s underlying investment style. Morningstar Direct includes access to numerous investment universes, including U.S. mutual funds; European and offshore funds; funds based in most major markets around the world; stocks; separate accounts; hedge funds; closed-end funds; exchange-traded funds; global equity ownership data; variable annuity and life portfolios; and market indexes.
In 2007, we enhanced Morningstar Direct by incorporating additional data on shorts and derivatives, adding a new alerts feature, enhancing our capabilities in aggregate and custom funds, adding additional charts, and improving the Report Builder functionality. In addition, we increased index coverage to nearly 30,000 global indexes and expanded our coverage in pension and life funds, offshore funds, and other data universes outside the United States. Morningstar Direct had 2,229 licensed users worldwide as of December 31, 2007.
Pricing for Morningstar Direct is based on the number of licenses purchased. We offer our Retirement Advice services primarily through Morningstar Associates, LLCcharge $15,000 for the first user, $10,000 for the second user, and Ibbotson Associates, Inc., which are registered investment advisors and wholly owned subsidiaries of Morningstar, Inc.$7,500 for each additional user.

Licensed Tools and Content
We offer an extensive set of online tools and editorial content that institutional clients can license to use in their Web sites and software products. Clients can select from more than 40 different tools and content offerings or purchase modules focusing on
13
screening and performance tools, editorial commentary and educational articles, or goal planning and portfolio analysis. Our online tools and content can be customized to meet the needs of international audiences, and can also be modified to analyze a set of investments, focus on client-defined data points, or perform calculations required by specific products or services. We also offer licenses for investment research and portfolio analysis tools. Licensed Tools and Content can be integrated with a client’s existing Web site and allows users to drill down into the underlying data when researching a potential investment.
In 2006, we added a series of proprietary Morningstar Stock Charts that are available for license. Clients can use these charts to track price movements, perform fundamental analysis, and evaluate technical aspects of stocks such as volume, momentum, and trends.
Pricing for Licensed Tools and Content depends on the audience, the level of distribution, and the scope of information and functionality licensed.
Morningstar DirectEnCorr
Morningstar Direct is a Web-based institutional research platform that provides advanced research on the complete range of securities in Morningstar’s global database. This comprehensive research platform allows research and marketing professionals to conduct advanced performance comparisons and in-depth analyses of a portfolio’s underlying investment style. Morningstar Direct includes access to numerous investment universes, including U.S. mutual funds; European and offshore funds; funds based in most major markets around the world; stocks; separate accounts; global hedge funds; closed-end funds; exchange-traded funds; global equity ownership data; variable annuity and life portfolios; and market indexes.
In 2006, we launched a new version of Morningstar Direct that included expanded information on U.S. stocks, a global stock ownership database, hedge fund firm portfolio information, hedge fund analyst reports, and an expanded European mutual fund database. We also added several news feeds and a library of pre-formatted graphs and data tables that users can incorporate into their investment fact sheets. We continued to expand our sales efforts outside the United States in 2006. Morningstar Direct had 1,348 licensed users worldwide as of December 31, 2006.
Pricing for Morningstar Direct is based on the number of licenses purchased. We charge $15,000 for the first user, $10,000 for the second user, and $7,500 for each additional user.
Investment Profiles & Guides
Our Investment Profiles & Guides are designed for institutions to use as an alternative to creating their own materials for communicating with clients, or for companies to use in communicating with retirement plan participants. Investment Profiles are single-page reports that combine key elements from our data, design, and editorial content to clearly present the essential facts about an investment. They cover mutual funds, stocks, exchange-traded funds, hedge funds, variable annuity/life subaccounts, separate accounts, custom funds, offshore funds, pension and life funds, and Section 529 College Savings Plans. We also offer Investment Guides, which are a collection of Investment Profiles combined with summary information and educational articles. Morningstar handles all of the document production, including data collection, design, and delivery. Investment Profiles & Guides are available in multiple languages both in print and online, and can be delivered as a stand-alone communication vehicle or through Morningstar Retirement Manager.
Pricing for Investment Profiles and Investment Guides is based on the number of securities covered, the amount of information we provide, and the level of distribution.
Morningstar EnCorr
Morningstar EnCorr, which became part of our Institutional segment following the Ibbotson acquisition, is an asset allocation software platform that helps institutional clients create, analyze, and implement asset allocation strategies. This advanced research tool allows investment professionals to develop recommendations and produce portfolios at various risk/reward tradeoffs along the efficient frontier, which is a visual representation of the asset mixes that deliver the higherhighest return per unit of risk. EnCorr incorporates historical data analysis, strategic asset allocation, forecasting, returns-based style analysis, portfolio attribution, and advanced statistical and graphical analyses. Target clients include analysts, investment consultants, registered investment advisors, and portfolio managers.
Pricing for EnCorr is based on the number of licenses purchased. We charge $10,000 for the first user and $3,000 for each additional user.
1416
Morningstar Indexes
Based on the same methodology as the Morningstar Style Box, our 3350 real-time indexes track the U.S. equity market by capitalization, investment style, and investment style.other traits. They include a broad market index, three capitalization-based indexes, three composite style indexes, nine indexes based on investment style and market capitalization, 15 sector indexes, and two dividend indexes. The Morningstar Indexes cover approximately 97% of the market capitalization of the U.S. equity market. We charge licensing fees for the Morningstar Indexes, with fee levels varying by client.
Barclays Global Investors licenses our 16 style-basedindexes, 14 bond indexes, five commodity indexes, and has introduced nine exchange-traded funds (ETFs) based on the Morningstar Indexes.
In 2006, we created the Morningstar Dividend Leaders Index, a broadly diversified portfolio of 100 stocks that have strong potential for sustaining and increasing dividend payouts. First Trust Advisors L.P. licenses the Dividend Leaders Index and introduced an exchange-traded fund based on this index in February 2006.
We’re in the process of developing a series of commodity indexes, which we plan to introduce in 2007. We’re also planning to launch a family of fixed-income indexes, the Morningstar Fixed-Income Indexes, which can serve as tools for portfolio benchmarking and performance measurement.one focused stock index. These indexes can also be licensed to institutions for creating investment vehicles, including mutual funds, exchange-traded funds (ETFs), and derivative securities. We plancharge licensing fees for the Morningstar Indexes, with fees consisting of an annual licensing fee as well as fees linked to launch theseassets under management.
We currently license the Morningstar Indexes to several institutions which offer exchange-traded funds or exchange-traded notes based on the indexes, in stages beginning inincluding Barclays Global Investors, First Trust, and Claymore Investments.
In 2007, we introduced a series of commodity indexes, which consists of five indexes providing diversified commodity exposure; the Morningstar Bond Index Family, which consists of 14 indexes that track the U.S. bond market by sector and term structure; and the Morningstar Wide Moat Focus Index, which is composed of 20 wide moat stocks with the first indexes coveringbest valuations as measured by the core fixed-income categories of U.S. TreasuryMorningstar price/fair value ratio. In 2007, the ELEMENTS platform launched exchange-traded notes (ETNs) based on the Wide Moat Focus Index that trade on the New York Stock Exchange. The ETNs are issued by Deutsche Bank and corporate bonds.distributed by Nuveen Investments and Merrill Lynch.
Marketing and Sales
We promote our print, software, Web-based products and services, and consulting services with a staff of sales and marketing professionals, as well as an in-house public relations.relations team. Our marketing staff includes both product specialists and a corporate marketing group that manages company initiatives. As part of these groups, we haveOur sales team includes several strategic account managers who oversee all aspects of our largest institutional client relationships. We also have a sales operations staff, which focuses on tracking revenue, forecasting sales, and other tasks to support our sales team. Across all three of our segments, we emphasize high levels of product support to help our customers use our products effectively and provide our product managers with feedback from customers. We had approximately 200250 sales and marketing professionals on staff as of December 31, 2006.2007.
International Operations
We conduct our business operations outside of the United States through wholly owned or majority-owned operating subsidiaries doing business in each of the following markets:countries: Australia, Canada, France, Germany, India, Italy, Japan, the Netherlands, New Zealand, Norway, People’s Republic of China (both Hong Kong and the mainland), Singapore, Spain, Switzerland, Taiwan, Thailand, and the United Kingdom. See Note 5 of the Notes to our Consolidated Financial Statements for additional information concerning revenue from customers and long-lived assets from our business operations outside the United States. See Note 16 of the Notes to our Consolidated Financial Statements for information on a legal proceeding that may, if decided adversely to us, affect our ownership of our Australian and New Zealand subsidiaries.
In addition, we hold minority ownership positions in operating companies based in Denmark, Japan, Korea, and Sweden. As of December 31, 2006,2007, we owned approximately 35% of the outstanding shares in Morningstar Japan K.K. (Morningstar Japan) and our share had a market value of approximately $85.5$48 million. Morningstar Japan is publicly traded under ticker 4765 on the Osaka Stock Exchange “Hercules Market.” See Note 8 of the Notes to our Consolidated Financial Statements for information on our investments in unconsolidated entities.
To enable these companies to do business in their designated territories, we provide them with the rights to the Morningstar name and logo and with access to certain of our products and technology. Each company operating within a particular country is responsible for developing marketing plans tailored to meet the specific needs of investors within its own marketcountry and working with Morningstar’s data collection and development centers to create and maintain databases, develop new products, and enhance existing products.
See Item 1A—Risk Factors for a discussion of the risks related to our business operations outside of the United States.
17
Intellectual Property and Other Proprietary Rights
We treat our brand, product names and logos, software, technology, databases, and other products as proprietary. We try to protect this intellectual property by using trademark, copyright, patent and trade secrets laws, licensing and nondisclosure arrangements, and other security measures. For example, in the normal course of business, we only provide our intellectual property to third parties through standard
15
licensing agreements. The purposes of these agreements are to both define the extent and duration of any third-party usage rights and to provide for our continued ownership in any intellectual property furnished.
Because of the value of our brand name and logo, we have tried to register one or both of them in all of the relevant international classes under the trademark laws of most of the jurisdictions in which we do business. As we move into new countries, we are continuingconsider adding to effect these registrations and, in some jurisdictions, the registration ofregister certain product identifiers as well. To date, weWe have registered our name and/or logo in 12numerous countries and the European Union and have applied for registrations in several other countries.
We currently hold three U.S. patents, one U.K. patent, and one Canadian patent. We believe these patents represent our commitment to developing innovative products and tools for investors.
From time to time, we encounter jurisdictions in which one or more third parties have a pre-existing trademark registration in certain relevant international classes that may prevent us from registering our own marks in those jurisdictions. It is possible that our continued ability to use the “Morningstar” name or logo, either on a stand-alone basis or in association with certain products or services, could be compromised in those jurisdictions because of these pre-existing registrations. Similarly, from time to time, we encounter situations in certain jurisdictions where one or more third parties are already using the Morningstar name, either as part of a registered corporate name, a registered domain name or otherwise. It is possible that our ability to continue to effectively market certain of our products and/or services could be adversely affected by these usages.
“Morningstar” and the Morningstar logo are registered marks of Morningstar in the United States and in certain other jurisdictions. The following are also trademarks or service marks of our company in the United States:
Advice by Ibbotson® |
| Morningstar® Managed PortfoliosSM Select Stock Baskets |
Morningstar® Advisor WorkstationSM |
| Morningstar® Mutual FundsTM |
Morningstar.com® |
| Morningstar® Ownership ZoneSM |
Morningstar DirectSM |
| Morningstar® Portfolio BuilderSM |
Morningstar® EnCorr® |
| Morningstar® Principia® |
Morningstar® Equity Research |
| Morningstar RatingTM |
Morningstar® ETFInvestorTM |
| Morningstar® Retirement Income StrategistSM |
Morningstar® ETFs 150TM |
| Morningstar® Retirement ManagerSM |
Morningstar® FundInvestorTM |
| Morningstar® Stewardship GradeSM |
Morningstar® Funds 500TM |
| Morningstar® StockInvestorTM |
Morningstar® IndexesSM |
| Morningstar® Stocks 500TM |
Morningstar® Investment GuidesTM |
| Morningstar Style BoxTM |
Morningstar® Investment ProfilesTM | Morningstar® Wide Moat FocusSM Index | |
Morningstar® Licensed DataSM |
| Portfolio X-Ray® |
Morningstar® |
| Stocks, Bonds, Bills, and Inflation® |
18
License Agreements
In the majority of our licensing agreements, we license our products and/or other intellectual property to our customers for a fee. We generally use our standard agreements, whether in paper or electronic form, and we do not provide our products and services to customers or other users without having an agreement in place.
We also maintain licensing agreements with each of our minority-owned operations. We put these agreements in place so these companies can use our intellectual property, such as our products and trademarks, to develop and market similar products under our name in their operating territories.
We also license certain intellectual property from third parties, and in the ordinary course of our business, we incorporate and use intellectual property from a variety of third-party sources.
Seasonality
We believe our business has a modest amount of seasonality. Most of our products are sold with subscription or license terms of at least one year, and we recognize revenue ratably over the term of each subscription or license agreement. This tends to moderate seasonality in sales patterns for individual products. Over the past three years, sequential revenue growth at the company level on a consolidated basis in the first quarter has been slightly higher than in other quarters. Refer to the discussion in Business Segments, Products, and Services above for additional information on the seasonality of each segment.
16
Customers
In 2006,2007, our largest customer accounted for less than 5% of our consolidated revenue.
Competitive Landscape
The economic and financial information marketindustry has been marked by increased consolidation over the past five years, with the strongest players generally gaining market share at the expense of smaller competitors. Our largest competitors are Lipper (a division of Reuters), Standard & Poor’s, and Thomson Financial Services. These companies have financial resources that are significantly greater than ours. In May 2007, Thomson and Reuters entered into an agreement to form a combined company, Thomson-Reuters. Pending regulatory approval, the two companies expect to complete the merger in the second quarter of 2008. The proposed formation of Thomson-Reuters would create a larger company with greater financial resources. We also have a number of smaller competitors in each of our three business segments; for more information, refer to the discussion in Business Segments, Products, and Services above. Most of our competitors compete with individual products or segments of our business; we are not aware of any company that offers substantially similar product solutions in all three of our segments.
Our non-U.S. operations outside the United States compete with a variety of other companies not named above, including Financial Express, Interactive Data Corporation, IWL Limited, MoneyMate,Telekurs, Towers Perrin, and
van Eyk Research.
We believe the most important competitive factors in our industry are brand and reputation, data accuracy and quality, and comprehensiveness,breadth of data coverage, quality of investment analysis and analytics, design, reliability, product support capabilities,reliability, and value of the products and services provided.
Research and Development
A key aspect of our growth strategy is to expand our investment research capabilities and enhance our existing products and services. We strive to rapidly adopt new technology that can improve our products and services. We have also built a flexible technology platform that allows our products to work together across a full range of investment databases, delivery formats, and market segments. As a general practice, we manage our own Web sites and build our own software applications rather than relying on outside vendors. This allows us to control our development and better manage costs, enabling us to respond quickly to market changes and to meet customer needs efficiently. As of December 31, 2006,2007, our technology team consisted of approximately 340400 programmers and technology and infrastructure professionals.
In 2007, 2006, 2005, and 2004,2005, our development expense represented 9.4%8.1%, 8.7%9.4%, and 9.0%8.7%, respectively, of our revenue. We expect that development expense will continue to represent a meaningful percentage of our revenue in the future.
19
Government Regulation
United States
Our investment advisory and broker-dealer businesses are subject to extensive regulation in the United States at both the federal and state level, as well as by self-regulatory organizations. Financial services companies are among the nation’s most extensively regulated. The Securities and Exchange Commission (SEC) is responsible for enforcing the federal securities laws and serves as a supervisory body for all federally registered investment advisors and broker-dealers.
As of December 31, 2006,2007, four of our subsidiaries, Ibbotson Associates, Inc., Ibbotson Associates Advisors, LLC, Morningstar Associates, LLC, and Morningstar Investment Services, Inc. are registered as investment advisors with the SEC under the Investment Advisers Act of 1940 (Advisers Act). As registered investment advisors, these companies are subject to the requirements and regulations of the Advisers Act. Such requirements relate to, among other things, record-keeping and reporting requirements, disclosure requirements, and limitations on principal transactions between an advisor and advisory clients, as well as general anti-fraud prohibitions.
Because Morningstar Associates and Ibbotson Associates provide investment advisory services to retirement plans and their participants, they may be acting as fiduciaries under the Employee Retirement Income Security Act of 1974 (ERISA). As fiduciaries under ERISA, Morningstar Associates and Ibbotson Associates have duties of loyalty and prudence, as well as duties to diversify investments and to follow plan documents to the extent that they comply with the applicable portions of ERISA.
We provide each of our investment advisor companies with financial and operational support. However, each of them operates independently from other areas of Morningstar, using separate personnel and making independent investment decisions.
Morningstar Investment Services is a broker-dealer registered under the Securities Exchange Act of 1934 (Exchange Act) and a member of the National Association of Securities Dealers (NASD)Financial Industry Regulatory Authority, Inc. (FINRA). The regulation of broker-dealers has, to a large extent, been delegated by the federal securities laws to self-regulatory organizations, including the NASD.FINRA. Subject to approval by the SEC, the
17
NASDFINRA adopts rules that govern its members. The NASDFINRA conducts periodic examinations of the operations of Morningstar Investment Services. Broker-dealers are subject to regulations that cover all aspects of the securities business, including sales practices, market making and trading among broker-dealers, use and safekeeping of clients’ funds and securities, capital structure, record-keeping, and the conduct of directors, officers, and employees. Violation of applicable regulations can result in the revocation of a broker-dealer license, the imposition of censures or fines, and the suspension or expulsion of a firm or its officers or employees. Morningstar Investment Services is subject to certain net capital requirements under the Exchange Act. The net capital requirements, which specify minimum net capital levels for registered broker-dealers, are designed to measure the financial soundness and liquidity of broker-dealers.
Additional legislation and regulations, including those relating to the activities of investment advisors and broker-dealers, changes in rules imposed by the SEC or other U.S. or non-U.S. regulatory authorities and self regulatory organizations, or changes in the interpretation or enforcement of existing laws and rules may adversely affect our business and profitability. Our businesses may be materially affected not only by regulations applicable to it as an investment advisor or broker-dealer, but also by regulations that apply to companies generally.
20
Australia
In order to provide financial information services in Australia, our Australian subsidiaries, Morningstar Research Pty Limited (Morningstar Australia) and Huntley’s Investment Information Pty Limited, must hold an Australian Financial Services License and submit to the jurisdiction of the Australian Securities and Investments Commission (ASIC). This license requires Morningstar Australia and Huntley’s Investment Information Pty Limited to maintain positive net asset levels and sufficient cash resources to cover three months of expenses and to comply with the audit requirements of the ASIC. The availability of this license may be adversely affected by the legal proceeding described in Note 16 of the Notes to our Consolidated Financial Statements.
United Kingdom
Morningstar Associates Europe Limited is authorized and regulated by the U.K. Financial Services Authority as an investment advisor. As an authorized firm, this company is subject to the requirements and regulations of the Financial Services Authority. Such requirements relate to, among other things, financial reporting and other reporting obligations, record keeping, and cross-border requirements.
Employees
We had approximately 1,4401,720 employees as of December 31, 2006,2007, including approximately 220240 investment analysts 180(including consulting and quantitative research analysts), 300 data analysts, 340400 programmers and technology staff, 3040 designers, and 200250 sales and marketing professionals. Our employees are not represented by any unions and we have never experienced a walkout or strike.
Executive Officers
As of December 31, 2006,March 1, 2008, we had 1513 executive officers. The table below summarizes information about each of these officers.
Name |
| Age |
| Position |
Joe Mansueto |
|
|
| Chairman, Chief Executive Officer, and Director |
|
|
| ||
Chris Boruff |
|
|
| President, Advisor Business |
Peng Chen |
|
|
| President and Chief Investment Officer, Ibbotson Associates |
Scott Cooley | 39 | Chief Financial Officer | ||
Bevin Desmond |
|
|
| President, International Business |
|
|
| ||
Catherine Gillis Odelbo |
|
|
| President, Individual Business |
Tao Huang |
|
|
| Chief Operating Officer |
Elizabeth Kirscher |
|
|
| President, Data Services Business |
|
|
| ||
Don Phillips |
|
|
| Managing Director and Director |
Patrick Reinkemeyer |
|
|
| President, Morningstar Associates |
John Rekenthaler |
|
|
| Vice President, Research and New Product Development |
Richard |
|
|
| General Counsel and Corporate Secretary |
David W. Williams |
|
|
| Managing Director, Design |
18
Joe Mansueto
Joe Mansueto founded Morningstar in 1984. He has served as our chairman since our inception and as our chief executive officer from our inception to 1996 and from 2000 to the present. He holds a bachelor’s degree in business administration from The University of Chicago and a master’s degree in business administration from The University of Chicago Graduate School of Business.
Tim Armour21
Tim Armour has been one of our managing directors since 2000. He is responsible for strategic relationships and business development. He joined us in 1998 as our chief operating officer and from 1999 to 2000 served as our president. He holds a bachelor’s degree in business administration from Gettysburg College and a master’s degree in business administration from the Columbia Business School at Columbia University.
Chris Boruff
Chris Boruff has been the president of our advisor business since 2000. He is responsible for overseeing strategy, development, and marketing associated with our products for financial advisors. He joined us in 1996 as product manager for Principia, and from 1997 to 1998, he served as senior product manager of advisor products. From 1999 to 2000, he served as vice president of advisor products, where he was responsible for all marketing related to financial advisors. He holds a bachelor’s degree in economics and psychology from Northwestern University.
Peng Chen
Peng Chen has been president and chief investment officer of Ibbotson Associates since August 2006. Prior to Morningstar’s acquisition of Ibbotson, he served as itsIbbotson’s managing director and chief investment officer. He joined Ibbotson in 1997 and played a key role in the development of its investment consulting and 401(k) advice/managed retirement account services. He received a bachelor’s degree in industrial management engineering from Harbin Institute of Technology and a master’s and doctorate in consumer economics from The Ohio State University.
Scott Cooley
Scott Cooley has been our chief financial officer since August 2007. Before joining Morningstar in 1996 as a stock analyst, he was a bank examiner for the Federal Deposit Insurance Corporation (FDIC), where he focused on credit analysis and asset-backed securities. From 1996 until 2003, he was an analyst, editor, and manager for Morningstar.com, Morningstar Mutual Funds, and other Morningstar publications. He became CEO of Morningstar Australia and Morningstar New Zealand in 2003 and served as co-CEO of these operations following our acquisition of Aspect Huntley in July 2006. He holds a bachelor’s degree in economics and social science and a master’s degree in history from Illinois State University.
Bevin Desmond
Bevin Desmond has been president of our international business since 2000. She is responsible for identifying and developing our business in new markets,countries, managing and directing operations, and launching new products. She joined us in 1993 and was one of three employees who started our international business. From 1998 to 2000, she served as manager of all international ventures. She holds a bachelor’s degree in psychology from St. Mary’s College.
Martha Dustin Boudos
Martha Dustin Boudos has been our chief financial officer since 2001. She oversees our finance, human resources, and accounting operations. She joined us in 1992 as a marketing manager. She also played a key role in the creation of our Web site for individual investors, Morningstar.com. From 1998 to 2000, she was responsible for our retirement advice service. During 2001, she served as our vice president of human resources. She holds a bachelor’s degree in political science from Wellesley College and a master’s degree in business administration from the Kellogg School of Management at Northwestern University.
In March 2007, we announced that Martha will be taking on a new role in the company. We are in the process of searching for a new chief financial officer, and Martha will remain chief financial officer until we name a replacement.
Catherine Gillis Odelbo
Catherine Gillis Odelbo has been president of our Individual segment since 2000. She joined us in 1988 as a mutual fund analyst and from 1999 to 2000 served as senior vice president of content development for the company, as well as publisher and editor of our stock and closed-end fund research. She holds a bachelor’s degree in American history from The University of Chicago and a master’s degree in business administration from The University of Chicago Graduate School of Business.
Tao Huang
Tao Huang has been our chief operating officer since 2000. He is responsible for corporate strategy, oversight of all business units, and directing our day-to-day operations. He joined us in 1990 as a software developer and from 1996 to 1998 served as chief technology officer. From 1998 to 2000, he served as senior vice president of business development and head of international
19
operations. He holds a bachelor’s degree in computer science from Hunan University in China, a master’s degree in computer science from Marquette University, and a master’s degree in business administration from The University of Chicago Graduate School of Business.
22
Elizabeth Kirscher
Elizabeth Kirscher has been president of our data services business since 2000. She is responsible for managing our investment databases and related products. She joined us in 1995 as a major accounts manager in our institutional sales area. From 1998 to 1999, she served as international product manager and worked on the launch of Morningstar Japan. From 1999 to 2000, she was director of sales and business development for Morningstar.com and marketed Morningstar.com data and tools to other Web sites. She holds a bachelor’s degree from Vassar College and a master’s degree in business administration from the Columbia Business School at Columbia University.
Art Lutschaunig
Art Lutschaunig has been president and chief investment officer for Morningstar Investment Services since August 2001. He is responsible for managing the investment services business, including oversight of the group’s investment research and portfolio management. Before joining us in May 2001, he was an independent consultant. From 2000 to 2001, he served as president of Giving Capital, Inc. He holds a bachelor’s degree in marketing from Villanova University.
Don Phillips
Don Phillips has been one of our managing directors since 2000. He is responsible for corporate strategy, research, and corporate communications. He joined us in 1986 as our first analyst. He served as our vice president and publisher from 1991 to 1996, as our president from 1996 to 1998, and as our chief executive officer from 1998 to 2000. He has served on our board of directors since August 1999. He also serves on the board of directors for Morningstar Japan. He holds a bachelor’s degree in English from the University of Texas and a master’s degree in American literature from The University of Chicago.
Patrick Reinkemeyer
Patrick Reinkemeyer has been president of Morningstar Associates since October 2004. He is responsible for Morningstar’s investment consulting and retirement businesses. He joined us in 1996 and directed our print and software variable annuity/life products from 1996 to 1997. From 1998 until 2001, he was director of Morningstar’s investment consulting business. From 2001 until October 2004, he served as president of Morningstar’s institutional investment consulting business. He joined us in 1996. From 1996 to 1997, he directed our print and software variable annuity/life products.consulting. He holds a bachelor’s degree in history from Middlebury College and a master’s degree in business administration from The University of Chicago Graduate School of Business.
John Rekenthaler
John Rekenthaler has been vice president of new product development since October 2004. In April 2005, he took on additional responsibilities as vice president of research. From 2001 until October 2004, he served as president of Morningstar Associates and head of the company’s retirement advice business. He joined us in 1988 as an assistant editor. From 1991 to 1995, he served as editor of Morningstar Mutual Funds and Morningstar FundInvestor. From 1998 to 2000, he served as our director of research. He holds a bachelor’s degree in English from the University of Pennsylvania and a master’s degree in business administration from The University of Chicago Graduate School of Business.
Richard E. Robbins
Richard E. Robbins has been our general counsel and corporate secretary since August 2005. He is responsible for directing Morningstar’s legal department and managing itsour relationships with outside counsel. From May 1999 until he joined Morningstar, he was a partner at Sidley Austin Brown & Wood LLP (now known as Sidley Austin LLP), which he joined as an associate in August 1991. He holds bachelor’s and master’s degrees in computer science and electrical engineering from the Massachusetts Institute of Technology and a juris doctor degree from The University of Chicago Law School.
David W. Williams
David W. Williams has been one of our managing directors since 2000. He is in charge of design and its application to brand identity, products, communications, and the workplace. He joined us in 1993 and has been instrumental in establishing design as one of our recognized core capabilities. He holds a bachelor’s degree in industrial design from The Ohio State University and a master’s degree in fine arts from the Yale University School of Art.
20
23
Company Information
We were incorporated in Illinois on May 16, 1984. Our corporate headquarters are located at 225 West Wacker Drive, Chicago, Illinois, 60606.
We maintain a Web site at http://corporate.morningstar.com. Our Annual Report on Form 10-K, quarterly reports on Form 10-Q, current reports on Form 8-K, and amendments to any of these documents are available free of charge on this site as soon as reasonably practicable after the reports are filed with or furnished to the Securities and Exchange Commission. We also post quarterly press releases on our financial results and other documents containing additional information related to our company on this site. We provide this Web site and the information contained in or connected to it for informational purposes only. That information is not part of this Annual Report on Form 10-K.
You should carefully consider the risks described below and all of the other information included in this Form 10-K when deciding whether to invest in our common stock or otherwise evaluating our business. If any of the following risks actually occur,materialize, our business, financial condition, or operating results could suffer. In this case, the trading price of our common stock could decline, and you may lose all or part of your investment.
Competition could reduce our share of the investment research market and hurt our financial performance.
We operate in a highly competitive industry, with many investment research providers competing for business from individual investors, financial advisors, and institutional clients. We compete with many different types of companies that vary in size, product scope, and media focus, including large and well-established distributors of financial information, such as Lipper, a division of Reuters; The McGraw-Hill Companies, through its Standard & Poor’s division; and Thomson Corporation, through its Thomson Financial Services division. In May 2007, Thomson and Reuters entered into an agreement to form a combined company, Thomson-Reuters. Pending regulatory approval, the two companies expect to complete the merger in the second quarter of 2008. The proposed formation of Thomson-Reuters would create a larger company with greater financial resources. In addition to these key competitors, we compete with a variety of other companies in different areas of our business, which we discuss in greater detail in the Business Segments, Products, and Services section in Item 1—Business.
Many of our competitors have larger customer bases and significantly greater resources than we do. This may allow these competitors to respond more quickly to new technologies and changes in demand for products and services, to devote greater resources to developing and promoting their services, and to make more attractive offers to potential clients, subscribers, and strategic partners. Industry consolidation may also lead to more intense competition. Increased competition could result in price reductions, reduced gross margins, or loss of market share, any of which could hurt our business, operating results, or financial condition.
If we do not maintain and increase the number of subscriptions and license agreements, our operating results could suffer.
A substantial portion of our revenue is generated from subscriptions and license agreements. In 2006, “walk-in” revenue, which we define as revenue from licenses or subscriptions that were in place at the beginning of the year adjusted for cancellations, currency translations, and other routine adjustments during the year, accounted for 47.5% of our revenue excluding 2006 acquisitions. Renewal revenue, which we define as revenue from renewals of licenses or subscriptions, accounted for 36.3% of our revenue excluding 2006 acquisitions. In general, our subscriptions are paid in advance. We may be obligated to refund a portion of prepaid subscription fees when a customer cancels. Cancellations may have a negative impact on our revenue and cash position. Our license agreements, which typically do not allow for cancellation, have terms ranging from one to three years. As of January 1, 2007, we had subscriptions and license agreements in place that were expected to generate $182.9 million of revenue in 2007, including $21.2 million of walk-in revenue from 2006 acquisitions. In 2006 and 2005, cancellations reduced “walk-in” revenue by between 2% and 4%. Our future success depends on our maintaining (through renewals) and increasing (through new subscriptions and license agreements) the number of customers who pay for our investment research and services. Further, if the market for our products and services develops more slowly than we expect, or declines, and the number of customers who pay for our services does not increase, or declines, our business, operating results, or financial condition could suffer.
The availability of free or low-cost investment information could lead to lower demand for our products and adversely affect our financial results.
Investment research and information relating to publicly traded companies and mutual funds is widely available for little or no cost from various sources, including the Internet and public libraries. Investors can also access information directly from publicly traded companies and mutual funds. The EDGAR database available through the Securities and Exchange Commission (SEC) Web site provides real-time access to SEC filings, including annual, semi-annual, and quarterly reports. Many brokerage firms also provide financial and investment research to their clients. The widespread availability of free or low-cost investment information may make it
2124
difficult for us to maintain or increase the prices we charge for our publications and services and could lead to a lower demand for our products. A loss of a significant number of customers would hurt our financial results.
Certain products and services have historically made up a large percentage of our revenue base. Our business could suffer if sales of these products and services decline.
In 2006,2007, our five largest products based on revenue (Investment Consulting, Licensed Data, Morningstar Advisor Workstation, Licensed Data, Morningstar.com, and Principia) accounted for a combined 59.5%approximately 60% of our consolidated revenue. We believe that sales of these products and services will continue to make up a substantial portion of our consolidated revenue for the foreseeable future. If we experience a significant decline in sales of any of these products for any reason, it would have a material adverse impact on our revenue and could harm our business.
The independent equity research we’re providing to six investment banks under the terms of the Global Analyst Research Settlement accounted for a significant portionapproximately 5% of our consolidated revenue in 2006.2007. The period during which investment banks are required to provide independent equity research to their clients will expire in July 2009. After the settlement period expires, the investment banks covered by it will no longer be required to provide independent investment research to their clients. We cannot guarantee that we will retain or replacedon’t know how much, if any, of this equity research revenue after that date.we’ll be able to retain or replace following the end of the settlement period in July 2009. Because these contracts include both renewal and cancellation options and the firms named in the settlement are free to choose from a variety of research providers, we also cannot guarantee that we will retain this business for any period prior to July 2009.
Changes in market and economic conditions could lower demand for our products and services.
Conditions in the financial and securities markets may have an impact on our performance. For example, in the event that the U.S. or international financial markets suffers a severe or prolonged downturn, demand for our products and services may decline, and our revenue and profitability levels could suffer. The financial markets and many businesses operating in the financial services industry are highly volatile and are affected by factors, such as U.S. and foreign economic conditions and general trends in business and finance, which are beyond our control.
Our revenue from asset-based fees could be affected by a decline in the equity market.
Our fee-based asset management business has continued to increase as a percentage of total revenue and become more important to our financial results. In 2007, revenue from asset-based fees made up approximately 16% of our consolidated revenue and a greater percentage of our operating income. During periods of significant market volatility, net inflows into the portfolios on which we provide investment advisory services may decrease, or these portfolios may experience redemptions or substantial declines in value. If the level of assets on which we provide investment advisory services declines, we expect that our fee-based revenue will show a corresponding decline.
Our results could suffer if the mutual fund industry experiences a lower growth rate than in the past.
A significant portion of our revenue is generated from products and services related to mutual funds. The mutual fund industry has experienced substantial growth over the past 20 years. Mutual fund assets may not continue to expand at the same rate in future years. Settlements and regulatory actions in the mutual fund industry following the market-timing scandal that emerged in 2003, downturns or volatility in the financial markets, or a relative increase in use of other investment vehicles could cause a decline in investor interest in mutual funds. A slower growth rate of mutual fund assets could decrease demand for some of our products.
Our reputation and business may be harmed by allegations made about possible conflicts of interest.
We offer products and services to our institutional clients, which include banks, brokerage firms, insurance companies, mutual fund companies, media outlets, and retirement plan providers and sponsors. Our institutional business generated revenue, before intersegment eliminations, of $230.3 million, or 52.9% of our consolidated revenue, in 2007, and $146.1 million, or 46.4% of our consolidated revenue, in 2006. We provide ratings, analyst research, and investment recommendations on mutual funds and other investment products offered and securities issued by our institutional clients. The fact that our institutional clients pay us for certain products and services may create the perception that our ratings, research, and recommendations are not impartial. This perception may undermine the confidence of our customers and potential customers in our reputation as a provider of independent research. Any such loss of confidence or damage to our reputation could hurt our business.
25
Our investment advisory operations may subject us to liability for any losses that result from a breach of our fiduciary duties.
Our investment advisory operations involve fiduciary obligations that require us to act in the best interests of our clients. We may face liabilities for actual or claimed breaches of our fiduciary duties. We may not be able to prevent clients from taking legal action against us for an actual or claimed breach of a fiduciary duty. Because we currently provide investment advisory services on substantialmore than $97.5 billion in assets, we could face substantial liability to our clientsliabilities if we breach our fiduciary duties. In addition, we may face other legal liabilities based on the quality and outcome of our investment advisory recommendations, even in the absence of an actual or claimed breach of fiduciary duty.
Changes in laws applicable to our investment advisory operations, compliance failures, or regulatory action could adversely affect our business.
Our investment advisory operations are relatively new and a growing part of our overall business. Our acquisition of Ibbotson Associates in 2006 substantially increased our business in this area. The securities laws and other laws that govern our activities as a registered investment advisor are complex. The activities of our investment advisory operations are primarily subject to provisions of the Investment Advisers Act of 1940 (the Advisers Act) and the Employee Retirement Income Security Act of 1974 (ERISA). In addition, our investment management business is conducted through a broker-dealer registered under the Securities Exchange Act of 1934 (the Exchange Act) and is subject to the rules of the National Association of Securities Dealers (NASD)Financial Industry Regulatory Authority, Inc. (FINRA). It is difficult to predict the future impact of the broad and expanding legislative and regulatory requirements affecting our business. The laws, rules, and regulations applicable to our business may change in the future and we may not be able to comply with any such changes. If we fail to comply with any applicable law, rule, or regulation, we could be fined, sanctioned, or barred from providing investment advisory services in the future, which could materially adversely affect our business, operating results, or financial condition.
Our reputationWe could be subject to fines, penalties, or other sanctions as a result of investigations by the New York Attorney General’s Office and the Department of Labor related to some of the services Morningstar Associates, LLC provides.
As previously disclosed, the New York Attorney General’s Office and the Department of Labor are conducting separate investigations related to some of the products and services offered by Morningstar Associates, LLC. See Item 3—Legal Proceedings for a description of these matters. We cannot predict the scope, timing, or outcome of these matters, which may include the institution of administrative, civil, injunctive, or criminal proceedings, the imposition of fines and penalties, and other remedies and sanctions, any of which could lead to an adverse impact on our stock price, the inability to attract or retain key employees, and the loss of customers. We also cannot predict what impact, if any, these matters may have on our business, operating results, or financial condition. We have not established any reserves relating to these matters.
Political and regulatory issues may be harmed by possible conflicts of interest.adversely affect our data and technology development center based in Shenzhen, China.
We offernow have approximately 300 programmers and data analysts working in our development center in China. Over the past several years, we have been moving a significant percentage of our data collection and development operations to this location. Because China has a restrictive government under centralized control, we cannot predict the level of political and regulatory risk that may affect our operations. Any difficulties that we face in successfully maintaining our development center in China may harm our business and have a negative impact on the products and services we provide.
26
Our operations outside of the United States are expanding and involve special challenges that we may not be able to meet.
Over the past three years, our institutional clients, which include banks, brokerage firms, insurance companies,operations outside of the United States have generated an increasing amount of revenue, expanding to $89.7 million in 2007 from $29.4 million in 2005. Our 2006 acquisition of Aspect Huntley in Australia, our 2007 acquisition of the mutual fund companies,data business from Standard & Poor’s, and our January 2008 acquisition of the Hemscott data, media, outlets, and retirement plan providersinvestor relations businesses substantially increased our business operations in Europe, Australia, and sponsors. Our institutionalother areas outside the United States. As mentioned above, we have approximately 300 programmers and data analysts working in our development center in China. Following the Hemscott acquisition, we have approximately 200 additional employees employed at a data collection facility in New Delhi, India. There are risks inherent in doing business generatedoutside the United States, including challenges in reaching new markets because of established competitors; difficulties in staffing, managing, and integrating non-U.S. operations; differences in laws and policies from country to country; exposure to varying legal standards, including intellectual property protection laws; and currency exchange rates and exchange controls. These risks could hamper our ability to expand around the world, which may hurt our financial performance and ability to grow.
We do not currently hedge any of our currency exposure, which may adversely impact our financial results.
As our non-U.S. revenue before intersegment eliminations, of $146.1 million, or 46.4%increases as a percentage of our consolidated revenue, fluctuations in 2006foreign currencies present a greater potential risk. To date, we have not engaged in currency hedging, and $95.9 million, or 42.2%we do not currently have any positions in derivative instruments to hedge our currency risk. Our reported revenue could suffer if certain foreign currencies decline relative to the U.S. dollar, although the impact on operating income may be offset by an opposing currency impact on locally based operating expense. In addition, because we use the local currency of our consolidated revenue,subsidiaries as the functional currency, our financial results are affected by the translation of foreign currencies into U.S. dollars.
Higher capital spending may adversely impact our free cash flow.
We expect that our 2008 capital spending will be significantly higher than in 2005. We also provide ratings, analyst research,previous years because of spending for our new corporate headquarters in Chicago. Higher capital expenditures may reduce the amount of cash available for investment in other areas, such as computer equipment, reinvestment in the business, and investment recommendations on mutual fundsemployee bonuses.
Stock option exercises and other investment products offeredfactors may create volatility in our cash flows.
Our cash provided by financing activities primarily consists of proceeds from stock option exercises and securities issuedexcess tax benefits related to stock option exercises and vesting of restricted stock units. Excess tax benefits occur at the time a stock option is exercised if the intrinsic value of the option (the difference between the exercise price of the option and the fair value of our stock on the date of exercise) exceeds the fair value of the option at the time of grant. Similarly, excess tax benefits are generated upon vesting of restricted stock units when the market value of our common stock at vesting is greater than the grant price of the restricted stock units. These excess tax benefits reduce the cash we pay for income taxes in the year they are recognized. It is not possible to predict the timing of stock option exercises nor the intrinsic value that will be achieved. Because of this uncertainty, there may be additional volatility in our cash flows from financing activities from year to year.
A prolonged outage of our database and network facilities could result in reduced revenue and the loss of customers.
The success of our business depends upon our ability to deliver time-sensitive, up-to-date data and information. We rely on our computer equipment, database storage facilities, and other office equipment, which are mainly located in our Chicago headquarters or elsewhere in the Chicago area. Our operations and those of our suppliers and customers are vulnerable to interruption by fire, earthquake, power loss, telecommunications failure, terrorist attacks, wars, Internet failures, computer viruses, and other events beyond our institutional clients. The factcontrol, including disasters affecting Chicago. We maintain off-site back-up facilities for our database and network equipment, but these facilities could be subject to the same interruptions that may affect our institutional clients payheadquarters. We’re not currently able to immediately switch over all of our systems to a back-up facility. If we experience a significant database or network facility outage, our business may be disrupted until we fully implement our back-up systems. Any losses, service disruption, or damages incurred by us for certaincould have a material adverse effect on our business, operating results, or financial condition.
27
Our business relies heavily on electronic delivery systems and the Internet. Any failures or disruptions could result in reduced revenue and the loss of customers.
Most of our products and services depend heavily on our electronic delivery systems and the Internet. Our ability to deliver information using the Internet may createbe impaired because of infrastructure failures, service outages at third-party Internet providers, or increased government regulation. If disruptions, failures, or slowdowns of our electronic delivery systems or the perception thatInternet occur, our ratings,ability to distribute our products and services effectively and to serve our customers may be impaired.
We could face liability related to our storage of personal information about our users.
Customers routinely input personal investment and financial information, including portfolio holdings and credit card information, on our Web sites. We could be subject to liability if we were to inappropriately disclose any user’s personal information or if third parties were able to penetrate our network security or otherwise gain access to any user’s name, address, portfolio holdings, or credit card information. Any such event could subject us to claims for unauthorized credit card purchases, impersonation or other similar fraud claims, or claims for other misuses of personal information, such as unauthorized marketing or unauthorized access to personal portfolio information.
The availability of free or low-cost investment information could lead to lower demand for our products and adversely affect our financial results.
Investment research and recommendations are not impartial. This perceptioninformation relating to publicly traded companies and mutual funds is widely available for little or no cost from various sources, including the Internet and public libraries. Investors can also access information directly from publicly traded companies and mutual funds. The EDGAR database available through the Securities and Exchange Commission (SEC) Web site provides real-time access to SEC filings, including annual, semi-annual, and quarterly reports. Many brokerage firms also provide financial and investment research to their clients. The widespread availability of free or low-cost investment information may underminemake it difficult for us to maintain or increase the confidence ofprices we charge for our customerspublications and potential customers inservices and could lead to a lower demand for our reputation as a provider of independent research. Any suchproducts. A loss of confidence or damage to our reputation coulda significant number of customers would hurt our business.financial results.
Our failure to successfully integrate acquisitions could strain our resources.
WeWe’ve completed several acquisitions in 2006,over the past three years, including Ibbotson Associates, which was our largest2007 acquisition to date.of the mutual fund data business from Standard & Poor’s and our January 2008 acquisition of the Hemscott data, media, and investor relations businesses. We cannot guarantee that we will successfully integrate the employees, product lines, business systems, and operations following any acquisition. We expect to continue making acquisitions and establishing investments and joint ventures as part of our long-term business strategy. Acquisitions, investments, and joint ventures involve a number of risks. They can be time-consuming and may divert management’s attention from day-to-day operations. Financing an acquisition could result in dilution from issuing equity securities, reduce our financial flexibility because of reductions in our cash balance, or result in a weaker
22
balance sheet from incurring debt.
Acquisitions might also result in losing key employees. We may fail to successfully complete any acquisitions, investments,an acquisition, investment, or joint ventures.venture. We may also fail to generate enough revenue or profits from an acquisition to earn a return on the associated purchase price.
28
We could face liability for the information we publish, including information based on data we obtain from other parties.
We may be subject to claims for securities law violations, defamation (including libel and slander), negligence, or other claims relating to the information we publish. For example, investors may take legal action against us if they rely on published information that contains an error, or a company may claim that we have made a defamatory statement about it or its employees. We could also be subject to claims based upon the content that is accessible from our Web site through links to other Web sites. We rely on a variety of outside parties as the original sources for the information we use in our published data. These sources include securities exchanges, fund companies, and transfer agents. Accordingly, in addition to possible exposure for publishing incorrect information that results directly from our own errors, we could face liability based on inaccurate data provided to us by others. Defending claims based on the information we publish could be expensive and time-consuming and could adversely impact our business, operating results, and financial condition.
We could be subject to fines, penalties, or other sanctions as a result of investigations by the New York Attorney General’s Office and the Department of Labor related to the investment consulting services Morningstar Associates, LLC provides to retirement plan providers, including fund lineup recommendations for retirement plan sponsors.
As previously disclosed, the New York Attorney General’s Office and the Department of Labor are conducting separate investigations related to some of the products and services offered by Morningstar Associates, LLC. See Item 3—Legal Proceedings for a description of these matters. We cannot predict the scope, timing, or outcome of these matters, which may include the institution of administrative, civil, injunctive, or criminal proceedings, the imposition of fines and penalties, and other remedies and sanctions, any of which could lead to an adverse impact on our stock price, the inability to attract or retain key employees, and the loss of customers. We also cannot predict what impact, if any, these matters may have on our business, operating results, or financial condition. We have not established any reserves relating to these matters.
We could face liability as a result of a proceeding brought by Mr. Graham Rich, a former managing director, chief executive officer, and beneficial shareholder of Morningstar Research Pty Limited, and two companies controlled by Mr. Rich.
In 2001, Mr. Graham Rich, the then managing director and chief executive officer of Morningstar Research Pty Limited (Morningstar Australia), and one of two companies controlled by Mr. Rich, filed a suit in the Supreme Court of New South Wales, Australia against Morningstar and certain of its officers and nominee directors on the board of Morningstar Australia. The claims seek various forms of relief, including monetary damages in the amount of Australian $25.0 million, the setting aside of transactions which resulted in Morningstar obtaining control of Morningstar Australia, and an order either setting aside Morningstar’s acquisition of shares formerly beneficially owned by Mr. Rich and his companies or determining a different price for this acquisition. In the alternative, Mr. Rich and his companies seek an order that they be entitled to purchase the shares in Morningstar Australia at a price to be determined by the court or book value (as defined in the shareholders agreement of Morningstar Australia). In February 2007, Mr. Rich and his companies notified Morningstar that they would be seeking the leave of the court to amend the claim to include a claim relating to Morningstar’s acquisition of Aspect Huntley Pty Ltd. (Aspect) in 2006. The amended claim alleges various breaches of obligations owed by Morningstar to Morningstar Australia and seeks various forms of relief, including an equity interest in Aspect and compensatory damages. The court has not yet granted leave to allow the amendment to proceed. The parties have discussed settling the claims but have been unable to reach an agreement. In the fourth quarter of 2003, we offered to settle all claims for Australian $1.3 million which then approximated U.S. $0.9 million, and, in accordance with Statement of Financial Accounting Standards No. 5, Accounting for Contingencies (SFAS No. 5), we recorded a reserve in this amount. In December 2005, we increased our offer to settle all claims to approximately Australian $2.5 million, which as of December 31, 2006 approximated U.S. $2.0 million, and, in accordance with SFAS No. 5, have a reserve recorded for this amount. While Morningstar is vigorously contesting the claims against it, we cannot predict the outcome of the proceeding. We also cannot predict what impact, if any, this matter may have on our business, operating results, or financial condition.
A prolonged outage of our database and network facilities could result in reduced revenue and the loss of customers.
The success of our business depends upon our ability to deliver time-sensitive, up-to-date data and information. We rely on our computer equipment, database storage facilities, and other office equipment, which are mainly located in our Chicago headquarters or elsewhere in the Chicago area. Our operations and those of our suppliers and customers are vulnerable to interruption by fire, earthquake, power loss, telecommunications failure, terrorist attacks, wars, Internet failures, computer viruses, and other events
23
beyond our control, including disasters affecting Chicago. We maintain off-site back-up facilities for our database and network equipment, but these facilities could be subject to the same interruptions that may affect our headquarters. We do not currently have the capability to switch over all of our systems to a back-up facility immediately. If we suffer a significant database or network facility outage, our business could experience disruption until we fully implement our back-up systems. Any losses, service disruption, or damages incurred by us could have a material adverse effect on our business, operating results, or financial condition.
Our business relies heavily on electronic delivery systems and the Internet. Any failures or disruptions could result in reduced revenue and the loss of customers.
Many of our products and services depend heavily on our electronic delivery systems and the Internet. Our ability to deliver information using the Internet may be impaired because of infrastructure failures, service outages at third-party Internet providers, or increased government regulation. If disruptions, failures, or slowdowns of our electronic delivery systems or the Internet occur, our ability to distribute our products and services effectively and to serve our customers may be impaired.
We could face liability related to our storage of personal information about our users.
Customers routinely input personal investment and financial information, including portfolio holdings and credit card information, on our Web sites. We could be subject to liability if we were to inappropriately disclose any user’s personal information or if third parties were able to penetrate our network security or otherwise gain access to any user’s name, address, portfolio holdings, or credit card information. Any such event could subject us to claims for unauthorized credit card purchases, impersonation or other similar fraud claims, or claims for other misuses of personal information, such as unauthorized marketing or unauthorized access to personal portfolio information.
Our future success depends on our ability to recruit and retain qualified employees, including our executive officers.
We experience competition for analysts and other employees from financial institutions and financial services organizations. These organizations generally have greater resources than we do and therefore may be able to offer significantly more attractive compensation packages to potential employees. Competition for these employees is intense, and we may not be able to retain our existing employees or be able to recruit and retain other highly qualified personnel in the future.
Our future success also depends on the continued service of our executive officers, including Joe Mansueto, our chairman, chief executive officer, and controlling shareholder. The loss of one or more of our executive officers could hurt our business, operating results, or financial condition. We do not carry any life insurance on our executive officers. We do not have employment agreements or non-compete agreements in place with any of our executive officers. They may leave us and work for our competitors or start their own competing businesses.
Our operations outside of the United States are expanding and involve special challenges that we may not be able to meet.
Over the past three years, our operations outside of the United States have generated an increasing amount of revenue, expanding from $25.4 million in 2004 to $44.3 million in 2006. There are certain risks inherent in doing business outside the United States, including difficulties in reaching new markets due to established competitors; difficulties in staffing, managing, and integrating non-U.S. operations; differences in laws and policies from country to country; exposure to varying legal standards, including intellectual property protection laws; and currency exchange rates and exchange controls. We do not currently hedge any of our currency exposure, which may adversely impact our financial results.
These risks could hamper our ability to expand around the world, which may hurt our financial performance and ability to grow.
In addition, we now have approximately 200 programmers and data analysts working in our development center in China. Over the past several years, we have been moving a significant percentage of our data collection and development operations to this location. Because China has a restrictive government under centralized control, we cannot predict the level of political and regulatory risk that may impact our operations. Any difficulties that we face in successfully maintaining our development center in China may harm our business and have a negative impact on the products and services we provide.
Changes in market and economic conditions could lower demand for our products and services.
We provide our products and services to individual investors, financial advisors, and institutional clients. Conditions in the financial and securities markets may have an impact on our performance. For example, in the event that the U.S. or international financial markets suffers a severe or prolonged downturn, demand for our products and services may decline, and our revenue and profitability levels could suffer. The financial markets and many businesses operating in the financial services industry are highly volatile and are
24
affected by factors, such as U.S. and foreign economic conditions and general trends in business and finance, that are beyond our control. In addition, as our fee-based asset management business increases as a percentage of total revenue, our results might become more closely tied to the performance of the market. We attempt to mitigate this potential risk by diversifying our business into various markets around the world, as well as different segments and price points within each area.
Our results could suffer if the mutual fund industry experiences a downturn or a slowdown in growth.
A significant portion of our revenue is generated from products and services related to mutual funds. The mutual fund industry has experienced substantial growth over the past 20 years. Mutual fund assets may not continue to expand at the same rate in future years. Settlements and regulatory actions in the mutual fund industry following the market-timing scandal that emerged in 2003, downturns in the financial markets, or a relative increase in usage of other investment vehicles could cause a decline in investor interest in mutual funds. If the mutual fund industry experiences a downturn or a slower growth rate than in the past, it could negatively impact demand for some of our products.
Failure to protect our intellectual property rights could harm our brand-building efforts and ability to compete effectively.
The steps we have taken to protect our intellectual property may not be adequate to safeguard our proprietary information. Further, effective trademark, copyright, and trade secret protection may not be available in every country in which we offer our services. Our continued ability to market one or more of our products under their current names could be adversely affected in those jurisdictions where another person registers, or has a pre-existing registration on, one or more of them. Failure to adequately protect our intellectual property could harm our brand, devalue our proprietary content, and affect our ability to compete in the marketplace.
Control by a principal shareholder could adversely affect our other shareholders.
As of December 31, 2006,2007, Joe Mansueto, our chairman and chief executive officer, owned approximately 70%63% of our outstanding common stock. As a result, he has the ability to control substantially all matters submitted to our shareholders for approval, including the election and removal of directors and any merger, consolidation, or sale of our assets. He also has the ability to control our management and affairs. This concentration of ownership may delay or prevent a change in control; impede a merger, consolidation, takeover, or other business combination involving us; discourage a potential acquirer from making a tender offer or otherwise attempting to obtain control of us; or result in actions that may be opposed by other shareholders.
Moreover, because of Joe’s substantial ownership, we are a “controlled company” for purposes of the NASDAQ Marketplace Rules. This means that, if in the future we elect to be treated as a controlled company under the NASDAQ Marketplace Rules, we will not be required by NASDAQ to have a majority of independent directors or to maintain compensation and nominating and corporate governance committees composed entirely of independent directors to continue to list our shares on NASDAQ.
29
Fluctuations in our operating results may negatively impact our stock price.
We believe our business has relatively large fixed costs and low variable costs, which magnify the impact of revenue fluctuations on our operating results. As a result, a decline in our revenue may lead to a larger decline in operating income. A substantial portion of our operating expense is related to personnel costs, marketing programs, and corporate overhead, none of which can be adjusted quickly. Our operating expense levels are based on our expectations for future revenue. If actual revenue falls behindbelow our expectations, or if our expenses increase before revenues do, our operating results would be materially and adversely affected. In addition, we do not provide earnings guidance or hold one-on-one meetings with institutional investors and research analysts. Because of this policy and limited analyst coverage on our stock, our stock price may be volatile. If our operating results or other operating metrics fail to meet the expectations of outside research analysts and investors, the market price of our common stock may decline.
The future sale of shares of our common stock may negatively impact our stock price.
If our shareholders sell substantial amounts of our common stock, the market price of our common stock could fall. A reduction in ownership by Joe Mansueto or any other large shareholder could cause the market price of our common stock to fall. In addition, the average daily trading volume in our stock is relatively low. The lack of trading activity in our stock may lead to greater fluctuations in our stock price. Low trading volume may also make it difficult for shareholders to make transactions in a timely fashion.
Our shareholders may experience dilution in their ownership positions.
Morningstar has historicallyIn the past, we’ve granted options to employees as a significant part of ourtheir overall compensation package. In 2006 we began granting restricted stock units to our employees and non-employee directors. As of December 31, 2006,2007, our employees and non-employee directors held options to acquire 8,969,9046,445,679 shares of common stock, 7,255,862
25
5,610,008 of which were exercisable at a weighted average exercise price of $10.90approximately $12.45 per share and 1,714,042835,671 were not exercisableexercisable. As of December 31, 2007, there were 420,903 restricted stock units outstanding. Of these, 122,967 are scheduled to vest in 2008, 122,967 in 2009, 119,669 in 2010, and had an average exercise price55,300 in 2011. Generally speaking, a share is issued when a restricted stock unit vests. Some holders have elected to defer when shares are issued and many holders satisfy tax withholding obligations by forfeiting the right to have some of $17.18 per share.their shares issued. To the extent that option holders exercise outstanding options to purchase common stock and to the extent that shares are issued when restricted stock units vest, there maywill be further dilution. Future grants of stock options or restricted stock units may also result in dilution. We may raise additional funds through future sales of our common stock. Any such financing maywould result in additional dilution to our shareholders.
Item 1B. Unresolved Staff Comments
We have not received any comments from the Staff of the Securities and Exchange Commission regarding our periodic or current reports under the Exchange Act.
2630
Our headquarters and U.S.-based officesOffices for our U.S. operations are located in Chicago, Illinois, and consistas of December 31, 2007 consisted of approximately 171,000187,000 square feet of leased space. In 2008, we will move our U.S. operations to a new office tower being constructed in Chicago where we will lease approximately 235,000 square feet of office space. We also lease approximately 77,500162,000 square feet of office space in 1417 countries around the world. We believe that our existing and planned office facilities are adequate for our immediate needs and that additional or substitute space is available if needed to accommodate growth and expansion.
In December 2005, we signed a 15-year lease for approximately 210,000 square feet of office space in an office tower being constructed at 108 North State Street in Chicago, Illinois. We are scheduled to move into the new space when the lease starts in 2008.
Morningstar Australia
In 2001, Mr. Graham Rich, the then managing director and chief executive officer of Morningstar Research Pty Limited (Morningstar Australia), and one of two companies controlled by Mr. Rich, filed a suit in the Supreme Court of New South Wales, Australia against Morningstar and certain of its officers and nominee directors on the board of Morningstar Australia. Mr. Rich was also a beneficial owner of shares in Morningstar Australia. Mr. Rich and his company originally sought an injunction which, if granted, would have precluded Morningstar Australia from terminating the services of Mr. Rich and from issuing additional shares to Morningstar in exchange for the provision of further funding by Morningstar to Morningstar Australia. Further, Mr. Rich and his company sought an order that a provisional liquidator be appointed for Morningstar Australia. The court rejected this injunction application, observing that Morningstar Australia would be insolvent without financial backing from Morningstar.application. The application for the appointment of a provisional liquidator also failed. The services of Mr. Rich were terminated in November 2001. Mr. Rich and his company were ordered to pay Morningstar’s costs of the injunction proceedings.
Mr. Rich and the two companies controlled by Mr. Rich havethereafter filed additional pending claims, alleging among other things, breaches by Morningstar of contracts and statutory and general law duties, misleading, deceptive, and unconscionable conduct by Morningstar, oppression by Morningstar and its nominee directors, claims under the Industrial Relations Act of New South Wales, breaches of directors’ duties by Morningstar’s nominee directors, and conflict of interest. The claims seeksought various forms of relief, including monetary damages in the amount of Australian $25,000,000, the setting aside of transactions which resulted in Morningstar obtaining control of Morningstar Australia, and an order either setting aside Morningstar’s acquisition of the shares formerly beneficially owned by Mr. Rich and his companies or determining a different price for this acquisition. In the alternative, Mr. Rich and his companies seeksought an order that they be entitled to purchase the shares in Morningstar Australia at a price to be determined by the court or book value (as defined in the Morningstar Australia shareholders agreement). Morningstar has denied the claims and filed counter-claims against Mr. Rich and certain of his companies, alleging breaches of statutory, general law, and contractual duties.
In July 2004, the court decided Morningstar’s application for security for its potential additional costs in the litigation by ordering the two companies controlled by Mr. Rich to provide approximately Australian $925,000 to the court as security for these potential costs. Morningstar has been paid some of its costs and will be entitled to be paid its costs in the future only if the court makes a determination to that effect. The court stayed the proceedings pending its receipt of the security and indicated that it would entertain an application by Morningstar for additional security at a later time in the proceedings.
In May 2005, Mr. Rich obtained conditional leave of the court to begin a proceeding in the name of Morningstar Australia against Morningstar and its nominee directors. The leave was, however, subject to the following conditions: (i) Mr. Rich must pay and bear, and indemnify Morningstar Australia against, all costs, charges, and expenses of and incidental to the bringing and continuation of the proceeding (except as the court may otherwise direct or allow) and may not seek contribution or indemnity from Morningstar Australia for any of these costs, charges, or expenses; (ii) Morningstar Australia, or Mr. Rich on its behalf, together with the two companies controlled by Mr. Rich were required to provide to the court, as security for Morningstar’s costs, approximately Australian $925,000 as described in the preceding paragraph; and (iii) approximately Australian $100,000 in costs owed by Mr. Rich and one of his companies to Morningstar in respect of the 2001 injunction proceedings were required to be paid to Morningstar. These conditions have been satisfied.
In September 2005, Mr. Rich and his companies filed a Second Further Amended Statement of Claim, consolidating the claims. Morningstar filed a Defence to that pleading and an Amended Cross-Claim against Mr. Rich, both his companies, and a third Australian company controlled by Mr. Rich.
In December 2006, Morningstar applied to the court for further security for its potential additional costs in the litigation. The court has not yet held a hearing for this application.
In February 2007, Mr. Rich and his companies notified Morningstar that they would be seeking the leave of the court to amend the Second Further Amended Statement of Claim to include a claim relating to Morningstar’s acquisition of Aspect Huntley Pty Ltd. (Aspect) in 2006. The amended claim alleges various breaches of obligations owed by Morningstar to Morningstar Australia and seeks
27
various forms of relief, including an equity interest in Aspect and compensatory damages. The court has not yet granted leave to allow the amendment to proceed.
The parties have discussed settling the claims but have been unable to reach an agreement. In the fourth quarter of 2003, Morningstar offered to settle all claims for Australian $1,250,000, which then approximated U.S. $942,000, and, in accordance with Statement of Financial Accounting Standards (SFAS) No. 5,Accounting for Contingencies, Morningstar recorded a reserve in this amount. In December 2005, Morningstar increased its offer to settle all claims to approximately Australian $2,500,000 which at December 31, 2006(which then approximated U.S. $2,000,000,$1,800,000) and in accordance with SFAS No. 5, Morningstar hashad a reserve recorded in this amount. While
In August 2007, the parties agreed to a settlement pursuant to which the parties dismissed and released all claims in the proceedings and Morningstar is vigorously contestingpaid Australian $4,000,000 (approximately U.S. $3,300,000) at the claims against it, we cannot predictdate of settlement. This amount was higher than the outcomepreviously recorded reserve of Australian $2,500,000 (approximately U.S. $2,100,000 at the settlement date). We recorded about $900,000 of the proceeding.difference as legal expense. We accounted for the remainder as an adjustment to the goodwill we initially recorded when we acquired Morningstar Australia in 2001.
31
Morningstar Associates, LLC Subpoenas from Securities and Exchange Commission, New York Attorney General’s Office, and the Department of Labor
Securities and Exchange Commission
In February 2005, Morningstar Associates, LLC, a wholly owned subsidiary of Morningstar, Inc., received a request from the Securities and Exchange Commission (SEC)SEC for the voluntary production of documents relating to the investment consulting services the company offers to retirement plan providers, including fund lineup recommendations for retirement plan sponsors. In July 2005, the SEC issued a subpoena to Morningstar Associates that was virtually identical to its February 2005 request.
Subsequently, the SEC focused on disclosure relating to an optional service offered to retirement plan sponsors (employers) that select 401(k) plan services from ING, one of Morningstar Associates’ clients. In response to the SEC investigation, ING and Morningstar Associates revised certain documents for plan sponsors to further clarify the roles of ING and Morningstar Associates in providing that service. The revisions also help reinforce that Morningstar Associates makes its selections only from funds available within ING’s various retirement products.
OnIn January 24, 2007, the SEC notified Morningstar Associates that it ended its investigation, with no enforcement action, fines, or penalties.
New York Attorney General’s Office
In December 2004, Morningstar Associates received a subpoena from the New York Attorney General’s office seeking information and documents related to an investigation the New York Attorney General’s office is conducting. The request is similar in scope to the SEC subpoena described above. Morningstar Associates has provided the requested information and documents and continues to cooperate fully with the New York Attorney General’s office.documents.
In January 2007, Morningstar Associates received a Notice of Proposed Litigation from the New York Attorney General’s office. The Notice centers on the same issues that became the focus of the SEC investigation described above. The Notice gave Morningstar Associates the opportunity to explain why the New York Attorney General’s office should not institute proceedings. Morningstar Associates promptly submitted its explanation. To date,explanation and has cooperated fully with the New York Attorney General’s office has not taken any further action.office.
We cannot predict the scope, timing, or outcome of this matter, which may include the institution of administrative, civil, injunctive, or criminal proceedings, the imposition of fines and penalties, and other remedies and sanctions, any of which could lead to an adverse impact on our stock price, the inability to attract or retain key employees, and the loss of customers. We also cannot predict what impact, if any, this matter may have on our business, operating results, or financial condition.
United States Department of Labor
In May 2005, Morningstar Associates received a subpoena from the United States Department of Labor, seeking information and documents related to an investigation the Department of Labor is conducting. The Department of Labor subpoena is substantially similar in scope to the SEC and New York Attorney General subpoenas.
In January 2007, the Department of Labor issued a request for additional documents pursuant to the May 2005 subpoena, including documents and information regarding Morningstar Associates’ retirement advice products for plan participants. Morningstar Associates continues to cooperate fully with the Department of Labor.
We cannot predict the scope, timing, or outcome of this matter, which may include the institution of administrative, civil, injunctive, or criminal proceedings, the imposition of fines and penalties, and other remedies and sanctions, any of which could lead to an adverse impact on our stock price, the inability to attract or retain key employees, and the loss of customers. We also cannot predict what impact, if any, these matters may have on our business, operating results, or financial condition.
32
In addition to these proceedings, we are involved in legal proceedings and litigation that have arisen in the normal course of our business. Although the outcome of a particular proceeding can never be predicted, we do not believe that the result of any of these
28
matters will have a material adverse effect on our business, operating results, or financial condition.
Item 4. Submission of Matters to a Vote of Security Holders
No matters were submitted to a vote of our security holders, through the solicitation of proxies or otherwise, during the quarter ended December 31, 2006.2007.
Item 5. Market for Registrant’s Common Equity, Related Stockholder Matters, and Issuer Purchases of Equity Securities
Our common stock is listed on the Nasdaq Global Select Market under the symbol “MORN.”
The following table shows the high and low price per share of our common stock for the periods indicated, as reported on the Nasdaq Global Select Market:
|
| 2006 |
| 2005 |
|
| 2007 |
| 2006 |
| ||||||||||||||||
|
| High |
| Low |
| High |
| Low |
|
| High |
| Low |
| High |
| Low |
| ||||||||
|
|
|
|
|
|
|
|
|
|
|
|
|
|
|
|
|
|
| ||||||||
First Quarter (our stock was first publicly traded on May 3, 2005) |
| $ | 46.37 |
| $ | 33.79 |
| $ | — |
| $ | — |
| |||||||||||||
First Quarter |
| $ | 54.57 |
| $ | 44.60 |
| $ | 46.37 |
| $ | 33.79 |
| |||||||||||||
|
|
|
|
|
|
|
|
|
|
|
|
|
|
|
|
|
|
| ||||||||
Second Quarter |
| 47.56 |
| 35.66 |
| 29.59 |
| 18.51 |
|
| 54.72 |
| 46.10 |
| 47.56 |
| 35.66 |
| ||||||||
|
|
|
|
|
|
|
|
|
|
|
|
|
|
|
|
|
|
| ||||||||
Third Quarter |
| 42.76 |
| 32.99 |
| 34.10 |
| 26.01 |
|
| 67.16 |
| 46.48 |
| 42.76 |
| 32.99 |
| ||||||||
|
|
|
|
|
|
|
|
|
|
|
|
|
|
|
|
|
|
| ||||||||
Fourth Quarter |
| 47.36 |
| 36.32 |
| 37.43 |
| 24.83 |
|
| 85.50 |
| 61.50 |
| 47.36 |
| 36.32 |
| ||||||||
As of March 1, 2007,February 29, 2008, the last reported price on the Nasdaq Global Select Market for our common stock was $50.11$65.19 per share and there were approximately 40775 shareholders of record of our common stock.
We do not currently pay cash dividends, nor have we paid cash dividends during the period covered by the financial statements included in this Annual Report on Form 10-K. Any determination to pay dividends in the future will be at the discretion of our board of directors and will be dependent upon our results of operations, financial condition, contractual restrictions, restrictions imposed by applicable law, and other factors deemed relevant by the board of directors. Future indebtedness and loan facilities may also prohibit or restrict our ability to pay dividends and make distributions to our shareholders.
In May 2005, we completed our initial public offering of 7,612,500 shares of our common stock. These shares began trading on May 3, 2005 and now trade on the Nasdaq Global Select Market under the symbol “MORN.” All of these shares were sold by affiliates of SOFTBANK Finance Corporation, a wholly owned subsidiary of SOFTBANK Corp. We did not receive any proceeds from the sale of these shares. We granted the underwriters the option to purchase up to an additional 1,141,875 shares at the initial public offering price of $18.50 per share to cover over-allotments. In May 2005, the underwriters exercised their over-allotment option in full. Our net proceeds from the exercise of the underwriters’ over-allotment option were $18.1 million, after deducting the underwriting discounts and commissions and approximately $2.6 million of offering expenses. On March 1, 2006, we completed our acquisition of Ibbotson Associates for $86.5 million in cash. We funded a portion of the purchase price with our net proceeds from the exercise of the underwriters’ over-allotment option.
Rule 10b5-1 Plans
Our directors and executive officers may exercise stock options or purchase or sell shares of our common stock in the market from time to time. We encourage them to make these transactions through plans that comply with Exchange Act Rule 10b5-1(c). Morningstar will not receive any proceeds, other than proceeds from the exercise of stock options, related to these transactions.
33
The following table, which we are providing on a voluntary basis, shows the Rule 10b5-1 sales plans entered into by our directors and executive officers that were in effect onas of March 1, 2007:2008:
Name and Position |
| Date of |
|
|
| Number of |
| Timing of Sales under the Plan |
| Number of |
| Projected |
|
Jack Noonan Director |
| 08/22/06 |
| 12/10/07 |
| 60,000 |
| Monthly increments of up to 4,000 shares |
| 20,000 |
| 76,000 |
|
Don Phillips Managing Director |
| 05/09/06 |
| 08/26/07 |
| 450,000 |
| Semimonthly increments of up to 15,000 shares |
| 180,000 |
| 1,413,628 |
|
Name and Position |
| Date of |
| Plan |
| Number of |
| Timing of Sales under the Plan |
| Number of |
| Projected |
Joe Mansueto Chairman and Chief Executive Officer |
| 09/12/07 |
| 12/31/08 |
| 1,120,000 |
| Shares to be sold ratably over the course of the plan |
| 216,842 |
| 26,976,550 |
Cheryl Francis Director |
| 09/12/07 |
| 12/14/08 |
| 20,000 |
| Daily increments of up to 500 shares, or all remaining shares under the plan if the stock reaches a specified price |
| 1,500 |
| 32,824 |
Tao Huang Chief Operating Officer |
| 02/26/08 |
| 12/31/08 |
| 300,000 |
| Weekly increments of up to 10,000 shares beginning March 26, 2008 |
| — |
| 1,090,303 |
Jack Noonan Director |
| 08/22/06 |
| 12/31/08 |
| 72,000 |
| Monthly increments of up to 1,000 shares |
| 62,000 |
| 68,824 |
Don Phillips Managing Director |
| 05/09/06 |
| 11/30/08 |
| 1,382,310 |
| Weekly increments of up to 17,500 shares |
| 711,600 |
| 541,196 |
Richard Robbins General Counsel and Corporate Secretary |
| 12/19/07 |
| 07/31/08 |
| 5,000 |
| Biweekly increments of up to 500 shares |
| — |
| 11,078 |
Paul Sturm Director |
| 03/21/07 |
| 04/30/08 |
| 120,000 |
| Biweekly increments of up to 5,000 shares |
| 115,000 |
| 235,824 |
(1) This column reflects an estimate of the number of shares each identified director and executive officer will beneficially own following the sale of all shares under histhe Rule 10b5-1 plansales plans identified above. This information reflects the beneficial ownership of our
29
common stock on December 31, 2006,2007, and includes shares of our common stock subject to options that were then exercisable or that will have become exercisable by March 1, 2007.February 29, 2008 and restricted stock units that will vest by February 29, 2008. The estimates do not reflect any changes to beneficial ownership that may have occurred since December 31, 2006.2007. Each director and executive officer identified in the table may amend or terminate his or her Rule 10b5-1 sales plan and may adopt additional Rule 10b5-1 plans in the future.
In his letter to shareholders in our 2005 Annual Report, Joe Mansueto, our chairman and chief executive officer, stated that he expects to sell approximately 4% of his Morningstar shares annually under a Rule 10b5-1 plan. As of the date of this report Joe has not yet established a Rule 10b5-1 plan for 2007, but we expect that he will do so.
3034
Item 6. Selected Financial Data
The selected historical financial data shown below should be read in conjunction with Management’s Discussion and Analysis of Financial Condition and Results of Operations and our Consolidated Financial Statements and related notes included elsewhere in this Annual Report on Form 10-K. We have derived our Consolidated Statements of Operations Data and Other Consolidated Financial Data for the years ended December 31, 2007, 2006, 2005, and 20042005 and Consolidated Balance Sheet Data as of December 31, 20062007 and 20052006 from our audited Consolidated Financial Statements included in this Annual Report on Form 10-K. The Consolidated Statements of Operations Data and Other Consolidated Financial Data for the years ended December 31, 20032004 and 20022003 and Consolidated Balance Sheet Data as of December 31, 2005, 2004, 2003, and 20022003 were derived from our audited Consolidated Financial Statements that are not included in this Annual Report on Form 10-K.
Consolidated Statements of Operations Data
(in thousands except per share amounts) |
| 2002 |
| 2003 |
| 2004 |
| 2005 |
| 2006 |
|
| 2003 |
| 2004 |
| 2005 |
| 2006 |
| 2007 |
| ||||||||||
Revenue |
| $ | 109,619 |
| $ | 139,496 |
| $ | 179,658 |
| $ | 227,114 |
| $ | 315,175 |
|
| $ | 139,496 |
| $ | 179,658 |
| $ | 227,114 |
| $ | 315,175 |
| $ | 435,107 |
|
Operating expense |
| 117,959 |
| 150,250 |
| 161,923 |
| 180,634 |
| 237,648 |
|
| 150,250 |
| 161,923 |
| 180,634 |
| 237,648 |
| 317,853 |
| ||||||||||
Operating income (loss) |
| (8,340 | ) | (10,754 | ) | 17,735 |
| 46,480 |
| 77,527 |
|
| (10,754 | ) | 17,735 |
| 46,480 |
| 77,527 |
| 117,254 |
| ||||||||||
Non-operating income, net |
| 4,463 |
| 1,110 |
| 1,805 |
| 3,199 |
| 4,164 |
|
| 1,110 |
| 1,805 |
| 3,199 |
| 4,164 |
| 6,229 |
| ||||||||||
Income (loss) before income taxes, equity in net income of unconsolidated entities, minority interest in net loss of consolidated entities, extraordinary gain, and cumulative effect of accounting change |
| (3,877 | ) | (9,644 | ) | 19,540 |
| 49,679 |
| 81,691 |
| |||||||||||||||||||||
Income tax expense (benefit) |
| (311 | ) | 2,950 |
| 11,574 |
| 20,224 |
| 32,975 |
| |||||||||||||||||||||
Income (loss) before income taxes, equity in net income of unconsolidated entities, and cumulative effect of accounting change |
| (9,644 | ) | 19,540 |
| 49,679 |
| 81,691 |
| 123,483 |
| |||||||||||||||||||||
Income tax expense |
| 2,950 |
| 11,574 |
| 20,224 |
| 32,975 |
| 51,255 |
| |||||||||||||||||||||
Equity in net income of unconsolidated entities |
| 750 |
| 697 |
| 843 |
| 1,662 |
| 2,787 |
|
| 697 |
| 843 |
| 1,662 |
| 2,787 |
| 1,694 |
| ||||||||||
Minority interest in net loss of consolidated entities |
| 178 |
| — |
| — |
| — |
| — |
| |||||||||||||||||||||
Income (loss) before extraordinary gain and cumulative effect of accounting change |
| (2,638 | ) | (11,897 | ) | 8,809 |
| 31,117 |
| 51,503 |
| |||||||||||||||||||||
Extraordinary gain—acquisition |
| 3,084 |
| — |
| — |
| — |
| — |
| |||||||||||||||||||||
Income (loss) before cumulative effect of accounting change |
| (11,897 | ) | 8,809 |
| 31,117 |
| 51,503 |
| 73,922 |
| |||||||||||||||||||||
Cumulative effect of accounting change, net of tax of $171 |
| — |
| — |
| — |
| — |
| 259 |
|
| — |
| — |
| — |
| 259 |
| — |
| ||||||||||
Net income (loss) |
| $ | 446 |
| $ | (11,897 | ) | $ | 8,809 |
| $ | 31,117 |
| $ | 51,762 |
|
| $ | (11,897 | ) | $ | 8,809 |
| $ | 31,117 |
| $ | 51,762 |
| $ | 73,922 |
|
Basic income (loss) per share: |
|
|
|
|
|
|
|
|
|
|
|
|
|
|
|
|
|
|
|
|
|
| ||||||||||
Income (loss) before extraordinary gain and cumulative effect of accounting change |
| $ | (0.07 | ) | $ | (0.31 | ) | $ | 0.23 |
| $ | 0.79 |
| $ | 1.25 |
| ||||||||||||||||
Extraordinary gain—acquisition |
| 0.08 |
| — |
| — |
| — |
| — |
| |||||||||||||||||||||
Cumulative effect of accounting change |
| — |
| — |
| — |
| — |
| 0.01 |
| |||||||||||||||||||||
Basic income (loss) per share |
| $ | 0.01 |
| $ | (0.31 | ) | $ | 0.23 |
| $ | 0.79 |
| $ | 1.26 |
| ||||||||||||||||
Basic income (loss) per share before cumulative effect of accounting change |
| $ | (0.31 | ) | $ | 0.23 |
| $ | 0.79 |
| $ | 1.25 |
| $ | 1.71 |
| ||||||||||||||||
Cumulative per share effect of accounting change |
| — |
| — |
| — |
| 0.01 |
| — |
| |||||||||||||||||||||
Basic net income (loss) per share |
| $ | (0.31 | ) | $ | 0.23 |
| $ | 0.79 |
| $ | 1.26 |
| $ | 1.71 |
| ||||||||||||||||
Weighted average common shares outstanding—basic |
| 38,345 |
| 38,382 |
| 38,418 |
| 39,392 |
| 41,176 |
|
| 38,382 |
| 38,418 |
| 39,392 |
| 41,176 |
| 43,216 |
| ||||||||||
Diluted income (loss) per share: |
|
|
|
|
|
|
|
|
|
|
|
|
|
|
|
|
|
|
|
|
|
| ||||||||||
Income (loss) before extraordinary gain and cumulative effect of accounting change |
| $ | (0.17 | ) | $ | (0.31 | ) | $ | 0.21 |
| $ | 0.70 |
| $ | 1.10 |
| ||||||||||||||||
Extraordinary gain—acquisition |
| 0.08 |
| — |
| — |
| — |
| — |
| |||||||||||||||||||||
Cumulative effect of accounting change |
| — |
| — |
| — |
| — |
| 0.01 |
| |||||||||||||||||||||
Diluted income (loss) per share |
| $ | (0.09 | ) | $ | (0.31 | ) | $ | 0.21 |
| $ | 0.70 |
| $ | 1.11 |
| ||||||||||||||||
Diluted income (loss) per share before cumulative effect of accounting change |
| $ | (0.31 | ) | $ | 0.21 |
| $ | 0.70 |
| $ | 1.10 |
| $ | 1.53 |
| ||||||||||||||||
Cumulative per share effect of accounting change |
| — |
| — |
| — |
| 0.01 |
| — |
| |||||||||||||||||||||
Diluted net income (loss) per share |
| $ | (0.31 | ) | $ | 0.21 |
| $ | 0.70 |
| $ | 1.11 |
| $ | 1.53 |
| ||||||||||||||||
Weighted average common shares outstanding—diluted |
| 40,361 |
| 38,382 |
| 41,858 |
| 44,459 |
| 46,723 |
|
| 38,382 |
| 41,858 |
| 44,459 |
| 46,723 |
| 48,165 |
| ||||||||||
|
|
|
|
|
|
|
|
|
|
|
|
|
|
|
|
|
|
|
|
|
|
| ||||||||||
Other Consolidated Financial Data ($000) |
| 2002 |
| 2003 |
| 2004 |
| 2005 |
| 2006 |
|
| 2003 |
| 2004 |
| 2005 |
| 2006 |
| 2007 |
| ||||||||||
Stock-based compensation expense (income) under the liability method |
| $ | (3,283 | ) | $ | 17,796 |
| $ | 8,963 |
| $ | 2,810 |
| $ | — |
| ||||||||||||||||
Stock-based compensation expense under the liability method |
| $ | 17,796 |
| $ | 8,963 |
| $ | 2,810 |
| $ | — |
| $ | — |
| ||||||||||||||||
Stock-based compensation expense under the equity method |
| 10,575 |
| 11,233 |
| 7,760 |
| 8,085 |
| 8,575 |
|
| 11,233 |
| 7,760 |
| 8,085 |
| 8,575 |
| 10,978 |
| ||||||||||
Total stock-based compensation expense (1) |
| $ | 7,292 |
| $ | 29,029 |
| $ | 16,723 |
| $ | 10,895 |
| $ | 8,575 |
|
| $ | 29,029 |
| $ | 16,723 |
| $ | 10,895 |
| $ | 8,575 |
| $ | 10,978 |
|
|
|
|
|
|
|
|
|
|
|
|
|
|
|
|
|
|
|
|
|
|
|
| ||||||||||
Sales tax expense (2) |
| $ | 2,837 |
| $ | 3,079 |
| $ | — |
| $ | — |
| $ | — |
|
| $ | 3,079 |
| $ | — |
| $ | — |
| $ | — |
| $ | — |
|
Cash used for investing activities |
| (6,068 | ) | (29,634 | ) | (22,750 | ) | (16,913 | ) | (129,002 | ) | |||||||||||||||||||||
Cash provided by (used for) financing activities |
| (1,952 | ) | (26 | ) | (6,367 | ) | 25,256 |
| 33,983 |
| |||||||||||||||||||||
Cash used for investing activities (3) |
| (29,634 | ) | (22,750 | ) | (16,913 | ) | (129,002 | ) | (102,838 | ) | |||||||||||||||||||||
Cash provided by (used for) financing activities (4) (8) |
| (26 | ) | (6,367 | ) | 25,256 |
| 33,983 |
| 52,465 |
| |||||||||||||||||||||
|
|
|
|
|
|
|
|
|
|
|
|
|
|
|
|
|
|
|
|
|
|
| ||||||||||
Cash provided by operating activities |
| $ | 16,542 |
| $ | 29,705 |
| $ | 32,862 |
| $ | 48,445 |
| $ | 98,677 |
|
| $ | 29,705 |
| $ | 32,862 |
| $ | 48,445 |
| $ | 98,677 |
| $ | 112,368 |
|
Capital expenditures |
| (5,989 | ) | (8,607 | ) | (7,730 | ) | (7,451 | ) | (4,722 | ) |
| (8,607 | ) | (7,730 | ) | (7,451 | ) | (4,722 | ) | (11,346 | ) | ||||||||||
Free cash flow (3) |
| $ | 10,553 |
| $ | 21,098 |
| $ | 25,132 |
| $ | 40,994 |
| $ | 93,955 |
| ||||||||||||||||
Free cash flow (5) |
| $ | 21,098 |
| $ | 25,132 |
| $ | 40,994 |
| $ | 93,955 |
| $ | 101,022 |
| ||||||||||||||||
|
|
|
|
|
|
|
|
|
|
|
|
|
|
|
|
|
|
|
|
|
|
| ||||||||||
Consolidated Balance Sheet Data |
| 2002 |
| 2003 |
| 2004 |
| 2005 |
| 2006 |
|
| 2003 |
| 2004 |
| 2005 |
| 2006 |
| 2007 |
| ||||||||||
Cash, cash equivalents and investments |
| $ | 64,796 |
| $ | 76,158 |
| $ | 95,463 |
| $ | 153,190 |
| $ | 163,751 |
|
| $ | 76,158 |
| $ | 95,463 |
| $ | 153,190 |
| $ | 163,751 |
| $ | 258,588 |
|
Working capital (deficit) (4) |
| 10,005 |
| (5,206 | ) | 16,902 |
| 90,374 |
| 70,021 |
| |||||||||||||||||||||
Working capital (deficit) (6) |
| (5,206 | ) | 16,902 |
| 90,374 |
| 70,021 |
| 149,723 |
| |||||||||||||||||||||
Total assets |
| 152,781 |
| 180,265 |
| 213,361 |
| 296,311 |
| 447,838 |
|
| 180,265 |
| 213,361 |
| 296,311 |
| 447,838 |
| 649,307 |
| ||||||||||
Deferred revenue (4) |
| 47,731 |
| 55,554 |
| 63,363 |
| 71,155 |
| 100,525 |
| |||||||||||||||||||||
Long-term liabilities (5) |
| 21,243 |
| 25,486 |
| 30,128 |
| 6,756 |
| 10,952 |
| |||||||||||||||||||||
Total shareholders’ equity (5) (6) |
| 48,132 |
| 44,821 |
| 64,381 |
| 173,714 |
| 269,423 |
| |||||||||||||||||||||
Deferred revenue (6) |
| 55,554 |
| 63,363 |
| 71,155 |
| 100,525 |
| 129,302 |
| |||||||||||||||||||||
Long-term liabilities (7) |
| 25,486 |
| 30,128 |
| 6,756 |
| 10,952 |
| 23,166 |
| |||||||||||||||||||||
Total shareholders’ equity (7) (8) |
| 44,821 |
| 64,381 |
| 173,714 |
| 269,423 |
| 408,303 |
| |||||||||||||||||||||
3135
(1) |
| |
In 2006, we began granting restricted stock units. We measure the fair value of our restricted stock units on the date of grant based on the market price of the underlying common stock as of the close of trading on the day prior to grant. We amortize that value to stock-based compensation expense, net of estimated forfeitures, ratably over the vesting period. Refer to Note 11 of the Notes to our Consolidated Financial Statements for more information on our stock-based compensation. | ||
(2) | In 2003, we began participating in voluntary disclosure or similar programs related to state sales tax. Through these programs, we identified sales tax amounts attributed to 2003 and prior years and negotiated or are in discussions with local tax authorities to settle these amounts. We recorded total expense of $9.0 million in 2000, 2001, 2002, and 2003, the years to which these sales tax amounts apply. Based on the most current information available, the actual sales tax expense was not materially different from the estimates recorded in those periods. | |
(3) | Cash used for investing activities consists primarily of cash used for acquisitions; purchases of investments, net of proceeds from the sale of investments; and capital expenditures. The level of investing activities can vary from period to period depending on the level of activity in these three categories. Cash used for investing activities increased substantially in 2007 and 2006, primarily for acquisitions. Over the past two years, Morningstar made four key acquisitions. In addition, capital expenditures increased in 2007 compared with prior years’ spending levels. Refer to Item 7 — Management’s Discussion and Analysis of Financial Condition and Results of Operations - Liquidity and Capital Resources, for more information concerning cash used for investing activities. |
Subsequent to our initial public offering, we no longer settle stock options for cash. As a result, all of our options are currently accounted for under the equity method. Refer to Note 11 of the Notes to our Consolidated Financial Statements for more information on our stock-based compensation.
(2) In 2003, we began participating in voluntary disclosure or similar programs related to state sales tax. Through these programs, we identified sales tax amounts attributed to 2003 and prior years and negotiated or are in discussions with local tax authorities to settle these amounts. We recorded total expense of $9.0 million in 2000, 2001, 2002, and 2003, the years to which these sales tax amounts apply. Based on the most current information available, the actual sales tax expense was not materially different from the estimates recorded in those periods.
(3) Free cash flow is considered a non-GAAP financial measure under SEC regulations. We present this measure as supplemental information to help investors better understand trends in our business results over time. Our management team uses free cash flow to evaluate the performance of our business. Free cash flow is not equivalent to any measure of performance required to be reported under U.S. generally accepted accounting principles (U.S. GAAP), nor should this data be considered an indicator of our overall financial performance or liquidity. Moreover, the free cash flow definition we use may not be comparable to similarly titled measures reported by other companies.
(4) We frequently invoice or collect cash in advance of providing services or fulfilling subscriptions for our customers. These amounts are recorded as deferred revenue on our Consolidated Balance Sheets. As a result of recording deferred revenue, our working capital may at times be negative.
(5) In the second quarter of 2005, upon completion of our initial public offering, we reclassified $24.9 million related to stock options accounted for as long-term liabilities, in accordance with SFAS No. 123, to additional paid-in capital.
(6) In May 2005, we completed our initial public offering of 7,612,500 shares of our common stock. These shares commenced trading on May 3, 2005 and now trade on the Nasdaq Global Select Market under the symbol “MORN.” All of these shares were sold by affiliates of SOFTBANK Finance Corporation, a wholly owned subsidiary of SOFTBANK Corp. We did not receive any proceeds from the sale of these shares. In addition, we granted the underwriters the right to purchase up to an additional 1,141,875 shares at the initial public offering price to cover over-allotments. In May 2005, the underwriters exercised their over-allotment option in full. We received net proceeds of $18.1 million based on our initial public offering price of $18.50 per share, after deducting the underwriting discounts and commissions and approximately $2.6 million of offering expenses.
3236
(4) | Cash provided by financing activities in 2005 includes $18.1 million of net proceeds from our initial public offering in May 2005. In 2006 and 2007, cash provided by financing activities consists primarily of proceeds from stock option exercises and excess tax benefits. Refer to Item 7 — Management’s Discussion and Analysis of Financial Condition and Results of Operations - Liquidity and Capital Resources, for more information concerning cash provided by financing activities. | |
(5) | Free cash flow is considered a non-GAAP financial measure under SEC regulations. We present this measure as supplemental information to help investors better understand trends in our business results over time. Our management team uses free cash flow to evaluate the performance of our business. Free cash flow is not equivalent to any measure of performance required to be reported under U.S. generally accepted accounting principles (U.S. GAAP), nor should this data be considered an indicator of our overall financial performance or liquidity. Moreover, the free cash flow definition we use may not be comparable to similarly titled measures reported by other companies. | |
(6) | We frequently invoice or collect cash in advance of providing services or fulfilling subscriptions for our customers. These amounts are recorded as deferred revenue on our Consolidated Balance Sheets. As a result of recording deferred revenue, our working capital may at times be negative. | |
(7) | In the second quarter of 2005, upon completion of our initial public offering, we reclassified $24.9 million related to stock options accounted for as long-term liabilities, in accordance with SFAS No. 123, to additional paid-in capital. | |
(8) | In May 2005, we completed our initial public offering of 7,612,500 shares of our common stock. These shares commenced trading on May 3, 2005 and now trade on the Nasdaq Global Select Market under the symbol “MORN.” All of these shares were sold by affiliates of SOFTBANK Finance Corporation, a wholly owned subsidiary of SOFTBANK Corp. We did not receive any proceeds from the sale of these shares. In addition, we granted the underwriters the right to purchase up to an additional 1,141,875 shares at the initial public offering price to cover over-allotments. In May 2005, the underwriters exercised their over-allotment option in full. We received net proceeds of $18.1 million based on our initial public offering price of $18.50 per share, after deducting the underwriting discounts and commissions and approximately $2.6 million of offering expenses. |
37
Item 7. Management’s Discussion and Analysis of Financial Condition and Results of Operations
The discussion included in this section, as well as other sections of this Annual Report on Form 10-K, contains forward-looking statements within the meaning ofas that term is used in the Private Securities Litigation Reform Act of 1995. These statements relate toare based on our current expectations about future events or to our future financial performance and involve known and unknown risks, uncertainties, and other factors that may cause our actual results, levels of activity, performance, or achievements to be materially different from any future results, levels of activity, performance, or achievements expressed or implied by these forward-looking statements. In some cases, you can identify forward-lookingperformance. Forward-looking statements by the use oftheir nature address matters that are, to different degrees, uncertain, and often contain words such as “may,” “could,” “expect,” “intend,” “plan,” “seek,” “anticipate,” “believe,” “estimate,” “predict,” “potential,” or “continue” or the negative of these terms or other comparable terminology. You should not place undue reliance on forward-looking“continue.” These statements because they involve known and unknown risks and uncertainties that may cause the events we discussed not to occur or to differ significantly from what we expected. For us, these risks and other factorsuncertainties include, among others, general industry conditions and competition; damage to our reputation resulting from claims made about possible conflicts of interest; liability for any losses that are,result from an actual or claimed breach of our fiduciary duties; legal, regulatory, or political issues related to our data center in some cases, beyondChina; the potential impact of market volatility on revenue from asset-based fees; a prolonged outage of our controldatabase and that could materially affect actual results, levelsnetwork facilities; challenges faced by our non-U.S. operations; and the availability of activity, performance,free or achievements.low-cost investment information.
Other factors that could materially affect actual results, levelsA more complete description of activity, performance, or achievementsthese risks and uncertainties can be found in Item 1A — Risk Factors of this Annual Report on Form 10-K. If any of these risks orand uncertainties materialize, or if our underlying assumptions prove to be incorrect, actual future results may vary significantly from what we projected. AnyWe do not undertake to update our forward-looking statement you read in this Annual Report on Form 10-K reflects our current views with respect to future events and is subject to these and other risks, uncertainties, and assumptions relating to our operations, results of operations, growth strategy, and liquidity. We assume no obligation to publicly update or revise these forward-looking statements for any reason, whether as a result of new information or future events, or otherwise.events.
Understanding Our Company
Our mission is to create great products that help investors reach their financial goals. We offer an extensive line of Internet, software, and print-based products for individual investors, financial advisors, and institutional clients. We also offer asset management services for advisors, institutions, and retirement plan participants. We have historically generated recurring revenue because manyMany of our products are sold through subscriptions or license agreements. We believe that while the fixed costs of the investments in our business are relatively high, the variable cost of adding customers is considerably lower, particularly as our products and services focus more on Internet-based platforms and assets under management. We strive to realize this operating leverage by sellingAs a wide variety of products and services to multiple investor segments, through multiple media, and in many geographic markets.
We manage Morningstar to maximize our long-term results, while staying focused on our mission of helping investors and adhering to our company values. We invest significantly in new product development and in enhancements to our current offerings. Itresult, we typically takes many years to recoup these investments, but we believe they are critical to building long-term value for our shareholders.generate recurring revenue.
We emphasize a decentralized approach to running our business to empower our managers and to create a culture of responsibility and accountability. We operate our decentralized business structure in three global business segments: Individual, Advisor, and Institutional. Early in our history, our product lineup emphasized products for individual investors. As a result, the Individual segment contributed a majority of our revenue. In the early 1990s, our Advisor segment became a more important part of our business. More recently, we’ve begun serving more investors through our Institutional segment, which was the largest of our three segments in terms of revenue in 2006, 2005, and 2004. In all three of these segments, we believe our work helps individual investors make better investment decisions.
33Historically, we have focused primarily on organic growth by introducing new products and services and expanding our marketing efforts for existing products. However, we have made and expect to continue making selective acquisitions that support our four key growth strategies, which are:
·Enhance our position in each of our three operating segments by focusing on our three major Internet-based platforms;
·Become a global leader in funds-of-funds investment management;
·Expand the range of services we offer investors, financial advisors, and institutional clients; and
·Expand our international brand presence, products, and services.
38

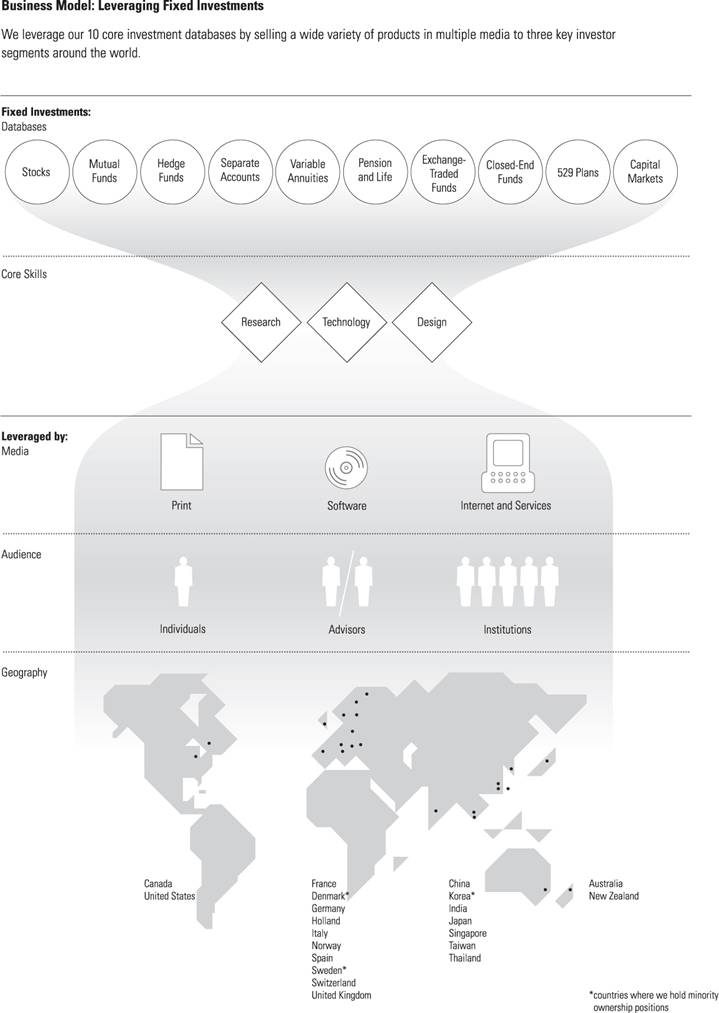
3439
Key Business Characteristics
We believe our business has the following characteristics:
Recurring Revenue
We have historically generated recurringgenerate revenue becauseby selling a variety of investment-related products and services. We sell many of our offerings, such as our newsletters, Principia software, and Premium service on Morningstar.com, via subscriptions. These subscriptions are mainly offered for a one-year term, although we also offer terms ranging from one month to three years. We also sell advertising on our Web sites throughout the world. Several of our other products are sold through subscriptions or license agreements. These subscriptions and licenses generally come up for renewal after one- to three-year terms. Many of the license agreements, inincluding Morningstar Advisor Workstation, Morningstar Equity Research, Morningstar Direct, Morningstar EnCorr, Retirement Advice, and Licensed Data. Our license agreements typically range from one to three years. For some of our Advisor and Institutional segments span multiple years. Because of this recurring revenue,other institutional services, mainly Investment Consulting, we generally have subscriptionsbase our fees on the scope of work and license agreements in place forthe level of service we provide and calculate them as a meaningful percentage of assets under management. We also earn fees relating to Morningstar Managed Portfolios and the managed retirement accounts offered through Morningstar Retirement Manager and Advice by Ibbotson that we calculate as a percentage of assets under management. Overall, revenue tied to asset-based fees accounted for about 16% of our total annualconsolidated revenue at the beginning of each year. We think of this as our “walk-in” revenue.in 2007.
Deferred Revenue
We separatefrequently invoice our annualclients and collect cash in advance of providing services or fulfilling subscriptions for our customers. As a result, we use some of this cash to fund our operations and invest in new product development. The businesses we acquired in 2007 and 2006 have similar business models, and as a result, we acquired their deferred revenue. The deferred revenue into three categories, definedshown on our balance sheet totaled $129.3 million as follows:
•New revenue.of December 31, 2007 and $100.5 million as of December 31, 2006. Deferred revenue is the largest liability on our Consolidated Balance Sheets. We define new revenue as revenue from selling additional products to current customers or from selling to new customers;
•Renewal revenue. We define renewal revenue as revenue from renewals of subscriptions or licenses; and
•“Walk-in” revenue. We define “walk-in” revenue as revenue we expect to recognize during the year from subscriptionsdeferred revenue in future periods as we fulfill our service obligations under our subscription, license, and license agreements in place as of January 1 of each year adjusted for cancellations, currency translations, and other routine adjustments during the year.
Beginning in 2007, we no longer plan to report quarterly information on new, renewal, and walk-in revenue. We’re currently evaluating potential new metrics that may be more useful to investors.
In addition to looking at walk-in, renewal, and new revenue, we calculate a retention rate to evaluate how successful we’ve been in maintaining existing business for products and services that have renewable revenue. We use two different methods for calculating retention. For subscription-based products (including our print newsletters, Morningstar.com Premium Membership service and Principia software), we track the number of subscriptions retained during the year. For products sold through contracts and licenses, we use the contract value method, which is based on tracking the dollar value of renewals compared with the total dollar value of contracts up for renewal during the period. We include changes in the contract value in the renewal amount, unless the change specifically results from adding a new product that we can identify. We also include variable contracts in this calculation and use the previous quarter’s actual revenue as the base rate for calculating the renewal percentage. The retention rate excludes setup and customization fees, migrations to other Morningstar products, and contract renewals that were pending as of January 31, 2007.agreements.
Significant Operating Leverage
Our business requires significant investments to create and maintain proprietary databases and content. We strive to leverage these costs by selling a wide variety of products and services to multiple investor segments, through multiple media, and in many geographic markets. We believe that while the fixed costs of the investments in our business are relatively high, the variable cost of adding customers is considerably lower, particularly as our products and services focus more on Internet-based platforms and assets under management. In the past, we have made investments in building our databases and content that have hurt our short-term operating results for certain periods. In the past several years, our profitability has improved because we’ve been able to increase revenue without increasing our cost base at the same rate. We look for this operating leverage to be evident in our operations over the long term.
Deferred Revenue
We frequently collect cash in advance of providing services or fulfilling subscriptions for our customers. As a result, we can use some of this cash to fund our operations and invest in new product development. Although we may need to issue refunds for the unused portion of the subscription if a customer cancels, we generally have used cash collected in advance of providing services or fulfilling subscriptions to fund many of our other activities. The deferred revenue shown on our balance sheet as of December 31, 2006 totaled $100.5 million, including deferred revenue from acquisitions. As of December 31, 2005, we had $71.2 million in deferred revenue. The $29.3 million increase in deferred revenue from 2005 to 2006 includes the impact of acquisitions.
How Our Business Works
Revenue
We earn revenue by selling a variety of investment-related products and services. Many of our offerings, such as our newsletters, Principia software, and Premium service on Morningstar.com, are sold via subscriptions. These subscriptions are mainly offered for a one-year term, although we also offer terms over other periods ranging from one month to three years. We also sell advertising on our Web sites throughout the world. Several of our other products are sold through license agreements, including Morningstar Advisor Workstation, Morningstar Equity Research, Morningstar Direct, Morningstar EnCorr, Retirement Advice, and Licensed Data. Our license agreements typically range from one to three years. For some of our other institutional services, mainly Investment Consulting, our fees are generally based on the scope of work and the level of service we provide and calculated as a percentage of assets under management. We also collect fees relating to Morningstar Managed Portfolios and the managed retirement accounts offered through Morningstar Retirement Manager and Advice by Ibbotson that are calculated as a percentage of assets under management.
Operating Expense
We classify our expenses into separate categories for cost of goods sold, development, sales and marketing, general and administrative, and depreciation and amortization, as described below. We include stock-based compensation expense, as appropriate,
35
in each of these categories.
•· Cost of goods sold. This category includes the compensation expense for employees who produce the products we deliver to our customers. For example, this category covers the cost of production teams and analysts who write investment research reports. Cost of goods sold also includes other expenses such as postage, printing, and CD-ROM replication, as well as shareholder servicing fees for Morningstar Managed Portfolios and costs for outsourced product implementation expense for development projects associated with the Advice by Ibbotson service.Portfolios.
•· Development. This category mainly includes compensation expense for programmers, designers, and other employees who develop new products and make enhancements toenhance existing products. In some cases, we capitalize the compensation costs associated with certain development projects. This reduces the expense that we would otherwise report in this category. We amortize these capitalized costs over the estimated economic life of the software, which is generally three years, and include this expense in depreciation and amortization.
40
•· Sales and marketing. This category includes compensation expense for our sales teams, product managers, and other marketing professionals. We also include the cost of advertising, direct mail campaigns, and other marketing programs to promote our products.
•· General and administrative. This category consists mainly of compensation expense for each segment’s management team, as well as human resources, finance, and support employees for each segment. The category also includes compensation expense for senior management and corporate expenses, including corporate systems, accounting, legal, and facilities expense.
•· Depreciation and amortization. Our capital expenditures consist mainly of computers, leasehold improvements, and capitalized product development costs related to certain software development projects. We recognize depreciationdepreciate property and amortizationequipment primarily using the straight-line method based on the useful life of the asset, which ranges from three to seven years. We amortize leasehold improvements over the remaining lease term or their useful lives, whichever is shorter. We amortize capitalized product development costs for these items over their estimated useful lives,economic life, which is generally ranging from three to seven years. We also include amortization related to intangible assets, which is mainly driven by acquisitions, in this category.
International Operations
We consolidate the results of our majority-owned operations outside the United States. We account for our minority-owned investments in Japan, Korea, Denmark, and Sweden using the equity method.
Our international operations continue to become a more important part of our business. Our non-U.S. revenue increased to 20.6% of consolidated revenue in 2007—6.6 percentage points higher than in 2006.
How We Evaluate Our Business
When our analysts evaluate a stock, they focus on assessing the company’s estimated intrinsic value—the value of the company’s future cash flows, discounted to their worth in today’s dollars. Our approach to evaluating our own business works the same way. Our goal is to increase the intrinsic value of our business over time, which we believe is the best way to create value for our shareholders.
We do not make public financial forecasts for our business because they are, by their nature, subjective and could have an effect on our company’s stock price. We want to avoid creating any incentiveincentives for people within our company to “makemake speculative statements about our financial results that could influence the numbers.”stock price, or to take actions that help us meet short-term forecasts but may not be in the long-term interest of building shareholder value.
We provide three specific measures that can help investors generate their own assessment of how our intrinsic value has changed over time:
•· Revenue;
•· Operating income (loss); and
•· Free cash flow, which we define as cash provided by or used for operating activities less capital expenditures.
Free cash flow is considered a non-GAAP financial measure under Securities and Exchange Commission (SEC) regulations. We present this measure as supplemental information to help investors better understand trends in our business results over time. Our management team uses free cash flow to evaluate the performance of our business. Free cash flow is not equivalent to any measure of performance required to be reported under U.S. generally accepted accounting principles (U.S. GAAP), and should not be considered an indicator of our overall financial performance or liquidity. Moreover, the free cash flow definition we use may not be comparable to similarly titled measures reported by other companies.
41
To evaluate how successful we’ve been in maintaining existing business for products and services that have renewable revenue, we calculate a retention rate. We use two different methods for calculating retention. For subscription-based products (including our print newsletters, Morningstar.com Premium Membership service, and Principia software), we track the number of subscriptions retained during the year. For products sold through contracts and licenses, we use the contract value method, which is based on tracking the dollar value of renewals compared with the total dollar value of contracts up for renewal during the period. We include changes in the contract value in the renewal amount, unless the change specifically results from adding a new product that we can identify. We also include variable contracts in this calculation and use the previous quarter’s actual revenue as the base rate for calculating the renewal percentage. The retention rate excludes setup and customization fees, migrations to other Morningstar products, and contract renewals that were pending as of January 31, 2008.
The Year 2007 in Review
Industry Overview
We monitor developments in the economic and financial information industry on an ongoing basis andbasis. We use these insights to help
36
inform our company strategy, product development plans, and marketing initiatives.
Investment Landscape, Research, and Data
AfterDespite pronounced market volatility and a strong rally towardmarket downturn during the endfourth quarter of 2006,2007, the U.S. equity markets finished the year in positive territory. Morningstar’s U.S. Market Index, a broad stock market benchmark, finishedended the year with a 5.9% total return, of 15.7%, compared with a 6.5% gain15.7% in 2005. Markets2006. Most markets outside of the United States posted similarly strong results. Withfinished the investment climate generally favorable and all diversified equity-fund categories posting positiveyear with higher total returns forversus the year, mutual funds basedU.S. Market Index.
The crisis in subprime mortgages caused extreme disruption in the United States enjoyed positive net inflows forfinancial markets beginning in late 2007. We believe that the year,impact of these problems in the financial services sector to date has been the most severe in areas such as mortgage lending, commercial banking, and investment banking, with less direct impact on asset management firms. However, there could be a spillover effect on other areas as the financial services sector attempts to address issues relating to the subprime mortgage crisis, uncertain credit markets, and a slowing economy.
Total U.S. mutual fund assets increased to $12.0 trillion as of December 31, 2007 based on data from the Investment Company Institute (ICI), compared with $10.4 trillion as of December 31, 2006. Net new cash flows into hybrid funds and taxable bond funds increased over 2006 levels, but cash flows into equity funds were about 16% higher than in 2005. Net cash flows into hybrid funds were lower than in 2005, but cash inflows to taxable bond, municipal bond, and money market funds all increased over 2005 levels.substantially lower. The number of mutual funds increaseddeclined slightly to 8,000 during 2007, compared with about 8,100 during 2006, and total fund assets increased by about 17% to $10.4 trillion as of year-end. the previous year.
The Investment Company Institute estimates that about 54.751 million households in the United States, or 48%44% of all households, own mutual funds. This total is still down slightly from theits peak level in 2001, but higher thanconsistent with the totals in each oflevels shown over the previous fourpast several years.
We believe that continued asset growth and widespread usage of mutual funds is significant because a relatively large portion of Morningstar’s business has historically focused on this area. However, this percentage has been declining as we’ve expanded into equity research and other areas.
The SEC issued interpretive guidance in July 2006 regarding the use of soft dollar payments, which are arrangements in which investment advisors receive research or other services from broker-dealers in exchange for executing trades through that broker. More recently, the Department of Labor proposed regulations that would require brokerage firms to report separately the cost of brokerage and research services provided to pension funds. Pension funds would also be required to disclose soft dollar research payments.
Also related to soft dollars, asset managers in the United Kingdom recently began disclosing the amount of brokerage commissions used for transaction costs and research. Trade associations for fund managers and brokers based in France recently issued recommendations to government regulators related to the amount and usage of brokerage commissions, and financial regulators in Canada have also proposed new soft dollar regulations that would require asset managers to itemize soft dollar costs and allocate them to clients.
We believe these developments are important because they underscore a longer-term trend toward greater pricing transparency and are prompting debate about the cost and value of securities research. In addition, we believe the trend toward unbundled commissions may place additional pressure on budgets for sell-side research, leading to further cuts in coverage lists and increased demand for independent research from companies such as Morningstar.
In September 2006, President Bush signed the Credit Agency Reform Act, which will allow companies that meet certain standards to register with the SEC as rating organizations, broadening competition from current restrictions that only allow credit ratings by five firms currently designated as nationally recognized rating agencies. We believe that increased competition in the credit ratings industry would be favorable for investors, and we’re continuing to monitor the potential impact of this development on our business.
We continued to see strong interestInterest in alternative asset classes, such as hedge funds, remained strong during most of 2007. Based on data from Hedge Fund Research, which tracks asset flows into hedge funds, hedge funds had about $195 billion in net inflows during 2007, compared with $127 billion in net inflows in 2006. Hedge funds, in particular, continued to enjoy strong growth. Based onFund Research estimates published by Hennessee Group,that total hedge fund industry assets increased to $1.44$1.87 trillion inas of December 2006,2007, a 17.5%30% increase from $1.2year-end 2006.
42
Based on data from Cerulli Associates, assets invested in separate accounts reached $850 billion as of December 31, 2007, up from about $767 billion as of year-end 2006. Based on Morningstar’s data, we estimate that total assets invested in variable annuities totaled about $1.5 trillion at the beginningas of the year. The numberDecember 31, 2007.
Assets in exchange-traded funds (ETFs) increased about 44% to reach about $608 billion as of hedge funds and funds of funds continued to balloon,December 2007, compared with more than 19,000 funds in existence$423 billion as of December 2006, based on a studydata from PerTrac Financial Solutions,the ICI. During 2007, the number of U.S.-based ETFs increased to more than 600, compared with about 12,250 as of December 2005. We substantially increased the size of our hedge fund database with our acquisition of the institutional hedge fund and separate account database division of InvestorForce. We’re continuing to expand the information we provide on hedge funds to meet investors’ need for information on this growing asset class.
Several firms, including Moody’s, Standard & Poor’s, and Fitch,350 previously. ETFs have announced plans to introduce hedge-fund ratings in response to investor interest in this area. We continue to monitor developments in the industry and have continued to expand our analyst coverage on hedge funds. We’re also continuing to evaluate the possibility of providing a rating system for hedge funds.
Following an appeals court ruling that overturned a previous SEC rule requiring hedge funds to register as investment advisors, numerous hedge fund firms have withdrawn their previous registrations. At the same time, losses experienced by individual funds have led some industry leaders to call for increased regulation. The SEC has also voiced concern about potential insider trading on the part of hedge funds, as well as the potential risks to hedge fund shareholders. Near the end of 2006, the SEC proposed increasing the
37
minimum net worth requirement for hedge fund investors to $2.5 million, from $1.0 million previously. As debate about hedge fund regulation goes on, we plan to continue our efforts to make the industry more transparent for investors.
Asset growth in separately managed accounts was also relatively strong in 2005. Based on data from the Money Management Institute, assets in separate accounts increased by about 25% to reach $806 billion as of September 30, 2006, compared with $646 billion as of September 30, 2005.
Assets in exchange-traded funds (ETFs) increased 40% to reach about $422 billion as of December 2006, compared with $301 billion as of December 2005, based on data from the Investment Company Institute. ETFs continued to gaingained share from mutual funds in some specialized areas of the market because of their lower annual costs, particularlyand have also started being used in passive investing strategies.defined contribution plans, such as 401(k)s. To meet greater investor demand for information on ETFs, we have increased ourcontinued to increase analyst coverage in this area and now cover about 165 ETFs. We’re also planning to create a new cover page for the ETF area of Morningstar.com and recently introduced a new rating systemreport format for ETFsETFs.
In 2007, we also saw significant investor interest and new product development in March 2006. In addition, we recently launchedopen-end mutual funds that pursue alternative investment strategies, such as 130/30 funds, which invest in traditional long-only securities but also sell short a portion of their assets and use the proceeds to build additional long exposure. We believe this trend signifies that the lines are blurring between traditional mutual funds registered under the Investment Company Act and alternative investment strategies often used by hedge funds. We believe we’re well-positioned to meet the need for information and analysis on complex investment strategies, and that our broad investment coverage also gives us an ETF newsletter and expanded our annual softcover reference guide, the Morningstar ETFs 100, to become the Morningstar ETFs 150.advantage in meeting this market need.
Individual Investor Market
With market conditions generally positive, the environment for advertising sales has been relatively healthy. A recent report from the Interactive Advertising Bureau estimated that spending on Internet advertising totaled about $16 billion in 2006, a 28% increase over $12.5 billion in 2005. Many advertisers have continued to shift traditional print, radio, and television placements to the Internet. Based on research from Nielsen/NetRatings, total page views to most retail investment Web sites remained fairly consistentdecreased in the fourth quarter of 2007, with aggregate page views declining 2% from the same period in 2006. PageHowever, some sites showed large increases and others posted declines. Overall, the number of unique users to retail investment Web sites increased by about 17%. For Morningstar.com, both page views and unique users increased in the fourth quarter of 2007 from the same period in 2006. Morningstar.com continued to Morningstar.com remained lowerperform better than those of larger competing sites based on metrics such as Yahoo! Finance, AOL Money & Finance, and MSN Money, but the time spent per visit and average page viewsthe number of pages viewed per visit statistics remained higher than those of competing sites. We believe this indicates that investors view our site as useful and find value in the information we provide. We also appeal to a highly qualified audience based on income levels and investable assets.visit.
Financial Advisor Market
In 2007, demand for financial advisory services continued to rise, as an increasing percentage of investors have been working with advisors to plan their financial futures. The agingindependent advisor channel has had particularly strong growth over the past three years, based on research published by Financial Research Corporation. We believe this trend is important because our products are well-suited to meet the needs of the American populationindependent financial advisors, and we have a strong market position in this growing area.
Larger advisory firms have been continuing to prepare for the corresponding needpending termination of the “Merrill Lynch rule,” which allowed brokerage firms to provide investment advice in exchange for more information andan asset-based fee. We think this development is notable because we believe many broker-dealers may shift their clients out of fee-based brokerage accounts, which typically include various services, including investment advice, on retirement income planning has beenin exchange for an important trendasset-based fee. We believe this highlights the ongoing regulatory complexity in the Advisoradvisor segment. To meet this need, in 2006In addition, it may lead to additional business opportunities for the investment advisory services we launched Retirement Income Strategist, a Web-based software application that helps advisors analyze retirement income for clients who are retired or nearing retirement. Retirement Income Strategist helps advisors analyze whether an individual’s savings will last during retirement and explore alternative scenarios for sustaining income during retirement. We also created a Retirement Income Education Center, a hosted Web site offering educational content and tools about retirement income for financial advisors affiliated with institutions.
Many advisors have also sought to streamline and simplify their operations; to meet this need, some advisors have been outsourcing investment management so they can spend more time on planning-related issues and client management. We’ve also seen a continuing consolidation trend among broker-dealers and other firms in the Advisor segment. For example, UBS increased the size of its advisor force by purchasing Piper Jaffray’s brokerage unit in 2006. We believe that this ongoing acquisition trend is being driven by the desire to increase scale and maximize cost efficiencies. Independent financial advisors have continued to gain market share among high-net-worth investors, but larger institutions are benefiting from their lower cost structures and economies of scale. As the financial advisory landscape continues to evolve, we believe advisors will continue to demand comprehensive research platforms and integrated portfolio tools.offer.
Institutional Market
In August 2006, President Bush signed the Pension Protection ActUnited States, there has been continuing debate about improving disclosure of 2006, which includes provisionsfees and returns in 401(k) plans. In July 2007, the U.S. House Education and Labor Committee chairman submitted a bill that would require 401(k) plans to disclose more information to retirement plan participants each year, as well as provide for offering investment advice programsadditional oversight by the Department of Labor. We believe this development is important because it highlights the need for participantstransparency in defined contribution plans. The investment advice provision went into effect for employer-sponsoredthe retirement plans on January 1, 2007.market.
Among other things, the new act allows plan service providers, mutual fund companies, and brokerage firms to offer investment advice to plan participants using their own computer models (including advising them to invest in their own proprietary funds), subject to certification of the computer model by an independent expert. We’re continuing to monitor the potential impact of this provision on our business. Although more companies may rely on retirement plan providers to offer investment advice to their employees, we believe there will be ongoing demand for third-party advice as well. In particular, we believe there may be opportunities for us to continue to license our computer-driven advice model to plan providers.
3843
The legislation also contains provisions that may encourage automatic enrollment and thePension Protection Act of 2006 has led to more use of target-date funds and other qualified default investment alternatives. In addition, the Pension Protection Act has led to more opportunities for retirement advice programs offered at the employer level. We continue to expand our retirement advice offerings to meet this need, particularly in managed retirement accounts as a default investment option. Therefore, we believe this development may have a positive impact on the managed retirement accounts that we offer through Morningstar Associates and Ibbotson Associates, two of our investment advisory subsidiaries.accounts.
Continuing an industry-wide trend toward separatingMerger and acquisition activity continued in the manufacturingindustry in 2007. In May 2007, Thomson Corporation and distribution of investment portfolios, Merrill Lynch spun off its investment management group in 2006, selling its asset management group to BlackRock, an asset management firm. Also in 2006, Principal Financial completed its acquisition of Washington Mutual’s mutual fund management arm, along with its distributor and shareholder-services business. In early 2007, the parent company of Putnam Investments (Marsh & McLennan Companies) reachedReuters entered into an agreement to sell its asset-management unit.form a combined company, Thomson-Reuters. Pending regulatory approval, the two companies expect to complete the merger in the second quarter of 2008. We continue to monitor mergersmerger and acquisitionsacquisition activity in the asset managementour industry because of theirits potential impact on specific areas of our business.
As an industry-wide trend, we continued to see strong interest in retirement income in 2007. A large number of investors are currently approaching retirement and making the transition from accumulating assets to drawing down their portfolios. As a result, Financial Research Corporation estimates that total assets invested in retirement income related products will total more than $7 trillion over the next 10 or 15 years. We have continued to develop products and services to meet this need, including target spending portfolios, annuitization programs, and retirement income planning tools.
Worldwide Markets
In Europe, many financial services companies have been preparing for the upcoming implementation date of the Market in Financial Instruments Directive (MiFID). The directive took effect in November 2007 and obligates companies to be more transparent with clients and make efforts to provide better-quality service to investors. We believe Morningstar is well-positioned to help companies meet the new requirements because our services and products are already largely in line with MiFID’s objectives.
In Germany, the legislature recently passed a tax rule that involves taxing long-term capital gains of mutual funds starting in January 2009. Investors holding funds of funds, however, will have some tax protection until they sell the fund. In addition, insurance-wrapped funds will be subject to different taxation rules that are more favorable than direct fund investments. Because of this change, we expect continued asset growth and product launches in insurance-wrapped and funds-of-of funds products.
In Canada, the traditional pension fund area continues to expand. We believe that pension funds have a need for more information on the various asset classes they invest in and see opportunities for Morningstar to add value in this area. In addition, Canadian regulators recently increased the age limits and annual contribution limits for several types of savings plans.
In New Zealand, the government introduced a new Kiwi Saver retirement savings initiative in July 2007 and established a number of incentives, including government and compulsory employer contributions, that will start in April 2008.
In Japan, regulators implemented a new Financial Products Law in September 2007. The new law entails more risk disclosure and suitability requirements, which we think is positive for the industry.
Emerging markets across Asia continued their strong growth in 2007, and we’ve continued to expand our presence to meet the need for investment information in markets such as China and India. We are expanding our operations in India and plan to launch a Web site for individual investors in 2008.
44
Performance Summary
The list below summarizes the key accomplishments and disappointmentschallenges that our management team has highlighted related to our 20062007 performance:
Accomplishments·We significantly increased our global presence. We doubled our revenue outside the United States and expanded our global database to 265,000 investment vehicles. Part of this growth came from the fund data business acquired from Standard & Poor’s, which strengthened our brand in several international markets. The integration was a big undertaking, and we accomplished it swiftly. In December 2007, we announced our plans to acquire several Hemscott businesses. We completed that acquisition on January 9, 2008.
•· We successfully completed and integrated several acquisitions, includingOur Investment Consulting businesses—both Ibbotson Associates and Morningstar Associates—had a leading providerbanner year, contributing about 24% of asset allocation research and services; Aspect Huntley,our annual revenue growth. We now have $97.5 billion in assets under advisement. Revenue from asset-based fees now makes up approximately 16% of our consolidated revenue. Despite significant market volatility, we continued to see net inflows into the funds of funds on which we provide advisory services throughout most of 2007. However, our asset-based revenue could be affected by a leading provider ofdecline in the equity information, research, and financial trade publishing in Australia; and the hedge fund and separate account database division of InvestorForce.market.
•· We significantly expandedlaunched a host of new offerings, including Morningstar Site Builder, which allows investment firms to integrate our hedgetools and content into their Web sites; Advisor Workstation Office Edition in the UK; Morningstar Advisor Magazine; and a family of fixed-income and commodity futures indexes.
·We continued to invest in our analyst staff and now have 171 stock and fund separate account,analysts around the world. We began qualitative research coverage on open-end investment companies and Europeanunit trusts in the UK and offshore mutual fund databases. We created a pension and life fund databaseinitial public offerings in the United Kingdom and established mutual fund databases in Taiwan and Singapore. We introduced new Investor Return data, also known as dollar-weighted return, to capture how the average investor fared in a fund.States.
•· We strengthened our board with the addition of two new members, Frank Ptak, president and CEO of the Marmon Group, and William Lyons, former president and CEO of American Century Companies.
·We launched several new Web-based software applications, includinga Retirement Income Strategist which analyzes an investor’s income needs in retirement; and Morningstar Portfolio Builder, which helpstool for financial advisors quickly create portfolio proposals.
• We achieved meaningful sales of Morningstar Direct outside of the United States, with nearly 25% of Direct’s revenue now coming from international markets. We also introduced several new products overseas, including Portfolio Builder and Morningstar Hypothetical Illustrator, a tool that creates customized historical investment illustrations.
Disappointments
• Software development for our major upgrade of Morningstar Direct took longer than we expected.
• The regulatory investigations into Morningstar Associates, which began in late 20042006, but did not see strong demand in 2007. We believe there’s a growing need for solutions that help investors manage their income during retirement, and early 2005, continuedwe’ve also developed several services for institutional clients within our Investment Consulting areas. We expect our in-retirement solutions to consume management’s timegain greater adoption in 2006 as we held ongoing discussions with regulators in an attempt to work toward a resolution.2008.
39
Consolidated Results
($000) |
| 2006 |
| 2005 |
| 2004 |
| 2006 Change |
| 2005 Change |
|
| 2007 |
| 2006 |
| 2005 |
| 2007 Change |
| 2006 Change |
| ||||||
Revenue |
| $ | 315,175 |
| $ | 227,114 |
| $ | 179,658 |
| 38.8 | % | 26.4 | % |
| $ | 435,107 |
| $ | 315,175 |
| $ | 227,114 |
| 38.1% |
| 38.8% |
|
Operating income (loss) |
| 77,527 |
| 46,480 |
| 17,735 |
| 66.8 | % | 162.1 | % | |||||||||||||||||
Operating margin (%) |
| 24.6 | % | 20.5 | % | 9.9 | % | 4.1 | pp | 10.6 | pp | |||||||||||||||||
Operating income |
| 117,254 |
| 77,527 |
| 46,480 |
| 51.2% |
| 66.8% |
| |||||||||||||||||
Operating margin |
| 26.9% |
| 24.6% |
| 20.5% |
| 2.3pp |
| 4.1pp |
| |||||||||||||||||
|
|
|
|
|
|
|
|
|
|
|
|
|
|
|
|
|
|
|
|
|
|
| ||||||
Cash used for investing activities |
| $ | (129,002 | ) | $ | (16,913 | ) | $ | (22,750 | ) | 662.7 | % | (25.7 | )% |
| $ | (102,838) |
| $ | (129,002) |
| $ | (16,913) |
| (20.3)% |
| 662.7% |
|
Cash provided by (used for) financing activities |
| 33,983 |
| 25,256 |
| (6,367 | ) | 34.6 | % | NMF |
| |||||||||||||||||
Cash provided by financing activities |
| 52,465 |
| 33,983 |
| 25,256 |
| 54.4% |
| 34.6% |
| |||||||||||||||||
|
|
|
|
|
|
|
|
|
|
|
|
|
|
|
|
|
|
|
|
|
|
| ||||||
Cash provided by operating activities |
| $ | 98,677 |
| $ | 48,445 |
| $ | 32,862 |
| 103.7 | % | 47.4 | % |
| $ | 112,368 |
| $ | 98,677 |
| $ | 48,445 |
| 13.9% |
| 103.7% |
|
Capital expenditures |
| (4,722 | ) | (7,451 | ) | (7,730 | ) | (36.6 | )% | (3.6 | )% |
| (11,346) |
| (4,722) |
| (7,451) |
| 140.3% |
| (36.6)% |
| ||||||
Free cash flow |
| $ | 93,955 |
| $ | 40,994 |
| $ | 25,132 |
| 129.2 | % | 63.1 | % |
| $ | 101,022 |
| $ | 93,955 |
| $ | 40,994 |
| 7.5% |
| 129.2% |
|
|
|
|
|
|
|
|
|
|
|
|
|
|
|
|
|
|
|
|
|
|
|
| ||||||
NMF–NMF—not meaningful
pp–pp—percentage point(s)
As noted inHow We Evaluate Our Business,we define free cash flow which we define as cash provided by or used for operating activities less capital expenditures,expenditures. We present free cash flow as a supplemental disclosure to help you better understand how much cash is considered a non-GAAP financial measure. This measureavailable after we spend money to operate our business. Our management team uses free cash flow to evaluate the performance of our business. Free cash flow is not equivalent to anya measure of performance required to be reportedset forth under U.S. GAAP andgenerally accepted accounting principles (GAAP). Also, the free cash flow definition we use may not be comparable to similarly titled measures reportedused by other companies.
45
Because we’ve made several acquisitions in recent years, comparing our financial results from year to year is complex. To make it easier for investors to compare our results in different periods, we provide information on both organic revenue, which includes our underlying business excluding acquisitions, and revenue from acquisitions. We include an acquired operation as part of our revenue from acquisitions for 12 months after we complete the acquisition. After that, we include it as part of our organic revenue stream.
The table below shows the periods in 2006 and 2007 during which we included each acquired operation in revenue from acquisitions:
Acquisition |
| 2006 |
| 2007 |
Ibbotson Associates, Inc. |
| March 1 through December 31, 2006 |
| January 1 through February 28, 2007 |
|
|
|
|
|
Aspect Huntley Pty Limited |
| July 25 through December 31, 2006 |
| January 1 through July 24, 2007 |
|
|
|
|
|
Hedge fund and separate account database division of InvestorForce, Inc. |
| August 1 through December 31, 2006 |
| January 1 through July 31, 2007 |
|
|
|
|
|
Mutual fund data business from Standard & Poor’s |
| — |
| March 16 through December 31, 2007 |
Consolidated Revenue
In 2006,2007, our consolidated revenue increased by38.1% to $435.1 million. During 2007, we had strong organic growth as well as new revenue from acquisitions, the majority of which was from the mutual fund data business we acquired from Standard & Poor’s in March 2007. As a whole, acquisitions contributed $44.2 million, or 14 percentage points, to our consolidated revenue growth in 2007—a slightly lower percentage compared with 2006.
Our consolidated revenue increased 38.8% over 2005. We finished the year with more than $300to $315.2 million in consolidated revenue. This past year was notable for us because we made2006 from strong organic growth as well as new revenue from three key acquisitions: Ibbotson Associates, Aspect Huntley, and the hedge fund and separate account database division of InvestorForce. Adding these operations to our existing business contributed $36.4 million of revenue, in 2006, the majority of which was from Ibbotson. WhileThese acquisitions helped expandrepresented 16 percentage points of our consolidated revenue basegrowth in 2006,2006.
To give investors more insight on our company’s underlying growth rate, we also generated strongprovide information about our organic growth. Without the impact ofrevenue growth, which excludes revenue from acquisitions and foreign currency translations, organictranslations. On this measure, we also performed well. Organic revenue increased 22.4%growth was $71.9 million, or 22.8%, in 2007, which was in line with our performance in 2006. Organic
Consolidated revenue excluding acquisitions and the impact of foreign currency translations (organic revenue) is considered a non-GAAP financial measure. The tabledefinition of organic revenue we use may not be the same as similarly titled measures used by other companies. Organic revenue should not be considered an alternative to any measure of performance as promulgated under GAAP.
46
The tables below presents a reconciliation fromreconcile consolidated revenue towith revenue excluding acquisitions and the impact of foreign currency translations (organic revenue):
2007 vs. 2006 ($000) |
| 2007 |
| 2006 |
| Change |
| ||
Consolidated revenue |
| $ | 435,107 |
| $ | 315,175 |
| 38.1% |
|
Less: acquisitions |
| (44,226 | ) | — |
| NMF |
| ||
Less: impact of foreign currency translations |
| (3,808 | ) | — |
| NMF |
| ||
Revenue excluding acquisitions and the impact of foreign currency translations |
| $ | 387,073 |
| $ | 315,175 |
| 22.8% |
|
($000) |
| 2006 |
| 2005 |
| Change |
| ||
Consolidated revenue |
| $ | 315,175 |
| $ | 227,114 |
| 38.8 | % |
Less: acquisitions |
| (36,434 | ) | — |
| NMF |
| ||
Less: impact of foreign currency |
| (793 | ) | — |
| NMF |
| ||
Revenue excluding acquisitions and foreign currency translations |
| $ | 277,948 |
| $ | 227,114 |
| 22.4 | % |
2006 vs. 2005 ($000) |
| 2006 |
| 2005 |
| Change |
| ||
Consolidated revenue |
| $ | 315,175 |
| $ | 227,114 |
| 38.8% |
|
Less: acquisitions |
| (36,434 | ) | — |
| NMF |
| ||
Less: impact of foreign currency translations |
| (793 | ) | — |
| NMF |
| ||
Revenue excluding acquisitions and the impact of foreign currency translations |
| $ | 277,948 |
| $ | 227,114 |
| 22.4% |
|
In contrast to 2006,While organic revenue growth and acquisitions had only a minorthe most significant impact on our resultsrevenue in 2005. We acquired Variable Annuity Research Database Services (VARDS)2007 and 2006, we also enjoyed a benefit from Finetre Corporationforeign currency translations in January 2005, and this business contributed revenueeach year because of $2.4 millioncontinued weakness in 2005.the U.S. dollar.
In both 20062007 and 2005,2006, our growth was diversified by segment, with all three segments generating meaningfulcontributing to revenue growth. OurHowever, the Institutional segment, is the largestwhich now makes up more than half of our three segments, so it has the greatest impact onconsolidated revenue, generated approximately 70% of our overall results.company-wide revenue increase in 2007. Acquisitions contributed $33.4 million to Institutional segment revenue in 2007. The Institutional segment generated a large percentage of our totalwas also the main contributor to the revenue increase in both 2006 and 2005. Institutional segment revenue increased $50.2 million in 2006, accounting for about 56% of Morningstar’s total revenue increase before eliminating intersegment revenue. In 2005,Acquisitions contributed $25.1 million to Institutional segment revenue increased by $17.5in 2006.
Our two other segments also generated strong revenue growth. Advisor segment revenue rose $21.0 million, generating about 38%or 22.2%, in 2007, accounting for approximately 17% of our totalthe revenue increase before eliminating intersegment revenue. TheAcquisitions contributed $5.8 million to the Advisor segment accounted forrevenue in 2007. Advisor segment revenue rose approximately 25%30.3% in 2006 compared with the full year of 2005, with acquisitions contributing $6.2 million of the revenue increase in both periods. increase.
Individual segment revenue increased $16.6 million, or 20.6%, in 2007 and $17.3 million, or 27.2%, in 20062006. Acquisitions contributed approximately $5.1 million to the Individual segment in 2007 and $16.4 million, or 35.0%, in 2005.2006.
40
|
| 2006 |
| 2005 |
| 2004 |
| |||||||||
Revenue by Segment ($000) |
| Amount |
| % |
| Amount |
| % |
| Amount |
| % |
| |||
Individual |
| $ | 80,706 |
| 25.6 | % | $ | 63,448 |
| 27.9 | % | $ | 46,996 |
| 26.2 | % |
Advisor |
| 94,694 |
| 30.0 |
| 72,689 |
| 32.0 |
| 60,880 |
| 33.9 |
| |||
Institutional |
| 146,085 |
| 46.4 |
| 95,947 |
| 42.2 |
| 78,402 |
| 43.6 |
| |||
Elimination of intersegment revenue |
| (6,310 | ) | (2.0 | ) | (4,970 | ) | (2.1 | ) | (6,620 | ) | (3.7 | ) | |||
Consolidated revenue |
| $ | 315,175 |
| 100.0 | % | $ | 227,114 |
| 100.0 | % | $ | 179,658 |
| 100.0 | % |
On a product level, Investment Consulting was the largest driver behind our revenue increase in 2007 and 2006. Much of our business in this area focuses on asset allocation services that we provide for funds of funds, where we typically act as a portfolio consultant or portfolio construction manager. We continued to see significant growth in assets under advisement from existing clients in both years. Changes in the value of assets under advisement can come from two primary sources: gains or losses related to overall trends in market performance, and net inflows or outflows caused when investors add to or redeem shares from these portfolios. In both 2006 and 2007, both factors contributed to growth in assets under advisement, but increases in net inflows were the main driver behind the asset growth. In 2007, the majority of the revenue increase was also a major contributor todriven by organic revenue growth, in 2005. Newlywhich came from both Morningstar Associates and Ibbotson Associates. In 2006, newly added revenue from Ibbotson’s consultingInvestment Consulting business generated more than 40% of the 2006revenue growth in Investment Consulting,this product, with the remaining amount from Morningstar’s existing consulting business. In both 2006 and 2005, we continued to expand our relationships and increase assets under management with existing clients for the asset allocation services we provide for funds of funds and variable annuities. Investment Consulting surpassed Licensed Data and Morningstar Advisor Workstation to become our single largest product based on revenue in 2006.
47
Advisor Workstation was the second-largest driver of the organic revenue increase in 20062007 and the largest contributor in 2005. About2006. Nearly 90% of the growth in this product was driven by the Enterprise Edition, which we offer to financial advisors affiliated with larger firms, with the remaining amount contributed by thefirms. Advisor Workstation Office Edition for independent financial advisors.advisors contributed the remainder. Total licenses for Advisor Workstation in the United States increased by about 36 %14% in 2006, and2007. Part of this growth reflects changes in the scope of some contracts. In 2007, a few clients who previously held tools-only contracts converted to full-site licenses when they renewed their contracts. For full-site licenses, we include all affiliated advisors who have access to the site in our average revenue pertotal license also increased.count. By contrast, for tools-only contracts, we include a smaller number of advisors in the total based on actual usage.
Newly incorporatedLicensed Data was the third-largest contributor to organic revenue from EnCorr, an asset allocation software package we acquired with Ibbotson,growth in 2007. This growth was anotherdriven by both new clients and higher contract values for existing clients. Including the impact of acquisitions, Licensed Data was also a major contributor to revenue growth, as product revenue now includes newly incorporated revenue from the fund data business acquired from Standard & Poor’s and Aspect Huntley’s institutional database.
Revenue from international operations continues to become a more important part of our business. Because the fund data business acquired from Standard & Poor’s has a strong presence in 2006. Morningstar.com and Licensed Data werenon-U.S. markets, this acquisition boosted our revenue outside the fourth and fifth largest driversUnited States. Our non-U.S. revenue increased to 20.6% of consolidated revenue growth in both 2006 and 2005, although Morningstar.com’s contribution was slightly larger relative to Licensed Data2007—6.6 percentage points higher than in 2006.
Principia wasRevenue from international operations grew $45.4 million, or 102.5%, to $89.7 million in 2007. Approximately half of this revenue increase came from the only one of our top five products based on revenue that didn’t experience revenue growth in 2006 and 2005 because many of our customers have been adopting Advisor Workstation, our newer Web-based investment planning system. Principia revenue was essentially flat in 2006 and declined about 2% in 2005. Our strategy for Principia is to continue increasing revenue per user to maintain the product’s revenue base.
Equity Research, which mainly consists of revenue related to the Global Analyst Research Settlement, was another key contributor to revenue growth in both 2006 and 2005, but to a greater extent in 2005. We began recognizing revenue for our equity research related to the settlement in July 2004, which led to a favorable year-over-year comparison in 2005. In addition, we entered into an equity research agreement with a sixth investment bank involved in the settlement in September 2005 and began recognizing this new revenue in the fourth quarter of that year. Our revenue in this area also benefited in 2006 and 2005 because we’ve continued to increase the number of stocks under coverage, leading to higher contract values for some of the agreements related to the settlement.
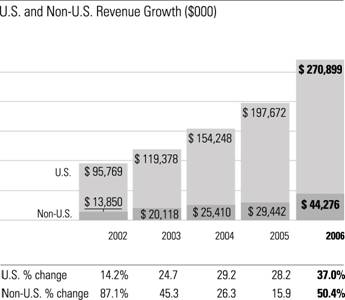
fund data business acquired from Standard & Poor’s. Revenue from non-U.S. operations increased $14.9 million, or 50.4%, to $44.3 million in 2006. Our acquisitions of Aspect Huntley and Ibbotson contributed $8.3 million of the increase. Non-U.S.In January 2008, we completed our acquisition of several Hemscott businesses from Ipreo Holdings LLC. Because most of Hemscott’s revenue made up about 14%is from markets outside the United States, we expect our non-U.S. business to continue increasing as a percentage of consolidatedtotal revenue.
Foreign currency translations had a much smaller, but still favorable, impact on international revenue in 2006, compared with about 13% in 2005. In 2005, our U.S. revenue grew at a faster pace than non-U.S. revenue, partly because of the new revenue related to the Global Analyst Research Settlementboth 2007 and growth in our Investment Consulting business in the United States.2006. Foreign currency translations contributed $0.8$3.8 million of the increase in non-U.S. revenue in 20062007 and $0.7$0.8 million in 2005.2006. Excluding acquisitions and the impact of acquisitions and foreign currency translations, our non-U.S. revenue increased approximately 20%22.4% in 2007 and 13%19.6% in 2006 and 2005, respectively.2006.
The tabletables below presentspresent a reconciliation from international revenue to international revenue excluding acquisitions and the impact of foreign currency translations (organic(international organic revenue):
($000) |
| 2006 |
| 2005 |
| Change |
| |||||||||||
2007 vs. 2006 ($000) |
| 2007 |
| 2006 |
| Change |
| |||||||||||
International revenue |
| $ | 44,276 |
| $ | 29,442 |
| 50.4 | % |
| $ | 89,680 |
| $ | 44,276 |
| 102.5% |
|
Less: acquisitions |
| (8,268 | ) | — |
| NMF |
|
| (31,690 | ) | — |
| NMF |
| ||||
Less: impact of foreign currency translations |
| (793 | ) | — |
| NMF |
|
| (3,808 | ) | — |
| NMF |
| ||||
Revenue excluding acquisitions and foreign currency translations |
| $ | 35,215 |
| $ | 29,442 |
| 19.6 | % | |||||||||
International revenue excluding acquisitions and the impact of foreign currency translations |
| $ | 54,182 |
| $ | 44,276 |
| 22.4% |
| |||||||||
2006 vs. 2005 ($000) |
| 2006 |
| 2005 |
| Change |
| ||
International revenue |
| $ | 44,276 |
| $ | 29,442 |
| 50.4% |
|
Less: acquisitions |
| (8,268 | ) | — |
| NMF |
| ||
Less: impact of foreign currency translations |
| (793 | ) | — |
| NMF |
| ||
International revenue excluding acquisitions and the impact of foreign currency translations |
| $ | 35,215 |
| $ | 29,442 |
| 19.6% |
|
41
($000) |
| 2005 |
| 2004 |
| Change |
| ||||
|
|
|
|
|
|
|
| ||||
International revenue |
| $ | 29,442 |
| $ | 25,410 |
| 15.9 | % | ||
Less: impact of foreign currency transaction translations |
| (694 | ) | — |
| NMF |
| ||||
Revenue excluding acquisitions and foreign currency translations |
| $ | 28,748 |
| $ | 25,410 |
| 13.1 | % | ||
4248
Our five largest products based on revenue–revenue—Investment Consulting, Licensed Data, Morningstar Advisor Workstation, Licensed Data, Morningstar.com, and Principia–represented 59.5%Principia—made up about 60% of our consolidated revenue in 2006, compared with 60.7% in 2005 and 61.5% in 2004.each of the past three years. While the percentage of our revenue made up by our top five products has remained relatively consistent, the order of the products within the top five has changed each year. In 2005, Principia, historically our largest product, was surpassed by Licensed Data and Advisor Workstation. Investment Consulting became our largest product in 2006.2006 and remained there in 2007. Because of organic growth as well as new revenue from Aspect Huntley and the mutual fund data business acquired from Standard & Poor’s, Licensed Data moved up to become our second-largest product in 2007.
Top Five Products (Segment) 2007 |
| Revenue |
| % of Consolidated |
| |
Investment Consulting (Institutional) |
| $ | 75,595 |
| 17.4 | % |
Licensed Data (Institutional) |
| 59,207 |
| 13.6 |
| |
Advisor Workstation (Advisor) |
| 54,980 |
| 12.6 |
| |
Morningstar.com (Individual) |
| 37,630 |
| 8.6 |
| |
Principia (Advisor) |
| 28,760 |
| 6.6 |
| |
Top Five Products (Segment) 2006 |
| Revenue |
| % of Consolidated |
| |
Investment Consulting (Institutional) |
| $ | 46,597 |
| 14.8 | % |
Advisor Workstation (Advisor) |
| 43,140 |
| 13.7 |
| |
Licensed Data (Institutional) |
| 37,730 |
| 12.0 |
| |
Morningstar.com (Individual) |
| 31,311 |
| 9.9 |
| |
Principia (Advisor) |
| 28,735 |
| 9.1 |
| |
Top Five Products (Segment) 2005 |
| Revenue |
| % of Consolidated |
| |
Licensed Data (Institutional) |
| $ | 32,435 |
| 14.3 | % |
Advisor Workstation (Advisor) |
| 29,280 |
| 12.9 |
| |
Principia (Advisor) |
| 28,788 |
| 12.7 |
| |
Morningstar.com (Individual) |
| 25,502 |
| 11.2 |
| |
Investment Consulting (Institutional) |
| 21,904 |
| 9.6 |
| |
Top Five Products (Segment) 2004 |
| Revenue |
| % of Consolidated |
| |
Principia (Advisor) |
| $ | 29,231 |
| 16.3 | % |
Licensed Data (Institutional) |
| 27,203 |
| 15.1 |
| |
Morningstar.com (Individual) |
| 20,670 |
| 11.5 |
| |
Advisor Workstation (Advisor) |
| 19,464 |
| 10.8 |
| |
Investment Consulting (Institutional) |
| 13,853 |
| 7.7 |
| |
Revenue Composition
As discussed in the Recurring RevenueHow We Evaluate Our Business section of Key Business Characteristics,, we separate our revenue into three categories: new revenue,calculate retention and renewal revenue,rates to help measure how successful we’ve been in maintaining existing business for products and “walk-in”services that have renewable revenue.
The following graph illustrates the composition of our revenuethese two metrics over the past four years.three years:


Our 2006 revenue consisted of $45.1 million in new revenue, or 16.2%, of our revenue excluding acquisitions for the year. Renewal revenue accounted for $101.2 million, or 36.3%, of revenue excluding acquisitions. Walk-in revenue accounted for $132.5 million, or 47.5%, of this amount.
As of January 1, 2007, our estimate of 2007 walk-in revenue was $182.9 million, which includes $21.2 million from acquisitions completed in 2006. This estimate is subject to change based on cancellations during the year, the impact of currency translations, and other routine adjustments. In comparison, our walk-in revenue as of January 1, 2006, was $138.8 million. In the second quarter of 2006, we reclassified a portion of our revenue composition, reducing 2006 walk-in revenue by $5.0 million, to more accurately reflect the cancellation terms of certain institutional contracts. Cancellations, foreign currency translations, and other routine adjustments subsequently reduced this revenue by $1.3 million, or approximately 1%, to $132.5 million by the end of 2006. This amount includes the positive impact of a one-time payment we received in the third quarter of 2006 because two clients merged and eliminated a redundant license. The walk-in revenue figure does not include variable revenue from asset-related services such as Morningstar Managed Portfolios, managed retirement account services, and Investment Consulting that are calculated as a percentage of total assets under management. These areas of our business have been increasing over the past several years.
In 2006,2007, we estimate that our retention rate for subscription-based products, such as Principia, Premium Membership service, and print and online newsletters, averaged between 60%65% to 65%70%, consistent withslightly higher than the level shown in 2005.2006. For contract-based products and services, we estimate that our weighted average renewal rate was between 95% and 100% in 2006, compared2007, which was consistent with an estimated 100% to 105%the level in 2005.2006. The figure for contract-based products includes the impact of price changes and changes to the contract value upon renewal, as well as changes in the value of variable contracts.
49
The renewal rate for contract-based products and services declined
43
slightly in 2006 compared with 2005 for three main reasons: 1) the impact of outstanding renewals in our data servicesData Services business; 2) our strategy of discontinuing some lower-margin contracts in our Retirement Advice business; and 3) a smaller increase in the number of incremental users added upon renewal in 2006 relative to 2005 for certain products, such as Morningstar Direct. While we’re satisfied with the retention and renewal rates we achieved in 2006, we constantly strive to improve these measures because the cost of maintaining existing customers is lower than the cost of acquiring new customers to replace business that doesn’t renew.

Consolidated Operating Expense
($000) |
| 2006 |
| 2005 |
| 2004 |
| 2006 Change |
| 2005 Change |
|
| 2007 |
| 2006 |
| 2005 |
| ||||||
Operating expense |
| $ | 237,648 |
| $ | 180,634 |
| $ | 161,923 |
| 31.6 | % | 11.6 | % |
| $ | 317,853 |
| $ | 237,648 |
| $ | 180,634 |
|
% change |
| 33.7% |
| 31.6% |
| 11.6% |
| |||||||||||||||||
|
|
|
|
|
|
|
| |||||||||||||||||
% of revenue |
| 75.4 | % | 79.5 | % | 90.1 | % | (4.1 | )pp | (10.6 | )pp |
| 73.1% |
| 75.4% |
| 79.5% |
| ||||||
Change |
| (2.3)pp |
| (4.1)pp |
| (10.6)pp |
| |||||||||||||||||
Our consolidated operating expense increased $57.0$80.3 million in 2007 compared with 2006. Two keyprimary factors impacted all of our operating expense categories: compensation-related costs, (includingincluding incentive compensation)compensation expenses, and recent acquisitions. Bonus
Compensation-related expense, recorded in 2006 increased $15.8excluding bonuses, rose $33.2 million because of an increase in headcount, as well as annual salary increases. We had approximately 1,720 employees worldwide as of December 31, 2007 compared with approximately 1,440 as of December 31, 2006. Approximately 30% of the increase in headcount was from acquisitions and approximately one-fourth of the increase was from continued improvementshiring in our development center in China. Bonus expense was up $13.7 million because of improvement in our financial performance, as well as increased headcount. A majority of our bonus pool is based on growth in our operating income, which may or may not recur.
OtherExcluding compensation-related expenses, general and administrative expense increased $10.7 million in 2007. We incurred additional costs in our operations from our acquisitions. Some of these incremental costs included transition costs, rent and facilities expense, and professional fees. We also incurred $0.9 million of expense related to settling our Australian litigation.
We also had higher amortization expense in 2007 because of our acquisitions. This additional amortization expense contributed $5.8 million to the operating expense increase in 2007. We expect that amortization of intangible assets will be an ongoing cost through the useful lives of these assets, which generally range from two to 25 years.
In 2006, our consolidated operating expense increased $57.0 million compared with the previous year. As in 2007, two key factors impacted all of our operating expense categories: compensation-related costs (including incentive compensation) and recent acquisitions.
Compensation-related expense, mainly including salaries, benefits, and sales commissions, increased $19.9 million in 2006 because of an increase in headcount, as well as annual salary increases. We had approximately 1,440 employees worldwide as of December 31, 2006, compared with approximately 1,130 as of December 31, 2005. About half of the increase in headcount was related to acquisitions, and a good portion of the remaining increase was from continued hiring in our development center in China. Bonus expense recorded in 2006 increased $15.8 million because of continued improvements in our financial performance, as well as increased headcount.
Lower stock-based compensation expense partially offset increases in all of our operating expense categories but to a limited extent.in 2006. Stock-based compensation expense decreased $2.3 million in 2006 because we are no longer required to record expense under the liability method. In the first quarter of 2005, we recorded $2.8 million of stock-based compensation expense under this method, which did not recur in 2006.
50
In addition to higher compensation-related expenses,expense, the increase in operating expense includesin 2006 included $6.2 million of amortization expense for the intangible assets acquired with Ibbotson, Aspect Huntley, and the hedge fund and separate account database division of InvestorForce. We expect that amortization of these intangible assets will be an ongoing cost through the useful lives of these assets, which generally range from three to 25 years.
Our consolidated operating expense increased $18.7 million in 2005. Approximately half of this increase was from higher cost of goods sold; the remaining portion of the increase occurred across other operating expense categories. The increase in consolidated operating expense was largely driven by a $15.6 million increase in compensation-related costs, including salaries, bonus, benefits, and sales commissions, stemming from higher headcount. We record these costs in the various operating expense categories as appropriate. We had approximately 1,130 employees worldwide as of December 31, 2005, compared with approximately 1,000 as of December 31, 2004. Approximately 60% of the increase in headcount was driven by technical staffing in our development center in China. Most of the remaining increase in headcount consists of additional stock analysts in our U.S. operations and increased staffing in our corporate departments to meet the requirements of being a public company. An increase in spending for corporate initiatives and legal fees and a decline in capitalized internal product development costs also contributed to the increase in operating expense. A decline in stock-based compensation expense of $5.8 million in 2005 partially offset the increase in compensation costs and other operating expenses.
Cost of Goods Sold
($000) |
| 2006 |
| 2005 |
| 2004 |
| 2006 Change |
| 2005 Change |
|
| 2007 |
| 2006 |
| 2005 |
| ||||||
Cost of goods sold |
| $ | 86,975 |
| $ | 64,408 |
| $ | 54,709 |
| 35.0 | % | 17.7 | % |
| $ | 113,777 |
| $ | 86,975 |
| $ | 64,408 |
|
% change |
| 30.8% |
| 35.0% |
| 17.7% |
| |||||||||||||||||
|
|
|
|
|
|
|
| |||||||||||||||||
% of revenue |
| 27.6 | % | 28.4 | % | 30.5 | % | (0.8 | )pp | (2.1 | )pp |
| 26.1% |
| 27.6% |
| 28.4% |
| ||||||
Change |
| (1.5)% |
| (0.8)pp |
| (2.1)pp |
| |||||||||||||||||
|
|
|
|
|
|
|
| |||||||||||||||||
Gross profit |
| $ | 228,200 |
| $ | 162,706 |
| $ | 124,949 |
| 40.3 | % | 30.2 | % |
| $ | 321,330 |
| $ | 228,200 |
| $ | 162,706 |
|
% change |
| 40.8% |
| 40.3% |
| 30.2% |
| |||||||||||||||||
|
|
|
|
|
|
|
| |||||||||||||||||
Gross margin |
| 72.4 | % | 71.6 | % | 69.5 | % | 0.8 | pp | 2.1 | pp |
| 73.9% |
| 72.4% |
| 71.6% |
| ||||||
Change |
| 1.5pp |
| 0.8pp |
| 2.1pp |
| |||||||||||||||||
44
Cost of goods sold has generally been our largest category of operating expense, and that pattern continuedwas the case again in 2006. 2007. Our business relies heavily on human capital, and cost of goods sold includes the compensation expense for employees who produce theour products and services we deliverservices.
Cost of goods sold increased $26.8 million in 2007. Approximately two-thirds of the growth was due to our customers. higher compensation expense, including incentive compensation. These costs rose because of continued hiring as well as additional headcount from acquisitions. Acquisitions contributed the largest portion of the remaining growth in this category’s operating expense. Outsourced product implementation expense associated with the Advice by Ibbotson service were $1.1 million lower in 2007 compared with 2006, offsetting the increases in other expenses in this category.
Cost of goods sold increased $22.6 million in 2006, which was mainly driven by higher bonus expense and other compensation-related expense from increased headcount. While compensation and bonus expense increased across all three of our business segments,headcount, as well as the increase was more pronounced in our Institutional segment because a larger portion of the headcount additions from recent acquisitions occurred in this segment.
Acquisitions, primarily Ibbotson, also contributed to the increase in cost of goods sold. In 2006, we recorded $2.8 million of outsourced product implementation expense associated with the Advice by Ibbotson service. Costs for outsourced product implementation may or may not recur, depending on client requests for development projects in a given period.
OurOver the past three years, our gross margin in 2006has increased to 72.4%, compared with73.9% in 2007 from 71.6% in 2005, reflectingas revenue growth thathas outpaced the increase in cost of goods sold.
Cost of goods sold increased $9.7 million in 2005. Compensationthis expense increased in all three segments, but mainly reflects additional costs for newly hired stock analysts in our Individual segment. Shareholder servicing fees related to Morningstar Managed Portfolios, which increased because of higher assets under management, contributed $1.5 million to the increase in cost of goods sold.
As a percentage of revenue, cost of goods sold declined by about 2 percentage points in 2005. This partly reflects the timing of hiring expenses for our independent equity research. We began incurring incremental compensation costs at the beginning of 2004 as we increased staffing in preparation for the ramp-up of our equity research efforts. We continued to increase staffing in 2005, but had already completed the majority of the staffing increase in 2004. As a result, cost of goods sold increased less dramatically in 2005.
Because cost of goods sold declined as a percentage of revenue in 2005, gross margin showed a corresponding increase. Gross margin has been steadily increasing over the past several years, to 72.4% in 2006 from 69.5% in 2004.category.
Development Expense
($000) |
| 2006 |
| 2005 |
| 2004 |
| 2006 Change |
| 2005 Change |
|
| 2007 |
| 2006 |
| 2005 |
| ||||
Development expense |
| $ | 29,494 |
| $19,654 |
| $16,167 |
| 50.1 | % | 21.6 | % |
| $ | 35,116 |
| $ | 29,494 |
| $ | 19,654 |
|
% change |
| 19.1% |
| 50.1% |
| 21.6% |
| |||||||||||||||
|
|
|
|
|
|
|
| |||||||||||||||
% of revenue |
| 9.4 | % | 8.7 | % | 9.0 | % | 0.7 | pp | (0.3 | )pp |
| 8.1% |
| 9.4% |
| 8.7% |
| ||||
Change |
| (1.3)pp |
| 0.7pp |
| (0.3)pp |
| |||||||||||||||
Development expense increased $9.8$5.6 million in 2006. This increase was mainly driven by higher compensation costs, including incentive compensation and other compensation-related expense. We2007. Although we continued to increase hiring for our programming and development staff and we also increased headcountin 2007 bonus costs included in this area through acquisitions. We hadcategory increased at a lower rate than in 2006. During 2007, we added about 34058 programmers and other technology staff, as of year-end 2006, compared with about 300 at the end of 2005. Because hiring and acquisitions both increased our cost base40 in this area, development2006. Development expense increased as a percentage of revenue over 2005 levels.declined in 2007, reversing the increase shown in 2006.
Development expense increased $3.5 million in 2005 because of increased hiring for programming and development staff (primarily in our Advisor and Institutional segments) and a reduction in the amount of expense capitalized related to development projects. We capitalize compensation costs associated with certain development projects, which reduces the costs included in development expense. Many of the projects for which we capitalized product development costs in 2004 have now been placed into service, and the ongoing costs are no longer capitalized. Instead, we expense these costs as incurred. In 2005, we capitalized $0.4 million of development costs, compared with $2.8 million in 2004. As a percentage of revenue, development expense was slightly lower in 2005 compared with 2004.51
Sales and Marketing Expense
($000) |
| 2006 |
| 2005 |
| 2004 |
| 2006 Change |
| 2005 Change |
|
| 2007 |
| 2006 |
| 2005 |
| |||
Sales and marketing expense |
| $50,614 |
| $39,071 |
| $36,034 |
| 29.5 | % | 8.4 | % |
| $ | 68,835 |
| $ | 50,614 |
| $ | 39,071 |
|
% change |
| 36.0% |
| 29.5% |
| 8.4% |
| ||||||||||||||
|
|
|
|
|
|
|
| ||||||||||||||
% of revenue |
| 16.1 | % | 17.2 | % | 20.1 | % | (1.1 | )pp | (2.9 | )pp |
| 15.8% |
| 16.1% |
| 17.2% |
| |||
Change |
| (0.3)pp |
| (1.1)pp |
| (2.9)pp |
| ||||||||||||||
Sales and marketing expense increasedrose $18.2 million in 2007 and $11.5 million in 2006. More than a thirdNearly 40% of thisthe increase was driven by added compensation expense from increased hiring for sales and marketing staff, mainly in our Advisor and Institutional segments. Higher incentive compensationcommission expense and marketing costs, and, to a lesser extent, commission expense and marketing costs,incentive compensation, also drove the increase in this cost category. In 2007, we significantly expanded our direct mail campaigns to promote annual publications such as the Morningstar Stocks 500, Morningstar Funds 500, Morningstar ETFs 150, and the Stocks, Bonds, Bills and Inflation Yearbook, which are published in the first quarter. These direct mail campaigns contributed to growth in marketing expense in the first nine months of 2007. Incremental costs added by acquisitions also contributed to the growth in this category because of increases in headcount and the number of products and services sold.
As a percentage of revenue, sales and marketing expense continued to decline as revenue
45
growth outpaced the increasedeclined slightly in cost,2007, but less so than in 2005.
Sales2006 and marketing expense increased $3.1 million in 2005 because of higher sales commissions, salaries, and benefits expense. We incurred additional commission costs because of both increased sales volume, primarily in our Advisor and Institutional segments, and changes to the incentive structure for certain products in the Advisor segment, including Principia and Advisor Workstation Office Edition. Salaries and benefits included in this expense category also increased, mainly because of an increase in headcount for the sales and marketing team in our Advisor segment. Because our revenue base increased at a faster pace than our sales and marketing expense, sales and marketing expense as a percentage of revenue declined by about 3 percentage points in 2005.
General and Administrative Expense
($000) |
| 2006 |
| 2005 |
| 2004 |
| 2006 Change |
| 2005 Change |
|
| 2007 |
| 2006 |
| 2005 |
| ||||||
General and administrative expense |
| $ | 55,590 |
| $ | 49,235 |
| $ | 46,788 |
| 12.9 | % | 5.2 | % |
| $ | 78,868 |
| $ | 55,590 |
| $ | 49,235 |
|
% change |
| 41.9% |
| 12.9% |
| 5.2% |
| |||||||||||||||||
|
|
|
|
|
|
|
| |||||||||||||||||
% of revenue |
| 17.6 | % | 21.7 | % | 26.0 | % | (4.1 | )pp | (4.3 | )pp |
| 18.1% |
| 17.6% |
| 21.7% |
| ||||||
Change |
| 0.5pp |
| (4.1)pp |
| (4.3)pp |
| |||||||||||||||||
General and administrative expense (G&A) has generally been our second largestsecond-largest category of operating expense following cost of goods sold. That pattern continued in 2007 and 2006, but generalG&A costs increased more dramatically in 2007.
In 2007, the $23.3 million increase in G&A was primarily driven by higher compensation and administrativebonus expense. In addition, we incurred additional costs continuedin our operations outside the U.S. primarily related to declinetemporary transition costs associated with the fund data operations acquired from Standard & Poor’s, mainly in Europe. Incremental costs from acquisitions in the United States, including rent and professional fees, also added to the increase in this category. An expense of $0.9 million related to settling our Australian litigation also contributed to the increase in G&A.
Because of these increases, G&A increased slightly as a percentage of revenue. Generalrevenue in 2007, after declining significantly in 2006 and administrative expense increased2005.
The increase in G&A in 2006 of $6.4 million in 2006,was mainly driven by increases in incentive compensation and incremental expense added by acquisitions. This increase was partially offset by a $1.8 million decrease in stock-based compensation expense, which dropped because we did not record any stock-based compensation expense under the liability method in 2006. In addition, legal expense was essentially flat in 2006. Overall, most costs included in this category rose at a lower rate than revenue, and general and administrative expense as a percentage of revenue declined by about 4 percentage points in 2006.
In 2005, the $2.4 millionWe anticipate that G&A costs will increase in general and administrative expense mainly included higher compensation costs, which increased primarily2008 because we added staff in our corporate departments to meet the requirements of being a public company. Higher incentive compensation also contributed to the increase in this area in 2005. We also incurred $2.0 million more for spending on corporate initiatives and legal fees related to regulatory investigations in 2005 than in 2004. In addition, we increased our offer to settle various claims related to Morningstar Research Pty Limited (Morningstar Australia). Refer to Note 16 of the Notes to our Consolidated Financial Statements for more information regarding this litigation. Stock-based compensation expense included in general and administrative expense decreased $4.3 million in 2005, which largely offset the increases in other areas. The decrease in stock-based compensation expense was driven by a decline in expense for options accounted for under the liability method, as described below. Because our general and administrative expense increased at a slower pace compared with our revenue growth, general and administrativeduplicate rent expense as we move into our new corporate headquarters in Chicago. We anticipate that we will record rent expense on both our existing lease and the new lease for a percentageperiod of revenue declined by about 4 percentage pointsone year, resulting in 2005.additional rent expense.
52
Depreciation and Amortization Expense
($000) |
| 2006 |
| 2005 |
| 2004 |
| 2006 Change |
| 2005 Change |
|
| 2007 |
| 2006 |
| 2005 |
| ||||||
Depreciation and amortization expense |
| $ | 14,975 |
| $ | 8,266 |
| $ | 8,225 |
| 81.2 | % | 0.5 | % | ||||||||||
Depreciation expense |
| $ | 8,488 |
| $ | 7,971 |
| $ | 7,574 |
| ||||||||||||||
Amortization expense |
| 12,769 |
| 7,004 |
| 692 |
| |||||||||||||||||
Total depreciation and amortization expense |
| $ | 21,257 |
| $ | 14,975 |
| $ | 8,266 |
| ||||||||||||||
% change |
| 41.9% |
| 81.2% |
| 0.5% |
| |||||||||||||||||
|
|
|
|
|
|
|
| |||||||||||||||||
% of revenue |
| 4.8 | % | 3.6 | % | 4.6 | % | 1.2 | pp | (1.0 | )pp |
| 4.9% |
| 4.8% |
| 3.6% |
| ||||||
Change |
| 0.1pp |
| 1.2pp |
| (1.0)pp |
| |||||||||||||||||
Depreciation and amortization expense rose $6.3 million in 2007 and $6.7 million in 2006. ThisThe increase was almost entirely driven by amortization expense fromof intangible assets acquired withfrom the 2007 acquisition of the mutual fund data business from Standard & Poor’s and the 2006 acquisitions of Ibbotson, Aspect Huntley, and the hedge fund and separate account database division of InvestorForce. As a percentage of revenue, this category of expense has increased in recent years primarily because amortization expense has become a higher fixed cost.
We expect that amortization of these intangible assets will be an ongoing cost for the remaining life of the assets. The increase in amortization expense was slightly offset by a decrease in depreciation andBased on acquisitions completed through December 31, 2007, we estimate that aggregate amortization expense for certain capitalized internal product development costs and computer equipment that are now fully depreciated.
Depreciation and amortization expense increased slightly in 2005 primarily because of amortization of the intangible assets related to the VARDS acquisition. This increase was offset by a decreasewill be $13.6 million in depreciation and amortization expense for capitalized software, computer equipment, and capitalized internal product development costs, as many of the assets in these categories are now fully depreciated.2008.
Stock-Based Compensation Expense
($000) |
| 2007 |
| 2006 |
| 2005 |
| |||
Restricted stock units — equity method |
| $ | 4,503 |
| $ | 1,406 |
| $ | — |
|
Stock options — equity method |
| 6,475 |
| 7,169 |
| 8,085 |
| |||
Stock options — liability method |
| — |
| — |
| 2,810 |
| |||
Stock-based compensation expense |
| $ | 10,978 |
| $ | 8,575 |
| $ | 10,895 |
|
% change |
| 28.0% |
| (21.3)% |
| (34.9)% |
| |||
% of revenue |
| 2.5% |
| 2.7% |
| 4.8% |
| |||
Change |
| (0.2)pp |
| (2.1)pp |
| (4.5)pp |
| |||
The majority of our
We include stock-based compensation expense relates to employee stock option grants.in each of our operating expense categories. Beginning in May 2006, we began granting restricted stock units insteadunits. Prior to May 2006, we granted stock options. Our stock-based compensation expense is determined in accordance with Statement of stock options.Financial Accounting Standards (SFAS) No. 123 (Revised 2004), Shared-Based Payment (SFAS No. 123(R)), which we adopted on January 1, 2006. We record stock-based compensation expense only for those awards that ultimately vest. As a result, the stock-based compensation expense recorded since the beginning of 2006 reflects an estimate of an expected forfeiture rate.
We have historicallyPrior to adopting SFAS No. 123(R), we recorded stock based compensation expense in our financial statements using the previously applicable accounting guidance. Up through the date of our initial public offering in May 2005, we used two different methods of accounting for employee stock options: the liability method, which involves recording a liability for vested options equal to the difference between the option exercise price and the fair value per share of the
46
common stock, and the equity method, which is based on the Black-Scholes value of the option at the time of the grant and recorded over the vesting period of the option. Following our initial public offering in May 2005, we are no longer required to settle stock options in cash, and therefore are no longer required to record stock-based compensation expense under the liability method.
The following table summarizes ourIn 2007, we reduced the estimated forfeiture rate for awards that haven’t yet vested. In addition, we make adjustments to stock-based compensation expense:expense following the vesting date to reflect only those awards that ultimately vested. We made this adjustment in the second quarter, which is when most of our larger equity grants typically vest. These two factors accounted for $0.8 million of additional stock-based compensation expense in 2007, the majority of which was recorded in the second quarter.
($000) |
| 2006 |
| 2005 |
| 2004 |
| 2006 Change |
| 2005 Change |
| |||
Stock-based compensation expense– liability method |
| $ | — |
| $ | 2,810 |
| $ | 8,963 |
| (100.0 | )% | (68.6 | )% |
Stock-based compensation expense– equity method |
| 8,575 |
| 8,085 |
| 7,760 |
| 6.1 | % | 4.2 | % | |||
Total stock-based compensation expense |
| $ | 8,575 |
| $ | 10,895 |
| $ | 16,723 |
| (21.3 | )% | (34.9 | )% |
% of revenue |
| 2.7 | % | 4.8 | % | 9.3 | % | (2.1 | )pp | (4.5 | )pp | |||
53
Total stock-based compensation expense declined $2.3 million in 2006, largely because we did not record any stock-based compensation expense under the liability method in 2006.method. Stock-based compensation expense for stock options and restricted stock units recorded under the equity method increased, but by only a small amount. An increase in expense related to our annual equity grant in May 2006, which consisted of restricted stock units, was substantially offset by lower expense recorded for stock options granted in previous years, as certain options became fully vested and no longer require us to record additional expense.
InBased on equity grants completed through December 31, 2007, we expect to record approximately $8.8 million ofestimate that stock-based compensation expense for all stock-based awards outstanding as of December 31, 2006.
In 2005, total stock-based compensation expense declined $5.8 million compared with 2004. Stock-based compensation expense recorded under the liability method declined $6.2will be $9.3 million in 2005. The expense recorded under the liability method in 2005 reflects the expense recorded through the first quarter, when we adjusted the liability to reflect our initial public offering price of $18.50 per share compared with a fair value of $17.50 per share as of December 31, 2004. The expense recorded under the liability method in 2004 reflects a $2.80 increase in the fair value per share of our common stock to $17.50 per share as of December 31, 2004 from $14.70 per share as of December 31, 2003.
Stock-based compensation expense recorded under the equity method increased $0.3 million in 2005. This increase mainly reflects the impact of approximately 1.1 million options granted in 2005, as well as ongoing expense associated with options granted in 2004 and prior years. This increase was partially offset by lower expense for options granted in previous years, which are now fully vested and no longer require recording additional expense.2008.
Bonus Expense
($000) |
| 2006 |
| 2005 |
| 2004 |
| 2006 Change |
| 2005 Change |
|
| 2007 |
| 2006 |
| 2005 |
| ||||||
Bonus expense |
| $ | 38,341 |
| $ | 22,511 |
| $ | 21,037 |
| 70.3 | % | 7.0 | % |
| $ | 52,014 |
| $ | 38,341 |
| $ | 22,511 |
|
% change |
| 35.7% |
| 70.3% |
| 7.0% |
| |||||||||||||||||
|
|
|
|
|
|
|
| |||||||||||||||||
% of revenue |
| 12.2 | % | 9.9 | % | 11.7 | % | 2.3 | pp | (1.8 | )pp |
| 12.0% |
| 12.2% |
| 9.9% |
| ||||||
Change |
| (0.2)pp |
| 2.3pp |
| (1.8)pp |
| |||||||||||||||||
Bonus expense recorded in 20062007 increased $13.7 million, which was slightly lower than the $15.8 million with the increase in 2006. The increase in both years was driven by improved financial performance versus 2005the prior year and incrementalincremental bonus expense from acquisitions. We pay annual bonuses that are related to increases in proportion to our operating income. Weincome and include bonus expense in each of our operating expense categories. Because the two factors mentioned above caused a substantial increase in the size of the bonus pool, bonus expense as
As a percentage of revenue, increasedbonus expense decreased slightly in 2007 after increasing by about 2 percentage points in 2006.
Bonus expense increased $1.5 million in 2005. This category of expense increased primarily because our financial performance in 2005 exceeded our financial performance in 2004. The impact of this increase was partially offset because our bonus expense in 2004 included a special bonus for our analyst team that did not recur in2006 compared with 2005.
Consolidated Operating Income
($000) |
| 2006 |
| 2005 |
| 2004 |
| 2006 Change |
| 2005 Change |
| |||
Operating income |
| $ | 77,527 |
| $ | 46,480 |
| $ | 17,735 |
| 66.8 | % | 162.1 | % |
% of revenue |
| 24.6 | % | 20.5 | % | 9.9 | % | 4.1 | pp | 10.6 | pp | |||
47
($000) |
| 2007 |
| 2006 |
| 2005 |
| |||
Operating income |
| $ | 117,254 |
| $ | 77,527 |
| $ | 46,480 |
|
% change |
| 51.2% |
| 66.8% |
| 162.1% |
| |||
|
|
|
|
|
|
|
| |||
Operating margin |
| 26.9% |
| 24.6% |
| 20.5% |
| |||
Change |
| 2.3pp |
| 4.1pp |
| 10.6pp |
| |||
Consolidated operating income increased $31.0$39.8 million in 2006.2007. Despite incremental costs added by acquisitions, such as amortization of intangible assets and increased compensation-related expense, our operating margin continued to improve because our revenue base expanded at a faster rate than operating expenses.expense. The lower rate of growth in generalcost of goods sold and administrative costs,development expense, in particular, allowed us to realize operating leverage in our consolidated results. We also realized operating leverage from revenue growth in products that have had slower-growing costs, such as Investment Consulting, Advisor Workstation, Licensed Data, and Morningstar.com. Our operating margin was also positively impacted by a $2.3 million decrease in stock-based compensation expense.

OurAlthough our operating margin increased more dramaticallyincome continued rising in 2005. This increase was primarily driven by the timing2007, operating income as a percentage of revenue and expense associatedincreased by a smaller amount compared with the Global Analyst Research Settlement, the $5.8 million decrease in stock-based compensation expense, and the operating leverage inherent in our business. 2005 was the first full year of revenue from equity research associated with the Global Analyst Research Settlement. In 2005, we were able to increase costs associated with this revenue at a lower ratetwo previous years because much of the cost increases occurredhigher rate of growth in 2004general and administrative costs as we built our staff in anticipation of this revenue. In addition, revenue growth for many of our Institutional products, suchwell as Investment Consultingdepreciation and Licensed Data, increased during the year. We were able to increase costs in most of the related expense categories at a lower rate than this revenue growth.amortization.
54
Consolidated Free Cash Flow
We generated free cash flow of $101.0 million in 2007, reflecting cash provided by operating activities of approximately $112.3 million offset in part by capital expenditures of $11.3 million.
Free cash flow increased by $7.1 million in 2007 compared with 2006, reflecting a $13.7 million increase in cash provided by operating activities partially offset by a $6.6 million increase in capital expenditures. The increase in cash provided by operating activities was the result of higher net income, adjusted for non-cash items and an increase in accrued compensation and income taxes payable, partially offset by higher payments for taxes and bonuses. We paid $18.2 million more for income taxes than we did in 2006. Our 2006 tax payments were reduced as a result of a $13.0 million cash tax benefit we received related to the Ibbotson acquisition, primarily related to the payments for the cancellation of Ibbotson’s stock options. The tax benefit was fully used during 2006. In 2007, we paid $12.3 million more for bonuses than we did in 2006.
In 2007 capital expenditures mainly consisted of leasehold improvements for our new office space in Canada, Europe, and Australia; computer hardware to keep our operations up and running in the event of a disaster, and design and architectural fees related to the planned office space for our corporate headquarters and U.S. operations.
We generated free cash flow of $94.0 million in 2006, reflecting cash provided by operating activities of $98.7 million andoffset in part by capital expenditures of $4.7 million. Free cash flow more than doubled compared with 2005, primarily reflecting a $50.3 million increase in cash provided by operating activities. In addition, capital expenditures declined by approximately $2.7 million compared with 2005. We spent less on leasehold improvements in 2006 after completing major build-outs of our office space in London and China in 2005. The increase in cash provided by operating activities was primarily driven by higher net income, as well as a reduction in income tax payments and an increase in accrued compensation. In 2006, we paid $9.9 million less for income taxes than we did in 2005 because of the cash tax benefitsbenefit we received from the Ibbotson acquisition.
Free cash flow as a percentage of revenue was 23.2% in 2007, 29.8% in 2006, compared withand 18.0% in 2005.2005.
In 2005,To provide investors with additional insight into our financial results, we generated freeprovide a comparison between the increase in net income with the change in cash flow of $41.0 million, reflecting cash provided by operating activities of $48.4 million and capital expenditures of $7.4 million. Free cash flow increased by $15.9 million in 2005, reflecting a $15.6activities:
($000) |
| 2007 |
| 2006 |
| 2005 |
| 2007 Change |
| 2006 Change |
| |||||
Net income |
| $ | 73,922 |
| $ | 51,762 |
| $ | 31,117 |
| $ | 22,160 |
| $ | 20,645 |
|
Adjustments to reconcile net income to net cash flows from operating activities: |
|
|
|
|
|
|
|
|
|
|
| |||||
Excess tax benefits in accordance with SFAS No. 123(R) |
| (30,428) |
| (13,734) |
| — |
| (16,694) |
| (13,734) |
| |||||
Depreciation and amortization expense |
| 21,257 |
| 14,975 |
| 8,266 |
| 6,282 |
| 6,709 |
| |||||
Stock-based compensation expense |
| 10,978 |
| 8,575 |
| 10,895 |
| 2,403 |
| (2,320) |
| |||||
All other non-cash items included in net income |
| (3,214) |
| (6,109) |
| 1,486 |
| 2,895 |
| (7,595) |
| |||||
Changes in operating assets and liabilities, net of effects of acquisitions: |
|
|
|
|
|
|
|
|
|
|
| |||||
Cash paid for bonuses |
| (35,269) |
| (22,978) |
| (18,000) |
| (12,291) |
| (4,978) |
| |||||
Cash paid for income taxes |
| (27,795) |
| (9,649) |
| (19,527) |
| (18,146) |
| 9,878 |
| |||||
Reduction of Australian litigation reserve |
| (2,091) |
| — |
| — |
| (2,091) |
| — |
| |||||
Accounts receivable |
| (11,723) |
| (9,261) |
| (14,989) |
| (2,462) |
| 5,728 |
| |||||
Deferred revenue |
| 8,401 |
| 10,967 |
| 7,364 |
| (2,566) |
| 3,603 |
| |||||
Income taxes payable |
| 53,024 |
| 36,345 |
| 17,089 |
| 16,679 |
| 19,256 |
| |||||
Accrued compensation |
| 58,387 |
| 39,404 |
| 24,997 |
| 18,983 |
| 14,407 |
| |||||
Accounts payable and accrued liabilities |
| 2,729 |
| (563) |
| 2,167 |
| 3,292 |
| (2,730) |
| |||||
All other |
| (5,810) |
| (1,057) |
| (2,420) |
| (4,753) |
| 1,363 |
| |||||
Cash provided by operating activities |
| $ | 112,368 |
| $ | 98,677 |
| $ | 48,445 |
| $ | 13,691 |
| $ | 50,232 |
|
55
The $13.7 million increase in cash provided by operating activities in 2007 was $8.5 million less than the $22.2 million increase in net income.
Non-cash items included in net income were a primary driver of the difference between net income and cash provided by operations in 2007. We had an additional $16.7 million of excess tax benefits primarily because of an increase in the number of stock options exercised and the higher stock price on the date of these exercises. SFAS No. 123(R), Share-Based Payment, requires that we classify excess tax benefits as a financing activity, which contributes to the difference between net income and cash from operations. In 2007, we classified $30.4 million of excess tax benefits as financing activities, compared with $13.7 million in 2006. (See the liquidity section for further discussion on these excess tax benefits). This $16.7 million was drivenpartially offset by an increase in depreciation and amortization expense of $6.3 million, an increase in deferred taxes of $2.8 million, and an increase in stock-based compensation of $2.4 million in 2007.
An increase in net operating assets and liabilities (working capital excluding cash) drove the remainder of the difference between net income as well as an approximately $0.3 millionand cash provided by operations. The primary contributors were higher cash paid for both income taxes and bonuses in 2007. The payment related to the Australian litigation also impacted cash flow from operations in 2007. Increases in accounts receivable and other assets combined with a reduction in capital expenditures. As a percentage of revenue, freethe cash flow was 18.0%benefit from higher deferred revenue balances contributed to the lag between net income and cash from operations. These factors were partially offset by the favorable cash flow impact of revenueincreases in 2005, compared with 14.0% in 2004. The decrease in capital expenditures in 2005 primarily reflects lower capitalized internal product development costs. Because several products for which costs were previously capitalized have now been put into service, we expense the ongoing costs as we incur them.accrued compensation and income taxes payable.
The table below presents a reconciliation betweencash flow benefit associated with accrued compensation increased $19.0 million, reflecting the increase in netthe size of the bonus liability. This was partially offset by a $12.3 million increase in the amount of cash paid for bonuses in 2007 compared with 2006. We anticipate making bonus payments of approximately $50 million in the first quarter of 2008, compared with $35.3 million in the first quarter of 2007.
We paid $18.2 million more for income taxes in 2007 than we paid in 2006 primarily because of the cash tax benefit we received from the Ibbotson acquisition in 2006 and to a lesser extent for taxes paid for our operations outside the United States. This was partially offset by higher income taxes payable of $16.7 million because of the increase in cash flow provided by operating activities:
($000) |
| 2006 |
| 2005 |
| 2004 |
| 2006 Change |
| 2005 Change |
| |||||
Net income |
| $ | 51,762 |
| $ | 31,117 |
| $ | 8,809 |
| $ | 20,645 |
| $ | 22,308 |
|
Adjustments to reconcile net income to net cash flows from operating activities: |
|
|
|
|
|
|
|
|
|
|
| |||||
Non-cash items included in net income |
| 3,707 |
| 20,647 |
| 23,899 |
| (16,940 | ) | (3,252 | ) | |||||
Changes in operating assets and liabilities, net of effects of acquisitions: |
|
|
|
|
|
|
|
|
|
|
| |||||
Accrued compensation |
| 16,426 |
| 6,997 |
| - |
| 9,429 |
| 6,997 |
| |||||
Income taxes payable |
| 26,696 |
| (2,438 | ) | 3,763 |
| 29,134 |
| (6,201 | ) | |||||
Accounts receivable |
| (9,261 | ) | (14,989 | ) | (10,866 | ) | 5,728 |
| (4,123 | ) | |||||
Deferred revenue |
| 10,967 |
| 7,364 |
| 7,038 |
| 3,603 |
| 326 |
| |||||
Other |
| (1,620 | ) | (253 | ) | 219 |
| (1,367 | ) | (472 | ) | |||||
Cash provided by operating activities |
| $ | 98,677 |
| $ | 48,445 |
| $ | 32,862 |
| $ | 50,232 |
| $ | 15,583 |
|
48

The $50.3 million increase in cash provided by operating activities in 2006 outpaced the $20.7 million increase in net income. The increase in net income and a reduction in net operating assets and liabilities (working capital excluding cash) were the two main factors driving this trend. The $46.5 million reduction in working capital excluding cash was mainly caused by an increase in income taxes payable and accrued compensation. The increase in income taxes payable reflects the increase in taxable income, mainly in the United States, and a $9.9 million reduction in the amount of cash paid for income taxes in 2006, as we were able to reduce income tax payments because of the cash tax benefitsbenefit related to the cancellation of Ibbotson’s stock options. The growth in accrued compensation reflects the increase in the size of the bonus liability partially offset by a $5.0 million increase in the amount of cash paid for bonuses. A reduction in non-cash items included in net income partially offset these positive factors. We anticipate makingmade bonus payments of approximately $35$23.0 million in the first quarter of 2007,2006, compared with $23.0$18.0 million of bonus payments made in the first quarter of 2006.2005.
In 2005, the increase in cash provided by operating activities of $15.6 million lagged the $22.3 million increase in net income. Several items contributed to lower relative growth in cash provided by operating activities in 2005. Income tax payments and bonus payments had the largest impact on the gap between cash provided by operating activities and net income. Income tax payments in 2005 increased $12.9 million compared with the previous year. In 2004, we used the majority of our U.S. net operating losses, reducing the amount of taxes paid. Bonus payments in 2005 increased $5.7 million compared with 2004, reflecting strong business performance during 2004, as well as the last installment of a special bonus established for our analyst team in 2004. In addition, non-cash items included in net income decreased primarily because of lower deferred income tax expense. While income tax payments, bonus payments, and non-cash items included in net income lowered our cash flow provided by operating activities, they were largely offset by a greater cash flow benefit in 2005 arising from changes in operating assets and liabilities. More than half of this benefit reflects increases in accounts payable and accrued expenses; the remaining increase was driven by accrued income taxes and accrued compensation, excluding the payments discussed above.
4956
Segment Results
($000) |
| 2006 |
| 2005 |
| 2004 |
| 2006 Change |
| 2005 Change |
| |||
Revenue |
|
|
|
|
|
|
|
|
|
|
| |||
Individual |
| $ | 80,706 |
| $ | 63,448 |
| $ | 46,996 |
| 27.2 | % | 35.0 | % |
Advisor |
| 94,694 |
| 72,689 |
| 60,880 |
| 30.3 | % | 19.4 | % | |||
Institutional |
| 146,085 |
| 95,947 |
| 78,402 |
| 52.3 | % | 22.4 | % | |||
Elimination of intersegment revenue |
| (6,310 | ) | (4,970 | ) | (6,620 | ) | 27.0 | % | (24.9 | )% | |||
Consolidated revenue |
| $ | 315,175 |
| $ | 227,114 |
| $ | 179,658 |
| 38.8 | % | 26.4 | % |
|
|
|
|
|
|
|
|
|
|
|
| |||
Operating income |
|
|
|
|
|
|
|
|
|
|
| |||
Individual |
| $ | 22,921 |
| $ | 15,005 |
| $ | 2,603 |
| 52.8 | % | 476.5 | % |
Advisor |
| 26,734 |
| 14,617 |
| 8,999 |
| 82.9 | % | 62.4 | % | |||
Institutional |
| 37,244 |
| 20,544 |
| 7,133 |
| 81.3 | % | 188.0 | % | |||
Corporate items and eliminations |
| (9,372 | ) | (3,686 | ) | (1,000 | ) | 154.3 | % | 268.6 | % | |||
Consolidated operating income |
| $ | 77,527 |
| $ | 46,480 |
| $ | 17,735 |
| 66.8 | % | 162.1 | % |
|
|
|
|
|
|
|
|
|
|
|
| |||
Operating margin |
|
|
|
|
|
|
|
|
|
|
| |||
Individual |
| 28.4 | % | 23.6 | % | 5.5 | % | 4.8 | pp | 18.1 | pp | |||
Advisor |
| 28.2 | % | 20.1 | % | 14.8 | % | 8.1 | pp | 5.3 | pp | |||
Institutional |
| 25.5 | % | 21.4 | % | 9.1 | % | 4.1 | pp | 12.3 | pp | |||
Consolidated operating margin |
| 24.6 | % | 20.5 | % | 9.9 | % | 4.1 | pp | 10.6 | pp | |||
|
|
|
|
|
|
|
|
|
|
|
| |||
($000) |
| 2007 |
| 2006 |
| 2005 |
| 2007 Change |
| 2006 Change |
| |||
Revenue |
|
|
|
|
|
|
|
|
|
|
| |||
Individual |
| $ | 97,299 |
| $ | 80,706 |
| $ | 63,448 |
| 20.6% |
| 27.2% |
|
Advisor |
| 115,739 |
| 94,694 |
| 72,689 |
| 22.2% |
| 30.3% |
| |||
Institutional |
| 230,329 |
| 146,085 |
| 95,947 |
| 57.7% |
| 52.3% |
| |||
Elimination of intersegment revenue |
| (8,260 | ) | (6,310 | ) | (4,970 | ) | 30.9% |
| 27.0% |
| |||
Consolidated revenue |
| $ | 435,107 |
| $ | 315,175 |
| $ | 227,114 |
| 38.1% |
| 38.8% |
|
|
|
|
|
|
|
|
|
|
|
|
| |||
Operating income |
|
|
|
|
|
|
|
|
|
|
| |||
Individual |
| $ | 23,738 |
| $ | 22,921 |
| $ | 15,005 |
| 3.6% |
| 52.8% |
|
Advisor |
| 31,669 |
| 26,734 |
| 14,617 |
| 18.5% |
| 82.9% |
| |||
Institutional |
| 76,656 |
| 37,244 |
| 20,544 |
| 105.8% |
| 81.3% |
| |||
Corporate items and eliminations |
| (14,809 | ) | (9,372 | ) | (3,686 | ) | 58.0% |
| 154.3% |
| |||
Consolidated operating income |
| $ | 117,254 |
| $ | 77,527 |
| $ | 46,480 |
| 51.2% |
| 66.8% |
|
|
|
|
|
|
|
|
|
|
|
|
| |||
Operating margin |
|
|
|
|
|
|
|
|
|
|
| |||
Individual |
| 24.4% |
| 28.4% |
| 23.6% |
| (4.0)pp |
| 4.8pp |
| |||
Advisor |
| 27.4% |
| 28.2% |
| 20.1% |
| (0.8)pp |
| 8.1pp |
| |||
Institutional |
| 33.3% |
| 25.5% |
| 21.4% |
| 7.8 pp |
| 4.1pp |
| |||
Consolidated operating margin |
| 26.9% |
| 24.6% |
| 20.5% |
| 2.3 pp |
| 4.1pp |
| |||
Individual Segment
Our Individual segment focuses on products and services for individual investors. The largest product in this segment based on revenue is our U.S.-based Web site, Morningstar.com, which includes both paid Premium Membership service and sales of Internet advertising space. Our Individual segment also includes Morningstar Equity Research, which we distribute through several channels. Investors can access our equity research through our Premium Membership offering on Morningstar.com. In addition, ourOur equity research is distributed through six major investment banks to meet the requirements for independent research under the Global Analyst Research Settlement, as well as to several other companies whothat purchase our research for their own use or provide our research to their affiliated financial advisors or to individual investors. In addition, investors can access our equity research through our Premium Membership offering on Morningstar.com.
We also offer a variety of print publications on stocks and mutual funds,about investing, including our monthly newsletters, Morningstar FundInvestor and Morningstar StockInvestor, and our twice-monthly publication, Morningstar Mutual Funds. We sell several annual reference guides, including the Morningstar Funds 500, the Morningstar Stocks 500, the Morningstar ETFs 150, and the Stocks, Bonds, Bills, and Inflation Yearbook. Since we acquired Aspect Huntley in July 2006, thisThis segment also includes several newsletters and other publications for Australian investors. Also, with the addition of Aspect Huntley, our Individual segment now includes revenue from both U.S.investors in Australia.
In 2007, 2006, and non-U.S. operations. In 2006, 2005 and 2004 this segment represented, before intersegment eliminations, 25.6%22.4%, 27.9%25.6%, and 26.2%27.9%, respectively, of our consolidated revenue.


In 2007, revenue for the Individual segment increased $16.6 million compared with 2006. Acquisitions contributed $5.1 million to the Individual segment revenue in 2007, primarily from Aspect Huntley. In 2006, revenue for the Individual segment increased $17.3 million compared with 2005. Our acquisitions of Aspect Huntley and Ibbotson contributed $5.1 million to 2006 revenue, with Aspect Huntley contributing about 70% of this incremental revenue. In 2005, our revenue increased $16.4 million compared with 2004, with all of the revenue growth generated organically. Excluding acquisitions, the product contributing the most to segment revenue
57
Growth in 2006 was Morningstar.com which includes Premium Membership and Internet advertising sales. This product wassales drove about 55% of the second-largest driver of segmentsegment’s organic revenue growth during 2005.increase in 2007 and 48% in 2006. The number of subscriptions for Morningstar.com Premium service has significantly expanded steadily over the past three years to 180,366 as of December 31, 2007 from 165,957 as of December 31, 2006 compared withand 147,010 as of December 31, 2005 and 131,035 as of December 31, 2004.2005. In addition, consistent with the trend over the past few years, we moderately increased subscription prices for Premium Membership in both January 20062007 and 2005.2006. Internet advertising sales growth was also strong in both years, increasing about 28% in 2007 and 25% in 2006 and 35% in 2005.2006.
50
Morningstar Equity Research, which mainlyprimarily includes revenue related to the Global Analyst Research Settlement, was the second-largest contributor to organic revenue growth for this segment in 2006,both 2007 and the largest driver in 2005. We began recognizing revenue for our equity research related to the settlement in July 2004, which led to a favorable year-over-year comparison in 2005. In addition, we entered into an equity research agreement with a sixth investment bank involved in the settlement in September 2005 and began recognizing this new revenue in the fourth quarter of that year.2006. Our revenue in this area also benefited in 20062007 and 20052006 because we’ve continued to increase the number of stocks under coverage,we cover, leading to higher contract values for some of the agreements related to the settlement. Revenue related to the Global Analyst Research Settlement accounted for approximately one-fifth of the segment’s 2007 revenue. The period covered by the Global Analyst Research Settlement will expire in July 2009. After the settlement period expires, the investment banks covered by it will no longer be required to provide independent investment research reports to their clients. For further discussion about this issue, see Item 1A — Risk Factors.
Newsletters also contributed to the organic growth in segment revenue in 2007, although to a lesser degree.
In 2006,2007, operating income for the Individual segment increased $0.8 million compared with 2006; and in 2006 operating income for this segment increased $7.9 million compared with 2005,2005. Operating expense increased $15.8 million and $9.4 million in 2005,2007 and 2006, respectively, and includes the incremental operating income increased $12.4 million comparedexpenses associated with 2004. Thethe newly acquired Aspect Huntley and Ibbotson operations included in this segment.
Excluding the impact of acquisitions, the operating expense increase in operating income in both years reflects revenue that grew at a faster rate than operating expense, though this leverage was more pronounced in 2005. The $9.4 million and $4.0 million of growth in operating expense in 2006 and 2005, respectively, was mainly driven by higher compensation-related expense, particularly in cost of goods sold.sold and sales and marketing. Hiring for our equity analyst team, whose compensation costs are includedwe include in cost of goods sold, contributed to this increase. The team expandedgrew to 113112 analysts worldwide as of December 31, 2006,2007, compared with 100 as of December 31, 2006 and 87 as of December 31, 2005 and 73 as of December 31, 2004.2005. An increase in bonus expense in 2007 and 2006 as well as incremental expense added by acquisitions wereparticularly in cost of goods sold, also significant drivers ofcontributed to operating expense growth in that year. Bonusboth years. Additional marketing expense, decreasedreflecting significantly expanded direct mail campaigns in 2005 because this category included a special bonus for our analyst teamthe first quarter of 2007, also contributed to the increase in 2004 that did not recur in 2005.2007. A decrease in stock-based compensation expense of $1.1 million in 2006 and $1.8 million in 2005 partially offset expense increases in both years.2006.
BecauseDespite the growth in operating income, the segment’s margin declined by 4.0 percentage points in 2007 compared with the previous year reflecting growth in operating expenses that outpaced the growth in revenue. The margin decline was partially due to the lower margins associated with the Aspect Huntley operations. An increase in sales and marketing expense as a percentage of revenue, reflecting our revenue grew at a faster pace than operating expensesignificantly expanded direct mail campaigns in both 2006the first quarter of 2007 and 2005, our operatingthe growth in sales staff, also contributed to the margin decline in 2007. The segment’s margin improved by 4.8 percentage points in 2006 and 18.1 percentage points in 2005. Our margin improvement in 2005 was more significant partly because of a difference in the timing between revenue and expense associated with the Global Analyst Research Settlement. Beginning in 2004, we invested heavily in the hiring of our analyst team in anticipation of the revenue associated with the settlement. We began recognizing revenue from the settlement at the end of July 2004. This resulted in higher compensation-related costs with no corresponding increase in revenue for the first seven months of 2004. In 2005, however, we had a full year of revenue to cover costs. As a result, operating margin significantly improved in 2005 compared with 2004.2005. The decrease in stock-based compensation expense in both 2006 and 2005 had a favorable impact on operating margins.margin.
Advisor Segment
Our Advisor segment focuses on products and services for financial advisors. Key products in this segment based on revenue are Morningstar Advisor Workstation and Morningstar Principia. Advisor Workstation is a Web-based investment planning system that provides financial advisors with a comprehensive set of tools for conducting their core business, including investment research, planning, and presentations. Advisor Workstation is available in two editions: the Office Edition for independent financial advisors and the Enterprise Edition for financial advisors affiliated with larger firms. Principia is our CD-ROM-based investment research and planning software for financial advisors. In addition, we offer Morningstar Managed Portfolios, a fee-based discretionary asset management service that includes a series of mutual fund, and exchange-traded fund, and stock portfolios tailored to differentmeet a range of investment time horizons and risk levels that financial advisors can use for their clients’ taxable and tax-deferred accounts.
Following our acquisition of Ibbotson, we began offering a series of NASD-reviewed Financial Communications materials that advisors can use to educate clients about asset allocation58
In 2007, 2006, and demonstrate other key investment concepts, as well as data and graphs that financial advisors can license for use in published materials. Following our acquisition of Aspect Huntley, this segment also includes investment conferences and software that we sell to financial planners and other market participants in Australia. In 2006, 2005, and 2004, this segment represented, before intersegment eliminations, 30.0%26.6%, 32.0%30.0%, and 33.9%32.0%, respectively, of our consolidated revenue.

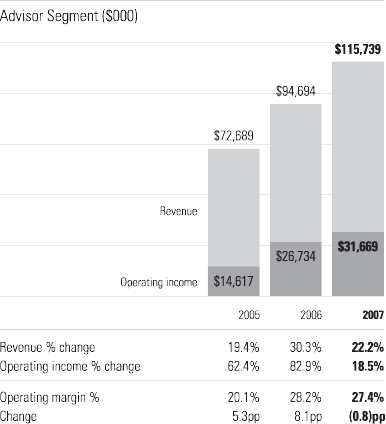
In 2007, revenue for the Advisor segment increased $21.0 million compared with 2006. Acquisitions contributed $5.8 million of revenue in 2007 from the fund data business acquired from Standard & Poor’s and, to a lesser extent, from Ibbotson and Aspect Huntley. In 2006, revenue for the Advisor segment increased $22.0 million compared with 2005. Acquisitions contributed $6.2 million of revenue in 2006, primarily from sales of Financial Communications materials and advisor-focused Ibbotson software tools. In 2005, revenue for the Advisor segment increased $11.8 million compared with 2004. Acquisitions had a smaller impact on revenue growth in 2005, with our acquisition of VARDS contributing $0.4 million.
In both 20062007 and 2005,2006, the increase in organic revenue was primarily driven by Morningstar
51
Advisor Workstation. We continued to see strong growthexpansion in licenses of the Enterprise Edition of Morningstar Advisor Workstation. The number of U.S. licenses for Morningstar Advisor Workstation increased to 175,725 as of December 31, 2007, compared with 153,838 as of December 31, 2006 and 113,461 as of December 31, 2005. Part of this growth reflects expansions in the scope of some contracts to full-site licenses (where we entered into numerousinclude all eligible advisors in our total license count), from tools-only licenses (where we include a smaller number of advisors based on actual usage). The increase in users from the prior year was also driven by the growth of users at existing clients and new agreements in both years. clients.
In addition, we also experienced strong renewals for the product during 20062007 and 2005,2006 and several contracts that were scheduled to expire renewed at significantly higher price points, reflecting both higher user counts and an increase in the amount of functionality licensed. In 2005, revenue from Advisor Workstation surpassed revenue from Principia, which historically had been our largest product, to become our second-largest product company-wide, and it continued to hold this ranking in 2006. The number of U.S. licenses for Morningstar Advisor Workstation increased to 153,838 as of December 31, 2006, compared with 113,461 as of December 31, 2005 and 80,235 as of December 31, 2004.
Morningstar Managed Portfolios also contributed to revenue growth in both 20062007 and 2005,2006, but to a lesser degree than Advisor Workstation. Assets under management for Morningstar Managed Portfolios increasedrose to $2.2 billion as of December 31, 2007 compared with $1.8 billion as of December 31, 2006 compared withand $1.4 billion as of December 31, 2005 and $936.0 million as of December 31, 2004. 2005.
Principia revenue remainedwas flat in 20062007 and declined slightly in 2005.2006. The number of subscriptions for Principia has been declining over the past few years towas 48,900 as of December 31, 2007, up from 47,835 as of December 31, 2006 but down from 49,728 as of December 31, 20052005. In March 2007, we introduced two new Principia modules, Presentation & Education and 51,308 as of December 31, 2004. WhileAsset Allocation, which contributed to the number of subscriptions has decreased, average revenue per subscription increased in both years because of an increase in the number of higher-priced advanced modules sold, previous price increases, and, in 2005, reductions in certain discount programs.subscriptions.
In 2007, our operating income for this segment was $31.7 million, an increase of $5.0 million compared with 2006. In 2006, operating income increased $12.1 million compared with 2005, and in 2005, operating income increased $5.6 million compared with 2004.2005. In both years, the increase in operating income reflects an increase in revenue partially offset by higher operating expense in all categories.
Operating expense increased $16.1 million, or 23.7%, in 2007 compared with 2006. Compensation-related expense including incentive compensation and commissions, accounted for approximately 42% of the increase in operating expense. The remainder of the operating expense increase was from an increase in G&A spending and higher expenses in cost of goods sold. Incremental costs added primarily from the mutual fund data business acquired from Standard & Poor’s also accounted for a portion of the increase across all cost categories.
59
Operating expense increased $9.9 million and $6.2 million, respectively, in 2006 andcompared with 2005. An increase in cost of goods sold was the biggest driver, in both years, contributing almost half of the expense increase in 2006 and more than one-third of the expense increase in 2005.2006. Higher cost of goods sold in both years partly reflects increased compensation costs from additional headcount. In 2006, an increase in bonus expense as well as incremental costs added by acquisitions were also major drivers behind the cost increase in this category. In 2005, an increase in shareholder servicing fees related to higher levels of assets under management for Morningstar Managed Portfolios was a major contributor to higher cost of goods sold.
The remaining operating expense growth in 2006 primarily reflects an increase in sales and marketing expense, driven by compensation-related expense, including bonuses. Incremental costs added by acquisitions also contributed to expense growth in all categories. In 2005, an increase in general and administrative expense, driven by higher corporate overhead expense, contributed a little less than one-third of the increase in operating expense. The remaining increase in operating expense in 2005 primarily reflects increased sales and marketing expense, which was driven by higher compensation-related expense and commissions for sales of Advisor Workstation and Principia. The higher sales commissions reflect increased sales volume in Advisor Workstation and changes to the incentive structure for both products.
A $0.7 million decrease in stock-based compensation of $0.7 million and $1.7 million in 2006 and 2005, respectively, lowered operating expense in all categories and contributed to the improvement in operating income.
Operating margin was 27.4% for 2007, a decline of 0.8 percentage points compared with 2006. In 2006, the operating income was positively impacted by $1.3 million of revenue from the elimination of a redundant license following the merger of two clients; no similar transaction occurred in 2007. This revenue added about 1 percentage point to the segment’s operating margin in 2006. Without the favorable effect of this revenue in the previous year, the segment’s operating margin would have increased slightly year over year.
Our operating margin improved by 8.1 percentage points in 2006, to 28.2%, and 5.3 percentage points in 2005, to 20.1%, reflecting the impact of higher revenue and ouragainst a smaller rate of increase in operating leverage.expense. Operating margin growth in both years was partly driven by Advisor Workstation Enterprise Edition; revenue for this product has grown at a more rapid pace thatthan operating expense. A decrease in stock-based compensation in 2006 and 2005the revenue from eliminating a redundant license following the merger of two clients also had a positive impact on the operating margins.margin.
Institutional Segment
Our Institutional segment focuses on products and services for institutions, including banks, insurance companies, mutual fund companies, brokerage firms, media firms, and retirement plan providers and sponsors. Key products and services in this segment based on revenue are Investment Consulting, which focuses on investment monitoring and asset allocation for funds of funds, including mutual funds and variable annuities; Licensed Data, a set of investment data spanning eightten core databases, available through electronic data feeds; Retirement Advice, including the Morningstar Retirement Manager and Advice by Ibbotson platforms; Morningstar Direct, a Web-based institutional research platform that provides advanced research and tools on the complete range of securities in Morningstar’s global database; the institutional Workstation product acquired from Standard & Poor’s; Licensed Tools and Content, a set of online tools and editorial content designed for institutions to use in their Web sites and software; Investment Profiles & Guides, which are designed for institutions to use in communicating investment information to individual investors; the Morningstar Annuity Research Center (formerly VARDS Online); and Morningstar EnCorr, an asset allocation software package (acquired with Ibbotson).package.
With the addition of Aspect Huntley, this segment now includes financial information as well as other data feeds on Australian stocks that we sell to stock brokers, information providers, and financial Web sites. The Institutional segment also includes the hedge fundmade up 52.9%, 46.4%, and separate account database division we acquired from InvestorForce in August 2006. In 2006, 2005, and 2004, this segment represented,42.2% of our consolidated revenue before intersegment eliminations 46.4%, 42.2%,in 2007, 2006, and 43.6%, respectively, of our consolidated revenue.2005, respectively. We expect that the Institutional segment will continue to account for the largest portion of our consolidated revenue for the foreseeable future.
52
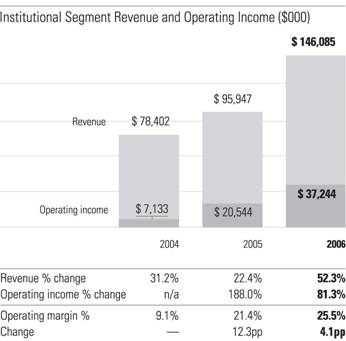
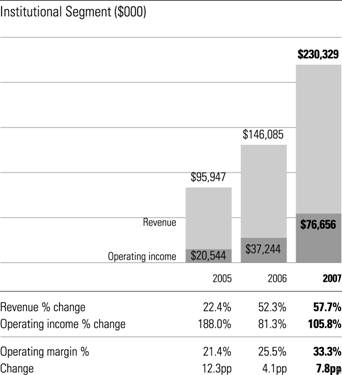
In 2007, revenue for the Institutional segment increased $84.2 million compared with 2006. Acquisitions contributed $33.4 million of revenue to this segment in 2007, primarily from the fund data business acquired from Standard & Poor’s, and to a lesser extent from Ibbotson, Aspect Huntley, and the hedge fund and separate account database division of InvestorForce. In 2006, revenue for the Institutional segment increased $50.2 million compared with 2005. Acquisitions contributed $25.1 million of revenue to this segment in 2006, mainly from Investment Consulting services and EnCorr. In 2005, revenue forMorningstar EnCorr, both from the Institutional segment increased $17.5 million compared with 2004. Acquisitions increased revenue to a much lesser extent in 2005, with VARDS contributing $2.0 million in segment revenue during the year.Ibbotson acquisition.
For the segment overall, on a product level, the increase in revenue in both 20062007 and 20052006 was driven by Investment Consulting, which includes asset-allocation and investment selection services for funds of funds and variable annuities. Investment Consulting contributed about 50%35% and 40%50% of the total increase in segment revenue in 20062007 and 2005,2006, respectively. In 2006, more than 40% of the increase in Investment Consulting revenue was contributed by newly incorporated revenue from Ibbotson. In 2005, we expanded existing relationshipsboth 2007 and our scope of responsibilities with two major clients.
In both 2006, and 2005, revenue also increased because we receive asset-based fees for our services, andof substantial growth in assets under advisement in this area significantly increased in both years.mainly among existing clients. We provided advisory services on approximately $55.5$97.5 billion in assets (including $40.5compared with $55.5 billion from Morningstar Associates and $15.0 billion from Ibbotson Associates) as of December 31, 2006 compared withand approximately $22.1 billion in assets as of December 31, 2005 and approximately $12.6 billion as of December 31, 2004 (Morningstar2005.
60
|
| As of December 31 |
| |||||||
|
| 2007 |
| 2006 |
| 2005 |
| |||
Assets under advisement for Investment Consulting ($ billions) |
|
|
|
|
|
|
| |||
Ibbotson Associates (1) |
| $ | 40.9 |
| $ | 15.0 |
| $ | n/a |
|
Morningstar Associates |
| 56.6 |
| 40.5 |
| 22.1 |
| |||
Total |
| $ | 97.5 |
| $ | 55.5 |
| $ | 22.1 |
|
(1) We acquired Ibbotson Associates only). in March 2006.
These totals include consulting relationships as well as agreements where we act as a portfolio construction manager for a mutual fund or variable annuity and receive a basis pointbasis-point fee. In addition, we also provide Investment Consulting services for some assets under management for which we receive a flat fee.
Changes in the value of assets under advisement can come from two primary sources: gains or losses related to overall trends in market performance, and net inflows or outflows caused when investors add to or redeem shares from these portfolios. In both 2006 and 2007, both factors contributed to growth in assets under advisement, but increases in net inflows were the main driver behind the asset growth.
Excluding 2006revenue from acquisitions, Licensed Data and Morningstar Direct were the next largest contributors to revenue growth in both 20062007 and 2005.2006. Both products have benefited from expanded sales efforts in Europe and other non-U.S. markets outside the United States, as well as continued strength in the United States. The number of licenses for Morningstar Direct increased 65.4% to 1,3482,229 worldwide as of December 31, 2006,2007, compared with 1,348 as of December 31, 2006 and 985 as of December 31, 2005 and 775 as of December 31, 2004. Revenue growth in Morningstar Direct in both 2006 and 2005 exceeded growth in the number of licenses because of the continued impact of a new pricing model implemented during 2004. Several key contracts whose terms ended during 2006 and 2005 renewed for a smaller number of licenses, but at a greater price per license.
Retirement Advice, EnCorr, and Advice by IbbotsonLicensed Tools and Content were also significant contributors to revenue growth during 2006.2007, although to a lesser extent. The Ibbotson acquisition significantly expanded our asset base in managed retirement accounts, and we are now amongone of the largest providers in this area. We had $8.6 billion in combined assets under management in
|
| As of December 31 |
| |||||||
|
| 2007 |
| 2006 |
| 2005 |
| |||
Assets under management in managed retirement accounts ($ billions) |
|
|
|
|
|
|
|
|
|
|
Advice by Ibbotson |
| $ | 12.7 |
| $ | 8.0 |
| $ | n/a |
|
Morningstar Retirement Manager |
| 1.0 |
| 0.6 |
| 0.3 |
| |||
Total |
| $ | 13.7 |
| $ | 8.6 |
| $ | 0.3 |
|
The tables below show the managed retirement accounts offered through Advice by Ibbotson ($8.0 billion) and Morningstar Retirement Manager ($647.0 million) asbreakdown of December 31, 2006, compared with $285.0 million as of December 31, 2005 and $123.9 million as of December 31, 2004 (Morningstar Retirement Manager only). As of December 31, 2006, more than 17 million retirement plan participants had access to our retirement advice services through approximately 108,000 plan sponsors and 31 plan providers. These totals include more than 9 million retirement plan participants, 71,000 plan sponsors and 24 plan providers who had access to Morningstar Retirement Manager, and nearly 8 million retirement plan participants, 37,000 plan sponsors and seven plan providers who had access to Advice by Ibbotson.
Revenue for our online advice service for retirement plan participants declined in both 2006 and 2005. We have been transitioning clients to our new user interface, which gives retirement plan participants streamlined, easy-to-use access to a broader range of advisory services. In particular, we are focusing our efforts on managed accounts, which may appeal to a broader segment of retirement plan participants. Revenue for the managed retirement accountsservices offered through Morningstar Retirement Manager increased in both 2006 and 2005,Advice by Ibbotson, as assets under management more than doubled in both 2006well as the number of plan sponsors and 2005.plan providers that provide this access.
|
| As of December 31 |
| ||||
|
| 2007 |
| 2006 |
| 2005 |
|
Plan Participants (millions) |
|
|
|
|
|
|
|
Advice by Ibbotson |
| 6.6 |
| 8.0 |
| n/a |
|
Morningstar Retirement Manager |
| 8.8 |
| 9.0 |
| 9.0 |
|
Total |
| 15.4 |
| 17.0 |
| 9.0 |
|
|
|
|
|
|
|
|
|
Plan Sponsors (approximate) |
|
|
|
|
|
|
|
Advice by Ibbotson |
| 60,000 |
| 37,000 |
| n/a |
|
Morningstar Retirement Manager |
| 75,000 |
| 71,000 |
| 69,000 |
|
Total |
| 135,000 |
| 108,000 |
| 69,000 |
|
|
|
|
|
|
|
|
|
Plan Providers |
|
|
|
|
|
|
|
Advice by Ibbotson |
| 8 |
| 7 |
| n/a |
|
Morningstar Retirement Manager |
| 22 |
| 24 |
| 30 |
|
Total |
| 30 |
| 31 |
| 30 |
|
In 2006,2007, operating income for the Institutional segment increased $16.7$39.4 million, or 105.8%, compared with 2005, and2006; in 2005,2006 the segment’s operating income increased $13.4$16.7 million, or 81.3%, compared with 2004.2005. The increase in operating income in both years was primarily driven by revenue growth in Investment Consulting and Licensed Data. Contract values in both areas and asset-basedAsset-based fees in Investment Consulting have increased while the cost base for these servicesthis service has increased at a lower rate.
61
Operating expense increased approximately $44.8 million in 2007 and $33.4 million in 20062006. Compensation-related expenses and $4.1 millionincremental costs added by acquisitions were the main contributors to the increase in 2005. In both years,this expense category in 2007. Operating expenses associated with our acquired businesses contributed a significant portion of the operating expense increase in 2007. These additional expenses are included throughout the expense categories, but had the largest impact on compensation expense. Compensation and bonus expense, including compensation expense from our acquired businesses, made up about 62% of the increase in operating expense. The operating expense increase in 2007 was partially offset by a $1.1 million reduction in product implementation fees related to our Advice by Ibbotson service.
In 2006, the increase in expense was largely driven by cost of goods sold, which contributed about 40% and 75% of the expense increase in 2006 and 2005, respectively. In both years, incremental2006. Incremental costs added by acquisitions also contributed to the increase in this expense category, but to a
53
larger extent in 2006. During 2006, we incurred approximately $2.8 million of product implementation fees related to our Advice by Ibbotson service.category. In addition, a large portion of incremental headcount from acquisitions was added to the Institutional segment, in 2006, which contributed to higher compensation and bonus expense in this category. Compensation-related costs excluding acquisitions increased in both years because of added headcount and higher bonuses.
bonus expense. The remaining increase in operating expense in 2006 waswere spread across the other expense categories and reflects higher compensation and bonus expense as well as incremental expense added from acquisitions. The remaining increase in operating expense in 2005 was driven by growth in sales and marketing expense, reflecting higher compensation and sales commission expense. A decrease of $0.7 million and $2.2 million in stock-based compensation expense in 2006 and 2005, respectively, partially offset these expense increases, and in turn, positively impacted operating income. increases.
Our operating margin improved 7.8 percentage points in 2007 and 4.1 percentage points in 2006, and 12.3 percentage points in 2005, reflecting the impact of revenue growth that exceeded the increase in operating expense.expense, largely driven by continued growth in higher-margin services, such as Investment Consulting. Product implementation fees related to our Advice by Ibbotson service represented approximately 0.7% of revenue in 2007 compared with 1.9% of revenue in the previous year. In addition, some of our acquired operations had a positive effect on the operating margin in 2007.
Corporate and Eliminations
Corporate items and eliminations include capitalized internal product development costs and related amortization expense. In addition, thisThis category includes amortization expense related to intangible assets. These intangible assets primarilyare mainly recorded as part of acquisition-relatedwhen we allocate the purchase price allocations.for acquisitions. In addition, this category includes capitalized internal product development costs (which result in a reduction of expense) and related amortization expense. The following table shows the components of corporate and eliminations expense (income) that impacted our consolidated operating income:
($000) |
| 2006 |
| 2005 |
| 2004 |
| 2006 Change |
| 2005 Change |
|
| 2007 |
| 2006 |
| 2005 |
| ||||||
Depreciation and amortization |
| $ | 9,669 |
| $ | 3,576 |
| $ | 3,342 |
| 170.4 | % | 7.0 | % | ||||||||||
Capitalized internal product |
| (178 | ) | (375 | ) | (2,802 | ) | (52.5 | )% | (86.6 | )% | |||||||||||||
Amortization expense |
| $ | 12,769 |
| $ | 7,004 |
| $ | 692 |
| ||||||||||||||
Depreciation expense |
| 1,905 |
| 2,665 |
| 2,884 |
| |||||||||||||||||
Other |
| (119 | ) | 485 |
| 460 |
| NMF |
| 5.4 | % |
| 135 |
| (297 | ) | 110 |
| ||||||
Corporate items and eliminations |
| $ | 9,372 |
| $ | 3,686 |
| $ | 1,000 |
| 154.3 | % | 268.6 | % |
| $ | 14,809 |
| $ | 9,372 |
| $ | 3,686 |
|
% change |
| 58.0% |
| 154.3% |
| 268.6% |
| |||||||||||||||||
In 2007 and 2006, corporate items and eliminations increased $5.7 million primarilyalmost entirely because of an increase inadditional amortization expense related to intangible assets we acquired with Ibbotson, Aspect Huntley, and the hedge fund and separate account database divisionfrom acquisitions. Amortization of InvestorForce. In 2005, corporate items and eliminationsintangible assets increased $2.7 million, reflecting a decrease of $2.4$5.8 million in capitalized2007 and $6.3 million in 2006. We made four key acquisitions during the past two years. As part of these acquisitions, we assigned $105.7 million to intangible assets other than goodwill. We amortize these intangible assets over their estimated lives, ranging from two to 25 years. Based on acquisitions completed through December 31, 2007, we estimate that aggregate amortization expense for intangible assets will be $13.6 million in 2008.
Depreciation expense included in this category has declined over the past three years as computer equipment and internal product development costs, and a $0.3 million increasecapitalized in depreciation and amortization.previous years, are now fully depreciated.
62
Equity in Net Income of Unconsolidated Entities, Non-Operating Income, and Income Tax Expense
Equity in Net Income of Unconsolidated Entities
($000) |
| 2006 |
| 2005 |
| 2004 |
| |||
Equity in net income of unconsolidated entities |
| $ | 2,787 |
| $ | 1,662 |
| $ | 843 |
|
($000) |
| 2007 |
| 2006 |
| 2005 |
| |||
Equity in net income of unconsolidated entities |
| $ | 1,694 |
| $ | 2,787 |
| $ | 1,662 |
|
Equity in net income of unconsolidated entities primarily includes our portion of the net income (loss) of Morningstar Japan K.K. (MJKK), Morningstar Korea, Ltd., Morningstar Danmark A/S, and Morningstar Sweden AB. In both 20062007 and 2005,2006, equity in net income of unconsolidated entities increasedwas primarily because of an increase infrom our equity earnings from MJKK. In addition, in 2006, MJKK recorded a gain related to the sale of shares in a subsidiary’s initial public offering. Our share of the pre-tax gain was approximately $1.0 million. For more information about our investments in unconsolidated entities, refer to Note 8 of the Notes to our Consolidated Financial Statements.
Non-Operating Income
The following table presents the components of net non-operating income:
($000) |
| 2006 |
| 2005 |
| 2004 |
|
| 2007 |
| 2006 |
| 2005 |
| ||||||
Interest income, net |
| $ | 4,623 |
| $ | 3,078 |
| $ | 1,211 |
|
| $ | 7,134 |
| $ | 4,623 |
| $ | 3,078 |
|
Other income (expense), net |
| (459 | ) | 121 |
| 594 |
|
| (905 | ) | (459 | ) | 121 |
| ||||||
Non-operating income |
| $ | 4,164 |
| $ | 3,199 |
| $ | 1,805 |
|
| $ | 6,229 |
| $ | 4,164 |
| $ | 3,199 |
|
Net interest income primarily reflects interest from our investment portfolio. Net interest income increased $2.5 million and $1.5 million during 2007 and $1.9 million during 2006, and 2005, respectively,respectively. We generated more interest income because of increases inhigher balances for cash, cash equivalents, and investments in 2007 compared with 2006, as well as higher returns on these invested cash balances.
54
Other income (expense), net primarily represents mainly consists of foreign currency exchange gains and losses arising from the ordinary course of business related to our non-U.S. operations, unrealized and realized gains and losses from our investment portfolio, and royalty income from MJKK. The increase in other expense net in 2007 and 2006 was primarily related to foreign currency exchange losses, particularly with regard to the euro.losses.
Income Tax Expense
The following table summarizes the components of our effective income tax expense rate:
($000) |
| 2006 |
| 2005 |
| 2004 |
|
| 2007 |
| 2006 |
| 2005 |
| ||||||||||
Income before income taxes and equity in net income of unconsolidated |
| $ | 81,691 |
| $ | 49,679 |
| $ | 19,540 |
|
| $ | 123,483 |
| $ | 81,691 |
| $ | 49,679 |
| ||||
Equity in net income of unconsolidated entities |
| 2,787 |
| 1,662 |
| 843 |
|
| 1,694 |
| 2,787 |
| 1,662 |
| ||||||||||
Total |
| $ | 84,478 |
| $ | 51,341 |
| $ | 20,383 |
|
| $ | 125,177 |
| $ | 84,478 |
| $ | 51,341 |
| ||||
Income tax expense |
| $ | 32,975 |
| $ | 20,224 |
| $ | 11,574 |
|
| $ | 51,255 |
| $ | 32,975 |
| $ | 20,224 |
| ||||
Effective income tax expense rate |
| 39.0 | % | 39.4 | % | 56.8 | % | |||||||||||||||||
Effective income tax rate |
| 40.9% |
| 39.0% |
| 39.4% |
| |||||||||||||||||
For a reconciliation of the U.S. federal tax rate to our effective income tax rate, refer to Note 15 of the Notes to our Consolidated Financial Statements.
OurIn 2007, our effective income tax rate is influenced by three primary factors: U.S. state income taxes, the reported income or loss of our non-U.S. entities and our evaluation of the realizability of their net operating losses; incentive stock options; and the impact of specific tax planning strategies. Incentive stock options also influenced our effective tax rate in 2007, but to a much lesser extent than in previous years.
63
In 2007, our effective income tax rate increased 1.9 percentage points compared with the previous year. Approximately half of the increase was because of an increase to our overall U.S. state tax rate and additional state income tax expense related to a change in state tax law enacted in 2007. As a result of this tax law change, we expect to realize a lower tax benefit when we use our net deferred tax assets in future periods. We therefore reduced the value of our deferred tax assets and recorded a corresponding increase to income tax expense as of the date of enactment. We expect the enacted tax law change will have a favorable impact on our effective income tax rate starting in 2008. The remainder of the increase in our effective tax rate was because of an increase in unrecognized tax benefits. On January 1, 2007, we adopted Financial Accounting Standards Board (FASB) Interpretation No. 48, Accounting for Uncertainty in Income Taxes, (FIN 48). Certain positions we have taken or intend to take on our U.S. and non-U.S. tax returns may be reviewed by tax authorities in the jurisdictions in which we operate.
In 2006, our effective income tax rate was 39.0%, which is comparable to our effective income tax rate in 2005. This rate, however, reflects three items related to our non-U.S. operations. Our 2006 effective income tax rate includes additional income tax expense outside the United States recorded in the second quarter of 2006. This additional income tax expense increased our effective tax rate by 1.1 percentage points. In addition, in 2006 we paid withholding taxes in non-U.S. jurisdictions for which we do not anticipate receiving a credit for U.S. income tax purposes. These withholding taxes increased our effective rate by approximately a half of a percentage point. These increases were mostly offset by the benefit we recorded as a result of reducing previously recorded deferred tax valuation allowances. Based on the evidence related to certain of our non-U.S. entities, we concluded it was more likely than not that we would be able to use the accumulated net operating losses.
We have net operating loss (NOL) carryforwards of $28.4$22.4 million related to our non-U.S. operations. Because of the historical operating losses of the non-U.S. operations that generated these NOLs, weWe have recorded a valuation allowance against all but $6.0$7.1 million of these NOLs reflecting the likelihood that the benefitas of December 31, 2007. Because of the NOLshistorical operating losses for certain non-U.S. operations, a valuation allowance is required because we do not believe that it is more likely than not that we will not be realized.able to use all of our non-U.S. NOLs.
We anticipate that our effective income tax rate may continue to fluctuate related to the creation or reversal of valuation allowances andfor our non-U.S. operations as well as to changes in unrecognized tax related items.benefits.
In 2005, our effective income tax expense rate decreased compared with prior years, primarily because of a reduction in the tax impact related to incentive stock options. For incentive stock options, we record stock-based compensation expense but we do not record a corresponding tax benefit. This had the impact of increasing our effective income tax rate above the U.S. Federal rate of 35%. The amount of incentive stock option expense recorded in 2005 was lower than the amounts recorded in 2004, reflecting the fact that, subsequent to our initial public offering, incentive stock options are no longer accounted for under the liability method, and because they are fully vested, no stock-based compensation expense was recorded for these options during the last nine months of 2005.
Our 2005 effective tax rate also reflects an increase in the number of disqualifying dispositions related to incentive stock options. A disqualifying disposition occurs when the option holder sells shares within one year of exercising an incentive stock option. We receive a tax benefit when a disqualifying disposition occurs. Our 2005 income tax expense also reflects a benefit of $0.7 million related to research and development expenses due to a change in U.S. income tax regulations. This benefit resulted in a one-time reduction of our effective income tax expense rate. In the fourth quarter of 2005, we formalized cost-sharing agreements among our operations to more accurately reflect the economic sharing arrangements that benefit our subsidiaries. This also had the effect of lowering our taxes in certain jurisdictions.
Liquidity and Capital Resources
We believe that our available cash balances and investments, along with cash generated from operations, will be sufficient to meet our
55
operating and cash needs for the foreseeable future. We invest our cash reserves in cash equivalents and investments, consisting primarily of fixed-income securities. We intend to use our cash, cash equivalents, and investments for general corporate purposes, including working capital, and for funding future growth.
Cash and Cash Equivalents
As of December 31, 2006,2007, we had cash, and cash equivalents, and investments of $96.1$258.6 million, an increase of $3.7$94.8 million compared with the balance as of December 31, 2005. The increase primarily reflects $98.7 million in2006. During 2007, we were able to generate sufficient cash provided by operating activitiesto more than offset payments related to acquisitions, bonuses, income taxes, and $34.0 million incapital expenditures. We also had sufficient cash provided by financing activities, partially offset by $129.0 million in cash used for investing activities. In addition to the $96.1 million of cash and cash equivalentson hand as of December 31, 2006, we had $67.6 million2007 to cover the costs of investments, consisting primarilythe acquisition of fixed-income securities, an increase of $6.8 millionthe Hemscott businesses from December 31, 2005.Ipreo Holdings LLC in early January 2008 and our annual bonus payments in February 2008.


64
Cash Provided by Operating Activities
Our main source of capital is cash generated from operating activities.
In 2007, cash provided by operating activities was $112.4 million. The increase of $13.7 million, or 13.9%, in operating cash flow was the result of higher net income, adjusted for non-cash items and an increase in accrued compensation and income taxes payable, partially offset by higher tax payments and higher bonus payments. Although our net income (adjusted for non-cash items) increased by $17.0 million, changes in our net operating assets and liabilities slightly reduced the cash flow benefit from net income.

The $6.7 million growth in accrued compensation reflects a $19.0 million increase in the size of the bonus liability partially offset by a $12.3 million increase in the amount of cash paid for bonuses. In February 2007, we made approximately $35.3 million of bonus payments that were accrued as of December 31, 2006. In 2006, we made bonus payments of $23.0 million. We anticipate making bonus payments of approximately $50 million in the first quarter of 2008 for bonuses accrued as of December 31, 2007.
The benefit to cash flow from operations related to income taxes was lower in 2007 compared with 2006. Payments for income taxes increased $18.2 million while income taxes payable increased by $16.7 million. In 2006, our tax payments were reduced primarily because of the cash tax benefit we received from the Ibbotson acquisition in 2006. This income tax benefit, primarily related to the payments for the cancellation of Ibbotson’s stock options, was fully used during 2006, reducing the amount we paid for income taxes. As of December 31, 2007, we had a net income tax receivable of $9.0 million. Our estimated tax payments made during 2007 could not predict the volume of stock option exercises which occurred primarily in the fourth quarter of 2007 and the value of excess tax benefits related to these option exercises. In 2007, we generated $30.4 million of excess tax benefits, more than half of which were generated in the fourth quarter. We will use this tax receivable to offset the future income tax liabilities, primarily in the United States.
The payment related to the Australian litigation also reduced the cash flow from operations in 2007. We paid a cash settlement of Australian $4.0 million ($3.3 million). This amount was higher than the previously recorded reserve of Australian $2,500,000 (approximately U.S. $2.1 million at the settlement date). Approximately $3.0 million of this payment reduced our cash flow from operations, with the remainder included in cash used for investing activities reflecting an adjustment to the goodwill we initially recorded when we acquired Morningstar Research Pty Ltd (Morningstar Australia) in 2001.
In 2006, cash provided by operating activities was $98.7 million. The increase of $50.3 million, or 103.7%, in operating cash flows mainly reflects increases in net income, income taxes payable, and accrued compensation. In 2006, we made $9.6 million of income tax payments, compared with $19.5 million in 2005. As part of the Ibbotson purchase price allocation, we recorded a reduction to income taxes payable of $13.0 million. This income tax benefit, primarily related to the payments for the cancellation of Ibbotson’s stock options, was fully used during 2006, reducing the amount we paid for income taxes. This cash income tax benefit did not impact our income tax expense or net income in 2006. We will not receive additional2006, but lowered the cash tax benefits from the Ibbotson acquisition, and therefore, ourpaid for income taxes payable has increased in anticipation of future payments.2006. Accrued compensation increased primarily because of an increase in accrued bonuses. In February 2007, we made approximately $35.0 million of bonus payments that were accrued as of December 31, 2006. In 2006, we made bonus payments of $23.0 million.
In 2005, cash provided by operating activities increased approximately $15.6 million, or 47.4%, to $48.4 million. The increase in operating cash flows during 2005 primarily reflects an increase in net income and a decrease in net operating assets and liabilities, excluding income tax and bonus payments. In 2005, we made income tax payments of $19.5 million. In 2004, we made only $6.6 million of income tax payments because of the U.S. net operating loss carryforwards available from prior years. In 2005 and 2004, we paid bonuses of approximately $18.0 million and $12.3 million, respectively. The higher bonuses paid in 2005 were the result of strong 2004 operating performance and the last installment of a special bonus paid to our analyst team in connection with the ramp-up of our independent equity research business. Excluding the impact of income tax and bonus payments, our net operating assets and liabilities decreased primarily because of increases in accounts payable and accrued liabilities, accrued bonuses related to the current year’s performance, and accrued income taxes. The increase in accounts receivable, resulting primarily from higher client billings, was partially offset by the related increase in deferred revenue.
Because we frequently invoice our customers and collect cash in advance of providing services or fulfilling subscriptions, we often have significant deferred revenue, which is shown as a liability on our Consolidated Balance Sheets. As of December 31, 2006 and December 31, 2005, our deferred revenue was $100.5 million (including deferred revenue from acquisitions) and $71.2 million, respectively.
In 2003, we began participating in voluntary disclosure or similar programs related to state sales tax. We estimated our total liability for these taxes to be approximately $9.0 million. Beginning in 2003 through the end of 2006, we made total cash payments of $8.2 million in conjunction with these voluntary disclosure programs. The remaining amount expected to be due in connection with these voluntary disclosure programs is recorded as an accrued liability in our Consolidated Balance Sheet as of December 31, 2006.
Cash Used for Investing Activities
Cash used for investing activities consists primarily of cash used for acquisitions; purchases of investments, net of proceeds from the sale of investments; and capital expenditures. The level of investing activities can vary from period to period depending on the level of activity in these three categories.
In 2007, cash used for investing activities decreased $26.2 million, compared with 2006, primarily reflecting a decrease in cash used for acquisitions partially offset by an increase in net purchases of investments and a greater amount of spending on capital expenditures. In 2006, cash used for investing activities increased $112.1 million compared with 2005, primarily reflecting an increase in cash used for acquisitions. In 2005,
Cash used for acquisitions, net of cash acquired, was $60.5 million in 2007. Cash used for acquisitions also includes transaction costs directly related to the acquisitions. The majority of the cash used for investing activities decreased $5.9 millionacquisitions in 2007 relates to our acquisition of the fund data business acquired from 2004 primarily reflecting a decreaseStandard & Poor’s.
65
In 2007 we also paid cash to acquire the remaining 2% share ownership in purchases of investments, net of proceeds fromMorningstar Europe NV and made the sale of investments. This decrease in cash used was partially offset by cash outflowsfinal payment related to the January 2005 acquisition of VARDS.Aspect Huntley acquisition.
56
Cash used for acquisitions in 2006, net of cash acquired, was $117.3 million. This total includes cash used to purchase Ibbotson in March 2006, Aspect Huntley in July 2006, and the hedge fund and separate account database division of InvestorForce in August 2006.
In 2005, cash used for acquisitions was $8.2 million, related to our January 2005 acquisition of VARDS. In 2004, cash used for acquisitions was $0.2 million, related to our February 2004 purchase of the remaining 51% of Morningstar Norge AS (Morningstar Norway) that we did not previously own.Variable Annuity Research and Data Service from Finetre Corporation.
Purchases of investments, net of proceeds from the sale of investments, were $31.0 million, $6.6 million, and $1.3 million in 2007, 2006, and $14.9 million in 2006, 2005, and 2004, respectively. As of December 31, 20062007 and 2005,2006, we had investments, consisting primarily of fixed-income securities, of $67.6 million$99.0 and $60.8$67.6 million, respectively. As of both December 31, 20062007 and 2005,2006, our investments represented approximately 40% of our total cash, cash equivalents, and investments.
Capital expenditures were $11.3 million, $4.7 million, and $7.5 million in 2007, 2006, and $7.7 million in 2006, 2005, and 2004, respectively. Capital expenditures are primarily for leasehold improvements, computer hardware, and capitalized internal product development costs. In 2007, wecomputer software. We anticipate that in 2008, our capital expenditures will be significantly higher than in previous years primarily because of the build-out of our new office space in Chicago for our U.S.-based operations. We expect to make capital expenditures of approximately $8 million primarily for computer hardware to support our technology platforms and the build-out of new office space for our non-U.S. operations. In addition, we may also spend up to $6$55 million in capital expenditures2008, including approximately $40 million for the build-out of ourthe new corporate headquarters in Chicago, depending on the progress of constructionoffice space. A portion of the new building.capital expenditures will be offset by tenant improvement allowances which will reduce the total amount of cash we will need to pay for the build-out.
Cash Provided by (Used for) Financing Activities
In 2006, cashCash provided by financing activities consists primarily of $34.0 million increased $8.7 million, or 34.6%, and primarily reflected proceeds of $20.2 million from stock option exercises. Stock option exercises continued to increase in 2006, our first full year as a public company. We also recognized $13.7 million of excess tax benefits from stock option exercises in 2006. We adopted Statement of Financial Accounting Standards (SFAS) No. 123(R), Share-Based Payment, on January 1, 2006; the new standard requires that we recordand excess tax benefits fromrelated to stock option exercises as a financing activity, insteadand vesting of as an operating activity.restricted stock units. Excess tax benefits occur at the time a stock option is exercised when the intrinsic value of the option (the difference between the exercise price of the option and the fair value of our stock on the date of exercise) is greater than the fair value of the option at the time of grant. Similarly, excess tax benefits are generated upon vesting of restricted stock units when the market value of our common stock on the vesting date exceeds the grant price of the restricted stock units. These excess tax benefits reduce the cash we pay for income taxes in the year they are recognized. It is not possible to predict the timing of stock option exercises nor the intrinsic value which will be achieved at the time options are exercised or upon vesting of restricted stock units. As a result, cash flow from financing activities is expected to vary over time. Note 11 in the Notes to our Consolidated Financial Statements includes additional information concerning stock options and restricted stock units outstanding as of December 31, 2007.
In 2007, cash provided by financing activities was $52.5 million. We received proceeds of $22.0 million from stock option exercises. We also recorded $30.4 million for excess tax benefits related to stock option exercises and vesting of restricted stock units. In 2007, cash provided by financing activities increased by $18.5 million, or 54.4%, compared with 2006, driven almost entirely by an additional $16.7 million of excess tax benefits. The increase was due to a larger number of stock options exercised and the stock price on the date of these exercises. In 2007, employees exercised approximately 2.5 million stock options compared with 2.1 million options exercised in 2006. The total intrinsic value (difference between the market value of our stock on the date of exercise and the exercise price of the option) of options exercised during 2007 and 2006 was $133.5 million and $66.7 million, respectively.
In 2006, cash provided by financing activities of $34.0 million increased $8.7 million, or 34.6%, and primarily reflected an increase of $13.0 million in proceeds from stock option exercises. Stock option exercises continued to increase in 2006, our first full year as a public company. We also recognized $13.7 million of excess tax benefits from stock option exercises in 2006. In 2005, cash provided by financing activities increased $31.7included $18.1 million reflectingof net proceeds of $18.1 million from our initial public offering in May 2005. These proceeds resulted
66
Acquisitions
Mutual fund data business acquired from the underwriters’ exercise of their over-allotment option based on our initial public offering price of $18.50 per share, after deducting the underwriting discounts and commissions and approximately $2.6 million of offering expenses. We also received proceeds of $7.2 million from stock option exercises in 2005, compared with only $0.2 million in 2004. Stock option exercises increased in 2005 following our initial public offering.Standard & Poor’s
In March 2004,2007, we repaid a $6.5acquired the mutual fund data business from Standard & Poor’s for $57.8 million promissory note payablein cash including post-closing adjustments and transaction costs directly related to Joe Mansueto,the acquisition, less cash acquired. This business consists of data and products covering approximately 135,000 managed investment vehicles, including mutual funds, ETFs, hedge funds, and offshore funds. Approximately 80% of the mutual fund data business acquired from Standard & Poor’s is outside the United States. We began including the results of this acquisition in our chairman, chief executive officer, and controlling shareholder. The obligation and related interest were paid in full.Consolidated Financial Statements on March 16, 2007.
Acquisitions
Institutional Hedge Fund and Separate Account Database Division of InvestorForce, Inc.
In August 2006, we acquired the institutional hedge fund and separate account database division of Investor Force, Inc., a financial software and data integration company based in Wayne, Pennsylvania, for $10.1 million in cash, including transaction-related costs. This acquisition included the Altvest database, one of the largest databases covering hedge funds, managers, and data, as well as InvestorForce’s extensive institutional separate account database. It also included several online software applications for manager search, research, and reporting. We began including the results of the hedge fund and separate account database division of InvestorForce’s operations in our Consolidated Financial Statements on August 1, 2006. This acquisition allowed us to strengthen and expand our proprietary investment data.
Aspect Huntley Pty Limited
In July 2006, we acquired Aspect Huntley Pty Limited, a leading provider of equity information, research, and financial trade publishing in Australia, for Australian $30.0$22.5 million in cash, (of which Australian $2.0 million will be paid in 2007) subjectincluding transaction costs directly related to the acquisition and post-closing and working capital adjustments. In 2006, the cash paid for Aspect Huntley, including transaction-related costs, was U.S. $20.9 million (net of $0.9 million of cash acquired).adjustments, less acquired cash. We began including the results of Aspect Huntley’s operations in our Consolidated Financial Statements on July 25, 2006. This acquisition fits with our growth strategy to expand our products and services outside the United States. This acquisition allowed us to combine Morningstar’s expertise in fund research and information with Aspect Huntley’s equity research, information, and financial media expertise in Australia.
57
Ibbotson Associates, Inc.
In March 2006, we acquired Ibbotson Associates, Inc., a privately held firm specializing in asset allocation research and services, for $83.0$86.1 million in cash, plus an additional $3.5 million for working capitalincluding transaction costs directly related to the acquisition and other items.post-closing adjustments, less cash acquired. We began including the results of Ibbotson’s operations in our Consolidated Financial Statements on March 1, 2006. This acquisition complemented our growth strategies in several key areas, including investment consulting, managed retirement accounts, and institutional and advisor software.
Variable Annuity Research and Data Service (VARDS)
In January 2005, we acquired the VARDS unit, which provides research and data on variable annuities, from Finetre Corporation for $8.2 million in cash. We believe this acquisition strengthenedbegan including the results of VARDS’ operations in our investment database and enhanced our efforts to provide investors with the information they need to make well-informed decisions when investing in variable annuities.
Morningstar Norway
In February 2004, we purchased the remaining 51% of Morningstar Norway that we did not previously own. The purchase price consisted of $0.2 million in cash and approximately $0.1 million of other consideration. Prior to this transaction, we accounted for our investment in Morningstar Norway using the equity method.Consolidated Financial Statements on January 1, 2005.
Initial Public Offering
In May 2005, we completed our initial public offering of 7,612,500 shares of our common stock. These shares began trading on May 3, 2005 on the Nasdaq National Market under the symbol “MORN” and now trade on the Nasdaq Global Select Market. All of these shares were sold by affiliates of SOFTBANK Finance Corporation, a wholly owned subsidiary of SOFTBANK Corp. We did not receive any proceeds from the sale of these shares.
We granted the underwriters the right to purchase up to an additional 1,141,875 shares at the initial public offering price to cover over-allotments. In May 2005, the underwriters exercised their over-allotment option in full. The net proceeds to us from the exercise of the underwriters’ over-allotment option were $18.1 million, based on our initial public offering price of $18.50 per share, after deducting the underwriting discounts and commissions and $2.6 million of offering expenses.
67
Subsequent Event
In February 2007,January 2008, we entered into a definitive agreement to acquire Standard & Poor’s mutual fundacquired the Hemscott data, businessmedia, and investor relations Web site businesses from Ipreo Holdings, LLC for $55$51.6 million in cash, subject to post-closingworking capital adjustments. Standard & Poor’s isThe acquisition includes Hemscott Data, which has more than 20 years of comprehensive fundamental data on virtually all publicly listed companies in the United States, Canada, the United Kingdom, and Ireland; Hemscott Guru, a division of The McGraw-Hill Companies. Standard & Poor’s fund data business consists ofleading online research tool that contains financial data and products coveringdirectors’ biographies on more than 135,000 managed2,500 UK-quoted companies and 400,000 private companies; Hemscott Adviser Rankings Guide, a comprehensive listing of more than 1,800 leading providers of professional services to all UK-and-Irish-registered companies listed on the London Stock Exchange; Hemscott India, which operates a state-of-the-art data collection center in New Delhi, India; Hemscott.com, a free investment vehicles, including mutual funds, exchange-traded funds (ETFs), hedge funds,research Web site in the United Kingdom; Hemscott Premium and offshore funds. Under termsPremium Plus, subscription-based investment research and data services for executives and high net-worth investors; and Hemscott IR, a pioneer in best-practice online investor relations and corporate communications services in the United Kingdom.
This acquisition fits with our strategies of building a premier global equity database and expanding our presence outside the agreement, Standard & Poor’s will license fund data from Morningstar after the acquisition is completed. We completed the transaction on March 16, 2007.United States.
68
Application of Critical Accounting Policies and Estimates
Our discussion and analysis of our financial condition and results of operations are based on our Consolidated Financial Statements, which have been prepared in accordance with U.S. GAAP. Our significant accounting policies are discussed in Note 2 of the Notes to our Consolidated Financial Statements. The preparation of financial statements in accordance with U.S. GAAP requires our management team to make estimates and assumptions that affect the reported amounts of assets, liabilities, revenue, expense, and related disclosures included in our Consolidated Financial Statements.
We evaluate our estimates on an ongoing basis. We base our estimates on historical experience and on various other assumptions that we believe are reasonable. Based on these assumptions and estimates, we make judgments about the carrying values of assets and liabilities that are not readily apparent from other sources. Our actual results could vary from these estimates and assumptions. If actual amounts are different from previous estimates, we include revisions in our results of operations for the period in which the actual amounts become known.
We believe the following critical accounting policies reflect the significant judgments and estimates used in the preparation of our Consolidated Financial Statements:
58
Revenue Recognition
Much of our revenue comes from the sale of subscriptions or licenses for print publications, software, and Internet-based products and services. We recognize this revenue in equal amounts over the term of the subscription or license, which generally ranges from one to three years. We also provide analysis, consulting, retirement advice, and other services. We recognize this revenue when the service is provided or during the service obligation period defined in the contract.
We make significant judgments related to revenue recognition, including whether fees are fixed or determinable and whether the collection of payment is probable. For contracts that combine multiple products and services, we make judgments regarding the fair value of each element in the arrangement based on selling prices of the items when sold separately. Delivery of our products and services is a prerequisite to the recognition of revenue. If arrangements include an acceptance provision, we recognize revenue upon the receipt of written customer acceptance.
Deferred revenue is the amount invoiced or collected in advance for subscriptions, licenses, or services that has not yet been recognized as revenue. As of December 31, 2006,2007, our deferred revenue was $100.5$129.3 million. We expect to recognize this deferred revenue in future periods as we fulfill our service obligations. The amount of deferred revenue may increase or decrease primarily based on the mix of contracted products and services and the volume of new and renewal subscriptions. The timing of future revenue recognition may change depending on the terms of the license agreements and the timing of fulfilling of our service obligations. We believe that the estimate related to revenue recognition is a critical accounting estimate, and to the extent that there are material differences between our determination of deferred revenue and actual results, our financial condition or results of operations may be affected.
Purchase Price Allocation
Over the past several years, we have acquired companies that complement our business operations. In 2007, we acquired the mutual fund data business from Standard & Poor’s. In 2006, we acquired Ibbotson Associates, Aspect Huntley, and the database division of InvestorForce. TheIn 2005, we acquired VARDS. Over the past three years, the total cash paid for these acquisitions, net of cash acquired, was $117.3 million in 2006. In 2005, we acquired VARDS for $8.2 million in cash. In 2004, we acquired the remaining 51% of Morningstar Norway that we did not previously own for $0.2 million in cash and $0.1 million in other consideration. approximately $186.0 million.
For each of these acquisitions,acquisition, the purchase price was allocated to the assets acquired, liabilities assumed, and goodwill, in accordance with SFAS No. 141, Business Combinations. We recognized the assets and liabilities acquired related to these acquisitions at their estimated fair values including $81.0and as of December 31, 2007 had allocated $116.8 million of value assigned to intangible assets such as customer lists, intellectual property, technology, non-competition agreements, and supplier lists. For these intangible assets, the estimated useful lives range from threetwo to 25 years. As of December 31, 2006,2007, we also have recorded $86.7$128.1 million of goodwill arising from acquisitions.
69
Management judgment is required in allocating the purchase price to the acquired assets and liabilities. We use judgment to:
•· identify the acquired assets,
•· estimate the fair value of these assets,
•· estimate the useful life of the assets; and
•· assess the appropriate method for recognizing depreciation or amortization expense over the asset’s useful life.
We believe that the accounting estimates related to purchase price allocations are critical accounting estimates because the assumptions impact the amounts and classifications of assets and liabilities presented in our Consolidated Balance Sheets, the amount of amortization and depreciation expense, if any, recorded in our Consolidated Statements of Income, and the impairment testing performed in subsequent periods.
Goodwill
Goodwill recorded on our Consolidated Balance Sheet as of December 31, 20062007 was $86.7$128.1 million. In accordance with SFAS No. 142, Goodwill and Other Intangible Assets, we do not amortize goodwill. Instead, it is subject to at least an annual test for impairment, or whenever indicators of impairment exist, based on a discounted cash-flow model. An impairment would occur if the carrying amount of a reporting unit, including goodwill, exceeded the fair value of that reporting unit.
The process of evaluating the potential impairment of goodwill is subjective and requires significant judgment. In estimating the fair value of the reporting units, we make estimates and judgments about the future cash flows of the reporting unit. These estimates include assumptions about future market growth and trends, forecasted revenue and costs, capital investments, appropriate discount rates, and other variables that can significantly affect the value of the reporting unit.
Although our cash flow forecasts are based on assumptions that are consistent with plans and estimates we use to manage the underlying business, there is significant judgment in determining the cash flows attributable to these businesses over a long-term horizon. We update these assumptions and cash flow estimates annually, at a minimum.
We believe that the accounting estimate related to goodwill impairment is a critical accounting estimate because the assumptions used are highly susceptible to changes in the operating results and cash flows of the reporting units included in our segments. If actual
59
results differ from our estimates, future tests may indicate an impairment of goodwill. This would result in a non-cash charge, adversely affecting our results of operations.
Impairment of Long-Lived Assets
Our Consolidated Balance Sheet as of December 31, 20062007 includes property, equipment, and capitalized software of $15.9$19.1 million and intangible assets of $72.8$95.8 million. In accordance with SFAS No. 144, Accounting for the Impairment or Disposal of Long-Lived Assets, we review our property, equipment, capitalized software, and intangible assets for impairment whenever events or changes in circumstances indicate that the carrying value may not be recoverable. Such events or changes may include a deterioration in the business climate for a specific product or service. If the total of projected future undiscounted cash flows is less than the carrying amount of an asset, we may need to record an impairment loss based on the excess of the carrying amount over the fair value of the assets.
70
Estimates of future cash flows and the estimated useful lives associated with these assets are critical to the assessment of recoverability and fair values. They are susceptible to change from period to period because of the requirement to make assumptions about future cash flows generated over extended periods of time. Changes in these estimates could result in a determination of asset impairment, which would result in a reduction to the carrying value and could adversely affect our operating results in the related period.
Stock-Based Compensation
We adopted SFAS No. 123 (Revised 2004)123(R), Share-Based Payment (SFAS No. 123(R)), as of January 1, 2006. Under SFAS No. 123 (R)123(R), stock-based compensation expense is measured at the grant date based on the fair value of the award, and the cost is recognized as expense ratably over the award’s vesting period. In 2006, we granted both stock options and restricted stock units to employees. In 2007, our equity grants were almost exclusively in the form of restricted stock units. We measure the fair value of our restricted stock units on the date of grant based on the market price of the underlying common stock as of the close of trading on the day prior to grant. We measure the fair value of our stock options on the date of grant using a Black-Scholes option-pricing model.
Determining the fair value of our stock options required that we make several estimates, including the volatility of our stock price, the expected life of the option, the expected strike price at the time of exercise, interest rates, and dividend yields. As a recently public company, we have limited historical information on the price of our stock as well as employees’ stock option exercise behavior. Because of this limitation, we cannot rely on our historical experience alone to develop assumptions for stock price volatility and the expected life of our options. We estimated stock-price volatility with reference to a peer group of companies. Determining the companies to include in this peer group involves judgment. We estimated the expected life of our options using the “shortcut method” described in Staff Accounting Bulletin Topic 14.D.2, which is based on a calculation to arrive at the midpoint between the vesting date and the end of the contractual term.
Certain stock options granted in 2004, 2005, and 2006 have initial exercise prices that will increase over the term of the options at a rate equal to the 10-year Treasury bond rate as of the date of grant. We estimated the expected exercise price included in the Black-Scholes model using our estimated 6.25 year estimated life and the applicable 10-year Treasury bond rate. We based the risk-free interest rate used in our assumptions on the implied yield available on U.S. Treasury zero-coupon issues with a remaining term that approximates the stock option award’s expected life. We do not intend to pay dividends on our common stock for the foreseeable future; therefore, we used a dividend yield of zero in our assumptions.
The use of different assumptions in the Black-Scholes model would result in different amounts of stock-based compensation expense. A 1% change in the Black-Scholes value would have resulted in a corresponding change of approximately $0.1 million in stock-based compensation expense in 2006 for stock options.
Under SFAS No. 123(R), we are required to estimate expected forfeitures of stock-based awards at the grant date and recognize compensation cost only for those awards expected to vest. The forfeiture assumption is ultimately adjusted to the actual forfeiture rate. Therefore, changes in the forfeiture assumptions do not impact the total amount of expense ultimately recognized over the vesting period. Rather, different forfeiture assumptions would only impact the timing of expense recognition over the vesting period. Estimated forfeitures
Because our largest annual equity grants typically have vesting dates in the second quarter of the year, we adjust the stock-based compensation expense at that time to reflect those awards that ultimately vested. In addition, we update our estimate of the forfeiture rate that will be reassessedapplied to awards not yet vested. In 2007, we recorded approximately $0.8 million of additional stock-based compensation expense related to these changes in subsequent periods and may change based on new facts and circumstances.estimates.
We believe that the estimates related to stock-based compensation expense are critical accounting estimates because the assumptions used could significantly impact the timing and amount of stock-based compensation expense recorded in our Consolidated Financial Statements.
60
Income Taxes
Our annual effective income tax expense rate is based on the mix of income and losses in our U.S. and non-U.S. entities which are part of our Consolidated Financial Statements, statutory tax rates, and tax-planning opportunities available to us in the various jurisdictions in which we operate. Significant judgment is required in evaluating our tax positions.
Tax law requires items to be included in the tax return at different times from when these items are reflected in our Consolidated Financial Statements.Income Statement. As a result, the effective tax rate reflected in our Consolidated Financial Statements is different from the tax rate reported on our tax return (our cash tax rate). Some of these differences are permanent, such as expenses that are not deductible in our tax return, and some differences reverse over time, such as depreciation expense. These timing differences create deferred tax assets and liabilities. Deferred tax assets and liabilities are determined based on temporary differences between the financial reporting and the tax basis of assets and liabilities. In addition, excess tax benefits associated with stock option exercises and vesting of restricted stock units also create a difference between our cash tax rate and the effective tax rate in our Consolidated Income Statement.
As of December 31, 2006,2007, we had $1.3$0.6 million of net current deferred tax liabilities and $13.8$15.7 million of net long-term deferred tax assets. In addition, we haveThe deferred tax assets include amounts related to net operating loss (NOL) carryforwardscarryforwards. As of $28.4December 31, 2007, we have NOLs of $22.4 million related to our non-U.S. operations. Of these NOLs, $9.3 million will begin to expire in 2008 through 2021 and $19.1 million have no expiration. Because of the historical operating losses of certain of the non-U.S. operations that generated these NOLs, we have recorded a valuation allowance against all but approximately $6.0$7.1 million of the NOLs, reflecting the likelihood that the benefit of the NOLs will not be realized. In assessing the realizability of our deferred tax assets, and NOLs, we consider whether it is more likely than not that some portion or all of the deferred tax assets will not be realized. The ultimate realization of deferred tax assets is dependent upon the generation of future taxable income during the periods in which those temporary differences become deductible.
71
In assessing the need for a valuation allowance, we consider both positive and negative evidence, including tax-planning strategies, projected future taxable income, and recent financial performance. If after future assessments of the realizability of the deferred tax assets we determine a lesser allowance is required, we would record a reduction to the income tax expense and to the valuation allowance in the period this determination was made. This would cause our income tax expense, effective tax rate, and net income to fluctuate.
In addition, we establish reserves atWe assess uncertain tax positions in accordance with FIN 48, Accounting for Uncertainty in Income Taxes. We use judgment to identify, recognize, and measure the time that we determine that it is more likely than not that we will needamounts to pay additional taxesbe recorded in the financial statements related to certain matters.tax positions taken or expected to be taken in a tax return. A liability is recognized to represent the potential future obligation to the taxing authority for the benefit taken in the tax return. We adjust these reserves,liabilities, including any impact of the related interest and penalties, in light of changing facts and circumstances such as the progress of a tax audit. A number of years may elapse before a particular matter for which we have established a reserve is audited and finally resolved. The number of years with open tax audits varies depending on the tax jurisdiction. While it is often difficult to predict the final outcome
We use judgment in classifying unrecognized tax benefits as either current or the timing of resolution of any particular tax matter, we record a reserve when we determine the likelihood of loss is more likely than not. Suchnoncurrent liabilities are recorded as income taxes payable in our Consolidated Balance Sheets. Settlement of any particular issue would usually require the use of cash. A liability associated with unrecognized tax benefits will generally be classified as a noncurrent liability because there will usually be a period of several years between the filing of the tax return and the final resolution of an uncertain tax position with the taxing authority. Favorable resolutions of tax matters for which we have previously established reserves are recognized as a reduction to our income tax expense when the amounts involved become known.
Assessing the future tax consequences of events that have been recognized in our financial statementsConsolidated Financial Statements or tax returns requires judgment. Variations in the actual outcome of these future tax consequences could materially impact our financial position, results of operations, or cash flows.
Contingencies
We are subject to various claims and contingencies related to legal proceedings and investigations. Refer to Note 16 of the Notes to our Consolidated Financial Statements. Due to their nature, such legal proceedings involve inherent uncertainties including, but not limited to, court rulings, negotiations between affected parties, and government actions. Judgment is required as we assess the probability of loss for such contingencies and either accrue a liability or disclose the relevant circumstances, as appropriate. If actual results differ from our assessments, our financial position, results of operations, or cash flows would be impacted.
Recently Issued Accounting Pronouncements
In December 2007, the FASB issued SFAS No. 141(R), Business Combinations. SFAS No. 141(R) modifies the financial accounting and reporting of business combinations. SFAS No. 141(R) requires the acquirer to recognize and measure the fair value of the acquired operation as a whole, and the assets acquired and liabilities assumed at their full fair values as of the date control is obtained, regardless of the percentage ownership in the acquired operation or how the acquisition was achieved. SFAS No. 141(R) is effective for business combination transactions with acquisition dates on or after the first annual reporting period beginning on or after December 15, 2008. SFAS No. 141 (R) is required to be adopted concurrently with SFAS No. 160, Accounting and Reporting of Noncontrolling Interests in Consolidated Financial Statements, an amendment of ARB No. 51. SFAS No. 141(R) requires prospective application and prohibits earlier application. We are in the process of determining the effect the adoption of SFAS No. 141 (R) will have on our Consolidated Financial Statements.
72
In December 2007, the FASB issued SFAS No. 160, Accounting and Reporting of Noncontrolling Interests in Consolidated Financial Statements, an amendment of ARB No. 51. SFAS No. 160 amends the financial accounting and reporting of noncontrolling (or minority) interests in consolidated financial statements. SFAS No. 160 is required to be adopted concurrently with SFAS No. 141 (R) and is effective for the first annual reporting period beginning on or after December 15, 2008. Earlier application is prohibited. We are in the process of determining the effect the adoption of SFAS No. 160 will have on our Consolidated Financial Statements.
In February 2007, the FASB issued SFAS No. 159, The Fair Value Option for Financial Assets and Financial Liabilities, (including an amendment to FASB Statement No. 115, Accounting for Certain Investments in Debt and Equity Securities). SFAS No. 159 permits entities to choose to measure many financial instruments and certain other items at fair value. The objective is to improve financial reporting by providing entities with the opportunity to mitigate volatility in reported earnings caused by measuring related assets and liabilities differently without having to apply complex hedge accounting provisions. The amendment to SFAS No. 115 applies to all entities with available-for-sale and trading securities. SFAS No. 159 is effective for fiscal years beginning after November 15, 2007 and for interim periods within those years; therefore, we will adopt SFAS No. 159 in the first quarter of 2008. We are in the process of determining the effect the adoption of SFAS No. 159 will have on our Consolidated Financial Statements.
In September 2006, the Financial Accounting Standards Board (FASB)FASB issued SFAS No. 157, Fair Value Measurements, which defines fair value, establishes a framework for measuring fair value, and expands disclosures about fair value measurements. The standard applies whenever other standards require (or permit) assets or liabilities to be measured at fair value. The standard does not expand the use of fair value in any new circumstances. SFAS No. 157 is effective for fiscal years beginning after November 15, 2007 and for interim periods within those years; therefore, we will adopt SFAS No. 157 in the first quarter of 2008. We are in the process of determining the effect the adoption of SFAS No. 157 will have on our Consolidated Financial Statements.
In September 2006, the SEC issued Staff Accounting Bulletin (SAB) No. 108, Considering the Effects of Prior Year Misstatements
61
when Quantifying Misstatements in Current Year Financial Statements (SAB 108). SAB 108 addresses quantifying the financial statement effects of misstatements; specifically, how the effects of prior year uncorrected errors must be considered in quantifying misstatements in the current year financial statements. SAB 108 is effective for fiscal years ending after November 15, 2006; therefore, we adopted SAB 108 in the fourth quarter of 2006. The adoption of SAB 108 did not have an impact on our Consolidated Financial Statements.
In July 2006, the FASB issued Interpretation No. 48, Accounting for Uncertainty in Income Taxes, an interpretation of FASB Statement No. 109 (FIN 48), which prescribes the minimum recognition threshold a tax position is required to meet before being recognized in the financial statements. FIN 48 also provides guidance on derecognition, measurement, classification, interest and penalties, accounting in interim periods, and disclosure for uncertain tax positions. FIN 48 is effective for fiscal years beginning after December 15, 2006; therefore, we will adopt FIN 48 in the first quarter of 2007. We do not anticipate that the adoption of FIN 48 will have a material impact on our Consolidated Financial Statements.
In June 2006, the Emerging Issues Task Force (EITF) ratified Issue No. 06-2, Accounting for Sabbatical Leave and Other Similar Benefits Pursuant to FASB Statement No. 43, “Accounting for Compensated Absences” (EITF No. 06-2), which requires that a liability for employees’ sabbatical benefits be accrued over the period required for employees to earn the right to sabbatical leave. EITF No. 06-2 is effective for fiscal years beginning after December 15, 2006; therefore, we will adopt EITF No. 06-2 in the first quarter of 2007. In the first quarter of 2007, we will record a cumulative effect of accounting change, net of tax, of approximately $3.4 million to record the portion of employee sabbatical leave that has been earned. Other than recording this cumulative effect of accounting change, we do not anticipate that the adoption of EITF No. 06-2 will have a material impact on our Consolidated Financial Statements.
Contractual Obligations
The following table presents our known contractual obligations as of December 31, 20062007 and the expected timing of cash payments related to these contractual obligations:
($000) |
| 2007 |
| 2008 |
| 2009 |
| 2010 |
| 2011 |
| Thereafter |
| Total |
| ||||||||||||||
Minimum commitments on non-cancelable |
| $ | 4,309 |
| $ | 7,446 |
| $ | 7,002 |
| $ | 6,988 |
| $ | 6,930 |
| $ | 68,753 |
| $ | 101,428 |
| |||||||
Asset retirement obligation (2) |
| — |
| — |
| 98 |
| — |
| — |
| — |
| 98 |
| ||||||||||||||
Total |
| $ | 4,309 |
| $ | 7,446 |
| $ | 7,100 |
| $ | 6,988 |
| $ | 6,930 |
| $ | 68,753 |
| $ | 101,526 |
| |||||||
($000) |
| 2008 |
| 2009 |
| 2010 |
| 2011 |
| 2012 |
| Thereafter |
| Total |
| |||||||
Minimum commitments on non-cancelable operating lease obligations (1) |
| $ | 7,427 |
| $ | 7,533 |
| $ | 13,013 |
| $ | 12,302 |
| $ | 10,454 |
| $ | 90,540 |
| $ | 141,269 |
|
Unrecognized tax benefits (2) |
| 1,492 |
| — |
| — |
| — |
| — |
| — |
| 1,492 |
| |||||||
Deferred compensation agreement (3) |
| 585 |
| — |
| — |
| — |
| — |
| — |
| 585 |
| |||||||
Asset retirement obligation (4) |
| — |
| 98 |
| — |
| — |
| — |
| — |
| 98 |
| |||||||
Total |
| $ | 9,504 |
| $ | 7,631 |
| $ | 13,013 |
| $ | 12,302 |
| $ | 10,454 |
| $ | 90,540 |
| $ | 143,444 |
|
|
|
|
|
|
|
|
|
|
|
|
|
|
|
|
| |||||||
(1) The non-cancelable operating lease obligations relate primarily to lease commitments onfor office space. In December 2005, we signed an agreement tospace and include the lease payments for approximately 210,000235,000 square feet of new office space in Chicago, Illinois for our corporate headquarters in Chicago, Illinois. TheU.S.-based operations. Although the lease begins in 2008, andthe minimum lease payments will begin in the second half of 2009. This lease has a term of 15 years.
(2) Represents unrecognized tax benefits (including penalties and interest, less the impact of any associated tax benefits) recorded in accordance with FIN 48. The minimum future lease payments areamount included in the above table presented above.represents amounts we anticipate may be paid in 2008. The above table excludes approximately $5.6 million of unrecognized tax benefits, included as other long-term liabilities in our Consolidated Balance Sheet as of December 31, 2007, for which we cannot make a reasonably reliable estimate of the period of payment.
(2)
73
(3) We have an obligation to pay up to approximately $0.6 million under a deferred compensation agreement with Don Phillips, one of our managing directors, as discussed in Note 12 of the Notes to our Consolidated Financial Statements. We are required to make these payments as Don exercises certain stock options granted to him under the 1999 Stock Option Plan. As of December 31, 2007, there were 217,286 stock options remaining to be exercised. If all of these options are exercised in 2008, we would make payments to him of approximately $0.6 million in accordance with the deferred compensation agreement.
(4) The asset retirement obligation relates to costs that will be incurred to return office space modified by leasehold improvements to its original condition in accordance with the lease agreement.
In addition, we have an obligation to pay up to approximately $2.0 million under a deferred compensation agreement with Don Phillips, one of our managing directors, as discussed in Note 12 of the Notes to our Consolidated Financial Statements. As of December 31, 2006, $1.9 million is classified as a current liability and $0.1 million is classified as a long-term liability. We are required to make these payments as Don exercises certain stock options granted to him under the 1999 Stock Option Plan. Because the timing of these payments is uncertain, we have not included this obligation in the above table. In May 2006, Don entered into a Rule 10b5-1 plan contemplating the sale of up to 450,000 shares to be acquired through stock option exercises during 2006 and 2007. As of December 31, 2006, there were 310,000 options remaining to be exercised under this 10b5-1 plan. If all 310,000 stock options are exercised in 2007, we would make payments to him of approximately $834,000 in accordance with the deferred compensation agreement.
There are no purchase commitments as of December 31, 20062007 that we believe would have a significant impact on our Consolidated Balance Sheet or Consolidated Statement of Cash Flows.
62
74
Selected Quarterly Financial Data
|
| 2005 |
| 2006 |
| |||||||||||||||||||||||||||
(in thousands except per share |
| Q1 |
| Q2 |
| Q3 |
| Q4 |
| Q1 |
| Q2 |
| Q3 |
| Q4 |
| |||||||||||||||
Revenue |
| $ | 53,204 |
| $ | 56,243 |
| $ | 56,927 |
| $ | 60,740 |
| $ | 70,060 |
| $ | 76,257 |
| $ | 81,821 |
| $ | 87,037 |
| |||||||
Operating expense (1): |
|
|
|
|
|
|
|
|
|
|
|
|
|
|
|
|
| |||||||||||||||
Cost of goods sold |
| 15,912 |
| 15,674 |
| 16,261 |
| 16,561 |
| 18,673 |
| 22,052 |
| 22,389 |
| 23,861 |
| |||||||||||||||
Development |
| 5,149 |
| 4,593 |
| 4,749 |
| 5,163 |
| 6,091 |
| 7,306 |
| 7,876 |
| 8,221 |
| |||||||||||||||
Sales and marketing |
| 9,785 |
| 9,845 |
| 9,499 |
| 9,942 |
| 11,660 |
| 11,880 |
| 12,971 |
| 14,103 |
| |||||||||||||||
General and administrative |
| 13,084 |
| 11,135 |
| 11,849 |
| 13,167 |
| 12,032 |
| 13,793 |
| 13,781 |
| 15,984 |
| |||||||||||||||
Depreciation and amortization |
| 2,396 |
| 1,852 |
| 2,222 |
| 1,796 |
| 2,406 |
| 3,767 |
| 4,267 |
| 4,535 |
| |||||||||||||||
Total operating expense |
| 46,326 |
| 43,099 |
| 44,580 |
| 46,629 |
| 50,862 |
| 58,798 |
| 61,284 |
| 66,704 |
| |||||||||||||||
Operating income |
| 6,878 |
| 13,144 |
| 12,347 |
| 14,111 |
| 19,198 |
| 17,459 |
| 20,537 |
| 20,333 |
| |||||||||||||||
Non-operating income: |
|
|
|
|
|
|
|
|
|
|
|
|
|
|
|
|
| |||||||||||||||
Interest income, net |
| 449 |
| 605 |
| 892 |
| 1,132 |
| 1,059 |
| 858 |
| 1,169 |
| 1,537 |
| |||||||||||||||
Other income (expense), net |
| 260 |
| (200 | ) | (46 | ) | 107 |
| (126 | ) | (186 | ) | (31 | ) | (116 | ) | |||||||||||||||
Non-operating income, net |
| 709 |
| 405 |
| 846 |
| 1,239 |
| 933 |
| 672 |
| 1,138 |
| 1,421 |
| |||||||||||||||
Income before income taxes, equity |
| 7,587 |
| 13,549 |
| 13,193 |
| 15,350 |
| 20,131 |
| 18,131 |
| 21,675 |
| 21,754 |
| |||||||||||||||
Income tax expense |
| 4,060 |
| 4,600 |
| 5,857 |
| 5,707 |
| 7,598 |
| 7,624 |
| 9,228 |
| 8,525 |
| |||||||||||||||
Equity in net income of |
| 480 |
| 549 |
| 183 |
| 450 |
| 647 |
| 658 |
| 1,100 |
| 382 |
| |||||||||||||||
Income before cumulative effect of |
| 4,007 |
| 9,498 |
| 7,519 |
| 10,093 |
| 13,180 |
| 11,165 |
| 13,547 |
| 13,611 |
| |||||||||||||||
Cumulative effect of accounting |
| — |
| — |
| — |
| — |
| 259 |
| — |
| — |
| — |
| |||||||||||||||
Net income |
| $ | 4,007 |
| $ | 9,498 |
| $ | 7,519 |
| $ | 10,093 |
| $ | 13,439 |
| $ | 11,165 |
| $ | 13,547 |
| $ | 13,611 |
| |||||||
Basic income per share: |
|
|
|
|
|
|
|
|
|
|
|
|
|
|
|
|
| |||||||||||||||
Income before cumulative effect |
| $ | 0.10 |
| $ | 0.24 |
| $ | 0.19 |
| $ | 0.25 |
| $ | 0.33 |
| $ | 0.27 |
| $ | 0.33 |
| $ | 0.32 |
| |||||||
Net income |
| $ | 0.10 |
| $ | 0.24 |
| $ | 0.19 |
| $ | 0.25 |
| $ | 0.33 |
| $ | 0.27 |
| $ | 0.33 |
| $ | 0.32 |
| |||||||
Weighted average common shares outstanding—basic |
| 38,448 |
| 39,064 |
| 39,922 |
| 40,109 |
| 40,355 |
| 40,925 |
| 41,448 |
| 41,957 |
| |||||||||||||||
Diluted income per share: |
|
|
|
|
|
|
|
|
|
|
|
|
|
|
|
|
| |||||||||||||||
Income before cumulative effect |
| $ | 0.09 |
| $ | 0.22 |
| $ | 0.17 |
| $ | 0.22 |
| $ | 0.28 |
| $ | 0.24 |
| $ | 0.29 |
| $ | 0.29 |
| |||||||
Net income |
| $ | 0.09 |
| $ | 0.22 |
| $ | 0.17 |
| $ | 0.22 |
| $ | 0.29 |
| $ | 0.24 |
| $ | 0.29 |
| $ | 0.29 |
| |||||||
Weighted average common shares |
| 42,944 |
| 43,742 |
| 45,354 |
| 45,730 |
| 46,424 |
| 46,684 |
| 46,578 |
| 47,100 |
| |||||||||||||||
|
| 2006 |
|
|
|
|
|
|
| 2007 |
|
|
|
|
|
|
|
(in thousands except per share |
| Q1 |
| Q2 |
| Q3 |
| Q4 |
| Q1 |
| Q2 |
| Q3 |
| Q4 |
|
Revenue |
| $70,060 |
| $76,257 |
| $81,821 |
| $87,037 |
| $95,447 |
| $109,685 |
| $111,859 |
| $118,116 |
|
Operating expense (1): |
|
|
|
|
|
|
|
|
|
|
|
|
|
|
|
|
|
Cost of goods sold |
| 18,673 |
| 22,052 |
| 22,389 |
| 23,861 |
| 25,855 |
| 29,020 |
| 28,674 |
| 30,228 |
|
Development |
| 6,091 |
| 7,306 |
| 7,876 |
| 8,221 |
| 8,055 |
| 9,134 |
| 9,010 |
| 8,917 |
|
Sales and marketing |
| 11,660 |
| 11,880 |
| 12,971 |
| 14,103 |
| 16,729 |
| 16,471 |
| 17,132 |
| 18,503 |
|
General and administrative |
| 12,032 |
| 13,793 |
| 13,781 |
| 15,984 |
| 16,086 |
| 21,128 |
| 19,936 |
| 21,718 |
|
Depreciation and amortization |
| 2,406 |
| 3,767 |
| 4,267 |
| 4,535 |
| 4,695 |
| 5,486 |
| 5,662 |
| 5,414 |
|
Total operating expense |
| 50,862 |
| 58,798 |
| 61,284 |
| 66,704 |
| 71,420 |
| 81,239 |
| 80,414 |
| 84,780 |
|
Operating income |
| 19,198 |
| 17,459 |
| 20,537 |
| 20,333 |
| 24,027 |
| 28,446 |
| 31,445 |
| 33,336 |
|
Non-operating income: |
|
|
|
|
|
|
|
|
|
|
|
|
|
|
|
|
|
Interest income, net |
| 1,059 |
| 858 |
| 1,169 |
| 1,537 |
| 1,749 |
| 1,437 |
| 1,812 |
| 2,136 |
|
Other income (expense), net |
| (126 | ) | (186 | ) | (31 | ) | (116 | ) | (236 | ) | (69 | ) | 408 |
| (1,008 | ) |
Non-operating income, net |
| 933 |
| 672 |
| 1,138 |
| 1,421 |
| 1,513 |
| 1,368 |
| 2,220 |
| 1,128 |
|
Income before income taxes, equity in net income of unconsolidated entities, and cumulative effect of accounting change |
| 20,131 |
| 18,131 |
| 21,675 |
| 21,754 |
| 25,540 |
| 29,814 |
| 33,665 |
| 34,464 |
|
Income tax expense |
| 7,598 |
| 7,624 |
| 9,228 |
| 8,525 |
| 10,291 |
| 11,996 |
| 14,229 |
| 14,739 |
|
Equity in net income of unconsolidated entities |
| 647 |
| 658 |
| 1,100 |
| 382 |
| 537 |
| 455 |
| 417 |
| 285 |
|
Income before cumulative effect of accounting change |
| 13,180 |
| 11,165 |
| 13,547 |
| 13,611 |
| 15,786 |
| 18,273 |
| 19,853 |
| 20,010 |
|
Cumulative effect of accounting change, net of income tax expense of $171 |
| 259 |
| — |
| — |
| — |
| — |
| — |
| — |
| — |
|
Net income |
| $13,439 |
| $11,165 |
| $13,547 |
| $13,611 |
| $15,786 |
| $18,273 |
| $19,853 |
| $20,010 |
|
Basic income per share: |
|
|
|
|
|
|
|
|
|
|
|
|
|
|
|
|
|
Basic income per share before cumulative effect of accounting change |
| $0.33 |
| $0.27 |
| $0.33 |
| $0.32 |
| $0.37 |
| $0.43 |
| $0.46 |
| $0.45 |
|
Basic net income per share |
| $0.33 |
| $0.27 |
| $0.33 |
| $0.32 |
| $0.37 |
| $0.43 |
| $0.46 |
| $0.45 |
|
Weighted average common shares outstanding—basic |
| 40,355 |
| 40,925 |
| 41,448 |
| 41,957 |
| 42,401 |
| 42,852 |
| 43,393 |
| 44,188 |
|
Diluted income per share: |
|
|
|
|
|
|
|
|
|
|
|
|
|
|
|
|
|
Diluted income per share before cumulative effect of accounting change |
| $0.28 |
| $0.24 |
| $0.29 |
| $0.29 |
| $0.33 |
| $0.38 |
| $0.41 |
| $0.41 |
|
Diluted net income per share |
| $0.29 |
| $0.24 |
| $0.29 |
| $0.29 |
| $0.33 |
| $0.38 |
| $0.41 |
| $0.41 |
|
Weighted average common shares outstanding—diluted |
| 46,424 |
| 46,684 |
| 46,578 |
| 47,100 |
| 47,381 |
| 47,868 |
| 48,232 |
| 48,757 |
|
|
|
|
|
|
|
|
|
|
|
|
|
|
|
|
|
|
|
(1) Includes stock-based compensation expense of:
|
| 2005 |
| 2006 |
|
| 2006 |
|
|
|
|
|
|
| 2007 |
|
|
|
|
|
|
| ||||||||||||||||||||||||||||||||||||||
|
| Q1 |
| Q2 |
| Q3 |
| Q4 |
| Q1 |
| Q2 |
| Q3 |
| Q4 |
|
| Q1 |
| Q2 |
| Q3 |
| Q4 |
| Q1 |
| Q2 |
| Q3 |
| Q4 |
| ||||||||||||||||||||||||||
Cost of goods sold |
| $ | 664 |
| $ | 264 |
| $ | 274 |
| $ | 271 |
| $ | 272 |
| $ | 285 |
| $ | 302 |
| $ | 313 |
|
| $ | 272 |
| $ | 285 |
| $ | 302 |
| $ | 313 |
| $ | 338 |
| $ | 513 |
| $ | 408 |
| $ | 447 |
| ||||||||||
Development |
| 275 |
| 105 |
| 112 |
| 111 |
| 114 |
| 131 |
| 141 |
| 146 |
|
| 114 |
| 131 |
| 141 |
| 146 |
| 253 |
| 371 |
| 302 |
| 330 |
| ||||||||||||||||||||||||||
Sales and marketing |
| 325 |
| 128 |
| 129 |
| 128 |
| 126 |
| 137 |
| 152 |
| 156 |
|
| 126 |
| 137 |
| 152 |
| 156 |
| 299 |
| 412 |
| 327 |
| 359 |
| ||||||||||||||||||||||||||
General and administrative |
| 3,623 |
| 1,441 |
| 1,515 |
| 1,530 |
| 1,422 |
| 1,526 |
| 1,663 |
| 1,689 |
|
| 1,422 |
| 1,526 |
| 1,663 |
| 1,689 |
| 1,444 |
| 1,907 |
| 1,560 |
| 1,708 |
| ||||||||||||||||||||||||||
Total stock-based compensation expense |
| $ | 4,887 |
| $ | 1,938 |
| $ | 2,030 |
| $ | 2,040 |
| $ | 1,934 |
| $ | 2,079 |
| $ | 2,258 |
| $ | 2,304 |
|
| $ | 1,934 |
| $ | 2,079 |
| $ | 2,258 |
| $ | 2,304 |
| $ | 2,334 |
| $ | 3,203 |
| $ | 2,597 |
| $ | 2,844 |
| ||||||||||
|
|
|
|
|
|
|
|
|
|
|
|
|
|
|
|
|
|
|
|
|
|
|
|
|
|
|
|
|
|
|
|
|
|
|
|
|
|
|
|
|
|
| ||||||||||||||||||
Stock-based compensation expense |
| $ | 2,810 |
| $ | — |
| $ | — |
| $ | — |
| $ | — |
| $ | — |
| $ | — |
| $ | — |
| |||||||||||||||||||||||||||||||||||
Stock-based compensation expense under |
| 2,077 |
| 1,938 |
| 2,030 |
| 2,040 |
| 1,934 |
| 2,079 |
| 2,258 |
| 2,304 |
| |||||||||||||||||||||||||||||||||||||||||||
Total stock-based compensation expense |
| $ | 4,887 |
| $ | 1,938 |
| $ | 2,030 |
| $ | 2,040 |
| $ | 1,934 |
| $ | 2,079 |
| $ | 2,258 |
| $ | 2,304 |
| |||||||||||||||||||||||||||||||||||
63
75
Item 7A. Quantitative and Qualitative Disclosures about Market Risk
We may be subject to risk from fluctuating interest rates. Our investment portfolio is actively managed and may suffer losses due tofrom fluctuating interest rates, market prices, or adverse security selection. AtOur investment portfolio is mainly invested in high-quality fixed-income securities. We do not have any direct exposure to sub-prime mortgages. As of December 31, 2006, we held $67.6 million of2007, our cash, cash equivalents, and investments consisting primarily of fixed-income securities.balance was $258.6 million. Based on our estimates, a 100 basis pointbasis-point change in interest rates would have increased or decreased the fair value of our investment portfolio by approximately $0.4$0.5 million.
As our non-U.S. revenue increases fluctuationas a percentage of our consolidated revenue, fluctuations in foreign currencies is an increasingpresent a greater potential risk. To date, we have not engaged in currency hedging, and we do not currently have any positions in derivative instruments to hedge our currency risk. Our results could suffer if certain foreign currencies decline relative to the U.S. dollar. In addition, because we use the local currency of our subsidiaries as the functional currency, we are affected by the translation of foreign currencies into U.S. dollars.
64
76
Item 8. Financial Statements and Supplementary Data
Reports of Independent Registered Public Accounting Firms
To the
The Board of Directors and Shareholders of
Morningstar, Inc.
We have audited the accompanying consolidated balance sheetsheets of Morningstar, Inc. and subsidiaries as of December 31, 2007 and 2006, and the related consolidated statements of income, shareholders’ equity and comprehensive income, and cash flows for each of the year then ended.two years in the period ended December 31, 2007. Our auditaudits also included the financial statement schedule listed in the index at Item 15(a). These financial statements and schedule are the responsibility of the Company’s management. Our responsibility is to express an opinion on these financial statements and schedule based on our audit.audits.
We conducted our auditaudits in accordance with the standards of the Public Company Accounting Oversight Board (United States). Those standards require that we plan and perform the audit to obtain reasonable assurance about whether the financial statements are free of material misstatement. An audit includes examining, on a test basis, evidence supporting the amounts and disclosures in the financial statements. An audit also includes assessing the accounting principles used and significant estimates made by management, as well as evaluating the overall financial statement presentation. We believe that our audit providesaudits provide a reasonable basis for our opinion.
In our opinion, the financial statements referred to above present fairly, in all material respects, the consolidated financial position of Morningstar, Inc. and subsidiaries atas of December 31, 2007 and 2006 and the consolidated results of their operations and their cash flows for each of the year thentwo years in the period ended December 31, 2007, in conformity with U.S. generally accepted accounting principles. Also in our opinion, the related financial statement schedule, when considered in relation to the basic consolidated financial statements taken as a whole, presents fairly in all material respects, the information set forth therein.
As described in Note 2 to the consolidated financial statements, effective January 1, 2007, the Company changed its method of accounting for uncertain tax positions to conform with Financial Accounting Standards Board (FASB) Interpretation No. 48, Accounting for Uncertainty in Income Taxes. In addition, effective January 1, 2007, the Company changed its method of accounting for sabbatical leave to conform with Emerging Issues Task Force (EITF) No. 06-02, Accounting for Sabbatical Leave and Other Similar Benefits Pursuant to FASB Statement No. 43, “Accounting for Compensated Absences.” Effective January 1, 2006, the Company changed its method of accounting for share-based payments to conform with FASB Statement No. 123(R), Share-Based Payment.
We also have audited, in accordance with the standards of the Public Company Accounting Oversight Board (United States), the effectiveness of Morningstar, Inc. and subsidiaries’ internal control over financial reporting as of December 31, 2006,2007, based on criteria established in Internal Control—Integrated Framework issued by the Committee of Sponsoring Organizations of the Treadway Commission and our report dated March 9, 20075, 2008 expressed an unqualified opinion thereon.
/s/ Ernst & Young LLP |
|
Ernst & Young LLP | |
Chicago, Illinois | |
March | |
77
To the Board of Directors and Shareholders of
Morningstar, Inc.
We have audited management’s assessment, included in the accompanying Management’s Report on Internal Control Over Financial Reporting, that Morningstar, Inc. and subsidiaries maintained effectivesubsidiaries’ internal control over financial reporting as of December 31, 2006,2007, based on criteria established in Internal Control—Integrated Framework issued by the Committee of Sponsoring Organizations of the Treadway Commission (the COSO criteria). Morningstar, Inc. and subsidiaries’ management is responsible for maintaining effective internal control over financial reporting and for its assessment of the effectiveness of internal control over financial reporting.reporting included in the accompanying Management’s Report on Internal Control Over Financial Reporting. Our responsibility is to express an opinion on management’s assessment and an opinion on the effectiveness of the Company’s internal control over financial reporting based on our audit.
We conducted our audit in accordance with the standards of the Public Company Accounting Oversight Board (United States). Those standards require that we plan and perform the audit to obtain reasonable assurance about whether effective internal control over financial reporting was maintained in all material respects. Our audit included obtaining an understanding of internal control over financial reporting, evaluating management’s assessment,assessing the risk that a material weakness exists, testing and evaluating the design and operating effectiveness of internal control based on the assessed risk, and performing such other procedures as we considered necessary in the circumstances. We believe that our audit provides a reasonable basis for our opinion.
A company’s internal control over financial reporting is a process designed to provide reasonable assurance regarding the reliability of financial reporting and the preparation of financial statements for external purposes in accordance with generally accepted accounting principles. A company’s internal control over financial reporting includes those policies and procedures that (1) pertain to the maintenance of records that, in reasonable detail, accurately and fairly reflect the transactions and dispositions of the assets of the company; (2) provide reasonable assurance that transactions are recorded as necessary to permit preparation of financial statements in accordance with generally accepted accounting principles, and that receipts and expenditures of the company are being made only in accordance with authorizations of management and directors of the company; and (3) provide reasonable assurance regarding prevention or timely detection of unauthorized acquisition, use, or disposition of the company’s assets that could have a material effect
65
on the financial statements.
Because of its inherent limitations, internal control over financial reporting may not prevent or detect misstatements. Also, projections of any evaluation of effectiveness to future periods are subject to the risk that controls may become inadequate because of changes in conditions, or that the degree of compliance with the policies or procedures may deteriorate.
In our opinion, management’s assessment that Morningstar, Inc. and subsidiaries maintained effective internal control over financial reporting as of December 31, 2006 is fairly stated, in all material respects, based on the COSO criteria. Also, in our opinion, Morningstar, Inc. and subsidiaries maintained, in all material respects, effective internal control over financial reporting as of December 31, 20062007, based on the COSO criteria.
We also have audited, in accordance with the standards of the Public Company Accounting Oversight Board (United States), the consolidated balance sheetsheets of Morningstar, Inc. and subsidiaries as of December 31, 2007 and 2006, and the related consolidated statements of income, shareholders’ equity and comprehensive income, and cash flows for each of the year thentwo years in the period ended December 31, 2007, and our report dated March 9, 2007,5, 2008, expressed an unqualified opinion thereon.
/s/ Ernst & Young LLP |
|
Ernst & Young LLP | |
Chicago, Illinois | |
March | |
78
To the Board of Directors and Shareholders of Morningstar, Inc.
Chicago, Illinois
We have audited the accompanying consolidated balance sheet of Morningstar, Inc. and subsidiaries (the Company) as of December 31, 2005, and the related consolidated statements of income, shareholders’ equity and comprehensive income, and cash flows of Morningstar, Inc. and subsidiaries (the Company) for the yearsyear ended December 31, 2005 and 2004.2005. These financial statements are the responsibility of the Company’s management. Our responsibility is to express an opinion on these financial statements based on our audits.audit.
We conducted our auditsaudit in accordance with the standards of the Public Company Accounting Oversight Board (United States). Those standards require that we plan and perform the audit to obtain reasonable assurance about whether the financial statements are free of material misstatement. The Company is not required to have, nor were we engaged to perform, an audit of its internal control over financial reporting.reporting as of December 31, 2005. Our auditsaudit included consideration of internal control over financial reporting as a basis for designing audit procedures that are appropriate in the circumstances, but not for the purpose of expressing an opinion on the effectiveness of the Company’s internal control over financial reporting. Accordingly, we express no such opinion. An audit also includes examining, on a test basis, evidence supporting the amounts and disclosures in the financial statements, assessing the accounting principles used and significant estimates made by management, as well as evaluating the overall financial statement presentation. We believe that our audits provideaudit provides a reasonable basis for our opinion.
In our opinion, such consolidated financial statements present fairly, in all material respects, the consolidated financial positionresults of operations of Morningstar, Inc. and subsidiaries as of December 31, 2005, and the results of its operations and its cash flows for the yearsyear ended December 31, 2005 and 2004, in conformity with accounting principles generally accepted in the United States of America.
/s/ Deloitte & Touche LLP |
|
Deloitte & Touche LLP | |
Chicago, Illinois | |
March 3, 2006 | |
6679
Morningstar, Inc. and Subsidiaries
Consolidated Statements of Income
Year ended December 31 (in thousands except per share amounts) |
| 2006 |
| 2005 |
| 2004 |
| ||||||||||
Revenue |
| $ | 315,175 |
| $ | 227,114 |
| $ | 179,658 |
| |||||||
Operating expenses: (1) |
|
|
|
|
|
|
| ||||||||||
Cost of goods sold |
| 86,975 |
| 64,408 |
| 54,709 |
| ||||||||||
Development |
| 29,494 |
| 19,654 |
| 16,167 |
| ||||||||||
Sales and marketing |
| 50,614 |
| 39,071 |
| 36,034 |
| ||||||||||
General and administrative |
| 55,590 |
| 49,235 |
| 46,788 |
| ||||||||||
Depreciation and amortization |
| 14,975 |
| 8,266 |
| 8,225 |
| ||||||||||
Total operating expense |
| 237,648 |
| 180,634 |
| 161,923 |
| ||||||||||
Operating income |
| 77,527 |
| 46,480 |
| 17,735 |
| ||||||||||
Non-operating income: |
|
|
|
|
|
|
| ||||||||||
Interest income, net |
| 4,623 |
| 3,078 |
| 1,211 |
| ||||||||||
Other income (expense), net |
| (459 | ) | 121 |
| 594 |
| ||||||||||
Non-operating income, net |
| 4,164 |
| 3,199 |
| 1,805 |
| ||||||||||
Income before income taxes, equity in net income of unconsolidated entities, |
| 81,691 |
| 49,679 |
| 19,540 |
| ||||||||||
Income tax expense |
| 32,975 |
| 20,224 |
| 11,574 |
| ||||||||||
Equity in net income of unconsolidated entities |
| 2,787 |
| 1,662 |
| 843 |
| ||||||||||
Income before cumulative effect of accounting change |
| 51,503 |
| 31,117 |
| 8,809 |
| ||||||||||
Cumulative effect of accounting change, net of income tax expense of $171 |
| 259 |
| — |
| — |
| ||||||||||
Net income |
| $ | 51,762 |
| $ | 31,117 |
| $ | 8,809 |
| |||||||
|
|
|
|
|
|
|
| ||||||||||
Basic income per share: |
|
|
|
|
|
|
| ||||||||||
Income before cumulative effect of accounting change |
| $ | 1.25 |
| $ | 0.79 |
| $ | 0.23 |
| |||||||
Cumulative effect of accounting change |
| 0.01 |
| — |
| — |
| ||||||||||
Net income |
| $ | 1.26 |
| $ | 0.79 |
| $ | 0.23 |
| |||||||
Diluted income per share: |
|
|
|
|
|
|
| ||||||||||
Income before cumulative effect of accounting change |
| $ | 1.10 |
| $ | 0.70 |
| $ | 0.21 |
| |||||||
Cumulative effect of accounting change |
| 0.01 |
| — |
| — |
| ||||||||||
Net income |
| $ | 1.11 |
| $ | 0.70 |
| $ | 0.21 |
| |||||||
|
|
|
|
|
|
|
| ||||||||||
Weighted average shares outstanding: |
|
|
|
|
|
|
| ||||||||||
Basic |
| 41,176 |
| 39,392 |
| 38,418 |
| ||||||||||
Diluted |
| 46,723 |
| 44,459 |
| 41,858 |
| ||||||||||
|
|
|
|
|
|
|
| |||||||||||||||
|
| 2006 |
| 2005 |
| 2004 |
| |||||||||||||||
(1) Includes stock-based compensation expense of: |
|
|
|
|
|
|
| |||||||||||||||
Year ended December 31 (in thousands except per share amounts) | Year ended December 31 (in thousands except per share amounts) |
| 2007 |
| 2006 |
| 2005 |
| ||||||||||||||
Revenue | Revenue |
| $ | 435,107 |
| $ | 315,175 |
| $ | 227,114 |
| |||||||||||
Operating expenses: (1) | Operating expenses: (1) |
|
|
|
|
|
|
| ||||||||||||||
Cost of goods sold |
| $ | 1,172 |
| $ | 1,473 |
| $ | 2,143 |
| Cost of goods sold |
| 113,777 |
| 86,975 |
| 64,408 |
| ||||
Development |
| 532 |
| 603 |
| 1,020 |
| Development |
| 35,116 |
| 29,494 |
| 19,654 |
| |||||||
Sales and marketing |
| 571 |
| 710 |
| 1,184 |
| Sales and marketing |
| 68,835 |
| 50,614 |
| 39,071 |
| |||||||
General and administrative |
| 6,300 |
| 8,109 |
| 12,376 |
| General and administrative |
| 78,868 |
| 55,590 |
| 49,235 |
| |||||||
Depreciation and amortization | Depreciation and amortization |
| 21,257 |
| 14,975 |
| 8,266 |
| ||||||||||||||
Total operating expense | Total operating expense |
| 317,853 |
| 237,648 |
| 180,634 |
| ||||||||||||||
Operating income | Operating income |
| 117,254 |
| 77,527 |
| 46,480 |
| ||||||||||||||
Non-operating income (expense): | Non-operating income (expense): |
|
|
|
|
|
|
| ||||||||||||||
Interest income, net | Interest income, net |
| 7,134 |
| 4,623 |
| 3,078 |
| ||||||||||||||
Other income (expense), net | Other income (expense), net |
| (905 | ) | (459 | ) | 121 |
| ||||||||||||||
Non-operating income, net | Non-operating income, net |
| 6,229 |
| 4,164 |
| 3,199 |
| ||||||||||||||
Income before income taxes, equity in net income of unconsolidated entities, and cumulative effect of accounting change | Income before income taxes, equity in net income of unconsolidated entities, and cumulative effect of accounting change |
| 123,483 |
| 81,691 |
| 49,679 |
| ||||||||||||||
Income tax expense | Income tax expense |
| 51,255 |
| 32,975 |
| 20,224 |
| ||||||||||||||
Equity in net income of unconsolidated entities | Equity in net income of unconsolidated entities |
| 1,694 |
| 2,787 |
| 1,662 |
| ||||||||||||||
Income before cumulative effect of accounting change | Income before cumulative effect of accounting change |
| 73,922 |
| 51,503 |
| 31,117 |
| ||||||||||||||
Cumulative effect of accounting change, net of income tax expense of $171 | Cumulative effect of accounting change, net of income tax expense of $171 |
| — |
| 259 |
| — |
| ||||||||||||||
Net income | Net income |
| $ | 73,922 |
| $ | 51,762 |
| $ | 31,117 |
| |||||||||||
|
|
|
|
|
|
|
|
| ||||||||||||||
Basic income per share: | Basic income per share: |
|
|
|
|
|
|
| ||||||||||||||
Basic income per share before cumulative effect of accounting change | Basic income per share before cumulative effect of accounting change |
| $ | 1.71 |
| $ | 1.25 |
| $ | 0.79 |
| |||||||||||
Cumulative per share effect of accounting change | Cumulative per share effect of accounting change |
| — |
| 0.01 |
| — |
| ||||||||||||||
Basic net income per share | Basic net income per share |
| $ | 1.71 |
| $ | 1.26 |
| $ | 0.79 |
| |||||||||||
Diluted income per share: | Diluted income per share: |
|
|
|
|
|
|
| ||||||||||||||
Diluted income per share before cumulative effect of accounting change | Diluted income per share before cumulative effect of accounting change |
| $ | 1.53 |
| $ | 1.10 |
| $ | 0.70 |
| |||||||||||
Cumulative per share effect of accounting change | Cumulative per share effect of accounting change |
| — |
| 0.01 |
| — |
| ||||||||||||||
Diluted net income per share | Diluted net income per share |
| $ | 1.53 |
| $ | 1.11 |
| $ | 0.70 |
| |||||||||||
|
|
|
|
|
|
|
|
| ||||||||||||||
Weighted average shares outstanding: | Weighted average shares outstanding: |
|
|
|
|
|
|
| ||||||||||||||
Basic | Basic |
| 43,216 |
| 41,176 |
| 39,392 |
| ||||||||||||||
Diluted | Diluted |
| 48,165 |
| 46,723 |
| 44,459 |
| ||||||||||||||
|
|
|
|
|
|
|
|
| ||||||||||||||
|
|
|
|
|
|
|
|
| ||||||||||||||
|
|
| 2007 |
| 2006 |
| 2005 |
| ||||||||||||||
(1) | Includes stock-based compensation expense of: |
|
|
|
|
|
|
| ||||||||||||||
| Cost of goods sold |
| $ | 1,706 |
| $ | 1,172 |
| $ | 1,473 |
| |||||||||||
| Development |
| 1,256 |
| 532 |
| 603 |
| ||||||||||||||
| Sales and marketing |
| 1,397 |
| 571 |
| 710 |
| ||||||||||||||
| General and administrative |
| 6,619 |
| 6,300 |
| 8,109 |
| ||||||||||||||
Total stock-based compensation expense |
| $ | 8,575 |
| $ | 10,895 |
| $ | 16,723 |
| Total stock-based compensation expense |
| $ | 10,978 |
| $ | 8,575 |
| $ | 10,895 |
| |
See notes to consolidated financial statements.
6780
Morningstar, Inc. and Subsidiaries
As of December 31 (in thousands except share amounts) |
| 2006 |
| 2005 |
|
| 2007 |
| 2006 |
| ||||||||
Assets |
|
|
|
|
|
|
|
|
|
| ||||||||
Current assets: |
|
|
|
|
|
|
|
|
|
| ||||||||
Cash and cash equivalents |
| $ | 96,140 |
| $ | 92,367 |
|
| $ | 159,576 |
| $ | 96,140 |
| ||||
Investments |
| 67,611 |
| 60,823 |
|
| 99,012 |
| 67,611 |
| ||||||||
Accounts receivable, less allowance of $225 and $418, respectively |
| 65,176 |
| 47,530 |
| |||||||||||||
Accounts receivable, less allowance of $161 and $225, respectively |
| 86,812 |
| 65,176 |
| |||||||||||||
Income tax receivable |
| 8,998 |
| — |
| |||||||||||||
Other |
| 8,557 |
| 5,495 |
|
| 13,163 |
| 8,557 |
| ||||||||
Total current assets |
| 237,484 |
| 206,215 |
|
| 367,561 |
| 237,484 |
| ||||||||
Property, equipment, and capitalized software, net |
| 15,869 |
| 17,355 |
|
| 19,108 |
| 15,869 |
| ||||||||
Investments in unconsolidated entities |
| 18,659 |
| 16,355 |
|
| 19,855 |
| 18,659 |
| ||||||||
Goodwill |
| 86,680 |
| 17,500 |
|
| 128,141 |
| 86,680 |
| ||||||||
Intangible assets, net |
| 72,841 |
| 7,251 |
|
| 95,767 |
| 72,841 |
| ||||||||
Deferred tax asset, net |
| 13,789 |
| 29,729 |
|
| 15,658 |
| 13,789 |
| ||||||||
Other assets |
| 2,516 |
| 1,906 |
|
| 3,217 |
| 2,516 |
| ||||||||
Total assets |
| $ | 447,838 |
| $ | 296,311 |
|
| $ | 649,307 |
| $ | 447,838 |
| ||||
|
|
|
|
|
|
|
|
|
|
| ||||||||
Liabilities and shareholders’ equity |
|
|
|
|
|
|
|
|
|
| ||||||||
Current liabilities: |
|
|
|
|
|
|
|
|
|
| ||||||||
Accounts payable and accrued liabilities |
| $ | 21,014 |
| $ | 13,664 |
|
| $ | 22,325 |
| $ | 21,014 |
| ||||
Accrued compensation |
| 40,856 |
| 26,463 |
|
| 64,709 |
| 40,856 |
| ||||||||
Deferred revenue |
| 129,302 |
| 100,525 |
| |||||||||||||
Income tax payable |
| 1,620 |
| 1,259 |
|
| — |
| 1,620 |
| ||||||||
Deferred revenue |
| 100,525 |
| 71,155 |
| |||||||||||||
Deferred tax liability, net |
| 1,266 |
| 833 |
|
| 557 |
| 1,266 |
| ||||||||
Other |
| 2,182 |
| 2,467 |
|
| 945 |
| 2,182 |
| ||||||||
Total current liabilities |
| 167,463 |
| 115,841 |
|
| 217,838 |
| 167,463 |
| ||||||||
Accrued compensation |
| 7,591 |
| 4,458 |
|
| 13,913 |
| 7,591 |
| ||||||||
Other long-term liabilities |
| 3,361 |
| 2,298 |
|
| 9,253 |
| 3,361 |
| ||||||||
Total liabilities |
| 178,415 |
| 122,597 |
|
| 241,004 |
| 178,415 |
| ||||||||
|
|
|
|
|
|
|
|
|
|
| ||||||||
Shareholders’ equity: |
|
|
|
|
|
|
|
|
|
| ||||||||
Common stock, no par value, 200,000,000 shares authorized, of which 42,228,418 and 40,284,513 shares were outstanding as of December 31, 2006 and 2005, respectively |
| 4 |
| 4 |
| |||||||||||||
Treasury stock at cost, 233,332 shares as of December 31, 2006 and 2005 |
| (3,280 | ) | (3,280 | ) | |||||||||||||
Common stock, no par value, 200,000,000 shares authorized, of which 44,843,166 and 42,228,418 shares were outstanding as of December 31, 2007 and 2006, respectively |
| 4 |
| 4 |
| |||||||||||||
Treasury stock at cost, 233,332 shares as of December 31, 2007 and 2006 |
| (3,280 | ) | (3,280 | ) | |||||||||||||
Additional paid-in capital |
| 268,721 |
| 226,593 |
|
| 332,164 |
| 268,721 |
| ||||||||
Retained earnings (accumulated deficit) |
| 1,154 |
| (50,608 | ) | |||||||||||||
Retained earnings |
| 71,757 |
| 1,154 |
| |||||||||||||
Accumulated other comprehensive income: |
|
|
|
|
|
|
|
|
|
| ||||||||
Currency translation adjustment |
| 2,871 |
| 1,130 |
|
| 7,606 |
| 2,871 |
| ||||||||
Unrealized losses on available for sale securities |
| (47 | ) | (125 | ) | |||||||||||||
Unrealized gain (loss) on available-for-sale securities |
| 52 |
| (47 | ) | |||||||||||||
Total accumulated other comprehensive income |
| 2,824 |
| 1,005 |
|
| 7,658 |
| 2,824 |
| ||||||||
Total shareholders’ equity |
| 269,423 |
| 173,714 |
|
| 408,303 |
| 269,423 |
| ||||||||
Total liabilities and shareholders’ equity |
| $ | 447,838 |
| $ | 296,311 |
|
| $ | 649,307 |
| $ | 447,838 |
| ||||
See notes to consolidated financial statements.
6881
Morningstar, Inc. and Subsidiaries
Consolidated Statements of Shareholders’ Equity and Comprehensive Income
|
| Common |
| Common |
|
|
|
|
| Retained |
| Accumulated |
|
|
| ||||||||||
|
| Stock |
| Stock |
|
|
| Additional |
| Earnings |
| Other |
| Total |
| ||||||||||
|
| Shares |
| Par |
| Treasury |
| Paid-In |
| (Accumulated |
| Comprehensive |
| Shareholders’ |
| ||||||||||
(in thousands except share amounts) |
| Outstanding |
| Value |
| Stock |
| Capital |
| Deficit) |
| Income (Loss) |
| Equity |
| ||||||||||
|
|
|
|
|
|
|
|
|
|
|
|
|
|
|
| ||||||||||
Balance at January 1, 2004 |
| 38,395,480 |
| $ | 4 |
| $ | (3,280 | ) | $ | 139,161 |
| $ | (90,534 | ) | $ | (530 | ) | $ | 44,821 |
| ||||
Comprehensive income: |
|
|
|
|
|
|
|
|
|
|
|
|
|
|
| ||||||||||
Net income |
|
|
| — |
| — |
| — |
| 8,809 |
| — |
| 8,809 |
| ||||||||||
Reclassification adjustment for realized gains included in net |
|
|
| — |
| — |
| — |
| — |
| (8 | ) | (8 | ) | ||||||||||
Unrealized loss on investments, net |
|
|
| — |
| — |
| — |
| — |
| (97 | ) | (97 | ) | ||||||||||
Foreign currency translation |
|
|
| — |
| — |
| — |
| — |
| 1,873 |
| 1,873 |
| ||||||||||
Total comprehensive income |
|
|
| — |
| — |
| — |
| 8,809 |
| 1,768 |
| 10,577 |
| ||||||||||
Issuance of common stock related to |
| 51,134 |
| — |
| — |
| 692 |
| — |
| — |
| 692 |
| ||||||||||
Reclassification related to conversion of |
|
|
| — |
| — |
| 531 |
| — |
| — |
| 531 |
| ||||||||||
Stock-based compensation |
|
|
| — |
| — |
| 7,760 |
| — |
| — |
| 7,760 |
| ||||||||||
Balance at December 31, 2004 |
| 38,446,614 |
| 4 |
| (3,280 | ) | 148,144 |
| (81,725 | ) | 1,238 |
| 64,381 |
| ||||||||||
Comprehensive income: |
|
|
|
|
|
|
|
|
|
|
|
|
|
|
| ||||||||||
Net income |
|
|
| — |
| — |
| — |
| 31,117 |
| — |
| 31,117 |
| ||||||||||
Reclassification adjustment for |
|
|
| — |
| — |
| — |
| — |
| (3 | ) | (3 | ) | ||||||||||
Unrealized loss on investments, net |
|
|
| — |
| — |
| — |
| — |
| (20 | ) | (20 | ) | ||||||||||
Foreign currency translation |
|
|
| — |
| — |
| — |
| — |
| (210 | ) | (210 | ) | ||||||||||
Total comprehensive income |
|
|
| — |
| — |
| — |
| 31,117 |
| (233 | ) | 30,884 |
| ||||||||||
Issuance of common stock related to |
| 1,141,875 |
| — |
| — |
| 18,108 |
| — |
| — |
| 18,108 |
| ||||||||||
Issuance of common stock related to |
| 696,024 |
| — |
| — |
| 8,221 |
| — |
| — |
| 8,221 |
| ||||||||||
Reclassification of stock-based compensation liabilities |
|
|
| — |
| — |
| 41,589 |
| — |
| — |
| 41,589 |
| ||||||||||
Stock-based compensation |
|
|
| — |
| — |
| 8,085 |
| — |
| — |
| 8,085 |
| ||||||||||
Tax benefit derived from stock option |
|
|
| — |
| — |
| 2,446 |
| — |
| — |
| 2,446 |
| ||||||||||
Balance at December 31, 2005 |
| 40,284,513 |
| 4 |
| (3,280 | ) | 226,593 |
| (50,608 | ) | 1,005 |
| 173,714 |
| ||||||||||
Comprehensive income: |
|
|
|
|
|
|
|
|
|
|
|
|
|
|
| ||||||||||
Net income |
|
|
| — |
| — |
| — |
| 51,762 |
| — |
| 51,762 |
| ||||||||||
Unrealized gains on investments, net |
|
|
| — |
| — |
| — |
| — |
| 78 |
| 78 |
| ||||||||||
Foreign currency translation |
|
|
| — |
| — |
| — |
| — |
| 1,741 |
| 1,741 |
| ||||||||||
Total comprehensive income |
|
|
| — |
| — |
| — |
| 51,762 |
| 1,819 |
| 53,581 |
| ||||||||||
Issuance of common stock related to |
| 1,943,905 |
| — |
| — |
| 20,249 |
| — |
| — |
| 20,249 |
| ||||||||||
Stock-based compensation |
|
|
| — |
| — |
| 8,575 |
| — |
| — |
| 8,575 |
| ||||||||||
Cumulative effect of accounting change |
|
|
| — |
| — |
| (430 | ) | — |
| — |
| (430 | ) | ||||||||||
Tax benefit derived from stock option |
|
|
| — |
| — |
| 13,734 |
| — |
| — |
| 13,734 |
| ||||||||||
Balance at December 31, 2006 |
| 42,228,418 |
| $ | 4 |
| $ | (3,280 | ) | $ | 268,721 |
| $ | 1,154 |
| $ | 2,824 |
| $ | 269,423 |
| ||||
|
|
|
|
|
|
|
|
|
|
|
| Accumulated |
|
|
| |||||||
|
| Common Stock |
|
|
| Additional |
| Retained |
| Other |
| Total |
| |||||||||
|
| Shares |
| Par |
| Treasury |
| Paid-In |
| Earnings |
| Comprehensive |
| Shareholders’ |
| |||||||
(in thousands except share amounts) |
| Outstanding |
| Value |
| Stock |
| Capital |
| (Deficit) |
| Income (Loss) |
| Equity |
| |||||||
|
|
|
|
|
|
|
|
|
|
|
|
|
|
|
| |||||||
Balance at January 1, 2005 |
| 38,446,614 |
| $ | 4 |
| $ | (3,280 | ) | $ | 148,144 |
| $ | (81,725 | ) | $ | 1,238 |
| $ | 64,381 |
| |
Comprehensive income: |
|
|
|
|
|
|
|
|
|
|
|
|
|
|
| |||||||
Net income |
|
|
| — |
| — |
| — |
| 31,117 |
| — |
| 31,117 |
| |||||||
Reclassification adjustment for realized gains included in net income |
|
|
| — |
| — |
| — |
| — |
| (3 | ) | (3 | ) | |||||||
Unrealized loss on investments, net of tax of $16 |
|
|
| — |
| — |
| — |
| — |
| (20 | ) | (20 | ) | |||||||
Foreign currency translation adjustment |
|
|
| — |
| — |
| — |
| — |
| (210 | ) | (210 | ) | |||||||
Total comprehensive income |
|
|
| — |
| — |
| — |
| 31,117 |
| (233 | ) | 30,884 |
| |||||||
Issuance of common stock related to initial public offering, net of related costs |
| 1,141,875 |
| — |
| — |
| 18,108 |
| — |
| — |
| 18,108 |
| |||||||
Issuance of common stock related to stock option exercises, net |
| 696,024 |
| — |
| — |
| 8,221 |
| — |
| — |
| 8,221 |
| |||||||
Reclassification of stock-based compensation liabilities |
|
|
| — |
| — |
| 41,589 |
| — |
| — |
| 41,589 |
| |||||||
Stock-based compensation |
|
|
| — |
| — |
| 8,085 |
| — |
| — |
| 8,085 |
| |||||||
Tax benefit derived from stock option exercises |
|
|
| — |
| — |
| 2,446 |
| — |
| — |
| 2,446 |
| |||||||
|
|
|
|
|
|
|
|
|
|
|
|
|
|
|
| |||||||
Balance at December 31, 2005 |
| 40,284,513 |
| 4 |
| (3,280 | ) | 226,593 |
| (50,608 | ) | 1,005 |
| 173,714 |
| |||||||
Comprehensive income: |
|
|
|
|
|
|
|
|
|
|
|
|
|
|
| |||||||
Net income |
|
|
| — |
| — |
| — |
| 51,762 |
| — |
| 51,762 |
| |||||||
Unrealized gains on investments, net of income tax of $52 |
|
|
| — |
| — |
| — |
| — |
| 78 |
| 78 |
| |||||||
Foreign currency translation adjustment |
|
|
| — |
| — |
| — |
| — |
| 1,741 |
| 1,741 |
| |||||||
Total comprehensive income |
|
|
| — |
| — |
| — |
| 51,762 |
| 1,819 |
| 53,581 |
| |||||||
Issuance of common stock related to stock option exercises, net |
| 1,943,905 |
| — |
| — |
| 20,249 |
| — |
| — |
| 20,249 |
| |||||||
Stock-based compensation |
|
|
| — |
| — |
| 8,575 |
| — |
| — |
| 8,575 |
| |||||||
Cumulative effect of accounting change related to the adoption of SFAS No. 123(R) |
|
|
| — |
| — |
| (430 | ) | — |
| — |
| (430 | ) | |||||||
Tax benefit derived from stock option exercises |
|
|
| — |
| — |
| 13,734 |
| — |
| — |
| 13,734 |
| |||||||
|
|
|
|
|
|
|
|
|
|
|
|
|
|
|
| |||||||
Balance at December 31, 2006 |
| 42,228,418 |
| 4 |
| (3,280 | ) | 268,721 |
| 1,154 |
| 2,824 |
| 269,423 |
| |||||||
Cumulative effect of accounting change related to the adoption of EITF No. 06-2 |
|
|
| — |
| — |
| — |
| (3,319 | ) | — |
| (3,319 | ) | |||||||
|
|
|
|
|
|
|
|
|
|
|
|
|
|
|
| |||||||
Balance as of January 1, 2007 |
| 42,228,418 |
| 4 |
| (3,280 | ) | 268,721 |
| (2,165 | ) | 2,824 |
| 266,104 |
| |||||||
Comprehensive income: |
|
|
|
|
|
|
|
|
|
|
|
|
|
|
| |||||||
Net income |
|
|
| — |
| — |
| — |
| 73,922 |
| — |
| 73,922 |
| |||||||
Unrealized gains on investments, net of income tax of $67 |
|
|
| — |
| — |
| — |
| — |
| 99 |
| 99 |
| |||||||
Foreign currency translation adjustment |
|
|
| — |
| — |
| — |
| — |
| 4,735 |
| 4,735 |
| |||||||
Total comprehensive income |
|
|
| — |
| — |
| — |
| 73,922 |
| 4,834 |
| 78,756 |
| |||||||
Issuance of common stock related to stock option exercises and vesting of restricted stock units, net |
| 2,614,748 |
| — |
| — |
| 22,037 |
| — |
| — |
| 22,037 |
| |||||||
Stock-based compensation |
|
|
| — |
| — |
| 10,978 |
| — |
| — |
| 10,978 |
| |||||||
Tax benefit derived from stock option exercises and vesting of restricted stock units |
|
|
| — |
| — |
| 30,428 |
| — |
| — |
| 30,428 |
| |||||||
|
|
|
|
|
|
|
|
|
|
|
|
|
|
|
| |||||||
Balance at December 31, 2007 |
| 44,843,166 |
| $ | 4 |
| $ | (3,280 | ) | $ | 332,164 |
| $ | 71,757 |
| $ | 7,658 |
| $ | 408,303 |
| |
See notes to consolidated financial statements.
6982
Morningstar, Inc. and Subsidiaries
Consolidated Statements of Cash Flows
Year ended December 31 (in thousands) |
| 2006 |
| 2005 |
| 2004 |
|
| 2007 |
| 2006 |
| 2005 |
| ||||||||||||||
Operating activities |
|
|
|
|
|
|
|
|
|
|
|
|
|
| ||||||||||||||
Net income |
| $ | 51,762 |
| $ | 31,117 |
| $ | 8,809 |
|
| $ | 73,922 |
| $ | 51,762 |
| $ | 31,117 |
| ||||||||
Adjustments to reconcile net income to net cash flows from operating activities: |
|
|
|
|
|
|
|
|
|
|
|
|
|
| ||||||||||||||
Cumulative effect of accounting change, net of tax |
| (259 | ) | — |
| — |
|
| — |
| (259 | ) | — |
| ||||||||||||||
Depreciation and amortization |
| 14,975 |
| 8,266 |
| 8,225 |
|
| 21,257 |
| 14,975 |
| 8,266 |
| ||||||||||||||
Deferred income taxes |
| (3,856 | ) | 583 |
| 830 |
| |||||||||||||||||||||
Deferred income tax expense (benefit) |
| (1,048 | ) | (3,856 | ) | 583 |
| |||||||||||||||||||||
Stock-based compensation |
| 8,575 |
| 10,895 |
| 16,723 |
|
| 10,978 |
| 8,575 |
| 10,895 |
| ||||||||||||||
Provision for (recovery of) bad debt |
| 159 |
| 223 |
| (55 | ) |
| (54 | ) | 159 |
| 223 |
| ||||||||||||||
Equity in net income of unconsolidated entities |
| (2,787 | ) | (1,662 | ) | (843 | ) |
| (1,694 | ) | (2,787 | ) | (1,662 | ) | ||||||||||||||
Foreign exchange (gain) loss |
| 880 |
| 146 |
| (333 | ) | |||||||||||||||||||||
(Gain) loss on sale of fixed assets |
| 165 |
| 19 |
| (73 | ) | |||||||||||||||||||||
Excess tax benefits from stock option exercises |
| (13,734 | ) | 2,446 |
| — |
| |||||||||||||||||||||
Foreign exchange loss |
| 28 |
| 880 |
| 146 |
| |||||||||||||||||||||
Loss on disposal of fixed assets |
| 151 |
| 165 |
| 19 |
| |||||||||||||||||||||
Excess tax benefits from stock option exercises and vesting of restricted stock units |
| (30,428 | ) | (13,734 | ) | 2,446 |
| |||||||||||||||||||||
Other, net |
| (411 | ) | (269 | ) | (575 | ) |
| (597 | ) | (411 | ) | (269 | ) | ||||||||||||||
Changes in operating assets and liabilities, net of effect of acquisitions: |
|
|
|
|
|
|
|
|
|
|
|
|
|
| ||||||||||||||
Accounts receivable |
| (9,261 | ) | (14,989 | ) | (10,866 | ) |
| (11,723 | ) | (9,261 | ) | (14,989 | ) | ||||||||||||||
Other assets |
| (1,217 | ) | (1,076 | ) | (2,358 | ) |
| (3,536 | ) | (1,217 | ) | (1,076 | ) | ||||||||||||||
Accounts payable and accrued liabilities |
| (563 | ) | 2,167 |
| 2,489 |
|
| 638 |
| (563 | ) | 2,167 |
| ||||||||||||||
Accrued compensation |
| 16,426 |
| 6,997 |
| — |
|
| 23,118 |
| 16,426 |
| 6,997 |
| ||||||||||||||
Deferred revenue |
| 10,967 |
| 7,364 |
| 7,038 |
|
| 8,401 |
| 10,967 |
| 7,364 |
| ||||||||||||||
Income taxes payable |
| 26,696 |
| (2,438 | ) | 3,763 |
|
| 25,229 |
| 26,696 |
| (2,438 | ) | ||||||||||||||
Other liabilities |
| 160 |
| (1,344 | ) | 88 |
|
| (2,274 | ) | 160 |
| (1,344 | ) | ||||||||||||||
Cash provided by operating activities |
| 98,677 |
| 48,445 |
| 32,862 |
|
| 112,368 |
| 98,677 |
| 48,445 |
| ||||||||||||||
|
|
|
|
|
|
|
|
|
|
|
|
|
|
| ||||||||||||||
Investing activities |
|
|
|
|
|
|
|
|
|
|
|
|
|
| ||||||||||||||
Purchases of investments |
| (81,265 | ) | (78,798 | ) | (79,126 | ) |
| (159,693 | ) | (81,265 | ) | (78,798 | ) | ||||||||||||||
Proceeds from sale of investments |
| 74,679 |
| 77,510 |
| 64,180 |
|
| 128,713 |
| 74,679 |
| 77,510 |
| ||||||||||||||
Capital expenditures |
| (4,722 | ) | (7,451 | ) | (7,730 | ) |
| (11,346 | ) | (4,722 | ) | (7,451 | ) | ||||||||||||||
Acquisitions, net of cash acquired |
| (117,331 | ) | (8,192 | ) | (210 | ) |
| (60,508 | ) | (117,331 | ) | (8,192 | ) | ||||||||||||||
Other, net |
| (363 | ) | 18 |
| 136 |
|
| (4 | ) | (363 | ) | 18 |
| ||||||||||||||
Cash used for investing activities |
| (129,002 | ) | (16,913 | ) | (22,750 | ) |
| (102,838 | ) | (129,002 | ) | (16,913 | ) | ||||||||||||||
|
|
|
|
|
|
|
|
|
|
|
|
|
|
| ||||||||||||||
Financing activities |
|
|
|
|
|
|
|
|
|
|
|
|
|
| ||||||||||||||
Proceeds from sale of common stock, primarily stock option exercises |
| 20,249 |
| 7,166 |
| 194 |
|
| 22,037 |
| 20,249 |
| 7,166 |
| ||||||||||||||
Excess tax benefits from stock option exercises |
| 13,734 |
| — |
| — |
| |||||||||||||||||||||
Excess tax benefits from stock option exercises and vesting of restricted stock units |
| 30,428 |
| 13,734 |
| — |
| |||||||||||||||||||||
Proceeds from initial public offering, net |
| — |
| 18,108 |
| — |
|
| — |
| — |
| 18,108 |
| ||||||||||||||
Payments of long-term debt and capital lease obligations |
| — |
| (18 | ) | (6,561 | ) |
| — |
| — |
| (18 | ) | ||||||||||||||
Cash provided by (used for) financing activities |
| 33,983 |
| 25,256 |
| (6,367 | ) | |||||||||||||||||||||
Cash provided by financing activities |
| 52,465 |
| 33,983 |
| 25,256 |
| |||||||||||||||||||||
|
|
|
|
|
|
|
|
|
|
|
|
|
|
| ||||||||||||||
Effect of exchange rate changes on cash and cash equivalents |
| 115 |
| (328 | ) | 317 |
|
| 1,441 |
| 115 |
| (328 | ) | ||||||||||||||
Net increase in cash and cash equivalents |
| 3,773 |
| 56,460 |
| 4,062 |
|
| 63,436 |
| 3,773 |
| 56,460 |
| ||||||||||||||
Cash and cash equivalents — Beginning of year |
| 92,367 |
| 35,907 |
| 31,845 |
|
| 96,140 |
| 92,367 |
| 35,907 |
| ||||||||||||||
Cash and cash equivalents — End of year |
| $ | 96,140 |
| $ | 92,367 |
| $ | 35,907 |
|
| $ | 159,576 |
| $ | 96,140 |
| $ | 92,367 |
| ||||||||
|
|
|
|
|
|
|
|
|
|
|
|
|
|
| ||||||||||||||
Supplemental disclosures of cash flow information |
|
|
|
|
|
|
|
|
|
|
|
|
|
| ||||||||||||||
Cash paid for interest |
| $ | — |
| $ | 29 |
| $ | 90 |
|
| $ | — |
| $ | — |
| $ | 29 |
| ||||||||
Cash paid for income taxes |
| $ | 9,649 |
| $ | 19,527 |
| $ | 6,613 |
|
| $ | 27,795 |
| $ | 9,649 |
| $ | 19,527 |
| ||||||||
|
|
|
|
|
|
|
|
|
|
|
|
|
|
| ||||||||||||||
Supplemental information of non-cash investing and financing activities |
|
|
|
|
|
|
|
|
|
|
|
|
|
| ||||||||||||||
Unrealized gain (loss) on available-for sale-investments |
| $ | 148 |
| $ | (36 | ) | $ | (166 | ) | ||||||||||||||||||
Non-cash consideration related to acquisition |
| $ | — |
| $ | — |
| $ | 69 |
| ||||||||||||||||||
Unrealized gain (loss) on available-for-sale investments |
| $ | 142 |
| $ | 148 |
| $ | (36 | ) | ||||||||||||||||||
See notes to consolidated financial statements.
7083
MORNINGSTAR, INC. AND SUBSIDIARIES
Notes to Consolidated Financial Statements
1. Description of Business
Morningstar, Inc. and its subsidiaries (Morningstar, we, our), is a provider of independent investment research in the United States and in major international markets. We offer an extensive line of Internet, software, and print-based products for individual investors, financial advisors, and institutional clients and provide data on investment offerings worldwide. We also offer asset management services for advisors, institutions, and retirement plan participants.
2. Summary of Significant Accounting Policies
Principles of Consolidation. The accompanying consolidated financial statements include the accounts of Morningstar, Inc. and our wholly and majority-owned subsidiaries. The assets, liabilities, and results of operations of subsidiaries in which we have a controlling interest have been consolidated. We account for investments in entities in which we exercise significant influence, but do not control, using the equity method. All significant intercompany accounts and transactions have been eliminated.
Use of Estimates. The preparation of financial statements in conformity with accounting principles generally accepted in the United States requires us to make estimates and assumptions that affect the reported amounts of assets, liabilities, revenues, and expenses during the reporting period. Actual results may differ from these estimates.
Reclassifications.In 2006, we changed our segment reporting by allocating stock-based compensation expense to each of our three business segments. Before 2006, stock-based compensation expense was recorded as a corporate item. We believe this change gives our chief operating decision maker a more complete picture of the profitability of each business segment. We have reclassified the 2005 and 2004 financial results for each segment to reflect this change.
Certain other amounts reported in 2005 and 20042006 have been reclassified to conform to the 20062007 presentation.
Cash and Cash Equivalents. Cash and cash equivalents consist of cash and investments with original maturities of three months or less. We state them at cost, which approximates fair market value.
Investments. We classify certain investments, consisting of certificates of deposit, as held-to-maturity securities, based on our intent and ability to hold these securities to maturity. We record held-to-maturity investments at amortized cost on thein our Consolidated Balance Sheets. We classify certain other investments, consisting primarily of equity securities, as trading securities, based on our intent to hold the securities for a short period of time and generate profits on short-term differences in price, as well as to satisfy the requirements of one of our wholly-ownedwholly owned subsidiaries, which is a registered broker-dealer. We include realized and unrealized gains and losses associated with these investments in “Other income (expense), net” in the Consolidated Statements of Income. We classify investmentsInvestments not classifiedconsidered as held-to-maturity or trading securities whichare classified as available-for-sale securities. Available-for-sale securities primarily consist of fixed-income securities, as available-for-sale securities. We report unrealized gains and losses for available-for-sale securities as other comprehensive income (loss), net of related income taxes. We record both trading and available-for-sale securities at their fair value on thein our Consolidated Balance Sheets.
Concentration of Credit Risk. No single customer is large enough to pose a significant credit risk to our operations or financial condition. For the years ended December 31, 2007, 2006, 2005, and 2004,2005, no single customer represented 10% or more of our consolidated revenue. If receivables from our customers become delinquent, we begin a collections process. We maintain an allowance for doubtful accounts based on our estimate of the probable losses of accounts receivable.
Property, Equipment, and Depreciation. We state property and equipment at historical cost, net of accumulated depreciation. We depreciate property and equipment primarily using the straight-line method based on the useful life of the asset, which ranges from three to seven years. We amortize leasehold improvements over the remaining lease term or their useful lives, whichever is shorter.
84
Computer Software and Internal Product Development Costs. We capitalize certain costs in accordance with American Institute of Certified Public Accountants Statement of Position No. 98-1, Accounting for the Costs of Computer Software Developed or Obtained for Internal Use, Statement of Financial Accounting Standards (SFAS) No. 86, Accounting for the Costs of Computer Software to be Sold, Leased, or Otherwise Marketed, and Emerging Issues Task Force (EITF) 00-2, Accounting for Web Site Development Costs. Internal product development costs mainly consist of personnel costs relating to the development of new Web-based products and certain major enhancements of existing products. We amortize these costs on a straight-line basis over the estimated economic life, which is generally three years.
Goodwill. During the years ended December 31, 2007, 2006, 2005, and 2004,2005, changes in the carrying amount of our recorded goodwill were primarily the result of business acquisitions. In accordance with SFAS No. 142, Goodwill and Other Intangible Assets, goodwill is not amortized; instead, goodwill is subject to at least an annual test for impairment, or whenever indicators of impairment exist. An impairment would occur if the carrying amount of a reporting unit exceeded the fair value of that reporting unit. Our reporting units are components of our reportable segments. We performed annual impairment reviews in the fourth quarter of 2007, 2006, 2005, and 20042005 and did not record any impairment losses in these years.
71
Intangible Assets. We amortize intangible assets using the straight-line method over their estimated economic useful lives, which range from threetwo to 2025 years. In accordance with SFAS No. 144, Accounting for the Impairment or Disposal of Long-Lived Assets, we review intangible assets for impairment whenever events or changes in circumstances indicate that the carrying value may not be recoverable. If the value of future undiscounted cash flows is less than the carrying amount of an asset, we record an impairment loss based on the excess of the carrying amount over the fair value of the asset. No impairment losses were recorded in 2007, 2006, 2005, or 2004.2005.
Revenue Recognition. We recognizeearn revenue from subscription sales, including print publications, CD-ROMby selling a variety of investment-related products and services. We sell many of our offerings, such as our newsletters, Principia software, Morningstar.comand Premium service on Morningstar.com, via subscriptions. These subscriptions are mainly offered for a one-year term, although we also offer terms ranging from one month to three years. We also sell advertising on our Web sites throughout the world.
Several of our other products are sold through license agreements, including Morningstar Advisor Workstation, Morningstar Equity Research, Morningstar Direct, Morningstar EnCorr, Retirement Advice, and Licensed Data. Our license agreements typically range from one to three years.
For some of our other subscription products, in equal installments overinstitutional services, mainly Investment Consulting, we generally base our fees on the termscope of work and the subscription, generally one year. level of service we provide and earn fees as a percentage of assets under management. We also earn fees relating to Morningstar Managed Portfolios and the managed retirement accounts offered through Morningstar Retirement Manager and Advice by Ibbotson as a percentage of assets under management.
Deferred revenue represents the portion of subscriptions billed or collected in advance which we expect to recognize in future periods.
We follow the standards established in Staff Accounting Bulletin (SAB) No. 101, Revenue Recognition in Financial Statements, as amended by SAB No. 104, Revenue Recognition; EITF No. 00-21, Revenue Arrangements with Multiple Deliverables; and Statement of Position (SOP) 97-2, Software Revenue Recognition, as amended by SOP 98-9, Modification of SOP 97-2, Software Revenue Recognition, With Respect to Certain Transactions.
We recognize revenue from subscription sales in equal installments over the term of the subscription. Revenue from consulting, retirement advice, and other non-subscription products and services is recognized when the product or service is delivered or, when applicable, over the service obligation period defined by the terms of the contract. We recognize asset-based fees once the fees are fixed and determinable assuming all other revenue recognition criteria are met. For contracts that combine multiple products and services, we assign the fair value of each element in the arrangement based on selling prices of the items when sold separately. Delivery of our products and services is a prerequisite to the recognition of revenue. If arrangements include an acceptance provision, we recognize revenue upon the receipt of written customer acceptance.
EITF Issue No. 06-2, How Taxes Collected from Customers and Remitted to Governmental Authorities Should be Presented in the Income Statement, allows companies the option to report
85
We record taxes imposed on revenue-producing transactions (such as sales, use, value added, and some excise taxes) on either a gross basis (included in revenues and costs) or a net basis (excluded from revenues). Morningstar records such taxes on a net basis; therefore, theysuch taxes are excluded from revenue in our Consolidated Statements of Income.
Advertising Costs. Advertising costs include expenses incurred for various print and Internet ads, search engine fees, and direct mail campaigns. We expense advertising costs as incurred. Advertising expense for the years ended December 31, 2007, 2006, and 2005 totaled $8,987,000, $6,450,000, and 2004 totaled $6,450,000, $5,862,000, and $6,180,000, respectively.
Stock-Based Compensation Expense. Effective January 1, 2006, we adopted SFAS No. 123 (Revised 2004), Share-Based Payment (SFAS No. 123(R)), using the modified prospective transition method. Under this method, the provisions of SFAS No. 123(R) apply to all awards granted after the date of adoption and to any unrecognized expense of awards unvested at the date of adoption based on the fair value as of the date of grant. Prior to this date, we accounted for our stock options in accordance with the fair value provisions of SFAS No. 123, Stock-Based Compensation. Under SFAS No. 123, we accounted for forfeitures of stock options as they occurred. SFAS No. 123(R) requires us to estimate expected forfeitures at the grant date and recognize compensation cost only for those awards expected to vest. Accordingly, in the first quarter of 2006, we recorded a cumulative effect of accounting change, net of tax, of $259,000 to reverse the impact of stock-based compensation expense recorded in prior years related to outstanding stock options that we estimate will not vest. Because we previously recognized stock-based compensation expense in accordance with SFAS No. 123, the adoption of SFAS No. 123(R) did not have any other impact on our financial position or results of operations.
Prior to our adoption of SFAS No. 123(R), we classified tax benefits arising from the exercise of stock options as operating cash flows. SFAS No. 123(R) requires that we classify the cash flows resulting from the tax benefit that arises when the tax deductions exceeddeduction exceeds the compensation cost recognized for those options and restricted stock units (excess tax benefits) as financing cash flows. These excess tax benefits were $30,428,000 in 2007 and $13,734,000 in 20062006.
Liability for Sabbatical Leave. In certain of our operations, we offer employees a sabbatical leave. Although the sabbatical policy varies by region, in general, Morningstar’s full-time employees are eligible for six weeks of paid time off after four years of continuous service. On January 1, 2007, we adopted EITF No. 06-2, Accounting for Sabbatical Leave and $2,446,000Other Similar Benefits Pursuant to FASB Statement No. 43, “Accounting for Compensated Absences”, which requires that we record a liability for employees’ sabbatical benefits over the period employees earn the right for sabbatical leave. Accordingly, on January 1, 2007, we recorded a cumulative-effect adjustment to retained earnings of $3,319,000, net of tax, to reflect the portion of employee sabbatical leave that had been earned at that date. Besides recording this cumulative effect of an accounting change, the adoption of EITF No. 06-2 did not have a significant impact on our financial position, results of operations, or cash flows.
Income Taxes. We record deferred income taxes for the temporary differences between the carrying amount of assets and liabilities for financial statement purposes and the amounts used for income tax purposes in 2005; there were no excessaccordance with SFAS No. 109, Accounting for Income Taxes.
On January 1, 2007, we adopted Financial Accounting Standard Board (FASB) Interpretation No. 48, Accounting for Uncertainty in Income Taxes, an interpretation of FASB Statement No. 109 (FIN 48), which prescribes the minimum recognition threshold a tax position is required to meet before being recognized in the financial statements. FIN 48 also provides guidance on derecognition, measurement, classification, interest and penalties, accounting in interim periods, and disclosure for uncertain tax positions.
The adoption of FIN 48 did not result in a material adjustment in the liability for unrecognized tax benefits, recordedand as a result, we did not record a cumulative effect adjustment to retained earnings as of January 1, 2007. As of January 1, 2007, we had approximately $2,691,000 of gross unrecognized tax benefits, of which $2,291,000, if recognized, would result in 2004.a reduction of our effective income tax expense rate.
86
We recognize interest and penalties related to unrecognized tax benefits as a component of income tax expense in our Consolidated Statements of Income. Interest and penalties were not material as of the date of adoption.
Liabilities related to unrecognized tax benefits are classified as a current liability to the extent that we expect to make a payment within a year. Liabilities expected to be resolved without a payment or which are not expected to be paid within a year are included as “Other long term liabilities” in our Consolidated Balance Sheet as of December 31, 2007.
Income per Share. We compute and present income per share in accordance with SFAS No. 128, Earnings per Share. The difference between weighted average shares outstanding and diluted shares outstanding reflects the dilutive effect of employee stock options in all periods presented, and beginning in 2006, the dilutive effect of restricted stock units.
Income Taxes. We record deferred income taxes for the temporary differences between the carrying amount of assets and liabilities for financial statement purposes and the amounts used for income tax purposes in accordance with SFAS No. 109, Accounting for Income Taxes.
Foreign Currency. We translate the financial statements of non-U.S. subsidiaries to U.S. dollars using the period-end exchange rate for assets and liabilities and an average exchange rate for revenue and expenses. We use the local currency as the functional currency for all of our non-U.S. subsidiaries. We record translation adjustments for non-U.S. subsidiaries as a component of “Accumulated other comprehensive income (loss)” in theour Consolidated Statements of Shareholders’ Equity and Comprehensive Income. We include exchange gains and losses arising from transactions denominated in currencies other than the functional currency in “Other income (expense), net” in theour Consolidated Statements of Income.
3. Initial Public Offering
In May 2005, we completed our initial public offering of 7,612,500 shares of our common stock. These shares began trading on May 3, 2005 on the Nasdaq National Market under the symbol “MORN” and now trade on the Nasdaq Global Select Market. All of these shares were sold by affiliates of SOFTBANK Finance Corporation, a wholly owned subsidiary of SOFTBANK Corp. We did not receive any proceeds from the sale of these shares. In addition, we granted the underwriters the right to purchase up to an additional 1,141,875 shares at the initial public offering price to cover over-allotments. In May 2005, the underwriters exercised their over-allotment option in full. We received net proceeds of $18,108,000 based on our initial public offering price of $18.50 per share, after deducting the underwriting discounts and commissions and $2,594,000 of offering expenses.
72
4. Income Per Share
The numerator for both basic and diluted income per share is net income. The denominator for basic income per share is the weighted average number of common shares outstanding during the period. The dilutive effect of outstanding employee stock options and restricted stock units is reflected in the denominator for diluted income per share using the treasury stock method.
87
The following table reconciles our net income and the number of shares used in computing basic and diluted income per share:
(in thousands, except per share amounts) |
| 2006 |
| 2005 |
| 2004 |
|
| 2007 |
| 2006 |
| 2005 |
| |||||||||||||||
Basic income per share: |
|
|
|
|
|
|
|
|
|
|
|
|
|
| |||||||||||||||
Income before cumulative effect of accounting change |
| $ | 51,503 |
| $ | 31,117 |
| $ | 8,809 |
|
| $ | 73,922 |
| $ | 51,503 |
| $ | 31,117 |
| |||||||||
Cumulative effect of accounting change, net of tax |
| 259 |
| — |
| — |
|
| — |
| 259 |
| — |
| |||||||||||||||
Net income |
| $ | 51,762 |
| $ | 31,117 |
| $ | 8,809 |
|
| $ | 73,922 |
| $ | 51,762 |
| $ | 31,117 |
| |||||||||
Weighted average common shares outstanding |
| 41,176 |
| 39,392 |
| 38,418 |
|
| 43,216 |
| 41,176 |
| 39,392 |
| |||||||||||||||
|
|
|
|
|
|
|
|
|
|
|
|
|
|
| |||||||||||||||
Basic income per share before cumulative effect of accounting change |
| $ | 1.25 |
| $ | 0.79 |
| $ | 0.23 |
|
| $ | 1.71 |
| $ | 1.25 |
| $ | 0.79 |
| |||||||||
Cumulative per share effect of accounting change, net of tax |
| 0.01 |
| — |
| — |
| ||||||||||||||||||||||
Cumulative per share effect of accounting change |
| — |
| 0.01 |
| — |
| ||||||||||||||||||||||
Basic net income per share |
| $ | 1.26 |
| $ | 0.79 |
| $ | 0.23 |
|
| $ | 1.71 |
| $ | 1.26 |
| $ | 0.79 |
| |||||||||
|
|
|
|
|
|
|
|
|
|
|
|
|
|
| |||||||||||||||
Diluted income per share: |
|
|
|
|
|
|
|
|
|
|
|
|
|
| |||||||||||||||
Income before cumulative effect of accounting change |
| $ | 51,503 |
| $ | 31,117 |
| $ | 8,809 |
|
| $ | 73,922 |
| $ | 51,503 |
| $ | 31,117 |
| |||||||||
Cumulative effect of accounting change, net of tax |
| 259 |
| — |
| — |
| ||||||||||||||||||||||
Cumulative effect of accounting change |
| — |
| 259 |
| — |
| ||||||||||||||||||||||
Net income |
| $ | 51,762 |
| $ | 31,117 |
| $ | 8,809 |
|
| $ | 73,922 |
| $ | 51,762 |
| $ | 31,117 |
| |||||||||
|
|
|
|
|
|
|
|
|
|
|
|
|
|
| |||||||||||||||
Weighted average common shares outstanding |
| 41,176 |
| 39,392 |
| 38,418 |
|
| 43,216 |
| 41,176 |
| 39,392 |
| |||||||||||||||
Net effect of dilutive stock options and restricted stock units |
| 5,547 |
| 5,067 |
| 3,440 |
|
| 4,949 |
| 5,547 |
| 5,067 |
| |||||||||||||||
Weighted average common shares outstanding for computing diluted |
| 46,723 |
| 44,459 |
| 41,858 |
|
| 48,165 |
| 46,723 |
| 44,459 |
| |||||||||||||||
|
|
|
|
|
|
|
|
|
|
|
|
|
|
| |||||||||||||||
Diluted income per share before cumulative effect of accounting change |
| $ | 1.10 |
| $ | 0.70 |
| $ | 0.21 |
|
| $ | 1.53 |
| $ | 1.10 |
| $ | 0.70 |
| |||||||||
Cumulative per share effect of accounting change, net of tax |
| 0.01 |
| — |
| — |
| ||||||||||||||||||||||
Cumulative per share effect of accounting change |
| — |
| 0.01 |
| — |
| ||||||||||||||||||||||
Diluted net income per share |
| $ | 1.11 |
| $ | 0.70 |
| $ | 0.21 |
|
| $ | 1.53 |
| $ | 1.11 |
| $ | 0.70 |
| |||||||||
|
|
|
|
|
|
| |||||||||||||||||||||||
88
5. Segment and Geographical Area Information
We organize our operations based on products and services sold in three primary business segments: Individual, Advisor, and Institutional.
•·Individual segment. Our Individual segment focuses on products and services for individual investors. The largest product in this segment based on revenue is our U.S.-based Web site, Morningstar.com, which includes ourboth paid Premium Membership service and sales of Internet advertising space. Our Individual segment also includes Morningstar Equity Research, which we distribute through several channels. Investors can access our equity research through our Premium Membership offering on Morningstar.com. In addition, ourOur equity research is distributed through six major investment banks to meet the requirementrequirements for independent research under the Global Analyst Research Settlement, as well as to several other companies whothat purchase our research for their own use or provide our research to their affiliated financial advisors or to individual investors. In addition, investors can access our equity research through our Premium Membership offering on Morningstar.com. We also offer a variety of print publications on stocks and mutual funds,about investing, including our monthly newsletters, Morningstar FundInvestor and Morningstar StockInvestor, and our twice-monthly publication, Morningstar Mutual Funds. We sell several annual reference guides, including the Morningstar Funds 500, the Morningstar Stocks 500, the Morningstar ETFs 150, and the Stocks, Bonds, Bills, and Inflation Yearbook. With the addition of Aspect Huntley in July 2006, thisThis segment also includes several newsletters and other publications for Australian investors. With the addition of Aspect Huntley, our Individual segment now includes revenue from both U.S. and non-U.S. operations.investors in Australia.
•· Advisor segment. Our Advisor segment focuses on products and services for financial advisors. Key products in this segment based on revenue are Morningstar Advisor Workstation and Morningstar Principia. Advisor Workstation is a Web-based investment planning system that provides financial advisors with a comprehensive set of tools for conducting their core business, including investment research, planning, and presentations. Advisor Workstation is available in two editions: the Office Edition for independent financial advisors and the Enterprise Edition for financial advisors affiliated with larger firms. Principia is our CD-ROM-based investment research and planning software for financial advisors. In addition, we offer Morningstar Managed Portfolios, a fee-based discretionary asset management service that includes a series of mutual fund, and exchange-traded fund, and stock portfolios tailored to differentmeet a range of investment time horizons and risk levels that financial advisors can use for their clients’ taxable and tax-deferred accounts. Following our acquisition of Ibbotson in March 2006, we offer a series of NASD-reviewed Financial Communications materials that advisors can use to educate clients about asset allocation and demonstrate other key investment concepts, as well as data and graphs that financial advisors can license to use in published materials. Following our acquisition of Aspect Huntley, this segment also includes software that we sell to financial planners and other market participants in Australia.
73
•· Institutional segment. Our Institutional segment focuses on products and services for institutions, including banks, insurance companies, mutual fund companies, brokerage firms, media firms, and retirement plan providers and sponsors. Key products and services in this segment based on revenue are Investment Consulting, which focuses on investment monitoring and asset allocation for funds of funds, including mutual funds and variable annuities; Licensed Data, a set of investment data spanning 10ten core databases, available through electronic data feeds; Retirement Advice, including the Morningstar Retirement Manager and Advice by Ibbotson platforms; Morningstar Direct, a Web-based institutional research platform that provides advanced research and tools on the complete range of securities in Morningstar’s global database; the institutional Workstation product acquired from Standard & Poor’s; Licensed Tools and Content, a set of online tools and editorial content designed for institutions to use in their Web sites and software; Investment Profiles & Guides, which are designed for institutions to use in communicating investment information to individual investors; the Morningstar Annuity Research Center (formerly VARDS Online); and Morningstar EnCorr, an asset allocation software package (acquired with Ibbotson). With the addition of Aspect Huntley, this segment now includes financial information as well as other data feeds on Australian stocks which we sell to stock brokers, information providers, and financial Web sites. The Institutional segment also includes the hedge fund and separate account database division we acquired from InvestorForce in August 2006.package.
We measure the operating results of these segments based on operating income (loss), including an allocation of corporate costs. We include intersegment revenue and expenses in segment information. We sell services and products between segments at predetermined rates primarily based on cost. The recovery of intersegment cost is shown as “Intersegment revenue.”
In the first quarter of 2006, we changed our segment reporting by allocating stock-based compensation expense to each of our three business segments; before 2006, stock-based compensation expense was recorded as a corporate item. We believe this change gives our chief operating decision maker a more complete picture of the profitability of each business segment. The 2005 and 2004 financial results for each segment have been reclassified to reflect this change.
Our segment accounting policies are the same as those described in Note 2, except for the capitalization and amortization of internal product development costs and amortization of intangible assets. We exclude these items from our operating segment results to provide our chief operating decision maker with a better indication of each segment’s ability to generate cash flow. This information is one of the criteria used by our chief operating decision maker in determining how to allocate resources to each segment. We include the capitalization and amortization of internal product development costs, the amortization of intangible assets, and the elimination of intersegment revenue and expense in the Corporate Items and Eliminations category to arrive at the consolidated financial information. Our segment disclosures include the business segment information provided to our chief operating decision maker on a recurring basis, and, therefore, we do not present balance sheet information, including goodwill or other intangibles, by segment.
89
The following tables show selected segment data for the years ended December 31, 2007, 2006, 2005, and 2004:2005:
2007 Segment Data
($000) |
| Individual |
| Advisor |
| Institutional |
| Corporate Items |
| Total |
| ||||||
Revenue: |
|
|
|
|
|
|
|
|
|
|
| ||||||
External customers |
| $ | 92,902 |
| $ | 115,508 |
| $ | 226,697 |
| $ | — |
| $ | 435,107 |
| |
Intersegment |
| 4,397 |
| 231 |
| 3,632 |
| (8,260 | ) | — |
| ||||||
Total revenue |
| 97,299 |
| 115,739 |
| 230,329 |
| (8,260 | ) | 435,107 |
| ||||||
Operating expense, excluding depreciation and amortization |
| 69,847 |
| 78,815 |
| 145,081 |
| (8,125 | ) | 285,618 |
| ||||||
Stock-based compensation |
| 2,167 |
| 3,349 |
| 5,462 |
| — |
| 10,978 |
| ||||||
Depreciation and amortization |
| 1,547 |
| 1,906 |
| 3,130 |
| 14,674 |
| 21,257 |
| ||||||
Operating income (loss) |
| $ | 23,738 |
| $ | 31,669 |
| $ | 76,656 |
| $ | (14,809 | ) | $ | 117,254 |
| |
|
|
|
|
|
|
|
|
|
|
|
| ||||||
Capital expenditures |
| $ | 704 |
| $ | 2,806 |
| $ | 4,041 |
| $ | 3,795 |
| $ | 11,346 |
| |
|
|
|
|
|
|
|
|
|
|
|
| ||||||
U.S. revenue |
|
|
|
|
|
|
|
|
|
| $ | 345,427 |
| ||||
Non-U.S. revenue |
|
|
|
|
|
|
|
|
|
| $ | 89,680 |
| ||||
|
| As of Dec. 31 |
| |
U.S. long-lived assets |
| $ | 9,560 |
|
Non-U.S. long-lived assets |
| $ | 9,548 |
|
2006 Segment Data
($000) |
| Individual |
| Advisor |
| Institutional |
| Corporate Items |
| Total |
|
| Individual |
| Advisor |
| Institutional |
| Corporate Items |
| Total |
| |||||||||||||||||||
Revenue: |
|
|
|
|
|
|
|
|
|
|
|
|
|
|
|
|
|
|
|
|
|
| |||||||||||||||||||
External customers |
| $ | 77,171 |
| $ | 94,635 |
| $ | 143,369 |
| $ | — |
| $ | 315,175 |
|
| $ | 77,171 |
| $ | 94,635 |
| $ | 143,369 |
| $ | — |
| $ | 315,175 |
| |||||||||
Intersegment |
| 3,535 |
| 59 |
| 2,716 |
| (6,310 | ) | — |
|
| 3,535 |
| 59 |
| 2,716 |
| (6,310 | ) | — |
| |||||||||||||||||||
Total revenue |
| 80,706 |
| 94,694 |
| 146,085 |
| (6,310 | ) | 315,175 |
|
| 80,706 |
| 94,694 |
| 146,085 |
| (6,310 | ) | 315,175 |
| |||||||||||||||||||
Operating expense, excluding |
| 54,254 |
| 63,620 |
| 102,831 |
| (6,607 | ) | 214,098 |
|
| 54,254 |
| 63,620 |
| 102,831 |
| (6,607 | ) | 214,098 |
| |||||||||||||||||||
Stock-based compensation |
| 2,306 |
| 2,645 |
| 3,624 |
| — |
| 8,575 |
|
| 2,306 |
| 2,645 |
| 3,624 |
| — |
| 8,575 |
| |||||||||||||||||||
Depreciation and amortization |
| 1,225 |
| 1,695 |
| 2,386 |
| 9,669 |
| 14,975 |
|
| 1,225 |
| 1,695 |
| 2,386 |
| 9,669 |
| 14,975 |
| |||||||||||||||||||
Operating income (loss) |
| $ | 22,921 |
| $ | 26,734 |
| $ | 37,244 |
| $ | (9,372 | ) | $ | 77,527 |
|
| $ | 22,921 |
| $ | 26,734 |
| $ | 37,244 |
| $ | (9,372 | ) | $ | 77,527 |
| |||||||||
|
|
|
|
|
|
|
|
|
|
|
|
|
|
|
|
|
|
|
|
|
|
| |||||||||||||||||||
Capital expenditures |
| $ | 313 |
| $ | 453 |
| $ | 1,255 |
| $ | 2,701 |
| $ | 4,722 |
|
| $ | 313 |
| $ | 453 |
| $ | 1,255 |
| $ | 2,701 |
| $ | 4,722 |
| |||||||||
|
|
|
|
|
|
|
|
|
|
|
|
|
|
|
|
|
|
|
|
|
|
| |||||||||||||||||||
U.S. revenue |
|
|
|
|
|
|
|
|
| $ | 270,899 |
|
|
|
|
|
|
|
|
|
| $ | 270,899 |
| |||||||||||||||||
Non-U.S. revenue |
|
|
|
|
|
|
|
|
| $ | 44,276 |
|
|
|
|
|
|
|
|
|
| $ | 44,276 |
| |||||||||||||||||
|
| As of Dec. 31 |
| |
U.S. long-lived assets |
| $ | 11,777 |
|
Non-U.S. long-lived assets |
| $ | 4,092 |
|
74
90
2005 Segment Data
($000) |
| Individual |
| Advisor |
| Institutional |
| Corporate Items |
| Total |
|
| Individual |
| Advisor |
| Institutional |
| Corporate Items |
| Total |
| ||||||||||||||||
Revenue: |
|
|
|
|
|
|
|
|
|
|
|
|
|
|
|
|
|
|
|
|
|
| ||||||||||||||||
External customers |
| $ | 60,643 |
| $ | 72,683 |
| $ | 93,788 |
| $ | — |
| $ | 227,114 |
|
| $ | 60,643 |
| $ | 72,683 |
| $ | 93,788 |
| $ | — |
| $ | 227,114 |
| ||||||
Intersegment |
| 2,805 |
| 6 |
| 2,159 |
| (4,970 | ) | — |
|
| 2,805 |
| 6 |
| 2,159 |
| (4,970 | ) | — |
| ||||||||||||||||
Total revenue |
| 63,448 |
| 72,689 |
| 95,947 |
| (4,970 | ) | 227,114 |
|
| 63,448 |
| 72,689 |
| 95,947 |
| (4,970 | ) | 227,114 |
| ||||||||||||||||
Operating expense, excluding |
| 43,903 |
| 53,290 |
| 69,140 |
| (4,860 | ) | 161,473 |
|
| 43,903 |
| 53,290 |
| 69,140 |
| (4,860 | ) | 161,473 |
| ||||||||||||||||
Stock-based compensation |
| 3,368 |
| 3,275 |
| 4,252 |
| — |
| 10,895 |
|
| 3,368 |
| 3,275 |
| 4,252 |
| — |
| 10,895 |
| ||||||||||||||||
Depreciation and amortization |
| 1,172 |
| 1,507 |
| 2,011 |
| 3,576 |
| 8,266 |
|
| 1,172 |
| 1,507 |
| 2,011 |
| 3,576 |
| 8,266 |
| ||||||||||||||||
Operating income (loss) |
| $ | 15,005 |
| $ | 14,617 |
| $ | 20,544 |
| $ | (3,686 | ) | $ | 46,480 |
|
| $ | 15,005 |
| $ | 14,617 |
| $ | 20,544 |
| $ | (3,686 | ) | $ | 46,480 |
| ||||||
|
|
|
|
|
|
|
|
|
|
|
|
|
|
|
|
|
|
|
|
|
|
| ||||||||||||||||
Capital expenditures |
| $ | 305 |
| $ | 709 |
| $ | 1,939 |
| $ | 4,498 |
| $ | 7,451 |
|
| $ | 305 |
| $ | 709 |
| $ | 1,939 |
| $ | 4,498 |
| $ | 7,451 |
| ||||||
|
|
|
|
|
|
|
|
|
|
|
|
|
|
|
|
|
|
|
|
|
|
| ||||||||||||||||
U.S. revenue |
|
|
|
|
|
|
|
|
| $ | 197,672 |
|
|
|
|
|
|
|
|
|
| $ | 197,672 |
| ||||||||||||||
Non-U.S. revenue |
|
|
|
|
|
|
|
|
| $ | 29,442 |
|
|
|
|
|
|
|
|
|
| $ | 29,442 |
| ||||||||||||||
|
| As of Dec. 31 |
| |
U.S. long-lived assets |
| $ | 13,894 |
|
Non-U.S. long-lived assets |
| $ | 3,461 |
|
2004 Segment Data
($000) |
| Individual |
| Advisor |
| Institutional |
| Corporate Items |
| Total |
| ||||||||||||
Revenue: |
|
|
|
|
|
|
|
|
|
|
| ||||||||||||
External customers |
| $ | 44,478 |
| $ | 59,326 |
| $ | 75,854 |
| $ | — |
| $ | 179,658 |
| |||||||
Intersegment |
| 2,518 |
| 1,554 |
| 2,548 |
| (6,620 | ) | — |
| ||||||||||||
Total revenue |
| 46,996 |
| 60,880 |
| 78,402 |
| (6,620 | ) | 179,658 |
| ||||||||||||
Operating expense, excluding stock- |
| 38,130 |
| 45,311 |
| 62,496 |
| (8,962 | ) | 136,975 |
| ||||||||||||
Stock-based compensation |
| 5,222 |
| 4,967 |
| 6,534 |
| — |
| 16,723 |
| ||||||||||||
Depreciation and amortization |
| 1,041 |
| 1,603 |
| 2,239 |
| 3,342 |
| 8,225 |
| ||||||||||||
Operating income (loss) |
| $ | 2,603 |
| $ | 8,999 |
| $ | 7,133 |
| $ | (1,000 | ) | $ | 17,735 |
| |||||||
|
|
|
|
|
|
|
|
|
|
|
| ||||||||||||
Capital expenditures |
| $ | 100 |
| $ | 622 |
| $ | 722 |
| $ | 6,286 |
| $ | 7,730 |
| |||||||
|
|
|
|
|
|
|
|
|
|
|
| ||||||||||||
U.S. revenue |
|
|
|
|
|
|
|
|
| $ | 154,248 |
| |||||||||||
Non-U.S. revenue |
|
|
|
|
|
|
|
|
| $ | 25,410 |
| |||||||||||
|
|
|
|
|
|
|
|
|
|
|
| ||||||||||||
|
|
|
|
|
|
|
|
|
| As of Dec. 31 |
| ||||||||||||
U.S. long-lived assets |
|
|
|
|
|
|
|
|
| $ | 16,016 |
| |||||||||||
Non-U.S. long-lived assets |
|
|
|
|
|
|
|
|
| $ | 1,505 |
| |||||||||||
|
|
|
|
|
|
|
|
|
|
|
| ||||||||||||
6. Investments
We classify our investment portfolio, which is primarily invested in fixed-income securities, as follows:
|
| December 31 |
| ||||||||||||
($000) |
| Dec. 31, 2006 |
| Dec. 31, 2005 |
|
| 2007 |
| 2006 |
| |||||
Available-for-sale |
| $ | 63,122 |
| $ | 58,761 |
|
| $ | 91,546 |
| $ | 63,122 |
| |
Held-to-maturity |
| 2,339 |
| 420 |
|
| 3,428 |
| 2,339 |
| |||||
Trading securities |
| 2,150 |
| 1,642 |
|
| 4,038 |
| 2,150 |
| |||||
Total |
| $ | 67,611 |
| $ | 60,823 |
|
| $ | 99,012 |
| $ | 67,611 |
| |
75
91
The following table shows the cost, unrealized gains (losses), and fair values related to investments classified as available-for-sale and held-to-maturity:
|
| Dec. 31, 2006 |
| Dec. 31, 2005 |
|
| Dec. 31, 2007 |
| Dec. 31, 2006 |
| |||||||||||||||||||||||||||||||||||||||||||||||||||||
($000) |
| Cost |
| Unrealized |
| Unrealized |
| Fair |
| Cost |
| Unrealized |
| Unrealized |
| Fair |
|
| Cost |
| Unrealized |
| Unrealized |
| Fair |
| Cost |
| Unrealized |
| Unrealized |
| Fair |
| |||||||||||||||||||||||||||||
Available-for-sale: |
|
|
|
|
|
|
|
|
|
|
|
|
|
|
|
|
|
|
|
|
|
|
|
|
|
|
|
|
|
|
|
|
|
| |||||||||||||||||||||||||||||
Auction-rate securities |
| $ | — |
| $ | — |
| $ | — |
| $ | — |
| $ | 16,298 |
| $ | — |
| $ | — |
| $ | 16,298 |
| ||||||||||||||||||||||||||||||||||||||
Corporate bonds |
| 31,006 |
| 10 |
| (9 | ) | 31,007 |
| 18,420 |
| 2 |
| (57 | ) | 18,365 |
|
| $ | 13,855 |
| $ | 1 |
| $ | (56 | ) | $ | 13,800 |
| $ | 31,006 |
| $ | 10 |
| $ | (9 | ) | $ | 31,007 |
| |||||||||||||||||||||
Government obligations |
| 31,587 |
| 4 |
| (59 | ) | 31,532 |
| 24,245 |
| — |
| (147 | ) | 24,098 |
|
| 76,347 |
| 150 |
| (7 | ) | 76,490 |
| 31,587 |
| 4 |
| (59 | ) | 31,532 |
| |||||||||||||||||||||||||||||
Certificates of deposit |
| 1,257 |
| — |
| (1 | ) | 1,256 |
| — |
| — |
| — |
| — |
| ||||||||||||||||||||||||||||||||||||||||||||||
Commercial paper |
| 583 |
| — |
| — |
| 583 |
| — |
| — |
| — |
| — |
|
| — |
| — |
| — |
| — |
| 583 |
| — |
| — |
| 583 |
| |||||||||||||||||||||||||||||
Total |
| $ | 63,176 |
| $ | 14 |
| $ | (68 | ) | $ | 63,122 |
| $ | 58,963 |
| $ | 2 |
| $ | (204 | ) | $ | 58,761 |
|
| $ | 91,459 |
| $ | 151 |
| $ | (64 | ) | $ | 91,546 |
| $ | 63,176 |
| $ | 14 |
| $ | (68 | ) | $ | 63,122 |
| |||||||||||||
|
|
|
|
|
|
|
|
|
|
|
|
|
|
|
|
|
|
|
|
|
|
|
|
|
|
|
|
|
|
|
|
|
|
| |||||||||||||||||||||||||||||
Held-to-maturity: |
|
|
|
|
|
|
|
|
|
|
|
|
|
|
|
|
|
|
|
|
|
|
|
|
|
|
|
|
|
|
|
|
|
| |||||||||||||||||||||||||||||
Certificate of deposit |
| $ | 2,339 |
| $ | — |
| $ | — |
| $ | 2,339 |
| $ | 420 |
| $ | — |
| $ | — |
| $ | 420 |
| ||||||||||||||||||||||||||||||||||||||
Certificates of deposit |
| $ | 3,428 |
| $ | — |
| $ | — |
| $ | 3,428 |
| $ | 2,339 |
| $ | — |
| $ | — |
| $ | 2,339 |
| ||||||||||||||||||||||||||||||||||||||
As of December 31, 20062007 and 2005,2006, investments with unrealized losses for greater than a 12-month period were not material to the Consolidated Balance Sheets and were not deemed to have other than temporary declines in value.
The table below shows the cost and estimated fair value of investments classified as available-for-sale and held-to-maturity based on their contractual maturities. The expected maturities of certain fixed-income securities may differ from their contractual maturities because some of these holdings have call features that allow the issuers the right to prepay obligations without penalties.
|
| Dec. 31, 2006 |
| Dec. 31, 2005 |
|
| Dec. 31, 2007 |
|
|
| Dec. 31, 2006 |
|
|
| |||||||||||||||||
($000) |
| Cost |
| Fair Value |
| Cost |
| Fair Value |
|
| Cost |
| Fair Value |
| Cost |
| Fair Value |
| |||||||||||||
Available-for-sale: |
|
|
|
|
|
|
|
|
|
|
|
|
|
|
|
|
|
| |||||||||||||
Due in one year or less |
| $ | 35,817 |
| $ | 35,768 |
| $ | 25,820 |
| $ | 25,740 |
|
| $ | 60,471 |
| $ | 60,468 |
| $ | 35,817 |
| $ | 35,768 |
| |||||
Due in one to three years |
| 27,359 |
| 27,354 |
| 16,845 |
| 16,723 |
|
| 30,988 |
| 31,078 |
| 27,359 |
| 27,354 |
| |||||||||||||
Due in greater than ten years |
| — |
| — |
| 16,298 |
| 16,298 |
| ||||||||||||||||||||||
Total |
| $ | 63,176 |
| $ | 63,122 |
| $ | 58,963 |
| $ | 58,761 |
|
| $ | 91,459 |
| $ | 91,546 |
| $ | 63,176 |
| $ | 63,122 |
| |||||
|
|
|
|
|
|
|
|
|
|
|
|
|
|
|
|
|
|
| |||||||||||||
Held-to-maturity: |
|
|
|
|
|
|
|
|
|
|
|
|
|
|
|
|
|
| |||||||||||||
Due in one year or less |
| $ | 2,339 |
| $ | 2,339 |
| $ | 420 |
| $ | 420 |
|
| $ | 3,428 |
| $ | 3,428 |
| $ | 2,339 |
| $ | 2,339 |
| |||||
AsHeld-to-maturity investments include a $2,500,000 certificate of December 31, 2005, securities with contractual maturities of greater than 10 years consisted of auction-rate securities. Auction-rate securities are long-term variable rate bonds tied to short-term interest rates that are reset through an auction process that occurs approximately every seven to 35 days. As of December 31, 2006, we no longer hold auction-rate securities.deposit held as collateral against two bank guarantees for our office space lease in Australia.
Net unrealized gains (losses) on trading securities included in our Consolidated Statements of Income were ($85,000), $176,000, and $18,000 in 2007, 2006, and $71,000 in 2006, 2005, and 2004, respectively.
The following table shows the net realized gains (losses) arising from sales of our investments recorded in our Consolidated Statements of Income:
($000) |
| 2006 |
| 2005 |
| 2004 |
|
| 2007 |
| 2006 |
| 2005 |
| ||||||||
Realized gains |
| $ | 25 |
| $ | 36 |
| $ | 33 |
|
| $ | 183 |
| $ | 25 |
| $ | 36 |
| ||
Realized losses |
| (2 | ) | (4 | ) | (2 | ) |
| (92 | ) | (2 | ) | (4 | ) | ||||||||
Realized gains, net |
| $ | 23 |
| $ | 32 |
| $ | 31 |
|
| $ | 91 |
| $ | 23 |
| $ | 32 |
| ||
92
7. Acquisitions, Goodwill, and Other Intangible Assets
Acquisition of the minority interest of Morningstar Europe NV
Morningstar Europe NV is the holding company for Morningstar’s European subsidiaries. Morningstar, Inc., the U.S. parent company, owned 98% of the shares of Morningstar Europe NV. Stadsporten Citygate AB (Citygate) owned the remaining 2% of the shares. In April 2007, Morningstar acquired the remaining 2% share ownership from Citygate for $1,000,000 in cash. As a majority-owned subsidiary, the financial results of Morningstar Europe NV have been included in our Consolidated Financial Statements for all periods presented. We assigned the purchase price of $1,000,000 to goodwill.
Acquisition of the mutual fund data business from Standard & Poor’s
In March 2007, we acquired the mutual fund data business from Standard & Poor’s for $57,767,000 in cash including post-closing adjustments and transaction costs directly related to the acquisition, less acquired cash. Approximately 80% of this business is generated outside the United States. We began including the financial results of this acquisition in our Consolidated Financial Statements on March 16, 2007.
The following table summarizes our preliminary allocation of the purchase price to the estimated fair values of the assets acquired and liabilities assumed at the date of acquisition.
|
| ($000) |
| |
Cash |
| $ | 2,974 |
|
Accounts receivable |
| 7,529 |
| |
Other current assets |
| 1,029 |
| |
Fixed assets |
| 126 |
| |
Intangible assets |
| 34,080 |
| |
Goodwill |
| 37,180 |
| |
Deferred revenue |
| (16,450 | ) | |
Accrued liabilities |
| (3,924 | ) | |
Deferred tax liabilities |
| (1,673 | ) | |
Other non-current liabilities |
| (130 | ) | |
Total purchase price |
| $ | 60,741 |
|
The preliminary allocation includes $34,080,000 of acquired intangible assets. These assets include customer-related assets of $13,040,000 that will be amortized over a weighted average period of 10 years; technology-based assets, including software and a database covering managed investment vehicles, including mutual funds, exchange-traded funds, hedge funds, and offshore funds, of $20,580,000 that will be amortized over a weighted average period of nine years; and a non-compete agreement of $460,000 that will be amortized over five years.
The deferred tax liability of $1,673,000 results primarily because the amortization expense related to certain of these intangible assets is not deductible for income tax purposes.
Based on the preliminary purchase price allocation, we recorded $37,180,000 of goodwill. The goodwill we recorded is not considered deductible for income tax purposes. SFAS No. 109, Accounting forIncome Taxes, prohibits recognition of a deferred tax asset or liability for goodwill temporary differences if goodwill is not amortizable and deductible for tax purposes.
The preliminary purchase price allocation includes a liability of $1,685,000 for severance and lease termination costs. Substantially all of these liabilities were paid as of December 31, 2007.
If this acquisition had occurred as of January 1, 2006 and 2007, our results of operations would not have been significantly different from the amounts reported in 2006 and 2007, respectively.
93
Institutional Hedge Fund and Separate Accounts Database Division of InvestorForce, Inc.
In August 2006, we acquired the institutional hedge fund and separate account database division of InvestorForce, Inc. (InvestorForce), a financial software and data integration company based in Wayne, Pennsylvania, for $10,050,000$10,051,000 in cash, including expenses directly related to the acquisition. We have includedbegan including the financial results of this acquisition in our Consolidated Financial Statements beginning on August 1, 2006. This acquisition included the Altvest database, one of the largest databases covering hedge funds, managers, and data, as well as InvestorForce’s extensive institutional separate account database. It also included several online software applications for manager search, research, and reporting. This acquisition allowed us to strengthen and expand our proprietary investment data.
The following table summarizes our preliminary allocation of the purchase price to the estimated fair values of the assets acquired and liabilities assumed at the date of the acquisition:
76
|
| ($000) |
| |
Accounts receivable |
| $ | 343 |
|
Intangible assets |
| 5,290 |
| |
Goodwill |
| 6,032 |
| |
Deferred revenue |
| (1,614 | ) | |
Total purchase price |
| $ | 10,051 |
|
|
| ($000) |
| ||
Accounts receivable |
| $ | 354 |
| |
Intangible assets |
| 5,290 |
| ||
Goodwill |
| 6,020 |
| ||
Deferred revenue |
| (1,614 | ) | ||
Total purchase price |
| $ | 10,050 |
| |
The preliminary purchase price allocation includes $5,290,000 of acquired intangible assets. These assets include technology-based assets of $2,500,000 that will be amortized over a weighted average period of 5five years; customer-based assets of $2,350,000 that will be amortized over a weighted average period of 5five years; trade names of $390,000 that will be amortized over a weighted average period of 4four years; and a non-compete agreement of $50,000 that will be amortized over 3three years.
The value assigned to goodwill and intangibles of $11,310,000$11,322,000 is deductible for U.S. income tax purposes over a period of 15 years.
If the acquisition of the database division of InvestorForce had occurred as of January 1, 2005 and 2006, revenue, operating income, net income, and basic and diluted income per shareour results of operations would not have been significantly different from the amounts reported in 2005 and 2006, and 2005.respectively.
94
Aspect Huntley Pty Limited
In July 2006, we acquired Aspect Huntley Pty Limited (Aspect Huntley), a leading provider of equity information, research, and financial trade publishing in Australia. We have included the results of Aspect Huntley’s operations in our Consolidated Financial Statements beginning on July 25, 2006. This acquisition fit our growth strategy to expand our products and services outside the United States and allowed us to combine Morningstar’s expertise in fund research and information with Aspect Huntley’s equity research, information, and financial media expertise in Australia.
The purchase price of $23,384,000$22,452,000 represents Australian $30,000,000 in cash (of which Australian $2,000,000 will be paid in the third quarter of 2007)cash), and includes transaction costs directly related to the acquisition and post-closing adjustments. In 2006, theadjustments, less cash acquired. The cash paid for Aspect Huntley, including transaction costs and post-closing adjustments, less acquired cash, was $20,914,000 (netin 2006. The remainder of cash acquired).the purchase price was paid in 2007. We began including the results of Aspect Huntley’s operations in our Consolidated Financial Statements on July 25, 2006.
The following table summarizes our preliminary allocation of the purchase price to the estimated fair values of the assets acquired and liabilities assumed at the date of the acquisition:
|
| ($000) |
|
| ($000) |
| |||
Cash |
| $ | 922 |
|
| $ | 922 |
| |
Accounts receivable |
| 671 |
|
| 671 |
| |||
Other current assets |
| 324 |
|
| 324 |
| |||
Fixed assets |
| 273 |
|
| 273 |
| |||
Deferred tax asset |
| 359 |
| ||||||
Intangible assets |
| 11,019 |
|
| 11,019 |
| |||
Goodwill |
| 17,274 |
|
| 16,905 |
| |||
Deferred revenue |
| (5,141 | ) |
| (5,141 | ) | |||
Other current liabilities |
| (1,850 | ) |
| (1,850 | ) | |||
Income taxes payable |
| (108 | ) |
| (108 | ) | |||
Total purchase price |
| $ | 23,384 |
|
| $ | 23,374 |
| |
The preliminary purchase price allocation includes $11,019,000 of acquired intangible assets. These assets include trade names of $6,622,000 that will be amortized over a weighted average period of 10 years; technology-based assets (primarily including a database) of $2,593,000 that will be amortized over a weighted average period of 18 years; and customer-related assets of $1,804,000 that will be amortized over 10 years.
The goodwill we recorded of $17,274,000$16,905,000 is not deductible for U.S. or Australian income tax purposes.
If the acquisition of Aspect Huntley had occurred as of January 1, 2005 and 2006, revenue, operating income, net income, and basic and diluted income per shareour results of operations would not have been significantly different from the amounts reported in 2005 and 2006, and 2005.respectively.
95
Ibbotson Associates, Inc.
In March 2006, we acquired Ibbotson Associates, Inc. (Ibbotson), a firm specializing in asset allocation research and services, for $83,000,000$86,367,000 in cash, plus an additional $3,470,000 inincluding transaction costs directly related to the acquisition and post-closing adjustments, less cash for working capitalacquired. In 2007 we received a payment of $301,000 representing a post-closing adjustment. This post-closing adjustment reduced the total purchase price paid and other items.the goodwill previously reported. We have includedbegan including the results of Ibbotson’s operations in our Consolidated Financial Statements beginning on March 1, 2006. This acquisition complemented our growth strategies in several key areas, including investment consulting, managed retirement accounts, and institutional and advisor
77
software.
The following table summarizes our allocation of the purchase price to the estimated fair values of the assets acquired and liabilities assumed at the date of the acquisition:
|
| ($000) |
|
| ($000) |
| |||
Cash |
| $ | 103 |
|
| $ | 103 |
| |
Accounts receivable |
| 6,770 |
|
| 6,770 |
| |||
Income tax benefits, net |
| 13,047 |
|
| 13,047 |
| |||
Other current assets |
| 1,398 |
|
| 1,398 |
| |||
Fixed assets |
| 1,407 |
|
| 1,407 |
| |||
Other assets |
| 156 |
|
| 156 |
| |||
Intangible assets |
| 55,280 |
|
| 55,280 |
| |||
Goodwill |
| 46,221 |
|
| 45,920 |
| |||
Deferred revenue |
| (10,772 | ) |
| (10,772 | ) | |||
Accrued liabilities |
| (4,882 | ) |
| (4,882 | ) | |||
Deferred tax liability, net |
| (21,497 | ) |
| (21,497 | ) | |||
Other non-current liabilities |
| (761 | ) |
| (761 | ) | |||
Total purchase price |
| $ | 86,470 |
|
| $ | 86,169 |
| |
As part of the purchase price allocation, we recorded an asset of $13,047,000, primarily for the income tax benefit related to payment for the cancellation of Ibbotson’s stock options. This cash income tax benefit reduced the amount of cash we paid for income taxes in 2006. This cash income tax benefit did not impact our income tax expense or net income in 2006.
The purchase price allocation also includes $55,280,000 of acquired intangible assets. These assets include customer-related assets of $34,200,000 that will be amortized over a weighted average period of 9nine years; intellectual property (including patents and trade names) of $17,710,000 that will be amortized over a weighted average period of 10 years; technology-based assets of $3,070,000 that will be amortized over a weighted average period of 5five years; and a non-compete agreement of $300,000 that will be amortized over 5five years. The deferred tax liability of $21,497,000 results primarily because the amortization expense for these intangible assets is not deductible for U.S. income tax purposes.
Based on the purchase price allocation, we recorded $46,221,000$45,920,000 of goodwill. The goodwill we recorded is not deductible for U.S. income tax purposes. SFAS No. 109, Accounting for Income Taxes, prohibits recognition of a deferred tax asset or liability for goodwill temporary differences if goodwill is not amortizable and deductible for tax purposes.
Based on plans in place at the time of acquisition, we recorded a liability of $596,000 for severance and $761,000 for lease termination costs, net of estimated sub-lease income. As of December 31, 2006,2007, we have made substantially all of the related severance payments. We expect to paybegin paying the lease termination costs beginning in March 2008, which is when we plan to vacate Ibbotson’s office space.
96
The following unaudited pro forma information presents a summary of our Consolidated Statements of Income for the yearstwelve months ended December 31, 20062005 and 20052006 as if we had acquired Ibbotson as of January 1, 2005 and 2006.2006, respectively. In calculating the pro forma information below, we made an adjustment to eliminate stock-based compensation expense previously recorded by Ibbotson based on the recognition and measurement principles of APBAccounting Principles Board Opinion No. 25, Accounting for Stock Issued to Employees, and related interpretations. We also made an adjustment to record stock-based compensation expense for an estimated value of stock options assumed to be granted to Ibbotson employees. This adjustment assumes the stock option awards were made in May 2005, consistent with the timing of our annual equity grant, and vest over a four-year period. In 2005, we recorded stock-based compensation expense based on the recognition and measurement principles of SFAS No. 123, Accounting for Stock-Based Compensation.
78
|
| Year Ended December 31 |
| ||||
($000) |
| 2006 |
| 2005 |
| ||
Revenue |
| $ | 322,566 |
| $ | 266,621 |
|
Operating income |
| 77,868 |
| 42,035 |
| ||
Income before cumulative effect of accounting change |
| 51,478 |
| 27,007 |
| ||
Net income |
| 51,737 |
| 27,007 |
| ||
|
|
|
|
|
| ||
Basic income per share: |
|
|
|
|
| ||
Basic income per share before cumulative effect of accounting change |
| $ | 1.25 |
| $ | 0.69 |
|
Basic net income per share |
| $ | 1.26 |
| $ | 0.69 |
|
|
|
|
|
|
| ||
Diluted income per share: |
|
|
|
|
| ||
Diluted income per share before cumulative effect of accounting change |
| $ | 1.10 |
| $ | 0.61 |
|
Diluted net income per share |
| $ | 1.11 |
| $ | 0.61 |
|
|
| Year Ended December 31 |
| ||||||
($000) |
| 2006 |
| 2005 |
| ||||
Revenue |
| $ | 322,566 |
| $ | 266,621 |
| ||
Operating income |
| 77,868 |
| 42,035 |
| ||||
Income before cumulative effect of accounting change |
| 51,478 |
| 27,007 |
| ||||
Net income |
| 51,737 |
| 27,007 |
| ||||
|
|
|
|
|
| ||||
Basic income per share: |
|
|
|
|
| ||||
Income before cumulative effect of accounting change |
| $ | 1.25 |
| $ | 0.69 |
| ||
Net income |
| $ | 1.26 |
| $ | 0.69 |
| ||
|
|
|
|
|
| ||||
Diluted income per share: |
|
|
|
|
| ||||
Income before cumulative effect of accounting change |
| $ | 1.10 |
| $ | 0.61 |
| ||
Net income |
| $ | 1.11 |
| $ | 0.61 |
| ||
Variable Annuity Research and Data Service
In January 2005, we acquired Variable Annuity Research and Data Service (VARDS) from Finetre Corporation for $8,192,000 in cash, including costs directly related to the acquisition. The results of the VARDS operations have been included in our Consolidated Financial Statements beginning in January 2005.
The following table summarizes the allocation of the purchase price to the estimated fair values of the assets acquired and liabilities assumed at the date of the acquisition:
|
| ($000) |
| |
Accounts receivable |
| $ | 639 |
|
Other assets |
| 57 |
| |
Intangible assets |
| 6,370 |
| |
Goodwill |
| 3,084 |
| |
Liabilities, primarily deferred revenue |
| (1,958 | ) | |
Total purchase price |
| $ | 8,192 |
|
The acquired intangible assets include $5,700,000 of customer-related assets, consisting primarily of acquired customer contracts; $430,000 for technology-based assets, consisting of a database and developed software; and $240,000 related to supplier relationships. Both the acquired intangible assets and the acquired goodwill are deductible for U.S. income tax purposes.
Morningstar Norway97
In February 2004, we purchased the remaining 51% of Morningstar Norway that we did not previously own. The purchase price consisted of $210,000 in cash and $69,000 of other consideration. Prior to this transaction, we accounted for our investment in Morningstar Norway using the equity method.
Goodwill
The following table shows the changes in our goodwill balances from January 1, 2005 to December 31,recorded in 2007 and 2006:
|
| ($000) |
| ||
Balance as of January 1, 2005 |
| $ | 14,408 |
| |
Goodwill acquired related to VARDS |
| 3,084 |
| ||
Other, primarily currency translation |
| 8 |
| ||
Balance as of December 31, 2005 |
| 17,500 |
| ||
Goodwill acquired related to Ibbotson |
| 46,221 |
| ||
Goodwill acquired related to Aspect Huntley |
| 17,274 |
| ||
Goodwill acquired related to the database division of InvestorForce |
| 6,020 |
| ||
Reversal of valuation allowances related to non-U.S. deferred tax assets, primarily related to net operating losses |
| (1,200 | ) | ||
Other, primarily currency translation |
| 865 |
| ||
Balance as of December 31, 2006 |
| $ | 86,680 |
| |
($000) |
| 2007 |
| 2006 |
| Total |
| |||
Acquisition of the mutual fund data business acquired from Standard & Poor’s |
| $ | 37,180 |
| $ | — |
| $ | 37,180 |
|
Acquisition of the minority interest in Morningstar Europe NV |
| 1,000 |
| — |
| 1,000 |
| |||
Ibbotson acquisition |
| (301 | ) | 46,221 |
| 45,920 |
| |||
Aspect Huntley acquisition |
| (369 | ) | 17,274 |
| 16,905 |
| |||
Acquisition of the data base division of Investorforce |
| 12 |
| 6,020 |
| 6,032 |
| |||
Reversal of valuation allowances related to non-U.S. deferred tax assets, primarily for net operating losses |
| — |
| (1,200 | ) | (1,200 | ) | |||
Adjustment to Morningstar Australia goodwill upon settlement of litigation |
| 299 |
| — |
| 299 |
| |||
Other, primarily currency translations |
| 3,640 |
| 865 |
| 4,505 |
| |||
Net increase to goodwill |
| 41,461 |
| 69,180 |
| $ | 110,641 |
| ||
Goodwill – beginning of year |
| 86,680 |
| 17,500 |
|
|
| |||
Goodwill – end of year |
| $ | 128,141 |
| $ | 86,680 |
|
|
| |
In August 2007, we settled the litigation related to Morningstar Research Pty Ltd. (Morningstar Australia) and paid Australian $4,000,000 (approximately U.S. $3,300,000). In the third quarter of 2007, we recorded $299,000 of this settlement payment as an adjustment to the goodwill initially recorded when we acquired Morningstar Australia in 2001.
At the date of acquisition of certain of our non-U.S. operations, we recorded a valuation allowance against the deferred tax assets related to the acquired entities’ deductible temporary differences and net operating losses. In 2006, we reversed these valuation allowances as we considered that it is more likely than not that these tax benefits will be realized. In accordance with SFAS No. 109, theAccounting for Income Taxes, tax benefits for those items that are first recognized in financial statements after the acquisition date (by eliminating the
79
valuation allowance) are applied first to reduce any goodwill related to the acquisition. We therefore recorded a reduction to goodwill in the amount of $1,200,000 related to the reduction of these valuation allowances.
We did not record any goodwill impairment losses in 2007, 2006, 2005, or 2004,2005, respectively.
Intangible Assets
The following table summarizes our intangible assets:
|
| As of December 31, 2006 |
| As of December 31, 2005 |
|
| As of December 31, 2007 |
| As of December 31, 2006 |
| ||||||||||||||||||||||||||||||||||||||
($000) |
| Gross |
| Accumulated |
| Net |
| Weighted |
| Gross |
| Accumulated |
| Net |
| Weighted |
|
| Gross |
| Accumulated |
| Net |
| Weighted |
| Gross |
| Accumulated |
| Net |
| Weighted |
| ||||||||||||||
Intellectual property |
| $ | 26,185 |
| $ | (2,455 | ) | $ | 23,730 |
| 10 |
| $ | 1,132 |
| $ | (405 | ) | $ | 727 |
| 7 |
|
| $ | 26,956 |
| $ | (5,542 | ) | $ | 21,414 |
| 10 |
| $ | 26,185 |
| $ | (2,455 | ) | $ | 23,730 |
| 10 |
| ||
Customer-related assets |
| 45,015 |
| (4,410 | ) | 40,605 |
| 10 |
| 6,571 |
| (597 | ) | 5,974 |
| 18 |
|
| 58,721 |
| (10,354 | ) | 48,367 |
| 10 |
| 45,015 |
| (4,410 | ) | 40,605 |
| 10 |
| ||||||||||||||
Supplier relationships |
| 240 |
| (24 | ) | 216 |
| 20 |
| 240 |
| (12 | ) | 228 |
| 20 |
|
| 240 |
| (36 | ) | 204 |
| 20 |
| 240 |
| (24 | ) | 216 |
| 20 |
| ||||||||||||||
Technology-based assets |
| 9,177 |
| (1,180 | ) | 7,997 |
| 9 |
| 430 |
| (108 | ) | 322 |
| 4 |
|
| 30,059 |
| (4,881 | ) | 25,178 |
| 9 |
| 9,177 |
| (1,180 | ) | 7,997 |
| 9 |
| ||||||||||||||
Non-competition agreement |
| 350 |
| (57 | ) | 293 |
| 5 |
| — |
| — |
| — |
| — |
|
| 810 |
| (206 | ) | 604 |
| 5 |
| 350 |
| (57 | ) | 293 |
| 5 |
| ||||||||||||||
Total intangible assets |
| $ | 80,967 |
| $ | (8,126 | ) | $ | 72,841 |
| 10 |
| $ | 8,373 |
| $ | (1,122 | ) | $ | 7,251 |
| 16 |
|
| $ | 116,786 |
| $ | (21,019 | ) | $ | 95,767 |
| 10 |
| $ | 80,967 |
| $ | (8,126 | ) | $ | 72,841 |
| 10 |
| ||
We amortize intangible assets using the straight-line method over their expected economic useful lives. Amortization expense for the years ended December 31, 2007, 2006, and 2005 was $12,769,000, $7,004,000, and 2004 was $7,004,000, $692,000, and $287,000, respectively.
98
As of December 31, 2006,2007, we estimate that aggregate amortization expense for intangible assets will be $9,529,000 in 2007; $9,458,000$13,592,000 in 2008; $9,113,000$13,230,000 in 2009; $8,188,000$11,725,000 in 2010; $10,573,000 in 2011; and $7,185,000$9,911,000 in 2011.2012.
8. Investments in Unconsolidated Entities
Our investments in unconsolidated entities consist primarily of the following:
Morningstar Japan K.K. In April 1998, we entered into an agreement with Softbank Corporation to form a joint venture, Morningstar Japan K.K. (MJKK), which develops and markets products and services customized for the Japanese market. In June 2000, MJKK became a public company, and itsMJKK’s shares are traded on the Osaka Stock Exchange, “Hercules Market,” using the ticker 4765. Subsequent to MJKK’s initial public offering, the joint venture agreement between us and Softbank Corporation was terminated, but we continued to hold shares of MJKK stock. As of December 31, 20062007 and 2005,2006, we owned approximately 35% of MJKK. We account for our investment in MJKK using the equity method. The book value of our investment in MJKK totaled $16,693,000$17,522,000 and $14,884,000$16,693,000 as of December 31, 20062007 and 2005,2006, respectively. The market value of our investment in MJKK was approximately Japanese Yen 5.4 billion (approximately U.S. $48,007,000) as of December 31, 2007 and Japanese Yen 10.2 billion (approximately U.S. $85,482,000) as of December 31, 2006 and Japanese Yen 9.7 billion (approximately U.S. $82,103,000) as of December 31, 2005.
In the third quarter of 2006, MJKK recorded a gain related to the sale of shares in a subsidiary’s initial public offering. Our share of the pre-tax gain was approximately $990,000 and is included in “Equity in net income of unconsolidated entities,” in our Consolidated Statements of Income.2006.
Morningstar Korea, Ltd. In June 2000, we entered into a joint venture agreement with Shinheung Securities Co., Ltd. and SOFTBANK Finance Corporation to establish a Korean limited liability company, Morningstar Korea Ltd. (Morningstar Korea). Morningstar Korea provides financial information and services for investors in South Korea. Our ownership interest and profit and loss sharing interest in Morningstar Korea was 40% as of December 31, 20062007 and December 31, 2005.2006. We account for this investment using the equity method. Our investment totaled $1,415,000$1,512,000 and $1,129,000$1,415,000 as of December 31, 2007 and 2006, and 2005, respectively.
Other Investments in Unconsolidated Entities. As of December 31, 20062007 and 2005,2006, the book value of our other investments in unconsolidated entities totaled $551,000$821,000 and $342,000,$551,000, respectively, and consist primarily includesof our investments in Morningstar Danmark A/S (Morningstar Denmark) and Morningstar Sweden AB (Morningstar Sweden). In August 2001, we entered into a joint venture agreement with Phosphorus A/S to establish Morningstar Denmark which develops and marketsMorningstar Sweden develop and market products and services customized for the Danish market. In April 2001, we entered into a joint venture agreement with Stadsporten Citygate AB to establish Morningstar Sweden, which develops and markets products and services customized for the Swedish market.their respective markets. Our ownership interest in both Morningstar Denmark and Morningstar Sweden was approximately 25% as of December 31, 20062007 and 2005.2006. We account for our investments in Morningstar Denmark and Morningstar Sweden using the equity method.
80
The following table shows condensed combined financial information, a portion of which is unaudited, for our investments in unconsolidated entities.
($000) |
| 2006 |
| 2005 |
| 2004 |
|
| 2007 |
| 2006 |
| 2005 |
| ||||||
Revenue |
| $ | 18,894 |
| $ | 15,069 |
| $ | 9,648 |
|
| $ | 49,028 |
| $ | 18,894 |
| $ | 15,069 |
|
Operating income |
| 4,985 |
| 2,940 |
| 1,143 |
|
| 7,352 |
| 4,985 |
| 2,940 |
| ||||||
Net income |
| 6,979 |
| 3,178 |
| 656 |
|
| 4,540 |
| 6,979 |
| 3,178 |
| ||||||
($000) |
| Dec. 31, 2006 |
| Dec. 31, 2005 |
| Dec. 31, 2004 |
| |||
Current assets |
| $ | 57,323 |
| $ | 49,538 |
| $ | 50,133 |
|
Total assets |
| 64,059 |
| 55,235 |
| 55,294 |
| |||
Current liabilities |
| 3,781 |
| 2,792 |
| 1,536 |
| |||
Total liabilities |
| 4,122 |
| 3,071 |
| 1,536 |
| |||
|
| December 31 |
|
|
|
|
| |||
($000) |
| 2007 |
| 2006 |
| 2005 |
| |||
Current assets |
| $ | 72,207 |
| $ | 57,323 |
| $ | 49,538 |
|
Total assets |
| 80,620 |
| 64,059 |
| 55,235 |
| |||
Current liabilities |
| 10,338 |
| 3,781 |
| 2,792 |
| |||
Total liabilities |
| 11,292 |
| 4,122 |
| 3,071 |
| |||
99
9. Property, Equipment, and Capitalized Software
The following table shows our property, equipment, and capitalized software summarized by major category:
|
| December 31 |
| |||||||||||||
($000) |
| Dec. 31, 2006 |
| Dec. 31, 2005 |
|
| 2007 |
| 2006 |
| ||||||
Computer equipment |
| $ | 22,833 |
| $ | 19,794 |
|
| $ | 27,573 |
| $ | 22,833 |
| ||
Capitalized software |
| 21,612 |
| 20,400 |
|
| 21,989 |
| 21,612 |
| ||||||
Furniture and fixtures |
| 4,461 |
| 2,710 |
|
| 6,301 |
| 4,461 |
| ||||||
Leasehold improvements |
| 13,034 |
| 13,529 |
|
| 16,655 |
| 13,034 |
| ||||||
Telephone equipment |
| 1,423 |
| 1,277 |
|
| 1,517 |
| 1,423 |
| ||||||
Construction in progress |
| 762 |
| 36 |
|
| 2,377 |
| 762 |
| ||||||
Other |
| - |
| 296 |
| |||||||||||
Property, equipment, and capitalized software, at cost |
| 64,125 |
| 58,042 |
|
| 76,412 |
| 64,125 |
| ||||||
Less accumulated depreciation |
| (48,256 | ) | (40,687 | ) |
| (57,304 | ) | (48,256 | ) | ||||||
Property, equipment, and capitalized software, net |
| $ | 15,869 |
| $ | 17,355 |
|
| $ | 19,108 |
| $ | 15,869 |
| ||
The construction in progress balance consists of spending related to the build-out of new office space in Chicago, Illinois for our U.S.-based operations. These assets will be placed into service in 2008 when we move into this new office space.
Depreciation and leasehold amortization expense totaled $8,488,000, $7,971,000, and $7,574,000 in 2007, 2006, and $7,938,000, in 2006, 2005, and 2004, respectively.
100
10. Operating Leases
The following table shows our minimum future rental commitments due in each of the next five years and thereafter for all non-cancelable operating leases, consisting primarily of leases for office space:
Minimum Future Rental Commitments |
| ($000) |
|
| ($000) |
| |||
2007 |
| $ | 4,309 |
| |||||
2008 |
| 7,446 |
|
| $ | 7,427 |
| ||
2009 |
| 7,002 |
|
| 7,533 |
| |||
2010 |
| 6,988 |
|
| 13,013 |
| |||
2011 |
| 6,930 |
|
| 12,302 |
| |||
2012 |
| 10,454 |
| ||||||
Thereafter |
| 68,753 |
|
| 90,540 |
| |||
Total |
| $ | 101,428 |
|
| $ | 141,269 |
| |
In December 2005, we signed an agreement toThe minimum future lease payments presented in the table above include the lease payments for approximately 210,000235,000 square feet of new office space in Chicago, Illinois for our corporate headquarters and U.S. operations in Chicago, Illinois. TheU.S.-based operations. Although the lease begins in 2008, andthe minimum lease payments will begin in the second-half of 2009. This lease has a term of 15 years. The minimum future lease payments are included in the table above.
Rent expense for 2007, 2006, and 2005 was $11,113,000, $6,818,000, and 2004 was $6,818,000, $5,234,000, and $4,155,000, respectively, including taxes, insurance, and other operating costs.
Deferred rent in the amount of $1,557,000 and $1,143,000 and $808,000 atas of December 31, 20062007 and 2005,2006, respectively, relates to build-out and rent abatement allowances received, which are being amortized on a straight-line basis over the remaining portion of the original term of the lease. Deferred rent is included, as appropriate, in “Other current liabilities” and “Other long-term liabilities” on our Consolidated Balance Sheets, as appropriate.
As of December 31, 2006 and 2005, we have recorded an asset retirement obligation of $98,000 for costs we expect to incur in 2009 to return office space modified by leasehold improvements to its original condition in accordance with the lease agreement. The asset retirement obligation is recorded in Other Long-Term Liabilities on our Consolidated Balance Sheets.
81
11. Stock-Based Compensation
Stock-Based Compensation Plans
Prior to November 2004, we granted stock options under various plans, including the 1993 Stock Option Plan (the 1993 Plan), the 2000 Morningstar Stock Option Plan (the 2000 Plan), and the 2001 Morningstar Stock Option Plan (the 2001 Plan). In general, options granted under the 1993 Plan vest ratably over a five-year period and options granted under the 2000 Plan and the 2001 Plan vest ratably over a four-year period; options under all three plans expire 10 years after the date of grant.
In November 2004, we adopted the 2004 Stock Incentive Plan. The 2004 Stock Incentive Plan amends and restates the 1993 Plan, the 2000 Plan, and the 2001 Plan (collectively, the Prior Plans). Under the 2004 Stock Incentive Plan, we will not grant any additional options under any of the Prior Plans, and any shares subject to an award under any of the Prior Plans that are forfeited, canceled, settled, or otherwise terminated without a distribution of shares, or withheld by us in connection with the exercise of options or in payment of any required income tax withholding, will not be available for awards under the 2004 Stock Incentive Plan. The 2004 Stock Incentive Plan provides for grants of options, stock appreciation rights, restricted stock restricted stock units, and performance shares. All of our employees are eligible for awards under the 2004 Stock Incentive Plan. Ourand our non-employee directors are also eligible for awards under the 2004 Stock Incentive Plan. Joe Mansueto, our chairman and chief executive officer, does not participate in the 2004 Stock Incentive Plan or the Prior Plans.prior plans.
Since the adoption of the 2004 Stock Incentive Plan, we have granted stock options and, beginning in 2006, restricted stock units. Stock options granted under the 2004 Stock Incentive Plan generally vest ratably over a four-year period and expire 10 years after the date of grant. Almost all of the options granted under the 2004 Stock Incentive Plan have a premium feature in which the exercise price increases over the term of the option at a rate equal to the 10-year Treasury bond yield as of the date of grant. Restricted stock units represent the right to receive a share of Morningstar common stock when that unit vests. Restricted stock units granted under the 2004 Stock Incentive Plan generally vest ratably over a four-year period. The numberAt the time of grant, employees may elect to defer receipt of the Morningstar common stock issued upon vesting of the restricted stock unit. As of December 31, 2007, we had 2,657,982 shares available for future grants under our 2004 Stock Incentive Plan compared with 2,827,006 as of December 31, 20062006.
Prior to November 2004, we granted stock options under various plans, including the 1993 Stock Option Plan (the 1993 Plan), the 2000 Morningstar Stock Option Plan (the 2000 Plan), and 2005 was 2,827,006the 2001 Morningstar Stock Option Plan (the 2001 Plan). Options granted under the 1993 Plan, the 2000 Plan, and 2,989,322, respectively.the 2001 Plan generally vested over a four-year period and as a result are substantially all vested as of December 31, 2007; however, because the options under all three plans expire 10 years after the date of grant, some options granted under these plans remain outstanding as of December 31, 2007. The 2004 Stock Incentive Plan amends and restates the 1993 Plan, the 2000 Plan, and the 2001 Plan (collectively, the Prior Plans). Under the 2004 Stock Incentive Plan, we will not grant any additional options under any of the Prior Plans, and any shares subject to an award under any of the Prior Plans that are forfeited, canceled, settled, or otherwise terminated without a distribution of shares, or withheld by us in connection with the exercise of options or in payment of any required income tax withholding, will not be available for awards under the 2004 Stock Incentive Plan.
101
In February 1999, we entered into an Incentive Stock Option Agreement and a Nonqualified Stock Option Agreement under the 1999 Incentive Stock Option Plan (the 1999 Plan) with Don Phillips, an officer of Morningstar. Under these agreements, we granted Don options to purchase 1,500,000 shares of common stock at an exercise price of $2.77 per share, equal to the fair value at the grant date. These options are fully vested and expire in February 2009. On the date of grant, 1,138,560 options were fully exercisable and an additional 36,144 were scheduledshares became and continue to become exercisable each year from 1999 through 2008. As of December 31, 2006 and 2005,2007, there were 710,174 and 869,174217,286 options remaining to be exercised, respectively.compared with 710,174 as of December 31, 2006.
Accounting for Stock-Based Compensation Awards
Effective January 1, 2006, we adopted SFAS No. 123 (R), Share-Based Payment, using the modified prospective transition method. Prior to this date, we accounted for our equity plans in accordance with the fair value provisions of SFAS No. 123, Stock-Based Compensation.
Prior to our initial public offering in May 2005, we accounted for stock options granted under the 1993 Plan and the 1999 Plan using the liability method inIn accordance with SFAS No. 123 because these plans allowed for cash settlement at the option holder’s election subject to certain conditions. Under the liability method,123(R), we accounted for options as a liability that was measured each period using the fair value per share of our common stock. We recorded changes in the liability resulting from changes in the fair value of our common stock in our Consolidated Statements of Income. As a result of our initial public offering, we are no longer required to settle options under the 1993 Plan and the 1999 Plan in cash. Upon our initial public offering, we valued the liability using a fair value of $18.50 per share, which was equal to the fair value of our common stock at the time of our initial public offering. We reclassified stock options accounted for as current liabilities of $16,707,000 and long-term liabilities of $24,882,000 to additional paid-in capital. In addition, because all of the options previously accounted for under the liability method were fully vested by March 31, 2005, we have not recorded any additional expense for these options in subsequent periods.
Conversion of Morningstar Europe Options
Prior to 2004, Morningstar Europe, a majority-owned subsidiary of Morningstar, granted approximately 1,500,000 options to acquire common stock of Morningstar Europe to certain of its employees. The options vested over a four-year period and none had been exercised as of December 31, 2004. We accounted for these options as equity instruments in accordance with the provisions of SFAS No. 123. In December 2004, the Board of Directors authorized the cancellation of the Morningstar Europe option plan and the exchange of all options outstanding under the Morningstar Europe option plan for 81,189 options granted under the 2004 Stock Incentive Plan. The conversion was accounted for in accordance with SFAS No. 123 and did not result in any incremental stock-based compensation expense.
82
Stock-Based Compensation Expense
The following table summarizes our stock-based compensation expense:
($000) |
| 2006 |
| 2005 |
| 2004 |
| ||||||
Stock-based compensation expense under the liability method |
| $ | — |
| $ | 2,810 |
| $ | 8,963 |
| |||
Stock-based compensation expense under the equity method |
| 8,575 |
| 8,085 |
| 7,760 |
| ||||||
Total stock-based compensation expense |
| $ | 8,575 |
| $ | 10,895 |
| $ | 16,723 |
| |||
The deferred tax benefit related to the stock-based compensation expense above was $3,030,000, $2,933,000, and $3,084,000 in 2006, 2005, and 2004, respectively.
We estimate forfeitures of all employee stock-based awards and recognize compensation cost only for those awards expected to vest. We determineBecause our largest annual equity grants typically have vesting dates in the second quarter, we adjusted the stock-based compensation expense to reflect those awards that ultimately vested. In addition, we reduced our estimate of the forfeiture rates based on historical experience. Estimated forfeitures are adjustedrate that will be applied to actual forfeiture experience as needed.awards not yet vested. These two factors accounted for approximately $800,000 of additional stock-based compensation expense in 2007, the majority of which was recorded in the second quarter.
The following table summarizes our stock-based compensation expense:
($000) |
| 2007 |
| 2006 |
| 2005 |
| |||
Stock-based compensation expense |
| $ | 10,978 |
| $ | 8,575 |
| $ | 10,895 |
|
The tax benefit related to the stock-based compensation expense above was $3,968,000, $3,030,000, and $2,933,000 in 2007, 2006, and 2005, respectively.
Restricted Stock Units
We measure the fair value of our restricted stock units on the date of grant based on the market price of the underlying common stock as of the close of trading on the day prior to grant. We amortize that value to stock-based compensation expense, net of estimated forfeitures, ratably over the vesting period. We granted restricted stock units for the first time in May 2006. The total grant date fair value of restricted stock units granted through December 31, 2006 was approximately $12,302,000.
The following table summarizes restricted stock unit activity in 2006:
|
| 2006 |
| |||
Restricted Stock Units |
| Shares |
| Weighted |
| |
Nonvested shares—January 1, 2006 |
| — |
| — |
| |
Granted |
| 280,263 |
| $ | 43.90 |
|
Vested |
| — |
| — |
| |
Forfeited |
| (19,801 | ) | $ | 42.41 |
|
Nonvested shares—December 31, 2006 |
| 260,462 |
| $ | 44.01 |
|
As of December 31, 2006,2007, the total amount of unrecognized stock-based compensation expense related to restricted stock units was approximately $8,351,000, which is expected$16,193,000. We expect to be recognizedrecognize this expense over an average period of approximately 4237 months.
102
The following table summarizes restricted stock unit activity in 2006 and 2007:
Restricted Stock Units (RSUs) |
| Unvested |
| Vested |
| Total |
| Weighted |
| |
RSUs outstanding—January 1, 2006 |
| — |
| — |
| — |
| $ | — |
|
Granted |
| 280,263 |
| — |
| 280,263 |
|
| 43.90 |
|
Forfeited |
| (19,801 | ) | — |
| (19,801 | ) | 42.41 |
| |
RSUs outstanding—December 31, 2006 |
| 260,462 |
| — |
| 260,462 |
| 44.01 |
| |
Granted |
| 248,584 |
| — |
| 248,584 |
| 51.72 |
| |
Vested |
| (64,792 | ) | — |
| (64,792 | ) | 47.21 |
| |
Vested but deferred |
| (6,621 | ) | 6,621 |
| — |
| — |
| |
Forfeited |
| (23,351 | ) | — |
| (23,351 | ) | 46.78 |
| |
RSU outstanding—December 31, 2007 |
| 414,282 |
| 6,621 |
| 420,903 |
|
| 48.41 |
|
Stock Option Fair Value
We estimate the fair value of our stock options on the date of grant using a Black-Scholes option-pricing model and amortize that value to stock-based compensation expense ratably over the option’soptions’ vesting period. The weighted average fair value of options granted during 2007, 2006, 2005, and 20042005 using this model was $34.15 per share, $14.16 per share, $9.62 per share, and $9.39$9.62 per share, respectively. We estimated the fair value of these options on the date of grant using the following weighted average assumptions:
|
| 2006 |
| 2005 |
| 2004 |
|
| 2007 |
| 2006 |
| 2005 |
| ||||||
Expected life (years) |
| 6.25 |
| 7.0 |
| 7.0 |
|
| 2.0 |
| 6.25 |
| 7.0 |
| ||||||
Expected volatility (%) |
| 43.0 | % | 50.0 | % | 50.0 | % |
| 43.0 | % | 43.0 | % | 50.0 | % | ||||||
Dividend yield (%) |
| — |
| — |
| — |
|
| — |
| — |
| — |
| ||||||
Interest rate (%) |
| 4.33 | % | 4.04 | % | 4.24 | % |
| 4.95 | % | 4.33 | % | 4.04 | % | ||||||
Expected exercise price |
| $ | 45.31 |
| $ | 26.20 |
| $ | 19.67 |
|
| $ | 14.70 |
| $ | 45.31 |
| $ | 26.20 |
|
83
Expected life. The expected life represents the period over which the stock options are expected to be outstanding. Because we have limited historical information regarding stock option exercises since becoming a public company in May 2005, in 2006 we determined the expected life using the “shortcut method” described in Staff Accounting Bulletin Topic 14.D.2, which is based on a calculation to arrive at the midpoint between the vesting date and the end of the contractual term.
Expected volatility. The volatility factor used in our assumptions is based on an average of the historical stock prices of a group of our peers over the most recent period commensurate with the expected term of the stock option award. Because we are a recently public company with limited historical data on the price of our stock, we do not base our volatility assumption on our own stock price.
Dividend yield. We do not intend to pay dividends on our common stock for the foreseeable future. Accordingly, we used a dividend yield of zero in our assumptions.
Interest rate. We based the risk-free interest rate used in our assumptions on the implied yield available on U.S. Treasury zero-coupon issues with a remaining term that approximates the stock option award’s expected term.
Expected exercise price. Options granted in 2006 2005, and 20042005 have initial exercise prices that increase over the term of the options at a rate equal to the 10-year Treasury bond rate as of the date of grant. The expected exercise price included in the option pricing models for these options was calculated using the applicable estimated life 10-year Treasury bond rate.
103
Stock Option Activity
The following tables summarize stock option activity for our various stock option grants. The first table includes activity for options granted at an exercise price below the fair value per share of our common stock on the grant date; the second table includes activity for all other option grants.
|
| 2006 |
| 2005 |
| 2004 |
| ||||||||||||
Options Granted At an Exercise Price |
| Underlying |
| Weighted |
| Underlying |
| Weighted |
| Underlying |
| Weighted |
| ||||||
Options outstanding—beginning of year |
| 3,338,959 |
| $ | 10.50 |
| 3,557,683 |
| $ | 10.39 |
| 1,936,624 |
| $ | 6.78 |
| |||
Granted |
| — |
| — |
| — |
| — |
| 1,622,539 |
| 14.70 |
| ||||||
Canceled |
| (73,999 | ) | 15.70 |
| (42,658 | ) | 14.84 |
| (1,455 | ) | 8.57 |
| ||||||
Exercised |
| (393,650 | ) | 7.41 |
| (176,066 | ) | 13.03 |
| (25 | ) | 8.57 |
| ||||||
Options outstanding—end of year |
| 2,871,310 |
| 11.11 |
| 3,338,959 |
| 10.50 |
| 3,557,683 |
| 10.39 |
| ||||||
|
|
|
|
|
|
|
|
|
|
|
|
|
| ||||||
Options exercisable |
| 2,113,535 |
| $ | 9.81 |
| 2,102,247 |
| $ | 8.31 |
| 1,760,893 |
| $ | 7.07 |
| |||
|
|
|
|
|
|
|
| ||||||||||||||||||||||||||||
|
| 2007 |
| 2006 |
| 2005 |
| ||||||||||||||||||||||||||||
Options Granted At an Exercise Price |
| Underlying |
| Weighted |
| Underlying |
| Weighted |
| Underlying |
| Weighted |
| ||||||||||||||||||||||
Options outstanding—beginning of year |
| 2,871,310 |
| $ | 11.11 |
| 3,338,959 |
| $ | 10.50 |
| 3,557,683 |
| $ | 10.39 |
| |||||||||||||||||||
Granted |
| 569 |
| 14.70 |
| — |
| — |
| — |
| — |
| ||||||||||||||||||||||
Canceled |
| (22,683 | ) | 16.36 |
| (73,999 | ) | 15.70 |
| (42,658 | ) | 14.84 |
| ||||||||||||||||||||||
Exercised |
| (780,606 | ) | 7.44 |
| (393,650 | ) | 7.41 |
| (176,066 | ) | 13.03 |
| ||||||||||||||||||||||
Options outstanding—end of year |
| 2,068,590 |
| 12.84 |
| 2,871,310 |
| 11.11 |
| 3,338,959 |
| 10.50 |
| ||||||||||||||||||||||
|
|
|
|
|
|
|
|
|
|
|
|
|
| ||||||||||||||||||||||
Options exercisable |
| 1,719,184 |
| $ | 12.34 |
| 2,113,535 |
| $ | 9.81 |
| 2,102,247 |
| $ | 8.31 |
| |||||||||||||||||||
|
|
|
|
|
|
|
|
|
|
|
|
|
| ||||||||||||||||||||||
|
|
|
|
|
|
|
| ||||||||||||||||||||||||||||
|
| 2006 |
| 2005 |
| 2004 |
|
| 2007 |
| 2006 |
| 2005 |
| |||||||||||||||||||||
All Other Option Grants, Excluding |
| Underlying |
| Weighted |
| Underlying |
| Weighted |
| Underlying |
| Weighted |
|
| Underlying |
| Weighted |
| Underlying |
| Weighted |
| Underlying |
| Weighted |
| |||||||||
Options outstanding—beginning of year |
| 7,795,848 |
| $ | 11.96 |
| 7,394,248 |
| $ | 10.67 |
| 7,556,364 |
| $ | 10.62 |
|
| 6,098,594 |
| $ | 12.55 |
| 7,795,848 |
| $ | 11.96 |
| 7,394,248 |
| $ | 10.67 |
| |||
Granted |
| 46,551 |
| 34.63 |
| 1,077,084 |
| 19.64 |
| — |
| — |
|
| — |
| — |
| 46,551 |
| 34.63 |
| 1,077,084 |
| 19.64 |
| |||||||||
Canceled |
| (85,697 | ) | 21.77 |
| (98,451 | ) | 13.79 |
| (80,705 | ) | 11.69 |
|
| (39,216 | ) | 20.12 |
| (85,697 | ) | 21.77 |
| (98,451 | ) | 13.79 |
| |||||||||
Exercised |
| (1,658,108 | ) | 10.46 |
| (577,033 | ) | 10.24 |
| (81,411 | ) | 5.45 |
|
| (1,682,289 | ) | 10.07 |
| (1,658,108 | ) | 10.46 |
| (577,033 | ) | 10.24 |
| |||||||||
Options outstanding—end of year |
| 6,098,594 |
| 12.55 |
| 7,795,848 |
| 11.96 |
| 7,394,248 |
| 10.67 |
|
| 4,377,089 |
| 13.61 |
| 6,098,594 |
| 12.55 |
| 7,795,848 |
| 11.96 |
| |||||||||
|
|
|
|
|
|
|
|
|
|
|
|
|
|
|
|
|
|
|
|
|
|
|
|
|
|
| |||||||||
Options exercisable |
| 5,142,327 |
| $ | 11.33 |
| 6,193,670 |
| $ | 10.79 |
| 6,011,684 |
| $ | 10.61 |
|
| 3,890,824 |
| $ | 12.49 |
| 5,142,327 |
| $ | 11.33 |
| 6,193,670 |
| $ | 10.79 |
| |||
The total intrinsic value (difference between the market value of our stock on the date of exercise and the exercise price of the option) of options exercised during 2007, 2006, and 2005 was $133,509,000, $66,655,000, and 2004 was $66,655,000, $13,095,000, and $23,000, respectively.
84
Stock Options Outstanding and Exercisable
The table below shows additional information for options outstanding and options exercisable as of December 31, 2006:2007:
|
| Options Outstanding |
| Options Exercisable |
| |||||||||||||||||||
Range of Exercise Prices |
| Outstanding |
| Weighted |
| Weighted |
| Aggregate |
| Exercisable |
| Weighted |
| Weighted |
| Aggregate |
| |||||||
$2.00 - $2.77 |
| 1,752,775 |
| 1.68 |
| $ | 2.53 |
| $ | 74,530 |
| 1,672,914 |
| 1.66 |
| $ | 2.52 |
| $ | 71,148 |
| |||
$8.57 - $14.70 |
| 4,973,167 |
| 4.00 |
| 12.64 |
| 161,176 |
| 4,798,208 |
| 3.91 |
| 12.79 |
| 154,799 |
| |||||||
$16.05 - $36.16 |
| 2,243,962 |
| 8.12 |
| 18.38 |
| 59,850 |
| 784,740 |
| 8.03 |
| 17.23 |
| 21,833 |
| |||||||
$2.00 - $36.16 |
| 8,969,904 |
| 4.58 |
| 12.10 |
| $ | 295,556 |
| 7,255,862 |
| 3.84 |
| 10.90 |
| $ | 247,780 |
| |||||
Vested or Expected to Vest |
|
|
|
|
|
|
|
|
|
|
|
|
|
|
|
|
| |||||||
$2.00 - $36.16 |
| 8,892,416 |
| 4.54 |
| $ | 12.04 |
| $ | 293,543 |
|
|
|
|
|
|
|
|
| |||||
|
| Options Outstanding |
| Options Exercisable |
| |||||||||||||||||
Range of Exercise Prices |
| Outstanding |
| Weighted |
| Weighted |
| Aggregate |
| Exercisable |
| Weighted |
| Weighted |
| Aggregate |
| |||||
$ | 2.00 - $2.77 |
| 673,477 |
| 0.73 |
| $ | 2.56 |
| $ | 50,638 |
| 636,713 |
| 0.71 |
| $ | 2.55 |
| $ | 47,881 |
|
$ | 8.57 - $14.70 |
| 3,992,872 |
| 2.93 |
| 12.57 |
| 260,246 |
| 3,991,767 |
| 2.93 |
| 12.57 |
| 260,171 |
| ||||
$ | 16.74 - $37.78 |
| 1,779,330 |
| 7.12 |
| 19.21 |
| 104,157 |
| 981,528 |
| 7.05 |
| 18.35 |
| 58,304 |
| ||||
$ | 2.00 - $37.78 |
| 6,445,679 |
| 3.86 |
|
| 13.36 |
| $ | 415,041 |
| 5,610,008 |
| 3.40 |
|
| 12.45 |
| $ | 366,356 |
|
Vested or Expected to Vest: |
|
|
|
|
|
|
|
|
|
|
|
|
|
|
|
|
| |||||
$ | 2.00 - $37.78 |
| 6,347,587 |
| 3.84 |
| $ | 13.34 |
| $ | 408,825 |
|
|
|
|
|
|
|
|
| ||
104
The aggregate intrinsic value in the tables above represents the total pretax intrinsic value, based on our closing stock price of $45.05$77.75 on December 29, 2006 (the last day of trading in 2006),31, 2007, which would have been received by the option holders had all option holders exercised their options as of that date.
As of December 31, 2006,2007, the total amount of unrecognized stock-based compensation expense related to stock options was approximately $11,362,000,$4,710,000, which is expected to be recognized over a weighted average period of approximately 2213 months.
12. Related Party Transactions
In 1989, under our 1989 Nonqualified Stock Option Plan (the 1989 Plan), we granted options to purchase 1,500,000 shares of common stock at an exercise price of $0.075 per share, equal to the fair value at date of issue, to Don Phillips, an officer of Morningstar. These options were not exercised and expired in February 1999. In February 1999, in conjunction with the expiration of options granted under the 1989 Plan, we entered into a Deferred Compensation Agreement (the Agreement) with Don. Under the terms of the Agreement, on any date that heDon exercises the right to purchase shares under the 1999 Plan, we shall pay to him $2.69 per share in the form of cash or, at our election, shares of common stock. If on the date of purchase the fair value of Morningstar’s stock is below $2.77 per share, the amount paid per share will be reduced based on the terms of the Agreement. Our obligation to pay deferred compensation will not be increased by any imputed interest or earnings amount.
In May 2006, Don Phillips entered into a Rule 10b5-1 plan contemplating the sale of up to 450,000 shares to be acquired through stock option exercises during 2006 and 2007.exercises. Upon exercise of thesecertain stock options, we will make payments to him, as prescribed by the Agreement, which, if all 450,000 stock options are exercised, would total $1,210,500. These payments would reduce the liability associated with the Agreement. In 2006,2007, Don exercised 159,000492,888 options, of which 140,000439,600 were sold under his 10b5-1 plan. As of December 31, 20062007 and 2005, a liability of $1,963,000 and $2,340,000, respectively, for the Agreement is recorded inDecember 31, 2006, our Consolidated Balance Sheets primarilyinclude a liability of $585,000 and $1,963,000, respectively, for the Agreement. The liability is classified as “Other current liabilities.”liabilities” at December 31, 2007. The reduction in the liability since December 31, 2006 reflects amounts paid to Don in 20062007 in accordance with the Agreement.
13. Defined Contribution Profit-Sharing Plan
We sponsor a defined contribution 401(k) plan, which allows our U.S.-based employees to voluntarily contribute pre-tax dollars up to a maximum amount allowable by the U.S. Internal Revenue Service. We contribute an amount equal to the employee’s contributions, up to 7% of the employee’s salary. Our matching contributions were $5,840,000, $4,839,000, $3,717,000, and $3,221,000,$3,717,000, for the years ended December 31, 2007, 2006, and 2005, and 2004, respectively.
85
14. Non-Operating Income
The following table presents the components of net non-operating income:
($000) |
| 2006 |
| 2005 |
| 2004 |
|
| 2007 |
| 2006 |
| 2005 |
| ||||||
Interest income, net |
| $ | 4,623 |
| $ | 3,078 |
| $ | 1,211 |
|
| $ | 7,134 |
| $ | 4,623 |
| $ | 3,078 |
|
Other income (expense), net |
| (459 | ) | 121 |
| 594 |
|
| (905 | ) | (459 | ) | 121 |
| ||||||
Non-operating income, net |
| $ | 4,164 |
| $ | 3,199 |
| $ | 1,805 |
|
| $ | 6,229 |
| $ | 4,164 |
| $ | 3,199 |
|
Interest income net primarily reflects interest from our investment portfolio. Other income (expense), net primarily represents foreign currency exchange gains and losses arising from the ordinary course of business related to our non-U.S. operations, unrealized and realized gains and losses from our investment portfolio, and royalty income from MJKK.
105
15. Income Taxes
Effective Income Tax Rate
The following table shows our effective income tax expense rate:
($000) |
| 2006 |
| 2005 |
| 2004 |
| |||||||
Income before income taxes, equity in net income of unconsolidated entities, and |
| $ | 81,691 |
| $ | 49,679 |
| $ | 19,540 |
| ||||
Equity in net income of unconsolidated entities |
| 2,787 |
| 1,662 |
| 843 |
| |||||||
Total |
| $ | 84,478 |
| $ | 51,341 |
| $ | 20,383 |
| ||||
Income tax expense |
| $ | 32,975 |
| $ | 20,224 |
| $ | 11,574 |
| ||||
Effective income tax expense rate |
| 39.0 | % | 39.4 | % | 56.8 | % | |||||||
The following table provides our income before income taxes, equity in net income of unconsolidated entities, and cumulative effect of accounting change, generated by our U.S. and non-U.S. operations:
($000) |
| 2006 |
| 2005 |
| 2004 |
| |||
U.S. |
| $ | 79,391 |
| $ | 48,580 |
| $ | 22,178 |
|
Non-U.S. |
| 2,300 |
| 1,099 |
| (2,638 | ) | |||
Income before income taxes, equity in net income of unconsolidated entities, and cumulative effect of accounting change |
| $ | 81,691 |
| $ | 49,679 |
| $ | 19,540 |
|
The following table reconciles our income tax expense at the U.S. federal income tax rate of 35% to income tax expense as recorded:
|
| 2006 |
| 2005 |
| 2004 |
| ||||||||||
($000, except percentages) |
|
|
| % |
|
|
| % |
|
|
| % |
| ||||
Income tax expense at U.S. federal rate |
| $ | 29,567 |
| 35.0 | % | $ | 17,969 |
| 35.0 | % | $ | 7,134 |
| 35.0 | % | |
State income taxes, net of federal income tax |
| 3,722 |
| 4.4 |
| 2,419 |
| 4.7 |
| 1,670 |
| 8.2 |
| ||||
Impact of equity in net income of |
| (839 | ) | (1.0 | ) | (494 | ) | (0.9 | ) | (295 | ) | (1.4 | ) | ||||
Stock option activity |
| 333 |
| 0.4 |
| 1,716 |
| 3.3 |
| 2,351 |
| 11.5 |
| ||||
Disqualifying dispositions on incentive stock |
| (483 | ) | (0.6 | ) | (441 | ) | (0.9 | ) | (78 | ) | (0.4 | ) | ||||
Non-U.S. withholding taxes, net of federal |
| 456 |
| 0.5 |
| — |
| — |
| — |
| — |
| ||||
Reversal of valuation allowance related to |
| (1,013 | ) | (1.2 | ) | — |
| — |
| — |
| — |
| ||||
Non-U.S. income tax reserve |
| 947 |
| 1.1 |
| — |
| — |
| — |
| — |
| ||||
Difference between U.S. federal statutory and |
| (191 | ) | (0.2 | ) | 115 |
| 0.2 |
| 366 |
| 1.8 |
| ||||
Research and development costs |
| — |
| — |
| (588 | ) | (1.1 | ) | — |
| — |
| ||||
Other — net |
| 476 |
| 0.6 |
| (472 | ) | (0.9 | ) | 426 |
| 2.1 |
| ||||
Total income tax expense |
| $ | 32,975 |
| 39.0 | % | $ | 20,224 |
| 39.4 | % | $ | 11,574 |
| 56.8 | % | |
($000) |
| 2007 |
| 2006 |
| 2005 |
| |||
Income before income taxes, equity in net income of unconsolidated entities, and cumulative effect of accounting change |
| $ | 123,483 |
| $ | 81,691 |
| $ | 49,679 |
|
Equity in net income of unconsolidated entities |
| 1,694 |
| 2,787 |
| 1,662 |
| |||
Total |
| $ | 125,177 |
| $ | 84,478 |
| $ | 51,341 |
|
Income tax expense |
| $ | 51,255 |
| $ | 32,975 |
| $ | 20,224 |
|
Effective income tax rate |
| 40.9% |
| 39.0% |
| 39.4% |
| |||
Our effective income tax rate in 2007 is influenced by three primary factors: incentive stock options;U.S. state income taxes, the reported income or loss of our non-U.S. entities and our evaluation of the realizability of their net operating losses; and the impact of specific tax planning strategies. Incentive stock options also influenced our effective tax rate in 2007, but to a much lesser extent than in previous years.
The following table reconciles our income tax expense at the U.S. federal income tax rate of 35% to income tax expense as recorded:
|
| 2007 |
| 2006 |
| 2005 |
| |||||||||
($000, except percentages) |
| Amount |
| % |
| Amount |
| % |
| Amount |
| % |
| |||
Income tax expense at U.S. federal rate |
| $ | 43,800 |
| 35.0 | % | $ | 29,567 |
| 35.0 | % | $ | 17,969 |
| 35.0 | % |
State income taxes, net of federal income tax benefit |
| 6,252 |
| 5.0 |
| 3,722 |
| 4.4 |
| 2,419 |
| 4.7 |
| |||
State income taxes, impact of enacted law change on deferred tax assets |
| 761 |
| 0.6 |
| — |
| — |
| — |
| — |
| |||
Impact of equity in net income of unconsolidated entities |
| (436 | ) | (0.3 | ) | (839 | ) | (1.0 | ) | (494 | ) | (0.9 | ) | |||
Stock option activity |
| 432 |
| 0.3 |
| 333 |
| 0.4 |
| 1,716 |
| 3.3 |
| |||
Disqualifying dispositions on incentive stock options |
| (241 | ) | (0.2 | ) | (483 | ) | (0.6 | ) | (441 | ) | (0.9 | ) | |||
Non-U.S. withholding taxes, net of federal income tax effect |
| 311 |
| 0.2 |
| 456 |
| 0.5 |
| — |
| — |
| |||
Net change in valuation allowance related to non-U.S. deferred tax assets, primarily net operating losses |
| (1,921 | ) | (1.5 | ) | (1,013 | ) | (1.2 | ) | — |
| — |
| |||
Difference between U.S. federal statutory and foreign tax rates |
| (810 | ) | (0.6 | ) | (191 | ) | (0.2 | ) | 115 |
| 0.2 |
| |||
Research and development costs |
| — |
| — |
| — |
| — |
| (588 | ) | (1.1 | ) | |||
Change in unrecognized tax benefits |
| 2,711 |
| 2.2 |
| 947 |
| 1.1 |
| — |
| — |
| |||
Other – net |
| 396 |
| 0.2 |
| 476 |
| 0.6 |
| (472 | ) | (0.9 | ) | |||
Total income tax expense |
| $ | 51,255 |
| 40.9 | % | $ | 32,975 |
| 39.0 | % | $ | 20,224 |
| 39.4 | % |
In 2004 and in the first quarter of 2005, we recorded stock-based compensation expense related to incentive stock options but we did not record a corresponding tax benefit. This had the impact of increasing2007, our effective income tax rate aboveincreased 1.9 percentage points compared with the prior year. The increase reflects a higher overall U.S. federalstate tax rate and additional state income tax expense related to a change in state tax law enacted in 2007. As a result of 35%. Subsequentthis tax law change, we expect to realize a lower tax benefit when we use our initial public offeringnet deferred tax assets in May 2005, we no longer account for incentive stock options underfuture periods. We therefore reduced the liabilityvalue of our deferred tax assets and recorded a corresponding increase to income tax expense as of the date of enactment. Our effective tax rate was also impacted due to an increase in unrecognized tax benefits.
86106
method, and because they are fully vested, no stock-based compensation expense was recorded for these options in the last nine months of 2005 or in 2006.
Incentive stock options also impact our effective tax rate once a disqualifying disposition occurs. A disqualifying disposition occurs when the option holder sells shares within one year of exercising an incentive stock option. We receive a tax benefit when a disqualifying disposition occurs. A disqualifying disposition reduces our effective income tax rate.
Our effective income tax expense rate also reflects the fact that we are not recording an income tax benefit related to losses recorded by certain of our non-U.S. operations. The net operating losses (NOLs) may become deductible in certain non-U.S. tax jurisdictions to the extent these non-U.S. operations become profitable. In the year certain non-U.S. entities record a loss, we do not record a corresponding tax benefit, thus increasing our effective tax rate. For each of our operations, we evaluate whether it is more likely than not that the tax benefits related to net operating lossesNOLs will be realized. As part of this evaluation, we consider evidence such as tax planning strategies, historical operating results, forecasted taxable income, and recent financial performance.
We establish reserves at the time that we determine Upon determining that it is more likely than not that the NOLs will be realized, we will need to pay additional taxesreduce the tax valuation allowances related to certain matters. We adjust these reserves, including any impact of the related interest and penalties,NOLs, which results in light of changing facts and circumstances such as the progress of a tax audit. A number of years may elapse before a particular matter for which we have established a reserve is audited and finally resolved. The number of years with open tax audits varies depending on the tax jurisdiction. While it is often difficult to predict the final outcome or the timing of resolution of any particular tax matter, we record a reserve when we determine the likelihood of loss is more likely than not. These liabilities are recorded as income taxes payable in our Consolidated Balance Sheets and are not material to our Consolidated Balance Sheets. Settlement of any particular issue would usually require the use of cash. Favorable resolutions of tax matters for which we have previously established reserves are recognized as a reduction to our income tax expense and our effective income tax rate in the period. In 2007 and 2006, based on our evaluations, we recorded a net reduction of the valuation allowances related to the NOLs for certain of our non-U.S. operations, reducing our effective tax rate in each of these years.
Incentive stock options impact our effective tax rate once a disqualifying disposition occurs. A disqualifying disposition occurs when the amounts involved become known.option holder sells shares within one year of exercising an incentive stock option. We receive a tax benefit when a disqualifying disposition occurs. A disqualifying disposition reduces our effective income tax rate.
Income tax expense consists of the following:
($000) |
| 2006 |
| 2005 |
| 2004 |
| ||||||
Federal – deferred |
| $ | (1,147 | ) | $ | 411 |
| $ | 1,043 |
| |||
Federal – current |
| 27,163 |
| 15,625 |
| 8,652 |
| ||||||
State – deferred |
| (200 | ) | 92 |
| 352 |
| ||||||
State – current |
| 5,832 |
| 3,515 |
| 2,084 |
| ||||||
Non-U.S. – deferred |
| (577 | ) | 80 |
| (565 | ) | ||||||
Non-U.S. – current |
| 1,904 |
| 501 |
| 8 |
| ||||||
Income tax expense |
| $ | 32,975 |
| $ | 20,224 |
| $ | 11,574 |
| |||
($000) |
| 2007 |
| 2006 |
| 2005 |
| |||
Current: |
|
|
|
|
|
|
| |||
U.S. |
|
|
|
|
|
|
| |||
Federal |
| $ | 36,425 |
| $ | 27,163 |
| $ | 15,625 |
|
State |
| 9,697 |
| 5,832 |
| 3,515 |
| |||
Non-U.S. |
| 3,544 |
| 1,904 |
| 501 |
| |||
|
| 49,666 |
| 34,899 |
| 19,641 |
| |||
Deferred: |
|
|
|
|
|
|
| |||
U.S. |
|
|
|
|
|
|
| |||
Federal |
| 187 |
| (1,147 | ) | 411 |
| |||
State |
| 1,352 |
| (200 | ) | 92 |
| |||
Non-U.S. |
| 50 |
| (577 | ) | 80 |
| |||
|
| 1,589 |
| (1,924 | ) | 583 |
| |||
Income tax expense |
| $ | 51,255 |
| $ | 32,975 |
| $ | 20,224 |
|
87The following table provides our income before income taxes, equity in net income of unconsolidated entities, and cumulative effect of accounting change, generated by our U.S. and non-U.S. operations:
($000) |
| 2007 |
| 2006 |
| 2005 |
| |||
U.S. |
| $ | 107,774 |
| $ | 79,391 |
| $ | 48,580 |
|
Non-U.S. |
| 15,709 |
| 2,300 |
| 1,099 |
| |||
Income before income taxes, equity in net income of unconsolidated entities, and cumulative effect of accounting change |
| $ | 123,483 |
| $ | 81,691 |
| $ | 49,679 |
|
107
Deferred Tax Assets and Liabilities
We recognize deferred income taxes for the temporary differences between the carrying amount of assets and liabilities for financial statement purposes and their tax basis. The tax effects of the temporary differences that give rise to the deferred income tax assets and liabilities are as follows:
|
| Dec. 31, 2006 |
| Dec. 31, 2005 |
| ||||||||||||||||||||
|
|
|
|
|
|
|
|
|
|
|
|
|
|
|
|
|
| ||||||||
($000) |
| Current |
| Current |
| Non-current |
| Non-current |
| Current |
| Current |
| Non-current |
| Non-current |
| ||||||||
Net operating loss |
| $ | — |
| $ | — |
| $ | 1,402 |
| $ | — |
| $ | — |
| $ | — |
| $ | 1,614 |
| $ | — |
|
Net operating loss |
| — |
| — |
| 1,422 |
| — |
| 143 |
| — |
| — |
| — |
| ||||||||
Stock-based |
| — |
| — |
| 21,415 |
| — |
| — |
| — |
| 23,633 |
| — |
| ||||||||
Deferred revenue |
| — |
| — |
| — |
| — |
| — |
| (847 | ) | — |
| — |
| ||||||||
Property, equipment, |
| — |
| — |
| 2,845 |
| — |
| — |
| — |
| 1,050 |
| — |
| ||||||||
Deferred rent |
| — |
| — |
| 338 |
| — |
| — |
| — |
| 190 |
| — |
| ||||||||
Allowance for |
| 389 |
| — |
| — |
| — |
| 167 |
| — |
| — |
| — |
| ||||||||
Prepaid expenses |
| — |
| (2,025 | ) | — |
| — |
| — |
| (1,133 | ) | — |
| — |
| ||||||||
Deferred royalty |
| — |
| — |
| 562 |
| — |
| — |
| — |
| 586 |
| — |
| ||||||||
Accrued liabilities |
| — |
| (16 | ) | 4,256 |
| — |
| 891 |
| — |
| 1,700 |
| — |
| ||||||||
Foreign exchange |
| 346 |
| — |
| — |
| — |
| — |
| — |
| — |
| (6 | ) | ||||||||
Alternative Minimum |
| — |
| — |
| — |
| — |
| — |
| — |
| 294 |
| — |
| ||||||||
Research and |
| — |
| — |
| 668 |
| — |
| — |
| — |
| 668 |
| — |
| ||||||||
Unrealized loss on |
| 31 |
| — |
| — |
| — |
| — |
| (54 | ) | — |
| — |
| ||||||||
Acquired intangible |
| — |
| — |
| — |
| (19,844 | ) | — |
| — |
| — |
| — |
| ||||||||
Other |
| 36 |
| (27 | ) | 736 |
| (11 | ) | — |
| — |
| — |
| — |
| ||||||||
|
| $ | 802 |
| $ | (2,068 | ) | $ | 33,644 |
| $ | (19,855 | ) | $ | 1,201 |
| $ | (2,034 | ) | $ | 29,735 |
| $ | (6 | ) |
|
| December 31 |
| ||||
Deferred Tax Assets (Liabilities) ($000) |
| 2007 |
| 2006 |
| ||
Deferred tax assets: |
|
|
|
|
| ||
Stock-based compensation expense |
| $ | 15,562 |
| $ | 21,415 |
|
Accrued liabilities |
| 10,572 |
| 4,256 |
| ||
Property, equipment, and capitalized software |
| 4,498 |
| 2,845 |
| ||
Net operating loss carryforwards – U.S. |
| 1,323 |
| 1,402 |
| ||
Net operating loss carryforwards – Non-U.S. |
| 6,379 |
| 8,591 |
| ||
Research and development |
| 628 |
| 668 |
| ||
Deferred royalty revenue |
| 532 |
| 562 |
| ||
Allowance for doubtful accounts |
| 354 |
| 389 |
| ||
Deferred rent |
| 313 |
| 338 |
| ||
Other |
| 180 |
| 1,149 |
| ||
Total deferred tax assets |
| 40,341 |
| 41,615 |
| ||
|
|
|
|
|
| ||
Deferred tax liabilities: |
|
|
|
|
| ||
Acquired intangible assets |
| (17,655 | ) | (19,844 | ) | ||
Prepaid expenses |
| (2,149 | ) | (2,025 | ) | ||
Other |
| (827 | ) | (54 | ) | ||
Total deferred tax liabilities |
| (20,631 | ) | (21,923 | ) | ||
Net deferred tax assets before valuation allowance |
| 19,710 |
| 19,692 |
| ||
Valuation allowance |
| (4,609 | ) | (7,169 | ) | ||
Net deferred tax assets |
| $ | 15,101 |
| $ | 12,523 |
|
A portionThe deferred tax assets and liabilities are included in our Consolidated Balance Sheets as follows:
|
| December 31 |
| ||||
Deferred Tax Assets (Liabilities) ($000) |
| 2007 |
| 2006 |
| ||
Deferred tax liability, net – current |
| $ | (557 | ) | $ | (1,266 | ) |
Deferred tax asset, net – non-current |
| 15,658 |
| 13,789 |
| ||
Net deferred tax assets |
| $ | 15,101 |
| $ | 12,523 |
|
As of the NOLs generated by mPowerDecember 31, 2007, we have a U.S. net operating loss (NOL) carryforward of $3,486,000 which will expire in the years prior to July 2003 (the date of acquisition) is available to Morningstar.2022. Because of limitations on the use of the NOLsNOL imposed by the U.S. Internal Revenue Code, our use of the NOLsNOL is limited to approximately $224,000 per year. We have NOL carryforwards of $22,385,000 related to our non-U.S. operations as of December 31, 2007. Of these NOLs, approximately $4,635,000 will begin to expire beginning in 2013 through 2020 and $17,750,000 have no expiration date. We have recorded a valuation allowance against all but approximately $7,104,000 of these NOLs. Further, we do not expect significant changes to our liability for uncertain tax positions in 2008 due to lapses of statutes of limitations.
As of December 31, 2006 the remaining U.S. NOL carryforward of $3,714,000 will expire in 2022.
In addition, as of December 31, 2006 we havehad NOL carryforwards of approximately $28,400,000 related to our non-U.S. operations. Of these NOLs, approximately $9,300,000 will begin to expire in 2008 through 2021operations and $19,100,000 have no expiration date. Because of the historical operating losses of the non-U.S. operations that generated these NOLs, we havehad recorded a valuation allowance against all but approximately $6,000,000 of these NOLs, reflectingNOLs.
Federal and state income taxes have not been provided on accumulated undistributed earnings of certain foreign subsidiaries aggregating approximately $4,500,000 at December 31, 2007, as such earnings have been permanently reinvested. The determination of the likelihoodamount of the unrecognized deferred tax liability related to the undistributed earnings is not practicable.
108
Accounting for Uncertainty in Tax Positions
We conduct business globally and as a result, we file income tax returns in U.S. Federal, state, local, and foreign jurisdictions. In the normal course of business we are subject to examination by tax authorities throughout the world. During 2007, the statute of limitations lapsed on our 2003 U.S. Federal tax return. In addition, the audit of our 2004 U.S. Federal tax return was closed during the year without change to the 2004 tax liability. The open tax years for our U.S. Federal tax return include the years 2004 to the present. Most of our state tax returns have open tax years from 2004 to the present. In non-U.S. jurisdictions, the statute of limitations generally extends to years prior to 2003. There were no significant changes to uncertain tax positions in 2007 due to lapses of statutes of limitation or audit activity. Further, we do not expect significant changes to our liability for uncertain tax positions in 2008 due to lapses of statutes of limitations.
We are currently under audit by various state and local tax authorities in the United States. We are also under audit by the tax authorities in certain non-U.S. jurisdictions. It is likely that the benefitexamination phase of some of these state, local, and non-U.S. audits will conclude in 2008. It is not possible to estimate the impact of current audits on previously recorded unrecognized tax benefits.
A reconciliation of the NOLs willbeginning and ending amount of the gross unrecognized tax benefits is as follows:
Gross Unrecognized tax benefits |
| ($000) |
| |
Gross unrecognized tax benefits as of January 1, 2007 |
| $ | 2,691 |
|
Increases as a result of tax positions taken during a prior year period |
| 1,520 |
| |
Increases as a result of tax positions taken during the current period |
| 2,984 |
| |
Decreases relating to settlements with tax authorities |
| — |
| |
Reductions as a result of lapse of the applicable statute of limitations |
| — |
| |
Gross unrecognized tax benefits as of December 31, 2007 |
| $ | 7,195 |
|
As of December 31, 2007 we had approximately $7,195,000 of gross unrecognized tax benefits, of which $4,741,000, if recognized, would result in a reduction of our effective income tax rate. The increase in the unrecognized tax benefits recorded in 2007 includes $2,383,000 of tax positions for which the ultimate deductibility is highly certain but for which there is uncertainty about the timing of the deduction. In recording this unrecognized tax benefit we also increased our deferred tax assets. Because of the impact of deferred tax accounting, other than interest and penalties, this liability did not be realized.affect our 2007 effective tax rate. The remaining increase in gross unrecognized tax benefits was recorded, net of any tax benefits, to income tax expense in our Consolidated Statement of Income for the year ended December 31, 2007.
As of December 31, 2005,2007, and 2006, we had NOL carryforwardsgross liabilities for interest and penalties of approximately $26,319,000 related$869,000 and $99,000, respectively. The increase in the liability was recorded, net of any tax benefits, to income tax expense in our non-U.S. operations. BecauseConsolidated Statement of the historical operating losses of the non-U.S. operations that generated these NOLs, we had recorded a valuation allowance against all but approximately $396,000 of these NOLs, reflecting the likelihood that the benefit of the NOLs would not be realized.Income in 2007.
16. Contingencies
Morningstar Australia
In 2001, Mr. Graham Rich, the then managing director and chief executive officer of Morningstar Research Pty Limited (Morningstar Australia), and one of two companies controlled by Mr. Rich, filed a suit in the Supreme Court of New South Wales, Australia against Morningstar and certain of its officers and nominee directors on the board of Morningstar Australia. Mr. Rich was also a beneficial owner of shares in Morningstar Australia. Mr. Rich and his company originally sought an injunction which, if granted, would have precluded Morningstar Australia from terminating the services of Mr. Rich and from issuing additional shares to Morningstar in exchange for the provision of further funding by Morningstar to Morningstar Australia. Further, Mr. Rich and his company sought an order that a provisional liquidator be appointed for Morningstar Australia. The court rejected this injunction application, observing that Morningstar Australia would be insolvent without financial backing from Morningstar.application. The application for the appointment of a provisional liquidator also failed. The services of Mr. Rich were terminated in November 2001. Mr. Rich and his company were ordered to pay Morningstar’s costs of the injunction proceedings.
88109
Mr. Rich and the two companies controlled by Mr. Rich havethereafter filed additional pending claims, alleging among other things, breaches by Morningstar of contracts and statutory and general law duties, misleading, deceptive, and unconscionable conduct by Morningstar, oppression by Morningstar and its nominee directors, claims under the Industrial Relations Act of New South Wales, breaches of directors’ duties by Morningstar’s nominee directors, and conflict of interest. The claims seeksought various forms of relief, including monetary damages in the amount of Australian $25,000,000, the setting aside of transactions which resulted in Morningstar obtaining control of Morningstar Australia, and an order either setting aside Morningstar’s acquisition of the shares formerly beneficially owned by Mr. Rich and his companies or determining a different price for this acquisition. In the alternative, Mr. Rich and his companies seeksought an order that they be entitled to purchase the shares in Morningstar Australia at a price to be determined by the court or book value (as defined in the Morningstar Australia shareholders agreement). Morningstar has denied the claims and filed counter-claims against Mr. Rich and certain of his companies, alleging breaches of statutory, general law, and contractual duties.
In July 2004, the court decided Morningstar’s application for security for its potential additional costs in the litigation by ordering the two companies controlled by Mr. Rich to provide approximately Australian $925,000 to the court as security for these potential costs. Morningstar has been paid some of its costs and will be entitled to be paid its costs in the future only if the court makes a determination to that effect. The court stayed the proceedings pending its receipt of the security and indicated that it would entertain an application by Morningstar for additional security at a later time in the proceedings.
In May 2005, Mr. Rich obtained conditional leave of the court to begin a proceeding in the name of Morningstar Australia against Morningstar and its nominee directors. The leave was, however, subject to the following conditions: (i) Mr. Rich must pay and bear, and indemnify Morningstar Australia against, all costs, charges, and expenses of and incidental to the bringing and continuation of the proceeding (except as the court may otherwise direct or allow) and may not seek contribution or indemnity from Morningstar Australia for any of these costs, charges, or expenses; (ii) Morningstar Australia, or Mr. Rich on its behalf, together with the two companies controlled by Mr. Rich were required to provide to the court, as security for Morningstar’s costs, approximately Australian $925,000 as described in the preceding paragraph; and (iii) approximately Australian $100,000 in costs owed by Mr. Rich and one of his companies to Morningstar in respect of the 2001 injunction proceedings were required to be paid to Morningstar. These conditions have been satisfied.
In September 2005, Mr. Rich and his companies filed a Second Further Amended Statement of Claim, consolidating the claims. Morningstar filed a Defence to that pleading and an Amended Cross-Claim against Mr. Rich, both his companies, and a third Australian company controlled by Mr. Rich.
In December 2006, Morningstar applied to the court for further security for its potential additional costs in the litigation. The court has not yet held a hearing for this application.
In February 2007, Mr. Rich and his companies notified Morningstar that they would be seeking the leave of the court to amend the Second Further Amended Statement of Claim to include a claim relating to Morningstar’s acquisition of Aspect Huntley Pty Ltd. (Aspect) in 2006. The amended claim alleges various breaches of obligations owed by Morningstar to Morningstar Australia and seeks various forms of relief, including an equity interest in Aspect and compensatory damages. The court has not yet granted leave to allow the amendment to proceed.
The parties have discussed settling the claims but have been unable to reach an agreement. In the fourth quarter of 2003, Morningstar offered to settle all claims for Australian $1,250,000, which then approximated U.S. $942,000, and, in accordance with SFAS No. 5,Accounting for Contingencies, Morningstar recorded a reserve in this amount. In December 2005, Morningstar increased its offer to settle all claims to approximately Australian $2,500,000 which at December 31, 2006(which then approximated U.S. $2,000,000,$1,800,000) and in accordance with SFAS No. 5, Morningstar hashad a reserve recorded in this amount. While
In August 2007, the parties agreed to a settlement pursuant to which the parties dismissed and released all claims in the proceedings and Morningstar is vigorously contestingpaid Australian $4,000,000 (approximately U.S. $3,300,000) at the claims against it, we cannot predictdate of settlement. This amount was higher than the outcomepreviously recorded reserve of Australian $2,500,000 (approximately U.S. $2,100,000 at the settlement date). We recorded about $900,000 of the proceeding.difference as legal expense. We accounted for the remainder as an adjustment to the goodwill we initially recorded when we acquired Morningstar Australia in 2001.
Morningstar Associates, LLC Subpoenas from Securities and Exchange Commission, New York Attorney General’s Office, and the Department of Labor
Securities and Exchange Commission
In February 2005, Morningstar Associates, LLC, a wholly owned subsidiary of Morningstar, Inc., received a request from the Securities and Exchange Commission (SEC)SEC for the voluntary production of documents relating to the investment consulting services the company offers to retirement plan providers, including fund lineup recommendations for retirement plan sponsors. In July 2005, the SEC issued a subpoena to Morningstar Associates that was virtually identical to its February 2005 request.
Subsequently, the SEC focused on disclosure relating to an optional service offered to retirement plan sponsors (employers) that select 401(k) plan services from ING, one of Morningstar Associates’ clients. In response to the SEC investigation, ING and Morningstar Associates revised certain documents for plan sponsors to further clarify the roles of ING and Morningstar Associates in providing that service. The revisions also help reinforce that Morningstar Associates makes its selections only from funds available within ING’s various retirement products.
89
OnIn January 24, 2007, the SEC notified Morningstar Associates that it ended its investigation, with no enforcement action, fines, or penalties.
110
New York Attorney General’s Office
In December 2004, Morningstar Associates received a subpoena from the New York Attorney General’s office seeking information and documents related to an investigation the New York Attorney General’s office is conducting. The request is similar in scope to the SEC subpoena described above. Morningstar Associates has provided the requested information and documents and continues to cooperate fully with the New York Attorney General’s office.documents.
In January 2007, Morningstar Associates received a Notice of Proposed Litigation from the New York Attorney General’s office. The Notice centers on the same issues that became the focus of the SEC investigation described above. The Notice gave Morningstar Associates the opportunity to explain why the New York Attorney General’s office should not institute proceedings. Morningstar Associates promptly submitted its explanation. To date,explanation and has cooperated fully with the New York Attorney General’s office has not taken any further action.office.
We cannot predict the scope, timing, or outcome of this matter, which may include the institution of administrative, civil, injunctive, or criminal proceedings, the imposition of fines and penalties, and other remedies and sanctions, any of which could lead to an adverse impact on our stock price, the inability to attract or retain key employees, and the loss of customers. We also cannot predict what impact, if any, this matter may have on our business, operating results, or financial condition.
United States Department of Labor
In May 2005, Morningstar Associates received a subpoena from the United States Department of Labor, seeking information and documents related to an investigation the Department of Labor is conducting. The Department of Labor subpoena is substantially similar in scope to the SEC and New York Attorney General subpoenas.
In January 2007, the Department of Labor issued a request for additional documents pursuant to the May 2005 subpoena, including documents and information regarding Morningstar Associates’ retirement advice products for plan participants. Morningstar Associates continues to cooperate fully with the Department of Labor.
We cannot predict the scope, timing, or outcome of this matter, which may include the institution of administrative, civil, injunctive, or criminal proceedings, the imposition of fines and penalties, and other remedies and sanctions, any of which could lead to an adverse impact on our stock price, the inability to attract or retain key employees, and the loss of customers. We also cannot predict what impact, if any, these matters may have on our business, operating results, or financial condition.
In addition to these proceedings, we are involved in legal proceedings and litigation that have arisen in the normal course of our business. Although the outcome of a particular proceeding can never be predicted, we do not believe that the result of any of these matters will have a material adverse effect on our business, operating results, or financial condition.
17. Subsequent Event
In February 2007,January 2008, we entered into a definitive agreement to acquire Standard & Poor’s mutual fundacquired the Hemscott data, businessmedia, and investor relations Web site businesses from Ipreo Holdings, LLC for $55$51.6 million in cash, subject to post-closingworking capital adjustments. Standard & Poor’s isThe acquisition includes Hemscott Data, which has more than 20 years of comprehensive fundamental data on virtually all publicly listed companies in the United States, Canada, the United Kingdom, and Ireland; Hemscott Guru, a division of The McGraw-Hill Companies. Standard & Poor’s fund data business consists ofleading online research tool that contains financial data and products coveringdirectors’ biographies on more than 135,000 managed2,500 UK-quoted companies and 400,000 private companies; Hemscott Adviser Rankings Guide, a comprehensive listing of more than 1,800 leading providers of professional services to all UK-and-Irish-registered companies listed on the London Stock Exchange; Hemscott India, which operates a state-of-the-art data collection center in New Delhi, India; Hemscott.com, a free investment vehicles, including mutual funds, exchange-traded funds (ETFs), hedge funds,research Web site in the United Kingdom, Hemscott Premium and offshore funds. Under termsPremium Plus, subscription-based investment research and data services for executives and high net-worth investors; and Hemscott IR, a pioneer in best-practice online investor relations and corporate communications services in the United Kingdom.
111
This acquisition fits with our strategies of building a premier global equity database and expanding our presence outside the agreement, Standard & Poor’s will license fund data from Morningstar after the acquisition is completed. We completed the transaction on March 16, 2007.United States.
18. Recently Issued Accounting Pronouncements
In December 2007, the FASB issued SFAS No. 141(R), Business Combinations. SFAS No. 141(R) modifies the financial accounting and reporting of business combinations. SFAS No. 141(R) requires the acquirer to recognize and measure the fair value of the acquired operation as a whole, and the assets acquired and liabilities assumed at their full fair values as of the date control is obtained, regardless of the percentage ownership in the acquired operation or how the acquisition was achieved. SFAS No. 141(R) is effective for business combination transactions with acquisition dates on or after the first annual reporting period beginning on or after December 15, 2008. SFAS No. 141(R) is required to be adopted concurrently with SFAS No. 160, Accounting and Reporting of Noncontrolling Interests in Consolidated Financial Statements, an amendment of ARB No. 51. SFAS No. 141(R) requires prospective application and prohibits earlier application. We are in the process of determining the effect the adoption of SFAS No. 141 (R) will have on our Consolidated Financial Statements.
In December 2007, the FASB issued SFAS No. 160, Accounting and Reporting of Noncontrolling Interests in Consolidated Financial Statements, an amendment of ARB No. 51. SFAS No. 160 amends the financial accounting and reporting of noncontrolling (or minority) interests in consolidated financial statements. SFAS No. 160 is required to be adopted concurrently with SFAS No. 141(R) and is effective for the first annual reporting period beginning on or after December 15, 2008. Earlier application is prohibited. We are in the process of determining the effect the adoption of SFAS No. 160 will have on our Consolidated Financial Statements.
In February 2007, the FASB issued SFAS No. 159, The Fair Value Option for Financial Assets and Financial Liabilities, (including an amendment to FASB Statement No. 115, Accounting for Certain Investments in Debt and Equity Securities). SFAS No. 159 permits entities to choose to measure many financial instruments and certain other items at fair value. The objective is to improve financial reporting by providing entities with the opportunity to mitigate volatility in reported earnings caused by measuring related assets and liabilities differently without having to apply complex hedge accounting provisions. The amendment to SFAS No. 115 applies to all entities with available-for-sale and trading securities. SFAS No. 159 is effective for fiscal years beginning after November 15, 2007 and for interim periods within those years; therefore, we will adopt SFAS No. 159 in the first quarter of 2008. We are in the process of determining the effect the adoption of SFAS No. 159 will have on our Consolidated Financial Statements.
In September 2006, the Financial Accounting Standards Board (FASB)FASB issued SFAS No. 157, Fair Value Measurements, which defines fair value, establishes a framework for measuring fair value, and expands disclosures about fair value measurements. The standard applies whenever other standards require (or permit) assets or liabilities to be measured at fair value. The standard does not expand the use of fair value in any new circumstances. SFAS No. 157 is effective for fiscal years beginning after November 15, 2007 and for interim periods within those years; therefore, we will adopt SFAS No. 157 in the first quarter of 2008. We are in the process of determining the effect the adoption of SFAS No. 157 will have on our Consolidated Financial Statements.
In September 2006, the Securities and Exchange Commission (SEC) issued Staff Accounting Bulletin (SAB) No. 108, Considering the Effects of Prior Year Misstatements when Quantifying Misstatements in Current Year Financial Statements (SAB 108). SAB 108 addresses quantifying the financial statement effects of misstatements, specifically, how the effects of prior year uncorrected errors must be considered in quantifying misstatements in the current year financial statements. SAB 108 is effective for fiscal years ending after November 15, 2006; therefore, we adopted SAB 108 in the fourth quarter of 2006. The adoption of SAB 108 did not have an impact on our
90112
Consolidated Financial Statements.
In July 2006, the FASB issued Interpretation No. 48, Accounting for Uncertainty in Income Taxes, an interpretation of FASB Statement No. 109 (FIN 48), which prescribes the minimum recognition threshold a tax position is required to meet before being recognized in the financial statements. FIN 48 also provides guidance on derecognition, measurement, classification, interest and penalties, accounting in interim periods, and disclosure for uncertain tax positions. FIN 48 is effective for fiscal years beginning after December 15, 2006; therefore, we will adopt FIN 48 in the first quarter of 2007. We do not anticipate that the adoption of FIN 48 will have a material impact on our Consolidated Financial Statements.
In June 2006, the EITF ratified Issue No. 06-2, Accounting for Sabbatical Leave and Other Similar Benefits Pursuant to FASB Statement No. 43, “Accounting for Compensated Absences” (EITF No. 06-2), which requires that a liability for employees’ sabbatical benefits be accrued over the period required for employees to earn the right to sabbatical leave. EITF No. 06-2 is effective for fiscal years beginning after December 15, 2006; therefore, we will adopt EITF No. 06-2 in the first quarter of 2007. In the first quarter of 2007, we will record a cumulative effect of accounting change, net of tax, of approximately $3.4 million to record the portion of employee sabbatical leave that has been earned. Other than recording this cumulative effect of accounting change, we do not anticipate that the adoption of EITF No. 06-2 will have a material impact on our Consolidated Financial Statements.
91
Item 9. Changes in and Disagreements with Accountants on Accounting and Financial Disclosure
None.
Item 9A. Controls and Procedures
(a) Evaluation of Disclosure Controls and Procedures
Disclosure controls and procedures are designed to reasonably assure that information required to be disclosed in the reports filed or submitted under the Exchange Act is recorded, processed, summarized, and reported within the time periods specified in the SEC’s rules and forms. Disclosure controls and procedures include, without limitation, controls and procedures designed to reasonably assure that information required to be disclosed in the reports filed under the Exchange Act is accumulated and communicated to management, including the chief executive officer and chief financial officer, as appropriate, to allow timely decisions regarding required disclosure.
We carried out an evaluation, under the supervision and with the participation of our management, including our chief executive officer and chief financial officer, of the effectiveness of the design and operation of our disclosure controls and procedures, as defined in Rules 12a-15(e) and 15d-15(e) of the Securities Exchange Act of 1934, as of December 31, 2006.2007. Based on that evaluation, our chief executive officer and chief financial officer concluded that our disclosure controls and procedures are effective to provide reasonable assurance that information required to be disclosed in the reports we file or submit under the Exchange Act is recorded, processed, summarized, and reported as and when required.
(b) Management’s Report on Internal Control Over Financial Reporting
Our management is responsible for establishing and maintaining adequate internal control over financial reporting. Our internal control over financial reporting is a process designed to provide reasonable assurance regarding the reliability of financial reporting and the preparation of financial statements for external purposes in accordance with U.S. generally accepted accounting principles.
We carried out an evaluation, under the supervision and with the participation of our management, including our chief executive officer and chief financial officer, of the effectiveness of our internal control over financial reporting based on the framework set forth in Internal Control –— Integrated Framework issued by the Committee of Sponsoring Organizations of the Treadway Commission.
Based on that evaluation, our management concluded that our internal control over financial reporting was effective as of December 31, 2006.2007. Ernst & Young LLP, our independent registered public accounting firm, has issued an attestationtheir report concurring with management’s assessmenton the effectiveness of our internal control over financial reporting, which is included in Part II, Item 8 of this Form 10-K.10-K under the caption “Financial Statements and Supplementary Data” and incorporated herein by reference.
(c) Changes in Internal Controls Over Financial Reporting
There were no changes in our internal controls over financial reporting during our fiscal quarter ended December 31, 20062007 that have materially affected, or are reasonably likely to materially affect, our internal control over financial reporting.
There is no information that was required to be disclosed in a report on Form 8-K during the fourth quarter of the year covered by this Annual Report on Form 10-K that was not reported.
113
Item 10. Directors, Executive Officers, and Corporate Governance
The information contained under the headings Proposal 1 –— Election of Directors, Board of Directors and Corporate Governance –— Independent Directors, Board of Directors and Corporate Governance –— Board Committees and Charters, and Section 16(a) Beneficial Ownership Reporting Compliance in the definitive proxy statement for our 20072008 Annual Meeting of Shareholders (the Proxy Statement) and the information contained under the heading Executive Officers in Part I of this report is incorporated herein by reference.reference in response to this item.
We have adopted a code of ethics, which is posted in the Investor Relations section on our Web site at http://corporate.morningstar.com. We intend to include on our Web site any amendments to, or waivers from, a provision of the code of ethics that applies to our principal executive officer, principal financial officer, principal accounting officer, or controller that relates to any element of the code of ethics definition contained in Item 406(b) of SEC Regulation S-K. Shareholders may request a free copy of these documents by sending an e-mail to investors@morningstar.com.
Item 11. Executive Compensation
The information contained under the headings Board of Directors and Corporate Governance –— Directors’ Compensation, Compensation Discussion and Analysis, Compensation Committee Report, Compensation Committee Interlocks and Insider Participation, Executive Compensation, and Certain Relationships and Related Party Transactions –— Deferred Compensation Agreement with Don Phillips in the Proxy Statement is incorporated herein by reference.reference in response to this item.
92
Item 12. Security Ownership of Certain Beneficial Owners and Management and Related Stockholder Matters
The information contained under the headings Security Ownership of Certain Beneficial Owners and Management and Equity Compensation Plan Information in the Proxy Statement is incorporated herein by reference.reference in response to this item.
Item 13. Certain Relationships and Related Transactions, and Director Independence
The information contained under the headings Certain Relationships and Related Party Transactions and Board of Directors and Corporate Governance –— Independent Directors in the Proxy Statement is incorporated herein by reference.reference in response to this item.
Item 14. Principal Accountant Fees and Services
The information contained under the headings Audit Committee Report and Principal Accounting Firm Fees in the Proxy Statement is incorporated herein by reference.reference in response to this item.
114
Item 15. Exhibits and Financial Statement Schedules
(a)
1. Consolidated Financial Statements
The following documents are filed as part of this Annual Report on Form 10-K:10-K under Item 8—Financial Statements and Supplementary Data:
Report of Ernst & Young LLP, Independent Registered Public Accounting Firm | ||
Report of Deloitte & Touche LLP, Independent Registered Public Accounting Firm | ||
| ||
Financial Statements: | ||
Consolidated Statements of Income—Years ended December 31, 2007, 2006, and 2005 | ||
Balance Sheets—December 31, 2007 and 2006 | ||
Consolidated Statements of Shareholders’ Equity and Comprehensive | Income—Years ended December 31, 2007, 2006, and 2005 | |
Consolidated Statements of Cash | ||
Notes to Consolidated Financial Statements |
93
REPORTSREPORT OF INDEPENDENT REGISTERED PUBLIC ACCOUNTING FIRMSFIRM
The report of Ernst & Young LLP dated March 9, 20075, 2008 concerning the Financial Statement Schedule II, Valuation and Qualifying Accounts, is included at the beginning of Part II, Item 8 of this Annual Report on Form 10-K for the year ended December 31, 2006.2007.
To the Board of Directors and Shareholders of Morningstar, Inc.
Chicago, Illinois
We have audited the consolidated balance sheet of Morningstar, Inc. and subsidiaries as of December 31, 2005, and the related consolidated statements of income, shareholders’ equity and comprehensive income, and cash flows of Morningstar, Inc. and subsidiaries for the yearsyear ended December 31, 2005, and 2004, and have issued our report thereon dated March 3, 2006. Such report is included elsewhere in this Annual Report on Form 10-K. Our auditsaudit also included the 2005 consolidated financial statement schedule of the Company listed in Item 15. This financial statement schedule is the responsibility of the Company’s management. Our responsibility is to express an opinion based on our audits.audit. In our opinion, such consolidated financial statement schedule, when considered in relation to the basic consolidated financial statements taken as a whole, presents fairly, in all material respects, the information set forth therein.
/s/ Deloitte & Touche LLP |
|
Deloitte & Touche LLP | |
Chicago, Illinois | |
March 3, 2006 |
2. Financial Statement Schedules
The following financial statement schedule is filed as part of this Annual Report on Form 10-K:
Schedule II: Valuation and Qualifying Accounts
All other schedules have been omitted as they are not required, not applicable, or the required information is otherwise included.
115
Schedule II Morningstar, Inc. and Subsidiaries Valuation and Qualifying Accounts
($000) |
| Balance at |
| Charged |
| Deductions |
| Balance at |
| ||||
Allowance for doubtful accounts: |
|
|
|
|
|
|
|
|
| ||||
Year Ended December 31, |
|
|
|
|
|
|
|
|
| ||||
2006 |
| $ | 418 |
| $ | 159 |
| $ | (352 | ) | $ | 225 |
|
2005 |
| 256 |
| 223 |
| (61 | ) | 418 |
| ||||
2004 |
| 654 |
| (55 | ) | (343 | ) | 256 |
| ||||
94
($000) |
| Balance at |
| Charged |
| Deductions |
| Balance at |
| ||||
Allowance for doubtful accounts: |
|
|
|
|
|
|
|
|
| ||||
Year Ended December 31, |
|
|
|
|
|
|
|
|
| ||||
2007 |
| $ | 225 |
| $ | (54 | ) | $ | (10 | ) | $ | 161 |
|
2006 |
| 418 |
| 159 |
| (352 | ) | 225 |
| ||||
2005 |
| 256 |
| 223 |
| (61 | ) | 418 |
| ||||
3. Exhibits
Exhibit |
| Description |
|
| |
3.1 |
| Amended and Restated Articles of Incorporation of Morningstar are incorporated by reference to Exhibit 3.1 to our Registration Statement on Form S-1, as amended, Registration No. 333-115209 (the Registration Statement). |
3.2 |
| By-laws of Morningstar, as in effect on July 28, 2006, are incorporated by reference to Exhibit 3.2 to our Current Report on Form 8-K that we filed with the SEC on July 31, 2006. |
4.1 |
| Specimen Common Stock Certificate is incorporated by reference to Exhibit 4.1 to the Registration Statement. |
10.1* |
| Form of Indemnification Agreement is incorporated by reference to Exhibit 10.1 to the Registration Statement. |
10.2* |
| Morningstar Incentive Plan, as amended May 22, 2007 to be effective January 1, 2007, is incorporated by reference to Exhibit |
10.3* |
| Morningstar 1999 Incentive Stock Option Plan is incorporated by reference to Exhibit 10.4 to the Registration Statement. |
10.4* |
| Morningstar 2004 Stock Incentive Plan is incorporated by reference to Exhibit 10.5 to the Registration Statement. |
10.5* |
| Form of Morningstar 2004 Stock Incentive Plan Stock Option Agreement is incorporated by reference to Exhibit 10.5 to our Annual Report on Form 10-K for the year ended December 31, 2005. |
10.6* |
| Form of Morningstar 2004 Stock Incentive Plan Restricted Stock Unit Award Agreement for awards made prior to November 15, 2007 is incorporated by reference to Exhibit 10.1 to our Quarterly Report on Form 10-Q for the quarter ended March 31, 2006 (the March 2006 10-Q). |
10.7* |
| Form of Morningstar 2004 Stock Incentive Plan Director Restricted Stock Unit Award Agreement for awards made prior to November 15, 2007 is incorporated by reference to Exhibit 10.2 to the March 2006 10-Q. |
10.8*† | Form of Morningstar 2004 Stock Incentive Plan Restricted Stock Unit Award Agreement for awards made on and after November 15, 2007. | |
10.9*† | Form of Morningstar 2004 Stock Incentive Plan Director Restricted Stock Unit Award Agreement for awards made on and after November 15, 2007. | |
10.10* |
| Form of Morningstar 2004 Stock Incentive Plan Deferral Election Form is incorporated by reference to Exhibit 10.3 to the March 2006 10-Q. |
|
| Form of Morningstar 2004 Stock Incentive Plan Director Deferral Election Form is incorporated by reference to Exhibit 10.4 to the March 2006 10-Q. |
|
| Deferred Compensation Agreement dated February 15, 1999 between Morningstar and Don Phillips is incorporated by reference to Exhibit 10.6 to the Registration Statement. |
|
| Purchase Agreement dated April 30, 2003 between Morningstar and Patrick Reinkemeyer is incorporated by reference to Exhibit 10.8 to the Registration Statement. |
|
| First Amendment to Purchase Agreement dated as of February 1, 2006 between Morningstar and Patrick Reinkemeyer is incorporated by reference to Exhibit 10.1 to our Current Report on Form 8-K that we filed with the SEC on February 3, 2006 (the February 2006 8-K). |
116
|
| Purchase Agreement dated April 30, 2003 between Morningstar and David Williams is incorporated by reference to Exhibit 10.9 to the Registration Statement. |
|
| First Amendment to Purchase Agreement dated as of February 1, 2006 between Morningstar and David Williams is incorporated by reference to Exhibit 10.2 to the February 2006 8-K. |
21.1† |
| Subsidiaries of Morningstar. |
23.1† |
| Consent of Ernst & Young LLP. |
23.2† |
| Consent of Deloitte & Touche LLP. |
31.1† |
| Certification of Chief Executive Officer pursuant to Rule 13a-14(a) |
31.2† |
| Certification of Chief Financial Officer pursuant to Rule 13a-14(a) |
32.1† |
| Certification of Chief Executive Officer Pursuant to 18 U.S.C. |
32.2† |
| Certification of Chief Financial Officer Pursuant to 18 U.S.C. |
* Management contract with a director or executive officer or a compensatory plan or arrangement in which directors or executive officers are eligible to participate.
† Filed herewith.
95117
Signatures
Pursuant to the requirements of Section 13 or 15(d) of the Securities Exchange Act of 1934, the registrant has duly caused this report to be signed on its behalf by the undersigned, thereunto duly authorized on March 16, 2007.7, 2008.
| MORNINGSTAR, INC. | |||||
| By: | /s/ Joe Mansueto |
| |||
|
| |||||
|
| |||||
| Name: Joe Mansueto | |||||
| Title: Chairman of the Board and Chief Executive | |||||
Pursuant to the requirements of the Securities Exchange Act of 1934, this report has been signed below by the following persons on behalf of the registrant and in the capacities and on the dates indicated.
Signature |
| Title |
| Date |
|
|
|
|
|
/s/ Joe Mansueto |
| Chairman of the Board and Chief Executive |
| March |
Joe Mansueto |
| Officer (principal executive officer) |
|
|
|
|
|
|
|
/s/ |
| Chief Financial Officer (principal |
| March |
|
| accounting and financial officer) |
|
|
|
|
|
|
|
/s/ Donald J. Phillips II |
| Director |
| March |
Donald J. Phillips II |
|
|
|
|
|
|
|
|
|
/s/ Cheryl Francis |
| Director |
| March |
Cheryl Francis |
|
|
|
|
|
|
|
|
|
/s/ Steven Kaplan |
| Director |
| March |
Steven Kaplan | ||||
/s/ Bill Lyons | Director | March 7, 2008 | ||
Bill Lyons |
|
|
|
|
|
|
|
|
|
/s/ Jack Noonan |
| Director |
| March |
Jack Noonan |
|
|
|
|
|
|
|
|
|
/s/ Frank Ptak |
| Director |
| March |
Frank Ptak |
|
|
|
|
|
|
|
|
|
/s/ Paul Sturm |
| Director |
| March |
Paul Sturm |
|
|
|
|
96118