QuickLinks-- Click here to rapidly navigate through this document
UNITED STATES
SECURITIES AND EXCHANGE COMMISSION
Washington, D.C. 20549
FORM 10-K
| (Mark One) | |
ý |
ANNUAL REPORT PURSUANT TO SECTION 13 OR 15(d) OF THE SECURITIES EXCHANGE ACT OF 1934 FOR THE FISCAL YEAR ENDED DECEMBER 31, 2007 |
o |
TRANSITION REPORT PURSUANT TO SECTION 13 OR 15(d) OF THE SECURITIES EXCHANGE ACT OF 1934 |
xANNUAL REPORT PURSUANT TO SECTION 13 OR 15(d) OF THE SECURITIES EXCHANGE ACT OF 1934 FOR THE FISCAL YEAR ENDED DECEMBER 31, 2006
oTRANSITION REPORT PURSUANT TO SECTION 13 OR 15(d) OF THE SECURITIES AND EXCHANGE ACT OF 1934
Commission file number 0-27231
KRATOS DEFENSE & SECURITY SOLUTIONS, INC.
WIRELESS FACILITIES, INC.
(Exact name of Registrant as specified in its charter)
Delaware | | 13-3818604
|
(State or other jurisdiction of
| | (I.R.S. Employer
|
incorporation or organization)
| | 13-3818604
(I.R.S. Employer
Identification No.) |
4810 Eastgate Mall
|
San Diego, CA 92121
|
(858) 228-2000812-7300
|
(Address, including zip code, and telephone number, including area code, |
of Registrant’sRegistrant's principal executive offices)
|
SECURITIES REGISTERED PURSUANT TO SECTION 12(b) OF THE ACT:
None
Title of Each Class
| | Name of each exchange on which registered
|
|---|
| Common Stock, par value $0.001 | | The NASDAQ Global Select Market |
| Right to Purchase Shares of Series C Preferred Stock | | |
SECURITIES REGISTERED PURSUANT TO SECTION 12(g) OF THE ACT:
Common Stock, par value $0.001None
Rights to Purchase Shares of Series C Preferred Stock
Indicate by check mark if the registrant is a well-known seasoned issuer, as defined in Rule 405 of the Securities Act. Yes o No ýx
Indicate by check mark if the registrant is not required to file reports pursuant to Section 13 or Section 15(d) of the Act. Yes o No ýx
Indicate by check mark whether the registrant: (1) has filed all reports required to be filed by Section 13 or 15(d) of the Securities Exchange Act of 1934 during the preceding 12 months (or for such shorter period that the registrant was required to file such reports), and (2) has been subject to such filing requirements for the past 90 days. Yes o No ýx
Indicate by check mark if disclosure of delinquent filers pursuant to Item 405 of Regulation S-K is not contained herein, and will not be contained, to the best of registrant’sregistrant's knowledge, in definitive proxy or information statements incorporated by reference in Part III of this Form 10-K or any amendment to this Form 10-K. o
Indicate by check mark whether the registrant is a large accelerated filer, an accelerated filer or a non-accelerated filer (as defined in Rule 12b-2 of the Exchange Act);
| | Large accelerated filer o
Non-accelerated filer o(Do not check if a smaller reporting company) | | Accelerated Filer filer ýx | Non Accelerated Filer
Smaller reporting company o
|
Indicate by check mark whether the registrant is a shell company (as defined in Rule 12b-2 of the Exchange Act). Yes o No ýx
The aggregate market value of the voting and non-voting stock (Common Stock) held by non-affiliates as of the last business day of most recently completed second fiscal quarter (June 30, 2006)29, 2007) was approximately $135.0$113.1 million, based on the closing sale price on the NASDAQ market exchangeGlobal Select Market on that date.*
The number of shares outstanding of the Registrant’sRegistrant's Common Stock was 74,061,65078,998,922 as of July 31, 2007.March 3, 2008.
- *
- Excludes the common stock held by executive officers, directors and stockholders whose individual ownership exceeds
5%10% of the Common Stock outstanding on June 30, 2006.2007.
DOCUMENTS INCORPORATED BY REFERENCE
None
Documents Incorporated by Reference
2 Portions of the Registrant's definitive proxy statement to be filed with the Commission pursuant to Regulation 14A in connection with the Registrant's 2008 Annual Meeting of Stockholders (the "Proxy Statement") or portions of the Registrant's Form 10-K/A, to be filed subsequent to the date here of, are incorporated by reference into Part III of this Report. Such Proxy Statement or Form-10K/A will be filed with the Commission not later than 120 days after the conclusion of the Registrant's fiscal year ended December 31, 2007.
WIRELESS FACILITIES, INC.
KRATOS DEFENSE & SECURITY SOLUTIONS, INC.
FORM 10-K
FOR THE FISCAL YEAR ENDED DECEMBER 31, 2006
2007
TABLE OF CONTENTS
3
All references to us, we, our, the Company and WFIKratos refer to Wireless Facilities,Kratos Defense & Security Solutions, Inc., a Delaware Corporation, and its subsidiaries.
EXPLANATORY NOTE
In this Annual Report on Form 10-K, we are restating our consolidated balance sheet as of December 31, 2005, and the related consolidated statements of income, stockholders’ equity, comprehensive income and cash flows for the years ended December 31, 2004 and 2005. This Report also includes restated unaudited quarterly financial information and financial statements for interim periods of 2005.
As a result of the findings of our Equity Award Review, our consolidated financial statements for the years ended December 31, 2004 and 2005 have been restated. The restated consolidated financial statements include unaudited financial information for interim periods of 2005 consistent with Article 10-01 of Regulation S-X. The Company also recorded additional stock-based compensation expense and associated tax adjustments affecting the Company
’s previously reported financial statements for 1998 through 2003, the effects of which are summarized in cumulative adjustments to additional paid-in capital, deferred compensation and accumulated deficit accounts as of December 31, 2003 in the amounts of $56.1 million, $6.6 million and $62.9 million, respectively, all of which are recorded in the Consolidated Statements of Shareholders’ Equity.
Equity Award ReviewPART I
Background and Scope of Review
Our current executive management team, which has been in place since 2004, initiated an internal review of our historical practices related to granting stock option awards and other equity awards (the “Equity Award Review”) in the summer of 2006 in reaction to media reports regarding stock option granting practices of public companies. The Equity Award Review was conducted with oversight from the Board of Directors (the “Board”), and assistance from our outside counsel, Morrison & Foerster LLP (“Morrison Foerster”). In February 2007, the Board appointed a Special Committee of the Board to review the adequacy of the Equity Award Review and the recommendations of management regarding historical option granting practices, and to make recommendations and findings regarding those practices and individual conduct. The Special Committee was not charged with making, and did not make, any evaluation of the accounting determinations and related tax adjustments. The accounting determinations and related tax adjustments were evaluated by management and the Audit Committee of the Board of Directors. The Special Committee was comprised of a non-employee director who had not served on our Compensation Committee before 2005.
The Equity Award Review encompassed all grants of options to purchase shares of our common stock and other equity awards made since two months prior to our initial public offering (our “IPO”) in November 1999 through December 2006. We also reviewed all option grants that were entered into our stock option database (Equity Edge) after our IPO with a grant date before November 1999, as well as other substantial grants issued prior to our IPO. The total number of grants reviewed in the Equity Award Review exceeded 14,000 individual grants. We further reviewed all option grants with a grant date that preceded an employee’s date of hire. As part of the review, interviews of 18 current and former officers, directors, employees and attorneys were conducted, and more than 40 million pages of electronic and hard copy documents were searched for relevant information. The Special Committee also conducted its own separate review of the option granting practices during the tenure of our current executive management team through additional interviews and document collection and review with the assistance of its own separate counsel, Pillsbury Winthrop Shaw Pittman LLP (“Pillsbury Winthrop”), and FTI Consulting Inc. (“FTI Consulting”), a forensic information technology consulting firm.
The Special Committee completed its evaluation of the Equity Award Review in August 2007 after considering the information gathered by management and Morrison & Foerster, along with testing and data gathering by Pillsbury Winthrop and FTI Consulting. The Special Committee concluded that the Equity Award Review was complete and worthy of reliance. Our Board has also concluded that the scope and thoroughness of the Equity Award Review was complete and appropriate.
The Equity Award Review established the absence of contemporaneous evidence supporting a substantial number of the previously-recorded option grants, substantially all of which were made in the period from 1998 through late 2003. During this period of time, in some instances, documents, data and interviews suggest that option grants were prepared or finalized days or, in some cases, weeks or months after the option grant date recorded in our accounting records. The affected grants include options issued to certain newly-hired employees using measurement dates prior to their employment start dates and options issued to non-employees, including advisors to the Board, erroneously designated as employees. The Special Committee also concluded that certain former employees and former officers participated in making improper option grants, including the selection of grant dates with the benefit of hindsight and in the delay in dating of otherwise approved option grants.
Impact on Previously Issued Reports and Financial Statements
In light of the Equity Award Review and the Special Committee’s findings described herein, the Audit Committee of the Board concluded that our prior financial statements for periods from 1998 through our filing of interim financial statements for the period ended September 30, 2006, must be restated. Our management determined that, from fiscal year 1998 through fiscal year 2005, the Company did not properly recognize non-cash equity-based compensation charges. These charges are material to our financial statements for the years ended December 31, 1998 through 2005, the periods to which such charges would have related. Previously filed annual reports on Form 10-K and quarterly reports on Form 10-Q affected by the restatements have not been and will not be amended and should not be relied upon.
Consistent with the relevant accounting standards and recent guidance from the Securities and Exchange Commission (the “SEC”) as part of the Equity Award Review, the grants during the relevant period were organized into categories based on grant type and process by which the grant was finalized. We analyzed the evidence related to grants in each category as part of the Equity Award Review. This evidence included, but was not limited to, electronic and physical documents, document metadata, and witness interviews. The controlling accounting standards were applied to the relevant facts and circumstances, in a manner consistent with the recent guidance from the SEC, to determine the proper measurement date for every grant within each category. If the measurement date was not the same as the originally assigned grant date, accounting adjustments were made as required, resulting in stock-based compensation expense and related income tax effects, as detailed below.
Based on the results of the Equity Award Review, we concluded that, pursuant to Accounting Principles Board Opinion No. 25, Accounting for Stock Issued to Employees (“APB 25”), and relevant interpretations, revised accounting measurement dates should be applied to a substantial number of the stock option grants covering options for the purchase of 15.2 million shares of our common stock that were awarded primarily between March 1998 and December 2003. The use of the revised measurement dates for the affected option grants required us to record a total of $75.0 million in additional deferred compensation, with substantially all of the increase relating to option grants made before December 31, 2003. We have also recorded $58.2 million in additional stock-based compensation expense for the years 1998 through 2005, reflecting the amortization of deferred compensation over the relevant vesting periods, which was typically over four years. After aggregate other tax adjustments and income tax adjustments of $9.6 million, the restatement resulted in total net adjustments to net income (loss) of $48.6 million for the years 1998 through 2005. This amount is net of forfeitures related to employee terminations of
approximately $16.8 million. These amounts do not include the unauthorized issuance of common stock charge of $0.6 million and $5.7 million in 2002 and 2003, respectively, related to misappropriated options by the Company’s former stock administrator described herein. The aggregate amount of the Equity Award Review including the misappropriated options is $64.5 million comprised of the $58.2 million in additional stock-based compensation expense and $6.3 million of a charge for unauthorized issuance of common stock. After aggregate other tax adjustments and income tax adjustments of $9.6 million, the restatement resulted in total net adjustments to net income (loss) of $54.9 million for the years 1998 through 2005. Approximately $26.6 million of the stock-based compensation expense was recorded in 2001, due to cancellations from our Stock Option Cancel/Re-grant Program, as described below, which resulted in the remaining unamortized deferred compensation being expensed upon the cancellation in March 2001 in accordance with Emerging Issues Task Force 00-23, “Issues Related to the Accounting for Stock Compensation under APB Opinion No. 25 and FASB Interpretation No. 44.”
As a consequence of these adjustments, our audited consolidated financial statements and related disclosures for the years ended December 31, 2004 and 2005 and our consolidated statements of operations and consolidated balance sheet data for the four years ended December 31, 2005, included in “Selected Consolidated Financial Data” in Part II, Item 6 of this Report, have been restated. Additionally, the unaudited quarterly financial information for interim periods of 2005, as well as the unaudited balance sheet data for the interim periods of 2006, included in “Management’s Discussion and Analysis of Financial Condition and Results of Operations” in Part II, Item 7 of this Report, have been amended. We have also restated the stock-based compensation expense footnote information calculated under Statement of Financial Accounting Standards, or SFAS, No. 123, 1. Accounting for Stock-Based CompensationBusiness, or SFAS 123, and SFAS No. 148, Accounting for Stock-Based Compensation—Transition and Disclosure, or SFAS 148, under the disclosure-only alternatives of those pronouncements for the years 2004 and 2005 and for interim periods of 2005. The restated footnote information has been included in “Management’s Discussion and Analysis of Financial Condition and Results of Operations” as well as in the Consolidated Financial Statements in Part II, Item 15 of this Report.
None of the adjustments resulting from the Equity Award Review affected our previously reported revenue, cash, cash equivalents or marketable securities balances in any prior periods.
Former Stock Option Administrator
During the course of the Equity Award Review, we discovered that Vencent Donlan, a former stock option administrator, had engaged in a fraudulent scheme by which he misappropriated options to purchase more than 700,000 shares of stock. Ill-gotten gains from this scheme approximated $6.3 million. We have brought an action against Donlan seeking return of the fraudulently obtained stock option proceeds. We also promptly alerted the SEC of our discovery in March 2007. The SEC commenced an enforcement action against Donlan, and the U.S. Attorney’s Office forwarded a grand jury subpoena to us seeking records related to Donlan and our historical option granting practices. We have cooperated with, and intend to continue to cooperate with, both the SEC and the U.S. Attorney’s Office in their actions against Donlan and otherwise. Donlan has consented to an injunction brought by the SEC and has plead guilty to federal criminal charges brought against him by the U.S. Attorney’s Office. We have recorded an unauthorized issuance of common stock charge of $0.6 million and $5.7 million in 2002 and 2003, respectively, related to this theft.
Except as otherwise stated, all financial information contained in this Annual Report on Form 10-K gives effect to this restatement. Information regarding the effect of the restatement on our financial position and results of operations is provided in Note 2 of Notes to Consolidated Financial Statements, included in Part IV, Item 15 of this Report. Financial information included in the previously filed reports on Form 10-K, Form 10-Q and Form 8-K, the related opinions of our independent registered public accounting firms, and all previously issued earnings press releases and similar communications, for all
periods ended on or before December 31, 2005 should not be relied upon and are superseded in their entirety by the information in this Annual Report on Form 10-K.
In 2006 and 2007, we undertook a transformation strategy whereby we divested our wireless related businesses and chose to aggressively pursue business with the federal government. A more detailed description of our transformation strategy is included herein.
PART I
Item 1.Business
This Annual Report on Form 10-K (including the section regarding Management’sManagement's Discussion and Analysis of Financial Condition and Results of Operations) contains forward-looking statements regarding our business, financial condition, results of operations and prospects. Words such as “expects,” “anticipates,” “intends,” “plans,” “believes,” “seeks,” “estimates”"expects," "anticipates," "intends," "plans," "believes," "seeks," "estimates" and similar expressions or variations of such words are intended to identify forward-looking statements, but are not deemed to represent an all-inclusive means of identifying forward-looking statements as denoted in this Annual Report on Form 10-K.Report. Additionally, statements concerning future matters are forward-looking statements.
Although forward-looking statements in thisour Annual Report on Form 10-K reflect our good faith judgment, such statements can only be based on facts and factors currently known by us. Consequently, forward-looking statements are inherently subject to risks and uncertainties and actual results and outcomes may differ materially from the results and outcomes discussed in or anticipated by the forward-looking statements. Factors that could cause or contribute to such differences in results and outcomes include, without limitation, those specifically addressed in Item 1A—“Risks Factors”"Risk Factors" below, as well as those discussed elsewhere in this Annual Report on Form 10-K.Report. Readers are urged not to place undue reliance on these forward-looking statements, which speak only as of the date of thisour Annual Report on Form 10-K. We file reports with the SEC. We make available on our website under “Investor Relations/SEC Filings,” free of charge, our annual reports on Form 10-K, quarterly reports on Form 10-Q, current reports on Form 8-K and amendments to those reports as soon as reasonably practicable after we electronically file such materials with or furnish them to the SEC. Our website address is www.wfinet.com. You can also read and copy any materials we file with the SEC at the SEC’s Public Reference Room at 100 F Street, NE, Washington, DC 20549. You can obtain additional information about the operation of the Public Reference Room by calling the SEC at 1-800-SEC-0330. In addition, the SEC maintains an Internet site (www.sec.gov) that contains reports, proxy and information statements, and other information regarding issuers that file electronically with the SEC, including us.
Report. We undertake no obligation to revise or update any forward-looking statements in order to reflect any event or circumstance that may arise after the date of this Annual Report on Form 10-K.Report. Readers are urged to carefully review and consider the various disclosures made throughout the entirety of this Annual Report, which attempt to advise interested parties of the risks and factors that may affect our business, financial condition, results of operations and prospects.
7
On November 7, 2006, our Board approved a change in the fiscal year end from the last Friday in December to December 31. Concurrently, the Board approved a change in the interim fiscal periods to provide that the last day of the fiscal quarter shall be the last day of the calendar month of each quarter. As a result, the end of fiscal 2006, which would have ended on December 29, 2006, ended as of December 31, 2006. Prior to this change in fiscal year, the Company operated and reported using a 52-53 week fiscal year ending the last Friday in December. As a result, a fifty-third week was added every five or six years. Under the prior reporting system, each 52 week fiscal year consisted of four equal quarters of 13 weeks each, and each 53 week fiscal year consists of three 13 week quarters and one 14 week quarter. The change in fiscal year and interim fiscal periods will not be applied to periods prior to the quarter ended September 30, 2006, and, consistent with prior reports, all prior fiscal periods presented or discussed in this report have been presented as ending on the last day of the nearest calendar month. In reliance on Exchange Act Release No. 26589, the Company will not file a transition report covering the transition period from December 30, 2006 to December 31, 2006.
We were incorporated in the state of New York on December 19, 1994 and began operations in March 1995. We reincorporated in the state of Delaware in 1998. On September 12, 2007, we changed our name from Wireless Facilities, Inc. to Kratos Defense & Security Solutions, Inc.
Overview
We consummatedare an innovative provider of mission critical engineering, IT services and warfighter solutions. We work primarily for the U.S. government and government agencies, but we also perform work for state and local agencies and commercial customers. Our principle services are related to, but are not limited to, Command, Control, Communications, Computing, Combat Systems Intelligence, Surveillance and Reconnaissance (C5ISR), weapons systems lifecycle support and extension, military weapon range operations and technical services, missile and rocket and weapons system test and evaluation, mission launch services, public safety, security and surveillance systems, advanced network engineering and information technology services, advanced IT services, security and surveillance systems, and critical infrastructure design and integration services. We offer our IPO on November 5, 1999. Our principal executive office is located at 4810 Eastgate Mall, San Diego, California 92121. Our telephone number is (858) 228-2000.customers solutions and expertise to support their mission-critical needs by leveraging our skills across our core service areas.
Description We derive a substantial portion of our revenue from contracts performed for federal government agencies, with the Businessmajority of our revenue currently generated from the delivery of mission-critical warfighter solutions, advanced engineering services, system integration and system sustainment services to defense and other non-DoD (Department of Defense) and civilian government agencies. We believe our diversified and stable client base, strong client relationships, broad array of contracts, considerable employee base possessing government security clearances, extensive list of past performance qualifications, and significant management and operational capabilities position us for continued growth.
General
Historical Structure
In 2006, Prior to 2007 we were an independent provider of outsourced engineering and network deployment services, security systems engineering and integration services and other technical services for the wireless communications industry, the U.S. government and enterprise customers.
Former Operating Segments
In 2006 and 2007, we undertook a transformation strategy whereby we divested our commercial wireless-related businesses and chose to pursue business with the federal government, primarily the U.S. Department of Defense, through strategic acquisitions. On September 12, 2007, we changed our name from Wireless Facilities, Inc. (WFI) to Kratos Defense & Security Solutions, Inc. (Kratos). Our new name reflects our revised focus as a defense contractor and security systems integrator for the federal government, for state and local agencies, and certain commercial customers. In connection with our name change, we changed our NASDAQ Global Market trading symbol to "KTOS".
Prior to the divestiture of our wireless-related business, we had three operating segments which consisted ofsegments: our Wireless Network Services (“WNS”)(WNS) segment, our Enterprise Network Services (“ENS”)(ENS) segment, and our Government Network Services (GNS) segment. Following the divestiture of the WNS segment also known as WFIand corporate name change, we reorganized into two operating segments, Kratos Government Services, Inc.Solutions (KGS) (formerly GNS) and Public Safety and Security (PSS) (formerly ENS). The financial statements in this Annual Report on Form 10-K are presented in a manner consistent with this formerour new operating structure. For additional information regarding our operating segments, see Note 14 of Notes to Consolidated Financial Statements, included in Part IV, Item 15Statements. From a customer and solutions perspective, we view our business as an integrated whole, leveraging skills and assets where ever possible.
The Kratos Government Solutions segment provides engineering, information technology and technical services to federal, state, and local government agencies, but primarily the U.S. Department of this Report.
Wireless Network Services Segment
Defense (DoD). Our Wireless Network Services segment consisted of two primary services: Wireless Engineering Serviceswork includes weapon systems lifecycle support and Wireless Network Deployment Services.
Wireless Engineering Services
Wireless Engineering Services providedextension; command, control, communications, computing, combat systems, intelligence, surveillance and reconnaissance (C5ISR); military range operations and technical services; missile, rocket, and weapons systems test and evaluation; mission launch services; public safety and security services; and advanced network engineering and business consultinginformation technology services; public safety, security and surveillance systems integration. Our KGS segment also focuses on the homeland security market with products and services for all pre-deployment planning for wireless carriers, including technology assessment, market analysis,aimed at supporting first responders.
The Kratos Public Safety and analyzed the traffic patterns, population density, and topography and propagation environment in each market under consideration. It analyzed the financial, engineering, competitive and technology issues applicable to a proposed technology or network deployment project.
Wireless Deployment Services
Wireless Deployment Services provided a range of services for the full design and deployment of wireless networks carrier customers. Such services included: Radio Frequency Engineering; Spectrum Relocation; Fixed Network Engineering; Site Development; and Installation and Optimization Services.
Enterprise Network Services Segment
Our ENSSecurity segment which we now call our non-federal business, provides system design, deployment, integration, monitoring and support services for enterprise networks. Enterprisepublic safety, security and surveillance networks for state and local governments and commercial customers. Public safety and security networks have been traditionally segregated into systems such as voice, data, access control, video surveillance, temperature control and fire alarm.and life safety. We provide services that combine such systems and offer integrated solutions on an Ethernet-based platform. We also offer solutions that combine voice, data, electronic security and building automation systems with fixed or wireless connectivity solutions. We aim to meet the needs of any business enterprise by understanding the needs of the particular entity, sifting through the multiple solutions and complex technologies available in the marketplace and designing, deploying, managing and maintaining a cost-effective and integrated solution that is capable of evolving as the needs of the client change with time. Our target markets are retail, healthcare, education, sports and entertainment, municipal government, correctional facilities and other public facilities. Our commitmentcommitments to these markets and our proven ability to provide feature-rich, cost-effective solutions hashave allowed us to become one of the larger independent integrators for these types of systems. We maintain regional office locations, comprised of Kratos Mid Atlantic, Kratos Southeast, and Kratos Southwest, where we are focused on security, surveillance and other building automation and integration services.
Government Network Services Segment
Our Government Network Services segment, which we now call our federal business, serves the federal engineering and information technology services market, which includes the design, development, deployment, integration and management of communications and information networks. This business is described in more detail below.
Corporate Transformation
In 2006 and 2007, we undertook a transformation strategy whereby we divested our wireless-related businesses and chose to aggressively pursue business with the federal government, primarily the U.S. Department of Defense, through strategic acquisitions. These divestitures and acquisitions are described in more detail below.
Sale and Discontinuance of Significant Subsidiaries
In December 2005, our Board made the decision to exit our Mexican operations and certain of our other deployment businesses in South America. Prior to this decision, these operations had been reported in our WNS segment. We determined that these operations met the criteria to be classified as held for sale. Accordingly, we reflected these operations as discontinued in accordance with SFAS No. 144, “Accounting for the Impairment or Disposal of Long-Lived Assets” in our financial statements as of and for the year ended 2005. The other South American operations were substantially shut down as of the end of December 2005.
On February 17, 2006, we entered into an Equity Purchase Agreement to sellfor the sale of all of the stock of our wholly owned subsidiaries (i) WFI de Mexico, S. de R.L. de C.V., (ii) WFI de Mexico, Servicios de Adminstracion, S. de R.L. de C.V., (iii) WFI de Mexico, Servicios de Ingenieria, S. de R.L. de C.V., (iv) WFI Services de Mexico S.A. de C.V., (v) WFI Asesoria en Adminstracion, S.C; and (vi) WFI Asesoria en Telecomunicaciones, S.C. (the “Mexico Operations”"Mexico Operations") to Sakoki LLC. The transaction closed on March 10, 2006. Refer to Note 14 Related Party Transactions2006 for further discussiontotal consideration of the purchaser, Sakoki, LLC.
9
The Equity Purchase Agreement provided that we would receive total approximate consideration ofapproximately $18.9 million, with $1.5 million in cash and the balance by a secured promissory note. As of December 31, 2006, we had received all installment payments due under the promissory note.
The impact of the divestiture has beenis reflected in theour consolidated balance sheets as of December 31, 2006. There was no gain or loss realized on the sale sincebecause the business was sold at its net carrying value.
On December 28, 2006, our Board approved a plan to divest portions of our business where critical mass had not been achieved. This plan involved the divestiture of our EMEA operations and remaining South American operations. We determined that these operations met the criteria to be classified as held for sale. Accordingly, we have reflected these operations as discontinued in accordance with SFAS No. 144, “Accounting for the Impairment or Disposal of Long-Lived Assets” in our financial statements as of and for the year ended December 31, 2006.
On March 9, 2007, we completed the sale of our EMEAEurope, Middle East and Africa (EMEA) operations to LCC Wireless Engineering Services Limited, a wholly-owned subsidiary of LCC International, Inc. (“LCC”("LCC") in a cash for stock transaction valued at $4 million. The sale of EMEA generated a gain of $3.3 million which was recorded in the first quarter of 2007. In the fourth quarter of 2007, we recorded a reserve of $0.7 million related to the remaining holdback amount due to our assessment of LCC's available liquidity.
On April 20, 2007, we completed the sale of all of the issued and outstanding equity interests of our wholly owned subsidiary WFI de Brazil Techlogia en Telecomunicaciones LTDA, to Strategic Project Services, LLC (SPS)("SPS"). The consideration included the assumption of substantially all outstanding liabilities of WFI Brazil, nominal cash consideration, and additional earn-out consideration based on 25% of net receivables collected subsequent to the closing date. We recorded an impairment charge in the fourth quarter of 2006 of approximately $5.2 million to reduce the current carrying value of the South American operations to their estimated fair value.
For the year ended December 31, 2006, our discontinued operations in Latin America and EMEA had revenues of $27.0 million and net loss of $11.2 million. The prior year’s activities have been reclassified as discontinued operations in the accompanying consolidated statements of operations.
On June 4, 2007, the Companywe completed the sale to LCC International, Inc. ("LCC") of the assets used in the conduct of the operation of the Company’s Wireless Engineering Servicesour wireless engineering services portion of the wireless network servicesWireless Network Services segment that providesprovided engineering services to the non-government wireless communications industry in the United States.
The aggregate consideration paid by LCC in connection with the saleacquisition was $46 million, subjectmillion. Pursuant to certain adjustments.the terms of the Acquisition Agreement, LCC delivered a subordinated promissory note for the principal amount of $21.6 million, subject to working capital adjustments, and paid $17 million in cash at the closing and paid final working capital adjustments of $2.4 million through an addition to the subordinated promissory note, and we have retained an estimated $7$5 million in net accounts receivable of the business, subject to working capital adjustments.capital.
On July 5, 2007, we sold the $21.6 million subordinated promissory note taken in the sale of assets to LCC. We receivedLCC in exchange for approximately $19.6 million in net cash proceeds, reflecting a discount from par value of less than five percent and aggregate transaction fees of approximately $1 million. The note was acquired by a fund affiliated with Silver Point Capital, L.P. On January 30, 2008, we received net proceeds of approximately $2.3 million on the working capital adjustment from Silverpoint. We aredid not providingprovide any guaranty for LCC’sLCC's payment obligations. Certain post closing adjustments that, underobligations for the terms of the sale of our U.S. Wireless Engineering business are expected to be made to the principal amount of the Note, may instead be made by payments between WFI and LCC or between Silver Point and WFI, as applicable.note.
On August 10, 2007, in accordance with the terms of the agreement, we provided the closing balance sheet working capital calculation, which indicated a $2.6 million working capital adjustment was due to WFI as an increase to the balance of the Subordinated Promissory Note. LCC has 30 days to review the calculation and notify us of any dispute.
On July 24, 2007, we completed the sale to an affiliate of Platinum Equity of our Wireless Deploymentwireless deployment services portion of the wireless network services segment.Wireless Network Services segment and the Wireless Facilities trade and corporate names. The total consideration for the acquisition was $24 million including $18 million in cash at closing, subject to typical post closingpost-closing working capital adjustments, and an aggregate $6 million in a three-year earn-out arrangement through 2010. The deal includes a Transition Services Agreement for thearrangement. We provided certain transition of certain services to Platinum Equity for a period of sixnine months and the deployment business employees will remain our employees until October 1, 2007; underpursuant to a Transition Services Agreement. Under an employee leasing arrangement with Platinum. The assets soldPlatinum Equity, we serviced the payroll for the deployment business employees until October 1, 2007. On September 25, 2007, in accordance with the acquisition agreement, we provided our working capital calculation to Platinum Equity. However, we have not
been able to come to an agreement with Platinum Equity include allon the amount of the working capital adjustment. Pursuant to the terms of the agreement, both parties are in the process of choosing a firm to resolve this issue. As of December 31, 2007, the balance of our Wireless Deployment business, and the Wireless Facilities name.calculation has been reflected in other current liabilities.
As a result of the Engineering and Deploymentabove divestitures, the Wireless Network Services divestitures in 2007, the wireless network services segment will behas been classified as a discontinued operationoperation.
On October 2, 2006 we acquired Huntsville, Alabama based Madison Research Corporation ("MRC") for $69 million in the secondcash. MRC offers a broad range of technical, engineering and third quarters of 2007, respectively.IT solutions, and has developed core competencies in weapons system lifecycle support, integrated logistics, test and evaluation, commercial-off-the-shelf software and hardware selection and implementation, software development and systems lifecycle maintenance.
Customers
A representative list of our customers in our WNS segment during 2006, consisting of both Engineering and Deployment services, included (in alphabetical order) Cingular (now AT&T), Clearwire, Fibertower, Huawei, Sprint, T-Mobile and Verizon Wireless and equipment vendors such as Motorola and Samsung. In our ENS segment, our customers in 2006 included General Electric, the Atlanta airport, Lockheed Martin, the City of Houston, Texas the Toyota Center, and Westfield Shopping Towns. Customers in our Government Network Services segment during 2006 included the U.S. Air Force, U.S. Army, U.S. Navy, Missile Defense Agency, the Department of Homeland Security, FMS and the U.S. Southern Command.
Employees
As of December 31, 2006, our then continuing operations employed approximately 2,180 full-time employees, consultants and contractors worldwide. None of our employees were represented by a labor union and we did not experience any work stoppage.
Transition to New Company Name
As noted above, the final wireless related divestiture of WFI’s Wireless Deployment business included the sale of the company’s name, Wireless Facilities, Inc. Accordingly, the Company announced that by On December 31, 2007 it would change its corporate namewe acquired Haverstick Consulting, Inc. ("Haverstick") for approximately $90.2 million in aggregate total merger consideration including Kratos transaction costs of $0.5 million, of which $66.7 million was paid in cash at closing and approximately $19.4 million was paid with unregistered shares of Kratos stock. Of the consideration, $2.4 million was cash paid shortly thereafter, approximately $1.2 million in cash and $7.4 million of the Kratos stock ticker symbolis being retained as an indemnity holdback. In addition to reflect its new business focus.
Company Overview
The following discussion presents our current business following the transformation actions that we made in 2007.
We are an innovative provider of mission critical engineering, IT servicesindemnity holdback, the Agreement also calls for a post closing working capital adjustment. Haverstick provides rocket and warfighter solutions. We work primarily for the U.S. federal government, but we also perform work for statemissile test and local agencies. Our principle services include, but are not limited to, Command, Control, Communications, Computing, Intelligence, Surveillance and Reconnaissance (C4ISR), weaponevaluation, weapons systems lifecycle support, military weapon range and technical services, network engineering services, advanced IT services, security and surveillance systems, and critical infrastructure design and integration services. We offer our customers solutions and expertise to support their mission-critical needs by leveraging the Company’s skills across our core service areas.
We derive a substantial portion of our revenue from contracts performed for federal government agencies, with the majority of our revenue currently generated from the delivery of mission-critical war
fighter solutions, advanced engineering services, system integration and system sustainment services to defense and other government agencies. We believe our diversified and stable client base, strong client relationships, broad array of contracts, considerable employee base with possession of government security clearances, and significant management and operational capabilities position us for continued growth.
We have strong, long-term relationships with our clients, as evidenced by our record of retaining business. We have provided high-end engineering, weapons support, and other solutionsprofessional services to customers within the U.S. Army, U.S. Air Force, U.S. Navy, National AeronauticsNASA, and Space Administration (NASA), Defense Logistics Agency (DLA), Defense Contract Management Agency (DCMA),other federal, state and local agencies. Through the Haverstick acquisition, we expanded our customer footprint within the DoD, and enhanced our presence with the U.S. DepartmentAir Force, a key growth area for Haverstick.
On February 29, 2008 we provided the working capital calculation to Haverstick, which indicated a working capital adjustment was due to us primarily because the working capital, as calculated per the Agreement, was below the target amount. Haverstick has reviewed our working capital calculation and is in disagreement. Their response proposes that there is actually excess working capital of Homeland Security,approximately $1.5 million. In accordance with the Agreement, we have fifteen days from the date of Haverstick's objection to resolve the disagreement. If resolution has not been achieved within the fifteen day period, we and various strategic military basesHaverstick have five days to agree on a nationally recognized independent accounting firm to resolve the disagreement.
In February 2008 we entered into a definitive merger agreement with San Diego-based C5ISR and defense locations throughoutnet-centric warfare solutions provider SYS Technologies in a stock-for-stock transaction. Under the United States for more than twenty years.
We believe our strong relationships areterms of the resultagreement, SYS will merge with and into a wholly-owned subsidiary of Kratos and all of SYS's outstanding common shares will be converted into Kratos common shares. Upon closing, we will issue approximately 25 million shares of our in-depth understandingcommon stock. The transaction is subject to customary closing conditions, including approval of our client’s missions, the strength of our technical solutions,transaction by SYS's shareholders and the co-locationapproval of a numberKratos stockholders for Kratos' issuance of our employees with our clients.
We have made significant investments in our management, employees and infrastructure in support of our growth and profitability strategies. Our senior managers have more than 125 years of collective experience with federal government agencies, the U.S. military and federal government contractors. Members of our management team have extensive experience growing businesses organically, as well as through acquisitions.
Relevant Industry Terms
We generally perform our services for federal government agencies pursuantshares. The transaction is expected to both contracts and task orders. Acontract may include specific work requirements for a particular job that is to be performed, or may instead provide a framework that defines the scope and terms under which work may be performedclose in the future, in which case anytask orders that may be issued from time to time under the contract set forth the specific work assignments that are to be performed under the contract. In this document, references to any contract include the task orders, if any, issued under that contract. Accordingly, information in this document regarding our revenue under government contracts includes revenue we receive under both contracts and task orders. We perform services as aprime contractor under those contracts and task orders that are awarded to us directly by the federal government. We also perform services for the federal government as asubcontractor to other companies that are awarded prime contracts. References in this prospectus regarding ourengagements mean specific work that we have contracted to perform as a prime contractor or subcontractor pursuant to both contracts and task orders for a particular client.second quarter of 2008.
Some of our contracts areIndustry Background
multiple award contracts (MACs). Multiple award contracts are vehicles pursuant to which the federal government may purchase goods or services from several different pre-qualified contractors. Such contracts include government-wide acquisition contracts (GWACs ), blanket purchase agreements (BPAs ),GSA Schedule 70 and other Indefinite Delivery/Indefinite Quantity (ID/IQ) contracts. GWACs are task-order or delivery-order contracts for goods and services established by one agency for government-wide use. BPAs are a simplified method of filling repetitive needs or services by establishing “charge accounts” with qualified suppliers and eliminating the need for issuing individual purchase, invoice and payment documents. GSA Schedule 70 is a contracting vehicle sponsored by the General Services Administration that is available to all federal government agencies for procuring information technology services and products pursuant to contracts (GSA Schedule 70 Contracts) and task orders (GSA Schedule 70 Task Orders) awarded thereunder. Finally,ID/IQs are contracts for goods or services which do not specify a firm quantity and that provide for issuance of orders for the performance of tasks during the contract period. Multiple award contracts typically have aceiling , which is the maximum amount the government is authorized to spend under the contract over the life of the contract. While the
government is permitted to spend up to the ceiling amount, there is no guarantee that it will do so or that any particular pre-qualified contractor will receive awards under the vehicle.
Federal government contracts for our services include three types of pricing: time-and-materials; cost-plus; and fixed-price.Time-and-materials contracts are contracts under which we are reimbursed for labor at fixed hourly rates and generally reimbursed separately for allowable materials, other direct costs and out-of-pocket expenses.Cost-plus contracts are contracts under which we are reimbursed for costs that are determined to be allowable and allocable to the contract and receive a fee, which represents our profit. Cost-plus fixed fee contracts specify the contract fee in dollars. Cost-plus incentive fee and cost-plus award fee contracts provide for increases or decreases in the contract fee, within specified limits, based upon actual results as compared to contractual targets for factors such as cost, quality, schedule and performance. Fixed-price contracts are contracts under which we perform specific tasks for a predetermined price.
Market Opportunity
U.S. Department of Defense Drives Strategic Priorities for the Company
The delivery and execution of our mission-critical engineering and support services are driven by the priorities of the U.S. Federal government. According to the U.S. Department of Defense (DoD) 2007 Fiscal Budget Priorities, the world has changed dramatically since the end of the last century, and the DoD is changing with it—refocusing America’s forces and capabilities for the future.
The strategic priorities of the DoD are based in large part on the Quadrennial Defense Review, the first conducted in an era of global terrorism, which continues the shift in emphasis by identifying key strategic priorities. These priorities are currently
focused on mission critical capabilities of ourthe U.S. armed forces and providing the support infrastructure necessary to sustain these forces in a time of heightened warfare readiness and deployment.
The 20072008 Fiscal Year DoD Budget request is $439.3$481.4 billion, an increase of $28.5$42.1 billion over Fiscal Year 2006. The budgetary increase is primarily a result of supporting Operation Iraqi Freedom with significant budgetary increases for the U.S. Army (+$12.7 billion), the U.S. Navy (+$4.1 billion) and the U.S. Marine Corps (+$0.8 billion), The U.S. Air Force (+$6.3 bilion), and Defense-wide increases of +$4.6 billion.2007. The total budgetary increase of approximately 7%9.6% represents a significant opportunity to key federal government contractors in support of the DoD’sDoD's war fighter, information technology, and other operational priorities. The fiscal DoD budget request for 2008 includes a request for supplemental funding of $141.7 billion to fight the Global War on Terror. We believe there will be significant market opportunities for providers of system sustainment, IT and engineering services and solutions to federal government agencies over the next several years, particularly those in the defense and homeland security community, over the next several years.communities.
The federal government, and the DoD in particular, is in the midst of a significant transformation that is driven by the federal government’sgovernment's need to address the changing nature of global threats. A significant aspect of this transformation is the use of Command, Control, Communications, Computing, Combat Systems, Intelligence, Surveillance and Reconnaissance (C4ISR)(C5ISR), and information technology to increase the federal government’sgovernment's effectiveness and efficiency. The result is increased federal government spending on information technology to upgrade networks and transform the federal government from separate, isolated organizations into larger, enterprise level, network-centric organizations capable of sharing information broadly and quickly. While the transformation initiative is driven by the need to prepare for new world threats, adopting these IT transformation initiatives will also improve efficiency and reduce infrastructure costs across all federal government agencies.
13 An additional aspect of the military transformation includes significantly enhancing military readiness in areas such as missile defense, weapons system sustainment and extension, and the overall strengthening of intelligence and security. For example, the objective of the DoD as it relates to missile defense is to continue to develop, test, and field missile defense systems to protect America, its allies and deployed forces.
Competitive Strengths
We believe we are well positioned to meet the rapidly evolving needs of federal government agencies for high-end engineering services,IT solutions and IT solutionsother technical operations because we possess the following key business strengths:strengths and performance qualifications:
Through the existing customer engagements and with the government focused acquisitions we have completed over the past several years, we have amassed significant and highly specialized experience in areas directly related to weapon system life cycle extension and sustainment; missile, rocket and weapons test and evaluation; C5ISR; military range operations and technical services and other highly differentiated services and solutions. This collective experience, or 'past performance qualifications,' is a requirement on the majority of contract vehicles and customer engagements we are involved in. We believe, this presents a significant barrier to entry and positions us for long-term success.
We have a long history of providing mission-critical services and solutions to our clients, enabling us to develop an in-depth understanding of their missions and technical needs. In addition, a significant number of our employees are located at client sites, giving us valuable strategic insights into clients’clients' ongoing and future program requirements. Our in-depth understanding of our client missions, in
conjunction with the strategic location of our employees, enables us to offer technical solutions tailored to our clients’clients' specific requirements and consistent with their evolving mission objectives.
As a result of our business development focus on securing key contracts, we are a preferred contractor on numerous multi-year GWACsgovernment-wide acquisition contracts and MACsmultiple award contracts that provide us with the opportunity to bid on hundreds of millions of dollars of business against a discrete number of other pre-qualified companies each year. These contracts include:
include Seaport-e,
GSA,
Passive RFID EPC-1,
PES,
IT,
LOG World,
Mobis
Millennia Lite,
AMCOM Express,
Consolidated Acquisition of Professional Services (CAPS)
, Support Services for Aviation, Air Defense &and Missile Systems, (NAVSURFWARCENDIV)
Systems Engineering and Technical Assistance Contract, (SETAC)
and Specialized Engineering, Development &and Test Articles/Models
Models. While the federal government is not obligated to make any awards under these vehicles, we believe that holding preferred positions on these contract vehicles provides us an advantage as we seek to expand the level of services we provide to our clients.
The federal government's Base Realignment and Closure (BRAC) Act of 2005 is the congressionally authorized process the Department of Defense has implemented to reorganize its base structure to more efficiently and effectively support U.S. armed forces, increase operational readiness and facilitate new ways of doing business. As a result of the DoD's BRAC transformation, we have concentrated our business strategy on building a significant presence in key BRAC receiving locations where the federal government is relocating its personnel as well as related technical and professional services. As we continue to entrench in these key locations, we expect this to be a significant competitive advantage.
We deliver our services through a highly skilled workforce of approximately 1,2001,500 full-time, part-time and on-call employees in our on-going business, as of August 1, 2007.business. Our senior managers have over 125 years of collective experience with federal government agencies, the U.S. military, and federal government contractors. Members of our management team have experience growing businesses organically, as well as through acquisitions.
The cumulative experience and differentiated expertise of our personnel in our core focus areas of C5ISR, weapons systems lifecycle extension and maintenance, missile and rocket test and evaluation, along with our sizable employee base with government security clearances, allow us to qualify for and bid on larger projects in the prime contracting role.
Services and Solutions
We provide a range of integrated engineering, war fighter, security and information technology services and solutions by leveraging our core service offerings: weapons systems lifecycle support and extension; C5ISR; military range operations and technical services; missile and rocket test and evaluation; security systems integration; and advanced network engineering; and IT services.
Weapon Systems Lifecycle Support and Extension
We provide weapons systems life cycle support and extension services for the DoD and foreign governments. These services focus on maintaining, testing and repairing certain weapons systems for the war fighter.
C5ISR (Command, Control, Communications, Computing, Combat Systems, Intelligence, Surveillance and Reconnaissance)
In the area of C5ISR, Kratos is involved in a wide range of services, including installation, upgrade and maintenance of command, control, combat and surveillance systems for customers such as Joint Inter Agency Task Force-south and the Naval Undersea Warfare Center (NUWC).
Strategy
Missile Range Operations and Technical Services
A key area of differentiation for us is within the range and technical service areas we offer. We have resources stationed at many major range locations throughout the United States, including NAWC Pt. Mugu, Hawaii Pacific Missile Range, Fort Bliss, Texas, and White Sands Missile Range, New Mexico. Our objectiveservices include aerial targets operations and maintenance, surface targets operations and maintenance, missile systems operations and maintenance, range operations planning and support, hazardous materials management, supply and logistics support, and manufacturing.
Missile and Rocket Test and Evaluation
Through the acquisition of Haverstick Consulting, Inc., we acquired expertise in the area of missile and rocket test and evaluation services. This includes exclusive rights to the design and manufacture of the motor on the Oriole Rocket System and ancillary hardware for sounding rockets, suborbital research and target services. Additionally, this area of our business develops and produces low-cost ballistic missile defense targets.
Security Systems Integration
We have broad experience integrating security services and solutions across a number of network and communications platforms. In particular, our non-federal business has long-standing experience and has developed significant customer relationships by providing best-in-class systems integration services on a variety of platforms including digital (IP) surveillance and security, building automation systems and controls, fire and life safety systems, access control and perimeter protection, and service and maintenance of the aforementioned systems.
We have comprehensive experience providing engineering services at any phase of a project lifecycle including program management, engineering design, system engineering, C5I System INCO, operations and maintenance, integrated telecommunications, and warfare systems training.
We also offer a range of IT services and solutions from conceptual network planning to system service and maintenance. We have extensive experience building complex and secure networks for the federal government, and we possess in-depth experience with network operations centers. Our services include network operations centers, help desks, system maintenance, system upgrades, configuration management, data warehousing, COTS selection and integration, and high performance computing.
Our Strategy
Our strategy is to aggressively grow our business as a leading provider of highly-differentiated services in our core areas of focus as noted above by delivering comprehensive, high-end engineering services, technical solutions and information technology solutions to federal government agencies while improving our profitability. To achieve our objective, we intend to:
We intend to accelerateare focused on accelerating our internal growth rate by capitalizing on our current contract base, expanding services provided to our existing clients, expanding our client base and offering new, complementary services.
Capitalize on Current Contract Base. We intend toare aggressively pursuepursuing task orders under existing contract vehicles to maximize our revenue and strengthen our client relationships, though there is no assurance that the federal government will make awards up to the ceiling amounts or that we will be awarded any task orders under these vehicles. We have developed several internal tools that facilitate our ability to track, prioritize and win task orders under these vehicles. Combining these tools with our
technical expertise, our strong past performance record and our knowledge of our clients’clients' needs, should position us to win additional task orders.
Expand Services Provided to Existing Clients. We intend to expandare focused on expanding the services we provide to our current clients by leveraging our strong relationships, technical capabilities and past performance record.record, and by offering a wider range of solutions as we continue to acquire companies with new areas of specialization. We believe our understanding of client missions, processes and needs, in conjunction with our full lifecycle IT offerings, positions us to capture new work from existing clients as the federal government continues to increase the volume of IT services contracted to professional services providers. Moreover, we believe our strong past performance record positions us to expand the level of services we provide to our clients as the federal government places greater emphasis on past performance as a criterion for awarding contracts.
Expand Client Base. We are also plan to expandfocused on expanding our client base into areas with significant growth opportunities by leveraging our industry reputation, long-term client relationships and diverse contract base. We anticipate that this expansion will enable us both to pursue additional higher value work and to further diversify our revenue base across the federal government. Our long-term relationships with federal government agencies, together with our GWACGovernment Wide Acquisition Contract vehicles, give us opportunities to win contracts with new clients within these agencies.
Improve Operating MarginsMargins.
We believe that we have significant opportunities to increase our operating margins and improve profitability by capitalizing on our corporate infrastructure investments and internally developed tools, and concentrating on high value-added prime contracts.
Capitalize on Corporate Infrastructure Investments. In recent periods, we have made significant investments in our senior management and corporate infrastructure in anticipation of future revenue growth. These investments included hiring senior executives with significant experience with federal IT services companies, strengthening our internal controls over financial reporting and accounting staff in support of Sarbanes-Oxley compliance and public company reporting requirements and expanding our Sensitive Compartmented Information Facilities (SCIFs) and other corporate facilities. We believe our management experience and corporate infrastructure are more typical of a company with a much larger revenue base than ours. We therefore anticipate that, asto the extent our revenue grows, we will be able to leverage this infrastructure base and increase our operating margins.
Concentrate on High Value-Added Prime Contracts. We expect to improve our operating margins as we strive to increase the percentage of revenue we derive from our work as a prime contractor and from engagements where contracts are awarded on a best value, rather than on a low cost, basis. The federal
government’s government's move toward performance-based contract awards to realize greater return on its investment has resulted in a shift to greater utilization of best value awards. We believe this shift will enable us to expand our operating margins as we are awarded more contracts of this nature.
We intend to supplement our organic growth by identifying, acquiring and integrating acquisitions that complement and broaden our existing client base and expand our primary service offerings. Our senior management team brings significant acquisition experience.
In the fourth quarter of 2006, we acquired Madison Research Corporation (“MRC”), a Huntsville, Alabama based privately-held provider of high-end engineering, weapon systems support, and professional services to the U.S. Army, U.S. Air Force, and NASA. Through the MRC acquisition, we significantly expanded our customer footprint within the DoD, added an important new customer with the U.S. Army, and added a key service differentiator by including weapon systems life cycle sustainment operations and maintenance to our core competencies, which will help us achieve our long term growth objectives.
We intend to pursue additional acquisition opportunities to continue to expand our customer base and to added new areas of differentiation to our business model.
Growth Strategy
Our revenues have grown organically by establishing new business units with experienced senior executives who have the ability to grow these business units and expand our customer base. Our objective is to continue growing revenues organically and through strategic acquisitions. In order to assist in accomplishing this objective, we are focused on expanding new business development resources to build the necessary infrastructure to identify, bid on and win new business. Additionally, we plan to acquire businesses that meet our primary objective of providing us with enhanced capabilities in order to pursue a broader cross section of the DoD, DHS and other government markets, which atcomplement and broaden our existing client base and expand our primary service offerings. Our senior management team brings significant acquisition experience.
As previously described in "Acquisitions" above, on December 31, 2007 we completed the same time, may enable usacquisition of Haverstick Consulting, Inc., an Indianapolis, Indiana based privately-held provider of rocket and missile test and evaluation, weapons systems support, and professional services to achieve our secondary objective of broadening our customer base.the U.S. Army, U.S. Air Force, U.S. Navy, NASA, and other federal, state and local agencies. In addition, on February 20, 2008 we entered into a definitive merger agreement with San Diego-based C5ISR and
net-centric warfare solutions provider SYS Technologies (AMEX:SYS) in a stock-for-stock transaction. We are currently evaluating other potential acquisition targets. We anticipate that we will need to obtain additional financing through the sale of equity or debt securities to fund any such acquisitions. We also expect to re-compete on our existing engineering and management contracts. Our rate of revenue growth depends upon many factors, including, among others, our success in bidding on new contracts and re-competes
Customers
A representative list of our existing contracts,customers in our KGS segment during 2007 included the continuation of our existing programs, the funding levels for our contracts, our ability to meet demand for our services or products and our ability to make strategic acquisitions and to grow the businesses of our acquired companies.
Current Organization
We currently have two types of business operations: federal; and non-federal. We do not treat our on-going business operations as separate segments. Rather, we view our business as an integrated whole. Within our federal division, we have sectors of expertise: “Communications & Technology Sector (CTS),” “Technical Resources Sector (TRS),” and “Engineering Design and Solutions Sector (EDSS).” Within our non-federal division, we maintain regional office locations, comprised of the Mid Atlantic Regional Office, Southeast Regional Office, and the Southwest Regional Office, where we are focused on security integration services.
Federal Business
Our federal business serves the federal information technology services market, which includes the design, development, deployment, integration and management of communications and information networks.
The fiscal year (FY) 2007 defense budget supports substantial investments in advanced technology to provide advantages over our enemies, particularly in remote sensing and high-performance computing. This includes investments in communications improving connectivity between troops and their commanders well beyond the field of battle. C4ISR capabilities, information communications and transformation are some of the key areas of focus for the DoD’s technology spending. We believe opportunities for growth can be found in the following areas:
Weapon Systems Lifecycle Support
C4ISR
U.S. Air Force, U.S. Army, U.S. Navy, Missile Defense IT
Knowledge management
Systems integration
Outsourced engineering services
We have historically targeted these areas for growth with our engineering service solutions, and in the past two years, we have begun to further supplement this growth by expanding our customer footprint in these areas through continued strategic acquisition. In particular, through our acquisition of MRC, we have added both service and product capabilities in: weapon systems support and maintenance; space programs; software and IT solutions; and advanced telecommunications programs.
The growth in the government information technology market is being driven by a number of factors, including an overall desire on the part of the federal government to upgrade communication and information systems, the aging of the federal workforce, and an increase in the use of private sector outsourcing. In addition, market growth has been driven and will continue to be driven in large part by DoD information technology spending which has been increasing over the past two years at an even faster rate than the overall government information technology market.
Our federal government business segment also focuses on the homeland security market with products and services aimed at providing first responders to emergency situations with a real time 3D image of the incident site.
Non-Federal Business
Our non-federal business provides system design, deployment, integration, monitoring and support services for non-federal, state, local and municipal governments and civilian networks. Non-federal networks have been traditionally segregated into systems such as voice, data, access control, video surveillance, temperature control and fire alarm. We provide services that combine such systems and offer integrated solutions on Ethernet-based and IP based platforms. We also offer solutions that combine safety, voice, data, electronic security and building automation systems with fixed or wireless connectivity solutions.
We aim to meet the needs of any non-federal government customer by understanding the needs of the particular entity, sifting through the multiple solutions and complex technologies available in the marketplace and designing, deploying, managing and maintaining a cost-effective and integrated solution that is capable of evolving as the needs of the client change with time. Our target markets include opportunities at; military bases, retail, healthcare, education, and public facilities.
Our commitment to these markets and our proven ability to provide feature-rich, cost-effective solutions has allowed us to become one of the larger independent civilian integrators for these types of systems.
Services and Solutions
We provide a range of integrated engineering, war fighter, security and information technology services and solutions by leveraging our five core service offerings: network engineering; engineering services; range and technical services; security systems integration; and IT services.
Weapons System Life Cycle Sustainment
We provide weapons systems life cycle sustainment services forAgency, the Department of DefenseHomeland Security, NASA, FMS and foreign governments. These services focus on maintaining, testingthe U.S. Southern Command. In our PSS segment, our customers in 2007 included General Electric, Atlanta's Hartsfield-Jackson Airport, Lockheed Martin, the City of Houston, Texas, and repairing certain weapons systems for the war fighter.Toyota Center.
The following table presents our customers from whom we receive more than 10% of our revenue:
Key Customer
| | Revenue
| | % of Total Revenue
| |
|---|
| 2005 | | | | | | |
| | U.S. Navy | | $ | 33.6 | | 22 | % |
| 2006 | | | | | | |
| | U.S. Navy | | $ | 34.2 | | 22 | % |
| 2007 | | | | | | |
| | U.S. Army | | $ | 46.7 | | 24 | % |
| | U.S. Navy | | $ | 38.7 | | 20 | % |
Engineering servicesEmployees
As of December 31, 2007, including the employees from the Haverstick Consulting acquisition, we employed approximately 1,500 full-time, part-time and on-call employees. We have comprehensive experience providing engineering services at any phaseone collective bargaining unit of a project lifecycle including Program Management, Engineering Design, Systems Engineering, C4I System INCO, Operationsapproximately 22 employees which is represented by the International Association of Machinists & Maintenance, Integrated Logistics, Test & Evaluation, Security/Building Mapping, Propulsion R&D, Advanced Telecommunications, and Warfare Systems Training.
Range & Technical Services
A key area of differentiation for us is within the range and technical service areas we offer. We have resources stationed at virtually all major range locations throughout the United States, including NAWC Pt. Magu, Hawaii Pacific Missile Range, Fort Bliss, Texas, andAerospace Workers, AFL-CIO, White Sands Missile Range,Local Lodge 2515, Alamogordo, New Mexico. Our services include, Aerial Targets Operations & Maintenance, Surface Targets Operations & Maintenance, Missile Systems Operations & Maintenance, Range Operations Planning & Support, HAZMAT Management, Supply & Logistics Support, and Manufacturing.
Security Systems IntegrationCompetition
We have broad experience integrating security services and solutions across a number of network and communications platforms. In particular, our non-federal business has long-standing experience and has developed vast customer relationships by providing best-in-class systems integration services on a variety of platforms including Digital (IP) Surveillance & Security, Building Automation Systems & Controls, Fire & Life Safety Systems, Access Control & Perimeter Protection, and Service & Maintenance.
Network Engineering
We offer a full lifecycle of network engineering services to our clients from the initial analysis of the requirements and design of the network through implementation and testing of the solution, including the design of disaster recovery contingency plans. Our network engineering capabilities include architecture development, design, implementation, configuration, and operation of Local Area Networks (LAN), Metropolitan Area Networks (MAN) and Wide Area Networks (WAN). Our extensive experience providing the following network engineering services for federal government clients allows us to rapidly identify potential bottlenecks, security threats and vulnerabilities, and address these potential issues with cost-effective solutions in Design, Architecture, Testing System, Integration, Deployment, Security Assessments, Recovery Plans, and Certification.
IT Services
We offer a range of IT services and solutions from conceptual network planning to system service and maintenance. We have extensive experience building complex and secure networks for the federal government, and we possess in-depth experience with network operations centers (NOCs). Our services
include Network Operations Centers (NOCs), Help Desks, System Maintenance, System Upgrades, Configuration Management, Data Warehousing, COTS Selection and Integration, and High Performance Computing.
Customers
Our primary customers include the U.S. Department of Defense, and various federal, state and local government agencies. Representative customers include:
U.S. Department of Defense (DoD)
U.S. Army
U.S. Navy
Foreign Military Services (FMS)
U.S. Department of Energy (DOE)
Defense Logistics Agency (DLA)
Defense Contract Management Agency (DCMA)
Defense Commissary Agency (DeCA)
Defense Information Systems Agency (DISA)
Space and Naval Warfare (SPAWAR) Systems Center
Joint Interagency Task Force-South (JIATF-South)
National Aeronautics and Space Administration (NASA)
Competition
Our market is competitive, and includes the full range of federal and non-federal engineering and IT service providers. Many of the companies that we compete against have significantly greater financial, technical and marketing resources, and generate greater revenues than we do.
Competition in the federal business segment includes tier one, large federal government contractors, such as Northrop Grumman, SAIC, ITT Industries, Inc., Computer Sciences Corporation, ARINC, Raytheon Corporation, BAE, and CACI. While we view government contractors as competitors, we often team with these companies in joint proposals or in the delivery of our services for customers. Tier two competitors include smaller and mid-tier government contractors such as NCI, Inc., Stanley, Inc., MTC Technologies, SYS Technologies, and Dynamics Research Corp.
Competition in the non-federal businessPSS segment includes Siemens Building Technology, Johnson Controls, Ingersoll Rand and Convergent.
We believe that the principal competitive factors in our ability to win new business include past performance, qualifications, domain and technology expertise, the ability to replace contract vehicles, the ability to deliver results within budget (time and cost), reputation, accountability, staffing flexibility including the large number of personnel with government security clearances, and project management expertise. We believe our ability to compete also depends on a number of additional factors including the ability of our customers to perform the services themselves, and competitive pricing for similar services.
Employees
Available Information
As We file reports with the SEC. We make available on our website under "Investor Relations/SEC Filings," free of August 1, 2007charge, our annual reports on Form 10-K, quarterly reports on Form 10-Q, current reports on Form 8-K and amendments to those reports as soon as reasonably practicable after we employed in our on-going business approximately 1,200 full-time employees, consultantselectronically file such materials with or furnish them to the SEC. Our website address iswww.kratosdefense.com. You can also read and contractors worldwide. Ascopy any materials we file with the SEC at the SEC's Public Reference Room at 100 F Street, NE, Washington, DC 20549. You can obtain additional information about the operation of the date of this report, approximately 25 employees are representedPublic Reference Room by a labor union,calling the SEC at 1-800-SEC-0330. In addition, the SEC maintains an Internet site (www.sec.gov) that contains reports, proxy and we have not experienced any work stoppages. This employee count does not includeinformation statements, and other information regarding issuers that file electronically with the deployment business employees on our payroll until October 1, 2007, who are currently being leased by Platinum Equity.SEC, including us.
19
Item 1A. Risk Factors
Risks Related to Our Business
You should carefully consider the following risk factors and all other information contained herein as well as the information included in this Annual Report, and other reports and filings made with the SEC in evaluating our business and prospects. Risks and uncertainties, in addition to those we describe below, that are not presently known to us or that we currently believe are immaterial may also impair our business operations. If any of the following risks occur, our business and financial results could be harmed and the price of our common stock could decline. You should also refer to the other information contained in this report, including our unaudited consolidated financial statements and related notes.
Our business could be adversely affected by changes in the contracting or fiscal policies of the federal government and governmental entities.
We derive a significant portion of our revenue from contracts with the U.S. federal government and government agencies and subcontracts under federal government prime contracts, and the success of our business and growth of our business will continue to depend on our successful procurement of government contracts either directly or through prime contractors. Accordingly, changes in government contracting policies or government budgetary constraints could directly affect our financial performance. Among the factors that could adversely affect our business are:
- •
- changes in fiscal policies or decreases in available government funding, including budgetary constraints affecting federal government spending generally, or specific departments or agencies in particular;
- •
- the adoption of new laws or regulations or changes to existing laws or regulations;
- •
- changes in political or social attitudes with respect to security and defense issues;
- •
- changes in federal government programs or requirements, including the increased use of small business providers;
- •
- changes in or delays related to government restrictions on the export of defense articles and services;
- •
- potential delays or changes in the government appropriations process; and
- •
- delays in the payment of our invoices by government payment offices.
These and other factors could cause governments and government agencies, or prime contractors that use us as a subcontractor, to reduce their purchases under existing contracts, to exercise their rights to terminate contracts at-will or to abstain from exercising options to renew contracts, any of which could have an adverse effect on our business, financial condition and results of operations. Many of our government customers are subject to stringent budgetary constraints. The award of additional
contracts from government agencies could be adversely affected by spending reductions or budget cutbacks at these agencies.
We derive a substantial amount of our revenues from the sale of our solutions either directly or indirectly to U.S. government entities pursuant to government contracts, which differ materially from standard commercial contracts, involve competitive bidding and may be subject to cancellation or delay without penalty, any of which may produce volatility in our revenues and earnings.
Government contracts frequently include provisions that are not standard in private commercial transactions, and are subject to laws and regulations that give the federal government rights and remedies not typically found in commercial contracts, including provisions permitting the federal government to:
- •
- terminate our existing contracts;
- •
- reduce potential future income from our existing contracts;
- •
- modify some of the terms and conditions in our existing contracts;
- •
- suspend or permanently prohibit us from doing business with the federal government or with any specific government agency;
- •
- impose fines and penalties;
- •
- subject us to criminal prosecution;
- •
- suspend work under existing multiple year contracts and related task orders if the necessary funds are not appropriated by Congress;
- •
- decline to exercise an option to extend an existing multiple year contract; and
- •
- claim rights in technologies and systems invented, developed or produced by us.
In addition, government contracts are frequently awarded only after formal competitive bidding processes, which have been and may continue to be protracted and typically impose provisions that permit cancellation in the event that necessary funds are unavailable to the public agency. Competitive procurements impose substantial costs and managerial time and effort in order to prepare bids and proposals for contracts that may not be awarded to us. In many cases, unsuccessful bidders for government agency contracts are provided the opportunity to formally protest certain contract awards through various agency, administrative and judicial channels. The protest process may substantially delay a successful bidder's contract performance, result in cancellation of the contract award entirely and distract management. We may not be awarded contracts for which we bid, and substantial delays or cancellation of purchases may follow our successful bids as a result of such protests.
Certain of our government contracts also contain "organizational conflict of interest" clauses that could limit our ability to compete for certain related follow-on contracts. For example, when we work on the design of a particular solution, we may be precluded from competing for the contract to install that solution. While we actively monitor our contracts to avoid these conflicts, we cannot guarantee that we will be able to avoid all organizational conflict of interest issues.
We face intense competition from many competitors that have greater resources than we do, which could result in price reductions, reduced profitability or loss of market share.
We operate in highly competitive markets and generally encounter intense competition to win contracts from many other firms, including mid-tier federal contractors with specialized capabilities and large defense and IT services providers. Competition in our markets may increase as a result of a number of factors, such as the entrance of new or larger competitors, including those formed through alliances or consolidation. These competitors may have greater financial, technical, marketing and
public relations resources, larger client bases and greater brand or name recognition than we do. These competitors could, among other things:
- •
- divert sales from us by winning very large-scale government contracts, a risk that is enhanced by the recent trend in government procurement practices to bundle services into larger contracts;
- •
- force us to charge lower prices; or
- •
- adversely affect our relationships with current clients, including our ability to continue to win competitively awarded engagements in which we are the incumbent.
If we lose business to our competitors or are forced to lower our prices, our revenue and our operating profits could decline. In addition, we may face competition from our subcontractors who, from time-to-time, seek to obtain prime contractor status on contracts for which they currently serve as a subcontractor to us. If one or more of our current subcontractors are awarded prime contractor status on such contracts in the future, it could divert sales from us or could force us to charge lower prices, which could cause our margins to suffer.
Recent acquisitions and potential future acquisitions could prove difficult to integrate, disrupt our business, dilute stockholder value and strain our resource.
We have completed several acquisitions of complementary businesses in recent years, including our October 2006 acquisition of Madison Research Technology Corporation and December 2007 acquisition of Haverstick Consulting, Inc. In addition, on February 20, 2008, we entered into an agreement to acquire SYS in a stock for stock transaction. We currently expect the transaction to close by the end of the second quarter of 2008, upon receipt of the required stockholder approvals. However, the transaction may not close as expected, and the anticipated synergies from the acquisition may not be fully realized or may take longer to realize than expected. The success of the acquisition will depend in part on the success in integrating the operations, technologies and personnel of SYS. The failure to successfully integrate the operations of the two companies or otherwise to realize any of the anticipated benefits of the acquisition could seriously harm our results of operations.
We continually evaluate opportunities to acquire new businesses as part of our ongoing strategy and we may in the future acquire additional companies that we believe could complement or expand our business or increase our customer base. Acquisitions involve numerous risks, including:
- •
- difficulties in integrating operations, technologies, accounting and personnel;
- •
- difficulties in supporting and transitioning customers of acquired companies;
- •
- difficulties or delays in transitioning federal government contracts pursuant to federal acquisition regulations;
- •
- diversion of financial and management resources from existing operations;
- •
- potential loss of key employees;
- •
- federal acquisition regulations may require us to enter into government novation agreements, a potentially time-consuming process; and
- •
- inability to generate sufficient revenue to offset acquisition costs.
Acquired companies may have liabilities or adverse operating issues that we fail to discover through due diligence prior to the acquisition. In particular, to the extent that prior owners of any acquired businesses or properties failed to comply with or otherwise violated applicable laws or regulations, or failed to fulfill their contractual obligations to the federal government or other clients, we, as the successor owner, may be financially responsible for these violations and failures and may suffer reputational harm or otherwise be adversely affected. Acquisitions also frequently result in the recording of goodwill and other intangible assets which are subject to potential impairments in the future that could harm our financial results. In addition, if we finance acquisitions by issuing convertible debt or equity securities, our existing stockholders may be diluted, which could affect the market price of our stock. As a result, if we fail to properly evaluate acquisitions or investments, we may not achieve the anticipated benefits of any such acquisitions, and we may incur costs in excess of what we anticipate.
We agreed to indemnify acquirers of our divested operations against specified losses in connection with the sale of these operations, and any demands for indemnification may result in expenses we do not anticipate and distract the attention of our management from our continuing businesses.
We agreed to indemnify acquirers of our divested operations against specified losses in connection with their sale and generally retain responsibility for various legal liabilities that accrued prior to closing. We also made representations and warranties to these acquirers about the condition of the divested businesses. If any acquirer makes an indemnification claim because it has suffered a loss or a third party has commenced an action against the divested business, we may incur substantial expenses resolving such claims or defending against the third party action, which would harm our operating results. In addition, our ability to defend ourselves may be impaired because our former employees are now employees of the acquirer or other companies, and our management may have to devote a substantial amount of time to resolving the claim. In addition, these indemnity claims may divert management attention from responsibilities related to the daily ongoing concerns of the business. In addition, we may be required to expend substantial resources trying to determine which party has responsibility for the claim, even if we are ultimately found to be not responsible.
Our financial results may vary significantly from quarter to quarter.
We expect our revenue and operating results to vary from quarter to quarter. Reductions in revenue in a particular quarter could lead to lower profitability in that quarter because a relatively large amount of our expenses are fixed in the short-term. We may incur significant operating expenses during the start-up and early stages of large contracts and may not be able to recognize corresponding revenue in that same quarter. We may also incur additional expenses when contracts expire, are terminated or are not renewed.
In addition, payments due to us from federal government agencies may be delayed due to billing cycles or as a result of failures of government budgets to gain congressional and administration approval in a timely manner. The federal government's fiscal year ends September 30. If a federal budget for the next federal fiscal year has not been approved by that date in each year, our clients may have to suspend engagements that we are working on until a budget has been approved. Any such suspensions may reduce our revenue in the fourth quarter of that year or the first quarter of the subsequent year. The federal government's fiscal year end can also trigger increased purchase requests from clients for equipment and materials. Any increased purchase requests we receive as a result of the federal government's fiscal year end would serve to increase our third or fourth quarter revenue, but will generally decrease profit margins for that quarter, as these activities generally are not as profitable as our typical offerings.
Additional factors that may cause our financial results to fluctuate from quarter to quarter include those addressed elsewhere in these Risk Factors and the following, among others:
- •
- the terms of customer contracts that affect the timing of revenue recognition;
- •
- variability in demand for our services and solutions;
- •
- commencement, completion or termination of contracts during any particular quarter;
- •
- timing of award or performance incentive fee notices;
- •
- timing of significant bid and proposal costs;
- •
- variable purchasing patterns under the GSA Schedule 70 Contracts, government wide acquisition contracts (GWACs), blanket purchase agreements and other indefinite delivery/indefinite quantity contracts;
- •
- restrictions on and delays related to the export of defense articles and services;
- •
- costs related to ongoing government inquiries;
- •
- strategic decisions by us or our competitors, such as acquisitions, divestitures, spin-offs and joint ventures;
- •
- strategic investments or changes in business strategy;
- •
- changes in the extent to which we use subcontractors;
- •
- seasonal fluctuations in our staff utilization rates;
- •
- changes in our effective tax rate including changes in our judgment as to the necessity of the valuation allowance recorded against our deferred tax assets; and
- •
- the length of sales cycles.
Significant fluctuations in our operating results for a particular quarter could cause us to fall out of compliance with the financial covenants contained in our credit facility, which if not waived by the lender, could restrict our access to capital and cause us to take extreme measures to pay down our debt under the credit facility. In addition, fluctuations in our financial results could cause our stock price to decline.
If we fail to establish and maintain important relationships with government entities and agencies and other government contractors, our ability to bid successfully for new business may be adversely affected.
To develop new business opportunities, we primarily rely on establishing and maintaining relationships with various government entities and agencies. We may be unable to successfully maintain our relationships with government entities and agencies, and any failure to do so could materially adversely affect our ability to compete successfully for new business. In addition, we often act as a subcontractor or in "teaming" arrangements in which we and other contractors bid together on particular contracts or programs for the federal government or government agencies. As a subcontractor or team member, we often lack control over fulfillment of a contract, and poor performance on the contract could tarnish our reputation, even when we perform as required. We expect to continue to depend on relationships with other contractors for a portion of our revenue in the foreseeable future. Moreover, our revenue and operating results could be materially adversely affected if any prime contractor or teammate chooses to offer a client services of the type that we provide or if any prime contractor or teammate teams with other companies to independently provide those services.
We derive a significant portion of our revenues from a limited number of customers.
We have derived, and believe that we will continue to derive, a significant portion of our revenues from a limited number of customers. To the extent that any significant customer uses less of our services or terminates its relationship with us, our revenues could decline significantly. As a result, the loss of any significant client could seriously harm our business. For the fiscal year ended December 31, 2007, two customers comprised approximately 60% and 44% of our federal business revenues and total revenues, respectively, and our five largest customers accounted for approximately 84% and 62% of our total federal business revenues and total revenues, respectively. None of our customers are obligated to purchase additional services from us. As a result, the volume of work that we perform for a specific customer is likely to vary from period to period, and a significant client in one period may not use our services in a subsequent period.
Our margins and operating results may suffer if we experience unfavorable changes in the proportion of cost-plus-fee or fixed-price contracts in our total contract mix.
Although fixed-price contracts entail a greater risk of a reduced profit or financial loss on a contract compared to other types of contracts we enter into, fixed-price contracts typically provide
higher profit opportunities because we may be able to benefit from cost savings. In contrast, cost-plus-fee contracts are subject to statutory limits on profit margins, and generally are the least profitable of our contract types. Our federal government customers typically determine what type of contract we enter into. Cost-plus-fee and fixed- price contracts in our federal business accounted for approximately 51.1% and 23.3%, respectively, of our federal business revenues for the fiscal year ended December 31, 2007. To the extent that we enter into more cost-plus-fee or less fixed-price contracts in proportion to our total contract mix in the future, our margins and operating results may suffer.
Our cash flow and profitability could be reduced if expenditures are incurred prior to the final receipt of a contract.
We provide various professional services and sometimes procure equipment and materials on behalf of our federal government customers under various contractual arrangements. From time to time, in order to ensure that we satisfy our customers' delivery requirements and schedules, we may elect to initiate procurement in advance of receiving final authorization from the government customer or a prime contractor. If our government or prime contractor customers' requirements should change or if the government or the prime contractor should direct the anticipated procurement to a contractor other than us or if the equipment or materials become obsolete or require modification before we are under contract for the procurement, our investment in the equipment or materials might be at risk if we cannot efficiently resell them. This could reduce anticipated earnings or result in a loss, negatively affecting our cash flow and profitability.
Loss of our GSA contracts or GWACs would impair our ability to attract new business.
We are a prime contractor under several GSA contracts and GWAC schedule contracts. We believe that our ability to provide services under these contracts will continue to be important to our business because of the multiple opportunities for new engagements each contract provides. If we were to lose our position as prime contractor on one or more of these contracts, we could lose substantial revenues and our operating results could suffer. GSA contracts and other GWACs typically have a one or two-year initial term with multiple options exercisable at the government client's discretion to extend the contract for one or more years. We cannot be assured that our government clients will continue to exercise the options remaining on our current contracts, nor can we be assured that our future clients will exercise options on any contracts we may receive in the future.
Failure to properly manage projects may result in additional costs or claims.
Our engagements often involve large scale, highly complex projects. The quality of our performance on such projects depends in large part upon our ability to manage the relationship with our customers, and to effectively manage the project and deploy appropriate resources, including third-party contractors, and our own personnel, in a timely manner. Any defects or errors or failure to meet clients' expectations could result in claims for substantial damages against us. Our contracts generally limit our liability for damages that arise from negligent acts, error, mistakes or omissions in rendering services to our clients. However, we cannot be sure that these contractual provisions will protect us from liability for damages in the event we are sued. In addition, in certain instances, we guarantee customers that we will complete a project by a scheduled date. If the project experiences a performance problem, we may not be able to recover the additional costs we will incur, which could exceed revenues realized from a project. Finally, if we underestimate the resources or time we need to complete a project with capped or fixed fees, our operating results could be seriously harmed.
The loss of any member of our senior management could impair our relationships with federal government clients and disrupt the management of our business.
We believe that the success of our business and our ability to operate profitably depends on the continued contributions of the members of our senior management. We rely on our senior management to generate business and execute programs successfully. In addition, the relationships and reputation
that many members of our senior management team have established and maintain with federal government personnel contribute to our ability to maintain strong client relationships and to identify new business opportunities. We do not have any employment agreements providing for a specific term of employment with any member of our senior management. The loss of any member of our senior management could impair our ability to identify and secure new contracts, to maintain good client relations and to otherwise manage our business.
If we fail to attract and retain skilled employees or employees with the necessary security clearances, we might not be able to perform under our contracts or win new business.
The growth of our business and revenue depends in large part upon our ability to attract and retain sufficient numbers of highly qualified individuals who have advanced information technology and/or engineering skills. These employees are in great demand and are likely to remain a limited resource in the foreseeable future. Certain federal government contracts require us, and some of our employees, to maintain security clearances. Obtaining and maintaining security clearances for employees involves a lengthy process, and it is difficult to identify, recruit and retain employees who already hold security clearances. In addition, some of our contracts contain provisions requiring us to staff an engagement with personnel that the client considers key to our successful performance under the contract. In the event we are unable to provide these key personnel or acceptable substitutions, the client may terminate the contract and we may lose revenue.
If we are unable to recruit and retain a sufficient number of qualified employees, our ability to maintain and grow our business could be limited. In a tight labor market, our direct labor costs could increase or we may be required to engage large numbers of subcontractor personnel, which could cause our profit margins to suffer. Conversely, if we maintain or increase our staffing levels in anticipation of one or more projects and the projects are delayed, reduced or terminated, we may underutilize the additional personnel, which would increase our general and administrative expenses, reduce our earnings and possibly harm our results of operations.
If our subcontractors fail to perform their contractual obligations, our performance and reputation as a prime contractor and our ability to obtain future business could suffer.
As a prime contractor, we often rely upon other companies to perform work we are obligated to perform for our clients as subcontractors. As we secure more work under our GWAC vehicles, we expect to require an increasing level of support from subcontractors that provide complementary and supplementary services to our offerings. Depending on labor market conditions, we may not be able to identify, hire and retain sufficient numbers of qualified employees to perform the task orders we expect to win. In such cases, we will need to rely on subcontracts with unrelated companies. Moreover, even in favorable labor market conditions, we anticipate entering into more subcontracts in the future as we expand our work under our GWACs. We are responsible for the work performed by our subcontractors, even though in some cases we have limited involvement in that work.
If one or more of our subcontractors fail to satisfactorily perform the agreed-upon services on a timely basis or violate federal government contracting policies, laws or regulations, our ability to perform our obligations as a prime contractor or meet our clients' expectations may be compromised. In extreme cases, performance or other deficiencies on the part of our subcontractors could result in a client terminating our contract for default. A termination for default could expose us to liability, including liability for the agency's costs of reprocurement, could damage our reputation and could hurt our ability to compete for future contracts.
Our failure to comply with complex procurement laws and regulations could cause us to lose business and subject us to a variety of penalties.
We must comply with laws and regulations relating to the formation, administration and performance of federal government contracts, which affect how we do business with our clients and
may impose added costs on us. In addition, the federal government, including the Defense Contract Audit Agency (DCAA), audits and reviews our performance on contracts, pricing practices, cost structure and compliance with applicable laws, regulations and standards. The DCAA reviews a contractor's internal control systems and policies, including the contractor's purchasing, property, estimating, compensation and management information systems, and the contractor's compliance with such policies. Any costs found to be improperly allocated to a specific contract will not be reimbursed, while such costs already reimbursed must be refunded. Adverse findings in a DCAA audit could materially affect our competitive position and result in a substantial adjustment to our revenue and profit.
The commercial business arena in which we operate has relatively low barriers to entry and increased competition could result in margin erosion, which would make profitability even more difficult to sustain.
Other than the technical skills required in our commercial business, the barriers to entry in area are relatively low. We do not have any intellectual property rights in this segment of our business to protect our methods and business start-up costs do not pose a significant barrier to entry. The success of our commercial business is dependent on our employees, customer relations and the successful performance of our services. If we face increased competition as a result of new entrants in our markets, we could experience reduced operating margins and loss of market share and brand recognition.
If our commercial customers do not invest in security systems and other new in-building technologies such as wireless local area networks and/or IP-based networks, our business will suffer.
We intend to devote significant resources to developing our enterprise-based wireless local area networks (WLAN), but we cannot predict that we will achieve widespread market acceptance amongst the enterprises we identify as potential customers. It is possible that some enterprises will determine that capital constraints and other factors outweigh their need for WLAN systems. As a result, we may be affected by a significant delay in the adoption of WLAN by enterprises, which would harm our business.
If we experience systems or service failure, our reputation could be harmed and our clients could assert claims against us for damages or refunds.
We create, implement and maintain IT solutions that are often critical to our clients' operations. We have experienced, and may in the future experience, some systems and service failures, schedule or delivery delays and other problems in connection with our work. If we experience these problems, we may:
- •
- lose revenue due to adverse client reaction;
- •
- be required to provide additional services to a client at no charge;
- •
- receive negative publicity, which could damage our reputation and adversely affect our ability to attract or retain clients; and
- •
- suffer claims for substantial damages.
In addition to any costs resulting from product or service warranties, contract performance or required corrective action, these failures may result in increased costs or loss of revenue if clients postpone subsequently scheduled work or cancel, or fail to renew, contracts.
While many of our contracts limit our liability for consequential damages that may arise from negligence in rendering services to our clients, we cannot assure you that these contractual provisions will be legally sufficient to protect us if we are sued. In addition, our errors and omissions and product liability insurance coverage may not be adequate, may not continue to be available on reasonable terms or in sufficient amounts to cover one or more large claims, or the insurer may disclaim coverage as to
some types of future claims. The successful assertion of any large claim against us could seriously harm our business. Even if not successful, these claims could result in significant legal and other costs, may be a distraction to our management and may harm our reputation.
Security breaches in sensitive federal government systems could result in the loss of clients and negative publicity.
Many of the systems we develop, install and maintain involve managing and protecting information involved in intelligence, national security and other sensitive or classified federal government functions. A security breach in one of these systems could cause serious harm to our business, damage our reputation and prevent us from being eligible for further work on sensitive or classified systems for federal government clients. We could incur losses from such a security breach that could exceed the policy limits under our errors and omissions and product liability insurance. Damage to our reputation or limitations on our eligibility for additional work resulting from a security breach in one of the systems we develop, install and maintain could materially reduce our revenue.
Our employees may engage in misconduct or other improper activities, which could cause us to lose contracts.
We are exposed to the risk that employee fraud or other misconduct could occur. Misconduct by employees could include intentional failures to comply with federal government procurement regulations, engaging in unauthorized activities or falsifying time records. Employee misconduct could also involve the improper use of our clients' sensitive or classified information, which could result in regulatory sanctions against us and serious harm to our reputation and could result in a loss of contracts and a reduction in revenues. It is not always possible to deter employee misconduct, and the precautions we take to prevent and detect this activity may not be effective in controlling unknown or unmanaged risks or losses, which could cause us to lose contracts or cause a reduction in revenues.
Our business is dependent upon our ability to keep pace with the latest technological changes.
The market for our services is characterized by rapid change and technological improvements. Failure to respond in a timely and cost effective way to these technological developments would result in serious harm to our business and operating results. We have derived, and we expect to continue to derive, a substantial portion of our revenues from providing innovative engineering services and technical solutions that are based upon today's leading technologies and that are capable of adapting to future technologies. As a result, our success will depend, in part, on our ability to develop and market service offerings that respond in a timely manner to the technological advances of our customers, evolving industry standards and changing client preferences.
If we are unable to manage our growth, our business could be adversely affected.
Sustaining our growth has placed significant demands on our management, as well as on our administrative, operational and financial resources. For us to continue to manage our growth, we must continue to improve our operational, financial and management information systems and expand, motivate and manage our workforce. If we are unable to manage our growth while maintaining our quality of service and profit margins, or if new systems that we implement to assist in managing our growth do not produce the expected benefits, our business, prospects, financial condition or operating results could be adversely affected.
We may be harmed by intellectual property infringement claims and our failure to protect our intellectual property could enable competitors to market products and services with similar features.
We may become subject to claims from our employees or third parties who assert that software and other forms of intellectual property that we use in delivering services and solutions to our clients infringe upon intellectual property rights of such employees or third parties. Our employees develop some of the software and other forms of intellectual property that we use to provide our services and
solutions to our clients, but we also license technology from other vendors. If our employees, vendors, or other third parties assert claims that we or our clients are infringing on their intellectual property rights, we could incur substantial costs to defend those claims. If any of these infringement claims are ultimately successful, we could be required to cease selling or using products or services that incorporate the challenged software or technology, obtain a license or additional licenses from our employees, vendors, or other third parties, or redesign our products and services that rely on the challenged software or technology.
We attempt to protect our trade secrets by entering into confidentiality and intellectual property assignment agreements with third parties, our employees and consultants. However, these agreements can be breached and, if they are, there may not be an adequate remedy available to us. In addition, others may independently discover our trade secrets and proprietary information and in such cases we could not assert any trade secret rights against such party. Enforcing a claim that a party illegally obtained and is using our trade secret is difficult, expensive and time consuming, and the outcome is unpredictable. If we are unable to protect our intellectual property, our competitors could market services or products similar to our services and products, which could reduce demand for our offerings. Any litigation to enforce our intellectual property rights, protect our trade secrets or determine the validity and scope of the proprietary rights of others could result in substantial costs and diversion of resources, with no assurance of success.
The matters relating to our internal review of our stock option granting practices and the restatement of our financial statements have exposed us to civil litigation claims, regulatory proceedings and government proceedings which could burden the Company and have a material adverse effect on us.
Our In the summer of 2006, our current executive management team, which has been in place since 2004, initiated the Equityan investigation of our past stock option granting practices (the "Equity Award Review in the summer of 2006Review") in reaction to media reports regarding stock option granting practices of public companies. The Equity Award Review was conducted with oversight from the Board and assistance from our outside counsel, Morrison & Foerster.counsel. In February 2007, the Board appointed a Special Committee of the Board to review the adequacy of the Equity Award Review and the recommendations of management regarding historical option granting practices, and to make recommendations and findings regarding those practices and individual conduct. The Special Committee was not charged with making, and did not make, any evaluation of the accounting determinations or tax adjustments. The Special Committee was comprised of a non-employee director who had not served on our Compensation Committee before 2005.
The Equity Award Review encompassed all grants of options to purchase shares of our common stock and other equity awards made since two months prior to our IPO in November 1999 through December 2006. We also reviewed all option grants that were entered into our stock option database (Equity Edge) after our IPO with a grant date before November 1999, as well as other substantial grants issued prior to our IPO, consisting of more than 14,000 grants. We further reviewed all option grants with a grant date that preceded an employee’semployee's date of hire. As part of the review, interviews of 18 current and former officers, directors, employees and attorneys were conducted, and more than 40 million pages of electronic and hard copy documents were searched for relevant information. The Special Committee also conducted its own separate review of the option granting practices during the tenure of current executive management team through additional interviews and document collection and review with the assistance of its own separate counsel Pillsbury Winthrop, and FTI Consulting.
The Equity Award Review established the absence of contemporaneous evidence supporting a substantial number of the previously-recorded option grants, substantially all of which were made in the period from 1998 through late 2003. During this period of time, in some instances, documents, data and interviews suggest that option grants were prepared or finalized days or, in some cases, weeks or months after the option grant date recorded in our books. The affected grants include options issued to certain newly-hired employees but dated prior to their employment start dates and options issued to
non-employees, including advisors to the Board erroneously designated as employees. The Special Committee also concluded that certain former employees and former officers participated in making improper option grants, including the selection of grant dates with the benefit of hindsight and in the deferral of the recording of otherwise approved option grants.
In light of the Equity Award Review, the Audit Committee of our Board concluded that our prior financial statements for periods from 1998 through our filing of interim financial statements for the period ended September 30, 2006, cancould no longer be relied upon and must be restated. Our management
determined that, from fiscal year 1998 through fiscal year 2005, we had unrecorded non-cash equity-based compensation charges associated with our equity incentive plans. These charges are material to our financial statements for the years ended December 31, 1998 through 2005, the periods to which such charges would have related. Previously filed annual reports on Form 10-K and quarterly reports on Form 10-Q affected by the restatements have not been and will not be amended and should not be relied upon. Our Annual Report on Form 10-K filed on September 11, 2007 superseded and replaced in their entirety all of our previously issued financial statements and related reports filed with the Securities and Exchange Commission.
Our past stock option granting practices and the restatement of our prior financial statements have exposed and may continue to expose us to greater risks associated with litigation, regulatory proceedings and government inquiries and enforcement actions. As described in Part I, Item 3, “Legal"Legal Proceedings,”" several derivative complaints have been filed in state and federal courts against our current directors, some of our former directors and some of our current and former executive officers pertaining to allegations relating to stock option grants. The SEC has initiated an informal inquiry into our historical stock option granting practices and we received a subpoena from the United States Attorney’sAttorney's Office for the Southern District of California for the production of documents relating to our historical stock option granting practices, which could result in civil and/or criminal actions seeking, among other things, injunctions against us and the payment of significant fines and penalties by us. We are cooperating with the SEC and the United States Attorney’sAttorney's Office for the Southern District of California, and expect to continue to do so.
We have not been in compliance with The Nasdaq Stock Market’s continued listing requirements and remain subject to the risk of our stock being delisted from The Nasdaq Global Select Market, which would have a material adverse effect on us and our stockholders.
Due to the Equity Award Review and resulting restatements, we could not timely file with the SEC our Annual Report on Form 10-K for the year ended December 31, 2006 or our Quarterly Reports on Form 10-Q for the periods ended March 31, 2007 and June 30, 2007. As a result, and as described in Part I, Item 3, “Legal Proceedings,” we were not in compliance with the filing requirements for continued listing on The Nasdaq Global Select Market as set forth in Marketplace Rule 4310(c)(14) and were subject to delisting from The Nasdaq Global Select Market. Until we file our Quarterly Reports on Form 10-Q for the periods ended March 31, 2007, and June 30, 2007, we will continue to be in non-compliance with Marketplace Rule 4310(c)(14), and our common stock may be delisted from The Nasdaq Select Global Market. If our stock is delisted, it would be uncertain when, if ever, our common stock would be relisted. If a delisting did happen, the price of our stock and the ability of our stockholders to trade in our stock could be adversely affected and, depending on the duration of the delisting, some institutions whose charters disallow holding securities in unlisted companies might sell our shares, which could have a further adverse effect on the price of our stock.
The process of restating our financial statements, making the associated disclosures, and complying with SEC requirements are subject to uncertainty and evolving requirements.
We have worked with our outside legal counsel and our independent registered public accounting firms to make our filings comply with all related requirements. Nevertheless the issues surrounding our historical stock option grant practices are complex and the regulatory guidelines or requirements continue to evolve. There can be no assurance that further SEC and other requirements will not evolve and that we will not be required to further amend this and other filings. In addition to the cost and time to amend financial reports, such amendments may have a material adverse affect on investors and common stock price and could result in a delisting of our common stock from The Nasdaq Global Select Market.
A number of our current and former executive officers and directors have been named as parties to several derivative action lawsuits arising from our internal option review, and there is a possibility of additional lawsuits, all of which could require significant management time and attention and result in significant legal expenses.
We are subject to a number of lawsuits purportedly on behalf of Wireless Facilities, Inc. against certain of our current and former executive officers and board members, and we may become the subject of additional private lawsuits. Subject to certain limitations, we are obligated to indemnify our current and former directors, officers and employees in connection with the investigation of our historical stock option practices and such lawsuits. The expenses associated with these lawsuits may be significant, the amount of time to resolve these lawsuits is unpredictable and defending these lawsuits may divert management’s attention from the day-to-day operations of our business, which could have a material adverse effect on our financial condition, business, results of operations and cash flows.
Ongoing government inquiries relating to our past stock option practices may be time consuming and expensive and could result in injunctions, fines and penalties that may have a material adverse effect on our financial condition and results of operations.
The inquiries by the Department of Justice (“DOJ”) and the SEC into our past stock option practices are ongoing. We have cooperated with the DOJ and the SEC and expect to continue to do so. The period of time necessary to resolve these inquiries is uncertain, and we cannot predict the outcome of these inquiries or whether we will face additional government inquiries, investigations or other actions related to our historical stock option grant practices. Subject to certain limitations, we are obligated to indemnify our current and former directors, officers and employees in connection with the investigation of our historical stock option practices, these DOJ and SEC inquiries and any future government inquiries, investigations or actions. These inquiries could require us to expend significant management time and incur significant legal and other expenses, and could result in civil and criminal actions seeking, among other things, injunctions against us and the payment of significant fines and penalties by us, which could have a material adverse effect on our financial condition, business, results of operations and cash flow.
We face intense competition from many competitors that have greater resources than we do, which could result in price reductions, reduced profitability or loss of market share.
We operate in highly competitive markets and generally encounter intense competition to win contracts from many other firms, including mid-tier federal contractors with specialized capabilities and large defense and IT services providers. Competition in our markets may increase as a result of a number of factors, such as the entrance of new or larger competitors, including those formed through alliances or consolidation. These competitors may have greater financial, technical, marketing and public relations resources, larger client bases and greater brand or name recognition than we do. These competitors could, among other things:
· divert sales from us by winning very large-scale government contracts, a risk that is enhanced by the recent trend in government procurement practices to bundle services into larger contracts;
· force us to charge lower prices; or
· adversely affect our relationships with current clients, including our ability to continue to win competitively awarded engagements in which we are the incumbent.
If we lose business to our competitors or are forced to lower our prices, our revenue and our operating profits could decline. In addition, we may face competition from our subcontractors who, from time-to-time, seek to obtain prime contractor status on contracts for which they currently serve as a subcontractor to us. If one or more of our current subcontractors are awarded prime contractor status on such contracts in the future, it could divert sales from us or could force us to charge lower prices, which could cause our margins to suffer.
Our quarterly operating results may fluctuate significantly as a result of factors outside of our control, which could cause the market price of our common stock to decline.
We expect our revenue and operating results to vary from quarter to quarter. As a result, our operating results may fall below the expectations of securities analysts and investors, which could cause the price of our common stock to decline. Factors that may affect our operating results include those listed in this “Risk Factors” section and others such as:
· fluctuations in revenue recognized on contracts;
· variability in demand for our services and solutions;
· commencement, completion or termination of contracts during any particular quarter;
· timing of award or performance incentive fee notices;
· timing of significant bid and proposal costs;
· variable purchasing patterns under the GSA Schedule 70 Contracts, government wide acquisition contracts (GWACs), blanket purchase agreements and other Indefinite Delivery/Indefinite Quantity (ID/IQ) contracts;
· strategic decisions by us or our competitors, such as acquisitions, divestitures, spin-offs and joint ventures;
· strategic investments or changes in business strategy;
· changes in the extent to which we use subcontractors;
· seasonal fluctuations in our staff utilization rates;
· federal government shutdowns or temporary facility closings;
· fluctuations in demand for outsourced network services or engineering services;
· changes in our effective tax rate including changes in our judgment as to the necessity of the valuation allowance recorded against our deferred tax assets, and
· the length of sales cycles.
Reductions in revenue in a particular quarter could lead to lower profitability in that quarter because a relatively large amount of our expenses are fixed in the short-term. We may incur significant operating expenses during the start-up and early stages of large contracts and may not be able to recognize corresponding revenue in that same quarter. We may also incur additional expenses when contracts expire, are terminated or are not renewed.
In addition, payments due to us from federal government agencies may be delayed due to billing cycles or as a result of failures of government budgets to gain congressional and administration approval in a timely manner. The federal government’s fiscal year ends September 30. If a federal budget for the next federal fiscal year has not been approved by that date in each year, our clients may have to suspend engagements that we are working on until a budget has been approved. Any such suspensions may reduce our revenue in the fourth quarter of that year or the first quarter of the subsequent year. The federal government’s fiscal year end can also trigger increased purchase requests from clients for equipment and materials. Any increased purchase requests we receive as a result of the federal government’s fiscal year end would serve to increase our third or fourth quarter revenue, but will generally decrease profit margins for that quarter, as these activities generally are not as profitable as our typical offerings.
23
Our business could be adversely affected by changes in budgetary priorities of the Federal Government.
Because we derive a significant portion of our revenue from contracts with the Federal Government, we believe that the success and development of our business will continue to depend on our successful participation in Federal Government contract programs. Changes in Federal Government budgetary priorities could directly affect our financial performance. A significant decline in government expenditures, a shift of expenditures away from programs that call for the types of services that we provide, or a change in Federal Government contracting policies could cause Federal Governmental agencies to reduce their expenditures under contracts, to exercise their right to terminate contracts at any time without penalty, not to exercise options to extend contracts, or to delay or not enter into new contracts. Any of those actions could seriously harm our business, prospects, financial condition or operating results. Moreover, although our contracts with governmental agencies often contemplate that our services will be performed over a period of several years, Congress usually must approve funds for a given program each government fiscal year and may significantly reduce or eliminate funding for a program. Significant reductions in these appropriations by Congress could have a material adverse effect on our business. Additional factors that could have a serious adverse effect on our Federal Government contracting business include:
· changes in Federal Government programs or requirements;
· budgetary priorities limiting or delaying Federal Government spending generally, or by specific departments or agencies in particular, and changes in fiscal policies or available funding, including potential governmental shutdowns;
· reduction in the Federal Government’s use of technology and/or professional services & solutions firms; and
· an increase in the number of contracts reserved for small businesses which could result in our inability to compete directly for these prime contracts.
Our contracts with the Federal Government may be terminated or adversely modified prior to completion, which could adversely affect our business.
Federal Government contracts generally contain provisions, and are subject to laws and regulations, that give the Federal Government rights and remedies not typically found in commercial contracts, including provisions permitting the Federal Government to:
· terminate our existing contracts;
· reduce potential future income from our existing contracts;
· modify some of the terms and conditions in our existing contracts;
· suspend or permanently prohibit us from doing business with the Federal Government or with any specific government agency;
· impose fines and penalties;
· subject us to criminal prosecution;
· subject the award of some contracts to protest or challenge by competitors, which may require the contracting federal agency or department to suspend our performance pending the outcome of the protest or challenge and which may also require the government to solicit new proposals for the contract or result in the termination, reduction or modification of the awarded contract;
· suspend work under existing multiple year contracts and related task orders if the necessary funds are not appropriated by Congress;
· decline to exercise an option to extend an existing multiple year contract; and
· claim rights in technologies and systems invented, developed or produced by us.
The Federal Government may terminate a contract with us either “for convenience” (for instance, due to a change in its perceived needs or its desire to consolidate work under another contract) or if we default by failing to perform under the contract. If the Federal Government terminates a contract with us for convenience, we generally would be entitled to recover only our incurred or committed costs, settlement expenses and profit on the work completed prior to termination. If the Federal Government terminates a contract with us based upon our default, we generally would be denied any recovery for undelivered work, and instead may be liable for excess costs incurred by the Federal Government in procuring undelivered items from an alternative source and other damages as authorized by law. As is common with government contractors, we have experienced and continue to experience occasional performance issues under some of our contracts. We may in the future receive show-cause or cure notices under contracts that, if not addressed to the Federal Government’s satisfaction, could give the government the right to terminate those contracts for default or to cease procuring our services under those contracts.
Our Federal Government contracts typically have terms of one or more base years and one or more option years. Many of the option periods cover more than half of the contract’s potential term. Federal governmental agencies generally have the right not to exercise options to extend a contract. A decision to terminate or not to exercise options to extend our existing contracts could have a material adverse effect on our business, prospects, financial condition and results of operations.
Certain of our Federal Government contracts also contain “organizational conflict of interest” clauses that could limit our ability to compete for certain related follow-on contracts. For example, when we work on the design of a particular solution, we may be precluded from competing for the contract to install that solution. While we actively monitor our contracts to avoid these conflicts, we cannot guarantee that we will be able to avoid all organizational conflict of interest issues.
If we fail to establish and maintain important relationships with government entities and agencies, our ability to successfully bid for new business may be adversely affected.
To develop new business opportunities, we primarily rely on establishing and maintaining relationships with various government entities and agencies. We may be unable to successfully maintain our relationships with government entities and agencies, and any failure to do so could materially adversely affect our ability to compete successfully for new business.
Failure to maintain strong relationships with other government contractors could result in a decline in our revenue.
In our federal business we often act as a subcontractor or in “teaming” arrangements in which we and other contractors bid together on particular contracts or programs. As a subcontractor or team member, we often lack control over fulfillment of a contract, and poor performance on the contract could tarnish our reputation, even when we perform as required. We expect to continue to depend on relationships with other contractors for a portion of our revenue in the foreseeable future. Moreover, our revenue and operating results could be materially adversely affected if any prime contractor or teammate chooses to offer a client services of the type that we provide or if any prime contractor or teammate teams with other companies to independently provide those services.
We cannot guarantee that our contracts will result in actual revenue.
There can be no assurance that our contracts will result in actual revenue in any particular period, or at all, or that any contract will be profitable. The actual receipt and timing of any revenue is subject to
various contingencies, many of which are beyond our control. The actual receipt of revenue on contracts may never occur or may change because a program schedule could change, the program could be canceled, a contract could be reduced, modified or terminated early, or an option that we had assumed would be exercised not being exercised. Further, while many of our federal government contracts require performance over a period of years, Congress often appropriates funds for these contracts for only one year at a time. Consequently, our contracts typically are only partially funded at any point during their term, and all or some of the work intended to be performed under the contracts will remain unfunded pending subsequent Congressional appropriations and the obligation of additional funds to the contract by the procuring agency. Our estimates of contract value are based on our experience under such contracts and similar contracts. However, there can be no assurances that all, or any, of such estimated contract value will be recognized as revenue.
Loss of our GSA contracts or GWACs would impair our ability to attract new business.
We are a prime contractor under several GSA contracts and GWAC schedule contracts. We believe that our ability to continue to provide services under these contracts will continue to be important to our business because of the multiple opportunities for new engagements each contract provides. If we were to lose our position as prime contractor on one or more of these contracts, we could lose substantial revenues and our operating results could suffer. GSA contracts and other GWACs typically have a one or two-year initial term with multiple options exercisable at the government client’s discretion to extend the contract for one or more years. We cannot be assured that our government clients will continue to exercise the options remaining on our current contracts, nor can we be assured that our future clients will exercise options on any contracts we may receive in the future.
If we fail to attract and retain skilled employees or employees with the necessary security clearances, we might not be able to perform under our contracts or win new business.
The growth of our business and revenue depends in large part upon our ability to attract and retain sufficient numbers of highly qualified individuals who have advanced information technology and/or engineering skills. These employees are in great demand and are likely to remain a limited resource in the foreseeable future. Further, obtaining and maintaining security clearances for employees involves a lengthy process, and it is difficult to identify, recruit and retain employees who already hold security clearances. If we are unable to recruit and retain a sufficient number of these employees, our ability to maintain and grow our business could be limited. In a tight labor market, our direct labor costs could increase or we may be required to engage large numbers of subcontractor personnel, which could cause our profit margins to suffer. In addition, some of our contracts contain provisions requiring us to staff an engagement with personnel that the client considers key to our successful performance under the contract. In the event we are unable to provide these key personnel or acceptable substitutions, the client may terminate the contract and we may lose revenue.
In addition, certain federal government contracts require us, and some of our employees, to maintain security clearances. If our employees lose or are unable to obtain security clearances, or if we are unable to hire employees with the appropriate security clearances, the client may terminate the contract or decide not to renew the contract upon its expiration. As a result, we may not derive the revenue anticipated from the contract, which, if not replaced with revenue from other contracts, could seriously harm our operating results.
Our failure to maintain appropriate staffing levels could adversely affect our business.
We can not be certain that we will be able to hire the requisite number of experienced and skilled personnel when necessary in order to service a major contract, particularly if the market for related personnel becomes competitive. Conversely, if we maintain or increase our staffing levels in anticipation of
one or more projects and the projects are delayed, reduced or terminated, we may underutilize the additional personnel, which would increase our general and administrative expenses, reduce our earnings and possibly harm our results of operations. If we are unable to obtain major contracts or effectively complete such contracts due to staffing deficiencies, our revenues may decline and our business may be harmed.
If our subcontractors fail to perform their contractual obligations, our performance and reputation as a prime contractor and our ability to obtain future business could suffer.
As a prime contractor, we often rely significantly upon other companies as subcontractors to perform work we are obligated to perform for our clients. As we secure more work under our GWAC vehicles, we expect to require an increasing level of support from subcontractors that provide complementary and supplementary services to our offerings. Depending on labor market conditions, we may not be able to identify, hire and retain sufficient numbers of qualified employees to perform the task orders we expect to win. In such cases, we will need to rely on subcontracts with unrelated companies. Moreover, even in favorable labor market conditions, we anticipate entering into more subcontracts in the future as we expand our work under our GWACs. We are responsible for the work performed by our subcontractors, even though in some cases we have limited involvement in that work.
If one or more of our subcontractors fail to satisfactorily perform the agreed-upon services on a timely basis or violate federal government contracting policies, laws or regulations, our ability to perform our obligations as a prime contractor or meet our clients’ expectations may be compromised. In extreme cases, performance or other deficiencies on the part of our subcontractors could result in a client terminating our contract for default. A termination for default could expose us to liability, including liability for the agency’s costs of reprocurement, could damage our reputation and could hurt our ability to compete for future contracts.
If we experience systems or service failure, our reputation could be harmed and our clients could assert claims against us for damages or refunds.
We create, implement and maintain IT solutions that are often critical to our clients’ operations. We have experienced, and may in the future experience, some systems and service failures, schedule or delivery delays and other problems in connection with our work. If we experience these problems, we may:
· lose revenue due to adverse client reaction;
· be required to provide additional services to a client at no charge;
· receive negative publicity, which could damage our reputation and adversely affect our ability to attract or retain clients; and
· suffer claims for substantial damages.
In addition to any costs resulting from product or service warranties, contract performance or required corrective action, these failures may result in increased costs or loss of revenue if clients postpone subsequently scheduled work or cancel, or fail to renew, contracts.
While many of our contracts limit our liability for consequential damages that may arise from negligence in rendering services to our clients, we cannot assure you that these contractual provisions will be legally sufficient to protect us if we are sued.
In addition, our errors and omissions and product liability insurance coverage may not continue to be available on reasonable terms or in sufficient amounts to cover one or more large claims, or the insurer may disclaim coverage as to some types of future claims. As we continue to grow and expand our business into new areas, our insurance coverage may not be adequate. The successful assertion of any large claim
against us could seriously harm our business. Even if not successful, these claims could result in significant legal and other costs, may be a distraction to our management and may harm our reputation.
Security breaches in sensitive federal government systems could result in the loss of clients and negative publicity.
Many of the systems we develop, install and maintain involve managing and protecting information involved in intelligence, national security and other sensitive or classified federal government functions. A security breach in one of these systems could cause serious harm to our business, damage our reputation and prevent us from being eligible for further work on sensitive or classified systems for federal government clients. We could incur losses from such a security breach that could exceed the policy limits under our errors and omissions and product liability insurance. Damage to our reputation or limitations on our eligibility for additional work resulting from a security breach in one of the systems we develop, install and maintain could materially reduce our revenue.
Our employees may engage in misconduct or other improper activities, which could cause us to lose contracts.
We are exposed to the risk that employee fraud or other misconduct could occur. Misconduct by employees could include intentional failures to comply with federal government procurement regulations, engaging in unauthorized activities or falsifying time records. Employee misconduct could also involve the improper use of our clients’ sensitive or classified information, which could result in regulatory sanctions against us and serious harm to our reputation and could result in a loss of contracts and a reduction in revenues. It is not always possible to deter employee misconduct, and the precautions we take to prevent and detect this activity may not be effective in controlling unknown or unmanaged risks or losses, which could cause us to lose contracts or cause a reduction in revenues.
We may not be successful in identifying acquisition candidates and if we undertake acquisitions, they could increase our costs or liabilities and impair our revenue and operating results.
One of our strategies is to pursue growth through acquisitions. We may not be able to identify suitable acquisition candidates at prices that we consider appropriate. If we do identify an appropriate acquisition candidate, we may not be able to successfully negotiate the terms of the acquisition or finance the acquisition on terms that are satisfactory to us. Negotiations of potential acquisitions and the integration of acquired business operations could disrupt our business by diverting management attention from day-to-day operations. Acquisitions of businesses or other material operations may require additional debt or equity financing, resulting in additional leverage or dilution of ownership. We may encounter increased competition for acquisitions, which may increase the price of our acquisitions.
We have completed several acquisitions of complementary businesses in recent years, and we continually evaluate opportunities to acquire new businesses as part of our ongoing strategy. On October 2, 2006, we acquired MRC as an expansion of our Government Network Services segment, and we cannot assure you that we will obtain the anticipated benefits of this acquisition. Further, our integration of historic and future acquisitions, including MRC, will require significant management time and financial resources because we will need to integrate dispersed operations with distinct corporate cultures. We also may continue to expand our operations through business acquisitions over time. Our failure to properly integrate businesses we acquire and to manage future acquisitions successfully could seriously harm our operating results. In addition, acquired companies may not perform as well as we expect, and we may fail to realize anticipated benefits. We may issue common stock that would dilute our current stockholders’ ownership and incur debt and other costs in connection with future acquisitions which may cause our quarterly operating results to vary significantly.
If we are unable to successfully integrate companies we may acquire in the future, our revenue and operating results could suffer. The integration of such businesses into our operations may result in
unforeseen operating difficulties (including incompatible accounting and information management systems), may absorb significant management attention and may require significant financial resources that would otherwise be available for the ongoing development or expansion of our business. These difficulties of integration may require us to coordinate geographically dispersed organizations, integrate personnel with disparate business backgrounds and reconcile different corporate cultures. In certain acquisitions, federal acquisition regulations may require us to enter into government novation agreements, a potentially time-consuming process. In addition, we may not be successful in achieving the anticipated synergies from these acquisitions, including our strategy of offering our services to clients of acquired companies to increase our revenue. We may experience increased attrition, including, but not limited to, key employees of the acquired companies, during and following the integration of acquired companies that could reduce our future revenue.
In addition, we may need to record write-downs from future impairments of identified intangible assets and goodwill, which could reduce our future reported earnings. Acquired companies may have liabilities or adverse operating issues that we fail to discover through due diligence prior to the acquisition. In particular, to the extent that prior owners of any acquired businesses or properties failed to comply with or otherwise violated applicable laws or regulations, or failed to fulfill their contractual obligations to the federal government or other clients, we, as the successor owner, may be financially responsible for these violations and failures and may suffer reputational harm or otherwise be adversely affected. The discovery of any material liabilities associated with our acquisitions could cause us to incur additional expenses and cause a reduction in our operating profits.
Additionally, the Small Business Administration (SBA) is enacting new regulations which will require small businesses to recertify their size standard within thirty days of any sale or merger. It is highly likely that any company we may look to acquire will have some component of small business contracts. These new regulations may impact our ability to retain all of the contracts after the acquisition.
The loss of any member of our senior management could impair our relationships with federal government clients and disrupt the management of our business.
We believe that the success of our business and our ability to operate profitably depends on the continued contributions of the members of our senior management. We rely on our senior management to generate business and execute programs successfully. In addition, the relationships and reputation that many members of our senior management team have established and maintain with federal government personnel contribute to our ability to maintain strong client relationships and to identify new business opportunities. We do not have any employment agreements providing for a specific term of employment with any member of our senior management. The loss of any member of our senior management could impair our ability to identify and secure new contracts, to maintain good client relations and to otherwise manage our business.
If we are unable to manage our growth, our business could be adversely affected.
Sustaining our growth has placed significant demands on our management, as well as on our administrative, operational and financial resources. For us to continue to manage our growth, we must continue to improve our operational, financial and management information systems and expand, motivate and manage our workforce. If we are unable to manage our growth while maintaining our quality of service and profit margins, or if new systems that we implement to assist in managing our growth do not produce the expected benefits, our business, prospects, financial condition or operating results could be adversely affected.
29
Our margins and operating results may suffer if we experience unfavorable changes in the proportion of cost-plus-fee or fixed-price contracts in our total contract mix.
Although fixed-price contracts entail a greater risk of a reduced profit or financial loss on a contract compared to other types of contracts we enter into, fixed-price contracts typically provide higher profit opportunities because we receive the benefit of cost savings. In contrast, cost-plus-fee contracts are subject to statutory limits on profit margins, and generally are the least profitable of our contract types. Our federal government customers typically determine what type of contract we enter into. Cost-plus-fee and fixed-price contracts in our federal business accounted for approximately 31% and 37%, respectively, of our federal business revenues for the fiscal year ended December 31, 2006. To the extent that we enter into more cost-plus-fee or less fixed-price contracts in proportion to our total contract mix in the future, our margins and operating results may suffer.
Our cash flow and profitability could be reduced if expenditures are incurred prior to the final receipt of a contract.
We provide various professional services and sometimes procure equipment and materials on behalf of our federal government customers under various contractual arrangements. From time to time, in order to ensure that we satisfy our customers’ delivery requirements and schedules, we may elect to initiate procurement in advance of receiving final authorization from the government customer or a prime contractor. If our government or prime contractor customers’ requirements should change or if the government or the prime contractor should direct the anticipated procurement to a contractor other than us or if the equipment or materials become obsolete or require modification before we are under contract for the procurement, our investment in the equipment or materials might be at risk if we cannot efficiently resell them. This could reduce anticipated earnings or result in a loss, negatively affecting our cash flow and profitability.
We may be harmed by intellectual property infringement claims and our failure to protect our intellectual property could enable competitors to market products and services with similar features.
We may become subject to claims from our employees or third parties who assert that software and other forms of intellectual property that we use in delivering services and solutions to our clients infringe upon intellectual property rights of such employees or third parties. Our employees develop some of the software and other forms of intellectual property that we use to provide our services and solutions to our clients, but we also license technology from other vendors. If our employees, vendors, or other third parties assert claims that we or our clients are infringing on their intellectual property rights, we could incur substantial costs to defend those claims. In addition, if any of these infringement claims are ultimately successful, we could be required to: cease selling or using products or services that incorporate the challenged software or technology; obtain a license or additional licenses from our employees, vendors, or other third parties; or redesign our products and services that rely on the challenged software or technology.
In addition, if we are unable to protect our intellectual property, our competitors could market services or products similar to our services and products, which could reduce demand for our offerings.
We may be unable to prevent unauthorized parties from attempting to copy or otherwise obtain and use our technology. Policing unauthorized use of our technology is difficult, and we may not be able to prevent misappropriation of our technology, particularly in foreign countries where the laws may not protect our intellectual property as fully as those in the United States. Others, including our employees, may circumvent the trade secrets and other intellectual property that we own. Litigation may be necessary to enforce our intellectual property rights, to protect our trade secrets and to determine the validity and
scope of the proprietary rights of others. Any litigation could result in substantial costs and diversion of resources, with no assurance of success.
A preference for minority-owned, small and small disadvantaged businesses could impact our ability to be a prime contractor on certain governmental procurements.
As a result of the SBA set-aside program, the federal government may decide to restrict certain procurements only to bidders that qualify as minority-owned, small or small disadvantaged businesses. As a result, we would not be eligible to perform as a prime contractor on those programs and would be restricted to a maximum of 49% of the work as a subcontractor on those programs. An increase in the amount of procurements under the SBA set-aside program may impact our ability to bid on new procurements as a prime contractor or restrict our ability to recompete on incumbent work that is placed in the set-aside program.
We derive a significant portion of our revenues from a limited number of customers.
We have derived, and believe that we will continue to derive, a significant portion of our revenues from a limited number of customers. To the extent that any significant customer uses less of our services or terminates its relationship with us, our revenues could decline significantly. As a result, the loss of any significant client could seriously harm our business. For the fiscal year ended December 31, 2006, in our federal business two customers comprised approximately 55% of our federal business revenues, and our five largest customers accounted for approximately 80% of our total federal business revenues. None of our customers are obligated to purchase additional services from us. As a result, the volume of work that we perform for a specific customer is likely to vary from period to period, and a significant client in one period may not use our services in a subsequent period.
If our customers do not receive sufficient financing or fail to pay us for services performed, our business may be harmed.
A few of our customers in our non-federal business rely upon outside financing to pay the costs of the services we provide. These customers may fail to obtain adequate financing or experience delays in receiving financing and they may choose the services of our competitors if our competitors are willing and able to provide project financing. In addition, we have historically taken significant write-offs of our accounts receivable. While the vast majority of our customers today are large federal customers and large enterprises, it is possible that in some instances we may not receive payment for services we have already performed. If our customers do not receive adequate financing or if we are required to write off significant amounts of our accounts receivables, then our net income will decline, and our business will be harmed.
Our business is dependent upon our ability to keep pace with the latest technological changes.
The market for our services is characterized by rapid change and technological improvements. Failure to respond in a timely and cost effective way to these technological developments will result in serious harm to our business and operating results. We have derived, and we expect to continue to derive, a substantial portion of our revenues from providing innovative engineering services and technical solutions that are based upon today’s leading technologies and that are capable of adapting to future technologies. As a result, our success will depend, in part, on our ability to develop and market service offerings that respond in a timely manner to the technological advances of our customers, evolving industry standards and changing client preferences.
Failure to properly manage projects may result in costs or claims.
Our engagements often involve large scale, highly complex projects. The quality of our performance on such projects depends in large part upon our ability to manage the relationship with our customers, and to effectively manage the project and deploy appropriate resources, including third-party contractors, and our own personnel, in a timely manner. Any defects or errors or failure to meet clients’ expectations could result in claims for substantial damages against us. Our contracts generally limit our liability for damages that arise from negligent acts, error, mistakes or omissions in rendering services to our clients. However, we cannot be sure that these contractual provisions will protect us from liability for damages in the event we are sued. In addition, in certain instances, we guarantee customers that we will complete a project by a scheduled date. If the project experiences a performance problem, we may not be able to recover the additional costs we will incur, which could exceed revenues realized from a project. Finally, if we underestimate the resources or time we need to complete a project with capped or fixed fees, our operating results could be seriously harmed.
If we fail to maintain an effective system of internal controls, we may not be able to accurately report our financial results or prevent fraud.
As previously disclosed in the Explanatory Note preceding Part I and in Note 2 of our consolidated financial statements of this Form 10-K, in 2006 the Company commenced an internal review of the Company’s past practices for granting and pricing stock options and other equity awards. The findings of this review and a separate review of historical stock option practices and related matters performed by a Special Committee of our Board, required restatement of the Company’s previously issued financial statements for periods from 1998 through the Company’s last filing of interim financial statements for the period ended September 30, 2006. Due to the duration of the stock option review that precluded the Company from filing its financial information with the SEC in a timely manner, and after discussion with our external auditors regarding varying accounting positions resulting in the recording in 2001 of a material adjustment related to the cancellation of stock options, we determined that a material weakness in our internal controls and procedures (see Item 9A, “Controls and Procedures”) exists as of December 31, 2006. In addition, as of December 31, 2006 after consultation with our external auditors, we recorded a material adjustment to reduce the valuation of deferred tax assets to reflect the risks and uncertainties related to our future ability to realize and utilize our deferred tax assets. A “material weakness”, by itself or in combination with other control deficiencies, results in a more than remote likelihood that a material misstatement in our financial statements will not be prevented or detected by our employees in the normal course of performing their assigned functions.
In addition, from time to time we acquire businesses which could have limited infrastructure and systems of internal controls. Performing assessments of internal controls, implementing necessary changes, and maintaining an effective internal controls process is costly and requires considerable management attention, particularly in the case of newly acquired entities. Internal control systems are designed in part upon assumptions about the likelihood of future events, and all such systems, however well designed and operated, can provide only reasonable, and not absolute, assurance that the objectives of the system are met.
Because of these and other inherent limitations of control systems, there can be no assurance that any design will succeed in achieving its stated goals under all potential future conditions. We also cannot assure you that we will implement and maintain adequate controls over our financial processes and reporting in the future or that additional material weaknesses or significant deficiencies in our internal controls will not be discovered in the future. Any failure to remediate any future material weaknesses or implement required new or improved controls, or difficulties encountered in their implementation, could harm our operating results, cause us to fail to meet our reporting obligations or result in material misstatements in our financial statements or other public disclosures. Inferior internal controls could also cause investors to
lose confidence in our reported financial information, which could have a negative effect on the trading price of our stock.
We may need additional capital in the future to fund the growth of our business, and financing may not be available.
We currently anticipate that our available capital resources, including our line of credit, and operating cash flows will be sufficient to meet our expected working capital and capital expenditure requirements for at least the next 12 months. However, we cannot assure you that such resources will be sufficient to fund the long-term growth of our business. In particular, we may experience a negative operating cash flow due to billing milestones and project timelines in certain of our contracts.
We may raise additional funds through public or private debt or equity financings if such financings become available on favorable terms or we may expand the senior credit facility we entered into on October 2, 2006 to fund future acquisitions and for general corporate purposes. However, we have not been in compliance with the terms of that credit facility as a result of our failure to timely file our annual and quarterly financial statements, and we can provide no assurance that the lender would agree to extend additional or continuing credit under that facility. We believe that, with the filing of this Report and our Quarterly Reports on Form 10-Q for the periods ended March 31, 2007 and June 30, 2007, we are no longer in default under this facility.
Any new financing or offerings would likely dilute our stockholders’ equity ownership. In addition, we cannot assure you that any additional financing we may need will be available on terms favorable to us, or at all. If adequate funds are not available or are not available on acceptable terms, we may not be able to take advantage of unanticipated opportunities, develop new products or otherwise respond to competitive pressures. In any such case, our business, operating results or financial condition could be materially adversely affected.
Litigation may harm our business or otherwise distract our management.
Substantial, complex or extended litigation could cause us to incur large expenditures and distract our management. For example, lawsuits by employees, stockholders or customers could be very costly and substantially disrupt our business. Disputes from time to time with such companies or individuals are not uncommon, and we cannot assure you that that we will always be able to resolve such disputes on terms favorable to us.
In addition, we and certain of our current and former officers and directors have been named defendants in class action and derivative lawsuits. While we believe that allegations lack merit and we intend to vigorously defend all claims asserted, we are unable to estimate what our liability in these matters may be. We may be required to pay judgments or settlements and incur expenses in connection with such matters in aggregate amounts that could have a material adverse effect on our business financial condition, results of operations and cash flows.
Disclosure of trade secrets could aid our competitors.
We attempt to protect our trade secrets by entering into confidentiality and intellectual property assignment agreements with third parties, our employees and consultants. However, these agreements can be breached and, if they are, there may not be an adequate remedy available to us. In addition, others may independently discover our trade secrets and proprietary information and in such cases we could not assert any trade secret rights against such party. Enforcing a claim that a party illegally obtained and is using our trade secret is difficult, expensive and time consuming, and the outcome is unpredictable. If our trade secrets become known we may lose our competitive position.
Our stock price may be volatile, which may result in lawsuits against us and our officers and directors.
The stock market in general and the stock prices of government services companies in particular, have experienced volatility that has often been unrelated to or disproportionate to the operating performance of those companies. The market price of our common stock has fluctuated in the past and is likely to fluctuate in the future. Factors which could have a significant impact on the market price of our common stock include, but are not limited to, the following:
· quarterly variations in operating results;
· announcements of new services by us or our competitors;
· the gain or loss of significant customers;
· changes in analysts’ earnings estimates;
· rumors or dissemination of false information;
· pricing pressures;
· short selling of our common stock;
· impact of litigation;
· general conditions in the market;
· political and/or military events associated with current worldwide conflicts; and
· events affecting other companies that investors deem comparable to us.
Companies that have experienced volatility in the market price of their stock have frequently been the object of securities class action litigation. We and certain of our current and former officers and directors have been named defendants in class action and derivative lawsuits. These matters and any other securities class action litigation, in which we may be involved, could result in substantial costs to us and a diversion of our management’s attention and resources, which could materially harm our financial condition and results of operations.
Our charter documents and Delaware law may deter potential acquirers and may depress our stock price.
Certain provisions of our charter documents and Delaware law, as well as certain agreements we have with our executives, could make it substantially more difficult for a third party to acquire control of us. These provisions include:
· authorizing the board of directors to issue preferred stock;
· prohibiting cumulative voting in the election of directors;
· prohibiting stockholder action by written consent;
· establishing advance notice requirements for nominations for election to our board of directors or for proposing matters that can be acted on by stockholders at meetings of our stockholders;
· Section 203 of the Delaware General Corporation Law, which prohibits us from engaging in a business combination with an interested stockholder unless specific conditions are met; and
· a number of our executives have agreements with us that entitle them to payments in certain circumstances following a change in control.
In addition, on December 16, 2004, we adopted a stockholder rights plan (“Rights Plan”). Pursuant to the Rights Plan, our Board declared a dividend distribution of one preferred share purchase right
(“Right”) on each outstanding share of our common stock. Each Right will entitle stockholders to buy one one-hundredth of a share of newly created Series C Preferred Stock at an exercise price of $54, subject to adjustment, in the event that the Rights become exercisable. Subject to limited exceptions, the Rights will become exercisable if a person or group acquires 15% or more of our common stock or announces a tender offer for 15% or more of the common stock. If we are acquired in a merger or other business combination transaction which has not been approved by our Board, each Right will entitle its holder to purchase, at the Rights then-current exercise price, a number of the acquiring company’s common shares having a market value at the time of twice the Rights exercise price. These provisions may discourage certain types of transactions involving an actual or potential change in control and may limit our stockholders’ ability to approve transactions that they deem to be in their best interests. As a result, these provisions may depress our stock price.
The non-federal business arena in which we operate has relatively low barriers to entry and increased competition could result in margin erosion, which would make profitability even more difficult to sustain.
Other than the technical skills required in our non-federal business, the barriers to entry in our non-federal business are relatively low. We do not have any intellectual property rights in this segment of our business to protect our methods and business start-up costs do not pose a significant barrier to entry. The success of our non-federal business is dependent on our employees, customer relations and the successful performance of our services. If we face increased competition as a result of new entrants in our markets, we could experience reduced operating margins and loss of market share and brand recognition.
If our non-federal customers do not invest in security systems and other new in-building technologies such as wireless local area networks and/or IP-based networks, our business will suffer.
We intend to devote significant resources to developing our enterprise-based WLAN (Wireless Local Area Networks), but we cannot predict that we will achieve widespread market acceptance amongst the enterprises we identify as potential customers. It is possible that some enterprises will determine that capital constraints and other factors outweigh their need for WLAN systems. As a result, we may be affected by a significant delay in the adoption of WLAN by enterprises, which would harm our business.
We may incur goodwill impairment charges in our reporting entities which could harm our profitability.
In accordance with Statement of Financial Accounting Standards, or SFAS, No. 142, “Goodwill and Other Intangible Assets,” we periodically review the carrying values of our goodwill to determine whether such carrying values exceed the fair market value. Our acquired companies are subject to annual review for goodwill impairment. If impairment testing indicates that the carrying value of a reporting unit exceeds its fair value, the goodwill of the reporting unit is deemed impaired. Accordingly, an impairment charge would be recognized for that reporting unit in the period identified, which could reduce our profitability.
Risks Related to Our Industry
Our revenue and operating profits could be adversely affected by significant changes in the contracting or fiscal policies of the federal government.
We depend on continued federal government expenditures on intelligence, defense and other programs that we support. Accordingly, changes in federal government contracting policies could directly affect our financial performance. In addition, a change in presidential administrations, congressional majorities or in other senior federal government officials may negatively affect the rate at which the federal government purchases IT services. The overall U.S. defense budget declined from time-to-time in the late 1980s and the early 1990s. While spending authorizations for intelligence and defense-related programs by the federal government have increased in recent years, future levels of expenditures and authorizations for
those programs may decrease, remain constant or shift to programs in areas where we do not currently provide services. Among the factors that could materially adversely affect us are:
· budgetary constraints affecting federal government spending generally, or specific departments or agencies in particular, and changes in fiscal policies or available funding;
· changes in federal government programs or requirements, including the increased use of small business providers;
· curtailment of the federal government’s use of professional services providers;
· the adoption of new laws or regulations;
· federal governmental shutdowns (such as that which occurred during the federal government’s 1996 fiscal year) and other potential delays in the government appropriations process;
· delays in the payment of our invoices by federal government payment offices due to problems with, or upgrades to, federal government information systems, or for other reasons;
· competition and consolidation in the IT industry;
· general economic conditions; and
· a reduction in spending or shift of expenditures from existing programs, and a failure of Congress to pass adequate supplemental appropriations to pay for an international conflict or related reconstruction efforts;
These or other factors could cause federal governmental agencies, or prime contractors for which we are acting as a subcontractor, to reduce their purchases under contracts, to exercise their right to terminate contracts or not to exercise options to renew contracts, any of which could cause our revenue and operating profits to decline.
Many of our federal government clients spend their procurement budgets through multiple award contracts under which we are required to compete for post-award orders or for which we may not be eligible to compete and could limit our ability to win new contracts and grow revenue.
Budgetary pressures and reforms in the procurement process have caused many federal government clients to increasingly purchase goods and services through ID/IQ contracts, the GSA Schedule 70 Contracts and other multiple award and/or GWAC vehicles. These contract vehicles have resulted in increased competition and pricing pressure, requiring us to make sustained post-award efforts to realize revenue under the relevant contract vehicle. The federal government’s ability to select multiple winners under multiple award schedule contracts, GWACs, blanket purchase agreements and other ID/IQ contracts, as well as its right to award subsequent task orders among such multiple winners, means that there is no assurance that these multiple award contracts will result in the actual orders equal to the ceiling value, or result in any actual orders. We are only eligible to compete for work (task orders and delivery orders) as a prime contractor pursuant to GWACs already awarded to us. Our failure to compete effectively in this procurement environment could reduce our revenue. If the federal government elects to use a contract vehicle that we do not hold we will not be able to compete as a prime contractor.
36
Our failure to comply with complex procurement laws and regulations could cause us to lose business and subject us to a variety of penalties.
We must comply with and are affected by laws and regulations relating to the formation, administration and performance of federal government contracts, which affect how we do business with our clients and may impose added costs on us. Among the most significant laws and regulations are:
· the Federal Acquisition Regulations, and agency regulations supplemental to the Federal Acquisition Regulations, which comprehensively regulate the formation, administration and performance of federal government contracts;
· the Truth in Negotiations Act, which requires certification and disclosure of all cost and pricing data in connection with contract negotiations;
· the Cost Accounting Standards and Cost Principles, which impose accounting requirements that govern our right to reimbursement under certain cost-based federal government contracts; and
· laws, regulations and executive orders restricting the use and dissemination of information classified for national security purposes and the export of certain products and technical data.
Moreover, we are subject to industrial security regulations of the DoD and other federal agencies that are designed to safeguard against foreigners’ access to classified information. If we were to come under foreign ownership, control or influence, our federal government clients could terminate or decide not to renew our contracts, and our ability to obtain new contracts could be impaired.
The federal government may revise its procurement or other practices in a manner adverse to us.
The federal government may revise its procurement practices or adopt new contracting rules and regulations, such as cost accounting standards. It could also adopt new contracting methods relating to GSA contracts, GWACs or other government-wide contracts, or adopt new standards for contract awards intended to achieve certain social or other policy objectives, such as establishing new set-aside programs for small or minority-owned businesses. In addition, the federal government may face restrictions from new legislation or regulations, as well as pressure from government employees and their unions, on the nature and amount of services the federal government may obtain from private contractors. These changes could impair our ability to obtain new contracts or contracts under which we currently perform when those contracts are put up for recompetition bids. Any new contracting methods could be costly or administratively difficult for us to implement, and, as a result, could harm our operating results.
We derive significant revenue from contracts awarded through a competitive procurement process, which may require significant upfront bid and proposal costs that could negatively affect our operating results.
We derive significant revenue from federal government contracts that are awarded through a competitive procurement process. We expect that most of the federal government business we seek in the foreseeable future will be awarded through competitive processes. Competitive procurements impose substantial costs and present a number of risks, including:
· the substantial cost and managerial time and effort that we spend to prepare bids and proposals for contracts that may not be awarded to us and could reduce our profitability; and
· the expense and delay that we may face if our competitors protest or challenge contract awards made to us pursuant to competitive procedures, and the risk that any such protest or challenge could result in the resubmission of offers, or in termination, reduction or modification of the awarded contract, which could result in increased cost and reduced profitability.
In addition, most federal government contract awards are subject to protest by competitors. If specified legal requirements are satisfied, these protests require the federal government agency to suspend the contractor’s performance of the newly awarded contract pending the outcome of the protest. These protests could also result in a requirement to resubmit bids for the contract or in the termination, reduction or modification of the awarded contract.
Unfavorable federal government audit results could subject us to a variety of penalties and sanctions, and could harm our reputation and relationships with our clients and impair our ability to win new contracts.
The federal government, including the Defense Contract Audit Agency (DCAA), audits and reviews our performance on contracts, pricing practices, cost structure and compliance with applicable laws, regulations and standards. The DCAA reviews a contractor’s internal control systems and policies, including the contractor’s purchasing, property, estimating, compensation and management information systems, and the contractor’s compliance with such policies. Any costs found to be improperly allocated to a specific contract will not be reimbursed, while such costs already reimbursed must be refunded. Adverse findings in a DCAA audit could materially affect our competitive position and result in a substantial adjustment to our revenue and profit.
If a federal government auditinvestigation uncovers improper or illegal activities, including any potential improper or illegal activities related to the Company's stock option review or related matters we may be subject to civil and criminal penalties and administrative sanctions, including termination of contracts, forfeiture of profits, suspension of payments, fines and suspension or debarment from doing business with federal government agencies. In addition, we could suffer serious harm to our reputation and competitive position if allegations of impropriety were made against us, whether or not true. If our reputation or relationship with federal government agencies were impaired, or if the federal government otherwise ceased doing business with us or significantly decreased the amount of business it does with us, our revenue and operating profit would decline.
ChangesIf we fail to maintain an effective system of internal controls, we may not be able to accurately report our financial results or prevent fraud.
Effective internal controls are necessary for us to provide reliable financial reports. If we cannot provide reliable financial reports, our operating results could be misstated, our reputation may be harmed and the trading price of our stock could be negatively affected. Our management has concluded that there are no material weaknesses in interest rates could adversely affect the profitability of the Company.
Our outstanding borrowings on our Credit Facility of $51.0 millioninternal controls over financial reporting as of December 31, 2006 are subject to changes in short-term interest rates. If interest rates increase in the future,2007. However, there can be no assurance that our controls over financial processes and reporting will be effective in the future or that additional material weaknesses or significant deficiencies in our internal controls will not be discovered in the future. Any failure to remediate any future material weaknesses or implement required new or improved controls, or difficulties encountered in their implementation, could harm our operating results, cause us to fail to meet our reporting obligations or result in material misstatements in our financial statements or other public disclosures. Inferior internal controls could also cause investors to lose confidence in our reported financial information, which could have a negative effect on the trading price of our stock. In addition, from time to time we acquire businesses which could have limited infrastructure and systems of internal controls. Performing assessments of internal controls, implementing necessary changes, and maintaining an effective internal controls process is costly and requires considerable management attention, particularly in the case of newly acquired entities.
We may need additional capital in the future to fund the growth of our business, and financing may not be available.
We currently anticipate that our available capital resources, including our credit facility and operating cash flows, will be sufficient to meet our expected working capital and capital expenditure requirements for at least the next 12 months. However, such resources may not be sufficient to fund the long-term growth of our business or the expenses associated with the ongoing litigation, litigation settlements and government inquiries. In particular, we may experience a negative operating cash flow due to billing milestones and project timelines in certain of our contracts.
We may raise additional funds through public or private debt or equity financings if such financings become available on favorable terms or we may expand our credit facility to fund future acquisitions and for general corporate purposes. However, due to the current challenges in the lending markets, we can provide no assurance that the lender would agree to extend additional or continuing credit under that facility. We could fall out of compliance with financial and other covenants contained in our credit facility which, if not waived, would restrict our access to capital and could require us to pay down our existing debt under the credit facility. Any new financing or offerings would likely dilute our stockholders' equity ownership. In addition, additional financing may not be available on terms favorable to us, or at all. If adequate funds are not available or are not available on acceptable terms, we may not be able to take advantage of unanticipated opportunities, develop new products or otherwise respond to competitive pressures. In any such case, our business, operating results or financial condition could be materially adversely affected.
Our ability to make payments on our debt will be contingent on our future operating performance, which will depend on a number of factors that are outside of our control.
Our debt service obligations are estimated to be approximately $11 million to $13 million in 2008, including approximately $2.6 million of principal repayments. This debt service may have an adverse impact on our earnings and cash flow, which could in turn negatively impact our stock price.
Our ability to make principal and interest payments on our debt is contingent on our future operating performance, which will depend on a number of factors, many of which are outside of our
control. The degree to which we are leveraged could have other important negative consequences, including the following:
- •
- we must dedicate a substantial portion of our cash flows from operations to the payment of our indebtedness, reducing the funds available for future working capital requirements, capital expenditures, acquisitions or other general corporate requirements;
- •
- a significant portion of our borrowings are, and will continue to be, at variable rates of interest, which may result in higher interest expense in the event of increases in interest
expense will notrates;
- •
- we may be more vulnerable to a downturn in the industries in which we operate or a downturn in the economy in general;
- •
- we may be limited in our flexibility to plan for, or react to, changes in our businesses and the industries in which we operate;
- •
- we may be placed at a competitive disadvantage compared to our competitors that have less debt;
- •
- we may determine it to be necessary to dispose of certain assets or one or more of our businesses to reduce our
overalldebt; and
- •
- our ability to borrow additional funds in excess of our current financing may be limited.
We may not generate sufficient cash flow from operations and future borrowings may not be available in amounts sufficient to enable us to pay our indebtedness or to fund our other liquidity needs. Moreover, we may need to refinance all or a portion of our indebtedness on or before maturity. In such a case, we cannot make assurances that we will be able to refinance any of our indebtedness on commercially reasonable terms or at all. If we are unable to make scheduled debt payments or comply with the other provisions of our debt instruments, our various lenders may be permitted under certain circumstances to accelerate the maturity of the indebtedness owed to them and exercise other remedies provided for in those instruments and under applicable law.
We are subject to restrictive debt covenants pursuant to our indebtedness. These covenants may restrict our ability to finance our business and, if we do not comply with the covenants or otherwise default under them, we may not have the funds necessary to pay all amounts that could become due and the lenders could foreclose on substantially all of our assets.
Our indebtedness contains covenants that, among other things, significantly restricts and, in some cases, effectively eliminates our ability and the ability of our subsidiaries to:
- •
- incur additional debt;
- •
- create or incur liens;
- •
- secure performance bonds by letters of credit, thereby limiting the amount of work we may bid on or perform;
- •
- pay dividends or make other equity distributions to our stockholders;
- •
- make investments;
- •
- sell assets;
- •
- issue or become liable on a guarantee;
- •
- create or acquire new subsidiaries;
- •
- effect a merger or consolidation of, or sell all or substantially all of our assets; and
- •
- raise capital via equity securities.
In addition, we must comply with certain financial covenants. In the event we failed to meet any of such covenants and were unable to cure such breach or otherwise renegotiate such covenants, our lenders would have significant rights to deny future access to liquidity and/or seize control of substantially all of our assets. The material financial covenants with which we must comply include a maximum first lien leverage ratio, a maximum total leverage ratio, a minimum liquidity ratio, a minimum fixed charge coverage ratio, and a minimum consolidated EBITDA.
The covenants contained in our indebtedness and any credit agreement governing future debt may significantly restrict our future operations. Furthermore, upon the occurrence of any event of default, our lenders could elect to declare all amounts outstanding under such agreements, together with accrued interest, to be immediately due and payable. If those lenders were to accelerate the payment of those amounts, our assets may not be sufficient to repay those amounts in full.
We are also subject to interest rate risk due to our indebtedness at variable interest rates, based on a base rate or LIBOR plus an applicable margin. Shifts in interest rates could have a material adverse effect on us.
We may be required to prepay our indebtedness prior to its stated maturity, which may limit our ability to pursue business opportunities.
Pursuant to the terms of certain of our indebtedness, in certain instances we are required to prepay outstanding indebtedness prior to its stated maturity date. Specifically, certain non-recurring cash inflows such as proceeds from asset sales, insurance recoveries, and equity offerings may have to be used to pay down indebtedness and may not be reborrowed. These prepayment provisions may limit our ability to utilize this cash flow to pursue business opportunities.
Our stock price may be volatile, which may result in lawsuits against us and our officers and directors.
The stock market in general and the stock prices of government services companies in particular, have experienced volatility that has often been unrelated to or disproportionate to the operating performance of those companies. The market price of our common stock has fluctuated in the past and is likely to fluctuate in the future. Factors which could have a significant impact on the market price of our common stock include, but are not limited to, the following:
- •
- quarterly variations in operating results;
- •
- announcements of new services by us or our competitors;
- •
- the gain or loss of significant customers;
- •
- changes in analysts' earnings estimates;
- •
- rumors or dissemination of false information;
- •
- pricing pressures;
- •
- short selling of our common stock;
- •
- impact of litigation and ongoing government inquiries;
- •
- general conditions in the market;
- •
- political and/or military events associated with current worldwide conflicts; and
- •
- events affecting other companies that investors deem comparable to us.
Companies that have experienced volatility in the market price of their stock have frequently been the object of securities class action litigation. We and certain of our current and former officers and directors have been named defendants in class action and derivative lawsuits. These matters and any other securities class action litigation and derivative lawsuits in which we may be involved could result
in substantial costs to us and a diversion of our management's attention and resources, which could materially harm our financial condition and results of operations.
Our charter documents and Delaware law may deter potential acquirers and may depress our stock price.
Certain provisions of our charter documents and Delaware law, as well as certain agreements we have with our executives, could make it substantially more difficult for a third party to acquire control of us. These provisions include:
- •
- authorizing the board of directors to issue preferred stock;
- •
- prohibiting cumulative voting in the election of directors;
- •
- prohibiting stockholder action by written consent;
- •
- establishing advance notice requirements for nominations for election to our board of directors or for proposing matters that can be acted on by stockholders at meetings of our stockholders;
- •
- Section 203 of the Delaware General Corporation Law, which prohibits us from engaging in a business combination with an interested stockholder unless specific conditions are met; and
- •
- a number of our executives have agreements with us that entitle them to payments in certain circumstances following a change in control.
We have a stockholder rights plan which may discourage certain types of transactions involving an actual or potential change in control and may limit our stockholders' ability to approve transactions that they deem to be in their best interests. As a result, these provisions may depress our stock price.
We may incur goodwill impairment charges in our reporting entities which could harm our profitability.
A significant portion of our net assets come from goodwill and other intangible assets. In accordance with Statement of Financial Accounting Standards, or SFAS, No. 142, "Goodwill and Other Intangible Assets," we periodically review the carrying values of our goodwill to determine whether such carrying values exceed the fair market value. Our acquired companies are subject to annual review for goodwill impairment. If impairment testing indicates that the carrying value of a reporting unit exceeds its fair value, the goodwill of the reporting unit is deemed impaired. Accordingly, an impairment charge would be recognized for that reporting unit in the period identified, which could reduce our profitability.
Item 1B.Unresolved Staff Comments
None.
Item 2.Properties
Our principal executive offices for all business segments are located in approximately 93,000 square feet of office space in San Diego, California. The lease for such space expires in April 2010. Other corporate resource offices are located in the following locations: Washington, D.C.; Marietta, Georgia; Newport, Delaware; Houston, Texas; Huntsville, Alabama, Reston, Virginia, Haryana, IndiaAlabama; Alexandria, Virginia; and Beijing, China. The CompanyIndianapolis, Indiana. We also leaseslease office space to provide local support engineering and design and deployment services to our customers in various regions throughout the United States. The leases on these spaces expire at various times through February 2015. We have leases on spaces related to discontinued operations in Sao Paulo, Brazil; Stockholm, Sweden; and London, U.K. that have been assigned to the buyers of the businesses or terminated with immaterial penalties.August 2016. We continually evaluate our current and future space capacity in relation to current and projected future staffing levels. We believe that our existing facilities are suitable and adequate to meet our current business requirements.
Item 3.Legal Proceedings
Contingencies
IPO Securities Litigation
Beginning in June 2001, WFIthe Company and certain of its officers and directors were named as defendants in several parallel class action shareholder complaints filed in the United States District Court for the Southern District of New York, now consolidated under the caption,In re Wireless Facilities, Inc. Initial Public Offering Securities Litigation, Case No. 01-CV-4779. In the amended complaint, the plaintiffs allege that WFI,the Company, certain of its officers and directors, and the underwriters of WFI’s IPOthe Company's initial public offering ("IPO") violated section 11 of the Securities Act of 1933 and section 10(b) of the Securities Exchange Act of 1934 based on allegations that WFI’sthe Company's registration statement and prospectus failed to disclose material facts regarding the compensation to be received by, and the stock allocation practices of, the IPO underwriters. The plaintiffs seek unspecified monetary damages and other relief. Similar complaints were filed in the same court against hundreds of other public companies (“Issuers”("Issuers") that conducted IPOs of their common stock in the late 1990s and 2000 (the “IPO Cases”"IPO Cases").
In June 2004, the Issuers (including WFI)the Company) executed a settlement agreement with the plaintiffs that would, among other things, result in the dismissal with prejudice of all claims against the Issuers and their officers and directors and the assignment of certain potential Issuer claims to the plaintiffs. On February 15, 2005, the court issued a decision certifying a class action for settlement purposes and granting preliminary approval of the settlement subject to modification of certain bar orders contemplated by the settlement. On August 31, 2005, the court reaffirmed class certification and preliminary approval of the modified settlement in a comprehensive Order. On February 24, 2006, the court dismissed litigation filed against certain underwriters in connection with certain claims to be assigned under the settlement. On April 24, 2006, the court held a Final Fairness Hearing to determine whether to grant final approval of the settlement. On December 5, 2006, the Second Circuit Court of Appeals vacated the lower court’scourt's earlier decision certifying as class actions the six IPO Cases designated as “focus"focus cases.”" Thereafter, the District Court ordered a stay of all proceedings in all of the IPO Cases pending the outcome of plaintiffs’plaintiffs' petition to the Second Circuit for rehearing en banc and resolution of the class certification issue. On April 6, 2007, the Second Circuit denied plaintiffs’plaintiffs' rehearing petition, but clarified that the plaintiffs may seek to certify a more limited class in the District Court. Accordingly, the stay remains in place and the plaintiffs and Issuers have stated that they are prepared to discuss how the settlement might be amended or renegotiated to comply with the Second Circuit’sCircuit's decision. Plaintiffs filed amended complaints in the six focus cases on or about August 14, 2007. On September 27, 2007, Plaintiffs filed a motion for class certification in the six focus cases. On November 13, 2007, the Issuer Defendants filed a motion to dismiss the amended complaints in the six focus cases. On November 14, 2007, the Underwriter Defendants filed a motion to dismiss the amended complaints in the six focus cases. The court has not yet set a deadline for the plaintiffs to file amended complaints in the other IPO lawsuits. Due to the inherent uncertainties of litigation, and because the settlement may not receive final approval from the Court, the ultimate outcome of this matter cannot be predicted. In accordance with FASB No. 5,“"Accounting for Contingencies”Contingencies" WFI The Company believes any contingent liability related to this claim is not probable or estimable and therefore no amounts have been accrued in regards to this matter.
2004 Securities Litigation
In August 2004, as a result offollowing the Company’sCompany's announcement on August 4, 2004 that it intended to restate its financial statements for the fiscal years ended December 31, 2000, 2001, 2002 and 2003, the Company and certain of its current and former officers and directors were named as defendants (“Defendants”("Defendants") in several securities class action lawsuits filed in the United States District Court for
the Southern District of California. These actions were filed on behalf of those who purchased, or otherwise acquired, the Company’sCompany's common stock between April 26, 2000 and August 4, 2004. The lawsuits generally allege that, during that time period, Defendants made false and misleading statements to the investing public about the Company’sCompany's business and financial results, causing its stock to trade at artificially inflated
levels. Based on these allegations, the lawsuits allege that Defendants violated the Securities Exchange Act of 1934, and the plaintiffs seek unspecified damages. These actions have been consolidated into a single action—In re Wireless Facilities, Inc. Securities Litigation, Master File No. 04CV1589-JAH. Plaintiffs filed a First Amended Consolidated Class Action Complaint on April 1, 2005. Defendants filed their motion to dismiss this first amended complaint on April 14, 2005. The plaintiffs then requested leave to amend their first amended complaint. The plaintiffs filed their Second Amended Complaint on June 9, 2005, this time on behalf of those who purchased, or otherwise acquired, the Company’sCompany's common stock between May 5, 2003 and August 4, 2004. Defendants filed their motion to dismiss this Second Amended Complaint on July 14, 2005. The motion to dismiss was taken under submission on October 20, 2005 and on March 8, 2006, the courtCourt granted the Defendants’Defendants' motion. However, plaintiffs were granted the right to amend their complaint within 45 days and subsequently filed their Third Amended Consolidated Class Action Complaint on April 24, 2006. Defendants filed a motion to dismiss this complaint on June 8, 2006. On May 7, 2007, the courtCourt denied the Defendants’Defendants' motion to dismiss. Defendants’Defendants' filed their answer to the plaintiffs’plaintiffs' complaint on July 13, 2007. In February 2008, following a voluntary mediation of the matter, the parties reached a tentative agreement to settle the class action. Under the tentative settlement, plaintiffs and the class will dismiss all claims, with prejudice, in exchange for a cash payment in the total amount of $12 million. The Company's directors' and officers' liability insurers will pay the settlement amount in accordance with the Company's insurance policies, less any applicable retention or co-insurance obligations that are expected to be paid directly by the Company. The Company estimates that the amount of its payment toward the settlement will be approximately $2.4 million. The Company has accrued approximately $2.4 million as of December 31, 2007 related to this matter. The parties currently are in the process of documenting their agreement and then will seek a determination by the Court that the proposed settlement is fair, reasonable and adequate. The Company makes no assurances at this time that the Court will approve the proposed settlement terms or that the matter ultimately will be settled. Despite the tentative settlement reached in this action, the Company believes that the allegations lack merit and intends to vigorously defend all claims asserted. It is impossible at this time to assess whether or not the outcome of these proceedings will or will not have a material adverse effect on the Company. We have not recorded any accrual for a contingent liability associated with this legal proceeding based on the Company’s belief that a liability, while possible, is not probable and any range of potential future charge cannot be reasonably estimated at this time.merit.
In 2004, two derivative lawsuits were filed in the United States District Court for the Southern District of California against certain of the Company’sCompany's current and former officers and directors:Pedicini v. Wireless Facilities, Inc.,Case No. 04CV1663; andRoth v. Wireless Facilities, Inc.,Case No. 04CV1810. These actions were consolidated into a single action inIn re Wireless Facilities, Inc. Derivative Litigation, Lead Case No 04CV1663-JAH. TheThese lawsuits contain factual allegations in these lawsuitsthat are substantially similar to those made in the class action lawsuits, but the plaintiffs in these lawsuits assert claims for breach of fiduciary duty, gross mismanagement, abuse of control, waste of corporate assets, violation of Sarbanes Oxley Act section 304, unjust enrichment and insider trading. The plaintiffs in these lawsuits seek unspecified damages and equitable and/or injunctive relief. The lead plaintiff filed a consolidated complaint on March 21, 2005. On May 3, 2005, the defendants filed motions to dismiss this action, to stay this action pending the resolution of the consolidated non-derivative securities case pending in the Southern District of California, and to dismiss the complaint against certain non-California resident defendants. Pursuant to a request by the Court, Defendants’Defendants' motions were withdrawn without prejudice pending a decision on defendants’defendants' motion to dismiss the complaint against the non-California resident defendants. On March 20, 2007, the Court ruled that it lacked personal jurisdiction over five of the six non-California defendants and dismissed them from the federal derivative complaint. On March 27, 2007, plaintiffs filed an amended derivative complaint setting forth all of the same allegations from the original complaint and adding allegations regarding WFI’sthe Company's stock option granting practices. Basically, plaintiffs allege that WFI “backdated”the Company "backdated" or “springloaded”
"springloaded" employee stock option grants so that the options were granted at less than fair market value. The amended complaint names all of the original defendants (including those dismissed for lack of jurisdiction) as well as nine new defendants. On July 2, 2007, the non-California resident defendants moved to dismiss the complaint for lack of personal jurisdiction. ThatOn October 17, 2007, the Court took the motion is set to be heard on November 5, 2007. Onceunder submission without oral argument. On February 26, 2008, the court has decided the issue ofCourt again ruled that it lacked personal jurisdiction WFI,over five of the six non-California defendants and dismissed them from the amended federal derivative complaint. The parties have conferred and discussed the Court's order and have stipulated to a briefing schedule for any remaining motions to dismiss that the Company, along with any remainingthe individual defendant founddefendants subject to the court’scourt's jurisdiction, may again movebring in an effort to dismiss the complaint as to them. Pursuant to the parties' stipulation, such motions must be brought on or before June 5, 2008. The Company believes that the allegations lack merit and intends to vigorously defend all claims asserted. It is impossible at this time to assess whether or not the outcome of these proceedings will or will not have a material adverse effect on the Company.
In April 2007, another derivative complaint was filed in the United States District Court for the Southern District of California,Hameed v. Tayebi, Case No. 07-CV-0680 BTM(RBB) (the “Hameed Action”"Hameed Action"), against several of WFI’sthe Company's current and former officers and directors. The allegations in this new derivative complaint mirror the amended allegations in the 2004 federal derivative action. Pursuant to a Courtthe Court's order and agreement betweenof the parties, the defendants need not responddefendants' responses to the complaint in theHameed Action were stayed until the Court rulesruled on the motion to dismiss for lack of personal jurisdiction currently pending in
the 2004 derivative litigation. OnceAs noted above, on February 26, 2008, the court inCourt ruled that matter has decided the issue ofit lacked personal jurisdiction over five of the non-California defendants named in the 2004 derivative action, including three that were also named in theHameed Action. The parties will meethave conferred and confer regarding defendants’ responsediscussed the Court's order and are in the process of stipulating to a briefing schedule for any remaining motions to dismiss that the Company, along with the individual defendants subject to the court's jurisdiction, may bring in an effort to dismiss theHameed Action. Action as to them. At this time, the parties have not set a date by which such motions must be brought. The Company believes that the allegations lack merit and intends to vigorously defend all claims asserted. Currently, we are unable to form a professional judgment that an unfavorable outcome is either probable or remote. Moreover, if an unfavorable outcome should eventually occur, we are not at this time able to estimate the amount or range of possible loss.”
In August and September 2004, two virtually identical derivative lawsuits were filed in California Superior Court for San Diego County against certain of the Company’sCompany's current and former officers and directors. These actions contain factual allegations similar to those of the federal lawsuits, but the plaintiffs in these cases assert claims for violations of California’sCalifornia's insider trading laws, breaches of fiduciary duty, abuse of control, gross mismanagement, waste of corporate assets and unjust enrichment. The plaintiffs in these actions seek unspecified damages, equitable and/or injunctive relief and disgorgement of all profits, benefits and other compensation obtained by defendants. These lawsuits have been consolidated into one action—In re Wireless Facilities, Inc. Derivative Litigation,California Superior Court, San Diego County, Lead Case No. GIC 834253. The plaintiffs filed a Consolidated Shareholder Derivative Complaint on October 14, 2004. This action has been stayed pending a decision in federal court on a motion to dismiss the federal derivative lawsuits. The parties will appear before the judge inIn October 2007, to apprise the courtparties notified the Court of the status of the federal action and requested the court continue its stay of this action. The Company anticipates that the court will continue to stay this matter and that the court will request the parties file an updated status report in April 2008. The Company believes that the allegations lack merit and intends to vigorously defend all claims asserted. It is impossible at this time to assess whether or not the outcome of these proceedings will or will not have a material adverse effect on the Company. We have not
The Company has recorded anyan accrual for a contingent liability associated with thisthe legal proceedingproceedings related to the derivative actions of $0.8 million based on the Company’s belief that a liability, while possible, is not probable and any rangeCompany's estimate of the potential future charge cannotamount it would have to pay, net of estimated amounts to be reasonably estimated at this time.paid by the Company's insurance carriers, in relation to these lawsuits.
2007 Securities Litigation
In March and April 2007, there were three federal class actions filed in the United States District Court for the Southern District of California against WFIthe Company and several of its current and former officers and directors. These class action lawsuits followed WFI'sthe Company's March 12, 2007 public announcement that it iswas conducting a voluntary internal review of its stock option granting processes. These actions have been consolidated into a single action,In re Wireless Facilities, Inc. Securities Litigation II, Master File No. 07-CV-0482-BTM-NLS. AThe consolidated class action complaint was filed on November 19, 2007. In March 2008, following a voluntary mediation of the matter, the parties reached a tentative agreement to settle the class action. Under the settlement proposal, plaintiffs and the class will dismiss all claims, with prejudice, in exchange for a cash payment in the amount of $4.5 million. The Company's directors' and officers' liability insurers will pay the settlement amount, less any applicable retention or co-insurance obligations and contributions that are expected to be paid directly by the Company. The Company estimates that the total amount of its payment toward the settlement will be approximately $1.7 million. The Company has not been filed. Ataccrued approximately $1.7 million as of December 31, 2007 related to this time, wematter. The parties currently are unable to formin the process of documenting their agreement, and then will seek a professional judgmentdetermination by the Court that an unfavorable outcomethe proposed settlement is either probable or remote. Moreover, if an unfavorable outcome should eventually occur, we are notfair, reasonable and adequate. The Company makes no assurances at this time able to estimatethat the amountCourt will approve the proposed settlement terms or range of possible loss.that the matter ultimately will be settled. Despite the tentative settlement reached in this action, the Company believes that the allegations lack merit.
Other Litigation and Government Investigations
In January 2005, a former independent contractor of the Company filed a lawsuit in Brazil against the Company’sCompany's subsidiary, WFI de Brazil, to which he had been assigned for a period of time. He sought to be designated an employee of WFI de Brazil and entitled to severance and related compensation pursuant to Brazilian labor law. The individual sought back wages, vacation pay, stock option compensation and related benefits in excess of $0.5 million. This matter was argued before the appropriate labor court in July 2005 and inIn July 2006, the labor court awarded the individual the Brazilian currency equivalent of approximately $0.3 million for his back wages, vacation pay and certain other benefits. The Company filed an appeal in the matter on July 20, 2006 and challenged the basis for the award on several theories. The Company has accrued approximately $0.3 million as of December 31, 2006 related to this matter.2006. On augustAugust 22, 2007, the appeals court partially upheld the Company’sCompany's appeal, although it upheld the individual’sindividual's designation as an employee. The labor court is reviewing possible damage calculations before publishing a final decision.has awarded the individual the Brazilian currency equivalent of approximately $0.6 million (based on the current currency exchange rate). The Company’sCompany's counsel is preparing a motionhas filed motions for clarification of the judgment due to omissions in the decision. The Company is unablehas accrued approximately $0.6 million as of December 31, 2007 related to determine the ultimate outcome of this matter.
On March 28, 2007, three plaintiffs, on behalf of a purported class of similarly situated employees and contractors, filed a lawsuit against the Company in the Superior Court of the State of California, Alameda County. The suit alleges various violations of the California Labor Code and seeks payments for allegedly unpaid straight time and overtime, meal period pay and associated penalties. The Company and the plaintiffs have agreed to venue for the suit in San Diego County. Based on our research to date,Although the Company has not concluded that it has any liability in the case. The Company believes that the allegations lack merit, it has agreed in principle with the plaintiffs to settle their claims for an aggregate amount in the range of $0.3 million to $0.5 million, to include individual and intendsincentive awards, attorneys' fees and administrative costs, subject to vigorously defend all claims asserted. It is impossible at this time to assess whether or notcourt approval. The actual amount paid by the outcomeCompany will depend upon the number of these proceedings will or will not have a material adverse effect onresponses received from members of the Company. We have notpurported class of plaintiffs. The Company has recorded anyan accrual for a contingent liability associated with this legal proceeding based on our belief that a liability, while possible, is not probable and any rangein the amount of potential future charge cannot be reasonably estimated at this time.$0.3 million.
On May 3, 2007, the Company announced that it hashad a filed a lawsuit against a former employee Vencent Donlan, who previously served as its stock option administrator and left the Company in mid-2004, and his spouse. The lawsuit seekssought to recover damages resulting from the theft by Donlana former employee of WFICompany stock options and common stock valued in excess of $6.3 million. The thefts, which appear to have taken place during 2002 and 2003, were discovered through the Company’sCompany's review of its past
practices related to the granting and pricing of employee stock options with the assistance of its outside counsel and forensic computer consultants. The complaint also allegesalleged that Donlanthe former employee attempted to cover up the scheme by, among other things, deleting entries from the Company’sCompany's records. WFI had
We promptly reported this discovery to the SEC in March 2007 when the theft was discovered.discovery of the theft. The SEC initiated an informal inquiry, and commenced an enforcement action against Donlan, and the former employee. The U.S. Attorney’sAttorney's Office also forwarded a grand jury subpoena to the companyus seeking records related to Donlanour former employee and our historical option granting practices. The SEC filed a federal lawsuit and obtained a temporary restraining order and asset freeze against Donlanthe former employee and his spouse. The U.S. Attorney’sAttorney's Office indicted Donlanhim for the theft and he pleadpled guilty to the federal criminal charges. The Companycharges and has been sentenced to 46 months in prison and currently is incarcerated. We have cooperated with, and intendsintend to continue to cooperate with both the SEC and the U.S. Attorney’sAttorney's Office on this matter and otherwise. He and his wife entered into a settlement agreement with us on October 5, 2007 turning over substantially all of their assets to us in settlement of the damages incurred in the theft. On February 15, 2008, the SEC approved the settlement. On February 19, 2008, the court entered a final judgment approving the settlement. We have obtained the assets, which aggregate approximately $3.4 million, and are in the process of liquidating them.
In addition to the foregoing matters, from time to time, the Company may become involved in various claims, lawsuits and legal proceedings that arise in the ordinary course of business. However, litigation is subject to inherent uncertainties, and an adverse result in these or other matters may arise from time to time that may harm the Company’sCompany's business. The Company is currently not aware of any such legal proceedings or claims that we believe will have, individually or in the aggregate, a material adverse affect on our business, financial condition or operating results.
Item 4.Submission of Matters to a Vote of Security Holders
On November 14, 2007, we held our annual stockholders' meeting at which our stockholders (i) elected five (5) directors to hold office until the 2008 election of directors and (ii) ratified the appointment of Grant Thornton LLP as our independent registered accounting firm for the year ending December 31, 2007. The vote on such matter was as follows:
Director
| | For
| | Withheld
|
|---|
| Scott I. Anderson | | 65,049,380 | | 535,981 |
| Bandel L. Carano | | 58,607,583 | | 6,977,778 |
| Eric M. DeMarco | | 54,444,218 | | 11,414,143 |
| William A. Hoglund | | 65,048,885 | | 536,476 |
| Scot B. Jarvis | | 65,044,280 | | 541,081 |
- 2.
- Ratification of the selection of Grant Thornton LLP as the Company's independent registered public accounting firm for the fiscal year ending December 31, 2007:
For
| | Against
| | Abstain
|
|---|
| 65,427,108 | | 91,957 | | 66,296 |
None.
42
PART II
Item 5.Market for Registrant’sRegistrant's Common Equity, Related Stockholder Matters and Issuer Purchases of Equity Securities
Market Information
Our Common Stock is listed on the NasdaqNASDAQ Global Select Market and has traded under the symbol “WFII” and has"KTOS" since September 17, 2007. Our common stock traded sinceunder the symbol "WFII" from November 5, 1999.1999 through September 14, 2007.
The following table sets forth the high and low sales prices for our Common Stock for the periods indicated, as reported by NASDAQ. Such quotation represents inter-dealer prices without retail markup, markdown or commission and may not necessarily represent actual transactions.
| | High | | Low | |
Year Ended December 31, 2006: | | | | | |
Fourth Quarter | | $ | 2.88 | | $ | 2.00 | |
Third Quarter | | $ | 2.83 | | $ | 1.91 | |
Second Quarter | | $ | 4.53 | | $ | 2.85 | |
First Quarter | | $ | 5.52 | | $ | 3.88 | |
Year Ended December 31, 2005: | | | | | |
Fourth Quarter | | $ | 6.86 | | $ | 5.10 | |
Third Quarter | | $ | 6.67 | | $ | 4.95 | |
Second Quarter | | $ | 6.43 | | $ | 5.13 | |
First Quarter | | $ | 9.54 | | $ | 6.25 | |
| | High
| | Low
|
|---|
| Year Ended December 31, 2007: | | | | | | |
| | Fourth Quarter | | $ | 3.04 | | $ | 1.91 |
| | Third Quarter | | $ | 2.75 | | $ | 1.73 |
| | Second Quarter | | $ | 1.74 | | $ | 1.07 |
| | First Quarter | | $ | 2.85 | | $ | 1.24 |
| Year Ended December 31, 2006: | | | | | | |
| | Fourth Quarter | | $ | 2.88 | | $ | 2.00 |
| | Third Quarter | | $ | 2.93 | | $ | 1.91 |
| | Second Quarter | | $ | 4.53 | | $ | 2.75 |
| | First Quarter | | $ | 5.52 | | $ | 3.88 |
On September 6, 2007,March 3, 2008 the last sale price of our Common Stock as reported by NASDAQ was $2.74$1.71 per share. On September 6, 2007,March 3, 2008, there were 210216 shareholders of record of our Common Stock.
We have not declared any cash dividends since becoming a public company. We currently intend to retain any future earnings to finance the growth and development of the business and, therefore, do not anticipate paying any cash dividends in the foreseeable future. In addition, our credit facility restricts our ability to pay dividends. Any future determination to pay cash dividends will be at the discretion of our Board and will be dependent upon the future financial condition, results of operations, capital requirements, general business conditions and other relevant factors as determined by our Board.
On December 16, 2004, we adopted our Rights Plan. Pursuant to the Rights Plan, our Board declared a dividend distribution of one preferred share purchase right (“Right”) on each outstanding share of our common stock. Each Right will entitle stockholders to buy one one-hundredth of a share of newly created Series C Preferred Stock at an exercise price of $54, subject to adjustment, in the event that the Rights become exercisable. Subject to limited exceptions, the Rights will become exercisable if a person or group acquires 15% or more of our common stock or announces a tender offer for 15% or more of the common stock. If we are acquired in a merger or other business combination transaction which has not been approved by our Board, each Right will entitle its holder to purchase, at the Right’s then-current exercise price, a number of the acquiring company’s common shares having a market value at the time of twice the Right’s exercise price.
Securities Authorized for Issuance Under Equity Compensation Plans
Information about our equity compensation plans as of December 31, 2006 was2007 is as follows (shares in thousands):
Plan Category | | | | Number of
Securities
to be Issued
Upon
Exercise of
Outstanding
Options,
Warrants and
Rights | | Weighted
Average
Exercise
Price of
Outstanding
Options,
Warrants and
Rights | | Number of
Securities
Remaining
Available for
Future
Issuance | |
Equity Compensation Plans Approved by Shareholders(1) | | | 9,277 | | | | $ | 6.28 | | | | 5,841 | (3) | |
Equity Compensation Plans Not Approved by Shareholders(2) | | | 2,357 | | | | $ | 5.30 | | | | 1,071 | | |
Total | | | 11,634 | | | | | | | | 6,912 | | |
Plan Category
| | Number of Securities to be Issued Upon Exercise of Outstanding Options, Warrants and Rights
| | Weighted Average Exercise Price of Outstanding Options, Warrants and Rights
| | Number of Securities Remaining Available for Future Issuance
| |
|---|
| Equity Compensation Plans Approved by Shareholders(1) | | 7,019 | | $ | 4.62 | | 7,321 | (3) |
| Equity Compensation Plans Not Approved by Shareholders(2) | | 1,318 | | $ | 4.86 | | 2,110 | |
| | |
| | | | |
| |
| | Total | | 8,337 | | | | | 9,431 | |
- (1)
Includes 1997 Stock Option Plan, 1999 and 2005 Equity Incentive Plan and 1999 Employee Stock Purchase Plan
- (2)
- Includes 2000 Non-Statutory Stock Option Plan
- (3)
- Includes
352,000351,811 shares reserved for issuance under the Employee Stock Purchase Plan which was suspended in 2006 but has been re-activated for 2007.2006.
For more detailed information regarding our equity compensation plans, see Note 10 to our consolidated financial statements.
Performance Graph
The following performance graph is a comparison of the five year cumulative stockholder return on our common stock against the cumulative total return of the NASDAQ Composite Index, and the NASDAQ Telecommunications Index and a peer group composed of the Russell 2000 Stock Index and SYS Technologies, NCI, Inc., Stanley, Inc., SI International, Inc., MTC Technologies, Inc., and Dynamic Research Corporation for the period commencing December 31, 20012002 and ending December 31, 2006.2007. The performance graph assumes an initial investment of $100 in our common stock and in each of the indices.indices and peer group. The performance graphcomparison also assumes that all dividends are reinvested and related textall returns are based onmarket-cap weighted. The historical data and areinformation set forth below is not necessarily indicative of future performance.
COMPARISON OF 5 YEAR CUMULATIVE TOTAL RETURN*
Among Wireless Facilities,Kratos Defense & Security Solutions, Inc., The NASDAQ Composite Index,
And The NASDAQ Telecommunications Index And A Peer Group
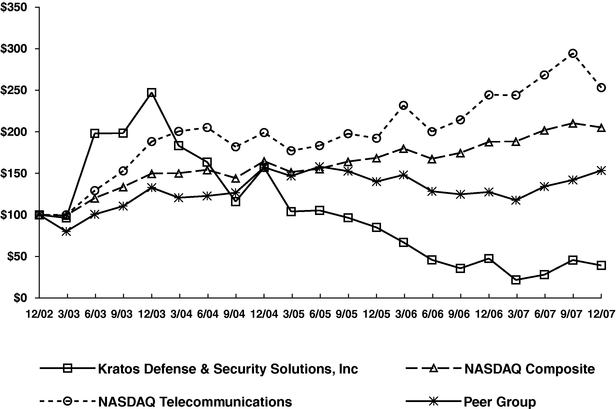
The performance graph above and related text are being furnished solely to accompany this annual report on Form 10-K pursuant to Item 201(e) of Regulation S-K, and are not being filed for purposes of Section 18 of the Securities Exchange Act of 1934, as amended, and are not to be incorporated by reference into any filing of ours, whether made before or after the date hereof, regardless of any general incorporation language in such filing.
Item 6.Selected Financial Data
We recently completed a voluntary review of our equity award practices. The voluntary review, which covered all option grants and other equity awards made since two months prior to our IPO in November 1999, as well as other substantial grants issued prior to our IPO, was initiated by the current executive management team, which has been in place since 2004, under the direction of our Board, with the assistance of outside counsel and forensic accountants. We also reviewed all option grants input into our stock option database (Equity Edge) subsequent to our IPO date of November 1999 but with a grant date prior to November 1999 and all option grants that preceded an employee’s date of hire.
Based on the results of the review, the Audit Committee concluded that, pursuant to APB 25 and related interpretations, the accounting measurement dates for certain stock option grants awarded between March 1998 and December 2003, covering options to purchase 15.2 million shares of our common stock, differed from the measurement dates previously used for such awards. As a result, revised measurement dates were applied to the affected option grants and WFI has recorded a total of $75.0 million in additional deferred compensation, with substantially all of the increase relating to option grants issued prior to December 31, 2003. WFI has recorded $58.2 million in additional stock-based compensation for the years 1998 through 2005, reflecting the amortization of deferred compensation over the relevant vesting periods, which is typically over four years. After related tax adjustments of $9.6 million, the restatement resulted in total net adjustments of $48.6 million. This amount is net of forfeitures related to employee terminations. The additional stock-based compensation expense is being amortized over the service period relating to each option, typically four years, with approximately 92% of the expense being recorded in years prior to 2004.
During the course of the Equity Award Review, we discovered that a former stock option administrator had engaged in a fraudulent scheme by which he misappropriated options to purchase more than 700,000 shares of stock. Ill-gotten gains from this scheme exceeded $6.3 million, and we have recorded an unauthorized issuance of common stock charge of $0.6 million and $5.7 million in 2002 and 2003, respectively, related to this theft.
The aggregate financial impact of the Equity Award Review including the unauthorized issuance of common stock charge was $64.5 million. After aggregate other tax adjustments and income tax adjustments of $9.6 million, the restatement resulted in total net adjustments to net income (loss) of $54.9 million for the years 1998 through 2005.
The selected consolidated financial data has been restated as a result of the above matters. SeeEngineering and Deployment Services divestitures in June and July 2007, respectively, the Explanatory Note included before Part I, Item 1 of this Report, the discussion includedWireless Network Services segment has been classified as a discontinued operation in “Management’s Discussion and Analysis of Financial Condition and Results of Operations” included in Part II, Item 7 of this Report and Note 2all prior year results presented herein have been reclassified to reflect these businesses as discontinued operations in accordance with SFAS No. 144, "Accounting for the Impairment or Disposal of Notes to Consolidated Financial Statements, included in Part IV, Item 15 of this Report.Long-Lived Assets".
The following selected consolidated financial data should be read in conjunction with our consolidated financial statements and related notes thereto and with “Management’s Discussion and Analysis of Financial Condition and Results of Operations” which are incorporated in Item 7 or included elsewhere in this Annual Report on Form 10-K. Our historical results are not necessarily indicative of operating results to be expected in the future.
46
In December 2005, our Board made the decision to exit our Mexican and South American deployment businesses. In December 2006, our Board made the decision to exit our EMEA and Brazilian businesses. Accordingly, all results of operations for these businesses have been reflected as discontinued operations for all years presented.
| | Year Ended December 31, | |
| | 2002 | | 2003 | | 2004 | | 2005 | | 2006 | |
| | (Restated) | | (Restated) | | (Restated) | | (Restated) | | | |
| | (All amounts except per share data in millions) | |
Consolidated Statements of Operations Financial Data: | | | | | | | | | | | | | | | | | | | |
Revenues | | | $ | 155.7 | | | | $ | 205.1 | | | | $ | 296.2 | | | | $ | 337.7 | | | $ | 327.8 | |
Gross profit | | | 47.5 | | | | 61.1 | | | | 69.4 | | | | 76.3 | | | 53.5 | |
Operating income (loss) | | | (11.3 | ) | | | 7.8 | | | | 5.6 | | | | 16.9 | | | (31.4 | ) |
Provision (benefit) for income taxes | | | 15.4 | | | | (1.6 | ) | | | (0.6 | ) | | | 5.9 | | | 14.5 | |
Income (loss) from continuing operations | | | (27.3 | ) | | | 10.2 | | | | 3.4 | | | | 11.3 | | | (46.7 | ) |
Income (loss) from discontinued operations | | | (42.2 | ) | | | (8.3 | ) | | | 11.6 | | | | (9.7 | ) | | (11.2 | ) |
Cumulative effect of change in accounting principle | | | (16.1 | ) | | | — | | | | — | | | | — | | | — | |
Net income (loss) | | | $ | (85.6 | ) | | | $ | 1.9 | | | | $ | 15.0 | | | | $ | 1.6 | | | $ | (57.9 | ) |
Income (loss) from continuing operations per common share | | | | | | | | | | | | | | | | | | | |
Basic | | | $ | (0.57 | ) | | | $ | 0.15 | | | | $ | 0.05 | | | | $ | 0.15 | | | $ | (0.64 | ) |
Diluted | | | $ | (0.57 | ) | | | $ | 0.14 | | | | $ | 0.05 | | | | $ | 0.15 | | | $ | (0.64 | ) |
Income (loss) from discontinued operations per common share | | | | | | | | | | | | | | | | | | | |
Basic | | | $ | (0.88 | ) | | | $ | (0.12 | ) | | | $ | 0.16 | | | | $ | (0.13 | ) | | $ | (0.15 | ) |
Diluted | | | $ | (0.88 | ) | | | $ | (0.11 | ) | | | $ | 0.15 | | | | $ | (0.13 | ) | | $ | (0.15 | ) |
Net income (loss) per common share | | | | | | | | | | | | | | | | | | | |
Basic | | | $ | (1.78 | ) | | | $ | 0.03 | | | | $ | 0.21 | | | | $ | 0.02 | | | $ | (0.79 | ) |
Diluted | | | $ | (1.78 | ) | | | $ | 0.03 | | | | $ | 0.20 | | | | $ | 0.02 | | | $ | (0.79 | ) |
Weighted average shares: | | | | | | | | | | | | | | | | | | | |
Basic | | | 48.1 | | | | 68.4 | | | | 72.8 | | | | 74.0 | | | 73.5 | |
Diluted | | | 48.1 | | | | 73.5 | | | | 75.3 | | | | 75.0 | | | 73.5 | |
| | As of December 31, | |
| | 2002 | | 2003 | | 2004 | | 2005 | | 2006 | |
| | (Restated) | | (Restated) | | (Restated) | | (Restated) | | | |
| | (All amounts in millions) | |
Consolidated Balance Sheet Data: | | | | | | | | | | | | | | | | | | | |
Cash and cash equivalents | | | $ | 97.0 | | | | $ | 75.8 | | | | $ | 50.4 | | | | $ | 7.7 | | | $ | 5.4 | |
Short-term investments | | | — | | | | 35.1 | | | | 7.6 | | | | — | | | — | |
Working capital | | | 101.4 | | | | 132.5 | | | | 98.6 | | | | 67.4 | | | (3.9 | ) |
Total assets | | | 221.3 | | | | 279.3 | | | | 330.7 | | | | 342.0 | | | 335.9 | |
Total debt | | | 2.8 | | | | 0.7 | | | | 1.9 | | | | 0.7 | | | 51.4 | |
Total stockholders’ equity | | | 140.0 | | | | 191.9 | | | | 219.6 | | | | 229.7 | | | 187.1 | |
| | | | | | | | | | | | | | | | | | | | | | | | |
The selected consolidated financial data has been restated as a result of the discontinued businesses. The following table presents details of the total stock-based compensation expense resulting fromselected consolidated financial data should be read in conjunction with our Equity Award Review as well as previously recorded stock-based compensation expense and unauthorized issuance of stock expense that is includedwithin the functional line items in the consolidated statements of operations data above. The expense below does not include the related tax adjustments.
| | As of December 31, | |
| | 2002 | | 2003 | | 2004 | | 2005 | | 2006 | |
| | (Restated) | | (Restated) | | (Restated) | | (Restated) | | | |
| | (All amounts in millions) | |
Supplemental Data on Stock-Based Compensation and Unauthorized Issuance of Stock Expense: | | | | | | | | | | | | | | | | | | | |
Cost of revenue | | | $ | 2.9 | | | | $ | 1.8 | | | | $ | 1.5 | | | | $ | 1.7 | | | $ | 4.1 | |
Selling, general and administrative | | | 2.6 | | | | 7.7 | | | | 0.9 | | | | 1.1 | | | 7.5 | |
Unauthorized issuance of stock | | | 0.6 | | | | 5.7 | | | | — | | | | — | | | — | |
Discontinued operations | | | 0.6 | | | | 0.6 | | | | — | | | | — | | | — | |
Total | | | $ | 6.7 | | | | $ | 15.8 | | | | $ | 2.4 | | | | $ | 2.8 | | | $ | 11.6 | |
The following table presents the detail of the non-income tax payroll related adjustments resulting from the Equity Award Review that is included within the functional line items in the consolidated statements of operations data above.
| | As of December 31, | |
| | 2002 | | 2003 | | 2004 | | 2005 | | 2006 | |
| | (Restated) | | (Restated) | | (Restated) | | (Restated) | | | |
| | (All amounts in millions) | |
Supplemental Data on Non-Income Tax Payroll Related Expense (Credit) | | | | | | | | | | | | | | | | | | | | | |
Cost of revenue | | | $ | 0.5 | | | | $ | (0.2 | ) | | | $ | (7.5 | ) | | | $ | (0.4 | ) | | | $ | — | | |
Selling, general and administrative | | | 0.4 | | | | (0.2 | ) | | | (3.9 | ) | | | (0.2 | ) | | | — | | |
Income (loss) from discontinued operations | | | — | | | | — | | | | (0.8 | ) | | | (0.0 | ) | | | — | | |
| | | $ | 0.9 | | | | $ | (0.4 | ) | | | $ | (12.2 | ) | | | $ | (0.6 | ) | | | $ | — | | |
The consolidated statement of operations data set forth above for the years ended December 31, 2005 and 2004 and the consolidated balance sheet data as of December 31, 2005, are derived from, and qualified by reference to, the audited restated financial statements appearing elsewhere in this Report. The consolidated statement of operations data for the years ended December 31, 2003 and 2002,related notes thereto and the consolidated balance sheet data as of December 31, 2004, 2003, and 2002, are derived from unaudited financial statements not included herein and have also been restated to reflect the results of the Equity Award Review.
See “Impact of the Additional Stock-Based Compensation Expense-Related Adjustments on the Consolidated Financial Statements” included in, ‘‘Management’swith "Management's Discussion and Analysis of Financial Condition and Results of Operations,” includedOperations" which are incorporated in Part II, Item 7 of this Report, for tables presenting the adjustments to our previously-reported consolidated statements of operations for the four years ended December 31, 2005.
The information that has been previously filed or otherwise reported in our Quarterly Reports on Form 10-Q or any of our Annual Reports on Form 10-K for the periods affected by the restatement is superseded by the informationelsewhere in this Report andon Form 10-K. Our historical results are not necessarily indicative of operating results to be expected in the previously filed financial statements and related financial information and opinions of our independent registered public accounting firm contained in such reports can no longer be relied upon. The restated consolidated financial statements include unauditedfuture.
| | Year Ended December 31,
| |
|---|
| | 2003
| | 2004
| | 2005
| | 2006
| | 2007
| |
|---|
| | (All amounts except per share data in millions)
| |
|---|
| Consolidated Statements of Operations Data: | | | | | | | | | | | | | | | | |
| | Revenues | | $ | 43.4 | | $ | 116.9 | | $ | 152.3 | | $ | 153.1 | | $ | 193.6 | |
| | Gross profit | | | 21.2 | | | 29.0 | | | 36.6 | | | 28.9 | | | 31.6 | |
| | Operating income (loss) from continuing operations | | | (2.6 | ) | | (13.8 | ) | | 3.2 | | | (31.5 | ) | | (24.6 | ) |
| | Provision (benefit) for income taxes from continuing operations | | | (1.0 | ) | | (8.4 | ) | | (0.1 | ) | | 13.8 | | | 1.3 | |
| | Income (loss) from continuing operations | | | (0.8 | ) | | (8.2 | ) | | 3.6 | | | (46.2 | ) | | (28.2 | ) |
| | Income (loss) from discontinued operations | | | 2.7 | | | 23.2 | | | (2.0 | ) | | (11.7 | ) | | (12.6 | ) |
| | Net income (loss) | | $ | 1.9 | | $ | 15.0 | | $ | 1.6 | | $ | (57.9 | ) | $ | (40.8 | ) |
| Income (loss) from continuing operations per common share | | | | | | | | | | | | | | | | |
| | Basic | | $ | (0.01 | ) | $ | (0.12 | ) | $ | 0.05 | | $ | (0.63 | ) | $ | (0.38 | ) |
| | Diluted | | $ | (0.01 | ) | $ | (0.12 | ) | $ | 0.05 | | $ | (0.63 | ) | $ | (0.38 | ) |
| Income (loss) from discontinued operations per common share | | | | | | | | | | | | | | | | |
| | Basic | | $ | 0.04 | | $ | 0.34 | | $ | (0.03 | ) | $ | (0.16 | ) | $ | (0.17 | ) |
| | Diluted | | $ | 0.04 | | $ | 0.34 | | $ | (0.03 | ) | $ | (0.16 | ) | $ | (0.17 | ) |
| Net income (loss) per common share | | | | | | | | | | | | | | | | |
| | Basic | | $ | 0.03 | | $ | 0.22 | | $ | 0.02 | | $ | (0.79 | ) | $ | (0.55 | ) |
| | Diluted | | $ | 0.03 | | $ | 0.22 | | $ | 0.02 | | $ | (0.79 | ) | $ | (0.55 | ) |
| Weighted average shares: | | | | | | | | | | | | | | | | |
| | Basic | | | 68.4 | | | 67.7 | | | 74.0 | | | 73.5 | | | 74.0 | |
| | Diluted | | | 68.4 | | | 67.7 | | | 75.0 | | | 73.5 | | | 74.0 | |
| | As of December 31,
|
|---|
| | 2003
| | 2004
| | 2005
| | 2006
| | 2007
|
|---|
| | (All amounts in millions)
|
|---|
| Consolidated Balance Sheet Data: | | | | | | | | | | | | | | | |
| | Cash and cash equivalents | | $ | 75.8 | | $ | 50.4 | | $ | 7.7 | | $ | 5.4 | | $ | 8.6 |
| | Short-term investments | | | 35.1 | | | 7.6 | | | — | | | — | | | — |
| | Working capital | | | 132.5 | | | 98.6 | | | 67.4 | | | (3.8 | ) | | 23.4 |
| | Total assets | | | 279.3 | | | 330.7 | | | 342.0 | | | 337.7 | | | 335.3 |
| | Short-term debt | | | 0.7 | | | 1.9 | | | 0.7 | | | 51.4 | | | 2.7 |
| | Long-term debt | | | — | | | — | | | — | | | — | | | 74.0 |
| | Total stockholders' equity | | $ | 191.9 | | $ | 219.6 | | $ | 229.7 | | $ | 187.1 | | $ | 167.2 |
financial information for interim periods of 2005 consistent with Article 10-01 of Regulation S-X. That information is presented in Note 2 to Notes to Consolidated Financial Statements, included in Part IV, Item 15 of this Report.
Certain amounts in the selected consolidated financial data above have been reclassified to conform to the 20062007 presentation. See Note 1 of Notes to Consolidated Financial Statements, included in Part IV, Item 15 of this Report.
You should read this selected consolidated financial data together with the Explanatory Note and Consolidated Financial Statements and related Notes contained in this Report, and in our subsequent reports filed with the SEC, as well as the section of this Report and our other reports entitled “Management’s"Management's Discussion and Analysis of Financial Condition and Results of Operations.”"
49
Item 7.Management’sManagement's Discussion and Analysis of Financial Condition and Results of Operations (“("MD&A”&A")
This report contains forward-looking statements. These statements relate to future events or our future financial performance. In some cases, you can identify forward-looking statements by terminology such as “may,” “will,” “should,” “expect,” “plan,” “anticipate,” “believe,” “estimate,” “predict,” “potential”"may," "will," "should," "expect," "plan," "anticipate," "believe," "estimate," "predict," "potential" or “continue,”"continue," the negative of such terms or other comparable terminology. These statements are only predictions. Actual events or results may differ materially. Factors that may cause our results to differ include, but are not limited to: changes in the scope or timing of our projects; changes or cutbacks in spending by the U.S. DoDDepartment of Defense which could cause delays or cancellations of key government contracts; slowdowns in telecommunications infrastructure spending in the United States and globally, which could delay network deployment and reduce demand for our services; the timing, rescheduling or cancellation of significant customer contracts and agreements, or consolidation by or the loss of key customers; failure to successfully consummate acquisitions or integrate acquired operations; the rate of adoption of telecom outsourcing by network carriers and equipment suppliers; the rate of growth of adoption of WLAN and wireless security systems by enterprises; and competition in the marketplace which could reduce revenues and profit margins.
Although we believe that the expectations reflected in the forward-looking statements are reasonable, we cannot guarantee future results, levels of activity, performance or achievements. Moreover, neither we, nor any other person, assume responsibility for the accuracy and completeness of the forward-looking statements. We are under no obligation to update any of the forward-looking statements after the filing of thisour Annual Report on Form 10-K to conform such statements to actual results or to changes in our expectations.
Certain of the information set forth herein, including costs and expenses that exclude the impact of stock compensation expense, amortization expense of purchased intangibles for 2006 and 2007, and the stock option investigation and related costs in 2006,2007, may be considered non-GAAP financial measures. We believe this information is useful to investors because it provides a basis for measuring the operating performance of our business and our cash flow, excluding the effect of stock compensation expense that would normally be included in the most directly comparable measures calculated and presented in accordance with Generally Accepted Accounting Principles. Our management uses these non-GAAP financial measures along with the most directly comparable GAAP financial measures in evaluating our operating performance, capital resources and cash flow. Non-GAAP financial measures should not be considered in isolation from, or as a substitute for, financial information presented in compliance with GAAP, and non-financial measures we report may not be comparable to similarly titled amounts reported by other companies.
The following discussion should be read in conjunction with our audited consolidated financial statements and the related notes and other financial information appearing elsewhere in this Form 10-KReport and other reports and filings made with the Securities and Exchange Commission. Readers are also urged to carefully review and consider the various disclosures made by us which attempt to advise interested parties of the factors which affect our business, including without limitation the disclosures made under the caption “Management��s Discussion and Analysis of Financial Condition and Results of Operations,” and And Item 1A—Risk Factors.
Equity Award Review
Background and Scope of Review
Our current executive management team, which has been in place since 2004, initiated an internal review of our historical practices relatedOverview
We provide mission critical engineering, IT services and warfighter solutions to granting stock option awardsthe U.S. Government and other equity awards (the “Equity Award Review”) in the summer of 2006 in reaction to media reports regarding stock option granting practices of public companies. In February 2007, the Board appointed a Special Committee of the Board to review the adequacy of the Equity Award Review and the recommendations of management regarding historical option granting practices, and to make recommendations and findings regarding those practices and individual conduct. The Special Committee was not charged with making, and did not make, any evaluation of the accounting determinations and related tax adjustments. The accounting determinations and related tax adjustments were evaluated by Management and the Audit Committee of the Board of Directors. The Special Committee was comprised of a non-employee director who had not served on our Compensation Committee before 2005.
The Equity Award Review encompassed all grants of options to purchase shares of our common stock and other equity awards made since two months prior to our IPO in November 1999 through December 2006. We also reviewed all option grants that were entered into our stock option database (Equity Edge) after our IPO with a grant date before November 1999,government agencies, as well as other substantial grants issued prior to our IPO. The total numberstate and local agencies and commercial customers. We are an innovative provider of grants reviewed in the Equity Award Review exceeded 14,000 individual grants. We further reviewed all option grants with a grant date that preceded an employee’s date of hire. As part of the review, interviews of 18 currentmission critical engineering, IT services and former officers, directors, employees and attorneys were conducted, and more than 40 million pages of electronic and hard copy documents were searched for relevant information. The Special Committee also conducted its own separate review of the option granting practices during the tenure of current executive management team through additional interviews and document collection and review with the assistance of its own separate counsel, Pillsbury Winthrop Shaw Pittman and FTI Consulting.
The Special Committee completed its evaluation of the Equity Award Review in August 2007 after considering the information gathered by management and Morrison & Foerster, along with testing and data gathering by Pillsbury Winthrop and FTI Consulting. The Special Committee concluded that the Equity Award Review was complete and worthy of reliance.warfighter solutions. Our Board has also concluded that the scope and thoroughness of the Equity Award Review was complete and appropriate.
The Equity Award Review demonstrated the absence of contemporaneous evidence supporting a substantial number of the previously-recorded option grants, substantially all of which were made in the period from 1998 through late 2003. During this period of time, in some instances, documents, data and interviews suggest that option grants were prepared or finalized days or, in some cases, weeks or months after the option grant date recorded in our accounting records. The affected grants include options issued to certain newly-hired employees using measurement dates prior to their employment start dates and options issued to non-employees, including advisors to the Board of Directors, erroneously designated as employees. The Special Committee also concluded that certain former employees and former officers participated in making improper option grants, including the selection of grant dates with the benefit of hindsight and in the delay in dating of otherwise approved option grants.
Impact on Previously Issued Reports and Financial Statements
In light of the Equity Award Review and the Special Committee’s findings described below, the Audit Committee of our Board concluded that our prior financial statements for periods from 1998 through our filing of interim financial statements for the period ended September 30, 2006 must be restated. Our management determined that, from fiscal year 1998 through fiscal year 2005, the Company did not properly recognize non-cash equity-based compensation charges. These chargesprincipal services are material to our financial statements for the years ended December 31, 1998 through 2005, the periods to which such charges would have related. Previously filed annual reports on Form 10-K and quarterly reports on Form 10-Q affected by the restatements have not been and will not be amended and should not be relied upon.
Consistent with the relevant accounting standards and recent guidance from the SEC as part of the Equity Award Review, the grants during the relevant period were organized into categories based on grant type and process by which the grant was finalized. We analyzed the evidence related to, grants in each category as part of the Equity Award Review. This evidence included, but wasare not limited to, electronicCommand, Control, Communications, Computing, Combat Systems Intelligence, Surveillance and physical documents, document metadata,Reconnaissance (C5ISR), weapons systems lifecycle support and witness interviews. The controlling accounting standards were applied to the relevant facts and circumstances, in a manner consistent with recent guidance from the SEC, to determine the proper measurement date for every grant within each category. If the measurement date was not the same as the originally assigned grant date, accounting adjustments were made as required, resulting in stock-based compensation expense and related income tax effects, as detailed below.
Based on the results of the Equity Award Review, we concluded that, pursuant to Accounting Principles Board Opinion No. 25, Accounting for Stock Issued to Employees (“APB 25”), and relevant
interpretations, revised accounting measurement dates should be applied to a substantial number of the stock option grants covering options for the purchase of 15.2 million shares of our common stock that were awarded primarily between March 1998 and December 2003. The use of the revised measurement dates for the affected option grants required us to record a total of $75.0 million in additional deferred compensation, with substantially all of the increase relating to option grants made before December 31, 2003. We have also recorded $58.2 million in additional deferred compensation for the years 1998 through 2005, reflecting the amortization of stock-based compensation expense over the relevant vesting periods, which was typically over four years. After aggregate payroll tax adjustments and income tax adjustments of $9.6 million, the restatement resulted in total net adjustments to net income (loss) of $48.6 million for the years 1998 through 2005. This amount is net of forfeitures related to employee terminations and cancellations of approximately $16.8 million. These amounts do not include the unauthorized issuance of common stock charge of $0.6 million and $5.7 million in 2002 and 2003 related to misappropriated options by the Company’s former stock administrator described herein. The aggregate amount of the Equity Award Review including the misappropriated options is $64.5 million comprised of the $58.2 million in additional stock-based compensation expense and $6.3 million of a charge for unauthorized issuance of common stock. After aggregate other tax adjustments and income tax adjustments of $9.6 million, the restatement resulted in total net adjustments to net income (loss) of $54.9 million for the years 1998 through 2005. Approximately $26.6 million of the stock-based compensation expense was recorded in 2001, which was primarily due to cancellations from our Stock Option Cancel/Re-grant Program, as described below, which resulted in the remaining unamortized deferred compensation being expensed upon the cancellation in March 2001.
As a consequence of these adjustments, our audited consolidated financial statements and related disclosures for the years ended December 31, 2004 and 2005 and our consolidated statements ofextension, military weapon range operations and consolidated balance sheet data for the four years ended December 31, 2005, included in “Selected Consolidated Financial Data” in Part II, Item 6 of this Report, have been restated. Additionally, the unaudited quarterly financial information for interim periods of 2005, included in “Management’s Discussiontechnical services, missile, rocket and Analysis of Financial Conditionweapon test and Results of Operations” in Part II, Item 7 of this Report, have been amended.evaluation, mission launch services, public safety, security and surveillance, advanced network engineering services and IT services, and critical infrastructure design and integration services. We have also restated the stock-based compensation expense footnote information calculated under Statement of Financial Accounting Standards, or SFAS, No. 123, Accounting for Stock-Based Compensation, or SFAS 123, offer our customers solutions and SFAS No. 148, Accounting for Stock-Based Compensation—Transition and Disclosure, or SFAS 148, under the disclosure-only alternatives of those pronouncements for the years 2004 and 2005 and for interim periods of 2005. The restated footnote information has been included in “Management’s Discussion and Analysis of Financial Condition and Results of Operations” as well as in the Consolidated Financial Statements in Part II, Item 15 of this Report.
None of the adjustments resulting from the Equity Award Review affected our previously-reported revenue, cash, cash equivalents or marketable securities balances in any prior periods.
Former Stock Option Administrator
During the course of the Equity Award Review, we discovered that Vencent Donlan, a former stock option administrator, had engaged in a fraudulent scheme by which he misappropriated options to purchase more than 700,000 shares of stock. Ill-gotten gains from this scheme exceeded $6.3 million. We have brought an action against Donlan seeking return of the fraudulently obtained stock option proceeds. We also promptly alerted the SEC of our discovery in March 2007. The SEC commenced an enforcement action against Donlan, and the U.S. Attorney’s Office forwarded a grand jury subpoena to us seeking records related to Donlan and our historical option granting practices. We have cooperated with, and intend to continue to cooperate with, both the SEC and the U.S. Attorney’s Office in their actions against Donlan and otherwise. Donlan has consented to an injunction brought by the SEC and has plead guilty to federal criminal charges brought against him by the U.S. Attorney’s Office. We have recorded an
unauthorized issuance of common stock charge of $0.6 million and $5.7 million in 2002 and 2003, respectively, related to this theft.
Historical Option Grant Approval Processes
Before our IPO, there was no formal policy or process covering granting or approval of stock option grants. As of December 1999, the Compensation Committee, which was comprised of three non-employee members of our Board, delegated authority to our then chief executive officer (“CEO”) to grant options covering the purchase of up to 10,000 shares of our common stock per non-executive officer employee per year (“CEO Award Grants”). Since our IPO, our policies required Compensation Committee approval of option grants that exceeded the limits of the CEO Award Grants and all option grants to executive officers, as defined in Rule 16a-1(f) promulgated under the Securities Exchange Act of 1934, as amended (“Executive Officers”). As a result of the information considered in the Equity Award Review, we have concluded that, from our IPO in November 1999 through October 2003, our option grant processes and procedures were not consistently followed.
The Compensation Committee approved stock option grants using two different forms of authorizations. First, on occasion, the Compensation Committee approved stock option grants at formal meetings of the Compensation Committee. After our IPO, these meetings were typically held quarterly. Second and more often, the Compensation Committee members held informal discussions with our then CEO—typically telephonically or via email—to determine whether option grants should be approved. The approval of option grants determined by the Compensation Committee was documented through the use of unanimous written consent actions. The unanimous written consent actions granted the options “as of” the date the committee members informally approved the grant, which was almost always a date earlier than the date on which the formal unanimous written consent actions were prepared and signed.
In March 2001, our Board approved a voluntary stock option cancel and re-grant program for employees (the “Cancel/Re-grant Program”). The Cancel/Re-grant Program provided employees with the opportunity to cancel all of their existing and outstanding stock options granted to them on or after September 30, 2000 and before March 30, 2001, and some or all of their existing and outstanding stock options granted to them prior to September 30, 2000, in exchange for a new option grant for an equal number of shares granted at a future date. The new options were issued six months and one day after the cancellation date, March 30, 2001, and the exercise price of the new options was based on the trading price of our common stock on the date of the new option grants.
One of the objectives of the Equity Award Review was to verify whether the unanimous written consent actions accurately identified the dates on which the Compensation Committee informally approved the option awards. For a number of the unanimous written consent actions, we were able to verify that the date reflected in the document was the date on which the Compensation Committee members informally approved the option grant. However, as to some of the unanimous written consent actions, we were unable to verify that the grant dates reflected in the approval documentation was the date for which the approval had occurred. When we could not verify the grant date reflected in a unanimous written consent action was the date on which it was approved through contemporaneous documents, we made measurement date adjustments based on the best available evidence such as fax dates on unanimous written consents and e-mail correspondence that supported the proper measurement date. This resulted in measurement date changes to 17 grant dates.
In November 2003, our current CEO, Eric DeMarco, commenced employment as the President of WFI. Shortly thereafter, in December 2003, our former Chief Financial Officer, Terry Ashwill, left the Company. In April 2004, Mr. DeMarco became CEO and the prior CEO, Masood Tayebi, became the Executive Chairman of our Board of Directors. In April 2004, the additional members of our executive team were hired, which included a new Chief Financial Officer, Deanna Lund, and new General Counsel, James Edwards. Shortly thereafter, other positions such as Corporate Controller, Vice President of
Human Resources, and Stock Administrator were also hired, replacing the former employees in those positions.
The new executive management team engaged in an overall review of our processes and controls and made improvements where deemed necessary. Our stock option granting processes and procedures were among the areas to which the new management team made improvements. Thus, shortly after April 2004, the processes were formalized and a consistent procedure was implemented for the CEO Award Grants and grants made by the Compensation Committee.
We believe that the Equity Award Review has confirmed that our equity granting processes and practices in effect since April 2004 are sound and have been consistently followed. The Equity Award Review did not identify any measurement date adjustments required under APB 25 for grants made since November 2003, although it did find minor administrative errors that have resulted in immaterial adjustments aggregating approximately $50,000 for grants during the period from 2004 through 2006.
In January 2007, for various business reasons, we made the decision to discontinue the issuance of stock options as a broad-based form of incentive compensation. Instead, we have begun using other forms of equity-based incentives such as restricted stock or restricted stock units on a limited basis.
Adjustments to Measurement Dates
As a result of the Equity Award Review, we determined under the criteria set forth in APB 25 that option grants covering a total of 15.2 million of the shares of our common stock require measurement date adjustments. For reasons that fell into four categories, we concluded that the measurement dates originally used for those option grants did not meet the criteria to establish a measurement date, as set forth in APB 25. For some of those grants, more than one reason applied. The four categories are:
·Lack of Contemporaneous Documentation.The Equity Award Review identified a number of grants for which we have been unable to locate contemporaneous documentation confirming that either a Compensation Committee approval occurred or the CEO Award Grants occurred on the indicated grant date. We identified grants requiring measurement date adjustments under the criteria of APB 25 when we were unable to locate contemporaneous documentation confirming that (1) a meeting occurred on the grant date, (2) the CEO approved the grant on the grant date, (3) the Compensation Committee approved the grant on the grant date or (4) the identification of employee-recipients and grant amounts were finalized by the grant date. The affected grants involved options allowing the purchase of 3.7 million shares of our common stock. Of these options, options to purchase 0.5 million shares were granted to Executive Officers, options to purchase 60,000 shares were granted to three of our current Directors and options to purchase 3.1 million shares were granted to other employees. Adjustments to the APB 25 measurement dates for the grants covered by these grants resulted in the recording of additional deferred compensation of $25.9 million, and amortization of stock-based compensation expense of $22.4 million, with the remaining $3.5 million eliminated due to forfeitures and terminations.
·Date Selection/Indications of Other Dates. For twelve grant dates, the Equity Award Review identified documents that indicated that the grant date for some options was selected with the benefit of hindsight after the date indicated on the unanimous written consent or after the CEO authorization form documenting the approval of those options. The affected awards on these twelve grant dates involved option grants covering 7.0 million shares. Of these option grants, options to purchase 1.3 million shares were granted to Executive Officers and options to purchase 5.7 million shares were granted to other employees. Adjustments to the APB 25 measurement dates for these grants resulted in the recording of additional deferred compensation of $13.1 million and amortization of stock-based compensation expense of $9.9 million, with the remaining $3.2 million eliminated due to forfeitures and terminations. Each of the twelve grant dates were on dates when the closing price of our common stock was at or near the lowest price experienced during the previous 7 weeks or earlier.
54
·Subsequent Allocations. In 1999, 2000, 2001, 2002 and 2003, we made large, broad-based grants of stock options covering a substantial percentage of our employees. With respect to seven of the broad-based grant dates, the Equity Award Review identified that we had not completed allocations of options to individual employees by the time the grant was approved by Compensation Committee. The affected awards on these seven grant dates involved option grants covering 4.2 million shares. Of these option awards, options to purchase 0.2 million shares were granted to Executive Officers and options to purchase 4.0 million shares were granted to other employees. Adjustments to the APB 25 measurement dates for these grants resulted in the recording of additional deferred compensation of $23.8 million and amortization of stock-based compensation expense of $17.5 million, with the remaining $6.3 million eliminated due to forfeitures and terminations.
·Pre-Hire Grants. We made certain grants in connection with offers of employment to new employees were made on grant dates that preceded the employee’s hire date. These grants involved options to purchase a total of 0.7 million shares. Of these option grants, options to purchase 0.2 million shares were granted to Executive Officers and options to purchase 0.5 million shares were granted to other employees. Adjustments to the APB 25 measurement dates for these grants resulted in the recording of additional deferred compensation of $7.9 million and amortization of stock-based compensation expense of $3.9 million, with the remaining $4.0 million eliminated due to forfeitures and terminations.
Other Adjustments
During the course of the Equity Award Review, we identified some instances in which adjustments to deferred compensation were required that were not related to changes in measurement dates for the following reasons:
·Non-Employee Grants. Certain grants made to consultants and board advisors under our incentive stock option plan, which allowed only grants to employees. These grants were accounted for under APB 25 as if they were proper incentive stock option awards. In some instances, individuals were added to our payroll, even though they were not employees. The affected awards involved options to purchase 0.3 million shares, of which options to purchase 75,000 shares were issued to one of our Directors prior to his joining our Board. To correctly account for these grants in accordance with SFAS 123 and EITF 96-18, “Accounting for Equity Instruments That Are Issued to Other Than Employees for Acquiring, or in conjunction with Selling, Goods or Services”, we recorded $3.6 million in additional deferred compensation during 1998 through 2003 and amortization of stock-based compensation expense of $3.6 million.
·Modifications of Existing Grants. With respect to 0.3 million option grants, modifications were made to employee stock options that were not accounted for in accordance with APB 25. The modifications included the extension of the post-service exercise period for vested stock options of terminated employees and the acceleration of vesting for an Executive Officer, which resulted in $0.1 million of additional deferred compensation and amortization of stock-based compensation expense. Adjustments to reflect the modification of terms in accordance with APB 25 resulted in the recording of $1.3 million in additional deferred compensation and amortization of stock-based compensation expense of $1.3 million, to properly account for these modifications.
We previously recorded stock-based compensation expenses in prior periods for certain former employees for whom, in connection with their terminations, the post-service exercise period for vested stock options was extended or of the vesting period of stock options was accelerated. Those charges were accounted for correctly pursuant to APB 25. However, as a result of adjustments made in the restatement, the previously-recorded deferred compensation charge was reduced by $0.4 million.
During the course of the Equity Award Review, we discovered that a former stock option administrator had engaged in a fraudulent scheme by which he misappropriated options to purchase more than 700,000 shares of stock. Ill-gotten gains from this scheme approximated $6.3 million, and we have
recorded an unauthorized issuance of common stock charge of $0.6 million and $5.7 million in 2002 and 2003, respectively, related to this theft.
Summary of Measurement Date Adjustments to Grants to Former Executive Officers and Related Party
The Equity Award Review identified option grants to former Executive Officers covering an aggregate of 2.2 million shares that required measurement date adjustments. The resulting aggregate gross increase in deferred compensation associated with these grants was $7.7 million, and the aggregate amortization of stock-based expense associated with these grants was $7.2 million, with the difference of $0.7 million eliminated due to forfeitures.
Neither of our co-founders, Dr. Massih Tayebi and Dr. Masood Tayebi, was awarded any grants of stock options. Throughout the periods covered by the Equity Award Review, the Tayebi family (including Massih and Masood Tayebi), owned between 30 percent to 40 percent of our outstanding capital stock. Thus, none of the grants requiring measurement date adjustments was made to our co-founders. However, there were grants requiring measurement date adjustments that were issued to the brother of our co-founders, Jay Tayebi, who was the former general manager of our Mexican operation. Options to purchase 530,597 shares that were granted to Jay Tayebi required measurement date adjustments, resulting in increased gross deferred compensation of $6.3 million and amortization of stock-based compensation expense of $5.4 million, with the difference of $0.9 million eliminated due to forfeitures. A total of 2,640 of the shares requiring measurement date adjustments were sold by Mr. Tayebi, of which $9,000 of the profit realized from the sale of those shares was related to the difference in the remeasured price compared to the original option grant price.
The financial statement impact of measurement date adjustments to grants to former Executive Officers is as follows:
· Terry Ashwill, former Executive Vice President and Chief Financial Officer (September 2000 to December 2003)—grants that in the aggregate allowed the purchase of 562,330 shares were found to require measurement date adjustments resulting in increased gross deferred compensation of $1.0 million and amortization of stock-based compensation expense of $0.6 million, with the difference of $0.3 million eliminated due to forfeitures. A total of 404,448 of the shares requiring measurement date adjustments were sold by Mr. Ashwill, of which $0.7 million of the profit realized from the sale of those shares was related to the difference in the remeasured price compared to the original option grant price.
· Frankie Farjood, former Senior Vice President Deployment (November 1999 to July 2004)—grants that in the aggregate allowed the purchase of 287,743 shares were found to require measurement date adjustments resulting in increased gross deferred compensation of $1.0 million and amortization of stock based compensation of $1.0 million. A total of 170,000 of the shares requiring measurement date adjustments were sold by Mr. Farjood, of which $0.5 million of the profit realized from the sale of those shares was related to the difference in the remeasured price compared to the original option grant price.
· Scott Fox, former President Network Management and Operations (May 1999 to June 2002)—(part time employee June 2002—April 2005) grants that in the aggregate allowed the purchase of 55,014 shares were found to require measurement date adjustments resulting in increased gross deferred compensation of $0.1 million and amortization of stock based compensation of $0.1 million. A total of 53,621 of the shares requiring measurement date adjustments was sold by Mr. Fox, of which $40,000 of the profit realized from the sale of those shares was related to the difference in the remeasured price compared to the original option grant price.
· Farzad Ghassemi, former President of Wireless Network Services (February 1998 to June 2007)—grants that in the aggregate allowed the purchase of 194,591 shares were found to require
measurement date adjustments resulting in increased gross deferred compensation of $0.3 million and amortization of stock based compensation of $0.3 million. A total of 117,000 of the shares requiring measurement date adjustments were sold by Mr. Ghassemi, of which $0.1 million of the profit realized from the sale of those shares was related to the difference in the remeasured price compared to the original option grant price.
· Greg Jacobssen, former Executive Vice President of Wireless Network Services (July 2002 to January 2004)—grants that in the aggregate allowed the purchase of 60,000 shares were found to require measurement date adjustments resulting in increased gross deferred compensation of $40,000 and amortization of stock based compensation of $10,000, with the difference of $30,000 eliminated due to forefeitures. Mr. Jacobssen did not sell any of the options requiring measurement date adjustments.
· David Knutson, former Executive Vice President of Wireless Network Services (July 2003 to February 2006)—grants that in the aggregate allowed the purchase of 300,000 shares were found to require measurement date adjustments resulting in increased gross deferred compensation of $1.3 million and amortization of stock based compensation of $1.3 million. Mr. Knutson did not sell any of the options requiring measurement date adjustments.
· Thomas Munro, former Chief Financial Officer (July 1997 to September 2000) and former President (September 2000 to December 2002)—grants that in the aggregate allowed the purchase of 510,890 shares were found to require measurement date adjustments resulting in increased gross deferred compensation of $3.1 million and amortization of stock based compensation of $3.1 million. A total of 88,890 of the shares requiring measurement date adjustments were sold by Mr. Munro, of which $0.1 million of the profit realized from the sale of those shares was related to the difference in the remeasured price compared to the original option grant price.
· William Brad Weller, former General Counsel and Vice President Legal Affairs (September 1999 to December 2002)—grants that in the aggregate allowed the purchase of 153,636 shares were found to require measurement date adjustments resulting in increased gross deferred compensation of $1.0 million and amortization of stock based compensation of $0.8 million, with the difference of $0.3 million eliminated due to forfeitures. A total of 60,865 of the shares requiring measurement date adjustments were sold by Mr. Weller, of which $0.1 million of the profit realized from the sale of those shares was related to the difference in the remeasured price compared to the original option grant price.
No Affected Grants to Current Executive Officers
The Equity Award Review examined all option grants to current Executive Officers and concluded that no measurement date adjustments related to those option grants was required.
Aggregate Financial Statement Impact of the Measurement Date and Other Adjustments Identified in the Equity Award Review
The aggregate gross additional deferred compensation that we recorded for the years 1998 through 2003 as a result of information identified in the Equity Award Review is $75.0 million. The aggregate gross additional deferred compensation that we recorded for the years 2004 through 2005 of approximately $0.5 million was primarily as a result of reductions in deferred compensation to reflect reductions in our stock price for option grants that were repriced and required variable accounting treatment for grants that were issued prior to 2004. The aggregate gross additional deferred compensation for the years 1998 through 2005 does not reflect the elimination of $16.8 million in deferred compensation due to subsequent forfeitures related to employee terminations. In addition, the remaining amount of deferred compensation totaling $0.1 million at December 31, 2005 was eliminated in accordance with the provisions of
SFAS No. 123 (revised 2004), Share-Based Payment, or SFAS 123R, which we adopted effective January 1, 2006. After these reductions, we recorded net additional stock-based compensation expense of $58.2 million for the years 1998 through 2005 in connection with our Equity Award Review. After related tax adjustments of $9.6 million, the restatement resulted in total net adjustments to net income (loss) of $48.6 million for the years 1998 through 2005. These amounts do not include the unauthorized issuance of common stock charge of $0.6 million and $5.7 million in 2002 and 2003, respectively, related to misappropriated options by the Company’s former stock administrator described herein. The aggregate amount of the Equity Award Review including the misappropriated options is $64.5 million comprised of the $58.2 million in additional stock-based compensation expense and $6.3 million of a charge for unauthorized issuance of common stock. After aggregate other tax adjustments and income tax adjustments of $9.6 million, the restatement resulted in total net adjustments to net income (loss) of $54.9 million for the years 1998 through 2005. The adjustments did not affect our previously-reported revenue, cash, cash equivalents or marketable securities balances in any prior period.
As stated previously, we made measurement date adjustments based on the best available evidence such as fax dates on unanimous written consents and e-mail correspondence that supported what management believes to be the appropriate measurement date. However, we also prepared sensitivity analyses using alternative measurement dates for certain grants that had less certain evidenceexpertise to support a measurement date. If the alternative measurement dates were used, an aggregate $47.7 million of additional stock-based compensation expense would have been recorded compared to the $58.2 million we recorded.their mission-critical needs by leveraging our skills across these core service areas.
Related Tax Adjustments
In our restated financial statements for 1998, 1999, 2000 and 2001, we recorded income tax benefits of $0.5 million, $1.6 million, $3.5 million, and $7.3 million, respectively, with respect to additional stock-based compensation expense relating to U.S.-based income. At December 31, 2002, we had no additional net deferred tax assets for additional stock-based compensation expense as such amounts were offset by a valuation allowance. No tax benefits were recorded for additional stock-based compensation expense recorded during 2002 as such amounts were offset by a valuation allowance because we did not believe such additional deferred tax assets were more likely than not to be realized. At December 31, 2002, we concluded that a full valuation allowance against our deferred tax assets was appropriate as a result of our cumulative losses as of December 31, 2002, which caused a presumption that any deferred tax assets would be difficult to realize, and reversed the $4.2 million of deferred tax assets recognized in prior periods which were yet to be realized for tax purposes, thereby increasing tax expense by $4.2 million. We recorded an income tax benefit of $1.5 million in 2003 related to income tax benefits realized from employee stock option exercises in 2003 that reduced our tax liabilities. Prior to the restatement, such income tax benefits were credited to additional paid-in capital because there was no associated stock-based compensation expense related to such employee stock options. No income tax benefits were recorded for additional stock-based compensation in 2004 and 2005 because of our domestic tax losses prior to deductions related to employee stock options. As a result, the cumulative net income tax benefit we recorded through December 31, 2005 was $10.2 million. We also recorded net other non-income tax payroll adjustments of $0.6 million, resulting in total related tax adjustments of 9.6 million. The other non-income tax payroll expenses recorded were $1.0 million, $10.3 million, $1.6 million and $0.9 million for 1999, 2000, 2001, and 2002, respectively. As a result of the expiration of certain statutory periods, previously recorded non-income tax payroll expenses were reduced by $0.4 million, $12.2 million and $0.6 million in 2003, 2004, and 2005, respectively.
The Conduct Review
Background and Scope of Review
As described above, in February 2007, the Board appointed a Special Committee of the Board (the “Committee”) to review the adequacy of the Equity Award Review and the recommendations of management regarding historical option granting practices, and to make recommendations and findings regarding those practices and individual conduct. The Committee was not charged with making, and did not make, any evaluation of the accounting determinations or tax adjustments. The accounting determinations and related tax adjustments were evaluated by management and the Audit Committee of the Board of Directors. The Committee was comprised of a non-employee director who had not served on our Compensation Committee before 2005.
In connection with its review of the individual conduct of persons involved in the historical option granting practices (the “Conduct Review”), the Committee’s counsel considered information developed in the Equity Award Review, which it reviewed and tested. In addition, the Committee conducted its own separate review of the option granting practices during the tenure of current executive management team through additional interviews and document collection and review. The Committee also reported on other matters, including areas for further improvements in the stock option granting process and the controls surrounding that process. The Conduct Review was accomplished with the full support and cooperation of our Board, management and employees.
Conduct of Certain Former Executive Officers and Former Employees
Upon completion of the Conduct Review, the Committee concluded that certain former Executive Officers and other former employees participated in making improper option grants, including the selection of grant dates with the benefit of hindsight and in the delay in dating of otherwise approved option grants. The Committee concluded that certain of the former Executive Officers and other former employees appreciated the legal and accounting consequences of their actions. The Committee further recommended that we consider pursuing available remedies against the former Executive Officers, including potentially seeking disgorgement of option exercise proceeds related to options with adjusted measurement dates from certain former Executive Officers. None of the former Executive Officers or former employees identified by the Committee as having participated in grant date selection were employed by us at the time of the Committee’s findings, as all of them had previously resigned for reasons unrelated to the Equity Award Review or the Conduct Review.
Conduct of Current Executive Officers and Employees
Upon completion of the Conduct Review, the Committee concluded that none of the current Executive Officers or other current employees had participated in making improper option grants. To the contrary, the Special Committee concluded that current management proactively improved the processes of approving and granting stock options on its own initiative from the beginning of its tenure in 2004, and that the Committee has confidence in the integrity of current management. The Committee concluded that, although at times there were minor administrative errors and delays in option grants from 2004 through 2006 resulting in cumulative immaterial adjustments of approximately $50,000, there was no evidence that any members of current management had engaged in or benefited from any inappropriate option granting practices.
Conduct of the Compensation Committee
Since our IPO, the Compensation Committee has consisted at various times of two or three non-employee members of the Board. The members of the Compensation Committee with their respective periods of service were: Scott Anderson (August 1999—February 2002); Scot Jarvis (August 1999 to present); David Lee (June 2001 to February 2002); Bandal Carano (August 1999 to June 2001,
September 2001 to present); William Hoglund (May 2005 to present). Messrs. Anderson, Jarvis, Carano and Hoglund continue to serve on our Board.
As described above, the Compensation Committee approved stock option grants using two forms of authorization. First, on occasion, the Committee approved stock option grants at formal Committee meetings which typically were held quarterly. Second and more often, the Compensation Committee members held informal discussions with our then CEO—usually telephonically or via email—to determine whether option grants should be approved. Approval was documented through the use of unanimous written consent action forms which were prepared by management and transmitted to the Committee members, who signed them and returned them to then management. The unanimous written consent actions granted the options “as of” the date the Committee members informally approved the grants, which almost always was a date earlier than the date on which the forms were prepared and signed. Before November 2003, as demonstrated by a comparison of the “as of dates” on the unanimous written consent action forms and the fax header lines reflecting the dates on which the signed forms were returned: (1) the consent forms generally were sent to the Compensation Committee members for signature within days or, in some cases, weeks or months after the option grant date recorded in our books; (2) the consent forms occasionally were sent to and returned by the Committee members out of sequence; and (3) in 2001, grants reflecting an “as of” date that resulted in option awards priced at the lowest price in our history up to that point were approved in three separate unanimous written consent actions awarding grants to different individuals that followed the “as of” date of the grant by two weeks to three months. On one occasion this included a consent action form signed by an individual who was not a Compensation Committee member on the “as of” date of the grant. From November 2003 through 2006, the Compensation Committee continued to approve option grants informally and, later, document that approval in a unanimous written consent action, but the time lag between the date of the approval—the “as of date”—and the execution of the unanimous written consent actions was reduced to days rather than weeks or months. After considering all of the information presented to the Special Committee, the Committee concluded that the members of the Compensation Committee were entitled to rely upon our option granting processes and that the Committee has confidence in their ability to continue to serve on our Board and any committees thereof.
Conclusion
With the completion of the review by the Committee, we are evaluating our available remedies arising from the inappropriate granting practices, but we have not yet made any decisions in that regard.
Restatement of Our Consolidated Financial Statements
As a result of the findings of Equity Award Review, our consolidated financial statements for the years ended December 31, 2004 and 2005 have been restated. The restated consolidated financial statements include unaudited financial information for interim periods of 2005 consistent with Article 10-01 of Regulation S-X. We also recorded additional stock-based compensation expense and associated tax adjustments affecting our previously-reported financial statements for 1998 through 2003, the effects of which are summarized in cumulative adjustments to our additional paid-in capital, deferred compensation and accumulated deficit accounts as of December 31, 2003, in the amounts of $56.1 million, $6.6 million and $62.9 million, respectively, all of which are recorded in the Consolidated Statements of Shareholders’ Equity, included in Part IV, Item 15 of this Report.
The following table summarizes the additional deferred compensation recorded on an annual basis as a result of the equity award review, categorized by each of the three reasons that led to the determination that particular option grants failed to meet the measurement date criteria of APB 25, together with the other adjustments made that were not related to changes in measurement dates:
| | | | | | | | | | | | | | Cumulative | | | | | | Cumulative | |
| | | | | | | | | | | | | | Amount | | Years ended | | Amount | |
| | Years Ended December 31, | | December 31, | | December 31, | | December 31, | |
| | 1998 | | 1999 | | 2000 | | 2001 | | 2002 | | 2003 | | 2003 | | 2004 | | 2005 | | 2005 | |
| (in millions) | |
Deferred Compensation Adjustments: | | | | | | | | | | | | | | | | | | | | | | | | | | | | | | | | | |
No contemporaneous
documentation | | | $ 3.2 | | | $ 4.6 | | $ 17.4 | | $ 0.0 | | | $ — | | | $ 0.7 | | | $ 25.9 | | | | $ 0.0 | | | | $ 0.0 | | | | $ 25.9 | | |
Date selection/Indication of other
date | | | — | | | — | | 5.2 | | 4.3 | | | 3.1 | | | 1.0 | | | 13.6 | | | | (0.2 | ) | | | (0.3 | ) | | | 13.1 | | |
Subsequent allocation | | | — | | | 1.2 | | 16.8 | | — | | | — | | | 5.8 | | | 23.8 | | | | — | | | | — | | | | 23.8 | | |
Start date issues | | | 0.2 | | | 4.3 | | 2.2 | | 0.1 | | | 0.3 | | | 0.4 | | | 7.5 | | | | 0.1 | | | | 0.4 | | | | 8.0 | | |
Other adjustments(a) | | | 0.1 | | | 2.8 | | 1.7 | | (1.3 | ) | | 0.1 | | | 0.3 | | | 3.7 | | | | 0.5 | | | | 0.0 | | | | 4.2 | | |
Subtotal | | | $ 3.5 | | | $ 12.9 | | $ 43.3 | | $ 3.1 | | | $ 3.5 | | | $ 8.2 | | | $ 74.5 | | | | $ 0.4 | | | | $ 0.1 | | | | $ 75.0 | | |
Unauthorized issuance of stock by administrator | | | $ — | | | $ — | | $ — | | $ — | | | $ 0.6 | | | $ 5.7 | | | $ 6.3 | | | | $ — | | | | $ — | | | | $ 6.3 | | |
Total | | | $ 3.5 | | | $ 12.9 | | $ 43.3 | | $ 3.1 | | | $ 4.1 | | | $ 13.9 | | | $ 80.8 | | | | $ 0.4 | | | | $ 0.1 | | | | $ 81.3 | | |
(a)Represents adjustments related to modifications that were made to employee stock options which included the extension of the post-service exercise period for vested stock options of terminated employees and the acceleration of vesting.
The following table summarizes the activity in additional deferred compensation as well as additional stock-based compensation expense and related tax adjustments on an annual basis. This table does not include previously-recorded activity in deferred compensation or stock-based compensation expense:
| | | | | | | | | | | | | | Cumulative | | | | | | Cumulative | |
| | | | | | | | | | | | | | Amount | | Years Ended | | Amount | |
| | Years Ended December 31, | | December 31, | | December 31, | | December 31, | |
| | 1998 | | 1999 | | 2000 | | 2001 | | 2002 | | 2003 | | 2003 | | 2004 | | 2005 | | 2005 | |
| | (in millions) | |
Activity in Deferred Compensation | | | | | | | | | | | | | | | | | | | | | | | | | | |
Deferred compensation
adjustment—beginning balance | | $ — | | $ 2.2 | | $ 10.2 | | $ 38.3 | | $ 7.0 | | $ 2.9 | | | $ — | | | $ 6.6 | | $ 3.2 | | | $ — | | | |
Additional deferred compensation recorded | | 3.5 | | 12.9 | | 43.3 | | 3.1 | | 3.5 | | 8.2 | | | 74.5 | | | 0.4 | | 0.1 | | | 75.0 | | | |
Additional stock-based
compensation expense amortization(a) | | (1.3 | ) | (4.4 | ) | (11.3 | ) | (26.6 | ) | (6.1 | ) | (3.7 | ) | | (53.4 | ) | | (2.2 | ) | (2.6 | ) | | (58.2 | ) | | |
Elimination due to employee terminations | | — | | (0.5 | ) | (3.9 | ) | (7.8 | ) | (1.5 | ) | (0.8 | ) | | (14.5 | ) | | (1.6 | ) | (0.7 | ) | | (16.8 | ) | | |
Additional deferred
compensation—ending balance | | $ 2.2 | | $ 10.2 | | $ 38.3 | | $ 7.0 | | $ 2.9 | | $ 6.6 | | | $ 6.6 | | | $ 3.2 | | $ (0.0 | ) | | $ (0.0 | ) | | |
Additional Stock-Based Compensation Expense and Related Tax Adjustments | | | | | | | | | | | | | | | | | | | | | | | | | | |
Additional stock-based
compensation expense | | $ 1.3 | | $ 4.4 | | $ 11.3 | | $ 26.6 | | $ 6.1 | | $ 3.7 | | | $ 53.4 | | | $ 2.2 | | $ 2.6 | | | 58.2 | | | |
Other tax adjustments(b) | | — | | 1.0 | | 10.3 | | 1.6 | | 0.9 | | (0.4 | ) | | 13.4 | | | (12.2 | ) | (0.6 | ) | | 0.6 | | | |
Additional operating expenses | | 1.3 | | 5.4 | | 21.6 | | 28.2 | | 7.0 | | 3.3 | | | 66.8 | | | (10.0 | ) | 2.0 | | | 58.8 | | | |
Income tax expense (benefit) | | (0.5 | ) | (1.6 | ) | (3.5 | ) | (7.3 | ) | 4.2 | | (1.5 | ) | | (10.2 | ) | | — | | — | | | (10.2 | ) | | |
Net adjustment | | $ 0.8 | | $ 3.8 | | $ 18.1 | | $ 20.9 | | $ 11.2 | | $ 1.8 | | | $ 56.6 | | | $ (10.0 | ) | $ 2.0 | | | $ 48.6 | | | |
(a)The increase in stock-based compensation expense in 2001 primarily reflects the cancellations from our Stock Option Cancel/Regrant Program in March 2001 which resulted in the remaining unamortized deferred compensation being expensed upon cancellation. In addition, the remaining amount of deferred compensation totaling $0.1 million at December 31, 2005 was
eliminated in accordance with the provisions of SFAS No. 123 (revised 2004), Share-Based Payment, or SFAS 123R, which we adopted effective January 1, 2006.
(b) Reflects the accrual of payroll related tax adjustments in 1999 through 2002, and a reduction of such accruals due to the expiration of statutory requirements in 2003 through 2005.
The following table summarizes the impact of the additional stock-based compensation expense resulting from the review of our equity award practices on our previously-reported stock-based compensation expense on an annual basis, excluding the impact of an additional $0.6 million and $5.7 million in 2002 and 2003, respectively, related to the theft of shares by the Company’s former stock administrator:
| | Stock-Based Compensation Expense | |
| | As Reported | | Adjustments | | As Restated | |
| | (in millions) | |
Year ended December 31, 2005 | | | $ 0.1 | | | | $ 2.6 | | | | $ 2.7 | | |
Year ended December 31, 2004 | | | 0.2 | | | | 2.2 | | | | 2.4 | | |
Year ended December 31, 2003 | | | 6.3 | | | | 3.7 | | | | 10.0 | | |
Year ended December 31, 2002 | | | — | | | | 6.1 | | | | 6.1 | | |
Year ended December 31, 2001 | | | — | | | | 26.6 | | | | 26.6 | | |
Year ended December 31, 2000 | | | — | | | | 11.3 | | | | 11.3 | | |
Year ended December 31, 1999 | | | — | | | | 4.4 | | | | 4.4 | | |
Year ended December 31, 1998 | | | — | | | | 1.3 | | | | 1.3 | | |
| | | $ 6.6 | | | | $ 58.2 | | | | $ 64.8 | | |
62
The following table presents the impact of the additional stock-based compensation expense-related adjustments and the discontinuance of our international businesses on our consolidated balance sheet as of December 31, 2002:
RECONCILIATION OF CONSOLIDATED BALANCE SHEET FOR 2002
(in millions)
| | | | Adjustment for | | | | | | | |
| | | | International | | As Restated for | | Adjustment for | | | |
| | | | Discontinued | | Discontinued | | Stock Based | | | |
| | As Reported | | Operations | | Operations | | Expenses | | As Restated | |
Assets | | | | | | | | | | | | | | | | | | | | | |
Current assets: | | | | | | | | | | | | | | | | | | | | | |
Cash and cash equivalents | | | $ | 98.1 | | | | $ | (1.1 | ) | | | $ | 97.0 | | | | $ | — | | | | $ | 97.0 | | |
Accounts receivable, net | | | 50.9 | | | | (4.7 | ) | | | 46.2 | | | | — | | | | 46.2 | | |
Accounts receivable—related party | | | 0.4 | | | | (0.4 | ) | | | 0.0 | | | | — | | | | — | | |
Prepaid expenses | | | 1.6 | | | | (0.1 | ) | | | 1.5 | | | | — | | | | 1.5 | | |
Employee loans and advances | | | 0.2 | | | | (0.1 | ) | | | 0.1 | | | | — | | | | 0.1 | | |
Other current assets | | | 2.1 | | | | (0.8 | ) | | | 1.3 | | | | — | | | | 1.3 | | |
Current assets of discontinued operations | | | 18.7 | | | | 8.2 | | | | 26.9 | | | | — | | | | 26.9 | | |
Total current assets | | | 172.0 | | | | 1.0 | | | | 173.0 | | | | — | | | | 173.0 | | |
Property and equipment, net | | | 11.7 | | | | (1.1 | ) | | | 10.6 | | | | — | | | | 10.6 | | |
Goodwill | | | 25.5 | | | | — | | | | 25.5 | | | | — | | | | 25.5 | | |
Deferred tax assets, net | | | 5.4 | | | | — | | | | 5.4 | | | | — | | | | 5.4 | | |
Investments in unconsolidated affiliates | | | 4.1 | | | | — | | | | 4.1 | | | | — | | | | 4.1 | | |
Other assets | | | 0.3 | | | | — | | | | 0.3 | | | | — | | | | 0.3 | | |
Other assets of discontinued operations | | | 1.3 | | | | 1.1 | | | | 2.4 | | | | — | | | | 2.4 | | |
Total assets | | | $ | 220.3 | | | | $ | 1.0 | | | | $ | 221.3 | | | | $ | — | | | | $ | 221.3 | | |
Liabilities and Stockholders’ Equity | | | | | | | | | | | | | | | | | | | | | |
Current liabilities: | | | | | | | | | | | | | | | | | | | | | |
Accounts payable | | | $ | 9.9 | | | | $ | (1.3 | ) | | | $ | 8.6 | | | | $ | — | | | | $ | 8.6 | | |
Accrued expenses | | | 15.0 | | | | (2.6 | ) | | | 12.4 | | | | 13.7 | | | | 26.1 | | |
Billings in excess of costs on completed contracts | | | 6.2 | | | | (0.2 | ) | | | 6.0 | | | | — | | | | 6.0 | | |
Tax contingencies | | | 2.0 | | | | — | | | | 2.0 | | | | — | | | | 2.0 | | |
Accrual for unused office space | | | 1.3 | | | | — | | | | 1.3 | | | | — | | | | 1.3 | | |
Income taxes payable | | | — | | | | 1.0 | | | | 1.0 | | | | — | | | | 1.0 | | |
Capital lease obligations | | | 2.3 | | | | (0.1 | ) | | | 2.2 | | | | — | | | | 2.2 | | |
Current liabilities of discontinued operations | | | 20.2 | | | | 4.2 | | | | 24.4 | | | | | | | | 24.4 | | |
Total current liabilities | | | 56.9 | | | | 1.0 | | | | 57.9 | | | | 13.7 | | | | 71.6 | | |
Capital lease obligations, net of current portion | | | 0.6 | | | | — | | | | 0.6 | | | | — | | | | 0.6 | | |
Accrual for unused office space, net of current portion | | | 7.6 | | | | — | | | | 7.6 | | | | — | | | | 7.6 | | |
Other liabilities | | | 1.5 | | | | — | | | | 1.5 | | | | — | | | | 1.5 | | |
Total liabilities | | | 66.6 | | | | 1.0 | | | | 67.6 | | | | 13.7 | | | | 81.3 | | |
Stockholders’ equity: | | | | | | | | | | | | | | | | | | | | | |
Preferred stock | | | — | | | | — | | | | — | | | | — | | | | — | | |
Common stock | | | — | | | | — | | | | — | | | | | | | | — | | |
Additional paid-in capital | | | 266.6 | | | | — | | | | 266.6 | | | | 44.5 | | | | 311.1 | | |
Deferred compensation | | | | | | | | | | | — | | | | (2.9 | ) | | | (2.9 | ) | |
Accumulated deficit | | | (109.9 | ) | | | — | | | | (109.9 | ) | | | (55.3 | ) | | | (165.2 | ) | |
Accumulated other comprehensive
loss | | | (3.0 | ) | | | — | | | | (3.0 | ) | | | — | | | | (3.0 | ) | |
Total stockholders’ equity | | | 153.7 | | | | — | | | | 153.7 | | | | (13.7 | ) | | | 140.0 | | |
Total liabilities and stockholders’ equity | | | $ | 220.3 | | | | $ | 1.0 | | | | $ | 221.3 | | | | $ | (0.0 | ) | | | $ | 221.3 | | |
63
The following table presents the impact of the additional stock-based compensation expense-related adjustments as well as the discontinuance of our international businesses on our previously-reported consolidated statement of operations for the years ended December 31, 2002:
RECONCILIATION OF CONSOLIDATED STATEMENT OF OPERATIONS FOR 2002
(in millions, except per share data)
| | As Reported | | Adjustment for
International
Discontinued
Operations | | As Restated for
Discontinued
Operations | | Adjustment for
Stock Based
Expenses | | As Restated | |
Revenues | | | $ | 170.4 | | | | $ | (14.7 | ) | | | $ | 155.7 | | | | $ | — | | | | $ | 155.7 | | |
Cost of revenues | | | 115.7 | | | | (10.9 | ) | | | 104.8 | | | | 3.4 | | | | 108.2 | | |
Gross profit | | | 54.7 | | | | (3.8 | ) | | | 50.9 | | | | (3.4 | ) | | | 47.5 | | |
Selling, general and administrative expenses | | | 47.6 | | | | (7.5 | ) | | | 40.1 | | | | 3.0 | | | | 43.1 | | |
Unauthorized issuance of stock option expense | | | — | | | | — | | | | — | | | | 0.6 | | | | 0.6 | | |
Impairment of goodwill | | | 14.6 | | | | (14.6 | ) | | | — | | | | — | | | | — | | |
Other asset impairment and other charges, net | | | 20.4 | | | | (5.3 | ) | | | 15.1 | | | | — | | | | 15.1 | | |
Operating income (loss) | | | (27.9 | ) | | | 23.6 | | | | (4.3 | ) | | | (7.0 | ) | | | (11.3 | ) | |
Interest income (expense), net | | | (0.9 | ) | | | 0.1 | | | | (0.8 | ) | | | — | | | | (0.8 | ) | |
Foreign currency gain (loss) | | | (0.5 | ) | | | 0.5 | | | | — | | | | — | | | | — | | |
Impairment of investment in unconsolidated affiliate and other income (expenses), net | | | 0.1 | | | | 0.1 | | | | 0.2 | | | | — | | | | 0.2 | | |
Total other income (expense) | | | (1.3 | ) | | | 0.7 | | | | (0.6 | ) | | | — | | | | (0.6 | ) | |
Income (loss) from continuing operations before cumulative and cumulative effect of change in accounting principle | | | (29.2 | ) | | | 24.3 | | | | (4.9 | ) | | | (7.0 | ) | | | (11.9 | ) | |
Provision (benefit) for income taxes | | | 11.1 | | | | 0.1 | | | | 11.2 | | | | 4.2 | | | | 15.4 | | |
Income (loss) from continuing operations before cumulative effect of change in accounting principle | | | (40.3 | ) | | | 24.2 | | | | (16.1 | ) | | | (11.2 | ) | | | (27.3 | ) | |
Loss from discontinued operations | | | (17.4 | ) | | | (24.2 | ) | | | (41.6 | ) | | | (0.6 | ) | | | (42.2 | ) | |
Cumulative effect of change in accounting principle | | | (16.1 | ) | | | — | | | | (16.1 | ) | | | — | | | | (16.1 | ) | |
Net income (loss) | | | $ | (73.8 | ) | | | $ | — | | | | $ | (73.8 | ) | | | $ | (11.8 | ) | | | $ | (85.6 | ) | |
Net income (loss) from continuing operations per share before cumulative effect of change in accounting principle | | | | | | | | | | | | | | | | | | | | | |
Basic | | | $ | (0.84 | ) | | | | | | | $ | (0.34 | ) | | | | | | | $ | (0.57 | ) | |
Diluted | | | $ | (0.84 | ) | | | | | | | $ | (0.34 | ) | | | | | | | $ | (0.57 | ) | |
Loss from discontinued operations | | | | | | | | | | | | | | | | | | | | | |
Basic | | | $ | (0.36 | ) | | | | | | | $ | (0.86 | ) | | | | | | | $ | (0.88 | ) | |
Diluted | | | $ | (0.36 | ) | | | | | | | $ | (0.86 | ) | | | | | | | $ | (0.88 | ) | |
Cumulative effect of change in accounting principle, per share | | | | | | | | | | | | | | | | | | | | | |
Basic | | | $ | (0.33 | ) | | | | | | | $ | (0.33 | ) | | | | | | | $ | (0.34 | ) | |
Diluted | | | $ | (0.33 | ) | | | | | | | $ | (0.33 | ) | | | | | | | $ | (0.34 | ) | |
Net income (loss), per share | | | | | | | | | | | | | | | | | | | | | |
Basic | | | $ | (1.53 | ) | | | | | | | $ | (1.53 | ) | | | | | | | $ | (1.78 | ) | |
Diluted | | | $ | (1.53 | ) | | | | | | | $ | (1.53 | ) | | | | | | | $ | (1.78 | ) | |
Weighted average common shares outstanding: | | | | | | | | | | | | | | | | | | | | | |
Basic | | | 48.1 | | | | | | | | 48.1 | | | | | | | | 48.1 | | |
Diluted | | | 48.1 | | | | | | | | 48.1 | | | | | | | | 48.1 | | |
The following table presents details of the total stock-based compenstion expense and unauthorized issuance of stock (excluding the impact of other tax and income tax adjustments) that is included in each functional line item in the consolidated statement of operations.
Supplemental Data on Stock-Based Compensation Expense | | | | | | | | | | | | | | | | | | | | | |
Cost of revenue | | | $ | — | | | | $ | — | | | | $ | — | | | | $ | 2.9 | | | | $ | 2.9 | | |
Selling, general and administrative | | | | | | | | | | | — | | | | 2.6 | | | | 2.6 | | |
Unauthorized issuance of stock option expense | | | — | | | | — | | | | — | | | | 0.6 | | | | 0.6 | | |
| | | — | | | | — | | | | — | | | | 6.1 | | | | 6.1 | | |
Discontinued operations | | | — | | | | — | | | | — | | | | 0.6 | | | | 0.6 | | |
Total | | | $ | — | | | | $ | — | | | | $ | — | | | | $ | 6.7 | | | | $ | 6.7 | | |
The following table presents details of the non-income tax payroll related expense (credit) that is included in each functional line item in the consolidated statement of operations:
Supplemental Data on Non-Income Tax Payroll Expense | | | | | | | | | | | | | | | | | | | | | |
Cost of revenue | | | $ | — | | | | $ | — | | | | $ | — | | | | $ | 0.5 | | | | $ | 0.5 | | |
Selling, general and administrative | | | — | | | | — | | | | — | | | | 0.4 | | | | 0.4 | | |
| | | — | | | | — | | | | — | | | | 0.9 | | | | 0.9 | | |
Discontinued operations | | | — | | | | — | | | | — | | | | — | | | | — | | |
Total | | | $ | — | | | | $ | — | | | | $ | — | | | | $ | 0.9 | | | | $ | 0.9 | | |
64
The following table presents the impact of the additional stock-based compensation expense-related adjustments and the discontinuance of our international businesses on our consolidated balance sheet as of December 31, 2003:
RECONCILIATION OF CONSOLIDATED BALANCE SHEET FOR 2003
(in millions)
| | | | Adjustment for | | | | | | | |
| | | | International | | As Restated for | | Adjustment for | | | |
| | | | Discontinued | | Discontinued | | Stock Based | | | |
| | As Reported | | Operations | | Operations | | Expenses | | As Restated | |
Assets | | | | | | | | | | | | | | | | | | | | | |
Current assets: | | | | | | | | | | | | | | | | | | | | | |
Cash and cash equivalents | | | $ | 76.8 | | | | $ | (1.0 | ) | | | $ | 75.8 | | | | $ | — | | | | $ | 75.8 | | |
Short-term investments | | | 35.1 | | | | | | | | 35.1 | | | | — | | | | 35.1 | | |
Accounts receivable, net | | | 69.0 | | | | (10.6 | ) | | | 58.4 | | | | — | | | | 58.4 | | |
Accounts receivable—related party | | | 0.2 | | | | | | | | 0.2 | | | | — | | | | 0.2 | | |
Prepaid expenses | | | 1.9 | | | | (0.2 | ) | | | 1.7 | | | | — | | | | 1.7 | | |
Employee loans and advances | | | 0.1 | | | | (0.1 | ) | | | 0.0 | | | | — | | | | — | | |
Other current assets | | | 2.0 | | | | (0.5 | ) | | | 1.5 | | | | — | | | | 1.5 | | |
Current assets of discontinued
operations | | | 31.0 | | | | 12.4 | | | | 43.4 | | | | — | | | | 43.4 | | |
Total current assets | | | 216.1 | | | | — | | | | 216.1 | | | | — | | | | 216.1 | | |
Property and equipment, net | | | 10.1 | | | | (0.8 | ) | | | 9.3 | | | | — | | | | 9.3 | | |
Goodwill | | | 31.0 | | | | — | | | | 31.0 | | | | — | | | | 31.0 | | |
Other intangibles, net | | | 1.9 | | | | — | | | | 1.9 | | | | — | | | | 1.9 | | |
Deferred tax assets | | | 14.6 | | | | — | | | | 14.6 | | | | — | | | | 14.6 | | |
Investments in unconsolidated affiliates | | | 4.0 | | | | — | | | | 4.0 | | | | — | | | | 4.0 | | |
Other assets | | | 0.3 | | | | (0.1 | ) | | | 0.2 | | | | — | | | | 0.2 | | |
Non current assets of discontinued
operations | | | 1.3 | | | | 0.9 | | | | 2.2 | | | | — | | | | 2.2 | | |
Total assets | | | $ | 279.3 | | | | $ | — | | | | $ | 279.3 | | | | $ | — | | | | $ | 279.3 | | |
Liabilities and Stockholders’ Equity | | | | | | | | | | | | | | | | | | | | | |
Current liabilities: | | | | | | | | | | | | | | | | | | | | | |
Accounts payable | | | $ | 11.5 | | | | $ | (1.5 | ) | | | $ | 10.0 | | | | $ | — | | | | $ | 10.0 | | |
Accrued expenses | | | 21.0 | | | | (4.9 | ) | | | 16.1 | | | | 13.4 | | | | 29.5 | | |
Billings in excess of costs on completed contracts | | | 6.8 | | | | (0.3 | ) | | | 6.5 | | | | — | | | | 6.5 | | |
Tax contingencies | | | 2.5 | | | | — | | | | 2.5 | | | | — | | | | 2.5 | | |
Accrual for contingent acquisition consideration | | | 3.8 | | | | — | | | | 3.8 | | | | — | | | | 3.8 | | |
Accrual for unused office space | | | 1.5 | | | | — | | | | 1.5 | | | | — | | | | 1.5 | | |
Income taxes payable | | | 1.1 | | | | (1.1 | ) | | | 0.0 | | | | — | | | | — | | |
Capital lease obligations | | | 0.5 | | | | — | | | | 0.5 | | | | — | | | | 0.5 | | |
Current liabilities of discontinued operations | | | 21.5 | | | | 7.8 | | | | 29.3 | | | | — | | | | 29.3 | | |
Total current liabilities | | | 70.2 | | | | — | | | | 70.2 | | | | 13.4 | | | | 83.6 | | |
Capital lease obligations, net of current portion | | | 0.2 | | | | — | | | | 0.2 | | | | — | | | | 0.2 | | |
Accrual for unused office space, net of current portion | | | 2.0 | | | | — | | | | 2.0 | | | | — | | | | 2.0 | | |
Other liabilities | | | 1.3 | | | | — | | | | 1.3 | | | | — | | | | 1.3 | | |
Other long-term liabilities of discontinued operations | | | 0.3 | | | | — | | | | 0.3 | | | | — | | | | 0.3 | | |
Total liabilities | | | 74.0 | | | | — | | | | 74.0 | | | | 13.4 | | | | 87.4 | | |
Stockholders’ equity: | | | | | | | | | | | | | | | | | | | | | |
Preferred stock | | | — | | | | — | | | | — | | | | — | | | | — | | |
Common stock | | | 0.1 | | | | — | | | | 0.1 | | | | — | | | | 0.1 | | |
Additional paid-in capital | | | 309.6 | | | | — | | | | 309.6 | | | | 56.1 | | | | 365.7 | | |
Deferred compensation | | | 0.0 | | | | — | | | | — | | | | (6.6 | ) | | | (6.6 | ) | |
Accumulated deficit | | | (100.4 | ) | | | — | | | | (100.4 | ) | | | (62.9 | ) | | | (163.3 | ) | |
Accumulated other comprehensive loss | | | (4.0 | ) | | | — | | | | (4.0 | ) | | | — | | | | (4.0 | ) | |
Total stockholders’ equity | | | 205.3 | | | | — | | | | 205.3 | | | | (13.4 | ) | | | 191.9 | | |
Total liabilities and stockholders’ equity | | | $ | 279.3 | | | | $ | — | | | | $ | 279.3 | | | | $ | (0.0 | ) | | | $ | 279.3 | | |
65
The following table presents the impact of the additional stock-based compensation expense-related adjustments as well as the discontinuance of our international businesses on our previously-reported consolidated statement of operations for the years ended December 31, 2003:
RECONCILIATION OF CONSOLIDATED STATEMENT OF OPERATIONS FOR 2003
(in millions, except per share data)
| | | | Adjustment for | | | | | | | |
| | | | International | | As Restated for | | Adjustment for | | | |
| | | | Discontinued | | Discontinued | | Stock Based | | | |
| | As Reported | | Operations | | Operations | | Expenses | | As Restated | |
Revenues | | | $ | 228.5 | | | | $ | (23.4 | ) | | | $ | 205.1 | | | | $ | — | | | | $ | 205.1 | | |
Cost of revenues | | | 161.9 | | | | (19.5 | ) | | | 142.4 | | | | 1.6 | | | | 144.0 | | |
Gross profit | | | 66.6 | | | | (3.9 | ) | | | 62.7 | | | | (1.6 | ) | | | 61.1 | | |
Selling, general and administrative expenses | | | 52.8 | | | | (6.5 | ) | | | 46.3 | | | | 1.2 | | | | 47.5 | | |
Unauthorized issuance of stock option expense | | | — | | | | — | | | | — | | | | 5.7 | | | | 5.7 | | |
Other asset impairment and other charges, net | | | 0.1 | | | | | | | | 0.1 | | | | — | | | | 0.1 | | |
Operating income (loss) | | | 13.7 | | | | 2.6 | | | | 16.3 | | | | (8.5 | ) | | | 7.8 | | |
Other income (expense): | | | | | | | | | | | | | | | | | | | | | |
Interest income (expense), net | | | 0.8 | | | | 0.1 | | | | 0.9 | | | | — | | | | 0.9 | | |
Foreign currency gain (loss) | | | (0.3 | ) | | | 0.3 | | | | — | | | | — | | | | — | | |
Impairment of investment in unconsolidated affiliate and other income (expenses), net | | | (0.3 | ) | | | 0.2 | | | | (0.1 | ) | | | — | | | | (0.1 | ) | |
Total other income (expense) | | | 0.2 | | | | 0.6 | | | | 0.8 | | | | — | | | | 0.8 | | |
Income (loss) from continuing operations before income taxes | | | 13.9 | | | | 3.2 | | | | 17.1 | | | | (8.5 | ) | | | 8.6 | | |
Provision (benefit) for income taxes | | | (0.4 | ) | | | 0.3 | | | | (0.1 | ) | | | (1.5 | ) | | | (1.6 | ) | |
Income (loss) from continuing operations | | | 14.3 | | | | 2.9 | | | | 17.2 | | | | (7.0 | ) | | | 10.2 | | |
Loss from discontinued operations | | | (4.8 | ) | | | (2.9 | ) | | | (7.7 | ) | | | (0.6 | ) | | | (8.3 | ) | |
Net income (loss) | | | $ | 9.5 | | | | $ | 0.0 | | | | $ | 9.5 | | | | $ | (7.6 | ) | | | $ | 1.9 | | |
Net income (loss) from continuing operations per share before cumulative effect of change in accounting principle | | | | | | | | | | | | | | | | | | | | | |
Basic | | | $ | 0.21 | | | | | | | | $ | 0.25 | | | | | | | | $ | 0.15 | | |
Diluted | | | $ | 0.19 | | | | | | | | $ | 0.23 | | | | | | | | $ | 0.14 | | |
Loss from discontinued operations | | | | | | | | | | | | | | | | | | | | | |
Basic | | | $ | (0.07 | ) | | | | | | | $ | (0.11 | ) | | | | | | | $ | (0.12 | ) | |
Diluted | | | $ | (0.07 | ) | | | | | | | $ | (0.11 | ) | | | | | | | $ | (0.11 | ) | |
Net income (loss), per share | | | | | | | | | | | | | | | | | | | | | |
Basic | | | $ | 0.14 | | | | | | | | $ | 0.14 | | | | | | | | $ | 0.03 | | |
Diluted | | | $ | 0.13 | | | | | | | | $ | 0.13 | | | | | | | | $ | 0.03 | | |
Weighted average common shares outstanding: | | | | | | | | | | | | | | | | | | | | | |
Basic | | | 68.4 | | | | | | | | 68.4 | | | | | | | | 68.4 | | |
Diluted | | | 73.5 | | | | | | | | 73.5 | | | | | | | | 73.5 | | |
The following table presents details of the total stock-based compenstion expense and unauthorized issuance of stock (excluding the impact of other tax and income tax adjustments) that is included in each functional line item in the consolidated statement of operations.
Supplemental Data on Stock-Based Compensation Expense | | | | | | | | | | | | | | | | | | | | | |
Cost of revenue | | | $ | — | | | | $ | — | | | | $ | — | | | | $ | 1.8 | | | | $ | 1.8 | | |
Selling, general and administrative | | | 6.3 | | | | | | | | 6.3 | | | | 1.4 | | | | 7.7 | | |
Unauthorized issuance of stock option expense | | | — | | | | — | | | | — | | | | 5.7 | | | | 5.7 | | |
| | | 6.3 | | | | — | | | | 6.3 | | | | 8.9 | | | | 15.2 | | |
Discontinued operations | | | — | | | | — | | | | — | | | | 0.6 | | | | 0.6 | | |
Total | | | $ | 6.3 | | | | $ | — | | | | $ | — | | | | $ | 9.5 | | | | $ | 15.8 | | |
The following table presents details of the non-income tax payroll related expense (credit) that is included in each functional line item in the consolidated statement of operations:
Supplemental Data on Non-Income Tax Payroll Expense | | | | | | | | | | | | | | | | | | | | | |
Cost of revenue | | | $ | — | | | | $ | — | | | | $ | — | | | | $ | (0.2 | ) | | | $ | (0.2 | ) | |
Selling, general and administrative | | | — | | | | — | | | | — | | | | (0.2 | ) | | | (0.2 | ) | |
| | | — | | | | — | | | | — | | | | (0.4 | ) | | | (0.4 | ) | |
Discontinued operations | | | — | | | | — | | | | — | | | | — | | | | — | | |
Total | | | $ | — | | | | $ | — | | | | $ | — | | | | $ | (0.4 | ) | | | $ | (0.4 | ) | |
66
The following table presents the impact of the additional stock-based compensation expense-related adjustments and the discontinuance of our international businesses on our consolidated balance sheet as of December 31, 2004:
RECONCILIATION OF CONSOLIDATED BALANCE SHEET FOR 2004
(in millions)
| | | | Adjustment for | | | | | | | |
| | | | International | | As Restated for | | Adjustment for | | | |
| | | | Discontinued | | Discontinued | | Stock Based | | | |
| | As Reported | | Operations | | Operations | | Expenses | | As Restated | |
Assets | | | | | | | | | | | | | | | | | | | | | |
Current assets: | | | | | | | | | | | | | | | | | | | | | |
Cash and cash equivalents | | | $ | 52.0 | | | | $ | (1.6 | ) | | | $ | 50.4 | | | | $ | — | | | | $ | 50.4 | | |
Short term investments | | | 7.6 | | | | — | | | | 7.6 | | | | — | | | | 7.6 | | |
Accounts receivable, net | | | 99.4 | | | | (16.1 | ) | | | 83.3 | | | | — | | | | 83.3 | | |
Deferred tax assets | | | 1.0 | | | | — | | | | 1.0 | | | | — | | | | 1.0 | | |
Prepaid expenses | | | 2.9 | | | | (0.1 | ) | | | 2.8 | | | | — | | | | 2.8 | | |
Employee loans and advances | | | 0.6 | | | | (0.1 | ) | | | 0.5 | | | | — | | | | 0.5 | | |
Other current assets | | | 2.2 | | | | (1.4 | ) | | | 0.8 | | | | — | | | | 0.8 | | |
Current assets of discontinued operations | | | 40.7 | | | | 19.3 | | | | 60.0 | | | | — | | | | 60.0 | | |
Total current assets | | | 206.4 | | | | — | | | | 206.4 | | | | — | | | | 206.4 | | |
Property and equipment, net | | | 12.5 | | | | (2.6 | ) | | | 9.9 | | | | — | | | | 9.9 | | |
Goodwill | | | 82.6 | | | | — | | | | 82.6 | | | | — | | | | 82.6 | | |
Other intangibles, net | | | 6.4 | | | | — | | | | 6.4 | | | | — | | | | 6.4 | | |
Deferred tax assets | | | 16.4 | | | | 0.1 | | | | 16.5 | | | | — | | | | 16.5 | | |
Investments in unconsolidated affiliates | | | 2.1 | | | | — | | | | 2.1 | | | | — | | | | 2.1 | | |
Other assets | | | 0.6 | | | | — | | | | 0.6 | | | | — | | | | 0.6 | | |
Non current assets of discontinued
operations | | | 3.7 | | | | 2.5 | | | | 6.2 | | | | — | | | | 6.2 | | |
Total assets | | | $ | 330.7 | | | | $ | — | | | | $ | 330.7 | | | | $ | — | | | | $ | 330.7 | | |
Liabilities and Stockholders’ Equity | | | | | | | | | | | | | | | | | | | | | |
Current liabilities: | | | | | | | | | | | | | | | | | | | | | |
Accounts payable | | | $ | 26.9 | | | | $ | (2.5 | ) | | | $ | 24.4 | | | | $ | — | | | | $ | 24.4 | | |
Accrued expenses | | | 5.9 | | | | (5.0 | ) | | | 0.9 | | | | 1.1 | | | | 2.0 | | |
Accrued compensation | | | 13.2 | | | | — | | | | 13.2 | | | | — | | | | 13.2 | | |
Accounts payable—related party | | | 1.0 | | | | — | | | | 1.0 | | | | — | | | | 1.0 | | |
Billings in excess of costs on completed contracts | | | 7.6 | | | | — | | | | 7.6 | | | | — | | | | 7.6 | | |
Tax contingencies | | | 1.7 | | | | — | | | | 1.7 | | | | — | | | | 1.7 | | |
Accrual for contingent acquisition consideration | | | 14.5 | | | | — | | | | 14.5 | | | | — | | | | 14.5 | | |
Accrual for unused office space | | | 0.9 | | | | — | | | | 0.9 | | | | — | | | | 0.9 | | |
Income taxes payable | | | 3.5 | | | | (2.4 | ) | | | 1.1 | | | | — | | | | 1.1 | | |
Capital lease obligations | | | 0.2 | | | | — | | | | 0.2 | | | | — | | | | 0.2 | | |
Current liabilities of discontinued
operations | | | 31.3 | | | | 9.9 | | | | 41.2 | | | | — | | | | 41.2 | | |
Total current liabilities | | | 106.7 | | | | — | | | | 106.7 | | | | 1.1 | | | | 107.8 | | |
Capital lease obligations, net of current
portion | | | 1.7 | | | | — | | | | 1.7 | | | | — | | | | 1.7 | | |
Other liabilities | | | 1.3 | | | | — | | | | 1.3 | | | | — | | | | 1.3 | | |
Other long-term liabilities of discontnued operations | | | 0.3 | | | | — | | | | 0.3 | | | | — | | | | 0.3 | | |
Total liabilities | | | 110.0 | | | | — | | | | 110.0 | | | | 1.1 | | | | 111.1 | | |
Stockholders’ equity: | | | | | | | | | | | | | | | | | | | | | |
Preferred stock | | | — | | | | — | | | | — | | | | — | | | | — | | |
Common stock, $.001 par value | | | 0.1 | | | | — | | | | 0.1 | | | | — | | | | 0.1 | | |
Additional paid-in capital | | | 319.8 | | | | — | | | | 319.8 | | | | 55.0 | | | | 374.8 | | |
Deferred compensation | | | — | | | | — | | | | — | | | | (3.2 | ) | | | (3.2 | ) | |
Accumulated deficit | | | (95.4 | ) | | | — | | | | (95.4 | ) | | | (52.9 | ) | | | (148.3 | ) | |
Accumulated other comprehensive loss | | | (3.8 | ) | | | — | | | | (3.8 | ) | | | — | | | | (3.8 | ) | |
Total stockholders’ equity | | | 220.7 | | | | — | | | | 220.7 | | | | (1.1 | ) | | | 219.6 | | |
Total liabilities and stockholders’ equity | | | $ | 330.7 | | | | $ | — | | | | $ | 330.7 | | | | $ | (0.0 | ) | | | $ | 330.7 | | |
67
Overview
Historically, the majority of our business was concentrated in the area of wireless network services, and our business operated in three reportable segments: wireless network services, government network services, and enterprise network services. InIn 2006, we were an independent provider of outsourced engineering and network deployment services, security systems engineering and integration services and other technical services for the wireless communications industry, the U.S. government, and enterprise customers.
In 2006 and 2007, we undertook a transformation strategy whereby we divested our wireless-related businesses and chose to aggressively pursue business with the federal government, primarily the U.S. Department of Defense, through strategic acquisitions and organic growth. These divestituresWe divested assets in our wireless network services segment and acquisitionsrenamed our enterprise network services segment "Public Safety and Security". Today, under the new corporate name of Kratos Defense & Security Solutions, Inc., we are described in more detail below.organized into two primary operating segments: Kratos Government Solutions (KGS) and Public Safety & Security (PSS).
In December 2005, our Board made the decision to exit our Mexican operations and certain of our other deployment businesses in South America. Prior to this decision, these operations had been reported in our Wireless Network Services segment. We determined that these operations met the criteria to be classified as held for sale. Accordingly, we reflected these operations as discontinued in accordance with SFAS No. 144, “Accounting"Accounting for the Impairment or Disposal of Long-Lived Assets.”" Our South American deployment operations were substantially shut down as of the end of 2005. Accordingly, all results for these operations for all periods presented have been reflected as discontinued.
On February 17, 2006, we entered into a definitive agreement to divest all of our operations in Mexico for total approximate cash consideration of $18.0 million, which approximated the net book value of the operations, including $13.2 million of liabilities associated with a loss contingency. The transaction closed on March 10, 2006. The transaction was structured as a sale of our subsidiaries in Mexico, and the purchase price consisted of $1.5 million in cash paid on February 17, 2006, plus a secured promissory note payable in installments through December 31, 2006. The note was secured by pledges of assets and a personal guaranty.
The final closing balance sheet as of February 17, 2006 resulted in net asset adjustments aggregating to a total approximate $18.9 million consideration, $1.5 million of which was paid on February 17, 2006, with the remaining $17.4 million payable by means of the promissory note in installments through December 31, 2006 with an interest rate of 7.5% per annum. On June 26, 2006, the Company entered into an Addendum with the buyer to finalize the closing net asset calculations, pursuant to which the parties agreed that the resulting total purchase price was $18.9 million. The Addendum provided for a conditional waiver that permitted the purchaser to make the payment due on August 17, 2006 by September 30, 2006, and for the installments due on November 17, 2006 and December 31, 2006 to be made on or before December 29, 2006. Failure to make the payments on such later dates would have resulted in a restoration of the original terms of the note. The first scheduled note payment of $3.3 million was received from the buyer on May 19, 2006, and the second scheduled note payment of $5.5 million was received in installments of $5.2 million on September 29, 2006 and $0.3 million on October 10, 2006. The remaining note receivable balance of $9.5 million was paid in December 2006. No amounts remain outstanding on the note receivable.
The purchaser, Sakoki LLC, was a newly-formed entity controlled by Massih Tayebi. Although Massih Tayebi has no current role with us, he was one of our co-founders and served as our Chief Executive Officer from inception in 1994 through September 2000, and as a director from inception through April 2002. In addition, as of July 31, 2007, Massih Tayebi ownsowned or controlscontrolled approximately 8.2% of the total voting power of our capital stock. He is also the brother of Masood Tayebi, who was the Chairman of our Board at the time of this transaction. Masood Tayebi is no longer on our Board and had no personal financial interest in the transaction and no role with the entity that purchased the Mexico operations.
On October 2, 2006, pursuant to a merger agreement, dated as of August 8, 2006, we consummated the acquisition of MRCMadison Research Corporation ("MRC") for $69.0 million in cash, subject to an adjustment paid in April 2007 based onwhich increased the closing final net asset value which was approximately $4.6 million resulting in a total purchase price ofto approximately $73.8 million, which includesincluding transaction costs of $0.2 million. Ten percent of the purchase price before adjustment, or $6.9 million, was being withheld as security for satisfaction of certain indemnification obligations and payable over eighteen months following the closing date of the merger pursuant to the terms of the merger agreement. In April 2007, $4.6 million of working capital adjustments and approximately $1.5 million of the holdback was released and paid to the former shareholders of MRC. In October 2007, a second scheduled holdback payment of $2.8 million was made. The remaining holdback payment of approximately $2.3 million is expected to be settled in April 2008 subject to the resolution of certain indemnification matters. The acquisition was funded by cash on hand and cash from our previous $85 million Credit Facility with Key Bank National Association.
The MRC acquisition is beinghas been accounted for using the purchase method of accounting in accordance with Statement of Financial Accounting Standards No. 141, “Business Combinations” (“"Business Combinations" ("SFAS 141”141"), whereby the total cost of the acquisition has been allocated to tangible and intangible assets acquired and liabilities assumed based upon a determination of fair values at the effective date of the acquisition. A valuation was performed by an independent appraiser to finalize the purchase price allocation based upon the fair value of the assets and liabilities acquired and the details of this valuation are included in Note 6 of our Consolidated Financial Statements.
On December 28, 2006, our Board approved a plan to divest portions of our business where critical mass hashad not been achieved. This plan involvesinvolved the divestiture of the our EMEA operations and our remaining South American operations. The EMEA operations were sold to LCC International, Inc. ("LCC") on March 9, 2007 for $4.0 million in cash, $3.3 million of which was received on that date. We have also received approximately $1.8 million from our EMEA operations prior and subsequent to the closing date as payment on outstanding intercompany debt. The balance of the $0.7 million sales price is being withheld as security for the satisfaction of certain indemnification obligations and is payable on a date that is the earlier of March 31, 2008 or the date that the buyer files its 10-K for the fiscal year ended December 31, 2007. All operating results discussed in resultsBased upon our review of operations relate to our continuing operationsthe most recently available financial statements of the buyer, as they existed onof December 31, 2006.2007, we have concern about their ability to pay this holdback, due to their available liquidity. We have recorded a reserve of $0.7 million for this receivable.
We recorded an impairment charge of $5.2 million in the fourth quarter of 2006 to reduce the current carrying value of theour South American operations to their estimated fair value based upon current indications of interest. On April 20, 2007, we entered into an Equity Purchase Agreement to sell all of the issued and outstanding equity of its interests of our wholly-owned subsidiary WFI de Brazil Techlogia en Telecomunicaciones LTDA to Strategic Project Services, LLC (SPS). The consideration included the assumption of substantially all outstanding liabilities of WFI Brazil, nominal
cash consideration, and additional earn-out consideration based on 25 percent of net receivables collected subsequent to the closing date. We do not currently anticipate that the impairment charges recorded in the fourth quarter of 2006 will result in any material net future cash expenditures.
On April 20, 2007, we entered into an Equity Purchase Agreement (the “Purchase Agreement”) to sell all of the issued and outstanding equity interests of our wholly-owned subsidiary WFI de Brasil Techologia em Telecomunicaciones LTDA, a company limited by shares formed under the laws of the Brazil (“WFI Brazil”), to Strategic Project Services, LLC, a Louisiana limited liability company (“SPS”). Pursuant to the Purchase Agreement, we received the following consideration:
· SPS assumed substantially all outstanding liabilities of WFI Brazil;
· Nominal cash consideration on signing of the Purchase Agreement;
· Following the sale of WFI Brazil to SPS, we are entitled to receive 25% of the Net Receivables of WFI Brazil until such time as the gross account receivables set forth in the financials of WFI Brazil at Closing are fully paid (the “Earn Out”). SPS shall pay the Earn Out portion of the Net Receivables to us within 15 days of SPS’ collection of such amount; and
· If the Working Capital left in WFI Brazil at Closing is less than $1.2 million; then SPS shall be entitled to apply such payments due us pursuant to the Earn Out to the Working Capital account, until it equals $1.2 million. Thereafter, such Earn Out amounts shall be paid to us into such accounts or to such entities as directed in writing by WFI.
On May 29, 2007, we entered into an Asset Purchase Agreement (the “Engineering Divestiture Agreement”) with LCC pursuant to which we agreed to sell to LCCInternational, Inc. for the sale of all of the assets used in the conduct of the operation of our Engineeringengineering services business of our wireless network servicesWireless Network Services segment that providesprovided engineering services to the non-government wireless communications industry in the United States, on the terms set forth in the Engineering Divestiture Agreement. Thefor aggregate consideration in connection with the Engineering Divestiture Agreement wasof $46 million, subject to certain adjustments. Pursuant to the terms of the Acquisition Agreement,million. LCC delivered a subordinated promissory note for the principal amount of $21.6 million (the “"Subordinated Promissory Note”"), subject topaid $17 million at closing and paid final working capital adjustments and paid $17of $2.4 million in cash and atthrough an amendment to the closing, and we haveSubordinated Promissory Note. We retained an estimated $7$5.0 million in net accounts receivable of the divested business, subject to working capital adjustments.capital. The transaction was completed on June 4, 2007.
On July 5, 2007, we announced that we sold the $21.6 million Subordinated Promissory Note to Silver Point Capital, L.P. ("Silver Point") in a transaction arranged by KeyBanc Capital Markets (“KeyBanc”("KeyBanc"). We received approximately $19.6 million in net cash proceeds, reflecting a discount from par value of less than five percent and aggregate transaction fees of approximately $1 million, which includes a $0.75 million fee to KeyBanc, an affiliate of our lender. The note was acquired by a fund affiliated withOn January 30, 2008, we received net proceeds of approximately $2.3 million on the working capital adjustment from Silver Point, Capital, L.P. (“Silver Point”).net of a $0.1 million discount from par value. We did not provide any guaranty for LCC’sLCC's payment obligations. Certain post closing adjustments that, underobligations for the terms of the Engineering Divesture Agreement were expected to be made to the principal amount of the Subordinated Promissory Note, may instead be made by payments between us and LCC, or between Silver Point and us, as applicable.note.
On August 10, 2007, in accordance with the terms of the Engineering Divestiture Agreement, we provided the closing balance sheet working capital calculation, which indicated a $2.6 million working capital adjustment was due to us as an increase to the balance of the Subordinated Promissory Note. LCC has until September 10, 2007 to review the calculation and notify us of any dispute.
As a result of the divestitures of the U.S. Wireless Engineering and U.S. Wireless Deployment businesses, the Company expects to record a loss of approximately $8 to $10 million in the second and third quarters of 2007.
On July 9, 2007, we entered into a definitive agreement with an affiliate of Platinum Equity to sell our Deploymentdeployment services business of our wireless network services segment (the “Deployment Divestiture Agreement”). Platinum is a Los Angeles-based private equity firm whose portfolio includes service and distribution businesses in a number of market sectors.
Thefor total consideration payable to us under the Deployment Divestiture Agreement isof $24 million, including $18 million in cash at closing subject(subject to typical post closing working capital adjustments,adjustments) and an aggregate $6 million in a three-year earn-out arrangement through 2010. The deal includes a Transition Services Agreement for thearrangement. We also agreed to provide certain transition of certain services for a period of six months. The assets sold to Platinum Equity includeincluded all of our Wireless Deploymentwireless deployment business and the Wireless Facilities name. The transaction closed on July 24, 2007.
On September 25, 2007, we provided the working capital calculation to Platinum Equity, which indicated a working capital adjustment was due to Platinum primarily due to cash collected on accounts receivables by us prior to the close of the transaction that exceeded our previous estimate of working capital to be delivered to Platinum. Platinum has reviewed our working capital calculation, and we have not been able to come to an agreement on the working capital adjustment. In accordance with the terms of the acquisition agreement, we and Platinum are currently in the process of choosing a firm to resolve this item. As of December 31, 2006,2007 the balance of our calculation has been reflected in other current liabilities.
As a result of the engineering and deployment services divestitures in 2007, the Wireless Network Services segment has been classified as a discontinued operation in this Annual Report and all prior year results presented herein have been reclassified to reflect these businesses as discontinued operations in accordance with SFAS No. 144, "Accounting for the Impairment or Disposal of Long-Lived Assets".
On December 31, 2007 we completed our acquisition of Indianapolis, Indiana headquartered Haverstick Consulting, Inc. ("Haverstick") as part of our Government Solutions Segment. Haverstick provides rocket and missile test and evaluation, weapons systems support, and professional services to the divestitureU.S. Army, U.S. Air Force, U.S. Navy, NASA, and other federal, state and local agencies. Through the Haverstick acquisition, we expanded our customer relationship within the DoD and enhanced our presence with the U.S. Air Force, a key growth area for Haverstick.
The total purchase price was $90.2 million including transaction costs incurred by Kratos of $0.5 million. The purchase price paid to Haverstick of $89.7 million was paid in a combination of $70.3 million of cash and common stock valued at $19.4 million. We paid $66.7 million in cash at
closing, $2.4 million in cash shortly thereafter and $12.0 million of common stock. In addition, $1.2 million in cash and $7.4 million in stock was held back to secure any negative working capital adjustments required by the merger agreement and our indemnity rights. The holdback consideration will be released on the 12th month and 21st month of the anniversary date of the acquisition. In addition to the indemnity holdback, the Agreement also calls for a post closing working capital adjustment. To fund the acquisition, we secured a new credit facility of $85.0 million arranged by KeyBanc Capital Markets. The credit facility, which includes a $25.0 million line of credit and $60.0 million in term notes, replaced our previous credit facility, which had an outstanding principal balance of $6.0 million on December 31, 2007.
On February 29, 2008 we provided the working capital calculation to Haverstick, which indicated a working capital adjustment was due to us primarily because the working capital, as calculated per the Agreement, was below the target amount. Haverstick has reviewed our working capital calculation and is in disagreement. Their response proposes that there is actually excess working capital of approximately $1.5 million. In accordance with the Agreement, we have fifteen days from the date of Haverstick's objection to resolve the disagreement. If resolution has not been achieved within the fifteen day period, we and Haverstick have five days to agree on a nationally recognized independent accounting firm to resolve the disagreement.
Pursuant to the terms of the Merger Agreement, the Company has agreed to use its reasonable best efforts to file a resale registration statement covering the shares issued in connection with the Merger promptly following the closing date. In the event that the common stock issued are not salable under rules promulgated under the Securities Acts, holders of the stock may elect to exchange such shares for a cash amount equal to $2.74 per share in accordance with the terms of the Merger Agreement. Until the date on which the shares of stock are salable interest shall accrue on the value of the Closing Stock at a floating rate of one-month LIBOR plus four percent (4%) per annum.
In February 2008 we entered into a definitive merger agreement with San Diego-based C5ISR and net-centric warfare solutions provider SYS Technologies (AMEX:SYS) in a stock-for-stock transaction. Under the terms of the agreement, SYS will merge into a wholly owned subsidiary of Kratos and all of SYS's outstanding common shares will be converted into Kratos common shares. Upon closing, we will issue approximately 25 million shares of common stock. The transaction is subject to customary closing conditions, including approval of the transaction by SYS's shareholders and the approval of our historical businesses,stockholders of the issuance of shares. The transaction is expected to close in the second quarter of 2008.
On September 12, 2007 we consideredchanged our name from Wireless Facilities, Inc. to Kratos Defense & Security Solutions, Inc. to reflect our new strategic focus.
As of December 31, 2007, we consider the following factors to be important in understanding itsour financial statements.
70
Our WNS contracts are primarily fixed-price contracts whereby revenue is recognized using the percentage-of-completion method of accounting under the provisions of Statement of Position (SOP) 81-1, “Accounting for Performance of Construction Type and Certain Production Type Contracts.” For contracts offered on a time and material basis, we recognize revenues as services are performed. We typically charge a fixed monthly fee for ongoing radio frequency optimization and network operations and maintenance services. With respect to these services, we recognize revenue as services are performed. Our Kratos Government Network ServicesSolutions' business with the U.S. government and prime contractors is generally performed under cost reimbursable, fixed-price or time and materials contracts. Cost reimbursable contracts for the government provide for reimbursement of costs plus the payment of a fee. Some cost reimbursable contracts include incentive fees that are awarded based on performance on the contract. Under fixed-price contracts, we agree to perform certain work for a fixed price. Under time and materials contracts, we are reimbursed for labor hours at negotiated hourly billing rates and reimbursed for travel and other direct expenses at actual costs plus applied general and administrative expenses. Our Pubic Security and Safety contracts are primarily fixed-price contracts whereby revenue is recognized using the percentage-of-completion method of accounting under the provisions of Statement of Position (SOP) 81-1, "Accounting for Performance of Construction Type and Certain Production Type Contracts." For contracts offered on a time and material basis, we recognize revenues as services are performed.
Cost of revenues includes direct compensation, living, travel and benefit expenses for project-related personnel, payments to third-party sub-contractors,subcontractors, cost of materials project-related incentive compensation based upon the successful achievement of certain project performance goals, allocation of corporate overhead costs of expendable computer software and equipment, and other direct project-related expenses. Direct compensation and benefits are computed based on standard costs and actual hours billed. We review and adjust these standard costs periodically to ensure they are comparable to actual costs.
Selling, general and administrative expenses include compensation and benefits for corporate service employees and similar costs for billable employees whose time and expenses cannot be assigned to a project (underutilization costs), expendable computer software and equipment, facilities expenses and other operating expenses not directly related and/or allocated to projects. General and administrative costs include all corporate and administrative functions that support existing operations and provide infrastructure to facilitate our future growth. Additionally, our sales personnel and senior corporate executives have, as part of their compensation packages, periodic and annual bonus/commission incentives based on the attainment of specified performance goals.
We consider the following factors when determining if collection of a receivable is reasonably assured: comprehensive collection history; results of our communications with customers; the current financial position of the customer; and the relevant economic conditions in the customer’scustomer's country. If we have had no prior experience with the customer, we review reports from various credit organizations to ensure that the customer has a history of paying its creditors in a reliable and effective manner. If the financial condition of our customers were to deteriorate, and adversely affect their financial ability to make payments, additional allowances would be required. Additionally, on certain contracts whereby we perform services for a prime/general contractor, a specified percentage of the invoiced trade accounts receivable may be retained by the customer until we complete the project. We periodically review all retainages for collectibility and record allowances for doubtful accounts when deemed appropriate, based on our assessment of the associated risks. Total retainages included in accounts receivable and current assets of discontinued operations were approximately $1.2$1.7 million and $0.0 million at December 31, 2006.2007, respectively. In addition, $0.2$0.6 million of retainages that are expected to be paid after 2007 are included in other assets (long term).
Our PSS segment previously built, installed and operated a wireless LAN system at a number of shopping malls in the United States. This network was developed to offer internet connectivity for a fee to customers and tenants at the malls. The market for these services had changed in 2006 with the emergence of free WiFi and WiMAX and this resulted in significantly reduced expectations for future revenue and profits related to the realizability of this asset. Based upon an analysis of the expected future cash flows from this asset in accordance with SFAS No. 144, we determined that the full value of this asset, approximately $1.8 million, was impaired at the end of 2006. In January 2008, we sold the LAN system network to the owner of the shopping malls for $0.3 million. This transaction will be recorded in our first quarter of 2008 at the time of the transfer of the network.
Due to a loss of management in early 2006 as a result of the completion of earn-outs on some of our PSS acquisitions at the end of 2005, our PSS operations experienced an underperformance relative to historic operating results in 2006 and this impacted our projected future performance. We determined at the end of 2006 that the total amount of goodwill for our PSS segment, approximately $18.3 million, was impaired. The fair value of the goodwill was estimated using these projections and a combination of a discounted cash flow model and a market approach model that takes into consideration comparable business and market transactions. We also concluded based on this analysis the intangible assets for PSS were not impaired.
As of December 31, 2007, our annual effective tax rate was a negative 5% for the year ending December 31, 2007 which resulted in tax expense of $1.3 million on a loss before income taxes of $26.9 million. The rate differs from the federal and state statutory rates primarily due to the increase in the valuation allowance against deferred tax assets created during the year for which recognition is not considered to be "more likely than not".
Management currently considers the following events, trends and uncertainties to be important to understanding its financial condition and operating performance:
We believe that our Kratos Government Network ServicesSolutions segment will build and expand our customer relationships within the U.S. Departments of Defense, andDepartment of Homeland Security and other non-DoD state and local agencies by taking advantage of the significant opportunities for companies with substantial expertise in wireless networkadvanced engineering and communicationsinformation technology. We believe we will experience continued growth in revenues and operating income from this operating segment. The acquisition of Haverstick on December 31, 2007 resulted in the addition of nearly 500 highly skilled technical professionals and engineers with expertise in the areas of military weapons and target range support as well as targets and missile operations and maintenance. The acquisition of MRC on October 2, 2006 provides us with expanded presence in Huntsville Alabama, which is a key strategic military location for this segment. MRC
offers a broad range of technical, engineering and IT solutions, and has developed core competencies in weapons system lifecycle support, integrated logistics, test and evaluation, commercial-off-the-shelfcommercial off-the-shelf software and hardware selection and implementation, software development and systems lifecycle maintenance. The results of operations of Haverstick have not been included in our consolidated statement of operations as that transaction closed on December 31, 2007. The results of operations of MRC have been included in our consolidated results beginning from the closing date of October 2, 2006.
Our restructuring assessments which occurred in the fourth quarter of 2006 included a critical review of our ENSPublic Safety & Security segment to take into consideration the overall Enterpriseenterprise related industry and market opportunities, as well as the management and performance setbacks that occurred in this segment during 2006. As a result of this analysis we have made the decision to change our strategy related to ENS, by focusingfocus primarily on areas where we have significant existing expertise, qualifications and relationships. For example, we believe our expertise and overall qualifications provide a clear competitive differentiator on projects related to physical and other types of security system integrations at Department of Defense Military Bases,military bases, production facilities, and other state, local and municipal government locations.
Our annual impairment testResults of goodwill resultedOperations
Comparison of Results for the Year Ended December 31, 2006 to the Year Ended December 31, 2007
Revenues. Revenues by operating segment for the years ended December 31, 2006 and 2007 are as follows (in millions):
| | 2006
| | 2007
| | $ change
| | % change
| |
|---|
| Public Safety & Security Segment | | $ | 55.6 | | $ | 51.1 | | $ | (4.5 | ) | (8.1 | )% |
| Kratos Government Solutions Segment | | | 97.5 | | | 142.5 | | | 45.0 | | 46.2 | % |
| | |
| |
| |
| |
| |
| | Total revenues | | $ | 153.1 | | $ | 193.6 | | $ | 40.5 | | 26.5 | % |
Revenues increased $40.5 million from $153.1 million in 2006 to $193.6 million in 2007, reflecting an increase of $45.0 million in our Kratos Government Solutions segment, primarily due to the acquisition of MRC in October 2006, which contributed $70.5 million in revenues in 2007 and $17.2 million in 2006. This increase of $53.3 million was partially offset by decreases due to the reduction of one program with annualized revenues of nearly $5.7 million that was consolidated by one of our Federal Government customers as well as, to a non-cash impairment chargelesser degree, other program delays and losses resulting in reduced revenues of $18.3$2.6 million in other businesses within our Government Solutions segment. Reductions in our Public Safety & Security segment of $4.5 million were primarily related to our exit of the municipal wireless business in the first quarter of 2007.
As described in the section "Critical Accounting Principles and Estimates" and in the footnotes to our audited consolidated financial statements, a portion of our revenue is derived from fixed-price contracts whereby revenue is calculated using the percentage-of-completion method based on the ratio of total costs incurred to date compared to estimated total costs to complete the contract. These estimates are reviewed monthly on a contract-by-contract basis, and are revised periodically throughout the life of the contract such that adjustments to profit resulting from revisions are made cumulative to the date of the revision. Significant management judgments and estimates, including the estimated costs to complete projects, which determine the project's percent complete, must be made and used in connection with the revenue recognized in any accounting period. Material differences may result in the amount and timing of our revenue for any period if management makes different judgments or utilizes different estimates. During the reporting periods contained herein, we did experience revenue and margin adjustments of certain projects based on the aforementioned factors, but the effect of such adjustments, both positive and negative, when evaluated in total were determined to be immaterial to the consolidated financial statements.
Cost of Revenues. Cost of revenues increased $37.8 million or 30.4% from $124.2 million for the write-down of goodwill related to acquisitions previously made in our ENS business. The fair value of goodwill was estimated by using a combination of a discounted cash flow model and a market approach model which takes into consideration recent and expected future performance as well as comparable businesses and market transactions.
As ofyear ended December 31, 2006 our annual effective tax rate was a negative 45%to $162.0 million for the year endingended December 31, 2006 which resulted in tax expense of $14.5 million on a loss before income taxes of $32.2 million. The rate differs from the federal and state statutory rates2007 primarily due to a valuation allowance recordedthe increase in total revenues. The increase was primarily attributable to cost of revenues of approximately $14.6 million related to the MRC acquisition, offset by decreases in cost of revenues as a result of the reduced revenues in our PSS segment discussed above. Gross margin during the year ended December 31, 2007 of 16.3% decreased from a 2006 gross margin of 18.9%. The decrease in gross margin primarily resulted from a change in the mix of Government Services revenue versus Public Safety & Security revenue.
Selling, General and Administrative Expenses. Selling, general and administrative expenses increased 2.6% from $38.5 million to $39.5 million for the years ended December 31, 2006 and 2007, respectively. The increase of $1.0 million is primarily due to an increase in costs reflecting the acquisition of MRC and an increase in external consulting and professional fees, such as legal and accounting, partially offset by a reduction in stock compensation expense of $4.9 million from 2006, which decreased from $5.9 million in 2006 to $1.0 million in 2007. Included in the selling, general and adminstrative expenses (SG&A) for 2006 and 2007 is amortization of purchased intangibles of $2.0 million and $2.8 million, respectively. The increase in amortization year over year is also a result of the MRC acquisition. As a percentage of revenues, selling, general and administrative expenses decreased from 25.1% in 2006 to 20.4% in 2007. Excluding the impact of the amortization of purchased intangibles and stock compensation expense, SG&A decreased from 20.0% to 19.0% of revenues for 2006 and 2007, respectively.
Stock Option Investigation, Related Fees and Recoveries. In the summer of 2006, our current executive management team, which has been in place since 2004, initiated an investigation of our past stock option granting practices (the "Equity Award Review") in reaction to media reports regarding stock option granting practices of public companies. Our 2007 costs of $10.6 million included $14.0 million in legal, accounting and other professional fees related to our Equity Award Review which was completed in September 2007 and the ongoing government inquiries by the Department of Justice and the SEC. This amount was partially offset by $3.4 million related to the recovery of assets from our settlement with our former stock option administrator related to damages for the theft of our stock options and common stock which occurred in 2002 and 2003 and was discovered during our internal review of our option granting practices. See Item 3. Legal Proceedings for a further discussion of these items.
Estimated Cost for Settlement of Securities Litigation. In March 2008, following a voluntary mediation of 2004 and 2007 securities litigation, the parties reached a tentative agreement to settle the class action. See Item 3. Legal Proceedings for a further discussion of these items. We have accrued an estimated $4.9 million related to its costs for the settlement of these litigations.
Contingent Acquisition Consideration and Restatement Fees. In September 2004, we amended the purchase agreements related to two of the companies acquired in our ENS segment in 2003 to more accurately reflect the intent of the transactions, resulting in a rescission of the continuous employment clauses from the earn-out arrangements, for which we recorded a $12.4 million accrual at that time. We had $0.1 million in expense associated with contingent acquisition consideration based upon the final payments on these agreements in 2006. There were no charges incurred in 2007.
Impairment and Restructuring Charges. Impairment and restructuring charges decreased $20.6 million from $21.8 million in 2006 to $1.2 million in 2007. During 2006, we recorded $21.8 million in impairment and restructuring charges as a result of a change in strategic focus of our PSS segment and a consolidation of our headquarter facilities, which included $18.3 million for goodwill impairment related to acquisitions made in the PSS segment. This was due in part to changes in the industry and the strategic focus, the impact of recent and future expected operating lossesperformance, as well as operational challenges from significant employee turnover that we encountered after the completion of $32.2the earn-out periods in early 2006. The balance of the charge was related to an asset impairment of approximately $1.8 million, recordedan unused facility charge of approximately $1.4 million related to facilities consolidation and severance costs associated with restructuring activities of approximately $0.3 million. The costs in 2007 of $1.2 million included $0.8 million for an excess facility accrual for obligations under facility leases with unused office space as a result of the recent divestitures of our wireless network services businesses, $0.2 million related to the impairment of leasehold improvements for these facilities and $0.2 million related to an impairment of fixed assets.
Other Expense, Net. For the year ended December 31, 2006, net other expense was $0.9 million compared to net other expense of $2.3 million for the year ended December 31, 2007. The other expense in 2006 was due to interest income on the note receivable relating to the sale of our Mexican subsidiary and interest expense for the bookborrowings on the line of credit used to fund the acquisition of MRC in October 2006. In 2007, in accordance with EITF 87-24,Allocation of Interest to Discontinued Operations, interest expense on the debt of $2.2 million that was required to be repaid as a result of the sales of our wireless network services business was allocated to discontinued operations for the periods presented. See Note 4 of Notes to Consolidated Financial Statements, included in Part IV, Item 15 of this report. Consequently, in 2007 the interest cost for the Line of Credit borrowings used to fund the MRC acquisition was primarily allocated to discontinued operations. The net other expense of $2.3 million in 2007 was primarily attributable to approximately $1.8 million of an impairment charge, recorded in the fourth quarter of 2007, related to the carrying value of investments to fair value as well as $1.2 million of interest expense incurred on our credit facility.
Provision (benefit) for Income Taxes. Our effective income tax rate for the year ended December 31, 2006 represented a negative 43% income tax provision compared to a negative 5% income tax provision for the year ended December 31, 2007. The tax provision of $13.8 million for the year ended December 31, 2006 included an increase to the valuation allowance of $15.9 million against the deferred tax assets. The tax provision for the year ended December 31, 2007 included an increase to the valuation allowance of $9.8 million against the deferred tax assets.
Income (Loss) from Discontinued Operations. Loss from discontinued operations increased from a loss of $11.7 million in 2006 to a loss of $12.6 million during 2007. The increase was primarily due to the impairment of assets related to the wireless deployment business of $13.4 million, an impairment of goodwill which is not deductibleof $7.2 million related to this business, a $1.9 million loss from the disposal of our deployment business and a $1.1 million excess facility accrual. These charges were all partially offset by a gain of $14.8 million on the sale of the wireless engineering services business operations and a gain of $2.6 million on the sale of the EMEA business. Revenues and net loss before taxes generated by these businesses in 2006 were approximately $201.7 million and $9.8 million, respectively, compared to $85.7 million and $12.7 million, respectively, in 2007. The decrease year over year was impacted by the
divestitures of the wireless network services businesses in 2007. See Note 4 to the Notes to the Consolidated Financial Statements for tax purposes.further discussion of these transactions.
Results of Operations
Comparison of Results for the Year Ended December 31, 2005 to the Year Ended December 31, 2006
Revenues.Revenues by operating segment for the years ended December 31, 2005 and 2006 are as follows (in millions):
| | 2005 | | 2006 | | $ change | | % change | |
Wireless Network Services | | $ | 185.4 | | $ | 174.7 | | | $ | (10.7 | ) | | | (5.8 | )% | |
Enterprise Network Services | | 67.3 | | 55.6 | | | (11.7 | ) | | | (17.4 | )% | |
Government Network Services | | 85.0 | | 97.5 | | | 12.5 | | | | 14.7 | % | |
Total revenues | | $ | 337.7 | | $ | 327.8 | | | $ | (9.9 | ) | | | (2.9 | )% | |
| | 2005
| | 2006
| | $ change
| | % change
| |
|---|
| Public Safety & Security Segment | | $ | 67.3 | | | 55.6 | | | (11.7 | ) | (17.4 | )% |
| Government Solutions Segment | | | 85.0 | | | 97.5 | | | 12.5 | | 14.7 | % |
| | |
| |
| |
| |
| |
| | Total revenues | | $ | 152.3 | | $ | 153.1 | | $ | 0.8 | | 0.1 | % |
Revenues increased $0.8 or 0.1% from $152.3 million in 2005 to $153.1 million in 2006. The $9.9 million reductionincrease in revenues was a resultincluded an increase of $12.5 million in our Government Solutions segment, substantially offset by reduced revenue in our Public Safety & Security segment.
The decreased revenues in the WNS segment of $10.7 million, which was primarily attributable to the impact of the merger of Western Wireless and Alltel, offset in part by increased revenues from Sprint. Also contributing to this decrease was reduced revenue in the ENSPSS segment of $11.7 million whichfrom 2005 to 2006 was negatively impacted byprimarily a result of significant employee turnover, particularly management sales and business development personnel, that occurred in our Atlanta and Houston offices following the completion of the three year acquisition earn-out periods at the beginning of 2006. These decreases were partially offset byThe increased revenue in the Government Network Services segment asis a result of the acquisition of MRC in the fourth quarter of 2006, which contributed $17.6 million in revenues in 2006, offset partially by decreases due to program delays and program reductions from two of our DOD Customers.
Cost of Revenues.Cost of revenues increased $12.9$8.5 million or 4.9%7.3% from $261.4$115.7 million for the year ended December 31, 2005 to $274.3$124.2 million for the year ended December 31, 2006. Gross margin during the year ended December 31, 2005 of 24.0% decreased to a gross margin of 18.9% for the year ended December 31, 2006. The increase in cost of revenues was primarilypartially attributable to cost of revenues of approximately $14.6 million related to the MRC acquisition.
Gross margin during The decrease in gross margins resulted from an increased mix of government network services business, which generally reports the year ended December 31,classification of cost elements based upon definitions in accordance with government contracting regulations. As a result, cost of revenues in the 2006 of 16.3% decreased fromperiods includes certain cost elements that would otherwise be classified as SG&A expense under a 2005 gross margin of 22.6%. Thecommercial contract arrangement. In addition, the overall decrease in gross margin percentage is primarilywas partially attributable to a stock-based compensation expense of $4.1$0.9 million in 2006 related to the Company’sour adoption of SFAS No. 123(R) in January 2006, compared to $1.3$0.0 million net of payroll tax adjustments, in 2005 as well as due to pricing pressure experienced in our legacy RF business in our WNS sector. In addition, gross margins have been negatively impacted by a large national deployment program for which we are building various cellular site networks in various regions throughoutand the United States for a wireless carrier under which the customer is issuing purchase orders for each separate phaseimpact of the project, rather than the entire project, resulting in our recording zero profit margin or below the anticipated projected margin at completion on the projects. We will not record the anticipated profit margin on the project until we receive the requisite purchase orders from the customer. In addition, gross margins were negatively impacted by cost overruns in the ENSPSS sector as a result of employee and management turnover that occurred following the completion of the earn-out periods in early 2006.
Selling, General and Administrative Expenses.Selling, general and administrative expenses increased 2.4%8.5% from $61.5$35.5 million to $63.0$38.5 million for the years ended December 31, 2005 and 2006, respectively. As a percentage of revenues, selling, general and administrative increased from 18.2%23.3% in 2005 to 19.2%25.1% in 2006. The increase of $1.5$3.0 million is primarily due to the cost of stock-based compensation which was $7.5$5.9 million in 2006 or 2.3%3.9% of revenues versus $0.8$0.2 million, net of related tax adjustments, in 2005 or 0.2%0.1% of revenues partially offset by a reduction in consulting fees. Excluding the stock-based compensation expense, SG&A decreased from $60.7$35.3 million, or 23.2% of revenues, in 2005 to $55.5$32.6 million, or 21.3% of revenues, in 2006.
Contingent Acquisition Consideration and Restatement Fees.In September 2004, we amended the purchase agreements related to two of the companies acquired in our ENS segment in 2003 to more accurately reflect the intent of the transactions, resulting in a rescission of the continuous employment clauses from the earn-out arrangements, for which we recorded a $12.4 million accrual at that time. In September 2005, we reduced $2.5 million of our contingent acquisition earn-out accruals that was determined to be excess based on the projected performance of the division compared to the minimum performance targets as defined in the earn-out arrangements. In December 2005, we increased our
contingent acquisition earn-out accruals by $0.4 million, to reflect the financial performance of one of the acquired entities that exceeded its previously projected performance. We had $0.1 million in expense associated with contingent acquisition consideration based upon the final payments on these agreements in 2006.
Impairment and Restructuring Charges.During 2006, the Companywe recorded $21.8 million in impairment and restructuring charges as a result of a change in strategic focus of our ENS segment and a consolidation of the Company’sour headquarter facilities, which included $18.3 million for goodwill impairment related to acquisitions made in the ENS segment. This was due in part to changes in the industry and theour strategic focus, of the Company, the impact of recent and future expected operating performance, as well as operational challenges from significant employee turnover that we encountered after the completion of the earn-out periods in early 2006. The balance of the charge was related to an asset impairment of approximately $1.8 million, an unused facility charge of approximately $1.4 million related to facilities consolidation and severance costs associated with restructuring activities of approximately $0.3 million. No impairment or restructuring charges were incurred in 2005.
Other Income (Expense), Net.For the year ended December 31, 2005, net other income was $0.3 million compared to net other expense of ($0.8)$0.9 million for the year ended December 31, 2006. The increase in net other expense of $1.1$1.2 million was primarily due to the interest that was incurred on the Key Bank Creditcredit facility as a result of the MRC acquisition, partially offset by the interest income earned on the Note Receivablenote receivable for the sale of Mexico.
Provision (benefit) for Income Taxes.Our effective income tax rate for the year ended December 31, 2005 represented a 28.7%3% income tax provisionbenefit compared to a negative 45%43% income tax provision for the
year ended December 31, 2006. The tax provisionbenefit of $5.9$0.1 million for the year ended December 31, 2005 included a decrease to the valuation allowance on deferred tax assets based upon the Company’sCompany's projections in 2005 of estimated taxable income for 2006, including the reversal of temporary differences. The reduction in the valuation allowance was primarily a result of our projected forecasts of 2006 taxable income, the estimated timing of reversal of temporary differences and the expected utilization of net operating loss carryforwards. In 2006, the income tax expense of $14.5$13.8 million is a result of an increase of $15.9 million in our valuation allowance for deferred tax assets.
Income (Loss) Loss from Discontinued Operations.Loss from discontinued operations increased from a loss of $9.7$2.0 million in 2005 to a loss of $11.2$11.7 million during 2006. Included in the loss from discontinued operations of $9.7$2.0 million for the year ended December 31, 2005 is an approximate $5.0 million charge related to a write off of unrecoverable contract costs incurred on sites we were building for our customers in Mexico and South America which were cancelled prior to the completion of the sites. Although we were under contractual arrangement with these customers to build these sites, these costs were contractually unrecoverable from our customers due to the termination clauses in the contracts, which did not provide for reimbursement for in process cancelled sites, unless agreed upon by the customer. Also included in our loss from discontinued operation in 2005 is an impairment charge of $0.9 million related to accumulated foreign currency translation losses as well as a $4.4 million valuation allowance established against the deferred tax assets of our discontinued operations. Included in the loss from discontinued operations of $11.2$11.7 million for the year ended December 31, 2006 is an impairment charge of approximately $5.2 million to reduce the current carrying value of the South American operations to their estimated fair value based upon current indications of interest. Also included in our loss from discontinued operations in 2006 is an impairment charge of $1.7 million related to accumulated foreign currency translation losses. Revenues and net income (loss) before taxes generated by our discontinued South American operations were $52.6 millionthese businesses in 2005 were approximately $265.1 million and $10.0net income of $7.1 million, respectively, compared to $201.7 million and a net loss of $9.8 million, respectively, in 2006. The reduction in revenues in 2006 from 2005 reflects the sale of our Latin American operations in February 2006. Revenues generated by our discontinued EMEA operations were $27.1 million in 2005 and $17.0 million in 2006.
Comparison of Results for the Year Ended December 31, 2004See Note 4 to the Year Ended December 31, 2005
Revenues.Revenues by operating segment for the years ended December 31, 2004 and 2005 are as follows (in millions):
| | 2004 | | 2005 | | $ change | | % change | |
Wireless Network Services | | $ | 179.3 | | $ | 185.4 | | | $ | 6.1 | | | | 3.4 | % | |
Enterprise Network Services | | 65.3 | | 67.3 | | | 2.0 | | | | 3.1 | % | |
Government Network Services | | 51.6 | | 85.0 | | | 33.4 | | | | 64.7 | % | |
Total revenues | | $ | 296.2 | | $ | 337.7 | | | $ | 41.5 | | | | 14.0 | % | |
Revenues increased 14.0% from $296.2 million for the year ended December 31, 2004 to $337.7 million for the year ended December 31, 2005. The $41.5 million increase was attributable to internal growth across each of our operating segments as well as due to our acquisition of TLA in January 2005. The acquisition of TLA that we made in 2005 resulted in $28.6 million of increased revenues in our Government Network Services segment.
Cost of Revenues.Cost of revenues increased 15.3% from $226.8 million for the year ended December 31, 2004 to $261.4 million for the year ended December 31, 2005 primarily dueNotes to the corresponding increase in total revenues as well due to a reductionConsolidated Financial Statements for further discussion of previously recorded payroll tax adjustments of $7.5 million in 2004 related to stock-based compensation expense recorded in years 2000 through 2003. The increase in cost of revenues during the 2005 period attributable to acquisitions was approximately $20.8 million. Gross margin during the year ended December 31, 2005 of 22.6% of totalthese transactions.
revenues decreased from 2004 gross margin of 23.4% of total revenues. Excluding the impact of the $7.5 million of the reduction of the previously recorded tax adjustments in 2004, gross margin increased from 20.9% in 2004 to 22.6% in 2005. The change between in gross margin from 2004 excluding the tax related reduction is primarily attributable to a gross margin reduction of $9.8 million in 2004 resulting from increases in estimated costs for contracts signed in 2003.
Selling, General and Administrative Expenses.Selling, general and administrative expenses increased 23.2% from $49.9 million to $61.5 million for the years ended December 31, 2004 and 2005, respectively. As a percentage of revenues, selling, general and administrative expenses increased from 16.8% of revenues in 2004 and 18.2% of revenues in 2005. The increase in SG&A expenses from 2004 to 2005 was in part related to the SG&A from the TLA acquisition in 2005 as well as due to a reduction of previously recorded payroll tax adjustments of $3.9 million in 2004 related to stock-based compensation expense recorded in years 2000 through 2003. In addition, the Company experienced increased accounting and contract administration costs in 2005 primarily incurred due to changes we have made related to compliance with the Sarbanes Oxley Act and increased infrastructure costs necessary to support the revenue growth.
Contingent Acquisition Consideration and Restatement Fees.In September 2004, we amended the purchase agreements related to two of the companies acquired in our ENS segment in 2003 to more accurately reflect the intent of the transactions, resulting in a rescission of the continuous employment clauses from the earn-out arrangements. These amendments constituted a triggering event which resulted in a one-time charge of $12.4 million in the third quarter of 2004. In addition, the Company incurred approximately $1.5 million of costs related to the restatement of its financial statements during the third quarter of 2004, primarily due to legal and accounting fees incurred. In September 2005, we reduced $2.5 million of our contingent acquisition earn-out accruals that was determined to be excess based on the projected performance of the division compared to the minimum performance targets as defined in the earn-out arrangements.
In December 2005, we increased our contingent acquisition earn-out accruals by $0.4 million, to reflect the financial performance of one of the acquired entities that exceeded its previously projected performance.
Other Income (Expense), Net.For the year ended December 31, 2004, net other expense was $2.8 million compared to net other income of $0.3 million for the year ended December 31, 2005. The decrease in expense of $3.1 million was attributable to an impairment charge of $3.1 million recorded in 2004 related to our investment in a privately held company.
Provision (benefit) for Income Taxes.Our effective income tax rate for the year ended December 31, 2004 represented a 22.2% income tax benefit compared to a 28.7% income tax provision for the year ended December 31, 2005. The tax provision of $5.9 million for the year ended December 31, 2005 included a decrease to the valuation allowance on deferred tax assets based upon the Company’s projections of taxable income for 2006, including the reversal of temporary differences. The reduction in the valuation allowance was primarily a result of our projected forecasts of 2006 taxable income, the estimated timing of reversal of temporary differences and the expected utilization of net operating loss carryforwards.
Income (Loss) from Discontinued Operations.Income (loss) from discontinued operations decreased from income of $11.6 million in 2004 to a loss of $9.7 million during 2005. Included in the income from discontinued operations for the year ended December 31, 2004, is an asset impairment charge of $0.4 million and a $1.7 million charge for estimated employee termination costs related to our Scandinavia operations as well as income from discontinued operations for our Mexico operations of $11.8 million. There was no tax benefit provided for the Scandinavia net operating losses due to no estimated future realizability of tax assets. Included in the loss from discontinued operations of $9.7 million for the year ended December 31, 2005 is an approximate $5.0 million of a write off of unrecoverable contract costs
incurred on sites we were building for our customers in Mexico and South America which were cancelled prior to the completion of the sites. Although we were under contractual arrangement with these customers to build these sites, these costs were contractually unrecoverable from our customers due to the termination clauses in the contracts, which do not provide for reimbursement for in process cancelled sites, unless agreed upon by the customer. Also included in our loss from discontinued operation in 2005 is an impairment charge of $0.9 million related to accumulated foreign currency translation losses as well as a $3.4 million valuation allowance established against the deferred tax assets of our discontinued operations. Revenues generated by our discontinued Latin and South American operations were $52.6 million in 2005 compared to $66.0 million in 2004. Revenues generated by our discontinued EMEA operations were $34.8 million in 2004 and $27.1 million in 2005.
Liquidity and Capital Resources
Overview
Strategy. We seek to allocate our available capital among the investment alternatives that we believe exhibit sufficient potential to achieve acceptable risk-adjusted returns. As such, we may continue to:
(1) make investments in businesses that we believe are complimentary to our Government Network Services segment when the expected returns from such investments meet our investment return criteria.
(2) divest additional assets as we continue to assess and prioritize our future business opportunities for critical mass, and ability for long term sustained and predictable profitability to raise capital for our strategic initiatives and to reduce interest expense and improve profitability through the reduction of debt.
Our goal is to maximize long-term net cash from operating activities and fund all non-discretionary capital spending and debt service from our operating cash flow, without reliance on additional borrowing. However, due to risk factors, including those set forth herein and in “Item 1A. Risk Factors” there can be no assurance that this will be possible. We may also incur additional debt to fund discretionary investments or to meet working capital requirements. We expect that the majority of our discretionary investments will occur in connection with acquisitions like the MRC which occurred in the fourth quarter of 2006. Our long-term business strategy may be influenced over the near term as a result of the debt financing of the MRC acquisition and working capital requirements which are a result of the timing of achieving milestones on our turnkey deployment projects in the Wireless Network Services segment.
Liquidity Position. As of December 31, 2006, we had consolidated cash and cash equivalents of $5.4 million (exclusive of restricted cash of $1.0 million), consolidated long-term and short-term debt of $51.5 million, and consolidated stockholders equity of $187.1 million. As of March 30, 2007 the Company was in technical default with its credit agreement with Key Bank as it had not yet filed its Form 10-K and 2006 audited financials. On April 6, 2007 the Company entered into an amendment to the credit agreement whereby Key Bank waived this technical default and provided an extension through April 30, 2007 for filing our 10-K and 2006 audited financial statements. On June 1, 2007, the Company entered into a second amendment to the credit agreement whereby Key Bank extended the original waiver for filing our 10-K and 2006 audited financial statements and the quarterly unaudited financial statements for the fiscal quarters ended March 31, 2007 and June 30, 2007 through September 30, 2007 and reduced the total Facility to $50 million to reflect the net pay downs of the revolving line of credit reflecting the divestiture of our EMEA business in March 2007 and the divesture of our domestic Engineering business. In addition, the second amendment provides for the further reduction of our credit facility to $35 million effective upon receipt of principal payments under the note received from the buyer of the domestic engineering business, which occurred on July 3, 2007. As of September 6, 2007, we had consolidated cash and cash equivalents of approximately $10.4$8.6 million, and consolidated long-term and short-term debt of $2.0$76.7 million, and consolidated stockholders equity of $167.2 million. Our principal sources of liquidity are cash flows from operations and borrowings under our credit facility.
76
Net Cash from Operations
Our operating cash flow is used to finance trade accounts receivable, fund capital expenditures, fund our ongoing litigation and government inquiries, and make selective acquisitions. Financing trade accounts receivable is necessary because, on average, our customers do not pay us as quickly as we pay our vendors and employees for their goods and services. Cash from continuing operations is primarily derived from our customer contracts in progress and associated changes in working capital components. A summary of our net cash provided by operating activities from continuing operations from our consolidated statement of cash flows is as follows (in millions):
| | Years Ended
December 31, | |
| | 2004 | | 2005 | | 2006 | |
| | (Restated) | | (Restated) | | | |
Net cash provided by operating activities of continuing operations | | | $ | 3.1 | | | | $ | 14.2 | | | $ | 2.1 | |
| | | | | | | | | | | | | | |
| | Years Ended December 31,
| |
|---|
| | 2005
| | 2006
| | 2007
| |
|---|
| Net cash used in operating activities of continuing operations | | $ | (3.4 | ) | $ | (3.9 | ) | $ | (1.1 | ) |
Cash provided byused in operating activities forof continuing operations for 20062007 decreased by $12.1$2.7 million from 20052006 primarily due to a decrease in days sales outstanding from 109 days to 101 days, after adjustment for the MRC transaction in 2006 and the Haverstick transaction in 2007, partially offset by payment related to our internal stock option investigation, as well as the timing of payments toof our suppliers, which did not correspond with the achievement of certain construction milestones on our large turnkey deployment projects in accordance with contractual terms. This resulted in an increase in our days sales outstanding (DSO) from 105 for the quarter ended December 31, 2005 to 112 for the quarter ended December 31, 2006.expenses.
Cash used in investing activities from continuing operations are summarized as follows (in millions):
| | 2004 | | 2005 | | 2006 | |
Investing activities: | | | | | | | |
Sale/maturity of short-term investments | | $ | 27.5 | | $ | 7.6 | | $ | — | |
Cash paid for contingent acquisition consideration | | (8.3 | ) | (17.1 | ) | (8.5 | ) |
Cash paid for acquisitions, net of cash acquired | | (53.9 | ) | (33.6 | ) | (59.1 | ) |
Proceeds from the disposition of discontinued operations | | — | | — | | 18.9 | |
Cash transferred to restricted cash | | — | | — | | (1.0 | ) |
Investment in unconsolidated subsidiary | | (1.0 | ) | — | | — | |
Capital expenditures | | (5.0 | ) | (6.9 | ) | (7.1 | ) |
Net cash used in investing activities from continuing operations | | $ | (40.7 | ) | $ | (50.0 | ) | $ | (56.8 | ) |
| | 2005
| | 2006
| | 2007
| |
|---|
| Investing activities: | | | | | | | | | | |
| | Sale/maturity of short-term investments | | $ | 7.6 | | $ | — | | $ | — | |
| | Cash paid for contingent acquisition consideration | | | (17.1 | ) | | (8.5 | ) | | (8.9 | ) |
| | Cash paid for acquisitions, net of cash acquired | | | (33.6 | ) | | (59.1 | ) | | (63.9 | ) |
| | Proceeds from the disposition of discontinued operations | | | — | | | 18.9 | | | 57.3 | |
| | Cash transferred from (to) restricted cash | | | — | | | (1.0 | ) | | 1.0 | |
| | Capital expenditures | | | (4.0 | ) | | (1.2 | ) | | (0.9 | ) |
| | |
| |
| |
| |
| | | Net cash used in investing activities from continuing operations | | $ | (47.1 | ) | $ | (50.9 | ) | $ | (15.4 | ) |
| | |
| |
| |
| |
Cash paid for acquisitions and contingent acquisition consideration accounted for the most significant outlays for investing activities in each of the three years from 20042005 to 20062007 as a result of the implementation of our strategies to diversify our business while focusing on our core competencies. These acquisitions included Haverstick in 2007, MRC in 2006, and TLA in 2005.
In 2006, we acquired MRC and paid the final amounts due for contingent acquisition consideration related to the companies acquired in our ENS segment. Refer to Note 6 of our Consolidated Financial Statements.
Investing activities in 2006 and 2007 also included proceeds of $18.9 million relatedand $57.3 million respectively, directly attributable to theour sale of our Mexican subsidiary. Refer to Note 4 of our Consolidated Financial Statements.wireless discontinued operations.
Capital expenditures consist primarily of investment in field equipment, computer hardware and software and improvement of our physical properties in order to maintain suitable conditions to conduct our business.
Cash provided by financing activities from continuing operationsare summarized as follows (in millions):
| | 2004 | | 2005 | | 2006 | |
Financing activities: | | | | | | | |
Proceeds from issuance of common stock | | $ | 7.3 | | $ | 2.6 | | $ | 0.5 | |
Proceeds from issuance of common stock under employee stock purchase plan | | 3.4 | | 2.3 | | — | |
Borrowings under line of credit | | — | | — | | 85.0 | |
Repayment under line of credit | | — | | — | | (34.0 | ) |
Repayment of capital lease obligations | | (0.5 | ) | (0.4 | ) | (0.3 | ) |
Net cash provided by financing activities | | $ | 10.2 | | $ | 4.5 | | $ | 51.2 | |
| | 2005
| | 2006
| | 2007
| |
|---|
| Financing activities: | | | | | | | | | | |
| | Proceeds from issuance of common stock | | $ | 0.1 | | $ | 0.4 | | $ | — | |
| | Proceeds from issuance of common stock under employee stock purchase plan | | | 0.8 | | | — | | | — | |
| | Borrowings under credit facility and line of credit | | | — | | | 85.0 | | | 88.5 | |
| | Repayment under line of credit | | | — | | | (34.0 | ) | | (64.0 | ) |
| | Repayment of capital lease obligations | | | (0.4 | ) | | (0.3 | ) | | (0.4 | ) |
| | Debt issuance costs | | | (0.3 | ) | | (1.2 | ) | | (3.0 | ) |
| | |
| |
| |
| |
| | | Net cash provided by financing activities from continuing operations | | $ | 0.2 | | $ | 49.9 | | $ | 21.1 | |
| | |
| |
| |
| |
In 2005, we entered into a $15 million credit facility with KeyBank National Association (“KeyBank”("KeyBank") for general working capital requirements and to fund future acquisitions. We did not draw on this facility until 2006 and in October of 2006 we replaced this facility with an $85 million facility from KeyBank to fund the acquisition of MRC. During 2007, we entered into two amendments to our credit facility, one in March and the other in June, which reduced the total facility to $35 million as a result of the divestitures of our wireless network services businesses. In December 2007, we successfully negotiated a new $85.0 million credit facility with Key Bank, which was used primarily to fund the Haverstick acquisition.
Proceeds from the issuance of common stock from 2004in 2005 through 2006 are related to the exercise of employee stock options.
Cash provided by (used in) discontinued operations are summarizedas follows (in millions):
| | 2004 | | 2005 | | 2006 | | |
| | (Restated) | | (Restated) | | | |
| | 2005
| | 2006
| | 2007
| |
|---|
Operating cash flows | | | $ | 5.0 | | | | $ | (10.2 | ) | | $ | (0.8 | ) | Operating cash flows | | $ | 7.7 | | 6.4 | | $ | 0.2 | |
Investing cash flows | | | (2.9 | ) | | | (2.2 | ) | | (0.7 | ) | Investing cash flows | | (5.1 | ) | | (6.6 | ) | | (1.6 | ) |
| Financing cash flows | | Financing cash flows | | 4.0 | | 0.1 | | — | |
Effect of exchange rates on cash and cash equivalents | | | (0.1 | ) | | | 1.0 | | | 2.7 | | Effect of exchange rates on cash and cash equivalents | | 1.0 | | 2.7 | | 0.0 | |
Net cash flows of discontinued operations | | | $ | 2.0 | | | | $ | (11.4 | ) | | $ | 1.2 | | |
| | | | |
| |
| |
| |
| | | Net cash flows of discontinued operations | | $ | 7.6 | | $ | 2.6 | | $ | (1.4 | ) |
| | | | |
| |
| |
| |
Our decision to divest portionsInvesting cash flow consists of capital expenditures incurred by our business where critical mass had not been achieved led towireless network services segment. Financing cash flows is the divestitureresult of our EMEA operations and our South American operations. We recorded a gain of $3.3 million related to the sale of EMEA in the first quarter of 2007, the period in which the transaction was consummated. We also recorded an impairment charge of $5.2 million in the fourth quarter of 2006 to reduce the current carrying value of the South American operations to the estimated fair value based upon current indications of interest. The divestiture in April 2007 did not result in any additional impairment charges.
We are focused on effectively managing our overall liquidity position by continuously monitoring expenses, integrating effective cost savings programs and managing our accounts receivable collection efforts. We believe that our cash and cash equivalent balances, short-term investments and our credit facility (as discussed in Contractual Obligations and Commitments below) will be sufficient to satisfy cash requirements for at least the next twelve months basedproceeds received on the current levelexercise of operations andstock options by the Company’s plans for future acquisitions. Although we cannot accurately anticipate the effect of inflation on our operations, we do not believe that inflation or foreign currency fluctuation has had, or is likely in the foreseeable future to have, a material impact on our revenues or results of operations.wireless network services employees.
Contractual Obligations and Commitments /OffOff Balance Sheet Arrangements
We have no significant contractual obligations that are not fully recorded on our consolidated balance sheets or fully disclosed in the notes to our consolidated financial statements. We have no material off-balance sheet arrangements as defined in Regulation S-K 303(a)(4)(ii).
Contractual Obligations and Commitments
In connection with our business acquisitions, we have agreed to make additional future payments to sellers based on final purchase price adjustments and the expiration of certain indemnification obligations. Pursuant to the provisions of SFAS No. 141, such amounts are accrued, and therefore, recorded by the Company when the contingency is resolved beyond a reasonable doubt and, hence, the additional consideration becomes payable. As of December 31, 2006,In 2007, we had $4.6 million of working capital adjustments, $6.9 million of holdbacks for indemnification obligations, and $0.1 million of interest accrued for liabilities related to the MRC acquisition. In April 2007,paid $4.6 million of working capital adjustments and approximately $1.5$4.3 million of the holdback amounts were paid to the former MRC shareholders in accordance with the Purchase Agreement. The remaining $5.4As of December 31, 2007, we have approximately
$3.5 million of cash holdback amounts that will be released subject to indemnity rights due for the MRC and Haverstick acquisitions. The MRC payment of approximately $2.3 million is due in installments following 12April 2008 and 18 monthsthe remaining amounts for Haverstick of $1.2 million are due in December 2008 and September 2009. The holdback arrangements accrue interest in accordance to terms in the purchase agreements.
In addition to the indemnity holdback, the Haverstick Agreement also calls for a post closing working capital adjustment. On February 29, 2008 we provided the working capital calculation to Haverstick, which indicated a working capital adjustment was due to us primarily because the working capital, as calculated per the Agreement, was below the target amount. Haverstick has reviewed our working capital calculation and is not in agreement. Their response proposes that there is actually excess working capital of approximately $1.5 million. In accordance with the Agreement, we have fifteen days from the date of close.Haverstick's objection to resolve the disagreement. If resolution has not been achieved within the fifteen day period, we and Haverstick have five days to agree on a nationally recognized independent accounting firm to resolve the disagreement.
Pursuant to the stock purchase agreement for acquisitions made in 2003 in our ENS segment, we were obligated to pay additional consideration to the selling stockholders that was contingent upon the successful achievement of specific annual earnings targets, as defined in the stock purchase agreement. As of December 31, 2006, all earn-out performance periods ended and there is no additional contingent consideration earned or payments due related to the ENS acquisitions.
In connection with the Company’s acquisition of Defense Systems, Incorporated (“DSI”) in August 2004, additional consideration of up to $3.2 million could be earned by the former major stockholders of DSI over an 18 month period, based upon performance milestones related to certain specified contracts. As of December 31, 2006, the performance period had ended and no further contingent acquisition consideration was due. Approximately $2.8 million in additional consideration had been earned and paid related to the contract milestones achieved by DSI.
Any amounts earned by shareholders of acquired companies for which there were no continuous employment clauses will result in additional goodwill recorded for those acquisitions when the earn-out consideration is earned. There waswere no contingent considerationearn-out considerations in connection with the MRC acquisition,or Haverstick acquisitions, but in connection with future acquisitions, we may agree to make additional payments to sellers contingent upon achievement of performance milestones by the acquired entities.
On March 16, 2005, the Company entered into a credit agreement with KeyBank National Association (“KeyBank”) to provide a $15.0 million senior credit facility. KeyBank was designated as the sole arranger and sole book manager. The facility had a three-year term and could have been expanded to a $60.0 million facility. The Company used the facility for general corporate purposes and to fund acquisitions.
On October 2, 2006, the CompanyDecember 31, 2007, we entered into a new credit facility of $85.0 million with KeyBanc Capital Markets which replaced the October 2, 2006 credit agreement with Key Bank to provide an $85 million seniorBank. This credit facility which replaced the Company’s existing $15provides for two term loans consisting of a first lien term note of $50.0 million senior credit facility.and a second lien term note of $10.0 million, as well as, a first lien $25 million revolving line of credit. The facility$10.0 million term loan has a 5five and one half year term with principal payments required quarterly beginning on March 31, 2008 of $25,000 through March 31, 2013 with the final balance of $9.5 million due on June 30, 2013. The $50.0 million term loan has a five year term with principal payments required quarterly beginning on March 31, 2008 of $0.6 million in 2008, $1.3 million in 2009, $2.5 million in 2110, and $4.1 million in 2011 and 2012. The term loans have a provision which states that once the full amount of the note has been borrowed, the notes cannot be paid down and reborrowed again. The revolving line of credit has a four year term which expires on December 31, 2011 and contains provisions typical in such arrangements. All loans under the new credit facility have an interest payable onrate equal to a monthly basis. The Company wrote off $0.2 million in deferred fees relatedbase rate defined as a fluctuating rate per annum equal to the $15 million facilityhigher of (a) the Federal Funds Rate plus1/2 of 1% and incurred $1.2 million(b) the rate of interest in fees relatedeffect for such day as publicly announced from time to time by KeyBank as its "prime rate" plus a margin for the new facility which are being amortized over 5 years. At the Company’s option, interest is payable at the London Interbank Offer Rate plus 1.75-3.50%, or at the prime rate plus 0.30-0.75%, with either option adjusted quarterly basedterm loans of 6.5% to 7.5% and a margin of 1.0% to 3.25% on the company’s total net debt-to-EBITDA ratio.revolving line of credit. The Company hasapplicable margin at date of borrowing is determined by the ratio of our aggregate debt to our EBITDA for the previous four fiscal quarters. We used the credit facility to fund its acquisitionthe Acquisition of MRCHaverstick Consulting Inc. (Haverstick) and for general corporate purposes.
to retire outstanding debt under our October 2006 credit facility with Key Bank. The terms of the new credit agreement require the Companyus to provide certain customary covenants for a credit agreement, including certain financial covenants computedwhich vary by quarter. See schedules 7.12(a) through (e) to both the First Lien Credit Agreement and the Second Lien Credit Agreement which are filed as definedExhibits 10.1 and 10.2 respectively, to our Current Report on Form 8-K filed with the SEC on January 7, 2008, and which are incorporated herein by the terms of the agreement.reference.
As of December 31, 2007, our outstanding balance on the date of this Report, we believe we have cured our non-compliance with the covenants in the credit agreement requiring that we timely file our financial statements with the SEC. These financial covenants include a maximum total net debt leverage ratio of 4.00 to 1.00, a minimum liquidity ratio of 1.35 to 1.00, and a minimum fixed charge coverage ratio of 1.10 to 1.00. The Credit Facility is secured by a pledge of certain equity interests of certain of our subsidiaries and is collateralized by the assets of the Company. The facility contains customary events of default, including payment defaults, breaches of
representations and warranties, and covenant defaults. As of March 30, 2007, we were in technical default of this agreement as we had not yet filed our 10-K and 2006 audited financials. On April 6, 2007, we entered into an amendment to the credit agreement whereby Key Bank waived this technical default and provided an extension through April 30, 2007 for filing our 10-K and 2006 audited financial statements. On June 1, 2007, we entered into a second amendment to the credit agreement whereby Key Bank extended the original waiver for filing our 10-K and 2006 audited financial statementswas $75.5 million and the quarterly unaudited financial statements for the fiscal quarters ended March 31, 2007 and June 30, 2007 through September 30, 2007 and reduced the total Facility to $50 million to reflect the net pay downs of the revolving line of credit reflecting the divestitures of our EMEA business in March 2007 and our domestic Engineering business in June 2007. In addition, the second amendment provides for the further reduction of our credit facility to $35 million effective upon receipt of principal payments under the note received from the buyer of the domestic engineering business, which occurred on July 3, 2007.
The weighted average interest rate of ouron the debt borrowed during 2007 was 8.99% as of December 31, 2006.8.3%. This includes $0.3$3.5 million of interest expense and financing costs related to the originalOctober 2006 credit facility and the new facility dated December 31, 2007. The replacement of the Senior Credit FacilityOctober 2006 facility resulted in a write-off of $1.0 million in deferred financing costs. We have $3.3 million in deferred financing costs outstanding as
of December 31, 2007 which are related to the new facility and are being amortized over the four, five and five and one half year life of the respective underlying notes.
On February 11, 2008, we entered into three interest swap agreements with Key Bank, to fix the our LIBOR rate to an average of 3.16% for the term of the swap agreements. The effective date of the swaps were February 14, 2008. The notional amounts and expiration dates of the swap agreements are $15 million and March 31, 2010; $22.5 million and March 31, 2011; and $32.5 million and March 31, 2011.
In March 2008 we entered into a tentative agreement to settle the 2004 and 2007 securities class action litigation actions (described in Item 3 Legal Proceedings), and as a result, we recorded a $4.9 million charge in the fourth quarter ended December 31, 2007 to accrue our share of 2006.
On October 2, 2006, the Company acquired MRC,settlement amounts, and an estimate for a privately-held technical solutionscontingent liability associated with legal proceedings related to the derivative actions, net of the amounts to be covered by our insurance carriers. As a consequence of recording this legal settlement, we did not meet certain of the financial covenants in accordance with the Credit Agreement. Accordingly, on March 27, 2008, we obtained an amendment and services company focusedwaiver from our lenders to waive the impact of the legal settlement amounts on advanced telecommunications programs, softwareour financial covenants as of December 31, 2007 and IT solutions, product solutionsthe affected future periods. The amendment also amended the Credit Agreement to provide for an increase in the LIBOR floor rate to 4.25% and space programs. The purchase price wasto require that we set aside in a restricted account approximately $73.8 million, including a working capital adjustment50% of $4.6 million and transactions coststhe proceeds of $0.2 million. The Company paid $62.1 million at closing and $0.2 after closing in 2006. The remaining $6.9 million was held back to secure the Company’s indemnity rights and will be released, subject to indemnity rights, in installments following 6, 12, and 18 monthsrecovery from the datetheft of close.stock options by our former stock option administrator, or approximately $1.7 million, to fund these settlement amounts. The working capital adjustment of $4.6 million and $1.5 millionlenders have also reserved the right to require us to utilize the entire amount of the holdback was paid$3.4 million in proceeds received from the theft of stock options to permanently pay down indebtedness. This right can be exercised no earlier than 60 days from March 27, 2008 and expires upon our compliance with financial covenants under the previous MRC shareholders inCredit Agreement for the second quarterfour consecutive quarters commencing after January 1, 2008.
The net benefit of 2007. To fund the acquisition,swap agreements entered into by us on February 11, 2008 has been reduced by the Company used the new $85 million credit facility with KeyBank National Association. The results of MRC have beenLIBOR floor included in the Company’s consolidated statements of operationsamendment and waiver discussed above. The cost related to this amendment will be recorded as deferred financing costs for the period from the acquisition date of October 2, 2006credit facility in the fourthfirst quarter of 2006.2008.
The following table summarizes our currently existing contractual obligations and other commitments at December 31, 2006,2007, and the effect such obligations could have on our liquidity and cash flow in future periods (in millions):
| | Payments due/forecast by Period | |
| | Payments due/forecast by Period
|
|---|
| | Total | | 2007 | | 2008-2009 | | 2010-2011 | | 2012
and After | |
| | Total
| | 2008
| | 2009-2010
| | 2011-2012
| | 2013 and After
|
|---|
Total debt, net of interest(1) | | $ | 51.0 | | $ | 48.0 | | | $ | 3.0 | | | | $ | — | | | | $ | — | | | |
| Long-term debt, net of interest(1) | | Long-term debt, net of interest(1) | | $ | 75.5 | | $ | 1.9 | | $ | 24.0 | | $ | 43.6 | | $ | 6.0 |
Capital leases(5) | | 0.4 | | 0.4 | | | 0 | | | | — | | | | — | | | Capital leases(5) | | 1.2 | | 0.1 | | 0.2 | | 0.3 | | 0.6 |
Estimated interest on debt(2) | | 10.1 | | 4.0 | | | 4.8 | | | | 1.3 | | | | — | | | Estimated interest on debt(2) | | 21.6 | | 7.4 | | 10.6 | | 3.5 | | 0.1 |
Other liabilities(3) | | 11.7 | | 9.8 | | | 1.7 | | | | 0.1 | | | | 0.1 | | | Other liabilities(3) | | 3.5 | | 2.9 | | 0.6 | | — | | — |
Purchase orders(4) | | 9.0 | | 9.0 | | | — | | | | — | | | | — | | | Purchase orders(4) | | 43.7 | | 40.7 | | 1.5 | | 0.6 | | 0.9 |
Operating leases(5) | | 20.0 | | 5.8 | | | 9.9 | | | | 3.6 | | | | 0.7 | | | Operating leases(5) | | 16.3 | | 5.6 | | 8.0 | | 1.8 | | 0.9 |
Total commitments and recorded
liabilities | | $ | 102.2 | | $ | 76.8 | | | $ | 19.4 | | | | $ | 5.0 | | | | $ | 0.8 | | | |
| Interpretation 48 obligations, including interest and penalties(6) | | Interpretation 48 obligations, including interest and penalties(6) | | 3.9 | | 1.4 | | 1.2 | | 0.5 | | 0.8 |
| | | | |
| |
| |
| |
| |
|
| | | Total commitments and recorded liabilities | | $ | 165.7 | | $ | 60.0 | | $ | 46.1 | | $ | 50.3 | | $ | 9.3 |
| | | | |
| |
| |
| |
| |
|
- (1)
The Key Bank Line of Credit.Credit Facility. The payments shown are our present forecast which contemplates that we will pay off the Key Bank LOCCredit Facility by the due date of October 2011.June 2013. The annual payment requirements for long-term debt obligations are $2.6 million in 2008, $15.2 million in 2009
to 2010, $32.7 million in 2011 to 2012, and $9.5 million in 2013. See “Notes"Notes to Consolidated Financial Statements”Statements" Note 8(a) for further details.
- (2)
Includes interest payments based on current interest rates for variable rate debt.debt and fixed rate debt based upon our swap arrangements. See “Notes"Notes to Consolidated Financial Statements”Statements" Note 8(a) for further details.80
(3)
Primarily the obligations under the working capital adjustment clause and holdback payments related to the acquisition of MRC.MRC and Haverstick. See “Notes"Notes to Consolidated Financial Statements”Statements" Note 6 for further details.
(4)Purchase orders include commitments in which a written purchase order has been issued to a vendor, but the goods have not been received or services have not been performed.
(5)See “Notes "Notes to Consolidated Financial Statements”Statements" Note 910 for further details.
(6)The Company had $3.6FIN 48 obligations shown in the above table represent certain uncertain tax positions. The years for which the uncertain tax positions will reverse have been estimated in scheduling the obligations in the table above. As of December 31, 2007 we have $2.4 million of standby letters of credit primarilyoutstanding. Our letters of credit are related to itsour workers compensation program, as support for our performance bond program and performance bonds. The Company had $1.0 million in restricted cash. The restricted cash was related to a $1.0 million standby letter of credit for performance of an international contract that we acquired with MRC. The Company has replaced the letter of credit with one issued under its KeyBank facility and is in the process of getting the original letter of credit and restricted cash released.
our work overseas. Additional information regarding our financial commitments at December 31, 20062007 is provided in the notes to our consolidated financial statements. See “Notes"Notes to Consolidated Financial Statements, Note 16—Commitments and Contingencies.”"
Other thanLiquidity Matters
We intend to fund our normal recurring trade payables, expense accruals, accrued payments related to acquisitions, debt related to our Credit Facility and operating and capital leases which are currently expected to be funded through existing working capital and futurecash requirements with cash flows from operations,operating activities, and borrowings under our current Credit Facilities and future Credit Facilities. We believe these sources should be sufficient to meet our cash needs for at least the professional fees relatednext 12 months. However, we expect to pay for the settlement of our Equity Award Review, which currently aggregate approximately $12 million, we have no other material cash commitments. Aside from these recurring expenses, future capital expenditures and overall expansion including potential future acquisitions, our future capital needs will depend upon many factors, includingshareholder litigation in the timingsecond half of payments under existing contracts and technology requirements within the wireless telecommunications industry. Other future cash requirements may include the payment of certain tax contingencies,2008 as discussed in Note 16 of17—Legal Matters to our audited consolidated financial statements included in Item 15 of Part IV of this Annual Report and potential future acquisitions. We continuewe may need to evaluate and use new technology including electronic equipment and software in our business operations. Additional capital expenditures may be required as deemed necessary, in orderraise additional funds to stay competitive and effectively service our customers.
Management’s Discussion and Analysis of Financial Condition and Results of Operations (“MD&A”)
The MD&A below reflects the discussion and analysis of our results of operationspay for the interim periods of March, June and September of 2005 comparedthis settlement. In addition, if we become subject to significant judgments, settlements or fines related to the same periods of 2006, as adjusted to reflect the restatement related to our Equity Award Review (asmatters discussed in Note 217—Legal Matters to the Financial Statements). In addition, the recent discontinuanceour audited consolidated financial statements included in Item 15 of Part IV of this Annual Report, or any other matters, or incur legal fees in excess of our international operations (our Europeancurrent expectations, we could be required to make significant payments that could materially and Brazilian operations) has also been reflected as discontinued operationsadversely affect our financial condition, potentially impacting our ability to access the capital markets and our compliance with our debt covenants.
As discussed in allPart II, Item 1A, "Risk Factors" section of this Annual Report on Form 10-K, our quarterly and annual operating results have fluctuated in the periods discussed.
Comparisonpast and may vary in the future due to a variety of Results for the Three Months Ended March 31, 2005 to the Three Months Ended March 31, 2006
Revenues.Revenues decreased $4.9 million from $81.2 million for the quarter ended March 31, 2005 to $76.3 million for the quarter ended March 31, 2006. The decline was primarily attributedfactors, many of which are external to our Enterprise Network Services segment, primarily ascontrol. If the conditions in our industry deteriorate or our customers cancel or postpone projects or if we are unable to sufficiently increase our revenues or further reduce our expenses, we may experience, in the future, a resultsignificant long-term negative impact to our financial results and cash flows from operations. In such a situation we could fall out of customer delays and the impact of personnel turnovercompliance with our financial and other related activities that occurred immediately following the completion of the earn—out period in one of the acquired entities.
Revenues by operating segment for the quarters ended March 31, 2005covenants which, if not waived, could limit our liquidity and 2006 were as follows (in millions):
| | 2005 | | 2006 | | $ change | | % change | |
Wireless network services | | $ | 44.2 | | $ | 43.4 | | | $ | (0.8 | ) | | | (1.8 | )% | |
Enterprise network services | | 17.1 | | 12.6 | | | (4.5 | ) | | | (26.3 | )% | |
Government network services | | 19.9 | | 20.3 | | | 0.4 | | | | 2.0 | % | |
Total revenues | | $ | 81.2 | | $ | 76.3 | | | $ | (4.9 | ) | | | (6.0 | )% | |
Cost of Revenues.Cost of revenues increased slightly from $63.2 million for the quarter ended March 31, 2005 to $63.8 million for the quarter ended March 31, 2006. Included in the increase of cost of revenues is $0.4 million of stock—based compensation in the first quarter of 2006 as a result of the adoption of SFAS 123R, compared to $0.1 million of stock—based compensation expense in the first quarter of 2005. Gross margin during the quarter ended March 31, 2006 decreased from 22.2% to 16.4% of total revenues compared to the quarter ended March 31, 2005. The decrease in gross margin primarily resulted from project cost overruns and execution issues, including in particular, re—work required because of substandard subcontract work, as well as the impact of our customers’ delayed building of previously scheduled sites under certain domestic deployment contracts for which we will not be compensated for the impact of delays.
Selling, General and Administrative Expenses.Selling, general and administrative expenses increased as a percentage of revenue from 17.9% to 18.4% for the quarters ended March 31, 2005 and 2006, respectively, primarily due to our adoption of SFAS No. 123R, which resulted in $0.5 million stock—based compensation expense in the first quarter of 2006, compared to $0.1 million of stock—based compensation expense recorded in 2005.
Other Income, Net.Net other income remained consistent at $0.2 million for the quarters ended March 31, 2005 and 2006.
Provision for Income Taxes.Our effective income tax rate for the quarter ended March 31, 2005 was a provision of 41.7% compared to a benefit of 27.1% for the quarter ended March 31, 2006. The effective tax benefit rate for the quarter ended March 31, 2006 is lower than federal and state statutory rates primarily due to nondeductible permanent tax items which were more than offset by the realization of tax expense through the increase in our valuation allowance and an increase in the income tax reserve.
Income from Discontinued Operations. Income from discontinued operations decreased from $1.3 million for the three months ended March 31, 2005 to $0.2 million for the three months ended March 31, 2006. The decrease of $1.1 million resulted primarily from the wind—down of operations in the Latin American operations at the end of 2005 and the sale of the Mexico operation effective on February 17, 2006.
Comparison of Results for the Three Months Ended June 30, 2005 to the Three Months Ended June 30, 2006
Revenues. Revenues decreased $4.0 million from $83.5 million for the three months ended June 30, 2005 to $79.5 million for the three months ended June 30, 2006. The decrease was primarily attributable to a decrease in our Enterprise Network Services segment, primarily as a result of customer delays and the impact of personnel turnover and other related activities that occurred immediately following the completion of the earn—out period in two of the acquired entities in the first quarter of 2006. The customer delays as well as the rebuilding of the management teams did not return to normalcy until later in the second quarter of 2006, resulting in reduced revenues and operating margins for both the first and second quarters for the Enterprise Network Services segment.
Revenues by operating segment for the three months ended June 30, 2005 and 2006 were as follows (in millions):
| | 2005 | | 2006 | | $ change | | % change | |
Wireless network services | | $ | 45.8 | | $ | 45.3 | | | $ | (0.5 | ) | | | (1.1 | )% | |
Enterprise network services | | 16.3 | | 13.5 | | | (2.8 | ) | | | (17.2 | )% | |
Government network services | | 21.4 | | 20.7 | | | (0.7 | ) | | | (3.3 | )% | |
Total revenues | | $ | 83.5 | | $ | 79.5 | | | $ | (4.0 | ) | | | (4.8 | )% | |
Cost of Revenues. Cost of revenues increased from $64.0 million for the three months ended June 30, 2005 to $64.9 million for the three months ended June 30, 2006. The increase in cost of revenues includes an increase of $0.4 million of stock—based compensation expense in 2006. Stock—based compensation expense increased from a net credit of $0.1 million in the second quarter of 2005, which reflected the net reduction of previously recorded payroll tax contingencies related to stock—based compensation, to $0.3 million in the second quarter of 2006 as a result of the Company’s adoption of SFAS 123R in 2006. Gross margin during the three months ended June 30, 2006 decreased from 23.3% in the second quarter of 2005 to 18.4%. The decrease in gross margin primarily resulted from the impact of competitive pricing pressures that we were experiencing in our legacy Radio Frequency engineering business in the U.S., as well as the impact of a large national deployment program which we were recording a zero profit margin since we had not yet received the requisite purchase orders from our customer to record the anticipated profit margin on the project.
Selling, General and Administrative Expenses. Selling, general and administrative expenses decreased from $15.4 million in the three months ended June 30, 2005 to $13.8 million in the three months ended June 30, 2006. Included in the second quarter 2006 SG&A is $0.5 million stock—based compensation expense resulting from our adoption of SFAS No. 123R. This was compared to a net credit of $0.1 million stock—based compensation expense recorded in 2005, reflecting a net reduction of previously recorded payroll tax contingencies related to stock—based compensation. Included in the second quarter of 2005 SG&A is approximately $1.0 million of professional fees primarily related to our 2005 annual audit and compliance with Sarbanes Oxley. The remaining reduction year over year is a result of cost reduction measures we have taken in 2006.
Other Income (Expense), Net. For the three months ended June 30, 2005, net other expense was $0 compared to net other income of $0.2 million for the three months ended June 30, 2006. The income for the three months ended June 30, 2006 was primarily attributable to the interest income on the Note Receivable relating to the sale of our Mexican subsidiary offset by interest expense for the borrowings on the Line of Credit.
Provision(Benefit) for Income Taxes. Our effective income tax rate for the three months ended June 30, 2005 was 35% compared to a provision of 40% for the three months ended June 30, 2006.
Income (loss) from Discontinued Operations.Income (loss) from discontinued operations decreased from income of $0.9 million for the three months ended June 30, 2005 to a loss of $1.3 million for the three months ended June 30, 2006. The decrease of $2.2 million resulted from the wind—down of operations in the Latin American operations at the end of 2005 and the sale of the Mexico operation effective on February 17, 2006.
Comparison of Results for the Three Months Ended September 30, 2005 to the Three Months Ended September 30, 2006
Revenues. Revenues decreased $8.8 million from $86.7 million for the three months ended September 30, 2005 to $77.9 million for the three months ended September 30, 2006. The $8.8 million decrease was attributable to a decline of $8.2 million in our Wireless Network Services segment, primarily
as a result of schedule delays resulting in part from our customer’s delays of expenditures which was attributed to the capital requirements to support bids in anticipation of capital funding required for the AWS auction in September 2006, the impact of the merger of one of our carrier customers in 2005, as well as pricing pressures experienced in our legacy RF business in the U.S.. The reduction in our domestic revenues was also impacted by a decline of $1.3 million in our Government Network Services business resulting from program delays and program reductions from two of our DOD customers offset partially by an increase of $0.7 million in our Enterprise Network Services segment.resources.
Revenues by operating segment for the three months ended September 30, 2005 and 2006 are as follows (in millions):
| | 2005 | | 2006 | | $ change | | % change | |
Wireless network services | | $ | 49.2 | | $ | 41.0 | | | $ | (8.2 | ) | | | (16.7 | )% | |
Enterprise network services | | 16.1 | | 16.8 | | | 0.7 | | | | 4.3 | % | |
Government network services | | 21.4 | | 20.1 | | | (1.3 | ) | | | (6.1 | )% | |
Total revenues | | $ | 86.7 | | $ | 77.9 | | | $ | (8.8 | ) | | | (10.1 | )% | |
Cost of Revenues. Cost of revenues decreased from $66.1 million for the three months ended September 30, 2005 to $63.4 million for the three months ended September 30, 2006 primarily as a result of the reduction in revenues. The decrease in cost of revenues includes an increase of $0.2 million of stock—based compensation in the third quarter of 2006 as a result of the adoption of SFAS 123R, compared to $0.2 million of stock—based compensation expense recorded in 2005. Gross margin during the three months ended September 30, 2006 decreased from 23.8% in the third quarter of 2005 to 18.6%. The decrease in gross margin primarily resulted from the impact of competitive pricing pressures that we were experiencing in our legacy Radio Frequency engineering business in the U.S. In addition, gross margins were negatively impacted by a large national deployment program under which the customer was issuing purchase orders for each separate phase of the project, rather than for the entire project, resulting in our recording zero profit margin or below the anticipated projected margin at completion on the projects. We have not recorded the anticipated profit margin on the project until we receive the requisite purchase orders from the customer.
Selling, General and Administrative Expenses. Selling, general and administrative expenses decreased from $15.0 million in the three months ended September 30, 2005 to $13.9 million in the three months ended September 30, 2006. Included in the third quarter 2006 SG&A is $0.5 million stock—based compensation expense resulting from our adoption of SFAS No. 123R, compared to $0.1 million of stock—based compensation expense recorded in 2005. The reduction year over year is primarily a result of the reduced revenue volume discussed previously as well as the impact of cost reduction measures we had taken in 2006.
Contingent Acquisition Consideration.Included in the third quarter 2005 operating results is a credit of $2.5 million resulting from the reduction of estimated earn—out consideration related to our acquisitions of certain of the ENS companies in 2003 which had been previously accrued in September 2004.
Other Income (Expense), Net. For the three months ended September 30, 2005, net other expense was $0 as compared to net other income of $0.1 million for the three months ended September 30, 2006. The change is primarily attributable to the interest income recorded in the three months ended September 30, 2006 on the Note Receivable relating to the sale of our Mexican subsidiary partially offset by interest expense for the borrowings on the Line of Credit.
Provision for Income Taxes. Our effective income tax rate for the three months ended September 30, 2005 was a provision of 19.8% compared to a benefit of 41.7% for the three months ended September 30, 2006.
Loss from Discontinued Operations.Loss from discontinued operations decreased from $1.6 million for the three months ended September 30, 2005 to $1.2 million for the three months ended September 30, 2006. The decrease of $0.4 million resulted from the wind—down of operations in the Latin American operations at the end of 2005 and the sale of the Mexico operation effective on February 17, 2006.
Critical Accounting Principles and Estimates
We have identified the following critical accounting policies that affect our more significant judgments and estimates used in the preparation of our consolidated financial statements. The preparation of our financial statements in conformity with accounting principles generally accepted in
the United States of America requires us to make estimates and judgments that affect the reported amounts of assets and liabilities, stockholders’stockholders' equity, revenues and expenses, and related disclosures of contingent assets and liabilities. On a periodic basis, as deemed necessary, we evaluate our estimates, including those related to revenue recognition, allowance for doubtful accounts, valuation of long-lived assets including identifiable intangibles and goodwill, accounting for income taxes including the related valuation allowance, accruals for partial self-insurance, contingencies and litigation and contingent acquisition consideration. We explain these accounting policies in the notes to the audited consolidated financial statements and at relevant sections in this discussion and analysis. These estimates are based on the information that is currently available and on various other assumptions that are believed to be reasonable under the circumstances. Actual results could vary from those estimates under different assumptions or conditions.
Revenue recognition. We derive a significant percentage of our revenue from long-term contracts and account for these contracts under the provisions of Statement of Position 81-1, “Accounting"Accounting for Performance of Construction-Type and Certain Production-Type Contracts”Contracts". Revenue on time and materials contracts is recognized as services are rendered at contracted labor rates plus material and other direct costs incurred. The portion of our revenue derived from fixed-price contracts accounted for approximately 64.3%51.1% of our revenues for 2006.2007. Revenue on fixed-price contracts is recognized using the percentage-of-completion method based on the ratio of total costs incurred to date compared to estimated total costs to complete the contract. Estimates of costs to complete include material, direct labor, overhead, and allowable general and administrative expenses for our government contracts. These cost estimates are reviewed and, if necessary, revised monthly on a contract-by-contract basis. If, as a result of this review, we determine that a loss on a contract is probable, then the full amount of estimated loss is charged to operations in the period it is determined that it is probable a loss will be realized from the full performance of the contract. In certain instances in which it is impractical to estimate the final outcome of the project margin, but it is certain that we will not incur a loss on the project, we may record revenue equal to cost incurred, at zero margin. In the event that our cost incurred to date may be in excess of our funded contract value, we may defer those costs until the associated contract value has been funded by the customer. Once the final estimate of the outcome of the project margin is determined, we will record revenue using the percentage-of-completion method of accounting based on the ratio of total costs incurred to date compared to the estimated total costs to complete the project. Significant management judgments and estimates, including but not limited to the estimated costs to complete projects, must be made and used in connection with the revenue recognized in any accounting period. The revenue we recognize in a given reporting period depends on: (1) the costs we have incurred for individual projects; (2) our then current estimate of the total remaining costs to complete individual projects; and (3) the current estimated contract value associated with the projects. If, in any period, we increase or decrease our estimate of the total costs to complete a project, and/or reduce or increase the associated contract value, revenue for that period would be impacted. As a result, our gross margin in such period and in future periods may be affected. To the extent that our estimates fluctuate over time or differ from actual results, gross margins in subsequent periods may vary significantly from our estimates. Material differences may result in the amount and timing of our revenue for any period if management made different judgments or utilized different estimates.
A cancellation, schedule delay, or modification of a fixed-price contract which is accounted for using the percentage-of-completion method may adversely affect our gross margins for the period in which the contract is modified or cancelled. Under certain circumstances, a cancellation or negative modification could result in us having to reverse revenue that we recognized in a prior period, thus significantly reducing the amount of revenues we recognize for the period in which the adjustment is made. Correspondingly, a positive modification may positively affect our gross margins. In addition, a schedule delay or modifications can result in an increase in estimated cost to complete the project, which would also result in an impact to our gross margin.
In addition, many of our contracts include milestone billings. If a contract is terminated or if the scope of a contract changes prior to a milestone billing, the amount of revenue we recognize may change, based upon the specific termination clauses of the contract, which would affect our revenue and gross margin in the period in which the contract is terminated or the scope is changed.
During the reporting periods contained herein, we did experience revenue and margin adjustments of certain projects based on the aforementioned factors.
Allowance for doubtful accounts. We maintain an allowance for doubtful accounts for estimated losses resulting from the potential inability of certain customers to make required future payments on amounts due to us. Management determines the adequacy of this allowance by periodically evaluating the aging and past due nature of individual customer accounts receivable balances and considering the customer’scustomer's current financial situation as well as the existing industry economic conditions and other relevant factors that would be useful towards assessing the risk of collectibility. If the future financial condition of our customers were to deteriorate, resulting in their inability to make specific required payments, additions to the allowance for doubtful accounts may be required. In addition, if the financial condition of our customers improves and collections of amounts outstanding commence or are reasonably assured, then we may reverse previously established allowances for doubtful accounts. Changes to estimates of contract value are recorded as adjustments to revenue and not as a component of the allowance for doubtful accounts. We write off accounts receivable when they become uncollectible and payments subsequently received on such receivables are credited to the allowance for doubtful accounts.
Long-lived and Intangible Assets. We account for long-lived assets in accordance with the provisions of SFAS No. 144,Accounting for the Impairment or Disposal of Long-Lived Assets (“ ("SFAS 144”144"). SFAS 144 addresses financial accounting and reporting for the impairment or disposal of long-lived assets. This Statement requires that long-lived assets be reviewed for impairment whenever events or changes in circumstances indicate that the carrying amount of an asset may not be recoverable. Recoverability is measured by comparing the carrying amount of an asset to the expected future net cash flows generated by the asset. If it is determined that the asset may not be recoverable and if the carrying amount of an asset exceeds its estimated fair value, an impairment charge is recognized to the extent of the difference. SFAS 144 requires companies to separately report discontinued operations, including components of an entity that either have been disposed of (by sale, abandonment or in a distribution to owners) or classified as held for sale. Assets to be disposed of are reported at the lower of the carrying amount or fair value less costs to sell.
In accordance with SFAS 144, we assess the impairment of identifiable intangibles and long-lived assets whenever events or changes in circumstances indicate that the carrying value may not be recoverable. Factors we consider important which could individually or in combination trigger an impairment review include the following:
·
- •
- significant underperformance relative to expected historical or projected future operating results;
·
- •
- significant changes in the manner of our use of the acquired assets or the strategy for our overall business;
·
- •
- significant negative industry or economic trends;
·
- •
- significant decline in our stock price for a sustained period; and
·
- •
- our market capitalization relative to net book value.
If we determined that the carrying value of intangibles and long-lived assets may not be recoverable based upon the existence of one or more of the above indicators of impairment, we would record an impairment equal to the excess of the carrying amount of the asset over its estimated fair value.
On a quarterly basis, we assess whether events or changes in circumstances have occurred that potentially indicate the carrying value of long-lived assets may not be recoverable.
In December 2005, our Board made the decision to exit our Mexico and South American deployment business and in December 2006, our Board made the decision to exit our EMEA and remaining South American businesses. Accordingly, all results for these operations for the periods presented have been reflected as discontinued operations. We also recorded an impairment of approximately $5.2 million on our Brazilian operations as a result of the indications of fair value we have had with various interested parties.
Our ENS segment had built, installed and operated a wireless LAN system at a number of shopping malls in the United States. This network was developed to offer internet connectivity for a fee to customers and tenants at the malls. The market for these services has changed over the last year with the emergence of free WiFi and WiMAX and this has resulted in significantly reduced expectations for future revenue and profits related to the realizability of this asset. Based upon an analysis of the expected future cash flows from this asset in accordance with SFAS No. 144, we determined that the full value of this asset, approximately $1.8 million was impaired.
Goodwill and Purchased Intangible Assets. We evaluate our goodwill and intangible assets for impairment pursuant to SFAS No. 142,Goodwill and Other Intangible Assets (“ ("SFAS 142”142"), which provides that goodwill and other intangible assets with indefinite lives are not amortized but tested for impairment annually or more frequently if circumstances indicate potential impairment. The impairment test is comprised of two steps:
(1) A reporting unit’sunit's fair value is compared to its carrying value. The carrying values of each reporting unit are determined by specifically identifying and allocating the assets and liabilities of the Company to each reporting unit based on headcount, relative revenues or costs, or other methods as deemed appropriate by management. If the fair value is less than its carrying value, impairment is indicated;
(2) if impairment is indicated in the first step, it is measured by comparing the implied fair value of goodwill and intangible assets to their carrying value at the reporting unit level.
We completed the required impairment review at the end of 2005 and 2004 and noted no impairment. Consequently, no impairment charges were recorded. In 2006 our annual test indicated that there was no impairment of goodwill or intangibles for our WNS or GNS segments but that the total amount of goodwill for our ENS segment, approximately $18.3 million, was impaired. Due to a loss of management earlier this year as a result of the completion of earn-outs on some of our ENS acquisitions at the end of 2005, our ENS operations experienced an underperformance relative to historic operating results in 2006 and this impacted our projected future performance. The fair value of the goodwill was estimated using these projections and a combination of a discounted cash flow model and a market approach model that takes into consideration comparable business and market transactions. We also concluded based on this analysis the intangible assets for ENS were not impaired.
Accounting for income taxes and tax contingencies. In July 2006, the FASB issued FASB Interpretation No. 48, "Accounting for Uncertainty in Income Taxes" ("Interpretation No. 48"). Interpretation No. 48 clarifies the accounting for uncertainty in income taxes recognized in an enterprise's financial statements in accordance with SFAS No. 109, "Accounting for Income Taxes." Interpretation No. 48 prescribes a recognition threshold and measurement attribute for the financial statement recognition and measurement of a tax position taken or expected to be taken in a tax return. Interpretation No. 48 also provides guidance on derecognition, classification, interest and penalties, accounting in interim periods, disclosure and transition. We adopted the provisions of Interpretation No. 48 effective January 1, 2007.
As part of the process of preparing our consolidated financial statements we are required to estimate our provision for income taxes in each of the tax jurisdictions in which we conduct business. This process involves estimating our actual current tax expense in conjunction with the evaluation and measurement of temporary differences resulting from differing treatment of certain items for tax and accounting purposes. These temporary differences result in the establishment of deferred tax assets and liabilities, which are recorded on a net basis and included in our consolidated balance sheet. We then assess on a periodic basis the probability that our net deferred tax assets will be recovered and, therefore realized from future taxable income and to the extent we believe that recovery is not more likely than not, a valuation allowance is established to address such risk resulting in an additional related provision for income taxes during the period.
Significant management judgment is required in determining our provision for income taxes, our deferred tax assets and liabilities, tax contingencies, unrecognized tax benefits, and any required valuation allowance, including taking into consideration the probability of the tax contingencies being incurred. Management assesses this probability based upon information provided to us by our tax advisors, our legal advisors and similar tax cases. If at a later time our assessment of the probability of these tax contingencies changes, our accrual for such tax uncertainties may increase or decrease.
We have a valuation allowance at December 31, 2006,2007, due to management’smanagement's overall assessment of risks and uncertainties related to our future ability to realize and, hence, utilize certain deferred tax assets, primarily consisting of net operating losses, carry forward temporary differences and future tax deductions resulting from certain types of stock option exercises, before they expire. Management determined that an increase to the valuation allowance was required at December 31, 2006 based upon its overall assessment of the risks and uncertainties related to our future ability to realize and utilize our deferred tax assets.
The 20062007 effective tax rate at December 31, 20062007 for annual and interim reporting periods could be impacted if certainuncertain tax itemspositions that are reserved fornot recognized at December 31, 20062007 are resolvedsettled at an amount which differs from our estimate. Finally, during 2007,2008, if we are impacted by a change in the valuation allowance as of December 31, 20062007 resulting from a change in judgment regarding the
realizability of deferred tax assets beyond December 31, 2006,2007, such effect will be recognized in the interim period in which the change occurs.
Accrual for partial self-insurance. We maintain an accrual for our health and workers compensation partial self-insurance, which is a component of total accrued expenses in the consolidated balance sheets. Management determines the adequacy of these accruals based on a monthly evaluation of our historical experience and trends related to both medical and workers compensation claims and payments, information provided to us by our insurance broker, industry experience and average lag period in which claims are paid. If such information indicates that our accruals require adjustment, we will, correspondingly, revise the assumptions utilized in our methodologies and reduce or provide for additional accruals as deemed appropriate. As of December 31, 2006, the accrual for our partial self-insurance programs approximated $1.8 million. We also carry stop-loss insurance that provides coverage limiting our total exposure related to each medical and workers compensation claim incurred, as defined in the applicable insurance policies. The medical and workers compensation limits per claim are $100,000 and $250,000, respectively.
Contingencies and litigation. We are currently involved in certain legal proceedings. We estimate a range of liability related to pending litigation where the amount and range of loss can be estimated. We record our estimate of a loss when the loss is considered probable and estimable. Where a liability is probable and there is a range of estimated loss and no amount in the range is more likely than any other number in the range, we record the minimum estimated liability related to the claim in accordance with SFAS No. 5, “Accounting"Accounting for Contingencies.”" As additional information becomes available, we assess the potential liability related to our pending litigation and revise our estimates. Revisions in our estimates of
potential liability could materially impact our results of operations. See Part II, Item 1 “Legal Proceedings”"Legal Proceedings" for additional information.
Share-Based Payments.Beginning in fiscal year 2006, we account for share-based compensation arrangements in accordance with the provisions of Statement of Financial Accounting Standards No. 123R (“("SFAS 123R”123R") “Share-Based"Share-Based Payments,”" which requires the measurement and recognition of compensation expense for all share-based payment awards to employees and directors based on estimated fair values. Prior to adoption of SFAS 123R, we accounted for share-based compensation using the intrinsic value-based method in accordance with Accounting Principles Board (APB) Opinion No. 25, “Accounting"Accounting for Stock Issued to Employees.”" We adopted SFAS 123R using the modified prospective transition method.
The valuation provisions of SFAS 123R apply to new awards and to awards that are outstanding on the effective date and subsequently modified or cancelled. Under the modified prospective application, which we used, prior periods are not revised for comparative purposes. We use the Black-Scholes option valuation model to estimate the fair value of our stock options at the grant date. The Black-Scholes option valuation model was developed for use in estimating the fair value of traded options which have no vesting restrictions and are fully transferable. Our employee stock options are generally subject to vesting restrictions and are generally not transferable.
Option pricing models require the input of highly subjective assumptions including the expected stock price volatility over the term of the award, the expected life of an option and the number of awards ultimately expected to vest. Changes in these assumptions can materially affect the fair value estimates of an option. Furthermore, the estimated fair value of an option does not necessarily represent the value that will ultimately be realized by an employee. We used historical data to estimate the expected forfeiture rate, intrinsic and historical data to estimate the expected price volatility, and a weighted-average expected life formula to estimate the expected option life. The risk-free rate is based on the U.S. Treasury yield curve in effect at the time of grant for the estimated life of the option.
Estimates of share-based compensation expenses are significant to our consolidated financial statements, but these expenses are based on option valuation models and will never result in the
payment of cash by us. For this reason, and because we do not view share-based compensation as related to our operational performance, we exclude estimated share-based compensation expense when evaluating the business performance of our operating segments.
Recently Issued Accounting Pronouncements
In June 2006, FASB issued Interpretation No. 48, Accounting for Uncertainty in Income Taxes—an interpretation of FASB Statement No. 109 (FIN 48), which clarifies the accounting for uncertainty in tax positions. This Interpretation requires that we recognize the impact of a tax position in our financial statements, if that position is more likely than not of being sustained on audit, based on the technical merits of the position. The provisions of FIN 48 are effective for fiscal years beginning after December 15, 2006, with the cumulative effect of the change in accounting principle recorded as an adjustment to opening retained earnings. The application of this Statement will reducereduced our retained earnings on January 1, 2007 by $0.3$0.1 million to increase reserves for uncertain tax positions.
The SEC issued Staff Accounting Bulletin No. 108 (“("SAB 108”108") in September 2006. SAB 108 expresses the views of the SEC staff regarding the process of quantifying the materiality of financial misstatements. SAB 108 requires both the balance sheet and income statement approaches be used when quantifying the materiality of misstatement amounts. In addition, SAB 108 contains guidance on correcting errors under the dual approach and provides transition guidance for correcting errors existing in prior years. SAB 108 was effective in the Company’sCompany's fourth quarter of 2006. The adoption of SAB 108 did not have a material impact on the Company’sCompany's consolidated financial statements.
In September 2006, the FASB issued SFAS No. 157, “Fair"Fair Value Measurements” (“Measurements" ("SFAS 157”157"). This new standard provides guidance for using fair value to measure assets and liabilities and information about the extent to which companies measure assets and liabilities at fair value, the information used to measure fair value, and the effect of fair value measurements on earnings. This framework is intended to provide increased consistency in how fair value determinations are made under various existing accounting standards which permit, or in some cases require, estimates of fair market value. SFAS 157 also expands financial statement disclosure requirements about a company’scompany's use of fair value measurements, including the effect of such measures on earnings. The provisions of SFAS 157 are effective for financial statements issued for fiscal years beginning after November 15, 2007. The Company is in the process of determining the impact of this statement on its consolidated financial statements.
In February 2007, the FASB issued FASB Statement No. 159,The Fair Value Option for Financial Assets and Financial Liabilities—Including an Amendment of FASB Statement No. 115. This standard permits an entity to choose to measure many financial instruments and certain other items at fair value. This option is available to all entities, including not-for-profit organizations. Most of the provisions in Statement 159 are elective; however, the amendment to FASB Statement No. 115,Accounting for Certain Investments in Debt and Equity Securities applies to all entities with available-for-sale and trading securities. Some requirements apply differently to entities that do not report net income. The FASB’sFASB's stated objective in issuing this standard is as follows: “to"to improve financial reporting by providing entities with the opportunity to mitigate volatility in reported earnings caused by measuring related assets and liabilities differently without having to apply complex hedge accounting provisions.”"
The fair value option established by Statement 159 permits all entities to choose to measure eligible items at fair value at specified election dates. A business entity will report unrealized gains and losses on items for which the fair value option has been elected in earnings (or another performance indicator if the business entity does not report earnings) at each subsequent reporting date. A not-for-profit organization will report unrealized gains and losses in its statement of activities or similar statement. The fair value option: (a) may be applied instrument by instrument, with a few exceptions, such as investments otherwise accounted for by the equity method; (b) is irrevocable (unless a new election date occurs); and (c) is applied only to entire instruments and not to portions of instruments.
Statement 159 is effective as of the beginning of an entity’sentity's first fiscal year that begins after November 15, 2007. Early adoption is permitted as of the beginning of the previous fiscal year provided that the entity makes that choice in the first 120 days of that fiscal year and also elects to apply the provisions of FASB Statement No. 157,Fair Value Measurements.The Company is in the process of determining the impact of this statement on its consolidated financials statements.
In December 2007, the FASB issued SFAS No. 141 (revised 2007) ("SFAS 141R"), "Business Combinations" and SFAS No. 160 ("SFAS 160") "Noncontrolling Interests in Consolidated Financial Statements, an amendment of Accounting Research Bulletin No. 51". SFAS 141R will change how business acquisitions are accounted for and will impact financial statements both on the acquisition date and in subsequent periods. SFAS 160 will change the accounting and reporting for minority interests, which will be recharacterized as noncontrolling interests and classified as a component of equity. The provisions of SFAS 141R and SFAS 160 are effective for financial statements issued for fiscal years beginning after December 15, 2008. Early adoption is not permitted. The Company is in the process of determining the impact of these statements on its consolidated financial statements.
Related Party Transactions
For detailed information regarding related party transactions, see Note 15 of our consolidated financial statements.
90
Item 7A.Quantitative and Qualitative Disclosures About Market Risk
We are exposed to foreign currency risks due to both transactions and translations between functional and reporting currencies in our Indian, Brazilian and European foreign subsidiaries. We are exposed to the impact of foreign currency fluctuations due to the operations of and net monetary asset and liability positions in our Indian, Brazilian and European foreign subsidiaries. Significant monetary assets and liabilities expected to be realized in the foreseeable future include trade receivables, trade payables and certain intercompany payables that are not denominated in their local functional currencies. As of December 31, 2006, our Indian, Brazilian and European subsidiaries were in average net liability positions (i.e., monetary liabilities were greater than monetary assets subject to foreign currency risk) of approximately $0.3 million, $17.0 million and $11.0 million, respectively. The potential foreign currency translation losses from a hypothetical 10% adverse change in the exchange rates from the net liability positions at December 31, 2006 were approximately zero, $1.7 million and $1.1 million for the, Indian, Brazilian and European subsidiaries, respectively. In the event that the functional currency of China does not continue to be based on the U.S. dollar, we may be exposed to foreign currency fluctuations due to the activities of our corporate resource center in China.
In addition, we estimate that an immediate 10% change in foreign exchange rates would impact reported net income or loss by approximately $0.2 million for the year ended December 31, 2006. This was estimated using a 10% deterioration factor to the average monthly exchange rates applied to net income or loss for each of the related subsidiaries in the respective period.
Due to the difficulty in determining and obtaining predictable cash flow forecasts in our foreign operations based on the overall challenging economic environment and associated contract structures, we do not currently utilize any derivative financial instruments to hedge foreign currency risks.
The Company is exposed to market risk in connection with changes in interest rates, primarily in connection with outstanding balances under itsour credit facility with KeyBank National Association. Based on the Company’sour average outstanding balances during the year ended December 31, 20062007 a 1% change in the LIBOR rate would impact the Company’sour financial position and results of operations by approximately $200 thousand$0.4 million over the next year. We currently dodid not utilize any derivative financial instruments to hedge interest rate risks.risks in 2007 or in prior years. Cash and cash equivalents as of December 31, 20062007 were $5.4$8.6 million and are primarily invested in money market interest bearing accounts. A hypothetical 10% adverse change in the average interest rate on our money market cash investments and short-term investments would have had no material effect on net income for the year ended December 31, 2006.2007.
Item 8.Financial Statements and Supplementary Data
The information required by this Item is included in Part IV Item 15(a)(1) and (2) of this Annual Report on Form 10-K.
Item 9.Changes in and Disagreements with Accountants on Accounting and Financial Disclosure
None.
Item 9A. Controls and Procedures
Stock Option Grant Practices Review and Restatement
As discussed in the Explanatory Note preceding Part I and in Note 2 of Notes to Consolidated Financial Statements of this Form 10-K, in 2006 we commenced our Equity Award Review of our past practices for granting and pricing stock options and other equity awards. In February 2007, the Company’s Board appointed a Special Committee of the Board to review the adequacy of the Equity Award Review and the recommendations of management regarding historical option granting practices, and to make
recommendations and findings regarding those practices and individual conduct. The Special Committee also conducted its own separate review of the option granting practices during the tenure of the current executive management team with the assistance of its own separate counsel and a forensic information technology consulting firm. As a result of the Equity Award Review and the independent investigation, management has concluded, and the Board agrees, that between 1998 and late 2003, incorrect measurement dates were used for non-cash stock-based compensation expense and related tax effects with regard to past stock option grants. Specifically:
· There was a lack of contemporaneous documentation for certain stock option grants confirming that proper approval occurred on the indicated grant date
· The grant dates for twelve grants were selected after the documented approval of those options
· Allocations of options to individual employees for seven broad-based grants to employees were determined subsequent to the documented approval of the grants by the Compensation Committee
· Thirty-three grants made in connection with employment offers were made on grant dates preceding the employee’s hire date
The Equity Award Review also discovered the following findings unrelated to changes in measurement dates:
· Certain consultants and board advisors were granted stock options under the Company’s incentive stock option plan which allowed only grants to employees
· Modifications were made to certain employee stock options that were not accounted for in accordance with APB 25
· A misappropriation of options perpetrated by the Company’s former stock option administrator
Substantially all of the findings relate to options granted between 1998 through late 2003 with related amortization of stock-based compensation expense impacting the years 1998 through 2005. Accordingly, the Company recorded additional non-cash stock-based compensation expense, charges for unauthorized issuance of common stock, deferred compensation and related tax effects and restated previously filed financial statements for the years ended December 31, 2004 and 2005 and consolidated statements of operations and consolidated balance sheet data for each of the four years in the period ended December 31, 2005, included in “Selected Consolidated Financial Data” in Part II, Item 6 of this Form 10-K. The Company also restated the stock-based compensation expense footnote information calculated under SFAS No, 123 and SFAS No. 148 under the disclosure-only alternatives of those pronouncements for the years 2004 and 2005 and for interim periods of 2005. The restated footnote information has been included in “Management’s Discussion and Analysis of Financial Condition and Results of Operations” as well as in the Consolidated Financial Statements in Part II, Item 15 of this Report. The Equity Award Review did not identify any measurement date adjustments required under APB 25 for grants made since November 2003, although it did find minor administrative errors that have resulted in immaterial adjustments aggregating approximately $50,000 for the period from 2004 through 2006.
Details of the restatement and its underlying circumstances are discussed in the Explanatory Note at the beginning of this report and in Note 2 of Notes to Consolidated Financial Statements in Item 15 of this report.
After discussion with the Company’s external auditors regarding varying accounting positions, a material adjustment related to the cancellation of stock options was recorded in 2001 in conjunction with the restatement. Accordingly, we determined that due to the material adjustment and the fact that the duration of the stock option reviews precluded the Company from filing its financial information with the SEC in a timely manner, a material weakness in our internal controls and procedures exists as of
December 31, 2006. From the period November 1999 through October 2003, the Company did not consistently follow option grant processes and procedures nor did the Company have sufficient safeguards in place to monitor its control practices regarding stock option pricing and related financial reporting.
From 2004 through 2006 the Company implemented improvements to procedures, processes, and systems to provide additional safeguards and greater internal control over financial reporting processes including the stock option granting and administration function in compliance with the Sarbanes-Oxley Act (“SOX”) and evolving accounting guidance. These improvements include, but are not limited to:
· An improved commitment to competency manifested by the hiring of more experienced and senior executive and legal personnel to replace certain members of former management
· Documenting and assessing the design and operating effectiveness of key internal controls over the stock administration function
· Segregating certain responsibilities related to option granting and the execution of stock option exercise transactions
· The establishment of processes and procedures to increase communications between the stock administration, human resources and accounting functions
· The addition of independent reviews and reconciliations of stock option activity separate from the stock administration function
· The establishment of a consistent, formalized procedure for stock option award procedures including limiting the authority to approve stock option grants
· Upgrading equity tracking software program and system controls that support the processes
· Requiring training for those employees who utilize the Company’s equity tracking software program.
· Adopting a grant date policy whereby all stock option grants are to occur on the 15th of the month, except in unusual circumstances
· Requiring that only an employee independent of the stock administration function be allowed to communicate stock option exercise instructions to the Company’s transfer agent
In addition to the significant improvements implemented between 2004 and 2006 discussed above, for various business reasons, the Company discontinued issuing stock option grants as a form of incentive compensation in lieu of other equity-based incentives effective January 2007.
The Company and the Company’s Board intend to adopt other measures recommended by the Special Committee to enhance the oversight of the stock option granting and administration function, including:
· The Company’s Compensation Committee will approve any future option grants during meetings rather than by use of Unanimous Written Consents
· In the event the Board determines in the future to again use option grants as a form of incentive compensation, it will require the development of an annual option granting plan and option granting matrix
· The Company will arrange more training for all those involved in the stock option granting process to enhance awareness and understanding of legal, tax and accounting implications
· The Company will continue to maintain the most current version of its option tracking software
· The Company’s non-officer stock option committee will be dissolved
· Annually, one member of the Company’s Board will attend director training
1) Disclosure Controls and Procedures
We maintain disclosure controls and procedures, that areas defined in Rules 13a-15(e) and 15d-15(e) promulgated under the Securities and Exchange Act of 1934, as amended ("Exchange Act"), designed to ensure that information required to be disclosed in our reports pursuant tofiled under the Securities Exchange Act of 1934, as amended, (the “Exchange Act”) is recorded, processed, summarized and reported within the time periods specified in the SEC’sSecurities and Exchange Commission's rules and forms, and that such information is accumulated and communicated to our management, including our Principal Executive Officer and Principal Financial Officer, as appropriate, to allow for timely decisions regarding required disclosure. UnderIn designing and evaluating the disclosure controls and procedures, management recognized that any controls and procedures, no matter how well designed and operated, can provide only reasonable assurance of achieving the desired
control objectives, and management necessarily was required to apply its judgment in evaluating the cost benefit relationship of possible controls and procedures.
As required by Rule 13a-15(e) promulgated under the Exchange Act, we carried out an evaluation, under the supervision of, and with the participation of our management, including our Principal Executive Officer and Principal Financial Officer, we conducted an evaluation of the effectiveness of the design and operation of our disclosure controls and procedures (as defined in Exchange Act Rule 13a-15(e) and Rule 15d-15(e)), as they existed on December 31, 2006. In light of material weaknesses in our internal control over financial reporting as of December 31, 2006 and the fact thatend of the period covered by this Annual Reportreport. Based on Form 10-K was not filed within the time limits prescribed by the Exchange Act,foregoing, our Principal Executive Officer and our Principal Financial Officer concluded that our disclosure controls and procedures were not effective at athe reasonable assurance level as of December 31, 2006.2007.
2) Management’sManagement's Report on Internal Control Over Financial Reporting
Our management is responsible for establishing and maintaining adequate internal control over financial reporting, as such term is defined in Exchange Act Rules 13a-15(f) and 15d-15(f). Under the supervision and with the participation of our management, including our Principal Executive Officer and Principal Financial Officer, we conducted an evaluation of the effectiveness of our internal control over financial reporting based on the framework inInternal Control—Integrated Framework issued by the Committee of Sponsoring Organizations of the Treadway Commission (COSO Framework). Based on this evaluation, our management identified material weaknesses inconcluded that our internal control over financial reporting is effective as of December 31, 2006 as described below. A material weakness is a control deficiency, or combination of control deficiencies, that results in more than a remote likelihood that a material misstatement of the annual or interim financial statements will not be prevented or detected.2007.
In connection with the results of the stock option review discussed in “Stock Option Grant Practices Review and Restatement” above the Company has restated our previously filed financial statements for the years ended December 31, 2004 and 2005 and consolidated statements of operations and consolidated balance sheet data for each of the four years in the period ended December 31, 2005, included in “Selected Consolidated Financial Data” in Part II, Item 6 of this Form 10-K. The Company also restated the stock-based compensation expense footnote information calculated under SFAS No. 123 and SFAS No. 148 under the disclosure-only alternatives of those pronouncements for the years 2004 and 2005 and for interim periods of 2005. Due to the duration of the stock option review that precluded the Company from filing its financial information with the SEC in a timely manner and after consultation with the Company’s external auditors regarding varying accounting positions a material adjustment was recorded in 2001 to revise the accounting treatment related to the cancellation of certain stock options.
In addition, as of December 31, 2006 after consultation with the Company’s external auditors, the Company recorded a material adjustment to reduce the valuation of deferred tax assets to reflect the impact of recent events on the Company’s business.
The foregoing identified deficiencies constitute material weaknesses in the Company’s internal control structure as of December 31, 2006.
Conclusion
Our management has discussed the material weaknesses described above with our audit committee. Because of these material weaknesses, management has concluded that our Company did not maintain
effectiveits inherent limitations, internal control over financial reporting asmay not prevent or detect misstatements. Also, projections of December 31, 2006, based onany evaluation of effectiveness to future periods are subject to the COSO Framework.risk that controls may become inadequate because of changes in conditions or that the degree of compliance with the policies and procedures may deteriorate.
Our Grant Thornton LLP, the independent registered public accounting firm Grant Thornton LLP,who audited the Company's consolidated financial statements included in this Form 10-K, has issued an attestationa report on the Company's internal control over financial reporting, which is included herein.
Changes in Internal Control over Financial Reporting
During 2007, we completed the integration of Madison Research Corporation's historical internal controls into our own internal control over financial reporting. Integration changes are included in our assessment of internal controls over financial reporting at December 31, 2007.
On May 10, 2007, we completed a significant upgrade to the Oracle financial accounting system software used primarily by the U.S. divisions of our Wireless Network Services segment. Subsequently, as discussed further in Note 4 to the consolidated financial statements covered by this report, we completed the sale of our U.S. engineering services business and wireless deployment business. The financial accounting system software was included in the sale of the wireless deployment business. As a result, the internal control over financial reporting that formerly operated at these businesses were excluded from our assessment of internal control over financial reporting. The report on the audit of internal control over financial reporting appears below in Item 9A(5).at December 31, 2007.
On October 2, 2006,December 31, 2007, we completed the acquisition of MRCHaverstick Consulting, Inc. (Haverstick) and, as permitted by SEC guidance, we excluded from our assessment of the effectiveness of our internal control over financial reporting as of December 31, 2006,2007, the internal control over financial reporting of this entity. Total assets related to MRCHaverstick of $86.5$111.1 million and no revenue for the period from the date of acquisition toof December 31, 2006 of $17.2 million2007 are included in our consolidated financial statements as of and for the year ended December 31, 2006.
3) Inherent Limitations Over Internal Controls
A control system, no matter how well designed and operated, can provide only reasonable, not absolute, assurance that the objectives of the control system are met. Further, the design of a control system must reflect the fact that there are resource constraints, and that the benefits of controls must be considered relative to their costs. Due to the inherent limitations in all control systems, no evaluation of controls can provide absolute assurance that all control issues, errors and instances of fraud, if any, within the Company have been or will be detected.
4) Changes in Internal Control Over Financial Reporting
2007. We continueplan to integrate MRC’sHaverstick's historical internal controlscontrol over financial reporting into our own internal controls over financial reporting. This integration may lead to our making changes in our, or MRC’s historical internal controlscontrol over financial reporting in future fiscal periods.
The Principal Executive Officer and Principal Financial Officer have concluded that, other than the specific2008. Accordingly, certain changes identified in this Item 9A, there have been no changeswill be made to our internal control over financial reporting until such time as this integration is complete.
Except as described above, there were no changes in our internal control over financial accounting and reporting (as defined in Rules 13a-15(f) underand 15d-15(f) of the Exchange Act) during the fourth quarter of fiscal 2006year ended December 31, 2007 that have materially affected, or are reasonably likely to materially affect, our internal control over financial reporting.
5) Report of Independent Registered Public Accounting Firm
REPORT OF INDEPENDENT REGISTERED PUBLIC ACCOUNTING FIRM
Board of Directors and Stockholders
Wireless Facilities,
Kratos Defense and Security Solutions, Inc.
We have audited management’s assessment, included in the accompanying “Management’s Report on Internal Control Over Financial Reporting,’’ that Wireless Facilities,Kratos Defense and Security Solutions, Inc. (a Delaware Corporation) and subsidiariessubsidiaries' (the Company) did not maintain effective"Company") internal control over financial reporting as of December 31, 2006, because of the effect of the material weaknesses identified in management’s assessment2007, based on criteria established inInternal Control—Integrated Framework issued by the Committee of Sponsoring Organizations of the Treadway Commission (COSO). Wireless Facilities, Inc.’sThe Company's management is responsible for maintaining effective internal control over financial reporting and for its assessment of the effectiveness of internal control over financial reporting.reporting, included in the accompanying Management's Report on Internal Control over Financial Reporting. Our responsibility is to express an opinion on management’s assessment and an opinion on the effectiveness of the Company’sCompany's internal control over financial reporting based on our audit.
As indicated in Management's Report on Internal Control over Financial Reporting, management's assessment of and conclusion on the effectiveness of internal control over financial reporting did not include the internal controls of its wholly-owned subsidiary, Haverstick Consulting Inc. which was acquired on December 31, 2007 and constituted approximately 33% of total consolidated assets as of December 31, 2007 and none of the total consolidated revenues for the year then ended. Our audit of internal control over financial reporting of Kratos Defense & Security Solutions, Inc. also did not include an evaluation of the internal control over financial reporting of this acquired company.
We conducted our audit in accordance with the standards of the Public Company Accounting Oversight Board (United States). Those standards require that we plan and perform the audit to obtain reasonable
assurance about whether effective internal control over financial reporting was maintained in all material respects. Our audit included obtaining an understanding of internal control over financial reporting, evaluating management’s assessment,assessing the risk that a material weakness exists, testing and evaluating the design and operating effectiveness of internal control based on the assessed risk, and performing such other procedures as we considered necessary in the circumstances. We believe that our audit provides a reasonable basis for our opinions.opinion.
A company’scompany's internal control over financial reporting is a process designed to provide reasonable assurance regarding the reliability of financial reporting and the preparation of financial statements for external purposes in accordance with generally accepted accounting principles. A company’scompany's internal control over financial reporting includes those policies and procedures that (1) pertain to the maintenance of records that, in reasonable detail, accurately and fairly reflect the transactions and dispositions of the assets of the company; (2) provide reasonable assurance that transactions are recorded as necessary to permit preparation of financial statements in accordance with generally accepted accounting principles, and that receipts and expenditures of the company are being made only in accordance with authorizations of management and directors of the company; and (3) provide reasonable assurance regarding prevention or timely detection of unauthorized acquisition, use, or disposition of the company’scompany's assets that could have a material effect on the financial statements.
Because of its inherent limitations, internal control over financial reporting may not prevent or detect misstatements. Also, projections of any evaluation of effectiveness to future periods are subject to the risk that controls may become inadequate because of changes in conditions, or that the degree of compliance with the policies or procedures may deteriorate.
A material weakness is a control deficiency, or combination of control deficiencies, that results in more than a remote likelihood that a material misstatement of the annual or interim financial statements will not be prevented or detected. The following material weaknesses have been identified and included in management’s assessment as of December 31, 2006:
The Company’s financial statements for the years ended December 31, 2005 and earlier were restated due to unrecorded non-cash equity-based compensation charges associated with the Company’s equity incentive plans. The stock option grant practices review extended for a significant period of time and precluded the Company from filing its financial information with the Securities and Exchange Commission (“SEC”) in a timely manner. The Company recorded a material adjustment to account for cancellation of stock options in 2001 after discussion with its external auditors regarding varying accounting positions. The Company also recorded a material adjustment to its net deferred tax assets after discussion with its auditors. The foregoing identified deficiencies constitute material weaknesses in the Company’s internal control structure as of December 31, 2006.
These material weaknesses were considered in determining the nature, timing, and extent of audit tests applied in our audit of the 2006 consolidated financial statements, and this report does not affect our report dated September 10, 2007, which expressed an unqualified opinion on those financial statements.
As indicated in the accompanying Management’s Report on Internal Control Over Financial Reporting, management’s assessment of and conclusion on the effectiveness of internal control over financial reporting excluded Madison Research Corporation (MRC), an entity that was acquired during 2006. This entity represented approximately 5% of consolidated revenues and 18% of total assets at December 31, 2006. Our audit of internal control over financial reporting of Wireless Facilities, Inc. also did not include an evaluation of the internal control over financial reporting of MRC.
In our opinion, management’s assessment that Wireless Facilities,Kratos Defense and Security Solutions, Inc. and subsidiaries did not maintainmaintained, in all material respects, effective internal control over financial reporting as of December 31, 2006, is fairly stated, in all material respects,2007, based on the criteria established inInternal Control—Integrated Framework issued by COSO. AlsoCOSO.
We have also audited, in our opinion, becauseaccordance with the standards of the effectPublic Company Accounting Oversight Board (United States), the consolidated balance sheets of the material weaknesses described above on the achievement of the
objectives of the control criteria, Wireless Facilities, Inc. and subsidiaries has not maintained effective internal control over financial reportingCompany as of December 31, 2006 based on criteria establishedand 2007, and the related consolidated statements of operations, stockholders' equity and cash flows for each of the three years in Internal Control—Integrated Framework issued by COSO.
/s/ GRANT THORNTON LLP
| | |
Los Angeles, California
| |
September 10, 2007
| |
the period ended December 31, 2007 and our report dated March 27, 2008 expressed an unqualified opinion thereon.
/s/ GRANT THORNTON LLP
Irvine, California
March 27, 2008
Item 9b.9B. Other Information
None.
None
PART III
Item 10. Directors and Executive Officers and Corporate Governance
Directors
Our Directors are each elected annually, the names, ages and years in which each became a Director are set forth in the following table and biographical information of each Director is set forth following the table:
Name | | | | Age | | Year in Which
Became Director | |
Scott I. Anderson | | | 49 | | | | 1997 | | |
Bandel L. Carano | | | 45 | | | | 2001 | | |
Eric M. DeMarco | | | 44 | | | | 2003 | | |
William A. Hoglund | | | 53 | | | | 2001 | | |
Scot B. Jarvis | | | 46 | | | | 1997 | | |
Scott I. Anderson, 49, has been one of our Directors since February 1997. Since 1997, Mr. Anderson has been a principal of Cedar Grove Partners, LLC, an investment and advisory concern. Since 1998, Mr. Anderson has also been a principal of Cedar Grove Investments, LLC, a private seed capital firm. Mr. Anderson was with McCaw Cellular/AT&T Wireless, most recently as Senior Vice President of the Acquisitions and Development group. Mr. Anderson serves on the board of directors of SunCom Wireless, mInfo, Inc. and GotVoice, Inc. HeRegistrant
The information required by this item is also an observer on the board of directors of Telephia, Inc. and Tigerstripe, Inc. Mr. Anderson is a memberincorporated by reference of the control groups of Von Donop Inlet PCS, LLC and LCW Wireless, LLC, both wireless licensees. He holds a B.A. in History from the University of Washington, Magna Cum Laude, and a J.D. from the University of Washington Law School, with highest honors.
Bandel L. Carano, 45, was originally one of our Directors from August 1998 to June 2001, and re-joined our Board in October 2001. Since 1987, he has been a general partner of Oak Investment Partners, a multi-stage venture capital firm. Mr. Carano also serves on the Investment Advisory Board of the Stanford Engineering Venture Fund, the board of directors of Airspan Networks, Inc., FiberTower Corporation, the Supervisory Board of Tele Atlas N.V. and the board of directors of numerous private companies, including Airgo Networks, nLight Photonics, Tensilica and Visto Corporation. Mr. Carano holds a B.S. and an M.S. in Electrical Engineering from Stanford University. Mr. Carano was nominated and elected as one of our Directors pursuant to the terms of a purchase agreement among the Company and certain of its stockholders in connection with the sale of the Company’s Series Registrant's Proxy Statement or Form 10-K/A, convertible preferred stock in October 2001.
Eric M. DeMarco, 44, joined the Company in November 2003 as President and Chief Operating Officer. Mr. DeMarco was appointed a Director and assumed the role of Chief Executive Officer effective
April 1, 2004. Prior to coming to the Company, Mr. DeMarco most recently served as President and Chief Operating Officer of The Titan Corporation (“Titan”), a Delaware corporation. Prior to his being named President and Chief Operating Officer, Mr. DeMarco served as Executive Vice President and Chief Financial Officer of Titan. Prior to joining Titan, Mr. DeMarco served in a variety of public accounting positions primarily focusing on large multinational corporations and publicly traded companies. Mr. DeMarco holds a Bachelor of Science, Business Administration and Finance, Summa Cum Laude, from the University of New Hampshire.
William A. Hoglund, 53, has been one of our Directors since February 2001. Mr. Hoglund is also a member of Safeboats International, LLC. From 1996 to 2000 Mr. Hoglund served as the Vice President and Chief Financial Officer of Eagle River, LLC, a private investment company. During his tenure at Eagle River, Mr. Hoglund was also a director of Nextel Communications, Inc. and Nextlink Communications, Inc. Mr. Hoglund holds a B.A. in Management Science and German Literature from Duke University and an MBA from the University of Chicago.
Scot B. Jarvis, 46, joined our Board in February 1997. Mr. Jarvis co-founded Cedar Grove Partners, LLC in 1997, an investment and consulting/advisory partnership, and currently is its managing member. Prior to co-founding Cedar Grove, Mr. Jarvis served as a senior executive of Eagle River, Inc., a McCaw investment firm. While at Eagle River he founded Nextlink Communications on behalf of McCaw and served as its president. He also served as a regional president for Nextel Communications. From 1985 to 1994, Mr. Jarvis served in several executive capacities at McCaw Cellular Communications up until it was sold to AT&T. Mr. Jarvis serves on the corporate boards of Cantata Technology, Inc., Wavelink Corporation, Visto Corporation, SkyPipeline, Slingshot Sports and Ultratouch. Mr. Jarvis holds a B.A. in Business Administration from the University of Washington.
Nominations for Directors
Nominating Committee
Effective September 5, 2007, the Board determined that a standing nominating and corporate governance committee of the Board is not necessary given the relatively small size of the Company’s Board and management team, limited scope of operations and simplicity of the Company’s business. In accordance with NASD Marketplace Rule 4200(a)(15), only the members of our Board who qualify as “independent directors”which we will now perform the functions of the nominating committee.
The independent members of our Board are responsible for screening potential director candidates and recommending qualified candidates to the full Board for nomination. The independent members of the Board will consider and evaluate any recommendation for director nominees proposed by a stockholder who (i) has continuously held at least 1% of the outstanding shares of the Company’s common stock entitled to vote at the annual meeting of stockholders for at least one year by the date the stockholder makes the recommendation and (ii) undertakes to continue to hold the common stock through the date of the meeting. In order to be evaluated in connection with the Company’s established procedures for evaluating potential director nominees, any recommendation for director nominee submitted by a qualifying stockholder must be received by the Company no later than 120 days prior to the anniversary of the date proxy statements were mailed to stockholders in connection with the prior year’s annual meeting of stockholders. Any stockholder recommendation for director nominee must be submitted to the Corporate Secretary in writing at 4810 Eastgate Mall, San Diego, California 92121 and must contain the following information:
· A statement by the stockholder that he/she is the holder of at least 1% of the Company’s common stock and that the stock has been held for at least a year prior to the date of the submission and that the stockholder will continue to hold the shares through the date of the annual meeting of stockholders;
· The candidate’s name, age, contact information and current principal occupation or employment;
· A description of the candidate’s qualifications and business experience during, at a minimum, the last five years, including his/her principal occupation and employment and the name and principal business of any corporation or other organization in which the candidate was employed;
· The candidate’s resume; and
· Three references.
The goal of our Board is to assemble a board of directors that brings a variety of perspectives and skills derived from high quality business and professional experience to the Company. In doing so, independent members of the Board also consider candidates with appropriate non-business backgrounds.
Other than the foregoing, there are no stated minimum criteria for director nominees. However, the independent members of the Board may also consider such other factors as they may deem are in the Company’s best interests and that of our stockholders. The independent members of the Board do, however, recognize that under applicable regulatory requirements at least one member of the Board must meet the criteria for an “audit committee financial expert” as defined by SEC rules, and that at least a majority of the members of the Board must meet the definition of “independent director” under NASD Marketplace Rules or the listing standards of any other applicable self regulatory organization. The independent members of the Board also believe it to be appropriate for certain key members of the Company’s management to participate as members of the Board.
The independent members of the Board identify nominees by first evaluating the current members of the Board willing to continue to serve. Current members of the Board with skills and experience that are relevant to the Company’s business and who are willing to continue in service are considered for re-nomination, balancing the value of continuity of service by existing members of the Board with that of obtaining a new perspective. If any member of the Board up for re-election at an upcoming annual meeting of stockholders does not wish to continue in service, the independent members of the Board identify the desired skills and experience of a new nominee in light of the criteria above. All of the members of the Board will be polled for suggestions as to individuals meeting the criteria for nomination to the Board. Research may also be performed to identify qualified individuals. If the independent members of the Board believe that the Board requires additional candidates for nomination, the independent members of the Board may explore alternative sources for identifying additional candidates. This may include engaging, as appropriate, a third party search firm to assist in identifying qualified candidates.
All Directors and director nominees will submit a completed form of directors’ and officers’ questionnaire as part of the nominating process. The process may also include interviews and additional background and reference checks for non-incumbent nominees, at the discretion of the independent members of the Board.
Code of Ethics
Our Board has adopted a Code of Ethics that applies to all of our Directors, officers and employees. The Code of Ethics is available for review on our website at www.wfinet.com; the Code of Ethics is also available in print, without charge, to any stockholder who requests a copy by writing to us at Wireless Facilities, Inc., 4810 Eastgate Mall, San Diego, California, 92121, Attention: Investor Relations. Each of our Directors, officers, including our Chief Executive Officer, Chief Financial Officer and Corporate Controller, and all of our other principal executive officers and employees is required to be familiar with the Code of Ethics and to certify compliance annually. There have not been any waivers of the Code of Ethics relating to any of our executive officers or Directors in the past year.
Audit Committee
Our Board has a separately designated standing Audit Committee that has been established in accordance with section 3(a)58(A) of the Exchange Act. Our Audit Committee consists of Messrs. Anderson (Chairperson), Hoglund and Jarvis. Our Board of Directors has affirmatively determined that each member of the Audit Committee is independent under NASD Marketplace Rule 4200(a)(15), and meets all other qualifications under NASD Marketplace Rule 4350(d)(2), the Sarbanes-Oxley Act of 2002 and applicable rules of the SEC. Our Board has also affirmatively determined that Mr. Hoglund qualifies as an “audit committee financial expert” as such term is defined in Regulation S-K of the Securities Act of 1933.
Management
Our executive officers and their respective positions are set forth in the following table. Biographical information of each executive officer who is not also a Director is set forth following the table. There are no family relationships between any Director or executive officer and any our other Directors or executive officers. Executive officers serve at the discretion of our Board.
Executive Officers
Name | | | | Position | | Age | | Year in Which
He/She
Became Officer | |
Eric M. DeMarco | | Chief Executive Officer and President | | 44 | | 2003 | |
James R. Edwards | | Senior Vice President, General Counsel and Secretary | | 56 | | 2004 | |
Deanna H. Lund | | Senior Vice President and Chief Financial Officer | | 39 | | 2004 | |
D. Robin Mickle | | President, WFI Government Services, Inc. | | 52 | | 2006 | |
The term of office of each executive officer is until his or her respective successor is elected and has been qualified, or until his or her earlier death, resignation or removal. Historically, the Board has elected officers annually at its first meeting following the Annual Meeting of Stockholders.
Mr. DeMarco’s biographical information is included with those of the other members of our Board.
Mr. Edwards has been our Senior Vice President, General Counsel and Secretary since April 2004. Prior to joining the Company, Mr. Edwards most recently served as Senior Legal Counsel for Qualcomm Incorporated working with Qualcomm’s Global Development Group and Ventures Group. Prior to joining Qualcomm, Mr. Edwards served as Vice President, General Counsel and Secretary of Wireless Knowledge, Inc., a Qualcomm subsidiary; Vice President, General Counsel and Secretary of Vapotronics, Inc., a developer of medical device technologies; Vice President, General Counsel and Secretary of General Atomics, an energy and defense contractor focused on advanced technology Research and Development; and General Counsel and Secretary of Logicon, Inc., a defense contractor. Mr. Edwards has been a member of the board of directors of IWT Tesoro Corporation since 2002. Mr. Edwards is a graduate of the University of San Diego, School of Law, where he received his Juris Doctorate, and of Colorado State University, where he received his Bachelor of Science Degree in Psychology, Cum Laude.
Ms. Lund has been our Senior Vice President and Chief Financial Officer since April 2004. Prior to joining the Company, Ms. Lund most recently served as Vice President of The Titan Corporation from July 1998 and Titan’s Corporate Controller from December 1996. Ms. Lund was also Titan’s Corporate Manager of Operations Analysis from 1993 to 1996. Prior thereto, Ms. Lund worked for Arthur Andersen LLP. Ms. Lund received her bachelor’s degree in accounting from San Diego State University, magna cum laude, and is a Certified Public Accountant.
Mr. Micklebecame one of our executive officers concurrent with our acquisition of MRC on October 2, 2006 and has been President of our wholly-owned subsidiary WFI Government Services, Inc. and our Government Network Services segment since December 2005. Mr. Mickle joined the Company in January 2005 as a vice president in our Government Network Services segment. Prior thereto, Mr. Mickle had been Vice President of the Fleet Systems Engineering Business Unit at Northrop Grumman Mission Systems since June 1996. From January 1994 to June 1996, Mr. Mickle had been an Executive Manager of Naval Engineering Services, Western Operations. Mr. Mickle is a retired Captain of the U.S. Naval Reserve and served in the U.S. Navy from 1977 to 1983. Mr. Mickle is a graduate of the U.S. Naval Academy and received an MBA in Management Science from San Diego State University.
Section 16(a) Beneficial Ownership Reporting Compliance
Section 16(a) of the Securities Exchange Act of 1934 (the “1934 Act”) requires our Directors and the executive officers, and persons who own more than ten percent of a registered class of our equity securities (the “Reporting Persons”), to file with the SEC initial reportswithin 120 days after the end of ownership and reports of changes in ownership of our common stock and other equity securities. Additionally, the Reporting Persons arefiscal 2007.
Item 11. Executive Compensation
The information required by SEC regulationthis item is incorporated by reference to furnish WFI with copies of all such Section 16(a) forms they file.
To the best of our knowledge and based solely upon our review of the copies of such reports furnished to us for the year ended December 31, 2006, and the information provided to us by the Reporting Persons,Registrant's Proxy Statement or Form 10-K/A, which we believe that the Reporting Persons complied with Section 16(a), except for Messrs. Alipanah and Mickle both of whom did not timelywill file reportable transactions on Forms 3 upon becoming subject to Section 16(a). Mr. Mickle has filed a Form 3 concurrent with the filing of this Annual Report on Form 10-K and Mr. Alipanah is no longer subject to Section 16(a) due toSEC within 120 days after the termination of his employment with the Company on June 1, 2007.
Item 11.Executive Compensation
Compensation Discussion and Analysis
Overview
This compensation discussion and analysis explains the material elements of the compensation awarded to, earned by, or paid to each of our executive officers who served as our named executive officers during the last completed fiscal year.
Compensation Program Objectives and Philosophy
The Compensation Committee (for purposes of this analysis, the “Committee”) of our Board currently oversees the design and administration of our executive compensation program. The Committee’s primary objectives in structuring and administering our executive officer compensation program are to:
· attract, motivate and retain talented and dedicated executive officers;
· tie annual and long-term cash and stock incentives to achievement of measurable corporate and individual performance objectives;
· reward individual performance; and
· reinforce business strategies and objectives for enhanced stockholder value.
101
To achieve these goals, the Committee maintains compensation plans that tie a portion of executives’ overall compensation to key short-term and long-term objectives. Short-term objectives are measured by metrics such as operating income and operating income margin, net earnings and net earnings margin. Long-term objectives include the timely development of new service offerings, enhancements and improvements to existing service offerings, identification of key markets for our services, development and execution of plans to address identified market opportunities, adequate control over and efficient use of our assets, and share price appreciation. The Committee evaluates individual executive performance with a goal of setting compensation at levels the Committee believes are comparable with those of executives at other companies of similar size and stage of growth, while taking into account our relative performance and our own strategic goals.
The principal elements of our current executive compensation program are base salary, annual cash bonus awards, long-term equity incentives in the form of restricted stock units, a deferred compensation plan, other benefits and perquisites, post-termination severance and accelerated vesting of previously granted stock options upon termination and/or a change in control. Our other benefits and perquisites consist of life and health insurance benefits and a qualified 401(k) savings plan equivalent to those offered to all employees.
We view these components of compensation as related but distinct. Although the Committee does review total compensation, we do not believe that significant compensation derived from one component of compensation should negate or offset compensation from other components. We determine the appropriate level for each compensation component based in part, but not exclusively, on competitive benchmarking consistent with our recruiting and retention goals, our view of internal equity and consistency, and other considerations we deem relevant, such as rewarding extraordinary performance.
Determination of Compensation Awards
The Committee has historically performed at least annually a strategic review of our executive officers’ compensation to determine whether they provide adequate incentives and motivation to our executive officers and whether they adequately compensate our executive officers relative to comparable officers in other similarly situated companies. The Committee’s most recent review occurred in December 2006.
The Committee meetings typically have included, for all or a portion of each meeting, not only the Committee members but also our chief executive officer, chief financial officer and general counsel. For compensation decisions relating to executive officers other than our chief executive officer, the Committee typically considers recommendations from our chief executive officer. When determining compensation for our chief executive officer, the Committee takes into account, but does not rely upon, the recommendation of our chief executive officer. Compensation for the chief executive officer has been determined by discussion among and action by the members of the Committee acting in consultation with the other independent members of our Board and market data obtained on behalf of the Committee.
It is our policy generally to qualify compensation paid to executive officers for deductibility under Section 162(m) of the Internal Revenue Code. Section 162(m) generally prohibits us from deducting the compensation of officers that exceeds $1,000,000 unless that compensation is based on the achievement of objective performance goals. We believe that our 1999 and 2005 Equity Incentive Plans (collectively, the “Equity Plans”) are structured to qualify stock options, restricted share and stock unit awards under such Equity Plans as performance-based compensation and to maximize the tax deductibility of such awards. However, we reserve the discretion to pay compensation to our officers that may not be deductible.
Benchmarking of Compensation
The Committee believes it is important when making its compensation-related decisions to be informed as to current practices of similarly situated companies. As a result, the Committee reviews third-party surveys and other information collected from public sources for executive officers at peer companies. The Committee also receives the recommendation of our chief executive officer on compensation for other executive officers. Historically, the Committee has relied only to a limited extent upon third party consultants to advise the Committee on compensation matters. In determining the compensation of our executive officers for 2006, the Committee reviewed surveys and other third party information, as well information collected from other public sources, regarding the compensation for executive officers at our peer companies. While benchmarking may not always be appropriate as a stand-alone tool for setting compensation due to the aspects of our business and objectives that may be unique to us, we generally believe that gathering this information is an important part of our compensation-related decision-making process.
Base Compensation
We provide our named executive officers and other executives with base salaries that we believe enable us to hire and retain individuals in a competitive environment and to reward individual performance and contribution to our overall business goals, while taking into account the unique circumstances of our company. We review base salaries for our named executive officers annually and increases, if any, are based on the executive’s success in contributing to our short-term and long-term objectives as well as unique challenges faced by our Company. We also take into account the base compensation that is payable by companies that we believe to be our competitors and by other public companies with which we believe we generally compete for executives in our market and geography. The base salary of our chief executive officer is reviewed and recommended by the Committee acting in consultation with the other independent members of our Board.
In March 2006, the Committee applied the principals described above and increased Mr. DeMarco’s base salary by 33% to $400,000, effective as of April 1, 2006. The Committee considered, among other things, Mr. DeMarco’s effectiveness in dealing with the challenges faced by our Company and in transitioning the business away from the declining business segments. The Committee reviewed similar considerations for each of the other named executives, and in March 2006 increased Ms. Lund’s annual salary by 22.2% to $275,000 and Mr. Edwards’ annual salary by 11.6% to $240,000, both effective as of April 1, 2006.
Annual Cash Bonus Awards
In addition to base salary, we provide executive officers and other key managers the opportunity to receive incentive compensation in the form of annual discretionary bonuses of cash based upon the achievement of certain individual and company performance objectives during the fiscal year. Target cash bonus awards are based upon a percentage of the executive’s salary, and typically range from 25% to 100% of the executive officer’s salary. In determining the appropriate level of target bonus for each officer, the Committee considers the recommendation of the chief executive officer, information provided through independent, third-party surveys and other information collected from public sources for similar positions at peer companies. Under our bonus plan, each executive typically receives 50% of his or her target bonus amount if the executive achieves specific individualized operational objectives and the other 50% if our earnings per share meet a specific target for the fiscal year. If our earnings per share fall within a certain specified range (with the target earnings per share at the high end of the range), then the executive would typically receive a pro rata percentage of their bonus target based on linear interpolation between the bottom and top of the range. Typically, the executive would not receive any of the company performance-based portion of the target bonus if earnings per share fall below the bottom of the range.
The Committee retains wide discretion to interpret the terms of the cash bonus plan and to identify the extent to which an individual’s performance objectives have been met in any particular fiscal year. The Committee also retains the right to exclude extraordinary charges or other special circumstances in determining whether the objectives were met during any particular fiscal year and may decide to grant 100% of the targeted cash bonus award even if the Company’s earnings per share do not fall within the specified range, based upon an evaluation of business conditions and industry trends. In addition, the Committee may approve cash bonuses outside of the cash bonus plan. For example, the Committee may approve bonus awards in connection with an executive officer’s efforts and accomplishments with respect to our strategic initiatives and milestones, and such bonus awards may overlap with or be in addition to bonus awards under the cash bonus plan.
For fiscal 2006 only Messrs. Mickle and Alipanah received awards under the cash bonus plan. For fiscal 2006, Messrs. Mickle and Alipanah received 100% of their target bonuses related to individualized operational objectives, even though the company did not achieve earnings per share within the targeted range. Specifically, Mr. Mickle received $51,250, or 25% of his base salary, and Mr. Alipanah received $50,000, or 25% of his base salary. In determining that Messrs. Mickle and Alipanah were entitled to these awards, the Committee considered each executive officer’s efforts in addressing the significant challenges that the Company faced during fiscal 2006. For fiscal 2006, the chief executive officer, not the Committee set the individualized operational objectives, earnings per share targets and other Company financial performance targets with respect to the cash bonus awards to Messrs. Mickle and Alipanah. However, the Committee evaluated whether Messrs. Mickle and Alipanah achieved their individualized performance objectives and approved the payment of their bonuses under the cash bonus plan.
For fiscal 2006, in early 2007, Messrs. DeMarco and Edwards and Ms. Lund received discretionary cash bonuses outside of the cash bonus plan as follows: Mr. DeMarco received $200,000, or 50% of his base salary, Ms. Lund received $82,500 or 30% of her base salary, and Mr. Edwards received $72,000, or 30% of his base salary. In awarding these bonuses, the Committee considered each executive officer’s efforts in addressing the significant challenges that the Company faced during fiscal 2006, especially as related to the industry dynamics of the Wireless Network Segment and the need to retain each executive officer during fiscal 2007 as the Company continues to undergo significant changes.
In the first quarter of 2007, the Committee worked with senior management to establish the annual target bonus amounts and performance objectives under the bonus plan. For fiscal 2007, each executive officer’s target bonus under the bonus plan will be a specified percentage of the executive officer’s base salary, and will range from 30% to 100% of an individual’s base salary.
Cash awards made to executive officers for fiscal year 2006 are reflected in column (g) of the Fiscal Year 2006 Summary Compensation Table.
Equity Compensation
We believe that equity ownership by our executive officers provides important incentives to make decisions and take actions that maximize long-term stockholder value. The Committee develops its equity award determinations based on its judgments as to whether the complete compensation packages provided to our executives, including prior equity awards, provide sufficient incentive to build stockholder value and align the interests or executive officers with our stockholders, and are sufficient to retain, motivate and adequately award each of our executives. This judgment is based in part on information provided by reviewing the equity compensation practices of companies that we believe to be our competitors and by other public companies with which we believe we generally compete for executives.
We grant equity compensation to our executive officers and other employees under our Equity Plans. Most initial grants currently vest over a four year period from the date of grant, with 25% vesting on the first anniversary of the date of grant and the balance vesting monthly over a three year period. Subsequent
option grants to employees with over one year of service vest on a monthly basis over a four year period. Our stock options have a 10-year contractual term. Beginning on January 1, 2006, we began accounting for stock-based payments in accordance with the requirements of FASB Statement 123R. In addition, as of January 1, 2007, our employees, including our executive officers, are able to purchase shares of our stock under our 1999 Employee Stock Purchase Plan.
The Committee reviews and approves all grants made to our officers under the Equity Plans and in connection with the initial hiring, promotions, extraordinary achievements or compensation adjustments. In addition to these factors, the size and timing of grants are generally subject to policies established by the Committee regarding the position of the grantee within our company, the overall number of options actually granted to the optionee in the past and the extent of vesting of prior grants. In general, the option grants are also subject to post-termination and change in control provisions. No options were granted to our executive officers during fiscal 2006.
On December 28, 2006, our Board approved the acceleration of vesting of all unvested options to purchase shares of our common stock issued prior to June 30, 2006 held by our employees and Directors under our 1999 Equity Incentive Plan and our 2000 Nonqualified Stock Option Plan. The acceleration was effective as of December 29, 2006. All affected options had exercise prices in excess of then-current market values. Holders were given the election to decline the acceleration of the options if such acceleration would have had the effect of changing the status of the option for federal income tax purposes from an incentive stock option to a non-qualified stock option. Options to purchase approximately 2.1 million shares of common stock were subject to the acceleration. Of this amount, our executive officers held options to purchase 582,000 shares at a weighted average exercise price of $5.72 per share.
In January 2007, for various business reasons, we generally discontinued the use of stock options as a form of equity compensation and instead began to issue restricted stock units on a limited basis.
Consistent with its belief that equity ownership by our executive officers provides important incentives to make decisions and take actions that maximize long-term stockholder value, on January 30, 2007, the Committee granted Restricted Stock Unit awards to named executive officers as follows:2007.
· Eric M. DeMarco: 987,500 shares
· Deanna Lund: 200,000 shares
· James R. Edwards: 170,000 shares
· D. Robin Mickle: 75,000 shares
· Dariush G. Alipanah: 100,000 shares
Further, in view of the significant challenges facing the Company, on March 26, 2007, the Committee granted Restricted Stock Unit awards as a retention tool as follows:
· Eric M. DeMarco: 493,750 shares
· Deanna Lund: 100,000 shares
· James R. Edwards: 85,000 shares
Deferred Compensation Plan
We provide our executive officers and other eligible highly compensated employees with the opportunity to defer up to 80% of their cash compensation derived from base salary, bonus awards and/or commissions pursuant to our Nonqualified Deferred Compensation Plan (“Deferred Compensation Plan”). The deferrals reduce a participant’s current taxable income and allow the participant to accumulate savings on a tax deferred basis. In addition, we may, in our sole and absolute discretion, make annual
discretionary contributions, including matching contributions, to the Deferred Compensation Plan. To date, we have not made any such contributions. Deferrals and contributions (if applicable) are adjusted for gain or loss based on the performance of one or more investment options selected by the participant from among investment funds chosen by a committee appointed by the Committee to administer the Deferred Compensation Plan. Generally, all distributions under the Deferred Compensation Plan will be made in a single lump sum, although participants that terminated their employment as a result of retirement may elect to receive distributions in annual installments.
Executive Benefits and Perquisites
All of our executives are eligible to participate in our employee benefit plans, including medical, dental, life insurance and 401(k) plans. These plans are available to all salaried employees and do not discriminate in favor of executive officers. It is generally our policy not to extend significant perquisites to our executives that are not available to our employees generally. We have no current plans to make changes to levels of benefits and perquisites provided to executives.
Change in Control and Severance Benefits
Pursuant to an employment agreement with Mr. DeMarco and change in control agreements with our other executive officers, we provide these officers the opportunity to receive additional compensation and benefits in the event of severance or change in control. Our severance and change in control provisions are summarized below in “Employment Agreements; Potential Payments Upon Termination or Change in Control”. Our analysis indicates that our severance and change in control provisions are consistent with the provisions and benefit levels of other companies disclosing such provisions as reported in public SEC filings. We believe our arrangements with our executive officers are reasonable.
2006 SUMMARY COMPENSATION TABLE
Annual Compensation $ (Dollars)
(a) | | (b) | | (c) | | (d) | | (f) | | (g) | | (h) | | (i) | |
| | | | Salary | | Bonus | | Option
Award(s) | | Non-Equity
Incentive Plan
Compensation | | All Other
Compensation | | Total
Compensation | |
Name and Principal Position | | | | Year | | ($) | | ($)(1) | | ($)(2) | | ($)(3) | | ($) | | ($) | |
Eric M. DeMarco
President and Chief Executive Officer | | 2006 | | 373,465 | | 200,000 | | 1,988,385 | | | — | | | | 12,750 | (4) | | | 2,574,600 | | |
Deanna Lund
Senior Vice President and Chief Financial Officer | | 2006 | | 261,767 | | 82,500 | | 550,716 | | | — | | | | — | | | | 894,983 | | |
James R. Edwards
Senior Vice President, General Counsel and Secretary | | 2006 | | 234,215 | | 72,000 | | 467,187 | | | | | | | — | | | | 773,402 | | |
D. Robin Mickle
President, WFI Government Services, Inc. | | 2006 | | 206,054 | | | | 470,382 | | | 51,250 | | | | — | | | | 727,686 | | |
Dariush G. Alipanah(5)
Former Vice President, WNS Engineering Services Division | | 2006 | | 196,364 | | | | 303,685 | | | 50,000 | | | | — | | | | 550,049 | | |
| | | | | | | | | | | | | | | | | | | | | | | |
(1)Represents discretionary cash bonus by the Committee to named executive officers earned in 2006 and paid in 2007 as described in further detail above.
(2)The amounts shown in column (f) represent the compensation costs of stock options for financial reporting purposes for fiscal year 2006 under FAS 123(R), rather than an amount paid to or realized by the named executive officer. The FAS 123(R) value as of the grant date for the stock option grants is spread over the number of months of service required for the grant to become non-forfeitable. Compensation costs shown in column (f) reflect ratable amounts expensed for grants that were made in prior fiscal years and with respect to which the exercise price of the subject stock option grants are above current market values. There can be no assurance that the FAS 123(R) amounts will ever by realized by the named executive officers.
(3)Represents bonus under the cash bonus plan to named executive officers earned in 2006 and paid in 2007. Annual cash bonus awards under the cash bonus plan are typically paid based on the achievement of certain individual and Company performance objectives approved by the Committee as described in further detail above. For fiscal 2006, the chief executive officer, not the Committee, determined individualized and Company performance objectives for Messrs. Mickle’s and Alipanah’s cash bonus awards. However, the Committee evaluated whether Messrs. Mickle and Alipanah achieved their individualized performance objectives and approved the payment of their bonuses under the cash bonus plan.
(4)Represents the taxable income attributable to Mr. DeMarco for his use of a Company automobile in fiscal year 2006.
(5)Effective June 1, 2007, Mr. Alipanah’s employment with the Company was terminated in connection with the Company’s sale of all of the assets of its Engineering Division.
GRANTS OF PLAN-BASED AWARDS
(a) | | (b) | | (d) | | (e) | |
| | | | Estimated Future Payouts
Under Non-Equity
Incentive Plan Awards(1) | |
Name | | | | Grant Date | | Target($) | | Maximum($) | |
Eric M. DeMarco | | | N/A | | | — | | | — | | |
Deanna Lund | | | N/A | | | — | | | — | | |
James R. Edwards | | | N/A | | | — | | | — | | |
D. Robin Mickle | | | 7/31/06 | | | $ | 100,000 | | | $ | 110,000 | | |
Dariush G. Alipanah | | | 7/31/06 | | | $ | 100,000 | | | $ | 120,000 | | |
| | | | | | | | | | | | | | | |
(1) Amounts shown in columns (d) and (e) are the estimated possible payouts for fiscal year 2006 under our annual cash bonus plan. Annual cash bonus plan awards are determined based on the achievement of certain Company and individual performance objectives determined by the Committee. For fiscal 2006, the chief executive officer, not the Committee, determined individualized and Company performance objectives for Messrs. Mickle’s and Alipanah’s cash bonus plan awards. However, the Committee evaluated whether Messrs. Mickle and Alipanah achieved their individualized performance objectives and approved the payment of their bonues under the cash bonus plan. The cash bonus plan awards to the named executive officers are reported in the Fiscal Year 2006 Summary Compensation Table under the column “Non-Equity Incentive Plan Compensation.”
(2) Effective June 1, 2007, Mr. Alipanah’s employment with the Company was terminated in connection the Company’s sale of all of the assets of its Engineering Division
The Company did not grant any equity based awards under incentive compensation plans to any named executive officers during the fiscal year ended December 31, 2006.
107
OUTSTANDING EQUITY AWARDS AT FISCAL YEAR-END
(a) | | (b) | | (e) | | (f) | |
Option Awards | |
| | Number of
Securities
Underlying
Unexercised
Options (#) | | Option | | Option | |
Name | | | | Exercisable (1) | | Exercise Price ($) | | Expiration Date (2) | |
Eric M. DeMarco | | | 1,250,000 | | | | 6.19 | (3) | | | 11/17/2013 | | |
| | | 500,000 | | | | 6.05 | (8) | | | 8/18/2014 | | |
| | | 225,000 | | | | 5.38 | (8) | | | 8/9/2015 | | |
Deanna Lund | | | 200,000 | | | | 6.19 | (4) | | | 4/20/2014 | | |
| | | 100,000 | | | | 6.05 | (8) | | | 8/18/2014 | | |
| | | 100,000 | | | | 5.38 | (8) | | | 8/9/2015 | | |
James R. Edwards | | | 170,000 | | | | 6.19 | (4) | | | 4/20/2014 | | |
| | | 100,000 | | | | 6.05 | (8) | | | 8/18/2014 | | |
| | | 70,000 | | | | 5.38 | (8) | | | 8/9/2015 | | |
D. Robin Mickle | | | 40,000 | | | | 6.19 | (5) | | | 4/12/2015 | | |
| | | 10,000 | | | | 5.90 | (8) | | | 9/29/2015 | | |
| | | 100,000 | | | | 5.43 | (8) | | | 12/20/2015 | | |
Dariush G. Alipanah(9) | | | 2,246 | | | | 6.19 | (6) | | | 1/26/2010 | | |
| | | 743 | | | | 6.19 | (6) | | | 12/1/2010 | | |
| | | 19,160 | | | | 4.47 | | | | 10/1/2011 | | |
| | | 36,000 | | | | 4.23 | | | | 4/30/2012 | | |
| | | 22,000 | | | | 6.19 | (7) | | | 5/23/2013 | | |
| | | 30,000 | | | | 6.19 | (7) | | | 5/20/2014 | | |
| | | 7,500 | | | | 6.05 | (8) | | | 8/18/2014 | | |
| | | 22,000 | | | | 6.19 | (5) | | | 4/12/2015 | | |
| | | 60,000 | | | | 6.19 | (8) | | | 7/20/2015 | | |
| | | | | | | | | | | | | | | |
(1) All options listed are fully vested and exercisable.
(2) Expiration date assumes that optionee remains in service of the Company through the full term of the stock option grant.
(3) Represents option shares originally granted to Mr. DeMarco on November 17, 2003 with respect to which the vesting was accelerated on May 18, 2005 pursuant to the Compensation Committee’s determination to accelerate the vesting on all outstanding and unvested stock options held by employees, officers and directors of the Company with an exercise price of more than $10.00 per share. The option was cancelled and re-issued on December 30, 2005 as part of a repricing of all outstanding employee stock options that were originally granted at exercise prices greater than 120% of the Company’s closing stock price on the Nasdaq Global Select Market on December 30, 2005.
(4) Represents option shares originally granted to Ms. Lund and Mr. Edwards on April 20, 2004 with respect to which the vesting was accelerated on May 18, 2005 pursuant to the Compensation Committee’s determination to accelerate the vesting on all outstanding and unvested stock options held by employees, officers and Directors of the Company with an exercise price of more than $10.00 per share. These options were cancelled and re-issued on December 30, 2005 as part of a repricing of all outstanding employee stock options that were originally granted at exercise prices greater than 120% of the Company’s closing stock price on the Nasdaq Global Select Market on December 30, 2005.
(5) Represents option shares granted to Messrs. Mickle and Alipanah on April 12, 2005, which options were cancelled and re-issued on December 30, 2005 as part of a repricing of all outstanding employee stock options that were originally granted at exercise prices greater than 120% of the Company’s closing stock price on the Nasdaq Global Select Market on December 30, 2005. The vesting of these options was subsequently accelerated on December 31, 2006 when the Board approved the acceleration of vesting on all outstanding options issued prior to June 30, 2006 under our 1999 Equity Incentive and 2000 Nonqualified Stock Option Plans.
(6) Represents option shares that were originally granted to Mr. Alipanah on January 26, 2000 and December 1, 2000, which options were cancelled and re-issued on December 30, 2005 as part of a repricing of all outstanding employee stock options that were originally granted at exercise prices greater than 120% of the Company’s closing stock price on the Nasdaq Global Select Market on December 30, 2005.
(7) Represents option shares originally granted to Mr. Alipanah on May 23, 2003 and May 20, 2004, respectively, with respect to which the vesting was accelerated on September 19, 2005 pursuant to the Compensation Committee’s determination to accelerate the vesting on all outstanding and unvested stock options held by employees, officers and directors of the Company with an exercise price of more than $8.00 per share. The option was cancelled and re-issued on December 30, 2005 as part of a repricing of all outstanding employee stock options that were originally granted at exercise prices greater than 120% of the Company’s closing stock price on the Nasdaq Global Select Market on December 30, 2005.
(8) Represents option shares granted to Ms. Lund and Messrs. DeMarco, Edwards, Mickle and Alipanah with respect to which the vesting was subsequently accelerated when the Board approved the acceleration of vesting on all outstanding options issued prior to June 30, 2006 under our 1999 Equity Incentive and 2000 Nonqualified Stock Option Plans.
(9) Effective June 1, 2007, Mr. Alipanah’s employment with the Company was terminated in connection with the Company’s sale of all of the assets of its Engineering Division.
OPTIONS EXERCISES AND STOCK VESTED
None of the named executive officers acquired any shares of the Company’s common stock through the exercise of stock options during the fiscal year ended December 31, 2006.
The Company did not have any outstanding stock based awards during the fiscal year ended December 31, 2006.
NON-QUALIFIED DEFERRED COMPENSATION
Pursuant to the Company’s Nonqualified Deferred Compensation Plan (the “Deferred Compensation Plan”), certain employees, including the named executive officers, may defer up to eighty percent (80%) of their cash compensation derived from base salary, bonus awards and/or commissions. The deferrals reduce a participant’s current taxable income and allow the participant to accumulate savings on a tax deferred basis. In addition, the Company may, in its sole and absolute discretion, make annual discretionary contributions to the Deferred Compensation Plan on behalf of participants, including matching contributions. To date, the Company has not made any contributions to the Deferred Compensation Plan.
Deferrals, and Company contributions, if applicable, are adjusted for gain or loss based on the performance of one or more investment options selected solely by the participant from time to time from among investment funds chosen by a Plan Committee appointed by the Compensation Committee to administer the Deferred Compensation Plan. Generally, all distributions under the Deferred Compensation Plan will be made in a single lump sum, although participants that terminate their
employment as a result of their retirement may elect to receive distributions in annual installments. The Company may, in its sole discretion, suspend or terminate the Deferred Compensation Plan or revise it in any respect whatsoever; provided, however, that no such action may reduce amounts credited to deferral accounts and such accounts will continue to be owed to the participants or beneficiaries.
(a) | | (b) | | (d) | | (f) | |
| | Executive
Contributions in
Last FY | | Aggregate
Earnings in
Last FY | | Aggregate
Balance at
Last FYE | |
Name | | | | ($)(1) | | ($) | | ($)(2) | |
Eric M. DeMarco | | | 91,731 | | | | 4,631 | | | | 151,373 | | |
Deanna Lund | | | 25,096 | | | | 1,812 | | | | 26,908 | | |
James R. Edwards | | | 6,490 | | | | 1,580 | | | | 14,163 | | |
D. Robin Mickle | | | 10,226 | | | | 905 | | | | 14,754 | | |
Dariush G. Alipanah(3) | | | 39,433 | | | | 11,034 | | | | 91,773 | | |
| | | | | | | | | | | | | | | |
(1) The amounts in this column are also included in the Summary Compensation Table on page 106, in the summary column or non-equity incentive plan compensation column.
(2) Of the totals in this column, the following totals have previously been reported in the Summary Compensation Table for this year, and for previous years:
(3) Effective June 1, 2007, Mr. Alipanah’s employment with the Company was terminated in connection with the Company’s sale of all of the assets of its Engineering Division.
Name | | | | 2006($) | | Previous
Years($) | | Total($) | |
Eric M. DeMarco | | 91,731 | | | 55,012 | | | 146,743 | |
Deanna Lund | | 25,096 | | | — | | | 25,096 | |
James R. Edwards | | 6,490 | | | 6,093 | | | 12,583 | |
D. Robin Mickle | | 10,226 | | | 3,623 | | | 13,849 | |
Dariush G. Alipanah | | 39,433 | | | 41,307 | | | 80,740 | |
Employment Agreements; Potential Payments Upon Termination or Change in Control
In addition to other compensation arrangements described elsewhere in this proxy statement, we have entered into agreements with three of the named executive officers herein as follows:
On November 14, 2003, we entered into an Executive Employment Agreement with Mr. DeMarco in connection with his duties as an executive of the Company. Among other things, the terms of the agreement provide for Mr. DeMarco’s compensation, eligibility to receive annual incentive awards and to participate in long-term incentive, employee benefit and retirement programs. In the event that Mr. DeMarco is terminated without cause, he will be entitled to a lump sum equal to three times the sum of his current base salary, plus three times his target bonus potential for the year, less any bonus already received for such year, vesting of all outstanding stock options and participation for Mr. DeMarco and his dependents in our employee health care program for one-year or, if earlier, until Mr. DeMarco procures health care coverage through another employer. Additionally, in the event that there is a change of control of the Company, Mr. DeMarco shall be entitled to accelerated vesting of 50% of all outstanding and unvested stock options. Furthermore, Mr. DeMarco shall also be entitled to the severance compensation described above should Mr. DeMarco’s employment be terminated as a result of such change in control. If Mr. DeMarco had been terminated on December 31, 2006 without cause or in connection with a change in control, he would have received the following benefits under his employment agreement: (i) a lump sum payment of $1,800,000 equal to three times his current base salary, plus three times his target bonus potential for the year, (ii) vesting of any unvested stock options then held by Mr. DeMarco and
(iii) continued participation by Mr. DeMarco and his family in the Company’s group health insurance benefits on the same terms as during his employment until the earlier of one year following his termination or procurement of health care coverage through another employer, provided that if the Company’s insurance carrier will not allow for such benefits continuation the Company shall pay the premiums required to continue Mr. DeMarco’s group health care coverage during the period under the applicable provisions of the Consolidated Omnibus Budget Reconciliation Act of 1985 (“COBRA”).
Under Mr. DeMarco’s agreement, a change in control is deemed to have occurred in the event of any one of the following occurrences: (i) the acquisition by an individual person or entity or a group of individuals or entities acting in concert, directly or indirectly, through one transaction or a series of related transactions of more than 50% of the Company’s outstanding voting securities; (ii) a merger or consolidation of the Company with or into another entity after which the Company’s stockholders immediately prior to such transaction hold less than 50% of the voting securities of the surviving entity; (iii) a sale of all or substantially all of the Company’s assets; or (iv) the change in the majority of the Board pursuant to a successful hostile proxy contest.
On March 28, 2005, we entered into Change in Control Agreements (the “Change in Control Agreements”) with Ms. Lund and Mr. Edwards (each an “Officer” and collectively the “Officers”), which were subsequently Amended and Restated on March 28, 2006. The terms of these agreements provide that upon a change in control of the Company, the Officers shall be entitled to accelerated vesting of 50% of all of their outstanding and unvested stock options and any applicable stock appreciation rights. Upon the one-year anniversary or a Triggering Event (as defined below), whichever occurs first, all remaining unvested stock options and applicable stock appreciation rights shall be fully vested. Additionally, in the event of a termination without cause the Officers shall be entitled to accelerated vesting of 100% of all of their outstanding and unvested stock options and any applicable stock appreciation rights.
The Change in Control Agreements also provide for severance payments to the Officers as follows: (i) if an Officer is terminated without cause, the Officer is entitled to (A) severance compensation equal to one year of the Officer’s base salary then in effect, (B) continuation of the Officer’s then current health insurance coverage at the same cost to the Officer as prior to termination for a period of one year following termination, and (C) the vesting of any then unvested stock options held by the Officer or (ii) if an Officer voluntarily resigns after a change in control as a result of a material change in the nature of such Officer’s role or job responsibilities or the relocation of such Officer’s principal place of work to a location more than thirty (30) miles from such Officer’s work location immediately prior to the change in control (each a “Triggering Event”), the Officer shall be entitled to: (A) severance compensation, equal to two years of the Officer’s base salary then in effect, plus the Officer’s maximum bonus amount for two years and (B) continuation of the Officer’s then current health insurance coverage at the same cost to the Officer as prior to termination for a period of two years following termination or resignation.
Under the Change in Control Agreements, a Change in Control is deemed to have occurred in the event of (i) the acquisition by an individual person or entity or a group of individuals or entities acting in concert, directly or indirectly, through one transaction or a series of transactions, of more than 50% of the outstanding voting securities of the Company; (ii) a merger or consolidation of the Company with or into another entity after which the stockholders of the Company immediately prior to such transaction hold less than 50% of the voting securities of the surviving entity; (iii) any action or event that results in the Board consisting of fewer than a majority of Incumbent Directors (“Incumbent Directors” shall mean directors who either (A) are directors of the Company as of the date of the Change in Control Agreements, or (B) are elected or nominated for election, to the Board with the affirmative votes of at least a majority of the Incumbent Directors at the time of such election or nomination); or (iv) a sale of all or substantially all of the assets of the Company.
111
Under her Change in Control Agreement, if Ms. Lund had been terminated without cause on December 31, 2006, she would have received the following benefits: (i) severance compensation equal to one year of her base salary then in effect in the amount of $225,000, (ii) continuation of her then current health insurance coverage at the same cost to her as prior to her termination for a period of one year following termination and (iii) the vesting of any unvested stock options then held by Ms. Lund. If Ms. Lund had voluntarily resigned on December 31, 2006 following a Triggering Event and a Change in Control she would have received the following benefits: (i) severance compensation equal to two years of her base salary then in effect in the amount of $450,000, (ii) continuation of her then current health insurance coverage at the same cost to her as prior to her termination for a period of two years following termination, and (iii) the vesting of any unvested stock options then held by Ms. Lund.
Under his Change in Control Agreement, if Mr. Edwards had been terminated without cause on December 31, 2006, he would have received the following benefits: (i) severance compensation equal to one year of his base salary then in effect in the amount of $215,000, (ii) continuation of his then current health insurance coverage at the same cost to him as prior to his termination for a period of one year following termination and (iii) the vesting of any unvested stock options then held by Mr. Edwards. If Mr. Edwards had voluntarily resigned on December 31, 2006 following a Triggering Event and in connection with a Change in Control he would have received the following benefits: (i) severance compensation equal to two years of his base salary then in effect in the amount of $430,000, (ii) continuation of his then current health insurance coverage at the same cost to him as prior to his termination for a period of two years following termination, and (iii) the vesting of any unvested stock options then held by Mr. Edwards.
DIRECTOR COMPENSATION
The following quarterly retainer and committee fees were payable to the Company’s non-employee Directors during the fiscal year ended December 31, 2006:
Quarterly Retainer
| | $3,500
| |
Audit Committee Chair
| | $3,000
| |
Audit Committee Chair Regular Meeting Fee
| | $2,000
| |
Audit Committee Chair Calls
| | $1,000
| |
Other Audit Committee Matters
| | $1,000 to $4,000*
| |
Committee Chair Retainer
| | $1,000
| |
Board Meetings
| | $4,000
| |
Board Conference Calls
| | $2,000
| |
Committee Meetings
| | $1,000
| |
Committee Conference Calls
| | $500
| |
Annual Stock Option Grant
| | 20,000 shares
| |
* (as determined by Board Chairman)
All fees are paid quarterly in arrears.
The Directors compensation schedule was approved by the Board on June 2, 2004 upon recommendation of the Committee and was modified on November 18, 2004 with respect to Audit Committee and Audit Committee Chair fees in light of the increased responsibilities of the Audit Committee as a result of the Sarbanes-Oxley Act. Additionally, in February 2005 the Board approved a Non-Management Directors Stock Fee Program whereby our non-management Directors may elect to receive all or a portion of their fees in shares of our common stock. Further, in July 2005, the Board approved a Non-Management Directors Stock Option Fee Program similar to the Non-Management Directors Stock Fee Program, whereby our non-management Directors may elect to receive all or a
portion of their accrued Directors fees in the form of a fully-vested stock option grant. If elected under either of these plans, the common stock, or the exercise price of the stock option grant, each such Director shall receive, is valued based on the closing trading price of our common stock on the trading day immediately preceding the regularly scheduled Board Meeting for the respective quarter in which the Directors fees are being paid. Our Directors also receive reimbursement for all out-of-pocket expenses related to their duties, including, but not limited to, travel, car rental and lodging fees.
The following table sets forth the fees paid to those members of the Company’s Board for the fiscal year ended December 31, 2006:
(a) | | (b) | | (d) | | (h) | |
Name | | | | Fees Earned or
Paid in Cash
($) | | Option
Awards
($)(1) | | Total
($) | |
Scott I. Anderson | | | 79,000 | | | 161,788 | | 240,788 | |
Bandel L. Carano | | | — | | | 177,039 | (2) | 177,039 | |
William A. Hoglund | | | 59,500 | | | 161,784 | | 221,284 | |
Scot B. Jarvis | | | 69,000 | | | 161,788 | | 230,788 | |
Andrew M. Leitch(3) | | | 32,750 | | | 12,550 | | 45,300 | |
Masood K. Tayebi(4) | | | 38,000 | | | — | | 38,000 | |
| | | | | | | | | | | |
(1) The amounts shown in column (d) represent the compensation costs of stock options for financial reporting purposes for fiscal year 2006 under FAS 123(R), rather than an amount paid to or realized by the Company’s Directors. The FAS 123(R) value as of the grant date for the stock option grants is spread over the number of months of service required for the grant to become non-forfeitable. Compensation costs shown in column (d) reflect ratable amounts expensed for grants that were made in prior fiscal years and the exercise price of the subject stock option grants are above current market values. There can be no assurance that the FAS 123(R) amounts will ever by realized by the Company’s Directors.
(2) Includes fully vested stock option grants granted to Mr. Carano in lieu of accrued Directors Fees as follows:
a. March 22, 2006, stock option to purchase 4,511 shares of common stock granted at $3.88/share in lieu of $17,500 accrued Directors Fees, which option is fully vested, has an exercise price of $3.88 per share and expires on March 22, 2016;
b. May 17, 2006, stock option to purchase 2,304 shares of common stock granted at $3.69/share in lieu of $8,500 accrued Directors Fees, which option is fully vested, has an exercise price of $3.69 per share and expires on May 17, 2016;
c. September 6, 2006, stock option to purchase 1,556 shares of common stock granted at $2.25/share in lieu of $3,500 accrued Directors Fees, which option is fully vested, has an exercise price of $2.25 per share and expires on September 6, 2016; and
d. November 15, 2006, stock option to purchase 5,896 shares of common stock granted at 2.29/share in lieu of $13,500 accrued Directors Fees, which option is fully vested, has an exercise price of $2.29 per share and expires on November 16, 2016.
(3) Effective May 17, 2006, Mr. Leitch’s term as a Director of the Company expired.
(4) Effective March 6, 2007, Dr. Tayebi resigned as a Director of the Company.
113
Compensation Committee Interlocks and Insider Participation
The Compensation Committee is comprised entirely of independent directors. None of the members of our Compensation Committee is or has ever been one of our officers or employees. No interlocking relationship exists between our Board or Compensation Committee and the board of directors or compensation committee of any other entity.
Compensation Committee Report
The Committee has reviewed and discussed the Compensation Discussion and Analysis required by Item 402(b) of Regulation S-K with management and, based on such review and discussions, the Committee recommended to the Board that the Compensation Discussion and Analysis be included in this Annual Report on Form 10-K.
| THE COMPENSATION COMMITTEE
|
| Bandel L. Carano
|
| Scot B. Jarvis
|
| William A. Hoglund
|
12. Item 12.Security Ownership of Certain Beneficial Owners and Management and Related Stockholder Matters
Ownership of more than 5%
The following table shows stock ownership information as of July 31, 2007 with respectrequired by this item is incorporated by reference to beneficial ownership of our common stock and our Series B Convertible preferred stock by each person known to us to be the beneficial owner of more than 5% of such stock. As of July 31, 2007, there were 74,061,650 shares of our common stock and 10,000 shares of our Series B preferred stock issued and outstanding. Information with respect to beneficial owners of more than 5% of the common stock is based upon the most recent Schedule 13G these owners have filed with SEC.
| | Beneficial Ownership(1) | |
| | Common Stock | | Series B Convertible
Preferred Stock | | Common Shares On An
As-Converted Basis | |
Identity of Owner or Group | | | | Shares | | % Ownership | | Shares | | % Ownership | | Shares | | % Ownership | |
ICM Asset Management | | 3,717,872 | | | 5.02 | | | | — | | | | — | | | | 3,717,872 | | | | 4.95 | | |
601 W. Main Avenue, Suite 600
Spokane, WA 99201 | | | | | | | | | | | | | | | | | | | | | | | |
T. Rowe Price | | 5,996,762 | | | 8.10 | | | | — | | | | — | | | | 5,996,762 | | | | 7.99 | | |
100 E. Pratt Street
Baltimore, MD 21202 | | | | | | | | | | | | | | | | | | | | | | | |
State of Wisconsin Investment Board | | 5,488,365 | | | 7.41 | | | | — | | | | — | | | | 5,488,365 | | | | 7.31 | | |
P.O. Box 7842
Madison, WI 53707 | | | | | | | | | | | | | | | | | | | | | | | |
Massih Tayebi BridgeWest LLC | | 6,054,898 | (3) | | 8.18 | | | | — | | | | — | | | | 6,054,898 | | | | 8.07 | | |
4350 La Jolla Village Drive, Suite 450
San Diego, CA 92121 | | | | | | | | | | | | | | | | | | | | | | | |
| | | | | | | | | | | | | | | | | | | | | | | | | |
(1) This table is based upon information supplied principal stockholders and Schedules 13G filedRegistrant's Proxy Statement or Form 10-K/A, which we will file with the SEC andwithin 120 days after the information is not necessarily indicativeend of beneficial ownership for any other purpose. Under such rules, beneficial ownership includes any shares as to which the individual or entity has sole or shared voting power or investment power and any shares as to which the individual or entity has the right to acquire beneficial ownership within 60 days of July 31, 2007 through the exercise of any stock
option or other right. The inclusion of such shares, however, does not constitute an admission that the named stockholder is a direct or indirect beneficial owner of, or receives the economic benefit from, such shares. Applicable percentages are based on 74,061,650 shares of common stock, and 10,000 shares of Series B convertible preferred stock outstanding on July 31,fiscal 2007.
(2) These securities are owned by various individual and institutional investors, which Price Associates serves as an investment adviser with power to direct investments and/or sole power to vote the securities. For purposes of the reporting requirements of the Securities Exchange Act of 1934, Price Associates is deemed to be a beneficial owner of such securities; however Price Associates expressly disclaims that it is, in fact, the beneficial owner of such securities.
(3) Does not include 52,762 shares held by spouse of Massih Tayebi. Massih Tayebi disclaims beneficial ownership of such shares.
Ownership by Directors and Executive Officers
The following table shows the amount of our common stock and our Series B convertible preferred stock beneficially owned by our (i) our Directors, (ii) each of the named executive officers in the Summary Compensation Table, and (iii) our Directors and executive officers as a group. All information in the following table is presented as of July 31, 2007. Unless otherwise indicated in the table set forth below, each person named below has an address in care of the Company’s principal executive offices.
| | Beneficial Ownership(1) | |
| | Common Stock | | Series B Convertible
Preferred Stock | | Common Shares On An
As-Converted Basis | |
Identity of Owner or Group | | | | Shares | | % Ownership | | Shares | | % Ownership | | Shares | | % Ownership | |
Directors | | | | | | | | | | | | | | | | | | | | | | | |
Scott I. Anderson
c/o Cedar Grove Investments, LLC
3825 Issaquah Pine Lake Road
Sammamish, WA 9807 | | 734,012 | (2) | | * | | | | — | | | | — | | | | 734,012 | | | | * | | |
Bandel L. Carano
Oak Investment Partners
525 University Avenue, Suite 1300
Palo Alto, CA 94302 | | 5,535,701 | (3) | | 7.46 | | | | — | | | | — | | | | 5,535,701 | | | | 7.36 | | |
Eric M. DeMarco | | 2,032,949 | (4) | | 2.67 | | | | — | | | | — | | | | 2,032,949 | | | | 2.64 | | |
William A. Hoglund
434 35th Avenue
Seattle, WA 98122 | | 251,626 | (5) | | * | | | | — | | | | — | | | | 251,626 | | | | * | | |
Scot B. Jarvis
c/o Cedar Grove Investments, LLC
3825 Issaquah Pine Lake Road Sammamish, WA 9807 | | 734,012 | (6) | | * | | | | — | | | | — | | | | 734,012 | | | | * | | |
Masood Tayebi(7)
4350 La Jolla Village Drive,
Suite 450 San Diego, CA 92121 | | 6,466,529 | (8) | | 8.73 | | | | — | | | | — | | | | 6,466,529 | | | | 8.61 | | |
Officers | | | | | | | | | | | | | | | | | | | | | | | |
Deanna Lund | | 407,615 | (9) | | * | | | | — | | | | — | | | | 407,615 | | | | * | | |
James R. Edwards | | 351,216 | (10) | | * | | | | — | | | | — | | | | 351,216 | | | | * | | |
D. Robin Mickle | | 155,823 | (11) | | * | | | | — | | | | — | | | | 155,823 | | | | * | | |
Dariush G. Alipanah(12) | | 7,545 | | | * | | | | — | | | | — | | | | 7,545 | | | | * | | |
All Directors and Officers as a Group (11 persons) | | 16,807,909 | (13) | | 22.69 | % | | | — | | | | — | | | | 16,807,909 | | | | 22.39 | % | |
Total Shares Outstanding | | 74,061,650 | | | | | | | | | | | | | | | | | | | | | |
Adjusted for Preferred Shares Conversion Series B | | | | | | | | | | | | | | | | | | | | | | | |
If Converted Additional Shares | | 1,000,000 | | | | | | | | | | | | | | | | | | | | | |
Adjusted Common Shares (If Converted) | | 75,061,650 | | | | | | | | | | | | | | | | | | | | | |
| | | | | | | | | | | | | | | | | | | | | | | | | |
* Less than one percent.
(1) This table is based upon information supplied by officers, directors and principal stockholders and Schedules 13G filed with the SEC, and the information is not necessarily indicative of beneficial ownership for any other purpose. Under such rules, beneficial ownership includes any shares as to which the individual or entity has sole or shared voting power or investment power and any shares as to which the individual or entity has the right to acquire beneficial ownership within 60 days of July 31, 2007 through the exercise of any stock option or other right. The inclusion of such shares, however, does not constitute an admission that the named stockholder is a direct or indirect beneficial owner of, or receives the economic benefit from, such shares. Applicable percentages are based on 74,061,650 shares of common stock, and 10,000 shares of Series B convertible preferred stock outstanding on July 31, 2007. In addition, shares issuable pursuant to options which may be exercised within 60 days of July 31, 2007 are deemed to be issued and outstanding and have been treated as outstanding in calculating the percentage ownership of those individuals possessing such interest, but not for any other individual, pursuant to SEC Rule 13d-3(d)(1).
(2) Includes 130,000 shares subject to options exercisable within 60 days of July 31, 2007.
(3) Includes 149,546 shares subject to options exercisable within 60 days of July 31, 2007. Includes 2,554 shares of common stock held directly by Mr. Carano, 14,828 shares of common stock held by Oak Investment Partners VI, L.P., 346 shares of common stock held by Oak VI Affiliates Fund, L.P., 1,402,084 shares of common stock held by Oak Investment Partners IX, Limited Partnership, 14,942 shares of common stock held by Oak IX Affiliates Fund, Limited Partnership, 33,655 shares of common stock held by Oak IX Affiliates Fund-A, Limited Partnership, 48,957 shares held by Oak IX Affiliates, LLC, 3,808,026 shares of common stock held by Oak Investment Partners X, Limited Partnership, 61,123 shares of common stock held by Oak X Affiliates Fund, Limited Partnership. Bandel Carano is a general partner of Oak Investment Partners VI, L.P., Oak VI Affiliates Fund, L.P., Oak Investment Partners IX, L.P., Oak IX Affiliates Fund, L.P., Oak IX Affiliates Fund-A, L.P., Oak IX Affiliates, LLC, Oak Investment Partners X, L.P. and Oak X Affiliates Fund, L.P. Mr. Carano has indirect ownership of these shares and has shared power to vote and dispose of these shares. Mr. Carano disclaims beneficial ownership of the shares held by Oak Investment Partners VI, L.P., Oak VI Affiliates Fund, L.P., Oak Investment Partners IX, L.P., Oak IX Affiliates Fund, L.P., Oak IX Affiliates Fund-A, L.P., Oak IX Affiliates, LLC, Oak Investment Partners X, L.P. and Oak X Affiliates Fund, L.P.
(4) Includes 7,949 shares held in the Company’s 401(k) Plan and 1,975,000 shares subject to options exercisable within 60 days from July 31, 2007.
(5) Includes 195,000 shares subject to options exercisable within 60 days from July 31, 2007.
(6) Includes 130,000 shares subject to options exercisable within 60 days from July 31, 2007.
(7) Effective March 6, 2007, Masood Tayebi, resigned from our Board.
(8) Includes 6,466,529 shares held directly by Masood K. Tayebi or over which Dr. Tayebi has sole voting power. Excludes: 404,693 shares held directly by Dr. Tayebi’s spouse; 2,000,000 shares held in a revocable living trust of which Dr. Tayebi’s spouse is trustee; and 646,137 shares held in a grantor retained annuity trust of which Dr. Tayebi’s spouse is trustee. Dr. Tayebi disclaims beneficial ownership of all such shares.
(9) Includes 7,615 shares held in the Company’s 401(k) Plan and 400,000 shares subject to options exercisable within 60-days from July 31, 2007.
(10) Includes 7,251 shares held in the Company’s 401(k) Plan and 340,000 shares subject to options exercisable within 60 days from July 31, 2007.
(11) Includes 5,823 shares held in the Company’s 401(k) Plan and 150,000 shares subject to options exercisable within 60-days of July 31, 2007.
(12) Effective June 1, 2007, Mr. Alipanah’s employment with the Company was terminated in connection the Company’s sale of all of the assets of its Engineering Division.
(13) Includes 3,592,134 shares subject to options exercisable within 60 days of July 31, 2007.
Item 13.Certain Relationships and Related Transactions and Director Independence
In December 2005, our Board made The information required by this item is incorporated by reference to the decision to exit our Mexican operations and certain of our other deployment businesses in South America. Prior to this decision, these operations had been reported in our Wireless Network Services segment. We determined that these operations meetRegistrant's Proxy Statement or Form 10-K/A, which we will file with the criteria to be classified as held for sale. Accordingly, we have reflected these operations as discontinued in accordance with SFAS No. 144, “Accounting for the Impairment or Disposal of Long-Lived Assets.” Our South American deployment operations were substantially shut down as ofSEC within 120 days after the end of December 2005.
On February 17, 2006, we entered into a definitive agreement with Sakoki LLC to divest all of our operations in Mexico for total approximate cash consideration of $18 million, payable in installments, subject to adjustment, which approximates the net book value of the operations, including $13.2 million of liabilities associated with a loss contingency. The transaction was finalized on March 10, 2006. The transaction was structured as a sale of our subsidiaries in Mexico, and the purchase price consisted of $1.5 million in cash paid on February 17, 2006, plus a secured promissory note in the principal amount of $16.5 million which was payable in installments through December 31, 2006, subject to adjustment. The note is secured by pledges of assets and a personal guaranty.
In making this decision, our Board considered a number of business factors occurring in the region to arrive at the conclusion that the divesture was in the best interests of our stockholders. The benefits associated with this transaction would improve our free cash flow, improve overall liquidity, and allow us to focus more of our resources on our domestic operations, including investing in the growth of our government business.
The decision to divest the Mexican operations was prompted by the changing business climate in Mexico and a review of the strategic alternatives for our free cash flow. Unfavorable contractual terms that had been proposed by our largest customer in Mexico would further increase the extensive working capital required to operate a Mexican deployment company while pricing pressure threatens to adversely affect the future profitability of the Mexican operations. Further, the refinements of the cell site build plans by our largest customers had resulted in the cancellation of a number of sites that we were building in Mexico and certain South American locations. This resulted in a write-off of unrecoverable expenses of approximately $5.0 million in 2005, for which we had not been able to negotiate any termination settlements with our customers to offset these costs.fiscal 2007.
The purchaser, Sakoki LLC, a newly-formed entity is controlled by Massih Tayebi. Although Massih Tayebi has no current role with the Company, he was one of our co-founders, having served as our Chief Executive Officer from inception in 1994 through September 2000, and as one of our Directors from inception through April 2002. In addition, at the time of the transaction, Massih Tayebi owned or controls approximately 11% of the total voting power of our capital stock. He is also the brother of Masood Tayebi, the former Chairman of our Board. Masood Tayebi had no personal financial interest in the transaction has never had any role with the entity that purchased the Mexico operations. The transaction was approved by the disinterested members of our Board of Directors after consideration of other expressions of interest and a valuation analysis by an independent firm.
Sakoki LLC paid the note in full to the Company in December 2006 and the Company released all secured assets to Massih Tayebi.
Based upon a review by disinterested members of management and our Board regarding the terms of comparable transactions available from or involving third parties, we believe that all transactions with related parties described above were made on terms no less favorable to us than could have been obtained from unaffiliated third parties. All transactions between the Company and related parties are subject to review by the Audit Committee and the independent members of the Board.
Procedures for Approval of Related Party Transactions
Under its charter the Audit Committee of our Board is charged with reviewing all potential related party transactions. Our policy has been that the Audit Committee, which is comprised solely of independent, disinterested Directors, then recommends such related party transactions to the entire Board for further review and approval. All such related party transactions are then required to be reported under applicable SEC rules. Otherwise, the Company has not adopted procedures for review of, or standards for approval of, these transactions, but instead reviews such transactions on a case-by-case basis.
Item 14.Principal Accountant Fees and Services
| | Fiscal 2005 | | Fiscal 2006 | |
Audit Fees(1) | | $ | 2,642,755 | | $ | 3,045,734 | |
Audit-Related Fees(2) | | $ | 130,000 | | $ | — | |
Tax Fees(3) | | $ | 62,573 | | $ | — | |
All Other Fees(4) | | $ | -0- | | $ | — | |
(1)Audit Fees consist of fees billed and expected to be billed for professional services rendered for the integrated audit of our consolidated annual financial statements and review of the interim consolidated financial statements included in quarterly reports and services that are normally provided The information required by Grant Thornton in connection with statutory and regulatory filings or engagements.
(2)Audit-Related Fees consist of fees billed and expected to be billed for assurance and related services that are reasonably relatedthis item is incorporated by reference to the performance of the auditRegistrant's Proxy Statement or review of our consolidated financial statements and are not reported under “Audit Fees.” This category includes fees related to due diligence services pertaining to potential business acquisitions/disposition; and consultation regarding accounting or disclosure treatment of transactions or events and/or the actual or potential impact of final or proposed rules, standard or interpretation byForm 10-K/A, which we will file with the SEC FASB or other regulatory or standard-setting bodies. General assistance with implementationwithin 120 days after the end of the requirements of SEC rules or listing standards promulgated pursuant to the Sarbanes-Oxley Act of 2002.fiscal 2007.
(3)Tax Fees consist of fees billed and expected to be billed for professional services rendered for tax compliance, tax advice and tax planning. These services include assistance regarding federal state and local tax compliance, planning and advice; international tax compliance, planning and advice; review of federal, state, local and international income franchising and other tax returns.
PART IV
(4)All Other Fees consist of fees for products and services other than the services reported above.
The Audit Committee’s policy is to pre-approve all audit and permissible non-audit services provided by our independent auditors. These services may include audit services, audit-related services, tax services and other services. Pre-approval is generally provided for up to one year and any pre-approval is detailed as to the particular service or category of services. The Audit Committee has delegated pre-approval authority to the Audit Committee Chairperson. The independent auditor and management are required to periodically report to the Audit Committee regarding the extent of services provided by the independent auditor in accordance with this pre-approval.
PART IV
Item 15.Exhibits, Financial Statement Schedules
(a) Financial Statements and Financial Statement Schedules
Report of Independent Registered Public Accounting FirmReport of Independent Registered Public Accounting Firm
Consolidated Balance Sheets as of December 31, 20052006 and 20062007
Consolidated Statements of Operations for the Years Ended December 31, 2004, 2005, 2006 and 20062007
Consolidated Statements of Stockholders’Stockholders' Equity for the Years Ended December 31, 2004, 2005, 2006 and 20062007
Consolidated Statements of Cash Flows for the Years Ended December 31, 2004, 2005, 2006 and 20062007
Notes to Consolidated Financial Statements
All other schedules for which provision is made in the applicable accounting regulations of the SEC are not required under the related instructions or are inapplicable and therefore have been omitted.
- (2)
- Exhibits
|
|
|
|
|
| |
| | Incorporated by Reference |
|
|
|
|
|
|---|
| Exhibit Number
| | Exhibit
Number |
| Exhibit Description
|
|
| | Form |
|
| | Filing
Date/Period
End Date |
|
| | Filed-
Furnished
Filed-Furnished Herewith |
|
|---|
| 2.1 | 2.1
| | | Stock Purchase Agreement by and among the Company, JMA Associates, Inc. d/b/a TLA Associates, and the Stockholders of JMA Associates, Inc., dated as of January 27, 2005. | | 8-K | S-1
| 02/02/05 | | | 08/18/99
| | | | | | |
| 2.2 | 2.2
| | | Equity Purchase Agreement, dated February 17, 2006, by and between Sakoki LLC and the Company. | | 8-K | 8-K
| | | | 02/23/06 | | | | | | |
| 2.3 | 2.3
| | | Addendum and Waiver Related to the Equity Purchase Agreement, dated June 26, 2006, by and between Sakoki LLC and the Company. | | 10-Q | 10-Q
| | | | 06/30/06 | | | | | | |
| 2.4 | 2.4
| | | Merger Agreement, dated August 8, 2006, by and among the Company, WFI Government Services, Inc., MRC Merger Company, Inc. and Madison Research Corporation. | | 8-K | 8-K
| | | | 08/14/06 | | | | | | |
| 2.5 | 2.5
| | | Agreement dated as of March 9, 2007 by and between LCC Wireless Engineering Services Limited and the Company. | | 10-K | | 12/31/06 | | | | | | | *
| | |
| 2.6 | 2.6
| Equity Purchase Agreement, dated April 20, 2007, by and between the Company and Strategic Project Services, LLC. | | 10-K | | 12/31/06 | | |
| 2.7 | | Asset Purchase Agreement, dated May 29, 2007, by and between the Company and LCC International, Inc. | | 8-K | 8-K
| | | | 05/30/07 | | | | | | |
| 2.8 | 2.7
| | | Asset Purchase Agreement, dated July 7, 2007, by and between the Company and Burgundy Acquisition Corporation. | | 8-K | 8-K
| | | | 07/12/07 | | | | | | |
| 2.9 | 3.1
| Agreement and Plan of Merger, dated November 2, 2007, by and among the Company, Kratos Government Solutions, Inc., Haverstick Acquisition Corporation and Haverstick Consulting, Inc. | | 8-K | | 11/07/07 | | |
| 3.1 | | Amended and Restated Certificate of Incorporation. | | 10-Q | 10-Q
| | | | 09/30/01 | | | | | | |
| 3.2 | 3.2
| Certificate of Ownership and Merger of Kratos Defense & Security Solutions, Inc. into Wireless Facilities, Inc. | | Bylaws in effect since Novmeber 5, 1999.
8-K | | 9/12/07 | S-1
| | | | 08/18/99
| | | | | | |
| 3.3 | 3.3
| Amended and Restated Bylaws of the Company, as amended December 31, 2007. | | 8-K | | 01/07/08 | | |
| 3.4 | | Certificate of Designations, Preferences and Rights of Series A Preferred Stock. | | 10-Q | 10-Q
| | | | 09/30/01 | | | | | | |
| 3.5 | 3.4
| | | Certificate of Designations, Preferences and Rights of Series B Preferred Stock. | | 8-K/A | 8-K/A
| | | | 06/05/02 | | | | | | |
| 3.6 | 3.5
| | | Certificate of Designation of Series C Preferred Stock. | | 8-K | 8-K
| | | | 12/17/04 | | | | | | |
| 4.1 | 4.1
| | | Reference is made to Exhibits 3.1 and 3.2. | | | | | | | | | | | | | |
| 4.2 | 4.2
| | | Specimen Stock Certificate. | | S-1 | S-1
| | | | 08/18/99 | | |
| 4.3 | | | | |
| 4.3
| | | Rights Agreement, dated as of December 16, 2004, between the Company and Wells Fargo, N.A. | | 8-K | 8-K
| | | | 12/17/04 | | | | | | |
| 10.1# | 10.1
| | | 1997 Stock Option Plan. | | S-1 | S-1
| | | | 08/18/99 | | | | | | |
| 10.2# | 10.2
| | | Form of Stock Option Agreement pursuant to the 1997 Stock Option Plan and related terms and conditions. | | S-1/A | S-1/A
| | | | 09/10/99 | | | | | | |
| 10.3# | 10.3
| | | 1999 Equity Incentive Plan. | | S-1 | S-1
| | | | 08/18/99 | | | | | | |
| 10.4# | 10.4
| | | Form of Stock Option Agreement pursuant to the 1999 Equity Incentive Plan. | | S-1/A | S-1/A
| | | | 09/10/99 | | | | | | |
| 10.5# | 10.5
| | | 1999 Employee Stock Purchase Plan and related offering documents. | | S-1 | S-1
| | | | 08/18/99 | | |
| 10.6# | | | | |
| 10.6
| | | Form of Indemnity Agreement by and between the Company and certain officers and directors of the Company. | | S-1 | S-1
| | | | 08/18/99 | | | | | | |
| 10.7# | 10.7
| | | 2000 Nonstatutory Stock Option Plan. | | 10-Q | 10-Q
| | | | 09/30/00 | | | | | | |
| 10.8# | 10.8
| | | Form of Stock Option Agreement and Grant Notice used in connection with the 2000 Nonstatutory Stock Option Plan. | | 10-Q | 10-Q
| | | | 09/30/00 | | | | | | |
| 10.9# | 10.9
| | | Executive Employment Agreement by and between the Company and Eric DeMarco effective November 14, 2003. | | 10-K | 10-K
| | | | 12/26/03 | | | | | | |
| 10.10# | 10.10
| | | Amended and Restated Severance and Change of Control Agreement dated March 28, 2006 between the Company and Deanna Lund. | | 10-K | 10-K
| | | | 12/31/05 | | | | | | |
| 10.11# | 10.11
| | | Amended and Restated Severance and Change of Control Agreement dated March 28, 2006 between the Company and James Edwards. | | 10-K | 10-K
| | | | 12/31/05 | | | | | | |
| 10.12# | 10.12
| | | Nonqualified Deferred Compensation Plan. | | 10-K | 10-K
| | | | 12/31/05 | | | | | | |
| 10.13# | 10.13
| | | 2005 Equity Incentive Plan. | | S-8 | S-8
| | | | 08/01/05 | | | | | | |
| 10.14# | 10.14
| | | Form of Stock Option Agreement pursuant to the 2005 Equity Incentive Plan. | | S-8 | S-8
| | | | 08/01/05 | | | | | | |
| 10.15# | 10.15
| Form of Restricted Stock Unit Agreement and Form of Notice of Grant under the Company's 2005 Equity Incentive Plan. | | Credit8-K
| | 01/17/07 | | |
| 10.16# | | Severance and Change of Control Agreement dated as of March 16, 2005, by and amongJuly 12, 2007 between the Company Keybank National Association and Keybank Capital Markets.Laura L. Siegal. | | 10-K | 10-K
| 09/11/07 | | | 12/31/05
| | | | | | |
| 10.17 | 10.16
| Form of Subordinated Promissory Note issued by LCC International, Inc. to the Company. | | Credit8-K
| | 5/30/07 | | |
| 10.18 | | Form of Subordination Agreement dated October 2, 2006,executed by and amongLCC International, Inc., the Company KeyBank National Association and Keybanc Capital Markets as lead arranger and sole book runner, dated October 2, 2006.Bank of America, N.A. | | 8-K | 8-K
| 5/30/07 | | | 08/14/06
| | | | | | |
| 10.19 | 10.17
| | | Note Sale Agreement, dated July 3, 2007, by and between SPCP Group, LLC International, Inc. and the Company. | | 8-K | 8-K
| 7/10/07 | | | 07/10/07
| | | | | | |
| 10.20 | 10.18
| | | Assignment Agreement, dated July 3, 2007, by and among the Company, SPCP Group LLC, LCC International, Inc. and Bank of America, N.A. | | 8-K | 8-K
| 7/10/07 | | | 07/10/07
| | | | | | |
| 10.21 | 10.19
| | | Form of Restricted Stock UnitEarnout Agreement executed by the Company and Form of Notice of Grant under the Company’s 2005 Equity Incentive Plan. Burgundy Acquisition Corporation. | | 8-K | 8-K
| 7/12/07 | | |
| 10.22 | 01/17/07
| | | | | | |
| 10.20
| | | SeveranceFacility Letter, dated October 24, 2007, by and Change of Control Agreement dated as of July 12, 2007 between the Company and Laura L. Siegal.
KeyBank Capital Markets. | | 8-K | | 11/07/07 | | | | | | | *
| | |
| 10.23 | 21.1
| First Lien Credit Agreement among Kratos Defense & Security Solutions, Inc., KeyBank National Association, as Administrative Agent and Lender and the other financial institutions parties thereto and Keybanc Capital Markets as lead arranger and book runner, dated as of December 31, 2007. | | 8-K | | 01/07/08 | | |
| 10.24 | | Second Lien Credit Agreement among Kratos Defense & Security Solutions, Inc., KeyBank National Association, as Administrative Agent and Lender, the other financial institutions parties thereto and Keybanc Capital Markets as lead arranger and book runner, dated as of December 31, 2007. | | 8-K | | 01/07/08 | | |
| 21.1 | | List of SubsidiariesSubsidiaries. | | | | | | | | | | | * | | |
| 23.1 | 23.1
| | | Consent of Independent Registered Public Accounting Firm. | | | | | | | | | | | * | | |
| 31.1 | 23.2
| | | Consent of Independent Registered Public Accounting Firm.
| | | | | | | | | | | *
| | |
| 31.1
| | | Certification of Chief Executive Officer Eric M. DeMarco, pursuant to Section 302 of the Sarbanes Oxley Act of 2002. | | | | | | * |
| 31.2 | | | | | *
| | |
| 31.2
| | | Certification of Chief Financial Officer Deanna Lund, pursuant to Section 302 of the Sarbanes Oxley Act of 2002. | | | | | | | | | | | * | | |
| 32.1 | 32.1
| | | Certification pursuant to 18 U.S.C. Section 1350, as adopted pursuant to Section 906 of the Sarbanes-Oxley Act of 2002 for Eric M. DeMarco. | | | | | | | | | | | * | | |
| 32.2 | 32.2
| | | Certification pursuant to 18 U.S.C. Section 1350, as adopted pursuant to Section 906 of the Sarbanes-Oxley Act of 2002 for Deanna Lund. | | | | | | | | | | | * | | |
- #
- Indicates a management contract or compensatory plan or arrangement required to be filed as an exhibit to this form.
121
SIGNATURES
SIGNATURES
Pursuant to the requirements of Section 13 or 15(d) of the Securities Exchange Act of 1934, the registrant has duly caused this report to be signed on its behalf by the undersigned, thereunto duly authorized.
Date: September 11, 2007March 27, 2008
| WIRELESS FACILITIES,
| KRATOS DEFENSE & SECURITY SOLUTIONS, INC. |
| By:
|
By:
|
|
/s/ ERIC M. DEMARCO |
|
|
Eric M. DeMarco
President and Chief Executive Officer |
Pursuant to the requirements of the Securities Exchange Act of 1934, this report has been signed below by the following persons on behalf of the registrant and in the capacities and on the date indicated:
Signature
| | Title
| | Date
|
|---|
| Signature
|
|
|
| Title
|
|
|
| Date
|
|
/s/ ERIC M. DEMARCO
Eric M. DeMarco | | President and Chief Executive Officer | | September 11, 2007
March 27, 2008 |
Eric M. DeMarco
| | | | |
/s/ DEANNA H. LUND
Deanna H. Lund |
|
Senior Vice President, Chief Financial Officer
|
| September 11, 2007
March 27, 2008 |
Deanna H. Lund
| | | | |
/S/ s/ LAURA L. SIEGAL
Laura L. Siegal |
|
VP, Corporate Controller and Principal Accounting
Officer |
| September 11, 2007
March 27, 2008 |
Laura L. Siegal
/s/ SCOTT ANDERSON
Scott Anderson |
| Officer
Director |
|
March 27, 2008 |
/S/ SCOTT ANDERSON
s/ BANDEL CARANO
Bandel Carano |
|
Director
|
| September 11, 2007
March 27, 2008 |
Scott Anderson
| | | | |
/S/ BANDEL CARANO
| | Director
| | September 11, 2007
|
Bandel Carano
| | | | |
/S/ s/ SCOT JARVIS
| | Director
| | September 11, 2007
|
Scot Jarvis |
|
Director |
| |
/S/ WILLIAM HOGLUND
| | Director
| | September 11, 2007
|
William Hoglund
| | | |
March 27, 2008 |
122
Report of Independent Registered Public Accounting FirmREPORT OF INDEPENDENT REGISTERED PUBLIC ACCOUNTING FIRM
Board of Directors and Stockholders
Wireless Facilities,Kratos Defense and Security Solutions, Inc.
We have audited the accompanying consolidated balance sheets of Wireless Facilities,Kratos Defense and Security Solutions, Inc. (a Delaware Corporation) and subsidiaries (the Company)"Company") as of December 31, 2006 and 2005,2007, and the related consolidated statements of operations, stockholders’stockholders' equity, and cash flows for each of the three years then ended.in the period ended December 31, 2007. These consolidated financial statements are the responsibility of the Company's management. Our responsibility is to express an opinion on these consolidated financial statements based on our audits.
We conducted our audits in accordance with the standards of the Public Company Accounting Oversight Board (United States). Those standards require that we plan and perform the audit to obtain reasonable assurance about whether the financial statements are free of material misstatement. An audit includes examining, on a test basis, evidence supporting the amounts and disclosures in the financial statements. An audit also includes assessing the accounting principles used and significant estimates made by management, as well as evaluating the overall financial statement presentation. We believe that our audits provide a reasonable basis for our opinion.
In our opinion, the consolidated financial statements referred to above present fairly, in all material respects, the financial position of Wireless Facilities,Kratos Defense and Security Solutions, Inc. and subsidiaries as of December 31, 2006 and 2005,2007, and the results of their consolidated operations and their cash flows for each of the three years thenin the period ended December 31, 2007 in conformity with accounting principles generally accepted in the United States of America.
As discussed in Note 1 of the notes to the consolidated financial statements, on January 1, 2006, the Company has adopted Statement of Financial Accounting Standards Board Statement No. 123R, “123(R),"Share-Based Payments”".
As discussed in Note 10 of the notes to consolidated financial statements, on January 1, 2006.2007, the Company has adopted Financial Accounting Standards Board issued Interpretation No. 48, "Accounting for Uncertainty in Income Taxes—An Interpretation of FASB Statement No. 109".
As described in Note 2, the accompanying consolidated financial statements for the year ended December 31, 2005 We have been restated.
We also have audited, in accordance with the standards of the Public Company Accounting Oversight Board (United States), the effectiveness of the Company’sKratos Defense and Security Solutions, Inc.'s internal control over financial reporting as of December 31, 2006,2007 based on criteria established inInternal Control—Integrated Framework issued by the Committee of Sponsoring Organizations of the Treadway Commission (COSO) and our report dated September 10, 2007March 27, 2008 expressed an unqualified opinion on management’s assessment of, and an adverse opinion on the effectiveness of the Company’s internal control over financial reporting.
/s/ GRANT THORNTON LLP
| |
Los Angeles, California
| |
September 10, 2007
| |
thereon.
123/s/GRANT THORNTON LLP
Irvine, California
March 27, 2008
Report of Independent Registered Public Accounting Firm
The Board of Directors and Stockholders
Wireless Facilities, Inc.:
We have audited the accompanying consolidated statements of operations, stockholders’ equity, and cash flows of Wireless Facilities, Inc. and subsidiaries (the Company) for the year ended December 31, 2004. These consolidated financial statements are the responsibility of the Company’s management. Our responsibility is to express an opinion on these consolidated financial statements based on our audit.
We conducted our audit in accordance with the standards of the Public Company Accounting Oversight Board (United States). Those standards require that we plan and perform the audit to obtain reasonable assurance about whether the financial statements are free of material misstatement. An audit includes examining, on a test basis, evidence supporting the amounts and disclosures in the financial statements. An audit also includes assessing the accounting principles used and significant estimates made by management, as well as evaluating the overall financial statement presentation. We believe that our audit provides a reasonable basis for our opinion.
In our opinion, the consolidated financial statements referred to above present fairly, in all material respects, the results of operations and cash flows of Wireless Facilities, Inc. and subsidiaries for the year ended December 31, 2004, in conformity with U.S. generally accepted accounting principles.
As discussed in Note 2 to the consolidated financial statements, the consolidated financial statements for the year ended December 31, 2004 have been restated.
/s/ KPMG LLP
| |
San Diego, California
| |
March 24, 2005, except for the 2004 related information in Notes 2 and 4,
| |
which is as of September 10, 2007
| |
124
WIRELESS FACILITIES, INC.
Consolidated Balance Sheets
December 31, 20052006 and 20062007
(in millions, except par value and number of shares)
| | 2005 | | 2006 | |
| | (Restated) | | | |
Assets | | | | | | | |
Current assets: | | | | | | | |
Cash and cash equivalents | | | $ | 7.7 | | | $ | 5.4 | |
Restricted cash | | | — | | | 1.0 | |
Accounts receivable, net | | | 100.0 | | | 115.7 | |
Income taxes receivable | | | — | | | 1.8 | |
Prepaid expenses | | | 2.5 | | | 2.6 | |
Other current assets | | | 3.0 | | | 5.5 | |
Current assets of discontinued operations | | | 63.3 | | | 8.0 | |
Total current assets | | | 176.5 | | | 140.0 | |
Property and equipment, net | | | 12.9 | | | 13.9 | |
Goodwill | | | 119.9 | | | 155.4 | |
Other intangibles, net | | | 7.4 | | | 13.4 | |
Deferred tax assets | | | 16.6 | | | 6.2 | |
Investments in unconsolidated affiliates | | | 2.1 | | | 2.1 | |
Other assets | | | 0.9 | | | 1.9 | |
Non current assets of discontinued operations | | | 5.7 | | | 3.0 | |
Total assets | | | $ | 342.0 | | | $ | 335.9 | |
Liabilities and Stockholders’ Equity | | | | | | | |
Current liabilities: | | | | | | | |
Accounts payable | | | $ | 21.6 | | | $ | 26.9 | |
Accrued expenses | | | 15.9 | | | 13.1 | |
Accrued compensation | | | 11.2 | | | 13.9 | |
Line of credit | | | — | | | 51.0 | |
Billings in excess of costs on completed contracts | | | 4.2 | | | 7.3 | |
Deferred tax liabilities | | | 4.3 | | | 7.6 | |
Tax contingencies | | | 1.8 | | | 1.7 | |
Accrual for contingent acquisition consideration | | | 8.2 | | | 9.8 | |
Accrual for unused office space | | | 0.5 | | | 0.8 | |
Income taxes payable | | | 0.1 | | | 0.1 | |
Capital lease obligations and other short-term debt | | | 0.3 | | | 0.4 | |
Current liabilities of discontinued operations | | | 41.0 | | | 11.3 | |
Total current liabilities | | | 109.1 | | | 143.9 | |
Capital lease obligations and debt, net of current portion | | | 0.4 | | | 0.0 | |
Accrual for unused office space, net of current portion | | | 1.2 | | | 1.8 | |
Other liabilities | | | 1.3 | | | 2.9 | |
Other long term liabilities of discontinued operations | | | 0.3 | | | 0.2 | |
Total liabilities | | | 112.3 | | | 148.8 | |
Commitments and contingencies (Notes 1, 6, 16 and 17) | | | | | | | |
Stockholders’ equity: | | | | | | | |
Preferred stock, 5,000,000 shares authorized Series B Convertible Preferred Stock, $.001 par value, 25,483 and 10,000 shares outstanding at December 31, 2005 and 2006, respectively (liquidation preference $12.7 and $5.0, respectively) | | | — | | | — | |
Common stock, $.001 par value, 195,000,000 shares authorized; 72,188,449 and 73,883,950 shares issued and outstanding at December 31, 2005 and 2006, respectively | | | — | | | — | |
Additional paid-in capital | | | 379.3 | | | 391.7 | |
Accumulated deficit | | | (146.7 | ) | | (204.6 | ) |
Accumulated other comprehensive loss | | | (2.9 | ) | | — | |
Total stockholders’ equity | | | 229.7 | | | 187.1 | |
Total liabilities and stockholders’ equity | | | $ | 342.0 | | | $ | 335.9 | |
| | 2006
| | 2007
| |
|---|
| Assets | | | | | | | |
| Current assets: | | | | | | | |
| | Cash and cash equivalents | | $ | 5.4 | | $ | 8.6 | |
| | Restricted cash | | | 1.0 | | | — | |
| | Accounts receivable, net | | | 59.3 | | | 77.0 | |
| | Income taxes receivable | | | 2.6 | | | 1.0 | |
| | Prepaid expenses | | | 2.1 | | | 7.4 | |
| | Notes receivable | | | — | | | 2.6 | |
| | Other current assets | | | 3.4 | | | 8.7 | |
| | Current assets of discontinued operations | | | 67.0 | | | 1.6 | |
| | |
| |
| |
| | | Total current assets | | | 140.8 | | | 106.9 | |
Property and equipment, net |
|
|
6.1 |
|
|
6.9 |
|
| Goodwill | | | 129.9 | | | 194.5 | |
| Other intangibles, net | | | 13.4 | | | 19.9 | |
| Deferred tax assets | | | 6.5 | | | — | |
| Investments in unconsolidated affiliates | | | 2.1 | | | 0.3 | |
| Other assets | | | 1.9 | | | 6.7 | |
| Non current assets of discontinued operations | | | 37.0 | | | 0.1 | |
| | |
| |
| |
| | | Total assets | | $ | 337.7 | | $ | 335.3 | |
| | |
| |
| |
| Liabilities and Stockholders' Equity | | | | | | | |
| Current liabilities: | | | | | | | |
| | Accounts payable | | $ | 16.4 | | $ | 22.7 | |
| | Accrued expenses | | | 5.0 | | | 14.5 | |
| | Accrued compensation | | | 6.4 | | | 9.9 | |
| | Line of credit | | | 51.0 | | | — | |
| | Billings in excess of costs and earnings on uncompleted contracts | | | 4.0 | | | 10.9 | |
| | Deferred tax liabilities | | | 1.3 | | | — | |
| | Accrual for contingent acquisition consideration | | | 9.8 | | | 2.9 | |
| | Income taxes payable | | | — | | | 0.2 | |
| | Accrual for unused office space | | | 0.8 | | | 1.0 | |
| | Other current liabilities | | | — | | | 13.4 | |
| | Current portion of long-term debt | | | 0.4 | | | 2.6 | |
| | Current portion of capital lease | | | — | | | 0.1 | |
| | Current liabilities of discontinued operations | | | 49.5 | | | 5.3 | |
| | |
| |
| |
| | | Total current liabilities | | | 144.6 | | | 83.5 | |
| | |
| |
| |
| Long-term debt, net of current portion | | | — | | | 72.9 | |
| Accrual for unused office space, net of current portion | | | 1.8 | | | 1.4 | |
| Capital lease | | | — | | | 1.1 | |
| Deferred tax liabilities | | | — | | | 2.0 | |
| Other liabilities | | | 2.9 | | | 4.5 | |
| Non current liabilities of discontinued operations | | | 1.3 | | | 2.7 | |
| | |
| |
| |
| | | Total liabilities | | | 150.6 | | | 168.1 | |
| Commitments and contingencies (Notes 1, 2, 6, 8, 9, 10, 16 and 17) | | | | | | | |
| Stockholders' equity: | | | | | | | |
| | Preferred stock, 5,000,000 shares authorized Series B Convertible Preferred Stock, $.001 par value, 10,000 shares outstanding at December 31, 2006 and 2007 (liquidation preference $5.0 million at December 31, 2006 and 2007) | | | — | | | — | |
| | Common stock, $.001 par value, 195,000,000 shares authorized; 73,883,950 and 78,998,922 shares issued and outstanding at December 31, 2006 and 2007, respectively | | | — | | | — | |
| | Additional paid-in capital | | | 391.7 | | | 412.7 | |
| | Accumulated deficit | | | (204.6 | ) | | (245.5 | ) |
| | |
| |
| |
| | | Total stockholders' equity | | | 187.1 | | | 167.2 | |
| | |
| |
| |
| | | Total liabilities and stockholders' equity | | $ | 337.7 | | $ | 335.3 | |
| | |
| |
| |
See accompanying notes to consolidated financial statements.
125
KRATOS DEFENSE & SECURITIES SOLUTIONS, INC.
WIRELESS FACILITIES, INC.
Consolidated Statements of Operations
Years ended December 31, 2004, 2005, 2006 and 20062007
(in millions, except per share amounts)
| | 2004 | | 2005 | | 2006 | |
| | (Restated) | | (Restated) | | | |
Revenues | | | $ | 296.2 | | | | $ | 337.7 | | | $ | 327.8 | |
Cost of revenues | | | 226.8 | | | | 261.4 | | | 274.3 | |
Gross profit | | | 69.4 | | | | 76.3 | | | 53.5 | |
Selling, general and administrative expenses | | | 49.9 | | | | 61.5 | | | 63.0 | |
Contingent acquisition consideration and restatement fees | | | 13.9 | | | | (2.1 | ) | | 0.1 | |
Impairment and restructuring charges | | | — | | | | — | | | 21.8 | |
Operating income (loss) | | | 5.6 | | | | 16.9 | | | (31.4 | ) |
Other income (expense): | | | | | | | | | | | |
Interest income (expense), net | | | 0.2 | | | | 0.1 | | | (0.6 | ) |
Foreign currency gain (loss) | | | (0.1 | ) | | | 0.2 | | | — | |
Impairment of investment in unconsolidated affiliate & other expenses, net | | | (2.9 | ) | | | — | | | — | |
Other expenses, net | | | — | | | | — | | | (0.2 | ) |
Total other income (expense), net | | | (2.8 | ) | | | 0.3 | | | (0.8 | ) |
Income (loss) from continuing operations before income taxes | | | 2.8 | | | | 17.2 | | | (32.2 | ) |
Provision (benefit) for income taxes | | | (0.6 | ) | | | 5.9 | | | 14.5 | |
Income (loss) from continuing operations | | | 3.4 | | | | 11.3 | | | (46.7 | ) |
Income (loss) from discontinued operations | | | 11.6 | | | | (9.7 | ) | | (11.2 | ) |
Net income (loss) | | | $ | 15.0 | | | | $ | 1.6 | | | $ | (57.9 | ) |
Basic earnings (loss) per common share: | | | | | | | | | | | |
Income (loss) from continuing operations | | | $ | 0.05 | | | | $ | 0.15 | | | $ | (0.64 | ) |
Income (loss) from discontinued operations | | | 0.16 | | | | (0.13 | ) | | (0.15 | ) |
Net income (loss) per common share: | | | $ | 0.21 | | | | $ | 0.02 | | | $ | (0.79 | ) |
Diluted earnings (loss) per common share: | | | | | | | | | | | |
Income (loss) from continuing operations | | | $ | 0.05 | | | | $ | 0.15 | | | $ | (0.64 | ) |
Income (loss) from discontinued operations | | | 0.15 | | | | (0.13 | ) | | (0.15 | ) |
Net income (loss) per common share: | | | $ | 0.20 | | | | $ | 0.02 | | | $ | (0.79 | ) |
Weighted average common shares outstanding: | | | | | | | | | | | |
Basic | | | 72.8 | | | | 74.0 | | | 73.5 | |
Diluted | | | 75.3 | | | | 75.0 | | | 73.5 | |
| | 2005
| | 2006
| | 2007
| |
|---|
| Revenues | | $ | 152.3 | | $ | 153.1 | | $ | 193.6 | |
| Cost of revenues | | | 115.7 | | | 124.2 | | | 162.0 | |
| | |
| |
| |
| |
| | | Gross profit | | | 36.6 | | | 28.9 | | | 31.6 | |
| | |
| |
| |
| |
| Selling, general and administrative expenses | | | 35.5 | | | 38.5 | | | 39.5 | |
| Stock option investigation and related fees | | | — | | | — | | | 14.0 | |
| Estimated cost for settlement of securities litigation | | | — | | | — | | | 4.9 | |
| Recovery of unauthorized issuance of stock options | | | — | | | — | | | (3.4 | ) |
| Contingent acquisition consideration and restatement fees | | | (2.1 | ) | | 0.1 | | | — | |
| Impairment and restructuring charges | | | — | | | 21.8 | | | 1.2 | |
| | |
| |
| |
| |
| | | Operating income (loss) from continuing operations | | | 3.2 | | | (31.5 | ) | | (24.6 | ) |
| | |
| |
| |
| |
| Other income (expense): | | | | | | | | | | |
| | Interest income (expense), net | | | 0.1 | | | (0.7 | ) | | (1.2 | ) |
| | Foreign currency gain | | | 0.2 | | | — | | | — | |
| | Impairment of investments in unconsolidated affiliates | | | — | | | — | | | (1.8 | ) |
| | Other income and (expenses), net | | | — | | | (0.2 | ) | | 0.7 | |
| | |
| |
| |
| |
| | | Total other income (expense), net | | | 0.3 | | | (0.9 | ) | | (2.3 | ) |
| | |
| |
| |
| |
| Income (loss) from continuing operations before income taxes | | | 3.5 | | | (32.4 | ) | | (26.9 | ) |
| Provision (benefit) for income taxes from continuing operations | | | (0.1 | ) | | 13.8 | | | 1.3 | |
| | |
| |
| |
| |
| Income (loss) from continuing operations | | | 3.6 | | | (46.2 | ) | | (28.2 | ) |
| Loss from discontinued operations | | | (2.0 | ) | | (11.7 | ) | | (12.6 | ) |
| | |
| |
| |
| |
| | | Net income (loss) | | $ | 1.6 | | $ | (57.9 | ) | $ | (40.8 | ) |
| | |
| |
| |
| |
| Basic earnings (loss) per common share: | | | | | | | | | | |
| | Income (loss) from continuing operations | | $ | 0.05 | | $ | (0.63 | ) | $ | (0.38 | ) |
| | Loss from discontinued operations | | | (0.03 | ) | | (0.16 | ) | | (0.17 | ) |
| | |
| |
| |
| |
| | | Net income (loss) per common share: | | $ | 0.02 | | $ | (0.79 | ) | $ | (0.55 | ) |
| | |
| |
| |
| |
| Diluted earnings (loss) per common share: | | | | | | | | | | |
| | Income (loss) from continuing operations | | $ | 0.05 | | $ | (0.63 | ) | $ | (0.38 | ) |
| | Loss from discontinued operations | | | (0.03 | ) | | (0.16 | ) | | (0.17 | ) |
| | |
| |
| |
| |
| | | Net income (loss) per common share: | | $ | 0.02 | | $ | (0.79 | ) | $ | (0.55 | ) |
| | |
| |
| |
| |
| Weighted average common shares outstanding: | | | | | | | | | | |
| | Basic | | | 74.0 | | | 73.5 | | | 74.0 | |
| | Diluted | | | 75.0 | | | 73.5 | | | 74.0 | |
See accompanying notes to consolidated financial statements.
126
WIRELESS FACILITIES,KRATOS DEFENSE & SECURITY SOLUTIONS, INC.
Consolidated Statements of Stockholders’Stockholders' Equity
Years ended December 31, 2004, 2005, 2006 and 20062007
(in millions)
| | | | | | | | | | Retained | | Accumulated | | | |
| | Convertible | | | | Additional | | | | Earnings | | Other | | Total | |
| | Preferred Stock | | Common Stock | | Paid-In | | Deferred | | (Accumulated | | Comprehensive | | Stockholders’ | |
| | Shares | | Amount | | Shares | | Amount | | Capital | | Compensation | | Deficit) | | Loss | | Equity | |
| | | | | | | | | (Restated) | | (Restated) | | (Restated) | | | | (Restated) | |
Balance, December 31, 2003 (As originally reported) | | | 0.1 | | | | — | | | | 62.6 | | | | $ 0.1 | | | | $ 309.6 | | | | $ — | | | | $ (100.4 | ) | | | $ (4.0 | ) | | | $ 205.3 | | | |
Prior period adjustments | | | | | | | | | | | | | | | | | | | 56.1 | | | | (6.6 | ) | | | (62.9 | ) | | | — | | | | (13.4 | ) | | |
Balance, December 31, 2003 (Restated) | | | 0.1 | | | | — | | | | 62.6 | | | | $ 0.1 | | | | $ 365.7 | | | | $ (6.6 | ) | | | $ (163.3 | ) | | | $ (4.0 | ) | | | $ 191.9 | | | |
Conversion of Series B convertible
preferred stock | | | (0.1 | ) | | | — | | | | 6.4 | | | | — | | | | — | | | | — | | | | — | | | | — | | | | — | | | |
Issuance of common stock for exercise of stock options | | | — | | | | — | | | | 1.5 | | | | — | | | | 7.3 | | | | — | | | | — | | | | — | | | | 7.3 | | | |
Issuance of common stock under employee stock purchase plan | | | — | | | | — | | | | 0.6 | | | | — | | | | 3.4 | | | | — | | | | — | | | | — | | | | 3.4 | | | |
Stock based compensation (Restated) | | | — | | | | — | | | | — | | | | — | | | | (0.9 | ) | | | 3.4 | | | | — | | | | — | | | | 2.5 | | | |
Adjustment of tax benefit from exercise of stock options | | | — | | | | — | | | | — | | | | — | | | | (0.7 | ) | | | — | | | | — | | | | — | | | | (0.7 | ) | | |
Components of comprehensive income: | | | | | | | | | | | | | | | | | | | | | | | | | | | | | | | | | | | | | | |
Net income (Restated) | | | — | | | | — | | | | — | | | | — | | | | — | | | | — | | | | 15.0 | | | | — | | | | 15.0 | | | |
Foreign currency translation gain, net of income taxes of $0.0 million | | | — | | | | — | | | | — | | | | — | | | | — | | | | — | | | | — | | | | 0.2 | | | | 0.2 | | | |
Total comprehensive income | | | | | | | | | | | | | | | | | | | | | | | | | | | | | | | | | | | 15.2 | | | |
Balance, December 31, 2004 (Restated) | | | — | | | | — | | | | 71.1 | | | | $ 0.1 | | | | $ 374.8 | | | | $ (3.2 | ) | | | $ (148.3 | ) | | | $ (3.8 | ) | | | $ 219.6 | | | |
Issuance of common stock for exercise of stock options | | | — | | | | — | | | | 0.6 | | | | (0.1 | ) | | | 2.7 | | | | — | | | | — | | | | — | | | | 2.6 | | | |
Issuance of common stock under employee stock purchase plan | | | — | | | | — | | | | 0.5 | | | | — | | | | 2.3 | | | | — | | | | — | | | | — | | | | 2.3 | | | |
Stock based compensation (Restated) | | | — | | | | — | | | | — | | | | — | | | | (0.5 | ) | | | 3.2 | | | | — | | | | — | | | | 2.7 | | | |
Components of comprehensive income: | | | | | | | | | | | | | | | | | | | | | | | | | | | | | | | | | | | | | | |
Net income (Restated) | | | — | | | | — | | | | — | | | | — | | | | — | | | | — | | | | 1.6 | | | | — | | | | 1.6 | | | |
WIRELESS FACILITIES, INC.
Consolidated Statements of Stockholders’ Equity (Continued)
Years ended December 31, 2004, 2005 and 2006
(in millions)
| | | | | | | | | Retained | | Accumulated | | | |
| Convertible | | | | Additional | | | | Earnings | | Other | | Total | |
| Preferred Stock | | Common Stock | | Paid-In | | Deferred | | (Accumulated | | Comprehensive | | Stockholders | |
| Shares | | Amount | | Shares | | Amount | | Capital | | Compensation | | Deficit) | | Loss | | Equity | |
| | | | | | | | | (Restated) | | (Restated) | | (Restated) | | | | | |
Foreign currency translation gain, net of income taxes of $0.2 million | | | — | | | | — | | | | — | | | | — | | | | — | | | | — | | | | — | | | | 0.9 | | | | 0.9 | | | |
Total comprehensive income | | | | | | | | | | | | | | | | | | | | | | | | | | | | | | | | | | | 2.5 | | | |
Balance, December 31, 2005 (Restated) | | | — | | | | — | | | | 72.2 | | | | $ 0.0 | | | | $ 379.3 | | | | $ — | | | | $ (146.7 | ) | | | $ (2.9 | ) | | | $ 229.7 | | | |
Conversion of Series B convertible preferred stock | | | — | | | | — | | | | 1.5 | | | | — | | | | — | | | | — | | | | — | | | | — | | | | — | | | |
Issuance of common stock for exercise of stock options | | | — | | | | — | | | | 0.2 | | | | — | | | | 0.5 | | | | — | | | | — | | | | — | | | | 0.5 | | | |
Issuance of common stock under employee stock purchase plan | | | — | | | | — | | | | — | | | | — | | | | — | | | | — | | | | — | | | | — | | | | | | | |
Stock based compensation | | | — | | | | — | | | | — | | | | — | | | | 11.9 | | | | — | | | | | | | | | | | | 11.9 | | | |
Components of comprehensive income: | | | | | | | | | | | | | | | | | | | | | | | | | | | | | | | | | | | | | | |
Net loss | | | — | | | | — | | | | — | | | | — | | | | — | | | | — | | | | (57.9 | ) | | | — | | | | (57.9 | ) | | |
Foreign currency translation gain, net of income taxes of $0.3 million | | | — | | | | — | | | | — | | | | — | | | | — | | | | — | | | | — | | | | 1.5 | | | | 1.5 | | | |
Reclassification adjustment—foreign currency translation gain/(loss), included in net income | | | — | | | | — | | | | — | | | | — | | | | — | | | | — | | | | — | | | | 1.4 | | | | 1.4 | | | |
Total comprehensive loss | | | | | | | | | | | | | | | | | | | | | | | | | | | | | | | | | | | (55.0 | ) | | |
Balance, December 31, 2006 | | | — | | | | — | | | | 73.9 | | | | $ 0.0 | | | | $ 391.7 | | | | $ 0.0 | | | | $ (204.6 | ) | | | $ 0.0 | | | | $ 187.1 | | | |
| | Convertible
Preferred Stock
| |
| |
| |
| |
| |
| |
| |
| |
|---|
| | Common Stock
| |
| |
| |
| |
| |
| |
|---|
| | Additional Paid-In Capital
| | Deferred Compensation
| | Retained Earnings (Accumulated Deficit)
| | Accumulated Other Comprehensive Loss
| | Total Stockholders' Equity
| |
|---|
| | Shares
| | Amount
| | Shares
| | Amount
| |
|---|
| Balance, December 31, 2004 | | — | | — | | 71.1 | | $ | 0.1 | | $ | 374.8 | | $ | (3.2 | ) | $ | (148.3 | ) | $ | (3.8 | ) | $ | 219.6 | |
| | Issuance of common stock for exercise of stock options | | — | | — | | 0.6 | | | (0.1 | ) | | 2.7 | | | — | | | — | | | — | | | 2.6 | |
| | Issuance of common stock under employee stock purchase plan | | — | | — | | 0.5 | | | — | | | 2.3 | | | — | | | — | | | — | | | 2.3 | |
| | Stock based compensation | | — | | — | | — | | | — | | | (0.5 | ) | | 3.2 | | | — | | | — | | | 2.7 | |
| | Components of comprehensive income: | | | | | | | | | | | | | | | | | | | | | | | | | |
| | | Net income | | — | | — | | — | | | — | | | — | | | — | | | 1.6 | | | — | | | 1.6 | |
| | | Foreign currency translation gain, net of income taxes of $0.2 million | | — | | — | | — | | | — | | | — | | | — | | | — | | | 0.9 | | | 0.9 | |
| | | | | | | | | | | | | | | | | | | | | | | |
| |
| | | | Total comprehensive income | | | | | | | | | | | | | | | | | | | | | | | | 2.5 | |
| | |
| |
| |
| |
| |
| |
| |
| |
| |
| |
| Balance, December 31, 2005 | | — | | — | | 72.2 | | $ | 0.0 | | $ | 379.3 | | $ | — | | $ | (146.7 | ) | $ | (2.9 | ) | $ | 229.7 | |
| | |
| |
| |
| |
| |
| |
| |
| |
| |
| |
| | Conversion of Series B convertible preferred stock | | — | | — | | 1.5 | | | — | | | — | | | — | | | — | | | — | | | — | |
| | Issuance of common stock for exercise of stock options | | — | | — | | 0.2 | | | — | | | 0.5 | | | — | | | — | | | — | | | 0.5 | |
| | Stock based compensation | | — | | — | | — | | | — | | | 11.9 | | | — | | | — | | | — | | | 11.9 | |
| | Components of comprehensive income: | | | | | | | | | | | | | | | | | | | | | | | | | |
| | | Net loss | | — | | — | | — | | | — | | | — | | | — | | | (57.9 | ) | | — | | | (57.9 | ) |
| | | Foreign currency translation gain, net of income taxes of $0.3 million | | — | | — | | — | | | — | | | — | | | — | | | — | | | 1.5 | | | 1.5 | |
| | | Reclassification adjustment—foreign currency translation gain, included in net loss | | — | | — | | — | | | — | | | — | | | — | | | — | | | 1.4 | | | 1.4 | |
| | | | | | | | | | | | | | | | | | | | | | | |
| |
| | | | Total comprehensive loss | | | | | | | | | | | | | | | | | | | | | | | | (55.0 | ) |
| | |
| |
| |
| |
| |
| |
| |
| |
| |
| |
| Balance, December 31, 2006 | | — | | — | | 73.9 | | $ | — | | $ | 391.7 | | $ | — | | $ | (204.6 | ) | $ | — | | $ | 187.1 | |
| | |
| |
| |
| |
| |
| |
| |
| |
| |
| |
| | Issuance of common stock for exercise of stock options | | — | | — | | 0.1 | | | — | | | — | | | — | | | — | | | — | | | — | |
| | Common stock issued for acquisitions | | — | | — | | 4.6 | | | — | | | 12.0 | | | — | | | — | | | — | | | 12.0 | |
| | Paid in capital for contingent consideration | | — | | — | | — | | | — | | | 7.4 | | | — | | | — | | | — | | | 7.4 | |
| | Cumulative effect adjustment upon adoption of FIN No. 48 | | — | | — | | — | | | — | | | — | | | — | | | (0.1 | ) | | — | | | (0.1 | ) |
| | Stock based compensation | | — | | — | | 0.4 | | | — | | | 1.6 | | | — | | | — | | | — | | | 1.6 | |
| | Net loss and total comprehensive loss | | — | | — | | — | | | — | | | — | | | — | | | (40.8 | ) | | — | | | (40.8 | ) |
| | |
| |
| |
| |
| |
| |
| |
| |
| |
| |
| Balance, December 31, 2007 | | — | | — | | 79.0 | | $ | — | | $ | 412.7 | | $ | — | | $ | (245.5 | ) | $ | — | | $ | 167.2 | |
| | |
| |
| |
| |
| |
| |
| |
| |
| |
| |
See accompanying notes to consolidated financial statements.
128
KRATOS DEFENSE & SECURITY SOLUTIONS, INC.
WIRELESS FACILITIES, INC.
Consolidated Statements of Cash Flows
Years ended December 31, 2004, 2005, 2006 and 20062007
(in millions)
| | 2004 | | 2005 | | 2006 | |
| | (Restated) | | (Restated) | | | |
Operating activities: | | | | | | | | | | | |
Net income (loss) | | | $ | 15.0 | | | | $ | 1.6 | | | $ | (57.9 | ) |
Less: income (loss) from discontinued operations | | | 11.6 | | | | (9.7 | ) | | (11.2 | ) |
Income (loss) from continuing operations | | | 3.4 | | | | 11.3 | | | (46.7 | ) |
Adjustments to reconcile net income (loss) from continuing operations to net cash provided by continuing operations: | | | | | | | | | | | |
Depreciation and amortization | | | 6.5 | | | | 6.7 | | | 7.0 | |
Deferred income taxes | | | (1.5 | ) | | | 5.6 | | | 13.7 | |
Asset impairment charges and net loss on disposition of fixed assets | | | — | | | | 0.1 | | | 20.3 | |
Equity loss in unconsolidated affiliates | | | 3.1 | | | | — | | | — | |
Tax benefit (expense) from stock options | | | (0.7 | ) | | | — | | | 0.1 | |
Provision (credit) for doubtful accounts | | | (0.7 | ) | | | 0.5 | | | — | |
Stock based compensation | | | 2.4 | | | | 2.8 | | | 11.6 | |
Changes in assets and liabilities, net of acquisitions: | | | | | | | | | | | |
Accounts receivable | | | (15.8 | ) | | | (9.5 | ) | | (3.5 | ) |
Prepaid expenses | | | (0.7 | ) | | | 0.9 | | | 0.2 | |
Other assets | | | 0.4 | | | | (2.1 | ) | | (2.8 | ) |
Accounts payable | | | 13.6 | | | | (3.6 | ) | | 2.1 | |
Accrued expenses | | | (18.7 | ) | | | 8.3 | | | (6.6 | ) |
Accrued compensation | | | (0.1 | ) | | | 0.7 | | | 2.7 | |
Tax contingencies | | | (1.4 | ) | | | (0.1 | ) | | (0.1 | ) |
Accrual for contingent acquisition consideration | | | 14.4 | | | | (2.1 | ) | | 0.1 | |
Billings in excess of costs on completed contracts | | | (0.8 | ) | | | (3.4 | ) | | 3.1 | |
Accrual for unused office space | | | (1.0 | ) | | | (0.9 | ) | | 0.9 | |
Income tax payable | | | 0.9 | | | | (1.1 | ) | | 0.1 | |
Other liabilities | | | (0.2 | ) | | | 0.1 | | | (0.1 | ) |
Net cash provided by continuing operations | | | 3.1 | | | | 14.2 | | | 2.1 | |
Investing activities: | | | | | | | | | | | |
Sale/maturity of short-term investments | | | 27.5 | | | | 7.6 | | | — | |
Cash paid for contingent acquisition consideration | | | (8.3 | ) | | | (17.1 | ) | | (8.5 | ) |
Cash paid for acquisitions, net of cash acquired | | | (53.9 | ) | | | (33.6 | ) | | (59.1 | ) |
Proceeds from the disposition of discontinued operations | | | — | | | | — | | | 18.9 | |
Cash transferred to restricted cash | | | — | | | | — | | | (1.0 | ) |
Investment in unconsolidated subsidiary | | | (1.0 | ) | | | — | | | — | |
Capital expenditures | | | (5.0 | ) | | | (6.9 | ) | | (7.1 | ) |
Net cash used in investing activities from continuing operations | | | (40.7 | ) | | | (50.0 | ) | | (56.8 | ) |
| | | | | | | | | | | | | | |
| | 2005
| | 2006
| | 2007
| |
|---|
| Operating activities: | | | | | | | | | | |
| | Net income (loss) | | $ | 1.6 | | $ | (57.9 | ) | $ | (40.8 | ) |
| | Less: Loss from discontinued operations | | | (2.0 | ) | | (11.7 | ) | | (12.6 | ) |
| | Income (loss) from continuing operations | | | 3.6 | | | (46.2 | ) | | (28.2 | ) |
| | Adjustments to reconcile income (loss) from continuing operations to net cash used in operating activities from continuing operations: | | | | | | | | | | |
| | | Depreciation and amortization | | | 4.3 | | | 4.7 | | | 4.3 | |
| | | Deferred income taxes | | | 5.2 | | | 13.6 | | | 0.7 | |
| | | Accrual for settlement of securities litigation | | | — | | | — | | | 4.9 | |
| | | Asset impairment charges | | | — | | | 20.1 | | | 2.5 | |
| | | Disposal of property and equipment | | | 0.1 | | | 0.1 | | | — | |
| | | Provision for doubtful accounts | | | 0.2 | | | 0.2 | | | 0.5 | |
| | | Stock based compensation | | | 0.9 | | | 6.9 | | | 0.9 | |
| | | Changes in assets and liabilities, net of acquisitions: | | | | | | | | | | |
| | | | Accounts receivable | | | (4.4 | ) | | (8.4 | ) | | 5.3 | |
| | | | Prepaid expenses | | | 1.9 | | | 0.3 | | | (0.1 | ) |
| | | | Other assets | | | (1.6 | ) | | (1.3 | ) | | (4.8 | ) |
| | | | Accounts payable | | | (2.5 | ) | | 5.0 | | | (0.8 | ) |
| | | | Accrued expenses | | | 1.2 | | | (6.3 | ) | | 1.8 | |
| | | | Accrued compensation | | | 5.1 | | | 1.3 | | | (1.5 | ) |
| | | | Accrual for contingent acquisition consideration | | | (2.0 | ) | | 0.1 | | | 1.4 | |
| | | | Accrual for unused office space | | | (0.9 | ) | | 0.9 | | | (0.1 | ) |
| | | | Billings in excess of costs and earnings on uncompleted contracts | | | (3.5 | ) | | 1.2 | | | 0.4 | |
| | | | Income tax receivable or payable | | | (4.5 | ) | | 3.0 | | | 1.6 | |
| | | | Other liabilities | | | — | | | (0.1 | ) | | 10.1 | |
| | |
| |
| |
| |
| | | | | Net cash provided by (used in) operating activities from continuing operations | | | 3.1 | | | (4.9 | ) | | (1.1 | ) |
| | |
| |
| |
| |
| Investing activities: | | | | | | | | | | |
| | Sale/maturity of short-term investments | | | 7.6 | | | — | | | — | |
| | Cash paid for contingent acquisition consideration | | | (17.1 | ) | | (8.5 | ) | | (8.9 | ) |
| | Cash paid for acquisitions, net of cash acquired | | | (33.6 | ) | | (59.1 | ) | | (63.9 | ) |
| | Proceeds from the disposition of discontinued operations | | | — | | | 18.9 | | | 57.3 | |
| | Cash transferred (to) from restricted cash | | | — | | | (1.0 | ) | | 1.0 | |
| | Capital expenditures | | | (4.0 | ) | | (1.2 | ) | | (0.9 | ) |
| | |
| |
| |
| |
| | | | | Net cash used in investing activities from continuing operations | | | (47.1 | ) | | (50.9 | ) | | (15.4 | ) |
| | |
| |
| |
| |
WIRELESS FACILITIES,KRATOS DEFENSE & SECURITY SOLUTIONS, INC.
Consolidated Statements of Cash Flows (Continued)
Years ended December 31, 2004, 2005, 2006 and 2006
2007
(in millions)
Financing activities: | | | | | | | | | | | |
Proceeds from issuance of common stock | | | 7.3 | | | | 2.6 | | | 0.5 | |
Proceeds from issuance of common stock under employee stock purchase plan | | | 3.4 | | | | 2.3 | | | — | |
Borrowings under line of credit | | | — | | | | — | | | 85.0 | |
Repayment under line of credit | | | — | | | | — | | | (34.0 | ) |
Repayment of capital lease obligations | | | (0.5 | ) | | | (0.4 | ) | | (0.3 | ) |
Net cash provided by financing activities from continuing operations | | | 10.2 | | | | 4.5 | | | 51.2 | |
Net cash flows of continuing operations | | | (27.4 | ) | | | (31.3 | ) | | (3.5 | ) |
Cash flows of discontinued operations (Revised—see Note 1(s)) | | | | | | | | | | | |
Operating cash flows | | | 5.0 | | | | (10.2 | ) | | (0.8 | ) |
Investing cash flows | | | (2.9 | ) | | | (2.2 | ) | | (0.7 | ) |
Effect of exchange rates on cash and cash equivalents | | | (0.1 | ) | | | 1.0 | | | 2.7 | |
Net cash flows of discontinued operations | | | 2.0 | | | | (11.4 | ) | | 1.2 | |
Net decrease in cash and cash equivalents | | | (25.4 | ) | | | (42.7 | ) | | (2.3 | ) |
Cash and cash equivalents at beginning of year | | | 75.8 | | | | 50.4 | | | 7.7 | |
Cash and cash equivalents at end of year | | | $ | 50.4 | | | | $ | 7.7 | | | $ | 5.4 | |
Supplemental disclosure of cash flow information: | | | | | | | | | | | |
Cash (paid) received during the year for interest | | | $ | 0.2 | | | | $ | 0.2 | | | $ | (0.2 | ) |
Net cash paid during the year for income taxes | | | $ | (0.9 | ) | | | $ | (1.1 | ) | | $ | (0.7 | ) |
Supplemental disclosures of non-cash investing and financing transactions: | | | | | | | | | | | |
Fair value of assets acquired in acquisitions | | | $ | 62.1 | | | | $ | 40.0 | | | $ | 80.1 | |
Fixed assets financed | | | — | | | | $ | 0.6 | | | — | |
Liabilities assumed in acquisitions | | | $ | 7.1 | | | | $ | 6.4 | | | $ | 6.3 | |
| Financing activities: | | | | | | | | | | |
| | Proceeds from issuance of common stock | | | 0.1 | | | 0.4 | | | — | |
| | Proceeds from issuance of common stock under employee stock purchase plan | | | 0.8 | | | — | | | — | |
| | Borrowings under credit facility and line of credit | | | — | | | 85.0 | | | 88.5 | |
| | Repayment under line of credit | | | — | | | (34.0 | ) | | (64.0 | ) |
| | Repayment of capital lease obligations | | | (0.4 | ) | | (0.3 | ) | | (0.4 | ) |
| | Debt issuance costs | | | (0.3 | ) | | (1.2 | ) | | (3.0 | ) |
| | |
| |
| |
| |
| | | | | Net cash provided by financing activities from continuing operations | | | 0.2 | | | 49.9 | | | 21.1 | |
| | |
| |
| |
| |
| Net cash flows of continuing operations | | | (43.8 | ) | | (5.9 | ) | | 4.6 | |
| | |
| |
| |
| |
| Cash flows of discontinued operations | | | | | | | | | | |
| | Operating cash flows | | | 1.2 | | | 7.4 | | | 0.2 | |
| | Investing cash flows | | | (5.1 | ) | | (6.6 | ) | | (1.6 | ) |
| | Financing cash flows | | | 4.0 | | | 0.1 | | | — | |
| | Effect of exchange rates on cash and cash equivalents | | | 1.0 | | | 2.7 | | | — | |
| | |
| |
| |
| |
| �� | | | | Net cash flows of discontinued operations | | | 1.1 | | | 3.6 | | | (1.4 | ) |
| | |
| |
| |
| |
| Net increase (decrease) in cash and cash equivalents | | | (42.7 | ) | | (2.3 | ) | | 3.2 | |
| Cash and cash equivalents at beginning of year | | | 50.4 | | | 7.7 | | | 5.4 | |
| | |
| |
| |
| |
| Cash and cash equivalents at end of year | | $ | 7.7 | | $ | 5.4 | | $ | 8.6 | |
| | |
| |
| |
| |
| Supplemental disclosure of cash flow information: | | | | | | | | | | |
| | Cash paid during the year for interest | | $ | 0.2 | | $ | (0.2 | ) | $ | 2.8 | |
| | Net cash received during the year for income taxes | | $ | (1.1 | ) | $ | (0.7 | ) | $ | (1.4 | ) |
| Noncash investing and financing activities: | | | | | | | | | | |
| | Common stock issued for acquisitions | | $ | — | | $ | — | | $ | 12.0 | |
| | Paid in capital for contingent consideration | | | — | | | — | | | 7.4 | |
| | Liability for contingent cash consideration | | $ | — | | $ | — | | $ | 1.2 | |
| Supplemental disclosures of non-cash investing and financing transactions: | | | | | | | | | | |
| | Fair value of assets acquired in acquisitions | | $ | 40.0 | | $ | 80.1 | | $ | 111.1 | |
| | Fixed assets financed | | $ | 0.6 | | $ | — | | $ | 1.2 | |
| | Liabilities assumed in acquisitions | | $ | 6.4 | | $ | 6.3 | | $ | 20.9 | |
See accompanying notes to consolidated financial statements.
130
KRATOS DEFENSE & SECURITY SOLUTIONS, INC.
WIRELESS FACILITIES, INC.
Notes to Consolidated Financial Statements
Years ended December 31, 2004, 2005, 2006 and 20062007
Note 1. Organization and Summary of Significant Accounting Policies
(a) Description of Business
Wireless Facilities, Kratos Defense & Security Solutions, Inc. (“WFI”("Kratos" or "the Company") was initially incorporated in the state of New York on December 19, 1994, commenced operations in March 1995 and was reincorporated in Delaware in 1998. WFIKratos historically conducted business in three segments: Wireless Network Services, Government Network Services and Enterprise Network Services. WFIThe Company was an independent, global provider of outsourced communications and security systems engineering and integration services for the wireless communications industry through its Wireless Network Services division (“WNS”("WNS"), the U.S. government through its Government Network Services division (“GNS”("GNS"), WFInow referred to as the Kratos Government Services, Inc.,Solutions ("KGS") segment, and enterprise customers through its Enterprise Network Services division (“ENS”("ENS")., now referred to as the Public Safety & Security ("PSS") segment.
In 2006, WFI was an independent provider of outsourced engineering and network deployment services, security systems engineering and integration services and other technical services for the wireless communications industry, the U.S. government, and enterprise customers.
In 2006 and 2007, the Company undertook a transformation strategy that culminated in the divestiture in 2007 of its wireless-related businesses and chose tohas aggressively pursuepursued business with the federal government, primarily the U.S. Department of Defense, through strategic acquisition. See Note 19, Subsequent Events.5, Acquisitions. The Company's divestiture of its European wireless engineering services business which was discontinued and held for sale in December 2006 was completed in March 2007. In addition, the Company's divestiture of its domestic wireless engineering services business was completed in June 2007 and the divestiture of its wireless deployment services business was completed in July 2007. Accordingly, the accompanying financial statements reflect the divestiture of the domestic wireless engineering services and wireless network deployment business and the results of operations through the date of divestiture are reflected as discontinued operations in the accompanying statements of operations.
As a result of the divestment of the Company's wireless related assets and businesses in 2007, the Company changed its name from Wireless Facilities, Inc to Kratos Defense & Security Solutions, Inc. on September 12, 2007. The name was changed to reflect the Company's revised focus as a defense contractor and security systems integrator for the federal government and for state and local agencies and reflects the Company's business going forward. All previous financial statements prior to September 12, 2007 were issued under the Company's previous name, Wireless Facilities, Inc.
(b) Principles of Consolidation
The consolidated financial statements include the accounts of WFIKratos and its wholly-owned and majority-owned subsidiaries. WFIsubsidiaries for which all inter-company transactions have been eliminated in consolidation. Kratos and its subsidiaries are collectively referred to herein as the “Company.”"Company."
In 2003, the Company acquired three privately-held companies as part of its Enterprise Network Solutions segment (now Enterprise Network Services) that provides voice, data, security, system design, deployment, integration and monitoring for enterprise networks. In 2004, the Company acquired two privately-held companies as part of its Government Network Services segment that provides systems engineering, systems integration and the outsourcing of technical services such as operational test and evaluation and program management. In 2005, the Company acquired one privately-held company as part of its Government Network Services segment that provides services including network engineering, network infrastructure support, information assurance, application development, and managed services, including network maintenance and monitoring, to government agencies. On October 2, 2006 the Company completed the acquisition of Madison Research Corporation, which is also in the Government Network Services segment. See Note 6 for additional details regarding these acquisitions.
All inter-company transactions have been eliminated in consolidation. Investments in unconsolidated affiliates are accounted for using the cost method and equity method. The cost method is used for companies in whichas the Company owns less than 20% and for which the Company has no significant influence.influence over the affiliates.
(c) Fiscal Calendar Year
On November 7, 2006, the Board of Directors (the “Board”) of the Company approved a change in the fiscal The Company's calendar year end from the last Friday in December to December 31. Concurrently, the Board approved a
change in the interim fiscal periods to provide thatis on the last day of the year, December 31st. The interim fiscal quarter shall beperiods are on the last day of the calendar month of each quarter. As
KRATOS DEFENSE & SECURITY SOLUTIONS, INC.
Notes to Consolidated Financial Statements (Continued)
Years ended December 31, 2005, 2006 and 2007
Note 1. Organization and Summary of Significant Accounting Policies (Continued)
(d) Use of Estimates
The preparation of financial statements in conformity with accounting principles generally accepted in the United States of America (US GAAP) requires management to make estimates and assumptions that affect the reported amounts of assets and liabilities, the disclosure of contingent assets and liabilities at the date of the financial statements and the reported amounts of revenues and expenses during the reporting period. Such estimates include revenue recognition, allowance for doubtful accounts, valuation of long-lived assets including identifiable intangibles and goodwill, accounting for income taxes including the related valuation allowance on the deferred tax asset, accruals for partial self-insurance, contingencies and litigation and contingent acquisition consideration. In the future, the Company may realize actual results that differ from the current reported estimates and if the estimates that we have used change in the future, such changes could have a material impact on the Company's consolidated financial position, results of operations and cash flows.
(e) Reclassifications
The accompanying consolidated statements of cash flows separately reflect the operating, investing and financing portions of the cash flows attributable to the Company's discontinued operations for each of the periods presented. These amounts were reported on a combined basis as a single amount in prior consolidated statements of cash flows. In addition, the consolidated balance sheets and statements of operations have been reclassified to present the discontinued operations.
(f) Revenue Recognition
The Company provides services to customers under three primary types of contracts: fixed-price; time and materials; and cost reimbursable plus fixed fee. The Company realizes a portion of its revenue from long-term contracts and accounts for these contracts under the provisions of Statement of Position (SOP) 81-1, "Accounting for Performance of Construction-Type and Certain Production-Type Contracts." Revenue on fixed-price contracts is recognized using the percentage-of-completion method of accounting based on the ratio of total costs incurred to date compared to estimated total costs to complete the contract. Estimates of costs to complete include materials, direct labor, overhead, and allowable general and administrative expenses (for government contracts). While the Company generally does not incur a material amount of set-up fees for its projects, such costs, if any, are excluded from the estimated total costs to complete the contract. Cost estimates are reviewed monthly on an individual contract basis, and are revised periodically throughout the life of the contract such that adjustments to profit resulting from revisions are made cumulative to the date of the revision. The full amount of an estimated loss associated with a contract is accrued and charged to operations in the period it is determined that it is probable a loss will be realized from the performance of the contract.
Significant management judgments and estimates, including the estimated costs to complete projects, which determine the project's percentage of completion and profit margin must be made and used in connection with the revenue recognized in any accounting period. In the future, the Company may realize actual results that differ from current estimates and the differences could be material.
Accordingly, the revenue the Company recognizes in a given financial reporting period depends on (1) the costs the Company has incurred for individual projects, (2) the Company's then current estimate of the total remaining costs to complete the individual projects and (3) current estimated
KRATOS DEFENSE & SECURITY SOLUTIONS, INC.
Notes to Consolidated Financial Statements (Continued)
Years ended December 31, 2005, 2006 and 2007
Note 1. Organization and Summary of Significant Accounting Policies (Continued)
contract value associated with the projects. If, in any period, we significantly increase or decrease our estimate of the total costs to complete a project, and/or reduce or increase the associated contract value, revenue for that period would be impacted. To the extent that the Company's estimates fluctuate over time or differ from actual results, gross margins in subsequent periods may vary significantly from previous estimates. Material differences may result in the endamount and timing of fiscalthe Company's revenue for any period if management made different judgments or utilized different estimates. In the event the Company is unable to provide reliable cost estimates on a given project, the Company records revenue using the completed contract method. There are no contracts for which the Company utilized the completed contract method for the years ended December 31, 2005, 2006 which would have endedand 2007.
Under the terms of substantially all of the Company's fixed price contracts, if a contract is terminated without proper cause by the customer, if the customer creates unplanned/unreasonable time delays, or if the customer modifies the contract tasks/scope, the Company has contractual rights to reimbursement in accordance with the terms and conditions regarding payment for work performed, but not yet billed (i.e., unbilled trade accounts receivable) at a gross profit margin that is consistent with the overall project margin. Furthermore, certain additional provisions compensate the Company for additional or excess costs incurred, whereby any scope reductions or other modifications are subject to reimbursement of costs incurred to date with a reasonable profit margin based on the contract value and completed work at that time. The inherent aforementioned risks are reflected in the Company's ongoing periodic assessment of the "total contract value" and the associated revenue recognized. Total net unbilled accounts receivable at December 29,31, 2006 endedand December 31, 2007 were $23.4 million and $34.2 million, respectively. Approximately, $0.5 million and $0.6 million of the unbilled receivables as of December 31, 2006. Prior2006 and December 31, 2007, respectively, are expected to this changebe collected after one year as they are related to future milestone payments and retainages. Retainages receivable which are included in fiscal year,net unbilled accounts receivable are $1.2 million and $1.5 million as of December 31, 2006 and December 31, 2007, respectively. The Company periodically performs work under authorizations to proceed or work orders from its customers for which a formal purchase order may not be received until after the work has commenced. As of December 31, 2006 and 2007, approximately $0.6 million and $0.4 million, respectively, of the Company's unbilled accounts receivable balance were under an authorization to proceed or work order from its customers where a formal purchase order had not yet been received.
Revenue from certain time and materials and fixed-price contracts are recognized when realized or realizable and earned, in accordance with Staff Accounting Bulletin (SAB) 101, as revised by SAB 104 (recognized when services are rendered at contracted labor rates, when materials are delivered and when other direct costs are incurred). Additionally, based on management's periodic assessment of the collectibility of its accounts receivable, credit worthiness and financial condition of customers, the Company operated and reported using a 52-53 week fiscal year ending the last Friday in December. As a result, a fifty-third week was added every five or six years. Under the prior reporting system, each 52 week fiscal year consisted of four equal quarters of 13 weeks each, and each 53 week fiscal year consists of three 13 week quarters and one 14 week quarter. The change in fiscal year will not be applied to periodsdetermines if collection is reasonably assured prior to the quarterrecognition of revenue.
Cost reimbursable contracts for the government provide for reimbursement of costs plus the payment of a fee. The Company records the fee as costs are incurred. Under time and materials contracts, the Company is reimbursed for labor hours at negotiated hourly billing rates and is reimbursed for travel and other direct expenses at actual costs plus applied general and administrative expenses. Under certain of the Company's contractual arrangements, the Company may also recognize revenue for out-of-pocket expenses in accordance with EITF 01-14 "Income Statement Characterization
KRATOS DEFENSE & SECURITY SOLUTIONS, INC.
Notes to Consolidated Financial Statements (Continued)
Years ended September 30,December 31, 2005, 2006 and consistent with prior reports, all prior fiscal periods presented or discussed in this report have been presented as ending2007
Note 1. Organization and Summary of Significant Accounting Policies (Continued)
of Reimbursements Received for Out-of-Pocket Expenses Incurred." Depending on the last daycontractual arrangement, these expenses may be reimbursed with or without a fee.
Under certain of its contracts, the Company provides supplier procurement services and materials for its customers. The Company records revenue on these arrangements on a gross or net basis in accordance with EITF 99-19, "Reporting Revenue Gross as a Principal versus Net as an Agent," depending on the specific circumstances of the nearest calendar month.arrangement. The transitionCompany considers the following criteria, among others, for recording revenue on a gross or net basis:
(1) Whether the Company acts as a principal in the transaction;
(2) Whether the Company takes title to the products;
(3) Whether the Company assumes risks and rewards of ownership, such as risk of loss for collection, delivery or returns;
(4) Whether the Company serves as an agent or broker, with compensation on a commission or fee basis; and
(5) Whether the Company assumes the credit risk for the amount billed to the customer subsequent to delivery.
(g) Derivative Instruments
In managing interest rate risk exposure, the Company enters into interest rate swap agreements. An interest rate swap is a contractual exchange of interest payments between two parties. A standard interest rate swap involves the payment of a fixed rate time a notational amount by one party in exchange for a floating rate times the same notational amount from another party. As interest rates change, the difference to be paid or received is accrued and recognized as interest expense or income over the life of the agreement. These instruments are not entered into for trading purposes. Counterparties to the Company's interest rate swap agreements are major financial institutions. In accordance with SFAS 133, Accounting for Derivative Instruments and Certain Hedging Activities, as amended by SFAS 137 and 138, the Company recognizes interest rate swap agreements on the consolidated balance sheet at fair value. The interest rate swap agreements are marked to market with changes in fair value recognized in either other comprehensive income (loss) or in the carrying value of the hedged portions of fixed rate debt, as applicable (Hedge accounting).
Hedge accounting is discontinued when it is determined that a derivative instrument is not highly effective as a hedge. Hedge accounting is also discontinued when: (1) the derivative instrument expires; is sold, terminated or exercised; or is no longer designated as a hedge instrument because it is unlikely that a forecasted transaction will occur; (2) a hedged firm commitment no longer meets the definition of a firm commitment; or (3) management determines that designation of the derivative as a hedging instrument is no longer appropriate.
When hedge accounting is discontinued, the derivative instrument will be either terminated, continue to be carried on the balance sheet at fair value, or redesignated as the hedging instrument in either a cash flow or fair value hedge, if the relationship meets all applicable hedging criteria. Any asset or liability that was previously recorded as a result of recognizing the value of a firm commitment will be removed from the balance sheet and recognized as a gain or loss in current period earnings.
KRATOS DEFENSE & SECURITY SOLUTIONS, INC.
Notes to Consolidated Financial Statements (Continued)
Years ended December 31, 2005, 2006 and 2007
Note 1. Organization and Summary of Significant Accounting Policies (Continued)
Any gains or losses that were accumulated in other comprehensive income from December 30hedging a forecasted transaction will be recognized immediately in current period earnings, if it is probable that the forecasted transaction will not occur.
(h) Allowance for Doubtful Accounts
The Company maintains an allowance for doubtful accounts for estimated losses resulting from the inability of its customers to make required payments, which results in bad debt expense. Management periodically determines the adequacy of this allowance by evaluating the comprehensive risk profiles of all individual customer receivable balances including, but not limited to, the customer's financial condition, credit agency reports, financial statements and overall current economic conditions. Additionally, on certain contracts whereby the Company performs services for a prime/general contractor, a specified percentage of the invoiced trade accounts receivable may be retained by the customer until the project is completed. The Company periodically reviews all retainages for collectibility and records allowances for doubtful accounts when deemed appropriate, based on its assessment of the associated credit risks. Total retainages included in billed accounts receivable were $0.2 million and $0.2 million at December 31, 2006 didand 2007, respectively. Changes to estimates of contract value are recorded as adjustments to revenue and not result inas a material impact tocomponent of the allowance of doubtful accounts. Allowances for doubtful accounts on receivable as of December 31, 2006 financial statements.and December 31, 2007 were $0.3 million and $0.5 million, respectively.
The following table outlines the balance of the Company's Allowance for Doubtful Account for 2005, 2006 and 2007. It identifies the additional provisions each year as well as the write-offs that utilized the allowance (in millions).
Allowance for Doubtful Accounts
| | Balance at Beginning of Year
| | Provisions
| | Write-offs/ Recoveries
| | Balance at End of Year
|
|---|
| Year ended December 31, 2005 | | $ | 0.6 | | $ | 0.2 | | $ | (0.3 | ) | $ | 0.5 |
| Year ended December 31, 2006 | | $ | 0.5 | | $ | 0.2 | | $ | (0.4 | ) | $ | 0.3 |
| Year ended December 31, 2007 | | $ | 0.3 | | $ | 0.5 | | $ | (0.3 | ) | $ | 0.5 |
(d)(j) Cash Equivalents and Short-Term Investments
The Company’sCompany's cash equivalents consist of its highly liquid investments with an original maturity of three months or less when purchased by the Company. The Company has evaluated its investments in accordance with the provisions of Statement of Financial Accounting Standards (SFAS) No. 115, “Accounting"Accounting for Certain Investments in Debt and Equity Securities.”" Based on such evaluation, the Company’sCompany's management has determined that all of its investment securities are properly classified as available-for-sale. Based on the Company’sCompany's intent and board-approved investment policy and its ability to liquidate debt securities maturing after one year, the Company classifies such short-term investment securities within current assets. Available-for-sale securities are carried at fair value, with unrealized gains and losses reported as a separate component of Stockholders’Stockholders' Equity within the caption “Accumulated"Accumulated Other Comprehensive Income (Loss).”" The amortized cost basis of debt securities is periodically adjusted for amortization of premiums and accretion of discounts to maturity. Such amortization is included as a component of interest income (expense), net. The amortized cost basis of securities sold is based on the specific identification method and all such realized gains and losses are
KRATOS DEFENSE & SECURITY SOLUTIONS, INC.
Notes to Consolidated Financial Statements (Continued)
Years ended December 31, 2005, 2006 and 2007
Note 1. Organization and Summary of Significant Accounting Policies (Continued)
recorded as a component within other income (expense). Interest and dividends on securities classified as available-for-sale are included in interest income.
As a result of the Company’sCompany's acquisition of Madison Research Corporation on December 31, 2006, wethe Company had approximately $1.0 million in restricted cash related to collateral required for two foreign letters of credit issued outside of ourthe Company's credit facility. On June 5, 2007 the cash collateral became unrestricted upon cancellation of the two letters of credit.
(e)(i) Inventory
Inventories which are comprised primarily of supplies including parts and materials are stated at the lower of cost or market and are comprised typically of supplies, including parts and materials.market. The Company regularly reviews inventory quantities on hand, future purchase commitments with its suppliers, and the estimated utility of its inventory. If the Company review indicates a reduction in utility below carrying value, it reduces its inventory to a new cost basis. As of December 31, 2006 and December 31, 2005,2007, the Company had $2.3$2.7 million and $1.3$2.1 million, respectively, of inventories which were reflected in Other Current Assetsother current assets of continuing operations on the Consolidated Balance Sheet, net of reserves of $0.2 million and $0.1 million, respectively.consolidated balance sheets.
(f)(k) Property and Equipment, Net
Property and equipment consists primarily of computer field testingequipment, software, leasehold improvements and office-related equipment and is recorded at cost. Equipment acquired under capital leases is recorded at the present value of the future minimum lease payments. Depreciation is calculated using the straight-line method over the estimated useful life of each asset, which is one to three years for computer equipment, five years for furniture and office equipment, and five to ten years for software for the Company’sCompany's enterprise systems. Equipment
and facilities acquired under capital leases is amortized over the shorter of the lease term or the estimated useful life of the asset. Improvements, which significantly improve and extend the useful life of an asset, are capitalized over the shorter of the lease period or the estimated useful life. Expenditures for maintenance and repairs are charged to operations as incurred.
In accordance with Statement of Position 98-1, “Accounting"Accounting for the Costs of Computer Software Developed or Obtained for Internal Use” (“Use" ("SOP 98-1”98-1"), the Company expenses all internal-use software costs incurred in the preliminary project stage and capitalizes certain direct costs associated with the development and purchase of internal-use software within property and equipment. Capitalized costs are amortized on a straight-line basis over the estimated useful lives of the software.
(g)(l) Goodwill and Other Intangible Assets, Net
In accordance with SFAS No. 142, “Goodwill"Goodwill and Other Intangible Assets,”" we classify intangible assets into three categories: (1) intangible assets with definite lives subject to amortization, (2) intangible assets with indefinite lives not subject to amortization, and (3) goodwill. We test intangible assets with definite lives for impairment if conditions exist that indicate the carrying value may not be recoverable. Such conditions may include an economic downturn in a geographic market or a change in the assessment of future operations. We record an impairment charge when the carrying value of the definite lived intangible asset is not recoverable by the cash flows generated from the use of the asset.
KRATOS DEFENSE & SECURITY SOLUTIONS, INC.
Notes to Consolidated Financial Statements (Continued)
Years ended December 31, 2005, 2006 and 2007
Note 1. Organization and Summary of Significant Accounting Policies (Continued)
Intangible assets with indefinite lives and goodwill are not amortized. We test these intangible assets and goodwill for impairment at least annually, typically in the fourth quarter, or more frequently if events or circumstances indicate that such intangible assets or goodwill might be impaired. All goodwill is assigned to our operating segments. We perform our impairment tests of goodwill at our reporting unit level. Such impairment tests for goodwill include comparing the fair value of the respective reporting unit with its carrying value, including goodwill. We use a variety of methodologies in conducting these impairment tests, including discounted cash flow analyses. When appropriate, we consider the assumptions that we believe hypothetical marketplace participants would use in estimating future cash flows. In addition, where applicable, an appropriate discount rate is used, based on the Company’sCompany's cost of capital rate. When the fair value is less than the carrying value of the intangible assets or the operating segment, we record an impairment charge to reduce the carrying value of the assets to fair value. These impairment charges are generally recorded in other operating charges.
The Company determines the useful lives of identifiable intangible assets after considering the specific facts and circumstances related to each intangible asset. Factors considered when determining useful lives include the contractual term of any agreement, the history of the asset, the Company’sCompany's long-term strategy for the use of the asset, any laws or other local regulations which could impact the useful life of the asset, and other economic factors, including competition and specific market conditions. Intangible assets that are deemed to have definite lives are amortized, generally on a straight-line basis, over their useful lives, ranging from 1 to 10 years. The estimated remaining useful lives also range from 1 to 10 years. Refer to Note 3.
(h) Revenue Recognition
The Company provides services to customers under three primary types of contracts: fixed-price; time and materials; and cost reimbursement. The Company realizes a significant portion of its revenue from long-term contracts and accounts for these contracts under the provisions of Statement of Position (SOP) 81-1, “Accounting for Performance of Construction-Type and Certain Production-Type Contracts.” Revenue on fixed-price contracts is recognized using the percentage-of-completion method of accounting based on the ratio of total costs incurred to date compared to estimated total costs to complete the contract. Estimates of costs to complete include materials, direct labor, overhead, and allowable general and administrative expenses (for government contracts). While the Company generally does not incur a
material amount of set-up fees for its projects, such costs, if any, are excluded from the estimated total costs to complete the contract. Cost estimates are reviewed monthly on an individual contract basis, and are revised periodically throughout the life of the contract such that adjustments to profit resulting from revisions are made cumulative to the date of the revision. In certain instances in which the Company is awarded work on a phase by phase basis rather than on a total project basis such as the Company’s large deployment program with a national carrier to build cellular sites in certain geographical regions in the U.S., it is impractical to estimate the final outcome of the project margin, but it is certain that the Company will not incur a loss on the project, the Company may record revenue equal to cost incurred, at a zero profit margin. In the event that the cost incurred to date may be in excess of the funded contract value, the Company may defer those costs until the associated contract value has been funded by the customer. As of December 31, 2006, the Company deferred costs of $1.1 million in excess of funded contract value and has recorded this amount in other current assets. There was no comparable balance as of December 31, 2005. Once the estimate of the final outcome of the project margin is determined, the Company will record revenue using the percentage-of-completion method of accounting based on the ratio of total costs incurred to date compared to the estimated total costs to complete the project. The full amount of an estimated loss associated with a contract is accrued and charged to operations in the period it is determined that it is probable a loss will be realized from the performance of the contract.
Significant management judgments and estimates, including the estimated costs to complete projects, which determine the project’s percentage of completion and profit margin must be made and used in connection with the revenue recognized in any accounting period.
Accordingly, the revenue the Company recognizes in a given financial reporting period depends on (1) the costs the Company has incurred for individual projects, (2) the Company’s then current estimate of the total remaining costs to complete the individual projects and (3) current estimated contract value associated with the projects. In the Company’s wireless network services business, the estimated contract value and costs are impacted by the estimated number and mix of site types that we may be assigned. If, in any period, we significantly increase or decrease our estimate of the total costs to complete a project, and/or reduce or increase the associated contract value, revenue for that period would be impacted. To the extent that the Company’s estimates fluctuate over time or differ from actual results, gross margins in subsequent periods may vary significantly from previous estimates. Material differences may result in the amount and timing of the Company’s revenue for any period if management made different judgments or utilized different estimates. In the event the Company is unable to provide reliable cost estimates on a given project, the Company records revenue using the completed contract method. There are no contracts for which the Company utilized the completed contract method for the years ended December 31, 2006 and December 31, 2005.
Many of the Company’s contracts in Wireless Network Services are master service agreements under which the Company is contracted to provide services to deploy a pre-determined and specific number of sites in specific geographic markets. These agreements are typically recognized on multiple projects to account for revenue under the combination or segmentation guidelines of SOP 81-1. These contractual arrangements with the Company’s customers typically include milestone billings. The milestone billing clauses relate specifically to the timing of customer billings and payment schedules, and are independent of the Company’s right to payment and the timing of when revenue is recognized. Under the terms of substantially all of the Company’s contracts, if a contract is terminated without proper cause by the customer, if the customer creates unplanned/unreasonable time delays, or if the customer modifies the contract tasks/scope, the Company has contractual rights to reimbursement in accordance with the terms and conditions regarding payment for work performed, but not yet billed (i.e., unbilled trade accounts receivable) at a gross profit margin that is consistent with the overall project margin. Furthermore, certain additional provisions compensate the Company for additional or excess costs incurred, whereby any scope reductions (i.e., reduction in original number of sites awarded) or other modifications are subject to reimbursement of costs incurred to date with a reasonable profit margin based on the contract value and
completed work at that time. The inherent aforementioned risks associated with the presence of potential “partial milestone billings” or “reductions in scope” are reflected in the Company’s ongoing periodic assessment of the “total contract value” and the associated revenue recognized. Total net unbilled accounts receivable at December 31, 2005 and December 31, 2006 were $46.8 million and $47.9 million, respectively. The Company periodically performs work under authorizations to proceed or work orders from its customers for which a formal purchase order may not be received until after the work has commenced. As of December 31, 2006, approximately $3.6 million of the Company’s unbilled accounts receivable balance were under unapproved change orders or claims. The Company expects that substantially all of the unbilled balances as of December 31, 2006 will be billed within one year as billing and performance milestones are achieved.
Revenue from certain time and materials and fixed-price contracts are recognized when realized or realizable and earned, in accordance with Staff Accounting Bulletin (SAB) 101, as revised by SAB 104 (recognized when services are rendered at contracted labor rates, when materials are delivered and when other direct costs are incurred). Additionally, based on management’s periodic assessment of the collectibility of its accounts receivable, credit worthiness and financial condition of customers, the Company determines if collection is reasonably assured prior to the recognition of revenue.
The Company’s government network services business with the U.S. government and prime contractors to the U.S. government is generally performed under cost reimbursable plus fixed fee, fixed-price or time and material contracts. Cost reimbursable contracts for the government provide for reimbursement of costs plus the payment of a fee. The Company records the fee as costs are incurred. Under fixed-price contracts, the Company agrees to perform certain work for a fixed price. Under time and materials contracts, the Company is reimbursed for labor hours at negotiated hourly billing rates and is reimbursed for travel and other direct expenses at actual costs plus applied general and administrative expenses. Under certain of the Company’s contractual arrangements, the Company may also recognize revenue for out-of-pocket expenses in accordance with EITF 01-14 “Income Statement Characterization of Reimbursements Received for “Out-of-Pocket Expenses Incurred.” Depending on the contractual arrangement, these expenses may be reimbursed with or without a fee.
Under certain of its contracts, the Company provides supplier procurement services and materials for its customers. The Company records revenue on these arrangements on a gross or net basis in accordance with EITF 99-19, “Reporting Revenue Gross as a Principal versus Net as an Agent,” depending on the specific circumstances of the arrangement. The Company considers the following criteria, among others, for recording revenue on a gross or net basis:
(1) Whether the Company acts as a principal in the transaction;
(2) Whether the Company takes title to the products;
(3) Whether the Company assumes risks and rewards of ownership, such as risk of loss for collection, delivery or returns;
(4) Whether the Company serves as an agent or broker, with compensation on a commission or fee basis; and
(5) Whether the Company assumes the credit risk for the amount billed to the customer subsequent to delivery.
(i) Allowance for Doubtful Accounts
The Company maintains an allowance for doubtful accounts for estimated losses resulting from the inability of its customers to make required payments, which results in bad debt expense. Management periodically determines the adequacy of this allowance by evaluating the comprehensive risk profiles of all individual customer receivable balances including, but not limited to, the customer’s financial condition,
credit agency reports, financial statements and overall current economic conditions. Additionally, on certain contracts whereby the Company performs services for a prime/general contractor, a specified percentage of the invoiced trade accounts receivable may be retained by the customer until the project is completed. The Company periodically reviews all retainages for collectibility and records allowances for doubtful accounts when deemed appropriate, based on its assessment of the associated credit risks. Total retainages included in accounts receivable were $1.5 million and $1.2 million at December 31, 2005 and 2006, respectively. In addition, $0.2 million of retainages at December 31, 2006 that are expected to be paid after 2007 are included in other assets (long term). Changes to estimates of contract value are recorded as adjustments to revenue and not as a component of the allowance of doubtful accounts. Allowances for doubtful accounts on billed accounts receivable as of December 31, 2005 and December 31, 2006 were $0.8 million and $0.5 million, respectively.
The following table outlines the balance of the Company’s Allowance for Doubtful Account for 2004, 2005 and 2006. It identifies the additional provisions each year as well as the write-offs that utilized the allowance.
Allowance for Doubtful Accounts | | | | Balance
at Beginning of
Year | | Provisions | | Write-offs/
Recoveries | | Balance
at End of Year | |
Year ended December 31, 2004 | | | $ | 1.4 | | | | $ | 0.5 | | | | $ | (0.7 | ) | | | $ | 1.2 | | |
Year ended December 31, 2005 | | | $ | 1.2 | | | | $ | 0.3 | | | | $ | (0.7 | ) | | | $ | 0.8 | | |
Year ended December 31, 2006 | | | $ | 0.8 | | | | $ | (0.1 | ) | | | $ | (0.2 | ) | | | $ | 0.5 | | |
(j)(m) Income Taxes
The Company records deferred tax assets and liabilities for the future tax consequences attributable to differences between the financial statement carrying amounts of existing assets and liabilities and their respective tax bases and operating loss and tax credit carryforwards. Deferred tax assets and liabilities are measured using enacted tax rates expected to apply to taxable income in the years in which those temporary differences are expected to be realized. The effect on deferred tax assets and liabilities of a change in tax rates is recognized in income in the period that includes the enactment date.
The Company maintains a valuation allowance on the deferred tax assets for which it is more likely than not that the Company will not realize the benefits of these tax assets in future tax periods. The valuation allowance is based on estimates of future taxable income by tax jurisdiction in which the Company operates, the number of years over which the deferred tax assets will be recoverable, and scheduled reversals of deferred tax liabilities.
In assessing On January 1, 2007, the realizability of deferred tax assets, management considers, on a periodic basis, whether it is more likely than not that some portion or all ofCompany adopted FASB Interpretation No. 48, "Accounting for Uncertainty in Income Taxes" ("Interpretation No. 48") to account for uncertainty in income taxes recognized in the deferred tax assets will not be realized. As of December 31, 2006, Management has concluded that an increaseCompany's financial statements in accordance with SFAS No. 109, "Accounting for Income Taxes." Refer to the valuation allowance was required based on its overall assessment of the risks and uncertainties related to its future ability to realize and utilize the Company’s deferred tax assets. Accordingly, management believes the current valuation allowance on deferred tax assets is sufficient and properly stated at December 31, 2006.Note 10.
(k)(n) Stock-Based Compensation
Effective January 1, 2006, the Company adopted the provisions of Statement of Financial Accounting Standards No. 123R (“("SFAS 123R”123R"), “Share-Based"Share-Based Payments,”" which requires the measurement and recognition of compensation expense for all share-based payment awards to
KRATOS DEFENSE & SECURITY SOLUTIONS, INC.
Notes to Consolidated Financial Statements (Continued)
Years ended December 31, 2005, 2006 and 2007
Note 1. Organization and Summary of Significant Accounting Policies (Continued)
employees and directors based on estimated fair values. SFAS 123R supersedes the Company’sCompany's previous accounting methodology using the intrinsic value method under Accounting Principles Board Opinion APB No. 25, “Accounting"Accounting for Stock Issued to Employees.”" Under the intrinsic value method, no share-based compensation expense related to stock option awards granted to employees at market price on date of grant had been recognized in the Company’sCompany's Consolidated
Statements of Operations until the completion of the Equity Award Review in 2007 as adjustmentsprior to record stock-based compensation expense were identified.January 1, 2006. The Company has no awards with market or performance conditions.
On November 10, 2005, the FASB issued FASB Staff Position No. FAS 123(R)-3, “Transition"Transition Election Related to Accounting for Tax Effects of Share-Based Payment Awards.”" The Company has elected to adopt the alternative transition method provided in this FASB Staff Position for calculating the tax effects of share-based compensation pursuant to FAS 123R. The alternative transition method includes a simplified method to establish the beginning balance of the additional paid-in capital pool (APIC pool) related to the tax effects of employee share-based compensation, which is available to absorb tax deficiencies which could be recognized subsequent to the adoption of FAS 123R.
The Company adopted SFAS 123R using the modified prospective transition method. Under this transition method, compensation expense recognized during the yearyears ended December 31, 2006 and 2007 included: (a) compensation expense for all share-based awards granted prior to, but not yet vested, as of December 31, 2005, based on the grant date fair value estimated in accordance with the original provisions of SFAS 123, and (b) compensation expense for all share-based awards granted subsequent to December 31, 2005, based on the grant date fair value estimated in accordance with the provisions of SFAS 123R. In accordance with the modified prospective transition method, the Company’sCompany's consolidated financial statements for prior periods have not been restated to reflect the impact of SFAS 123R. The Company adopted SFAS 123R as of January 1, 2006 and had $11.6 million related to equity awards for continuing operations and $0.3 million related to equity awards for discontinued operations that was expensed for the year ended December 31, 2006.
The following table shows the amounts recognized in the financial statements for the full year of 2006 from continuing operations for share-based compensation related to employees (in millions, except per share data). In addition, for For the twelve months ended December 31, 2006 and December 31, 2007, there was no incremental tax benefit from stock options exercised in the period due to expected tax losses for the year. The Company recorded cash received from the exercise of stock options of $0.5 million.$567 thousand in 2006
| | Full Year
ended
December 31, | |
| | 2006 | |
Cost of revenues | | | $ | 4.1 | | |
Selling, general and administrative | | | 7.5 | | |
Total cost of employee share-based compensation included in operating loss, before income tax | | | 11.6 | | |
Amount of income tax recognized in earnings | | | — | | |
Amount charged against income from continuing operations | | | 11.6 | | |
Amount charged against income from discontinued operations | | | 0.3 | | |
Total charged against income | | | $ | 11.9 | | |
Impact on net income (loss) per common share: | | | | | |
Basic | | | $ | (0.16 | ) | |
Diluted | | | $ | (0.16 | ) | |
KRATOS DEFENSE & SECURITY SOLUTIONS, INC.
Notes to Consolidated Financial Statements (Continued)
Years ended December 31, 2005, 2006 and 2007
Note 1. Organization and Summary of Significant Accounting Policies (Continued)
and $27 thousand in 2007. The following table shows the amounts recognized in the consolidated financial statements for 2006 and 2007 for share-based compensation related to employees (in millions).
| | Year ended December 31, 2006
| | Year ended December 31, 2007
| |
|---|
| Cost of revenues | | $ | 1.0 | | $ | 0.0 | |
| Selling, general and administrative expenses | | | 5.9 | | | 0.9 | |
| | |
| |
| |
| | Total cost of employee share-based compensation included in operating loss from continuing operations, before income tax | | | 6.9 | | | 0.9 | |
| Amount of related income tax benefit recognized in earnings | | | — | | | — | |
| | |
| |
| |
| Amount charged to loss from continuing operations | | | 6.9 | | | 0.9 | |
| Amount charged to loss from discontinued operations | | | 5.0 | | | 0.7 | |
| | |
| |
| |
| | Total charged against operations | | $ | 11.9 | | $ | 1.6 | |
| | |
| |
| |
| Impact on net loss per common share: | | | | | | | |
| | Basic | | $ | (0.16 | ) | $ | (0.02 | ) |
| | Diluted | | $ | (0.16 | ) | $ | (0.02 | ) |
The proforma effectseffect of recognizing estimated compensation expense under the fair value method on net income and earnings per common share for the yearsyear ended December 31, 2004 and 2005 were as follows (in millions, except per share data):
RECONCILIATION OF STOCK-BASED COMPENSATION EXPENSE FOR 2004 AND 2005
(In millions, except per share data)
| | Year Ended December 31, 2004 | | Year Ended December 31, 2005 | |
| | | | Adjustment | | | | | | Adjustment | | | |
| | | | for Stock- | | | | | | for Stock- | | | |
| | As | | Based | | As | | As | | Based | | As | |
| | Reported | | Compensation | | Restated | | Reported | | Compensation | | Restated | |
Net income (loss) | | | $ | 5.0 | | | | $ | 10.0 | | | | $ | 15.0 | | | | $ | 3.7 | | | | $ | (2.1 | ) | | | $ | 1.6 | | |
Add: Stock-based compensation expense included in net income (loss) | | | 0.2 | | | | 2.2 | | | | 2.4 | | | | 0.1 | | | | 2.7 | | | | 2.8 | | |
Deduct: Stock-based compensation expense determined under the fair value method | | | (16.3 | ) | | | 0.2 | | | | (16.1 | ) | | | (42.8 | ) | | | (5.1 | ) | | | (47.9 | ) | |
Net income (loss)—pro forma | | | $ | (11.1 | ) | | | $ | 12.4 | | | | $ | 1.3 | | | | $ | (39.0 | ) | | | $ | (4.5 | ) | | | $ | (43.5 | ) | |
Net income (loss) per share
(basic) | | | $ | 0.07 | | | | | | | | $ | 0.21 | | | | $ | 0.05 | | | | | | | | $ | 0.02 | | |
Net income (loss) per share (basic)—pro forma | | | $ | (0.16 | ) | | | | | | | $ | 0.02 | | | | $ | (0.53 | ) | | | | | | | $ | (0.59 | ) | |
Net income (loss) per share (diluted) | | | $ | 0.07 | | | | | | | | $ | 0.20 | | | | $ | 0.05 | | | | | | | | $ | 0.02 | | |
Net income (loss) per share (diluted)—pro forma | | | $ | (0.16 | ) | | | | | | | $ | 0.02 | | | | $ | (0.52 | ) | | | | | | | $ | (0.58 | ) | |
Weighted average shares: | | | | | | | | | | | | | | | | | | | | | | | | | |
Basic—as reported | | | 67.7 | | | | | | | | 72.8 | | | | 74.0 | | | | | | | | 74.0 | | |
Basic—pro forma | | | 67.7 | | | | | | | | 72.8 | | | | 74.0 | | | | | | | | 74.0 | | |
Diluted—as reported | | | 67.7 | | | | | | | | 75.3 | | | | 75.3 | | | | | | | | 75.0 | | |
Diluted—pro forma | | | 67.7 | | | | | | | | 75.3 | | | | 75.3 | | | | | | | | 75.0 | | |
| | Year Ended December 31, 2005
| |
|---|
| Net income | | $ | 1.6 | |
| Add: Stock-based compensation expense included in net income | | | 2.7 | |
| Deduct: Stock-based compensation expense determined under the fair value method | | | (47.9 | ) |
| | |
| |
| Net loss—pro forma | | $ | (43.6 | ) |
| | |
| |
| Net income per share (basic) | | $ | 0.02 | |
| | |
| |
| Net loss per share (basic)—pro forma | | $ | (0.59 | ) |
| | |
| |
| Net income per share (diluted) | | $ | 0.02 | |
| | |
| |
| Net loss per share (diluted)—pro forma | | $ | (0.59 | ) |
| | |
| |
| Weighted average shares: | | | | |
| Basic—as reported | | | 74.0 | |
| Basic—pro forma | | | 74.0 | |
| Diluted—as reported | | | 75.0 | |
| Diluted—pro forma | | | 74.0 | |
KRATOS DEFENSE & SECURITY SOLUTIONS, INC.
138Notes to Consolidated Financial Statements (Continued)
(l)Years ended December 31, 2005, 2006 and 2007
Note 1. Organization and Summary of Significant Accounting Policies (Continued)
(o) Net Income (Loss) per Common Share
The Company calculates net income (loss) per share in accordance with SFAS No. 128, “Earnings"Earnings Per Share”Share". Under SFAS No. 128, basic net income (loss) per common share is calculated by dividing net income (loss) by the weighted-average number of common shares outstanding during the reporting period. Diluted net income (loss) per common share reflects the effects of potentially dilutive securities. Weighted average shares used to compute basic and diluted net income (loss) per share are presented belowsecurities (in millions):.
| | 2004 | | 2005 | | 2006 | |
| | (Restated) | | (Restated) | | | |
Net income (loss) | | | $ | 15.0 | | | | $ | 1.6 | | | $ | (57.9 | ) |
Shares used in basic per share amounts: | | | | | | | | | | | |
Weighted average common shares outstanding | | | 72.8 | | | | 74.0 | | | 73.5 | |
Shares used in diluted per share amounts: | | | | | | | | | | | |
Dilutive effect of stock options | | | 2.5 | | | | 1.0 | | | — | |
Dilutive weighted average shares | | | 75.3 | | | | 75.0 | | | 73.5 | |
Basic net income (loss) per share | | | $0.21 | | | | $ | 0.02 | | | $ | (0.79 | ) |
Diluted net income (loss) per share | | | $ | 0.20 | | | | $ | 0.02 | | | $ | (0.79 | ) |
Anti-dilutive weighted shares from stock options excluded from calculation | | | 5.0 | | | | 7.4 | | | 12.2 | |
Average per share market value of common stock | | | $ | 9.80 | | | | $ | 6.33 | | | $ | 3.32 | |
Average outstanding stock option price per share | | | $ | 9.30 | | | | $ | 6.28 | | | $ | 6.20 | |
| | 2005
| | 2006
| | 2007
|
|---|
Anti-dilutive weighted shares from stock options excluded from
calculation | | 7.4 | | 12.2 | | 8.8 |
| Anti-dilutive weighted shares from preferred stock excluded from calculation | | — | | 1.4 | | 1.0 |
(m)(p) Impairment of Long-Lived Assets and Long-Lived Assets to Be Disposed Of
On January 1, 2002, the Company adopted SFAS No. 144, “Accounting for the Impairment or Disposal of Long-Lived Assets”, which addresses financial accounting and reporting for the impairment or disposal of long-lived assets. While SFAS No. 144 supersedes SFAS No. 121, “Accounting for the Impairment of Long-Lived Assets and for Long-Lived Assets to be Disposed Of”, it retains many of the fundamental provisions of SFAS No. 121, including the recognition and measurement of the impairment of long-lived assets to be held and used, and the measurement of long-lived assets to be disposed of by sale. Long-lived assets and certain identifiable intangibles are reviewed for impairment in accordance with SFAS No. 144, "Accounting for the Impairment or Disposal of Long-Lived Assets", whenever events or changes in circumstances indicate that the carrying amount of an asset may not be recoverable. Recoverability of assets to be held and used is measured by a comparison of the carrying amount of the assets to future net cash flows (undiscounted and without interest) expected to be generated by the asset. If such assets are considered to be impaired, the impairment to be recognized is measured by the amount by which the carrying amount of the assets exceeds the fair value of the assets. Assets to be disposed of are reported at the lower of the carrying amount or fair value less costs to sell. The Company concluded that $1.8 million of equipment related to a wireless LAN system that the Company had installed and operated in the Public Safety & Security ("PSS") segment was impaired in the fourth quarter of 2006 based upon recent trends regarding free WiFi and WiMAX services and the resulting impact to the realizability of this network. In addition, the Company concluded that its' investments in Tactical Survey Group and Commverge Solutions, Inc. were impaired as of December 31, 2007 (see Note 5).
The Company completed its annual impairment test as required under the provisions of SFAS No.142 during the fourth quarter of 2006 and did determine2007. In 2006, the Company determined that there was an impairment of goodwill for the Enterprise Network Services segment. OurPublic Safety & Security segment. The Company's annual impairment test resulted in a non-cash impairment charge of $18.3 million related to the write-down of goodwill for the acquisitions made in the Enterprise Network Services segment.PSS segment (See Note 3). The fair value of goodwill was estimated by taking into consideration recent performance, expected future performance and industry trends, using a combination of a discounted cash flow model and a market approach model which takes into consideration comparable businesses and market transactions.
In addition, $1.8 million of equipment related to a wireless LAN system that2007, the Company had installed and operated in the Enterprise Network Services segmentCompany's annual test did not indicate any impairment was impaired in the
fourth quarter of 2006 based upon recent trends regarding free WiFi and WiMAX services and the resulting impact to the realizability of this network.necessary.
We also concluded based on this analysis the intangible assets for ENS were not impaired.
(n)(q) Fair Value of Financial Instruments
SFAS No. 107, “Disclosures"Disclosures about Fair Value of Financial Instruments,”" requires that fair values be disclosed for the Company’sCompany's financial instruments. The carrying amounts of cash and cash equivalents, short-term investments, accounts receivable, accounts payable, accrued expenses, linebillings in excess of costs and
KRATOS DEFENSE & SECURITY SOLUTIONS, INC.
Notes to Consolidated Financial Statements (Continued)
Years ended December 31, 2005, 2006 and 2007
Note 1. Organization and Summary of Significant Accounting Policies (Continued)
earnings on uncompleted contracts, and our credit andfacility approximate fair value due to the short-term nature of these instruments. The fair value of the Company's long-term debt and capital lease obligations is estimated based on the quoted market prices for the same or similar issues or on the current rates offered to the Company for debt of the same remaining maturities. The fair value of the Company's long-term debt and capital lease obligations as of December 31, 2007 is $75.5 million and $1.2 million, respectively.
(o)(r) Comprehensive Income (Loss)
SFAS No. 130, “Reporting"Reporting Comprehensive Income,”" establishes rules for the reporting of comprehensive income (loss) and its components. Comprehensive income (loss) consists of net income and other gains and losses affecting shareholders’shareholders' investment that, under accounting principles generally accepted in the United States of America are excluded from net income (loss).
The components of other comprehensive income (loss) are as follows:
| | 2004 | | 2005 | | 2006 | |
| | (Restated) | | (Restated) | | | |
Net income (loss) | | | $ | 15.0 | | | | $ | 1.6 | | | $ | (57.9 | ) |
Foreign currency translation adjustment/reclassification | | | 0.2 | | | | 0.9 | | | 2.9 | |
Comprehensive income (loss) | | | $ | 15.2 | | | | $ | 2.5 | | | $ | (55.0 | ) |
The following table summarizes the components of accumulated other comprehensive loss:
| | December 31,
2005 | | December 31,
2006 | |
Cumulative foreign currency translation adjustment | | | $ | (2.9 | ) | | | $ | 0.0 | | |
Accumulated other comprehensive loss | | | $ | (2.9 | ) | | | $ | 0.0 | | |
(p)(s) Foreign Currency Translation
In accordance with SFAS No. 52 “Foreign"Foreign Currency Translation,”" the financial statements of the Company’sCompany's foreign subsidiaries where the functional currency has been determined to be the local currency are translated into United States dollars using year-end rates of exchange for assets and liabilities and rates of exchange that approximate the rates in effect at the transaction date for revenues, expenses, gains and losses. In 2007, all foreign subsidiaries are accounted for as discontinued operations.
(q)(t) Concentration of Credit Risk
The Company maintains cash balances at various financial institutions and such balances commonly exceed the $100,000 insured amount by the Federal Deposit Insurance Corporation. The Company has not experienced any losses in such accounts and management believes that the Company is not exposed to any significant credit risk with respect to such cash and cash equivalents.
Financial instruments, which potentially subject the Company to potential concentrations of credit risk, consist principally of cashthe Company's billed and cash equivalents, short-term investments, tradeunbilled accounts receivable. The Company's accounts receivable result from sales to customers within the federal government, state and contract management receivables. At times, cashlocal agencies and short-term investment balances heldwith commercial customers in financial institutions are in excess of federally insured limits.various industries. The Company performs periodicongoing credit evaluations of its commercial customers. See Note 13 for a discussion of our significant customers.
(u) Liquidity
As of December 31, 2007 the relative credit standing of financial institutions and limits the amount of risk by selecting financial institutions with a strong relative credit standing.
(r) Use of Estimates
The preparation of financial statements in conformity with Generally Accepted Accounting Principles in the United States (US GAAP) requires management to make estimates and assumptions that affect the reported amounts of assets and liabilities, the disclosure of contingent assets and liabilities at the dateCompany had substantially completed its reorganization of the financial statementsprimary business segments from one focused on wireless related activities to one focused on federal, state, and local government businesses. The change in focus was very costly due to the reported amountsnecessity to sell and discontinue operations of revenues and expenses during the reporting period. Such estimates include revenue recognition, allowance for doubtful accounts, valuation of long-lived assets including identifiable intangibles and goodwill, accounting for income taxes including the related valuation allowance on the deferred tax asset, accruals for partial self-insurance, contingencies and litigation and contingent acquisition consideration.previous significant subsidiaries. In the future,addition, the Company may realize actual results that differ fromcompleted its internal stock option investigation in 2007 which resulted in approximately $14.0 million of one time expenses. See Note 2. As a result, the currentCompany reported estimatesa net loss of $57.9 million and if$40.8 million for the estimates that we have used change in the future, such changes could haveyears ended December 31, 2006 and December 31, 2007, respectively. There has been a material impact.
(s) Reclassifications
The accompanying statementsnet use of cash flows separately reflect thefrom operating investing and financing portions of the cash flows attributable to its discontinued operationsactivities for each of the last three years presented. These amounts were reported onended December 31, 2007 due to working capital requirements and infrastructure costs associated with the Company's legacy wireless business in 2005 and 2006 and costs of the stock option investigation and related fees in 2007. In
KRATOS DEFENSE & SECURITY SOLUTIONS, INC.
Notes to Consolidated Financial Statements (Continued)
Years ended December 31, 2005, 2006 and 2007
Note 1. Organization and Summary of Significant Accounting Policies (Continued)
addition, corporate overhead has not been allocated to discontinued operations and as such the continuing operating segments have had to absorb general and administrative expenses intended for a combined basis as a single amountmuch larger company.
In December of 2007, the Company successfully negotiated an $85.0 million credit facility in prior statementsorder to increase the critical mass of cash flows.its new government focused operations and provide for any working capital requirements.
On December 31, 2007 the Company completed the acquisition of Haverstick Consulting, Inc. which required the use of $75.5 million of the aforementioned $85.0 million credit facility. In addition, the balance sheets and statementsCompany had $2.4 million in letters of operationscredit outstanding resulting in $7.1 million in borrowing capacity.
As the Company currently carries a significant amount of debt, the Company's ability to execute on additional business opportunities may be limited due to its existing borrowing capacity. In addition, given the relatively highly leveraged liquidity position, any down-turn in its operating earnings could impair its ability to comply with the financial covenants of its existing credit facility. If the Company anticipated a potential covenant violation, it would seek relief from its lenders. This relief would have been reclassified to present the discontinued operations and certain prior period amounts have been reclassified to conformsome cost to the current period presentation.Company and such relief might not be on terms as favorable as those in its existing Credit Agreement. If the Company were to actually default due to its failure to meet the financial covenants of its Credit Agreement and inability to obtain a waiver from the lenders, the Company's Credit Agreement could require the Company to immediately repay all amounts then outstanding under the Credit Agreement and/or require the Company to pay interest at default rates per the Credit Agreement.
In the event the Company was required to repay the amount outstanding under the existing credit facility, it would need to obtain alternative sources of financing to continue its operating activities at existing levels. There can be no assurance that alternative financing would be available on acceptable terms or at all.
(t)(v) Debt Issuance Costs
Fees paid to obtain debt financing are treated as debt issuance costs and are capitalized and amortized over the expected term of the related debt. These payments are shown as a financing activity in the consolidated statement of cash flows.
(w) Recent Accounting Pronouncements
In June 2006, FASB issued Interpretation No. 48, Accounting for Uncertainty in Income Taxes—an interpretation of FASB Statement No. 109 (FIN 48), which clarifies the accounting for uncertainty in tax positions. This Interpretation requires that we recognize the impact of a tax position in our financial statements, if that position is more likely than not of being sustained on audit, based on the technical merits of the position. The provisions of FIN 48 are effective for fiscal years beginning after December 15, 2006, with the cumulative effect of the change in accounting principle recorded as an adjustment to opening retained earnings. The application of this Statement will reduce our retained earnings on January 1, 2007 by $0.3 million to increase reserves for uncertain tax positions.
The SEC issued Staff Accounting Bulletin No. 108 (“SAB 108”) in September 2006. SAB 108 expresses the views of the SEC staff regarding the process of quantifying the materiality of financial misstatements. SAB 108 requires both the balance sheet and income statement approaches be used when quantifying the materiality of misstatement amounts. In addition, SAB 108 contains guidance on correcting errors under the dual approach and provides transition guidance for correcting errors existing in prior years. SAB 108 was effective in the Company’s fourth quarter of 2006. The adoption of SAB 108 did not have a material impact on the Company’s consolidated financial statements.
In September 2006, the FASB issued SFAS No. 157, “Fair"Fair Value Measurements” (“Measurements" ("SFAS 157”157"). This new standard provides guidance for using fair value to measure assets and liabilities and information about the extent to which companies measure assets and liabilities at fair value, the information used to measure fair value, and the effect of fair value measurements on earnings. This framework is intended to provide increased consistency in how fair value determinations are made under various existing accounting standards which permit, or in some cases require, estimates of fair market value. SFAS 157 also expands financial statement disclosure requirements about a company’scompany's use of fair value measurements, including the effect of such measures on earnings. The provisions of SFAS 157 are effective for financial statements issued for fiscal years beginning after November 15,
KRATOS DEFENSE & SECURITY SOLUTIONS, INC.
Notes to Consolidated Financial Statements (Continued)
Years ended December 31, 2005, 2006 and 2007
Note 1. Organization and Summary of Significant Accounting Policies (Continued)
2007. The Company is in the process of determining the impact of this statement on its consolidated financial statements.
In February 2007, the FASB issued FASB Statement No. 159,The Fair Value Option for Financial Assets and Financial Liabilities—Including an Amendment of FASB Statement No. 115. This standard
permits an entity to choose to measure many financial instruments and certain other items at fair value. This option is available to all entities, including not-for-profit organizations. Most of the provisions in Statement 159 are elective; however, the amendment to FASB Statement No. 115,Accounting for Certain Investments in Debt and Equity SecuritieSecurities,s, applies to all entities with available-for-sale and trading securities. Some requirements apply differently to entities that do not report net income. The FASB’sFASB's stated objective in issuing this standard is as follows: “to"to improve financial reporting by providing entities with the opportunity to mitigate volatility in reported earnings caused by measuring related assets and liabilities differently without having to apply complex hedge accounting provisions.”"
The fair value option established by Statement 159 permits all entities to choose to measure eligible items at fair value at specified election dates. A business entity will report unrealized gains and losses on items for which the fair value option has been elected in earnings (or another performance indicator if the business entity does not report earnings) at each subsequent reporting date. A not-for-profit organization will report unrealized gains and losses in its statement of activities or similar statement. The fair value option: (a) may be applied instrument by instrument, with a few exceptions, such as investments otherwise accounted for by the equity method; (b) is irrevocable (unless a new election date occurs); and (c) is applied only to entire instruments and not to portions of instruments.
Statement 159 is effective as of the beginning of an entity’sentity's first fiscal year that begins after November 15, 2007. Early adoption is permitted as of the beginning of the previous fiscal year provided that the entity makes that choice in the first 120 days of that fiscal year and also elects to apply the provisions of FASB Statement No. 157,Fair Value Measurements.The Company is in the process of determining the impact of this statement on its consolidated financials statements.
In December 2007, the FASB issued SFAS No. 141 (revised 2007) ("SFAS 141R"), "Business Combinations" and SFAS No. 160 ("SFAS 160") "Noncontrolling Interests in Consolidated Financial Statements, an amendment of Accounting Research Bulletin No. 51". SFAS 141R will change how business acquisitions are accounted for and will impact financial statements both on the acquisition date and in subsequent periods. SFAS 160 will change the accounting and reporting for minority interests, which will be recharacterized as noncontrolling interests and classified as a component of equity. The provisions of SFAS 141R and SFAS 160 are effective for financial statements issued for fiscal years beginning after December 15, 2008. Early adoption is not permitted. The Company is in the process of determining the impact of these statements on its consolidated financial statements.
Note 2. Restatement of Company’s Consolidated Financial StatementsStock Option Investigation
The Company completed an internal Equity Award Review of its past practices for granting and pricing stock options in August 2007. The voluntary review was initiated by its current executive management team, with oversight from the Board of Directors and assistance from outside legal counsel.
As a result of the findings of its equity award review, the accompanying consolidated financial statements for the yearsKRATOS DEFENSE & SECURITY SOLUTIONS, INC.
Notes to Consolidated Financial Statements (Continued)
Years ended December 31, 2005, 2006 and 2004 have been restated. The restated consolidated financial statements include unaudited financial information for interim periods of 2005 consistent with Article 10-01 of Regulation S-X. See Note 18. Quarterly Financial Data. The Company also recorded additional stock-based compensation expense and associated tax adjustments affecting the Company’s previously-reported financial statements for 1998 through 2003, the effects of which are summarized in cumulative adjustments to its additional paid-in capital, deferred compensation and accumulated deficit accounts as of December 31, 2003 in the amounts of $56.1 million, $6.6 million and $62.9 million, respectively. See the Consolidated Statements of Shareholders’ Equity.
Impact on Previously Issued Reports and Financial Statements2007
Consistent with the relevant accounting standards and recent guidance from the Securities and Exchange Commission (the “SEC”) as part of the Equity Award Review, the grants during the relevant period were organized into categories based on grant type and process by which the grant was finalized. The Company analyzed the evidence related to grants in each category as part of the Equity Award Review. This evidence included, but was not limited to, electronic and physical documents, document metadata, and witness interviews. The controlling accounting standards were applied to the relevant facts and circumstances, in a manner consistent with the recent guidance from the SEC, to determine the proper measurement date for every grant within each category. If the measurement date was not the same as the originally assigned grant date, accounting adjustments were made as required, resulting in stock-based compensation expense and related income tax effects, as detailed below.Note 2. Stock Option Investigation (Continued)
Based on the results of the Equity Award Review, On May 3, 2007, the Company concludedannounced that pursuant to Accounting Principles Board Opinion No. 25, Accounting for Stock Issued to Employees (“APB 25”), and relevant interpretations, revised accounting measurement dates should be applied toit had a substantial number of thefiled a lawsuit against a former employee who previously served as its stock option grants covering options for the purchase of 15.2 million shares of its common stock that were awarded primarily between March 1998administrator and December 2003. The use of the revised measurement dates for the affected option grants requiredleft the Company in mid-2004, and his spouse. The lawsuit sought to record a total of $75.0 million in additional deferred compensation, with substantially all of the increase relating to option grants made before December 31, 2003. The Company has also recorded $58.2 million in additional stock-based compensation expense for the years 1998 through 2005, reflecting the amortization of deferred compensation over the relevant vesting periods, which was typically over four years. After aggregate payroll tax adjustments and income tax adjustments of $9.6 million, the restatement resulted in total net adjustments to net income (loss) of $48.6 million for the years 1998 through 2005. This amount is net of forfeitures related to employee terminations of approximately $16.8 million. These amounts do not include the unauthorized issuance of common stock charge of $0.6 million and $5.7 million in 2002 and 2003 related to misappropriated options by the Company’s former stock administrator described herein. The aggregate amount of the Equity Award Review including the misappropriated options is $64.5 million comprised of the $58.2 million in additional stock-based compensation expense and $6.3 million of a charge for unauthorized issuance of common stock. After aggregate other tax adjustments and income tax adjustments of $9.6 million, the restatement resulted in total net adjustments to net income (loss) of $54.9 million for the years 1998 through 2005. Approximately $26.6 million of the stock-based compensation expense was recorded in 2001, which was primarily due to cancellations from our Stock Option Cancel/Re-grant Program, as described herein, which resulted in the remaining unamortized deferred compensation being expensed upon the cancellation in March 2001.
None of the adjustmentsrecover damages resulting from the Equity Award Review affected the Company’s previously-reported revenue, cash, cash equivalents or marketable securities balancestheft of stock options and common stock valued in any prior periods.
Former Stock Option Administrator
During the courseexcess of the Equity Award Review, the Company discovered that Vencent Donlan, a former stock option administrator, had engaged in a fraudulent scheme by which he misappropriated options to purchase more than 700,000 shares of stock. Ill-gotten gains from this scheme approximated $6.3 million. The Company has brought an action against Donlan seeking return ofU.S. Attorney's Office indicted the fraudulently obtained stock option proceeds. The Company also promptly alertedformer employee for the SEC of our discovery in March 2007. The SEC commenced an enforcement action against Donlan,theft and the U.S. Attorney’s Office forwarded a grand jury subpoena to the Company seeking records related to Donlan and its historical option granting practices. The Company has cooperated with, and intends to continue to cooperate with, both the SEC and the U.S. Attorney’s Office in their actions against Donlan and otherwise. Donlan has consented to an injunction brought by the SEC and has pleadhe pled guilty to federal criminal charges brought against himand has been sentenced to 46 months in prison and is currently incarcerated. The former employee and his wife entered into a settlement agreement with the Company on October 5, 2007 turning over substantially all of their assets to the Company in settlement of the damages incurred in the theft. The settlement has been approved by the U.S. Attorney’s Office. TheSEC and by the federal judge overseeing this case.
During the investigation, criminal prosecution, and settlement negotiations the Company has recorded an unauthorized issuance of common stock charge of $0.6 million and $5.7incurred $14.0 million in 2002legal expenses and 2003, respectively, related to this theft.
143
Adjustments to Measurement Dates
other fees. As a result of the Equity Award Review, the Company determined under the criteria set forth in APB 25 that option grants covering a total of 15.2 million of the shares of our common stock require measurement date adjustments. For reasons that fell into four categories, the Company concluded that the measurement dates originally used for those option grants did not meet the criteria to establish a measurement date as set forth in APB 25. For some of those grants, more than one reason applied. The four categories are:
·Lack of Contemporaneous Documentation.The Equity Award Review identified a number of grants for which the Company was unable to locate contemporaneous documentation confirming that either a Compensation Committee approval occurred or the CEO Award Grants occurred on the indicated grant date. The Company identified grants requiring measurement date adjustments under the criteria of APB 25 when it was unable to locate contemporaneous documentation confirming that (1) a meeting occurred on the grant date, (2) the CEO approved the grant on the grant date, (3) the Compensation Committee approved the grant on the grant date or (4) the identification of employee-recipients and grant amounts were finalized by the grant date. The affected grants involved options allowing the purchase of 3.7 million shares of our common stock. Of these options, options to purchase 0.5 million shares were granted to Executive Officers, options to purchase 60,000 shares were granted to three of the Company’s current Directors and options to purchase 3.1 million shares were granted to other employees. Adjustments to the APB 25 measurement dates for the grants covered by these grants resulted in the recording of additional deferred compensation of $25.9 million, and amortization of stock-based compensation expense of $22.4 million, with the remaining $3.5 million eliminated due to forfeitures and terminations.
·Date Selection/Indications of Other Dates.For twelve grant dates, the Equity Award Review identified documents that indicated that the grant date for some options was selected, with the benefit of hindsight after the date indicated on the unanimous written consent or after the CEO authorization form documenting the approval of those options. The affected awards on these twelve grant dates involved option grants covering 7.0 million shares. Of these option grants, options to purchase 1.3 million shares were granted to Executive Officers and options to purchase 5.7 million shares were granted to other employees. Adjustments to the APB 25 measurement dates for these grants resulted in the recording of additional deferred compensation of $13.1 million and amortization of stock-based compensation expense of $9.9 million, with the remaining $3.2 million eliminated due to forfeitures and terminations. Each of the twelve grant dates were on dates when the closing price of the Company’s common stock was at or near the lowest price experienced during the previous 7 weeks or earlier.
·Subsequent Allocations.In 1999, 2000, 2001, 2002 and 2003, the Company made large, broad-based grants of stock options covering a substantial percentage of our employees. With respect to seven of the broad-based grant dates, the Equity Award Review identified that it had not completed allocations of options to individual employees by the time the grant was approved by Compensation Committee. The affected awards on these seven grant dates involved option grants covering 4.2 million shares. Of these option awards, options to purchase 0.2 million shares were granted to Executive Officers and options to purchase 4.0 million shares were granted to other employees. Adjustments to the APB 25 measurement dates for these grants resulted in the recording of additional deferred compensation of $23.8 million and amortization of stock-based compensation expense of $17.5 million, with the remaining $6.3 million eliminated due to forfeitures and terminations.
·Pre-Hire Grants.The Company made certain grants in connection with offers of employment to new employees were made on grant dates that preceded the employee’s hire date. These grants involved options to purchase a total of 0.7 million shares. Of these option grants, options to purchase 0.2 million shares were granted to Executive Officers and options to purchase 0.5 million shares were granted to other
employees. Adjustments to the APB 25 measurement dates for these grants resulted in the recording of additional deferred compensation of $7.9 million and amortization of stock-based compensation expense of $3.9 million, with the remaining $4.0 million eliminated due to forfeitures and terminations.
Other Adjustments
During the course of the Equity Award Review, the Company identified some instances in which adjustments to deferred compensation were required that were not related to changes in measurement dates for the following reasons:
·Non-Employee Grants.Certain grants made to consultants and board advisors under our incentive stock option plan, which allowed only grants to employees. These grants were accounted for under APB 25 as if they were proper incentive stock option awards. In some instances, individuals were added to the Company’s payroll, even though they were not employees. The affected awards involved options to purchase 0.3 million shares, of which options to purchase 75,000 shares were issued to one of our Directors prior to his joining WFI’s Board of Directors. To correctly account for these grants in accordance with SFAS 123 and EITF 96-18, “Accounting for Equity Instruments That are Issued to Other Than Employees for Acquiring, or in Conjunction with Selling, Goods or Services”, we recorded $3.6 million in additional deferred compensation during 1998 through 2003 and amortization of stock-based compensation expense of $3.6 million.
·Modifications of Existing Grants. With respect to 0.3 million option grants, modifications were made to employee stock options that were not accounted for in accordance with APB 25. The modifications included the extension of the post-service exercise period for vested stock options of terminated employees and the acceleration of vesting for an Executive Officer, which resulted in $0.1 million of additional deferred compensation and amortization of stock-based compensation expense. Adjustments to reflect the modification of terms in accordance with APB 25 resulted in the recording of $1.3 million in additional deferred compensation and amortization of stock-based compensation expense of $1.3 million, to properly account for these modifications.
The Company previously recorded stock-based compensation expenses in prior periods for certain former employees for whom, in connection with their terminations, the post-service exercise period for vested stock options was extended or of the vesting period of stock options was accelerated. Those charges were accounted for correctly pursuant to APB 25. However, as a result of adjustments made in the restatement, the previously-recorded deferred compensation charge was reduced by $0.4 million.
During the course of the Equity Award Review, the Company discovered that a former stock option administrator had engaged in a fraudulent scheme by which he misappropriated options to purchase more than 700,000 shares of stock. Ill-gotten gains from this scheme exceeded $6.3 million, andDecember 31, 2007 the Company has recorded $3.4 million of recoveries which consists of $2.1 million of Money Market Accounts and two properties which are in escrow for $1.3 million. Subsequent to December 31, 2007, the Company intends to liquidate these assets. As more fully discussed in Note 8 to these consolidated financial statements, $1.7 million to $3.4 million of the proceeds from liquidation of these assets is subject to restrictions imposed by the Company's amended credit agreement.
Our past stock option granting practices have exposed us to greater risks associated with litigation, regulatory proceedings and government inquiries and enforcement actions. The SEC has initiated an unauthorized issuanceinformal inquiry into our historical stock option granting practices and we received a subpoena from the United States Attorney's Office for the Southern District of commonCalifornia for the production of documents relating to our historical stock chargeoption granting practices. We are cooperating with the SEC and the United States Attorney's Office for the Southern District of $0.6 millionCalifornia.
The period of time necessary to resolve these inquiries is uncertain, and $5.7 million in 2002 and 2003, respectively,we cannot predict the outcome of these inquiries or whether we will face additional government inquiries, investigations or other actions related to this theft.
Aggregate Financial Statement Impact of the Measurement Date and Other Adjustments Identified in the Equity Award Review
The aggregate gross additional deferred compensation that the Company recorded for the years 1998 through 2003 as a result of information identified in the Equity Award Review is $75.0 million. The aggregate grossadditional deferred compensation that the Company recorded for the years 2004 through 2005 was an impact of approximately $0.5 million primarily as a result of reductions in deferred compensation to reflect reductions in its stock price for option grants that were repriced and required variable accounting treatment for grants issued prior to 2004. The aggregate grossadditional deferred compensation for the years 1998 through 2005 does not reflect the elimination of $16.8 million in deferred compensation due to subsequent forfeitures related to employee terminations and cancellations. In
addition, the remaining amount of deferred compensation totaling $0.1 million at December 31, 2005 was eliminated in accordance with the provisions of SFAS No. 123 (revised 2004), Share-Based Payment, or SFAS 123R, which the Company adopted effective January 1, 2006. After these reductions, the Company recorded net additional stock-based compensation expense of $58.2 million for the years 1998 through 2005 in connection with its Equity Award Review. After related tax adjustments of $9.6 million, the restatement resulted in total net adjustments to net income (loss) of $48.6 million for the years 1998 through 2005. These amounts do not include the unauthorized issuance of common stock charge of $0.6 million and $5.7 million in 2002 and 2003, respectively, related to misappropriated options by the Company’s former stock administrator described herein. The aggregate amount of the Equity Award Review including the misappropriated options is $64.5 million comprised of the $58.2 million in additional stock-based compensation expense and $6.3 million of a charge for unauthorized issuance of common stock. After aggregate other tax adjustments and income tax adjustments of $9.6 million, the restatement resulted in total net adjustments to net income (loss) of $54.9 million for the years 1998 through 2005. The adjustments did not affect the Company’s previously-reported revenue, cash, cash equivalents or marketable securities balances in any prior period.
Related Tax Adjustments
In the Company’s restated financial statements for 1998, 1999, 2000 and 2001, the Company recorded income tax benefits of $0.5 million, $1.6 million, $3.5 million, and $7.3 million, respectively, with respect to additional stock-based compensation expense relating to U.S.-based income. At December 31, 2002, the Company had no additional net deferred tax assets for additional stock-based compensation expense as such amounts were offset by a valuation allowance. No tax benefits were recorded for additional stock-based compensation expense recorded during 2002 as such amounts were offset by a valuation allowance because the Company did not believe such additional deferred tax assets were more likely than not to be realized. At December 31, 2002, the Company concluded that a full valuation allowance against its deferred tax assets was appropriate as a result of our cumulative losses as of December 31, 2002, which caused a presumption that any deferred tax assets would be difficult to realize, and reversed the $4.2 million of deferred tax assets recognized in prior periods which were yet to be realized for tax purposes, thereby increasing tax expense by $4.2 million. The Company recorded an income tax benefit of $1.5 million in 2003 related to income tax benefits realized from employeehistorical stock option exercises in 2003 that reduced its tax liabilities. Priorgrant practices. These inquiries could require us to the restatement, such income tax benefits were credited to additional paid-in capital because there was no associated stock-based compensation expense related to such employee stock options. No income tax benefits were recorded for additional stock-based compensation in 2004expend significant management time and 2005 because of the Company’s domestic tax losses prior to deductions related to employee stock options. As a result, the cumulative net income tax benefit we recorded through December 31, 2005 was $10.2 million. The Company also recorded netincur significant legal and other non-income tax payroll expenses of $0.6 million, resulting in total related tax adjustments of $9.6 million. The other non-income tax payroll expenses recorded were $1.0 million, $10.3 million, $1.6 million and $0.9 million for 1999, 2000, 2001, and 2002, respectively. As a result of the expiration of certain statutory periods, previously recorded non-income tax payroll expenses were reduced by $0.4 million, $12.2 million and $0.6 million in 2003, 2004, and 2005, respectively.expenses.
146
Restatement of Our Consolidated Financial Statements
The following table summarizes the additional deferred compensation recorded on an annual basis as a result of the equity award review, categorized by each of the four reasons that led to the determination that particular option grants failed to meet the measurement date criteria of APB 25, together with the other adjustments made that were not related to changes in measurement dates:
| | | | | | | | | | | | | | Cumulative | | | | | | Cumulative | |
| | | | | | | | | | | | | | Amount | | Years ended | | Amount | |
| | Years Ended December 31, | | December 31, | | December 31, | | December 31, | |
| | 1998 | | 1999 | | 2000 | | 2001 | | 2002 | | 2003 | | 2003 | | 2004 | | 2005 | | 2005 | |
| | (in millions) | |
Additional Deferred Compensation Recorded: | | | | | | | | | | | | | | | | | | | | | | | | | | | | | | | | | |
No contemporaneous documentation | | | $ 3.2 | | | $ 4.6 | | $ 17.4 | | $ 0.0 | | | $ — | | | $ 0.7 | | | $ 25.9 | | | | $ 0.0 | | | | $ 0.0 | | | | $ 25.9 | | |
Date selection/Indication of other date | | | — | | | — | | 5.2 | | 4.3 | | | 3.1 | | | 1.0 | | | 13.6 | | | | (0.2 | ) | | | (0.3 | ) | | | 13.1 | | |
Subsequent allocation | | | — | | | 1.2 | | 16.8 | | — | | | — | | | 5.8 | | | 23.8 | | | | — | | | | — | | | | 23.8 | | |
Start date issues | | | 0.2 | | | 4.3 | | 2.2 | | 0.1 | | | 0.3 | | | 0.4 | | | 7.5 | | | | 0.1 | | | | 0.4 | | | | 8.0 | | |
Other adjustments(a) | | | 0.1 | | | 2.8 | | 1.7 | | (1.3 | ) | | 0.1 | | | 0.3 | | | 3.7 | | | | 0.5 | | | | 0.0 | | | | 4.2 | | |
Subtotal | | | $ 3.5 | | | $ 12.9 | | $ 43.3 | | $ 3.1 | | | $ 3.5 | | | $ 8.2 | | | $ 74.5 | | | | $ 0.4 | | | | $ 0.1 | | | | $ 75.0 | | |
Unauthorized issuance of stock by administrator | | | $ — | | | $ — | | $ — | | $ — | | | $ 0.6 | | | $ 5.7 | | | $ 6.3 | | | | $ — | | | | $ — | | | | $ 6.3 | | |
Total | | | $ 3.5 | | | $ 12.9 | | $ 43.3 | | $ 3.1 | | | $ 4.1 | | | $ 13.9 | | | $ 80.8 | | | | $ 0.4 | | | | $ 0.1 | | | | $ 81.3 | | |
(a)Represents adjustments related to modifications that were made to employee stock options which included the extension of the post-service exercise period for vested stock options of terminated employees and the acceleration of vesting.
The following table summarizes the activity in additional deferred compensation as well as additional stock-based compensation expense and related tax adjustments on an annual basis. This table does not include previously-recorded activity in deferred compensation or stock-based compensation expense:
| | | | | | | | | | | | | | Cumulative | | | | | | Cumulative | |
| | | | | | | | | | | | | | Amount | | Years Ended | | Amount | |
| | Years Ended December 31, | | December 31, | | December 31, | | December 31, | |
| | 1998 | | 1999 | | 2000 | | 2001 | | 2002 | | 2003 | | 2003 | | 2004 | | 2005 | | 2005 | |
| | (in millions) | |
Activity in Deferred Compensation | | | | | | | | | | | | | | | | | | | | | | | | | | |
Deferred compensation
adjustment—beginning balance | | $ — | | $ 2.2 | | $ 10.2 | | $ 38.3 | | $ 7.0 | | $ 2.9 | | | $ — | | | $ 6.6 | | $ 3.2 | | | $ — | | | |
Additional deferred compensation recorded | | 3.5 | | 12.9 | | 43.3 | | 3.1 | | 3.5 | | 8.2 | | | 74.5 | | | 0.4 | | 0.1 | | | 75.0 | | | |
Additional stock-based
compensation expense amortization(a) | | (1.3 | ) | (4.4 | ) | (11.3 | ) | (26.6 | ) | (6.1 | ) | (3.7 | ) | | (53.4 | ) | | (2.2 | ) | (2.6 | ) | | (58.2 | ) | | |
Elimination due to employee terminations | | — | | (0.5 | ) | (3.9 | ) | (7.8 | ) | (1.5 | ) | (0.8 | ) | | (14.5 | ) | | (1.6 | ) | (0.7 | ) | | (16.8 | ) | | |
Additional deferred
compensation—ending balance | | $ 2.2 | | $ 10.2 | | $ 38.3 | | $ 7.0 | | $ 2.9 | | $ 6.6 | | | $ 6.6 | | | $ 3.2 | | $ (0.0 | ) | | $ (0.0 | ) | | |
Additional Stock-Based Compensation Expense and Related Tax Adjustments | | | | | | | | | | | | | | | | | | | | | | | | | | |
Additional stock-based
compensation expense | | $ 1.3 | | $ 4.4 | | $ 11.3 | | $ 26.6 | | $ 6.1 | | $ 3.7 | | | $ 53.4 | | | $ 2.2 | | $ 2.6 | | | 58.2 | | | |
Other tax adjustments(b) | | — | | 1.0 | | 10.3 | | 1.6 | | 0.9 | | (0.4 | ) | | 13.4 | | | (12.2 | ) | (0.6 | ) | | 0.6 | | | |
Additional operating expenses | | 1.3 | | 5.4 | | 21.6 | | 28.2 | | 7.0 | | 3.3 | | | 66.8 | | | (10.0 | ) | 2.0 | | | 58.8 | | | |
Income tax expense (benefit) | | (0.5 | ) | (1.6 | ) | (3.5 | ) | (7.3 | ) | 4.2 | | (1.5 | ) | | (10.2 | ) | | — | | — | | | (10.2 | ) | | |
Net adjustment | | $ 0.8 | | $ 3.8 | | $ 18.1 | | $ 20.9 | | $ 11.2 | | $ 1.8 | | | $ 56.6 | | | $ (10.0 | ) | $ 2.0 | | | $ 48.6 | | | |
(a)The increase in stock-based compensation expense in 2001 primarily reflects the cancellations from our Stock Option Cancel/Regrant Program in March 2001 which resulted in the remaining unamortized deferred compensation being expensed
upon cancellation. In addition, the remaining amount of deferred compensation totaling $0.1 million at December 31, 2005 was eliminated in accordance with the provisions of SFAS No. 123 (revised 2004), Share-Based Payment, or SFAS 123R, which we adopted effective January 1, 2006.
(b) Reflects the accrual of payroll related tax adjustments in 1999 through 2002, and a reduction of such accruals due to the expiration of statutory requirements in 2003 through 2005.
The following table summarizes the impact of the additional stock-based compensation expense resulting from the review of our equity award practices on our previously-reported stock-based compensation expense on an annual basis, excluding the impact of an additional $0.6 million and $5.7 million in 2002 and 2003, respectively, related to the theft of shares by the Company’s former stock administrator:
| | Stock-Based Compensation Expense | |
| | As Reported | | Adjustments | | As Restated | |
| | (in millions) | |
Year ended December 31, 2005 | | | $ 0.1 | | | | $ 2.6 | | | | $ 2.7 | | |
Year ended December 31, 2004 | | | 0.2 | | | | 2.2 | | | | 2.4 | | |
Year ended December 31, 2003 | | | 6.3 | | | | 3.7 | | | | 10.0 | | |
Year ended December 31, 2002 | | | — | | | | 6.1 | | | | 6.1 | | |
Year ended December 31, 2001 | | | — | | | | 26.6 | | | | 26.6 | | |
Year ended December 31, 2000 | | | — | | | | 11.3 | | | | 11.3 | | |
Year ended December 31, 1999 | | | — | | | | 4.4 | | | | 4.4 | | |
Year ended December 31, 1998 | | | — | | | | 1.3 | | | | 1.3 | | |
| | | $ 6.6 | | | | $ 58.2 | | | | $ 64.8 | | |
148
Impact of the Additional Stock-Based Compensation Expense-Related Adjustments on the Consolidated Financial Statements
The following table presents the impact of the additional stock-based compensation expense-related adjustments, the issuance of unauthorized common stock, as well as the result of the discontinuance of our international businesses on our previously reported consolidated statements of operations for the year ended December 2004 and 2005.
RECONCILIATION OF CONSOLIDATED BALANCE SHEET FOR DECEMBER 31, 2005
(in millions)
| | | | Adjustment for | | | | | | | |
| | | | International | | As Restated for | | Adjustment for | | | |
| | | | Discontinued | | Discontinued | | Stock Based | | | |
| | As Reported* | | Operations | | Operations | | Expenses | | As Restated | |
Assets | | | | | | | | | | | | | | | | | | | | | |
Current assets: | | | | | | | | | | | | | | | | | | | | | |
Cash and cash equivalents | | | $ | 12.9 | | | | $ | (5.2 | ) | | | $ | 7.7 | | | | $ — | | | | $ | 7.7 | | |
Accounts receivable, net | | | 109.6 | | | | (9.6 | ) | | | 100.0 | | | | — | | | | 100.0 | | |
Income taxes receivable | | | — | | | | — | | | | — | | | | — | | | | — | | |
Prepaid expenses | | | 2.3 | | | | 0.2 | | | | 2.5 | | | | — | | | | 2.5 | | |
Employee loans and advances | | | 0.4 | | | | (0.4 | ) | | | — | | | | — | | | | — | | |
Other current assets | | | 4.6 | | | | (1.6 | ) | | | 3.0 | | | | — | | | | 3.0 | | |
Current assets of discontinued operations | | | 46.7 | | | | 16.6 | | | | 63.3 | | | | — | | | | 63.3 | | |
Total current assets | | | 176.5 | | | | (1.9 | ) | | | 174.6 | | | | — | | | | 174.6 | | |
Property and equipment, net | | | 14.6 | | | | (1.7 | ) | | | 12.9 | | | | — | | | | 12.9 | | |
Goodwill | | | 119.9 | | | | — | | | | 119.9 | | | | — | | | | 119.9 | | |
Other intangibles, net | | | 7.4 | | | | — | | | | 7.4 | | | | — | | | | 7.4 | | |
Deferred tax assets | | | 18.9 | | | | (2.3 | ) | | | 16.6 | | | | — | | | | 16.6 | | |
Investments in unconsolidated affiliates | | | 2.1 | | | | — | | | | 2.1 | | | | — | | | | 2.1 | | |
Other assets | | | 0.9 | | | | — | | | | 0.9 | | | | — | | | | 0.9 | | |
Non current assets of discontinued operations | | | 1.7 | | | | 4.0 | | | | 5.7 | | | | — | | | | 5.7 | | |
Total assets | | | $ | 342.0 | | | | $ | — | | | | $ | 342.0 | | | | $ | — | | | | $ | 342.0 | | |
Liabilities and Stockholders’ Equity | | | | | | | | | | | | | | | | | | | | | |
Current liabilities: | | | | | | | | | | | | | | | | | | | | | |
Accounts payable | | | $ | 22.9 | | | | $ | (1.3 | ) | | | $ | 21.6 | | | | $ — | | | | $ | 21.6 | | |
Accounts payable—related party | | | 0.8 | | | | (0.8 | ) | | | — | | | | — | | | | — | | |
Accrued expenses | | | 18.0 | | | | (2.7 | ) | | | 15.3 | | | | 0.6 | | | | 15.9 | | |
Accrued compensation | | | 13.0 | | | | (1.8 | ) | | | 11.2 | | | | — | | | | 11.2 | | |
Billings in excess of costs on completed contracts | | | 4.3 | | | | (0.1 | ) | | | 4.2 | | | | — | | | | 4.2 | | |
Deferred tax liabilities | | | 6.6 | | | | (2.3 | ) | | | 4.3 | | | | — | | | | 4.3 | | |
Tax contingencies | | | 1.8 | | | | | | | | 1.8 | | | | — | | | | 1.8 | | |
Accrual for contingent acquisition consideration | | | 8.2 | | | | — | | | | 8.2 | | | | — | | | | 8.2 | | |
Accrual for unused office space | | | 0.5 | | | | — | | | | 0.5 | | | | — | | | | 0.5 | | |
Income taxes payable | | | 2.0 | | | | (1.9 | ) | | | 0.1 | | | | — | | | | 0.1 | | |
Capital lease obligations and other
short-term debt | | | 0.3 | | | | — | | | | 0.3 | | | | — | | | | 0.3 | | |
Current liabilities of discontinued
operations | | | 30.1 | | | | 10.9 | | | | 41.0 | | | | — | | | | 41.0 | | |
Total current liabilities | | | 108.5 | | | | — | | | | 108.5 | | | | 0.6 | | | | 109.1 | | |
Capital lease obligations and debt, net of current portion | | | 0.4 | | | | — | | | | 0.4 | | | | — | | | | 0.4 | | |
Accrual for unused office space, net of
current portion | | | 1.2 | | | | — | | | | 1.2 | | | | — | | | | 1.2 | | |
Other liabilities | | | 1.3 | | | | — | | | | 1.3 | | | | — | | | | 1.3 | | |
Other long term liabilities of discontinued
operations | | | 0.3 | | | | — | | | | 0.3 | | | | — | | | | 0.3 | | |
Total liabilities | | | 111.7 | | | | — | | | | 111.7 | | | | 0.6 | | | | 112.3 | | |
Stockholders’ equity: | | | | | | | | | | | | | | | | | | | | | |
Preferred stock | | | — | | | | — | | | | — | | | | — | | | | — | | |
Common stock | | | — | | | | — | | | | — | | | | — | | | | — | | |
Additional paid-in capital | | | 324.9 | | | | — | | | | 324.9 | | | | 54.4 | | | | 379.3 | | |
Deferred compensation | | | — | | | | — | | | | — | | | | (0.0 | ) | | | (0.0 | ) | |
Accumulated deficit | | | (91.7 | ) | | | — | | | | (91.7 | ) | | | (55.0 | ) | | | (146.7 | ) | |
Accumulated other comprehensive loss | | | (2.9 | ) | | | — | | | | (2.9 | ) | | | — | | | | (2.9 | ) | |
Total stockholders’ equity | | | 230.3 | | | | — | | | | 230.3 | | | | (0.6 | ) | | | 229.7 | | |
Total liabilities and stockholders’ equity | | | $ | 342.0 | | | | $ | — | | | | $ | 342.0 | | | | $ | — | | | | $ | 342.0 | | |
*Certain items in the balance sheet have been reclassified to conform to the current period presentation.
149
RECONCILIATION OF CONSOLIDATED STATEMENT OF OPERATIONS FOR 2005
(in millions, except per share data)
| | | | Adjustment for | | As Restated | | | | | |
| | | | International | | for | | Adjustment for | | | |
| | As | | Discontinued | | Discontinued | | Stock Based | | | |
| | Reported | | Operations | | Operations | | Expenses | | As Restated | |
Revenues | | | $ | 375.3 | | | | $ | 37.6 | | | | $ | 337.7 | | | | $ | — | | | | $ | 337.7 | | |
Cost of revenues | | | 291.0 | | | | 30.9 | | | | 260.1 | | | | 1.3 | | | | 261.4 | | |
Gross profit | | | 84.3 | | | | 6.7 | | | | 77.6 | | | | (1.3 | ) | | | 76.3 | | |
Selling, general and administrative expenses | | | 69.3 | | | | 8.6 | | | | 60.7 | | | | 0.8 | | | | 61.5 | | |
Contingent acquisition consideration | | | (2.1 | ) | | | — | | | | (2.1 | ) | | | — | | | | (2.1 | ) | |
Operating income (loss) | | | 17.1 | | | | (1.9 | ) | | | 19.0 | | | | (2.1 | ) | | | 16.9 | | |
Other income (expense): | | | | | | | | | | | | | | | | | | | | | |
Interest income, net | | | 0.1 | | | | — | | | | 0.1 | | | | — | | | | 0.1 | | |
Foreign currency gain (loss) | | | (0.4 | ) | | | (0.6 | ) | | | 0.2 | | | | | | | | 0.2 | | |
Total other income (expense) | | | (0.3 | ) | | | (0.6 | ) | | | 0.3 | | | | — | | | | 0.3 | | |
Income (loss) from continuing operations before income taxes | | | 16.8 | | | | (2.5 | ) | | | 19.3 | | | | (2.1 | ) | | | 17.2 | | |
Provision (benefit) for income taxes | | | 5.4 | | | | (0.5 | ) | | | 5.9 | | | | — | | | | 5.9 | | |
Income (loss) from continuing operations | | | 11.4 | | | | (2.0 | ) | | | 13.4 | | | | (2.1 | ) | | | 11.3 | | |
Income (loss) from discontinued operations | | | (7.7 | ) | | | 2.0 | | | | (9.7 | ) | | | 0 | | | | (9.7 | ) | |
Net income (loss) | | | $ | 3.7 | | | | $ | — | | | | $ | 3.7 | | | | $ | (2.1 | ) | | | $ | 1.6 | | |
Net income (loss) from continuing
operations | | | | | | | | | | | | | | | | | | | | | |
Basic | | | $ | 0.15 | | | | | | | | $ | 0.18 | | | | | | | | $ | 0.15 | | |
Diluted | | | $ | 0.15 | | | | | | | | $ | 0.18 | | | | | | | | $ | 0.15 | | |
Loss from discontinued operations | | | | | | | | | | | | | | | | | | | | | |
Basic | | | $ | (0.10 | ) | | | | | | | $ | (0.13 | ) | | | | | | | $ | (0.13 | ) | |
Diluted | | | $ | (0.10 | ) | | | | | | | $ | (0.13 | ) | | | | | | | $ | (0.13 | ) | |
Net income (loss), per share | | | | | | | | | | | | | | | | | | | | | |
Basic | | | $ | 0.05 | | | | | | | | $ | 0.05 | | | | | | | | $ | 0.02 | | |
Diluted | | | $ | 0.05 | | | | | | | | $ | 0.05 | | | | | | | | $ | 0.02 | | |
Weighted average common shares outstanding: | | | | | | | | | | | | | | | | | | | | | |
Basic | | | 74.0 | | | | | | | | 74.0 | | | | — | | | | 74.0 | | |
Diluted | | | 75.3 | | | | | | | | 75.3 | | | | (0.3 | ) | | | 75.0 | | |
The following table presents details of the total stock-based compenstion expense (excluding the impact of other tax and income tax adjustments) that is included in each functional line item in the consolidated statement of operations | |
Supplemental Data on Stock-Based
Compensation Expense | | | | | | | | | | | | | | | | | | | | | |
Cost of revenue | | | $ | — | | | | $ | — | | | | $ | — | | | | $ | 1.7 | | | | $ | 1.7 | | |
Selling, general and administrative | | | 0.1 | | | | | | | | 0.1 | | | | 1.0 | | | | 1.1 | | |
| | | 0.1 | | | | — | | | | 0.1 | | | | 2.7 | | | | 2.8 | | |
Discontinued operations | | | — | | | | — | | | | — | | | | 0.0 | | | | 0.0 | | |
Total | | | $ | 0.1 | | | | $ | — | | | | $ | 0.1 | | | | $ | 2.7 | | | | $ | 2.8 | | |
The following table presents details of the non-income tax payroll related expense (credit) that is included in each functional line item in the consolidated statement of operations:
Supplemental Data on Non-Income
Tax Payroll Expense | | | | | | | | | | | | | | | | | | | | | |
Cost of revenue | | | $ | — | | | | $ | — | | | | $ | — | | | | $ | (0.4 | ) | | | $ | (0.4 | ) | |
Selling, general and administrative | | | — | | | | — | | | | — | | | | (0.2 | ) | | | (0.2 | ) | |
| | | — | | | | — | | | | — | | | | (0.6 | ) | | | (0.6 | ) | |
Discontinued operations | | | — | | | | — | | | | — | | | | 0.0 | | | | 0.0 | | |
Total | | | $ | — | | | | $ | — | | | | $ | — | | | | $ | (0.6 | ) | | | $ | (0.6 | ) | |
150
RECONCILIATION OF CONSOLIDATED STATEMENT OF OPERATIONS FOR 2004
(in millions, except per share data)
| | | | Adjustment for | | | | | | | |
| | | | International | | As Restated for | | Adjustment for | | | |
| | | | Discontinued | | Discontinued | | Stock Based | | | |
| | As Reported | | Operations | | Operations | | Expenses | | As Restated | |
Revenues | | | $ | 334.2 | | | | $ | (38.0 | ) | | | $ | 296.2 | | | | $ | — | | | | $ | 296.2 | | |
Cost of revenues | | | 263.0 | | | | (30.2 | ) | | | 232.8 | | | | (6.0 | ) | | | 226.8 | | |
Gross profit | | | 71.2 | | | | (7.8 | ) | | | 63.4 | | | | 6.0 | | | | 69.4 | | |
Selling, general and administrative expenses | | | 59.2 | | | | (6.1 | ) | | | 53.1 | | | | (3.2 | ) | | | 49.9 | | |
Contingent acquisition consideration and restatement fees | | | 13.9 | | | | | | | | 13.9 | | | | — | | | | 13.9 | | |
Operating income (loss) | | | (1.9 | ) | | | (1.7 | ) | | | (3.6 | ) | | | 9.2 | | | | 5.6 | | |
Other income (expense): | | | | | | | | | | | | | | | | | | | | | |
Interest income (expense), net | | | 0.2 | | | | — | | | | 0.2 | | | | — | | | | 0.2 | | |
Foreign currency gain (loss) | | | 0.3 | | | | (0.4 | ) | | | (0.1 | ) | | | — | | | | (0.1 | ) | |
Impairment of investment in unconsolidated affiliate and other income (expenses), net | | | (2.9 | ) | | | — | | | | (2.9 | ) | | | — | | | | (2.9 | ) | |
Total other income (expense) | | | (2.4 | ) | | | (0.4 | ) | | | (2.8 | ) | | | — | | | | (2.8 | ) | |
Income (loss) from continuing operations income taxes | | | (4.3 | ) | | | (2.1 | ) | | | (6.4 | ) | | | 9.2 | | | | 2.8 | | |
Provision (benefit) for income taxes | | | 0.1 | | | | (0.7 | ) | | | (0.6 | ) | | | — | | | | (0.6 | ) | |
Income (loss) from continuing operations | | | (4.4 | ) | | | (1.4 | ) | | | (5.8 | ) | | | 9.2 | | | | 3.4 | | |
Income (loss) from discontinued operations | | | 9.4 | | | | 1.4 | | | | 10.8 | | | | 0.8 | | | | 11.6 | | |
Net income (loss) | | | $ | 5.0 | | | | $ | (0.0 | ) | | | $ | 5.0 | | | | $ | 10.0 | | | | $ | 15.0 | | |
Net income (loss) from continuing operations | | | | | | | | | | | | | | | | | | | | | |
Basic | | | (0.07 | ) | | | | | | | (0.09 | ) | | | | | | | $ | 0.05 | | |
Diluted | | | (0.07 | ) | | | | | | | (0.09 | ) | | | | | | | $ | 0.05 | | |
Loss from discontinued operations | | | | | | | | | | | | | | | | | | | | | |
Basic | | | 0.14 | | | | | | | | 0.16 | | | | | | | | $ | 0.16 | | |
Diluted | | | 0.14 | | | | | | | | 0.16 | | | | | | | | $ | 0.15 | | |
Net income (loss), per share | | | | | | | | | | | | | | | | | | | | | |
Basic | | | 0.07 | | | | | | | | 0.07 | | | | | | | | $ | 0.21 | | |
Diluted | | | 0.07 | | | | | | | | 0.07 | | | | | | | | $ | 0.20 | | |
Weighted average common shares outstanding: | | | | | | | | | | | | | | | | | | | | | |
Basic | | | 67.7 | | | | | | | | 67.7 | | | | | | | | 72.8 | | |
Diluted | | | 67.7 | | | | | | | | 67.7 | | | | | | | | 75.3 | | |
The following table presents details of the total stock-based compensation expense (excluding the impact of other tax and income tax adjustments) that is included in each functional line item in the consolidated statement of operations
Supplemental Data on Stock-Based
Compensation Expense | | | | | | | | | | | | | | | | | | | | | |
Cost of revenue | | | $ | — | | | | $ | — | | | | $ | — | | | | $ | 1.5 | | | | $ | 1.5 | | |
Selling, general and administrative | | | 0.2 | | | | | | | | 0.2 | | | | 0.7 | | | | 0.9 | | |
| | | 0.2 | | | | — | | | | 0.2 | | | | 2.2 | | | | 2.4 | | |
Discontinued operations | | | — | | | | — | | | | — | | | | 0.0 | | | | 0.0 | | |
Total | | | $ | 0.2 | | | | $ | — | | | | $ | 0.2 | | | | $ | 2.2 | | | | $ | 2.4 | | |
The following table presents details of the non-income tax payroll related expense (credit) that is included in each functional line item in the consolidated statement of operations:
Supplemental Data on Non-Income
Tax Payroll Expense | | | | | | | | | | | | | | | | | | | | | |
Cost of revenue | | | $ | — | | | | $ | — | | | | $ | — | | | | $ | (7.5 | ) | | | $ | (7.5 | ) | |
Selling, general and administrative | | | — | | | | — | | | | — | | | | (3.9 | ) | | | (3.9 | ) | |
| | | — | | | | — | | | | — | | | | (11.4 | ) | | | (11.4 | ) | |
Discontinued operations | | | — | | | | — | | | | — | | | | (0.8 | ) | | | (0.8 | ) | |
Total | | | $ | — | | | | $ | — | | | | $ | — | | | | $ | (12.2 | ) | | | $ | (12.2 | ) | |
RECONCILIATION OF CONSOLIDATED STATEMENT OF CASH FLOWS
Year ended December 31, 2005
(in millions)
| | | | Adjustment for | | | | | | | |
| | | | International | | As Restated for | | Adjustment for | | | |
| | | | Discontinued | | Discontinued | | Stock Based | | | |
| | As Reported | | Operations | | Operations | | Expenses | | As Restated | |
Operating Activities: | | | | | | | | | | | | | | | | | | | | | |
Net income (loss) | | | $ | 3.7 | | | | $ | — | | | | $ | 3.7 | | | | $ | (2.1 | ) | | | $ | 1.6 | | |
Less: income (loss) from discontinued operations | | | (7.7 | ) | | | (2.0 | ) | | | (9.7 | ) | | | — | | | | (9.7 | ) | |
Income (loss) from continuing operations | | | 11.4 | | | | 2.0 | | | | 13.4 | | | | (2.1 | ) | | | 11.3 | | |
Adjustments to reconcile net income (loss) from continuing operations to net cash provided by continuing operations: | | | | | | | | | | | | | | | | | | | | | |
Depreciation and amortization | | | 8.0 | | | | (1.3 | ) | | | 6.7 | | | | — | | | | 6.7 | | |
Deferred income taxes | | | 5.5 | | | | 0.1 | | | | 5.6 | | | | — | | | | 5.6 | | |
Asset impairment charges and net (gain) loss on disposition of fixed assets | | | 0.7 | | | | (0.6 | ) | | | 0.1 | | | | — | | | | 0.1 | | |
Provision (credit) for doubtful accounts | | | 0.5 | | | | — | | | | 0.5 | | | | — | | | | 0.5 | | |
Stock based compensation | | | 0.1 | | | | — | | | | 0.1 | | | | 2.7 | | | | 2.8 | | |
Changes in assets and liabilities, net of acquisitions: | | | | | | | | | | | | | | | | | | | | | |
Accounts receivable | | | (2.9 | ) | | | (6.6 | ) | | | (9.5 | ) | | | — | | | | (9.5 | ) | |
Prepaid expenses | | | 0.9 | | | | — | | | | 0.9 | | | | — | | | | 0.9 | | |
Other assets | | | (2.3 | ) | | | 0.2 | | | | (2.1 | ) | | | — | | | | (2.1 | ) | |
Accounts payable | | | (4.9 | ) | | | 1.3 | | | | (3.6 | ) | | | — | | | | (3.6 | ) | |
Accrued expenses | | | 9.6 | | | | (0.7 | ) | | | 8.9 | | | | (0.6 | ) | | | 8.3 | | |
Accrued compensation | | | — | | | | 0.7 | | | | 0.7 | | | | — | | | | 0.7 | | |
Tax contingencies | | | 0.4 | | | | (0.5 | ) | | | (0.1 | ) | | | — | | | | (0.1 | ) | |
Accrual for contingent acquisition consideration | | | (2.1 | ) | | | — | | | | (2.1 | ) | | | — | | | | (2.1 | ) | |
Billings in excess of cost on completed contracts | | | (3.3 | ) | | | (0.1 | ) | | | (3.4 | ) | | | — | | | | (3.4 | ) | |
Accrual for unused office space | | | (0.9 | ) | | | — | | | | (0.9 | ) | | | — | | | | (0.9 | ) | |
Income tax payable | | | (1.5 | ) | | | 0.4 | | | | (1.1 | ) | | | — | | | | (1.1 | ) | |
Other liabilities | | | (0.1 | ) | | | 0.2 | | | | 0.1 | | | | — | | | | 0.1 | | |
Net cash provided by (used in) continuing operations | | | 19.1 | | | | (4.9 | ) | | | 14.2 | | | | 0.0 | | | | 14.2 | | |
Investing activities: | | | | | | | | | | | | | | | | | | | | | |
Sale/Maturity of short term investments | | | 7.6 | | | | — | | | | 7.6 | | | | — | | | | 7.6 | | |
Cash paid for contingent acquisition consideration | | | (17.1 | ) | | | — | | | | (17.1 | ) | | | — | | | | (17.1 | ) | |
Cash paid for acquisition, net of cash acquired | | | (33.6 | ) | | | — | | | | (33.6 | ) | | | — | | | | (33.6 | ) | |
Capital expenditures | | | (8.0 | ) | | | 1.1 | | | | (6.9 | ) | | | — | | | | (6.9 | ) | |
Net cash used in investing activities from continuing operations | | | (51.1 | ) | | | 1.1 | | | | (50.0 | ) | | | — | | | | (50.0 | ) | |
Financing activities: | | | | | | | | | | | | | | | | | | | | | |
Proceeds from issuance of common stock | | | 2.6 | | | | — | | | | 2.6 | | | | — | | | | 2.6 | | |
Proceeds from issuance of common stock under employee stock purchase plan | | | 2.4 | | | | (0.1 | ) | | | 2.3 | | | | — | | | | 2.3 | | |
Repayment of capital lease obligations | | | (0.4 | ) | | | — | | | | (0.4 | ) | | | — | | | | (0.4 | ) | |
Net cash provided by financing activities from continuing operations | | | 4.6 | | | | (0.1 | ) | | | 4.5 | | | | — | | | | 4.5 | | |
Net cash flows of continuing operations | | | (27.4 | ) | | | (3.9 | ) | | | (31.3 | ) | | | 0.0 | | | | (31.3 | ) | |
Cash flows of discontinued operations (Revised—see Note 1(s)) | | | | | | | | | | | | | | | | | | | | | |
Operating Cash Flows | | | (11.8 | ) | | | 1.6 | | | | (10.2 | ) | | | — | | | | (10.2 | ) | |
Investing Cash Flows | | | (1.0 | ) | | | (1.2 | ) | | | (2.2 | ) | | | — | | | | (2.2 | ) | |
Effect of exchange rates on cash and cash equivalents | | | 1.1 | | | | (0.1 | ) | | | 1.0 | | | | — | | | | 1.0 | | |
Net cash flows of discontinued operations | | | (11.7 | ) | | | 0.3 | | | | (11.4 | ) | | | — | | | | (11.4 | ) | |
Net decrease in cash and cash equivalents | | | (39.1 | ) | | | (3.6 | ) | | | (42.7 | ) | | | 0.0 | | | | (42.7 | ) | |
Cash and cash equivalents at beginning of year | | | 52.0 | | | | (1.6 | ) | | | 50.4 | | | | — | | | | 50.4 | | |
Cash and cash equivalents at end of year | | | $ | 12.9 | | | | $ | (5.2 | ) | | | $ | 7.7 | | | | $ | — | | | | $ | 7.7 | | |
RECONCILIATION OF CONSOLIDATED STATEMENT OF CASH FLOWS
Year ended December 31, 2004
(in millions)
| | | | Adjustment for | | | | | | | |
| | | | International | | As Restated for | | Adjustment for | | | |
| | | | Discontinued | | Discontinued | | Stock Based | | | |
| | As Reported | | Operations | | Operations | | Expenses | | As Restated | |
Operating Activities: | | | | | | | | | | | | | | | | | | | | | |
Net income (loss) | | | $ | 5.0 | | | | $ | — | | | | $ | 5.0 | | | | $ | 10.0 | | | | $ | 15.0 | | |
Less: income (loss) from discontinued operations | | | 9.4 | | | | 1.4 | | | | 10.8 | | | | 0.8 | | | | 11.6 | | |
Income (loss) from continuing operations | | | (4.4 | ) | | | (1.4 | ) | | | (5.8 | ) | | | 9.2 | | | | 3.4 | | |
Adjustments to reconcile net income (loss) from continuing operations to net cash provided by continuing operations: | | | | | | | | | | | | | | | | | | | | | |
Depreciation and amortization | | | 7.2 | | | | (0.7 | ) | | | 6.5 | | | | — | | | | 6.5 | | |
Deferred income taxes | | | (1.4 | ) | | | (0.1 | ) | | | (1.5 | ) | | | — | | | | (1.5 | ) | |
Asset impairment charges and net (gain) loss on disposition of fixed assets | | | 0.2 | | | | (0.2 | ) | | | — | | | | — | | | | — | | |
Equity loss in unconsolidated affiliates | | | 3.1 | | | | — | | | | 3.1 | | | | — | | | | 3.1 | | |
Tax benefit from stock options | | | (0.7 | ) | | | — | | | | (0.7 | ) | | | — | | | | (0.7 | ) | |
Provision (credit) for doubtful accounts | | | (0.7 | ) | | | — | | | | (0.7 | ) | | | — | | | | (0.7 | ) | |
Stock based compensation | | | 0.2 | | | | — | | | | 0.2 | | | | 2.2 | | | | 2.4 | | |
Changes in assets and liabilities, net of acquisitions: | | | | | | | | | | | | | | | | | | | | | |
Accounts receivable | | | (21.2 | ) | | | 5.4 | | | | (15.8 | ) | | | — | | | | (15.8 | ) | |
Prepaid expenses | | | (0.6 | ) | | | (0.1 | ) | | | (0.7 | ) | | | — | | | | (0.7 | ) | |
Other assets | | | (0.5 | ) | | | 0.9 | | | | 0.4 | | | | — | | | | 0.4 | | |
Accounts payable | | | 14.4 | | | | (0.8 | ) | | | 13.6 | | | | — | | | | 13.6 | | |
Accrued expenses | | | (7.4 | ) | | | 0.1 | | | | (7.3 | ) | | | (11.4 | ) | | | (18.7 | ) | |
Accrued compensation | | | — | | | | (0.1 | ) | | | (0.1 | ) | | | — | | | | (0.1 | ) | |
Tax contingencies | | | (1.2 | ) | | | (0.2 | ) | | | (1.4 | ) | | | — | | | | (1.4 | ) | |
Accrual for contingent acquisition consideration | | | 14.4 | | | | — | | | | 14.4 | | | | — | | | | 14.4 | | |
Billings in excess of cost on completed contracts | | | (1.0 | ) | | | 0.2 | | | | (0.8 | ) | | | — | | | | (0.8 | ) | |
Accrual for unused office space | | | (1.0 | ) | | | — | | | | (1.0 | ) | | | — | | | | (1.0 | ) | |
Income tax payable | | | 2.1 | | | | (1.2 | ) | | | 0.9 | | | | — | | | | 0.9 | | |
Other liabilities | | | (0.2 | ) | | | — | | | | (0.2 | ) | | | — | | | | (0.2 | ) | |
Net cash provided by (used in) continuing operations | | | 1.3 | | | | 1.8 | | | | 3.1 | | | | (0.0 | ) | | | 3.1 | | |
Investing activities: | | | | | | | | | | | | | | | | | | | | | |
Sale/Maturity of short term investments | | | 27.5 | | | | — | | | | 27.5 | | | | — | | | | 27.5 | | |
Cash paid for contingent acquisition consideration | | | (8.3 | ) | | | — | | | | (8.3 | ) | | | — | | | | (8.3 | ) | |
Cash paid for acquisition, net of cash acquired | | | (53.9 | ) | | | — | | | | (53.9 | ) | | | — | | | | (53.9 | ) | |
Proceeds from the disposition of discontinued operations | | | — | | | | — | | | | — | | | | — | | | | — | | |
Cash transferred to restricted cash | | | — | | | | — | | | | — | | | | — | | | | — | | |
Investment in unconsolidated subsidiary | | | (1.0 | ) | | | — | | | | (1.0 | ) | | | — | | | | (1.0 | ) | |
Capital expenditures | | | (7.7 | ) | | | 2.7 | | | | (5.0 | ) | | | — | | | | (5.0 | ) | |
Net cash used in investing activities from continuing operations | | | (43.4 | ) | | | 2.7 | | | | (40.7 | ) | | | — | | | | (40.7 | ) | |
Financing activities: | | | | | | | | | | | | | | | | | | | | | |
Proceeds from issuance of common stock | | | 7.3 | | | | — | | | | 7.3 | | | | — | | | | 7.3 | | |
Proceeds from issuance of common stock under employee stock purchase plan | | | 3.4 | | | | — | | | | 3.4 | | | | — | | | | 3.4 | | |
Repayment of capital lease obligations | | | (0.5 | ) | | | — | | | | (0.5 | ) | | | — | | | | (0.5 | ) | |
Net cash provided by financing activities from continuing operations | | | 10.2 | | | | — | | | | 10.2 | | | | — | | | | 10.2 | | |
Net cash flows of continuing operations | | | (31.9 | ) | | | 4.5 | | | | (27.4 | ) | | | (0.0 | ) | | | (27.4 | ) | |
Cash flows of discontinued operations (Revised—see Note 1(s)) | | | | | | | | | | | | | | | | | | | | | |
Operating Cash Flows | | | 7.4 | | | | (2.4 | ) | | | 5.0 | | | | — | | | | 5.0 | | |
Investing Cash Flows | | | (0.2 | ) | | | (2.7 | ) | | | (2.9 | ) | | | — | | | | (2.9 | ) | |
Effect of exchange rates on cash and cash equivalents | | | (0.1 | ) | | | — | | | | (0.1 | ) | | | — | | | | (0.1 | ) | |
Net cash flows of discontinued operations | | | 7.1 | | | | (5.1 | ) | | | 2.0 | | | | — | | | | 2.0 | | |
Net decrease in cash and cash equivalents | | | (24.8 | ) | | | (0.6 | ) | | | (25.4 | ) | | | (0.0 | ) | | | (25.4 | ) | |
Cash and cash equivalents at beginning of year | | | 76.8 | | | | (1.0 | ) | | | 75.8 | | | | — | | | | 75.8 | | |
Cash and cash equivalents at end of year | | | $ | 52.0 | | | | $ | (1.6 | ) | | | $ | 50.4 | | | | $ | — | | | | $ | 50.4 | | |
153
Note 3. Goodwill and Other Intangible Assets
The following tables set forth information for finite-lived intangible assets subject to amortization (in millions):
| | As of December 31, 2005 | | As of December 31, 2006 | |
| | Gross
Value | | Accumulated
Amortization | | Net
Value | | Gross
Value | | Accumulated
Amortization | | Net
Value | |
Acquired finite-lived intangible assets | | | | | | | | | | | | | | | | | | | |
Customer relationships | | $ | 3.4 | | | $ | (0.9 | ) | | | $ | 2.5 | | | $ | 10.0 | | | $ | (1.6 | ) | | $ | 8.4 | |
Contracts and Backlog | | 6.0 | | | (1.8 | ) | | | 4.2 | | | 7.5 | | | (2.8 | ) | | 4.7 | |
Non-compete agreements | | 1.3 | | | (0.7 | ) | | | 0.6 | | | 1.3 | | | (1.1 | ) | | 0.2 | |
Trade names | | 0.4 | | | (0.3 | ) | | | 0.1 | | | 0.4 | | | (0.3 | ) | | 0.1 | |
Total | | $ | 11.1 | | | $ | (3.7 | ) | | | $ | 7.4 | | | $ | 19.2 | | | $ | (5.8 | ) | | $ | 13.4 | |
Aggregate amortization expense | | $ | 1.7 | | | | | | | | | | $ | 2.1 | | | | | | | |
| | As of December 31, 2006
| | As of December 31, 2007
|
|---|
| | Gross Value
| | Accumulated Amortization
| | Net Value
| | Gross Value
| | Accumulated Amortization
| | Net Value
|
|---|
| Acquired finite-lived intangible assets | | | | | | | | | | | | | | | | | | |
| | Customer relationships | | $ | 9.9 | | $ | (1.5 | ) | $ | 8.4 | | $ | 15.0 | | $ | (2.6 | ) | $ | 12.4 |
| | Contracts and Backlog | | | 7.5 | | | (2.8 | ) | | 4.7 | | | 11.6 | | | (4.2 | ) | | 7.4 |
| | Non-compete agreements | | | 1.3 | | | (1.1 | ) | | 0.2 | | | 1.3 | | | (1.3 | ) | | 0.0 |
| | Trade names | | | 0.4 | | | (0.3 | ) | | 0.1 | | | 0.4 | | | (0.4 | ) | | 0.0 |
| | |
| |
| |
| |
| |
| |
|
| | | Total | | $ | 19.1 | | $ | (5.7 | ) | $ | 13.4 | | $ | 28.3 | | $ | (8.5 | ) | $ | 19.8 |
| | |
| |
| |
| |
| |
| |
|
KRATOS DEFENSE & SECURITY SOLUTIONS, INC.
Notes to Consolidated Financial Statements (Continued)
Years ended December 31, 2005, 2006 and 2007
Note 3. Goodwill and Other Intangible Assets (Continued)
The aggregate amortization expense for finite-lived intangible assets was $1.7 million, $2.1 million and $2.8 million for the years ended December 31, 2005, 2006, and 2007, respectively.
The increase in finite-lived intangibles in 2006 is related to the acquisition of Madison Research Corporation. Refer to the schedule below and to Note 56 of the Consolidated Financial Statements.Statements (in millions, except amortization period).
| | As of December 31, 2006 | |
| | Gross
Value | | Accumulated
Amortization | | Net
Value | | Weighted
Average
Amortization
Period (years) | |
Acquired Intangible Assets | | | | | | | | | | | | | | | | | |
Customer relationships | | | $ | 6.5 | | | | $ | (0.2 | ) | | | $ | 6.3 | | | | 10.0 | | |
Contracts and Backlog | | | 1.6 | | | | (0.2 | ) | | | 1.4 | | | | 2.8 | | |
Total | | | $ | 8.1 | | | | $ | (0.4 | ) | | | $ | 7.7 | | | | 8.6 | | |
| | As of December 31, 2006
|
|---|
| | Gross Value
| | Accumulated Amortization
| | Net Value
| | Weighted Average Amortization
Period (years)
|
|---|
| Acquired Intangible Assets | | | | | | | | | | | |
| | Customer relationships | | $ | 6.5 | | $ | (0.2 | ) | $ | 6.3 | | 10.0 |
| | Contracts and Backlog | | | 1.6 | | | (0.2 | ) | | 1.4 | | 2.8 |
| | |
| |
| |
| |
|
| | | Total | | $ | 8.1 | | $ | (0.4 | ) | $ | 7.7 | | 8.6 |
| | |
| |
| |
| |
|
The increase in finite-lived intangibles in 2007 is related to the acquisition of Haverstick Consulting, Inc (Haverstick). Refer to the schedule below and to Note 6 of the Consolidated Financial Statements (in millions, except amortization period).
| | As of December 31, 2007
|
|---|
| | Gross Value
| | Accumulated Amortization
| | Net Value
| | Weighted Average Amortization
Period (years)
|
|---|
| Acquired Intangible Assets | | | | | | | | | | | |
| | Customer relationships | | $ | 5.1 | | $ | — | | $ | 5.1 | | 9.0 |
| | Contracts and Backlog | | | 4.2 | | | — | | | 4.2 | | 3.3 |
| | |
| |
| |
| |
|
| | | Total | | $ | 9.3 | | $ | — | | $ | 9.3 | | 6.5 |
| | |
| |
| |
| |
|
There is no amortization in 2007 since Haverstick was acquired on December 31, 2007.
Information about estimated amortization expense for intangible assets subject to amortization for the five years succeeding December 31, 2006,2007, is as follows (in millions):
| | Amortization
Expense | | | Amortization Expense
|
|---|
2007 | | | $ | 2.8 | | | |
2008 | | | 2.1 | | | | $ | 4.5 |
2009 | | | 1.7 | | | | 3.1 |
2010 | | | 1.1 | | | | 2.6 |
2011 | | | 1.0 | | | | 2.4 |
| 2012 | | | 1.7 |
KRATOS DEFENSE & SECURITY SOLUTIONS, INC.
Notes to Consolidated Financial Statements (Continued)
Years ended December 31, 2005, 2006 and 2007
Note 3. Goodwill and Other Intangible Assets (Continued)
The changes in the carrying amounts of goodwill by operating segment for the yearyears ended December 31, 20052006 and 2006,2007, are as follows (in millions):
| | Wireless
Network
Services | | Enterprise
Network
Services | | Government
Network
Services | | Total | |
Balance as of December 31, 2004 | | | $ | 25.5 | | | | $ | 11.2 | | | | $ | 45.9 | | | $ | 82.6 | |
Acquisitions | | | — | | | | — | | | | 29.4 | | | 29.4 | |
Adjustments | | | — | | | | 0.2 | | | | (0.6 | ) | | (0.4 | ) |
Earn-out consideration | | | — | | | | 6.9 | | | | 1.4 | | | 8.3 | |
Balance as of December 31, 2005 | | | 25.5 | | | | 18.3 | | | | 76.1 | | | 119.9 | |
Acquisitions/Purchase Accounting | | | — | | | | — | | | | 53.8 | | | 53.8 | |
Impairments | | | — | | | | (18.3 | ) | | | — | | | (18.3 | ) |
Balance as of December 31, 2006 | | | $ | 25.5 | | | | $ | — | | | | $ | 129.9 | | | $ | 155.4 | |
| | Public Safety & Security
| | Government Solutions
| | Total
| |
|---|
| Balance as of December 31, 2004 | | $ | 11.2 | | $ | 45.9 | | $ | 57.1 | |
| | Acquisitions and purchase accounting adjustments | | | 0.2 | | | 28.8 | | | 29.0 | |
| | Earn-out consideration | | | 6.9 | | | 1.4 | | | 8.3 | |
| | |
| |
| |
| |
| Balance as of December 31, 2005 | | $ | 18.3 | | $ | 76.1 | | $ | 94.4 | |
| | Acquisitions | | | — | | | 53.8 | | | 53.8 | |
| | Impairments | | | (18.3 | ) | | — | | | (18.3 | ) |
| | |
| |
| |
| |
| Balance as of December 31, 2006 | | $ | — | | $ | 129.9 | | $ | 129.9 | |
| | Acquisitions and purchase accounting adjustments | | | — | | | 64.6 | | | 64.6 | |
| | |
| |
| |
| |
| Balance as of December 31, 2007 | | $ | — | | $ | 194.5 | | $ | 194.5 | |
| | |
| |
| |
| |
We test The Company tests goodwill for impairment annually during the fourth quarter of each fiscal year at the reporting unit level using a fair value approach, in accordance with the provisions of SFAS No. 142,Goodwill and Other Intangible Assets. OurIn 2007, the annual testing resultedtest did not result in no impairments of goodwill in fiscal year 2005.
any impairment charge. In 2006, the annual test resulted in a non-cash impairment charge of $18.3 million in the Enterprise Network ServicesPSS segment. This was due in part to changes in the industry and the strategic focus of the Company as well as operational challenges from significant employee turnover that we encountered after the completion of the earn-out periods. The fair value of goodwill was estimated by taking into consideration recent performance and expected future performance and using a combination of a discounted cash flow model and a market approach model which takes into consideration comparable businesses and market transactions. We also concluded based upon this analysis the intangible assets for ENS were not impaired.
If an event occurs or circumstances change that would more likely than not reduce the fair value of a reporting unit below its carrying value, goodwill will be evaluated for impairment between annual tests.
Note 4. Discontinued Operations
(a) EMEA Operations
During the second quarter of 2004, the Company made the decision to sell or otherwise divest its Network Management business in Scandinavia—a part of our EMEA operations which had been reported in its Wireless Network Services segment. WFI determined that this entity met the criteria to classify it as held for sale. Accordingly, WFI has reflected this operation as discontinued in accordance with SFAS No. 144, “Accounting for the Impairment or Disposal of Long-Lived Assets.” After actively marketing to sell this business for one quarter, the Company made the decision to wind-down this operation in the third quarter of 2004. As of December 31, 2004 operations had been substantially wound-down. All prior period amounts have been restated to reflect these operations as discontinued.
On December 28, 2006, the Board of Directors of the Company approved a plan to divest portions of the Company’s business where critical mass has not been achieved. This plan included the divestiture of all of the Company’s remaining EMEA operations. Accordingly, WFI has reflected this operation as discontinued in accordance with SFAS No. 144, “Accounting for the Impairment or Disposal of Long-Lived Assets.” On March 9, 2007, the Company signed a Definitive Agreement with LCC International (LCCI) to sell WFI’s EMEA operations in a cash for stock transaction valued at $4 million.
Revenue generated by these operations was $34.8 million, $27.1 million and $17.0 million for 2004, 2005 and 2006 respectively. Net income (loss) in these operations were $1.6 million, $1.1 million, and
$(3.2) million and income tax expense (benefit) was $(0.5) million, $0.0 million and $0.1 million for 2004, 2005 and 2006 respectively.
(b) Latin American Operations
In December 2005, the Company’s Board of Directors made the decision to exit the Company’s Mexican operations and certain of its other deployment businesses in South America. Prior to this decision, these operations had been reported in its Wireless Network Services segment. The Company determined that these operations meet the criteria to be classified as held for sale. Accordingly, WFI has reflected these operations as discontinued in accordance with SFAS No. 144, “Accounting for the Impairment or Disposal of Long-Lived Assets.” The South American operations were substantially shut down as of the end of December 2005. On February 17, 2006, the Company entered into a definitive agreement to divest all of ourits operations in Mexico for total approximate cash consideration of $18.0 million, which approximatesapproximated the net book value of the operations, including $13.2 million of liabilities associated with a loss contingency. The transaction closed on March 10, 2006. The transaction was structured as a sale of our subsidiaries in Mexico, and the purchase price consisted of $1.5 million in cash paid on February 17, 2006, plus a secured promissory note payable in installments through December 31, 2006. The note was fully paidsecured by pledges of assets and a personal guaranty.
KRATOS DEFENSE & SECURITY SOLUTIONS, INC.
Notes to Consolidated Financial Statements (Continued)
Years ended December 31, 2005, 2006 and 2007
Note 4. Discontinued Operations (Continued)
The final closing balance sheet as of February 17, 2006 resulted in net asset adjustments aggregating to a total approximate $18.9 million consideration, $1.5 million which was paid on February 17, 2006, with the endremaining $17.4 million payable by means of the promissory note in installments through December 31, 2006 with an interest rate of 7.5% per annum. The remaining note receivable balance was paid in December 2006. Total cash consideration of $18.9 million was collected related to this transaction. All prior periodNo amounts have been restated to reflect these operations as discontinued.remain outstanding on the note receivable.
(b) South American Operations
On December 28, 2006, the Board of Directors of the Company approved a plan to divest portions of the Company’sCompany's business where critical mass hashad not been achieved. This plan involvesinvolved the divestiture of the Company’sCompany's EMEA (Europe, Middle East and Asia) operations and its remaining South American operations. The Company determined that these operations met the criteria to be classified as held for sale. Accordingly, WFI hasthese operations were reflected this operation as discontinued in accordance with SFAS No. 144, “Accounting"Accounting for the Impairment or Disposal of Long-Lived Assets.” Assets" in the accompanying consolidated financial statements commencing as of and for the year ended December 31, 2006.
The EMEA operations were sold to LCC International, Inc. (LCC) on March 9, 2007 for $4.0 million in cash, $3.3 million of which was received on that date. We also received approximately $1.8 million from our EMEA operations, prior and subsequent to the closing date as payment on outstanding intercompany debt. The balance of the $0.7 million sales price is being withheld as security for the satisfaction of certain indemnification obligations and is payable on a date that is the earlier of March 31, 2008 or the date that the buyer files its 10-K for the fiscal year ended December 31, 2007. The sale of EMEA generated a gain on disposition of $3.3 million. In the fourth quarter of 2007, the Company recorded an impairment chargea reserve of approximately $5.2$0.7 million on the remaining sales price holdback based on the Company's assessment of LCC's available liquidity and ability to reducepay following the carrying valueCompany's review of LCC's most recently file financial statements, thereby reducing the South American operationsnet estimated gain on this transaction to their estimated fair value based upon current indications of interest.$2.6 million.
On April 20, 2007, the Company entered into an Equity Purchase Agreement to sell all of the issued and outstanding equity of its interests of its wholly owned subsidiary WFI de Brazil Techlogia en Telecomunicaciones LTDA, to Strategic Project Services, LLC (SPS). The consideration included the assumption of substantially all outstanding liabilities of WFI Brazil, nominal cash consideration, and additional earn-out consideration based on 25 percent of net receivables collected subsequent to the closing date. The Company doesrecorded an impairment charge of approximately $5.2 million as of December 31, 2006 to reduce the current carrying value of the Brazil operations to their estimated fair value based upon current indications of interest. In the second quarter of 2007, when this business was sold, a gain on disposition of $0.2 million was recorded primarily due to lower than expected selling costs.
On May 29, 2007, the Company entered into an Asset Purchase Agreement with LCC pursuant to which the Company agreed to sell to LCC all of the assets used in the conduct of the operation of the Company's Wireless Network Services business segment that provides engineering services to the non-government wireless communications industry in the United States.
The transaction was completed on June 4, 2007. The aggregate consideration paid by LCC in connection with the Acquisition was $46 million. LCC delivered a subordinated promissory note for the principal amount of $21.6 million (the "Subordinated Promissory Note"), paid $17 million at closing and paid final working capital adjustments of $2.4 million through an amendment to the Subordinated
KRATOS DEFENSE & SECURITY SOLUTIONS, INC.
Notes to Consolidated Financial Statements (Continued)
Years ended December 31, 2005, 2006 and 2007
Note 4. Discontinued Operations (Continued)
Promissory Note, and the Company has retained an estimated $5.0 million in net working capital of the business.
On July 5, 2007, the Company announced that it had sold the $21.6 million Subordinated Promissory Note in a transaction arranged by KeyBanc Capital Markets ("KeyBanc"). The Company received approximately $19.6 million in net cash proceeds, reflecting a discount from par value of less than five percent and aggregate transaction fees of approximately $1 million, which includes a $0.75 million fee to KeyBanc, an affiliate of the Company's lender. The note was acquired by a fund affiliated with Silver Point Capital, L.P. ("Silver Point"). The Company did not currently anticipateprovide any guaranty for LCC's payment obligations. Certain post closing adjustments that, under the terms of the sale of the U.S. wireless engineering business were expected to be made to the principal amount of the Note, may instead be made by payments between Kratos and LCC, or between Silver Point and the Company, as applicable.
On August 10, 2007, in accordance with the terms of the acquisition agreement, the Company provided the closing balance sheet working capital calculation, which indicated a $2.6 million working capital adjustment was due to the Company as an increase to the balance of the Subordinated Promissory Note. LCC had thirty days to review the calculation and notify the Company of any dispute. The Company and LCC agreed to a final working capital calculation of $2.4 million. The Company collected $2.3 million in January 2008, net of a $0.1 million discount from Silver Point in accordance with the terms of the note agreement. The net amount is presented as part of notes receivable in the consolidated balance sheet as of December 31, 2007.
On July 7, 2007, the Company entered into a definitive agreement with an affiliate of Platinum Equity to sell the Company's wireless deployment business. Platinum Equity is a Los Angeles based private equity firm whose portfolio includes service and distribution businesses in a number of equity sectors. The total consideration for the acquisition was $24 million including $18 million in cash at closing, subject to post closing working capital adjustments, and an aggregate $6 million in a three-year earn-out arrangement through 2010. The transaction included a Transition Services Agreement for the transition of certain services for a period of nine months. The assets sold to an affiliate of Platinum Equity include all of the Company's wireless deployment business, and the Wireless Facilities name. The transaction closed on July 24, 2007.
On September 25, 2007, in accordance with the terms of the acquisition agreement, the Company provided the working capital calculation to Platinum Equity (Platinum), which indicated a working capital adjustment was due to Platinum primarily due to cash collected on accounts receivables by the Company prior to the close of the transaction that exceeded the Company's previous estimate of working capital to be delivered to Platinum. Platinum has reviewed the Company's working capital calculation, and the Company and Platinum have not been able to come to an agreement on the working capital adjustment. In accordance with the agreement, the Company and Platinum are in the process of choosing a firm to resolve this item. As of December 31, 2007, the balance of the Company's calculation has been reflected in other current liabilities.
The Company determined that the U.S. engineering and U.S. deployment operations met the criteria to be classified as held for sale in the first quarter of 2007. Accordingly, the Company has reflected these operations as discontinued and assessed these assets for impairment charges will result in any material net future cash expendituresaccordance with
KRATOS DEFENSE & SECURITY SOLUTIONS, INC.
Revenue generatedNotes to Consolidated Financial Statements (Continued)
Years ended December 31, 2005, 2006 and 2007
Note 4. Discontinued Operations (Continued)
SFAS No. 144, "Accounting for the Impairment or Disposal of Long-Lived Assets". The Company determined that the assets of the U.S. deployment operations were impaired and recorded an impairment charge of approximately $13.4 million. The fair value of the assets was determined by utilizing the Latin Americansale price less estimated costs to sell the business. The Company subsequently recorded a gain in discontinued operations from the sale of the U.S. engineering operations of $14.8 million. Upon the divestiture of the deployment business, the Company recorded a loss from disposal of $1.9 million, reflecting the closing working capital adjustment and South Americanfinal closing balance sheet. In addition, the Company recorded a charge for an excess facility accrual of approximately $1.1 million related to certain facility leases of Deployment field offices that were not assumed by Platinum.
The determination that the U.S. engineering business and U.S. deployment operations met the criteria to be classified as held for sale in the first quarter of 2007 was also a triggering event under SFAS 142 Goodwill and Other Intangible Assets ("SFAS 142") that resulted in an accelerated review of the Company's goodwill and intangibles assets with indefinite lives. In accordance with SFAS 142, the Company allocated the goodwill for the WNS reporting unit based upon the fair value of the engineering business and the deployment business. The fair values used were based upon market information obtained as a result of the sale of the businesses. This resulted in an impairment charge of approximately $7.2 million related to goodwill for this reporting unit which was recorded in the first quarter of 2007.
In addition, in accordance with EITF 87-24,Allocation of Interest to Discontinued Operations ("EITF 87-24"), interest expense incurred on the debt that was required to be repaid as a result of the sales of our wireless network services business was allocated to discontinued operations for the periods presented. During the years ended December 31, 2005, 2006 and 2007, interest expense allocated to discontinued operations was $66.0approximately $0.0 million, $52.6$0.0 million and $10.0$2.2 million, for 2004,respectively. The following table presents the results of discontinued operations (in millions):
| | 2005
| | 2006
| | 2007
| |
|---|
| Revenue | | $ | 265.1 | | $ | 201.7 | | $ | 85.7 | |
| Net income (loss) before taxes | | | 7.1 | | | (9.8 | ) | | (12.7 | ) |
| Provision (benefit) for income taxes | | | 9.1 | | | 1.9 | | | (0.4 | ) |
| Net loss after taxes | | $ | (2.0 | ) | $ | (11.7 | ) | $ | (12.6 | ) |
KRATOS DEFENSE & SECURITY SOLUTIONS, INC.
Notes to Consolidated Financial Statements (Continued)
Years ended December 31, 2005, 2006 and 2006, respectively. Net income (loss) in these operations were $10.0 million, ($10.8) million, and ($8.0) million and income tax expense was $1.9 million, $3.1 million and $1.1 million respectively, for 2004, 2005 and 2006 respectively.2007
156Note 4. Discontinued Operations (Continued)
Following is a summary of the assets and liabilities of discontinued operations as of December 31, 20052006 and 2006December 31, 2007 (in millions) for each of the operations:
| | 2005 | | 2006 | | |
| | Latin and
South America | | EMEA | | Total | | Latin and
South America | | EMEA | | Total | | | December 31, 2006
| | December 31, 2007
|
|---|
Cash | | | $ | 4.2 | | | | $ | 4.2 | | | $ | 8.4 | | | $ | 1.6 | | | | $ | 1.4 | | | $ | 3.0 | | | $ | 3.0 | | $ | 0.3 |
Restricted cash | | | 0.6 | | | | — | | | 0.6 | | | — | | | | — | | | — | | |
Accounts receivable, net | | | 39.0 | | | | 5.0 | | | 44.0 | | | 3.5 | | | | 3.7 | | | 7.2 | | | 63.7 | | 0.8 |
Prepaid expenses | | | 0.2 | | | | 0.1 | | | 0.3 | | | 0.1 | | | | 0.2 | | | 0.3 | | |
Income tax receivable | | | 2.4 | | | | — | | | 2.4 | | | — | | | | — | | | — | | |
Other current assets | | | 6.9 | | | | 0.7 | | | 7.6 | | | 1.5 | | | | 0.6 | | | 2.1 | | | 4.9 | | 0.5 |
Impairment allowance | | | — | | | | — | | | — | | | (4.3 | ) | | | (0.3 | ) | | (4.6 | ) | | (4.6 | ) | | — |
| | | |
| |
|
Current assets of discontinued operations | | | $ | 53.3 | | | | $ | 10.0 | | | $ | 63.3 | | | $ | 2.4 | | | | $ | 5.6 | | | $ | 8.0 | | | $ | 67.0 | | $ | 1.6 |
| | | |
| |
|
Property, plant and equipment | | | $ | 1.9 | | | | $ | 1.3 | | | $ | 3.2 | | | $ | 0.4 | | | | $ | 0.9 | | | $ | 1.3 | | | $ | 9.1 | | $ | — |
| Goodwill | | | 25.5 | | — |
| Deferred tax assets | | | 2.8 | | — |
| Impairment allowance | | | (0.4 | ) | | — |
Other assets | | | 0.2 | | | | — | | | 0.2 | | | — | | | | — | | | — | | | — | | 0.1 |
Deferred tax asset | | | 2.3 | | | | — | | | 2.3 | | | 2.1 | | | | — | | | 2.1 | | |
Impairment allowance | | | — | | | | — | | | — | | | (0.4 | ) | | | — | | | (0.4 | ) | |
| | | |
| |
|
Non-current assets of discontinued operations | | | $ | 4.4 | | | | $ | 1.3 | | | $ | 5.7 | | | $ | 2.1 | | | | $ | 0.9 | | | $ | 3.0 | | | $ | 37.0 | | $ | 0.1 |
| | | |
| |
|
Accounts payable | | | $ | 4.2 | | | | $ | 1.0 | | | $ | 5.2 | | | $ | 0.4 | | | | $ | 0.5 | | | $ | 0.9 | | | $ | 11.4 | | $ | — |
Accrued expenses | | | 7.8 | | | | 4.1 | | | 12.0 | | | 2.2 | | | | 2.5 | | | 4.7 | | | 22.1 | | 3.7 |
Tax contingencies | | | 13.2 | | | | — | | | 13.2 | | | — | | | | — | | | — | | |
Billings in excess of cost | | | 0.6 | | | | — | | | 0.6 | | | 0.2 | | | | 0.1 | | | 0.3 | | |
Income taxes payable | | | 1.8 | | | | 0.1 | | | 1.9 | | | 2.6 | | | | 0.3 | | | 2.9 | | |
Deferred tax liability | | | 2.3 | | | | — | | | 2.3 | | | 2.1 | | | | — | | | 2.1 | | |
| Billings in excess of cost on uncompleted contracts | | | 3.7 | | — |
| Income tax contingencies | | | 3.6 | | 1.2 |
| Deferred tax liabilities | | | 8.3 | | — |
Other current liabilities | | | 5.7 | | | | 0.1 | | | 5.8 | | | — | | | | 0.4 | | | 0.4 | | | 0.4 | | 0.4 |
| | | |
| |
|
Current liabilities of discontinued operations | | | $ | 35.6 | | | | $ | 5.3 | | | $ | 41.0 | | | $ | 7.5 | | | | $ | 3.8 | | | $ | 11.3 | | | $ | 49.5 | | $ | 5.3 |
| | | |
| |
|
| Non-current income tax contingencies | | | $ | — | | $ | 2.0 |
| Other non-current liabilities | | | 1.3 | | 0.7 |
| | | |
| |
|
Non-current liabilities of discontinued operations | | | $ | 0.3 | | | | $ | — | | | $ | 0.3 | | | $ | 0.2 | | | | $ | — | | | $ | 0.2 | | | $ | 1.3 | | $ | 2.7 |
| | | |
| |
|
The restricted cash of $0.6 million for 2005, was a one-year fixed account at zero interest as a result of a 2005 regulation in Argentina which required the maintenance of cash balances as a percentage of foreign loans advanced by the Company to its foreign subsidiary. The final restriction was removed in the fourth quarter of 2006.
Note 5. Investments in Unconsolidated AffiliateAffiliates
Tactical Survey Group, Inc. (“TSG”("TSG")
In February 2004, the Company paid $1.0 million in cash to bring its total stock ownership position in Tactical Survey Group, Inc. (TSG), a privately-held company that provides expertise in developing, deploying and integrating tactical survey systems for use in government and commercial applications, to 11%. Pursuant to the provisions of APB Opinion No. 18, “The"The Equity Method of Accounting for Investments in Common Stock”Stock", this investment was accounted for under the equity method of accounting due to the presence of significant influence deemed to exist based on the significant number of subcontracts that the Company has entered into with TSG and the presence of a WFIKratos employee on TSG’sTSG's board of directors.
During the third quarter of 2006, TSG was no longer considered a significant subcontractor to the Company. This factor, combined with the lack of current representation on TSG’sTSG's board of directors
KRATOS DEFENSE & SECURITY SOLUTIONS, INC.
Notes to Consolidated Financial Statements (Continued)
Years ended December 31, 2005, 2006 and 2007
Note 5. Investments in Unconsolidated Affiliates (Continued)
resulted in the Company concluding effective September 29, 2006 that significant influence no longer existed. Accordingly, the investment in TSG no longer met the conditions for the use of the equity method of accounting and has been accounted for under the cost method effective September 29, 2006. There were no equity earnings related to this investment during the period this investment was accounted for under the equity method of accounting. The balance of the Company’sCompany's investment in TSG at December 31, 2005 and December 31, 2006 totaled $1.2 million and has been classified on the consolidated balance sheet under the caption “Investments in unconsolidated affiliates.”
million. The Company evaluates the realizability of its investment in TSG according to the provisions of APB Opinion No. 18 and EITF Issue 03-1.FAS 115-1 and FAS 124-1. The Company periodically obtains and reviews the financial statements of TSG. Based on this review, and the facts listed above, there is no indication that a decreaserecent indicators of fair value, an impairment charge of $0.9 million was recorded in value of the TSG investment has occurred which is other than temporary and the Company has concluded that2007 to reduce the carrying value of itsthis investment in TSG has not been impaired as of December 31, 2006.2007 to $0.3 million. This investment has been classified on the consolidated balance sheet under the caption "Investments in unconsolidated affiliates."
CommVerge Solutions, Inc.
The Company has an investment in CommVerge Solutions, Inc., a privately-held wireless network planning and deployment company. The balance of the Company’sCompany's investment in CommVerge Solutions, Inc. at December 31, 2005 and December 31, 2006 totalstotaled $0.9 million. This investment is accounted for under the cost method and has been classified on the consolidated balance sheet under the caption “Investments in unconsolidated affiliates.” One of the Company’s directors is also a director of CommVerge Solutions, Inc.
Management periodically obtains and reviews the most recent financial performance and financial forecasts available from CommVerge which may include information regarding project status and current progress of the business. Based on this review, there is no indication that a decrease in valuean impairment charge of the CommVerge investment has occurred which is other than temporary and the Company has concluded that$0.9 million was recorded to reduce the carrying value of itsthis investment in CommVerge has not been impaired as of December 31, 2006.2007 to $0.0 million. This investment is accounted for under the cost method and has been classified on the consolidated balance sheet under the caption "Investments in unconsolidated affiliates." One of the Company's directors is also a director of CommVerge Solutions, Inc.
Note 6. Acquisitions
Government Solutions Segment
Haverstick Consulting, Inc.
On December 31, 2007 the Company acquired Indianapolis, Indiana headquartered Haverstick Consulting, Inc. (Haverstick) as part of the Kratos Government Solutions Segment. Haverstick provides rocket and missile test and evaluation, weapons systems support, and professional services to the U.S. Army, U.S. Air Force, U.S. Navy, NASA, and other federal, state and local agencies. Through the Haverstick acquisition, the Company expanded its customer footprint within the DoD, and enhanced its presence with the U.S. Air Force, a key growth area for Kratos.
The total purchase price was $90.2 million including transaction costs incurred by Kratos of $0.5 million. The purchase price paid to Haverstick was $89.7 million comprised of $70.3 million in cash and the issuance of 7.48 million shares of the Company's common stock valued at $2.60 per share or an aggregate stock consideration of $19.4 million. The value of the share issued was determined by averaging the market price of the stock two days before and two days after the announcement of the acquisition, November 5, 2007. The Company paid $81.1 million, $66.7 million of which was cash paid at closing, $2.4 million was paid shortly thereafter, and $12.0 million in common stock. The Company held back $8.6 million (the Holdback Consideration) to secure any negative working capital adjustments
KRATOS DEFENSE & SECURITY SOLUTIONS, INC.
Government Network Services SegmentNotes to Consolidated Financial Statements (Continued)
Years ended December 31, 2005, 2006 and 2007
Note 6. Acquisitions (Continued)
required by the Merger Agreement and the Company's indemnity rights. The Holdback Consideration is comprised of both cash and Kratos stock in the amounts of $1.2 million and $7.4 million, respectively. The holdback consideration will be released in 50% increments on the 12th month and 21st month of the anniversary date of the acquisition. In addition to the indemnity holdback, the Agreement also calls for a post closing working capital adjustment. To fund the acquisition, the Company secured a new credit facility of $85.0 million arranged by KeyBanc Capital Markets. The credit facility, which includes a $25.0 million line of credit and $60.0 million in term notes, replaced the Company's previous credit facility which had an outstanding principal balance of $6.0 million on the date of closing.
On February 29, 2008 the Company provided the working capital calculation to Haverstick, which indicated a working capital adjustment was due to the Company primarily because the working capital, as calculated per the Agreement, was below the target amount. Haverstick has reviewed the Company's working capital calculation and is not in agreement. Haverstick's response proposes that there is actually excess working capital of approximately $1.5 million. In accordance with the Agreement, the Company and Haverstick have fifteen days from the date of the objection to resolve the disagreement. If resolution has not been achieved within the fifteen day period, the Company and Haverstick have five days to agree on a nationally recognized independent accounting firm to resolve the disagreement.
Pursuant to the terms of the Merger Agreement, the Company has agreed to use its reasonable best efforts to file a resale registration statement covering the shares issued in connection with the Merger promptly following the closing date. In the event that the common stock issued are not salable under rules promulgated under the Securities Acts, holders of the stock may elect to exchange such shares for a cash amount equal to $2.74 per share in accordance with the terms of the Merger Agreement. Until the date on which the shares of stock are salable interest shall accrue on the value of the Closing Stock at a floating rate of one-month LIBOR plus four percent (4%) per annum.
The purchase price paid to Haverstick of $89.7 million plus $0.5 in transaction costs was accounted for as follows (in millions):
| Current assets | | $ | 32.5 | |
| Property, plant, and equipment | | | 2.3 | |
| Intangible assets | | | 9.3 | |
| Goodwill | | | 64.6 | |
| Other assets | | | 2.4 | |
| | |
| |
| Total assets | | | 111.1 | |
| Current liabilities | | | (17.7 | ) |
| Other liabilities | | | (3.2 | ) |
| | |
| |
| Net assets acquired | | $ | 90.2 | |
| | |
| |
| | The goodwill recorded in this transaction is not tax deductible. | | | | |
Pro Forma Financial Information
The results of Haverstick's operations are not included in the accompanying Consolidated Statements of Operations for the years ended December 31, 2005, 2006 and 2007.
KRATOS DEFENSE & SECURITY SOLUTIONS, INC.
Notes to Consolidated Financial Statements (Continued)
Years ended December 31, 2005, 2006 and 2007
Note 6. Acquisitions (Continued)
The following summary presents pro forma consolidated results of operations for the years ended December 31, 2006 and December 31, 2007 as if the Haverstick acquisition described above had occurred on January 1, 2006 and includes adjustments that were directly attributable to the transaction, such as amortization of intangibles, interest related to debt, and one time expenses associated with the merger, or were not expected to have a continuing impact on the Company. The pro forma results are unaudited and for illustrative purposes only for the applicable period and do not purport to be indicative of the actual results which would have occurred had the transactions been completed as of the beginning of the period indicated, nor are they indicative of results of operations which may occur in the future (all unaudited amounts, except per share amounts, are in million):
| | 2006 As Reported
| | Pro forma Adjustments
| | 2006 Pro forma
| |
|---|
| Revenue | | $ | 153.1 | | $ | 93.0 | | $ | 246.1 | |
| Net income (loss) | | $ | (57.9 | ) | $ | (4.8 | ) | $ | (62.7 | ) |
| Basic and diluted loss per share | | $ | (0.79 | ) | $ | (0.06 | ) | $ | (0.85 | ) |
| | | | | | | | | | | |
| | 2007 As Reported
| | Pro forma Adjustments
| | 2007 Pro forma
| |
|---|
| Revenue | | $ | 193.6 | | $ | 94.2 | | $ | 287.8 | |
| Net loss | | $ | (40.8 | ) | $ | (5.1 | ) | $ | (45.9 | ) |
| Basic and diluted loss per share | | $ | (0.55 | ) | $ | (0.07 | ) | $ | (0.62 | ) |
Madison Research Corporation
On October 2, 2006 the Company acquired Huntsville, Alabama based Madison Research Technology Corporation (“MRC”("MRC") as part of the Company’sCompany's Government Network Services business.Solutions segment. MRC offers a broad range of technical, engineering and IT solutions, and has developed core competencies in weapons system lifecycle support, integrated logistics, test and evaluation, commercial-off-the-shelf software and hardware selection and implementation, software development and systems lifecycle maintenance.
The purchase price was approximately $73.8 million, including a working capital adjustment of $4.6 million and transaction costs of $0.2 million, and is subject to certain additional post-closing adjustments. The Company paid $62.1 million at closing, the working capital adjustment of $4.6 million was paid in April 2007 and the remaining $6.9 million, which has been subsequently adjusted for legal costs and a reduction in contingent cash consideration, was held back to secure the Company’sCompany's indemnity rights and will be released, subject to indemnity rights, in installments following 6, 12, and 18 months from the date of close. In April 2007, $1.5 million of the holdbackhold-back was released and paid to the former shareholders of MRC. In October 2007, a second scheduled holdback payment of $2.8 million was made. The remaining hold back balance of approximately $2.3 million as of December 31, 2007, subject to the resolution of certain indemnification matters, is expected to be paid in April 2008. The Company entered into a new $85 million credit facility with KeyBank National Association (“KeyBank”) to fund the acquisition, which replaced the Company’s existingCompany's previous credit facility of $15 million. Refer to Note 8 for further discussion. The results of operations of MRC have been included in the Company’sCompany's consolidated statement of operations for the period from the acquisition date of October 2, 2006 in the Company’sCompany's fourth quarter.quarter of 2006.
KRATOS DEFENSE & SECURITY SOLUTIONS, INC.
158Notes to Consolidated Financial Statements (Continued)
Years ended December 31, 2005, 2006 and 2007
Note 6. Acquisitions (Continued)
The purchase price, including transaction costs of $0.2 million, was accounted for as follows (in millions):
Current assets | | $ | 17.8 | | Current assets | | $ | 17.8 | |
Property, plant, and equipment | | 0.4 | | Property, plant, and equipment | | 0.4 | |
Intangible assets | | 8.1 | | Intangible assets | | 8.1 | |
Goodwill | | 53.8 | | Goodwill | | 53.8 | |
| | | | |
| |
Total assets | | 80.1 | | Total assets | | 80.1 | |
Other current liabilities | | (6.3 | ) | |
| Current liabilities | | Current liabilities | | (6.3 | ) |
| | | | |
| |
Net assets acquired | | $ | 73.8 | | Net assets acquired | | $ | 73.8 | |
| | | | |
| |
| | | The goodwill recorded in this transaction is not tax deductible. | | | |
Pro Forma Financial Information
The results of MRC’sMRC's operations since the acquisition date are included in the Company’sCompany's consolidated financial statements for 2006 and are a component within the Kratos Government Network ServicesSolutions segment.
The following summary presents pro forma consolidated results of operations for the years ended December 31, 2005 and December 31, 2006 as if the MRC acquisition described above had occurred January 1, 20062005 and includes adjustments that were directly attributable to the transaction or were not expected to have a continuing impact on the Company. The pro forma results are unaudited and for illustrative purposes only for the applicable period and do not purport to be indicative of the actual results which would have occurred had the transactions been completed as of the beginning of the period indicated, nor orare they indicative of results of operations which may occur in the future (all unaudited amounts, except per share amounts, are in million):
| | 2005
As Restated | | Pro forma
Adjustments | | 2005
Pro forma | | | 2005 As Reported
| | Pro forma Adjustments
| | 2005 Pro forma
| |
|---|
Revenue | | | $ | 337.7 | | | | $ | 62.4 | | | | $ | 400.1 | | | | $ | 152.3 | | $ | 62.4 | | $ | 214.7 | |
Net income (loss) | | | $ | 1.6 | | | | $ | (3.3 | ) | | | $ | (1.7 | ) | | | $ | 1.6 | | $ | (3.3 | ) | $ | (1.7 | ) |
Diluted Earnings per Share | | | $ | 0.02 | | | | $ | (0.04 | ) | | | $ | (0.02 | ) | | |
| Basic and diluted earnings (loss) per share | | | $ | 0.02 | | $ | (0.04 | ) | $ | (0.02 | ) |
| | | | | | | | | |
| | | 2006 As Reported
| | Pro forma Adjustments
| | 2006 Pro forma
| |
|---|
| Revenue | | | $ | 153.1 | | $ | 46.7 | | $ | 199.8 | |
| Net loss | | | $ | (57.9 | ) | $ | (3.9 | ) | $ | (61.8 | ) |
| Basic and diluted loss per share | | | $ | (0.79 | ) | $ | (0.5 | ) | $ | (0.84 | ) |
| | 2006
As Reported | | Pro forma
Adjustments | | 2006
Pro forma | |
Revenue | | | $ | 327.8 | | | | $ | 46.7 | | | | $ | 374.5 | | |
Net loss | | | $ | (57.9 | ) | | | $ | (3.9 | ) | | | $ | (61.8 | ) | |
Diluted Earnings per Share | | | $ | (0.79 | ) | | | $ | (0.5 | ) | | | $ | (0.84 | ) | |
On January 27, 2005, the Company acquired all of the issued and outstanding shares of capital stock of JMA Associates, Inc d/b/a TLA Associates (TLA) for $37.3 million in cash. TLA provides services including network engineering, network infrastructure support, information assurance, application development, and managed services, including network maintenance and monitoring, to government agencies. The acquisition was a continuation of the Company’s strategy to expand its government services business. The intangible assets consist of backlog of $1.3 million being amortized over a 3 year period, customer relationships of $0.8 million being amortized over a 10 year period and non-compete agreements of $0.6 million being amortized over a 3 year period.
The purchase price, including transaction costs of $0.6 million, was accounted for as follows (in millions):
Current assets | | $ | 8.4 | |
Property, plant, and equipment | | 0.8 | |
Intangible assets | | 2.7 | |
Goodwill | | 29.0 | |
Total assets | | 40.9 | |
Accrual for loss contracts | | (0.6 | ) |
Deferred profit | | (0.2 | ) |
Other current liabilities | | (2.2 | ) |
Total liabilities assumed | | (3.0 | ) |
Net assets acquired | | $ | 37.9 | |
On January 5, 2004, the Company acquired of all of the outstanding securities of High Technology Solutions, Inc. (HTS), for $48.5 million in cash. HTS provides systems engineering, systems integration, and the outsourcing of technical services such as operational test and evaluation and program management to government agencies. The acquisition of HTS was a part of the Company’s strategy to enter into the government sector and its overall diversification and long-term growth strategy. The excess purchase price paid over the fair value of tangible net assets acquired of $43.5 million to goodwill in the amount of $39.6 million, and to identifiable finite-life intangible assets in the amount of $3.9 million. The identified intangible assets consist of $3.2 million allocated to contracts and backlog, $0.2 million for intellectual property and $0.5 million for a non-compete agreement. The allocation of the purchase price is subject to adjustments within a one-year period of the acquisition date based on the resolution of pre-acquisition contingencies, which is comprised primarily of certain incentive arrangements. In connection with the Company’s acquisition of HTS and the determination of the fair value of assets acquired pursuant to the provisions of SFAS No. 141, the Company valued acquired contracts in process at contract price, minus the estimated costs to complete and an allowance of $1.5 million for the normal industry profit on its effort to complete such contracts. The Company reflected this allowance as an increase to goodwill and a corresponding increase to billings in excess of costs (deferred profit). During 2005 and 2004, $0.7 million and $0.4 million, respectively, of this allowance was amortized into income. The remaining amount of $0.3 million at December 31, 2005 is estimated to reduce costs through 2006. The results of operations of HTS since the acquisition date are included in the Company’s accompanying consolidated financial statements and are a component of the government network services operating segment.
The following table summarizes the final purchase price, including transaction costs (in millions):
At January 5, 2004
Current assets | | $ | 7.8 | |
Property, plant, and equipment | | 0.5 | |
Intangible assets | | 3.9 | |
Goodwill | | 39.6 | |
Deferred tax asset | | 4.1 | |
Other assets | | 0.4 | |
Total assets | | 56.3 | |
Current liabilities | | (3.6 | ) |
Deferred profit | | (1.5 | ) |
Deferred tax liability | | (1.5 | ) |
Long-term debt | | (0.2 | ) |
Total liabilities assumed | | (6.8 | ) |
Net assets acquired | | $ | 49.5 | |
On August 4, 2004, the Company completed its acquisition of Defense Systems, Incorporated (DSI), a company that provides a full range of information technology and logistics automation services to federal government and commercial clients, with a strategic focus on providing the end-to-end total radio frequency identification (“RFID”) solutions. The initial purchase consideration consisted of a cash payment of $6.6 million, of which $5.8 million was allocated to goodwill and $1.6 million was allocated to identifiable finite-lived intangible assets. The identified intangible assets consist of $0.8 million backlog, $0.7 million of customer relationships and $0.1 million non-compete agreement, which are being amortized over their useful lives of 5, 10 and 3 years, respectively. Additional consideration of up to $3.2 million could be earned by the former major stockholders of DSI over an 18 month period based upon performance milestones related to certain specified contracts. The additional consideration if any, has been recorded as goodwill as earned. As of December 31, 2005, approximately $0.5 million was accrued of the additional consideration based upon the attainment of certain milestones. As of December 31, 2006, the performance period had ended and no further contingent acquisition consideration was due. Approximately $2.8 million in additional consideration had been earned and paid related to the contract milestones achieved by DSI. The operating results for DSI for the year ended December 31, 2003, are not included in the proforma results presented above as the results were immaterial.
Pro Forma Financial Information
The results of operations of these acquired entities since the acquisition date are included in the Company’s consolidated financial statements for fiscal 2004 and 2005 and are a component within the Government Network Services segment.
The following summary presents pro forma consolidated results of operations for the year ended December 31, 2004 as if the acquisitions described above had occurred January 1, 2004 and includes adjustments that were directly attributable to the transaction or were not expected to have a continuing impact on the Company. The pro forma adjustment amount for the period from January 1, 2005 to January 27, 2005, related to the acquisition of TLA is immaterial. The pro forma results are unaudited and for illustrative purposes only for the applicable period and do not purport to be indicative of the actual results which would have occurred had the transactions been completed as of the beginning of the period, nor or they indicative of results of operations which may occur in the future (all unaudited amounts, except per share amounts, are in million):
| | 2004
As Restated | | Pro forma
Adjustments | | 2004
Pro forma | |
Revenue | | | $ | 296.2 | | | | $ | 31.6 | | | | $ | 327.8 | | |
Net income | | | $ | 15.0 | | | | $ | 2.8 | | | | $ | 17.8 | | |
Diluted earnings per share | | | $ | 0.20 | | | | $ | 0.04 | | | | $ | 0.24 | | |
Enterprise Network Services Segment
On February 13, 2003, the Company acquired all of the outstanding capital stock of Suntech Systems, Inc (Suntech)., a company that provides subcontracting services primarily for general contractors and enterprise customers for the design and installation of commercial electrical systems. This acquisition was the first in the Company’s diversification strategy into the enterprise market. Initial purchase consideration consisted of a cash payment totaling $1.8 million, of which $1.0 million was allocated to goodwill and $0.6 million was allocated to the fair value of identifiable intangible assets. Purchased intangible assets primarily consisted of customer relationships and are being amortized over their 5-year estimated useful life. The acquisition was accounted for under the provisions of purchase method accounting in accordance with Statement of Financial Accounting Standards No. 141 (SFAS No. 141) “Business Combinations”. Included in the stock purchase agreement is a provision whereby the Company has agreed to pay the selling shareholders additional consideration that is contingent upon the acquired
entity’s successful achievement of specific annual earnings targets for each of the years ending December 31, 2003, 2004 and 2005 and the continued employment of certain individuals. As of December 31, 2005, $2.6 million of additional purchase consideration was recorded as goodwill, bringing the total purchase consideration to $4.4 million.
On April 15, 2003, the Company acquired all of the outstanding capital stock of Delmarva Systems Corporation, a company that provides various commercial electrical systems integration services. This acquisition was a continuation of the Company’s diversification strategy. Initial purchase consideration consisted of a cash payment totaling $6.2 million, of which $1.3 million was allocated to goodwill and $2.1 million was allocated to the fair value of identifiable intangible assets. Purchased intangible assets consisted primarily of customer relationships that are being amortized over their 7-year estimated useful life. The acquisition was accounted for under the provisions of the purchase method of accounting in accordance with SFAS No. 141. The stock purchase agreement included a provision whereby the Company agreed to pay the selling shareholders additional consideration that is contingent upon the acquired entity’s successful achievement of specific earnings targets for each of the twelve month periods ended March 31, 2004, 2005 and 2006. As of December 31, 2005, $10.9 million of additional purchase consideration was recorded as goodwill, bringing the total purchase consideration to $15.8 million.
On August 7, 2003, the Company acquired all of the outstanding equity interests of Enco Systems, Inc. (Enco), a company that provides full-service security systems and building technologies integration. This acquisition was a continuation of the Company’s diversification strategy. The initial purchase consideration consisted of a cash payment totaling $3.7 million, of which $0.1 million was allocated to goodwill and $0.1 million was allocated to identifiable intangible assets. The acquisition was accounted for under the provisions of the purchase method of accounting in accordance with SFAS No. 141. The stock purchase agreement included a provision whereby the Company has agreed to pay the selling equity holders additional consideration that is contingent upon the acquired entity’s successful achievement of specific annual earnings targets for the six month period ended December 31, 2003 and the years ending December 31, 2004, 2005 and 2006, and the continued employment of certain individuals. All additional contingent consideration earned by Enco was classified as compensation expense. The stock purchase agreement contained a provision whereby either party could terminate the earn-out provision at the end of 2005 and the Company has chosen to exercise this option.
In connection with the acquisitions of Suntech and Enco, certain selling shareholders had continued employment provisions as a condition to receiving additional earn-out consideration. In accordance with EITF 95-8 “Accounting for Contingent Consideration Paid to the Shareholders of an Acquired Enterprise in a Purchase Business Combination,” such payments were recorded as compensation expense. During 2003, the Company recorded $2.9 million of associated compensation expense. In September 2004, the Company amended these purchase agreements to more accurately reflect the intent of the transaction, resulting in a rescission of the continuous employment clauses from the earn-out arrangements. These amendments constituted a triggering event which resulted in a one-time charge of $12.4 million in the third quarter of 2004 and is reflected on the consolidated statements of operations as Contingent Acquisition Consideration, which represents estimated payments to be made to certain ENS selling shareholders based on the original continuous employment clauses. During the third quarter of 2005, the Company reduced $2.5 million of this accrual as a credit to Contingent acquisition consideration on the accompanying consolidated statements of operations, when it became reasonably certain that the total earn-out consideration earned would be less than originally estimated based upon the performance of the acquired entities. During the fourth quarter of 2005, the Company recorded an additional increase of $0.4 million accrual that was recorded to selling, general and administrative expense of contingent acquisition consideration as a result of one of the entities financial performance exceeding previously estimated performance.
162
As part of the Company’s 2006 annual test of goodwill for impairment, the Company recorded a non-cash impairment charge of $18.3 million in the Enterprise Network Services segment. This was due in part to changes in the industry and the strategic focus of the Company as well as operational challenges from significant employee turnover that the Company encountered after the completion of the earn out periods. Refer to Note 2 Goodwill and Other Intangible Assets for further discussion. As of December 31, 2006, there is no remaining goodwill balances related to the Enterprise Network Services segment.
Contingent Acquisition Consideration
In connection with certain business acquisitions, the Company may agree to make additional future payments to sellers contingent upon achievement of specific performance-based milestones by the acquired entities. Pursuant to the provisions of SFAS No. 141, such amounts are accrued, and therefore, recorded by the Company when the contingency is resolved beyond a reasonable doubt and,
KRATOS DEFENSE & SECURITY SOLUTIONS, INC.
Notes to Consolidated Financial Statements (Continued)
Years ended December 31, 2005, 2006 and 2007
Note 6. Acquisitions (Continued)
hence, the additional consideration becomes payable. A summary of the contingent acquisition consideration as of December 31, 20052006 and December 31, 20062007 is summarized in the following table.table (in millions).
Summary of Contingent Acquisition Consideration
| |
| | PSS
| | Other KGS
| | Haverstick
| | MRC
| | Total
| |
|---|
| Balance as of December 31, 2004 | | Balance as of December 31, 2004 | | $ | 14.0 | | $ | 0.5 | | $ | — | | $ | — | | $ | 14.5 | |
| | | Post acquisition adjustments | | 4.8 | | 1.9 | | — | | — | | 6.7 | |
| | | Payments | | (11.1 | ) | | (1.9 | ) | | — | | — | | (13.0 | ) |
| | Suntech | | Enco | | DSI | | MRC | | Total | | | |
| |
| |
| |
| |
| |
Balance as of December 31, 2005 | | | $ | 6.9 | | | $ | 0.8 | | $ | 0.5 | | $ | — | | $ | 8.2 | | Balance as of December 31, 2005 | | $ | 7.7 | | $ | 0.5 | | $ | — | | $ | — | | $ | 8.2 | |
(Release) accrual for contingent consideration | | | (0.1 | ) | | 0.2 | | 0.2 | | 11.6 | | 11.9 | | |
Payments | | | (6.8 | ) | | (1.0 | ) | (0.7 | ) | — | | (8.5 | ) | |
| | | | |
| |
| |
| |
| |
| |
| | | Acquisitions | | — | | — | | — | | 11.6 | | 11.6 | |
| | | Post acquisition adjustments | | 0.1 | | 0.2 | | — | | — | | 0.3 | |
| | | Payments | | (7.8 | ) | | (0.7 | ) | | — | | — | | (8.5 | ) |
| | | | |
| |
| |
| |
| |
| |
Balance as of December 31, 2006 | | | $ | — | | | $ | — | | $ | — | | $ 11.6 | | $ | 11.6 | | Balance as of December 31, 2006 | | $ | — | | $ | — | | $ | — | | $ | 11.6 | | $ | 11.6 | |
| | | | | | | | | | | | | | | | | | | | |
| |
| |
| |
| |
| |
| | | Acquisitions | | — | | — | | 8.6 | | — | | 8.6 | |
| | | Post acquisition adjustments | | — | | — | | — | | (0.4 | ) | | (0.4 | ) |
| | | Payments | | — | | — | | — | | (8.9 | ) | | (8.9 | ) |
| | | | |
| |
| |
| |
| |
| |
| Balance as of December 31, 2007 | | Balance as of December 31, 2007 | | $ | — | | $ | — | | $ | 8.6 | | $ | 2.3 | | $ | 10.9 | |
| | | | |
| |
| |
| |
| |
| |
Enterprise Network Services
DuringThe current liabilities accrual for contingent consideration on the full year endedaccompanying Consolidated Balance Sheet as of December 31, 2006, $7.82007 includes $2.3 million wasfor MRC and $0.6 million for Haverstick. Included in long term other liabilities is $0.6 million for Haverstick with the contingent stock consideration of $7.4 million reflected as paid to certain shareholders of the companies acquired in ENS. As of March 31, 2006, all earn-out performance periods had ended and there was no additionalcapital for contingent consideration earned related toin the ENS shareholders.accompanying Consolidated Statement of Stockholder's Equity.
Government Network ServicesSolutions Segment
Madison Research Corporation (MRC)Haverstick Consulting, Inc.
In connection with the Company’sCompany's acquisition of Haverstick Consulting, Inc. (Haverstick) on December 31, 2007, the purchase price included $8.6 million in holdback consideration to secure, if any, negative adjustments to working capital and the Company's indemnity rights. The hold-back consideration includes both a cash and Kratos common stock component. As of December 31, 2007, the $8.6 million contingent acquisition consideration balance was reflected as $1.2 million in Accrual for contingent acquisition consideration for the cash portion and as $7.4 million in Paid-in-Capital for Contingent Consideration in the accompanying consolidated balance sheets.
In accordance with the terms of the Merger Agreement $0.6 million and $3.7 million of the cash and stock component of the hold back, respectively, will be released at December 31, 2008 with the remaining hold back amounts to be released in August 2009.
KRATOS DEFENSE & SECURITY SOLUTIONS, INC.
Notes to Consolidated Financial Statements (Continued)
Years ended December 31, 2005, 2006 and 2007
Note 6. Acquisitions (Continued)
Madison Research Corporation (MRC)
In connection with the Company's acquisition of Madison Research Corporation (“MRC”("MRC") in October 2006, the purchase price included a working capital adjustment of $4.6 million, which was paid in April 2007 and $6.9 million, which has been subsequently adjusted for legal costs and a reduction in contingent cash consideration, was held back to secure the Company’sCompany's indemnity rights and will be released, subject to indemnity rights, in installments following 6, 12, and 18 months from the date of close. In April 2007,Holdback payments of $1.5 million of the holdback wasand $2.8 million were released and paid to the former shareholders of MRC.MRC in April and October of 2007, respectively. As of December 31, 2006,2007, the $11.6$2.3 million contingent acquisition consideration balance which includes accrued interest of $0.1 million was reflected as $9.8$2.3 million in the Accrual for contingent acquisition consideration with the remaining $1.8 million non-current portion reflected in Other liabilities on the accompanying consolidated balance sheets.sheet. The Company expects to pay the remaining holdback, subject to the remaining indemnification obligations, in April 2008.
Defense Systems, IncorporatedPublic Safety & Security Segment
In connection with During the Company’s acquisition of Defense Systems, Incorporated (“DSI”) in August 2004, additional consideration of up to $3.2 million could be earned by the former major stockholders of DSI over an 18 month period, based upon performance milestones related to certain specified contracts. As ofyear ended December 31, 2006, approximately $2.8$7.8 million additionalof earn-out consideration had been earned andwas paid related to certain shareholders of the contract milestones achieved by DSI.companies acquired in the Public Safety & Security Segment. As of March 31, 2006, theall earn-out performance periodperiods had ended and there was no furtheradditional contingent consideration could be earned.earned related to those shareholders.
Note 7. Balance Sheet Details
The Company’sCompany's cash equivalents consist of overnight cash sweep accounts that are invested on a daily basis. As of December 31, 2006,2007, the company had no other short term investments. The cash and cash equivalents at December 31, 20052006 and December 31, 20062007 were as follows (in millions):
| | December 31, 2005 | | December 31, 2006 | |
| | Amortized Cost
Basis | | Fair Value
Basis | | Amortized Cost
Basis | | Fair Value
Basis | |
Cash and cash equivalents: | | | | | | | | | | | | | | | | | |
Cash | | | $ | 2.7 | | | | $ | 2.7 | | | | $ | (0.0 | ) | | | $ | (0.0 | ) | |
Money market | | | 5.0 | | | | 5.0 | | | | 5.4 | | | | 5.4 | | |
Cash and cash equivalents | | | $ | 7.7 | | | | $ | 7.7 | | | | $ | 5.4 | | | | $ | 5.4 | | |
| | December 31, 2006
| | December 31, 2007
|
|---|
| | Amortized Cost Basis
| | Fair Value Basis
| | Amortized Cost Basis
| | Fair Value Basis
|
|---|
| Cash and cash equivalents: | | | | | | | | | | | | |
| | | Cash | | $ | 0.0 | | $ | 0.0 | | $ | 3.6 | | $ | 3.6 |
| | | Money market | | | 5.4 | | | 5.4 | | | 5.0 | | | 5.0 |
| | |
| |
| |
| |
|
| | Cash and cash equivalents | | $ | 5.4 | | $ | 5.4 | | $ | 8.6 | | $ | 8.6 |
| | |
| |
| |
| |
|
Net unrealized gains and realized gains recorded during the year ended December 31, 20052006 and December 31, 20062007 were immaterial.
KRATOS DEFENSE & SECURITY SOLUTIONS, INC.
Notes to Consolidated Financial Statements (Continued)
Years ended December 31, 2005, 2006 and 2007
Note 7. Balance Sheet Details (Continued)
The breakdown of certain assets in the consolidated balance sheets consistconsists of the following at December 31, 20052006 and 20062007 (in millions):
| | 2005 | | 2006 | |
Accounts receivable, net: | | | | | |
Billed | | $ | 54.0 | | $ | 68.3 | |
Unbilled | | 46.8 | | 47.9 | |
Total accounts receivable | | 100.8 | | 116.2 | |
Allowance for doubtful accounts | | (0.8 | ) | (0.5 | ) |
Total accounts receivable, net | | $ | 100.0 | | $ | 115.7 | |
Property and equipment, net: | | | | | |
Computer equipment | | $ | 26.0 | | $ | 27.5 | |
Furniture and office equipment | | 4.4 | | 4.0 | |
Software | | 4.2 | | 7.4 | |
Leasehold improvements | | 1.5 | | 2.0 | |
Accumulated depreciation and amortization | | (23.2 | ) | (27.0 | ) |
Total property and equipment, net | | $ | 12.9 | | $ | 13.9 | |
Other intangibles, net: | | | | | |
Contracts and backlog | | $ | 6.0 | | $ | 7.5 | |
Customer relationships | | 3.4 | | 10.0 | |
Noncompete agreements | | 1.3 | | 1.3 | |
Trade name | | 0.4 | | 0.4 | |
Accumulated amortization | | (3.7 | ) | (5.8 | ) |
Total other intangibles, net | | $ | 7.4 | | $ | 13.4 | |
Investments in unconsolidated affiliates: | | | | | |
CommVerge, Inc. | | $ | 0.9 | | $ | 0.9 | |
Tactical Survey Group, Inc. | | 1.2 | | 1.2 | |
Total investments in unconsolidated affiliates | | $ | 2.1 | | $ | 2.1 | |
| | 2006
| | 2007
| |
|---|
| Accounts receivable, net: | | | | | | | |
| | Billed | | $ | 36.2 | | $ | 43.3 | |
| | Unbilled | | | 23.4 | | | 34.2 | |
| | |
| |
| |
| Total accounts receivable | | | 59.6 | | | 77.5 | |
| Allowance for doubtful accounts | | | (0.3 | ) | | (0.5 | ) |
| | |
| |
| |
| | | Total accounts receivable, net | | $ | 59.3 | | $ | 77.0 | |
| Property and equipment, net: | | | | | | | |
| | Computer equipment | | $ | 6.0 | | $ | 4.9 | |
| | Software | | | 7.4 | | | 3.3 | |
| | Furniture and office equipment | | | 3.8 | | | 4.3 | |
| | Facility under capital lease | | | — | | | 1.2 | |
| | Leasehold improvements | | | 1.7 | | | 1.8 | |
| | |
| |
| |
| | | Property and equipment | | | 18.9 | | | 15.5 | |
| | Accumulated depreciation and amortization | | | (12.8 | ) | | (8.6 | ) |
| | |
| |
| |
| | | Total property and equipment, net | | $ | 6.1 | | $ | 6.9 | |
| Investments in unconsolidated affiliates: | | | | | | | |
| | CommVerge, Inc. | | $ | 0.9 | | $ | — | |
| | Tactical Survey Group, Inc. | | | 1.2 | | | 0.3 | |
| | |
| |
| |
| | | Total investments in unconsolidated affiliates | | $ | 2.1 | | $ | 0.3 | |
164
Note 8. Notes Payable and Other Financing Arrangements
(a) Credit Agreement
On March 16, 2005, the Company entered into a credit agreement with KeyBank National Association (“KeyBank”("KeyBank") to provide a $15.0 million senior credit facility. KeyBank was designated as the sole arranger and sole book manager. The facility had a three-year term and could have been expanded to a $60.0 million facility. The Company used the facility for general corporate purposes and to fund acquisitions. On October 2, 2006, the Company entered into a new credit agreement with Key Bank to provide an $85 million senior credit facility, which replaced the Company’sCompany's existing $15 million senior credit facility. The facility hashad a 5 year term with principal due in 2011 and interest payable on a monthly basis. At the Company’sCompany's option, interest iswas payable at the London Interbank Offer Rate plus 1.75-3.50%, or at the prime rate plus 0.30-0.75%, with either option adjusted quarterly based on the company’sCompany's total net debt-to-EBITDA ratio. The Company has used the facility to fund its acquisition of Madison Research Corporation (MRC) and for general corporate purposes. The terms of the new credit agreement requirerequired the Company to provide certain customary covenants for a credit agreement, including certain financial covenants, computed as defined by the terms of the agreement. These financial covenants include a maximum total net debt leverage ratio of 4.00 to 1.00, a minimum liquidity ratio of 1.35 to 1.00, and a minimum fixed charge coverage ratio of 1.10 to 1.00. The facility iswas collateralized by the assets of the Company.
KRATOS DEFENSE & SECURITY SOLUTIONS, INC.
Notes to Consolidated Financial Statements (Continued)
Years ended December 31, 2005, 2006 and 2007
Note 8. Notes Payable and Other Financing Arrangements (Continued)
The facility containscontained customary events of default, including payment defaults, breaches of representations and warranties, and covenant defaults. As of March 30, 2007, the Company was in technical default of this agreement as it had not yet filed its Form 10-K and 2006 audited financials. On April 6, 2007, the Company entered into an amendment to the credit agreement whereby Key Bank waived this technical default and provided an extension through April 30, 2007 for filing our 10-K and 2006 audited financial statements. On June 1, 2007, the Company entered into a second amendment to the credit agreement whereby Key Bank extended the original waiver for filing our 10-K and 2006 audited financial statements and the quarterly unaudited financial statements for the fiscal quarters ended March 31, 2007 and June 30, 2007 through September 30, 2007 and reduced the total Facilityfacility to $50 million to reflect the net pay downs of the revolving line of credit reflectingrelated to the divestiture of our EMEA business in March 2007 and the divesture of our domestic Engineeringengineering business. In addition, the second amendment providesprovided for the further reduction of ourthe Company's credit facility to $35 million effective upon receipt of principal payments under the note received from the buyer of the domestic engineering business, which occurred on July 3, 2007.
On December 31, 2007, the Company entered into a new credit facility of $85.0 million with KeyBanc Capital Markets which replaced the October 2, 2006 credit agreement with Key Bank. This credit facility provides for two term loans consisting of a first lien term note of $50.0 million and a second lien term note of $10.0, as well as, a first lien $25 million revolving line of credit. The $10.0 million term loan has a five and one half year term with principal payments required quarterly beginning on March 31, 2008 of $25,000 through March 31, 2013 with the final balance of $9.5 million due on June 30, 2013. The $50.0 million term loan has a five year term with principal payments required quarterly beginning on March 31, 2008 of $0.6 million in 2008, $1.3 million in 2009, $2.5 million in 2110, and $4.1 million in 2011 and 2012. The term loans have a provision which states that once the full amount of the note has been borrowed, the notes cannot be paid down and reborrowed again. The revolving line of credit has a four year term which expires on December 31, 2011 and contains provisions typical in such arrangements. All loans under the new credit facility have an interest rate equal to a base rate defined as a fluctuating rate per annum equal to the higher of (a) the Federal Funds Rate plus 0.5% and (b) the rate of interest in effect for such day as publicly announced from time to time by KeyBank as its "prime rate" plus a margin for the term loans of 6.5% to 7.5% and a margin of 1.0% to 3.25% on the revolving line of credit. The applicable margin at date of borrowing is determined by the ratio of the Company's aggregate debt to it's EBITDA for the previous four fiscal quarters. The Company used the credit facility to fund the acquisition of Haverstick Consulting Inc. (Haverstick) and to retire the outstanding debt from the October 2006 agreement.
The Credit Facilities contain covenants which impose certain restrictions on the Company's ability to, among other things, incur additional debt, pay dividends, make investments or sell assets. Additionally, certain non-recurring cash inflows such as proceeds from asset sales, insurance recoveries, and equity offerings may have to be used to pay down indebtedness and may not be reborrowed. In addition, the Credit Facilities contain certain financial covenants which include certain financial covenants as defined by the terms of the agreements. These financial covenants include a maximum first lien leverage ratio, a maximum total leverage ratio, a minimum liquidity ratio, a minimum fixed
KRATOS DEFENSE & SECURITY SOLUTIONS, INC.
Notes to Consolidated Financial Statements (Continued)
Years ended December 31, 2005, 2006 and 2007
Note 8. Notes Payable and Other Financing Arrangements (Continued)
charge coverage ratio, and a minimum consolidated EBITDA at various dates for the $50.0 million term loan and the $25.0 million revolver as outlined in the following table.
Date
| | Maximum First Lien Leverage Ratio
| | Maximum Total Leverage Ratio
| | Minimum Liquidity Ratio
| | Minimum Fixed Charge Coverage Ratio
| | Minimum Consolidated EBITDA
(in millions)
|
|---|
| December 31, 2007—2008 | | 3.22 to 4.76:1.00 | | 3.76 to 5.68:1.00 | | 1.56 to 1.33:1.00 | | 1.05 to 0.50:1.00 | | $16.1 to $19.4 |
| 2009 | | 2.97 to 2.33:1.00 | | 2.78 to 3.50:1.00 | | 1.60 to 1.58:1.00 | | 1.11 to 1.02:1.00 | | $19,8 to $21.5 |
| 2010 | | 1.75 to 2.00:1.00 | | 2.25 to 2.50:1.00 | | 1.54 to 1.49:1.00 | | 1.10 to 1.06:1.00 | | $21.5 to 23.4 |
| 2011 | | 1.75:1.00 | | 2.25:1.00 | | 1.55 to 1.53:1.00 | | 1.10:1.00 | | $24.4 to $26.5 |
| 2012 | | 1.75:1.00 | | 2.25:1.00 | | 1.42 to 1.54:1.00 | | 1.10:1.00 | | $26.7 to $27.6 |
The $10.0 million term loan also provides for similar financial covenants.
Future maturities of long-term debt are as follows (in millions):
| 2008 | | $ | 2.6 |
| 2009 | | | 5.1 |
| 2010 | | | 10.1 |
| 2011 | | | 31.9 |
| 2012 | | | 16.4 |
| Thereafter | | | 9.4 |
| | |
|
| | | $ | 75.5 |
| | |
|
As of December 31, 2006,2007, the Company’sCompany's outstanding balance on the facility was $51.0$75.5 million and the weighted average interest rate on the debt borrowed during 2007 was 8.99%8.3%. This includes $0.3$3.5 million of interest expense and financing costs related to the originalOctober 2006 agreement and replacement of the Senior Credit Facility in the fourth quarter of 2006.new facility dated December 31, 2007. The replacement of the October 2006 facility in the fourth quarter resulted in a write-off of $0.2$1.0 million in deferred financing costs related to the original facility.costs. The Company had $1.2$3.3 million in deferred financing costs outstanding as of December 31, 20062007 which are related to the new facility and are being amortized over the four, five and five and one half year life of the respective underlying notes.
As of December 31, 2007 the unused line of credit under the revolving line of credit was $9.5 million. The only restriction on the use of these funds is that the Company must be in compliance with covenants of the credit facility.
(b) Financing
In On February 2005,11, 2008 the Company entered into an agreementa three derivative financial instruments with National City Vendor Finance, LLCKey Bank to finance $0.59reduce the Company's exposure to its variable interest rates on its outstanding debt. These instruments initially hedged $70 million in software, maintenance and support fees of one of its IT systems.LIBOR-based floating rate debt with the amounts hedged decreasing over time. The interestderivatives mature on March 31, 2010 and March 31, 2011 and result in an average fixed rate of 3.16% for the financing is at 4.2% per annum. Principalterm of the agreements. The Company designated these instruments as cash flow hedges. In March 2008 as a result of the amendment to the Company's Credit Facility, the Company determined that these instruments were no longer highly effective as a hedge. Future gains and interest paymentslosses on these derivative instruments as well as the offsetting gain or loss on the hedged item attributable to the hedged risk will be recognized in earnings.
KRATOS DEFENSE & SECURITY SOLUTIONS, INC.
Notes to Consolidated Financial Statements (Continued)
Years ended December 31, 2005, 2006 and 2007
Note 8. Notes Payable and Other Financing Arrangements (Continued)
In March 2008 The Company entered into a tentative agreement to settle the 2004 and 2007 securities class action litigation actions, and as a result, the Company recorded a $4.9 million charge in the quarter ended December 31, 2007 to accrue its share of $0.05 million are payable quarterly through January 2008.the settlement amounts and an estimate for a contingent liability associated with legal proceedings related to the derivative actions, net of the amounts to be covered by the Company's insurance carriers. As a consequence of recording this legal settlement, the Company did not meet certain of the financial covenants in accordance with the Credit Agreement. Accordingly, on March 27, 2008, the Company obtained an amendment and waiver from its lenders to waive the impact of the legal settlement amounts on its financial covenants as of December 31, 2006, $0.32007 and the affected future periods. The amendment also amended the Credit Agreement to provide for an increase in the LIBOR floor rate to 4.25% and to require that the Company set aside in a restricted account, approximately 50% of the proceeds of the recovery from the theft of stock options by its former stock option administrator, or approximately $1.7 million, was outstandingto fund these settlement amounts. The lenders have also reserved the right to require the Company to utilize the entire amount of the $3.4 million in proceeds received from the theft of stock options to permanently pay down indebtedness. This right can be exercised no earlier than 60 days from March 27, 2008 and expires upon the Company's compliance with financial covenants under the Credit Agreement for the four consecutive quarters commencing after January 1, 2008.
The net benefit of the swap agreements entered into by us on February 11, 2008 has been reduced by the LIBOR floor included in the amendment and waiver discussed above. The cost related to this financing.amendment will be recorded as deferred financing costs for the credit facility in the first quarter of 2008.
Note 9. Lease Commitments
The Company leases certain equipment under capital leases with a weighted average interest rate of approximately 5.0% that expire at various dates through 2010. The Company also leases certain facilities and equipment under operating leases having terms expiring at various dates through 2011.2016. Future minimum lease payments under capital and operating leases as of December 31, 20062007 are as follows (in millions):
| | Capital
Leases | | Net
Operating
Leases | |
| | Capital Leases
| | Net Operating Leases
|
|---|
Year ending December 31, | | | | | | | | | | Year ending December 31, | | | | |
2007 | | | $ | 0.4 | | | | $ | 5.8 | | | |
2008 | | | | | | | 5.1 | | | 2008 | | $ | 0.3 | | $ | 5.6 |
2009 | | | | | | | 4.8 | | | 2009 | | 0.3 | | 5.2 |
2010 | | | — | | | | 3.0 | | | 2010 | | 0.3 | | 2.8 |
2011 | | | — | | | | 0.6 | | | 2011 | | 0.3 | | 1.0 |
| 2012 | | 2012 | | 0.3 | | 0.8 |
Thereafter | | | — | | | | 0.7 | | | Thereafter | | 1.4 | | 0.9 |
Total future minimum lease payments | | | 0.4 | | | | $ | 20.0 | | | |
| | | | |
| |
|
| | | Total future minimum lease payments | | $ | 2.9 | | $ | 16.3 |
| | | | | | |
|
Less amount representing interest | | | 0.0 | | | | | | | Less amount representing interest | | 1.7 | | |
Present value of capital lease obligations | | | 0.4 | | | | | | | |
| | | | |
| | |
| | | Present value of capital lease obligations | | 1.2 | | |
Less current portion | | | 0.4 | | | | | | | Less current portion | | 0.1 | | |
Long-term capital lease obligations | | | $ | 0.0 | | | | | | | |
| | | | |
| | |
| | | Long-term capital lease obligations | | $ | 1.1 | | |
| | | | |
| | |
KRATOS DEFENSE & SECURITY SOLUTIONS, INC.
Equipment recorded under capital leases approximated $0.7 million as ofNotes to Consolidated Financial Statements (Continued)
Years ended December 31, 2005, 2006 and $0.9 million as of December 31, 2006, with accumulated amortization of $0.5 million and $0.4 million as of December 31, 2005 and 2006, respectively.2007
Note 9. Lease Commitments (Continued)
Pursuant to the terms of sublease agreements as of December 31, 2006,2007, approximately $0.3$0.8 million of sublease income will offset future minimum lease payments as of December 31, 2007.payments. Gross rent expense under operating leases for the years ended December 31, 2004, 2005, 2006 and 20062007 were $5.2$4.6 million, $6.6$4.0 million and $5.8$4.3 million, respectively. Total sublease income for the years ended December 31, 2004, 2005, 2006 and 20062007 totaling $1.0$0.3 million, $0.8$0.2 million and $0.6$0.2 million, respectively, has been netted against rent expense.
Based on management’smanagement's assessment of assumptions based upon existing market conditions, sublease rental rates and recoverability of operating lease expenses for the Company’sCompany's vacant properties and due to the Company’sCompany's actions to consolidate facilities, during the fourth quarter of 2006, the Company reevaluated its accrual for unused office space and determined that a portion of its corporate facility would no longer be utilized to the extent previously expected. As a result, the Company calculated the estimated loss on unused office space to increase by approximately $1.4 million in 2006. In 2007, the quarter ended December 31, 2006.Company recorded an additional $0.8 million for an excess facility accrual for obligations under facility leases that were unfavorably impacted by its recent divestitures of our wireless network services businesses which resulted in unused office space.
The accrual for loss on unused office space was $1.7 million, net of approximately $0.9 million of lease payments and $2.6 million net of approximately $0.4and $2.4 million of lease payments as of December 31, 20052006 and December 31, 2006,2007, respectively. The Company estimates that the remaining accrual will be paid through 2010. Such amount isThese amounts are included in asset impairment and other charges on the Company’sCompany's statement of operations. The lease on certain office facilities includes scheduled base rent increases over the term of the lease. The total amount of the base rent payments is being charged to expense on the straight-line method over the term of the lease. In addition to the base rent payment, the Company pays a monthly allocation of the building’sbuilding's operating expenses. The Company has recorded deferred rent, included in accrued expenses and other liabilities in the consolidated balance sheets, of $1.2$1.0 million and $1.1$0.8 million at December 31, 20052006 and 2006,2007, respectively, to reflect the excess of rent expense over cash payments since inception of the respective lease.
166
Note 10. Income Taxes
In July 2006, the FASB issued Interpretation No. 48, Accounting for Uncertainty in Income Taxes—An Interpretation of FASB Statement No. 109 ("FIN 48"). FIN 48 clarifies the accounting for uncertainty in income taxes recognized in an entity's financial statements in accordance with FASB Statement No. 109, Accounting for Income Taxes, and prescribes a recognition threshold and measurement attributes for financial statement disclosure of tax positions taken or expected to be taken on a tax return. Under FIN 48, the impact of an uncertain income tax position must be recognized at the largest amount that is more-likely-than-not to be sustained upon audit by the relevant taxing authority. An uncertain income tax position will not be recognized if it has less than a 50% likelihood of being sustained. Additionally, FIN 48 provides guidance on derecognition, classification, interest and penalties, accounting in interim periods, disclosure and transition.
The Company adopted the provisions of FIN 48 on January 1, 2007. The total liability for unrecognized tax benefits as of the date of adoption was $4.7 million. Additionally, the Company has a tax refund claim of $2.4 million for which it has not recorded any benefit under FIN 48 or prior standards. As a result of the implementation of FIN 48, the Company recognized a $0.7 million increase in the liability for unrecognized tax benefits, with $0.2 million net decrease in valuation allowance, $0.1 million charged to retained earnings, and $0.4 million recorded to goodwill. In addition,
KRATOS DEFENSE & SECURITY SOLUTIONS, INC.
Notes to Consolidated Financial Statements (Continued)
Years ended December 31, 2005, 2006 and 2007
Note 10. Income Taxes (Continued)
the Company reduced its gross deferred tax assets by $10.8 million for unrecognized tax benefits, which was offset by a reduction in its valuation allowance by the same amount.
The following table summarizes the activity related to the Company's unrecognized tax benefits (in millions):
| | Total
| |
|---|
| Balance at January 1, 2007 | | $ | 18.0 | |
| Increases related to prior periods | | | 5.7 | |
| Decreases related to current year tax positions | | | (7.3 | ) |
| Expiration of applicable statutes of limitations | | | (1.6 | ) |
| Foreign currency translation | | | 0.4 | |
| | |
| |
| Balance at December 31, 2007 | | $ | 15.2 | |
| | |
| |
Included in the balance of unrecognized tax benefits at December 31, 2007, are $12.8 million of tax benefits that, if recognized, would affect the effective tax rate. Included in this amount is $8.8 million that would become a deferred tax asset it the tax benefit were recognized. As such, this benefit may be impacted by a corresponding valuation allowance depending upon the Company's financial condition at the time the benefits are recognized.
The Company recognizes interest and penalties related to unrecognized tax benefits in its provision for income taxes. For the year ended December 31, 2007, the Company recorded $0.2 million in interest and penalties.
The Company believes that it is reasonably possible that as much as $3.8 million of the FIN 48 tax liabilities will expire within 12 months of December 31, 2007 due to the expiration of various applicable statutes of limitations and possible settlement of a pending income tax refund claim.
The Company is subject to taxation in the U.S. and various state tax jurisdictions. The Company's tax years for 2000 and forward are subject to examination by the U.S. and state tax authorities due to the existence of net operating loss carryforwards. Generally, the Company's tax years for 2002 and forwards are subject to examination by various foreign tax authorities.
In assessing the realizability of deferred tax assets, management considers on a periodic basis, whether it is more likely than not that some portion or all of the deferred tax assets will not be realized. As such, management has determined that it is appropriate to maintain a full valuation allowance against its deferred tax assets, with the exception of an amount equal to its deferred tax liabilities which can be expected to reverse. Management will continue to evaluate the necessity to maintain a valuation allowance against its deferred tax asset.
As of December 31, 2007, the Company had a net deferred tax liability of $2.0 million. The deferred tax assets and liabilities are allocated based upon the underlying asset or liability that produced the deferred taxes. As of December 31, 2007, there were no deferred tax assets or liabilities allocated to discontinued operations.
KRATOS DEFENSE & SECURITY SOLUTIONS, INC.
Notes to Consolidated Financial Statements (Continued)
Years ended December 31, 2005, 2006 and 2007
Note 10. Income Taxes (Continued)
Income (loss) from continuing operations before cumulative effect of change in accounting principle and before provision (benefit) for income taxes for the years ended December 31, 2004, 2005, 2006 and 20062007 is comprised of the following (in millions):
| | 2004 | | 2005 | | 2006 | |
| | (Restated) | | (Restated) | | | |
Domestic | | | $ | 2.8 | | | | $ | 17.1 | | | $ | (32.3 | ) |
Foreign | | | — | | | | 0.1 | | | 0.1 | |
Total | | | $ | 2.8 | | | | $ | 17.2 | | | $ | (32.2 | ) |
| | 2005
| | 2006
| | 2007
| |
|---|
| Domestic | | $ | 3.5 | | $ | (32.4 | ) | $ | (26.9 | ) |
The provision (benefit) for income taxes from continuing operations for the years ended December 31, 2004, 2005, 2006 and 20062007 is comprised of the following (in millions):
| | 2004 | | 2005 | | 2006 | |
| | (Restated) | | (Restated) | | | |
Current: | | | | | | | | | | | |
Federal | | | $ | 0.0 | | | | $ | (0.1 | ) | | $ | 0.0 | |
State | | | 0.6 | | | | 0.9 | | | 0.8 | |
Foreign | | | 0.9 | | | | 0.0 | | | 0.1 | |
Total current | | | 1.5 | | | | 0.8 | | | 0.9 | |
Deferred: | | | | | | | | | | | |
Federal | | | (2.6 | ) | | | 4.7 | | | 12.2 | |
State | | | 0.5 | | | | 0.4 | | | 1.4 | |
Foreign | | | 0.0 | | | | 0.0 | | | 0.0 | |
Total deferred | | | (2.1 | ) | | | 5.1 | | | 13.6 | |
Total | | | $ | (0.6 | ) | | | $ | 5.9 | | | $ | 14.5 | |
| | 2005
| | 2006
| | 2007
|
|---|
| Current: | | | | | | | | | |
| | Federal | | $ | (5.5 | ) | $ | (0.5 | ) | $ | 0.0 |
| | State | | | 0.2 | | | 0.7 | | | 0.7 |
| | |
| |
| |
|
| | | Total current | | | (5.3 | ) | | 0.2 | | | 0.7 |
| Deferred: | | | | | | | | | |
| | Federal | | | 4.8 | | | 12.1 | | | 0.5 |
| | State | | | 0.4 | | | 1.5 | | | 0.1 |
| | |
| |
| |
|
| | | Total deferred | | | 5.2 | | | 13.6 | | | 0.6 |
| | |
| |
| |
|
| Total | | $ | (0.1 | ) | $ | 13.8 | | $ | 1.3 |
| | |
| |
| |
|
Additionally, the Company recognized net tax benefits (adjustments) from exercise of stock options of $(0.7) million, zero and zero for the years ended December 31, 2004, 2005 and 2006, respectively, which were recorded in stockholders’ equity.
A reconciliation of total income tax provision (benefit) to the amount computed by applying the statutory federal income tax rate of 35% to income (loss) from continuing operations before income tax provision (benefit) for the years ended December 31, 2004, 2005, 2006 and 20062007 is as follows (in millions):
| | 2004 | | 2005 | | 2006 | | |
| | (Restated) | | (Restated) | | | |
| | 2005
| | 2006
| | 2007
| |
|---|
Income tax expense (benefit) at federal statutory rate | | | $ | (2.7 | ) | | | $ | 7.2 | | | $ | (11.2 | ) | Income tax expense (benefit) at federal statutory rate | | $ | 1.2 | | $ | (11.3 | ) | $ | (9.4 | ) |
State taxes, net of federal tax benefit and valuation allowance | | | 0.8 | | | | 1.3 | | | 2.2 | | State taxes, net of federal tax benefit and valuation allowance | | 0.6 | | 2.1 | | 0.7 | |
Foreign tax expense (benefit), net of valuation allowance | | | 0.9 | | | | (0.2 | ) | | — | | |
Increase (decrease) in federal valuation allowance | | | (4.6 | ) | | | (4.6 | ) | | 15.9 | | Increase (decrease) in federal valuation allowance | | (3.4 | ) | | 15.9 | | 9.9 | |
Increase in reserves for uncertain tax positions | | | — | | | | — | | | 0.1 | | |
| Increase (decrease) in reserves for uncertain tax positions | | Increase (decrease) in reserves for uncertain tax positions | | (0.2 | ) | | 0.1 | | — | |
Contingent acquisition consideration | | | 4.3 | | | | (0.7 | ) | | — | | Contingent acquisition consideration | | (0.7 | ) | | — | | — | |
Tax basis difference on subsidiaries | | | — | | | | 0.8 | | | — | | Tax basis difference on subsidiaries | | 0.8 | | — | | — | |
Nondeductible expense | | | 0.8 | | | | 0.7 | | | 1.1 | | Nondeductible expense | | 0.2 | | 0.6 | | 0.1 | |
Revision of prior year estimates | | | — | | | | 1.4 | | | — | | Revision of prior year estimates | | 1.4 | | — | | — | |
Goodwill write-off | | | — | | | | — | | | 6.4 | | Goodwill write-off | | — | | 6.4 | | — | |
Other, net | | | (0.1 | ) | | | — | | | — | | |
Total | | | $ | (0.6 | ) | | | $ | 5.9 | | | $ | 14.5 | | |
| | | | |
| |
| |
| |
| | | Total | | $ | (0.1 | ) | $ | 13.8 | | $ | 1.3 | |
| | | | |
| |
| |
| |
KRATOS DEFENSE & SECURITY SOLUTIONS, INC.
Notes to Consolidated Financial Statements (Continued)
Years ended December 31, 2005, 2006 and 2007
Note 10. Income Taxes (Continued)
The tax effects of temporary differences that give rise to the deferred tax assets and deferred tax liabilities as of December 31, 20052006 and 20062007 are as follows (in millions):
| | 2005 | | 2006 | |
| | (Restated) | | | |
Deferred tax assets: | | | | | | | |
Allowance for doubtful accounts | | | $ | 1.2 | | | $ | 0.7 | |
Sundry accruals | | | 1.2 | | | 1.1 | |
Vacation accrual | | | 1.0 | | | 1.6 | |
Stock-based compensation | | | 2.7 | | | 1.9 | |
Property and equipment, principally due to differences in depreciation | | | 0.4 | | | 2.2 | |
Investments | | | 0.7 | | | 1.7 | |
Goodwill and other intangibles | | | 2.4 | | | 1.8 | |
Net operating loss carryforwards | | | 41.5 | | | 52.1 | |
Capital loss carryforward | | | 1.5 | | | 1.6 | |
Tax credit carryforwards | | | 0.3 | | | 0.3 | |
Deferred revenue | | | 0.7 | | | 0.7 | |
Reserves and other | | | 8.4 | | | 9.3 | |
| | | 62.0 | | | 75.0 | |
Valuation allowance | | | (32.4 | ) | | (54.3 | ) |
Total deferred tax assets, net of allowance | | | 29.6 | | | 20.7 | |
Deferred tax liabilities: | | | | | | | |
Unearned revenue | | | (13.3 | ) | | (12.4 | ) |
Other intangibles | | | (2.2 | ) | | (4.8 | ) |
Property and equipment, principally due to differences in depreciation | | | (1.4 | ) | | (4.1 | ) |
Other liabilities | | | (0.4 | ) | | (0.8 | ) |
Total deferred tax liabilities | | | (17.3 | ) | | (22.1 | ) |
Net deferred tax asset (liability) | | | $ | 12.3 | | | $ | (1.4 | ) |
| | 2006
| | 2007
| |
|---|
| Deferred tax assets: | | | | | | | |
| | Allowance for doubtful accounts | | $ | 0.7 | | $ | 0.8 | |
| | Sundry accruals | | | 1.1 | | | 0.5 | |
| | Vacation accrual | | | 1.6 | | | 0.7 | |
| | Stock-based compensation | | | 1.9 | | | 7.7 | |
| | Property and equipment, principally due to differences in depreciation | | | 2.2 | | | 1.3 | |
| | Investments | | | 1.7 | | | 2.4 | |
| | Goodwill and other intangibles | | | 1.8 | | | — | |
| | Net operating loss carryforwards | | | 52.1 | | | 62.4 | |
| | Capital loss carryforward | | | 1.6 | | | 1.6 | |
| | Tax credit carryforwards | | | 0.3 | | | 0.3 | |
| | Deferred revenue | | | 0.7 | | | — | |
| | Reserves and other | | | 9.3 | | | 6.7 | |
| | |
| |
| |
| | | | 75.0 | | | 84.4 | |
| | Valuation allowance | | | (54.3 | ) | | (75.0 | ) |
| | |
| |
| |
| | | Total deferred tax assets, net of allowance | | | 20.7 | | | 9.4 | |
| | |
| |
| |
| Deferred tax liabilities: | | | | | | | |
| | Unearned revenue | | | (12.4 | ) | | (0.8 | ) |
| | Other intangibles | | | (4.8 | ) | | (9.0 | ) |
| | Property and equipment, principally due to differences in depreciation | | | (4.1 | ) | | (1.6 | ) |
| | Other liabilities | | | (0.8 | ) | | — | |
| | |
| |
| |
| | | Total deferred tax liabilities | | | (22.1 | ) | | (11.4 | ) |
| | |
| |
| |
| | | Net deferred tax liability | | $ | (1.4 | ) | $ | (2.0 | ) |
| | |
| |
| |
At December 31, 2006,2007, the Company had federal tax loss carryforwards of $105.9$174.2 million (including stock option net operating loss carryforwards) which expire beginning in 2020 and various state tax loss carryforwards of $85.3$152.7 million which expire beginning in 2012. Federal and state tax laws impose restrictions on the utilization of net operating loss and tax credit carryforwards in the event of an “ownership change”"ownership change" for tax purposes as defined by Section 382 of the Internal Revenue Code. The Company has determined that any ownership changesmay have incurred one or more "ownership changes" under Section 382 will not materially impact382. If an "ownership change" did occur, utilization of the Company’s abilitynet operating loss or credit carryforward amounts may be limited. As discussed elsewhere, deferred tax assets relating to utilize itsthe net operating loss and tax credit carryforwards.carryforwards are offset by a full valuation allowance. In addition, utilization of state tax loss carryforwards is dependent upon sufficient taxable income apportioned to the states.
KRATOS DEFENSE & SECURITY SOLUTIONS, INC.
Notes to Consolidated Financial Statements (Continued)
Years ended December 31, 2005, 2006 and 2007
Note 10. Income Taxes (Continued)
In assessing the realizability of deferred tax assets, management considers, on a periodic basis, whether it is more likely than not that some portion or all of the deferred tax assets will not be realized. During fiscal 2006,2007, the Company recorded an increase in its valuation allowance of $21.9$20.7 million. Of this amount, $9.9 million as it determined that anis a result of current year operations, causing the current year tax expense to increase over the expected expense or benefit. The remaining increase in the valuation allowance is attributed to deferred tax assets acquired in the acquisition of Haverstick Consulting, Inc. and the true-up of beginning deferred tax assets based on actual tax return filings. The increase was required based on the Company’sCompany's overall assessment of the risks and uncertainties related to its future ability to realize and utilize the Company’sCompany's deferred tax assets. This resulted in the income tax expense being greater than the expected amount for the year.
Note 11. Stockholders’Stockholders' Equity
(a) Preferred Stock
On May 30, 2002, the Company issued an aggregate of 90,000 shares of Series B Convertible Preferred Stock, at an aggregate purchase price of $45.0 million, in a private placement to entities
affiliated with one of the directors of the Company (40,000 shares), to a brother of the Chairman and Chief Executive Officer of the Company (10,000 shares) and to an unrelated third-party investor (40,000 shares). The Company received $44.9 million of net proceeds. Each share of Series B Convertible Preferred Stock is initially convertible into 100 shares of Common Stock for a conversion price of $5.00 per share, which was the fair market value of the common stock at the closing, at the option of the holder at any time, subject to certain provisions in the Series B Preferred Stock Purchase Agreement. The Series B Preferred Stock Purchase Agreement had a lock-up provision, which has expired priorPrior to March 5,December 31, 2004, on which date 40,00064,517 shares of Series B Convertible Preferred Stock were converted into 4,000,0006,451,700 shares of the Company’sCompany's Common Stock. On April 5, 2006, 15,483 shares of Series B Convertible Preferred Stock were converted into 1,548,300 shares of the Company’sCompany's Common Stock.
Through December 31, 2006,2007, the Company has received notices from the holders to convert an aggregate number of 80,000 shares of Series B Convertible Preferred Stock into an aggregate 8,000,000 shares of the Company’sCompany's Common Stock. On December 31, 2005 and December 31, 2006,2007, the total liquidatedliquidation preference equaled $12.7 million and $5.0 million, respectively. million. In accordance with EITF No. 03-06 “Participating"Participating Securities and the Two-Class Method under FASB Statement No. 128”128", the Company’sCompany's Series A and B Preferred Stock was considered a participating security for purposes of computing basic earnings per share as further discussed in Note 1(l)1(o).
(b) Stock Option Plans and Restricted Stock Unit Plans
During the years ended 1997, 1999 and 2000, the Board of Directors approved the 1997 Stock Option Plan (the “1997 Plan”"1997 Plan"), the 1999 Equity Incentive Plan (the “1999 Plan”"1999 Plan") and the 2000 Non-statutory Stock Option Plan (the “2000 Plan”"2000 Plan"), respectively. Further, in February 2005, the Board of Directors approved the 2005 Equity Incentive Plan (the “2005 Plan”"2005 Plan"). The 2005 Plan was subsequently approved by a majority of the Company’sCompany's stockholders on May 18, 2005.
Stock options granted under the 1997 Plan and 1999 Plan may be incentive stock options or non-statutory stock options and are exercisable for up to ten years following the date of grant. The Company ceased making grants under, and subsequently terminated the 1997 Plan upon completion of its initial public offering. The 1999 Plan permits the granting of incentive stock options or non-statutory stock options which are exercisable for up to ten years after the grant date. The 2000 Plan permits the grant of non-statutory stock options, which are
KRATOS DEFENSE & SECURITY SOLUTIONS, INC.
Notes to Consolidated Financial Statements (Continued)
Years ended December 31, 2005, 2006 and 2007
Note 11. Stockholders' Equity (Continued)
exercisable for a period following the date of grant as determined by the Board of Directors (generally ten years). Additionally, in July 2004, the Board of Directors resolved that all future stock option grants under all of the Company’sCompany's stock option plans would be non-statutory stock options, until such further determination by the Board of Directors.
Stock option exercise prices for the 1997 Plan, 1999 Plan, 2000 Plan and 2005 Plan must be equal to or greater than the fair market value of the common stock on the date of grant. A cumulative total of 7.5 million, 15.9 million, 6.5 million and 3.5 million shares of common stock have been authorized for issuance under the 1997 Plan, 1999 Plan, 2000 Plan and 2005 Plan, respectively. There remainsremain approximately 2.3 million shares of common stock authorized for the 1997 Plan which are no longer issuable due to the termination of the plan. In accordance with the provisions of SFAS No. 123, “Accounting"Accounting for Stock-Based Compensation,”" the Company applies APB Opinion No. 25, “Accounting"Accounting for Stock Issued to Employees,”" and related interpretations in accounting for its 1997 Plan, 1999 Plan and 2000 Plan. All options granted in 2002, 2003 and 2004, except as noted below, were at or above fair market value on the date of grant.
169
On May 18, 2005, the Compensation Committee of the Company’sCompany's Board of Directors approved the acceleration of vesting of all unvested options to purchase shares of the Company’sCompany's common stock that were held by current employees, including executive officers, and which have an exercise price per share equal to or greater than $10.00. Options to purchase 2,044,487 shares of common stock were subject to this acceleration. The options subject to acceleration had a weighted average exercise price of $12.02. The exercise prices and number of shares subject to the accelerated options were unchanged.
On September 19, 2005, the Compensation Committee of the Company’sCompany's Board of Directors approved the acceleration of vesting of all unvested options to purchase shares of the Company’sCompany's common stock that were held by current employees, including executive officers, and excluding Directors and which have an exercise price per share equal to or greater than $8.00. Options to purchase 1,026,197 shares of common stock were subject to this acceleration. The options subject to acceleration had a weighted average exercise price $9.06. The exercise prices and number of shares subject to the accelerated options were unchanged.
On December 21, 2005, the Company’sCompany's Board of Directors approved, subject to certain limited conditions, the acceleration of vesting of all unvested options to purchase shares of common stock of the Company that were held by employees, and which have an exercise price per share equal to or greater than $6.50. The acceleration was effective as of December 30, 2005, provided that holders of incentive stock options within the meaning of Section 422 of the Internal Revenue Code of 1986, as amended, were given the election to decline the acceleration of an option if such acceleration would have the effect of changing the status of such option for federal income tax purposes from an incentive stock option to a non-qualified stock option. Options to purchase approximately 316,239 shares of common stock were subject to this acceleration. The options subject to acceleration had a weighted average exercise price of $6.82. The number of shares subject to the accelerated options remained unchanged.
The acceleration of these options was undertaken to avoid recognition of future compensation expense that the Company would otherwise recognize in its consolidated statement of operations with respect to these options once the Financial Accounting Standards (“FASB”("FASB") No. 123 (revised 2004) “Share-Based Payment”"Share-Based Payment", issued by the Financial Accounting Standards Board, becomesbecame effective. As originally issued by the FASB, SFAS No. 123 was to be implemented as of the beginning of the first
KRATOS DEFENSE & SECURITY SOLUTIONS, INC.
Notes to Consolidated Financial Statements (Continued)
Years ended December 31, 2005, 2006 and 2007
Note 11. Stockholders' Equity (Continued)
interim or annual period beginning after June 15, 2005. In April, 2005, the SEC announced it willwould permit companies to implement SFAS No. 123R at the beginning of the next fiscal year. The future expense that was eliminated as a result of the acceleration of the accelerated vesting of these options was approximately $18.4 million, net of tax (of which approximately $7.8 million was attributable to options held by executive officers and $0.4 million is attributable to options held by directors).
In addition, on December 21, 2005, the Board of Directors of the Company approved, subject to certain limited conditions, the amendment of all outstanding stock option grants under the Company’sCompany's 1999 Equity Incentive Plan and 2000 Nonstatutory Stock Option Plan (collectively, the “"Option Plans”"), with an exercise price per share greater than 120% of the closing market price of the Company’sCompany's common stock on December 29, 2005 to provide that, as of December 30, 2005, the exercise price of each outstanding stock option under the Option Plans shall be reduced to 120% of the closing price of the Company’sCompany's common stock as reported on the NASDAQ National Market on December 29, 2005;provided, however, that the holder of such outstanding stock option is an employee of the Company on December 30, 2005, but excluding (i) employees of the Company that are categorized as project staff associates and (ii) employees who have, prior to December 30, 2005, given notice to, or received notice from, the Company terminating their employment on a date or time period after December 30, 2005. There was no financial impact related to this amendment.
The acceleration of these options was undertaken to eliminate the future compensation expense that the Company would otherwise recognizehave recognized in its consolidated statement of operations with respect to these
options once the Statement of Financial Accounting Standards No. 123 (revised 2004) “Share-Based Payment”"Share-Based Payment", issued by the Financial Accounting Standards Board (“("FAS 123”"), becomesbecame effective for reporting periods beginning in January 2006. Assuming that no holders of incentive stock options elect to decline the acceleration, theThe future expense that iswas eliminated as a result of the acceleration of the vesting of these options iswas approximately $0.8 million (none of which is attributable to options held by executive officers). In addition, because the repricing will occuroccurred in lieu of additional option grants in 2006 of approximately 2.5 million shares for certain of the Company’sCompany's employees (the “2006"2006Option Grants”"), the repricing enabled the Company to significantly offset the dilutive impact of the 2006 Option Grants by reducing both the FAS 123 compensation expense for future option grants as well as the dilution to the Company’sCompany's outstanding share amount.
Effective January 1, 2006, the Company adopted the provisions of Statement of Financial Accounting Standards No. 123R (“("SFAS 123R”123R"), “Share-Based"Share-Based Payments,”" which requires the measurement and recognition of compensation expense for all share-based payment awards to employees and directors based on estimated fair values. SFAS 123R supersedes the Company’sCompany's previous accounting methodology using the intrinsic value method under Accounting Principles Board Opinion APB No. 25, “Accounting"Accounting for Stock Issued to Employees.”" Under the intrinsic value method, no share-based compensation expense related to stock option awards granted to employees had been recognized in the Company’sCompany's Consolidated Statements of Operations, as all stock option awards granted under the plans had an exercise price equal to or greater than the market value of the common stock on the date of grant. The Company has no awards with market or performance conditions.
The Company adopted SFAS 123R using the modified prospective transition method. Under this transition method, compensation expense recognized during the twelve monthsyears ended December 31, 2006 and 2007 included: (a) compensation expense for all share-based awards granted prior to, but not yet vested, as of December 31, 2005, based on the grant date fair value estimated in accordance with the
KRATOS DEFENSE & SECURITY SOLUTIONS, INC.
Notes to Consolidated Financial Statements (Continued)
Years ended December 31, 2005, 2006 and 2007
Note 11. Stockholders' Equity (Continued)
original provisions of SFAS 123, and (b) compensation expense for all share-based awards granted subsequent to December 31, 2005, based on the grant date fair value estimated in accordance with the provisions of SFAS 123R. In accordance with the modified prospective transition method, the Company’sCompany's consolidated financial statements for prior periods have not been restated to reflect the impact of SFAS 123R.
On December 28, 2006, the Board of Directors of the Company approved the acceleration of vesting of all unvested options issued prior to June 30, 2006 to purchase shares of common stock of the Company that arewere held by employees and directors. The acceleration was effective as of December 29, 2006, provided that holders of incentive stock options within the meaning of Section 422 of the Internal Revenue Code of 1986, as amended, were given the election to decline the acceleration of an option if such acceleration would have the effect of changing the status of such option for federal income tax purposes from an incentive stock option to a non-qualified stock option. Options to purchase approximately 2.1 million shares of common stock were subject to this acceleration. The number of shares subject to the accelerated options will remain unchanged.
The acceleration of these options was undertaken to eliminate the future compensation expense that the Company would have otherwise recognizerecognized in its consolidated statement of operations with respect to these options under the Statement of Financial Accounting Standards No. 123R “Share-Based Payment”"Share-Based Payment", issued by the Financial Accounting Standards Board (“("FAS 123R”"). The future expense that is eliminated as a result of the acceleration of the vesting of these options is approximately $7.5 million (of which approximately $1.4 million is attributable to options held by executive officers). The expense that was incurred in 2006 related to the vesting of these options was $ 9.2$5.4 million in continuing operations and $0.3$4.1 million in discontinued operations due tooperations.
On January 10, 2007, the fact that the future expense assumed that options would be forfeited as employees left the company and the accelerationCompensation Committee of the vesting resulted inBoard approved a 0% forfeiture rateform of Restricted Stock Unit Agreement (the "RSU Agreement") to govern the issuance of restricted stock units ("RSU") to executive officers under the Company's 2005 Plan. Each RSU represents the right to receive a share of common stock (a "Share") on the vesting date. Unless and until the RSUs vest, the Employee will have no right to receive Shares under such RSUs. Prior to actual distribution of Shares pursuant to any vested options and thusRSUs, such RSUs will represent an unsecured obligation of the Company, payable (if at all) only from the general assets of the Company. The RSUs that may be awarded to executive officers under the RSU Agreement will vest according to vesting schedules specified in the notice of grant accompanying each grant. We recognize compensation expense on a higher expense.straight-line basis over the vesting periods based on the market price of our stock on the grant date. Of the awards granted in 2007, the vesting periods ranged from 11 months to 10 years with accelerated vesting occurring upon a change in control or termination. Upon exercise of the RSU, the Company issues new shares of common stock.
Information under FAS123R for Fiscal 2006 and 2007
The Company records compensation expense for employee stock options based on the estimated fair value of the options on the date of grant using the Black-Scholes option-pricing model and the weighted average assumptions (annualized percentages) included in the following table. Awards with
KRATOS DEFENSE & SECURITY SOLUTIONS, INC.
Notes to Consolidated Financial Statements (Continued)
Years ended December 31, 2005, 2006 and 2007
Note 11. Stockholders' Equity (Continued)
graded vesting are recognized using the straight-line method. Fair value under SFAS No. 123R is determined using the Black-Scholes option-pricing model with the following assumptions:
|
| 2006
|
|
Expected life:(1)
| | | |
Stock options
| | 3.8 years
| |
Purchase plan
| | —
| |
Risk-free interest rate(2)
| | 4.6
| %
|
Volatility(3)
| | 61.7
| %
|
Forfeiture rate(4)
| | 23.7
| %
|
Dividend yield(5)
| | —
| |
| | 2006
| | 2007
| |
|---|
| Expected life:(1) | | | | | |
| | Stock options | | 3.8 years | | 10.0 years | |
| | Purchase plan | | — | | — | |
| Risk-free interest rate(2) | | 4.6 | % | 4.5 | % |
| Volatility(3) | | 61.7 | % | 56.8 | % |
| Forfeiture rate(4) | | 23.7 | % | 23.7 | % |
| Dividend yield(5) | | — | | — | |
- (1)
The expected life of stock options granted under the Plans is based upon historical exercise patterns which the Company believes are representative of future behavior.behavior or the life of the option when the options are 100% vested at grant. All options granted in 2007 were 100% vested at grant date and had a life of 10 years. The expected life of shares under the Purchase Plan represents the amount of time remaining in the offering period.
(2)The risk-free interest rate is based on U.S. Treasury yields in effect at the time of grant with a term equal to the expected term of the options.
(3)The Company estimatesestimated the implied volatility of its common stock at the date of grant based on an equally weighted average of trailing volatility and market based implied volatility for the computation.computation in 2006 and in 2007 we estimated implied volatility based upon trailing volatility.
(4)Forfeitures are estimated at the time of grant based upon historical information. Forfeitures will be revised, if necessary, in subsequent periods if actual forfeitures differ from estimates. Previously, under APB25, the Company recognized forfeitures as they were incurred.
(5)The Company has no history or expectation of paying dividends on its common stock.
KRATOS DEFENSE & SECURITY SOLUTIONS, INC.
Notes to Consolidated Financial Statements (Continued)
Years ended December 31, 2005, 2006 and 2007
Note 11. Stockholders' Equity (Continued)
Upon option exercise, the Company issues new shares of common stock. A summary of the status of the Company’sCompany's stock option plan as of December 31, 20062007 and of changes in options outstanding under the plan for the year ended December 31, 20062007 is as follows:
| | Number of
Shares | | Weighted-
Average
Exercise Price
per Share | | Weighted-
Average
Remaining
Contractual
Term
(in years) | | Aggregate
Intrinsic Value | |
| | (000’s) | | | | | | (000’s) | |
Options outstanding at December 31, 2005 | | | 13,165 | | | | $ | 6.27 | | | | | | | | | | |
Options granted | | | 572 | | | | 4.71 | | | | | | | | | | |
Options exercised | | | (147 | ) | | | 3.85 | | | | | | | | | | |
Options forfeited or expired | | | (1,961 | ) | | | 6.42 | | | | | | | | | | |
Options outstanding at December 31, 2006 | | | 11,629 | | | | $ | 6.08 | | | | 6.6 | | | | $ | 176.7 | | |
Options vested and exercisable at December 31, 2006. | | | 11,435 | | | | $ | 6.11 | | | | 6.6 | | | | $ | 130.7 | | |
| | Number of Shares
| | Weighted-Average Exercise Price per Share
| | Weighted-Average Remaining Contractual Term (in years)
| | Aggregate Intrinsic Value
|
|---|
| | (000's)
| |
| |
| | (000's)
|
|---|
| Options outstanding at December 31, 2006 | | 11,144 | | $ | 6.12 | | | | | |
| | Options granted | | 15 | | | 2.18 | | | | | |
| | Options exercised | | (15 | ) | | 1.68 | | | | | |
| | Options forfeited or expired | | (4,963 | ) | | 5.93 | | | | | |
| | |
| |
| | | | | |
| Options outstanding at December 31, 2007 | | 6,181 | | $ | 6.28 | | 5.5 | | $ | 10.5 |
| | |
| |
| |
| |
|
| Options exercisable at December 31, 2007 | | 6,145 | | $ | 6.31 | | 5.5 | | $ | 9.8 |
| | |
| |
| |
| |
|
172
As of December 31, 20062007, there was $1.6 million$26 thousand of total unrecognized stock compensation expense related to nonvested shares which is expected to be recognized over a remaining weighted-average vesting period of 2.61.4 years. The total intrinsic value of options exercised during
During the yearyears ended December 31, 2006 was $0.7 million. The weighted-average estimated fair value of employee stock options granted during 2006 was $2.33. The total fair value of options vested duringand 2007, the year was $11.1 million.following activity occurred under our option plans:
(In thousands except weighted average grant date fair value)
| | 2006
| | 2007
|
|---|
| Weighted average grant date fair value of options granted | | $ | 2.33 | | $ | 1.54 |
| Total intrinsic value of options exercised | | $ | 179 | | $ | 10 |
Additional information about stock options outstanding at December 31, 20062007 with exercise prices less than $2.85$2.35 per share, the exercise price at December 29, 200631, 2007 the last trading day of the period, follows (number of shares in thousands):
| | | Exercisable | | Unexercisable | | Total | | | Exercisable
| | Unexercisable
| | Total
|
|---|
Stock Options | | | | Number
of Shares | | Weighted
Average
Exercise
Price | | Number
of Shares | | Weighted
Average
Exercise
Price | | Number
of Shares | | Weighted
Average
Exercise
Price | | | Number of Shares
| | Weighted Average Exercise Price
| | Number of Shares
| | Weighted Average Exercise Price
| | Number of Shares
| | Weighted Average Exercise Price
|
|---|
Less than $2.85 | | | 140 | | | | $ | 1.94 | | | | 68 | | | | $ | 2.21 | | | | 208 | | | | $ | 2.03 | | | |
Above $2.85 | | | 11,295 | | | | $6.16 | | | | 126 | | | | $5.80 | | | | 11,421 | | | | $6.16 | | | |
| Less than $2.35 | | | 109 | | $ | 2.03 | | 35 | | $ | 2.03 | | 144 | | $ | 2.04 |
| Above $2.35 | | | 6,036 | | $ | 6.39 | | 1 | | $ | 6.39 | | 6,037 | | $ | 6.39 |
| | | |
| | | |
| | | |
| | |
Total outstanding | Total outstanding | | | 11,435 | | | | $ | 6.11 | | | | 194 | | | | $ | 4.53 | | | | 11,629 | | | | $ | 6.08 | | | | 6,145 | | $ | 6.31 | | 36 | | $ | 2.15 | | 6,181 | | $ | 6.28 |
| | | | | | | | | | | | | | | | | | | | | | | | | | | | |
| | | |
| | | |
| | |
KRATOS DEFENSE & SECURITY SOLUTIONS, INC.
Notes to Consolidated Financial Statements (Continued)
Years ended December 31, 2005, 2006 and 2007
Note 11. Stockholders' Equity (Continued)
(Shares in Thousands)
| | Restricted Stock Units (000's)
| | Weighted-Average Grant-Date Fair Value
|
|---|
| Nonvested balance at December 31, 2006 | | — | | | — |
| Grants | | 2,751 | | $ | 2.29 |
| Vested | | (550 | ) | | 2.36 |
| Forfeitures | | (40 | ) | | 2.33 |
| | |
| |
|
| Nonvested balance at December 31, 2007 | | 2,156 | | $ | 2.28 |
| | |
| |
|
As of December 31, 2007, there was $4.6 million of total unrecognized stock compensation expense related to nonvested restricted stock units which is expected to be recognized over a remaining weighted-average vesting period of 8.8 years. The fair value of RSU awards that vested in 2007 was $1.2 million (none in 2005 and 2006).
Information under FAS 123 for Periods Prior to Fiscal 2006
Stock option transactions are summarized below (shares in thousands):
| | | | Options Outstanding | |
| | Shares | | Number of | | Exercise Price per Share | |
| | Available for
Grant | | Shares
Outstanding | | Range | | Weighted
Average | |
Outstanding at December 31, 2003 | | | 9,340 | | | | 11,374 | | | $ | 1.33 - $132.06 | | | $ | 9.16 | | |
Plan Shares Expired | | | (157 | ) | | | — | | | — | | | — | | |
Granted | | | (3,807 | ) | | | 3,807 | | | $ | 3.69 - $14.86 | | | $ | 8.49 | | |
Exercised | | | — | | | | (1,534 | ) | | $ | 1.33 - $15.00 | | | $ | 4.74 | | |
Cancelled | | | 1,816 | | | | (1,816 | ) | | $ | 1.33 - $132.00 | | | $ | 11.79 | | |
Outstanding at December 31, 2004 | | | 7,192 | | | | 11,831 | | | $ | 1.33 - $132.06 | | | $ | 9.11 | | |
Plan Shares Expired | | | (28 | ) | | | — | | | — | | | | | |
Granted | | | (10,196 | ) | | | 10,196 | | | $ | 4.95 - $9.54 | | | $ | 6.22 | | |
Exercised | | | — | | | | (593 | ) | | $ | 1.33 - $6.43 | | | $ | 4.31 | | |
Cancelled | | | 8,269 | | | | (8,269 | ) | | $ | 3.58 - $132.00 | | | $ | 10.42 | | |
Outstanding at December 31, 2005 | | | 5,237 | | | | 13,165 | | | $ | 1.33 - $52.88 | | | $ | 6.27 | | |
| |
| | Options Outstanding
|
|---|
| |
| |
| | Exercise Price per Share
|
|---|
| | Shares Available for Grant
| | Number of Shares Outstanding
| | Range
| | Weighted Average
|
|---|
| Outstanding at December 31, 2004 | | 7,192 | | 11,831 | | $1.33—$132.06 | | $ | 9.11 |
| | Plan Shares Expired | | (28 | ) | — | | — | | | |
| | Granted | | (10,196 | ) | 10,196 | | $4.95—$9.54 | | $ | 6.22 |
| | Exercised | | — | | (593 | ) | $1.33—$6.43 | | $ | 4.31 |
| | Cancelled | | 8,269 | | (8,269 | ) | $3.58—$132.00 | | $ | 10.42 |
| | |
| |
| | | | | |
| Outstanding at December 31, 2005 | | 5,237 | | 13,165 | | $1.33—$52.88 | | $ | 6.27 |
| | |
| |
| | | | | |
(c) Employee Stock Purchase Plan
In August 1999, the Board of Directors approved the 1999 Employee Stock Purchase Plan (the “Purchase Plan”"Purchase Plan"). A total of 2.9 million shares of Common Stock have been authorized for issuance under the Purchase Plan. The Purchase Plan qualifies as an employee stock purchase plan within the meaning of Section 423 of the Internal Revenue Service Code. The Purchase Plan commenced in November 1999 upon completion of the Company’sCompany's initial public offering. On November 16, 2005, the Compensation Committee of the Board of Directors elected to suspend all future offerings under the Purchase Plan effective January 1, 2006.
Unless otherwise determined by the Compensation Committee of the Board of Directors, all employees were eligible to participate in the Purchase Plan so long as they are employed by the Company (or a subsidiary designated by the board) for at least 20 hours per week and were customarily employed by the Company (or a subsidiary designated by the board) for at least 5 months per calendar year.
KRATOS DEFENSE & SECURITY SOLUTIONS, INC.
Notes to Consolidated Financial Statements (Continued)
Years ended December 31, 2005, 2006 and 2007
Note 11. Stockholders' Equity (Continued)
Employees who actively participated in the Purchase Plan were eligible to have up to 15% of their earnings for each purchase period withheld pursuant to the Purchase Plan. The amount that was withheld was used at various purchase dates within the offering period to purchase shares of Common Stock. The price paid for Common Stock at each such purchase date was then equal the lower of 85% of the fair market value of the Common Stock at the commencement date of that offering period or 85% of the fair market value of the Common Stock on the relevant purchase date. Employees were also able to end their participation in the offering at any time during the offering period, and participation ended automatically upon termination of employment. From the Purchase Plan’sPlan's inception through December 31, 2005,2007, the cumulative number of shares of Common Stock that have been issued under the Purchase Plan was 2,005,899.
(d) Restricted Stock Unit Agreement
On January 10, 2007, the Compensation Committee of the Board approved a form of Restricted Stock Unit Agreement (the “RSU Agreement”) to govern the issuance of restricted stock units (“RSU”) to executive officers under the Company’s 2005 Equity Incentive Plan (the “Plan”). Each RSU represents the right to receive a share of Stock (a “Share”) on the vesting date. Unless and until the RSUs vest, the Employee will have no right to receive Shares under such RSUs. Prior to actual distribution of Shares pursuant to any vested RSUs, such RSUs will represent an unsecured obligation of the Company, payable (if at all) only from the general assets of the Company. The RSUs that may be awarded to executive officers under the RSU Agreement will vest according to vesting schedules specified in the notice of grant accompanying each grant.
(e) Shelf Registration
On February 19, 2004 the Company filed a universal shelf Registration statement on Form S-3 and an acquisition shelf Registration on Form S-4 with the Securities and Exchange Commission (SEC). The Company has no immediate plans to raise capital under the shelf Form S-3 or to utilize the shelf Form S-4 for acquisition transactions.transactions and the registration statements are not currently usable due to the late filings made in 2007. The universal shelf registration statement on Form S-3 will permit the Company to sell, in one or more public offerings, shares of newly issued common stock, shares of newly issued preferred stock, warrants or debt securities, or any combination of such securities, for proceeds in an aggregate amount of up to $200 million. In addition, the universal shelf will permit certain stockholders who purchased the Company’sCompany's Series A and Series B Convertible Preferred Stock, to sell up to 5.4 million shares of common stock, all of which are currently included in the Company’sCompany's December 31, 2005 weighted average diluted common shares outstanding. The acquisition shelf registration statement on Form S-4 will enable the Company to issue up $200 million of its common stock in one or more acquisition transactions that the Company may make from time to time. These transactions may include the acquisition of assets, businesses or securities, whether by purchase, merger or any other form of business.
(f)(e) Stockholder Rights Agreement
On December 16, 2004, the Company entered into a Stockholder Right Agreement (the “Rights Agreement”"Rights Agreement"). Under the terms of the Rights Agreement, initially, the Rights will attach to all certificates representing shares of outstanding Company common stock and no separate Rights Certificates will be distributed. Subject to the provisions of the Rights Agreement the Rights will separate from the Company common stock and the “Distribution Date”"Distribution Date" will occur upon the earlier of (i) ten business days following a public announcement (the date of such announcement being the “Stock"Stock Acquisition Date”Date") that person or group of affiliated or associated persons has acquired or obtained the right to acquire beneficial ownership of 15% or more of the then-outstanding Common Stock (an “Acquiring Person”"Acquiring Person"), or (ii) ten business days (or such later date as may be determined by action of the Board of Directors prior to such time as any person becomes an Acquiring Person) following the commencement of a tender offer or exchange offer
that would result in a person or group becoming an Acquiring Person. An Acquiring Person does not include certain persons specified in the Rights Agreement.
KRATOS DEFENSE & SECURITY SOLUTIONS, INC.
Notes to Consolidated Financial Statements (Continued)
Years ended December 31, 2005, 2006 and 2007
Note 11. Stockholders' Equity (Continued)
On December 16, 2004, the Company’sCompany's Board of Directors authorized and declared a dividend of one right (a “Right”"Right") to purchase on one-hundredth of a share of the Company’sCompany's Series C Preferred Stock (“("Series C Preferred”Preferred") for each outstanding share of Common Stock, par value $0.001 (“("Common Stock”Stock"), to stockholders of record as of the close of business December 27, 2004 (the “Record Date”"Record Date"). Each Right entitles the registered holder, subject to the terms of the Rights Agreement, to purchase from the Company one one-hundredth of a share of Series C Preferred at a purchase price of $54.00, subject to adjustment (the “Purchase Price”"Purchase Price").
The Rights are not exercisable until the Distribution Date and will expire at the close of business on the tenth anniversary of the Rights Agreement unless earlier redeemed or exchanged by the Company.
Note 12. Employee Benefit Plan
In 1996, the Company implemented a 401(k) savings plan pursuant to Section 401(k) of the Internal Revenue Code (the “Code”"Code"), covering substantially all employees. Participants in the plan may contribute a percentage of compensation, but not in excess of the maximum allowed under the Code. The Company may make contributions at the discretion of its Board of Directors. The Company made contributions of $0.3 million in 2004, $2.1 million in 2005, and $1.2$2.5 million in 2006.2006 and $2.1 million in 2007.
On November 18, 2004, the Board of Directors adopted the Wireless Facilities, Inc. Nonqualified Deferred Compensation Plan, effective as of January 1, 2005 (the “Plan”"Plan"). The Plan provides executive officers and other eligible highly compensated employees with the opportunity to enter into agreements to defer up to eighty percent (80%) of their cash compensation derived from base salary, bonus awards and/or commissions. In addition, the Company may, in its sole and absolute discretion, award any participant under the Plan an additional employer contribution. Deferrals are adjusted for gain or loss based on the performance of one or more investment options selected by the participant from among investment funds chosen by the committee appointed to administer the Plan. Participants may elect that distribution of deferred amounts be paid in the form of either a lump sum or in annual installments if the participant terminates employment as a result of his or her retirement. However, all other distributions under the Plan will be made in a single lump sum. Distributions occur upon termination of service or upon such other dates that may be elected by the participant in accordance with the terms of the Plan. The Company, in its sole discretion, may suspend or terminate the Plan or revise of amend it in any respect whatsoever; provided, however, that no such action may reduce amounts credited to deferral accounts and such accounts will continue to be owed to the participants or beneficiaries and will continue to be a liability of the Company.
175KRATOS DEFENSE & SECURITY SOLUTIONS, INC.
Notes to Consolidated Financial Statements (Continued)
Years ended December 31, 2005, 2006 and 2007
Note 13. Significant Customers
The following table presents our key customers for the years presented and the percentage of net sales made to such customers (in millions):
Key Customer | | | | Revenue | | % of Total
Revenue | |
2004 | | | | | | | | | |
Cingular (now AT&T) | | | $ | 67.9 | | | | 23 | % | |
Western Wireless | | | 28.0 | | | | 10 | % | |
2005 | | | | | | | | | |
Cingular (now AT&T) | | | 98.8 | | | | 29 | % | |
U.S. Navy | | | 33.6 | | | | 10 | % | |
2006 | | | | | | | | | |
Cingular (now AT&T) | | | 89.6 | | | | 27 | % | |
U.S. Navy | | | 34.2 | | | | 10 | % | |
Sprint | | | 31.9 | | | | 10 | % | |
| | | | | | | | | | | | |
Key Customer
| | Revenue
| | % of Total Revenue
| |
|---|
| 2005 | | | | | | |
| | U.S. Navy | | $ | 33.6 | | 22 | % |
| 2006 | | | | | | |
| | U.S. Navy | | $ | 34.2 | | 22 | % |
| 2007 | | | | | | |
| | U.S. Army | | $ | 46.7 | | 24 | % |
| | U.S. Navy | | $ | 38.7 | | 20 | % |
Our top five customers accounted for approximately 53%38%, 54%47% and 56%62% of our total revenue in 2004, 2005, 2006 and 2006,2007, respectively. The U.S. Navy is a customer
For the fiscal year ended December 31, 2007, two customers comprised approximately 60% of our Government Services segmentfederal business revenues and Cingular (now AT&T), Sprint and Western Wireless areour five largest customers accounted for approximately 84% of our Wireless Network Services segment.federal business revenues.
The following table presents net accounts receivable for customers with significant concentrations (in millions):
Key Customer | | | | Accounts receivable, net | | % of Total accounts
receivable, net | |
2004 | | | | | | | | | |
Cingular (now AT&T) | | | $ | 14.9 | | | | 11 | % | |
2005 | | | | | | | | | |
Cingular (now AT&T) | | | 35.1 | | | | 35 | % | |
2006 | | | | | | | | | |
Cingular (now AT&T) | | | 18.0 | | | | 16 | % | |
Sprint | | | 17.2 | | | | 15 | % | |
| | | | | | | | | | | | |
Key Customer
| | Accounts receivable, net
| | % of Total accounts receivable, net
| |
|---|
| 2006 | | | | | | |
| | FMS | | $ | 6.4 | | 11 | % |
| 2007 | | | | | | |
| | U.S. Army | | $ | 15.2 | | 20 | % |
| | U.S. Navy | | $ | 10.4 | | 14 | % |
Note 14. Segment Information
SFAS No. 131, “Disclosures about Segments of an Enterprise and Related Information,” establishes annual and interim reporting standards for an enterprise’s operating segments and related disclosures about its products, services, geographic areas and major customers. An operating segment is defined as a component of an enterprise that engages in business activities from which it may earn revenues and incur expenses, and about which separate financial information is regularly evaluated by the chief operating decision maker in deciding how to allocate resources. Our chief operating decision maker is our Chief Executive Officer.
In 2004, the The Company reorganized its operating segments to reflect its current operations and strategic direction. Effective January 1, 2004, the Company reorganizedhas historically organized its business along service lines includingto include three reportable segments: Wireless Network Services (WNS), Enterprise Network Services (ENS) and Government Network Services.Services (GNS). The Company evaluatesWireless Network Services segment was discontinued in the performancefirst quarter of our operating segments based on operating income. Operating income includes2007 (see Note 4) and we have renamed the allocation of certain corporate expensesENS segment to the segments, including depreciationPublic Safety & Security (PSS) segment and amortization expense relatedthe GNS segment to corporate assets.the Government Solutions (KGS) segment to more accurately describe the underlying business operations. Certain income and charges that are not allocated to segments in the Company’sCompany's management reports because they are not considered in evaluating the segments’segments' operating performance.performance are categorized as reconciling items in the table below. Unallocated income and charges are
primarily related to corporate expenses previously allocated to the discontinued wireless network services segment prior to the disposal of those businesses, share based compensation charges and related tax adjustments, impairment and accruals such as unused office space.restructuring charges and expenses related to the stock option investigation conducted in 2007. As a result of the divestiture of the WNS businesses, the corporate expenses allocated to the PSS and KGS segments has increased in 2007, negatively impacting the
KRATOS DEFENSE & SECURITY SOLUTIONS, INC.
Notes to Consolidated Financial Statements (Continued)
Years ended December 31, 2005, 2006 we had discontinued substantially all of our international operations so all items presentedand 2007
Note 14. Segment Information (Continued)
operating income (loss) for these continuing operations relateoperations. Due to the United States and assets presented foraforementioned discontinued operations, relate to international geographical locations. All prior period amounts have been reclassified in order to conform withto the current period presentation and allocation methodology.
Revenues, operating income (loss) and assets provided by the Company’sCompany's segments for the years ended December 31, 2004, 2005, 2006 and 20062007 are as follows (in millions):
| | 2004 | | 2005 | | 2006 | |
| | (Restated) | | (Restated) | | | |
Revenues: | | | | | | | | | | | |
Wireless Network Services | | | $ | 179.3 | | | | $ | 185.4 | | | $ | 174.7 | |
Enterprise Network Services | | | 65.3 | | | | 67.3 | | | 55.6 | |
Government Network Services | | | 51.6 | | | | 85.0 | | | 97.5 | |
Total revenues | | | $ | 296.2 | | | | $ | 337.7 | | | $ | 327.8 | |
Operating income (loss): | | | | | | | | | | | |
Wireless Network Services | | | $ | 0.3 | | | | $ | 5.8 | | | $ | (2.7 | ) |
Enterprise Network Services | | | (8.1 | ) | | | 5.8 | | | (23.9 | ) |
Government Network Services | | | 4.2 | | | | 7.4 | | | 8.2 | |
Reconciling amounts | | | 9.2 | | | | (2.1 | ) | | (13.0 | ) |
Total operating income (loss) | | | $ | 5.6 | | | | $ | 16.9 | | | $ | (31.4 | ) |
Assets: | | | | | | | | | | | |
Wireless Network Services | | | $ | 162.4 | | | | $126.6 | | | $ | 109.0 | |
Enterprise Network Services | | | 40.3 | | | | 59.9 | | | 27.9 | |
Government Network Services | | | 61.8 | | | | 86.6 | | | 188.0 | |
Discontinued Operations | | | 66.2 | | | | 69.0 | | | 11.0 | |
Total assets | | | $ | 330.7 | | | | $ | 342.0 | | | $ | 335.9 | |
| | 2005
| | 2006
| | 2007
| |
|---|
| Revenues: | | | | | | | | | | |
| | Government Solutions | | $ | 85.0 | | $ | 97.5 | | $ | 142.5 | |
| | Public Safety & Security | | | 67.3 | | | 55.6 | | | 51.1 | |
| | |
| |
| |
| |
| | | Total revenues | | $ | 152.3 | | $ | 153.1 | | $ | 193.6 | |
| Operating income (loss) from continuing operations: | | | | | | | | | | |
| | Government Solutions | | $ | 7.4 | | $ | 8.2 | | $ | 3.3 | |
| | Public Safety & Security | | | 5.8 | | | (23.9 | ) | | (6.6 | ) |
| | Corporate activities | | | (10.0 | ) | | (15.8 | ) | | (21.3 | ) |
| | |
| |
| |
| |
| | | Total operating income (loss) from continuing operations | | $ | 3.2 | | $ | (31.5 | ) | $ | (24.6 | ) |
| | |
| |
| |
| |
| | 2006
| | 2007
| |
|
|---|
| Assets: | | | | | | | | |
| | Government Solutions | | $ | 188.0 | | $ | 292.4 | | |
| | Public Safety & Security | | | 27.9 | | | 22.5 | | |
| | Discontinued Operations | | | 104.0 | | | 1.7 | | |
| | Corporate activities | | | 17.8 | | | 18.7 | | |
| | |
| |
| | |
| | | Total assets | | $ | 337.7 | | $ | 335.3 | | |
| | |
| |
| | |
The operating income (loss) of Enterprise Network Servicesthe Public Safety & Security segment for 2004, 2005, 2006 and 20062007 were impacted by the following items:
· an expense in 2004 for contingent acquisition consideration of $12.4 million resulting from the Company’s amendment of the purchase agreements related to two of the companies acquired in the ENS division.
·
- •
- a benefit to operating income in 2005 as a result of a $2.1 million credit to reduce an excess contingent acquisition accrual.
·
- •
- charges in 2006 of $18.3 million related to the impairment of goodwill and a $1.8 million impairment of an asset.
The operating loss related to the Wireless Network Services segment in 2006 is primarily due to reduced margins in our deployment business that have been negatively impacted by a large national deployment program under which the customer is issuing purchase orders for each separate phase of the project, rather than the entire project, resulting in the Company recording zero profit margin or below the anticipated projected margin at completion on these projects.
The reconciling amounts in 2004 were impacted by the reduction of approximately $12.2 million of previously recorded payroll tax adjustments related to stock-based compensation expense that was previously recorded related to stock-based compensation expense from 2000 to 2003. The reconciling amounts in 2006 were impacted by increased stock-based compensation expense due to the Company’sCompany's adoption of SFAS No. 123R in January 2006.
Assets Amounts related to corporate activities in 2007 were impacted by the costs of the Company’s corporate headquartersstock option investigation and other corporate related assets have been included incosts as well as the assets ofrecovery from the Wireless Network Services segment.former stock option administrator. See Note 2 to Notes to Consolidated Financial Statements.
Note 15. Related Party Transactions
On May 30, 2002, the Company issued an aggregate of 90,000 shares of Series B Convertible Preferred Stock, at an aggregate purchase price of $45.0 million, in a private placement to entities
KRATOS DEFENSE & SECURITY SOLUTIONS, INC.
Notes to Consolidated Financial Statements (Continued)
Years ended December 31, 2005, 2006 and 2007
Note 15. Related Party Transactions (Continued)
affiliated with one of the directors of the Company (40,000 shares), to a brother of the previous Chairman and Chief Executive Officer of the Company (10,000 shares) and to an unrelated third-party investor (40,000 shares). The Company received $44.9 million of net proceeds. Each share of Series B Convertible Preferred Stock is initially convertible into 100 shares of Common Stock for a conversion price of $5.00 per share, which was the fair market value of the common stock at the closing, at the option of the holder at any time, subject to certain provisions in the Series B Preferred Stock Purchase Agreement. The Series B Preferred Stock Purchase Agreement had a lock-up provision, which has expired priorPrior to March 5,December 31, 2004, on which date 40,00064,517 shares of Series B Convertible Preferred Stock were converted into 4,000,0006,451,700 shares of the Company’sCompany's Common Stock. On April 5, 2006, 15,483 shares of Series B Convertible Preferred Stock were converted into 1,548,300 shares of the Company’sCompany's Common Stock.
Through December 31, 2006,2007, the Company has received notices from the holders to convert an aggregate number of 80,000 shares of Series B Convertible Preferred Stock into an aggregate 8,000,000 shares of the Company’sCompany's Common Stock. On December 31, 2005 and December 31, 2006,2007, the total liquidatedliquidation preference equaled $12.7 million and $5.0 million, respectively.million.
In 2003, in connection with the Company’s acquisition of a company in its Enterprise Network Services business, the Company assumed certain facility lease obligations relating to facilities that were owned by the previous shareholders. The lease expense, which approximates $0.3 million, $0.2 million and $0.2 million for the years ended December 31, 2004, 2005 and 2006, respectively, is reflected in the statement of operations.
In connection with the Company’s acquisition of TLA in January 2005, the Company assumed certain facility lease obligations for a facility owned by the previous shareholders. The lease expense, which approximates $0.7 million for the year ended December 31, 2005 and December 31, 2006, respectively, is reflected in the statement of operations.
On February 17, 2006, the Company entered into a definitive agreement to divest all of its operations in Mexico for total approximate cash consideration of $18.0 million subject to adjustments for the closing net asset calculations, with $1.5 million payable in cash on signing of the Equity Purchase Agreement and $16.5 million by means of a secured promissory note payable in installments through December 2006, which approximates the net book value of the operations. The purchaser, Sakoki LLC, is a newly-formed entity controlled by Massih Tayebi. Although Massih Tayebi has no current role with the Company, he was a co-founder of the Company, having served as Chief Executive Officer from inception in 1994 through September 2000 and as a director from inception through April 2002. In addition, as of July 31, 2007, Massih Tayebi owns or controls approximately 8.2% of the total voting power of the Company’sCompany's capital stock. He is also the brother of Masood Tayebi, who was the Company’sCompany's Chairman of the Board of Directors until March 6, 2007. Masood Tayebi had no personal financial interest in the transaction and has no role with the entity that has purchased the Mexico Operations. The transaction was approved by the disinterested members of the Company’sCompany's Board of Directors after consideration of other expressions of interest and an independent valuation analysis.
The final closing balance sheet as of February 17, 2006 resulted in net asset adjustments aggregating to a total approximate $18.9 million consideration, $1.5 million which was paid on February 17, 2006, with the remaining $17.4 million payable by means of the promissory note in installments through December 31, 2006 with an interest rate of 7.5% per annum. On June 26, 2006, the Company entered into
an Addendum with the buyer to finalize the closing net asset calculations, pursuant to which the parties agreed that the resulting total purchase price was $18.9 million. The Addendum also provided for a conditional waiver that permits the purchaser to make the payment due on August 17, 2006 by September 30, 2006, and for the installments due on November 17, 2006 and December 31, 2006 to be made on or before December 29, 2006. Failure to make the payments on such later dates would have resulted in a restoration of the original terms of the note. The first scheduled note payment of $3.3 million was received from the buyer on May 19, 2006, and the second scheduled note payment of $5.5 million was received in installments of $5.2 million on September 29, 2006 and $0.3 million on October 10, 2006. The remaining note receivable balance of $9.5 million which included accrued interest through December 29, 2006, was paid in full in on December 29, 2006.
KRATOS DEFENSE & SECURITY SOLUTIONS, INC.
Notes to Consolidated Financial Statements (Continued)
Years ended December 31, 2005, 2006 and 2007
Note 16. Commitments and Contingencies
The Company periodically evaluates all pending or threatened contingencies and any commitments, if any, that are reasonably likely to have a material adverse effect on its operations or financial position. The Company assesses the probability of an adverse outcome and determines if it is remote, reasonably possible or probable as defined in accordance with the provisions of SFAS No. 5, “Accounting"Accounting for Contingencies.”" If information available prior to the issuance of the Company’sCompany's financial statements indicates that it is probable that an asset had been impaired or a liability had been incurred at the date of the Company’sCompany's financial statements, and the amount of the loss, or the range of probable loss can be reasonably estimated, then such loss is accrued and charged to operations. If no accrual is made for a loss contingency because one or both of the conditions pursuant to SFAS No. 5 are not met, but the probability of an adverse outcome is at least reasonably possible, the Company will disclose the nature of the contingency and provide an estimate of the possible loss or range of loss, or state that such an estimate cannot be made.
The Company assesses tax uncertainties and exposure items related to value added taxes (VAT) after taking into consideration the probability of the tax contingencies being incurred. Accordingly, based upon the Company’s assessment of the probability of these tax contingencies, it was determined that accruals of $0.8 million and $0.8 million for VAT tax contingencies were required as of December 31, 2005 and December 31, 2006, respectively.
The Company maintains an accrual for the Company’sCompany's health and workers compensation partial self-insurance, which is a component of total accrued expenses and current liabilities of discontinued operations in the consolidated balance sheets. Management determines the adequacy of these accruals based on a monthly evaluation of the Company’sCompany's historical experience and trends related to both medical and workers compensation claims and payments, information provided to the Company by the Company’sCompany's insurance broker, industry experience and the average lag period in which claims are paid. If such information indicates that the Company’sCompany's accruals require adjustment, the Company will, correspondingly, revise the assumptions utilized in the Company’sCompany's methodologies and reduce or provide for additional accruals as deemed appropriate. As of December 31, 2005, 2006 and December 31, 2006,2007, the accrual for the Company’sCompany's partial self-insurance programs approximated $2.6 million, $1.8 million and $1.8$1.1 million, respectively. In 2005, 2006 and 2007 the accrual for these programs which was related to continuing operations was $1.1 million, $0.2 million, and $0.6 million, respectively. The Company also carries stop-loss insurance that provides coverage limiting the Company’sCompany's total exposure related to each medical and workers compensation claim incurred, as defined in the applicable insurance policies. The medical and workers compensation annual claim limits are $100,000 and $250,000, respectively. For theeach year ending December 31,2005 and 2006, the Company experienced no claims that exceeded the limits for medical andhad one claim that exceeded the limits for workers compensation and in 2007 no claims exceeded the limits for workers compensation. For each year ending 2005 and 2006, the Company had no claim that exceeded the limits for medical insurance and in 2007 three claims exceeded the limits for medical insurance. As of December 31, 2006,2007, the Company had a $700,000 letter of credit outstanding issued from the Company’sCompany's insurance carrier to cover a performance bond and liabilities in connection with the Company’s workers’Company's workers' compensation partial self-insurance.
179 As of December 31, 2007 the Company has $2.4 million of standby letters of credit. The letters of credit related to our worker compensation program of $0.7 million and $1.7 as support for our performance bond on work overseas.
KRATOS DEFENSE & SECURITY SOLUTIONS, INC.
Notes to Consolidated Financial Statements (Continued)
Years ended December 31, 2005, 2006 and 2007
Note 17. Legal Matters
Contingencies
IPO Securities Litigation
Beginning in June 2001, WFIthe Company and certain of its officers and directors were named as defendants in several parallel class action shareholder complaints filed in the United States District Court for the Southern District of New York, now consolidated under the caption,In re Wireless Facilities, Inc. Initial Public Offering Securities Litigation, Case No. 01-CV-4779. In the amended complaint, the plaintiffs allege that WFI,the Company, certain of its officers and directors, and the underwriters of WFI’sthe Company's initial public offering (“IPO”("IPO") violated section 11 of the Securities Act of 1933 and section 10(b) of the Securities Exchange Act of 1934 based on allegations that WFI’sthe Company's registration statement and prospectus failed to disclose material facts regarding the compensation to be received by, and the stock allocation practices of, the IPO underwriters. The plaintiffs seek unspecified monetary damages and other relief. Similar complaints were filed in the same court against hundreds of other public companies (“Issuers”("Issuers") that conducted IPOs of their common stock in the late 1990s and 2000 (the “IPO Cases”"IPO Cases").
In June 2004, the Issuers (including WFI)the Company) executed a settlement agreement with the plaintiffs that would, among other things, result in the dismissal with prejudice of all claims against the Issuers and their officers and directors and the assignment of certain potential Issuer claims to the plaintiffs. On February 15, 2005, the court issued a decision certifying a class action for settlement purposes and granting preliminary approval of the settlement subject to modification of certain bar orders contemplated by the settlement. On August 31, 2005, the court reaffirmed class certification and preliminary approval of the modified settlement in a comprehensive Order. On February 24, 2006, the court dismissed litigation filed against certain underwriters in connection with certain claims to be assigned under the settlement. On April 24, 2006, the court held a Final Fairness Hearing to determine whether to grant final approval of the settlement. On December 5, 2006, the Second Circuit Court of Appeals vacated the lower court’scourt's earlier decision certifying as class actions the six IPO Cases designated as “focus"focus cases.”" Thereafter, the District Court ordered a stay of all proceedings in all of the IPO Cases pending the outcome of plaintiffs’plaintiffs' petition to the Second Circuit for rehearing en banc and resolution of the class certification issue. On April 6, 2007, the Second Circuit denied plaintiffs’plaintiffs' rehearing petition, but clarified that the plaintiffs may seek to certify a more limited class in the District Court. Accordingly, the stay remains in place and the plaintiffs and Issuers have stated that they are prepared to discuss how the settlement might be amended or renegotiated to comply with the Second Circuit’sCircuit's decision. Plaintiffs filed amended complaints in the six focus cases on or about August 14, 2007. On September 27, 2007, Plaintiffs filed a motion for class certification in the six focus cases. On November 13, 2007, the Issuer Defendants filed a motion to dismiss the amended complaints in the six focus cases. On November 14, 2007, the Underwriter Defendants filed a motion to dismiss the amended complaints in the six focus cases. The court has not yet set a deadline for the plaintiffs to file amended complaints in the other IPO lawsuits. WFI is covered by a claims-made liability insurance policy which it believes will satisfy any potential liability of WFI under this settlement. Due to the inherent uncertainties of litigation, and because the settlement may not receive final approval from the Court, the ultimate outcome of this matter cannot be predicted. In accordance with FASB No. 5,“"Accounting for Contingencies”Contingencies" WFI The Company believes any contingent liability related to this claim is not probable or estimable and therefore no amounts have been accrued in regards to this matter.
KRATOS DEFENSE & SECURITY SOLUTIONS, INC.
Notes to Consolidated Financial Statements (Continued)
Years ended December 31, 2005, 2006 and 2007
Note 17. Legal Matters (Continued)
2004 Securities Litigation
In August 2004, as a result offollowing the Company’sCompany's announcement on August 4, 2004 that it intended to restate its financial statements for the fiscal years ended December 31, 2000, 2001, 2002 and 2003, the Company and certain of its current and former officers and directors were named as defendants (“Defendants”("Defendants") in several securities class action lawsuits filed in the United States District Court for the Southern District of California. These actions were filed on behalf of those who purchased, or otherwise acquired, the Company’sCompany's common stock between April 26, 2000 and August 4, 2004. The lawsuits generally allege that, during that time period, Defendants made false and misleading statements to the investing
public about the Company’sCompany's business and financial results, causing its stock to trade at artificially inflated levels. Based on these allegations, the lawsuits allege that Defendants violated the Securities Exchange Act of 1934, and the plaintiffs seek unspecified damages. These actions have been consolidated into a single action—In re Wireless Facilities, Inc. Securities Litigation, Master File No. 04CV1589-JAH. Plaintiffs filed a First Amended Consolidated Class Action Complaint on April 1, 2005. Defendants filed their motion to dismiss this first amended complaint on April 14, 2005. The plaintiffs then requested leave to amend their first amended complaint. The plaintiffs filed their Second Amended Complaint on June 9, 2005, this time on behalf of those who purchased, or otherwise acquired, the Company’sCompany's common stock between May 5, 2003 and August 4, 2004. Defendants filed their motion to dismiss this Second Amended Complaint on July 14, 2005. The motion to dismiss was taken under submission on October 20, 2005 and on March 8, 2006, the courtCourt granted the Defendants’Defendants' motion. However, plaintiffs were granted the right to amend their complaint within 45 days and subsequently filed their Third Amended Consolidated Class Action Complaint on April 24, 2006. Defendants filed a motion to dismiss this complaint on June 8, 2006. On May 7, 2007, the courtCourt denied the Defendants’Defendants' motion to dismiss. Defendants’Defendants' filed their answer to the plaintiffs’plaintiffs' complaint on July 13, 2007. In February 2008, following a voluntary mediation of the matter, the parties reached a tentative agreement to settle the class action. Under the tentative settlement, plaintiffs and the class will dismiss all claims, with prejudice, in exchange for a cash payment in the total amount of $12 million. The Company's directors' and officers' liability insurers will pay the settlement amount in accordance with the Company's insurance policies, less any applicable retention or co-insurance obligations that are expected to be paid directly by the Company. The Company estimates that the amount of its payment toward the settlement will be approximately $2.4 million. The Company has accrued approximately $2.4 million as of December 31, 2007 related to this matter. The parties currently are in the process of documenting their agreement and then will seek a determination by the Court that the proposed settlement is fair, reasonable and adequate. The Company makes no assurances at this time that the Court will approve the proposed settlement terms or that the matter ultimately will be settled. Despite the tentative settlement reached in this action, the Company believes that the allegations lack merit and intends to vigorously defend all claims asserted. It is impossible at this time to assess whether or not the outcome of these proceedings will or will not have a material adverse effect on the Company. We have not recorded any accrual for a contingent liability associated with this legal proceeding based on the Company’s belief that a liability, while possible, is not probable and any range of potential future charge cannot be reasonably estimated at this time.merit.
In 2004, two derivative lawsuits were filed in the United States District Court for the Southern District of California against certain of the Company’sCompany's current and former officers and directors:Pedicini v. Wireless Facilities, Inc.,Case No. 04CV1663; andRoth v. Wireless Facilities, Inc.,Case No. 04CV1810. These actions were consolidated into a single action inIn re Wireless Facilities, Inc. Derivative Litigation, Lead Case No 04CV1663-JAH. TheThese lawsuits contain factual allegations in these lawsuitsthat are substantially similar to those made in the class action lawsuits, but the plaintiffs in these lawsuits assert claims for breach of fiduciary duty, gross mismanagement, abuse of control, waste of corporate assets,
KRATOS DEFENSE & SECURITY SOLUTIONS, INC.
Notes to Consolidated Financial Statements (Continued)
Years ended December 31, 2005, 2006 and 2007
Note 17. Legal Matters (Continued)
violation of Sarbanes Oxley Act section 304, unjust enrichment and insider trading. The plaintiffs in these lawsuits seek unspecified damages and equitable and/or injunctive relief. The lead plaintiff filed a consolidated complaint on March 21, 2005. On May 3, 2005, the defendants filed motions to dismiss this action, to stay this action pending the resolution of the consolidated non-derivative securities case pending in the Southern District of California, and to dismiss the complaint against certain non-California resident defendants. Pursuant to a request by the Court, Defendants’Defendants' motions were withdrawn without prejudice pending a decision on defendants’defendants' motion to dismiss the complaint against the non-California resident defendants. On March 20, 2007, the Court ruled that it lacked personal jurisdiction over five of the six non-California defendants and dismissed them from the federal derivative complaint. On March 27, 2007, plaintiffs filed an amended derivative complaint setting forth all of the same allegations from the original complaint and adding allegations regarding WFI’sthe Company's stock option granting practices. Basically, plaintiffs allege that WFI “backdated”the Company "backdated" or “springloaded”"springloaded" employee stock option grants so that the options were granted at less than fair market value. The amended complaint names all of the original defendants (including those dismissed for lack of jurisdiction) as well as nine new defendants. On July 2, 2007, the non-California resident defendants moved to dismiss the complaint for lack of personal jurisdiction. ThatOn October 17, 2007, the Court took the motion is set to be heard on November 5, 2007. Onceunder submission without oral argument. On February 26, 2008, the court has decided the issue ofCourt again ruled that it lacked personal jurisdiction WFI,over five of the six non-California defendants and dismissed them from the amended federal derivative complaint. The parties have conferred and discussed the Court's order and have stipulated to a briefing schedule for any remaining motions to dismiss that the Company, along with any remainingthe individual defendant founddefendants subject to the court’scourt's jurisdiction, may again movebring in an effort to dismiss the complaint as to them. Pursuant to the parties' stipulation, such motions must be brought on or before June 5, 2008. The Company believes that the allegations lack merit and intends to vigorously defend all claims asserted. It is impossible at this time to assess whether or not the outcome of these proceedings will or will not have a material adverse effect on the Company.
In April 2007, another derivative complaint was filed in the United States District Court for the Southern District of California,Hameed v. Tayebi, Case No. 07-CV-0680 BTM(RBB) (the “Hameed Action”"Hameed Action"), against several of WFI’sthe Company's current and former officers and directors. The allegations in this new derivative complaint mirror the amended allegations in the 2004 federal derivative action. Pursuant to a Courtthe Court's order and agreement betweenof the parties, the defendants need not responddefendants' responses to the complaint in theHameed
Action were stayed until the Court rulesruled on the motion to dismiss for lack of personal jurisdiction currently pending in the 2004 derivative litigation. OnceAs noted above, on February 26, 2008, the court inCourt ruled that matter has decided the issue ofit lacked personal jurisdiction over five of the non-California defendants named in the 2004 derivative action, including three that were also named in theHameed Action. The parties will meethave conferred and confer regarding defendants’ responsediscussed the Court's order and are in the process of stipulating to a briefing schedule for any remaining motions to dismiss that the Company, along with the individual defendants subject to the court's jurisdiction, may bring in an effort to dismiss theHameed Action. Action as to them. At this time, we are unablethe parties have not set a date by which such motions must be brought. The Company believes that the allegations lack merit and intends to form a professional judgment that an unfavorable outcome is either probable or remote. Moreover, if an unfavorable outcome should eventually occur, we are not at this time able to estimate the amount or range of possible loss.vigorously defend all claims asserted.
In August and September 2004, two virtually identical derivative lawsuits were filed in California Superior Court for San Diego County against certain of the Company’sCompany's current and former officers and directors. These actions contain factual allegations similar to those of the federal lawsuits, but the plaintiffs in these cases assert claims for violations of California’sCalifornia's insider trading laws, breaches of
KRATOS DEFENSE & SECURITY SOLUTIONS, INC.
Notes to Consolidated Financial Statements (Continued)
Years ended December 31, 2005, 2006 and 2007
Note 17. Legal Matters (Continued)
fiduciary duty, abuse of control, gross mismanagement, waste of corporate assets and unjust enrichment. The plaintiffs in these actions seek unspecified damages, equitable and/or injunctive relief and disgorgement of all profits, benefits and other compensation obtained by defendants. These lawsuits have been consolidated into one action—In re Wireless Facilities, Inc. Derivative Litigation,California Superior Court, San Diego County, Lead Case No. GIC 834253. The plaintiffs filed a Consolidated Shareholder Derivative Complaint on October 14, 2004. This action has been stayed pending a decision in federal court on a motion to dismiss the federal derivative lawsuits. The parties will appear before the judge inIn October 2007, to apprise the courtparties notified the Court of the status of the federal action and requested the court continue its stay of this action. The Company anticipates that the court will continue to stay this matter and that the court will request the parties file an updated status report in April 2008. The Company believes that the allegations lack merit and intends to vigorously defend all claims asserted. It is impossible at this time to assess whether or not the outcome of these proceedings will or will not have a material adverse effect on the Company. We have not
The Company has recorded anyan accrual for a contingent liability associated with thisthe legal proceedingproceedings related to the derivative actions of $0.8 million based on the Company’s belief that a liability, while possible, is not probable and any rangeCompany's estimate of the potential future charge cannot be reasonably estimated at this time.amount it would have to pay in relation to these lawsuits.
2007 Securities Litigation
In March and April 2007, there were three federal class actions filed in the United States District Court for the Southern District of California against WFIthe Company and several of its current and former officers and directors. These class action lawsuits followed WFI’sthe Company's March 12, 2007 public announcement that it iswas conducting a voluntary internal review of its stock option granting processes. These actions have been consolidated into a single action,In re Wireless Facilities, Inc. Securities Litigation II, Master File No. 07-CV-0482-BTM-NLS. AThe consolidated class action complaint was filed on November 19, 2007. In March 2008, following a voluntary mediation of the matter, the parties reached a tentative agreement to settle the class action. Under the settlement proposal, plaintiffs and the class will dismiss all claims, with prejudice, in exchange for a cash payment in the amount of $4.5 million. The Company's directors' and officers' liability insurers will pay the settlement amount, less any applicable retention or co-insurance obligations and contributions that are expected to be paid directly by the Company. The Company estimates that the total amount of its payment toward the settlement will be approximately $1.7 million. The Company has not been filed. Ataccrued approximately $1.7 million as of December 31, 2007 related to this time, wematter. The parties currently are unable to formin the process of documenting their agreement, and then will seek a professional judgmentdetermination by the Court that an unfavorable outcomethe proposed settlement is either probable or remote. Moreover, if an unfavorable outcome should eventually occur, we are notfair, reasonable and adequate. The Company makes no assurances at this time able to estimatethat the amountCourt will approve the proposed settlement terms or range of possible loss.that the matter ultimately will be settled. Despite the tentative settlement reached in this action, the Company believes that the allegations lack merit.
Other Litigation and Government Investigations
In January 2005, a former independent contractor of the Company filed a lawsuit in Brazil against the Company’sCompany's subsidiary, WFI de Brazil, to which he had been assigned for a period of time. He sought to be designated an employee of WFI de Brazil and entitled to severance and related compensation pursuant to Brazilian labor law. The individual sought back wages, vacation pay, stock
KRATOS DEFENSE & SECURITY SOLUTIONS, INC.
Notes to Consolidated Financial Statements (Continued)
Years ended December 31, 2005, 2006 and 2007
Note 17. Legal Matters (Continued)
option compensation and related benefits in excess of $0.5 million. This matter was argued before the appropriate labor court in July 2005 and in July, 2006, the labor court awarded the individual the Brazilian currency equivalent of approximately $0.3$0.6 million for his back wages, vacation pay and certain other benefits. The Company filed an appeal in the matter on July 20, 2006 and is challenging the basis for the award on several theories. The Company has accrued approximately $0.3$0.6 million as of September 30, 2006December 31, 2007 related to this matter. On August 22, 2007, the appeals court partially upheld the Company's appeal, although it upheld the individual's designation as an employee. The Company intendscourt is reviewing possible damage calculations before publishing a final decision. The Company's counsel is preparing a motion for clarification of the judgment due to pursueomissions in the appeal of this award.decision.
On March 28, 2007, three plaintiffs, on behalf of a purported class of similarly situated employees and contractors, filed a lawsuit against the Company in the Superior Court of the State of California, Alameda
County. The suit alleges various violations of the California Labor Code and seeks payments for allegedly unpaid straight time and overtime, meal period pay and associated penalties. The Company and the plaintiffs have agreed to venue for the suit in San Diego County. Based on our research to date,Although the Company has not concluded that it has any liability in the case. The Company believes that the allegations lack merit, it has agreed in principle with the plaintiffs to settle their claims for an aggregate amount in the range of $0.3 million to $0.5 million, to include individual and intendsincentive awards, attorneys' fees and administrative costs, subject to vigorously defend all claims asserted. It is impossible at this time to assess whether or notcourt approval. The actual amount paid by the outcomeCompany will depend upon the number of these proceedings will or will not have a material adverse effect onresponses received from members of the Company. We have notpurported class of plaintiffs. The Company has recorded anyan accrual for a contingent liability associated with this legal proceeding based on our belief that a liability, while possible, is not probable and any rangein the amount of potential future charge cannot be reasonably estimated at this time.$0.3 million.
On May 3, 2007, the Company announced that it has a filed a lawsuit against a former employee, Vencent Donlan, who previously served as its stock option administrator and left the Company in mid-2004, and his spouse. The lawsuit seeks to recover damages resulting from the theft by Donlan of WFI stock options and common stock valued in excess of $6.3 million. The thefts, which appear to have taken place during 2002 and 2003, were discovered through the Company’s review of its past practices related to the granting and pricing of employee stock options with the assistance of its outside counsel and forensic computer consultants. The complaint also alleges that Donlan attempted to cover up the scheme by, among other things, deleting entries from the Company’s records. WFI had promptly reported this discovery to the SEC in March 2007 when the theft was discovered. The SEC commenced an enforcement action against Donlan, and the U.S. Attorney’s Office forwarded a grand jury subpoena to the company seeking records related to Donlan and our historical option granting practices. The SEC filed a federal lawsuit and obtained a temporary restraining order and asset freeze against Donlan and his spouse. The U.S. Attorney’s Office indicted Donlan for the theft and he plead guilty to the federal criminal charges. The Company has cooperated with, and intends to continue to cooperate with both the SEC and the U.S. Attorney’s Office on this matter and otherwise.
In addition to the foregoing matters, from time to time, the Company may become involved in various claims, lawsuits and legal proceedings that arise in the ordinary course of business. However, litigation is subject to inherent uncertainties, and an adverse result in these or other matters may arise from time to time that may harm the Company’sCompany's business. The Company is currently not aware of any such legal proceedings or claims that we believeit believes will have, individually or in the aggregate, a material adverse affect on our business, financial condition or operating results.
KRATOS DEFENSE & SECURITY SOLUTIONS, INC.
Notes to Consolidated Financial Statements (Continued)
Years ended December 31, 2005, 2006 and 2007
Note 18. Quarterly Financial Data (Unaudited)
The following financial information reflects all normal and recurring adjustments that are, in the opinion of management, necessary for a fair statement of the results of the interim periods. Summarized quarterly data for the years ended December 31, 20052006 and 2006,2007, is as follows (in millions, except per share data):
| | First
Quarter | | Second
Quarter | | Third
Quarter | | Fourth
Quarter | |
| | (Restated) | | (Restated) | | (Restated) | | (Restated) | |
Fiscal year 2005 | | | | | | | | | | | | | | | | | |
Revenues | | | $ | 81.2 | | | | $ | 83.5 | | | | $ | 86.7 | | | | $ | 86.3 | | |
Gross profit | | | $ | 18.0 | | | | $ | 19.5 | | | | $ | 20.6 | | | | $ | 18.2 | | |
Operating income | | | $ | 3.4 | | | | $ | 4.1 | | | | $ | 8.1 | | | | $ | 1.3 | | |
Provision for income taxes | | | $ | 1.5 | | | | $ | 1.4 | | | | $ | 1.6 | | | | $ | 1.4 | | |
Net income (loss) | | | $ | 3.4 | | | | $ | 3.6 | | | | $ | 4.9 | | | | $ | (10.3 | ) | |
Net income (loss) per common share: | | | | | | | | | | | | | | | | | |
Basic | | | $ | 0.05 | | | | $ | 0.05 | | | | $ | 0.07 | | | | $ | (0.14 | ) | |
Diluted | | | $ | 0.05 | | | | $ | 0.05 | | | | $ | 0.07 | | | | $ | (0.14 | ) | |
| | First Quarter
| | Second Quarter
| | Third Quarter
| | Fourth Quarter
| |
|---|
| Fiscal year 2006 | | | | | | | | | | | | | |
| Revenues | | $ | 33.0 | | $ | 34.1 | | $ | 36.9 | | $ | 49.1 | |
| Gross profit | | $ | 6.2 | | $ | 7.1 | | $ | 7.8 | | $ | 7.8 | |
| Operating loss from continuing operations | | $ | (1.7 | ) | $ | (1.1 | ) | $ | (0.8 | ) | $ | (27.9 | ) |
| Provision (benefit) for income taxes | | $ | (0.8 | ) | $ | (0.3 | ) | $ | 0.1 | | $ | 14.8 | |
| Net loss | | $ | (0.9 | ) | $ | (0.5 | ) | $ | (0.8 | ) | $ | (55.7 | ) |
| Net loss per common share: | | | | | | | | | | | | | |
| Basic | | $ | (0.01 | ) | $ | (0.01 | ) | $ | (0.01 | ) | $ | (0.76 | ) |
| Diluted | | $ | (0.01 | ) | $ | (0.01 | | $ | (0.01 | ) | $ | (0.76 | ) |
| | First
Quarter | | Second
Quarter | | Third
Quarter | | Fourth
Quarter | |
Fiscal year 2006 | | | | | | | | | | | | | | | | | |
Revenues | | | $ | 76.3 | | | | $ | 79.5 | | | | $ | 77.9 | | | | $ | 94.1 | | |
Gross profit | | | $ | 12.5 | | | | $ | 14.6 | | | | $ | 14.5 | | | | $ | 11.9 | | |
Operating income (loss) | | | $ | (1.5 | ) | | | $ | 0.9 | | | | $ | 0.5 | | | | $ | (31.3 | ) | |
Provision (benefit) for income taxes | | | $ | (0.4 | ) | | | $ | 0.4 | | | | $ | 0.3 | | | | $ | 14.2 | | |
Net income (loss) | | | $ | (0.8 | ) | | | $ | (0.6 | ) | | | $ | (0.9 | ) | | | $ | (55.6 | ) | |
Net income (loss) per common share: | | | | | | | | | | | | | | | | | |
Basic | | | $ | (0.01 | ) | | | $ | (0.01 | ) | | | $ | (0.01 | ) | | | $ | (0.75 | ) | |
Diluted | | | $ | (0.01 | ) | | | $ | (0.01 | ) | | | $ | (0.01 | ) | | | $ | (0.75 | ) | |
Quarterly Results in 2005
As required by Item 302 of Regulation S-K promulgated by the SEC, the following table sets forth selected unaudited consolidated quarterly financial information for our two most recent years. All quarters for 2005 have been restated from previously reported information filed in the Company’s Form 10-Q’s and Form 10-K as a result of the restatement of its financial results discussed in Note 2 “Restatement of Consolidated Financial Statements”. The previously reported consolidated statements of operations for all quarters of 2006 were not impacted by the Equity Award Review. In addition, the quarterly tables presented for all quarters of 2005 and 2006 have been restated in accordance with SFAS No. 144 to reflect the EMEA and Brazilian operations discontinued by the Company in the fourth quarter of 2006.
184
The following table presents the effect of the financial statement restatement adjustments as well as the Company’s discontinuance of its international operations on the Company’s previously reported consolidated statements of operations for the three months ended March 31, 2005, June 30, 2005, September 30, 2005 and December 31, 2005 (in millions, except per share data):
RECONCILIATION OF CONSOLIDATED STATEMENTS OF OPERATIONS FOR INTERIM PERIODS OF 2005
(In millions, except per share data)
| | Three Months Ended | |
| | March 31, 2005 | | | June 30, 2005 | |
| | As
Reported | | Adjustment for
International
Discontinued
Operations | | As Restated
for
Discontinued
Operations | | Adjustment for
Stock Based
Expenses | | As Restated | | | As
Reported | | Adjustment for
International
Discontinued
Operations | | As Restated
for
Discontinued
Operations | | Adjustment for
Stock Based
Expenses | | As Restated | |
Service revenue | | | $ 90.7 | | | | $ 9.5 | | | | $ 81.2 | | | | $ — | | | | $ 81.2 | | | | | $ 95.3 | | | | $ 11.8 | | | | $ 83.5 | | | | $ — | | | | $ 83.5 | | |
Cost of service revenue | | | 70.0 | | | | 6.9 | | | | 63.1 | | | | 0.1 | | | | 63.2 | | | | | 73.4 | | | | 9.2 | | | | 64.2 | | | | (0.2 | ) | | | 64.0 | | |
Gross profit | | | 20.7 | | | | 2.6 | | | | 18.1 | | | | (0.1 | ) | | | 18.0 | | | | | 21.9 | | | | 2.6 | | | | 19.3 | | | | 0.2 | | | | 19.5 | | |
General and administrative expenses | | | 16.4 | | | | 1.9 | | | | 14.5 | | | | 0.1 | | | | 14.6 | | | | | 17.6 | | | | 2.1 | | | | 15.5 | | | | (0.1 | ) | | | 15.4 | | |
Contingent acquisition consideration | | | — | | | | — | | | | — | | | | — | | | | — | | | | | — | | | | — | | | | — | | | | — | | | | — | | |
Operating income | | | 4.3 | | | | 0.7 | | | | 3.6 | | | | (0.2 | ) | | | 3.4 | | | | | 4.3 | | | | 0.5 | | | | 3.8 | | | | 0.3 | | | | 4.1 | | |
Other income (expense): | | | | | | | | | | | | | | | | | | | | | | | | | | | | | | | | | | | | | | | | | | |
Interest income (expense) | | | 0.2 | | | | — | | | | 0.2 | | | | — | | | | 0.2 | | | | | — | | | | — | | | | — | | | | — | | | | — | | |
Other income (expense) | | | (0.1 | ) | | | (0.1 | ) | | | — | | | | — | | | | — | | | | | (0.3 | ) | | | (0.3 | ) | | | — | | | | — | | | | — | | |
Total other income (expense) | | | 0.1 | | | | (0.1 | ) | | | 0.2 | | | | — | | | | 0.2 | | | | | (0.3 | ) | | | (0.3 | ) | | | — | | | | — | | | | — | | |
Income from continuing operations before income taxes | | | 4.4 | | | | 0.6 | | | | 3.8 | | | | (0.2 | ) | | | 3.6 | | | | | 4.0 | | | | 0.2 | | | | 3.8 | | | | 0.3 | | | | 4.1 | | |
Provision (benefit) for income taxes | | | 1.7 | | | | 0.2 | | | | 1.5 | | | | — | | | | 1.5 | | | | | 1.5 | | | | 0.1 | | | | 1.4 | | | | — | | | | 1.4 | | |
Net income (loss) from continuing operations | | | $ 2.7 | | | | $ 0.4 | | | | $ 2.3 | | | | $ (0.2 | ) | | | $ 2.1 | | | | | $ 2.5 | | | | $ 0.1 | | | | $ 2.4 | | | | $ 0.3 | | | | $ 2.7 | | |
Income (loss) from discontinued operations | | | 0.9 | | | | — | | | | 1.3 | | | | (0.0 | ) | | | 1.3 | | | | | 0.8 | | | | — | | | | 0.9 | | | | (0.0 | ) | | | 0.9 | | |
Net income (loss) | | | $ 3.6 | | | | $ 0.4 | | | | $ 3.6 | | | | $ (0.2 | ) | | | $ 3.4 | | | | | $ 3.3 | | | | $ 0.1 | | | | $ 3.3 | | | | $ 0.3 | | | | $ 3.6 | | |
| | | | | | | | | | | | | | | | | | | | | | | | | | | | | | | | | | | | | | | | | | |
Net income (loss) from continuing operations | | | | | | | | | | | | | | | | | | | | | | | | | | | | | | | | | | | | | | | | | | |
Basic | | | $ 0.04 | | | | | | | | $ 0.03 | | | | | | | | $ 0.03 | | | | | $ 0.03 | | | | | | | | $ 0.03 | | | | $ 0.00 | | | | $ 0.04 | | |
Diluted | | | $ 0.04 | | | | | | | | $ 0.03 | | | | | | | | $ 0.03 | | | | | $ 0.02 | | | | | | | | $ 0.03 | | | | $ 0.00 | | | | $ 0.04 | | |
Net income (loss) from discontinued operations | | | | | | | | | | | | | | | | | | | | | | | | | | | | | | | | | | | | | | | | | | |
Basic | | | $ 0.01 | | | | | | | | $ 0.02 | | | | | | | | $ 0.02 | | | | | $ 0.01 | | | | | | | | $ 0.01 | | | | $ (0.00 | ) | | | $ 0.01 | | |
Diluted | | | $ 0.01 | | | | | | | | $ 0.02 | | | | | | | | $ 0.02 | | | | | $ 0.01 | | | | | | | | $ 0.01 | | | | $ (0.00 | ) | | | $ 0.01 | | |
Net income (loss), per share | | | | | | | | | | | | | | | | | | | | | | | | | | | | | | | | | | | | | | | | | | |
Basic | | | $ 0.05 | | | | | | | | $ 0.05 | | | | | | | | $ 0.05 | | | | | $ 0.04 | | | | | | | | $ 0.04 | | | | $ 0.00 | | | | $ 0.05 | | |
Diluted | | | $ 0.05 | | | | | | | | $ 0.05 | | | | | | | | $ 0.05 | | | | | $ 0.04 | | | | | | | | $ 0.04 | | | | $ 0.00 | | | | $ 0.05 | | |
Weighted average common shares: | | | | | | | | | | | | | | | | | | | | | | | | | | | | | | | | | | | | | | | | | | |
Basic | | | 73.7 | | | | | | | | 73.7 | | | | — | | | | 73.7 | | | | | 73.9 | | | | | | | | 73.9 | | | | — | | | | 73.9 | | |
Diluted | | | 75.9 | | | | | | | | 75.9 | | | | (0.4 | ) | | | 75.5 | | | | | 74.8 | | | | | | | | 74.8 | | | | (0.4 | ) | | | 74.4 | | |
| | | | | | | | | | | | | | | | | | | | | | | | | | | | | | | | | | | | | | | | | | |
The following table presents details of the total stock-based compensation expense that is included in each functional line item in the consolidated statements of operations data above: | | | | | | | | | | | | | | | | | | | | | | | | | | | | | | | | | | | | | | | | | | |
Supplemental Data on Stock-Based Compensation Expense | | | | | | | | | | | | | | | | | | | | | | | | | | | | | | | | | | | | | | | | | | |
Cost of revenue | | | $ — | | | | $ — | | | | $ — | | | | $ 0.1 | | | | $ 0.1 | | | | | $ — | | | | $ — | | | | $ — | | | | $ 0.2 | | | | $ 0.2 | | |
Selling, general and administrative | | | | | | | | | | | 0.0 | | | | 0.1 | | | | 0.1 | | | | | | | | | | | | | 0.0 | | | | 0.1 | | | | 0.1 | | |
| | | — | | | | — | | | | — | | | | 0.2 | | | | 0.2 | | | | | — | | | | — | | | | — | | | | 0.3 | | | | 0.3 | | |
| | | | | | | | | | | | | | | | | | | | | | | | | | | | | | | | | | | | | | | | | | |
Discontinued operations | | | $ — | | | | $ — | | | | $ — | | | | $ (0.0 | ) | | | $ (0.0 | ) | | | | $ — | | | | $ — | | | | $ — | | | | $ (0.0 | ) | | | $ (0.0 | ) | |
| | | | | | | | | | | | | | | | | | | | | | | | | | | | | | | | | | | | | | | | | | |
The following table presents details of the non-income tax payroll related expense (credit) that is included in each functional line item in the consolidated statement of operations: | | | | | | | | | | | | | | | | | | | | | | | | | | | | | | | | | | | | | | | | | | |
Supplemental Data on Non-Income Tax Payroll Expense | | | | | | | | | | | | | | | | | | | | | | | | | | | | | | | | | | | | | | | | | | |
Cost of revenue | | | $ — | | | | $ — | | | | $ — | | | | $ 0.0 | | | | $ 0.0 | | | | | $ — | | | | $ — | | | | $ — | | | | $ (0.4 | ) | | | $ (0.4 | ) | |
Selling, general and administrative | | | — | | | | — | | | | 0.0 | | | | 0.0 | | | | 0.0 | | | | | — | | | | — | | | | 0.0 | | | | (0.2 | ) | | | (0.2 | ) | |
| | | | | | | | | | | | | | | | | | | | | | | | | | | | | | | | | | | | | | | | | | |
| | | — | | | | — | | | | — | | | | — | | | | — | | | | | — | | | | — | | | | — | | | | (0.6 | ) | | | (0.6 | ) | |
| | | | | | | | | | | | | | | | | | | | | | | | | | | | | | | | | | | | | | | | | | |
Discontinued operations | | | — | | | | — | | | | — | | | | (0.0 | ) | | | (0.0 | ) | | | | — | | | | — | | | | — | | | | 0.0 | | | | 0.0 | | |
| | | | | | | | | | | | | | | | | | | | | | | | | | | | | | | | | | | | | | | | | | |
Total | | | $ — | | | | $ — | | | | $ — | | | | $ 0.0 | | | | $ 0.0 | | | | | $ — | | | | $ — | | | | $ — | | | | $ (0.6 | ) | | | $ (0.6 | ) | |
| | | | | | | | | | | | | | | | | | | | | | | | | | | | | | | | | | | | | | | | | | |
185
| | Three Months Ended | | |
| | | | | | | |
| | As
Reported | | Adjustment for
International
Discontinued
Operations | | As Restated
for
Discontinued
Operations | | Adjustment for
Stock Based
Expenses | | As Restated | | | As
Reported | | Adjustment for
International
Discontinued
Operations | | As Restated
for
Discontinued
Operations | | Adjustment for
Stock Based
Expenses | | As Restated | | |
Service revenue | | | $ 94.5 | | | | $ 7.8 | | | | $ 86.7 | | | | $ — | | | | $ 86.7 | | | | | $ 94.8 | | | | $ 8.5 | | | | $ 86.3 | | | | $ — | | | | $ 86.3 | | |
Cost of service revenue | | | 74.3 | | | | 8.4 | | | | 65.9 | | | | 0.2 | | | | 66.1 | | | | | 73.3 | | | | 6.4 | | | | 66.9 | | | | 1.2 | | | | 68.1 | | |
Gross profit | | | 20.2 | | | | (0.6 | ) | | | 20.8 | | | | (0.2 | ) | | | 20.6 | | | | | 21.5 | | | | 2.1 | | | | 19.4 | | | | (1.2 | ) | | | 18.2 | | |
General and administrative expenses | | | 17.2 | | | | 2.3 | | | | 14.9 | | | | 0.1 | | | | 15.0 | | | | | 18.1 | | | | 2.3 | | | | 15.8 | | | | 0.7 | | | | 16.5 | | |
Contingent acquisition consideration | | | (2.5 | ) | | | — | | | | (2.5 | ) | | | — | | | | (2.5 | ) | | | | 0.4 | | | | — | | | | 0.4 | | | | — | | | | 0.4 | | |
Operating income | | | 5.5 | | | | (2.9 | ) | | | 8.4 | | | | (0.3 | ) | | | 8.1 | | | | | 3.0 | | | | (0.2 | ) | | | 3.2 | | | | (1.9 | ) | | | 1.3 | | |
Other income (expense): | | | | | | | | | | | | | | | | | | | | | | | | | | | | | | | | | | | | | | | | | | |
Interest income (expense) | | | — | | | | — | | | | — | | | | — | | | | — | | | | | (0.1 | ) | | | — | | | | (0.1 | ) | | | — | | | | (0.1 | ) | |
Other income (expense) | | | (0.1 | ) | | | (0.1 | ) | | | — | | | | — | | | | — | | | | | 0.1 | | | | (0.1 | ) | | | 0.2 | | | | — | | | | 0.2 | | |
Total other income (expense) | | | (0.1 | ) | | | (0.1 | ) | | | — | | | | — | | | | — | | | | | — | | | | (0.1 | ) | | | 0.1 | | | | — | | | | 0.1 | | |
Income from continuing operations before income taxes | | | 5.4 | | | | (3.0 | ) | | | 8.4 | | | | (0.3 | ) | | | 8.1 | | | | | 3.0 | | | | (0.3 | ) | | | 3.3 | | | | (1.9 | ) | | | 1.4 | | |
Provision (benefit) for income taxes | | | 0.7 | | | | (0.9 | ) | | | 1.6 | | | | — | | | | 1.6 | | | | | 1.5 | | | | 0.1 | | | | 1.4 | | | | — | | | | 1.4 | | |
Net income (loss) from continuing operations | | | $ 4.7 | | | | $ (2.1 | ) | | | $ 6.8 | | | | $ (0.3 | ) | | | $ 6.5 | | | | | $ 1.5 | | | | $ (0.4 | ) | | | $ 1.9 | | | | $ (1.9 | ) | | | $ (0.0 | ) | |
| | | | | | | | | | | | | | | | | | | | | | | | | | | | | | | | | | | | | | | | | | |
Income (loss) from discontinued operations | | | 0.5 | | | | — | | | | (1.6 | ) | | | (0.0 | ) | | | (1.6 | ) | | | | (9.9 | ) | | | — | | | | (10.3 | ) | | | — | | | | (10.3 | ) | |
Net income (loss) | | | $ 5.2 | | | | $ (2.1 | ) | | | $ 5.2 | | | | $ (0.3 | ) | | | $ 4.9 | | | | | $ (8.4 | ) | | | $ (0.4 | ) | | | $ (8.4 | ) | | | $ (1.9 | ) | | | $ (10.3 | ) | |
| | | | | | | | | | | | | | | | | | | | | | | | | | | | | | | | | | | | | | | | | | |
Net income (loss) from continuing operations | | | | | | | | | | | | | | | | | | | | | | | | | | | | | | | | | | | | | | | | | | |
Basic | | | $ 0.06 | | | | | | | | $ 0.09 | | | | | | | | $ 0.09 | | | | | $ 0.02 | | | | | | | | $ 0.03 | | | | | | | | $ (0.00 | ) | |
Diluted | | | $ 0.06 | | | | | | | | $ 0.09 | | | | | | | | $ 0.09 | | | | | $ 0.02 | | | | | | | | $ 0.03 | | | | | | | | $ (0.00 | ) | |
Net income (loss) from discontinued operations | | | | | | | | | | | | | | | | | | | | | | | | | | | | | | | | | | | | | | | | | | |
Basic | | | $ 0.01 | | | | | | | | $ (0.02 | ) | | | | | | | $ (0.02 | ) | | | | $ (0.13 | ) | | | | | | | $ (0.13 | ) | | | | | | | $ (0.14 | ) | |
Diluted | | | $ 0.01 | | | | | | | | $ (0.02 | ) | | | | | | | $ (0.02 | ) | | | | $ (0.13 | ) | | | | | | | $ (0.13 | ) | | | | | | | $ (0.14 | ) | |
Net income (loss), per share | | | | | | | | | | | | | | | | | | | | | | | | | | | | | | | | | | | | | | | | | | |
Basic | | | $ 0.07 | | | | | | | | $ 0.07 | | | | | | | | $ 0.07 | | | | | $ (0.11 | ) | | | | | | | $ (0.11 | ) | | | | | | | $ (0.14 | ) | |
Diluted | | | $ 0.07 | | | | | | | | $ 0.07 | | | | | | | | $ 0.07 | | | | | $ (0.11 | ) | | | | | | | $ (0.11 | ) | | | | | | | $ (0.14 | ) | |
Weighted average common shares: | | | | | | | | | | | | | | | | | | | | | | | | | | | | | | | | | | | | | | | | | | |
Basic | | | 74.2 | | | | | | | | 74.2 | | | | — | | | | 74.2 | | | | | 74.3 | | | | | | | | 74.3 | | | | — | | | | 74.3 | | |
Diluted | | | 75.3 | | | | | | | | 75.3 | | | | (0.4 | ) | | | 74.9 | | | | | 75.3 | | | | | | | | 75.3 | | | | (0.2 | ) | | | 75.1 | | |
The following table presents details of the total stock-based compensation expense that is included in each functional line item in the consolidated statement of operations data above: | | | | | | | | | | | | | | | | | | | | | | | | | | | | | | | | | | | | | | | | | | |
Supplemental Data on Stock-Based Compensation Expense | | | | | | | | | | | | | | | | | | | | | | | | | | | | | | | | | | | | | | | | | | |
Cost of revenue | | | $ — | | | | $ — | | | | $ — | | | | $ 0.2 | | | | $ 0.2 | | | | | $ — | | | | $ — | | | | $ — | | | | $ 1.2 | | | | $ 1.2 | | |
Selling, general and administrative | | | | | | | | | | | 0.0 | | | | 0.1 | | | | 0.1 | | | | | $ 0.10 | | | | | | | | 0.1 | | | | 0.7 | | | | 0.8 | | |
| | | — | | | | — | | | | — | | | | 0.3 | | | | 0.3 | | | | | 0.10 | | | | — | | | | 0.1 | | | | 1.9 | | | | 2.0 | | |
| | | | | | | | | | | | | | | | | | | | | | | | | | | | | | | | | | | | | | | | | | |
Discontinued operations | | | $ — | | | | $ — | | | | $ — | | | | $ (0.0 | ) | | | $ (0.0 | ) | | | | $ — | | | | $ — | | | | $ — | | | | $ 0 | | | | $ 0 | | |
| | | | | | | | | | | | | | | | | | | | | | | | | | | | | | | | | | | | | | | | | | |
The following table presents details of the non-income tax payroll related expense (credit) that is included in each functional line item in the consolidated statement of operations: | | | | | | | | | | | | | | | | | | | | | | | | | | | | | | | | | | | | | | | | | | |
Supplemental Data on Non-Income Tax Payroll Expense | | | | | | | | | | | | | | | | | | | | | | | | | | | | | | | | | | | | | | | | | | |
Cost of revenue | | | $ — | | | | $ — | | | | $ — | | | | $ 0.0 | | | | $ 0.0 | | | | | $ — | | | | $ — | | | | $ — | | | | $ 0.0 | | | | $ 0.0 | | |
Selling, general and administrative | | | — | | | | — | | | | 0.0 | | | | 0.0 | | | | 0.0 | | | | | — | | | | — | | | | 0.0 | | | | 0.0 | | | | 0.0 | | |
| | | — | | | | — | | | | — | | | | 0.0 | | | | 0.0 | | | | | — | | | | — | | | | — | | | | 0.0 | | | | 0.0 | | |
| | | | | | | | | | | | | | | | | | | | | | | | | | | | | | | | | | | | | | | | | | |
Discontinued operations | | | — | | | | — | | | | — | | | | (0.0 | ) | | | (0.0 | ) | | | | — | | | | — | | | | — | | | | (0.0 | ) | | | (0.0 | ) | |
| | | | | | | | | | | | | | | | | | | | | | | | | | | | | | | | | | | | | | | | | | |
Total | | | $ — | | | | $ — | | | | $ — | | | | $ 0.0 | | | | $ 0.0 | | | | | $ — | | | | $ — | | | | $ — | | | | $ 0.0 | | | | $ 0.0 | | |
| | | | | | | | | | | | | | | | | | | | | | | | | | | | | | | | | | | | | | | | | | |
186
The Company’s fourth quarter of 2005 net loss was impacted by a loss from discontinued operations of $10.3 million, which was primarily driven by the cancellation of a number of sites that the Company was building in Latin America locations which impact resulted in a loss of approximately $3.0 million. In addition, an impairment charge of $0.9 million related to the accumulated currency translation losses was recorded in accordance with EITF Issue 01-5 “Application of FASB Statement No. 52 to an Investment Being Evaluated for Impairment that Will Be Disposed Of.” Also, included in loss from discontinued operations was a $3.4 million increase to the valuation allowance related to certain of the discontinued operation’s deferred tax assets.
The following table presents select balance sheet information as of September 30, June 30 and March 31, 2006, respectively, and September 30, June 30, and March 31, 2005, respectively, as restated from previously reported information filed in the Company’s Form 10-Q’s, as a result of the restatement of our financial results discussed in Note 2 “Restatement of Consolidated Financial Statements” (in millions):
RECONCILIATION OF CONSOLIDATED BALANCE SHEETS FOR MARCH 31, 2005
(in millions)
| | | | Adjustment for | | | | | | | |
| | | | International | | As Restated for | | Adjustment for | | | |
| | | | Discontinued | | Discontinued | | Stock Based | | | |
| | As Reported* | | Operations | | Operations | | Expenses | | As Restated | |
Assets | | | | | | | | | | | | | | | | | | | | | |
CURRENT ASSETS | | | | | | | | | | | | | | | | | | | | | |
Cash and cash equivalents | | | $ | 35.3 | | | | $ | (5.4 | ) | | | $ | 29.9 | | | | $ | — | | | | $ | 29.9 | | |
Short-term investments | | | 1.9 | | | | — | | | | 1.9 | | | | — | | | | 1.9 | | |
Subtotal cash and cash equivalents & ST investments | | | 37.2 | | | | (5.4 | ) | | | 31.8 | | | | — | | | | 31.8 | | |
Accounts receivable—net | | | 95.5 | | | | (11.7 | ) | | | 83.8 | | | | — | | | | 83.8 | | |
Prepaid expenses | | | 4.0 | | | | (0.1 | ) | | | 3.9 | | | | — | | | | 3.9 | | |
Employee loans and advances | | | 0.5 | | | | (0.1 | ) | | | 0.4 | | | | — | | | | 0.4 | | |
Other current assets | | | 3.3 | | | | (1.1 | ) | | | 2.2 | | | | — | | | | 2.2 | | |
Current assets of discontinued
operations | | | 34.6 | | | | 18.4 | | | | 53.0 | | | | — | | | | 53.0 | | |
Total current assets | | | 175.1 | | | | — | | | | 175.1 | | | | — | | | | 175.1 | | |
Property and equipment, net | | | 13.0 | | | | (2.4 | ) | | | 10.6 | | | | — | | | | 10.6 | | |
Goodwill | | | 115.9 | | | | — | | | | 115.9 | | | | — | | | | 115.9 | | |
Other intangibles, net | | | 8.8 | | | | — | | | | 8.8 | | | | — | | | | 8.8 | | |
Deferred tax assets | | | 16.4 | | | | 0.7 | | | | 17.1 | | | | — | | | | 17.1 | | |
Investments in unconsolidated affiliates | | | 2.1 | | | | — | | | | 2.1 | | | | — | | | | 2.1 | | |
Other assets | | | 0.8 | | | | — | | | | 0.8 | | | | — | | | | 0.8 | | |
Non current assets of discontinued operations | | | 3.6 | | | | 1.7 | | | | 5.3 | | | | — | | | | 5.3 | | |
Total assets | | | $ | 335.7 | | | | $ | — | | | | $ | 335.7 | | | | $ | — | | | | $ | 335.7 | | |
Liabilities and stockholders’ equity | | | | | | | | | | | | | | | | | | | | | |
CURRENT LIABILITIES | | | | | | | | | | | | | | | | | | | | | |
Accounts payable | | | $ | 19.9 | | | | $ | (1.7 | ) | | | $ | 18.2 | | | | $ | — | | | | $ | 18.2 | | |
Accounts payable—related party | | | 0.8 | | | | — | | | | 0.8 | | | | — | | | | 0.8 | | |
Accrued expenses | | | 22.4 | | | | (4.7 | ) | | | 17.7 | | | | 1.2 | | | | 18.9 | | |
Contract management payables | | | 5.7 | | | | — | | | | 5.7 | | | | — | | | | 5.7 | | |
Deferred revenue | | | 5.6 | | | | (0.3 | ) | | | 5.3 | | | | — | | | | 5.3 | | |
Income taxes payable | | | 3.7 | | | | (0.1 | ) | | | 3.6 | | | | — | | | | 3.6 | | |
Accrual for unused office space | | | 0.8 | | | | — | | | | 0.8 | | | | — | | | | 0.8 | | |
Accrual for contingent consideration related to acquisitions | | | 22.4 | | | | — | | | | 22.4 | | | | — | | | | 22.4 | | |
Capital lease obligation | | | 0.1 | | | | — | | | | 0.1 | | | | — | | | | 0.1 | | |
Current liabilities of discontinued
operations | | | 26.4 | | | | 6.8 | | | | 33.2 | | | | — | | | | 33.2 | | |
Total current liabilities | | | 107.8 | | | | — | | | | 107.8 | | | | 1.2 | | | | 109.0 | | |
LONG-TERM LIABILITIES | | | | | | | | | | | | | | | | | | | | | |
Accrual for unused office space—net of
current portion | | | 1.6 | | | | — | | | | 1.6 | | | | — | | | | 1.6 | | |
Other long-term liabilities | | | 1.3 | | | | — | | | | 1.3 | | | | — | | | | 1.3 | | |
Long term liabilities of discontinued
operations | | | 0.3 | | | | — | | | | 0.3 | | | | — | | | | 0.3 | | |
Total long-term liabilities | | | 3.2 | | | | — | | | | 3.2 | | | | — | | | | 3.2 | | |
Total liabilities | | | 111.0 | | | | — | | | | 111.0 | | | | 1.2 | | | | 112.2 | | |
Common stock | | | 0.1 | | | | — | | | | 0.1 | | | | — | | | | 0.1 | | |
Additional paid-in capital | | | 320.5 | | | | — | | | | 320.5 | | | | 54.5 | | | | 375.0 | | |
Deferred compensation | | | | | | | — | | | | — | | | | (2.7 | ) | | | (2.7 | ) | |
Accumulated deficit | | | (91.9 | ) | | | — | | | | (91.9 | ) | | | (53.0 | ) | | | (144.9 | ) | |
Accumulated other comprehensive loss | | | (4.0 | ) | | | — | | | | (4.0 | ) | | | — | | | | (4.0 | ) | |
STOCKHOLDERS’ EQUITY | | | 224.7 | | | | — | | | | 224.7 | | | | (1.2 | ) | | | 223.5 | | |
Total liabilities and stockholders’
equity | | | $ | 335.7 | | | | $ | — | | | | $ | 335.7 | | | | $ | — | | | | $ | 335.7 | | |
* Certain items in the balance sheet have been reclassified to conform to the current period presentation.
188
RECONCILIATION OF CONSOLIDATED BALANCE SHEETS FOR JUNE 30, 2005
(in millions)
| | | | Adjustment for | | | | | | | |
| | | | International | | As Restated for | | Adjustment for | | | |
| | | | Discontinued | | Discontinued | | Stock Based | | | |
| | As Reported* | | Operations | | Operations | | Expenses | | As Restated | |
Assets | | | | | | | | | | | | | | | | | | | | | |
CURRENT ASSETS | | | | | | | | | | | | | | | | | | | | | |
Cash and cash equivalents | | | $ | 16.1 | | | | $ | (3.5 | ) | | | $ | 12.6 | | | | $ | — | | | | $ | 12.6 | | |
Restricted Cash | | | 0.1 | | | | — | | | | 0.1 | | | | — | | | | 0.1 | | |
Short-term investments | | | — | | | | — | | | | — | | | | — | | | | — | | |
Subtotal cash and cash equivalents & ST investments | | | 16.2 | | | | (3.5 | ) | | | 12.7 | | | | — | | | | 12.7 | | |
Accounts receivable—net | | | 95.7 | | | | (12.3 | ) | | | 83.4 | | | | — | | | | 83.4 | | |
Prepaid expenses | | | 5.0 | | | | (0.1 | ) | | | 4.9 | | | | — | | | | 4.9 | | |
Employee loans and advances | | | 0.5 | | | | (0.3 | ) | | | 0.2 | | | | — | | | | 0.2 | | |
Other current assets | | | 4.6 | | | | (0.9 | ) | | | 3.7 | | | | — | | | | 3.7 | | |
Current assets of discontinued operations | | | 44.6 | | | | 17.1 | | | | 61.7 | | | | — | | | | 61.7 | | |
Total current assets | | | 166.6 | | | | — | | | | 166.6 | | | | — | | | | 166.6 | | |
Property and equipment, net | | | 13.7 | | | | (2.2 | ) | | | 11.5 | | | | — | | | | 11.5 | | |
Goodwill | | | 116.4 | | | | — | | | | 116.4 | | | | — | | | | 116.4 | | |
Other intangibles, net | | | 8.3 | | | | — | | | | 8.3 | | | | — | | | | 8.3 | | |
Deferred tax assets | | | 14.9 | | | | 0.6 | | | | 15.5 | | | | — | | | | 15.5 | | |
Investments in unconsolidated affiliates | | | 2.1 | | | | — | | | | 2.1 | | | | — | | | | 2.1 | | |
Other assets | | | 1.0 | | | | — | | | | 1.0 | | | | — | | | | 1.0 | | |
Non current assets of discontinued
operations | | | 4.0 | | | | 1.6 | | | | 5.6 | | | | — | | | | 5.6 | | |
Total assets | | | $ | 327.0 | | | | $ | — | | | | $ | 327.0 | | | | $ | — | | | | $ | 327.0 | | |
Liabilities and stockholders’ equity | | | | | | | | | | | | | | | | | | | | | |
CURRENT LIABILITIES | | | | | | | | | | | | | | | | | | | | | |
Accounts payable | | | $ | 15.8 | | | | $ | (1.9 | ) | | | $ | 13.9 | | | | $ | — | | | | $ | 13.9 | | |
Accounts payable—related party | | | 1.2 | | | | — | | | | 1.2 | | | | — | | | | 1.2 | | |
Accrued expenses | | | 28.1 | | | | (4.7 | ) | | | 23.4 | | | | 0.6 | | | | 24.0 | | |
Contract management payables | | | 5.3 | | | | — | | | | 5.3 | | | | — | | | | 5.3 | | |
Deferred revenue | | | 5.4 | | | | — | | | | 5.4 | | | | — | | | | 5.4 | | |
Income taxes payable | | | 3.2 | | | | (0.1 | ) | | | 3.1 | | | | — | | | | 3.1 | | |
Accrual for unused office space | | | 0.7 | | | | — | | | | 0.7 | | | | — | | | | 0.7 | | |
Accrual for contingent consideration related to acquisitions | | | 8.9 | | | | — | | | | 8.9 | | | | — | | | | 8.9 | | |
Capital lease obligation | | | 0.1 | | | | — | | | | 0.1 | | | | — | | | | 0.1 | | |
Current liabilities of discontinued
operations | | | 25.2 | | | | 6.7 | | | | 31.9 | | | | — | | | | 31.9 | | |
Total current liabilities | | | 93.9 | | | | — | | | | 93.9 | | | | 0.6 | | | | 94.5 | | |
LONG-TERM LIABILITIES | | | | | | | | | | | | | | | | | | | | | |
Capital Lease obligation—net of current portion | | | 0.2 | | | | — | | | | 0.2 | | | | — | | | | 0.2 | | |
Accrual for unused office space—net of current portion | | | 1.4 | | | | — | | | | 1.4 | | | | — | | | | 1.4 | | |
Other long-term liabilities | | | 1.6 | | | | — | | | | 1.6 | | | | — | | | | 1.6 | | |
Long term liabilities of discontinued operations | | | 0.3 | | | | — | | | | 0.3 | | | | — | | | | 0.3 | | |
Total long-term liabilities | | | 3.5 | | | | — | | | | 3.5 | | | | — | | | | 3.5 | | |
Total liabilities | | | 97.4 | | | | — | | | | 97.4 | | | | 0.6 | | | | 98.0 | | |
Common stock | | | — | | | | — | | | | — | | | | — | | | | — | | |
Additional paid-in capital | | | 322.0 | | | | — | | | | 322.0 | | | | 54.5 | | | | 376.5 | | |
Deferred compensation | | | — | | | | — | | | | — | | | | (2.3 | ) | | | (2.3 | ) | |
Accumulated deficit | | | (88.6 | ) | | | — | | | | (88.6 | ) | | | (52.8 | ) | | | (141.4 | ) | |
Accumulated other comprehensive loss | | | (3.8 | ) | | | — | | | | (3.8 | ) | | | — | | | | (3.8 | ) | |
STOCKHOLDERS’ EQUITY | | | 229.6 | | | | — | | | | 229.6 | | | | (0.6 | ) | | | 229.0 | | |
Total liabilities and stockholders’
equity | | | $ | 327.0 | | | | $ | — | | | | $ | 327.0 | | | | $ | — | | | | $ | 327.0 | | |
*Certain items in the balance sheet have been reclassified to conform to the current period presentation.
189
RECONCILIATION OF CONSOLIDATED BALANCE SHEETS FOR SEPTEMBER 30, 2005
(in millions)
| | | | Adjustment for | | | | | | | |
| | | | International | | As Restated for | | Adjustment for | | | |
| | | | Discontinued | | Discontinued | | Stock Based | | | |
| | As Reported* | | Operations | | Operations | | Expenses | | As Restated | |
Assets | | | | | | | | | | | | | | | | | | | | | |
CURRENT ASSETS | | | | | | | | | | | | | | | | | | | | | |
Cash and cash equivalents | | | $ | 15.3 | | | | $ | (1.7 | ) | | | $ | 13.6 | | | | $ | — | | | | $ | 13.6 | | |
Accounts receivable—net | | | 110.8 | | | | (12.8 | ) | | | 98.0 | | | | — | | | | 98.0 | | |
Prepaid expenses | | | 4.5 | | | | (0.1 | ) | | | 4.4 | | | | — | | | | 4.4 | | |
Employee loans and advances | | | 0.4 | | | | (0.1 | ) | | | 0.3 | | | | — | | | | 0.3 | | |
Other current assets | | | 4.8 | | | | (1.1 | ) | | | 3.7 | | | | — | | | | 3.7 | | |
Current assets of discontinued operations | | | 47.1 | | | | 15.8 | | | | 62.9 | | | | — | | | | 62.9 | | |
Total current assets | | | 182.9 | | | | — | | | | 182.9 | | | | — | | | | 182.9 | | |
Property and equipment, net | | | 14.1 | | | | (2.2 | ) | | | 11.9 | | | | — | | | | 11.9 | | |
Goodwill | | | 117.2 | | | | — | | | | 117.2 | | | | — | | | | 117.2 | | |
Other intangibles, net | | | 7.8 | | | | — | | | | 7.8 | | | | — | | | | 7.8 | | |
Deferred tax assets | | | 13.7 | | | | 0.6 | | | | 14.3 | | | | — | | | | 14.3 | | |
Investments in unconsolidated affiliates | | | 2.1 | | | | — | | | | 2.1 | | | | — | | | | 2.1 | | |
Other assets | | | 1.0 | | | | — | | | | 1.0 | | | | — | | | | 1.0 | | |
Non current assets of discontinued
operations | | | 4.5 | | | | 1.6 | | | | 6.1 | | | | — | | | | 6.1 | | |
Total assets | | | $ | 343.3 | | | | $ | — | | | | $ | 343.3 | | | | $ | — | | | | $ | 343.3 | | |
Liabilities and stockholders’ equity | | | | | | | | | | | | | | | | | | | | | |
CURRENT LIABILITIES | | | | | | | | | | | | | | | | | | | | | |
Accounts payable | | | $ | 18.8 | | | | $ | (1.6 | ) | | | $ | 17.2 | | | | $ | — | | | | $ | 17.2 | | |
Accounts payable—related party | | | 1.0 | | | | — | | | | 1.0 | | | | — | | | | 1.0 | | |
Accrued expenses | | | 33.6 | | | | (5.7 | ) | | | 27.9 | | | | 0.6 | | | | 28.5 | | |
Contract management payables | | | 7.6 | | | | — | | | | 7.6 | | | | — | | | | 7.6 | | |
Deferred revenue | | | 6.5 | | | | (0.1 | ) | | | 6.4 | | | | — | | | | 6.4 | | |
Income taxes payable | | | 1.8 | | | | (0.1 | ) | | | 1.7 | | | | — | | | | 1.7 | | |
Accrual for unused office space | | | 0.6 | | | | — | | | | 0.6 | | | | — | | | | 0.6 | | |
Accrual for contingent consideration related to acquisitions | | | 6.4 | | | | — | | | | 6.4 | | | | — | | | | 6.4 | | |
Capital lease obligation | | | 0.3 | | | | — | | | | 0.3 | | | | — | | | | 0.3 | | |
Current liabilities of discontinued
operations | | | 27.3 | | | | 7.5 | | | | 34.8 | | | | — | | | | 34.8 | | |
Total current liabilities | | | 103.9 | | | | — | | | | 103.9 | | | | 0.6 | | | | 104.5 | | |
LONG-TERM LIABILITIES | | | | | | | | | | | | | | | — | | | | | | |
Capital Lease obligation—net of current portion | | | 0.5 | | | | — | | | | 0.5 | | | | — | | | | 0.5 | | |
Accrual for unused office space—net of current portion | | | 1.3 | | | | — | | | | 1.3 | | | | — | | | | 1.3 | | |
Other long-term liabilities | | | 1.3 | | | | — | | | | 1.3 | | | | — | | | | 1.3 | | |
Long term liabilities of discontinued operations | | | 0.3 | | | | — | | | | 0.3 | | | | — | | | | 0.3 | | |
Total long-term liabilities | | | 3.4 | | | | — | | | | 3.4 | | | | — | | | | 3.4 | | |
Total liabilities | | | 107.3 | | | | — | | | | 107.3 | | | | 0.6 | | | | 107.9 | | |
MINORITY INTEREST | | | — | | | | — | | | | — | | | | — | | | | — | | |
Common stock | | | — | | | | — | | | | — | | | | — | | | | — | | |
Additional paid-in capital | | | 322.8 | | | | — | | | | 322.8 | | | | 54.5 | | | | 377.3 | | |
Deferred compensation | | | — | | | | — | | | | — | | | | (2.0 | ) | | | (2.0 | ) | |
Accumulated deficit | | | (83.4 | ) | | | — | | | | (83.4 | ) | | | (53.1 | ) | | | (136.5 | ) | |
Accumulated other
comprehensive loss | | | (3.4 | ) | | | — | | | | (3.4 | ) | | | — | | | | (3.4 | ) | |
STOCKHOLDERS’ EQUITY | | | 236.0 | | | | — | | | | 236.0 | | | | (0.6 | ) | | | 235.4 | | |
Total liabilities and stockholders’ equity | | | $ | 343.3 | | | | $ | — | | | | $ | 343.3 | | | | $ | — | | | | $ | 343.3 | | |
*Certain items in the balance sheet have been reclassified to conform to the current period presentation.
190
UNAUDITED PRO FORMA RECONCILIATION OF STOCK-BASED COMPENSATION EXPENSE FOR INTERIM PERIODS OF 2005
(in millions, except per share data)
|
| Three Months Ended
|
|
|
| March 31, 2005
|
|
| June 30, 2005
|
|
| September 30, 2005
|
|
| December 31, 2005
|
|
|
| As
Reported
|
| Adjustment
for Stock-
Based
Compensation
|
| As
Restated
|
|
| As
Reported
|
| Adjustment
for Stock-
Based
Compensation
|
| As
Restated
|
|
| As
Reported
|
| Adjustment
for Stock-
Based
Compensation
|
| As
Restated
|
|
| As
Reported
|
| Adjustment
for Stock-
Based
Compensation
|
| As
Restated
|
|
| | | | | | | | | | | | | | | | | | | | | | | | | | | | |
Net income (loss) | | | $ 3.6 | | | | $ (0.2 | ) | | | $ 3.4 | | | | | $ 3.3 | | | | $ 0.3 | | | | $ 3.6 | | | | | $ 5.2 | | | | $ (0.3 | ) | | | $ 4.9 | | | | | $ (8.4 | ) | | | $ (1.9 | ) | | | $ (10.3 | ) | |
Add: Stock-based compensation expense included in net income (loss) | | | — | | | | 0.2 | | | | 0.2 | | | | | — | | | | 0.3 | | | | 0.3 | | | | | — | | | | 0.3 | | | | 0.3 | | | | | 0.1 | | | | 1.9 | | | | 2.0 | | |
Deduct: Stock-based compensation expense determined under the fair value method | | | (3.5 | ) | | | 0.3 | | | | (3.2 | ) | | | | (2.8 | ) | | | (2.4 | ) | | | (5.2 | ) | | | | (7.3 | ) | | | 0.7 | | | | (6.6 | ) | | | | (29.2 | ) | | | (3.7 | ) | | | (32.9 | ) | |
Net loss—pro forma | | | $ 0.1 | | | | $ 0.3 | | | | $ 0.4 | | | | | $ 0.5 | | | | $ (1.8 | ) | | | $ (1.3 | ) | | | | $ (2.1 | ) | | | $ 0.7 | | | | $ (1.4 | ) | | | | $ (37.5 | ) | | | $ (3.7 | ) | | | $ (41.2 | ) | |
Net income (loss) per share (basic) | | | $ 0.05 | | | | $ (0.00 | ) | | | $ 0.05 | | | | | $ 0.04 | | | | $ 0.00 | | | | $ 0.05 | | | | | $ 0.07 | | | | $ (0.00 | ) | | | $ 0.07 | | | | | $ (0.11 | ) | | | $ (0.03 | ) | | | $ (0.14 | ) | |
Net income (loss) per share (diluted) | | | $ 0.05 | | | | $ (0.00 | ) | | | $ 0.05 | | | | | $ 0.04 | | | | $ 0.00 | | | | $ 0.05 | | | | | $ 0.07 | | | | $ (0.00 | ) | | | $ 0.07 | | | | | $ (0.11 | ) | | | $ (0.03 | ) | | | $ (0.14 | ) | |
Net income (loss) per share (basic)—pro forma | | | $ 0.00 | | | | $ 0.01 | | | | $ 0.01 | | | | | $ 0.01 | | | | $ (0.02 | ) | | | $ (0.02 | ) | | | | $ (0.03 | ) | | | $ (0.01 | ) | | | $ (0.02 | ) | | | | $ (0.50 | ) | | | $ (0.05 | ) | | | $ (0.55 | ) | |
Net income (loss) per share (diluted)—pro forma | | | $ 0.00 | | | | $ 0.01 | | | | $ 0.01 | | | | | $ 0.01 | | | | $ (0.025 | ) | | | $ (0.02 | ) | | | | $ (0.03 | ) | | | $ (0.01 | ) | | | $ (0.02 | ) | | | | $ (0.50 | ) | | | $ (0.05 | ) | | | $ (0.55 | ) | |
Weighted average shares: | | | | | | | | | | | | | | | | | | | | | | | | | | | | | | | | | | | | | | | | | | | | | | | | | | | | |
Basic—as reported | | | 73.7 | | | | 73.7 | | | | 73.7 | | | | | 73.9 | | | | 73.9 | | | | 73.9 | | | | | 74.2 | | | | 74.2 | | | | 74.2 | | | | | 74.3 | | | | 74.3 | | | | 74.3 | | |
Diluted—as reported | | | 75.9 | | | | 75.5 | | | | 75.5 | | | | | 74.8 | | | | 74.4 | | | | 74.4 | | | | | 75.3 | | | | 74.9 | | | | 74.9 | | | | | 75.1 | | | | 75.1 | | | | 75.1 | | |
Basic—pro forma | | | 73.7 | | | | 73.7 | | | | 73.7 | | | | | 73.9 | | | | 73.9 | | | | 73.9 | | | | | 74.2 | | | | 74.2 | | | | 74.2 | | | | | 74.3 | | | | 74.3 | | | | 74.3 | | |
Diluted—pro forma | | | 75.9 | | | | 75.5 | | | | 75.5 | | | | | 74.8 | | | | 74.4 | | | | 74.4 | | | | | 75.3 | | | | 74.9 | | | | 74.9 | | | | | 75.1 | | | | 75.1 | | | | 75.1 | | |
| | First Quarter
| | Second Quarter
| | Third Quarter
| | Fourth Quarter
| |
|---|
| Fiscal year 2007 | | | | | | | | | | | | | |
| Revenues | | $ | 49.0 | | $ | 47.8 | | $ | 47.5 | | $ | 49.3 | |
| Gross profit | | $ | 7.3 | | $ | 7.5 | | $ | 8.2 | | $ | 8.6 | |
| Operating loss from continuing operations | | $ | (3.3 | ) | $ | (8.3 | ) | $ | (8.4 | ) | $ | (4.6 | ) |
| Provision for income taxes | | $ | 0.2 | | $ | 0.3 | | $ | 0.4 | | $ | 0.4 | |
| Net income (loss) | | $ | (20.1 | ) | $ | 4.2 | | $ | (13.4 | ) | $ | (11.5 | ) |
| Net income (loss) per common share: | | | | | | | | | | | | | |
| Basic | | $ | (0.28 | ) | $ | 0.06 | | $ | (0.18 | ) | $ | (0.16 | ) |
| Diluted | | $ | (0.28 | ) | $ | 0.06 | | $ | (0.18 | ) | $ | (0.16 | ) |
191
RECONCILIATION OF CONSOLIDATED BALANCE SHEETS FOR MARCH 31, 2006
(in millions)
| | As Reported | | Adjustment for
International
Discontinued
Operations | | As Restated for
Discontinued
Operations | | Adjustment for
Stock Based
Expenses | | As Restated | |
Assets | | | | | | | | | | | | | | | | | | | | | |
CURRENT ASSETS | | | | | | | | | | | | | | | | | | | | | |
Cash and cash equivalents | | | $ | 10.0 | | | | $ | (2.9 | ) | | | $ | 7.1 | | | | $ | — | | | | $ | 7.1 | | |
Short-term investments | | | — | | | | — | | | | — | | | | — | | | | — | | |
Subtotal cash and cash equivalents & ST investments | | | 10.0 | | | | (2.9 | ) | | | 7.1 | | | | — | | | | 7.1 | | |
Accounts receivable—net | | | 107.0 | | | | (8.7 | ) | | | 98.3 | | | | — | | | | 98.3 | | |
Note Receivable | | | 17.5 | | | | — | | | | 17.5 | | | | — | | | | 17.5 | | |
Prepaid expenses | | | 2.9 | | | | (0.2 | ) | | | 2.7 | | | | — | | | | 2.7 | | |
Employee loans and advances | | | 0.4 | | | | (0.1 | ) | | | 0.3 | | | | — | | | | 0.3 | | |
Income taxes receivable | | | — | | | | 0.4 | | | | 0.4 | | | | — | | | | 0.4 | | |
Other current assets | | | 6.1 | | | | (1.6 | ) | | | 4.5 | | | | — | | | | 4.5 | | |
Current assets of discontinued operations | | | 0.7 | | | | 14.0 | | | | 14.7 | | | | — | | | | 14.7 | | |
Total current assets | | | 144.6 | | | | 0.9 | | | | 145.5 | | | | — | | | | 145.5 | | |
Property and equipment, net | | | 14.8 | | | | (1.6 | ) | | | 13.2 | | | | — | | | | 13.2 | | |
Goodwill | | | 119.9 | | | | — | | | | 119.9 | | | | — | | | | 119.9 | | |
Other intangibles, net | | | 7.0 | | | | — | | | | 7.0 | | | | — | | | | 7.0 | | |
Deferred tax assets | | | 13.2 | | | | 0.2 | | | | 13.4 | | | | — | | | | 13.4 | | |
Investments in unconsolidated affiliates | | | 2.1 | | | | — | | | | 2.1 | | | | — | | | | 2.1 | | |
Other assets | | | 0.9 | | | | — | | | | 0.9 | | | | — | | | | 0.9 | | |
Non current assets of discontinued operations | | | — | | | | 1.6 | | | | 1.6 | | | | — | | | | 1.6 | | |
Total assets | | | $ | 302.5 | | | | $ | 1.1 | | | | $ | 303.6 | | | | $ | — | | | | $ | 303.6 | | |
Liabilities and stockholders’ equity | | | | | | | | | | | | | | | | | | | | | |
CURRENT LIABILITIES | | | | | | | | | | | | | | | | | | | | | |
Accounts payable | | | $ | 19.2 | | | | $ | (1.2 | ) | | | $ | 18.0 | | | | $ | — | | | | $ | 18.0 | | |
Accounts payable—related party | | | 0.8 | | | | — | | | | 0.8 | | | | — | | | | 0.8 | | |
Accrued expenses | | | 29.7 | | | | (4.2 | ) | | | 25.5 | | | | 0.6 | | | | 26.1 | | |
Contract management payables | | | — | | | | — | | | | — | | | | — | | | | — | | |
Deferred revenue | | | 4.0 | | | | (0.1 | ) | | | 3.9 | | | | — | | | | 3.9 | | |
Income taxes payable | | | 1.8 | | | | (1.8 | ) | | | — | | | | — | | | | — | | |
Line of credit | | | 7.0 | | | | — | | | | 7.0 | | | | — | | | | 7.0 | | |
Tax contingencies | | | 1.7 | | | | — | | | | 1.7 | | | | — | | | | 1.7 | | |
Deferred tax liabilities | | | 0.4 | | | | (0.4 | ) | | | — | | | | — | | | | — | | |
Accrual for unused office space | | | 0.4 | | | | — | | | | 0.4 | | | | — | | | | 0.4 | | |
Accrual for contingent consideration related to acquisitions | | | 1.1 | | | | — | | | | 1.1 | | | | — | | | | 1.1 | | |
Capital lease obligations and other short-term debt | | | 0.3 | | | | — | | | | 0.3 | | | | — | | | | 0.3 | | |
Current liabilities of discontinued operations | | | 1.2 | | | | 8.8 | | | | 10.0 | | | | — | | | | 10.0 | | |
Total current liabilities | | | 67.6 | | | | 1.1 | | | | 68.7 | | | | 0.6 | | | | 69.3 | | |
LONG-TERM LIABILITIES | | | | | | | | | | | | | | | | | | | | | |
Capital Lease obligations and debt—net of current portion | | | 0.4 | | | | — | | | | 0.4 | | | | — | | | | 0.4 | | |
Accrual for unused office space—net of current portion | | | 1.1 | | | | — | | | | 1.1 | | | | — | | | | 1.1 | | |
Other long-term liabilities | | | 1.2 | | | | — | | | | 1.2 | | | | — | | | | 1.2 | | |
Long term liabilities of discontinued operations | | | 0.2 | | | | — | | | | 0.2 | | | | — | | | | 0.2 | | |
Total long-term liabilities | | | 2.9 | | | | — | | | | 2.9 | | | | — | | | | 2.9 | | |
Total liabilities | | | 70.5 | | | | 1.1 | | | | 71.6 | | | | 0.6 | | | | 72.2 | | |
Common stock | | | — | | | | — | | | | — | | | | — | | | | — | | |
Additional paid-in capital | | | 326.3 | | | | — | | | | 326.3 | | | | 54.3 | | | | 380.6 | | |
Deferred compensation | | | — | | | | — | | | | — | | | | 0.0 | | | | 0.0 | | |
Accumulated deficit | | | (92.5 | ) | | | — | | | | (92.5 | ) | | | (54.9 | ) | | | (147.4 | ) | |
Accumulated other comprehensive income (loss) | | | (1.8 | ) | | | — | | | | (1.8 | ) | | | — | | | | (1.8 | ) | |
STOCKHOLDERS’ EQUITY | | | 232.0 | | | | — | | | | 232.0 | | | | (0.6 | ) | | | 231.4 | | |
Total liabilities and stockholders’ equity | | | $ | 302.5 | | | | $ | 1.1 | | | | $ | 303.6 | | | | $ | (0.0 | ) | | | $ | 303.6 | | |
RECONCILIATION OF CONSOLIDATED BALANCE SHEETS FOR JUNE 30, 2006
(in millions)
| | As Reported | | Adjustment for
International
Discontinued
Operations | | As Restated for
Discontinued
Operations | | Adjustment for
Stock Based
Expenses | | As Restated | |
Assets | | | | | | | | | | | | | | | | | | | | | |
CURRENT ASSETS | | | | | | | | | | | | | | | | | | | | | |
Cash and cash equivalents | | | $ | 11.6 | | | | $ | (2.3 | ) | | | $ | 9.3 | | | | $ | — | | | | $ | 9.3 | | |
Accounts receivable—net | | | 104.4 | | | | (8.7 | ) | | | 95.7 | | | | — | | | | 95.7 | | |
Note receivable | | | 14.6 | | | | — | | | | 14.6 | | | | — | | | | 14.6 | | |
Income taxes receivable | | | — | | | | 0.3 | | | | 0.3 | | | | — | | | | 0.3 | | |
Prepaid expenses | | | 3.2 | | | | (0.4 | ) | | | 2.8 | | | | — | | | | 2.8 | | |
Employee loans and advances | | | 0.3 | | | | (0.1 | ) | | | 0.2 | | | | — | | | | 0.2 | | |
Other current assets | | | 6.4 | | | | (1.9 | ) | | | 4.5 | | | | — | | | | 4.5 | | |
Current assets of discontinued operations | | | 0.7 | | | | 14.0 | | | | 14.7 | | | | — | | | | 14.7 | | |
Total current assets | | | 141.2 | | | | 0.9 | | | | 142.1 | | | | — | | | | 142.1 | | |
Property and equipment, net | | | 15.5 | | | | (1.5 | ) | | | 14.0 | | | | — | | | | 14.0 | | |
Goodwill | | | 119.9 | | | | — | | | | 119.9 | | | | — | | | | 119.9 | | |
Other intangibles, net | | | 6.5 | | | | — | | | | 6.5 | | | | — | | | | 6.5 | | |
Deferred tax assets | | | 12.9 | | | | 0.6 | | | | 13.5 | | | | — | | | | 13.5 | | |
Investments in unconsolidated affiliates | | | 2.1 | | | | — | | | | 2.1 | | | | — | | | | 2.1 | | |
Other assets | | | 1.0 | | | | — | | | | 1.0 | | | | — | | | | 1.0 | | |
Non current assets of discontinued operations | | | — | | | | 1.5 | | | | 1.5 | | | | — | | | | 1.5 | | |
Total assets | | | $ | 299.1 | | | | $ | 1.5 | | | | $ | 300.6 | | | | $ | — | | | | $ | 300.6 | | |
Liabilities and stockholders’ equity | | | | | | | | | | | | | | | | | | | | | |
CURRENT LIABILITIES | | | | | | | | | | | | | | | | | | | | | |
Accounts payable | | | $ | 19.7 | | | | $ | (1.3 | ) | | | $ | 18.4 | | | | $ | — | | | | $ | 18.4 | | |
Accounts payable—related party | | | 1.0 | | | | — | | | | 1.0 | | | | — | | | | 1.0 | | |
Accrued expenses | | | 25.6 | | | | (4.1 | ) | | | 21.5 | | | | 0.6 | | | | 22.1 | | |
Contract management payables | | | — | | | | — | | | | — | | | | — | | | | — | | |
Deferred revenue | | | 4.2 | | | | (0.6 | ) | | | 3.6 | | | | — | | | | 3.6 | | |
Income taxes payable | | | 2.1 | | | | (2.1 | ) | | | — | | | | — | | | | — | | |
Line of credit | | | 8.0 | | | | — | | | | 8.0 | | | | — | | | | 8.0 | | |
Tax contingencies | | | 1.7 | | | | — | | | | 1.7 | | | | — | | | | 1.7 | | |
Accrual for unused office space | | | 0.4 | | | | — | | | | 0.4 | | | | — | | | | 0.4 | | |
Accrual for contingent consideration related to acquisitions | | | 0.1 | | | | — | | | | 0.1 | | | | — | | | | 0.1 | | |
Capital lease obligations and other short-term debt | | | 0.3 | | | | — | | | | 0.3 | | | | — | | | | 0.3 | | |
Current liabilities of discontinued operations | | | 0.9 | | | | 9.6 | | | | 10.5 | | | | — | | | | 10.5 | | |
Total current liabilities | | | 64.0 | | | | 1.5 | | | | 65.5 | | | | 0.6 | | | | 66.1 | | |
LONG-TERM LIABILITIES | | | | | | | | | | | | | | | | | | | | | |
Capital Lease obligations and debt—net of current portion | | | 0.3 | | | | — | | | | 0.3 | | | | — | | | | 0.3 | | |
Accrual for unused office space—net of current portion | | | 1.0 | | | | — | | | | 1.0 | | | | — | | | | 1.0 | | |
Other long-term liabilities | | | 1.3 | | | | — | | | | 1.3 | | | | — | | | | 1.3 | | |
Long term liabilities of discontinued operations | | | 0.2 | | | | — | | | | 0.2 | | | | — | | | | 0.2 | | |
Total long-term liabilities | | | 2.8 | | | | — | | | | 2.8 | | | | — | | | | 2.8 | | |
Total liabilities | | | 66.8 | | | | 1.5 | | | | 68.3 | | | | 0.6 | | | | 68.9 | | |
Common stock | | | — | | | | — | | | | — | | | | — | | | | — | | |
Additional paid-in capital | | | 327.1 | | | | — | | | | 327.1 | | | | 54.3 | | | | 381.4 | | |
Deferred compensation | | | — | | | | — | | | | — | | | | 0.0 | | | | 0.0 | | |
Accumulated deficit | | | (93.1 | ) | | | — | | | | (93.1 | ) | | | (54.9 | ) | | | (148.0 | ) | |
Accumulated other comprehensive loss | | | (1.7 | ) | | | — | | | | (1.7 | ) | | | — | | | | (1.7 | ) | |
STOCKHOLDERS’ EQUITY | | | 232.3 | | | | — | | | | 232.3 | | | | (0.6 | ) | | | 231.7 | | |
Total liabilities and stockholders’ equity | | | $ | 299.1 | | | | $ | 1.5 | | | | $ | 300.6 | | | | $ | (0.0 | ) | | | $ | 300.6 | | |
RECONCILIATION OF CONSOLIDATED BALANCE SHEETS FOR SEPTEMBER 30, 2006
(in millions)
| | As Reported | | Adjustment for
International
Discontinued
Operations | | As Restated for
Discontinued
Operations | | Adjustment for
Stock Based
Expenses | | As Restated | |
Assets | | | | | | | | | | | | | | | | | | | | | |
CURRENT ASSETS | | | | | | | | | | | | | | | | | | | | | |
Cash and cash equivalents | | | $ | 12.9 | | | | $ | (3.8 | ) | | | $ | 9.1 | | | | $ | — | | | | $ | 9.1 | | |
Accounts receivable—net | | | 107.8 | | | | (6.7 | ) | | | 101.1 | | | | — | | | | 101.1 | | |
Note receivable | | | 9.6 | | | | — | | | | 9.6 | | | | — | | | | 9.6 | | |
Prepaid expenses | | | 3.0 | | | | (0.2 | ) | | | 2.8 | | | | — | | | | 2.8 | | |
Employee loans and advances | | | 0.3 | | | | (0.2 | ) | | | 0.1 | | | | — | | | | 0.1 | | |
Other current assets | | | 7.8 | | | | (1.9 | ) | | | 5.9 | | | | — | | | | 5.9 | | |
Current assets of discontinued operations | | | 0.6 | | | | 13.5 | | | | 14.1 | | | | — | | | | 14.1 | | |
Total current assets | | | 142.0 | | | | 0.7 | | | | 142.7 | | | | — | | | | 142.7 | | |
Property and equipment, net | | | 16.1 | | | | (1.5 | ) | | | 14.6 | | | | — | | | | 14.6 | | |
Goodwill | | | 119.9 | | | | — | | | | 119.9 | | | | — | | | | 119.9 | | |
Other intangibles, net | | | 6.1 | | | | — | | | | 6.1 | | | | — | | | | 6.1 | | |
Deferred tax assets | | | 12.9 | | | | 0.6 | | | | 13.5 | | | | — | | | | 13.5 | | |
Investments in unconsolidated affiliates | | | 2.1 | | | | — | | | | 2.1 | | | | — | | | | 2.1 | | |
Other assets | | | 0.8 | | | | — | | | | 0.8 | | | | — | | | | 0.8 | | |
Non current assets of discontinued operations | | | — | | | | 1.5 | | | | 1.5 | | | | — | | | | 1.5 | | |
Total assets | | | $ | 299.9 | | | | $ | 1.3 | | | | $ | 301.2 | | | | $ | — | | | | $ | 301.2 | | |
Liabilities and stockholders’ equity | | | | | | | | | | | | | | | | | | | | | |
CURRENT LIABILITIES | | | | | | | | | | | | | | | | | | | | | |
Accounts payable | | | $ | 18.8 | | | | $ | (1.7 | ) | | | $ | 17.1 | | | | $ | — | | | | $ | 17.1 | | |
Accounts payable—related party | | | — | | | | — | | | | — | | | | — | | | | — | | |
Accrued expenses | | | 28.8 | | | | (4.3 | ) | | | 24.5 | | | | 0.6 | | | | 25.1 | | |
Contract management payables | | | — | | | | — | | | | — | | | | — | | | | — | | |
Deferred revenue | | | 4.0 | | | | (0.4 | ) | | | 3.6 | | | | — | | | | 3.6 | | |
Income taxes payable | | | 2.5 | | | | (2.4 | ) | | | 0.1 | | | | — | | | | 0.1 | | |
Line of credit | | | 8.0 | | | | — | | | | 8.0 | | | | — | | | | 8.0 | | |
Tax contingencies | | | 1.7 | | | | — | | | | 1.7 | | | | — | | | | 1.7 | | |
Accrual for unused office space | | | 0.3 | | | | — | | | | 0.3 | | | | — | | | | 0.3 | | |
Accrual for contingent consideration related to acquisitions | | | 0.1 | | | | — | | | | 0.1 | | | | — | | | | 0.1 | | |
Capital lease obligations and other short-term debt | | | 0.3 | | | | — | | | | 0.3 | | | | — | | | | 0.3 | | |
Current liabilities of discontinued operations | | | 0.5 | | | | 10.1 | | | | 10.6 | | | | — | | | | 10.6 | | |
Total current liabilities | | | 65.0 | | | | 1.3 | | | | 66.3 | | | | 0.6 | | | | 66.9 | | |
LONG-TERM LIABILITIES | | | | | | | | | | | | | | | | | | | | | |
Capital Lease obligations and debt—net of current portion | | | 0.2 | | | | — | | | | 0.2 | | | | — | | | | 0.2 | | |
Accrual for unused office space—net of current portion | | | 1.0 | | | | — | | | | 1.0 | | | | — | | | | 1.0 | | |
Other long-term liabilities | | | 1.2 | | | | — | | | | 1.2 | | | | — | | | | 1.2 | | |
Long term liabilities of discontinued operations | | | 0.2 | | | | — | | | | 0.2 | | | | — | | | | 0.2 | | |
Total long-term liabilities | | | 2.6 | | | | — | | | | 2.6 | | | | — | | | | 2.6 | | |
Total liabilities | | | 67.6 | | | | 1.3 | | | | 68.9 | | | | 0.6 | | | | 69.5 | | |
MINORITY INTEREST | | | — | | | | — | | | | — | | | | — | | | | — | | |
Common stock | | | — | | | | — | | | | — | | | | — | | | | — | | |
Additional paid-in capital | | | 327.8 | | | | — | | | | 327.8 | | | | 54.3 | | | | 382.1 | | |
Deferred compensation | | | — | | | | — | | | | — | | | | 0.0 | | | | 0.0 | | |
Accumulated deficit | | | (94.0 | ) | | | — | | | | (94.0 | ) | | | (54.9 | ) | | | (148.9 | ) | |
Accumulated other comprehensive loss | | | (1.5 | ) | | | — | | | | (1.5 | ) | | | — | | | | (1.5 | ) | |
STOCKHOLDERS’ EQUITY | | | 232.3 | | | | — | | | | 232.3 | | | | (0.6 | ) | | | 231.7 | | |
Total liabilities and stockholders’ equity | | | $ | 299.9 | | | | $ | 1.3 | | | | $ | 301.2 | | | | $ | (0.0 | ) | | | $ | 301.2 | | |
Quarterly Results in 2006
The Company’sCompany's revenues in the fourth quarter were higher than the first three quarters because of the MRC acquisition, which occurred early in the fourth quarter. The Company’sCompany's fourth quarter losses were significantly greater than the first three quarters due to the impairment of goodwill of $18.3 million in our ENSPSS business, an accelerated vesting of stock options which resulted in a total charge of $9.5 million, a write—write-off of off assets related to discontinued operations of $5.2 million and restructuring and other asset impairment charges of $3.5 million.
Note 19. Subsequent Events
a. Former Stock Option Administrator
On May 3, 2007, In addition, the Company announced that it has a filed a lawsuit against a former employee, Vencent Donlan, who previously served asincreased its stock option administratorvaluation allowance by approximately $12.4 million on its deferred tax assets in the fourth quarter of 2006 to address the risks and left the Company in mid-2004, and his spouse. The lawsuit seeks to recover damages resulting from the theft by Donlan of WFI stock options and common stock valued in excess of $6.3 million. The thefts, which appear to have taken place during 2002 and 2003, were discovered through the Company’s review of its past practicesuncertainties related to the grantingCompany's future ability to realize and pricingutilize its deferred tax assets.
KRATOS DEFENSE & SECURITY SOLUTIONS, INC.
Notes to Consolidated Financial Statements (Continued)
Years ended December 31, 2005, 2006 and 2007
Note 18. Quarterly Financial Data (Unaudited) (Continued)
Quarterly Results in 2007
The Company's results by quarter were impacted by the divestitures of employee stock options withour wireless network services segment. In the assistancefirst quarter of its outside counsel and forensic computer consultants. The complaint also alleges that Donlan attempted2007 the loss was primarily due to cover up the scheme by, among other things, deleting entries from the Company’s records. WFI had promptly reported this discoveryimpairment of assets related to the SEC in March 2007 when the theift was discovered. The SEC commencedWireless Deployment business of $13.4 million and an enforcement action against Donlan, and the U.S. Attorney’s Office forwarded a grand jury subpoena to the company seeking recordsimpairment of goodwill related to Donlan and our historical option granting practices. The SEC filed a federal lawsuit and obtained a temporary restraining order and asset freeze against Donlan and his spouse. The U.S. Attorney’s Office indicted Donlan for the theft and he plead guilty to the federal criminal charges. The Company has cooperated with, and intends to continue to cooperate with both the SEC and the U.S. Attorney’s Office on this matter and otherwise.
b. Amendments with KeyBank
Asbusiness of March 30, 2007 the Company was in technical default of the covenants within its credit agreement with Key Bank as the Company had not yet filed its 10 K and 2006 audited financials. On April 6, 2007 the Company entered into an amendment to the credit agreement whereby Key Bank waived this technical default and provided an extension through April 30, 2007 for filing its 10 K and 2006 audited financial statements. On June 1, 2007, the Company entered into a second amendment to the credit agreement whereby Key Bank extended the original waiver for filing its 10 K and 2006 audited financial statements and the quarterly unaudited financial statements for the fiscal quarters ended March 31, 2007 and June 30, 2007 through September 30, 2007 and reduced the total Facility from $85$7.2 million to $50 million to reflect the net pay downs of the revolving line of credit reflecting the divestiture of its EMEA business in March 2007 and the divesture of its domestic Engineering business. In addition, the second amendment provides for the further reduction of the Company’s credit facility to $35 million effective upon receipt of principal payments under the note received from the buyer of the domestic engineering business, which occurred on July 3, 2007.
c. Sale of EMEA/Brazil
On March 9, 2007, the Company announced that it had signed a definitive agreement with LCC International to sell WFI’s entire Europe, Middle East and Africa (EMEA) business in a cash for stock transaction valued at $4 million. The sale of EMEA generatedpartially offset by a gain of $3.3 million which was recorded in the first quarter of 2007.
On April 20, 2007, the Company entered into an Equity Purchase Agreement to sell all of the issued and outstanding equity interests of its wholly owned subsidiary WFI de Brasil Techologia em Telecomunicaciones LTDA, a company limited by shares formed under the laws of the Brazil (“WFI Brazil”), to Strategic Project Services, LLC, a Louisiana limited liability company (“SPS”). Pursuant to the Purchase Agreement, WFI received the following consideration:
· SPS assumed substantially all outstanding liabilities of WFI Brazil;
· Nominal cash consideration on signing of the Purchase Agreement;
· Following the sale of WFI Brazil to SPS, WFI is entitled to receive 25% of the Net Receivables of WFI Brazil until such time as the gross account receivables set forth in the financials of WFI Brazil at Closing are fully paid (the “Earn Out”). SPS shall pay the Earn Out portion of the Net Receivables to WFI within 15 days of SPS’ collection of such amount; and
· If the Working Capital left in WFI Brazil at Closing is less than $1,200,000; then SPS shall be entitled to apply such payments due WFI from an Earn Out amounts to the Working Capital account, until it equals $1,200,000. Thereafter, such Earn Out amounts shall be paid to WFI into such accounts or to such entities as directed in writing by WFI.
d. Sale of Domestic Engineering Business
On May 29, 2007, the Company entered into an Asset Purchase Agreement (the “Acquisition Agreement”) with LCC International, Inc. (“LCC”) pursuant to which the Company agreed to sell to LCC all of the assets used in the conduct of the operation of the Company’s Wireless Network Services business segment that provides engineering services to the non—government wireless communications industry in the United States on the terms set forth in the Acquisition Agreement , subject to the satisfaction of certain closing conditions. The Board of Directors of each of the Company and LCC approved the Acquisition and the Acquisition Agreement.
The aggregate consideration to be paid by LCC in connection with the Acquisition is $46,000,000, subject to certain adjustments. Pursuant to the terms of the Acquisition Agreement, LCC delivered a subordinated promissory note for the principal amount of $21.6 million (the “Subordinated Promissory Note”), subject to working capital adjustments, and paid $17 million in cash and at the closing, and the Company has retained an estimated $7 million in net accounts receivable of the Business, subject to working capital adjustments. The transaction was completed on June 4, 2007.
On July 5, 2007, the Company announced that it had sold the $21.6 million subordinated promissory note in a transaction arranged by KeyBanc Capital Markets (“KeyBanc”). The Company received approximately $19.6 million in net cash proceeds, reflecting a discount from par value of less than five percent and aggregate transaction fees of approximately $1 million, which includes a $0.75 million fee to KeyBanc, an affiliate of the Company’s lender. The note was acquired by a fund affiliated with Silver Point Capital, L.P. (“Silver Point’). Certain post closing adjustments that, under the terms of the sale of the U.S. Wireless EngineeringEMEA business. The Company is not providing any guaranty for LCC’s payment obligations Certain post closing adjustments that, under the termssecond quarter income was impacted by a gain of $14.8 million on the sale of the U.S. Wireless Engineering Services business ere expected to be madeoperations. The third quarter was impacted by a $1.9 million loss from the disposal of our deployment business and a $2.1 million excess facility accrual. The fourth quarter was impacted by a gain of $3.4 million related to the principal amountrecovery of assets under the settlement with the Company's former stock option administrator as well as an expense of $4.9 million related to our estimated cost of the settlement of our 2004 and 2007 Securities Litigation. See Note may instead be made by payments between WFI16 to Notes to Consolidated Financial Statements. Stock option investigation and LCC International, or between Silver Pointrelated costs of $1.5 million, $5.2 million, $6.2 million, and WFI, as applicable.
On August 10, 2007, in accordance with$1.1 million impacted the terms ofresults for the Agreement, the Company provided the closing balance sheet working capital calculation, which indicated a $2.6 million working capital adjustment was is due to WFI as an increase to the balance of the Subordinated Promissory Note. LCC has until September 10, 2007 to review the calculationfirst, second, third and notify the Company of any dispute.
As a result of the divestitures of the U.S. Wireless Engineering and U.S. Wireless Deployment businesses, the Company expects to record a loss of approximately $8 to $10 million in the second and thirdfourth quarters of 2007.2007, respectively.
e. Sale of Deployment BusinessNote 19. Subsequent Events
On July 9, 2007, In February 2008, the Company entered into a definitive merger agreement with an affiliate of Platinum Equity to sell WFI’s Wireless Deployment business. Platinum is a Los Angeles based private equity firm whose portfolio includes serviceSan Diego-based C5ISR and distribution businessesnet-centric warfare solutions provider SYS Technologies (AMEX:SYS) in a numberstock-for-stock transaction. Under the terms of market sectors.
the agreement, SYS will merge with a wholly-owned subsidiary of Kratos, and all of SYS's outstanding common shares will be converted into Kratos common shares. Upon closing, Kratos will issue approximately 25 million shares of its common stock. Approximately 79 million shares of Kratos common stock are currently outstanding. The total consideration for the acquisitiontransaction is $24 million including $18 million in cash at closing, subject to typical postcustomary closing working capital adjustments, and an aggregate $6 million in a three—year earn—out arrangement through 2010. The deal includes a Transition Services Agreement forconditions, including approval of the transition of certain services for a period of six months. The assets sold to Platinum Equity include all of WFI’s Wireless Deployment business,transaction by SYS's shareholders and the Wireless Facilities name.approval of Kratos stockholders for Kratos' issuance of shares. The transaction closed on July 24, 2007.
UNAUDITED PRO FORMA CONDENSED CONSOLIDATED FINANCIAL STATEMENTS
The following unaudited pro forma condensed consolidated balance sheet as of December 31, 2006 and statement of operations for each of the years ended December 31, 2006, 2005 and 2004 give effectis expected to the Company’s completion of the discontinuance of all and sale of substantially all of its engineering business and the sale of its domestic deployment business as described above. For purposes of the unaudited pro forma condensed consolidated balance sheet, we assume that these transactions and the application of the net proceeds occurred as of December 31, 2006. For the unaudited pro forma condensed consolidated statement of operations for the aforementioned periods, we assume that the discontinuance and sales of the businesses occurred on January 1, 2004.
We derived the unaudited pro forma condensed consolidated financial statements from the historical financial statements of the Company. The pro forma adjustments are based upon currently available information and certain assumptions that we believe are reasonable as of the date of this filing. However, actual adjustments may differ materially from the information presented. The unaudited pro forma financial information is for informational purposes only and does not purport to present what our results would actually have been had these transactions actually occurred on the dates presented or to project our results of operations or financial position for any future period. Assumptions underlying the pro forma adjustments are describedclose in the accompanying notes, which should be read in conjunction with the unaudited pro forma condensed consolidated financial statements. In addition, the following information should be read in conjunction with the Company’s consolidated financial statementssecond quarter of 2008.
QuickLinks
Documents Incorporated by ReferenceKRATOS DEFENSE & SECURITY SOLUTIONS, INC. FORM 10-K FOR THE FISCAL YEAR ENDED DECEMBER 31, 2007 TABLE OF CONTENTSPART IPART IICOMPARISON OF 5 YEAR CUMULATIVE TOTAL RETURN* Among Kratos Defense & Security Solutions, Inc. The NASDAQ Composite Index, The NASDAQ Telecommunications Index And A Peer Group
Item 9A. Controls and Procedures
WIRELESS FACILITIES, INC.
UNAUDITED PRO FORMA CONDENSED CONSOLIDATED STATEMENT OF OPERATIONS
FOR THE YEAR ENDED DECEMBER of Operations Years ended December 31, 2005, 2006
($ in and 2007 (in millions, except per share data)amounts)
| | | | Pro Forma Adjustments | | | |
| | | | Wireless | | Wireless | | | |
| | Historical | | Engineering | | Deployment | | Pro Forma | |
| | | | (A) | | (B) | | | |
Revenues | | | $ | 327.8 | | | | $ | (68.0 | ) | | | $ | (106.6 | ) | | | $ | 153.2 | | |
Cost of Revenues | | | 274.3 | | | | (54.4 | ) | | | (95.6 | ) | | | 124.3 | | |
Gross Profit | | | 53.5 | | | | (13.6 | ) | | | (11.0 | ) | | | 28.9 | | |
Selling, general and administrative expenses | | | 63.1 | | | | (13.0 | ) | | | (11.4 | ) | | | 38.7 | | |
Impairment and restructuring charges | | | 21.8 | | | | — | | | | — | | | | 21.8 | | |
Operating loss | | | (31.4 | ) | | | (0.6 | ) | | | 0.4 | | | | (31.6 | ) | |
Other income, net | | | (0.8 | ) | | | — | | | | — | | | | (0.8 | ) | |
Loss from continuing operations before income taxes | | | (32.2 | ) | | | (0.6 | ) | | | 0.4 | | | | (32.4 | ) | |
Provision for income taxes | | | 14.5 | | | | (0.6 | )(G) | | | (0.1 | )(F) | | | 13.8 | | |
Loss from continuing operations | | | $ | (46.7 | ) | | | $ | (0.0 | ) | | | $ | 0.5 | | | | $ | (46.2 | ) | |
Basic and diluted loss per share from continuing operations | | | $ | (0.64 | ) | | | | | | | | | | | $ | (0.63 | ) | |
See Note
KRATOS DEFENSE & SECURITY SOLUTIONS, INC. Consolidated Statements of Cash Flows Years ended December 31, 2005, 2006 and 2007 (in millions)
KRATOS DEFENSE & SECURITY SOLUTIONS, INC. Notes to Unaudited Pro Forma Condensed Consolidated Financial Statements.
Statements Years ended December 31, 2005, 2006 and 2007
WIRELESS FACILITIES, INC.
UNAUDITED PRO FORMA CONDENSED CONSOLIDATED STATEMENTRECONCILIATION OF OPERATIONS
STOCK-BASED COMPENSATION EXPENSE FOR THE YEAR ENDED DECEMBER 31, 2005
($ in (In millions, except per share data)
| | | | Pro Forma Adjustments | | | |
| | as | | Wireless | | Wireless | | | |
| | Restated | | Engineering | | Deployment | | Pro Forma | |
| | | | (A) | | (B) | | | |
Revenues | | | $ | 337.7 | | | | $ | (76.1 | ) | | | $ | (109.5 | ) | | | $ | 152.1 | | |
Cost of Revenues | | | 261.4 | | | | (57.6 | ) | | | (88.3 | ) | | | 115.5 | | |
Gross Profit | | | 76.3 | | | | (18.5 | ) | | | (21.2 | ) | | | 36.6 | | |
Selling, general and administrative expenses | | | 59.4 | | | | (13.7 | ) | | | (12.3 | ) | | | 33.4 | | |
Operating income | | | 16.9 | | | | (4.8 | ) | | | (8.9 | ) | | | 3.2 | | |
Other expense, net | | | 0.3 | | | | — | | | | — | | | | 0.3 | | |
Income from continuing operations before income
taxes | | | 17.2 | | | | (4.8 | ) | | | (8.9 | ) | | | 3.5 | | |
Provision for income taxes | | | 5.9 | | | | (2.3 | )(G) | | | (3.7 | )(F) | | | (0.1 | ) | |
Income (loss) from continuing operations | | | 11.3 | | | | (2.5 | ) | | | (5.2 | ) | | | 3.6 | | |
Basic income per share from continuing operations | | | $ | 0.15 | | | | | | | | | | | | $ | 0.05 | | |
Diluted income per share from continuing operations | | | $ | 0.15 | | | | | | | | | | | | $ | 0.05 | | |
See Note to Unaudited Pro Forma Condensed Consolidated Financial Statements.
WIRELESS FACILITIES, INC.
UNAUDITED PRO FORMA CONDENSED CONSOLIDATED STATEMENT OF OPERATIONS
FOR THE YEAR ENDED DECEMBER 31, 2004
($ in millions except per share data)
| | | | Pro Forma Adjustments | | | |
| | as | | Wireless | | Wireless | | | |
| | Restated | | Engineering | | Deployment | | Pro Forma | |
| | | | (A) | | (B) | | | |
Revenues | | | $ | 296.2 | | | | $ | (79.0 | ) | | | $ | (100.3 | ) | | | $ | 116.9 | | |
Cost of Revenues | | | 226.8 | | | | (50.8 | ) | | | (88.1 | ) | | | 87.9 | | |
Gross Profit | | | 69.4 | | | | (28.2 | ) | | | (12.2 | ) | | | 29.0 | | |
Selling, general and administrative expenses | | | 49.9 | | | | (9.2 | ) | | | (11.8 | ) | | | 28.9 | | |
Contingent acquisition consideration and restatement fees | | | 13.9 | | | | — | | | | — | | | | 13.9 | | |
Operating income (loss) | | | 5.6 | | | | (19.0 | ) | | | (0.4 | ) | | | (13.8 | ) | |
Other income, net | | | 0.1 | | | | | | | | | | | | 0.1 | | |
Impairment of investment in unconsolidated affiliate and other expenses, net | | | (2.9 | ) | | | — | | | | — | | | | (2.9 | ) | |
Total other expense | | | (2.8 | ) | | | 0.0 | | | | 0.0 | | | | (2.8 | ) | |
Income (loss) from continuing operations before income taxes | | | 2.8 | | | | (19.0 | ) | | | (0.4 | ) | | | (16.6 | ) | |
Provision (benefit) for income taxes | | | (0.6 | ) | | | (7.6 | )(G) | | | (0.2 | )(F) | | | (8.4 | ) | |
Income (loss) from continuing operations | | | 3.4 | | | | (11.4 | ) | | | (0.2 | ) | | | (8.2 | ) | |
Basic income (loss) per share from continuing operations | | | $ | 0.05 | | | | | | | | �� | | | | $ | (0.11 | ) | |
Diluted income (loss) per share from continuing operations | | | $ | 0.05 | | | | | | | | | | | | $ | (0.11 | ) | |
See Note to Unaudited Pro Forma Condensed Consolidated Financial Statements.
201
Note 1. Pro Forma Adjustments and Assumptions
Pro Forma Balance Sheet and Statements of Operations
Calculation of gain/(loss) on sale (in millions): | | | | Engineering | | Deployment | |
Purchase price | | | $ | 46.0 | | | | $ | 18.0 | | |
Less: Direct transaction costs | | | (2.8 | ) | | | (1.8 | ) | |
Less: Discount on note receivable | | | (1.1 | ) | | | — | | |
Proceeds net of direct transaction costs | | | 42.1 | | | | 16.2 | | |
Less: Net assets/(liabilities) sold | | | 27.4 | | | | 34.3 | | |
Gain/(Loss) on sale before income taxes | | | 14.7 | | | | (18.1 | ) | |
Less: Income tax (provision)/benefit | | | (7.2 | )(E) | | | — | (F) | |
Net gain/(loss) on sale | | | $ | 7.5 | | | | $ | (18.1 | ) | |
(A) Adjustment to eliminate the balances related to the engineering business from Wireless Facilities, Inc.’s historical consolidated financial statements.
(B) Adjustment to eliminate the balances related to the domestic deployment business from Wireless Facilities, Inc.’s historical consolidated financial statements.
(C) Adjustment to record the cash proceeds received from LCC, the sale of the LCC note to Silver Point and the collection of the net retained working capital less transaction costs as of December 31, 2006.
(D) Adjustment to record the cash proceeds received from Platinum Equity less transaction costs as of December 31, 2006.
(E) Calculated tax effect of gain from the sale of the engineering business based upon the domestic tax rate of 39.1% (35% federal rate plus 4.1% state rate).
(F) No tax benefit was applied to the loss due to the presence of a valuation allowance as of December 31, 2006.
(G) The taxes for the engineering and deployment businesses are calculated at the United States and state combined tax rate of 39% for 2004 through 2006.
202