SECURITIES AND EXCHANGE COMMISSION
x | ANNUAL REPORT UNDER SECTION 13 OR 15(d) OF THE SECURITIES
EXCHANGE ACT OF 1934
| |
FOR THE FISCAL YEAR ENDED DECEMBER 31,
20082009
COMMISSION FILE NUMBER 333-90273
FIDELITY D & D BANCORP, INC.
COMMONWEALTH OF PENNSYLVANIA I.R.S. EMPLOYER IDENTIFICATION NO: 23-3017653
BLAKELY AND DRINKER STREETS
DUNMORE, PENNSYLVANIA 18512
TELEPHONE NUMBER (570) 342-8281
SECURITIES REGISTERED UNDER SECTION 12(b) OF THE ACT:
SECURITIES REGISTERED UNDER SECTION 12(g) OF THE ACT:
Common Stock, without par value
Indicate by check mark if the registrant is a well-known seasoned issuer, as defined in Rule 405 of the Securities Act. Yes o¨ No
x Indicate by check mark if the registrant is not required to file reports pursuant to Section 13 or Section 15(d) of the Act. Yes o¨ No x Indicate by check mark whether the registrant (1) has filed all reports required to be filed by Section 13 or 15(d) of the Securities Exchange Act of 1934 during the preceding 12 months (or for such shorter period that the registrant was required to file such reports), and (2) has been subject to such filing requirements for the past 90 days. Yes x No
o¨ Indicate by check mark whether the registrant has submitted electronically and posted on its corporate Web site, if any, every Interactive Data File required to be submitted and posted pursuant to Rule 405 of Regulation S-T (§ 232.405 of this chapter) during the preceding 12 months (or for such shorter period that the registrant was required to submit and post such files). Yes ¨ No ¨
Indicate by check mark if disclosure of delinquent filers pursuant to Item 405 of Regulation S-K is not contained herein, and will not be contained, to the best of the registrant’s knowledge, in definitive proxy or information statements incorporated by references in Part III of this Form 10-K or any amendment to this Form 10-K. x Indicate by check mark whether the registrant is a large accelerated filer, an accelerated filer, a non-accelerated filer or a smaller reporting company. See definition of “large accelerated filer,” “accelerated filer” and “smaller reporting company” in Rule 12b-2 of the Exchange Act. (Check One)
Large accelerated filer ¨o | | Accelerated filer ¨o |
| | |
Non-accelerated filer ¨o | | Smaller reporting company x |
(Do not check if a smaller reporting company) | | |
Indicate by check mark whether the registrant is a shell company (as defined in Rule 12B-2 of the Act). Yes o¨ No
xAggregate
The aggregate market value of the voting common stock held by non-affiliates of the registrant
equals $49,429,783,was $32,019,171 as of June 30,
2008,2009, based on
a marketthe closing price of
$29.25.$18.60. The number of shares of common stock outstanding as of February 28,
2009,2010, was
2,062,128.2,110,614.
DOCUMENTS INCORPORATED BY REFERENCE
Excerpts from the Registrant’s
20082009 Annual Report to Shareholders are incorporated herein by reference in response to Part I. Portions of the Registrant’s definitive Proxy Statement to be used in connection with the
20092010 Annual Meeting of Shareholders are incorporated herein by reference in partial response to Part II and Part III.
2009 Annual Report on Form 10-K
|
|
|
|
| | | |
| | | 3 |
| | | 5 |
| | | 11
10 |
| | | 11
10 |
| | | 12
11 |
| | | 12
11 |
| | | |
|
|
|
|
| | | |
| | | 12 |
| | | 15
14 |
| | | 16
15 |
| | | 47
46 |
| | | 48
47 |
| | | 81
84 |
| | | 81
84 |
| | | 82
84 |
| | | |
|
|
|
|
| | | |
| | | 82
84 |
| | | 82
85 |
| | | 82
85 |
| | | 82
85 |
| | | 83
85 |
| | | |
|
|
|
|
| | | |
| | | 83
85 |
| | | |
| | 86
88 |
| | 87
89 |
Certifications | | 91
93 |
Forward-Looking Statements
This
Certain of the matters discussed in this Annual Report on Form 10-K
contains a number ofmay constitute forward-looking statements
within the meaning of Section 27Afor purposes of the Securities Act of 1933, as amended,
or the Securities Act, and
Section 21E of the Securities Exchange Act of 1934, as amended,
or the Exchange Act. These statementsand as such may
be identified by the use of the words “anticipate,” “believe,” “could,” “estimate,” “expect,” “intend,” “may,” “outlook,” “plan,” “potential,” “predict,” “project,” “should,” “will,” “would”involve known and
similar terms and phrases, including references to assumptions. Forward-looking statements include risks and uncertainties.Forward-looking statements are based on various assumptions and analyses made by us in light of management’s experience and its perception of historical trends, current conditions and expected future developments, as well as other factors it believes are appropriate under the circumstances. These statements are not guarantees of future performance and are subject tounknown risks, uncertainties and other factors (many of which are beyond our control) that couldmay cause the actual results, performance or achievements of the Company to differbe materially different from future results, performance or achievements expressed or implied by such forward-looking statements. TheseThe words “expect,” “anticipate,” “intend,” “plan,” “believe,” “estimate,” and similar expressions are intended to identify such forward-looking statements.
The Company’s actual results may differ materially from the results anticipated in these forward-looking statements due to a variety of factors,
include,including, without
limitation, the following:· the timing and occurrence or non-occurrence of events may be subject to circumstances beyond our control;
· there may be increases in competitive pressure among financial institutions or from non-financial institutions;
· changes in the interest rate environment may reduce interest margins;
· changes in deposit flows, loan demand or real estate and investment securities values may adversely affect our business;
· changes in accounting principles, policies or guidelines may cause our financial condition to be perceived differently;
· general economic conditions, either nationally or locally in some or all areas in which we do business, or conditions in the securities markets or the banking industry may be less favorable than we currently anticipate;
· legislative or regulatory changes may adversely affect our business;
· technological changes may be more rapid, difficult or expensive than we anticipate;
· success or consummation of new business initiatives may be more difficult or expensive than we anticipate;
· acts of war or terrorism; or
· natural disaster.
Managementlimitation:
| § | the effects of economic deterioration on current customers, specifically the effect of the economy on loan customers’ ability to repay loans; |
| § | the costs and effects of litigation and of unexpected or adverse outcomes in such litigation; |
| § | governmental monetary and fiscal policies, as well as legislative and regulatory changes; |
| § | the effect of changes in accounting policies and practices, as may be adopted by the regulatory agencies, as well as the Financial Accounting Standards Board and other accounting standard setters; |
| § | the risks of changes in interest rates on the level and composition of deposits, loan demand, and the values of loan collateral, securities and interest rate protection agreements, as well as interest rate risks; |
| § | the effects of competition from other commercial banks, thrifts, mortgage banking firms, consumer finance companies, credit unions, securities brokerage firms, insurance companies, money market and other mutual funds and other financial institutions operating in our market area and elsewhere, including institutions operating locally, regionally, nationally and internationally, together with such competitors offering banking products and services by mail, telephone, computer and the internet; |
| § | acquisitions and integration of acquired businesses; |
| § | the failure of assumptions underlying the establishment of reserves for loan and lease losses and estimations of values of collateral and various financial assets and liabilities; |
| § | volatilities in the securities markets; |
| § | deteriorating economic conditions |
| § | acts of war or terrorism; and |
| § | disruption of credit and equity markets. |
The Company cautions readers not to place undue reliance on forward-looking statements, which reflect analyses only as of the date of this
report. We havedocument. The Company has no obligation to update any forward-looking statements to reflect events or circumstances after the date of this document.
Readers should review the risk factors described in
Item 1A, above,this document and
in other documents that we file
or furnish, from
time-to-timetime to time, with the
SEC,Securities and Exchange Commission, including quarterly reports
filed on Form 10-Q and any current reports
filed or furnished on Form 8-K.
ITEM 1:BUSINESS
Fidelity D & D Bancorp, Inc. (the Company) was incorporated in the Commonwealth of Pennsylvania, on August 10, 1999, and is a bank holding company, whose wholly-owned state chartered commercial bank is The Fidelity Deposit and Discount Bank (the Bank) (collectively, the Company). The Company is headquartered at Blakely and Drinker Streets in Dunmore, Pennsylvania.
3
Table of Contents
The Bank has offered a full range of traditional banking services since it commenced operations in 1903. The Bank has a personal and corporate trust department and also provides alternative financial and insurance products with asset management services. A full list of services provided by the Bank is detailed in the section entitled “Products and Services” contained within the 20082009 Annual Report to Shareholders, incorporated by reference. The service area is comprised of the Borough of Dunmore and the surrounding communities within Lackawanna and Luzerne counties in Northeastern Pennsylvania.
The banking business is highly competitive, and the profitability of the Company depends principally upon the Company’s ability to compete in its market area. Competition includes, among other sources, the following:
| ·
§ | local community banks | ·
§ | insurance companies |
| | | | |
| ·
§ | savings banks | ·
§ | money market funds |
| | | | |
| ·
§ | regional banks | ·
§ | mutual funds |
| | | | |
| ·
§ | credit unions | ·
§ | small loan companies |
| | | | |
| ·
§ | savings & loans | ·
§ | other financial service companies |
The Company has been able to compete effectively with other financial institutions by emphasizing technology and customer service, including local decision making on loans. These efforts enabled the Company to establish long-term customer relationships and build customer loyalty by providing products and services designed to address their specific needs.
There are no concentrations of loans that, if lost, would have a materially adverse effect on the continued business of the Company. The Company’s loan portfolio does not have a material concentration within a single industry or group of related industries that are vulnerable to the risk of a near-term severe impact. However, the Company’s success is dependent, to a significant degree, on economic conditions in Northeastern Pennsylvania, especially Lackawanna and Luzerne counties which the Company defines as its primary market area. The banking industry is affected by general economic conditions including the effects of inflation, recession, unemployment, real estate values, trends in national and global economies and other factors beyond the Company’s control. An economic recession or a delayed economic recovery over a prolonged period of time in the Company’s primary market area could cause an increase in the level of the Company’s non-performing assets and loan losses, and thereby cause operating losses, impairment of liquidity and erosion of capital. We cannot assure you that adverse changes in the local economy would not have a material effect on the Company’s future consolidated financial condition, results of operations and cash flows. Refer to Item 1A, “Risk Factors” for material risks and uncertainties that management believes affect the Company.
The Company had
196185 full-time equivalent employees on December 31,
2008,2009, which includes exempt officers,
exempt, non-exempt and part-time employees.
Federal and state banking laws contain numerous provisions that affect various aspects of the business and operations of the Company and the Bank. The Company is subject to, among others, the regulations of the Securities and Exchange Commission (the SEC) and the Federal Reserve Board (the FRB) and the Bank is subject to, among others, the regulations of the Pennsylvania Department of Banking and the Federal Deposit Insurance Corporation (the FDIC). Refer to Part II, Item 7 “Supervision and Regulation” for descriptions of and references to applicable statutes and regulations which are not intended to be complete descriptions of these provisions or their effects on the Company or the Bank. They are summaries only and are qualified in their entirety by reference to such statutes and regulations. Applicable regulations relate to, among other things:
| ·
§ | operations | ·
§ | consolidation |
| | | | |
| ·
§ | securities | ·
§ | reserves |
| | | | |
| ·
§ | risk management | ·
§ | dividends |
| | | | |
| ·
§ | consumer compliance | ·
§ | branches |
| | | | |
| ·
§ | mergers | ·
§ | capital adequacy |
4
Table of Contents
Annually, the Bank is examined by the Pennsylvania Department of Banking and/or the FDIC. The last examination was conducted by the Pennsylvania Department of BankingFDIC as of December 31, 2007.
2008.
The Company’s website address is http://www.bankatfidelity.com. The Company makes available through this website the annual reports on Form 10-K, quarterly reports on Form 10-Q and current reports on Form 8-K and amendments to those reports as soon as reasonably practical after filing with the SEC. You may read and copy any materials filed with the SEC at the SEC’s Public Reference Room at 100 F Street, NE, Washington, DC 20549. You may obtain information on the operation of the Public Reference Room by calling the SEC at (202) 551-8090. The SEC also maintains an internet site that contains reports, proxy and information statements and other information about the Company at http://www.sec.gov.
The Company’s accounting policies and procedures are designed to comply with accounting principles generally accepted in the United States of America (GAAP). Refer to “Critical Accounting Policies,” which are incorporated by reference in Part II, Item 7.
An investment in the Company’s common stock is subject to risks inherent to the Company’s business. The material risks and uncertainties that management believes affect the Company are described below. Before making an investment decision, you should carefully consider the risks and uncertainties described below together with all of the other information included or incorporated by reference in this report. The risks and uncertainties described below are not the only ones facing the Company. Additional risks and uncertainties that management is not aware of or focused on or that management currently deems immaterial may also impair the Company’s business operations. This report is qualified in its entirety by these risk factors.
If any of the following risks actually occur, the Company’s financial condition and results of operations could be materially and adversely affected. If this were to happen, the value of the Company’s common stock could decline significantly, and you could lose all or part of your investment.
Risks Related to the Company’s Business
The Company’s business is subject to interest rate risk and variations in interest rates may negatively affect its financial performance.
Changes in the interest rate environment may reduce profits. The Company’s earnings and cash flows are largely dependent upon its net interest income. Net interest income is the difference between the interest earned on loans, securities and other interest-earning assets, and interest paid on deposits, borrowings and other interest-bearing liabilities. As prevailing interest rates change, net interest spreads are affected by the difference between the maturities and re-pricing characteristics of interest-earning assets and interest-bearing liabilities. In addition, loan volume and yields are affected by market interest rates on loans, and rising interest rates generally are associated with a lower volume of loan originations. An increase in the general level of interest rates may also adversely affect the ability of certain borrowers to pay the interest on and principal of their obligations. Accordingly, changes in levels of market interest rates could materially adversely affect the Company’s net interest spread, asset quality, loan origination volume and overall profitability.
The Company is subject to lending risk.
There are inherent risks associated with the Company’s lending activities. These risks include, among other things, the impact of changes in interest rates and changes in the economic conditions in the markets where the Company operates as well as those across the Commonwealth of Pennsylvania and the United States. Increases in interest rates and/or weakening economic conditions could adversely impact the ability of borrowers to repay outstanding loans or the value of the collateral securing these loans. The Company is also subject to various laws and regulations that affect its lending activities. Failure to comply with applicable laws and regulations could subject the Company to regulatory enforcement action that could result in the assessment of significant civil money penalties against the Company.
As of December 31, 2008, approximately 56% of the Company’s loan portfolio consisted of commercial,
Commercial, commercial real estate and real estate construction
loans. These types of loans are generally viewed as having more risk of default than residential real estate loans or consumer loans. These types of loans are also typically larger than residential real estate loans and consumer loans. Because
the Company’s loan portfolio contains a significant number of commercial, commercialthese loans generally have larger balances than residential real estate
loans and
constructionconsumer loans,
with relatively large balances, the deterioration of one or a few of these loans could cause a significant increase in non-performing loans. An increase in non-performing loans could result in a net loss of earnings from
5
Table of Contents
these loans, an increase in the provision for possible loan losses and an increase in loan charge-offs, all of which could have a material adverse effect on the Company’s financial condition and results of operations.
The Company’s allowance for possible loan losses may be insufficient.
The Company maintains an allowance for possible loan losses, which is a reserve established through a provision for possible loan losses charged to expense, that represents management’s best estimate of probable losses that have been incurred within the existing portfolio of loans. The allowance, in the judgment of management, is necessary to reserve for estimated loan losses and risks inherent in the loan portfolio. The level of the allowance reflects management’s continuing evaluation of industry concentrations; specific credit risks; loan loss experience; current loan portfolio quality; present economic, political and regulatory conditions and unidentified losses inherent in the current loan portfolio. The determination of the appropriate level of the allowance for possible loan losses inherently involves a high degree of subjectivity and requires the Company to make significant estimates of current credit risks and future trends, all of which may undergo material changes. Changes in economic conditions affecting borrowers, new information regarding existing loans, identification of additional problem loans and other factors, both within and outside of the Company’s control, may require an increase in the allowance for possible loan losses. In addition, bank regulatory agencies periodically review the Company’s allowance for loan losses and may require an increase in the provision for possible loan losses or the recognition of further loan charge-offs, based on judgments different than those of management. In addition, if charge-offs in future periods exceed the allowance for possible loan losses, the Company will need additional provisions to increase the allowance for possible loan losses. Any increases in the allowance for loan losses will result in a decrease in net income and capital and may have a material adverse effect on the Company’s financial condition and results of operations.
The Company may need or be compelled to raise additional capital in the future, but that capital may not be available when it is needed and on terms favorable to current shareholders.
Federal banking regulators require the Company and Bank to maintain adequate levels of capital to support their operations. These capital levels are determined and dictated by law, regulation and banking regulatory agencies. In addition, capital levels are also determined by the Company’s management and board of directors based on capital levels that they believe are necessary to support the Company’s business operations. The Company is evaluating its present and future capital requirements and needs, is developing a comprehensive capital plan and is analyzing capital raising alternatives, methods and options. Even if the Company succeeds in meeting the current regulatory capital requirements, the Company may need to raise additional capital in the near future to support possible loan losses during future periods or to meet future regulatory capital requirements.
Further, the Company’s regulators may require it to increase its capital levels. If the Company raises capital through the issuance of additional shares of its common stock or other securities, it would likely dilute the ownership interests of current investors and would likely dilute the per-share book value and earnings per share of its common stock. Furthermore, it may have an adverse impact on the Company’s stock price. New investors may also have rights, preferences and privileges senior to the Company’s current shareholders, which may adversely impact its current shareholders. The Company’s ability to raise additional capital will depend on conditions in the capital markets at that time, which are outside its control, and on its financial performance. Accordingly, the Company cannot assure you of its ability to raise additional capital on terms and time frames acceptable to it or to raise additional capital at all. If the Company cannot raise additional capital in sufficient amounts when needed, its ability to comply with regulatory capital requirements could be materially impaired. Additionally, the inability to raise capital in sufficient amounts may adversely affect the Company’s operations, financial condition and results of operations.
If we conclude that the decline in value of any of our investment securities is other than temporary, we will be required to write down the credit-related portion of the impairment of that security through a charge to earnings.
We review our investment securities portfolio at each quarter-end reporting period to determine whether the fair value is below the current carrying value. When the fair value of any of our investment securities has declined below its carrying value, we are required to assess whether the decline is other than temporary. If we conclude that the decline is other than temporary, we will be required to write down the credit-related portion of the impairment of that security through a charge to earnings. As of December 31, 2009, the book value of the Company’s pooled trust preferred securities was $18,794,000 with an estimated fair value of $5,242,000. Changes in the expected cash flows of these securities and/or prolonged price declines have resulted and may result in our concluding in future periods that there is additional impairment of these securities that is other than temporary, which would require a charge to earnings for the portion of the impairment that is deemed to be-credit-related. Due to the complexity of the calculations and assumptions used in determining whether an asset, such as pooled trust preferred securities, is impaired, the impairment disclosed may not accurately reflect the actual impairment in the future.
The Company is subject to environmental liability risk associated with lending activities.
A significant portion of the Company’s loan portfolio is secured by real property. During the ordinary course of business, the Company may foreclose on and take title to properties securing certain loans. In doing so, there is a risk that hazardous or toxic substances could be found on these properties. If hazardous or toxic substances are found, the Company may be liable for remediation costs, as well as for personal injury and property damage. Environmental laws may require the Company to incur substantial
expensesexpense and may materially reduce the affected property’s value or limit the Company’s ability to use or sell the affected property. In addition, future laws or more stringent interpretations or enforcement policies with respect to existing laws may increase the Company’s exposure to environmental liability. Although the Company has policies and procedures to perform an environmental review before initiating any foreclosure action on real property, these reviews may not be sufficient to detect all potential environmental hazards. The remediation costs and any other financial liabilities associated with an environmental hazard could have a material adverse effect on the Company’s financial condition and results of operations.
The Company’s profitability depends significantly on economic conditions in the Commonwealth of Pennsylvania and the local region in which it conducts business.
The Company’s success depends primarily on the general economic conditions of the Commonwealth of Pennsylvania and the specific local markets in which the Company operates. Unlike larger national or other regional banks that are more geographically diversified, the Company provides banking and financial services to customers primarily in Lackawanna and Luzerne
Counties.Counties in Northeastern Pennsylvania. The local economic conditions in these areas have a significant impact on the demand for the Company’s products and services as well as the ability of the Company’s customers to repay loans, the value of the collateral securing loans and the stability of the Company’s deposit funding sources. A significant decline in general economic conditions, caused by inflation, recession, acts of terrorism, an outbreak of hostilities or other international or domestic occurrences, unemployment, changes in securities markets or other factors could impact these local economic conditions and, in turn, have a material adverse effect on the Company’s financial condition and results of operations.
Currently, our Country is in a recession. The severity, depth and length of this recession is indeterminable. Job layoffs and eliminations continue to be announced throughout the United States, as well as locally. Reductions in the levels of income of both businesses and individual consumers could have a material impact on their ability to meet their loan payment obligations. This in turn could have a material adverse impact on the companies overall financial condition and earnings.
There is no assurance that the Company will be able to successfully compete with others for business.
The Company competes for loans, deposits and investment dollars with numerous regional and national banks and other community banking institutions, as well as other kinds of financial institutions and enterprises, such as securities firms, insurance companies, savings associations, credit unions, mortgage brokers and private lenders. Many competitors have substantially greater resources than the Company does, and operate under less stringent regulatory environments. The differences in resources and regulations may make it more difficult for the Company to compete profitably, reduce the rates
6
Table of Contents
that it can earn on loans and on its investments, increase the rates it must offer on deposits and other funds, and adversely affect its overall financial condition and earnings.
The Company is subject to extensive government regulation and supervision.
The Company, primarily through the Bank,
, is subject to extensive federal and state regulation and supervision. Banking regulations are primarily intended to protect depositors’ funds, federal deposit insurance funds and the banking system as a whole, not shareholders. These regulations affect the Company’s lending practices, capital structure, investment practices, dividend policy and growth, among other things. Federal or commonwealth regulatory agencies continually review banking laws, regulations and policies for possible changes. Changes to statutes, regulations or regulatory policies, including changes in interpretation or implementation of statutes, regulations or policies, could affect the Company in substantial and unpredictable ways. Such changes could subject the Company to additional costs, limit the types of financial services and products the Company may offer and/or increase the ability of non-banks to offer competing financial services and products, among other things. Failure to comply with laws, regulations or policies could result in sanctions by regulatory agencies, civil money penalties and/or reputation damage, which could have a material adverse effect on the Company’s business, financial condition and results of operations. While the Company has policies and procedures designed to prevent any such violations, there can be no assurance that such violations will not occur.
The Company’s controls and procedures may fail or be circumvented.
Management regularly reviews and updates the Company’s internal controls, disclosure controls and procedures, and corporate governance policies and procedures. Any system of controls, however well designed and operated, is based in part on certain assumptions and can provide only reasonable, not absolute, assurances that the objectives of the system are met. Any failure or circumvention of the Company’s controls and procedures or failure to comply with regulations related to controls and procedures could have a material adverse effect on the Company’s business, results of operations and financial condition.
New lines of business or new products and services may subject the Company to additional risks.
From time-to-time, the Company may implement new lines of business or offer new products and services within existing lines of business. There are substantial risks and uncertainties associated with these efforts, particularly in instances where the markets are not fully developed. In developing and marketing new lines of business and/or new products and services the Company may invest significant time and resources. Initial timetables for the introduction and development of new lines of business and/or new products or services may not be achieved and price and profitability targets may not prove feasible. External factors, such as compliance with regulations, competitive alternatives, and shifting market preferences, may also impact the successful implementation of a new line of business or a new product or service. Furthermore, any new line of business and/or new product or service could have a significant impact on the effectiveness of the Company’s system of internal controls. Failure to successfully manage these risks in the development and implementation of new lines of business or new products or services could have a material adverse effect on the Company’s business, results of operations and financial condition.
The Company’s ability to pay dividends depends primarily on dividends from its banking subsidiary, which is subject to regulatory limits.
The Company is a bank holding company and its operations are conducted by its subsidiary. Its ability to pay dividends depends on its receipt of dividends from its subsidiary. Dividend payments from its banking subsidiary are subject to legal and regulatory limitations, generally based on net profits and retained earnings, imposed by the various banking regulatory agencies. The ability of its subsidiary to pay dividends is also subject to its profitability, financial condition, capital expenditures and other cash flow requirements. There is no assurance that its subsidiary will be able to pay dividends in the future or that the Company will generate adequate cash flow to pay dividends in the future. The Company’s failure to pay dividends on its common stock could have a material adverse effect on the market price of its common stock.
7
Table of Contents
The Company’s future acquisitions could dilute your ownership and may cause it to become more susceptible to adverse economic events.
The Company may use its common stock to acquire other companies or make investments in banks and other complementary businesses in the future. The Company may issue additional shares of common stock to pay for future acquisitions, which would dilute your ownership interest in the Company. Future business acquisitions could be material to the Company, and the degree of success achieved in acquiring and integrating these businesses into the Company could have a material effect on the value of the Company’s common stock. In addition, any acquisition could require it to use substantial cash or other liquid assets or to incur debt. In those events, it could become more susceptible to economic downturns and competitive pressures.
The Company may not be able to attract and retain skilled people.
The Company’s success depends, in large part, on its ability to attract and retain key people. Competition for the best people in most activities engaged in by the Company can be intense and the Company may not be able to hire people or to retain them. The unexpected loss of services of one or more of the Company’s key personnel could have a material adverse impact on the Company’s business because of their skills, knowledge of the Company’s market, years of industry experience and the difficulty of promptly finding qualified replacement personnel. The Company has an employment agreement with its President and Chief Executive Officer.personnel.
The Company’s information systems may experience an interruption or breach in security.
The Company relies heavily on communications and information systems to conduct its business. Any failure, interruption or breach in security of these systems could result in failures or disruptions in the Company’s customer relationship management, general ledger, deposit, loan and other systems. While the Company has policies and procedures designed to prevent or limit the effect of the failure, interruption or security breach of its information systems, there can be no assurance that any such failures, interruptions or security breaches will not occur or, if they do occur, that they will be adequately addressed. The occurrence of any failures, interruptions or security breaches of the Company’s information systems could damage the Company’s reputation, result in a loss of customer business, subject the Company to additional regulatory scrutiny, or expose the Company to civil litigation and possible financial liability, any of which could have a material adverse effect on the Company’s financial condition and results of operations.
The Company continually encounters technological change.
The financial services industry is continually undergoing rapid technological change with frequent introductions of new technology-driven products and services. The effective use of technology increases efficiency and enables financial institutions to better serve customers and to reduce costs. The Company’s future success depends, in part, upon its ability to address the needs of its customers by using technology to provide products and services that will satisfy customer demands, as well as to create additional efficiencies in the Company’s operations. Many of the Company’s competitors have substantially greater resources to invest in technological improvements. The Company may not be able to effectively implement new technology-driven products and services or be successful in marketing these products and services to its customers. Failure to successfully keep pace with technological change affecting the financial services industry could have a material adverse impact on the Company’s business and, in turn, the Company’s financial condition and results of operations.
The Company is subject to claims and litigation pertaining to fiduciary responsibility.
From time-to-time, customers make claims and take legal action pertaining to the Company’s performance of its fiduciary responsibilities. Whether customer claims and legal action related to the Company’s performance of its fiduciary responsibilities are founded or unfounded, if such claims and legal actions are not resolved in a manner favorable to the Company, they may result in significant financial liability and/or adversely affect the market perception of the Company and its products and services as well as impact customer demand for those products and services. Any financial liability or reputation damage could have a material adverse effect on the Company’s business, which, in turn, could have a material adverse effect on the Company’s financial condition and results of operations.
Severe weather, natural disasters, acts of war or terrorism and other external events could significantly impact the Company’s business.
Severe weather, natural disasters, acts of war or terrorism and other adverse external events could have a significant impact on the Company’s ability to conduct business. Such events could affect the stability of the Company’s deposit base, impair the ability of borrowers to repay outstanding loans, impair the value of collateral securing loans, cause significant property damage, result in loss of revenue and/or cause the Company to incur additional expenses. Severe weather or natural disasters, acts of war or terrorism or other adverse external events may occur in the future. Although management has
8
Table of Contents
established disaster recovery policies and procedures, the occurrence of any such event could have a material adverse effect on the Company’s business, which, in turn, could have a material adverse effect on the Company’s financial condition and results of operations.
We currently have an Interim Chief Executive Officer while we search for a permanent Chief Executive Officer.
During the third quarter of 2009 our President and Chief Executive Officer resigned. As a result, the board of directors formed a CEO search committee and is currently conducting a search. While we expect to recruit a new CEO no later than the end of the second quarter of 2010, we cannot assure you that the process will be concluded by then. Further, until we find a permanent CEO, we may be unable to successfully manage and grow the business; and, our business, financial condition and profitability may suffer. We believe each member of our senior management team is important to our success and the unexpected loss of any of these persons could impair our day-to-day operations as well as our strategic direction.
Readers should review the risk factors described in other documents that we file or furnish, from time to time, with the Securities and Exchange Commission, including Annual Reports to Shareholders, Annual Reports filed on Form 10-K and other current reports filed or furnished on Form 8-K.
Risks Associated with the Company’s Common Stock
The Company’s stock price can be volatile.
Stock price volatility may make it more difficult for you to resell your common stock when you want and at prices you find attractive. The Company’s stock price can fluctuate significantly in response to a variety of factors including, among other things:
· Actual or anticipated variations in quarterly results of operations.
· Recommendations by securities analysts.
· Operating and stock price performance of other companies that investors deem comparable to the Company.
· News reports relating to trends, concerns and other issues in the financial services industry.
· Perceptions in the marketplace regarding the Company and/or its competitors.
· New technology used, or services offered, by competitors.
· Significant acquisitions or business combinations, strategic partnerships, joint ventures or capital commitments by or involving the Company or its competitors.
· Failure to integrate acquisitions or realize anticipated benefits from acquisitions.
· Changes in government regulations.
· Geopolitical conditions such as acts or threats of terrorism or military conflicts.
| · | Actual or anticipated variations in quarterly results of operations. |
| · | Recommendations by securities analysts. |
| · | Operating and stock price performance of other companies that investors deem comparable to the Company. |
| · | News reports relating to trends, concerns and other issues in the financial services industry. |
| · | Perceptions in the marketplace regarding the Company and/or its competitors. |
| · | New technology used, or services offered, by competitors. |
| · | Significant acquisitions or business combinations, strategic partnerships, joint ventures or capital commitments by or involving the Company or its competitors. |
| · | Failure to integrate acquisitions or realize anticipated benefits from acquisitions. |
| · | Changes in government regulations. |
| · | Geopolitical conditions such as acts or threats of terrorism or military conflicts. |
General market fluctuations, industry factors and general economic and political conditions and events, such as economic slowdowns or recessions, interest rate changes or credit loss trends, could also cause the Company’s stock price to decrease regardless of operating results.
The trading volume in the Company’s common stock is less than that of other larger financial services companies.
The Company’s common stock is listed for trading on the over-the-counter bulletin
board;board and the trading volume in its common stock is less than that of other larger financial services companies. A public trading market having the desired characteristics of depth, liquidity and orderliness depends on the presence in the marketplace of willing buyers and sellers of the Company’s common stock at any given time. This presence depends on the individual decisions of investors and general economic and market conditions over which the Company has no control. Given the lower trading volume of the Company’s common stock, significant sales of the Company’s common stock, or the expectation of these sales, could cause the Company’s stock price to fall.
An investment in the Company’s common stock is not an insured deposit.
The Company’s common stock is not a bank deposit and, therefore, is not insured against loss by the FDIC, any other deposit insurance fund or by any other public or private entity. Investment in the Company’s common stock is inherently risky for the reasons described in this “Risk Factors” section and elsewhere in this report and is subject to the same market forces that affect the price of common stock in any company. As a result, if you acquire the Company’s common stock, you may lose some or all of your investment.
The Company’s articles of incorporation and by-laws, as well as certain banking laws, may have an anti-takeover effect.
Provisions of the Company’s articles of incorporation and by-laws, federal banking laws, including regulatory approval requirements, could make it more difficult for a third party to acquire the Company, even if doing so would be perceived to be beneficial to the Company’s shareholders. The combination of these provisions effectively inhibits a non-negotiated merger or other business combination, which, in turn, could adversely affect the market price of the Company’s common stock.
Risks Associated with the Company’s Industry
Future governmental regulation and legislation could limit the Company’s future growth.
The Company is a registered bank holding company, and its subsidiary bank is a depository institution whose deposits are insured by the FDIC. As a result, the Company is subject to various regulations and examinations by various regulatory authorities. In general, statutes establish the corporate governance and eligible business activities for the Company, certain
9
Table of Contents
acquisition and merger restrictions, limitations on inter-company transactions such as loans and dividends, capital adequacy requirements, requirements for anti-money laundering programs and other compliance matters, among other regulations. The Company is extensively regulated under federal and state banking laws and regulations that are intended primarily for the protection of depositors, federal deposit insurance funds and the banking system as a whole. Compliance with these statutes and regulations is important to itsthe Company’s ability to engage in new activities and to consummate additional acquisitions.
In addition, the Company is subject to changes in federal and state tax laws as well as changes in banking and credit regulations, accounting principles and governmental economic and monetary policies. The Company cannot predict whether any of these changes may adversely and materially affect it. Federal and state banking regulators also possess broad powers to take supervisory actions as they deem appropriate. These supervisory actions may result in higher capital requirements, higher insurance premiums and limitations on the Company’s activities that could have a material adverse effect on its business and profitability. While these statutes are generally designed to minimize potential loss to depositors and the FDIC insurance funds, they do not eliminate risk, and compliance with such statutes increases the Company’s expense, requires management’s attention and can be a disadvantage from a competitive standpoint with respect to non-regulated competitors.
The earnings of financial services companies are significantly affected by general business and economic conditions.
The Company’s operations and profitability are impacted by general business and economic conditions in the United States and abroad. These conditions include short-term and long-term interest rates, inflation, money supply, political issues, legislative and regulatory changes, fluctuations in both debt and equity capital markets, broad trends in industry and finance, and the strength of the U.S. economy and the local economies in which the Company operates, all of which are beyond the Company’s control. Deterioration in economic conditions could result in an increase in loan delinquencies and non-performing assets, decreases in loan collateral values and a decrease in demand for the Company’s products and services, among other things, any of which could have a material adverse impact on the Company’s financial condition and results of operations.
Financial services companies depend on the accuracy and completeness of information about customers and counterparties.
In deciding whether to extend credit or enter into other transactions, the Company may rely on information furnished by or on behalf of customers and counterparties, including financial statements, credit reports and other financial information. The Company may also rely on representations of those customers, counterparties or other third parties, such as independent auditors, as to the accuracy and completeness of that information. Reliance on inaccurate or misleading financial statements, credit reports or other financial information could have a material adverse impact on the Company’s business and, in turn, the Company’s financial condition and results of operations.
Consumers may decide not to use banks to complete their financial transactions.
Technology and other changes are allowing parties to complete financial transactions that historically have involved banks through alternative methods. For example, consumers can now maintain funds that would have historically been held as bank deposits in brokerage accounts or mutual funds. Consumers can also complete transactions such as paying bills and/or transferring funds directly without the assistance of banks. The process of eliminating banks as intermediaries, known as “disintermediation,” could result in the loss of fee income, as well as the loss of customer deposits and the related income generated from those deposits. The loss of these revenue streams and the lower cost deposits as a source of funds could have a material adverse effect on the Company’s financial condition and results of operations.
The capital and credit markets have experienced unprecedented levels of volatility.
During 2008 the capital and credit markets experienced severe volatility and disruption. In the third and fourth quarters of 2008, the volatility and disruption reached unprecedented levels. This has continued into 2009 and the Country is presently in a recession. Reflecting concern about the stability of the financial markets generally and the strength of counterparties, many lenders and institutional investors have reduced, and in some cases ceased to provide, funding to borrowers, including other financial institutions. Although to date we have not suffered liquidity problems, we are part of the financial system and a systemic lack of available credit, a lack of confidence in the financial sector, increased volatility in the financial markets and reduced business activity could materially and adversely affect our business, financial condition and results of operations.
In response to the turmoil in the banking system and financial markets, the U.S. government has taken unprecedented actions, including the U.S. Treasury’s plan to inject capital and to purchase mortgage loans and mortgage-backed and other securities from financial institutions for the purpose of stabilizing the financial markets generally or particular financial institutions. There is no assurance that these government actions will achieve their purpose.
10
Table of Contents
The failure to help stabilize the financial markets and a continuation or worsening of the current financial market conditions could have a material adverse affect on our business, our financial condition, the financial condition of our customers, our common stock trading price, as well as our ability to access credit.
ITEM 1B:UNRESOLVED STAFF COMMENTS
None
None
ITEM 2: PROPERTIESPROPERTIES
As of December 31,
2008,2009, the Company operated
1211 full-service banking offices, of which four were owned and
eightseven were leased. None of the lessors of the properties leased by the Company are affiliated with the Company
or the Bank and all of the properties are located in the Commonwealth of Pennsylvania. The Company is headquartered at its
owner occupiedowner-occupied main branch located on the corner of Blakely and Drinker Streets in Dunmore, PA.
The following table provides information with respect to the principal properties from which the Bank conducts business:
Location |
| Owned / leased* |
| Type of use |
| Full service |
| Drive-thru |
| ATM |
Drinker & Blakely Sts.,
Dunmore, PA | | Owned | | Main Branch (1) (2) | | x | | x | | x |
| | | | | | | | | | |
111 Green Ridge St.,
Scranton, PA | | Leased | | Green Ridge Branch (2) | | x | | x | | x |
| | | | | | | | | | |
139 Wyoming Ave.,
Scranton, PA
| | Leased
| | Scranton Branch
| | x
| | | | x
|
| | | | | | | | | | |
1311 Morgan Hwy.,
Clarks Summit, PA | | Leased | | Abington Branch (3) | | x | | x | | x |
| | | | | | | | | | |
1232 Keystone Industrial Park Rd.,
Dunmore, PA | | Owned | | Keystone Industrial Park Branch | | x | | x | | x |
| | | | | | | | | | |
338 North Washington Ave.,
Scranton, PA | | Owned | | Financial Center Branch (4) | | x | | | | x |
| | | | | | | | | | |
4010 Birney Ave.,
Moosic, PA | | Leased | | Moosic Branch | | x | | x | | x |
| | | | | | | | | | |
801 Wyoming Ave.,
West Pittston, PA | | Leased | | West Pittston Branch | | x | | | | x |
| | | | | | | | | | |
1598 Main St.,
Peckville, PA | | Leased | | Peckville Branch | | x | | x | | x |
| | | | | | | | | | |
247 Wyoming Ave.,
Kingston, PA | | Leased | | Kingston Branch | | x | | x | | x |
| | | | | | | | | | |
511 Scranton-Carbondale Hwy., Eynon, PA | | Leased | | Eynon Branch | | x | | x | | x |
| | | | | | | | | | |
400 S. Main St.,
Scranton, PA | | Owned | | West Scranton Branch(2) | | x | | x | | x |
*All of the owned properties are free of encumbrances
(1) Executive and administrative, commercial lending, trust and asset management services are located at this facility. (2) This office has two automated teller machines (ATMs). (3) In addition, there is a banking facility located in the Clarks Summit State Hospital. The office is leased from the hospital under a lease-for-service-provided agreement with service limited to employees and patients of the hospital. (4) Executive, mortgage and consumer lending, finance and operational offices are located in this building. A portion of the building is leased to a non-related entity.11
Table of Contents
The Bank maintains several free-standing 24-hour ATMs located at the following locations in Pennsylvania:
· U.S. Mini Marts, Inc., 511 Main St., Childs
· Marywood University, 2300 Adams Ave., Nazareth and Regina Halls, Scranton
· Snö Mountain Ski Resort, 1000 Montage Mountain Rd., Moosic
· Shoppes at Montage, 1035 Shoppes Blvd., Moosic
| · | 139 Wyoming Ave., Scranton (former location of the Bank’s Scranton branch) |
| · | Marywood University, 2300 Adams Ave., Nazareth and Regina Halls, Scranton |
| · | Snö Mountain Ski Resort, 1000 Montage Mountain Rd., Moosic |
| · | Shoppes at Montage, 1035 Shoppes Blvd., Moosic |
During
2008,2009, the Company closed its
PittstonScranton branch office located at
403 Kennedy Blvd., Pittston.139 Wyoming Avenue, Scranton.
Other real estate owned includes all foreclosed properties listed for sale. Upon possession, foreclosed properties are recorded on the Company’s balance sheet at the lower of cost or fair value.
The nature of the Company’s business generates some litigation involving matters arising in the ordinary course of business. However, in the opinion of the Company after consulting with legal counsel, no legal proceedings are pending, which, if determined adversely to the Company or the Bank, would have a material effect on the Company’s undivided profits or financial condition. No legal proceedings are pending other than ordinary routine litigation incidental to the business of the Company and the Bank. In addition, to management’s knowledge, no governmental authorities have initiated or contemplated any material legal actions against the Company or the Bank.
No matter was submitted during the quarter ended December 31, 2008 to a vote of our security holders through solicitation of proxies or otherwise.
PART II
ITEM 5:MARKET FOR REGISTRANT’S COMMON EQUITY, RELATED STOCKHOLDER MATTERS AND ISSUER PURCHASES OF EQUITY SECURITIES
The common stock of the Company is traded on the over-the-counter bulletin board under the symbol “FDBC.” Shareholders requesting information about the Company’s common stock may contact contact:
Salvatore R. DeFrancesco, Jr.,
Treasurer. Requests may be mailed to:Treasurer
Fidelity D & D Bancorp, Inc.
Blakely and Drinker
St.Sts.
The following table lists the quarterly cash dividends paid per share and the range of high and low bid prices for the Company’s common
stock.stock based on information obtained from on-line published sources. Such over-the-counter prices do not include retail mark-ups, markdowns or commissions:
| | 2008 | | | | 2007 | | | |
| | Prices | | Dividends | | Prices | | Dividends | |
| | High | | Low | | paid | | High | | Low | | paid | |
1st Quarter | | $ | 31.00 | | $ | 25.20 | | $ | 0.25 | | $ | 40.00 | | $ | 32.50 | | $ | 0.22 | |
2nd Quarter | | $ | 30.00 | | $ | 27.00 | | $ | 0.25 | | $ | 37.75 | | $ | 32.00 | | $ | 0.22 | |
3rd Quarter | | $ | 33.50 | | $ | 29.00 | | $ | 0.25 | | $ | 34.00 | | $ | 27.10 | | $ | 0.24 | |
4th Quarter | | $ | 28.75 | | $ | 21.75 | | $ | 0.25 | | $ | 34.00 | | $ | 27.00 | | $ | 0.25 | |
| | | 2009 Prices | | | Dividends | | | 2008 Prices | | | Dividends | |
| | | High | | | Low | | | paid | | | High | | | Low | | | paid | |
| 1st Quarter | | $ | 26.50 | | | $ | 19.50 | | | $ | 0.25 | | | $ | 31.00 | | | $ | 25.20 | | | $ | 0.25 | |
| 2nd Quarter | | $ | 24.00 | | | $ | 18.40 | | | $ | 0.25 | | | $ | 30.00 | | | $ | 27.00 | | | $ | 0.25 | |
| 3rd Quarter | | $ | 22.00 | | | $ | 18.35 | | | $ | 0.25 | | | $ | 33.50 | | | $ | 29.00 | | | $ | 0.25 | |
| 4th Quarter | | $ | 19.00 | | | $ | 14.60 | | | $ | 0.25 | | | $ | 28.75 | | | $ | 21.75 | | | $ | 0.25 | |
Dividends are determined and declared by the Board of Directors of the Company. The Company expects to continue to pay cash dividends in the future; however, future dividends are dependent upon earnings, financial condition, capital needs and other factors of the Company. For a further discussion of regulatory capital requirements see Note 14, “Regulatory
matters,”Matters”, contained within the notes to the consolidated financial
statements.statements, incorporated by reference in Part II, Item 8.
The Company has established a dividend reinvestment plan (DRP) for its shareholders. The plan
is designedprovides shareholders with a convenient and economical method of investing cash dividends payable upon their common stock and the opportunity to make
voluntary optional cash payments to purchase additional shares of the Company’s
common stock. Participants pay no brokerage commissions or service charges when they acquire additional shares of common stock
available at no transactional cost to our shareholders. Cash dividends, paid to shareholders who are enrolled inthrough the
DRP, are used toplan. The administrator may purchase shares directly from the Company,
or from shares that are available in the open
market.12
The Company had approximately
1,3231,307 shareholders
at February 28, 2009 and also at December 31,
2008.2009 and 1,287 shareholders as of February 28, 2010. The number of shareholders is the actual number of individual shareholders of record. Each security depository is considered a single shareholder for purposes of determining the approximate number of shareholders.
Securities authorized for issuance under equity compensation plans
The information required under this section is incorporated by reference herein, to the information presented in the Company’s definitive Proxy Statement for its
20092010 Annual Meeting of Shareholders to be filed with the SEC.
Purchases of equity securities by the issuer and affiliated purchasers
The following table summarizes the activity in the Company’s stock repurchase program during the fourth quarter of 2008:
| | (a) | | (b) | | (c) | | (d) | |
| | | | | | Total number of | | | |
| | | | | | shares (or units) | | Maximum number of | |
| | Total Number | | | | purchased as part as | | shares (or units) that may | |
| | of shares (or units) | | Average price paid | | publicly announced plans | | yet be purchased under the | |
Period | | purchased | | per share (or unit) | | or programs | | plans or programs | |
October 1, 2008
to
October 31, 2008 | | — | | $ | — | | — | | 37,000 | |
November 1, 2008
to
November 30, 2008 | | 2,000 | | 25.31 | | 2,000 | | 35,000 | |
December 1, 2008
to
December 31, 2008 | | — | | — | | — | | 35,000 | |
Total | | 2,000 | | $ | 25.31 | | 2,000 | | 35,000 | |
In the second quarter of 2008 the Company’s Board of Directors approved and publicly announced its intent to initiate a capital stock repurchase program covering up to 50,000 shares, or approximately 2.4% of its outstanding capital stock as of May 31, 2008. The Company has not made any purchases of its shares of capital that has not been publicly announced. Neither an expiration date nor a maximum dollar amount has been fixed to the program. The repurchases will be made from time-to-time in open-market transactions, subject to availability. The repurchased shares would become treasury stock and could be available for issuance under the Company’s various stock-based compensation, employee stock purchase and dividend reinvestment plans and for general corporate purposes. No repurchase program has expired or has been subject to a determination to terminate during the period covered by the above table. In December 2008, 2,745 shares were reissued by the Company to participants in the dividend reinvestment plan at a re-issue price of $26.81 per share.
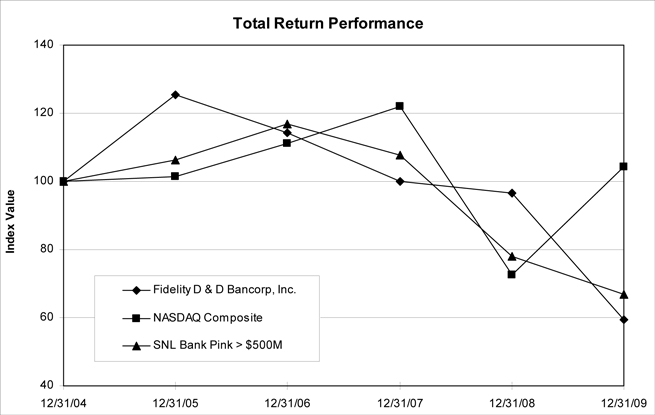
The following graph and table compare the cumulative total shareholder return on the Company’s common stock against the cumulative total return of the NASDAQ Composite and the SNL index of greater than $500 million in-asset banks traded on the OTC-BB and Pink Sheet (the SNL index) for the period of five fiscal years commencing January 1,
2004,2005, and ending December 31,
2008.2009. As of December 31, 2009, the SNL index consisted of 136 banks. The graph illustrates the cumulative investment return to shareholders, based on the assumption that a $100 investment was made on December 31,
2003,2004, in each of: the Company’s common stock, the NASDAQ Composite and the SNL index. All cumulative total returns are computed assuming the reinvestment of dividends into the applicable securities. The shareholder return shown on the graph and table below is not necessarily indicative of future performance:
| | | | Period Ending | |
| Index | | | 12/31/04 | | | 12/31/05 | | | 12/31/06 | | | 12/31/07 | | | 12/31/08 | | | 12/31/09 | |
| Fidelity D & D Bancorp, Inc. | | | 100.00 | | | 125.47 | | | 114.21 | | | 100.04 | | | 96.48 | | | 59.32 | |
| NASDAQ Composite | | | 100.00 | | | 101.37 | | | 111.03 | | | 121.92 | | | 72.49 | | | 104.31 | |
SNL > $500M OTC-BB and Pink Sheet Banks | | | 100.00 | | | 106.42 | | | 116.77 | | | 107.59 | | | 78.07 | | | 66.75 | |
Table of Contents
| | Period ending | |
Index | | 12/31/03 | | 12/31/04 | | 12/31/05 | | 12/31/06 | | 12/31/07 | | 12/31/08 | |
Fidelity D & D Bancorp, Inc. | | 100.00 | | 93.95 | | 117.87 | | 107.30 | | 93.99 | | 90.64 | |
NASDAQ Composite | | 100.00 | | 108.59 | | 110.08 | | 120.56 | | 132.39 | | 78.72 | |
SNL > $500M OTC-BB and Pink Sheet Banks | | 100.00 | | 116.97 | | 124.48 | | 136.58 | | 125.85 | | 91.32 | |
14
Set forth below are our selected consolidated financial and other data. This financial data is derived in part from, and should be read in conjunction with, the Company’s consolidated financial statements and related footnotes:
| | 2008 | | 2007 | | 2006 | | 2005 | | 2004 | |
Balance sheet data: | | | | | | | | | | | |
Total assets | | $ | 575,718,997 | | $ | 587,412,555 | | $ | 562,317,988 | | $ | 544,060,698 | | $ | 536,675,138 | |
Total investment securities | | 84,187,579 | | 122,984,160 | | 100,410,736 | | 97,678,573 | | 115,668,818 | |
Net loans | | 436,207,460 | | 421,424,379 | | 417,199,048 | | 403,144,095 | | 381,546,375 | |
Loans available-for-sale | | 84,000 | | 827,250 | | 122,000 | | 428,584 | | 576,378 | |
Total deposits | | 433,311,932 | | 425,708,361 | | 410,334,595 | | 379,498,640 | | 365,615,335 | |
Short-term borrowings | | 38,129,704 | | 39,656,354 | | 33,656,150 | | 28,772,997 | | 50,534,046 | |
Long-term debt | | 52,000,000 | | 62,708,677 | | 62,536,210 | | 83,704,188 | | 71,119,188 | |
Total shareholders’ equity | | 48,960,651 | | 55,191,294 | | 51,611,863 | | 48,846,029 | | 46,366,760 | |
| | | | | | | | | | | |
Operating data for the year ended: | | | | | | | | | | | |
Total interest income | | $ | 33,961,434 | | $ | 35,279,357 | | $ | 33,529,710 | | $ | 29,020,261 | | $ | 27,395,491 | |
Total interest expense | | 14,684,133 | | 17,660,075 | | 16,361,109 | | 11,720,986 | | 11,180,135 | |
Net interest income | | 19,277,301 | | 17,619,282 | | 17,168,601 | | 17,299,275 | | 16,215,356 | |
Provision (credit) for loan losses | | 940,000 | | (60,000 | ) | 325,000 | | 830,000 | | 2,150,000 | |
| | | | | | | | | | | |
Net interest income after provision (credit) for loan losses | | 18,337,301 | | 17,679,282 | | 16,843,601 | | 16,469,275 | | 14,065,356 | |
Other income | | 4,578,301 | | 5,205,215 | | 4,522,138 | | 4,150,502 | | 4,153,277 | |
Other operating expense | | 18,210,683 | | 16,636,760 | | 15,878,376 | | 14,561,968 | | 13,818,565 | |
| | | | | | | | | | | |
Income before provision for income taxes | | 4,704,919 | | 6,247,737 | | 5,487,363 | | 6,057,809 | | 4,400,068 | |
Provision for income taxes | | 1,068,971 | | 1,636,165 | | 1,362,080 | | 1,466,112 | | 1,035,594 | |
Net Income | | $ | 3,635,948 | | $ | 4,611,572 | | $ | 4,125,283 | | $ | 4,591,697 | | $ | 3,364,474 | |
| | | | | | | | | | | |
Per share data: | | | | | | | | | | | |
Net income per share, basic | | $ | 1.76 | | $ | 2.23 | | $ | 2.01 | | $ | 2.26 | | $ | 1.67 | |
Net income per share, diluted | | $ | 1.76 | | $ | 2.23 | | $ | 2.01 | | $ | 2.25 | | $ | 1.67 | |
Dividends declared | | $ | 2,068,680 | | $ | 1,921,533 | | $ | 1,801,361 | | $ | 1,624,263 | | $ | 1,610,423 | |
Dividends per share | | $ | 1.00 | | $ | 0.93 | | $ | 0.88 | | $ | 0.80 | | $ | 0.80 | |
Book value per share | | $ | 23.73 | | $ | 26.62 | | $ | 25.09 | | $ | 23.95 | | $ | 22.92 | |
Weighted-average number of shares outstanding * | | 2,068,851 | | 2,066,683 | | 2,047,975 | | 2,031,211 | | 2,013,798 | |
Number of shares outstanding at year-end * | | 2,062,927 | | 2,072,929 | | 2,057,433 | | 2,039,639 | | 2,023,529 | |
| | | | | | | | | | | |
Ratios: | | | | | | | | | | | |
Return on average assets | | 0.62 | % | 0.80 | % | 0.73 | % | 0.86 | % | 0.61 | % |
Return on average equity | | 6.81 | % | 8.65 | % | 8.31 | % | 9.64 | % | 7.51 | % |
Net interest margin | | 3.60 | % | 3.34 | % | 3.31 | % | 3.51 | % | 3.20 | % |
Efficiency ratio | | 72.98 | % | 71.61 | % | 71.67 | % | 65.99 | % | 64.45 | % |
Expense ratio | | 2.25 | % | 2.01 | % | 2.02 | % | 1.93 | % | 1.69 | % |
Allowance for loan losses to total loans | | 1.08 | % | 1.13 | % | 1.29 | % | 1.46 | % | 1.54 | % |
Dividend payout ratio | | 56.90 | % | 41.67 | % | 43.67 | % | 35.37 | % | 47.87 | % |
Equity to assets | | 8.50 | % | 9.40 | % | 9.18 | % | 8.98 | % | 8.64 | % |
Equity to deposits | | 11.30 | % | 12.96 | % | 12.58 | % | 12.87 | % | 12.68 | % |
* The number of shares and the weighted-average number of shares outstanding prior to 2006, have been adjusted to reflect the effect of a 10% stock dividend paid on February 15, 2006.
15
| | | 2009 | | | 2008 | | | 2007 | | | 2006 | | | 2005 | |
| Balance sheet data: | | | | | | | | | | | | | | | |
| Total assets | | $ | 556,017,271 | | | $ | 575,718,997 | | | $ | 587,412,555 | | | $ | 562,317,988 | | | $ | 544,060,698 | |
| Total investment securities | | | 76,529,998 | | | | 84,187,579 | | | | 122,984,160 | | | | 100,410,736 | | | | 97,678,573 | |
| Net loans | | | 423,124,054 | | | | 436,207,460 | | | | 421,424,379 | | | | 417,199,048 | | | | 403,144,095 | |
| Loans available-for-sale | | | 1,221,365 | | | | 84,000 | | | | 827,250 | | | | 122,000 | | | | 428,584 | |
| Total deposits | | | 458,994,458 | | | | 433,311,932 | | | | 425,708,361 | | | | 410,334,595 | | | | 379,498,640 | |
| Short-term borrowings | | | 16,533,107 | | | | 38,129,704 | | | | 39,656,354 | | | | 33,656,150 | | | | 28,772,997 | |
| Long-term debt | | | 32,000,000 | | | | 52,000,000 | | | | 62,708,677 | | | | 62,536,210 | | | | 83,704,188 | |
| Total shareholders' equity | | | 45,674,547 | | | | 48,960,651 | | | | 55,191,294 | | | | 51,611,863 | | | | 48,846,029 | |
| | | | | | | | | | | | | | | | | | | | | |
| Operating data for the year ended: | | | | | | | | | | | | | | | | | | | | |
| Total interest income | | $ | 29,909,273 | | | $ | 33,961,434 | | | $ | 35,279,357 | | | $ | 33,529,710 | | | $ | 29,020,261 | |
| Total interest expense | | | 10,796,854 | | | | 14,684,133 | | | | 17,660,075 | | | | 16,361,109 | | | | 11,720,986 | |
| Net interest income | | | 19,112,419 | | | | 19,277,301 | | | | 17,619,282 | | | | 17,168,601 | | | | 17,299,275 | |
| Provision (credit) for loan losses | | | 5,050,000 | | | | 940,000 | | | | (60,000 | ) | | | 325,000 | | | | 830,000 | |
| | | | | | | | | | | | | | | | | | | | | |
| Net interest income after provision (credit) for loan losses | | | 14,062,419 | | | | 18,337,301 | | | | 17,679,282 | | | | 16,843,601 | | | | 16,469,275 | |
| Other-than-temporary impairment | | | (3,300,094 | ) | | | (435,665 | ) | | | - | | | | - | | | | - | |
| Other income | | | 5,461,281 | | | | 5,013,966 | | | | 5,205,215 | | | | 4,522,138 | | | | 4,150,502 | |
| Other operating expense | | | 19,241,125 | | | | 18,210,683 | | | | 16,636,760 | | | | 15,878,376 | | | | 14,561,968 | |
| | | | | | | | | | | | | | | | | | | | | |
| (Loss) income before income taxes | | | (3,017,519 | ) | | | 4,704,919 | | | | 6,247,737 | | | | 5,487,363 | | | | 6,057,809 | |
| (Credit) provision for income taxes | | | (1,617,314 | ) | | | 1,068,971 | | | | 1,636,165 | | | | 1,362,080 | | | | 1,466,112 | |
| Net (loss) income | | $ | (1,400,205 | ) | | $ | 3,635,948 | | | $ | 4,611,572 | | | $ | 4,125,283 | | | $ | 4,591,697 | |
| | | | | | | | | | | | | | | | | | | | | |
| Per share data: | | | | | | | | | | | | | | | | | | | | |
| Net (loss) income per share, basic | | $ | (0.67 | ) | | $ | 1.76 | | | $ | 2.23 | | | $ | 2.01 | | | $ | 2.26 | |
| Net (loss) income per share, diluted | | $ | (0.67 | ) | | $ | 1.76 | | | $ | 2.23 | | | $ | 2.01 | | | $ | 2.25 | |
| Dividends declared | | $ | 2,078,171 | | | $ | 2,068,680 | | | $ | 1,921,533 | | | $ | 1,801,361 | | | $ | 1,624,263 | |
| Dividends per share | | $ | 1.00 | | | $ | 1.00 | | | $ | 0.93 | | | $ | 0.88 | | | $ | 0.80 | |
| Book value per share | | $ | 21.69 | | | $ | 23.73 | | | $ | 26.62 | | | $ | 25.09 | | | $ | 23.95 | |
| Weighted-average shares outstanding * | | | 2,080,507 | | | | 2,068,851 | | | | 2,066,683 | | | | 2,047,975 | | | | 2,031,211 | |
| Shares outstanding * | | | 2,105,860 | | | | 2,062,927 | | | | 2,072,929 | | | | 2,057,433 | | | | 2,039,639 | |
| | | | | | | | | | | | | | | | | | | | | |
| Ratios: | | | | | | | | | | | | | | | | | | | | |
| Return on average assets | | | -0.25 | % | | | 0.62 | % | | | 0.80 | % | | | 0.73 | % | | | 0.86 | % |
| Return on average equity | | | -2.91 | % | | | 6.81 | % | | | 8.65 | % | | | 8.31 | % | | | 9.64 | % |
| Net interest margin | | | 3.71 | % | | | 3.60 | % | | | 3.34 | % | | | 3.31 | % | | | 3.51 | % |
| Efficiency ratio | | | 72.51 | % | | | 72.98 | % | | | 71.61 | % | | | 71.67 | % | | | 65.99 | % |
| Expense ratio | | | 2.37 | % | | | 2.25 | % | | | 2.01 | % | | | 2.02 | % | | | 1.93 | % |
| Allowance for loan losses to loans | | | 1.75 | % | | | 1.08 | % | | | 1.13 | % | | | 1.29 | % | | | 1.46 | % |
| Dividend payout ratio | | | N/M | ** | | | 56.90 | % | | | 41.67 | % | | | 43.67 | % | | | 35.37 | % |
| Equity to assets | | | 8.21 | % | | | 8.50 | % | | | 9.40 | % | | | 9.18 | % | | | 8.98 | % |
| Equity to deposits | | | 9.95 | % | | | 11.30 | % | | | 12.96 | % | | | 12.58 | % | | | 12.87 | % |
| * | The number of shares and the weighted-average number of shares outstanding prior to 2006, have been adjusted to reflect the effect of a 10% stock dividend paid on February 15, 2006. |
| ** | The result of this calculation is not meaningful. |
Table of Contents
ITEM 7:MANAGEMENT’S DISCUSSION AND ANALYSIS OF FINANCIAL CONDITION ANDRESULTS OF OPERATIONS
Critical accounting policies
The presentation of financial statements in conformity with
U.S. GAAP requires management to make estimates and assumptions that affect many of the reported amounts and disclosures. Actual results could differ from these estimates.
A material estimate that is particularly susceptible to significant change relates to the determination of the allowance for loan losses. Management believes that the allowance for loan losses at December 31,
20082009 is adequate and reasonable. Given the subjective nature of identifying and valuing loan losses, it is likely that well-informed individuals could make different assumptions, and could, therefore calculate a materially different allowance value. While management uses available information to recognize losses on loans, changes in economic conditions may necessitate revisions in the future. In addition, various regulatory agencies, as an integral part of their examination process, periodically review the Company’s allowance for loan losses. Such agencies may require the Company to recognize adjustments to the allowance based on their judgment of information available to them at the time of their examination.
Another material estimate is the calculation of fair values of the Company’s investment securities. Except for the Company’s investment in corporate bonds, consisting of
pooled trust preferred
term securities,
marketfair values on the other investment securities are determined by prices provided by a third-party vendor, who is a provider of financial market data, analytics and related services to financial institutions. For the
pooled trust preferred
term securities, management was unable to obtain readily attainable and realistic pricing from market traders due to
a lack of active market participants and therefore management has determined
that the market for these securities
is currentlyto be inactive. In order to determine the
marketfair value of the
pooled trust preferred
term securities, management relied on the use of an income valuation approach (present value technique) that maximizes the use of relevant observable inputs and minimizes the use of unobservable inputs, the results of which are more representative of fair value than the market approach valuation technique used for the other investment securities.
Based on experience, management is aware that estimated fair values of investment securities tend to vary among valuation services. Accordingly, when selling investment securities,
managementprice quotes may
obtain price quotesbe obtained from more than one source. As described in Notes 1 and 3 of the consolidated financial statements, the
large majority of the Company’s investment securities are classified as available-for-sale (AFS). AFS securities are carried at fair value on the consolidated balance
sheet,sheets, with unrealized gains and losses, net of income tax, reported separately within shareholders’ equity through accumulated other comprehensive income (loss).
The fair value of residential mortgage loans, classified as AFS, is obtained from the Federal National Mortgage Association (FNMA) or the Federal Home Loan Bank (FHLB). Generally, the market to which the Company sells mortgages it originates for sale is restricted and price quotes from other sources are not typically obtained. On occasion, the Company may transfer loans from the loan and lease portfolio to loans AFS. Under these rare circumstances, pricing may be obtained from other entities and the loans are transferred at the lower of cost or market value and simultaneously sold. For a further discussion on the accounting treatment of AFS loans, see the section entitled “Loans available-for-sale,” contained within management’s discussion and analysis. As of December 31,
20082009 and
2007,2008, loans classified as AFS consisted of residential mortgages.
All significant accounting policies are contained in Note 1, “Nature of
operationsOperations and
summarySummary of
significant accounting policies,”Significant Accounting Policies”, within the notes to consolidated financial statements and incorporated by reference in Part II, Item 8.
The following discussion and analysis presents the significant changes in the financial condition and in the results of operations of the Company as of December 31,
20082009 and December 31,
20072008 and for each of the years then ended. This discussion should be read in conjunction with the consolidated financial statements and notes
thereto included in Part II, Item 8 of this report.
Comparison of Financial Condition as of December 31,
20082009
and
20072008 and Results of Operations for each of the Years then Ended
The national economy
continued to falter with particular emphasis onby some estimates may be improving, but the
deteriorationstate of the housing,
and real estate
markets.markets and capital markets continue to feel the downward pressure of the recession-stricken financial environment that began its downward spiral over a year ago. Capital constraints and asset quality concerns will restrict asset growth. The
current economysluggish recovery has
been marked by contractions insuppressed the availability of commercial and consumer credit,
falling home16
Tablecontinued to contain residential real estate at relatively low values, propelled the rate of Contents
prices, increasing home foreclosures and rising unemployment.sustained a level of unemployment not seen for decades. In response,an effort to stimulate the economy, among other things, the Federal Open Market Committee (FOMC), reduced has not adjusted the short-term federal funds rate which had remained near zero percent during 2009. While lower rates seven times during 2008certainly do help funding costs, their effect can be unfavorable to unprecedented levels, approaching zerofloating-rate asset yields and has resulted in a much morere-financed fixed-rate assets thereby pressuring margins. The shape of the interest rate yield curve continued to be positively sloped yield curve duringthroughout 2009 but the current year.interest rate environment was considerably lower in 2009 compared to 2008. The shape of the yield curve willmay present opportunities, howeveropportunities. However the local economy is not insulated from the disruptions, volatility and volatilityslow recovery that continues to plaguehas negatively impacted the national economy thereby requiringand that situation will continue to require the Company, like all banks, to operate in a very difficult, interest rate environment, the likes of which have been unseen for many decades.financially unstable economic landscape. The management team and steering committees of the Company is poisedare prepared to address the issues at hand and will implement strategies to navigate through these uncertain times.
Consolidated assets decreased
$11,694,000,$19,702,000, or
2%3%, during the year ended December 31,
20082009 to
$575,719,000.$556,017,000. The decline was the result of
decreases indecreased total borrowings of
$12,235,000,$41,597,000, or
12%46%, and a decrease in total shareholders’ equity of
$6,231,000$3,286,000, or 7%, partially offset by a
2%6%, or
$7,604,000$25,682,000 increase in deposits. The decline in
shareholders’borrowings resulted from a combination of deposit growth and balance sheet de-leveraging. Shareholders' equity
was primarily from increased unrealizeddeclined due to the net
losses inloss recorded for the
securities AFS portfolio,year ended December 31, 2009 and the declaration of cash dividends
andplus the
repurchasereduction in intrinsic value from expiration of the
Company’s capital stock (treasury stock). During 2008, the carrying amount of the investment portfolios declined by $38,797,000, or 32%, while the loan portfolios increased $14,040,000, or 3% to $436,291,000 as of December 31, 2008. Other increases included premises and equipment, the net deferred tax asset, bank owned life insurance, FHLB stock, the carrying value of the derivative contract and prepaid expenses. Cash increased $2,362,000 since 2007.cash flow hedge.
The following table is a comparison of condensed balance sheet accounts and percentage to total assets at December 31,
2009, 2008
and 2007
and 2006 (thousands of dollars)(dollars in thousands):
| | 2008 | | 2007 | | 2006 | |
| | Amount | | Percent | | Amount | | Percent | | Amount | | Percent | |
| | | | | | | | | | | | | | | | |
Assets: | | | | | | | | | | | | | | | | |
Cash and cash equivalents | | $ | 12,771 | | 2.2 | % | | $ | 10,409 | | 1.8 | % | | $ | 13,801 | | 2.4 | % | |
Investment securities | | 84,188 | | 14.6 | | | 122,984 | | 20.9 | | | 100,411 | | 17.9 | | |
Federal Home Loan Bank Stock | | 4,781 | | 0.8 | | | 3,303 | | 0.6 | | | 3,795 | | 0.7 | | |
Loans and leases, net | | 436,291 | | 75.8 | | | 422,252 | | 71.9 | | | 417,321 | | 74.2 | | |
Bank premises and equipment | | 16,056 | | 2.8 | | | 12,965 | | 2.2 | | | 11,324 | | 2.0 | | |
Life insurance cash surrender value | | 8,808 | | 1.5 | | | 8,489 | | 1.4 | | | 8,178 | | 1.5 | | |
Other assets | | 12,824 | | 2.3 | | | 7,011 | | 1.2 | | | 7,488 | | 1.3 | | |
Total assets | | $ | 575,719 | | 100.0 | % | | $ | 587,413 | | 100.0 | % | | $ | 562,318 | | 100.0 | % | |
| | | | | | | | | | | | | | | |
Liabilities: | | | | | | | | | | | | | | | |
Total deposits | | $ | 433,312 | | 75.3 | % | | $ | 425,708 | | 72.5 | % | | $ | 410,335 | | 73.0 | % | |
Short-term borrowings | | 38,130 | | 6.6 | | | 39,656 | | 6.7 | | | 33,656 | | 6.0 | | |
Long-term debt | | 52,000 | | 9.0 | | | 62,709 | | 10.7 | | | 62,536 | | 11.1 | | |
Other liabilities | | 3,316 | | 0.6 | | | 4,149 | | 0.7 | | | 4,179 | | 0.7 | | |
Total liabilities | | 526,758 | | 91.5 | | | 532,222 | | 90.6 | | | 510,706 | | 90.8 | | |
Shareholders’ equity | | 48,961 | | 8.5 | | | 55,191 | | 9.4 | | | 51,612 | | 9.2 | | |
Total liabilities and shareholders’ equity | | $ | 575,719 | | 100.0 | % | | $ | 587,413 | | 100.0 | % | | $ | 562,318 | | 100.0 | % | |
| | | 2009 | | | 2008 | | | 2007 | |
| | | Amount | | | Percent | | | Amount | | | Percent | | | Amount | | | Percent | |
| | | | | | | | | | | | | | | | | | | |
| Assets: | | | | | | | | | | | | | | | | | | |
| Cash and cash equivalents | | $ | 8,328 | | | | 1.5 | % | | $ | 12,771 | | | | 2.2 | % | | $ | 10,409 | | | | 1.8 | % |
| Investment securities | | | 76,530 | | | | 13.8 | | | | 84,188 | | | | 14.6 | | | | 122,984 | | | | 20.9 | |
| Federal Home Loan Bank Stock | | | 4,781 | | | | 0.9 | | | | 4,781 | | | | 0.8 | | | | 3,303 | | | | 0.6 | |
| Loans and leases, net | | | 424,345 | | | | 76.3 | | | | 436,291 | | | | 75.8 | | | | 422,252 | | | | 71.9 | |
| Bank premises and equipment | | | 15,362 | | | | 2.8 | | | | 16,056 | | | | 2.8 | | | | 12,965 | | | | 2.2 | |
| Life insurance cash surrender value | | | 9,117 | | | | 1.6 | | | | 8,808 | | | | 1.5 | | | | 8,489 | | | | 1.4 | |
| Other assets | | | 17,554 | | | | 3.1 | | | | 12,824 | | | | 2.3 | | | | 7,011 | | | | 1.2 | |
| Total assets | | $ | 556,017 | | | | 100.0 | % | | $ | 575,719 | | | | 100.0 | % | | $ | 587,413 | | | | 100.0 | % |
| | | | | | | | | | | | | | | | | | | | | | | | | |
| Liabilities: | | | | | | | | | | | | | | | | | | | | | | | | |
| Total deposits | | $ | 458,994 | | | | 82.6 | % | | $ | 433,312 | | | | 75.3 | % | | $ | 425,708 | | | | 72.5 | % |
| Short-term borrowings | | | 16,533 | | | | 3.0 | | | | 38,130 | | | | 6.6 | | | | 39,656 | | | | 6.7 | |
| Long-term debt | | | 32,000 | | | | 5.8 | | | | 52,000 | | | | 9.0 | | | | 62,709 | | | | 10.7 | |
| Other liabilities | | | 2,815 | | | | 0.4 | | | | 3,316 | | | | 0.6 | | | | 4,149 | | | | 0.7 | |
| Total liabilities | | | 510,342 | | | | 91.8 | | | | 526,758 | | | | 91.5 | | | | 532,222 | | | | 90.6 | |
| Shareholders' equity | | | 45,675 | | | | 8.2 | | | | 48,961 | | | | 8.5 | | | | 55,191 | | | | 9.4 | |
| Total liabilities and shareholders' equity | | $ | 556,017 | | | | 100.0 | % | | $ | 575,719 | | | | 100.0 | % | | $ | 587,413 | | | | 100.0 | % |
A comparison of net changes in selected balance sheet categories as of December 31, are as follows:
| | | | | | Earning | | | | | | | | Short-term | | | | Other | | | |
| | Assets | | % | | assets * | | % | | Deposits | | % | | borrowings | | % | | borrowings | | % | |
2008 | | $ | (11,693,558 | ) | (2) | | $ | (22,808,541 | ) | (4) | | $ | 7,603,571 | | 2 | | $ | (1,526,650 | ) | (4) | | $ | (10,708,677 | ) | (17) | |
2007 | | 25,094,567 | | 4 | | 26,073,807 | | 5 | | 15,373,766 | | 4 | | 6,000,204 | | 18 | | 172,467 | | — | |
2006 | | 18,257,290 | | 3 | | 21,202,050 | | 4 | | 30,835,955 | | 8 | | 4,883,153 | | 17 | | (21,167,978 | ) | (25) | |
2005 | | 7,385,560 | | 1 | | 2,784,580 | | 1 | | 13,883,305 | | 4 | | (21,761,049 | ) | (43) | | 12,585,000 | | 18 | |
2004 | | (38,540,328 | ) | (7) | | (35,884,098 | ) | (7) | | (35,827,211 | ) | (9) | | (4,222,932 | ) | (8) | | (756,846 | ) | (1) | |
| | | | | | | | | | | | | | | | | | | | | | | | | | |
| | | | | | | | | Earning | | | | | | | | | | | | Short-term | | | | | | Other | | | | |
| | | Assets | | | % | | | assets* | | | % | | | Deposits | | | % | | | borrowings | | | % | | | borrowings | | | % | |
| 2009 | | $ | (19,701,726 | ) | | | (3 | ) | | $ | (26,475,299 | ) | | | (5 | ) | | $ | 25,682,526 | | | | 6 | | | $ | (21,596,597 | ) | | | (57 | ) | | $ | (20,000,000 | ) | | | (38 | ) |
| 2008 | | | (11,693,558 | ) | | | (2 | ) | | | (22,808,541 | ) | | | (4 | ) | | | 7,603,571 | | | | 2 | | | | (1,526,650 | ) | | | (4 | ) | | | (10,708,677 | ) | | | (17 | ) |
| 2007 | | | 25,094,567 | | | | 4 | | | | 26,073,807 | | | | 5 | | | | 15,373,766 | | | | 4 | | | | 6,000,204 | | | | 18 | | | | 172,467 | | | | - | |
| 2006 | | | 18,257,290 | | | | 3 | | | | 21,202,050 | | | | 4 | | | | 30,835,955 | | | | 8 | | | | 4,883,153 | | | | 17 | | | | (21,167,978 | ) | | | (25 | ) |
| 2005 | | | 7,385,560 | | | | 1 | | | | 2,784,580 | | | | 1 | | | | 13,883,305 | | | | 4 | | | | (21,761,049 | ) | | | (43 | ) | | | 12,585,000 | | | | 18 | |
* Earning assets excludeexclude: loans and securities placed on non-accrual status.
17
The Bank is a community-based commercial financial institution, member FDIC, which offers a variety of deposit accountsproducts with varying ranges of interest rates and terms. Deposit products include savings, accounts,clubs, interest-bearing checking (NOW), money market, non-interest bearing checking (DDAs) and certificates of deposit accounts. Certificates of deposit accounts, or CDs, are deposits with stated maturities rangingwhich can range from seven days to ten years. The flow of deposits is significantly influenced by general economic conditions, changes in prevailing interest rates, pricing and competition. MostTo determine deposit product interest rates, the Company considers local competition, spreads to earning-asset yields, liquidity position and rates charged for alternative sources of funding such as borrowings which include repurchase agreements. Though the Company tends to experience intense competition for deposits, more so during this prolonged low interest-rate environment, the interest rate setting strategy also includes consideration of the Company’s balance sheet structure and cost effective strategies that are mindful of the current economic landscape.
The following table represents the components of total deposits as of December 31, 2009 and 2008 (dollars in thousands):
| | | 2009 | | | 2008 | |
| | | Amount | | | Percent | | | Amount | | | Percent | |
| | | | | | | | | | | | | |
| Money market | | $ | 91,488 | | | | 19.9 | % | | $ | 96,738 | | | | 22.3 | % |
| NOW | | | 62,031 | | | | 13.5 | | | | 50,124 | | | | 11.6 | |
| Savings and clubs | | | 86,335 | | | | 18.8 | | | | 41,326 | | | | 9.5 | |
| Certificates of deposit | | | 139,502 | | | | 30.5 | | | | 173,681 | | | | 40.1 | |
| CDARS | | | 8,748 | | | | 1.9 | | | | - | | | | - | |
| Total interest-bearing | | | 388,104 | | | | 84.6 | | | | 361,869 | | | | 83.5 | |
| Non-interest bearing | | | 70,890 | | | | 15.4 | | | | 71,443 | | | | 16.5 | |
| Total deposits | | $ | 458,994 | | | | 100.0 | % | | $ | 433,312 | | | | 100.0 | % |
During the first quarter of 2009, the Company began to use the Certificate of Deposit Account Registry Service (CDARS) reciprocal program to obtain FDIC insurance protection for customers who have large deposits that at times exceed the FDIC maximum amount of $250,000. In the CDARS program, deposits with varying terms and interest rates, originated in the Company’s own markets, are exchanged for deposits of other financial institutions that are members in the CDARS network. By placing these deposits in other participating institutions, the deposits of our customers are fully insured by the FDIC. In return for deposits placed with network institutions, the Company receives from network institutions deposits that are approximately equal in amount and contain similar terms as those placed for our customers. Deposits the Company receives, or reciprocal deposits, from other institutions are considered brokered deposits by regulatory definitions. As of December 31, 2009, CDARS represented $8,748,000, or 2%, of total deposits.
Total deposits increased $25,682,000, or 6%, during 2009 to $458,994,000. The increase stems from growth in savings and clubs of $45,009,000 and NOW accounts of $11,907,000, partially offset by declines in CDs including CDARS of $25,431,000, net and money market accounts of $5,250,000. Generally, deposits are obtained from consumers and businesses within the communities surrounding its 12that surround the Company’s 11 branch offices and all deposits are insured by the FDIC up to the full extent permitted by law. The Bank attemptsIn an effort to attractgrow and retain deposit customers via sales and marketing efforts, new products, quality service, competitive rates and maintaining long-standing customer relationships. To determine deposit product interest rates,core deposits, the Company considers local competition,introduced innovative options to its variety of deposit products. Most notably, in 2009 the Company created special savings account offerings tailored to the needs of both business and non-business customers. This creativity resulted in savings account balances that more than doubled by the end of 2009 compared to December 31, 2008. The Company’s niche is developing, promoting and bringing creative deposit-related ideas to the market yields and the rates charged for alternative sources of funding such as short- and long-term borrowings. Though we tend to experience intense competition for deposits, our interest rate setting strategy includes consideration of the Company’s liquidity needs, balance sheet structure and cost effective strategiesduring times that are mindfulbest suited for the customer and for the Company. This in conjunction with superior customer service contributed to the overall net increase in deposits.
Including CDARS, the maturity distribution of
the current interest rate environment.The following table represents the components of total deposits as of December 31, 2008 and 2007 (thousands of dollars):
| | 2008 | | 2007 | |
| | Amount | | Percent | | Amount | | Percent | |
| | | | | | | | | | |
Money market | | $ | 96,738 | | 22.3 | % | | $ | 87,892 | | 20.6 | % | |
NOW | | 50,124 | | 11.6 | | | 54,695 | | 12.9 | | |
Savings and clubs | | 41,326 | | 9.5 | | | 40,125 | | 9.4 | | |
Certificates of deposit | | 173,681 | | 40.1 | | | 178,200 | | 41.9 | | |
Total interest-bearing | | 361,869 | | 83.5 | | | 360,912 | | 84.8 | | |
Non-interest-bearing | | 71,443 | | 16.5 | | | 64,796 | | 15.2 | | |
Total deposits | | $ | 433,312 | | 100.0 | % | | $ | 425,708 | | 100.0 | % | |
Total deposits increased $7,604,000, or 2%, during 2008 to $433,312,000. The growth in deposits was mostly from increases in money markets $8,846,000 and DDAs of $6,647,000, or 10% each, partially offset by declines in NOW and certificates of deposit accounts of $4,571,000 and $4,519,000, respectively. The majority of the increase in DDAs was from a temporary deposit from a corporate trust account which has since been withdrawn. The new West Scranton branch office that opened during the third quarter of 2008 and the related bank-wide promotions, superior customer service, increased deposit business from our existing and new commercial customers all contributed to the net increase in deposits. The continued increases in money market accounts that the Company has experienced is from success in our deposit-gathering strategies in conjunction with promotional interest rates tailored to depositors’ needs. We attribute the decline in certificate of deposit accounts to the lower and highly volatile interest rate environment that exists today compared to a year ago.
The maturity distribution of certificate of deposit accounts at December 31, 20082009 is as follows:
| | Three months | | Three to six | | Six to twelve | | Over | | | |
| | or less | | Months | | months | | twelve months | | Total | |
CDs of $100,000 or more | | $ | 20,438,339 | | $ | 10,989,353 | | $ | 29,534,467 | | $ | 13,288,607 | | $ | 74,250,766 | |
CDs of less than $100,000 | | 13,641,073 | | 14,907,570 | | 49,896,837 | | 20,984,669 | | 99,430,149 | |
Total CDs | | $ | 34,079,412 | | $ | 25,896,923 | | $ | 79,431,304 | | $ | 34,273,276 | | $ | 173,680,915 | |
Approximately 80%follows (dollars in thousands):
| | | Three months | | | Three to six | | | Six to twelve | | | Over twelve | | | | |
| | | or less | | | months | | | months | | | months | | | Total | |
| CDs of $100,000 or more | | $ | 19,883 | | | $ | 5,197 | | | $ | 7,992 | | | $ | 21,867 | | | $ | 54,939 | |
| CDs of less than $100,000 | | | 17,817 | | | | 8,157 | | | | 17,980 | | | | 40,609 | | | | 84,563 | |
| CDARS | | | - | | | | 740 | | | | 4,088 | | | | 3,920 | | | | 8,748 | |
| Total CDs | | $ | 37,700 | | | $ | 14,094 | | | $ | 30,060 | | | $ | 66,396 | | | $ | 148,250 | |
Including CDARS, approximately 55% of the CDs are scheduled to mature within one year. Renewing CDs may re-price to lower or higher market rates depending on the direction of interest rate movements, the shape of the yield curve, competition, the rate profile of the maturing accounts and depositor preference for alternative products. To help reduce the
financialnegative impact of the unpredictable
and highly volatile interest rate environment, management
intends to continue to deploydeployed strategies that
will diversifydiversified the deposit mix across the entire
spectrumcontinuum of
products offered. As always, consideration will be afforded to customer retentionnew and
new customer relationships.existing deposit products.
In addition to deposits, other funding sources available to the Company are overnight funds purchased from the Federal Home Loan Bank of Pittsburgh (FHLB), fed funds purchased from correspondent banks and repurchase agreements with
18
Table of Contents
individuals, businesses and public entities. The Company uses overnight funding for asset growth, deposit run-off and short-term liquidity needs.
Repurchase
agreements are offered in both sweep and fixed-term products. These agreements are non-insured interest-bearing liabilities that have a
perfected security interest in qualified
pledged investments of the
Bank.Company. The FDIC Depositor Protection Act of 2009 requires banks to provide a perfected security interest to the purchasers of uninsured repurchase agreements. Repurchase agreements are offered through a sweep product. A sweep account is designed to ensure that on a daily basis, an attached DDA is adequately funded and excess
DDA funds are transferred, or swept, into an interest-bearing overnight repurchase agreement account.
In addition, the sweep is designed to transfer funds to the DDA as necessary to cover checks presented for payment. Due to the
natureconstant flow of funds in to and out of the sweep product,
theytheir balances tend to be
moresomewhat volatile,
thanmimicking the
fixed-term product because the daily sweep is dependent on the levellikes of
available funds in depositor accounts.a DDA deposit account. Customer liquidity
and investment needs and changes in interest rates areis the typical
causescause for variances in repurchase agreements, which during
20082009 declined
$11,412,000$3,665,000 from
$20,504,000$11,412,000 at December 31,
2007. At2008 to $7,747,000 as of December 31,
2008 and 2007, sweep accounts represented 93% and 62%, respectively, of total repurchase agreements. The low interest rate environment has caused our customers to seek higher rates in alternative products and as such the balances in the term-repurchase agreement declined by about 91%.2009.
Overnight borrowings and repurchase agreements are included with short-term borrowings on the consolidated balance sheets. For a further discussion on short-term borrowings, see Note 7,
“Short-term borrowings,”“Short-Term Borrowings”, contained in the notes to consolidated financial statements in Part II, Item 8.
Long-term debt consists of borrowings from the FHLB. The weighted-average rate in effect on funds borrowed at December 31,
20082009 was
5.35%5.11% compared to
5.26%5.35% as of December 31,
2007.2008. The
20082009 weighted-average rate was
9261 basis points below the tax-equivalent yield of
6.27% on5.72% earned from the Company’s portfolio of average interest-earning assets for the year ended December 31,
2008.2009. Rates on
$42,000,000the $32,000,000 balances of
the total long-term advances are currently fixed but are
designedstructured to adjust quarterly should market
interest rates increase beyond the issues’ original or strike rates. Significant prepayment penalties are attached to the borrowings thereby creating a
significant disincentive from paying off the
relatively highhigher cost advances. However, in the event underlying market rates drift above the rates currently paid on these borrowings, the
FHLB rate willfixed-rate would convert to a floating rate
advance and
at that time, the Company
haswould have the option
at that time, to repay or to renegotiate the converted advance rate. During
December 2008,the third quarter of 2009, $10,000,000 of convertible select advances with a
$10,000,000 capped floating-rate long-term advance was paid off early. During February 2009, a $10,000,000, 5.32% fixed-rate advance was also paid off early. Whether or not the advance will be renewed will be predicated on theweighted-average interest rate
environment, demandof 6.12%, scheduled to mature in 2010, were paid off. At the time of pay-off, the Company incurred $505,000 of prepayment interest costs that are included as a component of interest expense in the consolidated statement of income for
the year ended December 31, 2009. This deleveraging allowed the Company access to higher available liquidity and
relative cash-flowsto strengthen regulatory capital ratios. Due to the relatively high-costing nature of
deposits, demand for loan funding and prepaymentsthese advances, the strategy was immediately accretive to future earnings. As of
interest-earning assets.At December 31, 2008,2009, the Company had the ability to borrow an additional $117,348,000$138,346,000 from the FHLB, from their array of numerous funding products that are available at a varying terms and conditions.
FHLB.
The Company’s investment policy is designed to complement its lending activities, generate a favorable return without incurring undue interest rate and credit risk, manage interest rate sensitivity, provide monthly cash flow and manage liquidity at acceptable levels. In establishing investment strategies, the Company considers its business, growth or restructuring plans, the economic environment, the interest rate sensitivity position, the types of securities held, permissible purchases, credit quality, maturity and re-pricing terms, call or average-life intervals and investment concentrations. The policy prescribes permissible investment categories that meet the policy standards and management is responsible for structuring and executing the specific investment purchases within these policy parameters. Management buys and sells investment securities from time-to-time depending on market conditions, business trends, liquidity needs, capital levels and structuring strategies. Investment security purchases provide a way to quickly invest excess liquidity in order to generate additional earnings. The Company generally earns a positive interest spread by assuming interest rate risk and using deposits and/or borrowings to purchase securities with longer maturities.
At the time of purchase, management classifies investment securities into one of three categories: trading,
AFSavailable-for-sale (AFS) or held-to-maturity (HTM). To date, management has not purchased any securities for trading purposes. Most of the securities purchased are classified as AFS even though there is no immediate intent to sell them. The AFS designation affords management the flexibility to sell securities and position the balance sheet in response to capital levels, liquidity needs or changes in market conditions. Securities AFS are carried at
their net fair values in the consolidated balance
sheetsheets with an adjustment to shareholders’ equity, net of tax, presented under the caption “Accumulated other comprehensive income (loss).”
SecuritiesAs of December 31, 2009, AFS debt securities were recorded with an unrealized net loss of $14,038,000 while equity securities were recorded with an unrealized net gain of $107,000. Investment securities designated as HTM represent debt securities that the Company has the ability and intent to hold until maturity and are carried at amortized cost. As of December 31,
20082009 and December 31,
2007,2008, the aggregate fair value of
19
Table of Contents
securities HTM exceeded their respective aggregate amortized cost by $56,000 and $31,000, and $33,000, respectively.
Total investments decreased $38,797,000, including an $11,893,000 decline in the market value
As of AFS investments. During 2008,December 31, 2009, the Company sold approximately $48.4 million of mortgage-backed and agency securities, the proceeds of which were used to pay-down long-term debt, fund loan growth and fund the expansion of the Company’s branch network. The carrying value of investment securities at December 31, 2008, was $84,188,000,totaled $76,530,000, or 14% of total assets, compared to $84,187,000, or 15% of total assets compared to $122,984,000, or 21%at December 31, 2008. At December 31, 2009, approximately 19% of the carrying value of the investment portfolio was comprised of U.S. Government Sponsored Enterprise residential mortgage-backed securities (MBS – GSE residential) that amortize and provide monthly cash flow. Agency Government Sponsored Enterprise (Agency – GSE) securities, municipal general obligations and corporate bonds comprised 43%, 30% and 7%, respectively, of the investment portfolio at December 31, 2009.
A comparison of total investment securities as of December 31
2007.The market values for corporate investment securities are very depressed relative to historical levels. For example, the yield spreads for the broad market of investment grade and high yield corporate bonds reached all time wide levels compared to treasury securities at the end of 2008 and remain near those levels today. Thus in today’s market, a low market price for a particular bond may only provide evidence of stress in the credit markets in general versus being an indicator of credit problems with a particular issuer.
As of December 31, 2008 the debt securities with unrealized losses have depreciated 27.4% compared to 2.4% at December 31, 2007. Management believes that the cause of the unrealized losses is related to changes in interest rates, instability in the capital markets or the limited trading activity due to recent debt market illiquid conditions and is not directly related to credit quality, which is consistent with its past experience. Nearly all of the securities in the portfolio have fixed rates or have predetermined scheduled rate changes, and many have call features that allow the issuer to call the security at par before its stated maturity without penalty.
Management performs a review of the investment portfolio quarterly to determine the cause of declines in the fair value of each security. The Company uses inputs provided by an independent third party to determine the fair values of its investment securities portfolio. Inputs provided by the third party are reviewed and corroborated by management. Evaluations of the causes of the unrealized losses are performed to determine whether impairment, if any, is temporary or other-than-temporary. Considerations such as the Company’s intent and ability to hold the securities to maturity, recoverability of the invested amounts over the intended holding period, severity in pricing decline, the interest rate environment, receipts of amounts contractually due and whether or not there is an active market for the security, for example, are applied in determining whether a security is other-than-temporarily impaired. If a decline in value is deemed to be other-than-temporary, the amortized cost of the security is reduced by the impairment amount and a corresponding charge to earnings is recognized. If at the time of sale, call or maturity the proceeds exceed the security’s amortized cost, the impairment charge may be fully or partially recovered and recorded as a gain on sale of investment securities.
At December 31, 2008, the securities with the most significant reductions in fair value and associated estimated unrealized losses were in the Company’s corporate bond portfolio consisting of collateralized debt obligation (CDO) securities that are backed by pooled trust preferred term securities (preferred term securities) issued by banks, thrifts and insurance companies.
The Company owns 13 issues of preferred term securities. The market for these securities at December 31, 2008 was not active and markets for similar securities are also not active. The inactivity was evidenced first by a significant widening of the bid-ask spread in the brokered markets in which preferred term securities trade and then by a significant decrease in the volume of trades relative to historical levels. The new issue market is also inactive as no new preferred term securities have been issued since 2007. There are currently very few market participants who are willing and or able to transact for these securities. Given conditions in the debt markets today and the absence of observable transactions in the secondary and new issue markets, fair value of the preferred term securities was determined as explained in Note 3, “Securities Investments,” contained within the notes to the consolidated financial statements in Part II, Item 8.
Based on the technique described in Note 3, the Company determined that as of December 31, 2008, the fair value of one of its preferred term securities had declined $430,000 below its cost basis and has been deemed to be other-than-temporarily impaired. Accordingly, this amount has been recorded as an impairment charge and is included as a component of other income in the consolidated income statements for the year ended December 31, 2008. The market value of the Company’s investment in preferred term securities has declined by $9,958,000 since December 31, 2007. The Company intends to closely monitor the preferred term securities market and perform collateral sufficiency and cash flow analyses on at least a quarterly basis. Future analyses could yield results that may indicate further impairment has occurred and therefore require additional write-downs and corresponding other-than-temporary charges to current earnings. In addition to the impairment charge on the preferred term securities portfolio, the Company had an equity position in FNMA common stock whose fair value declined below its cost basis by $6,000 and has also been deemed to be other-than-temporarily impaired and written down as of December 31, 2008. There were no other-than-temporary impairment write-downs recorded in 2007 or 2006.
20
follows:
Table of Contents
A comparison of investments at December 31, for the three previous years is as follows:
| | 2008 | | 2007 | | 2006 | |
| | Amount | | Percent | | Amount | | Percent | | Amount | | Percent | |
U.S. government agencies | | $ | 43,507,359 | | 51.7 | % | | $ | 35,243,890 | | 28.7 | % | | $ | 33,891,985 | | 33.8 | % | |
Mortgage-backed securities | | 12,438,721 | | 14.8 | | | 58,767,109 | | 47.8 | | | 42,900,005 | | 42.7 | | |
State & municipal subdivisions | | 17,552,729 | | 20.8 | | | 12,133,443 | | 9.8 | | | 12,576,684 | | 12.5 | | |
Preferred term securities | | 10,260,196 | | 12.2 | | | 16,335,486 | | 13.3 | | | 10,570,993 | | 10.5 | | |
Equity securities | | 428,574 | | 0.5 | | | 504,232 | | 0.4 | | | 471,069 | | 0.5 | | |
Total | | $ | 84,187,579 | | 100.0 | % | | $ | 122,984,160 | | 100.0 | % | | $ | 100,410,736 | | 100.0 | % | |
| | | 2009 | | | 2008 | |
| | | Amount | | | Percent | | | Amount | | | Percent | |
| | | | | | | | | | | | | |
| Agency - GSE | | $ | 33,132,301 | | | | 43.3 | % | | $ | 43,507,359 | | | | 51.7 | % |
| MBS - GSE residential | | | 14,456,037 | | | | 18.9 | | | | 12,438,721 | | | | 14.8 | |
| State & municipal subdivisions | | | 23,270,289 | | | | 30.4 | | | | 17,552,729 | | | | 20.8 | |
| Pooled trust preferred securities | | | 5,241,844 | | | | 6.8 | | | | 10,260,196 | | | | 12.2 | |
| Equity securities - financial services | | | 429,527 | | | | 0.6 | | | | 428,574 | | | | 0.5 | |
| Total | | $ | 76,529,998 | | | | 100.0 | % | | $ | 84,187,579 | | | | 100.0 | % |
The distribution of debt securities by stated maturity date at December 31,
20082009 is as follows:
| | One year | | One through | | Five through | | More than | | | |
| | or less | | five years | | ten years | | ten years | | Total | |
U.S. government agencies | | $ | — | | $ | — | | $ | 7,917,994 | | $ | 35,589,365 | | $ | 43,507,359 | |
Mortgage-backed securities | | — | | — | | 381,537 | | 12,057,184 | | 12,438,721 | |
State & municipal subdivisions | | — | | — | | 2,788,460 | | 14,764,269 | | 17,552,729 | |
Preferred term securities | | — | | — | | — | | 10,260,196 | | 10,260,196 | |
Total debt securities | | $ | — | | $ | — | | $ | 11,087,991 | | $ | 72,671,014 | | $ | 83,759,005 | |
AFS securities are stated net of unrealized gains and losses. As of December 31, 2008, AFS debt securities were recorded with a net unrealized loss in the amount of $13,486,000. At December 31, 2008, AFS equity securities were recorded at $428,000 which included a net unrealized gain of $106,000.
| | | One year | | | One through | | | Five through | | | More than | | | | |
| | | or less | | | five years | | | ten years | | | ten years | | | Total | |
| Agency - GSE | | $ | - | | | $ | - | | | $ | 6,939,700 | | | $ | 26,192,601 | | | $ | 33,132,301 | |
| MBS - GSE residential | | | - | | | | 46,579 | | | | 487,049 | | | | 13,922,409 | | | | 14,456,037 | |
| State & municipal subdivisions | | | - | | | | - | | | | 592,410 | | | | 22,677,879 | | | | 23,270,289 | |
| Pooled trust preferred securities | | | - | | | | - | | | | - | | | | 5,241,844 | | | | 5,241,844 | |
| Total debt securities | | $ | - | | | $ | 46,579 | | | $ | 8,019,159 | | | $ | 68,034,733 | | | $ | 76,100,471 | |
The tax-equivalent yield on debt securities by stated maturity date at December 31,
2008,2009 is as follows:
| | One year | | One through | | Five through | | More than | | | |
| | or less | | five years | | ten years | | ten years | | Total | |
U.S. government agencies | | —% | | —% | | 5.07 | % | | 5.87 | % | | 5.74 | % | |
Mortgage-backed securities | | — | | — | | 6.01 | | | 5.44 | | | 5.45 | | |
State & municipal subdivisions | | — | | — | | 5.47 | | | 5.90 | | | 5.83 | | |
Preferred term securities | | — | | — | | — | | | 4.00 | | | 4.00 | | |
Total debt securities | | —% | | —% | | 5.21 | % | | 5.35 | % | | 5.34 | % | |
| | | One year | | | One through | | | Five through | | | More than | | | | |
| | | or less | | | five years | | | ten years | | | ten years | | | Total | |
| | | | | | | | | | | | | | | | |
| Agency - GSE | | | - | % | | | - | % | | | 3.32 | % | | | 5.02 | % | | | 4.67 | % |
| MBS - GSE residential | | | - | | | | 6.00 | | | | 6.04 | | | | 4.76 | | | | 4.81 | |
| State & municipal subdivisions | | | - | | | | - | | | | 5.60 | | | | 6.22 | | | | 6.21 | |
| Pooled trust preferred securities | | | - | | | | - | | | | - | | | | 1.69 | | | | 1.69 | |
| Total debt securities | | | - | % | | | 6.00 | % | | | 3.65 | % | | | 4.54 | % | | | 4.46 | % |
In the above table, the book yields on state & municipal subdivisions were adjusted to a tax-equivalent basis using the corporate federal tax rate of 34%. In addition, average yields on securities AFS are based on amortized cost and do not reflect unrealized gains or losses.
Uncertainty continues to prevail in the financial markets which has increased the volatility in fair value estimates for the securities in the Company’s investment portfolio. Other than pooled trust preferred securities, fair values of the Company’s investment securities have improved since year-end 2008. Management believes fair value changes are due mainly to the interest rate environment, instability in the capital markets, limited trading activity and illiquid conditions in the financial markets, not deterioration in the creditworthiness of the issuers. Nearly all of the securities in the portfolio have fixed rates or have predetermined scheduled rate changes, and many have call features that allow the issuer to call the security at par before its stated maturity without penalty. As of December 31, 2009, the debt securities with unrealized losses have depreciated 25.9% compared to 27.4% at December 31, 2008. The most significant component of the $14.0 million net unrealized loss in the AFS debt securities portfolio was $13.6 million from the Company’s investments in corporate bonds consisting of collateralized debt obligation (CDO) securities that are backed by pooled trust preferred securities issued by banks, thrifts and insurance companies.
Quarterly, management performs a review of the investment portfolio to determine the cause of declines in the fair value of each security. The Company uses inputs provided by independent third parties to determine the fair value of its investment securities portfolio. Inputs provided by the third party are reviewed and corroborated by management. Evaluations of the causes of the unrealized losses are performed to determine whether impairment is temporary or other-than-temporary. Considerations such as the Company’s intent and ability to hold the securities to maturity, recoverability of the invested amounts over the intended holding period, the length of time and the severity in pricing decline below cost, the interest rate environment, receipts of amounts contractually due and whether or not there is an active market for the security, for example, are applied, along with the financial condition of the issuer for management to make a realistic judgment of the probability that the Company will be unable to collect all amounts (principal and interest) due in determining whether a security is other-than-temporarily impaired. If a decline in value is deemed to be other-than-temporary, the amortized cost of the security is reduced by the credit impairment amount and a corresponding charge to earnings is recognized. If at the time of sale, call or maturity the proceeds exceed the security’s amortized cost, the impairment charge may be fully or partially recovered.
The Company owns 13 tranches of pooled trust preferred securities (PreTSLs). The market for these securities and other issues of PreTSLs at December 31, 2009 was not active. The inactivity was evidenced first by a significant widening of the bid-ask spread in the brokered markets in which PreTSLs trade, then by a significant decrease in the volume of trades relative to historical levels and the lack of a new-issue market since 2007. There are currently very few market participants who are willing and/or able to transact for these securities. Given the conditions in the debt markets today and the absence of observable transactions in the secondary and new issue markets, management has made the following observations and has determined:
| · | The few observable transactions and market quotations that were available were not reliable for purposes of determining fair value at December 31, 2009, |
| · | An income valuation approach (present value technique) that maximizes the use of relevant observable inputs and minimizes the use of unobservable inputs are equally or more representative of fair value than the market approach valuation technique, and |
| · | The PreTSLs securities are classified within “Level 3” (as defined in current accounting guidance and explained in Note 12, “Fair Value of Financial Instruments and Derivatives” of the consolidated financial statements) of the fair value hierarchy because significant adjustments are required to determine fair value at the measurement date. The valuations of the Company’s PreTSLs were prepared by an independent third party and corroborated by management. The approach to determine fair value involved the following: |
| o | Data about the issue structure as defined in the indenture and the underlying collateral were collected, |
| o | The credit quality of the collateral is estimated using issuer-specific probability of default values, |
| o | The default probabilities also considered the potential for 50% correlation among issuers within the same industry (e.g. banks with other banks) and 30% correlation between industries (e.g. banks vs. insurance), |
| o | The loss given default, or amount of cash lost to the investor when a debt asset defaults, was assumed to be 100% (no recovery) based upon Moody’s research. This replicates the historically high default loss levels on trust preferred instruments, |
| o | The cash flows were forecast for the underlying collateral and applied to each tranche to determine the resulting distribution among the securities. This ascertains which investors are paid and which investors incur losses. Thus, these cash flow projections capture the credit risk, |
| o | The expected cash flows utilize no prepayments and were discounted utilizing three-month LIBOR as the risk-free rate for the base case and then added a 300bp liquidity premium as the discount rate to calculate the present value of the security, |
| o | The effective discount rates on an overall basis range from 9.84% to 341.92% and are highly dependent upon the credit quality of the collateral, the relative position of the tranche within the capital structure of the security and the prepayment assumptions, and |
| o | The calculations were modeled in several thousand scenarios using a Monte Carlo engine to establish a distribution of intrinsic values and the average was used for valuation purposes. |
Based on the technique described, the Company determined that as of December 31, 2009, the fair value of five PreTSL securities: VII, IX, XV, XVI and XXV had declined $8,014,000 in total below their amortized cost basis and since the present value of the security’s expected cash flows were insufficient to recover the entire amortized cost basis, the securities are deemed to have experienced credit related other-than-temporary impairment in the amount of $3,300,000 which was charged to current earnings as a component of other income in the consolidated statement of income for the year ended December 31, 2009. This compares to $436,000 of impairment charges recorded for the year ended December 31, 2008. There were no other-than-temporary impairment charges recorded in 2007. The Company closely monitors the pooled trust preferred securities market and performs collateral sufficiency and cash flow analyses on a quarterly basis. Future analyses could yield results that may indicate further impairment has occurred and would therefore require additional write-downs and corresponding other-than-temporary charges to current earnings.
Federal Home Loan Bank Stock
Investment in FHLB stock is required for membership in the organization and is carried at cost since there is no market value available. The amount the Company is required to invest is dependent upon the relative size of outstanding borrowings the Company has with the FHLB. Excess stock is typically repurchased from the Company at par if the level of borrowings declines to a predetermined level. In addition, the Company normally earns a return or dividend on the amount invested. In
lateorder to preserve its capital level, in December
2008 the FHLB announced that it
hashad suspended
the payment of dividends and
the repurchase of excess capital stock
to preserve its capital level.repurchasing. That decision was based on
the FHLB’s analysis and consideration of certain negative market trends and the impact those trends will have on their financial condition. Based on the financial results of the FHLB for the year-ended December 31,
2009 and 2008, management believes that the suspension of both the dividend payments and excess capital stock repurchase is temporary in nature.
Management further believes that the FHLB will continue to be a primary source of wholesale liquidity for both short- and long-term funding and has concluded that its investment in FHLB stock is not other-than-temporarily impaired. There can be no assurance, however, that future negative changes to the financial condition of the FHLB may not require the Company to recognize an impairment charge with respect to such holdings. The Company will continue to monitor the financial condition of the FHLB and assess its
future ability to resume
these activities in the future.21
normal dividend payments and stock redemption activities.
The Company originates commercial and industrial (commercial) and commercial real estate (CRE) loans, residential mortgages, consumer, home equity and construction loans. The relative volume of originations is dependent upon customer demand, current interest rates and the perception and duration of future interest levels. As part of the overall strategy to serve the business community in which it operates, the Company is focused on developing and implementing products and services to the broad spectrum of businesses that operate in our marketplace. The Company’s goals center on building relationships by providing credit and non-credit products and services, continuing to diversify its loan portfolio and utilizing participations to reduce risk in larger credit transactions. Especially in today’s economy, the Company, in providing credit to existing and new customers, has implemented policies and procedures to reduce the associated risk. The risks associated with interest rates are being managed by utilizing floating versus long-term fixed rates and exploring programs where we can match our cost of funds.
Gross loans and leases
increased $14,704,000,decreased $10,255,000, or
3%2%, from
$426,249,000 at December 31, 2007, to $440,953,000 at December 31,
2008.2008, to $430,698,000 at December 31, 2009. Gross loans represented 77%
and 73% of total assets at December 31,
20082009 and December 31,
2007,2008, respectively.
In
2008,2009, the Company originated
$47,864,000$32,686,000 of commercial
and CRE loans,
$23,111,000$13,809,000 of residential mortgage loans and
$21,354,000$20,602,000 of consumer loans. This compares to
$32,919,000, $24,032,000$47,864,000, $23,111,000 and
$28,062,000,$21,354,000, respectively, in
2007.2008. Included in mortgage loans is
$9,476,000$8,307,000 of real estate construction lines in
20082009 and
$12,515,000$9,476,000 in
2007.2008. In addition for
2008,2009, the Company originated lines of credit in the amounts of
$50,664,000$35,296,000 for commercial borrowers and
$11,866,000$13,260,000 in home equity and other consumer lines of credit.
The Company’s origination,
for portfolio, activity
increased 9%declined 27% in
2008 over 2007 despite operating in a very difficult economy. Only the residential real estate portfolio recorded a decline2009 compared to
20072008. Because of the low interest rate environment, borrowers’ sentiment was to procure and
was more than offset by growth in commercial lending. The hiring of a new senior lender has enabledrefinance to low, fixed-rate mortgage loans; an activity that dominated housing lending throughout 2009. To manage interest rate risk, the Company
to grow itssells these loans into the secondary market rather than for portfolio retention. The decline in the commercial and CRE
portfolio. During 2009,originations was due to weak economic conditions and the related strict underwriting practices that the Company
will continueemploys to
channel efforts to develop total banking relationships with new customers and strengthen relationships with our existing base of loyal customers.help ensure against possible future losses.
Commercial and Commercial Real Estate Loans:Originations in commercial and commercial real estate (CRE) were relatively strong, as they fully exceeded scheduled principal curtailments and pre-payments thereby resulting in a commercial loan increase of $29,422,000 to $245,480,000 from $216,058,000, or 14% during 2008. During most of 2008,loans
: For 2009 the Company
bolsteredfurther implemented the
origination activities inconcept of reinforcing and building relationships. Commercial lenders have become relationship managers and have the
knowledge to deal with loans, deposits and referrals to other areas of the bank such as trust and asset management. The commercial
and CRE loan
business. Commercialportfolio increased to $263,514,000 from $245,480,000, or 7%, during 2009. Deposits associated with lending,
successfully restructured its team ofwhether they are retail or commercial,
loan officers led byhave benefited from the
experienced newly hired senior lender. This team has effectively penetrated our markets and successfully developed new businessemphasis on relationships and
re-kindled relationships with our existing commercial customer base.not just loans.
Residential Real Estate Loansreal estate loans: Residential real estate loans declined
$18,468,000,$27,509,000, or
16%28%, to
$98,511,000$71,001,000 in
2008. In2009. During the
beginningfirst quarter of
2008,2009, the Company transferred
approximately $28,103,000$10,838,000 of residential mortgage loans to the
loans AFS
portfolio. The loansportfolio, which were
subsequentlysimultaneously sold. From time-to-time, management will evaluate the composition of the residential loan portfolio and based upon liquidity needs, interest rate risk and other considerations may transfer loans to the
available-for-saleAFS portfolio, at the lower of cost or market
value, and simultaneously sell them. Excluding this transfer,value. The balance of the residential real estate
loan portfolio would have grown $6,900,000mortgage decline is mostly from net pay-downs during 2009 as
origination activity exceeded maturitiesborrowers’ desire, during this low-rate environment, is to re-finance their existing mortgage and
pay-downs.home equity debt into new lower rate mortgage loans. Operating in a lower interest rate environment throughout
most of 2008 with expectations of a continued period of low rates2009 that continues into
2009,2010, the Company expects
higher levels ofcontinued prepayment and refinance activity
in 2009.from its mortgage banking services, albeit on a much smaller scale.
Consumer Loansloans:Though
Despite reduced origination, compared to December 31, 2008, the consumer loan
originations were lowerportfolio remained relatively unchanged as of December 31, 2009. The Company’s success in
2008 compared to 2007, this sector increased $3,093,000, or 4%, during the
year. The increase was mainly from lower principal pay-downsdevelopment and
increased draw activity from customers accessing theirimplementation of promotional campaigns for prime-based home equity
available credit. Whilelines of credit, which customers find to be attractive in low interest
rates remain low, the Company expects the home equity businessrate environments, resulted in more lines, more line usage and lower installment balances. This in addition to
continue to increase into 2009. During 2008, the Company established a new relationship with
a localan automobile dealership
which should provide increased origination activity induring the latter part of 2008 helped stabilize the size of the consumer
lending in the years ahead.loan portfolio.
Real Estate Construction Loansestate construction loans: Real estate construction loans
increased $724,000,decreased $1,302,000, or
7%11%, at December 31,
20082009 compared to December 31,
2007.2008. These loans fund residential and commercial construction projects and then convert to a residential mortgage or to a commercial real estate loan usually within one year from the origination date. Generally, the converted loans will bear similar terms as the terms during the construction period.
The increase in 2008 was caused by more commercial construction projects that had not yet converted to permanent financing.
Direct Financing Leasesfinancing leases: The balance represents tax-free leasing arrangements provided to municipal customers.
For 2008,The Company has not originated new direct finance leasing and for the past several years, the activity
representsrepresented scheduled run-off.
22
Table of Contents
A comparison of domestic loans at December 31, for the five previous periods is as follows:
| | 2008 | | 2007 | | 2006 | | 2005 | | 2004 | |
Commercial and CRE | | $ | 245,479,992 | | $ | 216,057,882 | | $ | 218,213,216 | | $ | 216,288,597 | | $ | 221,968,137 | |
Residential real estate | | 98,510,562 | | 116,978,378 | | 112,742,692 | | 103,920,613 | | 91,294,401 | |
Consumer | | 85,091,205 | | 81,998,093 | | 77,729,520 | | 74,070,328 | | 61,487,608 | |
Real estate construction | | 11,426,978 | | 10,703,249 | | 13,369,712 | | 14,198,858 | | 10,620,472 | |
Direct financing leases | | 443,957 | | 511,178 | | 588,211 | | 650,348 | | 2,211,978 | |
Gross loans | | 440,952,694 | | 426,248,780 | | 422,643,351 | | 409,128,744 | | 387,582,596 | |
Less: | | | | | | | | | | | |
Unearned discount | | — | | — | | — | | — | | 48,423 | |
Allowance for loan losses | | 4,745,234 | | 4,824,401 | | 5,444,303 | | 5,984,649 | | 5,987,798 | |
Net loans | | $ | 436,207,460 | | $ | 421,424,379 | | $ | 417,199,048 | | $ | 403,144,095 | | $ | 381,546,375 | |
| | | | | | | | | | | |
Loans available-for-sale | | $ | 84,000 | | $ | 827,250 | | $ | 122,000 | | $ | 428,584 | | $ | 576,378 | |
| | | 2009 | | | 2008 | | | 2007 | | | 2006 | | | 2005 | |
| | | | | | | | | | | | | | | | |
| Real estate: | | | | | | | | | | | | | | | |
| Commercial | | $ | 186,726,196 | | | $ | 164,772,236 | | | $ | 143,596,397 | | | $ | 158,446,052 | | | $ | 158,566,841 | |
| Residential | | | 71,001,298 | | | | 98,510,562 | | | | 116,978,378 | | | | 112,742,692 | | | | 103,920,613 | |
| Construction | | | 10,125,354 | | | | 11,426,978 | | | | 10,703,249 | | | | 13,369,712 | | | | 14,198,858 | |
| Commercial and industrial | | | 76,787,809 | | | | 80,707,756 | | | | 72,461,485 | | | | 59,767,164 | | | | 57,721,756 | |
| Consumer | | | 85,689,831 | | | | 85,091,205 | | | | 81,998,093 | | | | 77,729,520 | | | | 74,070,328 | |
| Direct financing leases | | | 367,169 | | | | 443,957 | | | | 511,178 | | | | 588,211 | | | | 650,348 | |
| Gross loans | | | 430,697,657 | | | | 440,952,694 | | | | 426,248,780 | | | | 422,643,351 | | | | 409,128,744 | |
| Less: | | | | | | | | | | | | | | | | | | | | |
| Allowance for loan losses | | | 7,573,603 | | | | 4,745,234 | | | | 4,824,401 | | | | 5,444,303 | | | | 5,984,649 | |
| Net loans | | $ | 423,124,054 | | | $ | 436,207,460 | | | $ | 421,424,379 | | | $ | 417,199,048 | | | $ | 403,144,095 | |
| | | | | | | | | | | | | | | | | | | | | |
| Loans available-for-sale | | $ | 1,221,365 | | | $ | 84,000 | | | $ | 827,250 | | | $ | 122,000 | | | $ | 428,584 | |
A comparison of gross loans by percent at year-end for the five previous periods is as follows:
| | 2008 | | 2007 | | 2006 | | 2005 | | 2004 | |
Commercial and CRE | | 55.7 | % | | 50.7 | % | | 51.6 | % | | 52.9 | % | | 57.3 | % | |
Residential real estate | | 22.3 | | | 27.5 | | | 26.7 | | | 25.4 | | | 23.5 | | |
Consumer | | 19.3 | | | 19.2 | | | 18.4 | | | 18.1 | | | 15.9 | | |
Real estate construction | | 2.6 | | | 2.5 | | | 3.2 | | | 3.5 | | | 2.7 | | |
Direct financing leases | | 0.1 | | | 0.1 | | | 0.1 | | | 0.1 | | | 0.6 | | |
Gross loans | | 100.0 | % | | 100.0 | % | | 100.0 | % | | 100.0 | % | | 100.0 | % | |
| | | 2009 | | | 2008 | | | 2007 | | | 2006 | | | 2005 | |
| | | | | | | | | | | | | | | | |
| Real estate: | | | | | | | | | | | | | | | |
| Commercial | | | 43.3 | % | | | 37.4 | % | | | 33.7 | % | | | 37.5 | % | | | 38.8 | % |
| Residential | | | 16.5 | | | | 22.3 | | | | 27.5 | | | | 26.7 | | | | 25.4 | |
| Construction | | | 2.4 | | | | 2.6 | | | | 2.5 | | | | 3.2 | | | | 3.5 | |
| Commercial and industrial | | | 17.8 | | | | 18.3 | | | | 17.0 | | | | 14.1 | | | | 14.1 | |
| Consumer | | | 19.9 | | | | 19.3 | | | | 19.2 | | | | 18.4 | | | | 18.1 | |
| Direct financing leases | | | 0.1 | | | | 0.1 | | | | 0.1 | | | | 0.1 | | | | 0.1 | |
| Gross loans | | | 100.0 | % | | | 100.0 | % | | | 100.0 | % | | | 100.0 | % | | | 100.0 | % |
The following table sets forth the maturity distribution of select components of the loan portfolio at December 31,
2008.2009. Excluded from the table are residential real estate loans, consumer loans and direct financing leases (dollars in thousands):
| | One-year | | One to five | | More than | | | |
| | or less | | Years | | five years | | Total | |
| | | | | | | | | |
Commercial and CRE | | $ | 20,276 | | $ | 57,026 | | $ | 168,178 | | $ | 245,480 | |
Real estate construction | | 11,427 | | — | | — | | 11,427 | |
Total | | $ | 31,703 | | $ | 57,026 | | $ | 168,178 | | $ | 256,907 | |
| | | One year | | | One to five | | | More than | | | | |
| | | or less | | | years | | | five years | | | Total | |
| Commercial and CRE | | $ | 27,130 | | | $ | 50,854 | | | $ | 185,530 | | | $ | 263,514 | |
| Real estate construction | | | 10,125 | | | | - | | | | - | | | | 10,125 | |
| Total | | $ | 37,255 | | | $ | 50,854 | | | $ | 185,530 | | | $ | 273,639 | |
Real estate construction loans are included in the one-year or less category since, by their nature, these loans are converted into residential and CRE loans within one year from the date the real estate construction loan was consummated. Upon conversion, the residential and CRE loans would normally mature after five years.
The following table sets forth the
greater than one year sensitivity changes in interest rates for
performing commercial and CRE loans at December 31,
20082009 (dollars in thousands):
| | One to five | | More than | | | |
| | Years | | five years | | Total | |
Fixed interest rate | | $ | 38,807 | | $ | 46,121 | | $ | 84,928 | |
Variable interest rate | | 64,070 | | 56,801 | | 120,871 | |
Total | | $ | 102,877 | | $ | 102,922 | | $ | 205,799 | |
| | | One to five | | | More than | | | | |
| | | years | | | five years | | | Total | |
| | | | | | | | | | |
| Fixed interest rate | | $ | 33,564 | | | $ | 37,822 | | | $ | 71,386 | |
| Variable interest rate | | | 81,718 | | | | 53,186 | | | | 134,904 | |
| Total | | $ | 115,282 | | | $ | 91,008 | | | $ | 206,290 | |
Non-refundable fees or costs associated with all loan originations are deferred. Using the principal reduction method, the deferral is released as charges or credits to loan interest income over the life of the loan.
There are no concentrations of loans to a number of borrowers engaged in similar activities exceeding 10% of total loans that are not otherwise disclosed as a category in the tables above. There are no concentrations of loans that, if resulted in a loss, would have a material adverse effect on the business of the Company. The Company’s loan portfolio does not have a material concentration within a single industry or group of related industries that is vulnerable to the risk of a near-term severe negative business impact.
23
Upon origination, certain residential mortgages are classified as AFS. In the event market rates increase, fixed-rate loans and adjustable-rate loans not immediately scheduled to re-price would no longer produce yields consistent with the current market. In a declining interest rate environment, the Company would be exposed to prepayment risk and, as rates on adjustable-rate loans decrease, interest income would be negatively affected. Consideration is given to the Company’s current liquidity position and projected future liquidity needs. To better manage interest rate and prepayment risk, loans meeting these conditions may be classified as AFS. The carrying value of loans AFS is at the lower of cost or estimated fair value. If the fair values of loans AFS fall below their original cost, the difference is written down and charged to current earnings. Any subsequent appreciation in the portfolio is credited to current earnings but only to the extent of previous write-downs.
Loans AFS
atas of December 31,
20082009 were
$84,000$1,221,000 with a corresponding fair value of
$85,000$1,233,000 compared to
$827,000$84,000 and
$843,000,$85,000, respectively, at December 31,
2007.2008. During
2008,2009, the Company originated $87,896,000 of residential mortgages
AFS, compared to $14,754,000 in 2008. The higher volume in 2009 was a function of the low interest rate environment which spawned refinance activity of existing home debt. During 2009, residential mortgage loans with principal balances of
$46,969,000$98,213,000 were sold into the secondary market and recognized net gains of approximately
$261,000.$1,060,000, compared to $46,969,000 and $261,000, respectively during 2008. Included in the
2009 sale was
$28,103,000$10,838,000 of residential
mortgage loans transferred from the loan and lease
portfolio.portfolio during the first quarter of 2009 compared to $28,103,000 in the early part of 2008. The Company does not expect residential mortgage loan origination activity to continue at the 2009 pace.
The Company retains mortgage servicing rights (MSRs) on loans sold into the secondary market. MSRs are retained so that the Company can continue the personal relationships
they haveit has established with
theirits customers. At December 31,
20082009 and
2007,2008, the servicing portfolio balance of sold residential mortgage loans was
$157,516,000 and $95,856,000,
and $61,023,000, respectively.
Allowance for loan losses
Management continually evaluates the credit quality of the Company’s loan portfolio and performs a formal review of the adequacy of the allowance for loan losses (the allowance) on a quarterly basis. The allowance reflects management’s best estimate of the amount of credit losses in the loan portfolio. Management’s judgment is based on the evaluation of individual loans, past experience, the assessment of current economic conditions and other relevant factors including the amounts and timing of cash flows expected to be received on impaired loans. Those estimates may be susceptible to significant change. The provision for loan losses represents the amount necessary to maintain an appropriate allowance. Loan losses are charged directly against the allowance when loans are deemed to be uncollectible. Recoveries from previously charged-off loans are added to the allowance when received.
Management applies two primary components during the loan review process to determine proper allowance levels. The two components are a specific loan loss allocation for loans that are deemed impaired and a general loan loss allocation for those loans not specifically allocated. The methodology to analyze the adequacy of the allowance for loan losses is as follows:
· identification of specific impaired loans by loan category;
· calculation of specific allowances where required for the impaired loans based on collateral and other objective and quantifiable evidence;
· determination of homogenous pools by loan category and eliminating the impaired loans;
· application of historical loss percentages (five-year average) to pools to determine the allowance allocation; and
· application of qualitative factor adjustment percentages to historical losses for trends or changes in the loan portfolio.
| § | identification of specific impaired loans by loan category; |
| § | specific loans that could have potential loss; |
| § | calculation of specific allowances where required for the impaired loans based on collateral and other objective and quantifiable evidence; |
| § | determination of homogenous pools by loan category and eliminating the impaired loans; |
| § | application of historical loss percentages (three-year average) to pools to determine the allowance allocation; and |
| § | application of qualitative factor adjustment percentages to historical losses for trends or changes in the loan portfolio. Qualitative factor adjustments include: |
| o | levels of and trends in delinquencies and non-accrual loans; |
| o | levels of and trends in charge-offs and recoveries; |
| o | trends in volume and terms of loans; |
| o | changes in risk selection and underwriting standards; |
| o | changes in lending policies, procedures and practices; |
| o | experience, ability and depth of lending management; |
| o | national and local economic trends and conditions; and |
| o | changes in credit concentrations. |
Allocation of the allowance for different categories of loans is based on the methodology as explained above. A key element of the methodology to determine the allowance is the Company’s credit risk evaluation process, which includes credit risk grading of individual commercial loans. Commercial loans are assigned credit risk grades based on the Company’s assessment of conditions that affect the borrower’s ability to meet its contractual obligations under the loan agreement. That process includes reviewing borrowers’ current financial information, historical payment experience, credit documentation, public information and other information specific to each individual borrower.
Upon review, the commercial loan credit risk grade is revised or reaffirmed as the case may be. The credit risk grades may be changed at any time management feels an upgrade or downgrade may be warranted. The credit risk grades for the commercial loan portfolio are taken into account in the reserve methodology and loss factors are applied based upon the credit risk grades. The loss factors applied are based upon the Company’s historical experience as well as what we believe to be best practices and common industry standards. Historical experience reveals there is a direct correlation between the credit risk grades and loan charge-offs. The changes in allocations in the commercial loan portfolio from period to period are based upon the credit risk grading system and from periodic reviews of the loan and lease portfolios.
Each quarter, management performs an assessment of the allowance and the provision for loan losses. The Company’s Special Assets Committee meets quarterly and the applicable lenders discuss each relationship under review and reach a consensus on the appropriate estimated loss amount based on
Statement of Financial Accounting Standards No. 114, “Accounting by Creditors for Impairment of a Loan,” (SFAS 114).current accounting guidelines. The Special Assets Committee’s focus is on ensuring the pertinent facts are considered and the
SFAS 114 reserve amounts
pursuant to the accounting principles are reasonable. The assessment process includes the review
24
Table of Contents
of all loans on a non-accruing basis as well as a review of certain loans to which the lenders or the Company’s Credit Administration function have assigned a criticized or classified risk rating.
Total charge-offs net of recoveries for the
year endedtwelve months ending December 31,
2008,2009, were
$1,019,000,$2,221,000, compared to
$560,000 in 2007. The majority of the increase occurred$1,019,000 in the
commercial portfolio and was attributabletwelve months of 2008. The higher level of charge-offs recorded in the year primarily resulted from the write-down of impaired loans to
non-performingcurrent fair value. Commercial real estate loan
dispositions and write-downs before transfers to ORE.Combined consumer loan and lease financing net charge-offs increased from $237,000 atof $842,000 were recorded during the twelve months ending December 31, 2007 to $320,000 through2009 versus $547,000 at December 31, 2008. Commercial and industrial loan net charge-offs were $358,000$948,000 for the year 2007 compared to $654,000 for 2008. Mortgage loans showed net Charge-offs of $45,000 in 2008twelve months ending December 31, 2009 compared to net recoveriescharge-offs of $35,000$107,000 in 2007.the same period of 2008. Residential real estate loan net charge-offs totaled $9,000 for the twelve months ending December 31, 2009 compared to $45,000 in the like period of 2008. Consumer loan net charge-offs of $422,000 were recorded during the twelve months ending December 31, 2009 versus $320,000 at December 31, 2008. For a discussion on the provision for loan losses, see the “Provision for loan losses,” located in the results of operations section of management’s discussion and analysis contained herein.
For a further discussion of delinquencies and net charge-offs, see the section entitled “Non-performing assets.” Additional discussion is in Note 1, “Nature of operations and summary of significant accounting policies — Allowance
The allowance for loan losses
” and Note 4, “Loans and leases,” contained was $7,574,000 at December 31, 2009, an increase of $2,829,000 from December 31, 2008. The increase in the
notesallowance was primarily driven by a migration of commercial loan credit risk ratings from pass to
consolidated financial statements, incorporated herein by reference.classified status, higher loan charge-offs, and a generally weaker economic outlook.
Management believes that the current balance in the allowance for loan losses of
$4,745,000$7,574,000 is sufficient to withstand the identified potential credit quality issues that may arise and others unidentified but
are inherent to the portfolio.
At December 31, 2008, management was unaware of any potential problem loans that have not been reviewed. Potential problem loans are those where there is known information that leads management to believe repayment of principal and/or interest is in jeopardy and the loans are currently neither on non-accrual status
ornor past due 90 days or more.
However,Given continuing pressure on property values and the generally uncertain economic backdrop, there could be
certainadditional instances which become identified
over the upcoming yearin future periods that may require additional charge-offs and/or increases to the allowance.
TheAt December 31, 2009 the ratio of
the allowance for
loanloans losses
was increased to
total1.75% of loans
wascompared to 1.08% at December 31,
2008 compared to 1.13%2008. The 30-89 day past due loans at December 31,
2007.25
2009 were $5,173,000 compared to $1,858,000 at December 31, 2008. The increase in the 30-89 day past due loans can be attributed to a general decline in economic conditions, along with rising unemployment and diminishing real estate values, each having an impact on borrowers’ ability to make their payments in a timely fashion.
Table of Contents
The following table sets forth the activity in the allowance for loan losses and certain key ratios for the periods indicated (dollars in thousands):
| | 2008 | | 2007 | | 2006 | | 2005 | | 2004 | |
| | | | | | | | | | | |
Balance at beginning of period | | $ | 4,824 | | $ | 5,444 | | $ | 5,985 | | $ | 5,988 | | $ | 4,997 | |
| | | | | | | | | | | |
Charge-offs: | | | | | | | | | | | |
Commercial and all other | | 733 | | 376 | | 661 | | 1,077 | | 775 | |
Real estate | | 45 | | 90 | | 109 | | 21 | | 266 | |
Consumer | | 351 | | 256 | | 285 | | 288 | | 480 | |
Lease financing | | — | | — | | — | | 8 | | 85 | |
Total | | 1,129 | | 722 | | 1,055 | | 1,394 | | 1,606 | |
| | | | | | | | | | | |
Recoveries: | | | | | | | | | | | |
Commercial and all other | | 79 | | 18 | | 64 | | 395 | | 226 | |
Real estate | | — | | 125 | | 1 | | 11 | | 20 | |
Consumer | | 31 | | 19 | | 124 | | 155 | | 178 | |
Lease financing | | — | | — | | — | | — | | 23 | |
Total | | 110 | | 162 | | 189 | | 561 | | 447 | |
Net charge-offs | | 1,019 | | 560 | | 866 | | 833 | | 1,159 | |
Provision (credit) for loan losses | | 940 | | (60 | ) | 325 | | 830 | | 2,150 | |
Balance at end of period | | $ | 4,745 | | $ | 4,824 | | $ | 5,444 | | $ | 5,985 | | $ | 5,988 | |
| | | | | | | | | | | |
Net charge-offs to average net loans outstanding | | 0.24 | % | 0.13 | % | 0.21 | % | 0.22 | % | 0.30 | % |
Allowance for loan losses to net charge-offs | | 4.66 | x | 8.62 | x | 6.29 | x | 7.18 | x | 5.17 | x |
Allowance for loan losses to total loans | | 1.08 | % | 1.13 | % | 1.29 | % | 1.46 | % | 1.54 | % |
Loans 30 - 89 days past due and accruing | | $ | 1,858 | | $ | 4,698 | | $ | 2,571 | | $ | 1,609 | | $ | 4,317 | |
Loans 90 days or more past due and accruing | | $ | 604 | | $ | 26 | | $ | 81 | | $ | 197 | | $ | 557 | |
Non-accruing loans | | $ | 3,493 | | $ | 3,811 | | $ | 3,358 | | $ | 9,453 | | $ | 9,904 | |
Allowance for loan losses to loans 90 days or more past due and accruing | | 7.85 | x | 189.41 | x | 67.54 | x | 30.39 | x | 10.75 | x |
Allowance for loan losses to non-accruing loans | | 1.36 | x | 1.27 | x | 1.62 | x | 0.63 | x | 0.60 | x |
Allowance for loan losses to non-performing loans | | 1.16 | x | 1.26 | x | 1.58 | x | 0.62 | x | 0.57 | x |
Average net loans | | $ | 416,438 | | $ | 419,586 | | $ | 412,523 | | $ | 385,800 | | $ | 381,366 | |
| | | 2009 | | | 2008 | | | 2007 | | | 2006 | | | 2005 | |
| | | | | | | | | | | | | | | | |
| Balance at beginning of period | | $ | 4,745 | | | $ | 4,824 | | | $ | 5,444 | | | $ | 5,985 | | | $ | 5,988 | |
| | | | | | | | | | | | | | | | | | | | | |
| Charge-offs: | | | | | | | | | | | | | | | | | | | | |
| Real estate: | | | | | | | | | | | | | | | | | | | | |
| Commercial | | | 844 | | | | 565 | | | | - | | | | 31 | | | | 463 | |
| Residential | | | 9 | | | | 45 | | | | 90 | | | | 109 | | | | 21 | |
| Commercial and industrial | | | 983 | | | | 168 | | | | 376 | | | | 630 | | | | 614 | |
| Consumer | | | 433 | | | | 351 | | | | 256 | | | | 285 | | | | 288 | |
| Lease financing | | | - | | | | - | | | | - | | | | - | | | | 8 | |
| Total | | | 2,269 | | | | 1,129 | | | | 722 | | | | 1,055 | | | | 1,394 | |
| | | | | | | | | | | | | | | | | | | | | |
| Recoveries: | | | | | | | | | | | | | | | | | | | | |
| Real estate: | | | | | | | | | | | | | | | | | | | | |
| Commercial | | | 2 | | | | 18 | | | | 2 | | | | 27 | | | | 275 | |
| Residential | | | - | | | | - | | | | 125 | | | | 1 | | | | 11 | |
| Commercial and industrial | | | 35 | | | | 61 | | | | 16 | | | | 37 | | | | 120 | |
| Consumer | | | 11 | | | | 31 | | | | 19 | | | | 124 | | | | 155 | |
| Total | | | 48 | | | | 110 | | | | 162 | | | | 189 | | | | 561 | |
| Net charge-offs | | | 2,221 | | | | 1,019 | | | | 560 | | | | 866 | | | | 833 | |
| Provision (credit) for loan losses | | | 5,050 | | | | 940 | | | | (60 | ) | | | 325 | | | | 830 | |
| Balance at end of period | | $ | 7,574 | | | $ | 4,745 | | | $ | 4,824 | | | $ | 5,444 | | | $ | 5,985 | |
| | | | | | | | | | | | | | | | | | | | | |
| Net charge-offs to average net loans outstanding | | | 0.51 | % | | | 0.24 | % | | | 0.13 | % | | | 0.21 | % | | | 0.22 | % |
| Allowance for loan losses to net charge-offs | | | 3.41 | x | | | 4.66 | x | | | 8.62 | x | | | 6.29 | x | | | 7.18 | x |
| Allowance for loan losses to total loans | | | 1.75 | % | | | 1.08 | % | | | 1.13 | % | | | 1.29 | % | | | 1.46 | % |
| Loans 30 - 89 days past due and accruing | | $ | 5,173 | | | $ | 1,858 | | | $ | 4,698 | | | $ | 2,571 | | | $ | 1,609 | |
| Loans 90 days or more past due and accruing | | $ | 555 | | | $ | 604 | | | $ | 26 | | | $ | 81 | | | $ | 197 | |
| Non-accruing loans | | $ | 12,329 | | | $ | 3,493 | | | $ | 3,811 | | | $ | 3,358 | | | $ | 9,453 | |
| Allowance for loan losses to loans 90 days or more past due and accruing | | | 13.65 | x | | | 7.85 | x | | | 189.41 | x | | | 67.54 | x | | | 30.39 | x |
| Allowance for loan losses to non-accruing loans | | | 0.61 | x | | | 1.36 | x | | | 1.27 | x | | | 1.62 | x | | | 0.63 | x |
| Allowance for loan losses to non-performing loans | | | 0.59 | x | | | 1.16 | x | | | 1.26 | x | | | 1.58 | x | | | 0.62 | x |
| Average net loans | | $ | 432,642 | | | $ | 416,438 | | | $ | 419,586 | | | $ | 412,523 | | | $ | 385,800 | |
The allowance for loan losses can generally absorb losses throughout the loan and lease portfolios. However, in some instances an allocation is made for specific loans or groups of loans. Allocation of the allowance for loan losses for different categories of loans is based on the methodology used by the Company, as previously explained. The changes in the allocations from year-to-year are based upon year-end reviews of the loan and lease portfolios.
Allocation of the allowance among major categories of loans for the past five years is summarized in the following table. This table should not be interpreted as an indication that charge-offs in future periods will occur in these amounts or proportions, or that the allocation indicates future charge-off trends. The portion of the allowance designated as unallocated is within the Company’s policy guidelines.
26
Table of Contents
| | 2008 | | % | | 2007 | | % | | 2006 | | % | | 2005 | | % | | 2004 | | % | |
Category | | | | | | | | | | | | | | | | | | | | | |
Residential real estate | | $ | 710,981 | | 15.0 | | $ | 636,899 | | 13.2 | | $ | 578,117 | | 10.6 | | $ | 595,092 | | 9.9 | | $ | 451,349 | | 7.5 | |
Consumer | | 973,356 | | 20.5 | | 960,505 | | 19.9 | | 1,157,091 | | 21.2 | | 1,180,175 | | 19.7 | | 966,081 | | 16.1 | |
Commercial and commercial real estate | | 2,860,059 | | 60.3 | | 2,979,372 | | 61.7 | | 3,549,870 | | 65.2 | | 4,035,950 | | 67.4 | | 4,330,285 | | 72.3 | |
Direct financing leases | | 6,837 | | 0.1 | | 9,355 | | 0.2 | | 14,058 | | 0.3 | | 14,828 | | 0.3 | | 40,891 | | 0.7 | |
Real estate construction | | 67,141 | | 1.4 | | 52,634 | | 1.1 | | 59,617 | | 1.1 | | 59,953 | | 1.0 | | 46,465 | | 0.8 | |
Unallocated | | 126,860 | | 2.7 | | 185,636 | | 3.9 | | 85,550 | | 1.6 | | 98,651 | | 1.7 | | 152,727 | | 2.6 | |
Total | | $ | 4,745,234 | | 100.0 | % | $ | 4,824,401 | | 100.0 | % | $ | 5,444,303 | | 100.0 | % | $ | 5,984,649 | | 100.0 | % | $ | 5,987,798 | | 100.0 | % |
| | | 2009 | | | % | | | 2008 | | | % | | | 2007 | | | % | | | 2006 | | | % | | | 2005 | | | % | |
| Category | | | | | | | | | | | | | | | | | | | | | | | | | | | | | | |
| Real estate: | | | | | | | | | | | | | | | | | | | | | | | | | | | | | | |
| Commercial | | $ | 4,045,046 | | | | 53.3 | % | | $ | 1,930,511 | | | | 40.7 | % | | $ | 1,989,267 | | | | 41.2 | % | | $ | 2,586,967 | | | | 47.5 | % | | $ | 2,969,168 | | | | 49.6 | % |
| Residential | | | 880,401 | | | | 11.6 | | | | 710,981 | | | | 15.0 | | | | 636,899 | | | | 13.2 | | | | 578,117 | | | | 10.6 | | | | 595,092 | | | | 9.9 | |
| Construction | | | 72,105 | | | | 1.0 | | | | 67,141 | | | | 1.4 | | | | 52,634 | | | | 1.1 | | | | 59,617 | | | | 1.1 | | | | 59,953 | | | | 1.0 | |
| Commercial and industrial | | | 1,639,872 | | | | 21.7 | | | | 929,548 | | | | 19.6 | | | | 990,105 | | | | 20.5 | | | | 962,903 | | | | 17.7 | | | | 1,066,782 | | | | 17.8 | |
| Consumer | | | 840,660 | | | | 11.1 | | | | 973,356 | | | | 20.5 | | | | 960,505 | | | | 19.9 | | | | 1,157,091 | | | | 21.2 | | | | 1,180,175 | | | | 19.7 | |
| Direct financing leases | | | - | | | | - | | | | 6,837 | | | | 0.1 | | | | 9,355 | | | | 0.2 | | | | 14,058 | | | | 0.3 | | | | 14,828 | | | | 0.3 | |
| Unallocated | | | 95,519 | | | | 1.3 | | | | 126,860 | | | | 2.7 | | | | 185,636 | | | | 3.9 | | | | 85,550 | | | | 1.6 | | | | 98,651 | | | | 1.7 | |
| Total | | $ | 7,573,603 | | | | 100.0 | % | | $ | 4,745,234 | | | | 100.0 | % | | $ | 4,824,401 | | | | 100.0 | % | | $ | 5,444,303 | | | | 100.0 | % | | $ | 5,984,649 | | | | 100.0 | % |
The allocation of the allowance for the commercial loan portfolio
which is comprised
60%of commercial real estate loans and commercial and industrial loans, accounted for approximately 75%, or
$2,860,000,$5,685,000 of the total allowance for loan losses at December 31,
2008, of which approximately 10% is reserved for specifically identified non-performing commercial loan relationships.2009. Collateral values were prudently
valuedcalculated to provide a conservative and realistic value
of the collateral supporting these loans. The allocations to the other categories of loans are adequate compared to the actual three-year historical net charge-offs.
Approximately $793,000, or 11%, of the allowance is specifically allocated to individual impaired loans.
The Company defines non-performing assets as accruing loans past due 90 days or more, non-accrual loans,
troubled debt restructured loans
(TDRs), other real estate owned (ORE)
, repossessed assets and
repossessed assets.non-accrual investment securities. As of December 31,
2008,2009, non-performing assets represented
0.96%2.58% of total assets compared to
0.67%0.96% at December 31,
2007.2008.
The following table sets forth non-performing assets at December 31 (dollars in thousands):
| | 2008 | | 2007 | | 2006 | | 2005 | | 2004 | |
Net loans, including loans available-for-sale | | $ | 436,291 | | $ | 422,252 | | $ | 417,321 | | $ | 403,573 | | $ | 382,123 | |
| | | | | | | | | | | |
Loans past due 90 days or more and accruing | | $ | 604 | | $ | 26 | | $ | 81 | | $ | 197 | | $ | 557 | |
Non-accrual loans | | 3,493 | | 3,811 | | 3,358 | | 9,453 | | 9,904 | |
Total non-performing loans | | 4,097 | | 3,837 | | 3,439 | | 9,650 | | 10,461 | |
Restructured loans | | — | | — | | — | | — | | — | |
Other real estate owned | | 1,451 | | 107 | | 197 | | — | | 163 | |
Repossessed assets | | — | | — | | — | | 19 | | 50 | |
Total non-performing assets | | $ | 5,548 | | $ | 3,944 | | $ | 3,636 | | $ | 9,669 | | $ | 10,674 | |
| | | | | | | | | | | |
Non-accrual loans to net loans | | 0.80 | % | 0.90 | % | 0.80 | % | 2.34 | % | 2.59 | % |
Non-performing assets to net loans, foreclosed real estate and repossessed assets | | 1.27 | % | 0.93 | % | 0.87 | % | 2.40 | % | 2.79 | % |
Non-performing assets to total assets | | 0.96 | % | 0.67 | % | 0.65 | % | 1.78 | % | 1.99 | % |
Non-performing loans to net loans | | 0.94 | % | 0.91 | % | 0.82 | % | 2.39 | % | 2.74 | % |
| | | 2009 | | | 2008 | | | 2007 | | | 2006 | | | 2005 | |
| Net loans, including loans available-for-sale | | $ | 424,345 | | | $ | 436,291 | | | $ | 422,252 | | | $ | 417,321 | | | $ | 403,573 | |
| | | | | | | | | | | | | | | | | | | | | |
| Loans past due 90 days or more and accruing | | $ | 555 | | | $ | 604 | | | $ | 26 | | | $ | 81 | | | $ | 197 | |
| Non-accrual loans | | | 12,329 | | | | 3,493 | | | | 3,811 | | | | 3,358 | | | | 9,453 | |
| Total non-performing loans | | | 12,884 | | | | 4,097 | | | | 3,837 | | | | 3,439 | | | | 9,650 | |
| Restructured loans | | | - | | | | - | | | | - | | | | - | | | | - | |
| Other real estate owned | | | 887 | | | | 1,451 | | | | 107 | | | | 197 | | | | - | |
| Non-accrual securities | | | 583 | | | | - | | | | - | | | | - | | | | - | |
| Repossessed assets | | | - | | | | - | | | | - | | | | - | | | | 19 | |
| Total non-performing assets | | $ | 14,354 | | | $ | 5,548 | | | $ | 3,944 | | | $ | 3,636 | | | $ | 9,669 | |
| | | | | | | | | | | | | | | | | | | | | |
| Non-accrual loans to net loans | | | 2.91 | % | | | 0.80 | % | | | 0.90 | % | | | 0.80 | % | | | 2.34 | % |
| Non-performing loans to net loans | | | 3.04 | % | | | 0.94 | % | | | 0.91 | % | | | 0.82 | % | | | 2.39 | % |
| Non-performing assets to total assets | | | 2.58 | % | | | 0.96 | % | | | 0.67 | % | | | 0.65 | % | | | 1.78 | % |
The composition of non-performing loans as of December 31, 2009 is as follows (dollars in thousands):
| | | Gross | | | Past due 90 | | | Non- | | | Total non- | | | % of | |
| | | loan | | | days or more | | | accrual | | | performing | | | gross | |
| | | balances | | | and still accruing | | | loans | | | loans | | | loans | |
| Real estate: | | | | | | | | | | | | | | | |
| Commercial | | $ | 186,726 | | | $ | 103 | | | $ | 7,382 | | | $ | 7,485 | | | | 4.01 | % |
| Residential | | | 71,001 | | | | 387 | | | | 3,865 | | | | 4,253 | | | | 5.99 | % |
| Construction | | | 10,125 | | | | - | | | | - | | | | - | | | | - | |
| Commercial and industrial | | | 76,788 | | | | 12 | | | | 726 | | | | 738 | | | | 0.96 | % |
| Consumer | | | 85,690 | | | | 52 | | | | 355 | | | | 408 | | | | 0.48 | % |
| Direct financing leases | | | 367 | | | | - | | | | - | | | | - | | | | - | |
| Total | | $ | 430,698 | | | $ | 555 | | | $ | 12,329 | | | $ | 12,884 | | | | 2.99 | % |
In the review of loans for both delinquency and collateral sufficiency, management concluded that there were a number of loans that lacked the ability to repay in accordance with contractual terms. The decision to place loans or leases on a non-accrual status is made on an individual basis after considering factors pertaining to each specific loan.
The commercial loans are placed on non-accrual status when management has determined that payment of all contractual principal and interest is in doubt or the loan is past due 90 days or more as to principal and interest, unless well-secured and in the process of collection. Consumer loans secured by real estate and residential mortgage loans are placed on non-accrual status at 120 days past due as to principal and interest, and, unsecured consumer loans are charged-off when the loan is 90 days or more past due as to principal and interest. Securities are placed on non-accrual status when principal has been impaired and the receipt of cash interest has ceased. Uncollected accrued interest is reversed and charged against interest income when loans and securities are placed on non-accrual status.
The majority of
the increase non-performing assets for the period is attributed to non-accruing commercial business loans,
and non-accruing real estate loans in the process of
foreclosure.foreclosure and non-accruing investment securities. During the period $583,000 of corporate bonds consisting of pooled trust preferred securities were moved to non-accrual status. There were no non-accrual securities prior to 2009. For a further discussion the Company’s securities portfolio, see Note 3, “Investment Securities”, within the notes to the consolidated financial statements, and incorporated by reference in Part II, Item 8, and the section entitled, “Investments”, contained within management’s discussion and analysis. Most of
thesethe non-accruing loans are collateralized, thereby mitigating the Company’s potential for loss. In
2007,2008, non-performing loans were
$3,837,000 compared to $4,097,000
and $12,884,000 at year-end
2008.2009. The increase occurred mainly in the commercial loan portfolio as several local borrowers were unable to meet their contractual repayment obligations as a result of the weakened economic conditions. Action plans for the resolution of each of the Company’s non-performing loans have been developed, monitored and are periodically updated as needed. There were no repossessed assets at December 31,
20082009 or
2007.2008. ORE at December 31,
2009 consisted of three properties which are listed for sale with realtors. ORE at year-end 2008, consisted of four
properties of which one had an agreement to sell pending at that time. ORE at year-end 2007, consisted of one property which was subsequently sold. The Special Assets Department had developed specific action plans for each of the Company’s non-performing loans. During 2008, several of those plans were brought to a conclusion resulting in repayments of non-performing loans.properties. The non-accrual loans aggregated
$12,329,000 at December 31, 2009 and were $3,493,000 at December 31,
2008, a reduction of $318,000 from year-end 2007.2008. During
2008,2009, approximately
$4,946,000$12,492,000 of loans were placed in non-accrual status. These were partially offset by reductions or payoffs of
$2,426,000,$1,131,000, charge-offs of
$916,000, $1,562,000$1,979,000, $469,000 of transfers to ORE and
$360,000$77,000 of loans that
27
Table of Contents
returned to performing status. Loans past due 90 days or more and accruing totaled $604,000$555,000 at December 31, 20082009 compared to $26,000, at December 31, 2007. The majority of the increase was attributable to one residential mortgage migrating to the over 90 day category. Non-accrual loans were reduced by 8% to $3,493,000. The ORE balance rose from $107,000 to $1,450,000. This sizeable increase is a result of the collections process as the collateral securing non-accruing loans are taken in the foreclosure process. These three items comprise the non-performing assets of $5,548,000$604,000, at December 31, 2008. The percentage of non-performing assets to total assets was 2.58% at December 31, 2009, an increase from 0.96% at December 31, 2008, an increase from 0.67% at December 31, 2007, primarily due to the aforementioned ORE increase.transfer of loans and investments to non-performing status. Non-performing loans to net loans were 3.04% at December 31, 2009, and 0.94% at December 31, 2008, and 0.91% at December 31, 2007. The 30-89 day past due loans at December 31, 2008 were $1,858,000 reduced from $4,698,000 at December 31, 2007. Contributing to the reduction was the repayment of previously delinquent loans and others which had been brought current.
During the latter part of January 2009 the Company was notified by a customer of a significant adverse business event causing management to place the customer’s $3,300,000 loan relationship on non-accruing status. Management does not expect this will have a material impact on income going forward.
2008.
Repossessed assets consist of previously financed vehicles held-for-sale. Subsequent to the loan or lease maturity, the borrower or lessee defaulted on their contract and the Company repossessed the unit. Repossessed assets are sold through either a private or public sale and any deficiency balance from the sale of the asset is charged to the allowance for loan losses.
The Company terminated its automobile leasing business in 2005. There were no repossessed assets or
troubled debt restructured loans at December 31,
20072009 or December 31, 2008.
Payments received on non-accrual loans are recognized on a cash basis. Payments are first applied against the outstanding principal balance, then to the recovery of any charged-off loan amounts. Any excess is treated as a recovery of interest income. During
2008,2009, the Company collected approximately
$311,000$31,000 of interest income recognized on the cash basis. If the non-accrual loans that were outstanding as of December 31,
20082009 had been performing in accordance with their original terms, the Company would have recognized interest income with respect to such loans of
$250,000$365,000 for the year ended December 31,
2008.2009.
Bank premises and equipment, net
Net of accumulated depreciation and disposals, premises and equipment
increased $3,091,000.decreased $695,000. The Company purchased
fixed assetspremises and equipment or transferred assets from construction in process, a component of other assets in the consolidated balance sheet, of approximately
$4,489,000$908,000 in total during
20082009 compared to
$3,293,000$4,489,000 in
2007.2008. The
increase was principally from the2008 amount includes construction and completion of the Company’s West Scranton branch expansion project.
There were no expansion projects in 2009.
Foreclosed
assets held-for-sale
ORE was
$1,451,000$887,000 at December 31,
20082009 consisting of
fourthree properties,
oneall of which
was under an agreement to be sold. The remaining three properties were listed for sale with
a realtor. The one ORE property which had been owned at year endrealtors. At December 31,
2007 was sold.2008 ORE consisted of four properties at an aggregate value of $1,451,000.
Cash surrender value of bank owned life insurance
The Company maintains bank owned life insurance (BOLI) for a chosen group of employees, namely its officers, where the Company is the owner and sole beneficiary of the policies. BOLI is classified as a non-interest earning asset. Increases in the cash surrender value are recorded as components of non-interest income. The BOLI is profitable from the appreciation of the cash surrender values of the pool of insurance and its tax-free advantage to the Company. This profitability is used to offset a portion of current and future employee benefit costs. The BOLI can be liquidated if necessary with associated tax costs. However, the Company intends to hold this pool of insurance, because it provides income that enhances the Company’s capital position. Therefore, the Company has not provided for deferred income taxes on the earnings from the increase in cash surrender value.
Other assets
more than doubled in 2008increased 61% to
$14,416,000 as of December 31, 2009 from $8,930,000
compared to 2007.at December 31, 2008. The increase was caused predominately by the
increase in the net deferred tax asst of $4,046,000recent federal mandate that banks pre-fund their three-year estimated FDIC insurance premium. The prepaid FDIC insurance premium will be released as a
result of additional unrealized losses incharge to earnings over the
securities AFS portfolio. See Note 10, “Income Taxes,” for an analysis of the net deferred tax asset. Also contributingnext three years. Contributing to the increase in other assets was
an increaseadditional deferred tax assets from current year impairment losses in the
fair valuesecurities AFS portfolio. Partially offsetting these increases was a reduction in the carrying amount of the Company’s derivative contract which
is more fully explainedexpired in
Note 1, “Naturethe fourth quarter of
28
Table of Contents
operations and summary of significant accounting policies,” and 2009. For a further discussion on the Company’s derivative contract, see Note 12, “Fair valueValue of financial instrumentsFinancial Instruments and derivatives,” contained withinDerivatives” of the notes to consolidated financial statements, in Part II, Item 8.
The Company’s results of operations depend primarily on net interest income. Net interest income is the difference between interest income and interest expense. Interest income is generated from yields on interest-earning assets, which consist principally of loans and investment securities. Interest expense is incurred from rates paid on interest-bearing liabilities, which consist of deposits and borrowings. Net interest income is determined by the Company’s interest rate spread
(i.e., the(the difference between the yields earned on its interest-earning assets and the rates paid on its interest-bearing liabilities) and the relative amounts of interest-earning assets and interest-bearing liabilities. The interest rate spread is significantly impacted by: changes in interest rates and market yield curves and their related impact on cash flows; the composition and characteristics of interest-earning assets and interest-bearing liabilities; differences in the maturity and re-pricing characteristics of assets compared to the maturity and re-pricing characteristics of the liabilities that fund them and by the competition in our marketplace.
The Company’s profitability is also affected by the level of
its non-interest income and expenses, provision for loan losses and provision for income taxes. Non-interest income consists mostly of service charges on the Bank’s deposit and loan products, trust and asset management service fees, increases in the cash surrender value of the bank owned life insurance,
(BOLI), net gains or losses from the sales of loans,
securities and
securities AFS, salesforeclosed properties held-for-sale, write-down to market value of
other real estate (ORE)foreclosed properties
held-for-sale and from
credit related other-than-temporary impairment
(OTTI) charges from investment securities. Non-interest expense consists of compensation and related employee benefit expenses, occupancy, equipment, data processing, advertising, marketing, professional fees, insurance and other operating overhead.
The Company’s profitability is significantly affected by general economic and competitive conditions, changes in market interest rates, government policies and actions of regulatory authorities. The Company’s loan portfolio is comprised principally of commercial and commercial real estate loans. The properties underlying the Company’s mortgages are concentrated in Northeastern Pennsylvania. Credit risk, which represents the possibility of the Company not recovering amounts due from its borrowers, is significantly related to local economic conditions in the areas where the properties are located as well as the Company’s underwriting standards. Economic conditions affect the market value of the underlying collateral as well as the levels of adequate cash flow and revenue generation from income-producing commercial properties.
For the year ended 2009, the Company incurred a net loss of $1,400,000, or $0.67 per diluted share, compared to net income
of $3,636,000, or $1.76 per share, for the year ended December 31,
2008 was $3,636,000, compared to $4,612,000 for the year ended December 31, 2007. During the same periods, diluted earnings per common share was $1.76 and $2.23, respectively.2008. For the year ended December 31,
2008,2009, the Company’s return on average assets (ROA) and return on average shareholders’ equity (ROE) were
-0.25% and -2.91% compared to 0.62% and 6.81%
compared to 0.80% and 8.65%, respectively, for the year ended December 31,
2007.2008. The current year included a non-operating, non-cash, after-tax charge of
$288,000$2,178,000 related to
an other-than-temporary impairment
(OTTI) in the Company’s security AFS portfolio
that did not occur in 2007.compared to $288,000 for the year ended December 31, 2008. In addition, during
2008,2009, the Company recorded a provision for loan losses in the amount of
$940,000$5,050,000 compared to
a credit for loan losses of $60,000$940,000 in
2007.2008. The provision for loan losses in
20082009 was recorded
in anticipation ofto reinforce and fund the allowance for loan losses for heightened credit
quality deterioration ensuingrisks from
accelerated declines in economic conditions during the fourth quarter of 2008, in addition to growtha weakened economy and declining real estate values as well as an increase in the commercial
real estate loan portfolio. Further contributing to the lower net income
werewas lower
non-interest interest income and higher non-interest expenses. These items were partially offset by an improvement in net interest income of
$1,658,000,$165,000 and $1,030,000, or
9%6%,
of higher non-interest expenses. During 2009, the Company paid off long-term debt and incurred $505,000 of prepayment interest costs which are included as a component of interest expense in the consolidated income statement for the year ended December 31, 2009. Higher FDIC insurance premiums contributed to
$19,277,000the increase in
2008non-interest expense in 2009 compared to
$17,619,000 in 2007.2008. The decline in ROA and ROE was caused by the decrease in net income.
The following table reconciles net income, as reported to pro forma net operating income for the years indicated:
| | 2008 | | 2007 | |
| | Amount | | Per share | | Amount | | Per share | |
Net income, as reported | | $ | 3,635,948 | | $ | 1.76 | | $ | 4,611,572 | | $ | 2.23 | |
OTTI | | 435,665 | | 0.21 | | — | | — | |
Tax effect | | (148,126 | ) | (0.07 | ) | — | | — | |
Net operating earnings | | $ | 3,923,487 | | $ | 1.90 | | $ | 4,611,572 | | $ | 2.23 | |
The following table sets forth a comparison of average balances of assets and liabilities and their related net tax equivalent yields and rates for
2009, 2008
2007 and
20062007 (dollars in thousands):
| | 2008 | | 2007 | | 2006 | |
| | Average | | | | Yield/ | | Average | | | | Yield/ | | Average | | | | Yield/ | |
| | balance | | Interest | | rate | | balance | | Interest | | rate | | balance | | Interest | | rate | |
Assets | | | | | | | | | | | | | | | | | | | |
| | | | | | | | | | | | | | | | | | | |
Interest-earning assets | | | | | | | | | | | | | | | | | | | |
Interest-bearing deposits | | $ | 233 | | $ | 3 | | 1.36 | % | $ | 184 | | $ | 9 | | 4.81 | % | $ | 240 | | $ | 9 | | 3.82 | % |
| | | | | | | | | | | | | | | | | | | |
Investments: | | | | | | | | | | | | | | | | | | | |
U.S. government agencies | | 49,034 | | 2,576 | | 5.25 | | 34,682 | | 1,724 | | 4.97 | | 43,299 | | 1,795 | | 4.15 | |
Mortgage-backed securities | | 35,294 | | 1,833 | | 5.19 | | 51,781 | | 2,540 | | 4.91 | | 42,999 | | 1,944 | | 4.52 | |
State and municipal | | 15,813 | | 1,014 | | 6.41 | | 12,267 | | 780 | | 6.36 | | 14,485 | | 927 | | 6.40 | |
Other | | 25,967 | | 1,252 | | 4.82 | | 17,487 | | 1,175 | | 6.72 | | 14,536 | | 946 | | 6.50 | |
Total investments | | 126,108 | | 6,675 | | 5.29 | | 116,217 | | 6,219 | | 5.35 | | 115,319 | | 5,612 | | 4.87 | |
| | | | | | | | | | | | | | | | | | | |
Loans: | | | | | | | | | | | | | | | | | | | |
Commercial | | 231,721 | | 15,869 | | 6.85 | | 220,968 | | 16,458 | | 7.45 | | 219,482 | | 16,018 | | 7.30 | |
Consumer | | 71,089 | | 4,872 | | 6.85 | | 68,395 | | 4,625 | | 6.76 | | 65,011 | | 4,200 | | 6.46 | |
Real estate | | 117,547 | | 6,985 | | 5.94 | | 134,869 | | 8,360 | | 6.20 | | 133,279 | | 8,101 | | 6.08 | |
Direct financing leases | | 477 | | 29 | | 6.15 | | 549 | | 34 | | 6.16 | | 618 | | 38 | | 6.18 | |
Total loans | | 420,834 | | 27,755 | | 6.60 | | 424,781 | | 29,477 | | 6.94 | | 418,390 | | 28,357 | | 6.78 | |
| | | | | | | | | | | | | | | | | | | |
Federal funds sold | | 3,342 | | 91 | | 2.73 | | 1,948 | | 103 | | 5.28 | | 2,479 | | 123 | | 4.97 | |
| | | | | | | | | | | | | | | | | | | |
Total interest-earning assets | | 550,517 | | 34,524 | | 6.27 | % | 543,130 | | 35,808 | | 6.59 | % | 536,428 | | 34,101 | | 6.36 | % |
| | | | | | | | | | | | | | | | | | | |
Non-interest earning assets | | 33,301 | | | | | | 32,328 | | | | | | 28,495 | | | | | |
| | | | | | | | | | | | | | | | | | | |
Total Assets | | $ | 583,818 | | | | | | $ | 575,458 | | | | | | $ | 564,923 | | | | | |
| | | | | | | | | | | | | | | | | | | |
Liabilities and shareholders’ equity | | | | | | | | | | | | | | | | | | | |
| | | | | | | | | | | | | | | | | | | |
Interest-bearing liabilities | | | | | | | | | | | | | | | | | | | |
Deposits: | | | | | | | | | | | | | | | | | | | |
Savings | | $ | 38,425 | | $ | 331 | | 0.86 | % | $ | 41,055 | | $ | 511 | | 1.24 | % | $ | 46,422 | | $ | 620 | | 1.34 | % |
NOW | | 59,130 | | 616 | | 1.04 | | 67,489 | | 1,837 | | 2.72 | | 69,138 | | 1,880 | | 2.72 | |
MMDA | | 93,465 | | 2,460 | | 2.63 | | 84,000 | | 3,658 | | 4.35 | | 68,476 | | 2,948 | | 4.30 | |
CDs < $100,000 | | 98,410 | | 4,052 | | 4.12 | | 94,420 | | 4,173 | | 4.42 | | 87,345 | | 3,235 | | 3.70 | |
CDs > $100,000 | | 80,389 | | 3,638 | | 4.53 | | 66,998 | | 3,168 | | 4.73 | | 67,129 | | 2,791 | | 4.16 | |
Clubs | | 1,764 | | 21 | | 1.19 | | 1,908 | | 23 | | 1.21 | | 1,750 | | 19 | | 1.08 | |
Total deposits | | 371,583 | | 11,118 | | 2.99 | | 355,870 | | 13,370 | | 3.76 | | 340,260 | | 11,493 | | 3.38 | |
| | | | | | | | | | | | | | | | | | | |
Repurchase agreements | | 12,074 | | 103 | | 0.85 | | 19,580 | | 465 | | 2.38 | | 23,391 | | 624 | | 2.67 | |
| | | | | | | | | | | | | | | | | | | |
Borrowed funds | | 74,530 | | 3,463 | | 4.65 | | 71,573 | | 3,825 | | 5.34 | | 79,627 | | 4,244 | | 5.33 | |
| | | | | | | | | | | | | | | | | | | |
Total interest-bearing liabilities | | 458,187 | | 14,684 | | 3.20 | % | 447,023 | | 17,660 | | 3.95 | % | 443,278 | | 16,361 | | 3.69 | % |
| | | | | | | | | | | | | | | | | | | |
Non-interest bearing deposits | | 67,717 | | | | | | 70,606 | | | | | | 68,224 | | | | | |
| | | | | | | | | | | | | | | | | | | |
Non-interest bearing liabilities | | 4,503 | | | | | | 4,499 | | | | | | 3,771 | | | | | |
| | | | | | | | | | | | | | | | | | | |
Total liabilities | | 530,407 | | | | | | 522,128 | | | | | | 515,273 | | | | | |
| | | | | | | | | | | | | | | | | | | |
Shareholders’ equity | | 53,411 | | | | | | 53,330 | | | | | | 49,650 | | | | | |
| | | | | | | | | | | | | | | | | | | |
Total liabilities and shareholders’ equity | | $ | 583,818 | | | | | | $ | 575,458 | | | | | | $ | 564,923 | | | | | |
Net interest income | | | | $ | 19,840 | | | | | | $ | 18,148 | | | | | | $ | 17,740 | | | |
| | | | | | | | | | | | | | | | | | | |
Net interest spread | | | | | | 3.07 | % | | | | | 2.64 | % | | | | | 2.67 | % |
| | | | | | | | | | | | | | | | | | | |
Net interest margin | | | | | | 3.60 | % | | | | | 3.34 | % | | | | | 3.31 | % |
| | | 2009 | | | 2008 | | | 2007 | |
| | | Average | | | | | | Yield / | | | Average | | | | | | Yield / | | | Average | | | | | | Yield / | |
| | | balance | | | Interest | | | rate | | | balance | | | Interest | | | rate | | | balance | | | Interest | | | rate | |
Assets | | | | | | | | | | | | | | | | | | | | | | | | | | | |
| | | | | | | | | | | | | | | | | | | | | | | | | | | | |
Interest earning assets | | | | | | | | | | | | | | | | | | | | | | | | | | | |
| Interest-bearing deposits | | $ | 562 | | | $ | 1 | | | | 0.10 | % | | $ | 233 | | | $ | 3 | | | | 1.36 | % | | $ | 184 | | | $ | 9 | | | | 4.81 | % |
| | | | | | | | | | | | | | | | | | | | | | | | | | | | | | | | | | | | | |
| Investments: | | | | | | | | | | | | | | | | | | | | | | | | | | | | | | | | | | | | |
| Agency - GSE | | | 36,842 | | | | 1,769 | | | | 4.80 | | | | 49,034 | | | | 2,576 | | | | 5.25 | | | | 34,682 | | | | 1,724 | | | | 4.97 | |
| MBS - GSE residential | | | 11,072 | | | | 618 | | | | 5.58 | | | | 35,294 | | | | 1,833 | | | | 5.19 | | | | 51,781 | | | | 2,540 | | | | 4.91 | |
| State and municipal | | | 24,278 | | | | 1,610 | | | | 6.63 | | | | 15,813 | | | | 1,014 | | | | 6.41 | | | | 12,267 | | | | 780 | | | | 6.36 | |
| Other | | | 25,988 | | | | 475 | | | | 1.83 | | | | 25,967 | | | | 1,252 | | | | 4.82 | | | | 17,487 | | | | 1,175 | | | | 6.72 | |
| Total investments | | | 98,180 | | | | 4,472 | | | | 4.56 | | | | 126,108 | | | | 6,675 | | | | 5.29 | | | | 116,217 | | | | 6,219 | | | | 5.35 | |
| | | | | | | | | | | | | | | | | | | | | | | | | | | | | | | | | | | | | |
| Loans: | | | | | | | | | | | | | | | | | | | | | | | | | | | | | | | | | | | | |
| Commercial and CRE | | | 261,842 | | | | 15,829 | | | | 6.05 | | | | 231,721 | | | | 15,869 | | | | 6.85 | | | | 220,968 | | | | 16,458 | | | | 7.45 | |
| Consumer | | | 65,916 | | | | 4,559 | | | | 6.92 | | | | 71,089 | | | | 4,872 | | | | 6.85 | | | | 68,395 | | | | 4,625 | | | | 6.76 | |
| Residential real estate | | | 104,481 | | | | 5,787 | | | | 5.54 | | | | 117,547 | | | | 6,985 | | | | 5.94 | | | | 134,869 | | | | 8,360 | | | | 6.20 | |
| Direct financing leases | | | 403 | | | | 25 | | | | 6.12 | | | | 477 | | | | 29 | | | | 6.15 | | | | 549 | | | | 34 | | | | 6.16 | |
| Total loans | | | 432,642 | | | | 26,200 | | | | 6.06 | | | | 420,834 | | | | 27,755 | | | | 6.60 | | | | 424,781 | | | | 29,477 | | | | 6.94 | |
| | | | | | | | | | | | | | | | | | | | | | | | | | | | | | | | | | | | | |
| Federal funds sold | | | 4,603 | | | | 11 | | | | 0.25 | | | | 3,342 | | | | 91 | | | | 2.73 | | | | 1,948 | | | | 103 | | | | 5.28 | |
| | | | | | | | | | | | | | | | | | | | | | | | | | | | | | | | | | | | | |
| Total interest-earning assets | | | 535,987 | | | | 30,684 | | | | 5.72 | % | | | 550,517 | | | | 34,524 | | | | 6.27 | % | | | 543,130 | | | | 35,808 | | | | 6.59 | % |
| | | | | | | | | | | | | | | | | | | | | | | | | | | | | | | | | | | | | |
| Non-interest earning assets | | | 29,289 | | | | | | | | | | | | 33,301 | | | | | | | | | | | | 32,328 | | | | | | | | | |
| | | | | | | | | | | | | | | | | | | | | | | | | | | | | | | | | | | | | |
| Total Assets | | $ | 565,276 | | | | | | | | | | | $ | 583,818 | | | | | | | | | | | $ | 575,458 | | | | | | | | | |
| | | | | | | | | | | | | | | | | | | | | | | | | | | | | | | | | | | | | |
Liabilities and shareholders' equity | | | | | | | | | | | | | | | | | | | | | | | | | | | | | | | | | | | | |
| | | | | | | | | | | | | | | | | | | | | | | | | | | | | | | | | | | | | |
Interest-bearing liabilities | | | | | | | | | | | | | | | | | | | | | | | | | | | | | | | | | | | | |
| Deposits: | | | | | | | | | | | | | | | | | | | | | | | | | | | | | | | | | | | | |
| Savings | | $ | 53,690 | | | $ | 404 | | | | 0.75 | % | | $ | 38,425 | | | $ | 331 | | | | 0.86 | % | | $ | 41,055 | | | $ | 511 | | | | 1.24 | % |
| NOW | | | 62,090 | | | | 197 | | | | 0.32 | | | | 59,130 | | | | 616 | | | | 1.04 | | | | 67,489 | | | | 1,837 | | | | 2.72 | |
| MMDA | | | 106,115 | | | | 1,624 | | | | 1.53 | | | | 93,465 | | | | 2,460 | | | | 2.63 | | | | 84,000 | | | | 3,658 | | | | 4.35 | |
| CDs < $100,000 | | | 101,286 | | | | 3,217 | | | | 3.18 | | | | 98,410 | | | | 4,052 | | | | 4.12 | | | | 94,420 | | | | 4,173 | | | | 4.42 | |
| CDs > $100,000 | | | 63,436 | | | | 2,435 | | | | 3.84 | | | | 80,389 | | | | 3,638 | | | | 4.53 | | | | 66,998 | | | | 3,168 | | | | 4.73 | |
| Clubs | | | 1,687 | | | | 19 | | | | 1.14 | | | | 1,764 | | | | 21 | | | | 1.19 | | | | 1,908 | | | | 23 | | | | 1.21 | |
| Total interest-bearing deposits | | | 388,304 | | | | 7,896 | | | | 2.03 | | | | 371,583 | | | | 11,118 | | | | 2.99 | | | | 355,870 | | | | 13,370 | | | | 3.76 | |
| | | | | | | | | | | | | | | | | | | | | | | | | | | | | | | | | | | | | |
Repurchase agreements | | | 8,743 | | | | 28 | | | | 0.32 | | | | 12,074 | | | | 103 | | | | 0.85 | | | | 19,580 | | | | 465 | | | | 2.38 | |
| | | | | | | | | | | | | | | | | | | | | | | | | | | | | | | | | | | | | |
| Borrowed funds | | | 45,979 | | | | 2,873 | | | | 6.25 | | | | 74,530 | | | | 3,463 | | | | 4.65 | | | | 71,573 | | | | 3,825 | | | | 5.34 | |
| | | | | | | | | | | | | | | | | | | | | | | | | | | | | | | | | | | | | |
Total interest-bearing liabilities | | | 443,026 | | | | 10,797 | | | | 2.44 | % | | | 458,187 | | | | 14,684 | | | | 3.20 | % | | | 447,023 | | | | 17,660 | | | | 3.95 | % |
| | | | | | | | | | | | | | | | | | | | | | | | | | | | | | | | | | | | | |
| Non-interest bearing deposits | | | 70,285 | | | | | | | | | | | | 67,717 | | | | | | | | | | | | 70,606 | | | | | | | | | |
| | | | | | | | | | | | | | | | | | | | | | | | | | | | | | | | | | | | | |
| Non-interest bearing liabilities | | | 3,828 | | | | | | | | | | | | 4,503 | | | | | | | | | | | | 4,499 | | | | | | | | | |
| | | | | | | | | | | | | | | | | | | | | | | | | | | | | | | | | | | | | |
| Total liabilities | | | 517,139 | | | | | | | | | | | | 530,407 | | | | | | | | | | | | 522,128 | | | | | | | | | |
| | | | | | | | | | | | | | | | | | | | | | | | | | | | | | | | | | | | | |
| Shareholders' equity | | | 48,137 | | | | | | | | | | | | 53,411 | | | | | | | | | | | | 53,330 | | | | | | | | | |
| | | | | | | | | | | | | | | | | | | | | | | | | | | | | | | | | | | | | |
Total liabilities and shareholders' equity | | $ | 565,276 | | | | | | | | | | | $ | 583,818 | | | | | | | | | | | $ | 575,458 | | | | | | | | | |
| Net interest income | | | | | | $ | 19,887 | | | | | | | | | | | $ | 19,840 | | | | | | | | | | | $ | 18,148 | | | | | |
| | | | | | | | | | | | | | | | | | | | | | | | | | | | | | | | | | | | | |
| Net interest spread | | | | | | | | | | | 3.28 | % | | | | | | | | | | 3.07 | % | | | | | | | | | | 2.64 | % |
| | | | | | | | | | | | | | | | | | | | | | | | | | | | | | | | | | | | | |
| Net interest margin | | | | | | | | | | | 3.71 | % | | | | | | | | | | 3.60 | % | | | | | | | | | | 3.34 | % |
Table of Contents
In the preceding table, interest income was adjusted to a tax-equivalent basis, using the corporate federal tax rate of 34%, to recognize the income from tax-exempt interest-earning assets as if the interest was taxable. This treatment allows a uniform comparison between yields on interest-earning assets. Loans include loans AFS and non-accrual loans but exclude the allowance for loan losses. Securities include non-accrual securities. Average balances are based on amortized cost and do not reflect net unrealized gains or losses. Net interest margin representsis calculated by dividing net interest income divided by total average interest-earning assets.
assets.
Changes in net interest income are a function of both changes in interest rates and changes in volume of interest-earning assets and interest-bearing liabilities. The following table presents the extent to which changes in interest rates and changes in volumes of interest-earning assets and interest-bearing liabilities have affected the Company’s interest income and interest expense during the periods indicated. Information is provided in each category with respect to (1) the changes attributable to changes in volume (changes in volume multiplied by the prior period rate), (2) the changes attributable to changes in interest rates (changes in rates multiplied by prior period volume) and (3) the net change. The combined effect of changes in both volume and rate has been allocated proportionately to the change due to volume and the change due to rate. Tax-exempt income was not converted to a tax-equivalent basis on the rate/volume analysis (dollars in thousands):
| | Years ended December 31, | |
| | 2008 compared to 2007 | | 2007 compared to 2006 | |
| | Increase (decrease) due to | |
| | Volume | | Rate | | Total | | Volume | | Rate | | Total | |
Interest income: | | | | | | | | | | | | | |
Loans and leases: | | | | | | | | | | | | | |
Mortgage | | $ | (1,040 | ) | $ | (336 | ) | $ | (1,376 | ) | $ | 97 | | $ | 163 | | $ | 260 | |
Commercial | | 766 | | (1,305 | ) | (539 | ) | 108 | | 318 | | 426 | |
Consumer | | 178 | | 66 | | 244 | | 219 | | 203 | | 422 | |
Total loans and leases | | (96 | ) | (1,575 | ) | (1,671 | ) | 424 | | 684 | | 1,108 | |
Investment securities, interest-bearing deposits and federal funds sold | | 564 | | (211 | ) | 353 | | 14 | | 628 | | 642 | |
Total interest income | | 468 | | (1,786 | ) | (1,318 | ) | 438 | | 1,312 | | 1,750 | |
| | | | | | | | | | | | | |
Interest expense: | | | | | | | | | | | | | |
Deposits: | | | | | | | | | | | | | |
Certificates of deposit greater than $100,000 | | 611 | | (141 | ) | 470 | | (5 | ) | 382 | | 377 | |
Other | | 81 | | (2,803 | ) | (2,722 | ) | 520 | | 980 | | 1,500 | |
Total deposits | | 692 | | (2,944 | ) | (2,252 | ) | 515 | | 1,362 | | 1,877 | |
Other interest-bearing liabilities | | (206 | ) | (518 | ) | (724 | ) | (558 | ) | (20 | ) | (578 | ) |
Total interest expense | | 486 | | (3,462 | ) | (2,976 | ) | (43 | ) | 1,342 | | 1,299 | |
Net interest income | | $ | (18 | ) | $ | 1,676 | | $ | 1,658 | | $ | 481 | | $ | (30 | ) | $ | 451 | |
| | | Years ended December 31, | |
| | | 2009 compared to 2008 | | | 2008 compared to 2007 | |
| | | Increase (decrease) due to | |
| | | Volume | | | Rate | | | Total | | | Volume | | | Rate | | | Total | |
| Interest income: | | | | | | | | | | | | | | | | | | |
| Loans and leases: | | | | | | | | | | | | | | | | | | |
| Residential real estate | | $ | (744 | ) | | $ | (454 | ) | | $ | (1,198 | ) | | $ | (1,040 | ) | | $ | (336 | ) | | $ | (1,376 | ) |
| Commercial and CRE | | | 1,912 | | | | (1,992 | ) | | | (80 | ) | | | 766 | | | | (1,305 | ) | | | (539 | ) |
| Consumer | | | (362 | ) | | | 45 | | | | (317 | ) | | | 178 | | | | 66 | | | | 244 | |
| Total loans and leases | | | 806 | | | | (2,401 | ) | | | (1,595 | ) | | | (96 | ) | | | (1,575 | ) | | | (1,671 | ) |
Investment securities, interest-bearing deposits and Federal funds sold | | | (1,159 | ) | | | (1,298 | ) | | | (2,457 | ) | | | 564 | | | | (211 | ) | | | 353 | |
| Total interest income | | | (353 | ) | | | (3,699 | ) | | | (4,052 | ) | | | 468 | | | | (1,786 | ) | | | (1,318 | ) |
| | | | | | | | | | | | | | | | | | | | | | | | | |
| Interest expense: | | | | | | | | | | | | | | | | | | | | | | | | |
| Deposits: | | | | | | | | | | | | | | | | | | | | | | | | |
| Certificates of deposit greater than $100,000 | | | (700 | ) | | | (503 | ) | | | (1,203 | ) | | | 611 | | | | (141 | ) | | | 470 | |
| Other | | | 790 | | | | (2,809 | ) | | | (2,019 | ) | | | 81 | | | | (2,803 | ) | | | (2,722 | ) |
| Total deposits | | | 90 | | | | (3,312 | ) | | | (3,222 | ) | | | 692 | | | | (2,944 | ) | | | (2,252 | ) |
| Other interest-bearing liabilities | | | (1,525 | ) | | | 860 | | | | (665 | ) | | | (206 | ) | | | (518 | ) | | | (724 | ) |
| Total interest expense | | | (1,435 | ) | | | (2,452 | ) | | | (3,887 | ) | | | 486 | | | | (3,462 | ) | | | (2,976 | ) |
| Net interest income | | $ | 1,082 | | | $ | (1,247 | ) | | $ | (165 | ) | | $ | (18 | ) | | $ | 1,676 | | | $ | 1,658 | |
The interest rate yield curve remained positively sloped in 2009, but at unprecedented low levels. The FOMC has not adjusted the short-term federal funds rate which has remained near zero percent during 2009. Similarly, at 3.25%, the national prime interest rate remained constant throughout 2009. National prime is a benchmark rate banks use to set rates on various lending and other interest-sensitive products. Operating in a very low interest rate environment will continue to present challenges in the coming year for all banks. In today’s markets, funding longer-termed assets with shorter-termed liabilities solely for higher spread is not a prudent means of managing interest rate risk as this strategy is detrimental to future earnings when rates begin to rise and asset duration lengthens. Therefore, operating in this low interest rate environment will continue to suppress significant asset growth.
While national prime has remained at 3.25% throughout 2009, the weighted-average national prime rate decreased 184 basis points, from 5.09%, in 2008. The effect of this decrease has been to exert extreme downward pressure on yields of the Company’s interest-earning assets. With rate-cutting beginning in January 2008, this pressure existed with increasing momentum throughout 2009. The Company was able to more than offset this pressure by periodically adjusting rates on its interest-bearing deposits. In response to the swift downward shift in rates, the Company’s asset / liability committee assessed, among other things, the impact the interest rate movements have had on its earning assets. Where necessary, rate adjustments to interest-bearing deposits and repurchase agreements were implemented and high-costing long-term wholesale funding sources were paid off, all of which helped minimize the effect rate changes have had on net interest income. The committee meets frequently and has successfully implemented rate setting strategies to help mitigate the interest rate risk inherent in the balance sheet and has been able to preserve its net interest margin to acceptable levels.
As market rates fell along with national prime, loan originations, renewing commercial and residential loans and lines of credit continued to price below the average 2009 portfolio yields. In addition, the decrease in the Treasury yields and other capital market rates, which largely began during the second half of 2008, has had and could continue to have an unfavorable impact on the Company’s total 2009 and 2010 investment portfolio yield. The relative and predominantly lower interest rate environment of 2008 and 2009 had a negative impact on the Company’s interest-earning assets. Total interest income declined 12%, or $4,052,000 from $33,961,000 in 2008 to $29,909,000 in 2009 and further caused the tax-equivalent yield on earning assets to decrease 55 basis points. The Company should continue to experience a period of sliding yields on its interest-earning assets during 2010, in what has become a sustained low interest rate environment.
Interest expense decreased $3,887,000, or 26%, from $14,684,000 in 2008 to $10,797,000 in 2009. The lower interest rate environment that has dominated the economy over the last two years required the Company to periodically reduce offering rates on both its deposit and repurchase agreement products. Though the Company recorded a net increase in average interest-bearing deposits, interest expense on deposits declined by $3,223,000 in 2009 compared to 2008 caused by a 96 basis point decline on rates paid. The effect of the $16,721,000 net increase in average interest-bearing deposits was an additional $90,000 in interest expense. In an effort to maintain reasonable interest rate spreads to its earning-assets, the Company’s asset / liability committee reduced rates paid on CDs as well as rates paid on transactional deposits. In today’s environment, rates on CD’s should naturally price lower as they mature. Whether or not the Company can continue to reduce rates on deposits that are currently priced at unprecedented low levels, to maintain its interest rate spread will be predicated on the interest rate environment, liquidity position and competition. Interest expense on borrowings, including repurchase agreements, declined $665,000 during 2009, mostly from the $31,882,000 decline in average balances. During 2009, the Company paid off $10,000,000 of high-costing long-term debt and incurred $505,000 of prepayment interest costs that are included as a component of interest expense in the consolidated statement of income for the year ended December 31, 2009.
The resulting performance that the mix of the Company’s interest-sensitive assets and liabilities and the varying effects the severity of the yield curve slope has had during 2009, combined with the early pay off of high-costing long-term debt, caused net interest income to decrease $165,000, or 1%, from $19,277,000 in 2008 to $19,112,000 in 2009. On a tax-equivalent basis, the net interest rate spread increased 21 basis points from 3.07% to 3.28% and the tax-equivalent margin improved 11 basis points, from 3.60% in 2008 to 3.71% in 2009, respectively.
Provision for loan losses
The provision for loan losses represents the necessary amount to charge against current earnings, the purpose of which is to increase the allowance for loan losses to a level that represents management’s best estimate of known and inherent losses in the Company’s loan portfolio. Management continuously reviews the risks inherent in the loan and lease portfolio. Loans and leases determined to be uncollectible are charged-off against the allowance for loan losses. The required amount of the provision for loan losses, based upon the adequate level of the allowance for loan losses, is subject to ongoing analysis of the loan portfolio. The Company’s Special Asset Committee meets periodically to review problem loans and leases. The committee is comprised of management, including the chief risk officer, loan workout officers and collection personnel. The committee reports quarterly to the Credit Administration Committee of the Board of Directors.
Provisions for loan losses of $5,050,000 were made for the year ended December 31, 2009. In 2008, provisions of $940,000 were made. The $5,050,000 provision for loan losses was recorded due to credit quality deterioration ensuing from the declines in economic conditions during 2009. This increase in the provision compared to 2008 was due to the increased levels of credit downgrades, net charge-offs, and an increase in the level of non-performing loans. A portion was also allocated to safeguard against possible future losses due to weaker economic conditions.
Other income
For the year ended December 31, 2009, total other income was $2,417,000, or 53%, less than the $4,578,000 recorded during the year ended December 31, 2008. In 2009, a non-cash other-than-temporary impairment (OTTI) charge of $3,300,000 was recorded compared to $436,000 recorded for the year ended December 31, 2008. For both years, the OTTI charges were related to the Company’s investment in pooled trust preferred securities. The carrying values of these securities were written down to their fair values as management has deemed the impairment to be other-than-temporary. For a further discussion on the Company’s investment in pooled trust preferred securities see Note 3, “Investment Securities”, within the notes to the consolidated financial statements, and incorporated by reference in Part II, Item 8, and the section entitled, “Investments”, contained within management’s discussion and analysis. Service charges on deposit related accounts declined $271,000, or 9%, in 2009 compared to 2008. This decline was the result of lower volumes of overdraft transactions. Further contributing to the decline in other income in 2009, the Company wrote down to fair value, the carrying amount of its investment in two foreclosed assets held-for-sale by a total of $178,000. There were no similar write-downs in 2008. The assets represent two commercial real estate properties acquired in foreclosure during 2008. The current year subsequent write-downs were based on sales indications received by the Company that were less than the carrying value of the properties. Partially offsetting these declines in other income were increased gains from mortgage banking services which increased by $799,000 in the year-over-year comparison and higher levels of loan and financial services fee income.
Other expenses
For the year ended December 31, 2009, other operating expenses grew $1,030,000, or 6%, from $18,211,000 for the year ended December 31, 2008 to $19,241,000 for the 2009 year. The higher operating expenses include a $1,046,000 increase in FDIC insurance premiums, or nearly nine times the 2008 assessment. With the requirement for the FDIC to shore up the insurance reserve, the Company expects to continue to incur relatively high FDIC insurance premiums over the next several years. In conjunction with the Company’s branch expansion project in 2008, depreciation on premises and equipment increased $305,000, or 6%, from a full year of expense. Partially offsetting the increased FDIC premiums and branch expansion related expenses were lower employee salary and benefit costs and less expenses from advertising. The reduced salary and benefits is from fewer full-time equivalent employees in 2009 compared to 2008. The decline in advertising was due to expansion projects and the related promotion costs consummated in 2008 that did not recur in 2009. Other expenses also increased by higher collection and ORE expenses associated with more legal, maintenance and other costs associated with the property foreclosure process.
The ratios of non-interest expense less non-interest income to average assets (expense ratio) at December 31, 2009 and 2008 were 2.37% and 2.25%, respectively. The overhead expense ratio, which excludes OTTI and gains from securities sales, drifted upward due mostly to lower average assets and to a lesser extent, higher net non-interest expenses.
As the Company enters 2010, management expects certain expenses to rise above or remain at above-normal, inflationary-only prone increases. In 2009, the Company’s FDIC costs, grew nearly nine times the 2008 level. In 2010, the Company will continue to experience high premiums and does not expect these coverage costs to recede in the near future. In addition, the deterioration of real estate values, a lackluster environment for commercial business expansion and the potential for contraction of existing businesses and those whose operations have been negatively affected by the current economic climate, could result in additional legal costs associated with collection efforts as well as higher maintenance costs for existing and potentially more properties acquired in foreclosure. The management team of the Company is poised to minimize losses and expenses associated with these activities, however there is no assurance that such activity will not occur.
Provision for income taxes
The Company’s pre tax loss in 2009 compared to pretax income in 2008 was the cause of a credit for income taxes in 2009 compared to a provision for income taxes in 2008.
Comparison of Financial Condition as of December 31, 2008
and 2007 and Results of Operations for each of the Years then Ended
Financial Condition
Overview
Consolidated assets decreased $11,694,000, or 2%, during the year ended December 31, 2008 to $575,719,000. The decline was the result of decreases in total borrowings of $12,235,000, or 12%, and a decrease in total shareholders’ equity of $6,231,000 partially offset by a 2%, or $7,604,000 increase in deposits. The decline in shareholders’ equity was primarily from increased unrealized net losses in the securities AFS portfolio, the declaration of cash dividends and the repurchase of the Company’s capital stock (treasury stock). During 2008, the carrying amount of the investment portfolios declined by $38,797,000, or 32%, while the loan portfolios increased $14,040,000, or 3% to $436,291,000 as of December 31, 2008. Other increases included premises and equipment, the net deferred tax asset, bank owned life insurance, FHLB stock, the carrying value of the derivative contract and prepaid expenses. Cash increased $2,362,000 since 2007.
Deposits
Total deposits increased $7,604,000, or 2%, during 2008 to $433,312,000. The growth in deposits was mostly from increases in money markets of $8,846,000 and DDAs of $6,647,000, or 10% each, partially offset by declines in NOW and certificates of deposit accounts of $4,571,000 and $4,519,000, respectively. The majority of the increase in DDAs was from a temporary deposit from a corporate trust account which had since been withdrawn. The West Scranton branch office, that had opened during the third quarter of 2008 and the related bank-wide promotions, superior customer service, increased deposit business from our existing and new commercial customers all contributed to the net increase in deposits. The continued increases in money market accounts that the Company had experienced were from success in our deposit-gathering strategies in conjunction with promotional interest rates tailored to depositors’ needs. We attributed the decline in certificate of deposit accounts to the lower and highly volatile interest rate environment that existed at December 31, 2008 when compared to the prior year.
Short-term borrowings
During 2008, repurchase agreements declined to $9,092,000 from $20,504,000 at December 31, 2007. At December 31, 2008 and 2007, sweep accounts represented 93% and 62%, respectively, of total repurchase agreements. The low interest rate environment had caused our customers to seek higher rates in alternative products and as such the balances in the term-repurchase agreements declined by about 91%.
Long-term debt
The weighted-average rate in effect on funds borrowed at December 31, 2008, was 5.35% compared to 5.26% as of December 31, 2007. The 2008 weighted-average rate was 92 basis points below the tax-equivalent yield of 6.27% on the Company’s portfolio of average interest-earning assets for the year ended December 31, 2008. Rates on $42,000,000 of the total long-term advances were fixed but would adjust quarterly had market rates increased beyond the issues’ original or strike rates. Significant prepayment penalties are attached to the borrowings which thereby created a significant disincentive from paying off the relatively high cost advances. However, in the event that the underlying market rates drifted above the rates that were paid on these borrowings, the FHLB rate would have converted to a floating rate and the Company would have had the option, at that time, to repay or to renegotiate the converted advance rate. During December 2008, a $10,000,000 capped floating-rate long-term advance was paid off early.
Investments
As of December 31, 2008 and December 31, 2007, the aggregate fair value of securities HTM exceeded their respective aggregate amortized cost by $31,000 and $33,000, respectively. Total investments decreased $38,797,000 in 2008, including an $11,893,000 decline in the market value of AFS investments. During 2008, the Company sold approximately $48.4 million of MBS – GSE residential and Agency – GSE securities, the proceeds of which were used to pay-down long-term debt, fund loan growth and fund the expansion of the Company’s branch network. The carrying value of investment securities, at December 31, 2008, was $84,188,000, or 15% of total assets compared to $122,984,000, or 21%, as of December 31, 2007.
The tax-equivalent yield on debt securities by stated maturity date at December 31, 2008, was as follows:
| | | One year | | | One through | | | Five through | | | More than | | | | |
| | | or less | | | five years | | | ten years | | | ten years | | | Total | |
| Agency - GSE | | | - | % | | | - | % | | | 5.07 | % | | | 5.87 | % | | | 5.74 | % |
| MBS - GSE residential | | | - | | | | - | | | | 6.01 | | | | 5.44 | | | | 5.45 | |
| State & municipal subdivisions | | | - | | | | - | | | | 5.47 | | | | 5.90 | | | | 5.83 | |
| Pooled trust preferred securities | | | - | | | | - | | | | - | | | | 4.00 | | | | 4.00 | |
| Total debt securities | | | - | % | | | - | % | | | 5.21 | % | | | 5.35 | % | | | 5.34 | % |
Loans and leases
Gross loans and leases increased $14,704,000, or 3%, from $426,249,000 at December 31, 2007, to $440,953,000 at December 31, 2008. Gross loans represented 77% and 73% of total assets at December 31, 2008 and December 31, 2007, respectively.
In 2008, the Company originated $47,864,000 of commercial loans, $23,111,000 of residential mortgage loans and $21,354,000 of consumer loans. This compares to $32,919,000, $24,032,000 and $28,062,000, respectively, in 2007. Included in mortgage loans is $9,476,000 of real estate construction lines in 2008 and $12,515,000 in 2007. In addition for 2008, the Company originated lines of credit in the amounts of $50,664,000 for commercial borrowers and $11,866,000 in home equity and other consumer lines of credit.
The Company’s origination activity increased 9% in 2008 over 2007 despite operating in a very difficult economy. Only the residential real estate portfolio recorded a decline compared to 2007 which was more than offset by growth in commercial lending. A new senior lender was hired which enabled the Company to grow its commercial and CRE portfolio.
Commercial and Commercial Real Estate Loans:
Originations in commercial and commercial real estate were relatively strong, as they fully exceeded scheduled principal curtailments and pre-payments, which thereby resulted in a commercial loan increase of $29,422,000 to $245,480,000 from $216,058,000, or 14% during 2008. During most of 2008, the Company bolstered the origination activities in the commercial loan business. Commercial lending successfully restructured its team of commercial loan officers led by the experienced newly hired senior lender. This team had effectively penetrated our markets and successfully developed new business relationships and re-kindled relationships with our existing commercial customer base.
Residential Real Estate Loans:
Residential real estate loans declined $18,468,000, or 16%, to $98,511,000 in 2008. In the beginning of 2008, the Company transferred approximately $28,103,000 to the loans AFS portfolio. The loans were subsequently sold. Excluding this transfer, the residential real estate loan portfolio would have grown $6,900,000 as origination activity exceeded maturities and pay-downs.
Consumer Loans:
Though consumer loan originations were lower in 2008 compared to 2007, this sector increased $3,093,000, or 4%, during the year. The increase was mainly from lower principal pay-downs and increased draw activity from customers who accessed their home equity available credit. During 2008, the Company established a new relationship with a local automobile dealership which provided increased origination activity in consumer lending.
Real Estate Construction Loans:
Real estate construction loans increased $724,000, or 7%, at December 31, 2008 compared to December 31, 2007. The increase in 2008 was caused by more commercial construction projects that had not yet converted to permanent financing.
Loans available-for-sale
Loans AFS at December 31, 2008 were $84,000 with a corresponding fair value of $85,000 compared to $827,000 and $843,000, respectively, at December 31, 2007. During 2008, residential mortgages with principal balances of $46,969,000 were sold into the secondary market and recognized net gains of approximately $261,000. Included in the sale were $28,103,000 of residential loans transferred from the loan and lease portfolio.
At December 31, 2008 and 2007, the servicing portfolio balance of sold residential mortgage loans was $95,856,000 and $61,023,000, respectively.
Allowance for loan losses
Total charge-offs, net of recoveries, for the year ended December 31, 2008, were $1,019,000, compared to $560,000 in 2007. The majority of the increase occurred in the commercial portfolio and was attributable to non-performing loan dispositions and write-downs before transfers to ORE. Combined consumer loan and lease financing net charge-offs increased from $237,000 at December 31, 2007 to $320,000 through December 31, 2008. Commercial loan net charge-offs were $358,000 for the year 2007 compared to $654,000 for 2008. Mortgage loans showed net charge-offs of $45,000 in 2008 compared to net recoveries of $35,000 in 2007.
Non-performing assets
The majority of non-performing assets for the period were attributed to non-accruing commercial business loans and non-accruing real estate loans in the process of foreclosure. Most of these loans were collateralized, thereby mitigating the Company’s potential for loss. In 2007, non-performing loans were $3,837,000 compared to $4,097,000 at year-end 2008. There were no repossessed assets at December 31, 2008 or 2007. ORE at December 31, 2008 consisted of four properties of which one had an agreement to sell pending at that time. ORE at year-end 2007 consisted of one property which was subsequently sold. The Special Assets Committee had developed specific action plans for each of the Company’s non-performing loans. During 2008, several of those plans were brought to a conclusion resulting in repayments of non-performing loans. The non-accrual loans aggregated $3,493,000 at December 31, 2008, a reduction of $318,000 from year-end 2007. During 2008, approximately $4,946,000 of loans were placed in non-accrual status. These were partially offset by reductions or payoffs of $2,426,000, charge-offs of $916,000, $1,562,000 of transfers to ORE and $360,000 of loans that returned to performing status. Loans past due 90 days or more and accruing totaled $604,000 at December 31, 2008 compared to $26,000, at December 31, 2007. The majority of the increase was attributable to one residential mortgage migrating to the over 90 day category. Non-accrual loans were reduced by 8% to $3,493,000. The ORE balance rose from $107,000 to $1,450,000. This sizeable increase was a result of the collections process as the collateral securing non-accruing loans was taken in the foreclosure process. These three items comprise the non-performing assets of $5,548,000 at December 31, 2008. The percentage of non-performing assets to total assets was 0.96% at December 31, 2008, an increase from 0.67% at December 31, 2007, primarily due to the aforementioned ORE increase. Non-performing loans to net loans were 0.94% at December 31, 2008, and 0.91% at December 31, 2007. The 30-89 day past due loans at December 31, 2008 were $1,858,000 reduced from $4,698,000 at December 31, 2007. Contributing to the reduction was the repayment of previously delinquent loans and others which had been brought current.
During 2008, the Company collected approximately $311,000 of interest income recognized on the cash basis. If the non-accrual loans that were outstanding as of December 31, 2008 had been performing in accordance with their original terms, the Company would have recognized interest income with respect to such loans of $250,000 for the year ended December 31, 2008.
Bank premises and equipment, net
Net of accumulated depreciation and disposals, premises and equipment increased $3,091,000. During 2008, the Company purchased or transferred from construction in process approximately $4,489,000 compared to $3,293,000 in 2007. The increase was principally from the construction and completion of the Company’s West Scranton branch expansion project.
Foreclosed assets held-for-sale
Other real estate owned
ORE was $1,451,000 at December 31, 2008 consisting of four properties, one of which was under an agreement to be sold. The three remaining properties were listed for sale with a realtor. The one residential property which was owned at year end 2007 was sold.
Other assets
Other assets more than doubled in 2008 to $8,930,000 compared to 2007. The increase was caused predominately by the increase in the net deferred tax asset of $4,046,000 as a result of additional unrealized losses in the securities AFS portfolio. Also contributing to the increase in other assets was an increase in the fair value of the Company’s derivative contract.
Results of Operations
Earnings Summary
Net income for the year ended December 31, 2008 was $3,636,000, compared to $4,612,000 for the year ended December 31, 2007. During the same periods, diluted earnings per common share was $1.76 and $2.23, respectively. For the year ended December 31, 2008, the Company’s return on average assets (ROA) and return on average shareholders’ equity (ROE) were 0.62% and 6.81% compared to 0.80% and 8.65%, respectively, for the year ended December 31, 2007. 2008 included a non-operating, non-cash, after-tax charge of $288,000 related to an other-than-temporary impairment (OTTI) in the Company’s security AFS portfolio that did not occur in 2007. In addition, during 2008, the Company recorded a provision for loan losses in the amount of $940,000 compared to a credit for loan losses of $60,000 in 2007. The provision for loan losses in 2008 was recorded in anticipation of credit quality deterioration ensuing from accelerated declines in economic conditions during the fourth quarter of 2008, in addition to growth in the commercial loan portfolio. Further contributing to the lower net income were lower non-interest interest income and higher non-interest expenses. These items were partially offset by an improvement in net interest income of $1,658,000, or 9%, to $19,277,000 in 2008 compared to $17,619,000 in 2007. The decline in ROA and ROE was caused by the decrease in net income.
Net interest income
The slope of the yield curve
has returned to a more normal, positive slope in 2008 compared to 2007, but at unprecedented low levels. In several efforts to stimulate a recessing economy, the FOMC reduced short-term interest rates seven times during 2008, in intervals ranging from 25 to 75 basis points, sometimes occurring twice in a single month. In response to these actions, the national prime rate also decreased during 2008. National prime, the benchmark rate banks use to set rates on various lending and other interest sensitive products, decreased seven times for a total decrease of 400 basis points from 7.25% at December 31, 2007 to 3.25% at December 31, 2008.
As a result of the short-term rate reductions, the yield curve has become positively sloped thereby resulting in opportunities for the Company to improve its net interest margin. However, operating in a very low, highly volatile interest rate environment will also present challenges in the coming year.While national prime decreased 400 basis points, the weighted-average national prime rate decreased to 5.09% in 2008 compared to 8.05% in 2007. The effect of this average decrease
has beenwas to exert extreme downward pressure on yields of the Company’s interest-earning assets. With rate cutting beginning in January 2008, this pressure existed with increasing momentum throughout all of 2008. The Company was able to more than offset this pressure by periodically adjusting rates on its interest-bearing deposits.
In response to the swift downward shift in rates, the Company’s asset liability committee assessed, among other things, the impact the interest rate movements have had on its earning assets. Where necessary, rate adjustments to interest-bearing deposit and repurchase agreements were implemented and wholesale funding sources were utilized, all
of which helped minimize the effect rate changes
have had on net interest income. The
Company’s ALM committee
meetsmet frequently and
has successfully implemented rate setting strategies to mitigate the interest rate risk inherent in the balance sheet and
has beenwas able to preserve its net interest margin while always mindful of our customers’ needs.
31
Table of Contents
As market rates fall along with national prime, loan originations, renewing commercial and residential loans and lines of credit should price belowexpected the average 2008 portfolio yields. In addition, the decrease in the Treasury yields and other capital market rates, which largely began during the second half of 2008, could continue to have an unfavorable impact on the Company’s total 2009 investment portfolio yield. The relative and predominantly lower interest rate environment of 2008 continued to have a negative impact on the Company’s interest-earning assets. Total interest income declined 4%, or $1,318,000 from $35,279,000 in 2007 to $33,961,000in$33,961,000 in 2008 and further caused the tax-equivalent yield on earning assets to decrease 32 basis points. The Company should continue to experience a period of sliding yields on its interest-earning assets during 2009, and in what appears to be a prolonged low interest rate environment.
Interest expense decreased $2,976,000, or 17%, from $17,660,000 in 2007 to $14,684,000 in 2008. The fast-falling, lower interest rate environment that was prevalent throughout most of 2008, required the Company to periodically reduce offering rates on both its deposit and repurchase agreement products. Though the Company recorded a net increase in average interest-bearing liabilities, due to deposit growth, interest expense on deposits declined by almost $3,000,000 in 2008 compared to 2007 caused by a 77 basis point decline on rates paid. The effect of the $15,713,000 increase in average interest-bearing deposits was an additional $692,000 in interest expense. In an effort to maintain reasonable interest rate spreads to its earning-assets, throughout 2008 the Company’s asset / liability committee has reduced rates paid on CDs as well as rates paid on transactional deposits. Rates on CD’s should naturally price lower as they mature. However, whether or not the Company can continue to reduce rates on transaction deposits that are currently priced at unprecedented low levels to maintain its interest rate spread will be predicated on the interest rate environment, liquidity position and competition. Interest expense on borrowings, including repurchase agreements, declined $724,000 during 2008, mostly from lower rates.
The resulting performance
As a result of the mix of the Company’s interest-sensitive assets and liabilities and the varying effects the severity of the yield curve slope
has had during 2008, net interest income increased $1,658,000, or 9%, from $17,619,000 in 2007 to $19,277,000 in 2008. On a tax-equivalent basis, the net interest rate spread increased 43 basis points from 2.64% to 3.07% and the tax-equivalent margin improved 26 basis points, from 3.34% in 2007 to 3.60% in 2008, respectively. The improvement in spread and margin were due largely to lower rates paid on interest-bearing liabilities and more net interest income.
Provision for loan losses
The provision for loan losses represents the necessary amount to charge against current earnings, the purpose of which is to increase the allowance for loan losses to a level that represents management’s best estimate of known and inherent losses in the Company’s loan portfolio. Loans and leases determined to be uncollectible are charged-off against the allowance for loan losses. The required amount of the provision for loan losses, based upon the adequate level of the allowance for loan losses, is subject to ongoing analysis of the loan portfolio. The Company’s Special Asset Committee meets periodically to review problem loans and leases. The committee is comprised of management, including the chief risk officer, loan workout officers and collection personnel. The committee reports quarterly to the Credit Administration Committee of the Board of Directors.
Management continuously reviews the risks inherent in the loan and lease portfolio. Specific factors used to evaluate the adequacy of the loan loss provision during the formal process include:
· specific loans that could have loss potential;
· levels of and trends in delinquencies and non-accrual loans;
· levels of and trends in charge-offs and recoveries;
· trends in volume and terms of loans;
· changes in risk selection and underwriting standards;
· changes in lending policies, procedures and practices;
· experience, ability and depth of lending management;
· national and local economic trends and conditions; and
· changes in credit concentrations.
Provisions for loan losses of $940,000 were made for the year ended December 31, 2008. In 2007, the Company did not need to make provisions and reduced the allowance for loan losses due to a reduced level of internally criticized and classified loans. The $940,000 provision for loan losses was recorded for anticipated credit quality deterioration, ensuing from accelerated declines in economic conditions during the fourth quarter of 2008, together with providing for over $30 million of
commercial loan growth throughout 2008. The provision increase occurred to reinforce and fund the allowance for loan losses balance as of December 31, 2008 to safeguard against possible future losses. The allowance for loan losses was $4,745,000 at December 31, 2008, and was $4,824,000 at December 31, 2007.
32
For the year ended December 31, 2008, total other income was $4,578,000, $627,000, or 12% less than the $5,205,000 recorded during the year ended December 31, 2007. In 2008, a non-cash OTTI charge of $436,000 was recorded. There was no similar charge in 2007. The OTTI charge
iswas related to the Company’s investment in a pooled preferred term security and a common stock equity position in FNMA. The carrying values of these securities were written down to their fair values during the third and fourth quarters
of 2008 as management
hashad deemed the impairment to be other-than-temporary. Service charges on deposit related accounts declined $106,000, or 4%, in 2008 compared to 2007. Most of this decline was the result of lower volumes of overdraft transactions. During 2008, the Company recorded net losses from the disposal of premises and equipment of $36,000 compared to net gains of $98,000 recorded in 2007, or an adverse impact of approximately $134,000. The loss in 2008 was from the disposal of unused, obsolete capital equipment while in 2007 gains included the sales of two commercial facilities previously leased to non-related third parties. Further contributing to the non-interest income decline in 2008 were the gains recorded
formfrom the sale of foreclosed properties in 2007 of $144,000 compared to $43,000 in 2008. Partially offsetting these adverse changes in non-interest income were: $101,000 more gains from the sales of residential mortgages into the secondary market; fees earned from the Company’s trust services business and an increase in the cash surrender value of BOLI.
In 2009, the Company projects continued decline in service fees from deposit accounts, which in 2008 declined by nearly 4% from 2007, as the expectation there will be an even lower volume of overdraft transactions. In the current environment, it is difficult to determine whether this trend will continue.
For the year ended December 31, 2008, other operating expenses grew $1,574,000, or 9%, from $16,637,000 for the year ended December 31, 2007. Merit and performance-based incentive increases, branch expansion and the related employee benefits, health care, and wider participation in the Company’s 401(k) plan caused salaries and employee benefit costs to rise $1,164,000, or 13%, for the twelve months ended December 31, 2008 compared to the same period in 2007.
Higher occupancyOccupancy related expenses, a component of premises and equipment, increased $95,000, or 3%, due to a full year of depreciation and amortization on the Green Ridge branch relocation and the 2008 opening of the West Scranton branch. Branch expansion activities also included more advertising and marketing, up $33,000, or 5%, and other increased overhead including: office supplies, postage, data processing and FDIC premiums. Other expenses
were also increased by higher collection and ORE expenses associated with more legal and foreclosure costs.
As the Company enters 2009, management expects certain expenses to rise over and above normal expected inflationary increases. In 2009, the West Scranton branch will reflect a full year of operational expenses. For example occupancy related costs could amount to $230,000 more in 2009 than in 2008.
The
Company’s FDIC premium, which grew 1.5 times the 2007 level, will significantly increase even further, by increased premiums and also from the Company’s decision to voluntarily participate in the Temporary Liquidity Guarantee Program (TLGP). The Company anticipates up to $300,000 of additional premiums, but cannot quantify the effect of the TLGP premium impact as it will be determined by depositor sentiment for mitigating their personal risk.In late February 2009, the FDIC voted to impose a special assessment of 20 basis points on all FDIC-insured banks to be collected on September 30, 2009. The Company anticipates that the special assessment will adversely affect earning by approximately $900,000 based on our current federally-insured deposit amounts. Furthermore, the FDIC has the authority, after June 30, 2009, to impose an additional 10 basis point emergency special assessment on all FDIC-insured banks if it estimates the reserve ratio of the Deposit Insurance Fund will fall to a level that it believes would adversely affect public confidence or to a level which would be close to zero or negative at the end of a calendar quarter. At this time we cannot estimate the probability of this event; however, any additional FDIC assessment and/or premium would be adverse to our 2009 earnings.
The ratioratios of non-interest expense less non-interest income (expense ratio) to average assets (expense ratio) at December 31, 2008 and 2007 waswere 2.25% and 2.01%, respectively. The overhead expense ratio of the Company drifted upward due to higher non-interest expenses.
Provision for income taxes
Income before provision for income taxes in 2008 decreased $1,543,000 from 2007. The effective federal income tax rate was 22.7% and 26.2% for the years ending December 31, 2008 and 2007, respectively. The decrease in the effective tax rate is attributable to the decrease in pre-tax income.
33
Table of Contents
Comparison of Financial Condition as of December 31, 2007
and 2006 and Results of Operations for each of the Years then Ended
Financial Condition
Overview
Consolidated assets increased $25,095,000, or 4%, during the year ended December 31, 2007 to $587,413,000. The increase resulted from increases in total deposits of $15,374,000, total borrowings of $6,173,000 and total shareholders’ equity of $3,579,000. During 2007, the carrying values of the investment and loan portfolios increased $22,573,000 and $4,931,000, respectively, while premises and equipment, net plus construction in process, a component of other assets in the consolidated balance sheet, increased $1,287,000. Cash decreased $3,392,000 since December 31, 2006.
Deposits
Total deposits increased $15,373,000, or 4%, during 2007 to $425,708,000. The growth in deposits was from increases in money market and certificate of deposit accounts of $15,533,000 and $24,389,000, or 21% and 16%, respectively, partially offset by declines in NOW, savings and DDAs of $10,427,000, $5,176,000 and $8,946,000, respectively. Certificate of deposit accounts continued to grow as customers locked in rates during the declining interest rate environment. The increase in money market accounts, net of the decline in savings and club accounts, was from success in our deposit-gathering strategies in conjunction with promotional interest rates tailored to depositors’ needs. DDAs decreased 12% compared to December 31, 2006; however, management believed this outflow was related to customer transaction timing and therefore temporary rather than permanent.
Short-term borrowings
During 2007, repurchase agreements declined to $20,504,000 from $22,224,000 at December 31, 2006. At December 31, 2007 and 2006, sweep accounts represented 62% and 70%, respectively, of total repurchase agreements. Investment security pre-refunding strategies and late-year deposit outflow resulted in an increase in overnight borrowings of $8,555,000 as of December 31, 2007 compared to December 31, 2006.
Long-term debt
The weighted-average rate in effect on funds borrowed at December 31, 2007, was 5.26% compared to 5.15% as of December 31, 2006. The 2007 weighted-average rate was 133 basis points below the tax-equivalent yield of 6.59% on average earning assets for the year ended December 31, 2007. Rates on $42,000,000 of the total long-term advances are fixed but will adjust quarterly should market rates increase beyond the issues’ original or strike rates. As of December 31, 2007, the weighted-average rate on this convertible debt was 5.35%. To help reduce the Company’s reliance on overnight funding, during 2007 $16,000,000 of advances that had matured or converted, and carried a weighted-average interest rate of 4.78%, were replaced with fixed- and capped floating-rate advances. The new advances aggregated $20,000,000 that mature in 2009 and carried an initial weighted-average interest rate of 5.40%. As of December 31, 2007, the weighted-average interest rate on these advances amounted to 5.13%.
Investments
As of December 31, 2007 and December 31, 2006, the aggregate fair value of securities HTM exceeded their respective aggregate amortized cost by $33,000 and $29,000, respectively. Total investments increased $22,574,000, net of a $23,000 decline in the market value of AFS investments. The increase in the investment portfolio during 2007 was the result of investing excess liquidity stemming from deposit inflows and late-year overnight borrowings used as a pre-refunding strategy. The carrying value of investment securities, at December 31, 2007, was $122,984,000, or 21%, of total assets compared to $100,411,000, or 18%, as of December 31, 2006. Mortgage-backed securities, which amortize and provide monthly cash flow, continue to dominate the composition of the total investment portfolio representing 48% at December 31, 2007, compared to 43% at December 31, 2006.
34
Table of Contents
The tax-equivalent yield on debt securities by stated maturity date at December 31, 2007, is as follows:
| | One year | | One through | | Five through | | More than | | | |
| | or less | | five years | | ten years | | ten years | | Total | |
U.S. government agencies | | 3.00 | % | | 4.83 | % | | 4.90 | % | | 5.99 | % | | 5.25 | % | |
Mortgage-backed securities | | 6.00 | | | 4.11 | | | 4.32 | | | 5.22 | | | 5.06 | | |
State & municipal subdivisions | | — | | | — | | | 5.55 | | | 5.71 | | | 5.69 | | |
Preferred term securities | | — | | | — | | | — | | | 6.25 | | | 6.25 | | |
Total debt securities | | 3.05 | % | | 4.54 | % | | 4.78 | % | | 5.59 | % | | 5.34 | % | |
Loans and leases
Gross loans and leases increased $3,606,000, or 1%, from $422,643,000 at December 31, 2006, to $426,249,000 at December 31, 2007. Gross loans represented 73% and 75% of total assets at December 31, 2007 and December 31, 2006, respectively.
In 2007, the Company originated $32,919,000 of commercial loans, $24,032,000 of residential mortgage loans and $28,062,000 of consumer loans. This compares to $17,152,000, $21,431,000 and $29,565,000, respectively, in 2006. Included in mortgage loans is $12,515,000 of real estate construction lines in 2007 and $11,111,000 in 2006. In addition for 2007, the Company originated lines of credit in the amounts of $18,564,000 for commercial borrowers and $6,296,000 in home equity and other consumer lines of credit.
Though loan originations increased in 2007 compared to 2006, and despite operating in an overall higher interest rate environment, payoffs and pay-downs were high in 2007 almost offsetting the originations. As a result, there was only a subtle increase in the loan portfolio.
Commercial and Commercial Real Estate Loans:
Though commercial and commercial real estate (CRE) originations were relatively strong, they were fully offset by scheduled principal curtailments and pre-payments, thereby resulting in a commercial loan decline of $2,155,000 to $216,058,000 from $218,213,000, or almost 1% during 2007. The Company hired a new senior lender and had restructured its existing team of commercial loan officers to better serve our existing customer base and strategically penetrate the markets for new business relationships.
Residential Real Estate Loans:
Residential real estate loans increased $4,235,000, or 4%, to $116,978,000 in 2007. Though operating in a higher interest rate environment, which tends to reduce the level of prepayment and refinance activity, the Company was able to continue to grow its residential real estate loan portfolio on the strength of its very dedicated staff of loan originators and transfers of construction loans to permanent financing.
Consumer Loans:
Consumer loans increased $4,269,000, or 6%, during 2007. The increase in this sector is mainly from less refinance and payoff activity caused by a relatively higher interest rate environment. This enabled the portfolio to grow despite a minor decline in loan originations.
Real Estate Construction Loans:
Real estate construction loans decreased by $2,666,000, or 20%, at December 31, 2007 compared to December 31, 2006. The decline in 2007 was caused by more residential construction loans converting to permanent mortgage loans; however, both categories remain strong.
Direct Financing Leases:
The balance represents tax-free leasing arrangements provided to municipal customers. For 2007, the activity represents scheduled run-off.
35
Table of Contents
Loans available-for-sale
Loans AFS at December 31, 2007, were $827,000, with a corresponding fair value of $843,000 compared to $122,000 and $123,000, respectively, at December 31, 2006. During 2007, residential mortgages and student loans with principal balances of $16,210,000 and $57,000, respectively, were sold into the secondary market and combined gains of approximately $159,000 were recognized. There were no sold SBA loans during 2007.
At December 31, 2007 and 2006, the servicing portfolio balance of sold residential mortgage loans was $61,023,000 and $53,112,000, respectively.
Allowance for loan losses
Total charge-offs, net of recoveries, for the year ended December 31, 2007, were $560,000, compared to $865,000 in 2006. Combined consumer loan and lease financing net charge-offs increased slightly from $161,000 at December 31, 2006 to $237,000 through December 31, 2007. Commercial loan net charge-offs were $597,000 for the year 2006 compared to $357,000 for 2007. Mortgage loans showed net recoveries of $35,000 in 2007 compared to net charge-offs of $108,000 in 2006. This reversal from net mortgage charge-offs in 2006 to net recoveries in 2007 was the result of recording one large mortgage loan recovery of $107,000 on a loan which had been charged-off in a prior year.
Non-performing assets
The majority of non-performing assets for the period was attributed to non-accruing commercial business loans and non-accruing real estate loans in the process of foreclosure. Most of these loans were collateralized, thereby mitigating the Company’s potential for loss. In 2006, non-performing loans were $3,439,000 compared to $3,837,000 at year-end 2007. There were no repossessed assets at December 31, 2007 or 2006. ORE at December 31, 2007 consisted of one property which had an agreement to sell pending. At year-end 2006, five residential properties were owned, all of which were sold. The Special Assets Department had developed specific action plans for each of the Company’s non-performing loans. During 2007, many of those plans came to a conclusion resulting in repayments of non-performing loans. The non-accrual loans aggregated $3,811,000 at December 31, 2007, an increase of $453,000 from year-end 2006. During 2007 approximately $3,075,000 of loans were placed in non-accrual status. These were partially offset by payoffs or pay-downs of $1,888,000, charge-offs of $236,000, $352,000 in transfers to ORE and $146,000 of loans that returned to performing status. Loans past due 90 days or more and accruing declined 68%, to $26,000, at December 31, 2007. The non-accrual loans rose by 14 % to $3,811,000 and ORE declined by 46 % to $107,000. These three items comprise the non-performing assets of $3,944,000. The percentage of non-performing assets to total assets was 0.67% at December 31, 2007, a minor change from 0.65% at December 31, 2006. Non-performing loans to net loans were 0.91% at December 31, 2007, and 0.82% at December 31, 2006.
During 2007, the Company collected $93,000 of interest income recognized on the cash basis. If the non-accrual loans that were outstanding as of December 31, 2007 had been performing in accordance with their original terms, the Company would have recognized interest income with respect to such loans of $391,000 for the year ended December 31, 2007.
Bank premises and equipment, net
Net of accumulated depreciation and disposals, premises and equipment increased $1,640,467. During 2007, the Company purchased or transferred from construction in process approximately $3,293,000 compared to $852,000 in 2006. The increase was principally from the completion of the Company’s Green Ridge branch relocation construction project.
Foreclosedassets held-for-sale
Other Real Estate Owned
ORE was $107,000 at December 31, 2007 consisting of one property, the sale of which is pending. The five residential properties which were owned at year end 2006 have all been sold.
Other assets
The decrease in other assets of $384,000, or 8%, from December 31, 2006 was due mostly to the reduction of capitalized interim construction costs for the Company’s branch expansion and other projects and a decrease in the net deferred tax asset, partially offset by an increase in the market value of the Company’s derivative contract. See Note 10, “Income Taxes,” for an analysis of the net deferred tax asset. For a further discussion on the Company’s derivative contract, see Note 1, “Nature
36
Table of Contents
of operations and summary of significant accounting policies,” and Note 12, “Fair value of financial instruments and derivatives,” contained within the notes to consolidated financial statements in Part II, Item 8.
Results of Operations
Earnings Summary
Net income for the year ended December 31, 2007 was $4,612,000, compared to $4,125,000 for the year ended December 31, 2006. During the same periods, diluted earnings per common share was $2.23 and $2.01, respectively. For the year ended December 31, 2007, the Company’s ROA and ROE were 0.80% and 8.65%, respectively, compared to 0.73% and 8.31% for the year ended December 31, 2006. The improvement in net income was primarily from a 3%, or $451,000, increase in net interest income, a 15%, or $683,000, rise in non-interest income, partially offset be a 5%, or $758,000, increase in operating expenses. Also contributing to the improvement was a credit for loan losses of $60,000 during the twelve months ended December 31, 2007 compared to a provision of $325,000 in 2006. The improvement in ROA and ROE was largely due to the improvement in net income.
Net interest income
The slope of the yield curve, which became inverted, or negatively sloped in 2006, had returned to a more normal, positive slope in 2007. An inverted yield curve presents challenges to banks because short-term rates are higher than long-term rates which tends to compress net interest income because deposit and borrowing terms are generally shorter than investment and loan terms. The FOMC reduced short-term interest rates three times during the second half of 2007. In response to these actions, national prime also decreased during 2007. National prime also decreased three times for a total decrease of 100 basis points from 8.25% at December 31, 2006 to 7.25% at December 31, 2007. As a result of the rate reductions, the yield curve had become more positively sloped thereby provided opportunities for the Company to bolster its net interest margin.
Though national prime decreased 100 basis points, the weighted-average national prime rate increased to 8.05% in 2007 compared to 7.96% in 2006. This phenomenon was caused by the first rate reduction occurring well into the third quarter. Thus, most of 2007 consisted of market rates that existed at the year-end 2006 level. The effect of this average increase pressured rates paid on interest-bearing liabilities and was only marginally offset by the effect rates had on interest earning-assets.
As expected, the relative and predominantly higher interest rate environment during 2007 continued to have a positive influence on the Company’s interest-earning assets. Total interest income increased 5%, from $33,530,000 in 2006 to $35,279,000 in 2007 and further, caused the tax-equivalent yield on earning assets to increase 23 basis points. Interest expense increased $1,299,000, or 8%, from $16,361,000 in 2006 to $17,660,000 in 2007. The cost of interest-bearing liabilities increased 26 basis points in 2007. The higher interest rate environment that was prevalent throughout most of 2007, in conjunction with higher average interest-bearing deposit balances, necessitated the need for the Company to increase offering rates on its deposit products. As a result, interest expense on deposits increased $1,877,000 during 2007, of which approximately $1,362,000 was caused by a 38 basis point rise in average rates. Average balances in interest-bearing deposits increased by $15,610,000 during 2007, resulting in an additional $515,000 in expense. Interest expense on borrowings, including repurchase agreements, declined $578,000 during 2007, due almost entirely to lower average balances.
As a result of the mix of the Company’s interest-sensitive assets and liabilities and the varying effects the slope of the interest rate yield curve has had during 2007, net interest income increased $451,000, or 3%, from $17,168,000 in 2006 to $17,619,000 in 2007. On a tax-equivalent basis, the net interest rate spread declined 3 basis points from 2.67% to 2.64% and the tax-equivalent margin improved 3 basis points, from 3.31% in 2006 to 3.34% in 2007, respectively. The decrease in spread was due to a larger increase in rates paid on interest-bearing liabilities than the increase in yields from interest-earning assets. The margin improvement was from more net interest income in 2007 compared to 2006.
Provision for loan losses
A credit for loan losses of $60,000 was made to the allowance during 2007 compared to a provision for loan losses of $325,000 for the year ended December 31, 2006. In 2007, the Company did not need to make provisions and reduced the allowance for loan losses due to a reduced level of internally criticized and classified loans. These reductions occurred as a result of some adversely rated loans which were either upgraded in rating due to credit improvement or were repaid. The allowance for loan losses was $4,824,000 at December 31, 2007, compared to $5,444,000 at December 31, 2006. The reduced level of the allowance was due to the improved quality of the portfolio.
37
Table of Contents
Other income
For the year ended December 31, 2007, total other income was $5,205,000, an increase of $683,000, or 15%, from the $4,522,000 recorded during 2006. In 2007, the Company experienced growth in service charges on deposit accounts of $376,000, or 14%, and also recognized net gains of $144,000 from sales of foreclosed properties held-for-sale. An increase in overdraft charges was the principal reason for growth in deposit service charges. The significant gain from the sale of foreclosed properties was the result of excess collateral value compared to the carrying value. Further contributing to the increase in non-interest income were: increased sales activities of residential mortgages into the secondary market resulting in $62,000 more of gains compared to 2006; increases in BOLI earnings; higher revenue from financial services activities; and the disposal of premises and equipment that produced net gains of $98,000 in 2007 compared to net losses of $20,000 in 2006. Included in 2007 were the sales of two commercial facilities previously leased to non-related third parties.
Other expense
For the twelve months ended December 31, 2007, other operating expenses were $16,637,000 compared to $15,878,000 for the twelve months ended December 31, 2006, a $758,000 or 5% increase. Merit and performance-based incentive increases caused salary and employee benefit costs to rise $377,000, or 5%, for the twelve months ended December 31, 2007 compared to the same period in 2006. Advertising and marketing related expenses were up $144,000, or 27%, due to activities associated with the grand opening and relocation project of Company’s Green Ridge branch office. Other expenses increased $225,000, or 6%, in 2007 compared to 2006 caused by increased professional services, ATM expense and other branch related operating costs.
The expense ratio at December 31, 2007 and 2006 was 2.01% and 2.02%, respectively. The overhead expense ratio of the Company remained comparable to the Uniform Bank Performance Report peer comparison group ratio.
Provision for income taxes
Income before provision for income taxes in 2007 increased $760,000 from 2006. The effective federal income tax rate was 26.2% and 24.8% for the years ending December 31, 2007 and 2006, respectively. The increase in the effective tax rate is attributed to an increase in pre-tax income and a decrease in tax-free income.
Off-Balance Sheet Arrangements and Contractual Obligations
The Company is a party to financial instruments with off-balance sheet risk in the normal course of business in order to meet the financing needs of its customers and in connection with the overall interest rate management strategy. These instruments involve, to a varying degree, elements of credit, interest rate and liquidity risk. In accordance with GAAP, these instruments are either not recorded in the consolidated financial statements or are recorded in amounts that differ from the notional amounts. Such instruments primarily include lending commitments, lease obligations and derivative instruments. For a further discussion on the Company’s derivative instrument, see Note 1, “Nature of
operationsOperations and
summarySummary of
significant accounting policies,”Significant Accounting Policies”, and Note 12, “Fair
valueValue of
financial instrumentsFinancial Instruments and
derivatives,”Derivatives”, contained within the notes to consolidated financial statements in Part II, Item 8.
Lending commitments include commitments to originate loans and commitments to fund unused lines of credit. Commitments to extend credit are agreements to lend to a customer as long as there is no violation of any condition established in the contract. Commitments generally have fixed expiration dates or other termination clauses and may require payment of a fee. Since some of the commitments are expected to expire without being drawn upon, the total commitment amounts do not necessarily represent future cash requirements.
In addition to lending commitments, the Company has contractual obligations related to operating lease commitments. Operating lease commitments are obligations under various non-cancelable operating leases on buildings and land used for office space and banking purposes.
The following table presents, as of December 31,
2008,2009, the Company’s significant determinable contractual obligations and significant commitments by payment date. The payment amounts represent those amounts contractually due to the recipient, excluding interest (dollars in thousands):
38
| | | | | | Over one | | | Over three | | | | | | | |
| | | One year | | | year through | | | years through | | | Over | | | | |
| | | or less | | | three years | | | five years | | | five years | | | Total | |
| Contractual obligations: | | | | | | | | | | | | | | | |
| Certificates of deposit * | | $ | 81,854 | | | $ | 54,794 | | | $ | 10,015 | | | $ | 1,587 | | | $ | 148,250 | |
| Long-term debt | | | 11,000 | | | | 5,000 | | | | - | | | | 16,000 | | | | 32,000 | |
| Repurchase agreements | | | 7,747 | | | | - | | | | - | | | | - | | | | 7,747 | |
| Operating leases | | | 357 | | | | 695 | | | | 670 | | | | 3,493 | | | | 5,215 | |
| | | | | | | | | | | | | | | | | | | | | |
| Significant commitments: | | | | | | | | | | | | | | | | | | | | |
| Letters of credit | | | 2,169 | | | | 6,105 | | | | - | | | | 772 | | | | 9,046 | |
| Loan commitments ** | | | 17,652 | | | | - | | | | - | | | | - | | | | 17,652 | |
| | | | | | | | | | | | | | | | | | | | | |
| Total | | $ | 120,779 | | | $ | 66,594 | | | $ | 10,685 | | | $ | 21,852 | | | $ | 219,910 | |
Table of Contents
| | | | Over one | | Over three | | | | | |
| | One year | | year through | | years through | | Over | | | |
| | or less | | three years | | five years | | five years | | Total | |
| | | | | | | | | | | |
Contractual obligations: | | | | | | | | | | | |
Certificates of deposit | | $ | 138,896 | | $ | 29,544 | | $ | 4,433 | | $ | 808 | | $ | 173,681 | |
Long-term debt | | 10,000 | | 21,000 | | 5,000 | | 16,000 | | 52,000 | |
Repurchase agreements | | 11,412 | | — | | — | | — | | 11,412 | |
Operating leases | | 368 | | 666 | | 682 | | 3,844 | | 5,560 | |
| | | | | | | | | | | |
Significant commitments: | | | | | | | | | | | |
Letters of credit | | 2,053 | | 1,190 | | — | | 725 | | 3,968 | |
Loan commitments* | | 25,613 | | — | | — | | — | | 25,613 | |
| | | | | | | | | | | |
Total | | $ | 188,342 | | $ | 52,400 | | $ | 10,115 | | $ | 21,377 | | $ | 272,234 | |
*Available credit to borrowers in the amount of $68,379 is excluded from the above table since, by its nature, the borrowers may not have the need for additional funding, and, therefore, the credit may or may not be disbursed by the Company.
| * | Includes certificates in the CDARS program. |
| ** | Available credit to borrowers in the amount of $61,713 is excluded from the above table since, by its nature, the borrowers may not have the need for additional funding, and, therefore, the credit may or may not be disbursed by the Company. |
Related Party Transactions
Information with respect to related parties is contained in Note 15, “Related
party transactions,”Party Transactions”, within the notes to the consolidated financial statements, and incorporated by reference in Part II, Item 8.
Impact of Accounting Standards and Interpretations
Information with respect to the impact of accounting standards is contained in Note 18, “Recent
accounting pronouncements,”Accounting Pronouncements”, within the notes to the consolidated financial statements, and incorporated by reference in Part II, Item 8.
Impact of Inflation and Changing Prices
The consolidated financial statements and notes thereto presented herein have been prepared in accordance with GAAP, which requires the measurement of the Company’s financial condition and results of operations in terms of historical dollars without considering the changes in the relative purchasing power of money over time due to inflation. The impact of inflation is reflected in the increased cost of our operations. Unlike industrial businesses, most all of the Company’s assets and liabilities are monetary in nature. As a result, interest rates have a greater impact on our performance than do the effects of general levels of inflation as interest rates do not necessarily move in the same direction or, to the same extent, as the price of goods and services.
The Company is subject to various regulatory capital requirements administered by the federal banking agencies. Failure to meet minimum capital requirements can initiate certain mandatory and possible additional discretionary actions by regulators that, if undertaken, could have a direct material effect on the Company’s financial statements. Under capital adequacy guidelines and the regulatory framework for prompt corrective action, the Company must meet specific capital guidelines that involve quantitative measures of the Company’s assets, liabilities and certain off-balance-sheet items as calculated under regulatory accounting practices. The Company’s capital amounts and classification are also subject to qualitative judgments by the regulators about components, risk-weightings and other factors.
Under these guidelines, assets and certain off-balance sheet items are assigned to broad risk categories, each with prescribed risk weightings.
The appropriate risk-weighting, pursuant to regulatory guidelines, required an increase in the weights applied to securities that are rated below investment grade, thereby inflating the total risk-weighted assets. The resulting capital ratios represent capital as a percentage of total risk-weighted assets and certain off-balance sheet items. The guidelines require all banks and bank holding companies to maintain a minimum ratio of total risk-based capital to total risk-weighted assets (Total Risk Adjusted Capital) of 8%, including Tier I capital to total risk-weighted assets (Tier I Capital) of 4% and Tier I capital to average total assets (Leverage Ratio) of at least 4%. Additional information with respect to capital requirements is contained in Note 14, “Regulatory
matters,”Matters”, within the notes to the consolidated financial statements, and incorporated by reference in Part II, Item 8.
In October 2008, the U.S. Department of Treasury (Treasury), the Board of Governors of the Federal Reserve System (FRB) and the FDIC issued a joint statement announcing a voluntary capital purchase program where the Treasury will purchase
39
Table of Contents
senior preferred stock of certain financial institutions. The Treasury had allocated $250 billion under the Troubled Asset Relief Program (TARP) created under the Economic Stabilization Act of 2008 (ESSA) to purchase senior preferred stock in banks through the Capital Purchase Program. The Company received preliminary approval from the U.S. Treasury Department to participate in the TARP, however because of the Company’s strong capital position, the Company has decided not to participate as the effect of accepting the program was determined to not be in the best interest of the Company’s shareholders. At December 31, 2008, the Company’s total risk-based capital ratio was 13.6%, Tier 1 risk-based ratio was 12.6% and its leverage ratio was 9.9%. The Company currently exceeds the regulatory guidelines with the Company’s capital adequacy levels above the “well-capitalized” regulatory requirements.
During the second quarter of 2008, the Company’s Board of Directors announced its intent to initiate a capital stock repurchase program covering up to 50,000 shares of its outstanding capital stock. The repurchased shares would become treasury stock and could be available for issuance under the Company’s various stock-based compensation, employee stock purchase and dividend reinvestment (DRP) plans and for general corporate purposes. The repurchases willmay be made from time-to-time in open-market transactions, subject to availability, pursuant to safe harbor rule 10b-18 under the Securities Exchange Act of 1934. Currently,Management has suspended repurchase-plan activity as a prudent means, in light of the current economic pressures on banking, to preserve and grow the Company’s capital base. Since the program’s inception, the Company has reacquired 12,255 shares, net ofat $27.83 per share and reissued at $21.11 per share 17,500 shares to participants in the Company’s DRP.
In January 2010, the DRP
was amended to authorize and issue not more than 300,000 shares of common stock of the Company. The DRP provides shareholders with a convenient and economical method of investing cash dividends payable upon the common stock and the opportunity to make voluntary optional cash payments to purchase additional shares of the Company’s common stock. Participants pay no brokerage commissions or service charges when they acquire additional shares of common stock through the DRP. In addition, until further notice and action of the Company’s Board of Directors, shareholders who participate in the DRP may use their cash dividends and optional cash payments to purchase additional shares of stock directly from the Company at
a weighted-average cost90% of
$28.70 per share. For a further discussion about this program, see “Unregistered Salesthe fair market value of
Equity Securities and Use of Proceeds” included in Part II, Item 5, “Marketthe common stock on the investment date. To the extent that additional shares are purchased directly from the Company under the DRP, the Company will receive additional funds for
Registrant’s Common Equity, Related Stockholder Matters and Issue Purchasesits general corporate purposes. Post-Effective Amendment No. 1 to Form S-3, Registration Statement No. 333-152806 was filed with the SEC on
Equity Securities,” above.January 25, 2010.
During the year-ended December 31,
2008,2009, total
shareholders’shareholders' equity decreased
$6,231,000,$3,240,000, or
11%9%, due principally from
increased unrealizedthe recorded net
losses in the securities AFS portfolio,loss, the declaration of cash dividends and the
repurchaseexpiration of the Company’s
capital stock (treasury stock).cash flow hedge and the related adjustment for its remaining intrinsic value. Conversely, shareholders’ equity was enhanced by
current year earnings, stock issued from the Company’s Employee Stock Purchase and Dividend Reinvestment
Plans, and an increase in the intrinsic value of the Company’s cash flow hedge instrument.Plans. The Company’s primary source
(use) of capital during the previous five years has been from the retention of equity in undistributed earnings of the Bank, as reflected below:
| | Net | | Cash dividends | | Earnings | |
| | Income | | declared | | Retained | |
| | | | | | | |
2008 | | $ | 3,635,948 | | $ | 2,068,680 | | $ | 1,567,268 | |
2007 | | 4,611,572 | | 1,921,533 | | 2,690,039 | |
2006 | | 4,125,283 | | 1,801,361 | | 2,323,922 | |
2005 | | 4,591,697 | | 1,624,263 | | 2,967,434 | |
2004 | | 3,364,474 | | 1,610,423 | | 1,754,051 | |
| | | | | | | | | | |
At
| | | Net | | | Cash dividends | | | Earnings | |
| | | (loss) income | | | declared | | | retained | |
| | | | | | | | | | |
| 2009 | | $ | (1,400,205 | ) | | $ | 2,078,171 | | | $ | (3,478,376 | ) |
| 2008 | | | 3,635,948 | | | | 2,068,680 | | | | 1,567,268 | |
| 2007 | | | 4,611,572 | | | | 1,921,533 | | | | 2,690,039 | |
| 2006 | | | 4,125,283 | | | | 1,801,361 | | | | 2,323,922 | |
| 2005 | | | 4,591,697 | | | | 1,624,263 | | | | 2,967,434 | |
As of December 31,
2008,2009, the Company reported a net unrealized loss of
$8,831,000$9,194,000, net of tax, from the securities AFS portfolio
including $6,126,000 of non-credit related OTTI recorded in 2009 compared to a net unrealized loss of
$982,000$8,831,000 as of December 31,
2007, or nearly nine times greater at2008. Other than the
endCompany’s investment in corporate bonds consisting of
pooled trust preferred securities, the unrealized loss position has improved from December 31, 2008.
The large decrease in 2008 was caused by a faltering economy whichHowever, the prolonged economic slump has created uncertainty and in certain circumstances illiquidity in the financial and capital markets and has had a
momentoussizable negative impact on the
volatility in fair value estimates
and determination for securities in
banksbanks’ investment portfolios. Management believes these changes are due mainly to liquidity problems in the financial markets and to a lesser extent the deterioration in the creditworthiness of the issuers.
Nonetheless, there is no assurance that future unrealized losses will not be recognized on the Company’s portfolio of investment securities. Additional information with respect to the investment portfolio and a discussion on the related decline in fair value, is contained in Note 3, “Investment
Securities,”Securities”, within the notes to the consolidated financial statements, and incorporated by reference in Part II, Item
8.8, and the section entitled, “Investments”, in management’s discussion and analysis.
Liquidity management ensures that adequate funds will be available to meet customers’ needs for borrowings, deposit withdrawals and maturities and normal operating expenses of the Company. Current sources of liquidity are cash and cash equivalents, asset maturities and pay-downs within one year, loans and investments AFS, growth of core deposits, growth of repurchase agreements, increases of other borrowed funds from correspondent banks and issuance of capital stock. Although regularly scheduled investment and loan payments are a dependable source of daily funds, the sales of both loans and investments AFS, deposit activity and investment and loan prepayments are significantly influenced by general economic conditions and the
level of interest
rates.rate environment. During a declining interest rate environment, prepayments from interest-sensitive assets tend to accelerate and provide significant liquidity which can be used to invest in other interest-earning assets but at lower market rates. Conversely, in a period of rising interest rates,
prepaymentprepayments from interest-sensitive assets tend to decelerate causing cash flow from mortgage loans and
mortgage-backedthe MBS – GSE residential securities portfolio to decrease.
DepositRising interest rates may also cause deposit inflow
mayto accelerate and be invested at higher market interest rates. The Company closely monitors activity in the capital markets and takes appropriate action to ensure that the liquidity levels are adequate for funding, investing and operating activities.
40
Table of Contents
During the year ended December 31, 2008,2009, the Company generatedused approximately $2.4$4.4 million of cash. During this period, the Company’s operations provided approximately $35.8$11.8 million, primarily from the sales of mortgages AFS net of originations. Included in thesethe sales were approximately $28.1$10.8 million of residential mortgage loans that were transferred to the loan AFS portfolio. ThisCash provided by investing activities was partially offset by cash used for investing and financing of $33.4 million net, for loan growth, purchases of investment securities, facility expansion, the repayment of debt and shareholder dividends. In addition to operations, the Company’s primary sources of funds used for investing and financing was from the proceedsgenerated from the sales calls and maturities of investment securities and ORE properties. The combined $12.7 million generated from operations and financing along with deposit generation.
growth from financing activities was used to pay cash dividends, reduce overnight borrowings and de-leverage the balance sheet by the pay down and non-renewal of long-term debt.
As of December 31,
2008,2009, the Company maintained
$12,771,000$8,328,000 in cash and cash equivalents and
$83,362,000$77,043,000 of investments and loans AFS. In addition, as of December 31,
2008,2009, the Company had approximately
$117,348,000$138,346,000 available to borrow from the FHLB,
$19,700,000$30,000,000 available from other correspondent banks and
$2,250,000$960,000 from the Discount Window
fromof the Federal Reserve
Bank of Philadelphia.Bank. This combined total of
$235,431,000$254,677,000 represented
41%46% of total assets at December 31,
2008.2009. Management believes this level of liquidity to be strong and adequate to support current operations.
Included in the $30,000,000 availability from correspondent banks is $20,000,000 from one bank whose credit facility expired on January 1, 2010. The correspondent bank provides liquidity to the Company in the form of short-term overnight borrowings. In February 2010, the Company renewed the relationship for $15,000,000. The $5,000,000 reduction of available funds from this relationship will not have a significant effect on the Company’s liquidity position. For a discussion on the Company’s significant determinable contractual obligations and significant commitments, see
“Off-balance sheet arrangements“Off-Balance Sheet Arrangements and
contractual obligations,Contractual Obligations,” above.
During the third quarter of 2008, the Company terminated its relationship with a correspondent bank, due to inactivity, that previously provided access to $10,000,000 of liquidity in the form of short-term overnight borrowings. The Company is currently analyzing replacement correspondent banks to provide access to similar funding levels, if needed. The termination of the relationship does not have a significant effect on the Company’s liquidity position.In October 2008, the FDIC announced the Temporary Liquidity Guarantee Program (TLGP) to strengthen confidence and encourage liquidity in the banking system. Among other things, this new program
will provideprovides full deposit insurance coverage for non-interest bearing deposit transaction accounts in FDIC-insured institutions regardless of the dollar amount. To protect its depositors, the Company
is participating indecided to participate the Transaction Account Guarantee (TAG) component of the TLGP. Under the
TLGP,TAG, all depositors who hold funds in non-interest bearing accounts, or interest-bearing accounts with an interest rate of 0.50% or less, including the Lawyers Trust Accounts,
will have a temporary unlimited guarantee from the FDIC
untilwhich was originally scheduled to expire on December 31, 2009.
The coverageTo assure an orderly phase out of the
TAG component of the TLGP,
the FDIC has extended the program, on a voluntary basis to June 30, 2010. Participation in the extended program required the assessment of a higher premium – from 15 to 25 basis points depending on pre-determined risk factors assigned to financial institutions. To protect the deposit base, the Company opted to extend its participation in the TAG program. Under the program, through June 30, 2010, all noninterest-bearing transaction accounts will continue to be fully guaranteed by the FDIC for the entire account balance. The Company, rated with the lowest tier 1 risk factor, was assessed 15 basis points and as a result will incur $42,000 of additional FDIC premiums to voluntarily participate in the TAG extension program. Coverage under the TAG program is in addition to and separate from coverage available under the FDIC’s general deposit insurance rules, which insures accounts up to $250,000 until the end of
20092013, unless extended.
Management of interest rate risk and market risk analysis
The Company is subject to the interest rate risks inherent in its lending, investing and financing activities. Fluctuations of interest rates will impact interest income and interest expense along with affecting market values of all interest-earning assets and interest-bearing liabilities, except for those assets or liabilities with a short term remaining to maturity. Interest rate risk management is an integral part of the asset/liability management process. The Company has instituted certain procedures and policy guidelines to manage the interest rate risk position. Those internal policies enable the Company to react to changes in market rates to protect net interest income from significant fluctuations. The primary objective in managing interest rate risk is to minimize the adverse impact of changes in interest rates on net interest income along with creating an asset/liability structure that maximizes earnings.
Asset/Liability Management. One major objective of the Company when managing the rate sensitivity of its assets and liabilities is to stabilize net interest income. The management of and authority to assume interest rate risk is the responsibility of the Company’s Asset/Liability Committee (ALCO), which is comprised of senior management and members of the board of directors. ALCO meets quarterly to monitor the relationship of interest sensitive assets to interest sensitive liabilities. The process to review interest rate risk is a regular part of managing the Company. Consistent policies and practices of measuring and reporting interest rate risk exposure, particularly regarding the treatment of non-contractual assets and liabilities, are in effect. In addition, there is an annual process to review the interest rate risk policy with the board of directors which includes limits on the impact to earnings from shifts in interest rates.
Interest Rate Risk Measurement. Interest rate risk is monitored through the use of three complementary measures: static gap analysis, earnings at risk simulation and economic value at risk simulation. While each of the interest rate risk measurements has limitations, taken togethercollectively, they represent a reasonably comprehensive view of the magnitude of interest rate risk in the Company and the distribution of risk along the yield curve, the level of risk through time and the amount of exposure to changes in certain interest rate relationships.
Static Gap. The ratio between assets and liabilities re-pricing in specific time intervals is referred to as an interest rate sensitivity gap. Interest rate sensitivity gaps can be managed to take advantage of the slope of the yield curve as well as forecasted changes in the level of interest rate changes.41
Table of Contents
To manage this interest rate sensitivity gap position, an asset/liability model commonly known as cumulative gap analysis is used to monitor the difference in the volume of the Company’s interest sensitive assets and liabilities that mature or re-price within given time intervals. A positive gap (asset sensitive) indicates that more assets will re-price during a given period compared to liabilities, while a negative gap (liability sensitive) has the opposite effect. The Company employs computerized net interest income simulation modeling to assist in quantifying interest rate risk exposure. This process measures and quantifies the impact on net interest income through varying interest rate changes and balance sheet compositions. The use of this model assists the ALCO to gauge the effects of the interest rate changes on interest-sensitive assets and liabilities in order to determine what impact these rate changes will have upon the net interest spread. At December 31, 20082009 the Company maintained a one-year cumulative gap of positive $6.8$35.1 million, or 1.2%6.3%, of total assets. The effect of this positive gap position provided a mismatch of assets and liabilities which may expose the Company to interest rate risk during periods of falling interest rates. Conversely, in an increasing interest rate environment, net interest income could be positively impacted because more assets than liabilities will re-price upward during the one-year period.
Certain shortcomings are inherent in the method of analysis discussed above and presented in the next table. Although certain assets and liabilities may have similar maturities or periods of re-pricing, they may react in different degrees to changes in market interest rates. The interest rates on certain types of assets and liabilities may fluctuate in advance of changes in market interest rates, while interest rates on other types of assets and liabilities may lag behind changes in market interest rates. Certain assets, such as adjustable-rate mortgages, have features which restrict changes in interest rates on a short-term basis and over the life of the asset. In the event of a change in interest rates, prepayment and early withdrawal levels may deviate significantly from those assumed in calculating the table. The ability of many borrowers to service their adjustable-rate debt may decrease in the event of an interest rate increase.
The following table reflects the re-pricing of the balance sheet or “gap” position at December 31,
20082009 (dollars in thousands):
| | Three months
or less | | Three to
twelve months | | One to
three years | | Over
three years | | Total | |
Cash and cash equivalents | | $ | 176 | | $ | — | | $ | — | | $ | 12,595 | | $ | 12,771 | |
Investment securities (1)(2) | | 41,429 | | 30,169 | | 6,517 | | 10,854 | | 88,969 | |
Loans (2) | | 120,778 | | 55,961 | | 113,196 | | 146,356 | | 436,291 | |
Fixed and other assets | | — | | 8,808 | | — | | 28,880 | | 37,688 | |
Total assets | | $ | 162,383 | | $ | 94,938 | | $ | 119,713 | | $ | 198,685 | | $ | 575,719 | |
Total cumulative assets | | $ | 162,383 | | $ | 257,321 | | $ | 377,034 | | $ | 575,719 | | | |
| | | | | | | | | | | |
Non-interest-bearing transaction deposits (3) | | $ | — | | $ | 7,146 | | $ | 19,646 | | $ | 44,651 | | $ | 71,443 | |
Interest-bearing transaction deposits (3) | | 56,325 | | — | | 50,504 | | 81,363 | | 188,192 | |
Certificates of Deposit | | 33,464 | | 105,430 | | 29,597 | | 5,186 | | 173,677 | |
Repurchase agreements | | 11,412 | | — | | — | | — | | 11,412 | |
Short-term borrowings | | 26,718 | | — | | — | | — | | 26,718 | |
Long-term debt | | — | | 10,000 | | 21,000 | | 21,000 | | 52,000 | |
Other liabilities | | — | | — | | — | | 3,316 | | 3,316 | |
Total liabilities | | $ | 127,919 | | $ | 122,576 | | $ | 120,747 | | $ | 155,516 | | $ | 526,758 | |
Total cumulative liabilities | | $ | 127,919 | | $ | 250,495 | | $ | 371,242 | | $ | 526,758 | | | |
| | | | | | | | | | | |
Interest sensitivity gap | | $ | 34,464 | | $ | (27,638 | ) | $ | (1,034 | ) | $ | 43,169 | | | |
Cumulative gap | | $ | 34,464 | | $ | 6,826 | | $ | 5,792 | | $ | 48,961 | | | |
| | | | | | | | | | | |
Cumulative gap to total assets | | 6.0 | % | 1.2 | % | 1.0 | % | 8.5 | % | | |
| | | Three months | | | Three to | | | One to | | | Over | | | | |
| | | or less | | | twelve months | | | three years | | | three years | | | Total | |
| | | | | | | | | | | | | | | | |
| Cash and cash equivalents | | $ | 117 | | | $ | - | | | $ | - | | | $ | 8,211 | | | $ | 8,328 | |
Investment securities (1)(2) | | | 16,665 | | | | 2,005 | | | | 24,022 | | | | 38,619 | | | | 81,311 | |
Loans (2) | | | 133,949 | | | | 53,600 | | | | 105,175 | | | | 131,621 | | | | 424,345 | |
| Fixed and other assets | | | - | | | | 9,117 | | | | - | | | | 32,916 | | | | 42,033 | |
| Total assets | | $ | 150,731 | | | $ | 64,722 | | | $ | 129,197 | | | $ | 211,367 | | | $ | 556,017 | |
| Total cumulative assets | | $ | 150,731 | | | $ | 215,453 | | | $ | 344,650 | | | $ | 556,017 | | | | | |
| | | | | | | | | | | | | | | | | | | | | |
Non-interest-bearing transaction deposits (3) | | $ | - | | | $ | 7,090 | | | $ | 19,495 | | | $ | 44,306 | | | $ | 70,891 | |
| Interest-bearing transaction deposits | | | 63,917 | | | | - | | | | 66,621 | | | | 109,315 | | | | 239,853 | |
| Certificates of deposit | | | 38,439 | | | | 43,415 | | | | 54,814 | | | | 11,583 | | | | 148,251 | |
| Repurchase agreements | | | 7,747 | | | | - | | | | - | | | | - | | | | 7,747 | |
| Short-term borrowings | | | 8,786 | | | | - | | | | - | | | | - | | | | 8,786 | |
| Long-term debt | | | - | | | | 11,000 | | | | - | | | | 21,000 | | | | 32,000 | |
| Other liabilities | | | - | | | | - | | | | - | | | | 2,815 | | | | 2,815 | |
| Total liabilities | | $ | 118,889 | | | $ | 61,505 | | | $ | 140,930 | | | $ | 189,019 | | | $ | 510,343 | |
| Total cumulative liabilities | | $ | 118,889 | | | $ | 180,394 | | | $ | 321,324 | | | $ | 510,343 | | | | | |
| | | | | | | | | | | | | | | | | | | | | |
| Interest sensitivity gap | | $ | 31,842 | | | $ | 3,217 | | | $ | (11,733 | ) | | $ | 22,348 | | | | | |
| Cumulative gap | | $ | 31,842 | | | $ | 35,059 | | | $ | 23,326 | | | $ | 45,674 | | | | | |
| | | | | | | | | | | | | | | | | | | | | |
| Cumulative gap to total assets | | | 5.7 | % | | | 6.3 | % | | | 4.2 | % | | | 8.2 | % | | | | |
(1) | Includes FHLB stock and the net unrealized gains/losses on available-for-sale securities. |
| (2) | |
(2)
| Investments and loans are included in the earlier of the period in which interest rates were next scheduled to adjust or the period in which they are due. In addition, loans were included in the periods in which they are scheduled to be repaid based on scheduled amortization. For amortizing loans and mortgage-backed securities,MBS – GSE residential, annual prepayment rates are assumed reflecting historical experience as well as management’s knowledge and experience of its loan products. |
| (3) | |
(3)
| The Company’s demand and savings accounts were generally subject to immediate withdrawal. However, management considers a certain amount of such accounts to be core accounts having significantly longer effective maturities based on the retention |
42
Table of Contents
| experiences of such deposits in changing interest rate environments. The effective maturities presented are the recommended maturity distribution limits for non-maturing deposits based on historical deposit studies. |
Earnings at Risk and Economic Value at Risk Simulations. The Company recognizes that more sophisticated tools exist for measuring the interest rate risk in the balance sheet that extend beyond static re-pricing gap analysis. Although it will continue to measure its re-pricing gap position, the Company utilizes additional modeling for identifying and measuring the interest rate risk in the overall balance sheet. The ALCO is responsible for focusing on “earnings at risk” and “economic value at risk”, and how both relate to the risk-based capital position when analyzing the interest rate risk.
Earnings at Risk. Earnings at risk simulation measures the change in net interest income and net income should interest rates rise and fall. The simulation recognizes that not all assets and liabilities re-price one-for-one with market rates (e.g., savings rate). The ALCO looks at “earnings at risk” to determine income changes from a base case scenario under an increase and decrease of 200 basis points in interest rate simulation models.
Economic Value at Risk. Earnings at risk simulation measures the short-term risk in the balance sheet. Economic value (or portfolio equity) at risk measures the long-term risk by finding the net present value of the future cash flows from the Company’s existing assets and liabilities. The ALCO examines this ratio quarterly utilizing an increase and decrease of 200 basis points in interest rate simulation models. The ALCO recognizes that, in some instances, this ratio may contradict the “earnings at risk” ratio. The following table illustrates the simulated impact of an immediate 200 basis points upward or downward movement in interest rates on net interest income, net income and the change in the economic value (portfolio equity). This analysis assumed that interest-earning asset and interest-bearing liability levels at December 31,
20082009 remained constant. The impact of the rate movements was developed by simulating the effect of the rate change over a twelve-month period from the December 31,
20082009 levels:
| | Rates +200 | | Rates -200 | |
| | | | | |
Earnings at risk: | | | | | |
Percent change in: | | | | | |
Net interest income | | 1.3 | % | 5.1 | % |
Net income | | 6.1 | | 19.7 | |
| | | | | |
Economic value at risk: | | | | | |
Percent change in: | | | | | |
Economic value of equity | | (7.8 | ) | (8.3 | ) |
Economic value of equity as a percent of total assets | | (0.6 | ) | (0.7 | ) |
| | | Rates +200 | | | Rates -200 | |
| | | | | | | |
| Earnings at risk: | | | | | | |
| Percent change in: | | | | | | |
| Net interest income | | | 3.9 | % | | | 0.4 | % |
| Net income | | | 14.3 | | | | 1.0 | |
| | | | | | | | | |
| Economic value at risk: | | | | | | | | |
| Percent change in: | | | | | | | | |
| Economic value of equity | | | (42.0 | ) | | | (2.0 | ) |
| Economic value of equity as a percent of total assets | | | (3.5 | ) | | | (0.2 | ) |
Economic value has the most meaning when viewed within the context of risk-based capital. Therefore, the economic value may normally change beyond the Company’s policy guideline for a short period of time as long as the risk-based capital ratio (after adjusting for the excess equity exposure) is greater than 10%. At December 31,
2008,2009, the Company’s risk-based capital ratio was
13.6%11.4%.
The table below summarizes estimated changes in net interest income over a twelve-month period beginning January 1,
2009,2010, under alternate interest rate scenarios using the income simulation model described above (dollars in thousands):
Change in interest rates | | Net interest
income | | $
variance | | %
variance | |
| | | | | | | |
+200 basis points | | $ | 19,729 | | $ | 259 | | 1.3 | % |
+100 basis points | | 19,791 | | 321 | | 1.6 | |
Flat rate | | 19,470 | | — | | — | |
-100 basis points | | 20,067 | | 597 | | 3.1 | |
-200 basis points | | 20,454 | | 984 | | 5.1 | |
| | | | | | | | | |
| | | Net interest | | | $ | | | % | |
| | | income | | | variance | | | variance | |
| | | | | | | | | | |
| Change in interest rates | | | | | | | | | |
| | | | | | | | | | |
| +200 basis points | | $ | 21,637 | | | $ | 803 | | | | 1.3 | % |
| +100 basis points | | | 21,015 | | | | 181 | | | | 1.6 | |
| Flat rate | | | 20,834 | | | | - | | | | - | |
| -100 basis points | | | 21,086 | | | | 252 | | | | 3.1 | |
| -200 basis points | | | 20,912 | | | | 78 | | | | 5.1 | |
Simulation models require assumptions about certain categories of assets and liabilities. The models schedule existing assets and liabilities by their contractual maturity, estimated likely call date or earliest re-pricing opportunity.
Mortgage-backedMBS – GSE residential securities and amortizing loans are scheduled based on their anticipated cash flow including estimated prepayments. For
43
Table of Contents
investment securities, the Company uses a third-party service to provide cash flow estimates in the various rate environments. Savings, money market and interest-bearing checking accounts do not have a stated maturitymaturities or re-pricing termterms and can be withdrawn or re-price at any time. This may impact the margin if more expensive alternative sources of deposits are required to fund loans or deposit runoff. Management projects the re-pricing characteristics of these accounts based on historical performance and assumptions that it believes reflect their rate sensitivity. The model reinvests all maturities, repayments and prepayments for each type of asset or liability into the same product for a new like term at current product interest rates provided by management. As a result, the mix of interest-earning assets and interest bearing-liabilities is held constant.
Derivative Financial Instruments. As part of the Company’s overall interest rate risk strategy, the Company has adopted a policy whereby the Company may periodically use derivative instruments to minimize significant fluctuations in earnings caused by interest rate volatility. This interest rate risk management strategy entails the use of interest rate floors, caps and swaps. In October 2006, the Company entered into an interest rate floor derivative agreement on $20,000,000 notional value of its prime-based loan portfolio. The purpose of the hedge is to help protect the Company’s interest income in the event interest rates decline below a pre-determined contractual interest rate. The strategy isswaps that when utilized would be reflected in the scenarios for earnings and economic value at risk and the net interest income in the two immediately preceding tables. For a further discussion on the Company’s derivative contract, see Note 1, “Nature of operationsOperations and summarySummary of significant accounting policies,”Significant Accounting Policies”, and Note 12, “Fair valueValue of financial instrumentsFinancial Instruments and derivatives,”Derivatives”, contained within the notes to consolidated financial statements in Part II, Item 8.
Supervision and Regulation
The following is a brief summary of the regulatory environment in which the Company and the Bank operate and is not designed to be a complete discussion of all statutes and regulations affecting such operations, including those statutes and regulations specifically mentioned herein. Changes in the laws and regulations applicable to the Company and the Bank can affect the operating environment in substantial and unpredictable ways. We cannot accurately predict whether legislation will ultimately be enacted, and if enacted, the ultimate effect that legislation or implementing regulations would have on our financial condition or results of operations. While banking regulations are material to the operations of the Company and the Bank, it should be noted that supervision, regulation and examination of the Company and the Bank are intended primarily for the protection of depositors, not shareholders.
Recent Legislation and Rulemaking
Emergency Economic Stabilization Act of 2008 and American Recovery and Reinvestment Act of 2009. In response to the financial crises affecting the banking system and financial markets and going concern threats to investment banks and other financial institutions, on October 3, 2008, the Emergency Economic Stabilization Act of 2008 (the “EESA”) was signed into law and subsequently amended by the American Recovery and Reinvestment Act of 2009 on February 17, 2009. Under the authority of the EESA, as amended, the United States Department of the Treasury (the “Treasury”) created the Troubled Asset Relief Program (“TARP”) Capital Purchase Program and through this program invested in financial institutions by purchasing preferred stock and warrants to purchase either common stock or additional shares of preferred stock. As of December 31, 2009, the Treasury will not make additional investments under the TARP Capital Purchase Program but is considering continuing a similar program for banks under $10 billion in assets under a different program.
The EESA, as amended, also included a provision for a temporary increase in FDIC insurance coverage from $100,000 to $250,000 per depositor through December 31, 2009. In May 2009, Congress extended the increased coverage until December 31, 2013. After that time, the per depositor coverage will return to $100,000.
FDIC Rulemaking. On November 26, 2008, the FDIC issued the final rule regarding the Temporary Liquidity Guarantee Program enabling the FDIC to temporarily provide a 100% guarantee of the senior debt of all FDIC-insured institutions and their holding companies under the Debt Guarantee Program as well as deposits in non-interest bearing transaction deposit accounts under the Transaction Account Guarantee Program. Coverage under the Debt Guarantee Program and the Transaction Account Guarantee Program was available until November 12, 2008 without charge and thereafter at a cost of 75 basis points per annum for senior unsecured debt and 10 basis points per annum for non-interest bearing transaction deposits. Institutions may continue to participate in the Transaction Account Guarantee Program until June 30, 2010.
On November 12, 2009, the Board of Directors of the FDIC adopted rulemaking that requires insured institutions to prepay their estimated quarterly risk-based assessments for the fourth quarter of 2009 and for all of 2010, 2011 and 2012. Each institution recorded the entire amount of its prepaid assessment as a prepaid expense (asset) as of December 31, 2009. As of December 31, 2009, and each quarter thereafter, each institution records an expense (charge to earnings) for its regular quarterly assessment for the quarter and an offsetting credit to the prepaid assessment until the asset is exhausted. Once the asset is exhausted, the institution records an accrued expense payable each quarter for the assessment payment, which will be paid in arrears to the FDIC at the end of the following quarter. If the prepaid assessment is not exhausted by December 30, 2014, any remaining amount will be returned to the depository institution. The FDIC also voted to adopt a uniform three-basis point increase in assessment rates effective on January 1, 2011.
Financial Services Regulatory Relief Act of 2006.This federal act amends several federal banking laws to reduce redundant and costly regulatory burden. Among its many provisions, the act allows the payment of interest on certain reserve balances of depository institutions that are held at the Federal Reserve beginning in year 2011, requires banking regulatory agencies to streamline reports of condition and clarifies the authority of home and host state regulators with respect to supervision of interstate branches. The act was signed into law in October 2006.
Federal Deposit Insurance Reform Act of 2005 and the Federal Deposit Insurance Reform Conforming Amendments Act of 2005.These federal acts were signed into law in February 2006 to amend the Federal Deposit Insurance Act. These laws enact FDIC and banking industry deposit insurance reform proposals by amendments including: increasing the coverage for retirement accounts to $250,000 and indexing the coverage limit for retirement accounts to inflation as with the general deposit insurance coverage limit; merging the Bank Insurance Fund (BIF) and the Savings Association Insurance Fund (SAIF) into a new fund, the Deposit Insurance Fund (DIF); establishing a percentage range within which the FDIC Board of Directors may set the FDIC’s Designated Reserve Ratio (DRR); allowing the FDIC to manage the pace at which the DRR varies within this range; eliminating the restrictions on premium rates based on the DRR and granting the FDIC Board the discretion to price deposit insurance according to risk for all insured institutions at all times.
Sarbanes-Oxley Act of 2002. In July, 2002, the Sarbanes-Oxley Act of 2002 was enacted. The stated goals of the Act are to increase corporate responsibility, to provide for enhanced penalties for accounting and auditing improprieties at publicly traded companies, and to protect investors by improving the accuracy and reliability of corporate disclosures pursuant to the securities laws. The Act is the most far-reaching U.S. securities legislation enacted in decades. The Act generally applies to all companies, both U.S. and non-U.S., that file or are required to file periodic reports with the Securities and Exchange Commission under the Securities Exchange Act of 1934.
Table of Contents
The Act includes very specific additional disclosure requirements and corporate governance rules, requires the SEC and securities exchanges to adopt extensive additional disclosure, corporate governance and other related rules and mandates further studies of certain issues by the SEC. The Act adds new obligations and restrictions on directors and senior executives of public companies, such as requiring certification of financial statements, and new audit committee procedures. The Act represents significant federal involvement in matters traditionally left to state regulatory systems such as the regulation of the accounting profession, and to state corporate law such as the relationship between a board of directors and management and between a board of directors and its committees.
USA PATRIOT Act of 2001. The Uniting and Strengthening America by Providing Appropriate Tools Required to Intercept and Obstruct Terrorism Act of 2001 (USA PATRIOT Act) was signed into law in October 2001. The USA PATRIOT Act broadened the application of anti-money laundering regulations to apply to additional types of financial institutions, such as broker-dealers, and strengthened the ability of the U.S. government to detect and prosecute international money laundering and the financing of terrorism. The principal provisions of Title III of the USA PATRIOT Act require that regulated financial institutions, including banks: (1) establish an anti-money laundering program that includes training and audit components; (2) comply with regulations regarding the verification of the identity of any person seeking to open an account; (3) take additional required precautions with regard to non-U.S. owned accounts; and (4) perform certain verification and certification of money laundering risk for their foreign correspondent banking relationships. The USA PATRIOT Act also expanded the conditions under which funds in a U.S. inter-bank account may be subject to forfeiture and increased the penalties for violation of anti-money laundering regulations. Failure of a financial institution to comply with the USA PATRIOT ActsAct’s requirements could have serious legal and reputational consequences for the institution. The Bank has adopted policies, procedures and controls to address compliance with the requirements of the USA PATRIOT Act under the existing regulations and will continue to revise and update its policies, procedures and controls to reflect changes required by the USA PATRIOT Act and implementing regulations. As part of the USA PATRIOT Act, Congress adopted the International Money Laundering Abatement and Financial Anti-Terrorism Act of 2001 (IML Act). The IML Act amended the Bank Secrecy Act and adopted certain additional measures that increase the obligation of financial institutions, including the Bank, to identify their customers, watch for and report upon suspicious transactions, respond to requests for information by federal banking regulatory authorities and law enforcement agencies, and share information with other financial institutions. The Secretary of the Treasury has adopted several regulations to implement these provisions. The Bank is also barred from dealing with foreign “shell” banks. In addition, the IML Act expands the circumstances under which funds in a bank account may be forfeited. The IML Act also amended the Bank Holding Company Act and the Bank Merger Act to require the federal banking regulatory authorities to consider the effectiveness of a financial institution’s anti-money laundering activities when reviewing an application to expand operations. The Bank has in place a Bank Secrecy Act compliance program.
Gramm-Leach-Bliley Act of 1999. This law authorized cross-industry affiliations between banks, securities firms, insurance companies and other financial service providers. This was landmark legislation that repealed the Glass-Steagall Act which since the 1930’s had prohibited such affiliations. Among other provisions, the Act provided new authority for banks and created a revised framework for regulating affiliated financial services institutions.
Regulation W. Transactions between a bank and its “affiliates” are quantitatively and qualitatively restricted under the Federal Reserve Act. The Federal Deposit Insurance Act applies Sections 23A and 23B to insured nonmember banks in the same manner and to the same extent as if they were members of the Federal Reserve System. In 2002, the Federal Reserve Board issued Regulation W, which became effective in 2003. Regulation W codifies prior regulations under Sections 23A and 23B of the Federal Reserve Act and interpretative guidance with respect to affiliate transactions. Regulation W incorporates the exemption from the affiliate transaction rules but expands the exemption to cover the purchase of any type of loan or extension of credit from an affiliate. Affiliates of a bank include, among other entities, the Bank’s holding company and companies that are under common control with the Bank. The Company is considered to be an affiliate of the Bank.
Future Federal and State Legislation
and Rulemaking
From time-to-time, various types of federal and state legislation have been proposed that could result in additional regulations and restrictions on the business of the Company and the Bank. We cannot predict whether legislation will be adopted, or if adopted, how the new laws would affect our business. As a consequence, we are susceptible to legislation that may increase the cost of doing business. Management believes that the effect of any current legislative proposals on the liquidity, capital resources and the results of operations of the Company and the Bank will be minimal.
45
Table of Contents
It is possible that there will be regulatory proposals which, if implemented, could have a material effect upon our liquidity, capital resources and results of operations. In addition, the general cost of compliance with numerous federal and state laws does have, and in the future may have, a negative impact on our results of operations. As with other banks, the status of the financial services industry can affect the Bank. Consolidations of institutions are expected to continue as the financial services industry seeks greater efficiencies and market share. Bank management believes that such consolidations may enhance the Bank’s competitive position as a community bank.
Recent Developments
The global and U.S. economies are experiencing significantly reduced business activity as a result of, among other factors, disruptions in
Future Outlook
Based upon the uncertain economic outlook that has affected the financial
system duringand capital markets, the
past year. Dramatic declinesuncertainty in the housing
market during the past year, with falling home prices and
increasingreal estate arena, deterioration in asset and collateral values, tightened credit, high rate of foreclosures,
andhigh unemployment
have resulted in significant write-downs of asset values by financial institutions, including government-sponsored entities and major commercial and investment banks. These write-downs, initially of mortgage-backed securities but spreading to credit default swaps and other derivative securities have caused many financial institutions to seek additional capital, to merge with larger and stronger institutions and, in some cases, to fail.Reflecting concern about the stability of the financial markets generally and the strength of counterparties, many lenders and institutional investors have reduced, and in some cases, ceased to provide funding to borrowers, including other financial institutions. The availability of credit, confidence in the financial sector, and level of volatility in the financial markets have been significantly adversely affected as a result. In recent weeks, volatility and disruption in the capital and credit markets has reached unprecedented levels. In some cases, the markets have produced downward pressure on stock prices and credit capacity for certain issuers without regard to those issuers’ underlying financial strength.
In response to the financial crises affecting the banking system and financial markets and going concern threats to investment banks and other financial institutions, on October 3, 2008, the Emergency Economic Stabilization Act of 2008 (the “EESA”) was signed into law. Pursuant to the EESA, the U.S. Treasury will have the authority to, among other things, purchase up to $700 billion of mortgages, mortgage-backed securities and certain other financial instruments from financial institutions for the purpose of stabilizing and providing liquidity to the U.S. financial markets. The EESA included a provision for a temporary increase in FDIC insurance from $100,000 to $250,000 per depositor through December 31, 2009.
On October 14, 2008, Secretary Paulson, after consulting with the Federal Reserve and the FDIC, announced that the Department of the Treasury will purchase equity stakes in a wide variety of banks and thrifts. Under this program, known as the Troubled Asset Relief Program (“TARP”) Capital Purchase Program, from the $700 billion authorized by the EESA, the Treasury will make $250 billion of capital available to U.S. financial institutions in the form of preferred stock. In conjunction with the purchase of preferred stock, the Treasury will receive warrants to purchase common stock with an aggregate market price equal to 15% of the preferred investment. Participating financial institutions will be required to adopt the Treasury’s standards for executive compensation and corporate governance for the period during which the Treasury holds equity issued under TARP Capital Purchase Program.
Also on October 14, 2008, after receiving a recommendation from the boards of the FDIC and the Federal Reserve, and consulting with the President, Secretary Paulson signed the systemic risk exception to the FDIC Act, enabling the FDIC to temporarily provide a 100% guarantee of the senior debt of all FDIC-insured institutions and their holding companies, as well as deposits in non-interest bearing transaction deposit accounts under a Temporary Liquidity Guarantee Program. Coverage under the Temporary Liquidity Guarantee Program is available until November 12, 2008 without charge and thereafter at a cost of 75 basis points per annum for senior unsecured debt and 10 basis points per annum for non-interest bearing transaction deposits.
It is not clear at this time what impact the EESA, TARP Capital Purchase Program, the Temporary Liquidity Guarantee Program, other liquidity and funding initiatives of the Federal Reserve and other agencies that have been previously announced, and any additional programs that may be initiated in the future will have on the financial markets and the other difficulties described above, including the extreme levels of volatility and limited credit availability currently being experienced, or on the U.S. banking and financial industries and the broader U.S. and global economies. Further adverse effects could have an adverse effect on the Corporation and its business.
46
Table of Contents
Future Outlook
Based upon the current uncertain economic outlook and inability to predict when and by how much interest rates will change and whether rates will continue to fall or begin to rise, the Company recognizes that there are challenges ahead. The Company is prepared to meet thethese challenges and effects of a volatile interest rate environment. Management believes that a significant impact onfeels future earnings depends onwill be significantly impacted by its ability to react to changes in the interest rates.
The Company will continue to monitor interest rate sensitivity of its interest-earning assets and interest-bearing liabilities to minimize any adverse effects on future earnings. The Company’s commitment to remain a community based organization is very strong. Our intention is to
recognize a steady disciplined growth in the loan portfolioscautiously grow while increasing our base of core
deposits.deposits and maintain risk-based regulatory capital ratios above “well capitalized” limits. Review and implementation of policies and procedures along with adding innovative products and services will continue. These steps are designed to provide
our customers with confidence that the Company
with stability and the meansis doing everything possible to
provide customer service andmaximize their banking experience which in turn will increase shareholder value.
The information required by 7A is set forth at Item 7, under “Liquidity” and “Management of interest rate risk and market risk analysis,” contained within management’s discussion and analysis of financial condition and results of operations and incorporated herein by reference.
47
Report Of Independent Registered Public Accounting Firm
Board of Directors and Shareholders
Fidelity D & D Bancorp, Inc.:
We have audited the accompanying consolidated balance sheets of Fidelity D & D Bancorp, Inc. and Subsidiary as of December 31,
20082009 and
20072008 and the related consolidated statements of income, changes in shareholders’ equity and cash flows for each of the years in the three-year period ended December 31,
2008.2009. These financial statements are the responsibility of the Company’s management. Our responsibility is to express an opinion on these financial statements based on our audits.
We conducted our
auditaudits in accordance with the standards of the Public Company Accounting Oversight Board (United States). Those standards require that we plan and perform the audit to obtain reasonable assurance about whether the financial statements are free of material misstatement. The Company is not required to have, nor were we engaged to perform, an audit of its internal control over financial reporting. Our audit included consideration of internal control over financial reporting as a basis for designing audit procedures that are appropriate in the circumstances, but not for the purpose of expressing an opinion on the effectiveness of the Company’s internal control over financial reporting. Accordingly, we express no such opinion. An audit also includes examining, on a test basis, evidence supporting the amounts and disclosures in the financial statements, assessing the accounting principles used and significant estimates made by management, as well as evaluating the overall financial statement presentation. We believe that our
audit providesaudits provide a reasonable basis for our opinion.
In our opinion, the consolidated financial statements referred to above present fairly, in all material respects, the financial position of Fidelity D & D Bancorp, Inc. and Subsidiary as of December 31,
20082009 and
2007,2008, and the results of their operations and their cash flows for each of the years in the three-year period ended December 31,
20082009 in conformity with accounting principles generally accepted in the United States of America.

Scranton, Pennsylvania
March 6, 2009
48
| /s/ ParenteBeard LLC | |
| ParenteBeard LLC |
| Wilkes-Barre, Pennsylvania |
| March 5, 2010 |
FIDELITY D & D BANCORP, INC. AND SUBSIDIARY
Consolidated Balance Sheets
As of December 31,
20082009 and
2007 | | 2008 | | 2007 | |
| | | | | |
Assets: | | | | | |
Cash and due from banks | | $ | 12,335,905 | | $ | 10,204,714 | |
Interest-bearing deposits with financial institutions | | 435,242 | | 204,102 | |
| | | | | |
Total cash and cash equivalents | | 12,771,147 | | 10,408,816 | |
| | | | | |
Available-for-sale securities | | 83,278,132 | | 121,836,851 | |
Held-to-maturity securities | | 909,447 | | 1,147,309 | |
Federal Home Loan Bank Stock | | 4,781,100 | | 3,302,900 | |
Loans and leases, net (allowance for loan losses of $4,745,234 in 2008; $4,824,401in 2007) | | 436,207,460 | | 421,424,379 | |
Loans available-for-sale (fair value $85,312 in 2008; $842,923 in 2007) | | 84,000 | | 827,250 | |
Bank premises and equipment, net | | 16,056,362 | | 12,964,932 | |
Cash surrender value of bank owned life insurance | | 8,807,784 | | 8,488,663 | |
Other assets | | 8,929,917 | | 4,403,723 | |
Accrued interest receivable | | 2,443,141 | | 2,500,696 | |
Foreclosed assets held-for-sale | | 1,450,507 | | 107,036 | |
| | | | | |
Total assets | | $ | 575,718,997 | | $ | 587,412,555 | |
| | | | | |
Liabilities: | | | | | |
Deposits: | | | | | |
Interest-bearing | | $ | 361,869,281 | | $ | 360,912,740 | |
Non-interest-bearing | | 71,442,651 | | 64,795,621 | |
| | | | | |
Total deposits | | 433,311,932 | | 425,708,361 | |
| | | | | |
Accrued interest payable and other liabilities | | 3,316,710 | | 4,147,869 | |
Short-term borrowings | | 38,129,704 | | 39,656,354 | |
Long-term debt | | 52,000,000 | | 62,708,677 | |
| | | | | |
Total liabilities | | 526,758,346 | | 532,221,261 | |
| | | | | |
Shareholders’ equity: | | | | | |
Preferred stock authorized 5,000,000 shares with no par value; none issued | | — | | — | |
Capital stock, no par value (10,000,000 shares authorized; 2,075,182 shares issued and 2,062,927 shares outstanding in 2008; 2,072,929 shares issued and outstanding in 2007 | | 19,410,306 | | 19,223,363 | |
Treasury stock, at cost (12,255 shares in 2008, none in 2007) | | (351,665 | ) | — | |
Retained earnings | | 38,126,250 | | 36,564,157 | |
Accumulated other comprehensive loss | | (8,224,240 | ) | (596,226 | ) |
| | | | | |
Total shareholders’ equity | | 48,960,651 | | 55,191,294 | |
| | | | | |
Total liabilities and shareholders’ equity | | $ | 575,718,997 | | $ | 587,412,555 | |
2008
| | | 2009 | | | 2008 | |
| | | | | | | |
| Assets: | | | | | | |
| Cash and due from banks | | $ | 8,173,199 | | | $ | 12,335,905 | |
| Interest-bearing deposits with financial institutions | | | 154,755 | | | | 435,242 | |
| | | | | | | | | |
| Total cash and cash equivalents | | | 8,327,954 | | | | 12,771,147 | |
| | | | | | | | | |
| Available-for-sale securities | | | 75,821,292 | | | | 83,278,132 | |
| Held-to-maturity securities | | | 708,706 | | | | 909,447 | |
| Federal Home Loan Bank stock | | | 4,781,100 | | | | 4,781,100 | |
| Loans and leases, net (allowance for loan losses of | | | | | | | | |
| $7,573,603 in 2009; $4,745,234 in 2008) | | | 423,124,054 | | | | 436,207,460 | |
| Loans available-for-sale (fair value $1,233,345 in | | | | | | | | |
| 2009; $85,312 in 2008) | | | 1,221,365 | | | | 84,000 | |
| Bank premises and equipment, net | | | 15,361,810 | | | | 16,056,362 | |
| Cash surrender value of bank owned life insurance | | | 9,117,156 | | | | 8,807,784 | |
| Other assets | | | 14,415,582 | | | | 8,929,917 | |
| Accrued interest receivable | | | 2,250,855 | | | | 2,443,141 | |
| Foreclosed assets held-for-sale | | | 887,397 | | | | 1,450,507 | |
| | | | | | | | | |
| Total assets | | $ | 556,017,271 | | | $ | 575,718,997 | |
| | | | | | | | | |
| Liabilities: | | | | | | | | |
| Deposits: | | | | | | | | |
| Interest-bearing | | $ | 388,103,880 | | | $ | 361,869,281 | |
| Non-interest-bearing | | | 70,890,578 | | | | 71,442,651 | |
| | | | | | | | | |
| Total deposits | | | 458,994,458 | | | | 433,311,932 | |
| | | | | | | | | |
| Accrued interest payable and other liabilities | | | 2,815,159 | | | | 3,316,710 | |
| Short-term borrowings | | | 16,533,107 | | | | 38,129,704 | |
| Long-term debt | | | 32,000,000 | | | | 52,000,000 | |
| | | | | | | | | |
| Total liabilities | | | 510,342,724 | | | | 526,758,346 | |
| | | | | | | | | |
| Shareholders' equity: | | | | | | | | |
| Preferred stock authorized 5,000,000 shares with no par | | | | | | | | |
| value; none issued | | | - | | | | - | |
| Capital stock, no par value (10,000,000 shares authorized; | | | | | | | | |
| shares issued and outstanding; 2,105,860 in 2009; and | | | | | | | | |
| 2,075,182 shares issued and 2,062,927 shares outstanding | | | | | | | | |
| in 2008) | | | 19,982,677 | | | | 19,410,306 | |
| Treasury stock, at cost (no shares in 2009; 12,255 shares in 2008) | | | - | | | | (351,665 | ) |
| Retained earnings | | | 34,886,265 | | | | 38,126,250 | |
| Accumulated other comprehensive loss | | | (9,194,395 | ) | | | (8,224,240 | ) |
| | | | | | | | | |
| Total shareholders' equity | | | 45,674,547 | | | | 48,960,651 | |
| | | | | | | | | |
| Total liabilities and shareholders' equity | | $ | 556,017,271 | | | $ | 575,718,997 | |
See notes to consolidated financial statements
49
FIDELITY D & D BANCORP, INC. AND SUBSIDIARY
Consolidated Statements of Income
For the years ended December 31,
2009, 2008
2007 and
2006 | | 2008 | | 2007 | | 2006 | |
| | | | | | | |
Interest income: | | | | | | | |
Loans and leases: | | | | | | | |
Taxable | | $ | 27,194,191 | | $ | 28,765,640 | | $ | 27,681,779 | |
Nontaxable | | 370,097 | | 469,389 | | 445,527 | |
Interest-bearing deposits with financial institutions | | 3,173 | | 8,865 | | 9,166 | |
Investment securities: | | | | | | | |
U.S. government agency and corporations | | 4,408,437 | | 4,264,152 | | 3,738,995 | |
States and political subdivisions (nontaxable) | | 648,000 | | 498,335 | | 590,558 | |
Other securities | | 1,246,403 | | 1,170,063 | | 940,467 | |
Federal funds sold | | 91,133 | | 102,913 | | 123,218 | |
| | | | | | | |
Total interest income | | 33,961,434 | | 35,279,357 | | 33,529,710 | |
| | | | | | | |
Interest expense: | | | | | | | |
Deposits | | 11,118,194 | | 13,369,992 | | 11,492,827 | |
Securities sold under repurchase agreements | | 102,577 | | 465,391 | | 623,902 | |
Other short-term borrowings and other | | 276,407 | | 504,972 | | 377,958 | |
Long-term debt | | 3,186,955 | | 3,319,720 | | 3,866,422 | |
| | | | | | | |
Total interest expense | | 14,684,133 | | 17,660,075 | | 16,361,109 | |
| | | | | | | |
Net interest income | | 19,277,301 | | 17,619,282 | | 17,168,601 | |
| | | | | | | |
Provision (credit) for loan losses | | 940,000 | | (60,000 | ) | 325,000 | |
| | | | | | | |
Net interest income after provision (credit) for loan losses | | 18,337,301 | | 17,679,282 | | 16,843,601 | |
| | | | | | | |
Other income: | | | | | | | |
Service charges on deposit accounts | | 2,901,156 | | 3,007,365 | | 2,631,859 | |
Gain (loss) on sale or disposal of: | | | | | | | |
Loans | | 260,940 | | 159,441 | | 97,848 | |
Investment securities | | 25,428 | | 79 | | 1,200 | |
Premises and equipment | | (35,658 | ) | 97,518 | | (19,654 | ) |
Foreclosed assets held-for-sale | | 43,199 | | 143,559 | | (3,390 | ) |
Leased assets | | — | | — | | 15,154 | |
Other-than-temporary impairment on securities | | (435,665 | ) | — | | — | |
Fees and other service charges | | 1,818,901 | | 1,797,253 | | 1,799,121 | |
| | | | | | | |
Total other income | | 4,578,301 | | 5,205,215 | | 4,522,138 | |
| | | | | | | |
Other expenses: | | | | | | | |
Salaries and employee benefits | | 9,869,866 | | 8,705,698 | | 8,328,407 | |
Premises and equipment | | 3,251,453 | | 3,156,372 | | 3,144,669 | |
Advertising | | 717,685 | | 684,732 | | 540,543 | |
Other | | 4,371,679 | | 4,089,958 | | 3,864,757 | |
| | | | | | | |
Total other expenses | | 18,210,683 | | 16,636,760 | | 15,878,376 | |
| | | | | | | |
Income before provision for income taxes | | 4,704,919 | | 6,247,737 | | 5,487,363 | |
| | | | | | | |
Provision for income taxes | | 1,068,971 | | 1,636,165 | | 1,362,080 | |
| | | | | | | |
Net income | | $ | 3,635,948 | | $ | 4,611,572 | | $ | 4,125,283 | |
| | | | | | | |
Per share data: | | | | | | | |
Net income—basic | | $ | 1.76 | | $ | 2.23 | | $ | 2.01 | |
Net income—diluted | | $ | 1.76 | | $ | 2.23 | | $ | 2.01 | |
Dividends | | $ | 1.00 | | $ | 0.93 | | $ | 0.88 | |
2007
| | | 2009 | | | 2008 | | | 2007 | |
| | | | | | | | | | |
| Interest income: | | | | | | | | | |
| Loans and leases: | | | | | | | | | |
| Taxable | | $ | 25,521,742 | | | $ | 27,194,191 | | | $ | 28,765,640 | |
| Nontaxable | | | 447,802 | | | | 370,097 | | | | 469,389 | |
| Interest-bearing deposits with financial institutions | | | 589 | | | | 3,173 | | | | 8,865 | |
| Investment securities: | | | | | | | | | | | | |
| U.S. government agency and corporations | | | 2,387,192 | | | | 4,408,437 | | | | 4,264,152 | |
| States and political subdivisions (nontaxable) | | | 1,072,027 | | | | 648,000 | | | | 498,335 | |
| Other securities | | | 468,604 | | | | 1,246,403 | | | | 1,170,063 | |
| Federal funds sold | | | 11,317 | | | | 91,133 | | | | 102,913 | |
| | | | | | | | | | | | | |
| Total interest income | | | 29,909,273 | | | | 33,961,434 | | | | 35,279,357 | |
| | | | | | | | | | | | | |
| Interest expense: | | | | | | | | | | | | |
| Deposits | | | 7,895,576 | | | | 11,118,194 | | | | 13,369,992 | |
| Securities sold under repurchase agreements | | | 27,959 | | | | 102,577 | | | | 465,391 | |
| Other short-term borrowings and other | | | 34,602 | | | | 276,407 | | | | 504,972 | |
| Long-term debt | | | 2,838,717 | | | | 3,186,955 | | | | 3,319,720 | |
| | | | | | | | | | | | | |
| Total interest expense | | | 10,796,854 | | | | 14,684,133 | | | | 17,660,075 | |
| | | | | | | | | | | | | |
| Net interest income | | | 19,112,419 | | | | 19,277,301 | | | | 17,619,282 | |
| | | | | | | | | | | | | |
| Provision for loan losses | | | 5,050,000 | | | | 940,000 | | | | (60,000 | ) |
| | | | | | | | | | | | | |
| Net interest income after provision for loan losses | | | 14,062,419 | | | | 18,337,301 | | | | 17,679,282 | |
| | | | | | | | | | | | | |
| Other income: | | | | | | | | | | | | |
| Service charges on deposit accounts | | | 2,630,190 | | | | 2,901,156 | | | | 3,007,365 | |
| Fees and other service charges | | | 1,940,912 | | | | 1,818,901 | | | | 1,797,253 | |
| Gain (loss) on sale or disposal of: | | | | | | | | | | | | |
| Loans | | | 1,059,876 | | | | 260,940 | | | | 159,441 | |
| Investment securities | | | 10,695 | | | | 25,428 | | | | 79 | |
| Premises and equipment | | | (43,027 | ) | | | (35,658 | ) | | | 97,518 | |
| Foreclosed assets held-for-sale | | | 40,195 | | | | 43,199 | | | | 143,559 | |
| Write-down of foreclosed assets held-for-sale | | | (177,560 | ) | | | - | | | | - | |
| Impairment losses on investment securities: | | | | | | | | | | | | |
| Other-than-temporary impairment on investment securities | | | (12,050,257 | ) | | | (435,665 | ) | | | - | |
| Non-credit related losses on investment securities not expected | | | | | | | | | | | | |
| to be sold (recognized in other comprehensive income/(loss)) | | | 8,750,163 | | | | - | | | | - | |
| Net impairment losses on investment securities recognized in earnings | | | (3,300,094 | ) | | | (435,665 | ) | | | - | |
| Total other income | | | 2,161,187 | | | | 4,578,301 | | | | 5,205,215 | |
| | | | | | | | | | | | | |
| Other expenses: | | | | | | | | | | | | |
| Salaries and employee benefits | | | 9,763,430 | | | | 9,869,866 | | | | 8,705,698 | |
| Premises and equipment | | | 3,556,862 | | | | 3,251,453 | | | | 3,156,372 | |
| Advertising | | | 524,868 | | | | 717,685 | | | | 684,732 | |
| Other | | | 5,395,965 | | | | 4,371,679 | | | | 4,089,958 | |
| | | | | | | | | | | | | |
| Total other expenses | | | 19,241,125 | | | | 18,210,683 | | | | 16,636,760 | |
| | | | | | | | | | | | | |
| (Loss) income before income taxes | | | (3,017,519 | ) | | | 4,704,919 | | | | 6,247,737 | |
| | | | | | | | | | | | | |
| (Credit) provision for income taxes | | | (1,617,314 | ) | | | 1,068,971 | | | | 1,636,165 | |
| | | | | | | | | | | | | |
| Net (loss) income | | $ | (1,400,205 | ) | | $ | 3,635,948 | | | $ | 4,611,572 | |
| | | | | | | | | | | | | |
| Per share data: | | | | | | | | | | | | |
| Net (loss) income - basic | | $ | (0.67 | ) | | $ | 1.76 | | | $ | 2.23 | |
| Net (loss) income - diluted | | $ | (0.67 | ) | | $ | 1.76 | | | $ | 2.23 | |
| Dividends | | $ | 1.00 | | | $ | 1.00 | | | $ | 0.93 | |
See notes to consolidated financial statements
50
FIDELITY D & D BANCORP, INC. AND SUBSIDIARY
Consolidated Statements of Changes in
Shareholders’Shareholders' Equity
For the years ended December
31,30, 2009, 2008
2007 and
2006 | | | | | | | | | | | | Accumulated | | | |
| | | | | | | | | | | | other | | | |
| | Capital stock | | Treasury stock | | Retained | | comprehensive | | | |
| | Shares | | Amount | | Shares | | Amount | | earnings | | income (loss) | | Total | |
| | | | | | | | | | | | | | | |
Balance, December 31, 2005 | | 1,854,217 | | $ | 10,594,901 | | — | | $ | — | | $ | 39,363,461 | | $ | (1,112,333 | ) | $ | 48,846,029 | |
Cumulative effect adjustments | | | | | | | | | | (343,717 | ) | | | (343,717 | ) |
Total comprehensive income: | | | | | | | | | | | | | | | |
Net income | | | | | | | | | | 4,125,283 | | | | 4,125,283 | |
Change in net unrealized holding losses on available-for-sale securities, net of reclassification adjustment and tax effects | | | | | | | | | | | | 146,624 | | 146,624 | |
Change in cash flow hedge intrinsic value | | | | | | | | | | | | 917 | | 917 | |
Comprehensive income | | | | | | | | | | | | | | 4,272,824 | |
Issuance of common stock through Employee Stock Purchase Plan | | 1,571 | | 48,151 | | | | | | | | | | 48,151 | |
Dividends reinvested through Dividend Reinvestment Plan | | 16,251 | | 568,641 | | | | | | | | | | 568,641 | |
Stock-based compensation expense | | | | 28,744 | | | | | | | | | | 28,744 | |
Cash dividends declared | | | | | | | | | | (1,801,361 | ) | | | (1,801,361 | ) |
Stock dividend declared | | 185,394 | | 7,462,100 | | | | | | (7,469,548 | ) | | | (7,448 | ) |
| | | | | | | | | | | | | | | |
Balance, December 31, 2006 | | 2,057,433 | | 18,702,537 | | — | | — | | 33,874,118 | | (964,792 | ) | 51,611,863 | |
Total comprehensive income: | | | | | | | | | | | | | | | |
Net income | | | | | | | | | | 4,611,572 | | | | 4,611,572 | |
Change in net unrealized holding losses on available-for-sale securities, net of reclassification adjustment and tax effects | | | | | | | | | | | | (16,258 | ) | (16,258 | ) |
Change in cash flow hedge intrinsic value | | | | | | | | | | | | 384,824 | | 384,824 | |
Comprehensive income | | | | | | | | | | | | | | 4,980,138 | |
Issuance of common stock through Employee Stock Purchase Plan | | 2,266 | | 67,820 | | | | | | | | | | 67,820 | |
Dividends reinvested through Dividend Reinvestment Plan | | 13,230 | | 437,145 | | | | | | | | | | 437,145 | |
Stock-based compensation expense | | | | 15,861 | | | | | | | | | | 15,861 | |
Cash dividends declared | | | | | | | | | | (1,921,533 | ) | | | (1,921,533 | ) |
| | | | | | | | | | | | | | | |
Balance, December 31, 2007 | | 2,072,929 | | 19,223,363 | | — | | — | | 36,564,157 | | (596,226 | ) | 55,191,294 | |
Total comprehensive loss: | | | | | | | | | | | | | | | |
Net income | | | | | | | | | | 3,635,948 | | | | 3,635,948 | |
Change in net unrealized holding losses on available-for-sale securities, net of reclassification adjustment and tax effects | | | | | | | | | | | | (7,848,766 | ) | (7,848,766 | ) |
Change in cash flow hedge intrinsic value | | | | | | | | | | | | 220,752 | | 220,752 | |
Comprehensive loss | | | | | | | | | | | | | | (3,992,066 | ) |
Issuance of common stock through Employee Stock Purchase Plan | | 2,253 | | 57,891 | | | | | | | | | | 57,891 | |
Dividends reinvested through Dividend Reinvestment Plan | | | | | | 2,745 | | 78,770 | | (5,175 | ) | | | 73,595 | |
Stock-based compensation expense | | | | 129,052 | | | | | | | | | | 129,052 | |
Purchase of treasury stock | | | | | | (15,000 | ) | (430,435 | ) | | | | | (430,435 | ) |
Cash dividends declared | | | | | | | | | | (2,068,680 | ) | | | (2,068,680 | ) |
Balance, December 31, 2008 | | 2,075,182 | | $ | 19,410,306 | | (12,255 | ) | $ | (351,665 | ) | $ | 38,126,250 | | $ | (8,224,240 | ) | $ | 48,960,651 | |
2007
| | | | | | | | | | | | | | | | | | Accumulated | | | | |
| | | | | | | | | | | | | | | | | | other | | | | |
| | | Capital stock | | | Treasury stock | | | Retained | | | comprehensive | | | | |
| | | Shares | | | Amount | | | Shares | | | Amount | | | earnings | | | income (loss) | | | Total | |
| | | | | | | | | | | | | | | | | | | | | | |
| Balance, December 31, 2006 | | | 2,057,433 | | | $ | 18,702,537 | | | | - | | | $ | - | | | $ | 33,874,118 | | | $ | (964,792 | ) | | $ | 51,611,863 | |
| Total comprehensive income: | | | | | | | | | | | | | | | | | | | | | | | | | | | | |
| Net income | | | | | | | | | | | | | | | | | | | 4,611,572 | | | | | | | | 4,611,572 | |
| Change in net unrealized holding losses | | | | | | | | | | | | | | | | | | | | | | | | | | | | |
| on available-for-sale securities, net of | | | | | | | | | | | | | | | | | | | | | | | | | | | | |
| reclassification adjustment and tax effects | | | | | | | | | | | | | | | | | | | | | | | (16,258 | ) | | | (16,258 | ) |
| Change in cash flow hedge intrinsic value | | | | | | | | | | | | | | | | | | | | | | | 384,824 | | | | 384,824 | |
| Comprehensive income | | | | | | | | | | | | | | | | | | | | | | | | | | | 4,980,138 | |
| Issuance of common stock through Employee Stock | | | | | | | | | | | | | | | | | | | | | | | | | | | | |
| Purchase Plan | | | 2,266 | | | | 67,820 | | | | | | | | | | | | | | | | | | | | 67,820 | |
| Dividends reinvested through Dividend | | | | | | | | | | | | | | | | | | | | | | | | | | | | |
| Reinvestment Plan | | | 13,230 | | | | 437,145 | | | | | | | | | | | | | | | | | | | | 437,145 | |
| Stock-based compensation expense | | | | | | | 15,861 | | | | | | | | | | | | | | | | | | | | 15,861 | |
| Cash dividends declared | | | | | | | | | | | | | | | | | | | (1,921,533 | ) | | | | | | | (1,921,533 | ) |
| | | | | | | | | | | | | | | | | | | | | | | | | | | | | |
| Balance, December 31, 2007 | | | 2,072,929 | | | $ | 19,223,363 | | | | - | | | $ | - | | | $ | 36,564,157 | | | $ | (596,226 | ) | | $ | 55,191,294 | |
| Total comprehensive loss: | | | | | | | | | | | | | | | | | | | | | | | | | | | | |
| Net income | | | | | | | | | | | | | | | | | | | 3,635,948 | | | | | | | | 3,635,948 | |
| Change in net unrealized holding losses | | | | | | | | | | | | | | | | | | | | | | | | | | | | |
| on available-for-sale securities, net of | | | | | | | | | | | | | | | | | | | | | | | | | | | | |
| reclassification adjustment and tax effects | | | | | | | | | | | | | | | | | | | | | | | (7,848,766 | ) | | | (7,848,766 | ) |
| Change in cash flow hedge intrinsic value | | | | | | | | | | | | | | | | | | | | | | | 220,752 | | | | 220,752 | |
| Comprehensive loss | | | | | | | | | | | | | | | | | | | | | | | | | | | (3,992,066 | ) |
| Issuance of common stock through Employee | | | | | | | | | | | | | | | | | | | | | | | | | | | | |
| Stock Purchase Plan | | | 2,253 | | | | 57,891 | | | | | | | | | | | | | | | | | | | | 57,891 | |
| Dividends reinvested through Dividend | | | | | | | | | | | | | | | | | | | | | | | | | | | | |
| Reinvestment Plan | | | | | | | | | | | 2,745 | | | | 78,770 | | | | (5,175 | ) | | | | | | | 73,595 | |
| Stock-based compensation expense | | | | | | | 129,052 | | | | | | | | | | | | | | | | | | | | 129,052 | |
| Purchase of treasury stock | | | | | | | | | | | (15,000 | ) | | | (430,435 | ) | | | | | | | | | | | (430,435 | ) |
| Cash dividends declared | | | | | | | | | | | | | | | | | | | (2,068,680 | ) | | | | | | | (2,068,680 | ) |
| | | | | | | | | | | | | | | | | | | | | | | | | | | | | |
| Balance, December 31, 2008 | | | 2,075,182 | | | $ | 19,410,306 | | | | (12,255 | ) | | $ | (351,665 | ) | | $ | 38,126,250 | | | $ | (8,224,240 | ) | | $ | 48,960,651 | |
| Cumulative effect of change in accounting principle | | | | | | | | | | | | | | | | | | | 350,720 | | | | (350,720 | ) | | | - | |
| Total comprehensive loss: | | | | | | | | | | | | | | | | | | | | | | | | | | | | |
| Net loss | | | | | | | | | | | | | | | | | | | (1,400,205 | ) | | | | | | | (1,400,205 | ) |
| Change in net unrealized holding losses | | | | | | | | | | | | | | | | | | | | | | | | | | | | |
| on available-for-sale securities, net of | | | | | | | | | | | | | | | | | | | | | | | | | | | | |
| reclassification adjustment and tax effects | | | | | | | | | | | | | | | | | | | | | | | 5,762,165 | | | | 5,762,165 | |
| Non-credit related impairment losses on | | | | | | | | | | | | | | | | | | | | | | | | | | | | |
| investment securities not expected to | | | | | | | | | | | | | | | | | | | | | | | | | | | | |
| be sold, net of tax effects | | | | | | | | | | | | | | | | | | | | | | | (5,775,107 | ) | | | (5,775,107 | ) |
| Change in cash flow hedge intrinsic value | | | | | | | | | | | | | | | | | | | | | | | (606,493 | ) | | | (606,493 | ) |
| Comprehensive loss | | | | | | | | | | | | | | | | | | | | | | | | | | | (2,019,640 | ) |
| Issuance of common stock through Employee Stock | | | | | | | | | | | | | | | | | | | | | | | | | | | | |
| Purchase Plan | | | 1,701 | | | | 40,569 | | | | | | | | | | | | | | | | | | | | 40,569 | |
| Purchase of treasury stock | | | | | | | | | | | (2,500 | ) | | | (56,505 | ) | | | | | | | | | | | (56,505 | ) |
| Dividends reinvested through Dividend | | | | | | | | | | | | | | | | | | | | | | | | | | | | |
| Reinvestment Plan | | | 28,977 | | | | 527,294 | | | | 14,755 | | | | 408,170 | | | | (112,329 | ) | | | | | | | 823,135 | |
| Stock-based compensation expense | | | | | | | 4,508 | | | | | | | | | | | | | | | | | | | | 4,508 | |
| Cash dividends declared | | | | | | | | | | | | | | | | | | | (2,078,171 | ) | | | | | | | (2,078,171 | ) |
| Balance, December 30, 2009 | | | 2,105,860 | | | $ | 19,982,677 | | | | - | | | $ | - | | | $ | 34,886,265 | | | $ | (9,194,395 | ) | | $ | 45,674,547 | |
See notes to consolidated financial statements
51
FIDELITY DEPOSIT & DISCOUNT BANCORP, INC. AND SUBSIDIARY
Consolidated Statements of Cash Flows
For the years ended December 31,
2009, 2008
2007 and
2006 | | 2008 | | 2007 | | 2006 | |
Cash flows from operating activities: | | | | | | | |
Net income | | $ | 3,635,948 | | $ | 4,611,572 | | $ | 4,125,283 | |
Adjustments to reconcile net income to net cash provided by operating activities: | | | | | | | |
Depreciation, amortization and accretion | | 611,429 | | 1,130,274 | | 1,349,990 | |
Provision (credit) for loan losses | | 940,000 | | (60,000 | ) | 325,000 | |
Deferred income tax (benefit) expense | | (2,941 | ) | 78,838 | | (75,003 | ) |
Stock-based compensation expense | | 129,052 | | 15,861 | | 28,744 | |
Loss from investment in limited partnership | | 80,400 | | 80,400 | | 80,000 | |
Proceeds from sale of loans available-for-sale | | 47,230,437 | | 16,399,530 | | 12,573,745 | |
Originations of loans available-for-sale | | (14,754,219 | ) | (16,945,339 | ) | (12,169,313 | ) |
Increase in cash surrender value of life insurance | | (319,121 | ) | (310,702 | ) | (286,063 | ) |
Net gain on sale of loans | | (260,940 | ) | (159,441 | ) | (97,848 | ) |
Net gain on sale of investment securities | | (25,428 | ) | (79 | ) | (1,200 | ) |
Net (gain) loss on sale of foreclosed assets held-for-sale | | (43,199 | ) | (143,559 | ) | 3,390 | |
Net loss (gain) on disposal of equipment | | 35,658 | | (97,518 | ) | 19,654 | |
Other-than-temporary impairment on securities | | 435,665 | | — | | — | |
Change in: | | | | | | | |
Accrued interest receivable | | 48,394 | | 1,880 | | (542,750 | ) |
Other assets | | (1,122,487 | ) | (8,933 | ) | (385,141 | ) |
Accrued interest payable and other liabilities | | (829,539 | ) | (29,680 | ) | 922,747 | |
| | | | | | | |
Net cash provided by operating activities | | 35,789,109 | | 4,563,104 | | 5,871,235 | |
| | | | | | | |
Cash flows from investing activities: | | | | | | | |
Held-to-maturity securities: | | | | | | | |
Proceeds from maturities, calls and principal pay-downs | | 237,303 | | 421,096 | | 424,880 | |
Available-for-sale securities: | | | | | | | |
Proceeds from sales | | 48,402,457 | | 3,818,914 | | 19,554,141 | |
Proceeds from maturities, calls and principal pay-downs | | 31,969,469 | | 12,001,895 | | 24,445,735 | |
Purchases | | (53,111,087 | ) | (38,399,150 | ) | (46,996,118 | ) |
Net (increase) decrease in FHLB stock | | (1,478,200 | ) | 492,200 | | 833,100 | |
Net increase in loans and leases | | (48,759,407 | ) | (4,517,367 | ) | (14,619,300 | ) |
Acquisition of bank premises and equipment | | (3,950,934 | ) | (2,939,866 | ) | (1,723,928 | ) |
Proceeds from sale of bank premises and equipment | | 600 | | 453,186 | | 1,560 | |
Proceeds from sale of foreclosed assets held-for-sale | | 262,406 | | 584,088 | | 55,890 | |
| | | | | | | |
Net cash used in investing activities | | (26,427,393 | ) | (28,085,004 | ) | (18,024,040 | ) |
| | | | | | | |
Cash flows from financing activities: | | | | | | | |
Net increase in deposits | | 7,603,571 | | 15,373,765 | | 30,835,955 | |
Net (decrease) increase in short-term borrowings | | (1,526,650 | ) | 6,000,204 | | 4,883,153 | |
Proceeds from long-term debt advances | | — | | 20,000,000 | | 16,000,000 | |
Repayments of long-term debt | | (10,708,677 | ) | (19,827,533 | ) | (37,167,978 | ) |
Proceeds from employee stock purchase plan | | 57,891 | | 67,820 | | 48,151 | |
Dividends paid, net of dividends reinvested | | (1,995,085 | ) | (1,484,388 | ) | (1,232,720 | ) |
Purchase of treasury stock | | (430,435 | ) | — | | — | |
Cash payments in lieu of fractional shares on stock dividend | | — | | — | | (7,448 | ) |
| | | | | | | |
Net cash (used in) provided by financing activities | | (6,999,385 | ) | 20,129,868 | | 13,359,113 | |
| | | | | | | |
Net increase (decrease) in cash and cash equivalents | | 2,362,331 | | (3,392,032 | ) | 1,206,308 | |
| | | | | | | |
Cash and cash equivalents, beginning | | 10,408,816 | | 13,800,848 | | 12,594,540 | |
| | | | | | | |
Cash and cash equivalents, ending | | $ | 12,771,147 | | $ | 10,408,816 | | $ | 13,800,848 | |
2007
| | | 2009 | | | 2008 | | | 2007 | |
| | | | | | | | | | |
| Cash flows from operating activities: | | | | | | | | | |
| Net (loss) income | | $ | (1,400,205 | ) | | $ | 3,635,948 | | | $ | 4,611,572 | |
| Adjustments to reconcile net (loss) income to net cash provided by | | | | | | | | | | | | |
| operating activities: | | | | | | | | | | | | |
| Depreciation, amortization and accretion | | | 1,603,459 | | | | 611,429 | | | | 1,130,274 | |
| Provision (credit) for loan losses | | | 5,050,000 | | | | 940,000 | | | | (60,000 | ) |
| Deferred income tax (benefit) expense | | | (1,776,033 | ) | | | (2,941 | ) | | | 78,838 | |
| Stock-based compensation expense | | | 4,508 | | | | 129,052 | | | | 15,861 | |
| Loss from investment in limited partnership | | | 40,961 | | | | 80,400 | | | | 80,400 | |
| Proceeds from sale of loans available-for-sale | | | 98,391,716 | | | | 47,230,437 | | | | 16,399,530 | |
| Originations of loans available-for-sale | | | (87,896,403 | ) | | | (14,754,219 | ) | | | (16,945,339 | ) |
| Write-down of foreclosed assets held-for-sale | | | 177,560 | | | | - | | | | - | |
| Increase in cash surrender value of life insurance | | | (309,372 | ) | | | (319,121 | ) | | | (310,702 | ) |
| Net gain on sale of loans | | | (1,059,876 | ) | | | (260,940 | ) | | | (159,441 | ) |
| Net gain on sale of investment securities | | | (10,695 | ) | | | (25,428 | ) | | | (79 | ) |
| Net gain on sale of foreclosed assets held for sale | | | (40,195 | ) | | | (43,199 | ) | | | (143,559 | ) |
| Loss (gain) on disposal of equipment | | | 43,027 | | | | 35,658 | | | | (97,518 | ) |
| Other-than-temporary impairment on securities | | | 3,300,094 | | | | 435,665 | | | | - | |
| Change in: | | | | | | | | | | | | |
| Accrued interest receivable | | | (26,435 | ) | | | 48,394 | | | | 1,880 | |
| Other assets | | | (3,797,337 | ) | | | (1,122,487 | ) | | | (8,933 | ) |
| Accrued interest payable and other liabilities | | | (499,931 | ) | | | (829,539 | ) | | | (29,680 | ) |
| | | | | | | | | | | | | |
| Net cash provided by operating activities | | | 11,794,843 | | | | 35,789,109 | | | | 4,563,104 | |
| | | | | | | | | | | | | |
| Cash flows from investing activities: | | | | | | | | | | | | |
| Held-to-maturity securities: | | | | | | | | | | | | |
| Proceeds from maturities, calls and principal pay-downs | | | 200,697 | | | | 237,303 | | | | 421,096 | |
| Available-for-sale securities: | | | | | | | | | | | | |
| Proceeds from sale | | | 5,075,325 | | | | 48,402,457 | | | | 3,818,914 | |
| Proceeds from maturities, calls and principal pay-downs | | | 39,348,330 | | | | 31,969,469 | | | | 12,001,895 | |
| Purchases | | | (39,614,223 | ) | | | (53,111,087 | ) | | | (38,399,150 | ) |
| Net (increase) decrease in FHLB stock | | | - | | | | (1,478,200 | ) | | | 492,200 | |
| Net increase in loans and leases | | | (3,890,584 | ) | | | (48,759,407 | ) | | | (4,517,367 | ) |
| Acquisition of bank premises and equipment | | | (1,068,538 | ) | | | (3,950,934 | ) | | | (2,939,866 | ) |
| Proceeds from sale of bank premises and equipment | | | 2,323 | | | | 600 | | | | 453,186 | |
| Proceeds from sale of foreclosed assets held-for-sale | | | 893,677 | | | | 262,406 | | | | 584,088 | |
| | | | | | | | | | | | | |
| Net cash provided by (used in) investing activities | | | 947,007 | | | | (26,427,393 | ) | | | (28,085,004 | ) |
| | | | | | | | | | | | | |
| Cash flows from financing activities: | | | | | | | | | | | | |
| Net increase in deposits | | | 25,682,526 | | | | 7,603,571 | | | | 15,373,765 | |
| Net (decrease) increase in short-term borrowings | | | (21,596,597 | ) | | | (1,526,650 | ) | | | 6,000,204 | |
| Proceeds from issuance of long-term debt advances | | | - | | | | - | | | | 20,000,000 | |
| Repayments of long-term debt | | | (20,000,000 | ) | | | (10,708,677 | ) | | | (19,827,533 | ) |
| Purchase of treasury stock | | | (56,505 | ) | | | (430,435 | ) | | | - | |
| Proceeds from employee stock purchase plan | | | 40,569 | | | | 57,891 | | | | 67,820 | |
| Dividends paid, net of dividends reinvested | | | (1,255,036 | ) | | | (1,995,085 | ) | | | (1,484,388 | ) |
| | | | | | | | | | | | | |
| Net cash (used in) provided by financing activities | | | (17,185,043 | ) | | | (6,999,385 | ) | | | 20,129,868 | |
| | | | | | | | | | | | | |
| Net (decrease) increase in cash and cash equivalents | | | (4,443,193 | ) | | | 2,362,331 | | | | (3,392,032 | ) |
| | | | | | | | | | | | | |
| Cash and cash equivalents, beginning | | | 12,771,147 | | | | 10,408,816 | | | | 13,800,848 | |
| | | | | | | | | | | | | |
| Cash and cash equivalents, ending | | $ | 8,327,954 | | | $ | 12,771,147 | | | $ | 10,408,816 | |
See notes to consolidated financial statements
52
NOTES TO CONSOLIDATED FINANCIAL STATEMENTS
1.NATURE OF OPERATIONS AND SUMMARY OF SIGNIFICANT ACCOUNTING POLICIES
| 1. | NATURE OF OPERATIONS AND SUMMARY OF SIGNIFICANT ACCOUNTING POLICIES |
PRINCIPLES OF CONSOLIDATION
The accompanying consolidated financial statements include the accounts of Fidelity D & D Bancorp, Inc. and its wholly-owned subsidiary, The Fidelity Deposit and Discount Bank (the Bank) (collectively, the Company). All significant inter-company balances and transactions have been eliminated in consolidation.
The Company provides a
varietyfull range of
basic financial services to individuals,
small businesses and corporate
customers incustomers. Its primary market area is Lackawanna and Luzerne Counties, Pennsylvania.
This region has a diversified and fairly stable economy. The
Company’sCompany's primary deposit products are
checking accounts,demand deposits and interest-bearing time and savings
accounts, NOW accounts, money market deposit accountsaccounts. It offers a full array of loan products to meet the needs of retail and
certificatescommercial customers. The Company is subject to regulation by the Federal Deposit Insurance Corporation (FDIC) and the Pennsylvania Department of
deposit accounts. Its primary lending products are single-family residential loans, secured consumer loans and secured loans to businesses. In addition to these traditional banking services, the Company also provides asset management, investment and trust services.Although the Company has a diversified loan portfolio, a substantial portion of its debtors’ ability to honor their contracts is dependent on the economic sector in which the Company operates. While management uses available information to recognize losses on loans, leases and foreclosed assets, future additions to the allowance for loan losses and foreclosed assets may be necessary based on changes in local economic conditions. In addition, regulatory agencies, as an integral part of their examination process, periodically review the Company’s allowance. Such agencies may require the Company to recognize additions to the allowance based on their judgments about information available to them at the time of their examination. Because of these factors, it is reasonably possible that the allowance for loan losses and foreclosed assets may change materially in the near future.
Banking.
The preparation of financial statements in conformity with accounting principles generally accepted in the United States of America requires management to make estimates and assumptions that affect the reported amounts of assets and liabilities and disclosure of contingent assets and liabilities at the date of the financial statements and the reported amounts of revenues and expenses during the reporting period. Actual results could differ from those estimates.
Material estimates that are particularly susceptible to significant change relate to the determination of the allowance for loan losses, the valuation of real estate acquiredinvestment securities, the determination of and the amount of impairment in connection with foreclosures or in satisfaction of loansthe securities portfolios and fair value pricingthe related realization of the deferred tax assets on the allowance for loan losses and valuations of investment securities portfolio. securities.
In connection with the determination of
the allowance for
loan losses,
on loans and foreclosed real estate, management
generally obtains independent appraisals for
significant properties.
While management uses available information to recognize losses on loans, further reductions in the carrying amounts of loans may be necessary based on changes in economic conditions. In addition, regulatory agencies, as an integral part of their examination process, periodically review the estimated losses on loans. Such agencies may require the Company to recognize additional losses based on their judgments about information available to them at the time of their examination. Because of these factors, it is reasonably possible that the estimated losses on loans may change materially in the near term. However, the amount of the change that is reasonably possible cannot be estimated.
The Company’s investment securities are comprised of a variety of financial instruments. The fair values of these securities are subject to various risks including changes in the interest rate environment and general economic conditions including illiquid conditions in the capital markets. Due to the increased level of these risks and their potential impact on the fair values of the securities, it is possible that the amounts reported in the accompanying financial statements could materially change in the near term including changes caused by other-than-temporary impairment, the recovery of which may not occur until maturity. Credit-related impairment is included as a component of non-interest income in the consolidated income statements while non-credit related impairment is charged to other comprehensive income, net of tax.
SIGNIFICANT GROUP CONCENTRATION OF CREDIT RISK
The Company originates commercial, consumer, and mortgage loans to customers primarily located in Lackawanna and Luzerne Counties of Pennsylvania. Although the Company has a diversified loan portfolio, a substantial portion of its debtors’ ability to honor their contracts is dependent on the economic sector in which the Company operates. The loan portfolio does not have any significant concentrations from one industry or customer.
HELD-TO-MATURITY SECURITIES
Debt securities, for which the Company has the positive intent and ability to hold to maturity, are reported at cost. Premiums and discounts are amortized or accreted, as a component of interest income over the life of the related security as an adjustment to yield using the interest method.
Debt and equity securities held principally for resale in the near-term,
or trading securities, are recorded at their fair values. Unrealized gains and losses are included in other income. The Company did not have any investment securities held for trading purposes during
2009, 2008
2007 or
2006.2007.
AVAILABLE-FOR-SALE SECURITIES
Available-for-sale (AFS) securities consist of debt and equity securities not classified as either held-to-maturity securities or trading securities and are reported at fair value. Premiums and discounts are amortized or accreted as a component of interest income over the life of the related security as an adjustment to yield using the interest method.
53
Table of Contents
Unrealized holding gains and losses, including non-credit related other-than-temporary impairment (OTTI), on AFS securities are reported as a separate component of shareholders’ equity, net of deferred income taxes, until realized. The net unrealized holding gains and losses are a component of accumulated other comprehensive (loss) income. Gains and losses from sales of securities AFS are determined using the specific identification method.
Credit related OTTI is recorded as a reduction of the amortized cost of the impaired security. Net gains and losses from sales of securities and credit related OTTI are recorded as a component of other income in the consolidated statements of income.
FEDERAL HOME LOAN BANK STOCK
Investment in
The Company, is a member of the Federal Home Loan Bank
stock is required for membership in the organizationsystem, and
is carried at cost since there is no market value available. The Companyas such is required to maintain an investment in
capital stock of the Federal Home Loan Bank of Pittsburgh (FHLB). The amount the Company is required to invest is dependent upon the relative size of outstanding borrowings the Company has with the FHLB. Based on redemption provisions of the FHLB, the stock
based uponhas no quoted market value and is carried at cost. In December 2008, in order to preserve capital, the
levelFHLB declared a suspension on the redemption of its
outstanding borrowings.stock and ceased payment of quarterly dividends. Management reviews for impairment based on the ultimate recoverability of the cost basis in the FHLB stock. Based on the financial results of the FHLB for the year-ended December 31, 2009 and 2008, management believes that the suspension of both the dividend payments and excess capital stock redemptions is temporary in nature.
Loans that management has the intent and ability to hold for the foreseeable future or until maturity or payoff are stated at face value, net of unamortized loan fees and costs and the allowance for loan losses. Interest on residential real estate loans is recorded on an amortized schedule. Commercial loan interest is accrued on the principal balance on an actual day basis. Interest on consumer loans is determined using the simple interest method.
Loans are generally placed on non-accrual status when principal or interest is past due 90 days or more. When a loan is placed on non-accrual status, all interest previously accrued but not collected is charged against current
income.earnings. Any payments received on non-accrual loans are applied, first to the outstanding loan amounts, then to the recovery of any charged-off loan amounts. Any excess is treated as a recovery of lost interest.
Loans originated and intended for sale in the secondary market are carried at the lower of cost or estimated fair value in the aggregate. Net unrealized losses are recognized through a valuation allowance by charges to income. Unrealized gains are recognized but only to the extent of previous write-downs.
ALLOWANCE FOR LOAN LOSSES
The allowance for loan losses is established through a provision for loan losses. The allowance represents an amount which, in management’s judgment, will be adequate to absorb losses on existing loans and leases that may become uncollectible. Management’s judgment in determining the adequacy of the allowance is based on evaluations of the collectability of the loans. These evaluations take into consideration such factors as changes in the nature and volume of the loan portfolio, current economic conditions that may affect the borrower’s ability to pay, collateral value, overall portfolio quality and review of specific loans for impairment.
Management applies two primary components during the loan review process to determine proper allowance levels; a specific loan loss allocation for loans that are deemed impaired; and a general loan loss allocation for those loans not specifically allocated based on historical charge-off history and qualitative factor adjustments for trends or changes in the loan portfolio. Delinquencies, changes in lending polices, local economic conditions are some of the items used for the qualitative factor adjustments. Loans considered uncollectible are charged against the allowance. Recoveries on loans previously charged off are added to the allowance.
A loan is considered impaired when, based on current information and events, it is probable that the Company will be unable to collect the scheduled payments in accordance with the contractual terms of the loan. Factors considered in determining impairment include payment status, collateral value and the probability of collecting payments when due. The significance of payment delays and/or shortfalls is determined on a case by case basis. All circumstances surrounding the loan are taken into account. Such factors include the length of the delinquency, the underlying reasons and the borrower’s prior payment record. Impairment is measured on these loans on a loan by loan basis.
The Company currently employs the Federal Financial Institutions Examination Council Interagency Policy Statement, as amended December 13, 2006, following GAAP in assessing the adequacy of the allowance. Under GAAP, the adequacy of the allowance is determined based on the provisions of Statement of Financial Accounting Standards No. 114, “Accounting by Creditors for Impairment of a Loan,” (SFAS 114) for loans specifically identified to be individually evaluated for impairment and the requirements of SFAS 5, “Accounting for Contingencies,” for large groups of homogeneous loans to be collectively evaluated.
Allowances for impaired loans under SFAS 114 are determined based on collateral values or the present value of estimated cash flows. All loans placed on a non-accruing status are considered impaired loans as well as other specific loans which, based upon all the pertinent facts known at the time, were deemed to be impaired and to which a specific allowance has been allotted. SFAS 5 allowances include a portion based on historical charge-off experience and a portion based on evaluation of qualitative factors.
54
LEASES
Financing of equipment was provided to municipal customers under lease arrangements accounted for as direct financing leases. Income earned is based on a constant periodic return on the net investment in the lease.
TRANSFER OF FINANCIAL ASSETS
Transfers of financial assets are accounted for as sales, when control over the assets has been surrendered. Control over transferred assets is deemed to be surrendered when (1) the assets have been isolated from the Company—put presumptively beyond the reach of the transferor and its creditors, even in bankruptcy or other receivership, (2) the transferee obtains the right (free of conditions that constrain it from taking advantage of that right) to pledge or exchange the transferred assets, and (3) the Company does not maintain effective control over the transferred assets through an agreement to repurchase them before their maturity or the ability to unilaterally cause the holder to return specific assets.
Nonrefundable loan origination fees and certain direct loan origination costs are recognized as a component of interest income over the life of the related loans as an adjustment to yield. The unamortized balance of these fees and costs are included as part of the loan balance to which it relates.
BANK PREMISES AND EQUIPMENT
Land is carried at cost. Bank premises and equipment are stated at cost less accumulated depreciation. Depreciation is computed on the straight-line method over the estimated useful lives of the assets. Leasehold improvements are amortized over the shorter of the term of the lease or the estimated useful lives of the improved property.
BANK OWNED LIFE INSURANCE
The Company is the owner and sole beneficiary of bank owned life insurance (BOLI) policies on certain employees. The earnings from the BOLI are recognized as a component of other income in the consolidated statements of income. The BOLI is an asset that can be liquidated, if necessary, with tax
costs associated.cost consequences. However, the Company intends to hold these policies and, accordingly, the Company has not provided for deferred income taxes on the earnings from the increase in
the cash surrender value.
FORECLOSED ASSETS HELD-FOR-SALE
Foreclosed assets held-for-sale are carried at the lower of cost or fair value less cost to sell. Losses from the acquisition of property in full and partial satisfaction of debt are treated as credit losses. Routine holding costs are included in other operating expenses. Write-downs for subsequent declines in value are recorded in other income as a component of gain or loss on sale of foreclosed assets held-for-sale. Gains or losses are recorded when the properties are sold.
The Company has two stock-based compensation plans, which are described more fully in Note
9.9, “Stock Plans”. The Company accounts for these plans under the recognition and measurement
accounting principles,
of SFAS No. 123R, Share-Based Payment, which requires the cost of share-based payment transactions
(including those with employees and non-employees) be recognized in the financial statements.
The stock compensation accounting guidance requires that compensation cost for all stock awards be calculated and recognized over the employees’ service period, generally defined as the vesting period. Compensation cost is recognized on a straight-line basis over the requisite service period for the entire award. The Company uses the Black-Sholes model to estimate the fair value of stock options.
TRUST AND FINANCIAL SERVICE FEES
Trust and financial service fees are recorded on the cash basis, which is not materially different from the accrual basis.
Advertising costs are charged to expense as incurred.
FAIR VALUE OF FINANCIAL INSTRUMENTS
Cash and short-term instruments:
The carrying
amountsvalue of
cash and short-term
financial instruments,
approximateas listed below, approximates their fair value.
These instruments generally have limited credit exposure, no stated or short-term maturities and carry interest rates that approximate market:
| · | Cash and cash equivalents; |
| · | Non-interest bearing deposit accounts; |
| · | Savings, NOW and money market accounts; |
| · | Short-term borrowings and |
Securities: With the exception of pooled trust preferred term securities, fair values on the other investment securities are determined by prices provided by a third-party vendor, who is a provider of financial market data, analytics and related services to financial institutions. Federal Home Loan Bank Stock is carried at cost, which approximates fair value. The fair values of pooled trust preferred term securities is determined based on a present value technique (income valuation) which is fullyas described in Note 3, “Security Investments.”“Investment Securities”.
Loans receivable:and leases: The fair value of all loans isand leases are estimated by the net present value of the future expected cash flows discounted at the current offering rates.55
Table of Contents
Loans available-for-sale: For loans available-for-sale, the fair value is estimated using rates currently offered for similar loans and is typically obtained from the FNMAFederal National Mortgage Association (FNMA) or the FHLB.
Deposit liabilities: The fair valuesFederal Home Loan of deposits with no stated maturity such as demand, NOW, savings and money market deposit accounts, are equal to the amount payable on demand which are their carrying values. Pittsburgh (FHLB).
Certificates of deposit: The fair values of certificate of deposit accounts are based on discounted cash flows using rates which approximate the rates we offer for deposits of similar maturities.
Short-term borrowings:Long-term debt: For short-term borrowings, the fair Fair value is estimated using the rates currently offered for similar borrowings.
Long-term debt:Cash flow hedge For other borrowed funds, the fair value is estimated using the rates currently offered for similar borrowings.Accrued interest: The carrying amounts of accrued interest approximate their fair values.
Derivative financial instruments: The carrying amount of interest rate contracts are based on pricing provided by a third party who considers observable interest rates, forward yield curves at commonly quoted intervals and volatility.
Off-balance-sheet instruments: Commitments to extend credit and unused lines of credit are priced to market. The rates on standby letters of credit are priced on prime. Therefore, the estimated fair value of these financial instruments is face value.
Deferred tax assets and liabilities are reflected at currently enacted income tax rates applicable to the period in which the deferred tax assets or liabilities are expected to be realized or settled. As changes in tax laws or rates are enacted, deferred tax assets and liabilities are adjusted through the provision for income taxes.
As part of
ourits asset/liability management program,
from time-to-time the Company will utilize
from time-to-time, interest rate floors, caps or swaps to reduce its sensitivity to interest rate fluctuations. These are derivative instruments which are recorded as assets or liabilities in the consolidated balance sheets at fair value. Changes in the fair values of derivatives are reported in the consolidated income statements or other comprehensive income (OCI) depending on the use of the derivative and whether the instrument qualifies for hedge accounting. The key criterion for hedge accounting is that the hedged relationship must be highly effective in achieving offsetting changes in those cash flows that are attributable to the hedged risk, both at inception of the hedge and on an ongoing basis.
Derivatives that qualify for hedge accounting treatment are designated as either: a hedge of the fair value of a recognized asset or liability or of an unrecognized firm commitment (a fair value hedge) or a hedge of a forecasted transaction or the variability of cash flows to be received or paid related to a recognized asset or liability (a cash flow hedge). To date, the Company has only entered into a cash flow hedge. For cash flow hedges, changes in the fair values of the derivative instruments are reported in OCI to the extent the hedge is effective. The gains and losses on derivative instruments that are reported in OCI are reflected in the consolidated income statements in the periods in which the results of operations are impacted by the variability of the cash flows of the hedged item. Generally, net interest income is increased or decreased by amounts receivable or payable with respect to the derivatives which qualify for hedge accounting. At inception of the hedge, the Company establishes the method it uses for assessing the effectiveness of the hedging derivative and the measurement approach for determining the ineffective aspect of the hedge. The ineffective portion of the hedge, if any, is recognized currently in the consolidated statements of income. The Company excludes the time value expiration of the hedge when measuring ineffectiveness.
For purposes of reporting cash flows, cash and cash equivalents includes cash on hand, amounts due from banks and interest-bearing deposits with financial institutions.
56
Table of Contents
For the years ended December 31, 2009, 2008, 2007, and 2006,2007, the Company paid interest of $11,522,000, $15,030,000 $18,306,000 and $15,318,000,$18,306,000, respectively. For the years ended December 31, 2009, 2008, 2007, and 2006,2007, the Company paid income taxes of $675,000, $1,250,000 and $1,500,000, and $1,480,000, respectively.
Transfers from loans to foreclosed assets held-for-sale amounted to
$470,000, $1,564,000
and $352,000
in 2009, 2008, and
$258,000 in 2008, 2007,
and 2006, respectively. Transfers from loans to loans available-for-sale amounted to
$28,103,000$11,454,000 and $31,472,000 in
2008.2009 and 2008, respectively. There were no transfers from loans to loans available-for-sale in
2007 or 2006.2007. Expenditures for construction in process, a component of other assets in the consolidated balance sheets, are included in acquisition of premises and equipment.
OTHER COMPREHENSIVE INCOME (LOSS)
The components of other comprehensive income (loss) and related tax effects are as follows:
| | 2008 | | 2007 | | 2006 | |
| | | | | | | |
Unrealized holding (losses) gains on available-for-sale securities | | $ | (11,866,642 | ) | $ | (24,554 | ) | $ | 223,358 | |
| | | | | | | |
Less reclassification adjustment for gains realized in income | | (25,428 | ) | (79 | ) | (1,200 | ) |
| | | | | | | |
Net unrealized (losses) gains | | (11,892,070 | ) | (24,633 | ) | 222,158 | |
| | | | | | | |
Tax effect | | 4,043,304 | | 8,375 | | (75,534 | ) |
| | | | | | | |
Net of tax amount | | (7,848,766 | ) | (16,258 | ) | 146,624 | |
| | | | | | | |
Change in cash flow hedge intrinsic value | | 220,752 | | 384,824 | | 917 | |
| | | | | | | |
Total | | $ | (7,628,014 | ) | $ | 368,566 | | $ | 147,541 | |
| | | 2009 | | | 2008 | | | 2007 | |
| | | | | | | | | | |
| Unrealized holding gains (losses) on available-for-sale securities | | $ | 8,741,249 | | | $ | (11,866,642 | ) | | $ | (24,554 | ) |
| | | | | | | | | | | | | |
| Loan reclassification adjustment for gains realized in income | | | (10,695 | ) | | | (25,428 | ) | | | (79 | ) |
| | | | | | | | | | | | | |
| Non-credit related impairment losses on investment securities | | | (8,750,163 | ) | | | - | | | | - | |
| | | | | | | | | | | | | |
| Net unrealized losses | | | (19,609 | ) | | | (11,892,070 | ) | | | (24,633 | ) |
| | | | | | | | | | | | | |
| Tax effect | | | 6,667 | | | | 4,043,304 | | | | 8,375 | |
| | | | | | | | | | | | | |
| Net of tax amount | | | (12,942 | ) | | | (7,848,766 | ) | | | (16,258 | ) |
| | | | | | | | | | | | | |
| Change in cash flow hedge intrinsic value | | | (606,493 | ) | | | 220,752 | | | | 384,824 | |
| | | | | | | | | | | | | |
| Total | | $ | (619,435 | ) | | $ | (7,628,014 | ) | | $ | 368,566 | |
The components of accumulated other comprehensive loss consisted
of: | | 2008 | | 2007 | | 2006 | |
| | | | | | | |
Unrealized holding losses on available-for-sale securities | | $ | (8,830,733 | ) | $ | (981,967 | ) | $ | (965,709 | ) |
| | | | | | | |
Cash flow hedge intrinsic value | | 606,493 | | 385,741 | | 917 | |
| | | | | | | |
Accumulated other comprehensive loss | | $ | (8,224,240 | ) | $ | (596,226 | ) | $ | (964,792 | ) |
2.CASH
of:
| | | 2009 | | | 2008 | | | 2007 | |
| | | | | | | | | | |
| Unrealized holding losses on available-for-sale securities | | $ | (3,068,568 | ) | | $ | (8,830,733 | ) | | $ | (981,967 | ) |
| | | | | | | | | | | | | |
| Non-credit related impairment losses on investment securities | | | (6,125,827 | ) | | | - | | | | - | |
| | | | | | | | | | | | | |
| Cash flow hedge intrinsic value | | | - | | | | 606,493 | | | | 385,741 | |
| | | | | | | | | | | | | |
| Accumulated other comprehensive loss | | $ | (9,194,395 | ) | | $ | (8,224,240 | ) | | $ | (596,226 | ) |
The Company is required by the Federal Reserve Bank to maintain average reserve balances based on a percentage of deposits. The amounts of those reserve requirements on December 31,
2009 and 2008
were $600,000 and
2007 were $594,000,
and $702,000, respectively.
Deposits with any one financial institution are insured up to $250,000. From time-to-time, the Company
maintainsmay maintain cash and cash equivalents with certain other financial institutions in excess of the insured amount.
Amortized cost and fair value of investment securities at December 31,
20082009 and
20072008 are as follows
(in(dollars in thousands):
| | 2008 | |
| | Amortized
cost | | Gross
unrealized
gains | | Gross
unrealized
losses | | Fair
value | |
| | | | | | | | | |
Held-to-maturity securities: | | | | | | | | | |
Mortgage-backed securities | | $ | 909 | | $ | 31 | | $ | — | | $ | 940 | |
| | | | | | | | | |
Available-for-sale securities: | | | | | | | | | |
U.S. government agencies and corporations | | $ | 45,824 | | $ | 134 | | $ | 2,451 | | $ | 43,507 | |
Obligations of states and political subdivisions | | 18,009 | | 97 | | 553 | | 17,553 | |
Corporate bonds | | 21,415 | | — | | 11,155 | | 10,260 | |
Mortgage-backed securities | | 11,088 | | 442 | | — | | 11,530 | |
| | | | | | | | | |
Total debt securities | | 96,336 | | 673 | | 14,159 | | 82,850 | |
| | | | | | | | | |
Equity securities | | 322 | | 122 | | 16 | | 428 | |
| | | | | | | | | |
Total available-for-sale securities | | $ | 96,658 | | $ | 795 | | $ | 14,175 | | $ | 83,278 | |
| | 2007 | |
| | Amortized
cost | | Gross
unrealized
gains | | Gross
unrealized
losses | | Fair
value | |
| | | | | | | | | |
Held-to-maturity securities: | | | | | | | | | |
Mortgage-backed securities | | $ | 1,147 | | $ | 33 | | $ | — | | $ | 1,180 | |
| | | | | | | | | |
Available-for-sale securities: | | | | | | | | | |
U.S. government agencies and corporations | | $ | 35,406 | | $ | 101 | | $ | 263 | | $ | 35,244 | |
Obligations of states and political subdivisions | | 12,127 | | 63 | | 57 | | 12,133 | |
Corporate bonds | | 17,532 | | — | | 1,197 | | 16,335 | |
Mortgage-backed securities | | 57,930 | | 70 | | 380 | | 57,620 | |
| | | | | | | | | |
Total debt securities | | 122,995 | | 234 | | 1,897 | | 121,332 | |
| | | | | | | | | |
Equity securities | | 329 | | 183 | | 7 | | 505 | |
| | | | | | | | | |
Total available-for-sale securities | | $ | 123,324 | | $ | 417 | | $ | 1,904 | | $ | 121,837 | |
| | | 2009 | |
| | | | | | Gross | | | Gross | | | | |
| | | Amortized | | | unrealized | | | unrealized | | | Fair | |
| | | cost | | | gains | | | losses | | | value | |
| | | | | | | | | | | | | |
| Held-to-maturity securities: | | | | | | | | | | | | |
| MBS - GSE residential | | $ | 709 | | | $ | 56 | | | $ | - | | | $ | 765 | |
| | | | | | | | | | | | | | | | | |
| Available-for-sale securities: | | | | | | | | | | | | | | | | |
| Agency - GSE | | $ | 34,205 | | | $ | 4 | | | $ | 1,077 | | | $ | 33,132 | |
| Obligations of states and | | | | | | | | | | | | | | | | |
| political subdivisions | | | 23,013 | | | | 394 | | | | 137 | | | | 23,270 | |
| Corporate bonds: | | | | | | | | | | | | | | | | |
| Pooled trust preferred securities | | | 18,794 | | | | - | | | | 13,552 | | | | 5,242 | |
| MBS - GSE residential | | | 13,418 | | | | 401 | | | | 71 | | | | 13,748 | |
| | | | | | | | | | | | | | | | | |
| Total debt securities | | | 89,430 | | | | 799 | | | | 14,837 | | | | 75,392 | |
| | | | | | | | | | | | | | | | | |
| Equity securities - financial services | | | 322 | | | | 121 | | | | 14 | | | | 429 | |
| | | | | | | | | | | | | | | | | |
| Total available-for-sale securities | | $ | 89,752 | | | $ | 920 | | | $ | 14,851 | | | $ | 75,821 | |
| | | 2008 | |
| | | | | | Gross | | | Gross | | | | |
| | | Amortized | | | unrealized | | | unrealized | | | Fair | |
| | | cost | | | gains | | | losses | | | value | |
| | | | | | | | | | | | | |
| Held-to-maturity securities: | | | | | | | | | | | | |
| MBS - GSE residential | | $ | 909 | | | $ | 31 | | | $ | - | | | $ | 940 | |
| | | | | | | | | | | | | | | | | |
| Available-for-sale securities: | | | | | | | | | | | | | | | | |
| Agency - GSE | | $ | 45,824 | | | $ | 134 | | | $ | 2,451 | | | $ | 43,507 | |
| Obligations of states and | | | | | | | | | | | | | | | | |
| political subdivisions | | | 18,009 | | | | 97 | | | | 553 | | | | 17,553 | |
| Corporate bonds: | | | | | | | | | | | | | | | | |
| Pooled trust preferred securities | | | 21,415 | | | | - | | | | 11,155 | | | | 10,260 | |
| MBS - GSE residential | | | 11,088 | | | | 442 | | | | - | | | | 11,530 | |
| | | | | | | | | | | | | | | | | |
| Total debt securities | | | 96,336 | | | | 673 | | | | 14,159 | | | | 82,850 | |
| | | | | | | | | | | | | | | | | |
| Equity securities - financial services | | | 322 | | | | 122 | | | | 16 | | | | 428 | |
| | | | | | | | | | | | | | | | | |
| Total available-for-sale | | $ | 96,658 | | | $ | 795 | | | $ | 14,175 | | | $ | 83,278 | |
Most of the Company’s debt
and equity securities are pledged to secure trust funds, public deposits, repurchase agreements, other short-term
borrowings, Federal Home Loan Bank of Pittsburgh (FHLB) borrowings, Federal Reserve Bank of Philadelphia Discount Window borrowings and certain other deposits as required by law.
U.S. governmentAgency – GSE securities pledged on repurchase agreements are under the Company’s control.
The amortized cost and fair value of debt securities at December 31,
20082009 by contractual maturity are shown below
(in(dollars in thousands):
| | Amortized
cost | | Fair
value | |
| | | | | |
Held-to-maturity securities: | | | | | |
Mortgage-backed securities | | $ | 909 | | $ | 940 | |
| | | | | |
Available-for-sale securities: | | | | | |
Debt securities: | | | | | |
Due in one year or less | | $ | — | | $ | — | |
Due after one year through five years | | — | | — | |
Due after five years through ten years | | 10,649 | | 10,706 | |
Due after ten years | | 74,599 | | 60,614 | |
| | | | | |
Total debt securities | | 85,248 | | 71,320 | |
| | | | | |
Mortgage-backed securities | | 11,088 | | 11,530 | |
| | | | | |
Total available-for-sale debt securities | | $ | 96,336 | | $ | 82,850 | |
| | | Amortized | | | Fair | |
| | | cost | | | value | |
| Held-to-maturity securities: | | | | | | |
| MBS - GSE residential | | $ | 709 | | | $ | 765 | |
| | | | | | | | | |
| Available-for-sale securities: | | | | | | | | |
| Debt securities: | | | | | | | | |
| Due in one year or less | | $ | - | | | $ | - | |
| Due after one year through five years | | | - | | | | - | |
| Due after five years through ten years | | | 7,590 | | | | 7,532 | |
| Due after ten years | | | 68,422 | | | | 54,112 | |
| | | | | | | | | |
| Total debt securities | | | 76,012 | | | | 61,644 | |
| | | | | | | | | |
| MBS - GSE residential | | | 13,418 | | | | 13,748 | |
| | | | | | | | | |
| Total available-for-sale debt securities | | $ | 89,430 | | | $ | 75,392 | |
Expected maturities will differ from contractual maturities because issuers and borrowers may have the right to call or repay obligations with or without call or prepayment penalty.
Federal agencyAgency – GSE and municipal securities are included based on their original stated maturity.
Mortgage-backed securities,MBS – GSE residential, which are based on weighted-average lives and subject to monthly principal pay-downs, are listed in total.
Table of Contents
The following table presents the fair value and gross unrealized losses of investments aggregated by investment type, the length of time and the number of securities that have been in a continuous unrealized loss position at December 31,
2009 and 2008
and 2007 (in(dollars in thousands):
| | Less than 12 months | | 12 months or more | | Total | |
| | Fair
value | | Unrealized
losses | | Fair
value | | Unrealized
losses | | Fair
value | | Unrealized
losses | |
| | | | | | | | | | | | | |
December 31, 2008: | | | | | | | | | | | | | |
| | | | | | | | | | | | | |
U.S. government agencies and corporations | | $ | 12,506 | | $ | 1,878 | | $ | 5,145 | | $ | 573 | | $ | 17,651 | | $ | 2,451 | |
Obligations of states and political subdivisions | | 8,154 | | 496 | | 1,455 | | 57 | | 9,609 | | 553 | |
Mortgage-backed securities | | 17 | | — | | — | | — | | 17 | | — | |
Corporate bonds | | 2,235 | | 2,352 | | 8,025 | | 8,803 | | 10,260 | | 11,155 | |
| | | | | | | | | | | | | |
Subtotal, debt securities | | 22,912 | | 4,726 | | 14,625 | | 9,433 | | 37,537 | | 14,159 | |
| | | | | | | | | | | | | |
Equity securities | | — | | — | | 60 | | 16 | | 60 | | 16 | |
| | | | | | | | | | | | | |
Total temporarily impaired securities | | $ | 22,912 | | $ | 4,726 | | $ | 14,685 | | $ | 9,449 | | $ | 37,597 | | $ | 14,175 | |
Number of securities | | 20 | | | | 22 | | | | 42 | | | |
| | | | | | | | | | | | | |
December 31, 2007: | | | | | | | | | | | | | |
| | | | | | | | | | | | | |
U.S. government agencies and corporations | | $ | 5,311 | | $ | 126 | | $ | 11,827 | | $ | 137 | | $ | 17,138 | | $ | 263 | |
Obligations of states and political subdivisions | | 5,177 | | 55 | | 204 | | 2 | | 5,381 | | 57 | |
Mortgage-backed securities | | 12,809 | | 16 | | 26,603 | | 364 | | 39,412 | | 380 | |
Corporate bonds | | 14,076 | | 954 | | 2,260 | | 243 | | 16,336 | | 1,197 | |
| | | | | | | | | | | | | |
Subtotal, debt securities | | 37,373 | | 1,151 | | 40,894 | | 746 | | 78,267 | | 1,897 | |
| | | | | | | | | | | | | |
Equity securities | | 69 | | 7 | | — | | — | | 69 | | 7 | |
| | | | | | | | | | | | | |
Total temporarily impaired securities | | $ | 37,442 | | $ | 1,158 | | $ | 40,894 | | $ | 746 | | $ | 78,336 | | $ | 1,904 | |
Number of securities | | 33 | | | | 22 | | | | 55 | | | |
| | | Less than 12 months | | | More than 12 months | | | Total | |
| | | Fair | | | Unrealized | | | Fair | | | Unrealized | | | Fair | | | Unrealized | |
| | | value | | | losses | | | value | | | losses | | | value | | | losses | |
| | | | | | | | | | | | | | | | | | | |
| December 31, 2009: | | | | | | | | | | | | | | | | | | |
| | | | | | | | | | | | | | | | | | | |
| Agency - GSE | | $ | 21,090 | | | $ | 291 | | | $ | 5,038 | | | $ | 786 | | | $ | 26,128 | | | $ | 1,077 | |
| Obligations of states and political subdivisions | | | 3,534 | | | | 115 | | | | 2,600 | | | | 22 | | | | 6,134 | | | | 137 | |
| Corporate bonds: | | | | | | | | | | | | | | | | | | | | | | | | |
| Pooled trust preferred securities | | | - | | | | - | | | | 5,242 | | | | 13,552 | | | | 5,242 | | | | 13,552 | |
| MBS – GSE residential | | | 5,055 | | | | 71 | | | | - | | | | - | | | | 5,055 | | | | 71 | |
| Subtotal, debt securities | | | 29,679 | | | | 477 | | | | 12,880 | | | | 14,360 | | | | 42,559 | | | | 14,837 | |
| | | | | | | | | | | | | | | | | | | | | | | | | |
| Equity securities - financial services | | | 114 | | | | 10 | | | | 46 | | | | 4 | | | | 160 | | | | 14 | |
| | | | | | | | | | | | | | | | | | | | | | | | | |
| Total temporarily impaired securities | | $ | 29,793 | | | $ | 487 | | | $ | 12,926 | | | $ | 14,364 | | | $ | 42,719 | | | $ | 14,851 | |
| Number of securities | | | 23 | | | | | | | | 17 | | | | | | | | 40 | | | | | |
| | | | | | | | | | | | | | | | | | | | | | | | | |
| December 31, 2008: | | | | | | | | | | | | | | | | | | | | | | | | |
| | | | | | | | | | | | | | | | | | | | | | | | | |
| Agency - GSE | | $ | 12,506 | | | $ | 1,878 | | | $ | 5,145 | | | $ | 573 | | | $ | 17,651 | | | $ | 2,451 | |
| Obligations of states and political subdivisions | | | 8,154 | | | | 496 | | | | 1,455 | | | | 57 | | | | 9,609 | | | | 553 | |
| Corporate bonds: | | | | | | | | | | | | | | | | | | | | | | | | |
| Pooled trust preferred securities | | | 2,235 | | | | 2,352 | | | | 8,025 | | | | 8,803 | | | | 10,260 | | | | 11,155 | |
| MBS - GSE residential | | | 17 | | | | - | | | | - | | | | - | | | | 17 | | | | - | |
| | | | | | | | | | | | | | | | | | | | | | | | | |
| Subtotal, debt securities | | | 22,912 | | | | 4,726 | | | | 14,625 | | | | 9,433 | | | | 37,537 | | | | 14,159 | |
| | | | | | | | | | | | | | | | | | | | | | | | | |
| Equity securities - financial services | | | - | | | | - | | | | 60 | | | | 16 | | | | 60 | | | | 16 | |
| | | | | | | | | | | | | | | | | | | | | | | | | |
| Total securities Total temporarily impaired securities | | $ | 22,912 | | | $ | 4,726 | | | $ | 14,685 | | | $ | 9,449 | | | $ | 37,597 | | | $ | 14,175 | |
| Number of securities | | | 20 | | | | | | | | 22 | | | | | | | | 42 | | | | | |
As of December 31, 20082009 the debt securities with unrealized losses have depreciated 27.4%25.9% compared to 2.4%27.4% at December 31, 2007.2008. Management believes that the cause of the unrealized losses is related to changes in interest rates, instability in the capital markets or the limited trading activity due to recentilliquid debt market illiquid conditions and is not directly related to credit quality, which is consistent with its past experience. Nearly all of the securities in the portfolio have fixed rates or have predetermined scheduled rate changes, and many have call features that allow the issuer to call the security at par before its stated maturity without penalty.60
Table of Contents
Management performsconducts a formal review of investment securities on a quarterly basis for the investment portfolio quarterlypresence of other-than-temporary-impairment (OTTI). The accounting guidance related to determineOTTI, adopted in 2009, requires the cause of declines inCompany to assess whether OTTI is present when the fair value of each security. The Company uses inputs provided by independent third partiesa debt security is less than its amortized cost at the balance sheet date. Under these circumstances, OTTI is considered to determinehave occurred if: (1) the fair valueentity has intent to sell the security; (2) more likely than not the entity will be required to sell the security before recovery of its investment securities portfolio. Inputs provided by the third party are reviewed and corroborated by management. Evaluations of the causes of the unrealized losses are performed to determine whether impairment, if any, is temporary or other-than-temporary. Considerations such as the Company’s intent and ability to hold the securities to maturity, recoverability of the invested amounts over the intended holding period, the length of time and the severity in pricing decline below cost, the interest rate environment, receipts of amounts contractually due and whether or not there is an active market for the security, for example are applied, along with the financial condition of the issuer for management to make a realistic judgment of the probability that the Company will be unable to collect all amounts (principal and interest) due in determining whether a security is other-than-temporarily impaired. If a decline in value is deemed to be other-than-temporary, the amortized cost of the security is reduced by the impairment amount and a corresponding charge to earnings is recognized. If at the time of sale, callbasis; or maturity the proceeds exceed the security’s amortized cost, the impairment charge may be fully or partially recovered.
During 2008, uncertainty in the financial markets increased the volatility in fair value estimates for the securities in our investment portfolio. Compared to year-end 2007, the fair values of securities have declined. Management believes these changes were due mainly to liquidity problems in the financial markets, not deterioration in the creditworthiness of the issuers.
At December 31, 2008, the securities with the most significant reductions in fair value and associated estimated unrealized losses were in the Company’s corporate bond portfolio consisting of collateralized debt obligation (CDO) securities that are backed by pooled trust preferred term securities (preferred term securities) issued by banks, thrifts and insurance companies.
Except for preferred term securities, market values on the other investment securities are determined by prices provided by a third-party vendor, who is a provider of financial market data, analytics and related services to financial institutions. For the trust preferred term securities portfolio, management was unable to obtain readily attainable and realistic pricing from market traders due to lack of active market participants and therefore management has determined that the market for these securities is currently inactive.
The Company owns 13 issues of preferred term securities. The market for these securities at December 31, 2008 is not active and markets for similar securities are also not active. The inactivity was evidenced first by a significant widening of the bid-ask spread in the brokered markets in which preferred term securities trade and then by a significant decrease in the volume of trades relative to historical levels. The new issue market is also inactive as no new preferred term securities have been issued since 2007. There are currently very few market participants who are willing and or able to transact for these securities. Given conditions in the debt markets today and the absence of observable transactions in the secondary and new issue markets, we determined:
· The few observable transactions and market quotations that are available are not reliable for purposes of determining fair value at December 31, 2008,
· An income valuation approach technique (present value technique) that maximizes the use of relevant observable inputs and minimizes the use of unobservable inputs will be equally or more representative of fair value than the market approach valuation technique used at prior measurement dates and
· Our preferred term securities will be classified within Level 3 of the fair value hierarchy because we determined that significant adjustments are required to determine fair value at the measurement date. Our preferred term securities valuations were prepared by an independent third party. Their approach to determining fair value involved the following:
· Data about the issue structure as defined in the indenture and the underlying collateral were collected.
· The credit quality of the collateral is estimated using average probability of default values for each issuer (adjusted for rating levels and stressed to reflect the current environment),
· The default probabilities also considered the potential for correlation among issuers within the same industry (e.g. banks with other banks),
· The loss given default was assumed to be 95%,
61
Table of Contents
· The cash flows were forecast for the underlying collateral and applied to each CDO tranche to determine the resulting distribution among the securities,
· The expected cash flows were discounted to calculate(3) the present value of expected cash flows is not sufficient to recover the security,
·entire amortized cost.
The effective discountnewly adopted guidance requires that credit-related OTTI be recognized in earnings while non-credit related OTTI on securities not expected to be sold be recognized in other comprehensive income (OCI). Non-credit related OTTI is based on other factors effecting market conditions, including illiquidity. Presentation of OTTI is made in the consolidated statements of income on a gross basis with an offset for the amount of non-credit related OTTI recognized in OCI. Non-credit related OTTI recognized in earnings prior to April 1, 2009 has been reclassified from retained earnings to accumulated OCI as a cumulative effect adjustment.
The Company’s OTTI evaluation process also follows the guidance set forth in topics related to debt and equity securities. The guidance set forth in these pronouncements require the Company to take into consideration current market conditions, fair value in relationship to cost, extent and nature of changes in fair value, issuer rating changes and trends, volatility of earnings, current analysts’ evaluations, all available information relevant to the collectability of debt securities, the ability and intent to hold investments until a recovery of fair value, which may be maturity, and other factors when evaluating for the existence of OTTI. This guidance also eliminates the requirement that a holder’s best estimate of cash flows is based upon those that a market participant would use. Instead, the guidance requires that OTTI be recognized as a realized loss through earnings when there has been an adverse change in the holder’s expected cash flows such that the full amount (principal and interest) will probably not be received. This requirement is consistent with the impairment model in the guidance for accounting for debt and equity securities.
For all security types discussed below where no OTTI is considered necessary at December 31, 2009, the Company applied the criteria provided in the recognition and presentation of OTTI guidance. That is, management has no intent to sell the securities and no conditions were identified by management that more likely than not would require the Company to sell the securities before recovery of their amortized cost basis.
Agency - GSE and MBS - GSE residential
Agency – GSE and MBS – GSE residential securities consist of medium and long-term notes issued by Federal Home Loan Mortgage Corporation (FHLMC), Federal National Mortgage Association (FNMA), Federal Home Loan Bank (FHLB) and Government National Mortgage Association (GNMA). These securities have interest rates on an overall basis range from 5.04%that are largely fixed-rate issues, have varying mid- to 14.19%long-term maturity dates and have contractual cash flows guaranteed by the U.S. government or agencies of the U.S. government. In the latter half of 2008, the U.S. Government provided substantial liquidity to FNMA and FHLMC to bolster their creditworthiness.
Obligations of states and political subdivisions
The municipal securities are bank qualified, general obligation bonds rated as investment grade by various credit rating agencies and have fixed rates of interest with mid- to long-term maturities. Fair values of these securities are highly dependent upon thedriven by interest rates. Management performs ongoing credit quality reviews on these issues.
In all of the above security types, the decline in fair value is attributable to changes in interest rates and not credit quality. As such, no OTTI is considered necessary for these securities as of December 31, 2009.
Pooled trust preferred securities
A Pooled Trust Preferred Collateralized Debt Obligation (CDO) is a type of investment security collateralized by trust preferred securities (TPS) issued by banks, insurance companies and real estate investment trusts (REITs). The primary collateral type is a TPS issued by a bank. A TPS is a hybrid security with both debt and equity characteristics such as the relative position of the trancheability to voluntarily defer interest payments for up to 20 consecutive quarters. A TPS is considered a junior security in the capital structure of the issuer.
There are various tranches or investment classes issued by the CDO with the most senior tranche having the lowest yield but the most protection from credit losses compared to other tranches that are subordinate. Losses are generally allocated from the lowest tranche with the equity component holding the most risk and then subordinate tranches in reverse order up to the senior tranche. The allocation of losses is defined in the indenture when the CDO was formed.
Unrealized losses in the pooled trust preferred securities (PreTSLs) were caused mainly by the following factors: (1) collateral deterioration due to bank failures and credit concerns across the banking sector; (2) widening of credit spreads and (3) illiquidity in the market. The Company’s review of these securities, in accordance with the previous discussion, determined that in 2009 credit-related OTTI be recorded on five holdings of these securities all of which are in the AFS securities portfolio.
The following table summarizes the amount of credit-related OTTI recognized in earnings under the new guidance for 2009 and the
prepayment assumptions,·amount of credit- and non-credit related OTTI recognized in earnings under the former guidance for 2008 by security during the periods indicated (dollars in thousands):
| | | Twelve months ended | |
| | | December 31, | |
| | | 2009 | | | 2008 | |
| Pooled trust preferred securities: | | | | | | |
| PreTSL VII, Mezzanine | | $ | 674 | | | $ | 430 | |
| PreTSL IX, B1, B3 | | | 690 | | | | - | |
| PreTSL XV, B1 | | | 154 | | | | - | |
| PreTSL XVI, C | | | 1,275 | | | | - | |
| PreTSL XXV, C1 | | | 507 | | | | - | |
| Equity securities | | | - | | | | 6 | |
| Total | | $ | 3,300 | | | $ | 436 | |
The calculations were modeledfollowing table is a tabular roll-forward of the amount of credit-related OTTI recognized in several thousand scenarios usingearnings (dollars in thousands):
| | | Twelve months ended | |
| | | December 31, 2009 | |
| | | HTM | | | AFS | | | Total | |
| Beginning balance of credit-related OTTI | | $ | - | | | $ | (429 | ) | | $ | (429 | ) |
| Reduction - cumulative effect of accounting change | | | - | | | | 531 | | | | 531 | |
| Additions for credit-related OTTI | | | | | | | | | | | | |
| not previously recognized | | | - | | | | (2,626 | ) | | | (2,626 | ) |
| Additional credit-related OTTI | | | | | | | | | | | | |
| previously recognized when there | | | | | | | | | | | | |
| is no intent to sell before recovery | | | | | | | | | | | | |
| of amortized cost basis | | | - | | | | (674 | ) | | | (674 | ) |
| Ending balance of credit-related OTTI | | $ | - | | | $ | (3,198 | ) | | $ | (3,198 | ) |
To determine the ending balance of credit-related OTTI, the Company used discounted present value cash flow analysis and compared the results with the bond’s face value. The analysis considered the following assumptions: the discount rate which equated to the discount margin for each tranche (credit spread) at the time of purchase which was then added to the appropriate three-month libor forward rate obtained from the forward libor curve; historical average default rates obtained from the FDIC for U.S. Banks and Thrifts for the period spanning 1988 to 1991 increased by a Monte Carlo enginefactor of three and rolled forward to establishproject a distributionrate of intrinsic valuesdefault of approximately one-third; the default rate was reduced by the actual deferrals / defaults experienced in all preferred term securities for the full year 2008 and the averagefirst nine months of 2009; the remaining 10% estimated default rate was usedthen stratified with higher default rates occurring in the beginning regressing to normal in 2011 with an estimated 15% recovery by way of a two year lag; and no prepayments with receipt of principal at maturity. The present value of PreTSL VII as modeled resulted in cash flow of $777,000 as of April 1, 2009, or approximately $224,000 below the bond’s face value of $1,001,000. Upon adoption, the recognition and presentation of OTTI guidance in the second quarter of 2009, and as a result of the credit-related OTTI determination, the $531,000 non-credit related portion of OTTI that existed prior to April 1, 2009, or $351,000 after tax, was reclassified from retained earnings to OCI as a cumulative effect adjustment.
Two of the Company’s initial mezzanine holdings (PreTSLs IV and V) are now senior tranches and the remaining holdings are mezzanine tranches. As of December 31, 2009, none of the pooled trust preferred securities were investment grade. At the time of initial issue, the subordination in the Company’s tranches ranged in size from approximately 8.0% to 25.2% of the total principal amount of the respective securities and no more than 5% of any pooled trust preferred security consisted of a security issued by any one bank and 4% for
valuation purposes.Basedinsurance companies. As of December 31, 2009, management estimates the subordination in the Company’s tranches ranging from 0% to 19.0% of the current performing collateral. During the fourth quarter of 2009, PreTSLs VII, XV, XVI and XXV with a combined book value of $3.6 million and corresponding fair value of $0.6 million were placed on non-accrual status. Each of these securities have impairment of principal and interest was “paid-in-kind”. Each of the technique described,other issues will be evaluated quarterly for the Company determined thatpresence of these two conditions and placed on non-accrual status if necessary.
The following table provides additional information with respect to the Company’s pooled trust preferred securities as of December 31, 2008,2009:
| | | | | | | | | | | | | | | | Current | | | | | | Actual | | | | | | Excess | | | Effective | |
| | | | | | | | | | | | | | | | number | | | | | | deferrals | | | | | | subordination (2) | | | subordination (3) | |
| | | | | | | | | | | | | | | | of | | | Actual | | | and defaults | | | | | | as a % of | | | as a % of | |
| | | | | | | | | | | | | | Moody's / | | banks / | | | deferrals | | | as a % of | | | Excess | | | current | | | current | |
| | | | | | Book | | | Fair | | | Unrealized | | Fitch | | insurance | | | and defaults | | | current | | | subordination | | | performing | | | performing | |
| Deal | | Class | | | value | | | value | | | loss | | ratings (1) | | companies | | | $(000) | | | collateral | | | $(000) | | | collateral | | | collateral | |
| Pre TSL IV | | Mezzanine | | | $ | 609,971 | | | $ | 440,643 | | | $ | (169,328 | ) | Ca / CCC | | | 6 / - | | | | 18,000 | | | | 27.1 | | | | 9,760 | | | | 19.0 | | | | 33.1 | |
| Pre TSL V | | Mezzanine | | | | 276,694 | | | | 167,566 | | | | (109,128 | ) | Ba3 / C | | | 4 / - | | | | 18,950 | | | | 43.1 | | | None | | | | N/A | | | | N/A | |
| Pre TSL VII | | Mezzanine | | | | 431,869 | | | | 219,403 | | | | (212,466 | ) | Ca / C | | | 19 / - | | | | 142,000 | | | | 62.6 | | | None | | | | N/A | | | | N/A | |
| Pre TSL IX | | B-1,B-3 | | | | 2,810,338 | | | | 1,101,100 | | | | (1,709,238 | ) | Ca / C | | | 49 / - | | | | 126,510 | | | | 28.1 | | | None | | | | N/A | | | | N/A | |
| Pre TSL XI | | B-3 | | | | 2,391,182 | | | | 965,000 | | | | (1,426,182 | ) | Ca / C | | | 65 / - | | | | 114,250 | | | | 19.0 | | | None | | | | N/A | | | | 9.4 | |
| Pre TSL XV | | B-1 | | | | 1,359,562 | | | | 296,737 | | | | (1,062,825 | ) | Ca / C | | | 63 / 9 | | | | 141,050 | | | | 23.6 | | | None | | | | N/A | | | | 1.6 | |
| Pre TSL XVI | | C | | | | 1,289,741 | | | | 65,122 | | | | (1,224,619 | ) | Ca / C | | | 49 / 7 | | | | 182,270 | | | | 31.7 | | | None | | | | N/A | | | | N/A | |
| Pre TSL XVII | | C | | | | 1,001,574 | | | | 91,012 | | | | (910,562 | ) | Ca / C | | | 50 / 7 | | | | 95,840 | | | | 19.9 | | | None | | | | N/A | | | | 7.7 | |
| Pre TSL XVIII | | C | | | | 1,003,885 | | | | 123,578 | | | | (880,307 | ) | Ca / C | | | 66 / 14 | | | | 134,640 | | | | 19.9 | | | None | | | | N/A | | | | 7.6 | |
| Pre TSL XIX | | C | | | | 2,537,026 | | | | 477,461 | | | | (2,059,565 | ) | Ca / C | | | 60 / 14 | | | | 115,000 | | | | 16.4 | | | None | | | | N/A | | | | 11.6 | |
| Pre TSL XXIV | | B-1 | | | | 2,198,696 | | | | 499,473 | | | | (1,699,223 | ) | Caa3 / CC | | | 80 / 13 | | | | 309,300 | | | | 29.4 | | | None | | | | N/A | | | | 15.7 | |
| Pre TSL XXV | | C-1 | | | | 506,673 | | | | 2,128 | | | | (504,545 | ) | Ca / C | | | 64 / 9 | | | | 271,600 | | | | 31.0 | | | None | | | | N/A | | | | N/A | |
| Pre TSL XXVII | | B | | | | 2,376,455 | | | | 792,621 | | | | (1,583,834 | ) | Caa3 / B | | | 42 / 7 | | | | 69,300 | | | | 21.0 | | | | 10,833 | | | | 4.2 | | | | 25.4 | |
| | | | | | $ | 18,793,666 | | | $ | 5,241,844 | | | $ | (13,551,822 | ) | | | | | | | | | | | | | | | | | | | | | | | | | |
(1) All ratings have been updated through February 12, 2010.
(2) Excess subordination represents the fair value of one preferred term security had declined $430,000 below its amortized cost and has deemed this security to be other-than-temporarily impaired. Accordingly, this amount has been recorded as an impairment charge and is included as a component of other income in the consolidated income statements for the year ended December 31, 2008. The market valueexcess (if any) of the Company’s investmentamount of performing collateral over the given class of bonds.
(3) Effective subordination represents the estimated percentage of the performing collateral that would need to defer or default at the next payment in
preferred term securities has declined by $9,958,000 since December 31, 2007. The Company closely monitorsorder to trigger a loss of principal or interest. This differs from excess subordination in that it considers the
preferred term securities market and performs collateral sufficiency and cash flow analyses on at least a quarterly basis. Future analyses could yield results that may indicate further impairment has occurred and therefore require additional write-downs and corresponding other-than-temporary charges to current earnings. In addition to the impairment chargeeffect of excess interest earned on the
preferred term securities portfolio, the Company had an equity position in FNMA common stock whose fair value declined below its cost basis by $6,000 and has also been deemed to be other-than-temporarily impaired and written down as of December 31, 2008. There were no other-than-temporary impairment write-downs recorded in 2007 or 2006.performing collateral.
For a further discussion on the fair value of the Company’s financial instruments, see Note 12, “Fair
valueValue of
financial instrumentsFinancial Instruments and
derivatives.”As of December 31, 2008, the AFS debt securities portfolio was carried at a net unrealized loss of $13,486,000 compared to a net unrealized loss of $1,663,000 at December 31, 2007. Management believes the cause of the unrealized losses is related to changes in interest rates or the limited trading activity due to recent debt market illiquid conditions and is not directly related to credit quality, which is consistent with its past experience. In addition, the Company has the ability and intent to hold its investments for a period of time sufficient for the fair value of the securities to recover, which may be at maturity.
Derivatives”.
Gross realized gains and losses on sales of available-for-sale securities, determined using specific identification of the securities were as follows:
| | 2008 | | 2007 | | 2006 | |
| | | | | | | |
Gross realized gain | | $ | 113,070 | | $ | 18,853 | | $ | 71,201 | |
Gross realized loss | | 87,642 | | 18,774 | | 70,001 | |
Net gain | | $ | 25,428 | | $ | 79 | | $ | 1,200 | |
62
| | | 2009 | | | 2008 | | | 2007 | |
| | | | | | | | | | |
| Gross realized gain | | $ | 84,989 | | | $ | 113,070 | | | $ | 18,853 | |
| Gross realized loss | | | 74,294 | | | | 87,642 | | | | 18,774 | |
| Net gain | | $ | 10,695 | | | $ | 25,428 | | | $ | 79 | |
The
major classifications of loans and leases at December 31,
20082009 and
20072008 are summarized as follows:
| | 2008 | | 2007 | |
| | | | | |
Commercial and CRE | | $ | 245,479,992 | | $ | 216,057,882 | |
Residential real estate | | 98,510,562 | | 116,978,378 | |
Consumer | | 85,091,205 | | 81,998,093 | |
Real estate construction | | 11,426,978 | | 10,703,249 | |
Direct financing leases | | 443,957 | | 511,178 | |
| | | | | |
Total | | 440,952,694 | | 426,248,780 | |
| | | | | |
Less: | | | | | |
Allowance for loan losses | | 4,745,234 | | 4,824,401 | |
| | | | | |
Loans and leases, net | | $ | 436,207,460 | | $ | 421,424,379 | |
| | | 2009 | | | 2008 | |
| | | | | | | |
| Real estate: | | | | | | |
| Commercial | | $ | 186,726,196 | | | $ | 164,772,236 | |
| Residential | | | 71,001,298 | | | | 98,510,562 | |
| Construction | | | 10,125,354 | | | | 11,426,978 | |
| Commercial and industrial | | | 76,787,809 | | | | 80,707,756 | |
| Consumer | | | 85,689,831 | | | | 85,091,205 | |
| Direct financing leases | | | 367,169 | | | | 443,957 | |
| | | | | | | | | |
| Total | | | 430,697,657 | | | | 440,952,694 | |
| | | | | | | | | |
| Less: | | | | | | | | |
| Allowance for loan losses | | | 7,573,603 | | | | 4,745,234 | |
| | | | | | | | | |
| Loans and leases, net | | $ | 423,124,054 | | | $ | 436,207,460 | |
Net deferred loan costs of
$629,000$495,000 and
$722,000$629,000 have been added to the carrying values of loans at December 31,
2009 and 2008,
and 2007, respectively.
The Company services real estate loans for investors in the secondary mortgage market which are not included in the accompanying consolidated balance
sheet.sheets. The approximate amount of mortgages serviced amounted to
$157,516,000 as of December 31, 2009 and $95,856,000 as of December 31,
2008 and $61,023,000 as of December 31, 2007.2008.
Information related to impaired and past due loans as of December 31 is as follows:
| | 2008 | | 2007 | |
At December 31: | | | | | |
Non-accrual loans | | $ | 3,493,169 | | $ | 3,811,205 | |
Other impaired loans | | 186,774 | | 2,283,501 | |
Total impaired loans | | $ | 3,679,943 | | $ | 6,094,706 | |
| | | | | |
Amount of impaired loans that have a specific allowance | | $ | 2,571,851 | | $ | 5,038,972 | |
Amount of impaired loans with no specific allowance | | 1,108,092 | | 1,055,734 | |
Allowance for impaired loans | | 630,093 | | 1,143,203 | |
| | | | | |
Accruing loans that are contractually past due as to principal or interest: | | | | | |
Past due 90 days or more | | 604,140 | | 25,470 | |
Past due 30-89 days | | 1,858,481 | | 4,697,953 | |
| | | | | |
During the year ended December 31: | | | | | |
Average investment in impaired loans | | 4,372,742 | | 5,214,365 | |
Interest income recognized on impaired loans | | 327,063 | | 109,889 | |
Interest income recognized on impaired loans (cash basis) | | 310,899 | | 93,426 | |
63
| | | 2009 | | | 2008 | |
| At December 31: | | | | | | |
| Non-accrual loans | | $ | 12,329,337 | | | $ | 3,493,169 | |
| Other impaired loans | | | 20,312 | | | | 186,774 | |
| Total impaired loans | | $ | 12,349,649 | | | $ | 3,679,943 | |
| | | | | | | | | |
| Amount of impaired loans that have a specific allowance | | $ | 5,635,548 | | | $ | 2,571,851 | |
| Amount of impaired loans with no specific allowance | | | 6,714,101 | | | | 1,108,092 | |
| Allowance for impaired loans | | | 793,267 | | | | 630,093 | |
| | | | | | | | | |
| Accruing loans that are contractually past due as to principal or interest: | | | | | | | | |
| Past due 90 days or more | | | 554,806 | | | | 604,140 | |
| Past due 30-89 days | | | 5,173,394 | | | | 1,858,481 | |
| | | | | | | | | |
| During the year ended December 31: | | | | | | | | |
| Average investment in impaired loans | | | 7,951,402 | | | | 4,372,742 | |
| Interest income recognized on impaired loans | | | 41,645 | | | | 327,063 | |
| Interest income recognized on impaired loans (cash basis) | | | 31,495 | | | | 310,899 | |
Information related to the changes in the allowance for loan losses as of December 31 is as follows:
| | 2008 | | 2007 | | 2006 | |
| | | | | | | |
Balance, beginning | | $ | 4,824,401 | | $ | 5,444,303 | | $ | 5,984,649 | |
Recoveries | | 109,703 | | 161,861 | | 189,668 | |
Provision (credit) for loan losses | | 940,000 | | (60,000 | ) | 325,000 | |
Losses charged to allowance | | (1,128,870 | ) | (721,763 | ) | (1,055,014 | ) |
| | | | | | | |
Balance, ending | | $ | 4,745,234 | | $ | 4,824,401 | | $ | 5,444,303 | |
5.BANK PREMISES AND EQUIPMENT
| | | 2009 | | | 2008 | | | 2007 | |
| | | | | | | | | | |
| Balance, beginning | | $ | 4,745,234 | | | $ | 4,824,401 | | | $ | 5,444,303 | |
| Recoveries | | | 47,495 | | | | 109,703 | | | | 161,861 | |
| Provision (credit) for loan losses | | | 5,050,000 | | | | 940,000 | | | | (60,000 | ) |
| Losses charged to allowance | | | (2,269,126 | ) | | | (1,128,870 | ) | | | (721,763 | ) |
| | | | | | | | | | | | | |
| Balance, ending | | $ | 7,573,603 | | | $ | 4,745,234 | | | $ | 4,824,401 | |
| 5. | BANK PREMISES AND EQUIPMENT |
Components of bank premises and equipment at December 31,
20082009 and
20072008 are summarized as follows:
| | 2008 | | 2007 | |
| | | | | |
Land | | $ | 2,072,048 | | $ | 2,072,048 | |
Bank premises | | 9,683,614 | | 7,171,328 | |
Furniture, fixtures and equipment | | 10,096,550 | | 8,603,310 | |
Leasehold improvements | | 4,820,202 | | 5,102,308 | |
| | | | | |
Total | | 26,672,414 | | 22,948,994 | |
| | | | | |
Less accumulated depreciation and amortization | | 10,616,052 | | 9,984,062 | |
| | | | | |
Bank premises and equipment, net | | $ | 16,056,362 | | $ | 12,964,932 | |
| | | 2009 | | | 2008 | |
| | | | | | | |
| Land | | $ | 2,072,048 | | | $ | 2,072,048 | |
| Bank premises | | | 9,686,913 | | | | 9,683,614 | |
| Furniture, fixtures and equipment | | | 10,228,790 | | | | 10,096,550 | |
| Leasehold improvements | | | 4,836,002 | | | | 4,820,202 | |
| | | | | | | | | |
| Total | | | 26,823,753 | | | | 26,672,414 | |
| | | | | | | | | |
| Less accumulated depreciation and amortization | | | 11,461,943 | | | | 10,616,052 | |
| | | | | | | | | |
| Bank premises and equipment, net | | $ | 15,361,810 | | | $ | 16,056,362 | |
Depreciation expense, which includes amortization of leasehold improvements, was
$1,557,000, $1,362,000
$1,297,000 and
$1,191,000$1,297,000 for the years ended December 31,
2009, 2008
and 2007,
and 2006, respectively.
The Company leases its Green Ridge, Scranton, West Pittston, Moosic, Kingston, Peckville, Clarks Summit and Eynon branches under the terms of operating leases. Rental expense was $401,000 in 2009, $392,000 in 2008 and $435,000 in 2007 and $428,0002007. In 2009, the Company closed its Wyoming Ave., Scranton branch but continues to pay monthly lease payments under an operating lease agreement that expires in 2006.2024. The Company is searching for a tenant to fill the vacant space to help offset the rental cost. In 2008, the Company closed its Pittston branch. The future minimum rental payments at December 31, 20082009 under these leases are as follows:Year ending December 31 | | Amount | |
| | | |
2009 | | $ | 368,143 | |
2010 | | 331,927 | |
2011 | | 333,594 | |
2012 | | 339,665 | |
2013 | | 342,402 | |
2014 and thereafter | | 3,844,309 | |
| | | |
Total | | $ | 5,560,040 | |
64
| | | | |
| Year ending December 31 | | Amount | |
| | | | |
| 2010 | | $ | 357,415 | |
| 2011 | | | 359,717 | |
| 2012 | | | 335,018 | |
| 2013 | | | 334,950 | |
| 2014 | | | 334,950 | |
| 2015 and thereafter | | | 3,492,839 | |
| | | | | |
| Total | | $ | 5,214,889 | |
At December 31,
2008,2009, the scheduled maturities of certificates of deposit
including certificates reciprocated in the Certificate of Deposit Account Registry Service (CDARS) program are as follows:
2009 | | $ | 138,895,533 | | 80.0 | % |
2010 | | 26,519,078 | | 15.3 | |
2011 | | 3,024,673 | | 1.7 | |
2012 | | 1,386,305 | | 0.8 | |
2013 | | 3,047,070 | | 1.8 | |
2014 and thereafter | | 808,255 | | 0.4 | |
| | | | | |
| | $ | 173,680,914 | | 100.0 | % |
Certificate
| 2010 | | $ | 81,854,344 | | | | 55.2 | % |
| 2011 | | | 30,453,680 | | | | 20.6 | |
| 2012 | | | 24,339,350 | | | | 16.4 | |
| 2013 | | | 3,461,321 | | | | 2.3 | |
| 2014 | | | 6,553,909 | | | | 4.4 | |
| 2015 and thereafter | | | 1,587,304 | | | | 1.1 | |
| | | | | | | | | |
| | | $ | 148,249,908 | | | | 100.0 | % |
Excluding the $8,748,000 through CDARS, certificate of deposit accounts of $100,000 or more aggregated
$74,250,000$54,941,000 and
$80,857,000$74,250,000 at December 31,
20082009 and
2007,2008, respectively. Certificate of deposit accounts of $250,000 or more aggregated
$20,641,000 and $35,108,000 at December 31,
2008.2009 and 2008, respectively.
Investment securities with a fair value of
$51,388,000$35,253,000 and letters of credit with a notional amount of
$4,350,000$255,000 as of December 31,
20082009 were pledged as collateral to secure public deposits and trust funds.
7.SHORT-TERM BORROWINGS
Short-term borrowings
are as follows at December 31,
2009, 2008
and 2007
and 2006: | | 2008 | | 2007 | | 2006 | |
| | | | | | | |
Overnight borrowings | | $ | 25,668,000 | | $ | 18,950,000 | | $ | 10,395,000 | |
Securities sold under repurchase agreements | | 11,411,939 | | 20,504,408 | | 22,224,445 | |
Demand note, U.S. Treasury | | 1,049,765 | | 201,946 | | 1,036,705 | |
Total | | $ | 38,129,704 | | $ | 39,656,354 | | $ | 33,656,150 | |
65
are as follows:| | | 2009 | | | 2008 | | | 2007 | |
| | | | | | | | | | |
| Overnight borrowings | | $ | 8,573,000 | | | $ | 25,668,000 | | | $ | 18,950,000 | |
| Securities sold under repurchase agreements | | | 7,746,597 | | | | 11,411,939 | | | | 20,504,408 | |
| Demand note, U.S. Treasury | | | 213,510 | | | | 1,049,765 | | | | 201,946 | |
| Total | | $ | 16,533,107 | | | $ | 38,129,704 | | | $ | 39,656,354 | |
The maximum and average amounts of short-term borrowings outstanding and related interest rates for the years ended December 31,
2009, 2008
2007 and
20062007 are as follows:
| | Maximum
outstanding
at any
month end | | Average
outstanding | | Weighted-
average
rate during
the year | | Rate at
year end | |
| | | | | | | | | |
2008 | | | | | | | | | |
| | | | | | | | | |
Overnight borrowings | | $ | 29,960,000 | | $ | 12,314,584 | | 2.13% | | 0.62% | |
Repurchase agreements | | 17,210,316 | | 12,074,345 | | 0.85% | | 0.33% | |
Demand note, U.S. Treasury | | 1,049,765 | | 509,715 | | 1.85% | | 0.00% | |
| | | | | | | | | |
Total | | $ | 48,220,081 | | $ | 24,898,644 | | | | | |
| | | | | | | | | |
2007 | | | | | | | | | |
| | | | | | | | | |
Overnight borrowings | | $ | 30,795,000 | | $ | 8,781,767 | | 5.17% | | 4.24% | |
Repurchase agreements | | 21,678,303 | | 19,579,632 | | 2.38% | | 1.94% | |
Demand note, U.S. Treasury | | 1,057,677 | | 523,018 | | 6.19% | | 3.60% | |
| | | | | | | | | |
Total | | $ | 53,530,980 | | $ | 28,884,417 | | | | | |
| | | | | | | | | |
2006 | | | | | | | | | |
| | | | | | | | | |
Overnight borrowings | | $ | 13,308,000 | | $ | 6,110,115 | | 5.21% | | 5.36% | |
Repurchase agreements | | 24,917,518 | | 23,390,881 | | 2.67% | | 2.80% | |
Demand note, U.S. Treasury | | 1,081,822 | | 500,907 | | 6.11% | | 5.06% | |
| | | | | | | | | |
Total | | $ | 39,307,340 | | $ | 30,001,903 | | | | | |
| | | Maximum | | | | | | Weighted- | | | | |
| | | outstanding | | | | | | average | | | | |
| | | at any | | | Average | | | rate during | | | Rate at | |
| | | month end | | | outstanding | | | the year | | | year-end | |
| | | | | | | | | | | | | |
| 2009 | | | | | | | | | | | | |
| | | | | | | | | | | | | |
| Overnight borrowings | | $ | 29,133,000 | | | $ | 4,896,685 | | | | 0.66 | % | | | 0.65 | % |
| Repurchase agreements | | | 10,130,515 | | | | 8,743,015 | | | | 0.32 | % | | | 0.30 | % |
| Demand note, U.S. Treasury | | | 985,663 | | | | 525,807 | | | | 0.00 | % | | | 0.00 | % |
| | | | | | | | | | | | | | | | | |
| Total | | $ | 40,249,178 | | | $ | 14,165,507 | | | | | | | | | |
| | | | | | | | | | | | | | | | | |
| 2008 | | | | | | | | | | | | | | | | |
| | | | | | | | | | | | | | | | | |
| Overnight borrowings | | $ | 29,960,000 | | | $ | 12,314,584 | | | | 2.13 | % | | | 0.62 | % |
| Repurchase agreements | | | 17,210,316 | | | | 12,074,345 | | | | 0.85 | % | | | 0.33 | % |
| Demand note, U.S. Treasury | | | 1,049,765 | | | | 509,715 | | | | 1.85 | % | | | 0.00 | % |
| | | | | | | | | | | | | | | | | |
| Total | | $ | 48,220,081 | | | $ | 24,898,644 | | | | | | | | | |
| | | | | | | | | | | | | | | | | |
| 2007 | | | | | | | | | | | | | | | | |
| | | | | | | | | | | | | | | | | |
| Overnight borrowings | | $ | 30,795,000 | | | $ | 8,781,767 | | | | 5.17 | % | | | 4.24 | % |
| Repurchase agreements | | | 21,678,303 | | | | 19,579,632 | | | | 2.38 | % | | | 1.94 | % |
| Demand note, U.S. Treasury | | | 1,057,677 | | | | 523,018 | | | | 6.19 | % | | | 3.60 | % |
| | | | | | | | | | | | | | | | | |
| Total | | $ | 53,530,980 | | | $ | 28,884,417 | | | | | | | | | |
Overnight borrowings may include
both Fed funds purchased
withfrom correspondent banks and open repurchase agreements with the FHLB. Securities sold under agreements to repurchase (repurchase agreements) are non-insured interest-bearing liabilities that have a
perfected security interest in qualified investment securities of the Company. Repurchase agreements are reflected at the amount of cash received in connection with the transaction. The carrying value of the underlying qualified investment securities was approximately
$10,151,000, $11,866,000
$22,000,000 and
$25,000,000$22,000,000 at December 31,
2009, 2008
2007 and
2006,2007, respectively. The Company may be required to provide additional collateral based on the fair value of the underlying securities. The U. S. Treasury demand note is generally repaid within 1 to 90 days.
At December 31,
2008,2009, the Company had approximately
$117,348,000$138,346,000 available to borrow from the FHLB,
$19,700,000$30,000,000 from correspondent banks and approximately
$2,250,000$960,000 that it could borrow at the Discount Window from the Federal Reserve Bank of Philadelphia. There were no
outstanding borrowings from the Federal Reserve Bank Discount Window at December 31,
2009, 2008
2007 or
2006.8.LONG-TERM DEBT
2007.
Long-term debt consists of
outstanding advances from the FHLB
with interest rates ranging from 3.61% to 6.14% atof $32,000,000 and $52,000,000 as of December 31,
2008.2009 and 2008, respectively. These advances are secured by
unencumbered U.S. government agency securities, mortgage-backed securities, certain residential mortgages and otherblanket liens on all real estate
collateralizedand commercial and industrial loans with a combined
fair valueweighted valuation, for collateral purposes, of
$170,000,000$179,174,000 as of September 30,
20082009 that was in effect as of December 31,
2008.66
2009.At December 31,
2008,2009, the maturities and weighted-average interest rates of long-term debt are as follows:
Year ending December 31, | | Amount | | Rate | |
| | | | | |
2009 | | $ | 10,000,000 | | 5.32 | % |
2010 | | 21,000,000 | | 5.84 | |
2013 | | 5,000,000 | | 3.61 | |
2016 | | 16,000,000 | | 5.26 | |
| | | | | |
Total | | $ | 52,000,000 | | 5.35 | % |
Rates on $42,000,000
| Year ending December 31, | | Amount | | | Rate | |
| | | | | | | |
| 2010 | | $ | 11,000,000 | | | | 5.59 | % |
| 2013 | | | 5,000,000 | | | | 3.61 | |
| 2016 | | | 16,000,000 | | | | 5.26 | |
| | | | | | | | | |
| Total | | $ | 32,000,000 | | | | 5.11 | % |
All of the long-term debt outstanding as of December 31, 2009 consisted of convertible select FHLB advances
arethat have fixed
interest rates but may adjust quarterly should market rates increase beyond the issues’ original or strike rates. Significant prepayment penalties attached to the borrowings is a deterrent from paying off the high cost advances. However, in the event underlying market rates rise above the rates currently paid on these borrowings, the FHLB rate will convert to
a floating
rate and the
BankCompany has the option at that time to repay or to renegotiate the converted advance.
AsDuring 2009, the Company paid off $20,000,000 of
December 31, 2008 the weighted-average interest rate on these convertible select advancesFHLB advances; $10,000,000 of which was
5.35% with maturity dates ranging from 2010scheduled to
2016.9.STOCK PLANS
The Company uses the fair value method of accounting for stock-based compensation provided under SFAS 123R, Share Based Payment. SFAS 123R requires that the cost of share-based payment transactions (including those with employees and non-employees) be recognizedmature in the financial statements. SFAS 123R applies to all share-based payment transactions in which an entity acquires goods or services by issuing (or offering to issue) its shares, share options, or other equity instruments (except for those held by an ESOP) or by incurring liabilities (1) in amounts based (even in part) on the price of the entity’s shares or other equity instruments, or (2) that require (or may require) settlement by the issuance of an entity’s shares or other equity instruments.
2010.
The Company has two stock-based compensation plans (the stock option plans). The stock option plans were shareholder-approved and permit the grant of share-based compensation awards to its directors, key officers and certain other employees. The Company believes that these stock option plans better align the interest of its directors, key officers and employees with the interest of its shareholders. The Company further believes that the granting of share-based awards under the provisions of the stock option plans is necessary to retain the knowledge base, continuity and expertise of its directors, key officers and employees.
In the stock option plans, directors, key officers and certain other employees are eligible to be awarded stock options to purchase the Company’s common stock at the fair market value on the date of grant.
The Company established the 2000 Independent Directors Stock Option Plan (the Directors Plan) and reserved 55,000 shares of its un-issued capital stock for
issuance.issuance to its directors. In the Directors Plan, no stock options were awarded during
20082009 or
20062008 and 17,500 options were awarded in 2007. As of December 31,
2008,2009, there were
30,15027,400 unexercised stock options outstanding under this plan.
The Company has also established the 2000 Stock Incentive Plan (the Incentive Plan) and reserved 55,000 shares of its un-issued capital stock for
issuance. In 2007, the Incentive Plan was amendedissuance to
provide that no qualified incentive stock options will be granted after the amendment date. In the Incentive Plan as amended, key officers and certain other
employees are eligible to be awarded non-qualifiedemployees. In the Incentive Plan, no stock options
to purchase the Company’s common stock at the fair market value on the date of grant. During 2008, 2007were awarded during 2009, and
2006, 2,000 and 5,000
non-qualifiedstock options
were granted in 2008 and
2,200 qualified options, respectively, were granted.2007, respectively. As of December 31,
2008,2009, there were
12,83010,190 unexercised stock options outstanding under this plan.
67
Table of ContentsA summary of the status of the Company’s stock option plans as of December 31, 2008,2009, December 31, 20072008 and December 31, 20062007 and changes during the periods isare presented in the following table:
| | Options | | Weighted-
average
exercise price | | Weighted-
average
remaining
contractual
term (yrs) | |
| | | | | | | |
Outstanding and exercisable, December 31, 2005 | | 20,130 | | $ | 32.25 | | 4.7 | |
Granted | | 2,200 | | 36.59 | | | |
Exercised | | — | | — | | | |
Forfeited | | (1,650 | ) | 33.07 | | | |
| | | | | | | |
Outstanding and exercisable, December 31, 2006 | | 20,680 | | 32.64 | | 4.3 | |
Granted | | 22,500 | | 28.90 | | | |
Exercised | | — | | — | | | |
Forfeited | | — | | — | | | |
| | | | | | | |
Outstanding and exercisable, December 31, 2007 | | 43,180 | | 30.69 | | 6.8 | |
Granted | | 2,000 | | 26.90 | | | |
Exercised | | — | | — | | | |
Forfeited | | (2,200 | ) | 31.85 | | | |
| | | | | | | |
Outstanding, December 31, 2008 | | 42,980 | | $ | 30.46 | | 6.1 | |
Exercisable, December 31, 2008 | | 42,980 | | $ | 30.46 | | | |
| | | | | | | | | Weighted- | |
| | | | | | Weighted- | | | average | |
| | | | | | average | | | remaining | |
| | | | | | exercise | | | contractual | |
| | | Options | | | price | | | term (yrs) | |
| | | | | | | | | | |
| Outstanding and exercisable, December 31, 2006 | | | 20,680 | | | $ | 32.64 | | | | 4.3 | |
| Granted | | | 22,500 | | | | 28.90 | | | | | |
| Exercised | | | - | | | | - | | | | | |
| Forfeited | | | - | | | | - | | | | | |
| | | | | | | | | | | | | |
| Outstanding and exercisable, December 31, 2007 | | | 43,180 | | | | 30.69 | | | | 6.8 | |
| Granted | | | 2,000 | | | | 26.90 | | | | | |
| Exercised | | | - | | | | - | | | | | |
| Forfeited | | | (2,200 | ) | | | 31.85 | | | | | |
| | | | | | | | | | | | | |
| Outstanding and exercisable, December 31, 2008 | | | 42,980 | | | | 30.46 | | | | 6.1 | |
| Granted | | | - | | | | - | | | | | |
| Exercised | | | - | | | | - | | | | | |
| Forfeited | | | (5,390 | ) | | | 31.61 | | | | | |
| | | | | | | | | | | | | |
| Outstanding, December 31, 2009 | | | 37,590 | | | $ | 30.29 | | | | 5.6 | |
| Exercisable, December 31, 2009 | | | 37,590 | | | $ | 30.29 | | | | | |
In the above table, the weighted-average exercise price includes options with exercise prices ranging from $26.05 to $36.59. Also in the above table, options that are fully vested are included in the amounts that are exercisable as of December 31,
2008.2009.
As of December 31,
2009 and 2008,
2007 and 2006, theno intrinsic value (stock options with fair values that exceeded their exercise or strike price)
aggregated $0 and $1,200 and $28,000, respectively.existed. The intrinsic value as of December 31, 2007 was $1,200.
Under the stock option plans, options are granted with an exercise price equal to the market price of the Company’s stock at the date of grant. The awards vest based on six months of continuous service from the date of grant and have 10-year contractual terms. Generally, all shares that are granted become fully vested.
The Company does not have stock options that are traded on organized capital exchanges. As such, the estimated fair value of options awarded under its stock option plans is determined, on the date of grant, using the Black-Scholes Option Pricing Valuation Model (the model).
There were no options granted in 2009. For the options granted in 2008
2007 and
2006,2007, the model incorporated the following assumptions:
| | 2008 | | 2007 | | 2006 | |
Expected volatility | | 26.31 | % | 25.36 | % | 16.00 | % |
Expected dividend | | 3.72 | % | 3.46 | % | 2.41 | % |
Risk-free interest rate | | 2.77 | % | 3.57 | % | 4.35 | % |
Expected term | | 5.25 | years | 5.25 | years | 5.25 | years |
| | | 2008 | | | 2007 | |
| Expected volatility | | | 26.31 | % | | | 25.36 | % |
| Expected dividend | | | 3.72 | % | | | 3.46 | % |
| Risk-free interest rate | | | 2.77 | % | | | 3.57 | % |
| Expected term | | 5.25 years | | | 5.25 years | |
The expected volatility was determined based on the daily five-year historical volatility of the Company’s stock. Management believes the five-year historical volatility measurement closely resembles the fluctuation of its stock value under most economic conditions and cycles. Because of the relatively short vesting period, the model assumes that all options granted will fully vest. The risk-free rate is for the period within the expected term of the options based on the U.S. Treasury yield curve. The Company used the simplified method to determine the term in which options are expected to be outstanding. The Company does not have sufficient historical share option exercise experience upon which to estimate expected term and therefore used the simplified method.
The following tables illustrate stock-based compensation expense recognized during the years ended December 31,
2009, 2008
2007 and
20062007 and the unrecognized stock-based compensation expense as of December 31 of the
same years.68
Table of Contents
corresponding year-end dates. Stock-based compensation expense is a component of salaries and employee benefits in the consolidated income statements.
| | 2008 | | 2007 | | 2006 | |
Stock-based compensation expense: | | | | | | | |
Director’s Plan | | $ | 90,550 | | $ | 6,925 | | $ | — | |
Incentive Plan | | 35,562 | | 1,978 | | 13,662 | |
Total | | $ | 126,112 | | $ | 8,903 | | $ | 13,662 | |
| | 2008 | | 2007 | | 2006 | |
Unrecognized stock-based compensation expense: | | | | | | | |
Director’s Plan | | $ | — | | $ | 90,550 | | $ | — | |
Incentive Plan | | — | | 25,872 | | — | |
Total | | $ | — | | $ | 116,422 | | $ | — | |
statements:
| | | 2009 | | | 2008 | | | 2007 | |
| Stock-based compensation expense: | | | | | | | | | |
| | | | | | | | | | |
| Director's Plan | | $ | - | | | $ | 90,550 | | | $ | 6,925 | |
| Incentive Plan | | | - | | | | 35,562 | | | | 1,978 | |
| | | | | | | | | | | | | |
| Total | | $ | - | | | $ | 126,112 | | | $ | 8,903 | |
| | | 2009 | | | 2008 | | | 2007 | |
| Unrecognized stock-based compensation expense: | | | | | | | | | |
| | | | | | | | | | |
| Director's Plan | | $ | - | | | $ | - | | | $ | 90,550 | |
| Incentive Plan | | | - | | | | - | | | | 25,872 | |
| | | | | | | | | | | | | |
| Total | | $ | - | | | $ | - | | | $ | 116,422 | |
The following table summarizes the per share weighted-average fair value of options granted:
| | 2008 | | 2007 | | 2006 | |
| | Options
granted | | Weighted-
average grant
date fair value | | Options
granted | | Weighted-
average grant
date fair value | | Options
granted | | Weighted-
average grant
date fair value | |
Director’s Plan | | — | | $ | — | | 17,500 | | $ | 5.57 | | — | | $ | — | |
Incentive Plan | | 2,000 | | 4.85 | | 5,000 | | 5.57 | | 2,200 | | 6.21 | |
Total | | 2,000 | | $ | 4.85 | | 22,500 | | $ | 5.57 | | 2,200 | | $ | 6.21 | |
As
| | | 2008 | | | 2007 | |
| | | | | | Weighted- | | | | | | Weighted- | |
| | | Options | | | average grant | | | Options | | | average grant | |
| | | granted | | | date fair value | | | granted | | | date fair value | |
| | | | | | | | | | | | | |
| Director's Plan | | | - | | | $ | - | | | | 17,500 | | | $ | 5.57 | |
| Incentive Plan | | | 2,000 | | | | 4.85 | | | | 5,000 | | | | 5.57 | |
| | | | | | | | | | | | | | | | | |
| Total | | | 2,000 | | | $ | 4.85 | | | | 22,500 | | | $ | 5.57 | |
There were no options granted in 2009 and as of December 31,
2008,2009 there were no unvested
options compared to 22,500 unvested options with a grant-date weighted-average fair value of $5.57 per share as of December 31, 2007.options.
In addition to the two stock option plans, the Company has established the 2002 Employee Stock Purchase Plan (the ESPP) and has reserved 110,000 shares of its un-issued capital stock for issuance under the plan. The plan was designed to promote broad-based employee ownership of the Company’s stock. Under the ESPP, employees
haveuse automatic payroll
withholdingwithholdings to purchase the Company’s capital stock at a discounted price based
aton the fair market value of the capital stock on either the commencement date or termination date. At December 31,
2008, 10,5702009, 12,271 shares have been issued under the ESPP. The ESPP is considered a compensatory plan and as such, is required to comply with the provisions of
SFAS 123R.authoritative accounting guidance. The Company recognizes compensation expense on its ESPP on the date the shares are purchased. For the
yearyears ended December 31,
2009, 2008
2007 and
2006,2007, compensation expense related to the ESPP approximated
$5,000, $3,000
$7,000 and
$15,000,$7,000, respectively, and is included as a component of salaries and employee benefits in the consolidated
income statements.statements of income. For the year ended December 31,
2009,2010, the Company expects to issue approximately
1,7004,754 shares and recognize compensation expense of
$5,000.$7,000.
The Company also established the dividend reinvestment plan
(DRP)(the DRP) for its shareholders. The plan is designed to avail the Company’s stock at no transactional cost to its shareholders. Cash dividends paid to shareholders who are enrolled in the DRP plus voluntary cash deposits received are used to purchase shares either directly from the Company, from shares that become available in the open market or from the Company’s previously acquired treasury stock. The Company has reserved
110,000300,000 shares of its un-issued capital stock for issuance under the DRP.
ReservedUntil further notice and action of the Company’s Board of Directors, additional shares
underof stock purchased directly from the Company through the DRP are issued at
90% of fair value as of the
dividend paymentinvestment date. As of December 31,
2008,2009, there
are 29,330were 200,353 shares
are available for future issuance.
10.INCOME TAXES
The
Pursuant to the accounting guidelines related to income taxes, the Company
adopted FASB Interpretation No. 48, Accounting for Uncertainty in Income Taxes—an interpretation of FASB Statement No. 109 (FIN 48) during the first quarter of 2007 and has evaluated its material tax positions as
69
Table of Contents
of December 31, 20082009 and 2007. The adoption of FIN 48 had no effect on its consolidated financial statements.2008. Under the “more-likely-than-not” threshold guidelines, the Company believes no significant uncertain tax positions exist, either individually or in the aggregate, that would give rise to the non-recognition of an existing tax benefit. In periods subsequent to December 31, 2008,2009, determinations of potentially adverse material tax positions will be evaluated to determine whether an uncertain tax position may have previously existed or has been originated. In the event an adverse tax position is determined to exist, penalty and interest will be accrued, in accordance with the Internal Revenue Service guidelines, and will be recorded as a component of other expenses in the Company’s consolidated statements of income.
As of December 31,
2008,2009, there were no unrecognized tax benefits that, if recognized, would significantly affect the Company’s effective tax rate. Also, as of December 31,
2008,2009, there were no penalties and interest recognized in the consolidated statements of income as a result of
the adoptionmanagement’s evaluation of
FIN 48,whether an uncertain tax position may exist nor does the Company foresee a change in its material tax positions that would give rise to the non-recognition of an existing tax benefit during the forthcoming twelve months. Tax returns filed with the Internal Revenue Service are subject to review by law under a three-year statute of limitations. The Company has not received notification from the IRS regarding adverse tax issues from tax returns filed for tax years
2005, 2006,
2007 or
2007.2008. The Company has not yet filed its income tax return for the year ended December 31,
2008.2009.
The following temporary differences gave rise to the deferred tax asset (liability) at December 31, 20082009 and 2007: | | 2008 | | 2007 | |
Deferred tax assets: | | | | | |
Allowance for loan losses | | $ | 1,613,380 | | $ | 1,640,296 | |
Unrealized losses on available-for-sale securities | | 4,549,165 | | 505,861 | |
Deferred interest from non-accrual loans | | 269,278 | | 297,482 | |
Other-than-temporary impairment on available-for-sale securities | | 148,126 | | — | |
Stock-based compensation | | 45,905 | | 3,027 | |
Deferred compensation | | — | | 24,479 | |
Retirement settlement reserve | | 32,365 | | 39,714 | |
Other | | 121,013 | | 108,201 | |
| | | | | |
Total | | 6,779,232 | | 2,619,060 | |
| | | | | |
Deferred tax liabilities: | | | | | |
Depreciation | | (272,108 | ) | (251,475 | ) |
Loan fees and costs | | (510,858 | ) | (469,892 | ) |
Other | | (160,496 | ) | (108,168 | ) |
| | | | | |
Total | | (943,462 | ) | (829,535 | ) |
| | | | | |
Deferred tax asset, net | | $ | 5,835,770 | | $ | 1,789,525 | |
2008:
| | | 2009 | | | 2008 | |
| Deferred tax assets: | | | | | | |
| Allowance for loan losses | | $ | 2,575,024 | | | $ | 1,613,380 | |
| Unrealized losses on available-for-sale securities | | | 4,736,506 | | | | 4,549,165 | |
| Deferred interest from non-accrual assets | | | 463,780 | | | | 269,278 | |
| Other-than-temporary impairment on available-for-sale securities | | | 1,089,484 | | | | 148,126 | |
| Stock-based compensation | | | 45,905 | | | | 45,905 | |
| Retirement settlement reserve | | | 57,861 | | | | 32,365 | |
| Other | | | 208,537 | | | | 121,013 | |
| | | | | | | | | |
| Total | | | 9,177,097 | | | | 6,779,232 | |
| | | | | | | | | |
| Deferred tax liabilities: | | | | | | | | |
| Depreciation | | | (466,933 | ) | | | (272,108 | ) |
| Loan fees and costs | | | (603,736 | ) | | | (510,858 | ) |
| Other | | | (307,284 | ) | | | (160,496 | ) |
| | | | | | | | | |
| Total | | | (1,377,953 | ) | | | (943,462 | ) |
| | | | | | | | | |
| Deferred tax asset, net | | $ | 7,799,144 | | | $ | 5,835,770 | |
The
(credit) provision for income taxes for the years ended December 31 are as follows:
| | 2008 | | 2007 | | 2006 | |
| | | | | | | |
Current | | $ | 1,071,912 | | $ | 1,557,327 | | $ | 1,437,083 | |
Deferred | | (2,941 | ) | 78,838 | | (75,003 | ) |
| | | | | | | |
Total provision | | $ | 1,068,971 | | $ | 1,636,165 | | $ | 1,362,080 | |
70
| | | 2009 | | | 2008 | | | 2007 | |
| | | | | | | | | | |
| Current | | $ | 158,719 | | | $ | 1,071,912 | | | $ | 1,557,327 | |
| Deferred | | | (1,776,033 | ) | | | (2,941 | ) | | | 78,838 | |
| | | | | | | | | | | | | |
| Total (credit) provision for income taxes | | $ | (1,617,314 | ) | | $ | 1,068,971 | | | $ | 1,636,165 | |
Table of ContentsThe reconciliation between the expected statutory income tax and the actual provision for income taxes is as follows:
| | 2008 | | 2007 | | 2006 | |
| | | | | | | |
Expected provision at the statutory rate | | $ | 1,599,672 | | $ | 2,124,231 | | $ | 1,865,703 | |
Tax-exempt income | | (371,360 | ) | (348,903 | ) | (376,906 | ) |
Nondeductible interest expense | | 41,542 | | 47,385 | | 54,670 | |
Bank owned life insurance | | (108,501 | ) | (105,639 | ) | (97,261 | ) |
Nondeductible other expenses and other, net | | 25,319 | | 36,792 | | 33,575 | |
Low income housing tax credits | | (117,701 | ) | (117,701 | ) | (117,701 | ) |
| | | | | | | |
Actual provision for income taxes | | $ | 1,068,971 | | $ | 1,636,165 | | $ | 1,362,080 | |
11.RETIREMENT PLAN
| | | 2009 | | | 2008 | | | 2007 | |
| | | | | | | | | | |
| Expected provision at the statutory rate | | $ | (1,025,956 | ) | | $ | 1,599,672 | | | $ | 2,124,231 | |
| Tax-exempt income | | | (511,488 | ) | | | (371,360 | ) | | | (348,903 | ) |
| Nondeductible interest expense | | | 45,713 | | | | 41,542 | | | | 47,385 | |
| Bank owned life insurance | | | (105,186 | ) | | | (108,501 | ) | | | (105,639 | ) |
| Nondeductible other expenses and other, net | | | 25,409 | | | | 25,319 | | | | 36,792 | |
| Low income housing credits | | | (45,806 | ) | | | (117,701 | ) | | | (117,701 | ) |
| | | | | | | | | | | | | |
| Actual (credit) provision for income taxes | | $ | (1,617,314 | ) | | $ | 1,068,971 | | | $ | 1,636,165 | |
The Company has a defined contribution profit sharing 401(k) plan covering substantially all of its employees. The plan is subject to the provisions of the Employee Retirement Income Security Act of 1974 (ERISA). Contributions to the plan
were approximatelyapproximated $357,000 in 2009, $351,000 in 2008
and $292,000 in
2007 and $242,000 in 2006.2007.
| 12. | FAIR VALUE OF FINANCIAL INSTRUMENTS AND DERIVATIVES |
12.FAIR VALUE OF FINANCIAL INSTRUMENTS AND DERIVATIVESThe following table represents the carrying amount and estimated fair value of the Company’s financial instruments as of December 31 (in(dollars in thousands):
| | 2008 | | 2007 | |
| | Carrying
amount | | Estimated
fair value | | Carrying
amount | | Estimated
fair value | |
| | | | | | | | | |
Financial assets: | | | | | | | | | |
Cash and cash equivalents | | $ | 12,771 | | $ | 12,771 | | $ | 10,409 | | $ | 10,409 | |
Held-to-maturity securities | | 910 | | 940 | | 1,147 | | 1,180 | |
Available-for-sale securities | | 83,278 | | 83,278 | | 121,837 | | 121,837 | |
FHLB Stock | | 4,781 | | 4,781 | | 3,303 | | 3,303 | |
Loans and leases | | 436,207 | | 438,838 | | 421,424 | | 423,219 | |
Loans available-for-sale | | 84 | | 85 | | 827 | | 843 | |
Accrued interest | | 2,443 | | 2,443 | | 2,501 | | 2,501 | |
| | | | | | | | | |
Financial liabilities: | | | | | | | | | |
Deposit liabilities | | 433,312 | | 436,011 | | 425,708 | | 426,357 | |
Short-term borrowings | | 38,130 | | 38,130 | | 39,656 | | 39,656 | |
Long-term debt | | 52,000 | | 57,230 | | 62,709 | | 65,514 | |
Accrued interest | | 1,390 | | 1,390 | | 1,736 | | 1,736 | |
| | | | | | | | | |
On-balance sheet derivative instrument: | | | | | | | | | |
Cash flow hedge | | 636 | | 636 | | 441 | | 441 | |
| | | | | | | | | | | | | |
On January 1, 2008,
| | | 2009 | | | 2008 | |
| | | Carrying | | | Estimated | | | Carrying | | | Estimated | |
| | | amount | | | fair value | | | amount | | | fair value | |
| | | | | | | | | | | | | |
| Financial assets: | | | | | | | | | | | | |
| Cash and cash equivalents | | $ | 8,328 | | | $ | 8,328 | | | $ | 12,771 | | | $ | 12,771 | |
| Held-to-maturity securities | | | 709 | | | | 765 | | | | 910 | | | | 940 | |
| Available-for-sale securities | | | 75,821 | | | | 75,821 | | | | 83,278 | | | | 83,278 | |
| FHLB Stock | | | 4,781 | | | | 4,781 | | | | 4,781 | | | | 4,781 | |
| Loans and leases | | | 423,124 | | | | 420,908 | | | | 436,207 | | | | 438,838 | |
| Loans available-for-sale | | | 1,221 | | | | 1,233 | | | | 84 | | | | 85 | |
| Accrued interest | | | 2,251 | | | | 2,251 | | | | 2,443 | | | | 2,443 | |
| | | | | | | | | | | | | | | | | |
| Financial liabilities: | | | | | | | | | | | | | | | | |
| Deposit liabilities | | | 458,994 | | | | 453,264 | | | | 433,312 | | | | 436,011 | |
| Short-term borrowings | | | 16,533 | | | | 16,533 | | | | 38,130 | | | | 38,130 | |
| Long-term debt | | | 32,000 | | | | 35,017 | | | | 52,000 | | | | 57,230 | |
| Accrued interest | | | 665 | | | | 665 | | | | 1,390 | | | | 1,390 | |
| | | | | | | | | | | | | | | | | |
| On-balance sheet derivative instrument: | | | | | | | | | | | | | | | | |
| Cash flow hedge | | | - | | | | - | | | | 636 | | | | 636 | |
The expanded accounting guidelines for fair value measurements was adopted by the Company adopted SFAS 157, Fair Value Measurements. SFAS 157 defines fair value, establishesin 2008. The guidelines establish a framework for measuring fair value and enhancesenhance disclosures about fair value measurements required under other accounting pronouncements, but does not change existing guidance as to whether or not an instrument is carried atmeasurements. The guidelines of fair value. SFAS 157 establishesvalue reporting instituted a valuation hierarchy for disclosure of the inputs used to measure fair value. This hierarchy prioritizes the inputs into three broad levels as follows. follows:
Level 1 inputs are quoted prices (unadjusted) in active markets for identical assets or liabilities. liabilities;
Level 2 inputs are quoted prices for similar assets and liabilities in active markets; quoted prices for identical or similar assets or liabilities in markets that are not active; or inputs that are observable for the asset or liability, either directly or indirectly through market corroboration, for substantially the full term of the financial instrument. instrument;
Level 3 inputs are unobservable inputs based on our own assumptions to measure assets and liabilities at fair value. Level 3 pricing for securities may also include unobservable inputs based upon broker-traded transactions. A financial asset or liability’s
71
Table of Contents
classification within the hierarchy is determined based on the lowest level input that is significant to the fair value measurement.
The
adoption of this statement had no effect on the Company’s financial condition, results of operations and cash flows.In February 2008 the Financial Accounting Standards Board (FASB) issued FASB Staff Position (FSP) 157-2, Effective Date of FASB Statement No. 157, which delays the effective date of SFAS 157Company uses fair value to fiscal years beginning after November 15, 2008 for non-financialmeasure certain assets and, non-financialif necessary, liabilities that are not recognized or disclosed at fair value in the financial statements on a recurring basis. In October 2008, FASB issued FSP 157-3, Determining the Fair Value of a Financial Asset When the Market for that Asset is not Active, which clarifies the application of FAS 157 in a market that is not active and provides an example to illustrate key considerations in determining thebasis when fair value ofis the primary measure for accounting. This is done for AFS securities, loans AFS and derivatives. Fair value is used on a financial assetnon-recurring basis to measure certain assets when theadjusting carrying values to market for that financial asset is not active.
values, such as impaired loans.
The following table illustratestables illustrate the financial instruments measured at fair value on a recurring basis segregated by hierarchy fair value levels (inas of December 31, 2009 and December 31, 2008 (dollars in thousands): | | Fair value measurement at December 31, 2008 | |
| | Total carrying value
at December 31,
2008 | | Quoted prices
in active
markets
(Level 1) | | Significant other
observable inputs
(Level 2) | | Significant other
unobservable
inputs (Level 3) | |
| | | | | | | | | |
Available-for-sale securities | | $ | 83,278 | | $ | 428 | | $ | 72,590 | | $ | 10,260 | |
Loans available-for-sale | | 84 | | — | | 84 | | — | |
Derivative instrument | | 636 | | — | | 636 | | — | |
| | | | | | | | | |
Total | | $ | 83,998 | | $ | 428 | | $ | 73,310 | | $ | 10,260 | |
| | | | | | Fair value measurements at December 31, 2009: | |
| | | Total carrying | | | Quoted prices | | | Significant other | | | Significant | |
| | | value at | | | in active markets | | | observable inputs | | | unobservable inputs | |
| | | December 31, 2009 | | | (Level 1) | | | (Level 2) | | | (Level 3) | |
Assets: | | | | | | | | | | | | |
| Available-for-sale securities: | | | | | | | | | | | | |
| Agency - GSE | | $ | 33,132 | | | $ | - | | | $ | 33,132 | | | $ | - | |
| Obligations of states and political subdivisions | | | 23,270 | | | | - | | | | 23,270 | | | | - | |
| Corporate bonds: | | | | | | | | | | | | | | | | |
| Pooled trust preferred securities | | | 5,242 | | | | - | | | | - | | | | 5,242 | |
| MBS - GSE residential | | | 13,748 | | | | - | | | | 13,748 | | | | - | |
| Equity securities - financial services | | | 429 | | | | 429 | | | | - | | | | - | |
| Total available-for-sale securities | | | 75,821 | | | | 429 | | | | 70,150 | | | | 5,242 | |
| Loans available-for-sale | | | 1,221 | | | | - | | | | 1,221 | | | | - | |
| Total | | $ | 77,042 | | | $ | 429 | | | $ | 71,371 | | | $ | 5,242 | |
| | | | | | Fair value measurements at December 31, 2008: | |
| | | Total carrying | | | Quoted prices | | | Significant other | | | Significant | |
| | | value at | | | in active markets | | | observable inputs | | | unobservable inputs | |
| | | December 31, 2008 | | | (Level 1) | | | (Level 2) | | | (Level 3) | |
Assets: | | | | | | | | | | | | |
| Available-for-sale securities: | | | | | | | | | | | | |
| Agency - GSE | | $ | 43,507 | | | $ | - | | | $ | 43,507 | | | $ | - | |
| Obligations of states and political subdivisions | | | 17,553 | | | | - | | | | 17,553 | | | | - | |
| Corporate bonds: | | | | | | | | | | | | | | | | |
| Pooled trust preferred securities | | | 10,260 | | | | - | | | | - | | | | 10,260 | |
| MBS - GSE residential | | | 11,530 | | | | - | | | | 11,530 | | | | - | |
| Equity securities - financial services | | | 428 | | | | 428 | | | | - | | | | - | |
| Total available-for-sale securities | | | 83,278 | | | | 428 | | | | 72,590 | | | | 10,260 | |
| Loans available-for-sale | | | 84 | | | | - | | | | 84 | | | | - | |
| Derivative instrument | | | 636 | | | | - | | | | 636 | | | | - | |
| Total | | $ | 83,998 | | | $ | 428 | | | $ | 73,310 | | | $ | 10,260 | |
Equity securities in the available-for-sale securitiesAFS portfolio are measured at fair value using quoted market prices for identical assets and are classified within Level 1of1 of the valuation hierarchy. Other than the Company’s investment in corporate bonds, consisting of pooled trust preferred securities, all other debt securities in the available-for-sale securitiesAFS portfolio are measured at fair value using pricesmarket quotations provided by a third-party vendor, who is a provider of financial market data, analytics and related services to financial institutions. The Company’s investment gradepooled trust preferred term securities classified under corporate bonds, include both observable and unobservable inputs to determine fair value as described above and, therefore, are considered Level 3 inputs. OnceIn 2009, the accounting guidance related to fair value measurement was further expanded and provides guidance on estimating fair value when the volume and level of activity for an asset or liability have significantly decreased in relation to normal market activity including new issues, begins to occur,such as is the case with the Company’s investment in pooled trust preferred securities. The requirements of fair value measurement also call for additional disclosures on fair value measurements and the unobservable subjective inputs are replaced by market activity, these securitiesprovide additional guidance on circumstances that may be transferred out of Level 3 intoindicate that a Level 2 classification by management. transaction is not orderly.
For a further discussion on the fair value determination of the Company’s investment in pooled trust preferred term securities, see Note 3, “Investment Securities.” Securities”.
Loans
available-for-saleAFS are measured
atfor fair value from quotes received through secondary market sources, i.e., FNMA or FHLB, who provide pricing for similar assets with similar terms in actively traded markets.
The derivative instrument,In the above table, loans AFS reflect the carrying value which is the lower of cost or market value. Derivative instruments, included in other assets,
isare measured at fair value from pricing provided by a third party who considers observable interest rates, forward yield curves at commonly quoted intervals and volatility.
The following table illustrates the changes in Level 3 financial instruments measured at fair value on a recurring basis for the
yearyears ended December 31,
2009 and December 31, 2008
(in(dollars in thousands):
Balance at beginning of period | | $ | 16,335 | |
| | | |
Realized / unrealized gains losses: | | | |
In earnings | | (430 | ) |
In comprehensive income | | (9,958 | ) |
Purchases, sales, issuances and settlements, amortization and accretion, net | | 4,313 | |
| | | |
Transfers into (out of) Level 3 | | — | |
Balance at end of period | | $ | 10,260 | |
72
| | | As of and for the | | | As of and for the | |
| | | twelve months ended | | | twelve months ended | |
| | | December 31, 2009 | | | December 31, 2008 | |
| Assets: | | | | | | |
| Balance at beginning of period | | $ | 10,260 | | | $ | 16,335 | |
| Realized / unrealized losses: | | | | | | | | |
| in earnings | | | (3,300 | ) | | | (430 | ) |
| in comprehensive income loss | | | (2,397 | ) | | | (9,958 | ) |
| Purchases, sales, issuances and settlements, amortization and accretion, net | | | 679 | | | | 4,313 | |
| Balance at end of period | | $ | 5,242 | | | $ | 10,260 | |
Table of ContentsThe following table illustrates the financial instruments measured at fair value on a nonrecurring basis segregated by hierarchy fair value levels (in(dollars in thousands):
| | Fair value measurement at December 31, 2008 | |
| | Total carrying value
at December 31,
2008 | | Quoted prices
in active
markets
(Level 1) | | Significant other
observable inputs
(Level 2) | | Significant other
unobservable
inputs (Level 3) | |
| | | | | | | | | |
Impaired loans | | $ | 1,942 | | $ | 12 | | $ | 1,136 | | $ | 794 | |
| | | | | | | | | | | | | |
| | | Fair value measurement at December 31, 2009 | |
| | | | | | Quoted prices in | | | Significant other | | | Significant other | |
| | | Total carrying value | | | active markets | | | observable inputs | | | unobservable inputs | |
| | | at December 31, 2009 | | | (Level 1) | | | (Level 2) | | | (Level 3) | |
| | | | | | | | | | | | | |
| Impaired loans | | $ | 4,842 | | | $ | 15 | | | $ | 4,447 | | | $ | 380 | |
| | | Fair value measurement at December 31, 2008 | |
| | | | | | Quoted prices in | | | Significant other | | | Significant other | |
| | | Total carrying value | | | active markets | | | observable inputs | | | unobservable inputs | |
| | | at December 31, 2008 | | | (Level 1) | | | (Level 2) | | | (Level 3) | |
| | | | | | | | | | | | | |
| Impaired loans | | $ | 1,942 | | | $ | 12 | | | $ | 1,136 | | | $ | 794 | |
Impaired loans that are collateral dependent are written down to fair value through the establishment of specific reserves. Techniques used to value the collateral that secures the impaired loan include: quoted market prices for identical assets classified as Level 1 inputs; observable inputs, employed by certified appraisers, for similar assets classified as Level 2 inputs. In cases where valuation techniques included inputs that are unobservable or are based on estimates and assumptions developed by management, with significant adjustments from the best information available under each circumstance, the asset
valuation isvaluations are classified as Level 3 inputs.
Financial Instruments with Off-Balance Sheet Risk
The Company is a party to financial instruments with off-balance sheet risk in the normal course of business to meet the financing needs of its
customers and to manage its exposure to interest rate risk. Interest rate risk includes the possibility that the Company’s net interest income will be adversely affected as a result of changes in interest rates.customers. These financial instruments include commitments to extend credit
and standby letters of
credit and interest rate floors.credit. Those instruments involve, to varying degrees, elements of credit
and interest rate risk in excess of the amount recognized in the balance sheet. The contract or notional amounts of those instruments reflect the extent of the Company’s involvement in particular classes of financial instruments.
Because of the nature of these instruments, the fair value of these off-balance sheet items are not material.
As of December 31,
20082009 and
2007,2008, the notional amount
and estimated fair values of the Company’s financial instruments with off-balance sheet risk were as follows
(in(dollars in thousands):
| | 2008 | | 2007 | |
| | Notional | | Estimated | | Notional | | Estimated | |
| | amount | | fair value | | amount | | fair value | |
Off-balance sheet financial instruments: | | | | | | | | | |
Commitments to extend credit | | $ | 93,992 | | $ | 93,992 | | $ | 83,379 | | $ | 83,379 | |
Standby letters of credit | | 3,968 | | 3,968 | | 5,950 | | 5,950 | |
Cash flow hedge | | 20,000 | | 636 | | 20,000 | | 441 | |
| | | | | | | | | | | | | |
In the above table, the estimated fair value of the cash flow hedge is an on-balance sheet item included as a component of other assets in the consolidated balance sheets.
| | | 2009 | | | 2008 | |
| Off-balance sheet financial instruments: | | | | | | |
| Commitments to extend credit | | $ | 79,365 | | | $ | 93,992 | |
| Standby letters of credit | | | 9,046 | | | | 3,968 | |
Commitments to Extend Credit and Standby Letters of Credit
The Company’s exposure to credit loss from nonperformance by the other party to the financial instruments for commitments to extend credit and standby letters of credit is represented by the contractual amount of those instruments. The Company uses the same credit policies in making commitments and conditional obligations as it does for on-balance sheet instruments.
Commitments to extend credit are legally binding agreements to lend to customers. Commitments generally have fixed expiration dates or other termination clauses and may require payment of fees. Since commitments may expire without being drawn upon, the total commitment amounts do not necessarily represent future liquidity requirements. The Company evaluates each customer’s credit-worthiness on a case-by-case basis. The amount of collateral obtained, if considered necessary by the Company on extension of credit, is based on management’s credit assessment of the customer.
73
Table of Contents
Financial standby letters of credit are conditional commitments issued by the Company to guarantee performance of a customer to a third party. Those guarantees are issued primarily to support public and private borrowing arrangements, including commercial paper, bond financing, and similar transactions. The Company’s performance under the guarantee is required upon presentation by the beneficiary of the financial standby letter of credit. The credit risk involved in issuing letters of credit is essentially the same as that involved in extending loan facilities to customers. The Company was not required to recognize any liability in connection with the issuance of these financial standby letters of credit.
The following table summarizes outstanding financial letters of credit as of December 31,
2008 (in2009 (dollars in thousands):
| | Less than | | One to five | | Over five | | | |
| | one year | | years | | years | | Total | |
Secured by: | | | | | | | | | |
Collateral | | $ | 1,938 | | $ | 1,000 | | $ | 725 | | $ | 3,663 | |
Bank lines of credit | | 44 | | 95 | | — | | 139 | |
| | | | | | | | | |
| | 1,982 | | 1,095 | | 725 | | 3,802 | |
| | | | | | | | | |
Unsecured | | 71 | | 95 | | — | | 166 | |
| | | | | | | | | |
Total | | $ | 2,053 | | $ | 1,190 | | $ | 725 | | $ | 3,968 | |
| | | Less than | | | One to five | | | Over five | | | | |
| | | one year | | | years | | | years | | | Total | |
| Secured by: | | | | | | | | | | | | |
| Collateral | | $ | 1,696 | | | $ | 6,020 | | | $ | 772 | | | $ | 8,488 | |
| Bank lines of credit | | | 386 | | | | 80 | | | | - | | | | 466 | |
| | | | | | | | | | | | | | | | | |
| | | | 2,082 | | | | 6,100 | | | | 772 | | | | 8,954 | |
| | | | | | | | | | | | | | | | | |
| Unsecured | | | 87 | | | | 5 | | | | - | | | | 92 | |
| | | | | | | | | | | | | | | | | |
| Total | | $ | 2,169 | | | $ | 6,105 | | | $ | 772 | | | $ | 9,046 | |
The Company has not incurred
any losses on its commitments in
2009, 2008
2007 or
2006.2007.
Interest Rate Floors, Caps and Swaps
As part of the Company’s overall interest rate risk management strategy, the Company has adopted a policy whereby it may periodically use derivative instruments to minimize significant fluctuations in earnings caused by interest rate volatility. This interest rate risk management strategy entails the use of interest rate floors, caps and swaps. During the fourth quarter of 2006, the Company entered into a three-year interest rate floor derivative agreement on $20,000,000 notional value of its prime-based loan portfolio. The transaction required the payment of a premium by the Company to the seller for the right to receive payments in the event national prime drops below a pre-determined level (strike rate), essentially converting floating rate loans to fixed rate loans when prime drops below the contractual strike rate. When purchased, the Company recorded an asset representing the fair value of the
hedge at the time of purchase.hedge. The Company has designated this agreement as a cash flow hedge pursuant to
SFAS No. 133.the current accounting principles. Accordingly, the change in the fair value of the instrument related to the hedge’s intrinsic value, or approximately
($606,000) in 2009, $221,000 in 2008
and $385,000 in 2007
and $900 in 2006 is recorded as a component of OCI in the consolidated statement of changes in shareholders’ equity and the portion of the change in fair value related to the time value expiration, or approximately
$29,000, $25,000
$169,000 and
$22,000$169,000 for the years ended December 31,
2009, 2008
2007 and
20062007 respectively, is recorded in the consolidated income statements as a reduction of interest income. No gain or loss has been recognized in earnings due to hedge ineffectiveness as of December 31,
2009, 2008
2007 and
2006. As2007. The contract expired in the fourth quarter of
December 31, 2008,2009 and the Company
doeswas not
expectrequired to reclassify any amount from OCI to
earnings over the next twelve months and no hedge has been discontinued.earnings. As of December 31, 2008,
and 2007, the fair value of the derivative contract approximated
$636,000$635,000 and
$441,000, respectively, and iswas recorded as a component of other assets in the consolidated balance
sheets.sheet.
The use of derivative instruments exposes the Company to credit risk in the event of non-performance by the agreement’s counterparty to the derivative instrument. In the event of default by the counterparty, the Company would be subject to an economic loss that corresponds to the cost to replace the agreement. The Company controls the credit risk associated with the derivative instrument by engaging counterparties with high credit ratings, establishing counterparty exposure limits and monitoring procedures.
13.EARNINGS PER SHARE
Basic earnings
(loss) per share (EPS) is computed by dividing income
(loss) available to common shareholders by the weighted-average number of common shares outstanding for the period. Diluted EPS is computed in the same manner as basic EPS but reflects the potential dilution that could occur if stock options to issue additional common stock were exercised, which would then result in additional stock outstanding to share in or dilute the earnings of the Company. The Company maintains two share-based compensation plans that may generate additional
potentialpotentially dilutive common
74
Table of Contents
shares. Generally, dilution would occur if Company-issued stock options were exercised and converted into common stock.
There were no potentially dilutive shares outstanding as of December 31, 2009 and 20 and 386 potentially dilutive shares outstanding as of December 31, 2008 and 2007, respectively.
In the computation of diluted EPS, the Company uses the treasury stock method to determine the dilutive effect of its granted but unexercised stock options. Under this method, the assumed proceeds received from shares issued, in a hypothetical stock option exercise, are assumed to be used to purchase treasury stock. Pursuant to the
accounting guidance
of SFAS No. 128, Earnings Per Share,for earnings per share, proceeds include: proceeds from the exercise of outstanding stock options; compensation cost for future service that the Company has not yet recognized; and any “windfall” tax benefits that would be credited directly to shareholders’ equity when the grant generates a tax deduction (or a reduction in proceeds if there is a charge to equity). For a further discussion on the Company’s stock plans, see
noteNote 9,
“Stock Plans”, above.
The following data illustrates the data used in computing earnings per share and the effects on income and the weighted-average number of shares of potentially dilutive common stock for the years ended December 31,
2009, 2008
2007 and
2006: | | 2008 | | 2007 | | 2006 | |
| | | | | | | |
Basic EPS: | | | | | | | |
| | | | | | | |
Net income available to common shareholders | | $ | 3,635,948 | | $ | 4,611,572 | | $ | 4,125,283 | |
| | | | | | | |
Weighted-average common shares outstanding | | 2,068,851 | | 2,066,683 | | 2,047,975 | |
| | | | | | | |
Basic EPS | | $ | 1.76 | | $ | 2.23 | | $ | 2.01 | |
| | | | | | | |
Diluted EPS: | | | | | | | |
| | | | | | | |
Net income available to common shareholders | | $ | 3,635,948 | | $ | 4,611,572 | | $ | 4,125,283 | |
| | | | | | | |
Weighted-average common shares outstanding | | 2,068,851 | | 2,066,683 | | 2,047,975 | |
Diluted potential common shares | | 20 | | 386 | | 1,172 | |
Weighted-average common shares and dilutive potential shares outstanding | | 2,068,871 | | 2,067,069 | | 2,049,147 | |
| | | | | | | |
Diluted EPS | | $ | 1.76 | | $ | 2.23 | | $ | 2.01 | |
14.REGULATORY MATTERS
2007:
| | | 2009 | | | 2008 | | | 2007 | |
| | | | | | | | | | |
| Basic EPS: | | | | | | | | | |
| | | | | | | | | | |
| Net (loss) income available to common shareholders | | $ | (1,400,205 | ) | | $ | 3,635,948 | | | $ | 4,611,572 | |
| | | | | | | | | | | | | |
| Weighted-average common shares outstanding | | | 2,080,507 | | | | 2,068,851 | | | | 2,066,683 | |
| | | | | | | | | | | | | |
| Basic EPS | | $ | (0.67 | ) | | $ | 1.76 | | | $ | 2.23 | |
| | | | | | | | | | | | | |
| Diluted EPS: | | | | | | | | | | | | |
| | | | | | | | | | | | | |
| Net (loss) income available to common shareholders | | $ | (1,400,205 | ) | | $ | 3,635,948 | | | $ | 4,611,572 | |
| | | | | | | | | | | | | |
| Weighted-average common shares outstanding | | | 2,080,507 | | | | 2,068,851 | | | | 2,066,683 | |
| Diluted potential common shares | | | - | | | | 20 | | | | 386 | |
| Weighted-average common shares and dilutive potential shares outstanding | | | 2,080,507 | | | | 2,068,871 | | | | 2,067,069 | |
| | | | | | | | | | | | | |
| Diluted EPS | | $ | (0.67 | ) | | $ | 1.76 | | | $ | 2.23 | |
The Company (on a consolidated basis) and the Bank are subject to various regulatory capital requirements administered by the federal banking agencies. Failure to meet minimum capital requirements can initiate certain mandatory and possible additional discretionary actions by regulators that, if undertaken, could have a direct material effect on the Company’s and the Bank’s financial statements. Under capital adequacy guidelines and the regulatory framework for prompt corrective action, the Company and the Bank must meet specific capital guidelines that involve quantitative measures of their assets, liabilities and certain off-balance-sheet items as calculated under regulatory accounting practices. The capital amounts and classification are also subject to qualitative judgments by the regulators about components, risk-weightings and other factors. Prompt corrective action provisions are not applicable to bank holding companies.
Quantitative measures, established by regulation
Under these guidelines, assets and certain off-balance sheet items are assigned to
ensurebroad risk categories, each with appropriate weights. The resulting capital
adequacy, requireratios represent capital as a percentage of total risk-weighted assets. For the Company
andin 2009, the
Bankappropriate risk-weighting pursuant to
maintain minimum amounts and ratios (set forthregulatory guidelines, required a gross-up in the
table below)risk-weighting of
securities that were rated below investment grade, thus significantly inflating the total
risk-weighted assets. This requirement had an adverse impact on the total capital and Tier I capital
(as definedratios in
the regulations)2009 compared to
2008. The guidelines require all banks and bank holding companies to maintain a minimum ratio of total risk-based capital to total risk-weighted assets
(as defined)(Total Risk Adjusted Capital) of 8%,
and ofincluding Tier I capital
(as defined)to total risk-weighted assets (Tier I Capital) of 4% and Tier I capital to average
total assets
(as defined)(Leverage Ratio) of at least 4%. As of December 31,
2008,2009, the Company and the Bank met all capital adequacy requirements to which
they areit was subject.
To be categorized as well capitalized, the Company and the Bank must maintain minimum total risk-based, Tier I risk-based and Tier I leverage ratios as set forth in the following table. The Company’s and the Bank’s actual capital amounts and ratios are also presented in the table. No amounts were deducted from capital for interest-rate risk in either
20082009 or
2007.75
2008.Table of Contents
| | Actual | | For capital
adequacy purposes | | To be well capitalized
under prompt corrective
action provisions | |
| | Amount | | Ratio | | Amount | | Ratio | | Amount | | Ratio | |
| | | | | | | | | | | | | |
As of December 31, 2008: | | | | | | | | | | | | | |
Total capital (to risk-weighted assets) | | | | | | | | | | | | | |
Consolidated | | $ | 61,929,662 | | 13.6% | | ³$36,323,088 | | ³8.0% | | N/A | | N/A | |
Bank | | $ | 61,552,250 | | 13.6% | | ³$36,313,495 | | ³8.0% | | ³$45,391,868 | | ³10.0% | |
| | | | | | | | | | | | | |
Tier I capital (to risk-weighted assets) | | | | | | | | | | | | | |
Consolidated | | $ | 57,136,680 | | 12.6% | | ³$18,161,544 | | ³4.0% | | N/A | | N/A | |
Bank | | $ | 56,806,892 | | 12.5% | | ³$18,156,747 | | ³4.0% | | ³$27,235,121 | | ³6.0% | |
| | | | | | | | | | | | | |
Tier I capital (to average assets) | | | | | | | | | | | | | |
Consolidated | | $ | 57,136,680 | | 10.0% | | ³$22,934,915 | | ³4.0% | | N/A | | N/A | |
Bank | | $ | 56,806,892 | | 9.9% | | ³$22,918,851 | | ³4.0% | | ³$28,648,563 | | ³5.0% | |
| | | | | | | | | | | | | |
As of December 31, 2007: | | | | | | | | | | | | | |
Total capital (to risk-weighted assets) | | | | | | | | | | | | | |
Consolidated | | $ | 60,657,888 | | 13.6% | | ³$35,593,844 | | ³8.0% | | N/A | | N/A | |
Bank | | $ | 60,313,618 | | 13.6% | | ³$35,587,244 | | ³8.0% | | ³$44,484,055 | | ³10.0% | |
| | | | | | | | | | | | | |
Tier I capital (to risk-weighted assets) | | | | | | | | | | | | | |
Consolidated | | $ | 55,754,463 | | 12.5% | | ³$17,796,922 | | ³4.0% | | N/A | | N/A | |
Bank | | $ | 55,485,085 | | 12.5% | | ³$17,793,622 | | ³4.0% | | ³$26,690,433 | | ³6.0% | |
| | | | | | | | | | | | | |
Tier I capital (to average assets) | | | | | | | | | | | | | |
Consolidated | | $ | 55,754,463 | | 9.5% | | ³$23,573,565 | | ³4.0% | | N/A | | N/A | |
Bank | | $ | 55,485,085 | | 9.4% | | ³$23,557,576 | | ³4.0% | | ³$29,446,969 | | ³5.0% | |
| | | | | | | | | | | | | | | To be well capitalized | |
| | | | | | | | | For capital | | | under prompt corrective | |
| | | Actual | | | adequacy purposes | | | action provisions | |
| | | Amount | | | Ratio | | | Amount | | | Ratio | | | Amount | | | Ratio | |
| | | | | | | | | | | | | | | | | | | |
| As of December 31, 2009: | | | | | | | | | | | | | | | | | | |
| | | | | | | | | | | | | | | | | | | |
| Total capital (to risk-weighted assets) | | | | | | | | | | | | | | | | | | |
| Consolidated | | $ | 61,568,720 | | | | 11.4 | % | | $ | ≥43,085,677 | | | | ≥8.0 | % | | | N/A | | | | N/A | |
| Bank | | $ | 61,170,729 | | | | 11.4 | % | | $ | ≥43,075,958 | | | | ≥8.0 | % | | $ | ≥53,844,947 | | | | ≥10.0 | % |
| | | | | | | | | | | | | | | | | | | | | | | | | |
| Tier I capital (to risk-weighted assets) | | | | | | | | | | | | | | | | | | | | | | | | |
| Consolidated | | $ | 54,778,019 | | | | 10.2 | % | | $ | ≥21,542,839 | | | | ≥4.0 | % | | | N/A | | | | N/A | |
| Bank | | $ | 54,429,494 | | | | 10.1 | % | | $ | ≥21,537,979 | | | | ≥4.0 | % | | $ | ≥32,306,968 | | | | ≥6.0 | % |
| | | | | | | | | | | | | | | | | | | | | | | | | |
| Tier I capital (to average assets) | | | | | | | | | | | | | | | | | | | | | | | | |
| Consolidated | | $ | 54,778,019 | | | | 9.8 | % | | $ | ≥22,380,403 | | | | ≥4.0 | % | | | N/A | | | | N/A | |
| Bank | | $ | 54,429,494 | | | | 9.7 | % | | $ | ≥22,363,361 | | | | ≥4.0 | % | | $ | ≥27,954,202 | | | | ≥5.0 | % |
| | | | | | | | | | | | | | | | | | | | | | | | | |
| As of December 31, 2008: | | | | | | | | | | | | | | | | | | | | | | | | |
| | | | | | | | | | | | | | | | | | | | | | | | | |
| Total capital (to risk-weighted assets) | | | | | | | | | | | | | | | | | | | | | | | | |
| Consolidated | | $ | 61,929,662 | | | | 13.6 | % | | $ | ≥36,323,088 | | | | ≥8.0 | % | | | N/A | | | | N/A | |
| Bank | | $ | 61,552,250 | | | | 13.6 | % | | $ | ≥36,313,495 | | | | ≥8.0 | % | | $ | ≥45,391,868 | | | | ≥10.0 | % |
| | | | | | | | | | | | | | | | | | | | | | | | | |
| Tier I capital (to risk-weighted assets) | | | | | | | | | | | | | | | | | | | | | | | | |
| Consolidated | | $ | 57,136,680 | | | | 12.6 | % | | $ | ≥18,161,544 | | | | ≥4.0 | % | | | N/A | | | | N/A | |
| Bank | | $ | 56,806,892 | | | | 12.5 | % | | $ | ≥18,156,747 | | | | ≥4.0 | % | | $ | ≥27,235,121 | | | | ≥6.0 | % |
| | | | | | | | | | | | | | | | | | | | | | | | | |
| Tier I capital (to average assets) | | | | | | | | | | | | | | | | | | | | | | | | |
| Consolidated | | $ | 57,136,680 | | | | 10.0 | % | | $ | ≥22,934,915 | | | | ≥4.0 | % | | | N/A | | | | N/A | |
| Bank | | $ | 56,806,892 | | | | 9.9 | % | | $ | ≥22,918,851 | | | | ≥4.0 | % | | $ | ≥28,648,563 | | | | ≥5.0 | % |
The Bank can pay dividends to the Company equal to the Bank’s retained earnings which approximated
$48,057,000$45,722,000 at December 31,
2008.2009. However, such dividends are limited due to the capital requirements discussed above.
| 15. | RELATED PARTY TRANSACTIONS |
15.RELATED PARTY TRANSACTIONSDuring the ordinary course of business, loans are made to executive officers, directors, greater than 5% shareholders and associates of such persons. These transactions are executed on substantially the same terms and at the rates prevailing at the time for comparable transactions with others. These loans do not involve more than the normal risk of collectibilitycollectability or present other unfavorable features. A summary of loan activity with officers, directors, associates of such persons and shareholders who own more than 5% of the Company’s outstanding shares is as follows:
| | 2008 | | 2007 | | 2006 | |
| | | | | | | |
Balance, beginning | | $ | 7,665,710 | | $ | 9,028,873 | | $ | 9,165,554 | |
Adjustments for loans to individuals no longer officers, directors, associates or greater than 5% shareholders | | — | | (1,254,485 | ) | — | |
Additions | | 1,696,194 | | 1,261,950 | | 1,600,137 | |
Collections | | (1,308,300 | ) | (1,370,628 | ) | (1,736,818 | ) |
| | | | | | | |
Balance, ending | | $ | 8,053,604 | | $ | 7,665,710 | | $ | 9,028,873 | |
76
| | | 2009 | | | 2008 | | | 2007 | |
| | | | | | | | | | |
| Balance, beginning | | $ | 8,053,604 | | | $ | 7,665,710 | | | $ | 9,028,873 | |
| Adjustments for loans to individuals no longer | | | | | | | | | | | | |
| officers, directors, associates, or greater than | | | | | | | | | | | | |
| 5% shareholders | | | - | | | | - | | | | (1,254,485 | ) |
| Additions | | | 531,239 | | | | 1,696,194 | | | | 1,261,950 | |
| Collections | | | (1,755,988 | ) | | | (1,308,300 | ) | | | (1,370,628 | ) |
| | | | | | | | | | | | | |
| Balance, ending | | $ | 6,828,855 | | | $ | 8,053,604 | | | $ | 7,665,710 | |
Aggregate loans to directors and associates exceeding 2.5% of shareholders’ equity included in the table above are as follows:
| | 2007 | | 2006 | | 2005 | |
| | | | | | | |
Number of persons | | 2 | | 2 | | 2 | |
| | | | | | | |
Balance, beginning | | $ | 7,196,079 | | $ | 7,349,167 | | $ | 7,446,933 | |
Additions | | 1,090,044 | | 793,049 | | 2,312,295 | |
Collections | | (707,961 | ) | (946,137 | ) | (1,203,870 | ) |
Prior loan balances no longer exceeding threshold | | — | | — | | (1,206,191 | ) |
| | | | | | | |
Balance, ending | | $ | 7,578,162 | | $ | 7,196,079 | | $ | 7,349,167 | |
| | | 2009 | | | 2008 | | | 2007 | |
| | | | | | | | | | |
| Number of persons | | | 2 | | | | 2 | | | | 2 | |
| | | | | | | | | | | | | |
| Balance, beginning | | $ | 7,578,162 | | | $ | 7,196,079 | | | $ | 7,349,167 | |
| Additions | | | 106,044 | | | | 1,090,044 | | | | 793,049 | |
| Collections | | | (1,079,090 | ) | | | (707,961 | ) | | | (946,137 | ) |
| | | | | | | | | | | | | |
| Balance, ending | | $ | 6,605,116 | | | $ | 7,578,162 | | | $ | 7,196,079 | |
As of December 31,
2009, 2008
2007 and
2006,2007, deposits from executive officers, directors and associates of such persons approximated
$6,919,000, $9,000,000
and $8,100,000,
and $7,876,000, respectively.
| 16. | QUARTERLY FINANCIAL INFORMATION (UNAUDITED) |
16.QUARTERLY FINANCIAL INFORMATION (UNAUDITED)The following is a summary of quarterly results of operations for the years ended December 31, 2009, 2008 and 2007 and 2006 (in(dollars in thousands, except per share data):
2008 | | First
quarter | | Second
quarter | | Third
quarter | | Fourth
quarter | | Total | |
| | | | | | | | | | | |
Interest income | | $ | 8,745 | | $ | 8,613 | | $ | 8,419 | | $ | 8,184 | | $ | 33,961 | |
Interest expense | | (4,198 | ) | (3,670 | ) | (3,540 | ) | (3,276 | ) | (14,684 | ) |
| | | | | | | | | | | |
Net interest income | | 4,547 | | 4,943 | | 4,879 | | 4,908 | | 19,277 | |
Provision for loan losses | | — | | (125 | ) | (130 | ) | (685 | ) | (940 | ) |
Gain on sale of investment securities | | 1 | | 7 | | 17 | | — | | 25 | |
Other-than-temporary impairment | | — | | — | | (403 | ) | (33 | ) | (436 | ) |
Other income | | 1,295 | | 1,259 | | 1,231 | | 1,204 | | 4,989 | |
Other expenses | | (4,393 | ) | (4,445 | ) | (4,673 | ) | (4,699 | ) | (18,210 | ) |
| | | | | | | | | | | |
Income before income taxes | | 1,450 | | 1,639 | | 921 | | 695 | | 4,705 | |
Provision for income taxes | | (361 | ) | (435 | ) | (180 | ) | (93 | ) | (1,069 | ) |
| | | | | | | | | | | |
Net income | | $ | 1,089 | | $ | 1,204 | | $ | 741 | | $ | 602 | | $ | 3,636 | |
| | | | | | | | | | | |
Net income per share | | $ | 0.52 | | $ | 0.59 | | $ | 0.35 | | $ | 0.30 | | $ | 1.76 | |
77
| | | First | | | Second | | | Third | | | Fourth | | | | |
| | | quarter | | | quarter | | | quarter | | | quarter | | | Total | |
| | | | | | | | | | | | | | | | |
| 2009 | | | | | | | | | | | | | | | |
| | | | | | | | | | | | | | | | |
| Interest income | | $ | 7,827 | | | $ | 7,456 | | | $ | 7,454 | | | $ | 7,173 | | | $ | 29,910 | |
| Interest expense | | | (3,002 | ) | | | (2,715 | ) | | | (3,033 | ) | | | (2,047 | ) | | | (10,797 | ) |
| | | | | | | | | | | | | | | | | | | | | |
| Net interest income | | | 4,825 | | | | 4,741 | | | | 4,421 | | | | 5,126 | | | | 19,113 | |
| Provision for loan losses | | | (425 | ) | | | (300 | ) | | | (3,125 | ) | | | (1,200 | ) | | | (5,050 | ) |
| Gain on sale of investment securities | | | - | | | | - | | | | - | | | | 11 | | | | 11 | |
| Other-than-temporary impairment | | | (326 | ) | | | (1 | ) | | | (2,432 | ) | | | (542 | ) | | | (3,301 | ) |
| Other income | | | 1,639 | | | | 1,459 | | | | 1,139 | | | | 1,213 | | | | 5,450 | |
| Other expenses | | | (4,662 | ) | | | (4,739 | ) | | | (5,109 | ) | | | (4,731 | ) | | | (19,241 | ) |
| | | | | | | | | | | | | | | | | | | | | |
| Income (loss) before taxes | | | 1,051 | | | | 1,160 | | | | (5,106 | ) | | | (123 | ) | | | (3,018 | ) |
| (Provision) credit for income taxes | | | (226 | ) | | | (248 | ) | | | 1,895 | | | | 197 | | | | 1,618 | |
| | | | | | | | | | | | | | | | | | | | | |
| Net income (loss) | | $ | 825 | | | $ | 912 | | | $ | (3,211 | ) | | $ | 74 | | | $ | (1,400 | ) |
| | | | | | | | | | | | | | | | | | | | | |
| Net income (loss) per share | | $ | 0.40 | | | $ | 0.44 | | | $ | (1.55 | ) | | $ | 0.04 | | | $ | (0.67 | ) |
Table of Contents
2007 | | First
quarter | | Second
quarter | | Third
quarter | | Fourth
quarter | | Total | |
| | | | | | | | | | | |
Interest income | | $ | 8,632 | | $ | 8,684 | | $ | 8,892 | | $ | 9,071 | | $ | 35,279 | |
Interest expense | | (4,328 | ) | (4,362 | ) | (4,470 | ) | (4,500 | ) | (17,660 | ) |
| | | | | | | | | | | |
Net interest income | | 4,304 | | 4,322 | | 4,422 | | 4,571 | | 17,619 | |
Credit for loan losses | | — | | — | | 60 | | — | | 60 | |
Other income | | 1,214 | | 1,329 | | 1,309 | | 1,354 | | 5,206 | |
Other expenses | | (4,113 | ) | (4,087 | ) | (4,189 | ) | (4,248 | ) | (16,637 | ) |
| | | | | | | | | | | |
Income before income taxes | | 1,405 | | 1,564 | | 1,602 | | 1,677 | | 6,248 | |
Provision for income taxes | | (361 | ) | (405 | ) | (424 | ) | (446 | ) | (1,636 | ) |
| | | | | | | | | | | |
Net income | | $ | 1,044 | | $ | 1,159 | | $ | 1,178 | | $ | 1,231 | | $ | 4,612 | |
| | | | | | | | | | | |
Net income per share | | $ | 0.51 | | $ | 0.56 | | $ | 0.57 | | $ | 0.59 | | $ | 2.23 | |
2006 | | First
quarter | | Second
quarter | | Third
quarter | | Fourth
quarter | | Total | |
| | | | | | | | | | | |
Interest income | | $ | 7,893 | | $ | 8,371 | | $ | 8,595 | | $ | 8,671 | | $ | 33,530 | |
Interest expense | | (3,663 | ) | (4,106 | ) | (4,281 | ) | (4,311 | ) | (16,361 | ) |
| | | | | | | | | | | |
Net interest income | | 4,230 | | 4,265 | | 4,314 | | 4,360 | | 17,169 | |
Provision for loan losses | | (75 | ) | (175 | ) | (75 | ) | — | | (325 | ) |
Gain on sale of investment securities | | — | | — | | — | | 1 | | 1 | |
Other income | | 1,129 | | 1,084 | | 1,136 | | 1,172 | | 4,521 | |
Other expenses | | (3,923 | ) | (3,948 | ) | (3,996 | ) | (4,012 | ) | (15,879 | ) |
| | | | | | | | | | | |
Income before income taxes | | 1,361 | | 1,226 | | 1,379 | | 1,521 | | 5,487 | |
Provision for income taxes | | (329 | ) | (288 | ) | (349 | ) | (396 | ) | (1,362 | ) |
| | | | | | | | | | | |
Net income | | $ | 1,032 | | $ | 938 | | $ | 1,030 | | $ | 1,125 | | $ | 4,125 | |
| | | | | | | | | | | |
Net income per share | | $ | 0.51 | | $ | 0.45 | | $ | 0.51 | | $ | 0.54 | | $ | 2.01 | |
17.CONTINGENCIES
| | | First | | | Second | | | Third | | | Fourth | | | | |
| | | quarter | | | quarter | | | quarter | | | quarter | | | Total | |
| 2008 | | | | | | | | | | | | | | | |
| | | | | | | | | | | | | | | | |
| Interest income | | $ | 8,745 | | | $ | 8,613 | | | $ | 8,419 | | | $ | 8,184 | | | $ | 33,961 | |
| Interest expense | | | (4,198 | ) | | | (3,670 | ) | | | (3,540 | ) | | | (3,276 | ) | | | (14,684 | ) |
| | | | | | | | | | | | | | | | | | | | | |
| Net interest income | | | 4,547 | | | | 4,943 | | | | 4,879 | | | | 4,908 | | | | 19,277 | |
| Provision for loan losses | | | - | | | | (125 | ) | | | (130 | ) | | | (685 | ) | | | (940 | ) |
| Gain on sale of investment securities | | | 1 | | | | 7 | | | | 17 | | | | - | | | | 25 | |
| Other-than-temporary impairment | | | - | | | | - | | | | (403 | ) | | | (33 | ) | | | (436 | ) |
| Other income | | | 1,295 | | | | 1,259 | | | | 1,231 | | | | 1,204 | | | | 4,989 | |
| Other expenses | | | (4,393 | ) | | | (4,445 | ) | | | (4,673 | ) | | | (4,699 | ) | | | (18,210 | ) |
| | | | | | | | | | | | | | | | | | | | | |
| Income before taxes | | | 1,450 | | | | 1,639 | | | | 921 | | | | 695 | | | | 4,705 | |
| Provision for income taxes | | | (361 | ) | | | (435 | ) | | | (180 | ) | | | (93 | ) | | | (1,069 | ) |
| | | | | | | | | | | | | | | | | | | | | |
| Net income | | $ | 1,089 | | | $ | 1,204 | | | $ | 741 | | | $ | 602 | | | $ | 3,636 | |
| | | | | | | | | | | | | | | | | | | | | |
| Net income per share | | $ | 0.52 | | | $ | 0.59 | | | $ | 0.35 | | | $ | 0.30 | | | $ | 1.76 | |
| | | First | | | Second | | | Third | | | Fourth | | | | |
| | | quarter | | | quarter | | | quarter | | | quarter | | | Total | |
| | | | | | | | | | | | | | | | |
| 2007 | | | | | | | | | | | | | | | |
| | | | | | | | | | | | | | | | |
| Interest income | | $ | 8,632 | | | $ | 8,684 | | | $ | 8,892 | | | $ | 9,071 | | | $ | 35,279 | |
| Interest expense | | | (4,328 | ) | | | (4,362 | ) | | | (4,470 | ) | | | (4,500 | ) | | | (17,660 | ) |
| | | | | | | | | | | | | | | | | | | | | |
| Net interest income | | | 4,304 | | | | 4,322 | | | | 4,422 | | | | 4,571 | | | | 17,619 | |
| Credit for loan losses | | | - | | | | - | | | | 60 | | | | - | | | | 60 | |
| Other income | | | 1,214 | | | | 1,329 | | | | 1,309 | | | | 1,354 | | | | 5,206 | |
| Other expenses | | | (4,113 | ) | | | (4,087 | ) | | | (4,189 | ) | | | (4,248 | ) | | | (16,637 | ) |
| | | | | | | | | | | | | | | | | | | | | |
| Income before taxes | | | 1,405 | | | | 1,564 | | | | 1,602 | | | | 1,677 | | | | 6,248 | |
| Provision for income taxes | | | (361 | ) | | | (405 | ) | | | (424 | ) | | | (446 | ) | | | (1,636 | ) |
| | | | | | | | | | | | | | | | | | | | | |
| Net income | | $ | 1,044 | | | $ | 1,159 | | | $ | 1,178 | | | $ | 1,231 | | | $ | 4,612 | |
| | | | | | | | | | | | | | | | | | | | | |
| Net income per share | | $ | 0.51 | | | $ | 0.56 | | | $ | 0.57 | | | $ | 0.59 | | | $ | 2.23 | |
The nature of the Company’s business generates litigation involving matters arising in the ordinary course of business. However, in the opinion of management of the Company after consulting with the Company’s legal counsel, no legal proceedings are pending, which, if determined adversely to the Company or the Bank, would have a material effect on the Company’s shareholders’ equity or results of operations. No legal proceedings are pending other than ordinary routine litigation incident to the business of the Company and the Bank. In addition, to management’s knowledge, no government authorities have initiated or contemplated any material legal actions against the Company or the Bank.
18.RECENT ACCOUNTING PRONOUNCEMENTS
In April 2008,
| 18. | RECENT ACCOUNTING PRONOUNCEMENTS |
On July 1, 2009, the Company adopted new accounting guidance related to U.S. GAAP. This guidance establishes the Financial Accounting Standards Board (FASB) postedAccounting Standards Codification (ASC), or FASB ASC, as the source of authoritative U.S GAAP recognized by the FASB to be applied by non-governmental entities. Rules and interpretive releases of the SEC under authority of federal securities laws are also sources of authoritative U.S. GAAP for SEC registrants. FASB will no longer issue new standards in the form of Statements, FASB Staff Position (FSP) No. 142-3, DeterminationPositions or Emerging Issues Task Force Abstracts. Instead, it will issue Accounting Standards Updates (ASUs), which will serve to update the FASB ASC, provide background information about the guidance and provide the basis for conclusions on the changes to the FASB ASC. The FASB ASC is not intended to change U.S. GAAP or any requirements of the Useful LifeSEC. Contents in each topic are organized first by subtopic, then section and finally paragraph. The paragraph level is the only level that contains substantive content. FASB suggests that all citations begin with “FASB ASC.” This guidance is effective for interim periods ending after September 15, 2009.
In 2009, the Company adopted the new accounting guidance related to fair value measurements. The topic of Intangible Assets, (FSP 142-3). FSP 142-3fair value measurement was expanded to provide guidance on estimating fair value when the volume and level of activity for an asset or liability have significantly decreased in relation to normal market activity. The requirements of fair value measurement also call for additional disclosures on fair value measurements and provide additional guidance on circumstances that may indicate that a transaction is not orderly. The recent accounting guidance requires disclosure of qualitative and quantitative information about the fair value of all financial instruments on a quarterly basis, including methods and significant assumptions used to estimate fair value during the period. These disclosures were previously only required annually. The adoption of this guidance had no effect on how the Company accounts for these instruments.
In 2009, the Company adopted the new accounting guidance related to recognition and presentation of other-than-temporary impairment. This recent accounting guidance amends the recognition guidance for other-than-temporary impairments of debt securities and expands the financial statement disclosures for other-than-temporary impairment losses on debt and equity securities. The recent guidance replaced the “intent and ability” indication in current guidance by specifying that (a) if a company does not have the intent to sell a debt security prior to recovery and (b) it is more likely than not that it will not have to sell the debt security prior to recovery, the security would not be considered other-than-temporarily impaired unless there is a credit loss. When an entity does not intend to sell the security, and it is more likely than not, the entity will not have to sell the security before recovery of its cost basis, it will recognize the credit component of an other-than-temporary impairment of a debt security in earnings and the remaining portion in other comprehensive income. For held-to-maturity debt securities, the amount of an other-than-temporary impairment recorded in other comprehensive income for the non-credit portion of a previous other-than-temporary impairment should be amortized prospectively over the remaining life of the security on the basis of the timing of future estimated cash flows of the security. For available-for-sale and held-to-maturity debt securities that management has no intent to sell and believes that it more-likely-than-not will not be required to sell prior to recovery, only the credit loss component of the impairment is recognized in earnings, while the non-credit loss is recognized in accumulated other comprehensive income. The credit loss component recognized in earnings is identified as the amount of principal cash flows not expected to be received over the remaining term of the security as projected based on cash flow projections. See Note 3, “Investment Securities” for the impact this guidance had on the Company’s consolidated financial statements.
In 2009, the Company adopted the new accounting guidance related to disclosures about derivative instruments. The recent accounting guidance provides requirements on the disclosures of derivative instruments and hedging activities. The guidance requires qualitative disclosures about objectives and strategies for using derivatives, quantitative disclosures about fair value amounts of gains and losses on derivative instruments, and disclosures about credit-risk-related contingent features in derivative agreements. The new accounting guidance did not have an impact on the Company’s consolidated financial statements.
In 2009, the Company adopted the new accounting guidance related to the determination of the useful life of intangible assets. The new accounting guidance provides factors that should be considered in developing renewal or extension assumptions used to determine the useful life of a recognized intangible
asset under FASB Statement No. 142, Goodwill and Other Intangible Assets.asset. The intent of
FSP 142-3this new guidance is to improve the consistency between the useful life of a recognized intangible asset and the period of expected cash flows, particularly as used to measure fair value in business combinations.
FSP 142-3The adoption of this new guidance is
effective for fiscal years beginning after December 15, 2008, and is not expectedimmaterial as it relates to
have a material effect on the Company’s consolidated financial statements.
78
In
February 2008,2010, the
FASB issued FSP 157-2, Effective DateCompany will adopt the new accounting guidance related to transfers and servicing and the accounting for transfers of FASB 157, (FSP 157-2) which delaysfinancial assets. The standard will eliminate the
effective dateconcept of
FAS 157, Fair Value Measurements,qualifying special purpose entities, will provide guidance as to when a portion of a transferred financial asset can be evaluated for
nonfinancialsale accounting, provides additional guidance with regard to accounting for transfers of financial assets and
nonfinancial liabilities, except for items that are recognized or disclosed at fair value in the financial statements on a recurring basis (at least annually). The provisions of FSP 157-2 are effective for the Company on January 1, 2009. The Company is currently evaluating the impact that the adoption of FAS 157, as it pertains to nonfinancial assets and nonfinancial liabilities, will have on its consolidated financial statements.In October 2008, the FASB issued FSP 157-3, Determining the Fair Value of a Financial Asset When the Market For That Asset Is Not Active (FSP 157-3). FSP 157-3 clarifies how management’s internal assumptions and observable market information should be considered when measuring fair value in an inactive market and how market quotes should be considered when assessing the relevance of observable available data in measuring fair value.requires additional disclosures. The adoption of FSP No. 157-3 did not have a material impact on the Company’s consolidated financial statements.
In January 2009, the FASB issued FSP EITF 99-20-1, Amendments to the Impairment Guidance of EITF Issue No. 99-20 (FSP EITF 99-20-1). While FSP EITF 99-20-1 retains fair value as the measurement attribute for those other-than-temporarily impaired beneficial interests, the Company is not permitted to use market participant assumptions regarding future cash flows to assess other-than-temporary impairment. FSP EITF 99-20-1 requires the Company to update our interest income recognition any time it is probable that there is a favorable change in the estimated cash flows or an adverse change in estimated cash flows resulting in an other-than-temporary impairment. FSP EITF 99-20-1 would be applied prospectively to interim and annual reporting periods ending after December 15, 2008. The adoption of FSP EITF 99-20-1 will not have a material impact on our consolidated financial statements.
In November 2008, the FASB ratified the consensus reached by the EITF on Issue 08-6, Equity Method Investment Accounting Considerations (Issue 08-6). Under Issue 08-6, an entity shall measure its equity method investment initially at cost in accordance with Financial Accounting Standard (FAS) 141(R), Business Combinations. Any other-than-temporary impairment of an equity method investment should be recognized in accordance with Accounting Principal Board Opinion 18, The Equity Method of Accounting for Investments in Common Stock. An equity method investor shall not separately test an investee’s underlying assets for impairment. Share issuance by an investee shall be accounted for as if the equity method investor had sold a proportionate share of its investment, with gain or loss recognized in earnings. Issue 08-6 is effective for the Company on January 1, 2009, andnew accounting guidance is not expected to have a material impact on the Company’s consolidated financial statements.
79
In 2010, the Company will adopt the amended accounting guidance related to fair value measurements which will require new disclosures and clarify some existing disclosure requirements about fair value measurement as set forth in previous guidance. The objective is to improve these disclosures and, thus, increase the transparency in financial reporting. Specifically, an entity will be required to disclose separately the amounts of
Contents19.PARENT COMPANY ONLY
significant transfers in and out of Level 1 and Level 2 fair value measurements and describe the reasons for the transfers; and in the reconciliation for fair value measurements using significant unobservable inputs, a reporting entity should present separately information about purchases, sales, issuances, and settlements. The amended guidance will also clarify the requirements of the following existing disclosures: for purposes of reporting fair value measurement for each class of assets and liabilities, a reporting entity needs to use judgment in determining the appropriate classes of assets and liabilities; and a reporting entity should provide disclosures about the valuation techniques and inputs used to measure fair value for both recurring and nonrecurring fair value measurements. The new guidance is effective for interim and annual reporting periods beginning after December 15, 2009, except for the disclosures about purchases, sales, issuances, and settlements in the roll forward of activity in Level 3 fair value measurements. Those disclosures are effective for fiscal years beginning after December 15, 2010, and for interim periods within those fiscal years.
The following is the condensed financial information for Fidelity D & D Bancorp, Inc. on a parent company only basis
(in(dollars in thousands):
Condensed Balance Sheets
| | December 31, | |
| | 2008 | | 2007 | |
| | | | | |
Assets: | | | | | |
Cash | | $ | 2 | | $ | 2 | |
Investment in subsidiary | | 48,561 | | 54,812 | |
Securities available-for-sale | | 428 | | 489 | |
Other assets | | 10 | | — | |
| | | | | |
Total | | $ | 49,001 | | $ | 55,303 | |
| | | | | |
Liabilities and shareholders’ equity: | | | | | |
Liabilities | | $ | 40 | | $ | 112 | |
Shareholders’ equity | | 48,961 | | 55,191 | |
| | | | | |
Total | | $ | 49,001 | | $ | 55,303 | |
| | | December 31, | |
| | | 2009 | | | 2008 | |
| Assets: | | | | | | |
| Cash | | $ | 47 | | | $ | 2 | |
| Investment in subsidiary | | | 45,256 | | | | 48,561 | |
| Securities available-for-sale | | | 429 | | | | 428 | |
| Other assets | | | 10 | | | | 10 | |
| | | | | | | | | |
| Total | | $ | 45,742 | | | $ | 49,001 | |
| | | | | | | | | |
| Liabilities and shareholders' equity: | | | | | | | | |
| Liabilities | | $ | 67 | | | $ | 40 | |
| Shareholders' equity | | | 45,675 | | | | 48,961 | |
| | | | | | | | | |
| Total | | $ | 45,742 | | | $ | 49,001 | |
Condensed Income Statements
| | Years ended December 31, | |
| | 2008 | | 2007 | | 2006 | |
| | | | | | | |
Income: | | | | | | | |
Equity in undistributed earnings of subsidiary | | $ | 1,337 | | $ | 3,163 | | $ | 2,972 | |
Dividends from subsidiary | | 2,580 | | 1,613 | | 1,253 | |
Other income | | 16 | | 13 | | 14 | |
| | | | | | | |
Total income | | 3,933 | | 4,789 | | 4,239 | |
| | | | | | | |
Operating expenses | | 446 | | 267 | | 163 | |
| | | | | | | |
Income before income taxes | | 3,487 | | 4,522 | | 4,076 | |
| | | | | | | |
Credit for income taxes | | 149 | | 90 | | 49 | |
| | | | | | | |
Net income | | $ | 3,636 | | $ | 4,612 | | $ | 4,125 | |
80
Table of Contents
| | | Years ended December 31, | |
| | | 2009 | | | 2008 | | | 2007 | |
| Income: | | | | | | | | | |
| Equity in undistributed earnings of subsidiary | | $ | (2,684 | ) | | $ | 1,337 | | | $ | 3,163 | |
| Dividends from subsidiary | | | 1,439 | | | | 2,580 | | | | 1,613 | |
| Other income | | | 19 | | | | 16 | | | | 13 | |
| | | | | | | | | | | | | |
| Total (loss) income | | | (1,226 | ) | | | 3,933 | | | | 4,789 | |
| | | | | | | | | | | | | |
| Operating expenses | | | 258 | | | | 446 | | | | 267 | |
| | | | | | | | | | | | | |
| (Loss) income before taxes | | $ | (1,484 | ) | | $ | 3,487 | | | $ | 4,522 | |
| | | | | | | | | | | | | |
| Credit for income taxes | | | 84 | | | | 149 | | | | 90 | |
| | | | | | | | | | | | | |
| Net (loss) income | | $ | (1,400 | ) | | $ | 3,636 | | | $ | 4,612 | |
Condensed Statements of Cash Flows
| | | Years ended December 31, | |
| | | 2009 | | | 2008 | | | 2007 | |
| Cash flows from operating activities: | | | | | | | | | |
| Net (loss) income | | $ | (1,400 | ) | | $ | 3,636 | | | $ | 4,612 | |
| Adjustments to reconcile net (loss) income to net cash used in operations: | | | | | | | | | | | | |
| Equity in earnings of subsidiary | | | 1,245 | | | | (3,917 | ) | | | (4,777 | ) |
| Stock-based compensation expense | | | 5 | | | | 129 | | | | 16 | |
| Deferred income tax benefit | | | - | | | | (43 | ) | | | (3 | ) |
| Changes in other assets and liabilities, net | | | 27 | | | | (17 | ) | | | (10 | ) |
| | | | | | | | | | | | | |
| Net cash used in operating activities | | | (123 | ) | | | (212 | ) | | | (162 | ) |
| | | | | | | | | | | | | |
| Cash flows provided by investing activities: | | | | | | | | | | | | |
| Dividends received from subsidiary | | | 1,439 | | | | 2,580 | | | | 1,613 | |
| Purchases of securities available-for-sale | | | - | | | | - | | | | (50 | ) |
| | | | | | | | | | | | | |
| Net cash provided by investing activities | | | 1,439 | | | | 2,580 | | | | 1,563 | |
| | | | | | | | | | | | | |
| Cash flows from financing activities: | | | | | | | | | | | | |
| Dividends paid, net of dividend reinvestment | | | (1,255 | ) | | | (1,995 | ) | | | (1,484 | ) |
| Purchase of treasury stock | | | (57 | ) | | | (430 | ) | | | - | |
| Withholdings to purchase capital stock | | | 41 | | | | 57 | | | | 68 | |
| | | | | | | | | | | | | |
| Net cash used in financing activities | | | (1,271 | ) | | | (2,368 | ) | | | (1,416 | ) |
| | | | | | | | | | | | | |
| Net increase (decrease) in cash | | | 45 | | | | - | | | | (15 | ) |
| | | | | | | | | | | | | |
| Cash, beginning | | | 2 | | | | 2 | | | | 17 | |
| | | | | | | | | | | | | |
| Cash, ending | | $ | 47 | | | $ | 2 | | | $ | 2 | |
| | Years ended December 31, | |
| | 2008 | | 2007 | | 2006 | |
| | | | | | | |
Cash flows from operating activities: | | | | | | | |
Net income | | $ | 3,636 | | $ | 4,612 | | $ | 4,125 | |
Adjustments to reconcile net income to net cash used in operations: | | | | | | | |
Equity in earnings of subsidiary | | (3,917 | ) | (4,777 | ) | (4,225 | ) |
Stock-based compensation expense | | 129 | | 16 | | 29 | |
Deferred income tax benefit | | (17 | ) | (3 | ) | — | |
Changes in other assets and liabilities, net | | (43 | ) | (10 | ) | 19 | |
| | | | | | | |
Net cash used in operating activities | | (212 | ) | (162 | ) | (52 | ) |
| | | | | | | |
Cash flows provided by investing activities: | | | | | | | |
Dividends received from subsidiary | | 2,580 | | 1,613 | | 1,253 | |
Purchases of securities available for sale | | — | | (50 | ) | — | |
| | | | | | | |
Net cash provided by investing activities | | 2,580 | | 1,563 | | 1,253 | |
| | | | | | | |
Cash flows from financing activities: | | | | | | | |
Dividends paid, net of dividend reinvestment | | (1,995 | ) | (1,484 | ) | (1,240 | ) |
Purchase of treasury stock | | (430 | ) | — | | — | |
Withholdings to purchase capital stock | | 57 | | 68 | | 48 | |
| | | | | | | |
Net cash used in financing activities | | (2,368 | ) | (1,416 | ) | (1,192 | ) |
| | | | | | | |
Net (decrease) increase in cash | | — | | (15 | ) | 9 | |
| | | | | | | |
Cash, beginning | | 2 | | 17 | | 8 | |
| | | | | | | |
Cash, ending | | $ | 2 | | $ | 2 | | $ | 17 | |
Item 9: CHANGES IN AND DISAGREEMENTS WITH ACCOUNTANTS ON ACCOUNTING AND FINANCIAL DISCLOSURE
As of the end of the period covered by this Annual Report on Form 10-K, an evaluation was carried out by the Company’s management, with the participation of its
Interim President and Chief Executive Officer and
the Chief Financial Officer, of the effectiveness of the Company’s disclosure controls and procedures, as defined in Rule 13a-15(e) under the Securities Exchange Act of 1934. Based on such evaluation, the
Interim President and Chief Executive Officer and
the Chief Financial Officer concluded that the Company’s disclosure controls and procedures are designed to ensure that information required to be disclosed in the reports the Company files or furnishes under the Securities Exchange Act of 1934 is recorded, processed, summarized and reported within the time periods specified in the SEC’s rules and regulations, and are
operating in an effective manner. In addition, theThe SEC has extended the deadline for non-accelerated filers, such as the Company, for an auditor attestation on internal control over financial reporting to fiscal years ending after DecemberJune 15, 2009.2010. Furthermore, the Company made no changes in its internal controls over financial reporting or in other factors that materially affected, or are reasonably likely to materially affect, these controls during the last fiscal quarter ended December 31, 2008.2009.
Management’s Report on Internal Control Over Financial Reporting
Management of the Company is responsible for establishing and maintaining adequate internal control over financial reporting. The Company’s internal control over financial reporting is a process designed under the supervision of the
81
Table of Contents
Company’s Interim President and Chief Executive Officer and the Chief Financial Officer, and implemented in conjunction with management and other personnel, to provide reasonable assurance regarding the reliability of financial reporting and the preparation of the Company’s consolidated financial statements for external purposes in accordance with generally accepted accounting principles.
There are inherent limitations in the effectiveness of any internal control, including the possibility of human error and the circumvention or overriding of controls. Accordingly, even effective internal control can provide only reasonable assurance with respect to financial statement preparation. Further, because of changes in conditions, the effectiveness of internal control may vary over time.
Management assessed the effectiveness of the Company’s internal control over financial reporting as of December 31,
2008.2009. This assessment was based on criteria for effective internal control over financial reporting described in “Internal Control
—– Integrated Framework,” issued by the Committee of Sponsoring Organizations of the Treadway Commission (COSO). Based on this assessment, management determined that, as of December 31,
2008,2009, the Company maintained effective internal control over financial reporting.
This annual report does not include an attestation report of the Company’s registered public accounting firm regarding internal control over financial reporting. Management’s report was not subject to attestation by the Company’s registered public accounting firm pursuant to temporary rules of the SEC that permit the Company to provide only management’s report in this annual report.
None.
Item 10: DIRECTORS, EXECUTIVE OFFICERS AND CORPORATE GOVERNANCE
The information required under Items 401 and 407(c)(3), (d)(4) and (d)(5) of Regulation S-K is incorporated by reference herein, to the information presented in the Company’s definitive Proxy Statement for its
20092010 Annual Meeting of Shareholders to be filed with the SEC.
Section 16(a) Beneficial Ownership Reporting Compliance
The information required under this section is incorporated by reference herein, to the information presented in the Company’s definitive Proxy Statement for its
20092010 Annual Meeting of Shareholders to be filed with the SEC.
The Company adopted a written code of ethics that applies to our directors, officers and employees, including our chief executive officer and chief financial officer, which is available on our website at http://www.bankatfidelity.com through the Investor Relations link and then under the heading “Governance Documents.” In addition, copies of our code of ethics will be provided to shareholders upon written request to Fidelity D & D Bancorp, Inc., Blakely and Drinker Streets, Dunmore, PA 18512 at no charge.
The information required by this Item is incorporated by reference herein, to the information presented in the Company’s definitive Proxy Statement for its
20092010 annual meeting of shareholders to be filed with the SEC.
The information required by this Item is incorporated by reference herein, to the information presented in the Company’s definitive Proxy Statement for its
20092010 annual meeting of shareholders to be filed with the SEC.
The information required by this Item, relating to transactions with management and others, certain business relationships and indebtedness of management, is set forth above in Footnote No. 15 “Related
Part Transactions,”Party Transactions”, of
82
Table of Contents
Part II, Item 8 “Financial Statements and Supplementary Data,”Data”, and is also incorporated by reference herein to the information presented in the Company’s definitive Proxy Statement for its 20092010 annual meeting of shareholders to be filed with the SEC.
Item 14:PRINCIPAL ACCOUNTANT FEES AND SERVICES The information required by this Item is incorporated by reference herein, to the information presented in the Company’s definitive Proxy Statement for its
20092010 annual meeting of shareholders to be filed with the SEC.
Item 15: EXHIBITS AND FINANCIAL STATEMENT SCHEDULES
| (a) | (a) (1) Financial Statements - The following financial statements are included by reference in Part II, Item 8 hereof:
|
Report of Independent Registered Public Accounting Firm
Consolidated Balance Sheets
Consolidated Statements of Income
Consolidated Statements of Changes in Shareholders’ Equity
Consolidated Statements of Cash Flows
Notes to Consolidated Financial Statements
- The following financial statements are included by reference in Part II, Item 8 hereof: (2) Financial Statement Schedules
Financial Statement Schedules are omitted because the required information is either not applicable, the data is not significant or the required information is shown in the respective financial statements or in the notes thereto or elsewhere herein.
(3) Exhibits
The following exhibits are filed herewith or incorporated by reference as a part of this Form 10-K:
3(i) Amended and Restated Articles of Incorporation of Registrant. Incorporated by reference to Annex B of the Proxy Statement/Prospectus included in Registrant’s Amendment 4 to its Registration Statement No. 333-90273 on Form S-4, filed with the SEC on April 6, 2000.
3(ii) Amended and Restated Bylaws of Registrant. Incorporated by reference to Exhibit 3(ii) to Registrant’s Form 8-K filed with the SEC on November 21, 2007.
*10.1 1998 Independent Directors Stock Option Plan of The Fidelity Deposit and Discount Bank, as assumed by Registrant. Incorporated by reference to Exhibit 10.1 to Registrant’s Registration Statement No. 333-90273 on Form S-4, filed with the SEC on November 3, 1999.
*10.2 1998 Stock Incentive Plan of The Fidelity Deposit and Discount Bank, as assumed by Registrant. Incorporated by reference to Exhibit 10.2 of Registrant’s Registration Statement No. 333-90273 on Form S-4, filed with the SEC on November 3, 1999.
*10.3 Registrant’s 2000 Dividend Reinvestment Plan. Incorporated by reference to Exhibit 4 to Registrant’s Registration Statement No. 333-45668 on Form S-1, filed with the SEC on September 12, 2000 and as amended by Pre-Effective Amendment No. 1 on October 11, 2000, by Post-Effective Amendment No. 1 on May 30, 2001, by Post-Effective Amendment No. 2 on July 7, 2005, and by Registration Statement No. 333-152806 on Form S-3 filed on August 6, 2008.2008 and by Post-Effective Amendment No. 1 on January 25, 2010.
*10.4 Registrant’s 2000 Independent Directors Stock Option Plan. Incorporated by reference to Exhibit 4.3 to Registrant’s Registration Statement No. 333-64356 on Form S-8 filed with the SEC on July 2, 2001.
*10.5 Amendment, dated October 2, 2007, to the Registrant’s 2000 Independent Directors Stock Option Plan. Incorporated by reference to Exhibit 10.2 to Registrant’s Form 8-K filed with the SEC on October 4, 2007.83
Table of Contents
*10.6 Registrant’s 2000 Stock Incentive Plan. Incorporated by reference to Exhibit 4.4 to Registrant’s Registration Statement No. 333-64356 on Form S-8 filed with the SEC on July 2, 2001.
*10.7 Amendment, dated October 2, 2007, to the Registrant’s 2000 Stock Incentive Plan. Incorporated by reference to Exhibit 10.1 to Registrant’s Form 8-K filed with the SEC on October 4, 2007.
*10.8 Registrant’s 2002 Employee Stock Purchase Plan. Incorporated by reference to Exhibit 4.54.4 to Registrant’s Registration Statement No. 333-113339 on Form S-8 filed with the SEC on March 5, 2004.
*10.9 Complete Settlement Agreement and General Release between Michael F. Marranca, Registrant and The Fidelity Deposit and Discount Bank, dated July 30, 2004. Incorporated by reference to Exhibit 99.1 to Registrant’s Current Report on Form 8-K filed with the SEC on August 10, 2004.*10.10 Amendment to the Complete Settlement Agreement and General Release between Michael F. Marranca, Registrant and The Fidelity Deposit and Discount Bank, dated November 4, 2005. Incorporated by reference toExhibit 99.1 to Registrant’s Current Report on Form 8-K filed with the SEC on November 9, 2005.
*10.11 Change of Control Agreements with Salvatore R. DeFrancesco, Registrant and The Fidelity Deposit and Discount Bank, dated March 21, 2006. Incorporated by reference to Exhibit 99.2 to Registrant’s Current Report on Form 8-K filed with the SEC on March 27, 2006.
*10.1210.10 Amended and Restated Executive Employment Agreement between Fidelity D & D Bancorp, Inc., The Fidelity Deposit and Discount Bank and Steven C. Ackmann, dated July 11, 2007.Incorporated by reference to Exhibit 10.1 to Registrant’s Current Report on Form 8-K filed with the SEC on July 13, 2007.
*10.1310.11 Executive Employment Agreement between Fidelity D & D Bancorp, Inc., The Fidelity Deposit and Discount Bankand Timothy P. O’Brien, dated January 3, 2008. Incorporated by reference to Exhibit 10.1 to Registrant’s Current Report on Form 8-K filed with the SEC on January 10, 2008.
*10.1410.12 Executive Employment Agreement between Fidelity D & D Bancorp, Inc., The Fidelity Deposit and Discount Bankand Daniel J. Santaniello, dated February 28, 2008. Incorporated by reference to Exhibit 10.1 to Registrant’s Current Report on Form 8-K filed with the SEC on March 3, 2008.
*10.13 Release Agreement between Steven C. Ackmann, Registrant and The Fidelity Deposit and Discount Bank, dated August 31, 2009. Incorporated by reference to Exhibit 99.1 to Registrant’s Current Report on Form 8-K filed with the SEC on September 8, 2009.
*10.14 Consulting Agreement between Steven C. Ackmann, former President and Chief Executive Officer of the Registrant and The Fidelity Deposit and Discount Bank, and The Fidelity Deposit and Discount Bank, dated September 1, 2009. Incorporated by reference to Exhibit 99.2 to Registrant’s Current Report on Form 8-K filed with the SEC on September 8, 2009.
11 Statement regarding computation of earnings per share. Included herein in Note 13 “Earnings per Share,”Share”, contained within the notes to consolidated financial statements, and incorporated herein by reference.
12 Statement regarding computation of ratios. Included herein in Item 6, “Selected Financial Data.”
13 Annual Report to Shareholders. Incorporated by reference to the 20082009 Annual Report to Shareholders filed with the SEC on Form ARS.
14 Code of Ethics. Incorporated by reference to the 2003 Annual Report to Shareholders on Form 10-K filed with the SEC on March 29, 2004.
21 Subsidiaries of the Registrant.
23 Consent of Independent Registered Public Accounting Firm.
31.1 Rule 13a-14(a) Certification of Principal Executive Officer, filed herewith.
31.2 Rule 13a-14(a) Certification of Principal Financial Officer, filed herewith.
84
Table of Contents
32.1 Certification of Principal Executive Officer pursuant to 18 U.S.C. Section 1350,as adopted pursuant to Section 906 of the Sarbanes-Oxley Act of 2002, filed herewith.
32.2 Certification of Principal Financial Officer pursuant to 18 U.S.C. Section 1350,
as adopted pursuant to Section 906 of the Sarbanes-Oxley Act of 2002, filed herewith.(b)The exhibits required to be filed by this Item are listed under Item 15(a) 3, above.
(c)Not applicable.
| (b) | The exhibits required to be filed by this Item are listed under Item 15(a) 3, above. |
* Management contract or compensatory plan or arrangement.
85
Pursuant to the requirements of Section 13 or 15(d) of the Securities and Exchange Act of 1934, the registrant has duly caused this report to be signed on its behalf by the undersigned, thereunto duly authorized.
| FIDELITY D & D BANCORP, INC. |
| (Registrant) |
| | |
| | |
Date: March 6, 2009 5, 2010 | By: | /s/ STEVEN C. ACKMANNPatrick J. Dempsey | |
| | Steven C. Ackmann,
Patrick J. Dempsey, |
| | Interim President and Chief Executive Officer |
| | |
| | |
Date: March 6, 2009 5, 2010 | By: | /s/ SALVATORESalvatore R. DEFRANCESCO, JR.DeFrancesco, Jr. | |
| | Salvatore R. DeFrancesco, Jr., |
| | Treasurer and Chief Financial Officer |
Pursuant to the requirements of the Securities and Exchange Act of 1934, this report has been signed below by the following person on behalf of the registrant and in the capacities and on the dates indicated.
|
|
| DATE |
|
| | | | |
By: | /s/ STEVEN C. ACKMANNPatrick J. Dempsey | | March 6, 2009 | 5, 2010 |
| Steven C. Ackmann,Patrick J. Dempsey, Interim President and
Chief | | | |
| Chief Executive Officer
and Chairman of the Board of Directors | | | |
| | | | |
By: | /s/ SALVATORESalvatore R. DEFRANCESCO, JR.DeFrancesco, Jr. | | March 6, 2009 | 5, 2010 |
| Salvatore R. DeFrancesco, Jr., Treasurer | | | |
| and Chief Financial Officer | | | |
| | | | |
By: | /s/ SAMUEL C. CALIJohn T. Cognetti | | March 6, 2009 | 5, 2010 |
| Samuel C. Cali, Chairman Emeritus
John T. Cognetti, Secretary and Director | | | |
| and Director
| | | |
| By: | /s/ Michael J. McDonald | | | March 5, 2010 |
By:
| /s/ PATRICKMichael J. DEMPSEY
McDonald, Vice Chairman | | March 6, 2009
| |
| Patrick J. Dempsey, Chairman
| | | |
| of the Board of Directors and Director | | | |
| | | | |
By: | /s/ JOHN T. COGNETTIDavid L. Tressler | | March 6, 2009 | 5, 2010 |
| John T. Cognetti, Secretary and Director
| | | |
| | | | |
By:
| /s/ MICHAEL J. MCDONALD
| | March 6, 2009
| |
| Michael J. McDonald, Vice Chairman
| | | |
| of the Board of Directors and Director
| | | |
| | | | |
By:
| /s/ DAVID L. TRESSLER
| | March 6, 2009
| |
| David L. Tressler, Director | | | |
| | | | |
By: | /s/ MARYMary E. MCDONALDMcDonald | | March 6, 2009 | 5, 2010 |
| Mary E. McDonald, Assistant Secretary
and Director | | | |
| | | | |
By: | /s/ BRIANBrian J. CALICali | | March 6, 2009 | 5, 2010 |
| Brian J. Cali, Director | | | |
86
|
| Page |
| | |
3(i) Amended and Restated Articles of Incorporation of Registrant. Incorporated by reference to Annex B of the Proxy Statement/Prospectus included in Registrant’s Amendment 4 to its Registration Statement No. 333-90273 on Form S-4, filed with the SEC on April 6, 2000. | | * |
| | |
3(ii) Amended and Restated Bylaws of Registrant. Incorporated by reference to Exhibit 3(ii) to Registrant’s Form 8-K filed with the SEC on November 21, 2007. |
| * |
| | |
10.1 1998 Independent Directors Stock Option Plan of The Fidelity Deposit and Discount Bank, as assumed by Registrant. Incorporated by reference to Exhibit 10.1 to Registrant’s Registration Statement No. 333-90273 on Form S-4, filed with the SEC on November 3, 1999. |
| * |
| | |
10.2 1998 Stock Incentive Plan of The Fidelity Deposit and Discount Bank, as assumed by Registrant. Incorporated by reference to Exhibit 10.2 of Registrant’s Registration Statement No. 333-90273 on Form S-4, filed with the SEC on November 3, 1999. |
| * |
| | |
10.3 Registrant’s 2000 Dividend Reinvestment Plan. Incorporated by reference to Exhibit 4 to Registrant’s Registration Statement No. 333-45668 on Form S-1, filed with the SEC on September 12, 2000 and as amended by Pre-Effective Amendment No. 1 on October 11, 2000, by Post-Effective Amendment No. 1 on May 30, 2001, by Post-Effective Amendment No. 2 on July 7, 2005 and by Registration Statement No. 333-152806 on Form S-3 filed on August 6, 2008.2008 and by Post-Effective Amendment No. 1 on January 25, 2010 . |
| * |
| | |
10.4 Registrant’s 2000 Independent Directors Stock Option Plan. Incorporated by reference to Exhibit 4.3 to Registrant’s Registration Statement No. 333-64356 on Form S-8 filed with the SEC on July 2, 2001. |
| * |
| | |
10.5 Amendment, dated October 2, 2007, to the Registrant’s 2000 Independent Directors Stock Option Plan. Incorporated by reference to Exhibit 10.2 to Registrant’s Form 8-K filed with the SEC on October 4, 2007. |
| * |
| | |
10.6 Registrant’s 2000 Stock Incentive Plan. Incorporated by reference to Exhibit 4.4 to Registrant’s Registration Statement No. 333-64356 on Form S-8 filed with the SEC on July 2, 2001. |
| * |
| | |
10.7 Amendment, dated October 2, 2007, to the Registrant’s 2000 Stock Incentive Plan. Incorporated by reference to Exhibit 10.1 to Registrant’s Form 8-K filed with the SEC on October 4, 2007. |
| * |
| | |
10.8 Registrant’s 2002 Employee Stock Purchase Plan. Incorporated by reference to Exhibit 4.5 to Registrant’s Registration Statement No. 333-113339 on Form S-8 filed with the SEC on March 5, 2004. |
| * |
| | |
10.9 Complete Settlement Agreement and General Release between Michael F. Marranca, Registrant and The Fidelity Deposit and Discount Bank, dated July 30, 2004. Incorporated by reference to Exhibit 99.1 to Registrant’s Current Report on Form 8-K filed with the SEC on August 10, 2004. |
| *
|
| | |
10.10 Amendment to the Complete Settlement Agreement and General Release between Michael F. Marranca, Registrant and The Fidelity Deposit and Discount Bank, dated November 4, 2005. Incorporated by reference to Exhibit 99.1 to Registrant’s Current Report on Form 8-K filed with the SEC on November 9, 2005.
|
| *
|
| | |
10.11 Change of Control Agreements with Salvatore R. DeFrancesco, Registrant and The Fidelity Deposit and Discount Bank, dated March 21, 2006.Incorporated by reference to Exhibit 99.2 to Registrant’s Current Report on Form 8-K filed with the SEC on March 27, 2006.
|
| * |
| | |
10.1210.10 Amended and Restated Executive Employment Agreement between Fidelity D & D Bancorp, Inc., The Fidelity Deposit and Discount Bank and Steven C. Ackmann, dated July 11, 2007.Incorporated by reference to Exhibit 10.1 to Registrant’s Current Report on Form 8-K filed with the SEC on July 13, 2007.
|
| * |
87
10.13
10.11 Executive Employment Agreement between Fidelity D & D Bancorp, Inc., The Fidelity Deposit and Discount Bank and Timothy P. O’Brien, dated January 3, 2008. Incorporated by reference to Exhibit 10.1 to Registrant’s Current Report on Form 8-K filed with the SEC on January 10, 2008. |
| * |
|
|
|
10.1410.12 Executive Employment Agreement between Fidelity D & D Bancorp, Inc., The Fidelity Deposit and Discount Bank and Daniel J. Santaniello, dated February 28, 2008. Incorporated by reference to Exhibit 10.1 to Registrant’s Current Report on Form 8-K filed with the SEC on March 3, 2008.
|
| * |
|
|
|
*10.13 Release Agreement between Steven C. Ackmann, Registrant and The Fidelity Deposit and Discount Bank, dated August 31, 2009. Incorporated by reference to Exhibit 99.1 to Registrant’s Current Report on Form 8-K filed with the SEC on September 8, 2009. | | * |
| | |
*10.14 Consulting Agreement between Steven C. Ackmann, former President and Chief Executive Officer of the Registrant and The Fidelity Deposit and Discount Bank, and The Fidelity Deposit and Discount Bank, dated September 1, 2009. Incorporated by reference to Exhibit 99.2 to Registrant’s Current Report on Form 8-K filed with the SEC on September 8, 2009. | | * |
| | |
11 Statement regarding computation of earnings per share. Included herein Note 13, “Earnings per Share,”Share”, contained within the Notes to Consolidated Financial Statements, and incorporated herein by reference. |
| 74
76 |
|
|
|
12 Statement regarding computation of ratios. Included herein in Item 6, “Selected Financial Data”. |
| 15
14 |
|
|
|
13 Annual Report to Shareholders. Incorporated by reference to the 20082009 Annual Report to Shareholders filed with the SEC on Form ARS. |
| * |
|
|
|
14 Code of Ethics. Incorporated by reference to the 2003 Annual Report to Shareholders on Form 10-K filed with the SEC on March 29, 2004. |
| * |
|
|
|
21 Subsidiaries of the Registrant. |
| 89
91 |
| | |
23 Consent of Independent Registered Public Accounting Firm. |
| 90
92 |
|
|
|
31.1 Rule 13a-14(a) Certification of Principal Executive Officer. |
| 91
93 |
|
|
|
31.2 Rule 13a-14(a) Certification of Principal Financial Officer. |
| 92
94 |
|
|
|
32.1 Certification of Principal Executive Officer pursuant to 18 U.S.C. Section 1350, as adopted pursuant to Section 906 of the Sarbanes-Oxley Act of 2002. |
| 93
95 |
|
|
|
32.2 Certification of Principal Financial Officer pursuant to 18 U.S.C. Section 1350, as adopted pursuant to Section 906 of the Sarbanes-Oxley Act of 2002. |
| 94
96 |
*Incorporated by Reference
88