2010
DELAWARE | 39-1140809 | |||
(State of incorporation) | (I.R.S. Employer Identification no.) | |||
129 MARTEN STREET | ||||
MONDOVI, WISCONSIN | 54755 |
| (715) 926-4216 | |
(Address of principal executive offices) | (Zip Code) | (Registrant’s telephone number) |
COMMON STOCK, PAR VALUE $.01 PER SHARE THE NASDAQ STOCK MARKET LLC (NASDAQ GLOBAL SELECT MARKET) No ¨ $348,723,000. Page BUSINESS 1 PROPERTIES OTHER the units. otherwise adversely affect our business or operations. 2010. carriers” as approved service providers, or conduct bids from multiple carriers for their shipping needs, and in some instances we may not be selected as a core carrier or to provide service under such bids. Ongoing insurance and claims expenses could significantly affect our earnings. Our future insurance and claims expense might exceed historical levels, which could reduce our earnings. We self-insure for a portion of our claims exposure resulting from workers’ compensation, auto liability, general liability, cargo and property damage claims, as well as employees’ health insurance. We also are responsible for our legal expenses relating to such claims. We reserve currently for anticipated losses and expenses. We periodically evaluate and adjust our claims reserves to reflect our experience. However, ultimate results may differ from our estimates, which could result in losses over our reserved amounts. Service instability in the railroad industry could increase our operating costs and reduce our ability to offer intermodal services, which could adversely affect our revenue, results of operations, and customer relationships. In the future, our dependence on railroads will increase if we continue to expand our intermodal services. In most markets, rail service is limited to a few railroads or even a single railroad. Any reduction in service by the railroads with which we have, or in the future may have, relationships is likely to increase the cost of the rail-based services we provide and reduce the reliability, timeliness, and overall attractiveness of our rail-based services. Furthermore, railroads are relatively free to adjust shipping rates up or down as market conditions permit. Price increases could result in higher costs to our customers and reduce or eliminate our ability to offer intermodal services. In addition, we cannot assure you that we will be able to negotiate additional contracts with railroads to expand our capacity, add additional routes, or obtain multiple providers, which could limit our ability to provide this service. Maintenance Fueling Dispatch Sales Mondovi, Wisconsin X X X Ontario, California X Atlanta, Georgia X Portland, Oregon X Indianapolis, Indiana X X Irving, Texas X X Phoenix, Arizona Name Age Position Randolph L. Marten Timothy M. Kohl President Robert G. Smith Chief Operating Officer Timothy P. Nash Executive Vice President of Sales and Marketing James J. Hinnendael Chief Financial Officer John H. Turner Vice President of Sales Randolph L. Marten has been a full-time employee of ours since 1974. Mr. Marten has been a Director since October 1980, our Chairman of the Board since August 1993 and our Chief Executive Officer since January 2005. Mr. Marten also served as our President from June 1986 until June 2008, our Chief Operating Officer from June 1986 until August 1998 and as a Vice President from October 1980 to June 1986. Common Stock Price High Low Year ended December 31, 2008 Fourth Quarter $ 20.61 $ 14.98 Third Quarter 22.59 15.00 Second Quarter 18.32 15.00 First Quarter 17.85 11.50 Year ended December 31, 2007 Fourth Quarter $ 16.60 $ 10.60 Third Quarter 18.46 13.54 Second Quarter 19.80 15.70 First Quarter 19.28 14.30 In the first quarter of 2008 we repurchased and retired 67,500 shares of our common stock for $810,000. We made no purchases in (Dollars in thousands, except per share amounts) 2008 2007 2006 2005 2004 FOR THE YEAR Operating revenue $ 607,099 $ 560,017 $ 518,890 $ 460,202 $ 380,048 Operating income 32,705 27,801 41,169 42,867 31,345 Net income 18,071 14,968 24,518 25,061 17,536 Operating ratio 94.6 % 95.0 % 92.1 % 90.7 % 91.8 % PER-SHARE DATA Basic earnings per common share $ 0.83 $ 0.69 $ 1.13 $ 1.16 $ 0.83 Diluted earnings per common share 0.82 0.68 1.12 1.14 0.81 Book value 11.71 10.86 10.15 8.99 7.82 AT YEAR END Total assets $ 397,443 $ 407,390 $ 410,822 $ 349,733 $ 288,929 Long-term debt 2,857 44,643 58,659 48,300 30,257 Stockholders’ equity 255,736 236,930 220,993 193,917 167,921 customers. our internal brokerage and intermodal services, and in the logistics services provided by to 21.6% in 2009 and 16.3% in 2008. 2009. The increased profitability in 2010 was primarily due to the improvement in our overall cost structure and the increase in revenue per tractor per week in our Truckload segment. 2014. 2008 2007 2006 Truckload Segment: Average truckload revenue, net of fuel surcharges, per total mile $ 1.512 $ 1.480 $ 1.477 Average miles per tractor(1) 108,026 109,269 108,781 Average truckload revenue, net of fuel surcharges, per tractor $ 3,124 $ 3,101 $ 3,081 Average tractors(1) 2,352 2,516 2,504 Average miles per trip 853 911 937 Total miles — company-employed drivers (in thousands) 222,043 228,776 222,579 Total miles — independent contractors (in thousands) 32,081 46,096 49,810 Logistics Segment: Brokerage: Revenue (in thousands) $ 62,315 $ 48,640 $ 28,636 Loads 30,410 25,246 16,083 Intermodal: Revenue (in thousands) $ 36,598 $ 20,837 $ 12,604 Loads 11,513 6,793 4,073 Average tractors 53 31 19 Dollar Percentage Change Change (Dollars in thousands) 2008 2007 2008 vs. 2007 2008 vs. 2007 Operating revenue: Truckload revenue, net of fuel surcharge revenue $ 384,264 $ 406,754 $ (22,490 ) (5.5 )% Truckload fuel surcharge revenue 123,922 83,786 40,136 47.9 Total Truckload revenue 508,186 490,540 17,646 3.6 Logistics revenue, net of intermodal fuel surcharge revenue(1) 90,194 66,163 24,031 36.3 Intermodal fuel surcharge revenue 8,719 3,314 5,405 163.1 Total Logistics revenue 98,913 69,477 29,436 42.4 Total operating revenue $ 607,099 $ 560,017 $ 47,082 8.4 % Operating income: Truckload $ 26,055 $ 22,689 $ 3,366 14.8 % Logistics 6,650 5,112 1,538 30.1 Total operating income $ 32,705 $ 27,801 $ 4,904 17.6 % Operating ratio(2): Truckload 94.9 % 95.4 % 0.5 % Logistics 93.3 92.6 (0.8 ) Consolidated operating ratio 94.6 % 95.0 % 0.4 % prices in 2010. operating statistics are 2009. arranged as a percentage of our brokerage revenue due to carrier constraints. Dollar Percentage Percentage of Change Change Operating Revenue (Dollars in thousands) 2008 vs. 2007 2008 vs. 2007 2008 2007 Operating revenue: $ 47,082 8.4 % 100.0 % 100.0 % Operating expenses (income): Salaries, wages and benefits (1,158 ) (0.8 ) 25.1 27.5 Purchased transportation 9,399 9.1 18.6 18.5 Fuel and fuel taxes 26,871 18.0 29.0 26.6 Supplies and maintenance (243 ) (0.6 ) 6.3 6.9 Depreciation 2,696 5.7 8.2 8.4 Operating taxes and licenses (94 ) (1.4 ) 1.1 1.2 Insurance and claims 3,056 13.7 4.2 4.0 Communications and utilities (129 ) (3.3 ) 0.6 0.7 Gain on disposition of revenue equipment 722 21.3 (0.4 ) (0.6 ) Other 1,058 10.2 1.9 1.8 Total operating expenses 42,178 7.9 94.6 95.0 Operating income 4,904 17.6 5.4 5.0 Other expenses (income): Interest expense (2,681 ) (70.1 ) 0.2 0.7 Interest income and other 509 73.4 — (0.1 ) Minority interest 318 39.7 0.2 0.1 (1,854 ) (47.2 ) 0.3 0.7 Income before income taxes 6,758 28.3 5.0 4.3 Provision for income taxes 3,655 41.1 2.1 1.6 Net income $ 3,103 20.7 % 3.0 % 2.7 % from 2009 to 2010. segment. capacity of our regional maintenance facilities. Our maintenance practices were consistent with 2009. inventory. 93.5% for 2009. 2009. Dollar Percentage Change Change (Dollars in thousands) 2007 2006 2007 vs. 2006 2007 vs. 2006 Operating revenue: Truckload revenue, net of fuel surcharge revenue $ 406,754 $ 402,327 $ 4,427 1.1 % Truckload fuel surcharge revenue 83,786 75,323 8,463 11.2 Total Truckload revenue 490,540 477,650 12,890 2.7 Logistics revenue, net of intermodal fuel surcharge revenue(1) 66,163 39,298 26,865 68.4 Intermodal fuel surcharge revenue 3,314 1,942 1,372 70.6 Total Logistics revenue 69,477 41,240 28,237 68.5 Total operating revenue $ 560,017 $ 518,890 $ 41,127 7.9 % Operating income: Truckload $ 22,689 $ 37,500 $ (14,811 ) (39.5 )% Logistics 5,112 3,669 1,443 39.3 Total operating income $ 27,801 $ 41,169 $ (13,368 ) (32.5 )% Operating ratio(2): Truckload 95.4 % 92.1 % (3.6 )% Logistics 92.6 91.1 (1.6 ) Consolidated operating ratio 95.0 % 92.1 % (3.1 )% revenue. 2009 increased by 0.8% from 2008. Dollar Percentage Percentage of Change Change Operating Revenue (Dollars in thousands) 2007 vs. 2006 2007 vs. 2006 2007 2006 Operating revenue: $ 41,127 7.9 % 100.0 % 100.0 % Operating expenses (income): Salaries, wages and benefits 9,401 6.5 27.5 27.8 Purchased transportation 19,367 22.9 18.5 16.3 Fuel and fuel taxes 13,942 10.3 26.6 26.0 Supplies and maintenance 5,466 16.5 6.9 6.4 Depreciation 2,649 6.0 8.4 8.5 Operating taxes and licenses (691 ) (9.2 ) 1.2 1.4 Insurance and claims 1,170 5.5 4.0 4.1 Communications and utilities 234 6.4 0.7 0.7 Gain on disposition of revenue equipment 3,604 51.6 (0.6 ) (1.3 ) Other (647 ) (5.9 ) 1.8 2.1 Total operating expenses 54,495 11.4 95.0 92.1 Operating income (13,368 ) (32.5 ) 5.0 7.9 Other expenses (income): Interest expense 259 7.3 0.7 0.7 Interest income and other 413 37.3 (0.1 ) (0.2 ) Minority interest 34 4.4 0.1 0.1 706 21.9 0.7 0.6 Income before income taxes (14,074 ) (37.1 ) 4.3 7.3 Provision for income taxes (4,524 ) (33.7 ) 1.6 2.6 Net income $ (9,550 ) (39.0 )% 2.7 % 4.7 % bonus compensation expensed for our non-driver employees. other assets. The increase in depreciation was primarily due to 2009. We expect our annual cost of tractor and trailer ownership will increase in future periods as a result of higher prices of new equipment, which will result in greater depreciation over the useful life. trailers sold. 2008. The operating ratio for our Truckload segment decreased to 94.2% from 94.9% in 2008 and the operating ratio for our Logistics segment increased to 94.0% from 93.3% in 2008. The more broad implementation of our per diem pay structure for our drivers in 2009 positively impacted our operating ratio in 2009 compared with 2008. more broadly implemented during 2009. (In thousands) 2008 2007 2006 Net cash flows provided by operating activities $ 76,356 $ 61,807 $ 77,070 Net cash flows (used for) investing activities (37,602 ) (46,826 ) (86,848 ) Net cash flows (used for) provided by financing activities (39,977 ) (14,351 ) 11,686 Long-term debt, including current maturities, at December 31 2,857 44,643 58,659 The following is a summary of our contractual obligations as of December 31, Payments Due by Period 2010 and (In thousands) 2009 2011 2012 Thereafter Total Purchase obligations for revenue equipment $ 3,451 $ — $ — $ — $ 3,451 Long-term debt obligations 1,428 1,429 — — 2,857 Building construction obligations 2,170 — — — 2,170 Operating lease obligations 478 460 83 56 1,077 Total $ 7,527 $ 1,889 $ 83 $ 56 $ 9,555 2010. fuel price increases related to non-revenue miles or fuel used while the tractor is idling. We account for revenue of our Logistics segment and revenue on freight transported by independent contractors within our Truckload segment on a gross basis because we are the primary obligor in the arrangements, we have the ability to establish prices, we have the risk of loss in the event of cargo claims and we bear credit risk with customer payments. Accordingly, all such revenue billed to customers is classified as operating revenue and all corresponding payments to carriers for transportation services we arrange in connection with brokerage and intermodal activities and to independent contractor providers of revenue equipment are classified as purchased transportation expense. useful life. We determine and periodically evaluate our estimate of the projected salvage values and useful lives primarily by considering the market for used equipment, prior useful lives and changes in technology. We have not changed our policy regarding salvage values as a percentage of initial cost or useful lives of tractors and trailers within the last ten years. We believe that our policies and past estimates have been reasonable. Actual results could differ from these estimates. A 5% decrease in estimated salvage values would have decreased our net property and equipment as of December 31, Share-based Payment Arrangement increases related to non-revenue miles or fuel used while the tractor is idling. In addition, we have worked diligently to control fuel usage and costs by improving our volume purchasing arrangements and optimizing our drivers’ fuel purchases with national fuel centers, focusing on shorter lengths of haul, installing and tightly managing the use of auxiliary power units in our tractors to minimize engine idling and improving fuel usage in the temperature-control units on our trailers. December 31, (In thousands, except share information) 2008 2007 ASSETS Current assets: Cash $ 2,395 $ 3,618 Marketable securities 2,604 350 Receivables: Trade, less allowances of $380 and $315, respectively 50,143 51,539 Other 7,385 6,175 Prepaid expenses and other 13,705 13,823 Deferred income taxes 6,140 4,653 Total current assets 82,372 80,158 Property and equipment: Revenue equipment 423,188 423,261 Buildings and land 14,067 12,099 Office equipment and other 13,917 12,070 Less accumulated depreciation (136,871 ) (122,246 ) Net property and equipment 314,301 325,184 Other assets 770 2,048 $ 397,443 $ 407,390 LIABILITIES AND STOCKHOLDERS’ EQUITY Current liabilities: Checks issued in excess of cash balances $ 1,807 $ — Accounts payable 15,785 14,653 Insurance and claims accruals 21,386 17,431 Accrued liabilities 17,109 17,731 Current maturities of long-term debt 1,428 5,000 Total current liabilities 57,515 54,815 Long-term debt, less current maturities 1,429 39,643 Deferred income taxes 81,048 74,719 Total liabilities 139,992 169,177 Commitments and contingencies (Note 10) Minority interest 1,715 1,283 Stockholders’ equity: Preferred stock, $.01 par value per share; 2,000,000 shares authorized; no shares issued and outstanding — — Common stock, $.01 par value per share; 48,000,000 shares authorized; 21,830,071 shares at December 31, 2008, and 21,811,837 shares at December 31, 2007, issued and outstanding 218 218 Additional paid-in capital 75,305 74,570 Retained earnings 180,213 162,142 Total stockholders’ equity 255,736 236,930 $ 397,443 $ 407,390 For the years ended December 31, (In thousands, except per share information) 2008 2007 2006 Operating revenue $ 607,099 $ 560,017 $ 518,890 Operating expenses (income): Salaries, wages and benefits 152,616 153,774 144,373 Purchased transportation 113,175 103,776 84,409 Fuel and fuel taxes 175,892 149,021 135,079 Supplies and maintenance 38,378 38,621 33,155 Depreciation 49,705 47,009 44,360 Operating taxes and licenses 6,729 6,823 7,514 Insurance and claims 25,409 22,353 21,183 Communications and utilities 3,740 3,869 3,635 Gain on disposition of revenue equipment (2,664 ) (3,386 ) (6,990 ) Other 11,414 10,356 11,003 574,394 532,216 477,721 Operating income 32,705 27,801 41,169 Other expenses (income): Interest expense 1,142 3,823 3,564 Interest income (184 ) (693 ) (1,106 ) Minority interest 1,120 802 768 2,078 3,932 3,226 Income before income taxes 30,627 23,869 37,943 Provision for income taxes 12,556 8,901 13,425 Net income $ 18,071 $ 14,968 $ 24,518 Basic earnings per common share $ 0.83 $ 0.69 $ 1.13 Diluted earnings per common share $ 0.82 $ 0.68 $ 1.12 Common Stock Additional Retained Total (In thousands) Shares Amount Paid-In Capital Earnings Equity Balance at December 31, 2005 21,573 $ 216 $ 71,045 $ 122,656 $ 193,917 Net income — — — 24,518 24,518 Issuance of common stock from share-based payment arrangement exercises 192 2 811 — 813 Tax benefits from share-based payment arrangement exercises — — 1,298 — 1,298 Share-based payment arrangement compensation expense — — 447 — 447 Balance at December 31, 2006 21,765 218 73,601 147,174 220,993 Net income — — — 14,968 14,968 Issuance of common stock from share-based payment arrangement exercises 47 — 303 — 303 Tax benefits from share-based payment arrangement exercises — — 206 — 206 Share-based payment arrangement compensation expense — — 460 — 460 Balance at December 31, 2007 21,812 218 74,570 162,142 236,930 Net income — — — 18,071 18,071 Repurchase and retirement of common stock (67 ) — (810 ) — (810 ) Issuance of common stock from share-based payment arrangement exercises 85 — 356 — 356 Tax benefits from share-based payment arrangement exercises — — 523 — 523 Share-based payment arrangement compensation expense — — 666 — 666 Balance at December 31, 2008 21,830 $ 218 $ 75,305 $ 180,213 $ 255,736 For the years ended December 31, (In thousands) 2008 2007 2006 CASH FLOWS PROVIDED BY OPERATING ACTIVITIES: Operations: Net income $ 18,071 $ 14,968 $ 24,518 Adjustments to reconcile net income to net cash flows from operating activities: Depreciation 49,705 47,009 44,360 Gain on disposition of revenue equipment (2,664 ) (3,386 ) (6,990 ) Deferred income taxes 4,842 (1,237 ) 8,866 Tax benefits from share-based payment arrangement exercises 523 206 1,298 Excess tax benefits from share-based payment arrangement exercises (456 ) (166 ) (1,156 ) Share-based payment arrangement compensation expense 666 460 447 Minority interest in earnings of affiliate, net of distributions 432 370 482 Changes in other current operating items: Receivables 186 (3,251 ) (105 ) Prepaid expenses and other 118 404 (963 ) Accounts payable (2,066 ) 1,999 5,008 Other current liabilities 6,999 4,431 1,305 Net cash provided by operating activities 76,356 61,807 77,070 CASH FLOWS USED FOR INVESTING ACTIVITIES: Revenue equipment additions (64,509 ) (74,732 ) (125,388 ) Proceeds from revenue equipment dispositions 31,938 27,939 37,301 Buildings and land, office equipment and other additions (4,055 ) (2,976 ) (1,257 ) Proceeds from buildings and land, office equipment and other dispositions — 617 — Net change in other assets 1,278 2,376 2,302 Purchases of marketable securities (28,146 ) (50 ) (3,635 ) Sales of marketable securities 25,892 — 3,829 Net cash used for investing activities (37,602 ) (46,826 ) (86,848 ) CASH FLOWS (USED FOR) PROVIDED BY FINANCING ACTIVITIES: Borrowings under credit facility and long-term debt 154,267 139,105 131,023 Repayment of borrowings under credit facility and long-term debt (196,053 ) (153,121 ) (120,664 ) Repurchase and retirement of common stock (810 ) — — Issuance of common stock from share-based payment arrangement exercises 356 303 813 Excess tax benefits from share-based payment arrangement exercises 456 166 1,156 Change in net checks issued in excess of cash balances 1,807 (804 ) (642 ) Net cash (used for) provided by financing activities (39,977 ) (14,351 ) 11,686 NET CHANGE IN CASH (1,223 ) 630 1,908 CASH: Beginning of year 3,618 2,988 1,080 End of year $ 2,395 $ 3,618 $ 2,988 SUPPLEMENTAL DISCLOSURE OF CASH FLOW INFORMATION: Cash paid for: Interest $ 1,240 $ 3,966 $ 3,620 Income taxes $ 6,368 $ 6,629 $ 2,336 Non-cash investing activities: Change in revenue equipment not yet paid for $ (468 ) $ (10,233 ) $ 7,976 Years 20-40 Tires in service: The cost of original equipment and replacement tires placed in service is capitalized. Amortization is calculated based on cost, less estimated salvage value, using the straight-line method over 24 months. The current portion of capitalized tires in service is included in prepaid expenses and other in the accompanying consolidated balance sheets. The long-term portion of capitalized tires in service and the estimated salvage value are included in revenue equipment in the accompanying consolidated balance sheets. The cost of recapping tires is charged to operations. purchased transportation expense. (In thousands) 2008 2007 License fees $ 4,243 $ 4,416 Tires in service 3,684 3,606 Parts and tires inventory 2,235 2,189 Insurance premiums 1,531 1,349 Other 2,012 2,263 $ 13,705 $ 13,823 (In thousands) 2008 2007 Total minimum lease payments to be received $ 912 $ 3,567 Less: unearned income (115 ) (562 ) Net investment in direct financing leases $ 797 $ 3,005 Accrued liabilities: As of December 31, accrued liabilities consisted of the following: (In thousands) 2008 2007 Accrued payables $ 5,319 $ 9,152 Salaries and wages 4,741 1,529 Vacation 3,416 3,456 Current income taxes 2,535 2,921 Other 1,098 673 $ 17,109 $ 17,731 (In thousands) 2008 2007 Series B Senior Unsecured Notes maturing in April 2010 with annual principal payments of $1.43 million bearing interest at 8.57% $ 2,857 $ 4,286 Series A Senior Unsecured Notes which matured in October 2008 and which bore interest at 6.78% — 3,571 Unsecured committed credit facility in the amount of $75 million with banks maturing in September 2011 and bearing variable interest based upon either the London Interbank Offered Rate or the agent bank’s Prime Rate, in each case plus/minus applicable margins (5.82% weighted average interest rate for the facility at December 31, 2007) — 36,786 Total long-term debt 2,857 44,643 Less current maturities of long-term debt 1,428 5,000 Long-term debt, less current maturities $ 1,429 $ 39,643 the facility is within the next twelve months. (In thousands) Amount 2009 $ 1,428 2010 1,429 $ 2,857 2010; 2009. 2009. (In thousands) 2008 2007 2006 Current: Federal $ 6,497 $ 8,922 $ 4,159 State 1,217 1,216 400 7,714 10,138 4,559 Deferred: Federal 4,549 (944 ) 9,088 State 293 (293 ) (222 ) 4,842 (1,237 ) 8,866 Total provision $ 12,556 $ 8,901 $ 13,425 2008 2007 2006 Statutory federal income tax rate 35 % 35 % 35 % Increase in taxes arising from state income taxes, net of federal income tax benefit 3 2 — Non-deductible expenses 3 — — Effective tax rate 41 % 37 % 35 % was more broadly implemented during 2009. (In thousands) 2008 2007 Deferred tax assets: Reserves and accrued liabilities $ 8,711 $ 7,131 Other 958 679 9,669 7,810 Deferred tax liabilities: Depreciation 82,022 75,408 Prepaid expenses 2,555 2,468 84,577 77,876 Net deferred tax liability $ 74,908 $ 70,066 (In thousands, except per share amounts) 2008 2007 2006 Numerator: Net income $ 18,071 $ 14,968 $ 24,518 Denominator: Basic earnings per common share - weighted-average shares 21,787 21,795 21,735 Effect of dilutive stock options 144 166 220 Diluted earnings per common share - weighted-average shares and assumed conversions 21,931 21,961 21,955 Basic earnings per common share $ 0.83 $ 0.69 $ 1.13 Diluted earnings per common share $ 0.82 $ 0.68 $ 1.12 diluted earnings per share because inclusion of average unrecognized compensation expense in the calculation would cause the performance units to be antidilutive. Under our 1995 Plan, officers, directors and employees were granted incentive and non-statutory stock options. Incentive stock option exercise prices were required to be at least the fair market value of our common stock on the date of grant. Non-statutory stock option exercise prices were required to be at least 85% of the fair market value of our common stock on the date of grant. Stock options expire within 10 years after the date of grant. Stock options issued to non-employee directors upon their annual re-election to our Board of Directors are generally exercisable at the date of grant. Consolidated Financial Statements (Continued) 2008 2007 2006 Service-based options: Expected option life in years(1) 6.2 7.0 7.0 Expected stock price volatility percentage(2) 40 % 36 % 29 % Risk-free interest rate percentage(3) 3.3 % 4.6 % 4.6 % Expected dividend yield(4) — — — Fair value as of the date of grant $ 7.76 $ 8.05 $ 9.55 Performance-based options: Expected option life in years(1) 6.6 7.0 7.0 Expected stock price volatility percentage(2) 39 % 36 % 29 % Risk-free interest rate percentage(3) 3.3 % 4.6 % 4.6 % Expected dividend yield(4) — — — Fair value as of the date of grant $ 7.90 $ 7.72 $ 9.83 (1) Expected option life Expected stock price volatility Risk-free interest rate Expected dividend yield Service-based option awards become immediately exercisable in full in the event of retirement, death or disability and upon a change in control with respect to all options that have been outstanding for at least six months. To be eligible for retirement, an employee must reach age 65. options. achieving the vesting requirements of the awards through 2014. Weighted Average Shares Exercise Price Outstanding at December 31, 2007 616,897 $ 12.46 Granted 171,600 17.55 Exercised (85,734 ) 4.16 Forfeited (7,400 ) 18.84 Outstanding at December 31, 2008 695,363 $ 14.67 Exercisable at December 31, 2008 382,063 $ 10.41 Options Outstanding Options Exercisable Range of Exercise Prices Shares Life(1) Price(2) Value(3) Shares Life(1) Price(2) Value(3) Service-based options: $3.84 - $5.78 205,324 2.5 $ 4.63 $ 2,942 205,324 2.5 $ 4.63 $ 2,942 $10.76 67,439 4.8 10.76 553 67,439 4.8 10.76 553 $15.45 - $23.59 323,100 7.2 19.79 286 109,300 7.5 21.06 55 595,863 5.3 $ 13.54 $ 3,781 382,063 4.3 $ 10.41 $ 3,550 Performance-based options: $15.45 - $23.59 99,500 7.6 $ 21.46 $ 73 — — $ — $ — Weighted Average Weighted Remaining Average Contractual Grant Date Life Shares Fair Value (in Years) Service-based options: Nonvested at December 31, 2007 147,986 $ 8.61 8.2 Granted 150,100 7.76 6.9 Vested (79,286 ) 7.93 7.3 Forfeited (5,000 ) 7.72 8.7 Nonvested at December 31, 2008 213,800 $ 8.29 7.0 Performance-based options: Nonvested at December 31, 2007 78,000 $ 9.51 8.4 Granted 21,500 7.90 8.1 Nonvested at December 31, 2008 99,500 $ 9.16 7.6 Asset Balance as Fair Value Measurements Using: (In thousands) 2008 Level 1 Level 2 Level 3 Marketable securities $ 2,604 $ 2,604 $ — $ — amendment to the Marten Transport, Ltd. 2005 Stock Incentive Plan to allow for deferral of receipt of income from a performance unit award under the plan. As of December 31, 2010, there were no participant account balances within the plan. 2014. The following table sets forth for the years indicated our operating revenue (Dollars in thousands) 2008 2007 2006 Operating revenue: Truckload revenue, net of fuel surcharge revenue $ 384,264 $ 406,754 $ 402,327 Truckload fuel surcharge revenue 123,922 83,786 75,323 Total Truckload revenue 508,186 490,540 477,650 Logistics revenue, net of intermodal fuel surcharge revenue(1) 90,194 66,163 39,298 Intermodal fuel surcharge revenue 8,719 3,314 1,942 Total Logistics revenue 98,913 69,477 41,240 Total operating revenue $ 607,099 $ 560,017 $ 518,890 Operating income: Truckload $ 26,055 $ 22,689 $ 37,500 Logistics 6,650 5,112 3,669 Total operating income $ 32,705 $ 27,801 $ 41,169 Operating ratio(2) Truckload 94.9 % 95.4 % 92.1 % Logistics 93.3 % 92.6 % 91.1 % Consolidated operating ratio 94.6 % 95.0 % 92.1 % 2008 Quarters (In thousands, except per share amounts) First Second Third Fourth Operating revenue $ 143,374 $ 159,994 $ 163,377 $ 140,354 Operating income 5,482 6,428 10,528 10,267 Net income 2,653 3,469 6,127 5,822 Basic earnings per common share 0.12 0.16 0.28 0.27 Diluted earnings per common share 0.12 0.16 0.28 0.27 2007 Quarters (In thousands, except per share amounts) First Second Third Fourth Operating revenue $ 131,416 $ 138,821 $ 144,969 $ 144,811 Operating income 8,390 8,041 5,696 5,674 Net income 4,594 4,344 3,065 2,965 Basic earnings per common share 0.21 0.20 0.14 0.14 Diluted earnings per common share 0.21 0.20 0.14 0.14 ITEM 15. EXHIBITS AND FINANCIAL STATEMENT SCHEDULES 1. Financial Statements (See Part II, Item 8 of this Report): Management’s Annual Report on Internal Control Over Consolidated Balance Sheets as of December 31, 2. Schedule II Schedules not listed above have been omitted as the required information is inapplicable or the information is presented in the consolidated financial statements or related notes. 3. The exhibits to this Report are listed in the Exhibit Index on pages The following is a list of each management contract or compensatory plan or arrangement required to be filed as an exhibit to this Report under Item 15(a)(3): (1) Marten Transport, Ltd. 1995 Stock Incentive Plan. (2) Marten Transport, Ltd. 2005 Stock Incentive Plan. (3) Amendment to the Marten Transport, Ltd. 2005 Stock Incentive Plan. Named Executive Form of Amended and Restated Change in Control Severance Agreement. Form of First Amendment to Amended and Restated Change in Control Severance Form of Non-employee Director Non-statutory Stock Option Agreement. Form of Performance Based Non-Statutory Stock Option Agreement for 2005 Stock Incentive Plan. 2009 Non-Driver Employee Bonus Plan. Dated: March /s/ Randolph L. Marten Randolph L. Marten Signature Title /s/ Randolph L. Marten Chairman of the Board, Chief Executive Officer Randolph L. Marten and Director (Principal Executive Officer) /s/ James J. Hinnendael Chief Financial Officer James J. Hinnendael (Principal Financial and Accounting Officer) /s/ Larry B. Hagness Director Larry B. Hagness /s/ Thomas J. Winkel Director Thomas J. Winkel /s/ Jerry M. Bauer Director Jerry M. Bauer /s/ Robert L. Demorest Director Robert L. Demorest /s/ G. Larry Owens Director G. Larry Owens Balance at Charged to Beginning of Costs and Balance at Description Year Expenses Deductions End of Year Insurance and claims accruals: Year ended December 31, 2008 $ 17,431 $ 37,271 $ (33,316 )(1) $ 21,386 Year ended December 31, 2007 16,073 30,865 (29,507 )(1) 17,431 Year ended December 31, 2006 13,126 28,338 (25,391 )(1) 16,073 Allowance for doubtful accounts: Year ended December 31, 2008 315 78 (13 )(3) 380 Year ended December 31, 2007 861 (534 )(2) (12 )(3) 315 Year ended December 31, 2006 928 — (67 )(3) 861 Item No. Item Filing Method 3.1 Amended and Restated Certificate of Incorporation effective August 11, 2003 Incorporated by reference to Exhibit 4.1 of the Company’s Amendment No. 2 to Registration Statement on Form S-2 (File No. 33-107367). 3.2 Amendment to Amended and Restated Certificate of Incorporation effective May 25, 2005 Incorporated by reference to Exhibit 3.3 of the Company’s Quarterly Report on Form 10-Q for the quarter ended June 30, 2005 (File No. 0-15010). 3.3 Bylaws of the Company, as amended Incorporated by reference to Exhibit 3.3 of the Company’s Annual Report on Form 10-K for the fiscal year ended December 31, 2007 (File No. 0-15010). 4.1 Specimen form of the Company’s Common Stock Certificate Incorporated by reference to Exhibit 4.1 of the Company’s Registration Statement on Form S-1 (File No. 33-8108). 4.2 Amended and Restated Certificate of Incorporation effective August 11, 2003 See Exhibit 3.1 above. 4.3 Amendment to Amended and Restated Certificate of Incorporation effective May 25, 2005 See Exhibit 3.2 above. 4.4 Bylaws of the Company See Exhibit 3.3 above. 10.1 Marten Transport, Ltd. 1995 Stock Incentive Plan Incorporated by reference to Exhibit 10.18 of the Company’s Annual Report on Form 10-K for the year ended December 31, 1994 (File No. 0-15010). 10.2 Note Purchase and Private Shelf Agreement dated October 30, 1998, between the Company and The Prudential Insurance Company of America Incorporated by reference to Exhibit 10.12 of the Company’s Quarterly Report on Form 10-Q for the quarter ended September 30, 1998 (File No. 0-15010). 10.3 Note Purchase Agreement, dated April 6, 2000, between the Company and The Prudential Insurance Company of America Incorporated by reference to Exhibit 10.19 of the Company’s Quarterly Report on Form 10-Q for the quarter ended March 31, 2000 (File No. 0-15010). Incorporated by reference to Exhibit 10.18 of the Company’s Quarterly Report on Form 10-Q for the quarter ended June 30, 2005 (File No. 0-15010). 10.5 Form of Non-Statutory Stock Option Agreement for the 2005 Stock Incentive Plan Incorporated by reference to Exhibit 10.1 of the Company’s Current Report on Form 8-K filed January 31, 2006. 10.6 Form of Non-employee Director Non-statutory Stock Option Agreement Incorporated by reference to Exhibit 10.26 of the Company’s Quarterly Report on Form 10-Q for the quarter ended June 30, 2006 (File No. 0-15010). Credit Agreement, dated as of August 31, 2006, by and among Marten Transport, Ltd., as borrower, the banks party thereto as lenders, and U.S. Bank National Association, as agent for the lenders Incorporated by reference to Exhibit 10.1 of the Company’s Current Report on Form 8-K filed September 6, 2006. First Amendment to Credit Agreement, effective as of January 1, 2007, by and among Marten Transport, Ltd., as borrower, the banks party thereto as lenders, and U.S. Bank National Association, as agent for the lenders Incorporated by reference to Exhibit 10.1 of the Company’s Current Report on Form 8-K filed January 5, 2007. Form of Performance Based Non-Statutory Stock Option Agreement for 2005 Stock Incentive Plan Incorporated by reference to Exhibit 10.2 of the Company’s Current Report on Form 8-K filed February 16, 2007. Form of Amended and Restated Change in Control Severance Agreement Incorporated by reference to Exhibit 10.1 of the Company’s Current Report on Form 8-K filed August 15, 2007. Incorporated by reference to Exhibit 10.14 of the Company’s Annual Report on Form 10-K for the year ended December 31, 2007 (File No. 0-15010). Incorporated by reference to Exhibit Incorporated by reference to Exhibit 10.12 of the Company’s Quarterly Report on Form 10-Q for the quarter ended March 31, 2010 (File No. 0-15010). 10.17 Filed with this Report. Filed with this Report. Certification pursuant to Item 601(b)(31) of Regulation S-K, as adopted pursuant to Section 302 of the Sarbanes-Oxley Act of 2002, by Randolph L. Marten, the Registrant’s Chief Executive Officer (Principal Executive Officer) Filed with this Report. 31.2 Certification pursuant to Item 601(b)(31) of Regulation S-K, as adopted pursuant to Section 302 of the Sarbanes-Oxley Act of 2002, by James J. Hinnendael, the Registrant’s Chief Financial Officer (Principal Financial Officer) Filed with this Report. 32.1 Certification pursuant to 18 U.S.C. Section 1350, as adopted pursuant to Section 906 of the Sarbanes-Oxley Act of 2002 Filed with this Report.class:class:registered:registered:Securities registered pursuant to Section 12(g) of the Act:NONESecurities registered pursuant to Section 12(g) of the Act: NONE o NO Sxo NO Sxx NO £oIndicate by check mark whether the Registrant has submitted electronically and posted on its corporate Web site, if any, every Interactive Data File required to be submitted and posted pursuant to Rule 405 of Regulation S-T (Section 232.405 of this chapter) during the preceding 12 months (or for such shorter period that the Registrant was required to submit and post such files). Yes ¨xo Accelerated filer Sx Non-accelerated filer (do not check if a smaller reporting company) £o Smaller reporting company £oo NO Sx20082010 (the last business day of the Registrant’s most recently completed second fiscal quarter), the aggregate market value of the Common Stock of the Registrant (based upon the closing price of the Common Stock at that date as reported by the NASDAQ Global Select Market), excluding outstanding shares beneficially owned by directors and executive officers, was $265,403,000.February 27, 2009, 21,836,571March 1, 2011, 21,950,252 shares of Common Stock of the Registrant were outstanding.5, 2009,3, 2011, or 20092011 Proxy Statement.61111111111131516313254545455565656565759Signature Page 61 Exhibit Index 61i6.7. We undertake no obligation to correct or update any forward-looking statements, whether as a result of new information, future events, or otherwise. You are advised, however, to consult any future disclosures we make on related subjects in future filings with the Securities and Exchange Commission.ITEM 1. BUSINESS 2008,2010, we generated $607.1$516.9 million in operating revenue, which consists of revenue from both truckload and logistics operations. Approximately 85%83% of our truckload revenue resulted from hauling temperature-sensitive products and 15%17% from hauling dry freight. We operate throughout the United States and in parts of Canada and Mexico, with substantially all of our revenue generated from within the United States. Our primary long-haul traffic lanes are between the Midwest and the West Coast, Southwest, Southeast, and the East Coast, as well as from California to the Pacific Northwest. We provide regional truckload carrier services in the Southeast, West Coast, Midwest, and South Central and Northeast regions. In 2008,2010, our average length of haul was 853655 miles. large shippers that offer consistent volumes of freight in the lanes we prefer and are willing to compensate us for a high level of service. With our fleet of 2,3762,146 company and independent contractor tractors, we are able to offer service levels that include up to 99% on-time performance and delivery within the narrow time windows often required when shipping perishable commodities.reportablereporting segments —– Truckload and Logistics. Financial information regarding these segments can be found in Footnote 13 to the Notes to Consolidated Financial Statements under Item 8 of this Form 10-K. The primary source of our operating revenue is truckload revenue, which we generate by transporting long-haul and regional freight for our customers and report within our Truckload segment. Generally, we are paid by the mile for our services. We also derive truckload revenue from fuel surcharges, loading and unloading activities, equipment detention and other ancillary services. We continue to expand our regional truckload operations, which represented 52% of our tractor fleet as of December 31, 2010. Our operating revenue also includes revenue reported within our Logistics segment, which consists of revenue from our internal brokerage and intermodal operations, both launched in 2005, and through our 45% interest in MW Logistics, LLC, or MWL, a third-party provider of logistics services to the transportation industry. Brokerage services involve arranging for another company to transport freight for our customers while we retain the billing, collection and customer management responsibilities. Intermodal services involve the transport of our trailers on railroad flatcars for a portion of a trip, with the balance of the trip using our tractors or, to a lesser extent, contracted carriers.truckload market, which is generally service-sensitive, as opposed to being solely price competitive. We target large food and consumer packaged goods companies whose products require temperature-sensitive services and who ship multiple truckloads per week. By emphasizing high-quality service, we seek to become a core carrier for our customers. In 2008,2010, our two largest customers were General Mills and Kraft.125135 sales, customer service and support personnel under the supervision of our senior management team. Marketing personnel travel within their regions to solicit new truckload and logistics customers and maintain contact with existing customers. Customer service managers regularly contact customers to solicit additional business on a load-by-load basis.·Satellite-based tracking and messaging that allows us to communicate with our drivers, obtain load position updates, provide our customers with freight visibility, and download engine operating information such as fuel mileage and idling time.·Freight optimization software that assists us in selecting loads that match our overall criteria, including profitability, repositioning, identifying capacity for expedited loads, driver availability and home time, and other factors.·Electronic data interchange and internet communication with customers concerning freight tendering, invoices, shipment status, and other information.·Fuel-routing software that optimizes the fuel stops for each trip to take advantage of volume discounts available in our fuel network.· Terrestrial- and satellite-based tracking and messaging that allows us to communicate with our drivers, obtain load position updates, provide our customers with freight visibility, and download operating information such as fuel mileage and idling time for the tractor engines and temperature setting and run time for the temperature-control units on our trailers. · Freight optimization software that assists us in selecting loads that match our overall criteria, including profitability, repositioning, identifying capacity for expedited loads, driver availability and home time, and other factors. · Electronic data interchange and internet communication with customers concerning freight tendering, invoices, shipment status, and other information. ·Auxiliary power units installed on approximately 96% of our company-owned tractors as of December 31, 2008 that allow us to decrease fuel costs associated with idling our tractors.· Electronic onboard recorders in our tractors to monitor drivers’ hours of service. · Auxiliary power units installed on our company-owned tractors that allow us to decrease fuel costs associated with idling our tractors. · Fuel-routing software that optimizes the fuel stops for each trip to take advantage of volume discounts available in our fuel network. 8.1%9.6% during 2008, and a tractor to non-driver employee ratio of 4.5-to-1 as of December 31, 2008. Both of these statistics point2010, which points to the efficiency of our operations and we believe comparecompares favorably to other temperature-sensitive and dry van trucking companies.2008,2010, our top 30 customers accounted for approximately 77%78% of our revenue, and our top ten customers accounted for 55%52% of our revenue. Nine of our top ten customers have been significant customers of ours for over ten years. We believe we are the largest or second largest temperature-sensitive carrier for eightsix of our top ten customers. General Mills accounted for 19%18% and Kraft accounted for 10% of our revenue in 2008.2010. We believe our relationships with these key customers are sound, but we are dependent upon them and the loss of some or all of their business could have a materially adverse effect on our results.256175 of our drivers as of December 31, 20082010 have driven more than one million miles for us without a preventable accident, while approximately 9051 of our drivers have driven more than two million miles and threeeight have driven more than three million miles for us without a preventable accident. Wisconsin, California, Georgia, Oregon, Indiana and Texas terminals in all phases of our policies and operations, as well as in safety techniques and fuel-efficient operation of the equipment. All new drivers also must pass DOT required tests prior to assignment to a vehicle.on a fixed rate per mile. Independent contractors pay for their own fuel, insurance, maintenance, and repairs.intense.intense and is expected to increase as a result of recent regulatory changes mandated by CSA. Our operations have been impacted, and from time-to-time we have experienced under-utilization and increased expense, as a result of a shortage of qualified drivers. We place a high priority on the recruitment and retention of an adequate supply of qualified drivers.2008,2010, we had approximately 2,7752,678 employees. This total consists of approximately 2,2482,083 drivers, 171224 mechanics and maintenance personnel, and 356371 support personnel, which includes management and administration. As of that date, we also contracted with 18886 independent contractors. None of our employees are represented by a collective bargaining unit. We consider relations with our employees to be good.2008,2010, we operated a fleet of 2,3762,146 tractors, including 2,1882,060 company-owned tractors and 18886 tractors supplied by independent contractors. The average age of our company-owned tractor fleet at December 31, 20082010 was approximately 2.22.5 years. In 2008,2010, we replaced most of our company-owned tractors within approximately 3.54.5 years after purchase.FreightlinerPeterbiltFreightliner manufacture most of our company-owned tractors. Maintaining a relatively new and standardized fleet allows us to operate most miles while the tractors are under warranty to minimize repair and maintenance costs. It also enhances our ability to attract drivers, increases fuel economy, and improves customer acceptance by minimizing service interruptions caused by breakdowns. We adhere to a comprehensive maintenance program during the life of our equipment. We perform most routine servicing and repairs at our terminal facilities to reduce costly on-road repairs and out-of-route trips. We do not have any agreements with tractor manufacturers pursuant to which they agree to repurchase the tractors or guarantee a residual value, and we therefore could incur losses upon disposition if resale values of used tractors decline.We believe that a combined fleet complements our recruiting efforts. The percentage of our fleet provided by independent contractors was 8%4.0% as of December 31, 2010 compared to 7.8% as of December 31, 2009 and 7.9% as of December 31, 2008.2008,2010, we operated a fleet of 4,2183,928 trailers. Most of our trailers are equipped with Thermo-King refrigeration units, air ride suspensions, and anti-lock brakes. Most of our single van trailers are refrigerated, 53 feet long and 102 inches wide. The average age of our trailer fleet at December 31, 20082010 was approximately 3.12.8 years. In 2008,2010, we replaced most of our company-owned trailers within approximately 5.5six years after purchase.in the aggregate for 33% of alleach auto liability claim amountsamount in excess of $1.0 million. We are also responsible for the first $750,000 on each workers’ compensation claim. We have $6.8$8.3 million in standby letters of credit to guarantee settlement of claims under agreements with our insurance carriers and regulatory authorities. We maintain insurance coverage for per-incident and total losses in excess of the amounts for which we self-insure up to specified policy limits with licensed insurance carriers. Insurance carriers have raised premiums for many businesses, including trucking companies. As a result, our insurance and claims expense could increase, or we could raise our self-insured retention when our policies are renewed. We believe that our policy of self-insuring up to set limits, together with our safety and loss prevention programs, are effective means of managing insurance costs.42008,2010, over 99% of our fuel purchases were made at these designated locations. To help further reduce fuel consumption, we began installinghave equipped our company-owned tractors with auxiliary power units in our tractors duringsince 2007. These units reduce fuel consumption by providing quiet climate control and electrical power for our drivers without idling the tractor engine. TheseWe have also invested in satellite tracking equipment for our temperature-control units were installed in approximately 96%on our trailers that has improved fuel usage through management of our company-owned fleet asrequired temperature settings and run time of December 31, 2008.mosta significant portion of long-term increases in fuel prices and related taxes to customers in the form of fuel surcharges. These fuel surcharges, which adjust with the cost of fuel, enable us to recover a substantial portion of the higher cost of fuel as prices increase, except for non-revenue miles, out-of-route miles or fuel used while the tractor is idling. As of December 31, 2008,2010, we had no derivative financial instruments to reduce our exposure to fuel price fluctuations. Revised ruleslimit driverpredict safety issues, be more proactive with intervention and maximize compliance monitoring resources. The implementation of CSA could remove a significant number of drivers from the industry as carriers will be less willing to hire and retain drivers with marginal ratings, which will increase competition for qualified drivers.were adopted effective January 4, 2004,requirements for drivers, which designate the length of time that drivers are allowed to drive and then modified effective October 1, 2005. On July 24, 2007,work. The proposal retains the current “34-hour restart” provision allowing drivers to restart the clock on their weekly 60 hours per seven-day period or 70 hours per eight-day period by taking at least 34 consecutive hours off-duty. However, the restart period would be required to include two consecutive off-duty periods from midnight to 6:00 a.m. Additionally, the proposal would require drivers to complete all on-duty work within a federal appeals court vacated portions14-hour window, including at least a one hour break. The proposal leaves open for comment whether drivers’ daily driving time should remain at 11 hours or be reduced to 10 hours, with 10 hours the preference of the FMCSA. A final rule is expected by July 2011. Should the proposed changes be finalized, including a reduction in the daily driving time, tractor productivity would decrease and a loss of efficiency could be caused as drivers and shippers may need to be retrained, computer programming may require modifications and some shipping lanes may need to be reconfigured.2005 Rules; however, interim rules issued in December 2007 retained2002, and thereafter. The revised regulations decrease the vacated portions in effect. On November 19, 2008, final rulesamount of emissions that can be released by tractor engines and affect tractors produced after the effective January 19, 2009 were issued which left the interim rules unchanged.We believe that we are well equipped to minimize the economic impactdate of the current hours-of-service rules onregulations. The last of three stepped reductions in exhaust emissions was effective for engines manufactured in January 2010, and thereafter. All tractor engines in our business. Wefleet as of December 31, 2010 were manufactured prior to January 2010 and, therefore, were not required to meet the revised design requirements. Compliance with these regulations has increased the cost of our new tractors, lowered fuel mileage and increased our operating expenses. Some manufacturers have negotiated delay time chargessignificantly increased new equipment prices, in part to meet more stringent engine design requirements imposed by the EPA. These adverse effects combined with the majority of our customers. Prioruncertainty as to the effectivenessreliability of the current rules, we also initiated discussionsvehicles equipped with many of our customers regarding stepsthe newly designed diesel engines and the residual values that they can take to assist us in managing our drivers’ non-driving activities, such as loading, unloading, or waiting, and we plan to continue to actively communicate with our customers regarding these matters in the future. In situations where shippers are unable or unwilling to take these steps, we assess detention and other5charges to offset losses in productivity resultingwill be realized from the current hours-of-service regulations. The regulations did not have a significant impact ondisposition of these vehicles could increase our operationscosts or financial results in 2006 through 2008. vehicles and facilities, engine idling, and discharge and retention of storm water. These regulations did not have a significant impact on our operations or financial results in 20062008 through 2008.ITEM 1A. RISK FACTORS The recent instabilityInstability of the credit markets and the resulting effects on the economy could have a material adverse effect on our operating results. Recently, there has been widespread concern over the instability ofIf the credit markets and the current credit market effects on the economy. If the economy and credit markets continue to weaken, our business, financial results, and results of operations could be materially and adversely affected, especially if consumer confidence declines and domestic spending decreases. Although we think it is unlikely given our current cash position, weWe may need to incur additional indebtedness, which may include drawing on our Credit Facility, or issue debt securities in the future to fund working capital requirements, make investments, or for general corporate purposes. Additionally, the stresses in the credit market have causedcauses uncertainty in the equity markets, which may result in volatility of the market price for our securities.62008,2010, our top 30 customers, based on revenue, accounted for approximately 77%78% of our revenue; our top ten customers accounted for approximately 55%52% of our revenue; our top five customers accounted for approximately 41% of our revenue; and our top two customers accounted for approximately 30%28% of our revenue. Generally, we enter into one-year contracts with our major customers, the majority of which do not contain any firm obligations to ship with us. We cannot assure you that, upon expiration of existing contracts, these customers will continue to use our services or that, if they do, they will continue at the same levels. Many of our customers periodically solicit bids from multiple carriers for their shipping needs, and this process may depress freight rates or result in loss of business to our competitors. Some of our customers also operate their own private trucking fleets, and they may decide to transport more of their own freight. A reduction in or termination of our services by one or more of our major customers could have a materially adverse effect on our business and operating results.better pricing power among equipment manufacturers, and government regulations applicable to newly manufactured tractors and diesel engines. We expect to continue to pay increased prices for revenue equipment and incur additional expenses and related financing costs for the foreseeable future. Our business could be harmed if we are unable to continue to obtain an adequate supply of new tractors and trailers or if we have to pay increased prices for new revenue equipment.requirerequired progressive reductions in exhaust emissions from diesel engines through 2010, for engines manufactured in October 2002, and thereafter. The revised regulations decrease the amount of emissions that can be released by tractor engines and affect tractors produced after the effective date of the regulations. The last of three stepped reductions in exhaust emissions was effective for engines manufactured in January 2010, and thereafter. All tractor engines in our fleet as of December 31, 2010 were manufactured prior to January 2010 and, therefore, were not required to meet the revised design requirements. Compliance with these regulations has increased the cost of our new tractors, lowered fuel mileage and increased our operating expenses. Some manufacturers have significantly increased new equipment prices, in part to meet newmore stringent engine design requirements imposed by the EPA. These adverse effects combined with the uncertainty as to the reliability of the vehicles equipped with the newly designed diesel engines and the residual values that will be realized from the disposition of these vehicles could increase our costs or otherwise adversely affect our business or operations.7Table of ContentsIn recent years theThe transportation industry has historically experienced substantial difficulty in attracting and retaining qualified drivers, including independent contractors. With increased competition for drivers, including the impact that recent regulatory changes mandated by CSA may have on the number of drivers in the transportation industry, we could experience greater difficulty in attracting sufficient numbers of qualified drivers. In addition, due in part to current economic conditions, including the cost of fuel and insurance, the available pool of independent contractor drivers is smaller than it has been historically. Accordingly, we may face difficulty in attracting and retaining drivers for all of our current tractors and for those we may add. Additionally, we may face difficulty in increasing the number of our independent contractor drivers. In addition, our industry suffers from high turnover rates of drivers. Our turnover rate requires us to recruit a substantial number of drivers. Moreover, our turnover rate could increase. If we are unable to continue to attract drivers and contract with independent contractors, we could be required to continue adjusting our driver compensation package beyond the norm or let trucks sit idle. An increase in our expenses or in the number of tractors without drivers could materially and adversely affect our growth and profitability.8We operate in a highly regulated industry and increased costs of compliance with, or liability for violation of, existing or future regulations could have a materially adverse effect on our business. The DOT and various state and local agencies exercise broad powers over our business, generally governing such activities as authorization to engage in motor carrier operations, safety and insurance requirements. Our company drivers and independent contractors also must comply with the safety and fitness regulations promulgated by the DOT, including those relating to drug and alcohol testing and hours-of-service. We also may become subject to new or more restrictive regulations relating to fuel emissions, drivers’ hours-of-service, ergonomics, or other matters affecting safety or operating methods. Other agencies, such as the EPA and the Department of Homeland Security, or DHS, also regulate our equipment, operations, and drivers. Future laws and regulations may be more stringent and require changes in our operating practices, influence the demand for transportation services, or require us to incur significant additional costs. Higher costs incurred by us or by our suppliers who pass the costs onto us through higher prices could adversely affect our results of operations.The DOT, through the Federal Motor Carrier Safety Administration, or FMCSA, imposes safety and fitness regulations on us and our drivers. Revised rules that limit driver hours-of-service were adopted effective January 4, 2004, and then modified effective October 1, 2005. On July 24, 2007, a federal appeals court vacated portions of these rules. Two of the key portions that were vacated include the expansion of the driving day from 10 hours to 11 hours, and the “34-hour restart,” which allows drivers to reset their maximum allowable hours in a week. The court indicated that, in addition to other reasons, it vacated these two portions of the rules because FMCSA failed to provide adequate data supporting its decision to increase the driving day and provide for the 34-hour restart. Following a request by FMCSA for a 12-month extension of the vacated rules, the court, in an order filed on September 28, 2007, granted a 90-day stay of the mandate and directed that issuance of its ruling be withheld until December 27, 2007, to allow FMCSA time to prepare its response. On December 17, 2007, FMCSA submitted interim final rules, which became effective December 27, 2007. The interim rules retained the 11 hour driving day and the 34-hour restart, but provided greater statistical support and analysis regarding the increased driving time and the 34-hour restart. The FMCSA published final rules effective January 19, 2009 on November 19, 2008 which left the interim rules unchanged. As advocacy groups may continue to challenge the final rules, a court’s decision to strike down the final rules could have varying effects, as reducing driving time to 10 hours daily may reduce productivity in some lanes. A court’s decision to strike down the final rules could decrease productivity and cause some loss of efficiency, as drivers and shippers may need to be retrained, computer programming may require modifications, additional drivers may need to be employed or engaged, additional equipment may need to be acquired, and some shipping lanes may need to be reconfigured. We are also unable to predict the effect of any new rules that might be proposed, but any such proposed rules could increase costs in our industry or decrease productivity.In the aftermath of the September 11, 2001 terrorist attacks, federal, state, and municipal authorities have implemented and continue to implement various security measures, including checkpoints and travel restrictions on large trucks. As a result, it is possible we may fail to meet the needs of our customers or may incur increased expenses to do so. These security measures could negatively impact our operating results.Some states and municipalities have begun to restrict the locations and amount of time where diesel-powered tractors, such as ours, may idle, in order to reduce exhaust emissions. The State of California has recently enacted legislation which requires tractors weighing more than 10,000 pounds to use alternative sources, such as auxiliary power units, when powering their cabs at idle for more than five minutes. The State of California has also enacted legislation requiring compliance with exhaust emissions standards for refrigeration units on trailers. Compliance is being phased in by the state, beginning with 2001 and earlier models. Given our investment in auxiliary power units for our tractors and the average age of our trailer fleet, we do not expect these regulations will have a significant impact on our operations or financial results.From time to time, various federal, state, or local taxes are increased, including taxes on fuels. We cannot predict whether, or in what form, any such increase applicable to us will be enacted, but such an increase could aversely affect our profitability.910ITEM 1B. ITEM 2. PROPERTIES an additional facilityequipment repair and maintenance facilities in 2007 and in 2009 in Mondovi, Wisconsin which consistsconsist of 15,000 square feet of equipment repair and maintenance space located on approximately 11 acres.acres and 50,000 square feet of space located on approximately three acres, respectively. We operate facilities in or near the following cities at which we perform the following designated operating activities: andMaintenanceRecruitmentDriverTrainingDispatchOwned OwnedX X XXOwned OwnedX XX Owned OwnedX XX X XOwned OwnedX XX XOwned OwnedX XX XLeased LeasedX XX X XRichmond, VirginiaLeased LeasedX Leased X X X X X Memphis, Tennessee Leased X X X X X Richmond, Virginia Leased X X Laredo, Texas Leased LeasedX XITEM 3. ITEM 4.SUBMISSION OF MATTERS TO A VOTE OF SECURITY HOLDERSNo matters were submitted to a vote of security holders during the fourth quarter of the year ended December 31, 2008.ITEM 4A.EXECUTIVE OFFICERS OF THE REGISTRANTITEM 4A. February 27, 2009,March 1, 2011, are as follows:Age58 5663 6167 6559 5747 4549 4711Table of Contents12ITEM 5.MARKET FOR REGISTRANT’S COMMON EQUITY, RELATED STOCKHOLDER MATTERS AND ISSUER PURCHASES OF EQUITY SECURITIESITEM 5. Common Stock Price Year ended December 31, 2010 High Low $ 24.36 $ 20.08 24.25 17.00 23.54 18.75 20.52 16.66 Year ended December 31, 2009 $ 18.82 $ 16.40 21.46 16.05 22.50 17.75 19.57 14.49 February 27, 2009,March 1, 2011, we had 233202 record stockholders, and approximately 1,5281,198 beneficial stockholders of our common stock.We have not paidonprogram to our stockholders, subject to approval each quarter. The first two quarterly cash dividends of $0.02 per share of common stock since we became publicly tradedwere paid in September 1986.and December 2010. We currently expect to continue to pay quarterly cash dividends in the future. The payment of cash dividends in the future, and the amount of any such dividends, will depend upon our financial condition, results of operations, cash requirements, and certain corporate law requirements, as well as other factors deemed relevant by our Board of Directors. Our ability to pay cash dividends is currently limited by restrictions contained in our revolving credit facility. Our revolving credit facility prohibits us from paying, in any fiscal year, dividends in excess of 25% of our net income from the prior fiscal year. Future payments of cash dividends will depend on our financial condition, results of operations, capital commitments, restrictions under then-existing agreements, and other factors our Board of Directors deems relevant.20072010, 2009, or in the remainder of 2008.13Morningstar,Research Data Group, Inc. prepared the line-of-business index. The graph assumes $100 is invested in our common stock, the NASDAQ Stock Market index and the line-of-business index on January 1, 2004,December 31, 2005, with reinvestment of dividends. The comparisons in the graph below are based on historical data and are not intended to forecast the possible future performance of our common stock. The information in the graph below shall be deemed “furnished” and not “filed” for purposes of Section 18 of the Exchange Act or otherwise subject to the liabilities of that section.COMPARISON OF 5-YEAR CUMULATIVE TOTAL RETURNAMONG MARTEN TRANSPORT, LTD.,NASDAQ MARKET INDEX AND SIC CODE INDEX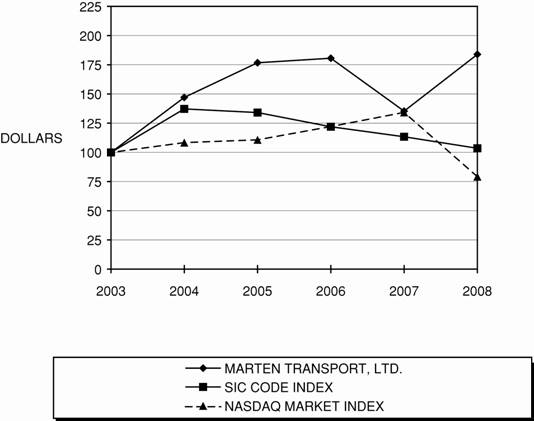
ASSUMES $100 INVESTED ONJAN. 1, 2004ASSUMES DIVIDENDREINVESTEDFISCAL YEAR ENDINGDEC. 31, 200814
15 2010 2009 2008 2007 2006 FOR THE YEAR Operating revenue $ 516,920 $ 505,874 $ 607,099 $ 560,017 $ 518,890 Operating income 35,289 29,359 32,705 27,801 41,169 Net income 19,742 16,267 18,071 14,968 24,518 93.2 % 94.2 % 94.6 % 95.0 % 92.1 % PER-SHARE DATA Basic earnings per common share $ 0.90 $ 0.74 $ 0.83 $ 0.69 $ 1.13 Diluted earnings per common share 0.90 0.74 0.82 0.68 1.12 Dividends paid per common share 0.04 — — — — Book value 13.48 12.56 11.79 10.92 10.20 AT YEAR END Total assets $ 460,308 $ 414,838 $ 397,443 $ 407,390 $ 410,822 Long-term debt 19,346 1,499 2,857 44,643 58,659 Stockholders’ equity 295,904 274,907 257,451 238,213 221,906 (1) Represents operating expenses as a percentage of operating revenue. ITEM 7. MANAGEMENT’S DISCUSSION AND ANALYSIS OF FINANCIAL CONDITION AND RESULTS OF OPERATIONS 6.7. We do not assume, and specifically disclaim, any obligation to update any forward-looking statement contained in this report.and the number of miles we generate with our equipment.equipment and changes in fuel prices. We monitor our revenue production primarily through average truckload revenue, net of fuel surcharges, per tractor per week. We also analyze our average truckload revenue, net of fuel surcharges, per total mile, non-revenue miles percentage, the miles per tractor we generate, our accessorial revenue and our other sources of operating revenue.customers and the rates charged by third-party providers.In 2008, we increased ourby $47.1increased $11.0 million, or 8.4%.2.2%, in 2010. This increase was primarily due to fuel surcharge revenue increasing by $20.2 million, or 36.2%, caused by significantly higher fuel prices in 2010. Our operating revenue, net of fuel surcharges, increased $1.5decreased $9.1 million, or 0.3%2.0%, compared with 2007. Fuel surcharges increased $45.5 million, or 52.3%, in 2008 due to the significant increase in the average cost of fuel from 2007.2009. Truckload segment revenue, net of fuel surcharges, decreased 5.5%6.1% primarily due to a 6.5% decrease in our weighted average numberfleet size of 253 tractors, or 10.7%, partially offset by a 2.2%an increase in average truckload revenue, net of fuel surcharges, per total mile. The increase in average truckload revenue, net of fuel surcharges, per total mile was the result of an improved freight mix and a reduced average length of haul. Ourour average truckload revenue, net of fuel surcharges, per tractor per week increased 0.7%of 5.2% in 2008 primarily due to the increase in revenue per total mile, partially offset by a 1.1% decrease in average miles per tractor.2010. The changes in our operating statistics are consistent withprimarily the result of the continued growth of our regional temperature-controlled operations, in 2008.which we have increased to 51.8% of our truckload fleet as of December 31, 2010 from 25.9% as of December 31, 2009. By focusing on shorter lengths of haul in certain defined areas, we are addressing customer trends toward regional distribution to lower their transportation expense, furthering our own objectives of reducing fuel consumption per load, and matching some of our drivers’ desires to stay closer to home. The concentration of a portion of our fleet in these markets is evident in a 6.4%13.9% reduction from 20072009 in average length of haul to 853655 miles. In response to a challenging freight environment with industry-wide capacity exceeding freight demand, we decreased our fleet throughout 2007. As a result, our average fleet size was 164 tractors less in 2008 than in 2007. The 0.3% increase in our operatingLogistics segment revenue, net of intermodal fuel surcharges, was driven by continuedincreased 11.7% compared with 2009. The increase in logistics revenue primarily resulted from volume growth in each of16MWL, partially offset by the decrease in truckload revenue, net of fuel surcharges.MWL. Logistics revenue which represented 16.3%24.0% of our operating revenue in 2008, increased $29.4 million, or 42.4%,2010 compared with 2007.D.O.E.United States Department of Energy, or DOE, national average cost of fuel increasing to $3.80$2.99 per gallon in 20082010 from $2.89$2.47 per gallon in 2007.2009. We manage our exposure to changes in fuel prices primarily through fuel surcharge programs with our customers, as well as through volume fuel purchasing arrangements with national fuel centers and bulk purchases of fuel at our terminals. To help further reduce fuel expense, we began installinginstalled auxiliary power units in our tractors in 2007 to provide climate control and electrical power for our drivers without idling the tractor engine. For our Logistics segment, our profitability on the expense side is impacted by the percentage of logistics revenue we pay to providers for the transportation services we arrange.was 94.6%improved to 93.2% in 2008 compared2010 from 94.2% in 2009. Operating expenses as a percentage of operating revenue, with 95.0% in 2007.both amounts net of fuel surcharge revenue, improved to 92.0% for 2010 from 93.5% for 2009. Our earnings per diluted sharenet income increased to $0.82$19.7 million in 20082010 from $0.68$16.3 million in 2007.2008,2010, we had approximately $2.9$4.4 million of cash and cash equivalents and marketable securities, net of checks issued in excess of cash balances, $19.3 million of long-term debt, including current maturities, and $255.7$295.9 million in stockholders’ equity. In 2008, we spent $32.6 million2010, net cash flows provided by operating and financing activities were primarily used to purchase new revenue equipment, net of proceeds from dispositions. These expenditures were funded with cash flows from operations.dispositions, in the amount of $69.3 million and to partially construct two regional operating facilities in the amount of $9.6 million. We estimate that capital expenditures, net of proceeds from dispositions, will be approximately $40 million to $60$50 million in 2009, which we will adjust throughout2011. We paid our first two quarterly cash dividends of $0.02 per share of common stock in the year as we size our fleet to existing customer demand.third and fourth quarters of 2010 totaling $877,000. We believe our sources of liquidity are adequate to meet our current and anticipated needs for at least the next twelve months. Based upon anticipated cash flows, existing cash and cash equivalents balances, current borrowing availability and other sources of financing we expect to be available to us, we do not anticipate any significant liquidity constraints in the foreseeable future.surcharges,surcharge revenue, and net fuel expense (fuel and fuel taxes net of fuel surcharge revenue and surcharges passed through to independent contractors, outside drayage carriers and railroads). We provide these additional disclosures because management believes these measures provide a more consistent basis for comparing results of operations from period to period. These financial measures in this report have not been determined in accordance with U.S. generally accepted accounting principles (GAAP). Pursuant to Item 10(e) of Regulation S-K, we have included the amounts necessary to reconcile these non-GAAP financial measures to the most directly comparable GAAP financial measures, operating revenue, operating expenses divided by operating revenue, and fuel and fuel taxes.17Effective January 1, 2006, we adopted the fair value recognition provisionsStatementincome tax benefit), in 2009 was $586,000 ($353,000 net of Financial Accounting Standards No. 123R, “Share-Based Payment” (“SFAS 123R”) using the modified prospective transition method,income tax benefit) and therefore have not restated prior periods’ results.in 2008 was $666,000 ($432,000 net of income tax benefit). All share-based compensation expense is recorded in salaries, wages and benefits expense. Total share-based compensation expense recorded in 2008 was $666,000 ($432,000 net of income tax benefit), in 2007 was $460,000 ($321,000 net of income tax benefit) and in 2006 was $447,000 ($318,000 net of income tax benefit), which entirely represents additional share-based compensation expense recorded as a result of adopting SFAS 123R. Unrecognized compensation expense from unvested service-based stock option awards was $1.5$1.9 million as of December 31, 20082010 and is expected to be recorded over a weighted-average period of 3.63.3 years. Unrecognized compensation expense from unvested performance-based stock optionperformance unit awards was $911,000$875,000 as of December 31, 20082010 and will be recorded inbased on the periods in which the performance condition isestimated number of units probable of achievementachieving the vesting requirements of the awards through 2010.
per week(1)(1) Includes tractors driven by both company-employed drivers and independent contractors. Independent contractors provided 188, 339 and 365 tractors as of December 31, 2008, 2007 and 2006, respectively.18 2010 2009 2008 Truckload Segment: $ 392,764 $ 396,795 $ 508,186 2,968 2,822 3,124 2,105 2,358 2,352 655 761 853 193,342 206,894 222,043 13,776 23,415 32,081 Logistics Segment: Total Logistics revenue (in thousands) $ 124,156 $ 109,079 $ 98,913 Brokerage: Marten Transport Revenue (in thousands) $ 41,219 $ 35,014 $ 24,746 Loads 21,896 18,932 11,621 MWL Revenue (in thousands) $ 35,247 $ 32,160 $ 37,569 Loads 18,704 17,868 18,789 $ 47,690 $ 41,905 $ 36,598 20,150 18,090 11,513 67 62 53 (1) Includes tractors driven by both company-employed drivers and independent contractors. Independent contractors provided 86, 177 and 188 tractors as of December 31, 2010, 2009 and 2008, respectively. (1) Logistics revenue is net of $16.8 million and $17.1 million of inter-segment revenue in 2008 and 2007, respectively, for loads transported by our tractors and arranged by MWL that have been eliminated in consolidation.(2) Operating expenses as a percentage of operating revenue. Dollar Percentage Change Change (Dollars in thousands) 2010 2009 2010 vs. 2009 2010 vs. 2009 Operating revenue: $ 325,791 $ 346,983 $ (21,192 ) (6.1 )% Truckload fuel surcharge revenue 66,973 49,812 17,161 34.5 392,764 396,795 (4,031 ) (1.0 ) 115,223 103,166 12,057 11.7 Intermodal fuel surcharge revenue 8,933 5,913 3,020 51.1 124,156 109,079 15,077 13.8 $ 516,920 $ 505,874 $ 11,046 2.2 % Operating income: Truckload $ 28,680 $ 22,827 $ 5,853 25.6 % Logistics 6,609 6,532 77 1.2 $ 35,289 $ 29,359 $ 5,930 20.2 % Truckload 92.7 % 94.2 % (1.6 )% Logistics 94.7 94.0 0.7 93.2 % 94.2 % (1.1 )% (1) Logistics revenue is net of $9.1 million and $10.2 million of inter-segment revenue in 2010 and 2009, respectively, for loads transported by our tractors and arranged by MWL that have been eliminated in consolidation. (2) Represents operating expenses as a percentage of operating revenue. $47.1$11.0 million, or 8.4%2.2%, to $607.1$516.9 million in 20082010 from $560.0$505.9 million in 2007.2009. Our operating revenue, net of fuel surcharges, increased $1.5decreased $9.1 million, or 0.3%2.0%, to $474.5$441.0 million in 20082010 from $472.9$450.1 million in 2007.2009. The increasedecrease in operating revenue, net of fuel surcharges, was driven by continued volume growth in each of our internal brokerage and intermodal services and in the logistics services provided by MWL, partially offset bydue to a decrease in truckload revenue, net of fuel surcharges.surcharges, partially offset by growth in logistics revenue. Fuel surchargessurcharge revenue increased $45.5to $75.9 million or 52.3%, in 2008 due to the significant increase2010 from $55.7 million in the average cost of2009, caused by significantly higher fuel from 2007.increased $17.6decreased $4.0 million, or 3.6%1.0%, to $508.2$392.8 million in 20082010 from $490.5$396.8 million in 2007.2009. Truckload segment revenue, net of fuel surcharges, decreased 5.5%6.1% primarily due to a 6.5% decrease in our weighted average numberfleet size of 253 tractors, or 10.7%, partially offset by a 2.2%an increase in average truckload revenue, net of fuel surcharges, per total mile. The increase in average truckload revenue, net of fuel surcharges, per total mile was the result of an improved freight mix and a reduced average length of haul. Ourour average truckload revenue, net of fuel surcharges, per tractor per week increased 0.7%of 5.2% in 20082010 from 2007 due to the increase in revenue per total mile, partially offset by a 1.1% decrease in average miles per tractor.2009. The changes in our19consistent withprimarily the result of the continued growth of our regional temperature-controlled operations, in 2008.which we have increased to 51.8% of our truckload fleet as of December 31, 2010 from 25.9% as of December 31, 2009. By focusing on shorter lengths of haul in certain defined areas, we are addressing customer trends toward regional distribution to lower their transportation expense, furthering our own objectives of reducing fuel consumption per load, and matching some of our drivers’ desires to stay closer to home. The concentration of a portion of our fleet in these markets is evident in a 6.4%13.9% reduction from 20072009 in average length of haul to 853655 miles. In response to a challenging freight environment with industry-wide capacity exceeding freight demand, we decreased our fleet throughout 2007. As a result, our average fleet size was 164 tractors less in 2008 than in 2007. The improvement in tractor productivity and in our overall cost structure resultedand the increase in increasedrevenue per tractor per week primarily caused the increase in profitability from 2007.$29.4$15.1 million, or 42.4%13.8%, to $98.9$124.2 million in 20082010 from $69.5$109.1 million in 2007.2009. Logistics segment revenue, net of intermodal fuel surcharges, increased 36.3%11.7%. The increase in logistics revenue primarily resulted from continued volume growth in each of our internal brokerage and intermodal services, and in the logistics services provided by MWL. The increase in the operating ratio for our Logisticslogistics segment in 20082010 was primarily due to an increase as a percentage of logistics revenue ofin the payments to carriers for transportation services which we arranged.yearsperiods indicated the dollar and percentage increase or decrease of the items in our consolidated statements of operations, and those items as a percentage of operating revenue:20 2010 vs. 2009 2010 vs. 2009 2010 2009 Operating revenue $ 11,046 2.2 % 100.0 % 100.0 % Operating expenses (income): Salaries, wages and benefits (7,233 ) (5.2 ) 25.4 27.4 Purchased transportation 3,831 3.6 21.4 21.1 Fuel and fuel taxes 15,029 15.0 22.2 19.7 Supplies and maintenance (3,005 ) (7.9 ) 6.8 7.6 Depreciation (1,153 ) (2.2 ) 10.0 10.5 Operating taxes and licenses (450 ) (6.7 ) 1.2 1.3 Insurance and claims (3,323 ) (16.7 ) 3.2 3.9 Communications and utilities (206 ) (4.9 ) 0.8 0.8 520 31.9 (0.2 ) (0.3 ) Other 1,106 10.2 2.3 2.2 Total operating expenses 5,116 1.1 93.2 94.2 Operating income 5,930 20.2 6.8 5.8 Net interest expense (income) (58 ) (181.3 ) - - Income before income taxes 5,988 20.4 6.8 5.8 47 8.0 0.1 0.1 5,941 20.7 6.7 5.7 Provision for income taxes 2,466 19.8 2.9 2.5 Net income $ 3,475 21.4 % 3.8 % 3.2 % 2.9%6.6% decrease in the total miles driven by company drivers and the adoption in the first quartercoupled with a broader implementation of 2008 of aour per diem expense reimbursement programpay structure for our drivers which was partially offset by a $2.3 million increase in our self-insured medical claims, which increased our employees’ health insurance expense, and a $1.3 million increase in bonus compensation expensed for our non-driver employees.$9.4$3.8 million in total, or 9.1%3.6%, in 20082010 from 2007.2009. Payments to carriers for transportation services we arranged in our brokerage and intermodal operations increased $21.3$12.7 million to $73.8$93.5 million in 20082010 from $52.5$80.7 million in 2007, as our Logistics operations significantly increased in size and scope.2009. The portion of purchased transportation expense related to our independent contractors, including fuel surcharges, decreased $11.9$8.9 million in 2008,2010, primarily due to a decrease in the number of independent contractor-owned tractors in our fleet. We expect that purchased transportation expense will continue to increase as we continue to grow our Logistics segment, but this increase will be partially offset by an expected continuing decline in the number of independent contractor-owned tractors in our fleet due to difficult operating conditions.$14.6$4.2 million, or 19.2%8.0%, to $61.4$47.9 million in 20082010 from $76.1$52.1 million in 2007.2009. Fuel surcharges passed through to independent contractors, outside drayage carriers and railroads were $18.2$8.9 million in 20082010 and $14.2$7.9 million in 2007. Over the past year, we2009. We have worked diligently to control fuel costsusage and usagecosts by improving our volume purchasing arrangements and optimizing our drivers’ fuel purchases with national fuel centers, focusing on shorter lengths of haul, installing and tightly managing the use of auxiliary power units in our tractors to minimize engine idling and improving fuel usage in the temperature-control units on our trailers’ refrigeration units.trailers. Auxiliary power units, which we have installed in our company-owned tractors, provide climate control and electrical power for our drivers without idling the tractor engine. The decrease in net fuel expense was primarily due to a 2.9%6.6% decrease in the total miles driven by our company-owned fleet and to the cost control measures stated above, principally the use of auxiliary power units. Auxiliary power units, which were installed in 96% of our company-owned tractors as of December 31, 2008, provide climate control and electrical power for our drivers without idling the tractor engine. The impact of decreased miles and the cost control measures were partially offset by a significant increase in the D.O.E.DOE national average cost of fuel during 2008 to $3.80 per gallon from $2.89$2.99 per gallon in 2007.2010 from $2.47 per gallon in 2009. Net fuel expense represented 14.9%13.1% of truckload and intermodal revenue, net of fuel surcharges, in 2008,2010, compared with 17.9%13.6% in 2007.Depreciation relates to owned tractors, trailers, auxiliary power units, communications units, terminal facilities2009.other assets. The increase in depreciation was due to our investment in auxiliary power units since mid-2007maintenance consist of repairs, maintenance, tires, parts, oil, and to an increase in the relative percentage of company-owned tractors to independent contractor-owned tractors in 2008. We expect our annual cost of tractorengine fluids, along with load-specific expenses including loading/unloading, tolls, pallets and trailer ownership will increasehostling. The decrease in future periods assupplies and maintenance in 2010 primarily resulted from a result of higher prices of newdecrease in outside vendor maintenance on our revenue equipment which is expectedwe were able to result in greater depreciation overachieve by increasing the useful life.increase$3.3 million decrease in insurance and claims in 20082010 was primarily the result of an increasedue to a decrease in the cost of our self-insured auto liability and workers’ compensation accident claims. We are responsible for the first $1.021million on each auto liability claim and also responsible for up to $1.0 million in the aggregate for 33% of all auto liability claim amounts in excess of $1.0 million. We are responsible for the first $750,000 on each workers’ compensation claim. Our significant self-insured retention exposes us to the possibility of significant fluctuations in claims expense between periods depending on the frequency, severity and timing of claims and to adverse financial results if we incur large or numerous losses. In the eventan uninsured claim above our insurance coverage, or an increaserevenue equipment decreased to $1.1 million in the frequency or severity2010 from $1.6 million in 2009 as a result of claims within our self-insured retention, our financial condition and results of operations could be materially and adversely affected.Aa decrease in the market value for used revenue equipment, which we believe was drivenpartially offset by capacity reductions in the industry, caused our gain on disposition of revenue equipment to decrease to $2.7 million in 2008 from $3.4 million in 2007, despite an increase in the number of tractorstrailers sold. Future gains or losses on disposition of revenue equipment will be impacted by the market for used revenue equipment, which is beyond our control. We do not expect our gain on disposition to improve in the near future as we believe that there are few buyers with adequate financing in comparison with available inventory, and the expectation of additional trucking company failures is likely to keep used truck inventories high.was 94.6%improved to 93.2% in 2008 compared2010 from 94.2% in 2009. The operating ratio for our Truckload segment improved to 92.7% from 94.2% in 2009 and the operating ratio for our Logistics segment increased to 94.7% from 94.0% in 2009. Operating expenses as a percentage of operating revenue, with 95.0% in 2007.Interest expense primarily consistsboth amounts net of interest on our unsecured committed credit facility and senior unsecured notes. The decrease in interest expense of $2.7 million, or 70.1%, in 2008fuel surcharge revenue, improved to 92.0% for 2010 from 2007 was primarily the result of lower average debt balances outstanding.increased to 41.0%was 43.1% in 2008 from 37.3%2010 and 43.4% in 2007, primarily because of the nondeductible effect of a per diem pay structure for our drivers adopted in the first quarter of 2008.$18.1$19.7 million in 20082010 from $15.0$16.3 million in 2007.2009. Net earnings increased to $0.82$0.90 per diluted share in 20082010 from $0.68$0.74 per diluted share in 2007.22(1) Logistics revenue is net of $17.1 million and $16.5 million of inter-segment revenue in 2007 and 2006, respectively, for loads transported by our tractors and arranged by MWL that have been eliminated in consolidation.(2)Operating expenses as a percentage of operating revenue. Dollar Percentage Change Change (Dollars in thousands) 2009 2008 2009 vs. 2008 2009 vs. 2008 Operating revenue: $ 346,983 $ 384,264 $ (37,281 ) (9.7 )% Truckload fuel surcharge revenue 49,812 123,922 (74,110 ) (59.8 ) 396,795 508,186 (111,391 ) (21.9 ) 103,166 90,194 12,972 14.4 Intermodal fuel surcharge revenue 5,913 8,719 (2,806 ) (32.2 ) 109,079 98,913 10,166 10.3 $ 505,874 $ 607,099 $ (101,225 ) (16.7 )% Operating income: Truckload $ 22,827 $ 26,055 $ (3,228 ) (12.4 )% Logistics 6,532 6,650 (118 ) (1.8 ) $ 29,359 $ 32,705 $ (3,346 ) (10.2 )% Truckload 94.2 % 94.9 % (0.7 )% Logistics 94.0 93.3 0.8 94.2 % 94.6 % (0.4 )% (1) Logistics revenue is net of $10.2 million and $16.8 million of inter-segment revenue in 2009 and 2008, respectively, for loads transported by our tractors and arranged by MWL that have been eliminated in consolidation. (2) Represents operating expenses as a percentage of operating revenue. increased $41.1decreased $101.2 million, or 7.9%16.7%, to $560.0$505.9 million in 20072009 from $518.9$607.1 million in 2006.2008. This decrease was primarily due to fuel surcharge revenue decreasing to $55.7 million in 2009 from $132.6 million in 2008, caused by significantly lower fuel prices in 2009. Our operating revenue, net of fuel surcharges, increased $31.3decreased $24.3 million, or 7.1%5.1%, to $472.9$450.1 million in 20072009 from $441.6$474.5 million in 2006.2008. The increasedecrease in operating revenue, net of fuel surcharges, was primarily due to continued volumea decrease in truckload revenue, net of fuel surcharges, partially offset by growth in each of our internal brokerage and intermodal services and in the logistics services provided by MWL. Fuel surcharges increased $9.8 million, or 12.7%, in 2007 due to an increase in the average cost of fuel from 2006.increased $12.9decreased $111.4 million, or 2.7%21.9%, to $490.5$396.8 million in 20072009 from $477.7$508.2 million in 2006.2008. Truckload segment revenue, net of fuel surcharges, increased 1.1%. We were abledecreased 9.7% primarily due to increasea decrease in our truckload revenue by increasing the size of our fleet and our business with existing and new customers. Our average truckload revenue, net of fuel surcharges, per tractor per week increased 0.6%of 9.7% in 2007 from 2006, due to2009. The reduction in revenue per tractor per week was primarily caused by a 0.4% increasedecrease in our average miles per tractor in 2009 due to the difficult freight environment. The changes in our operating statistics are consistent with the continued growth of our regional temperature-controlled operations. By focusing on shorter lengths of haul in certain defined areas, we are addressing customer trends toward regional distribution to lower their transportation expense, furthering our own objectives of reducing fuel consumption per load, and matching some of our drivers’ desires to stay closer to home. The concentration of a 0.2% increaseportion of our fleet in these markets is evident in a 10.8% reduction from 2008 in average truckloadlength of haul to 761 miles. Our average fleet size was relatively stable in 2009 compared with 2008. The decrease in revenue net of fuel surcharges, per total mile. Our weighted average number of tractors increased 0.5% in 2007 from 2006. The slight improvement in tractor productivity was more thanper week, partially offset by an increasethe improvement in our overall cost23structure, which resulted in decreased profitability from 2006. Due to a challenging freight environment, we were not able to increase freight rates to cover higher costs.$28.2$10.2 million, or 68.5%10.3%, to $69.5$109.1 million in 20072009 from $41.2$98.9 million in 2006.2008. Logistics segment revenue, net of intermodal fuel surcharges, increased 68.4%14.4%. The increase in logistics revenue primarily resulted from continued volume growth in each of our internal brokerage and intermodal services, andpartially offset by a decrease in the logistics services providedrevenue generated by MWL. The increase inWithin the difficult freight environment, our operating ratio for ourthe Logistics segment in 2007 was primarily due to an increase as a percentage of logistics revenue of the payments to carriers for transportation services which we arranged. (Dollars in thousands) 2009 vs. 2008 2009 vs. 2008 2009 2008 Operating revenue $ (101,225 ) (16.7 )% 100.0 % 100.0 % Operating expenses (income): Salaries, wages and benefits (13,864 ) (9.1 ) 27.4 25.1 Purchased transportation (6,598 ) (5.8 ) 21.1 18.6 Fuel and fuel taxes (75,994 ) (43.2 ) 19.7 29.0 Supplies and maintenance (155 ) (0.4 ) 7.6 6.3 Depreciation 3,364 6.8 10.5 8.2 Operating taxes and licenses (57 ) (0.8 ) 1.3 1.1 Insurance and claims (5,513 ) (21.7 ) 3.9 4.2 Communications and utilities 430 11.5 0.8 0.6 Gain on disposition of revenue equipment 1,034 38.8 (0.3 ) (0.4 ) Other (526 ) (4.6 ) 2.2 1.9 Total operating expenses (97,879 ) (17.0 ) 94.2 94.6 Operating income (3,346 ) (10.2 ) 5.8 5.4 Net interest expense (income) (926 ) (96.7 ) - 0.2 Income before income taxes (2,420 ) (7.6 ) 5.8 5.2 (536 ) (47.9 ) 0.1 0.2 (1,884 ) (6.2 ) 5.7 5.0 Provision for income taxes (80 ) (0.6 ) 2.5 2.1 Net income $ (1,804 ) (10.0 )% 3.2 % 3.0 % increasedecrease in salaries, wages and benefits resulted primarily from a 2.8% increase6.8% decrease in the total miles driven by company drivers. Additionally, higherdrivers coupled with a more broad implementation of our per diem pay structure for our drivers in 2009, a $3.4 million decrease in our self-insured medical claims, increasedwhich decreased our employees’ health insurance expense, by $1.8and a $1.6 million decrease in 2007.increased $19.4decreased $6.6 million in total, or 22.9%5.8%, in 20072009 from 2006.2008. Payments to carriers for transportation services we arranged in our brokerage and intermodal operations increased $22.8$6.9 million to $52.5$80.7 million in 20072009 from $29.7$73.8 million in 2006, as our Logistics operations significantly increased in size and scope compared with 2006.2008. The portion of purchased transportation expense related to our independent contractors, including fuel surcharges, decreased $3.5$13.5 million in 2007,2009, primarily due to a decrease in the amount of fuel surcharges paid to the independent contractors and a decrease in the number of independent contractor-owned tractors in our fleet.24increased $5.3decreased $9.3 million, or 7.6%15.2%, to $76.1$52.1 million in 20072009 from $70.7$61.4 million in 2006.2008. Fuel surcharges passed through to independent contractors, outside drayage carriers and railroads were $14.2$7.9 million in 20072009 and $12.9$18.2 million in 2006.2008. We have worked diligently to control fuel usage and costs by improving our volume purchasing arrangements and optimizing our drivers’ fuel purchases with national fuel centers, focusing on shorter lengths of haul, installing and tightly managing the use of auxiliary power units in our tractors to minimize engine idling and improving fuel usage in the temperature-control units on our trailers. The increasedecrease in net fuel expense was primarily due to a 2.8% increasesignificant decrease in the DOE national average cost of fuel to $2.47 per gallon in 2009 from $3.80 per gallon in 2008, a 6.8% decrease in the total miles driven by our company-owned fleet and an increase into the D.O.E. national average cost of fuel during 2007 to $2.89 per gallon from $2.71 per gallon in 2006. These increases were partially offset by reduced idling fuel consumption resulting from the installation of auxiliary power units for our tractors that provide climate control and electrical power for our drivers without idling the tractor engine. Auxiliary power units were installed in approximately 60% of our company-owned tractors as of December 31, 2007.measures stated above. Net fuel expense represented 17.9%13.6% of truckload and intermodal revenue, net of fuel surcharges, in 2007,2009, compared with 17.1%14.9% in 2006.Supplies2008.maintenance consist of repairs, maintenance, tires, parts, oil and engine fluids, along with load-specific expenses including loading/unloading, tolls, pallets and trailer hostling. The increase in supplies and maintenance in 2007 primarily resulted from the higher percentage of company-owned tractors in our fleet, for which we bear all maintenance expenses, an increase in the size of our trailer fleet associated with growth of our intermodal operations and an increase in the average age of our tractor and trailer fleets. Our maintenance practices in 2007 were consistent with 2006.ana continued increase in the cost of revenue equipment and an increase in the relative percentage of company-owned tractors to independent contractor-owned tractors in 2007.increase$5.5 million decrease in insurance and claims in 20072009 was primarily due to a decrease in the resultcost of an increase inour self-insured auto liability and workers’ compensation accident claims and to reduced physical damage claims with respectrelated to our tractors and trailers.A decrease in the planned numberdispositions anddecreased to $1.6 million in 2009 from $2.7 million in 2008 as a result of a decrease in the market value for used revenue equipment, caused our gain on dispositionwhich was partially offset by an increase in the number of revenue equipment to decrease to $3.4 million in 2007 from $7.0 million in 2006.ratio,”ratio”, was 95.0%94.2% in 20072009 compared with 92.1%94.6% in 2006.37.3%43.4% in 20072009 from 35.4%41.0% in 2006,2008, primarily because we decreasedof the nondeductible effect of a per diem pay structure for our deferred income tax liabilitydrivers adopted in 2006 by 3.3%the first quarter of income before income taxes. This decrease2008 which was primarily due to a change in income apportionment for several states, which produced a lower effective state income tax rate, net of federal impact.$15.0$16.3 million in 20072009 from $24.5$18.1 million in 2006.2008. Net earnings per share decreased to $0.68$0.74 per diluted share in 20072009 from $1.12$0.82 per diluted share in 2006.25 our unsecured senior notes and our revolving credit facility. A portion of our tractor fleet is provided by independent contractors who own and operate their own equipment. We have no capital expenditure requirements relating to those drivers who own their tractors or obtain financing through third parties. However, to the extent we purchase tractors and extend financing to the independent contractors through our tractor purchase program, we have an associated capital expenditure requirement.provided by financing activities and total long-term debt, including current maturities, for the years indicated.(In thousands) 2010 2009 2008 $ 64,522 $ 81,686 $ 77,044 (81,181 ) (77,164 ) (37,602 ) 16,555 (1,507 ) (40,665 ) 20072010, 2009, or in the remainder of 2008. The repurchase program does not have an expiration date.In 2008, we spent $32.6 million to purchase new revenue equipment, net of proceeds from dispositions. These expenditures were funded with cash flows from operations. We estimate that capital expenditures, net of proceeds from dispositions, will be approximately $40 million to $60 million in 2009, which we will adjust throughout the year as we size our fleet to existing customer demand. We believe our sources of liquidity are adequate to meet our current and anticipated needs for at least the next twelve months. Based upon anticipated cash flows, current borrowing availability and sources of financing we expect to be available to us, we do not anticipate any significant liquidity constraints in the foreseeable future.We have outstanding senior unsecured notes with an aggregate principal balance of $2.9 million at December 31, 2008. These notes mature in April 2010, require annual principal payments of $1.4 million and bear interest at a fixed annual rate of 8.57%.We maintain a credit agreement that provides for a five-year unsecured committed credit facility maturing in September 2011 in an aggregate principal amount of up to $75 million. The aggregate principal amount of the credit facility may be increased at our option up to a maximum aggregate principal amount of $100 million. At December 31, 2008, there was no outstanding principal balance on the credit facility. As of that date, we had outstanding standby letters of credit of $6.8 million and remaining borrowing availability of $68.2 million. This facility bears interest at a variable rate based on the London Interbank Offered Rate or the agent bank’s Prime Rate, in each case plus/minus applicable margins.Our credit facility prohibits us from paying, in any fiscal year, dividends in excess of 25% of our net income from the prior fiscal year. The debt agreements discussed above also contain restrictive covenants26which, among other matters, require us to maintain certain financial ratios, including debt-to-equity, cash flow leverage, interest coverage and fixed charge coverage. We were in compliance with all of these covenants at December 31, 2008.We had $797,000 in direct financing receivables from independent contractors under our tractor purchase program as of December 31, 2008, compared with $3.0 million in receivables as of December 31, 2007. These receivables, which are collateralized by the financed tractors, are used to attract and retain qualified independent contractors. We deduct payments from the independent contractors’ settlements weekly and, as a result, have experienced minimal collection issues for these receivables. The decrease in the receivables balance is related to an initiative to direct the leases to a third-party leasing vendor in 2007.2008. Payments Due by Period 2012 2014 And And (In thousands) 2011 2013 2015 Thereafter Total Long-term debt obligations $ 19,346 $ — $ — $ — $ 19,346 Purchase obligations for revenue equipment 9,381 — — — 9,381 2,856 — — — 2,856 Operating lease obligations 627 459 3 — 1,089 Total $ 32,210 $ 459 $ 3 $ — $ 32,672 $1.1 million in 2007 and $1.3 million in 2006 for fuel and tire services. In addition, we paid $1.7 million in 2010, $1.5 million in 2009 and $2.3 million in 2008 $2.4 million in 2007 and $2.4 million in 2006 to tire manufacturers for tires that we purchased from the tire manufacturers but were provided by BBI. BBI received commissions from the tire manufacturers related to these purchases. Other than any benefit received from his ownership interest, Mr. Bauer receives no compensation or other benefits from our business with BBI. and $547,000 in 2007 for various construction projects. Larry B. Hagness, one of our directors, is the president and owner of Durand Builders Service, Inc. Other than any benefit received from his ownership interest, Mr. Hagness receives no compensation or other benefits from these transactions.$6.8$8.3 million and operating leases summarized above in our summary of contractual obligations, we did not have any other material off-balance sheet arrangements at December 31, 2008.27mosta significant portion of long-term increases in fuel prices and related taxes to customers in the form of surcharges and higher rates, such increases usually are not fully recovered. Fuel prices were high throughoutThese surcharge provisions are not effective in mitigating the past three years, which has increased our cost of operating.RecognitionRecognition. . We recognize revenue, including fuel surcharges, at the time shipment of freight is completed.ReceivableReceivable. . We are dependent upon a limited number of customers, and, as a result, our trade accounts receivable are highly concentrated. Trade accounts receivable are recorded at the invoiced amounts, net of an allowance for doubtful accounts. Our allowance for doubtful accounts was $170,000 as of December 31, 2010 and $245,000 as of December 31, 2009. A considerable amount of judgment is required in assessing the realization of these receivables including the current creditworthiness of each customer and related aging of the past-due balances, including any billing disputes. In order to assess the collectibility of these receivables, we perform ongoing credit evaluations of our customers’ financial condition. Through these evaluations, we may become aware of a situation where a customer may not be able to meet its financial obligations due to deterioration of its financial viability, credit ratings or bankruptcy. The allowance for doubtful accounts is based on the best information available to us and is reevaluated and adjusted as additional information is received. We evaluate the allowance based on historical write-off experience, the size of the individual customer balances, past-due amounts and the overall national economy. We review the adequacy of our allowance for doubtful accounts monthly.EquipmentEquipment.. The transportation industry requires significant capital investments. Our net property and equipment was $314.3$372.1 million as of December 31, 20082010 and $325.2$341.5 million as of December 31, 2007.2009. Our depreciation expense was $51.9 million in 2010, $53.1 million in 2009 and $49.7 million for 2008, $47.0 million for 2007 and $44.4 million for 2006.in 2008. We compute depreciation of our property and equipment for financial reporting purposes based on the cost of each asset, reduced by its estimated salvage value, using the straight-line method over its estimated2820082010 by approximately $8.3$8.1 million, or 2.6%2.2%.2008,2010, we replaced most of our company-owned tractors within approximately 3.54.5 years and our trailers within approximately 5.5six years after purchase. Our useful lives for depreciating tractors is five years and trailers is seven years, with a 25% salvage value for tractors and a 35% salvage value for trailers. These salvage values are based upon the expected market values of the equipment after five years for tractors and seven years for trailers. Depreciation expense calculated in this manner approximates the continuing declining value of the revenue equipment, and continues at a consistent straight-line rate for units held beyond the normal replacement cycle. Calculating tractor depreciation expense with a five-year useful life and a 25% salvage value results in the same depreciation rate of 15% of cost per year and the same net book value of 47.5%32.5% of cost at the 3.5-year4.5-year replacement date as using a 3.5-year4.5-year useful life and 47.5%32.5% salvage value. As a result, there is no difference in recorded depreciation expense on a quarterly or annual basis with our five-year useful life and 25% salvage value compared with a 3.5-year4.5-year useful life and 47.5%32.5% salvage value. Similarly, calculating trailer depreciation expense with a seven-year useful life and a 35% salvage value results in the same depreciation rate of 9.3% of cost per year and the same net book value of 48.9%44.3% of cost at the 5.5-yearsix-year replacement date as using a 5.5-yearsix-year useful life and 48.9%44.3% salvage value. As a result, there is no difference in recorded depreciation expense on a quarterly or annual basis with our seven-year useful life and 35% salvage value compared with a 5.5-yearsix-year useful life and 48.9%44.3% salvage value.AssetsAssets.. Long-lived assets are reviewed for impairment whenever events or changes in circumstances indicate that the carrying amount of an asset may not be recoverable. Recoverability of assets to be held and used is measured by a comparison of the carrying amount of an asset to future net undiscounted cash flows expected to be generated by the asset. If such assets are considered to be impaired, the impairment to be recognized is measured by the amount by which the carrying amount of the assets exceeds the fair value of the assets. Assets to be disposed of are reported at the lower of the carrying amount or fair value less the costs to sell.ClaimsClaims.. We self-insure, in part, for losses relating to workers’ compensation, auto liability, general liability, cargo and property damage claims, along with employees’ health insurance with varying risk retention levels. We maintain insurance coverage for per-incident and total losses in excess of these risk retention levels in amounts we consider adequate based upon historical experience and our ongoing review. However, we could suffer a series of losses within our self-insured retention limits or losses over our policy limits, which could negatively affect our financial condition and operating results. We are responsible for the first $1.0 million on each auto liability claim and also responsible for up to $1.0 million in the aggregate for 33% of all auto liability claim amounts in excess of $1.0 million. We are responsible for the first $750,000 on each workers’ compensation claim. We have $6.8$8.3 million in standby letters of credit to guarantee settlement of claims under agreements with our insurance carriers and regulatory authorities. The insurance and claims accruals in our consolidated balance sheets were $21.4$17.7 million as of December 31, 2008,2010, and $17.4$19.2 million as of December 31, 2007.2009. We reserve currently for the estimated cost of the uninsured portion of pending claims. We periodically evaluate and adjust these reserves based on our evaluation of the nature and severity of outstanding individual claims and our estimate of future claims development based on historical claims development factors. We believe that our claims development factors have historically been reasonable, as indicated by the adequacy of our insurance and claims accruals compared to settled claims. Actual results could differ from these current estimates. In addition, to the extent that claims are litigated and not settled, jury awards are difficult to predict. If our claims settlement experience worsened causing our historical claims development factors to increase by 5%, our estimated outstanding loss reserves as of December 31, 20082010 would have needed to increase by approximately $3.3$3.7 million.29Table of ContentsCompensationCompensation. . We have granted stock options to certain employees and non-employee directors. We recognize compensation expense for all share-based payment arrangementsstock options granted after December 31, 2005 and prior to but not yet vested as of December 31, 2005, in accordance with Statement of Financial Accounting Standards No. 123R, “Share-Based Payment” (SFAS 123R). Under the fair value recognition provisions of SFAS 123R, we record share-based compensation expense net of an estimated forfeiture rate and only record compensation expense for those shares expected to vest on a straight-line basis over the requisite service period for service-based awards (normally the vesting period). Compensation expense will be recorded for performance-based awards in the periods in which the performance condition is probable of achievement. Determining the appropriate fair value model and calculating the fair value of share-based payment arrangementsstock options require the input of highly subjective assumptions, including the expected life of the share-based payment arrangementsstock options and stock price volatility. We use the Black-Scholes model to value our stock option awards. We believe that future volatility will not materially differ from our historical volatility. Thus, we use the historical volatility of our common stock over the expected life of the award. The assumptions used in calculating the fair value of share-based payment awardsstock options represent our best estimates, but these estimates involve inherent uncertainties and the application of judgment. As a result, if factors change and we use different assumptions, share-basedstock option compensation expense could be materially different in the future.addition,August 2010, we also granted performance unit awards to certain employees which are requiredsubject to estimatevesting requirements over a five-year period, primarily based on our earnings growth. The fair value of each performance unit is based on the expected forfeiture rate and onlyclosing market price on the date of grant. We recognize compensation expense for those shares expected to vest. Ifthese awards based on the actual forfeiture rate is materially different fromestimated number of units probable of achieving the estimate, share-based compensation expense could be significantly different from what has been recorded in the current period.Recent Accounting PronouncementsIn September 2006, the Financial Accounting Standards Board, or FASB, issued Statement of Financial Accounting Standards No. 157, “Fair Value Measurements,” (SFAS 157). SFAS 157 provides enhanced guidance for using fair value to measure assets and liabilities. The statement provides a common definition of fair value and establishes a framework to make the measurement of fair value in generally accepted accounting principles more consistent and comparable. SFAS 157 also requires expanded disclosures to provide information about the extent to which fair value is used to measure assets and liabilities, the methods and assumptions used to measure fair value, and the effect of fair value measures on earnings. SFAS 157 is effective for 2008 financial statements. However, SFAS 157 as it relates to fair value measurementvesting requirements for non-financial assets and liabilities that are not remeasured at fair value on a recurring basis is effective for 2009. The adoption of SFAS 157 did not and is not expected to have a significant impact on our financial condition, results of operations or cash flows.In December 2007, the FASB issued Statement of Financial Accounting Standards No. 160, “Noncontrolling Interests in Consolidated Financial Statements — an amendment of ARB No. 51” (SFAS 160). SFAS 160 requires that accounting and reporting for minority interests will be recharacterized as noncontrolling interests and classified as a component of equity. SFAS 160 also establishes reporting requirements that provide sufficient disclosures that clearly identify and distinguish between the interests of the parent and the interestsawards, net of the noncontrolling owners. SFAS 160 applies to all entities that prepare consolidated financial statements, except not-for-profit organizations, but will affect only those entities that have an outstanding noncontrolling interest in one or more subsidiaries or that deconsolidate a subsidiary. This statement is effective for the first quarter of 2009. We continue to evaluate the impact of this new pronouncement, but currently believe the only impact of adopting SFAS 160 would be to reclassify $1.7 million in minority interest to a separate component of stockholders’ equity.In December 2007, the FASB issued Statement of Financial Accounting Standards No. 141 (revised 2007), “Business Combinations” (SFAS 141R), which replaces FASB Statement No. 141. SFAS 141R establishes principles and requirements for how an acquirer recognizes and measures in its financial statements the identifiable assets acquired, the liabilities assumed, any non-controlling interest in the acquiree and the goodwill acquired. The statement also establishes disclosure requirements that will enable users to evaluate the nature and financial effects of the business combination. SFAS 141R is effective for the first quarter of302009. The adoption of SFAS 141R could have a significant impact on our financial condition, results of operations and cash flows if we should enter into a business combination after that date.ITEM 7A.QUANTITATIVE AND QUALITATIVE DISCLOSURES ABOUT MARKET RISKITEM 7A. QUANTITATIVE AND QUALITATIVE DISCLOSURES ABOUT MARKET RISK fuel. Our operations are heavily dependent upon the usefuel and changes in interest rates.fuel.fuel to operate our tractors and power the temperature-control units on our trailers. The price and availability of diesel fuel can vary, and are subject to political, economic and market factors that are beyond our control. Significant increases in diesel fuel costs could materially and adversely affect our results of operations and financial condition. Historically, weBased upon our fuel consumption in 2010, a 5% increase in the average cost of diesel fuel would have increased our fuel expense by $5.6 million.recoverpass through a significant portion of long-term increases in diesel fuel price increases fromprices and related taxes to customers in the form of fuel surcharges.We presently use fuel surcharges to address the risk of high fuel prices. Fuel surcharge programs are widely accepted among our customers, though they can vary somewhat from customer-to-customer. We believeThese fuel surcharges, which adjust weekly with the cost of fuel, enable us to recover a substantial portion of the higher cost of fuel as prices increase. These fuel surcharge provisions are not effective atin mitigating the risk of high fuel prices, although we do not recover the full amount of fuel price increases.2008.2010. In making this evaluation, management used the criteria set forth by the Committee of Sponsoring Organizations of the Treadway Commission (COSO) in Internal Control —– Integrated Framework. Based on this assessment, management concluded that the Company’s internal control over financial reporting was effective as of December 31, 2008.2010. Further, the Company’s independent registered public accounting firm, KPMG LLP, has issued a report on the Company’s internal controls over financial reporting on page 3334 of this Report.13, 20093220082010 and 20072009 and the related consolidated statements of operations, stockholders’ equity, and cash flows for each of the years in the three-year period ended December 31, 2008.2010. In connection with our audits of the consolidated financial statements, we also have audited the financial statement schedule listed in Item 15(a)(2). We also have audited the Company’s internal control over financial reporting as of December 31, 20082010 based on criteria established in Internal Control - Integrated Framework issued by the Committee of Sponsoring Organizations of the Treadway Commission (COSO). The Company’s management is responsible for these consolidated financial statements, for maintaining effective internal control over financial reporting, and for its assessment of the effectiveness of internal control over financial reporting, included in the accompanying Management’s Report on Internal Control Over Financial Reporting. Our responsibility is to express an opinion on these consolidated financial statements and financial statement schedule and an opinion on the Company’s internal control over financial reporting based on our audits.20082010 and 20072009 and the results of their operations and their cash flows for each of the years in the three-year period ended December 31, 2008,2010, in conformity with accounting principles generally accepted in the United States of America. Also, in our opinion, the accompanying financial statement schedule, when considered in relation to the basic consolidated financial statements taken as a whole, presents fairly, in all material respects, the information set forth therein. It is also in our opinion, Marten Transport, Ltd. maintained, in all material respects, effective internal control over financial reporting as of December 31, 20082010 based on criteria established in Internal Control - Integrated Framework issued by the Committee of Sponsoring Organizations of the Treadway Commission./s/ KPMG LLP Minneapolis, MinnesotaMarch 13, 200933 December 31, (In thousands, except share information) 2010 2009 ASSETS Current assets: $ 5,306 $ 5,410 138 118 51,094 45,434 12,968 4,382 13,406 12,328 4,794 5,172 87,706 72,844 Property and equipment: 469,437 455,641 25,678 18,763 20,507 16,723 (143,563 ) (149,670 ) 372,059 341,457 Other assets 543 537 $ 460,308 $ 414,838 LIABILITIES AND STOCKHOLDERS’ EQUITY Current liabilities: $ 1,066 $ 1,671 17,800 16,308 17,653 19,222 12,724 15,588 19,346 1,428 68,589 54,217 — 71 Deferred income taxes 95,815 85,643 164,404 139,931 Stockholders’ equity: — — 220 219 78,428 76,477 215,345 196,480 Total Marten Transport, Ltd. stockholders’ equity 293,993 273,176 Noncontrolling interest 1,911 1,731 295,904 274,907 $ 460,308 $ 414,838 34 For the years ended December 31, 2010 2009 2008 Operating revenue $ 516,920 $ 505,874 $ 607,099 Operating expenses (income): 131,519 138,752 152,616 110,408 106,577 113,175 114,927 99,898 175,892 35,218 38,223 38,378 51,916 53,069 49,705 6,222 6,672 6,729 16,573 19,896 25,409 3,964 4,170 3,740 (1,110 ) (1,630 ) (2,664 ) 11,994 10,888 11,414 481,631 476,515 574,394 Operating income 35,289 29,359 32,705 Net interest expense (income) (26 ) 32 958 Income before income taxes 35,315 29,327 31,747 Less: Income before income taxes attributable to noncontrolling interest 631 584 1,120 Income before income taxes attributable to Marten Transport, Ltd. 34,684 28,743 30,627 Provision for income taxes 14,942 12,476 12,556 $ 19,742 $ 16,267 $ 18,071 Basic earnings per common share $ 0.90 $ 0.74 $ 0.83 Diluted earnings per common share $ 0.90 $ 0.74 $ 0.82 Dividends paid per common share $ 0.04 $ — $ — 35
Stockholders’ Marten Transport, Ltd. Stockholders Common Stock Additional Retained Total Stockholders’ (In thousands) Shares Amount Paid-In Capital Earnings Interest Equity Balance at December 31, 2007 21,812 $ 218 $ 74,570 $ 162,142 $ 1,283 $ 238,213 Net income — — — 18,071 — 18,071 Repurchase and retirement of common stock (67 ) — (810 ) — — (810 ) Issuance of common stock from share-based payment arrangement exercises 85 — 356 — — 356 Tax benefits from share-based payment arrangement exercises — — 523 — — 523 Share-based payment arrangement compensation expense — — 666 — — 666 — — — — 1,120 1,120 Noncontrolling interest distributions — — — — (688 ) (688 ) Balance at December 31, 2008 21,830 218 75,305 180,213 1,715 257,451 Net income — — — 16,267 — 16,267 Issuance of common stock from share-based payment arrangement exercises 55 1 331 — — 332 Tax benefits from share-based payment arrangement exercises — — 255 — — 255 Share-based payment arrangement compensation expense — — 586 — — 586 — — — — 584 584 Noncontrolling interest distributions — — — — (568 ) (568 ) Balance at December 31, 2009 21,885 219 76,477 196,480 1,731 274,907 Net income — — — 19,742 — 19,742 Issuance of common stock from share-based payment arrangement exercises 65 1 302 — — 303 Tax benefits from share-based payment arrangement exercises — — 385 — — 385 Share-based payment arrangement compensation expense — — 1,264 — — 1,264 Dividends on common stock — — — (877 ) — (877 ) — — — — 631 631 Noncontrolling interest distributions — — — — (451 ) (451 ) Balance at December 31, 2010 21,950 $ 220 $ 78,428 $ 215,345 $ 1,911 $ 295,904 36 For the years ended December 31, (In thousands) 2010 2009 2008 CASH FLOWS PROVIDED BY OPERATING ACTIVITIES: Operations: Net income $ 19,742 $ 16,267 $ 18,071 Depreciation 51,916 53,069 49,705 Gain on disposition of revenue equipment (1,110 ) (1,630 ) (2,664 ) Deferred income taxes 10,550 5,563 4,842 Tax benefits from share-based payment arrangement exercises 385 255 523 Excess tax benefits from share-based payment arrangement exercises (338 ) (223 ) (456 ) Share-based payment arrangement compensation expense 1,264 586 666 Income before income taxes attributable to noncontrolling interest 631 584 1,120 Changes in other current operating items: Receivables (14,246 ) 7,712 186 Prepaid expenses and other (1,078 ) 1,377 118 Accounts payable 348 3,519 (2,066 ) Insurance and claims accruals (1,569 ) (2,164 ) 3,955 Accrued liabilities (1,973 ) (3,229 ) 3,044 Net cash provided by operating activities 64,522 81,686 77,044 CASH FLOWS USED FOR INVESTING ACTIVITIES: Revenue equipment additions (109,345 ) (104,842 ) (64,509 ) Proceeds from revenue equipment dispositions 40,062 32,876 31,938 Buildings and land, office equipment and other additions (11,959 ) (7,948 ) (4,055 ) Proceeds from buildings and land, office equipment and other dispositions 87 31 — Purchases of marketable securities (20 ) (113,170 ) (28,146 ) Sales of marketable securities — 115,656 25,892 Net change in other assets (6 ) 233 1,278 Net cash used for investing activities (81,181 ) (77,164 ) (37,602 ) CASH FLOWS PROVIDED BY (USED FOR) FINANCING ACTIVITIES: Borrowings under credit facility and long-term debt 160,395 1,115 154,267 Repayment of borrowings under credit facility and long-term debt (142,548 ) (2,473 ) (196,053 ) Dividends on common stock (877 ) — — Issuance of common stock from share-based payment arrangement exercises 303 332 356 Excess tax benefits from share-based payment arrangement exercises 338 223 456 Change in net checks issued in excess of cash balances (605 ) (136 ) 1,807 Noncontrolling interest distributions (451 ) (568 ) (688 ) Repurchase and retirement of common stock — — (810 ) Net cash provided by (used for) financing activities 16,555 (1,507 ) (40,665 ) NET CHANGE IN CASH AND CASH EQUIVALENTS (104 ) 3,015 (1,223 ) CASH AND CASH EQUIVALENTS: Beginning of year 5,410 2,395 3,618 End of year $ 5,306 $ 5,410 $ 2,395 SUPPLEMENTAL DISCLOSURE OF CASH FLOW INFORMATION: Cash paid for: Interest $ 225 $ 200 $ 1,240 Income taxes $ 13,789 $ 4,905 $ 6,368 Non-cash investing activities: Change in property and equipment not yet paid for $ 253 $ (1,288 ) $ (468 ) 37Interpretation No. 46, “Consolidation of Variable Interest Entities,” as revised,ASC, 810, Consolidation to our investment in MWL.MWL and have determined that Marten is the primary beneficiary based on MWL’s equity structure. All material intercompany accounts and transactions have been eliminated in consolidation. As of December 31, 2010, MWL’s total assets and total liabilities, net of intercompany accounts and transactions, were $6.4 million and $3.9 million, respectively. MWL has elected to be classified as a partnership for federal income tax purposes. Consequently, federal income taxes are not payable by MWL. See note 9 for additional discussion.38Revenue equipment:5 Tractors57 Trailers73-15 Satellite tracking7Auxiliary power units5BuildingsOffice equipment and other3-152008,2010, we replaced most of our company-owned tractors within approximately 3.54.5 years and our trailers within approximately 5.5six years after purchase. Our useful lives for depreciating tractors is five years and for trailers is seven years, with a 25% salvage value for tractors and a 35% salvage value for trailers. These salvage values are based upon the expected market values of the equipment after five years for tractors and seven years for trailers. Depreciation expense calculated in this manner approximates the continuing declining value of the revenue equipment, and continues at a consistent straight-line rate for units held beyond the normal replacement cycle.Net investment in direct financing leases: We have direct financing tractor lease receivables from independent contractors, which expire over the next three years.39We adopted the provisions of Financial Accounting Standards Board, or FASB, Interpretation No. 48, “Accounting for Uncertainty in Income Taxes — an Interpretation of FASB Statement No. 109” (FIN 48), on January 1, 2007. The implementation of FIN 48 did not have a significant impact on our results of operations or financial position. See Note 5 for additional discussion.claims.claims, including legal costs. These reserves are periodically evaluated and adjusted based on our evaluation of the nature and severity of outstanding individual claims and an estimate of future claims development based on historical claims development factors. Under agreements with our insurance carriers and regulatory authorities, we have $6.8$8.3 million in standby letters of credit to guarantee settlement of claims.customers whose trade receivables represented 16% and 10%, respectively,customers.trade receivablesLogistics segment and revenue on freight transported by independent contractors within our Truckload segment on a gross basis because we are the primary obligor in the arrangements, we have the ability to establish prices, we have the risk of loss in the event of cargo claims and we bear credit risk with customer payments. Accordingly, all such revenue billed to customers is classified as operating revenue and all corresponding payments to carriers for transportation services we arrange in connection with brokerage and intermodal activities and to independent contractor providers of December 31, 2008. We earned 18% of our revenue in 2007 from a single customer whose trade receivables represented 12% of our trade receivablesequipment are classified as of December 31, 2007. We earned 17% of our revenue in 2006 from a single customer.consultants, advisors and independent contractors, may be granted stock-based awards, including incentive and non-statutory stock options and restricted stockperformance unit awards. Effective January 1, 2006, we began recording compensation expense associated withWe account for share-based payment arrangements in accordance with Statement of Financial Accounting Standards No. 123R, “Share-Based Payment” (“SFAS 123R”) as interpreted by SEC Staff Accounting Bulletin No. 107. SFAS 123RFASB ASC 718, Compensation-Stock Compensation, which requires all share-based payments to employees and non-employee directors, including grants of employee stock options and performance unit awards, to be recognized in the income statement based on their fair values at the date of grant.other dilutive securitiesperformance unit awards had been issued using the treasury stock method.40adopted the provisions of Statement of Financial Accounting Standards No. 131, “Disclosures about Segments of an Enterprisesix operating segments that have been aggregated into two reporting segments (Truckload and Related Information.” Statement No. 131 establishes accounting standardsLogistics) for segment reporting. Beginning with fiscal 2007, we have two reportable segments — Truckload and Logistics.financial reporting purposes. See Note 1113 for more information.(In thousands) 2010 2009 License fees $ 3,894 $ 4,009 Tires in service 3,049 2,912 Parts and tires inventory 2,826 2,222 Insurance premiums 992 905 Other 2,645 2,280 $ 13,406 $ 12,328 Net investment in direct financing leases: As of December 31, the components of the net investment in direct financing lease receivables from independent contractors consisted of the following:The current portion of our net investment in direct financing leases is included in other receivables in the accompanying consolidated balance sheets. The long-term portion of our net investment in direct financing leases is included in other assets in the accompanying consolidated balance sheets. The interest method is used to amortize unearned income, which amortizes unearned income to income over the lease term so as to produce a constant periodic rate of return on the net investment in each lease. The amortization of unearned income is included in interest income and other in the accompanying consolidated statements of operations.As of December 31, 2008, minimum lease payments to be received for each of the three succeeding fiscal years are as follows: $591,000 in 2009, $272,000 in 2010 and $49,000 in 2011.41MARTEN TRANSPORT, LTD.Notes to Consolidated Financial Statements (Continued)(In thousands) 2010 2009 Accrued expenses $ 6,024 $ 6,075 Vacation 3,110 3,146 Salaries and wages 1,820 1,795 Current income taxes 519 3,116 Other 1,251 1,456 $ 12,724 $ 15,588 (In thousands) 2010 2009 Unsecured committed credit facility in the September 2011 $ 19,346 $ 71 Secured B Senior Unsecured Notes which - 1,428 Total long-term debt 19,346 1,499 Less current maturities of long-term debt 19,346 1,428 Long-term debt, less current maturities $ - $ 71 $75$50 million. The aggregate principal amount of the credit facility may be increased at our option, subject to completion of signed amendments with participating banks, up to a maximum aggregate principal amount of $100 million. At December 31, 2008, there2010, the credit facility had an outstanding principal balance of $19.3 million, outstanding standby letters of credit of $8.3 million and remaining borrowing availability of $22.4 million. This facility bears interest at a variable rate based on the London Interbank Offered Rate or the agent bank’s Prime Rate, in each case plus/minus applicable margins. The weighted average interest rate for the facility was no0.86% at December 31, 2010. The $19.3 million outstanding principal balance on the credit facility. Asfacility was classified as a current liability in our consolidated balance sheet as of thatDecember 31, 2010 because the maturity date we had outstanding standby letters of credit of $6.8 million and remaining borrowing availability of $68.2 million.2008.42Maturities of long-term debt at December 31, 2008, are as follows:2008: $1.1 million in 2007 and $1.3 million in 2006 for fuel and tire services. In addition, we paid $1.7 million in 2010, $1.5 million in 2009 and $2.3 million in 2008 $2.4 million in 2007 and $2.4 million in 2006 to tire manufacturers for tires that we purchased from the tire manufacturers but were provided by the same company. The same company received commissions from the tire manufacturers related to these purchases. We had accounts payable to that company of $14,000$44,000 as of December 31, 20082010 and $25,000$24,000 as of December 31, 2007. and $547,000 in 2007 for various construction projects to a company in which one of our directors is the president and owner. We had no accounts payable to that company of $56,000 as of December 31, 2010, and no payables to that company as of December 31, 2008 and 2007.43(In thousands) 2010 2009 2008 Current: $ 2,747 $ 6,084 $ 6,497 1,645 829 1,217 4,392 6,913 7,714 Deferred: 10,761 4,472 4,549 (211 ) 1,091 293 10,550 5,563 4,842 $ 14,942 $ 12,476 $ 12,556 2010 2009 2008 35 % 35 % 35 % Per diem and other non-deductible expenses 6 5 3 3 4 3 Other (1 ) (1 ) — Effective tax rate 43 % 43 % 41 % increased towas 43.1% in 2010, 43.4% in 2009 and 41.0% in 2008. The increase in the effective rate from 2008 from 37.3% in 2007,to 2009 was primarily because ofdue to the nondeductible effect of a per diem pay structure for our drivers adopted in the first quarter of 2008. In 2006, we decreased our deferred income tax liability by $1.3 million, or 3.3% of income before income taxes. Our effective income tax rate in 2006 included a revision to our previously recorded deferred income tax liability of 2.8% of income before income taxes, primarily due to a change in income apportionment for several states,2008 which produced a lower effective state income tax rate, net of federal impact.(In thousands) 2010 2009 Deferred tax assets: $ 7,097 $ 7,452 1,684 1,168 8,781 8,620 Deferred tax liabilities: 97,510 86,823 2,292 2,268 99,802 89,091 $ 91,021 $ 80,471 20082010 or 2007.2009. We believe the deferred tax assets will be realized principally through future reversals of existing taxable temporary differences (deferred tax liabilities) and future taxable income.As disclosed in Note 1, we adopted the provisions of FIN 48 as of January 1, 2007. $131,000$215,000 as of December 31, 20082010 and $69,000$158,000 as of December 31, 2007.2009. The $62,000$57,000 increase in the amount reserved in 20082010 relates to current period tax positions. The amount reserved as of December 31, 20072009 was added in 2007 through 2009 relating to current period tax positions. If recognized, $85,000$140,000 of the unrecognized tax benefits as of December 31, 20082010 would impact our effective tax rate. No potential interest or penalties related to unrecognized tax benefits were recognized in our financial statements as of December 31, 2008.2010. We do not expect the reserves for unrecognized tax benefits to change significantly within the next twelve months.20052007 and forward. We file tax returns in numerous state jurisdictions with varying statutes of limitations.44(In thousands, except per share amounts) 2010 2009 2008 Numerator: Net income $ 19,742 $ 16,267 $ 18,071 Denominator: 21,927 21,870 21,787 Effect of dilutive stock options 104 114 144 22,031 21,984 21,931 Basic earnings per common share $ 0.90 $ 0.74 $ 0.83 Diluted earnings per common share $ 0.90 $ 0.74 $ 0.82 410,100, 280,000351,000, 418,100, and 226,000310,600 shares were outstanding but were not included in the calculation of diluted earnings per share for 2010, 2009 and 2008, 2007 and 2006, respectively, primarily because their exercise prices were greater than the average market price of the common shares and, therefore, including the options in the denominator would be antidilutive, or decrease the number of weighted-average shares. The shares, above include 99,500, 90,000 and 78,000due to their exercise prices exceeding the average market price of the common shares respectively,or due to inclusion of performance-basedaverage unrecognized compensation expense in the calculation. Performance-based option awards totaling 107,000, 107,000 and 99,500 shares for which2010, 2009 and 2008, respectively, were also not included in the calculation of diluted earnings per share because the performance condition was not met.probableoutstanding but were not included in the calculation of achievement.7.In August 2010, we announced that our Board of Directors approved a regular cash dividend program to our stockholders, subject to approval each quarter. The first two quarterly cash dividends of $0.02 per share of common stock were paid in September and December 2010.20072010, 2009, or in the remainder of 2008. The repurchase program does not have an expiration date.8. - - Under our 2005 Stock Incentive Plan (the “2005 Plan”), all of our employees and any subsidiary employees, as well as all of our non-employee directors, consultants, advisors and independent contractors, may be granted stock-based awards, including incentive and non-statutory stock options and restricted stockperformance unit awards. Stock options expire within 7 or 10 years after the date of grant and the exercise price must be at least the fair market value of our common stock on the date of grant. Stock options issued to non-employee directors upon their annual re-election to our Board of Directors are generally exercisable at the date of grant. Service-basedStock options issued to employees are generally exercisable beginning one year from the date of grant in cumulative amounts of 20% per year. Performance-based options become exercisable upon achievement of certainPerformance unit awards are subject to vesting requirements over a five-year period, primarily based on our earnings growth. Options exercised and performance criteria established by the Compensation Committee of our Board of Directors. Options exercisedunit award shares issued represent newly issued shares. The maximum number of shares of common stock available for issuance under the 2005 Plan is 2.85 million shares. As of December 31, 2008,2010, there were 422,600535,600 shares reserved for issuance under options outstanding and 63,400 shares reserved for issuance under outstanding performance unit awards under the 2005 Plan. The 2005 Plan replaces our 1995 Stock Incentive Plan (the “1995 Plan”), which expired by its terms in March 2005.45MARTEN TRANSPORT, LTD.Notes to Consolidated Financial Statements (Continued)Service-basedStock options issued to employees are generally exercisable beginning one year from the date of grant in cumulative amounts of 20% per year. Options exercised represent newly issued shares. As of December 31, 2008,2010, there were 272,763153,582 shares reserved for issuance under options outstanding under the 1995 Plan. No additional options will be granted under the 1995 Plan.Effective January 1, 2006, we began recording compensation expense associated withStatement of Financial Accounting Standards No. 123R, “Share-Based Payment” (“SFAS 123R”) as interpreted by SEC Staff Accounting Bulletin No. 107. SFAS 123R supersedes Accounting Principles Board Opinion No. 25, “Accounting for Stock Issued to Employees” (“APB 25”)FASB ASC 718, Compensation-Stock Compensation, and amends Statement of Financial Accounting Standards No. 95, “Statement of Cash Flows.” Generally, the approach in SFAS 123R is similar to the approach described in Statement of Financial Accounting Standards No. 123, “Accounting For Stock-Based Compensation” (“SFAS 123”). However, SFAS 123Rwhich requires all share-based payments to employees and non-employee directors, including grants of employee stock options and performance unit awards, to be recognized in the income statement based on their fair values at the date of grant.We adopted the modified prospective transition method provided for under SFAS 123R, and consequently have not retroactively adjusted results from prior periods. Under this transition method, compensation cost associated with share-based awards recognized in 2008, 2007 and 2006 includes: (a) compensation cost for all share-based payments granted priorbut not yet vested as of December 31, 2005, based on the grant-date fair value estimated in accordance with the provisions of SFAS 123, and (b) compensation cost for all share-based payments granted subsequent to December 31, 2005, based on the grant-date fair value estimated in accordance with the provisions of SFAS 123R.46 2010 2009 2008 Service-based options: 6.1 6.1 6.2 39 % 40 % 40 % 2.7 % 2.5 % 3.3 % 0.05 % — $ 9.31 $ 7.77 $ 7.76 Performance-based options: — 6.0 6.6 — 41 % 39 % — 2.4 % 3.3 % — — — — $ 8.55 $ 7.90 MARTEN TRANSPORT, LTD.Notes to Consolidated Financial Statements (Continued)—– We use historical employee exercise and option expiration data to estimate the expected life assumption for the Black-Scholes grant-date valuation. We believe that this historical data is currently the best estimate of the expected term of a new option. We use a weighted-average expected life for all awards.(2) (2)—– We use our stock’s historical volatility for the same period of time as the expected life. We have no reason to believe that its future volatility will differ from the past.(3) (3)—– The rate is based on the U.S. Treasury yield curve in effect at the time of the grant for the same period of time as the expected life.(4) (4)— We have not historically paid cash dividends– The calculation is based on our common stock.Compensation expense will be recorded for performance-based option awards in the periods in which the performance condition is probable of achievement. Performance-based option awards will remain exercisable to the extent previously exercisable for a period of one year after the employee’s employment is terminated due to retirement, death or disability. Performance-based option awards become immediately exercisable in full in the event of a change in control with respect to all options that have been outstanding for at least six months.SFAS 123R requires compensationto beare recognized, net of an estimated forfeiture rate, over the requisite service period, which is the period between the grant date and the earlier of the award’s stated vesting term or the date the employee is eligible for retirement. We immediately recognize the entire amount of share-based compensation cost for employees that are eligible for retirement at the date of grant. For awards granted to employees approaching retirement eligibility, we recognize compensation cost on a straight-line basis over the period from the grant date through the retirement eligibility date. Share-based compensation expense for employees who are not retirement eligible is recognized on a straight-line basis over the stated vesting period of the award.SFAS 123R requires forfeitures to beForfeitures are estimated at the time of grant and revised, if necessary, in subsequent periods if actual forfeitures differ from those estimates. The term “forfeitures” is distinct from “cancellations” or “expirations” and represents only the unvested portion of the surrendered award. We currently expect, based on an analysis of our historical forfeitures and known forfeitures on existing awards, that approximately 1.25% of unvested outstanding optionsawards will be forfeited each year. This analysis will be re-evaluated quarterly and the forfeiture rate will be adjusted as necessary. Ultimately, the actual expense recognized over the vesting period will only be for those shares that vest., in 2007 was $460,000 ($321,000 net of income tax benefit, $0.015 of earnings per basic and diluted share) and in 2006 was $447,000 ($318,000 net of income tax47MARTEN TRANSPORT, LTD.Notes to Consolidated Financial Statements (Continued)benefit, $0.015 of earnings per basic share and $0.014 of earnings per diluted share). All share-based compensation expense was recorded in salaries, wages and benefits expense.Prior to the adoption of SFAS 123R,were reported as operating cash flows. SFAS 123R requires that they beare recorded as a financing cash inflow rather than a deduction of taxes paid in operating cash flows. In 2008, 20072010, 2009 and 2006,2008, there was $456,000, $166,000$338,000, $223,000 and $1.2 million,$456,000, respectively, of excess tax benefits recognized resulting from exercises of options granted prior to December 31, 2005.2008,2010, there was a total of $1.5$1.9 million of unrecognized compensation expense related to unvested service-based option awards, which is expected to be recognized over a weighted-average period of 3.63.3 years, and $911,000$875,000 of unrecognized compensation expense related to unvested performance-based optionperformance unit awards, which will be recorded inbased on the periods in which our achievementestimated number of certain operating ratios is probable through 2010. As of December 31, 2008, the performance condition was not consideredunits probable of achievement.20082010 was as follows: Weighted Average Shares Exercise Price Outstanding at December 31, 2009 765,361 $ 15.89 Granted 99,000 22.11 Exercised (65,179 ) 4.65 Expired (107,000 ) 21.35 Forfeited (3,000 ) 17.83 Outstanding at December 31, 2010 689,182 $ 16.99 Exercisable at December 31, 2010 412,722 $ 15.30 fair value of options granted in 2007 was $338,000 for service-based options and $93,000 for performance-based options. The fair value of options granted in 2006 was $1.4 million for service-based options and $767,000 for performance-based options. The total intrinsic value of options exercised in 2010, 2009 and 2008 2007was $1.0 million, $719,000 and 2006 was $1.3 million, $564,000 and $3.4 million, respectively. Intrinsic value is the difference between the fair value of the acquired shares at the date of exercise and the exercise price, multiplied by the number of options exercised. Proceeds received from option exercises in 2010, 2009 and 2008 2007were $303,000, $332,000 and 2006 were $356,000, $303,000 and $813,000, respectively.482008:(1) Represents the weighted-average remaining contractual life in years.(2) Represents the weighted-average exercise price.(3) Represents the aggregate intrinsic value based on our closing stock price on December 31, 2008 for in-the-money options (in thousands). Options Outstanding Options Exercisable Range of Exercise Prices Shares Shares Service-based options: $4.14 - $5.78 102,956 1.5 $ 4.99 $ 1,687 102,956 1.5 $ 4.99 $ 1,687 $10.76 50,626 2.8 10.76 538 50,626 2.8 10.76 538 $15.45 - $23.59 535,600 5.6 19.88 988 259,140 5.5 20.28 401 689,182 4.8 $ 16.99 $ 3,213 412,722 4.2 $ 15.30 $ 2,626 (1) Represents the weighted-average remaining contractual life in years. (2) Represents the weighted-average exercise price. (3) Represents the aggregate intrinsic value based on our closing stock price on December 31, 2010 for in-the-money options (in thousands). 20082010 and changes during 20082010 were as follows: Weighted Average Weighted Remaining Average Contractual Grant Date Life Shares Fair Value (in Years) Service-based options: Nonvested at December 31, 2009 266,080 $ 7.98 6.3 Granted 99,000 9.31 6.8 Vested (85,620 ) 8.51 5.9 Forfeited (3,000 ) 7.54 5.9 276,460 $ 8.30 5.7 Performance-based options: Nonvested at December 31, 2009 107,000 $ 9.12 6.6 Expired (107,000 ) 9.12 — Nonvested at December 31, 2010 — $ — — 2007was $729,000, $561,000 and 2006 was $629,000, $419,000 and $227,000, respectively.49 Weighted Average Grant Date Shares Fair Value Nonvested at December 31, 2009 - $ - Granted 63,400 20.73 Vested (16,484 ) (1) 20.73 Nonvested at December 31, 2010 46,916 $ 20.73 (1) This number of performance unit award shares vested based on our financial performance in 2010 and will be distributed or credited to the Marten Transport, Ltd. Deferred Compensation Plan in March 2011. The fair value of unit award shares that vested in 2010 was $342,000. - - We sponsor a defined contribution retirement savings plan under Section 401(k) of the Internal Revenue Code. Employees are eligible for the plan after one year of service. Participants are able to contribute up to the limit set by law, which in 20082010 was $15,500$16,500 for participants less than age 50 and $20,500$22,000 for participants age 50 and above. We contribute 35% of each participant’s contribution, up to a total of 6% contributed. Our contribution vests at the rate of 20% per year for the second through sixth years of service. In addition, we may make elective contributions as determined by the boardBoard of directors. ElectiveDirectors. No elective contributions were not made in 2008, 20072010, 2009 or 2006.2008. Total expense recorded for the plan was $633,000 in 2010, $996,000 in 2009 and $1.0 million in 2008, $1.3 million in 2007 and $1.1 million in 2006.2008. - - An Employee Stock Purchase Plan and an Independent Contractor Stock Purchase Plan are sponsored to encourage employee and independent contractor ownership of our common stock. Eligible participants specify the amount of regular payroll or contract payment deductions and voluntary cash contributions that are used to purchase shares of our common stock. The purchases are made at the market price on the open market. We pay the broker’s commissions and administrative charges for purchases of common stock under the plans.9. Fair Value MeasurementsIn September 2006, the FASB issued Statement of Financial Accounting Standards No. 157, “Fair Value Measurements,” (SFAS 157). This statement provides a single definition for fair value, establishes a framework for measuring fair value and expands disclosures about fair value measurements. Under SFAS 157, fair value is defined as the exit price, or the amount that would be received to sell an asset or paid to transfer a liability in an orderly transaction between market participants as of the measurement date. SFAS 157 also establishes a hierarchy for inputs used in measuring fair value that maximizes the use of observable inputs and minimizes the use of unobservable inputs by requiring that the most observable inputs be used when available. Observable inputs are inputs market participants would use in valuing the asset or liability developed based on market data obtained from independent sources. Unobservable inputs are inputs that reflect a company’s assumptions about the factors market participants would use in valuing the asset or liability developed based upon the best information available in the circumstances.We adopted the provisions of SFAS 157 (as impacted by FSP Nos. 157-1 and 157-2) effective January 1, 2008 with respect to fair value measurements of (a) nonfinancial assets and liabilities that are recognized or disclosed at fair value in our consolidated financial statements on a recurring basis (at least annually) and (b) all financial assets and liabilities. The financial assets and liabilities that are re-measured and reported at fair value for each reporting period include our marketable securities. There were no fair value measurements with respect to nonfinancial assets or liabilities that are recognized or disclosed at fair value in our consolidated financial statements on a recurring basis in 2008. SFAS 157 as it relates to fair value measurement requirements for non-financial assets and liabilities that are not remeasured at fair value on a recurring basis is effective for 2009. The adoption of SFAS 157 did not and is not expected to have a significant impact on our financial condition, results of operations or cash flows.The following table presents information about our financial assets and liabilities that are measured at fair value on a recurring basis as of December 31, 2008, and indicates the fair value hierarchy of the valuation techniques utilized to determine such fair value. The hierarchy is broken down into three levels. Level 1 inputs are quoted prices (unadjusted) in active markets for identical assets or liabilities. Level 2 inputs include data points that are observable such as quoted prices for similar assets or liabilities in active markets, quoted prices for identical or similar assets or liabilities in markets that are not active, and inputs (other than quoted prices) such as interest rates and yield curves that are observable for the asset or liability, either directly or50indirectly. Level 3 inputs are unobservable data pointsasset or liability,participant’s deferral account other than certain required performance unit award deferrals credited to the discretionary account, which will be distributed after the later of the date of the participant’s termination of employment of the date the participant attains age 62. Upon termination of a participant’s employment with the company, the plan requires a lump-sum distribution of the deferral account, excluding the required performance unit award deferrals, unless the participant had elected an installment distribution. Upon a participant’s death, the plan provides that a participant’s distributions accelerate and include situations where there is little, if any, market activity for the asset or liability.
of December 31,Our investment in short-term marketable securities iswill be paid in a mutual fundlump sum to the participant’s beneficiary. We may terminate the plan and accelerate distributions to participants, but only to the extent and at the times permitted under the Internal Revenue Code. We may terminate the plan and accelerate distributions upon a change in control, which is valued daily based upon quoted prices innot a payment event under the plan. In conjunction with the approval of the plan, our Board of Directors also adopted an active market. receivable, direct financing leases receivable and accounts payable approximate fair value because of the short maturity of these instruments. The faircarrying value of our total long-term debt is estimated to be $2.9 million at December 31, 2008, and $45.0 million at December 31, 2007. Theapproximates fair value was estimated by discounting future cash flows usingas the credit facility bears interest based upon a current borrowing rate for similar long-term debt instruments.10.variable interest rate.$3.5$9.4 million of new revenue equipment in 2009;2011; (b) building construction expenditures of $2.2$2.9 million in 2009;2011; and (c) operating lease obligation expenditures totaling $1.1 million through 2013.operations.11.operations, but could be material to the results of any individual period.Our presentation includesreportablereporting segments — Truckload(Truckload and Logistics.Logistics) for financial reporting purposes. The primary source of our operating revenue is truckload revenue, which we generate by transporting freight for our customers and report within our Truckload segment. Generally, we are paid by the mile for our services. We also derive truckload revenue from fuel surcharges, loading and unloading activities, equipment detention and other ancillary services.51MARTEN TRANSPORT, LTD.Notes to Consolidated Financial Statements (Continued)operating income and operating ratioincome by segment. We do not prepare separate balance sheets by segment and, as a result, assets are not separately identifiable by segment.(1) Logistics revenue is net of $16.8 million, $17.1 million and $16.5 million of inter-segment revenue in 2008, 2007 and 2006, respectively, for loads transported by our tractors and arranged by MWL that have been eliminated in consolidation.(2) Operating expenses as a percentage of operating revenue. 2010 2009 2008 Operating revenue: Truckload revenue, net of fuel surcharge revenue $ 325,791 $ 346,983 $ 384,264 Truckload fuel surcharge revenue 66,973 49,812 123,922 Total Truckload revenue 392,764 396,795 508,186 115,223 103,166 90,194 Intermodal fuel surcharge revenue 8,933 5,913 8,719 Total Logistics revenue 124,156 109,079 98,913 Total operating revenue $ 516,920 $ 505,874 $ 607,099 Operating income: Truckload $ 28,680 $ 22,827 $ 26,055 Logistics 6,609 6,532 6,650 Total operating income $ 35,289 $ 29,359 $ 32,705 (1) Logistics revenue is net of $9.1 million, $10.2 million and $16.8 million of inter-segment revenue in 2010, 2009 and 2008, respectively, for loads transported by our tractors and arranged by MWL that have been eliminated in consolidation. 2008,2010, more than 99% of our revenue was generated within the United States. We earned 18% and 10% of our revenue in 2010 from two single customers whose trade receivables represented 11% and 12%, respectively, of our trade receivables as of December 31, 2010. We earned 20% and 12% of our revenue in 2009 from two single customers whose trade receivables represented 11% and 16%, respectively, of our trade receivables as of December 31, 2009. We earned 19% and 10% of our revenue in 2008 from two single customers whose trade receivables represented 16% and 10%, respectively, of our trade receivables as of December 31, 2008. We earned 18% of our revenue in 2007 from a single customer whose trade receivables represented 12% of our trade receivables as of December 31, 2007. We earned 17% of our revenue in 2006 from a single customer.5212.20082010 and 2007:The diluted earnings per common share for the 2008 quarters exceeds the diluted earnings per common share for the year due to differences in rounding.53 First Second Third Fourth Operating revenue $ 125,812 $ 125,862 $ 128,674 $ 136,572 Operating income 7,034 9,193 9,986 9,076 Net income 3,892 5,158 5,482 5,210 Basic earnings per common share 0.18 0.24 0.25 0.24 Diluted earnings per common share 0.18 0.23 0.25 0.24 First Second Third Fourth Operating revenue $ 121,955 $ 125,804 $ 129,395 $ 128,720 Operating income 7,251 7,503 6,536 8,069 Net income 4,053 4,477 3,472 4,265 Basic earnings per common share 0.19 0.20 0.16 0.19 Diluted earnings per common share 0.18 0.20 0.16 0.19 2008,2010, involving a change of accountants or disagreements on accounting and financial disclosure.ITEM 9A.CONTROLS AND PROCEDURESITEM 9A. CONTROLS AND PROCEDURES 2008.2010. There were no changes in our internal control over financial reporting that occurred during the period covered by this report that have materially affected, or that are reasonably likely to materially affect, our internal control over financial reporting. We intend to periodically evaluate our disclosure controls and procedures as required by the Exchange Act Rules.ITEM 9B. OTHER INFORMATION 54ITEM 10. DIRECTORS, EXECUTIVE OFFICERS AND CORPORATE GOVERNANCE A. Directors of the Registrant. B. Executive Officers of the Registrant. C. Compliance with Section 16(a) of the Exchange Act. D. Procedure for Director Nominations by Security Holders. E. Audit Committee Financial Expert. F. Identification of the Audit Committee. G. Our Code of Ethics for Senior Financial Management applies to all of our executive officers, including our principal executive officer, principal financial officer and controller, and meets the requirements of the Securities and Exchange Commission. We have posted our Code of Ethics for Senior Financial Management on our website at www.marten.com. We intend to disclose any amendments to and any waivers from a provision of our Code of Ethics for Senior Financial Management on our website within five business days following such amendment or waiver. ITEM 11. EXECUTIVE COMPENSATION Directors—Information About Nominees”Directors--Director Compensation,” “Compensation and “Election of Directors—Other Information About Nominees”Benefits” and “Compensation Discussion and Analysis” sections of our 20092011 Proxy Statement is incorporated in this Report by reference.B.Executive Officers of the Registrant.Information about our executive officers is included in this Report under Item 4A, “Executive Officers of the Registrant.”C.Compliance with Section 16(a) of the Exchange Act.The information in the “Section 16(a) Beneficial Ownership Reporting Compliance” section of our 2009 Proxy Statement is incorporated in this Report by reference.D.Procedure for Director Nominations by Security Holders.There have been no material changes to the procedures by which security holders may recommend nominees to our board of directors.E.Audit Committee Financial Expert.The information in the “Election of Directors—Board and Board Committees” section of our 2009 Proxy Statement is incorporated in this Report by reference.F.Identification of the Audit Committee.The information in the “Election of Directors—Board and Board Committees” section of our 2009 Proxy Statement is incorporated in this Report by reference.G.Code of Ethics for Senior Financial Management.Our Code of Ethics for Senior Financial Management applies to all of our executive officers, including our principal executive officer, principal financial officer and controller, and meets the requirements of the Securities and Exchange Commission. We have posted our Code of Ethics for Senior Financial Management on our website at www.marten.com. We intend to disclose any amendments to and any waivers from a provision of our Code of Ethics for Senior Financial Management on our website within five business days following such amendment or waiver.55ITEM 12. SECURITY OWNERSHIP OF CERTAIN BENEFICIAL OWNERS AND MANAGEMENT AND RELATED STOCKHOLDER MATTERS ITEM 11.EXECUTIVE COMPENSATIONThe information in the “Election of Directors—Director Compensation” and “Compensation and Other Benefits” sections of our 2009 Proxy Statement is incorporated in this Report by reference.ITEM 12.SECURITY OWNERSHIP OF CERTAIN BENEFICIAL OWNERS AND MANAGEMENT AND RELATED STOCKHOLDER MATTERSBenefits—EquityBenefits--Equity Compensation Plan Information” sections of our 20092011 Proxy Statement is incorporated in this Report by reference.ITEM 13.CERTAIN RELATIONSHIPS AND RELATED TRANSACTIONS, AND DIRECTOR INDEPENDENCEITEM 13. CERTAIN RELATIONSHIPS AND RELATED TRANSACTIONS, AND DIRECTOR INDEPENDENCE Directors—BoardDirectors--Board and Board Committees” sections of our 20092011 Proxy Statement is incorporated in this Report by reference.ITEM 14.PRINCIPAL ACCOUNTANT FEES AND SERVICESITEM 14. PRINCIPAL ACCOUNTANT FEES AND SERVICES 20092011 Proxy Statement is incorporated in this Report by reference.56(a) Page(a)1.Page Financial Reporting3233 Report of Independent Registered Public Accounting Firm 3320082010 and 2007342008, 20072010, 2009 and 20062008352008, 20072010, 2009 and 20062008362008, 20072010, 2009 and 200620083738—– Valuation and Qualifying Accounts and Reserves60576163 through 63.65. A copy of any of the exhibits listed will be sent at a reasonable cost to any shareholder as of March 10, 2009.8, 2011. Requests should be sent to James J. Hinnendael, Chief Financial Officer, at our corporate headquarters.(4) Form of Non-Statutory Stock Option Agreement for the 2005 Stock Incentive Plan. (4)Officers’ Compensation Summary.(5)20092011 Non-employee Director Compensation Summary.(6)(7)Agreement(8)Amended and Restated 2006 Executive Officer Incentive Bonus Plan.(9)Non-Driver Employee Performance Incentive Bonus Plan.(10)(11)(12)(12) Form of Indemnification Agreement. (13) Marten Transport, Ltd. Deferred Compensation Plan. (14) Form of Performance Unit Award Agreement. 5813, 2009By13, 2009,15, 2011, by the following persons on behalf of the Registrant and in the capacities indicated.59 Balance at Charged to Beginning of Costs and Balance at Description Year Expenses Deductions End of Year Insurance and claims accruals: $ 19,222 $ 24,892 $ (26,461 )(1) $ 17,653 21,386 28,695 (30,859 )(1) 19,222 17,431 37,271 (33,316 )(1) 21,386 Allowance for doubtful accounts: 245 (21 ) (54 )(2) 170 380 30 (165 )(2) 245 315 78 (13 )(2) 380 Revision of estimate(3) Write-off of bad debts, net of recoveries6020082010Item6110.410.4 Marten Transport, Ltd. 2005 Stock Incentive Plan Executive Officer Performance Incentive Bonus PlanIncorporated by reference to Exhibit 10.2 of the Company’s Current Report on Form 8-K filed April 4, 2006.10.7Non-Driver Employee Performance Incentive Bonus PlanIncorporated by reference to Exhibit 10.3 of the Company’s Current Report on Form 8-K filed April 4, 2006.10.810.910.1010.1110.12Amended and Restated 2006 Executive Officer Incentive Bonus PlanIncorporated by reference to Exhibit 10.3 of the Company’s Current Report on Form 8-K filed February 16, 2007.10.136210.1410.11 Second Amendment to Credit Agreement, effective as of November 30, 2007, by and among Marten Transport, Ltd., as borrower, the banks party thereto as lenders, and U.S. Bank National Association, as agent for the lenders 10.15Form of First Amendment to Amended and Restated Change in Control Severance Agreement Separation Agreement and Release, dated December 28, 2007 between the Company and Donald J. Hinson10.1510.18 of the Company’s Annual Report on Form 10-K for the year ended December 31, 20072008 (File No. 0-15010).10.162009 Non-Driver Employee Bonus Plan Incorporated by reference to Exhibit 10.19 of the Company’s Annual Report on Form 10-K for the year ended December 31, 2008 (File No. 0-15010). 10.14 Form of Indemnification Agreement Incorporated by reference to Exhibit 10.1 of the Company’s Current Report on Form 8-K filed February 22, 2010. 10.15 Named Executive Officers’Officer Compensation Summary10.16 Amendment to the Marten Transport, Ltd. 2005 Stock Incentive Plan Incorporated by reference to Exhibit 10.17 of the Company’s Quarterly Report on Form 10-Q for the quarter ended JuneSeptember 30, 20082010 (File No. 0-15010).Marten Transport, Ltd. Deferred Compensation Plan 2009Incorporated by reference to Exhibit 10.18 of the Company’s Quarterly Report on Form 10-Q for the quarter ended September 30, 2010 (File No. 0-15010). 10.18 Form of Performance Unit Award Agreement Incorporated by reference to Exhibit 10.19 of the Company’s Quarterly Report on Form 10-Q for the quarter ended September 30, 2010 (File No. 0-15010). 10.19 2011 Non-employee Director Compensation Summary 10.18Consent of KPMG LLP Form of First Amendment to Amended and Restated Change in Control Severance Agreement10.192009 Non-Driver Employee Bonus PlanFiled with this Report.23.1Consent of KPMG LLPFiled with this Report.31.163