Table of Contents
UNITED STATES
SECURITIES AND EXCHANGE COMMISSION
Washington, D.C. 20549
FORM 10-K
x ANNUAL REPORT PURSUANT TO SECTION 13 OR 15(d) OF THE SECURITIES EXCHANGE ACT OF 1934
x
| ANNUAL REPORT PURSUANT TO SECTION 13 OR 15(d) OF THE SECURITIES EXCHANGE ACT OF 1934
|
For the fiscal year ended September30, 20092011
or
o TRANSITION REPORT PURSUANT TO SECTION 13 OR 15(d) OF THE SECURITIES EXCHANGE ACT OF 1934 | TRANSITION REPORT PURSUANT TO SECTION 13 OR 15(d) OF THE SECURITIES EXCHANGE ACT OF 1934
|
Commission file number: 1-31371
Oshkosh Corporation
(Exact name of registrant as specified in its charter)
Wisconsin | | 39-0520270 |
(State or other jurisdiction of incorporation or organization) |
| (I.R.S. Employer Identification No.) |
|
|
|
P.O.Box 2566 Oshkosh, Wisconsin | | 54903-2566 |
(Address of principal executive offices) | | (Zip Code) |
Registrant’s telephone number, including area code: (920) 235-9151
Securities registered pursuant to Section12(b)of the Act:
Titleofeachclass | | Nameofeachexchangeonwhichregistered |
Common Stock ($.01 par value) | | New York Stock Exchange |
Securities registered pursuant to Section12(g)of the Act:None
Indicate by check mark if the registrant is a well-known seasoned issuer, as defined in Rule405 of the Securities Act. x Yes o No
Indicate by check mark if the registrant is not required to file reports pursuant to Section13 or Section15(d)of the Act. o Yes x No
Indicate by check mark whether the registrant (1)has filed all reports required to be filed by Section13 or 15(d)of the Securities Exchange Act of 1934 during the preceding 12 months (or for such shorter period that the registrant was required to file such reports), and (2)has been subject to such filing requirements for the past 90 days. x Yes o No
Indicate by check mark whether the registrant has submitted electronically and posted on its corporate Website, if any, every Interactive Data File requirerequired to be submitted and posted pursuant to Rule405 of Regulation S-T (§ 232.405 of this chapter) during the preceding 12 months (or for such shorter period that the registrant was required to submit and post such files). ox Yes o No
Indicate by check mark if disclosure of delinquent filers pursuant to Item 405 of Regulation S-K (§ 229.405 of this chapter) is not contained herein, and will not be contained, to the best of registrant’s knowledge, in definitive proxy or information statements incorporated by reference in PartIII of this Form10-K or any amendment to this Form10-K. o
Indicate by check mark whether the registrant is a large accelerated filer, an accelerated filer, a non-accelerated filer, or a smaller reporting company. See the definitions of “large accelerated filer,” “accelerated filer” and “smaller reporting company” in Rule12b-2 of the Exchange Act.
Large accelerated filer x | | Accelerated filer o |
| | |
Non-accelerated filer o (Do not check if a smaller reporting company)
| | Smaller reporting company o |
Indicate by check mark whether the registrant is a shell company (as defined in Rule12b-2 of the Act). o Yes x No
At March31, 2009,2011, the aggregate market value of the registrant’s Common Stock held by non-affiliates was $501,614,424$3,222,820,985 (based on the closing price of $6.74$35.38 per share on the New York Stock Exchange as of such date).
As of November 16, 2009, 89,462,65111, 2011, 91,421,701 shares of the registrant’s Common Stock were outstanding.
DOCUMENTS INCORPORATED BY REFERENCE:
Portions of the Proxy Statement for the 2012 Annual Meeting of Shareholders to be held on February 4, 2010 (to be filed with the Commission under Regulation 14A within 120 days after the end of the registrant’s fiscal year and, upon such filing, to be incorporated by reference into PartIII).
Table of Contents
OSHKOSH CORPORATION
FISCAL 20092011 ANNUAL REPORT ON FORM10-K
TABLE OF CONTENTS
Table of Contents
As used herein, the “Company”“Company,” “we,” “us” and “our” refers to Oshkosh Corporation and its consolidated subsidiaries. “Oshkosh” refers to Oshkosh Corporation, not including JLG Industries,Inc. and its wholly-owned subsidiaries (“JLG”), Pierce Manufacturing Inc. (“Pierce”), McNeilus Companies,Inc. (“McNeilus”) and its wholly-owned subsidiaries, Kewaunee Fabrications, LLC (“Kewaunee”), Medtec Ambulance Corporation (“Medtec”), JerrDan Corporation (“JerrDan”), Concrete Equipment Company,Inc. and its wholly-owned subsidiary (“CON-E-CO”), London Machinery Inc. and its wholly-owned subsidiary (“London”), BAI Brescia Antincendi International S.r.l. and its wholly-owned subsidiary (“BAI”), Oshkosh Specialty Vehicles Inc.(UK), Limited and AK Specialty Vehicles B.V. and theirits wholly-owned subsidiariessubsidiary (together, “OSV”“SMIT”) and Iowa Mold Tooling Co.,Inc. (“IMT”). “Oshkosh” refers to Oshkosh Corporation, not including JLG, Pierce, McNeilus, Kewaunee, Medtec, JerrDan, CON-E-CO, London, BAI, OSV, IMT or any other subsidiaries.
The “OshkoshÒ,” “JLGÒ,” “PierceÒ,” “McNeilusÒ,” “MEDTECÒ,” “Jerr-DanÒ,” “FrontlineÔ ;,” “SMITÔ,” “McNeilusÒ,” “CON-E-COÒ,” “LondonÒ,” “IMTÒ,” “SkyTrakÒ,” “LullÒ,” “ToucanÒ,” “LiftluxÒ,” “RevolutionÒ,” “Command ZoneÔ,” “All-SteerÒ,” “TAK-4Ò,” “HerculesÔ,” “HuskyÔ“ “VelocityÔ,” “ImpelÔ,” “Smart-PakÒ,” “PUCÔ,” “LiftpodÔ,” “ClearSkyÔ,” “Auto ReachÒ,” “Sky-ArmÒ,” “TerraMaxÔ“,” “SandCatÔ” and “ProPulseÒ” trademarks and related logos are trademarks or registered trademarks of the Company. All other product and service names referenced in this document are the trademarks or registered trademarks of their respective owners.
All references herein to earnings per share refer to earnings per share assuming dilution.dilution, unless noted otherwise.
For ease of understanding, the Company refers to types of specialty vehicles for particular applications as “markets.” When the Company refers to “market” positions, these comments are based on information available to the Company concerning units sold by those companies currently manufacturing the same types of specialty vehicles and vehicle bodies and are therefore only estimates. Unless otherwise noted, these market positions are based on sales in the United States of America. There can be no assurance that the Company will maintain such market positions in the future.
Cautionary Statement About Forward-Looking Statements
The Company believes that certain statements in “Business” and “Management’s Discussion and Analysis of Financial Condition and Results of Operations” and other statements located elsewhere in this Annual Report on Form10-K are “forward-looking statements” within the meaning of the Private Securities Litigation Reform Act of 1995. All statements other than statements of historical fact included in this report, including, without limitation, statements regarding the Company’s future financial position, business strategy, targets, projected sales, costs, earnings, capital expenditures, debt levels and cash flows, and plans and objectives of management for future operations, including those under the caption “Executive Overview” in “Management’s Discussion and Analysis of Financial Condition and Results of Operations”Operations,” are forward-looking statements. When used in this Annual Report on Form10-K, words such as “may,” “will,” “expect,” “intend,” “estimate,” “anticipate,” “believe,” “should,” “project” or “plan” or the negative thereof or variations thereon or similar terminology are generally intended to identify forward-looking statements. These forward-looking statements are not guarantees of future performance and are subject to risks, uncertainties, assumptions and other factors, some of which are beyond the Company’s control, which could cause actual results to differ materially from those expressed or implied by such forward-looking statements. Additional information concerning factors that could cause actual results to differ materially from those in the forward-looking statements is contained in Item 1A of PartI of this report.
All forward-looking statements, including those under the caption “Executive Overview” in “Management’s Discussion and Analysis of Financial Condition and Results of Operations,” speak only as of November 18, 2009.16, 2011. The Company assumes no obligation, and disclaims any obligation, to update information contained in this Annual Report on Form10-K. Investors should be aware that the Company may not update such information until the Company’s next quarterly earnings conference call, if at all.
Table of Contents
PARTI
ITEM 1.BUSINESS
The Company
The Company is a leading designer, manufacturer and marketer of a broad range of specialty vehicles and vehicle bodies. The Company partners with customers to deliver superior solutions that safely and efficiently move people and materials at work, around the globe, and around the clock. The Company began business in 1917 and was among theas an early pioneerspioneer of four-wheel drive technology.technology, and off road mobility technology remains one of its core competencies. The Company currently operates in four business segments:reportable segments for financial reporting purposes: defense, access equipment, fire& emergency and commercial, which comprised 49%57%, 20%26%, 21%10% and 10%7%, respectively, of the Company’s consolidated net sales duringin fiscal 2009.2011. The Company made approximately 56%, 72% and 53% of its net sales for fiscal 2011, 2010 and 2009, respectively, to the U.S. government, a substantial majority of which were under multi-year contracts and programs in the defense vehicle market. See Note 23 to the Consolidated Financial Statements for financial information related to the Company’s business segments.
The Company’s defense segmentCompany has sold products to the U.S. Department of Defense (“DoD”) for over 80 years.years and operates its military tactical wheeled vehicles business as its defense segment. In 1981, Oshkosh was awarded the first Heavy Expanded Mobility Tactical Truck (“HEMTT”) contract for the DoD, and quicklythereafter its defense segment developed into the DoD’s leading supplier of severe-duty, heavy-payload tactical trucks. In recent years, the CompanyOshkosh has broadened its defense product offerings to become the leading manufacturer of severe-duty, heavy- and medium-payload tactical trucks for the DoD, manufacturing vehicles that perform a variety of demanding tasks such as hauling tanks, missile systems, ammunition, fuel, troops and cargo for combat units.
In June2009, the DoD awarded the Company a sole source contract for 2,244 MRAP All Terrain Vehicles (“M-ATVs”) and associated aftermarket parts packages, valued at $1.06 billion. Through November 18, 2009, the DoD awarded the Company an additional 3,975 M-ATVs and associated aftermarket parts packages, valued at $2.23 billion. Unit deliveries under the contract are scheduled through April 2010, with aftermarket parts packages to be delivered through May 2010. Key attributes of the M-ATV include superior survivability and mobility required for the current conflict in Afghanistan. The M-ATV represents, the Company’s first major entry into the market for vehicles used in small unit combat operations.
light tactical vehicles. In August2009, the DoD awarded the Company a five-year requirements contract valued at $280.9 million for the production and delivery of 2,571 trucksmedium-payload tactical vehicles and trailers as well as supporting services and engineering under the U.S. Army’s Family of Medium Tactical Vehicles (“FMTV”) Rebuy program. The FMTV Rebuy program is a five-year requirements contract award for the production of up to 23,000 medium-payload tactical vehicles and trailers as well as support services and engineering. Competitors have filed protests with the Government Accountability Office (“GAO”) regarding the award of the FMTV contract, and the DoD has issued a stop work order on the FMTV program pending resolution of the protests. The Company expects the GAO to issue its decision on the protests in December 2009.
In fiscal 2009,2007, the Company received orders totaling $195 million to retrofit approximately 2,400 Mine Resistant Ambush Protected (“MRAP”) vehicles originally manufactured by other companies for the DoD with the Company’s patented TAK-4 independent suspension system. The Company is actively supporting the engineering and testing for retrofit installationacquired JLG, a global manufacturer of TAK-4 under other MRAP models that could lead to additional TAK-4 sales in the future. The existing MRAP fleet maintained by the U.S. military consists of over 16,000 vehicles.
The Company’s access equipment segment manufactures aerial work platforms and telehandlers used in a wide variety of construction, agricultural, industrial, institutional and general maintenance applications to position workers and materials at elevated heights. AccessJLG forms the base of the Company’s access equipment segment. JLG’s customers include equipment rental companies, construction contractors, manufacturing companies, home improvement centers and the U.S. military. The access equipment segment also includes Jerr-Dan branded tow trucks (“wreckers”) and roll-back vehicle carriers (“carriers”) sold to towing companies in the U.S. and abroad.
The Company’s fire& emergency segment manufactures commercial and custom firefighting vehicles and equipment, aircraft rescue and firefighting (“ARFF”) vehicles, snow removal vehicles, ambulances wreckers, carriers and other emergency vehicles primarily sold to fire departments, airports and other governmental units and towing companies in the U.S.Americas and abroad; mobile medical trailers sold to hospitals and third-party medical service providers in the U.S., Europe and a growing number of other regions;Europe; and broadcast vehicles sold to broadcasters and television stations in North Americathe Americas and abroad. In October 2009, the Company sold its 75% interest in its European fire apparatus business, BAI.
The Company’s commercial segment manufactures rear- and front-discharge concrete mixers, refuse collection vehicles, portable and stationary concrete batch plants and vehicle components sold to ready-mix companies and commercial and municipal waste haulers in North America and other international markets and field service vehicles and truck-mounted cranes sold to mining, construction and other companies in the U.S.Americas and abroad. On July 1, 2009, the Company completed
1
Table of Contents
the sale of its European refuse collection vehicle business, Geesink Group B.V., Norba A.B. and Geesink Norba Limited and their wholly-owned subsidiaries (together, “Geesink”). Geesink has been reflected as a discontinued operation in this Form 10-K.
See Note 21 to the Consolidated Financial Statements for financial information related to the Company’s business segments.
Competitive Strengths
The following competitive strengths support the Company’s business strategy:
Strong Market Positions. The Company has developed strong market positions and brand recognition in its core businesses, which it attributes to its reputation for quality products, advanced engineering, innovation, vehicle performance, reliability, customer service and low total product life cycle costs. The Company maintains leading market shares in most of its businesses and is the sole-source supplier of a number of vehicles to the DoD, including M-ATVs.DoD.
1
Table of Contents
Diversified Product Offering. The Company believes its broad product offerings and target markets serve to diversify its sources of revenues, mitigate the impact of economic cycles and provide multiple platforms for potential internalorganic growth and acquisitions. The Company’s product offerings provide extensive opportunities for bundling of products for sale to customers, co-location of manufacturing, leveraging purchasing power and sharing technology within and between segments. For each of its target markets, the Company has developed or acquired a broad product line in an effort to become a single-source provider of specialty vehicles, vehicle bodies, parts and service and related products to its customers. In addition, the Company has established an extensive domestic and international distribution system for specialty vehicles and vehicle bodies tailored to each market.
Quality Products and Customer Service. The Company has developed strong brand recognition amongfor its products as a result of its commitment to meet the stringent product quality and reliability requirements of its customers andin the specialty vehicle and vehicle body markets it serves. The Company frequently achieves premium pricing due to the durability and low life cycle costs for its products. The Company also achieves high quality customer service through its extensive parts and service support programs, which are generally available to domestic customers 365days a year in all product lines throughout the Company’s distribution systems.
Innovative and Proprietary Components. The Company’s advanced design and engineering capabilities have contributed to the development of innovative and/or proprietary, severe-duty components that enhance vehicle performance, reduce manufacturing costs and strengthen customer relationships. The Company’s advanced design and engineering capabilities have also allowed it to integrate many of these components across various product lines, which enhances its ability to compete for new business and reduces its costs to manufacture its products compared to manufacturers who simply assemble purchased components. Examples of the Company’s innovative components include:
· The TAK-4 independent suspension system, which the Company is able to installuses on multiple vehicle platforms in its defense and fire& emergency segments and which it installs on other manufacturers’ MRAP vehicles andMine Resistant Ambush Protected (“MRAP”) vehicles;
·The Command Zone multiplexing technology which the Company believes was criticalhas applied to the Company winning the M-ATV contract;numerous products in each of its segments to control, monitor and diagnose electronic components;
· The Pierce Ultimate Configuration (“PUC”) vehicle configuration, which eliminates the bulky pumphouse from firefighting vehicles, making such vehicles easier to use and service;
· McNeilusThe pulse technology on the Company’s new Global Striker, which allows the customer to deliver dry chemical powder 90 feet;
·The integration of compressed natural gas-poweredgas to power McNeilus’ refuse collection vehicles and concrete mixers, which reducereduces fuel costs and emissions; and
· ClearSky telematics solution for JLG aerial work platforms, which remotely connects a rental fleet, providing information on location, operating status and equipment health.
Flexible and Efficient Manufacturing. Over the past 13 15years, the Company has significantly increased manufacturing efficiencies. The Company believes it has competitive advantages over larger vehicle manufacturers in its specialty vehicle markets due to its manufacturing flexibility, vertical integration, purchasing power in specialty vehicle components and custom fabrication capabilities. In addition, the Company believes it has competitive advantages over smaller vehicle and vehicle body manufacturers due to its relatively higher volumes of similar products that permit the use of moving assembly lines and which allow it to leverage purchasing power and technology opportunities across product lines. The Company believes its plan to meet the aggressive delivery requirements for M-ATVs under the recently awarded DoD contract is an example of its robust manufacturing capability. In addition to the Company’s existing defense truck manufacturing facilities in Oshkosh, Wisconsin, the Company is assembling M-ATV crew capsules and complete M-ATVs at its JLG manufacturing facility in McConnellsburg, Pennsylvania.
2
Table of Contents
Strong Management Team. The Company is led by ChairmanPresident and Chief Executive Officer Robert G. Bohn, and President and Chief Operating Officer,(“CEO”) CharlesL. Szews who havehas been employed byan executive of the Company since 1992 and 1996, respectively. Messrs. Bohn and 1996. Mr.Szews areis complemented by an experienced senior management team that has been assembled through internal promotions, new hires and acquisitions. The management team has successfully executed a strategic reshaping and expansion of its business since 1996, which has positioned the Company to significantly improve its financialbe a global leader in the specialty vehicle and operating performance.vehicle body markets.
2
Table of Contents
Business Strategy
The Company is focused on increasing its net sales, profitability and cash flow and strengthening its balance sheet by capitalizing on its competitive strengths and pursuing a comprehensive,an integrated business strategy. Key elementsThe Company completed a comprehensive strategic planning process in fiscal 2011 that culminated in the creation of the Company’s business strategy include:roadmap, named MOVE, to deliver superior long-term growth and earnings for its shareholders. The Company’s MOVE roadmap consists of four key strategies:
Pursuing Global GrowthMarket Recovery and Profitability.Growth. The Company believes that many of its non-defense markets will begin to recover after fiscal 2012. The Company plans to capture and improve its historic share of a market recovery. A number of the markets in which the Company participates are down anywhere from 40% to more than 90% from peak levels, some since 2007, and vehicle fleets continue to age. The Company is working to improve its sales, inventory and operations planning and sales capture processes to more effectively respond to customers’ needs when the recovery occurs in each of its markets. Also, throughout the extended period of weak economic conditions, the Company has continued to focus on staying close to its customers and providing high quality customer service through its extensive parts and service support programs, which are generally available to customers 365 days a year in all product lines throughout the Company’s distribution systems.
Optimize Cost and Capital Structure. The Company plans to continueoptimize its focus on those specialty vehiclecost and vehicle body markets where it has or can acquire strong market positions over time and where it believes it can leverage synergies in purchasing, manufacturing, technology and distribution to increase sales and profitability. As it focuses in the near-term on ramping up production to meet the delivery requirements of the recently awarded M-ATV and TAK-4 independent suspension contracts, the Company will continue to pursue follow-on orders and additional contracts from its largest customer, the DoD. Business development teams actively pursue new customers, including those in adjacent markets. In addition, the Company believes that opportunities exist to develop or increase distribution of its products, particularly in the access equipment segment, in global markets including developing countries in Asia, Eastern Europe, the Middle East and Latin America. After it accomplishes its plan to significantly reduce debt, the Company intends to selectively pursue strategic acquisitions, both domestically and internationally, to enhance the Company’s product offerings and expand its international presence in specialty vehicle and vehicle body markets.
Introducing New Products. The Company intends to maintain its emphasis on new product development as it seeks to expand sales by leading its core markets in the introduction of new or improved products and new technologies, through internal development, strategic acquisitions or licensing of technology. The Company actively seeks to commercialize emerging technologies that are capable of expanding customer uses of its products.
Providing Superior Quality and Service to Each Market. The Company generally sells premium product lines in each of its markets and seekscapital structure to provide superior qualityvalue for customers and service in each market to sustainshareholders by aggressively attacking its premium product positioning. In times of weak economic conditions, the Company believes that providing superior quality and service is even more important as customers look to partner with suppliers they know will be there to help them through tough conditions. Each of the Company’s businesses maintains active programs involving customer outreach, design and manufacturing quality and supplier certification to assure superior product quality.
Focusing on Lean Operations. The Company seeks to deliver high performance products to customers at both low total product life cycle costs and low acquisition prices.operating costs. Historically, the Company has utilized teams of industrial engineers and procurement specialists to re-engineer manufacturing processes and leverage purchasing volumes to meet these objectives. The Company also utilizes a comprehensive, lean enterprise focus to continue its drive to be a low cost producer in all of its product lines and to deliver low product life cycle costs for its customers. Lean is a methodology to eliminate non-value added work from a process stream. During the last few years, the Company has implemented this strategy by:
· Consolidating its manufacturing footprint resulting in a 20% reduction in manufacturing facilities since 2008 with plans to further optimize its footprint;
·Combining the Company’s strategic purchasing teams globally into a single organization led by an externally recruited chief procurement officer to capture its full purchasing power across its businesses and to promote low cost country sourcing;
· Utilizing integrated project teams to reduce product costs for the FMTV program and other key products;
·Creating chartered cost reduction teams at all businesses and introducing broad-based training programs;
· Creating a new global manufacturing team to leverage manufacturing synergies across its segments and further promote quality and lean initiatives;
·Creating a quality management system to drive enhanced quality throughout all of the Company’s businesses resulting in satisfied customers and a lower cost of quality; and
· Launching the Oshkosh Operating System (“OOS”) to create common practices across the Company to enhance its performance. The OOS is a system of doing business that is focused on serving and delighting customers by utilizing continuous improvement and lean practices. The Company believes that the OOS enables it to sustain superior performance for its customers, shareholders, employees and other stakeholders.
As a result of this focus, the Company expects to more efficiently utilize its manufacturing facilities, increase inventory turns and reduce product costs, manufacturing lead times and new product development cycle times over the next several years. The Company believes that by optimizing its cost structure it will be able to continue to reduce its outstanding debt.
Value Innovation. The Company intends to maintain its emphasis on new product development as it seeks to expand sales and margins by leading its core markets in the introduction of new or improved products and new technologies. Internal development, licensing of technology and strategic acquisitions are utilized to execute multi-generational product plans in each of the Company’s businesses. The Company actively seeks to commercialize emerging technologies that are capable of expanding customer uses of its products.
3
Table of Contents
Focusing on Cost Management and Debt Reduction. In light of significantly lower demand in certainExamples of the Company’s businesses asinnovative components include:
·The TAK-4 independent suspension system, which the Company uses on multiple vehicle platforms in its defense and fire& emergency segments and which it installs on other manufacturers’ MRAP vehicles;
·The Dash Cab Forward, which is a resultnew fire fighting vehicle featuring an innovative tilting cab-forward design that repositions the engine rearward and lower between the frame rails, with an open interior configuration that helps firefighters to better prepare for the unexpected situations they face when arriving on the scene of the global recession, fluctuating steela fire or other emergency situation;
·The integration of compressed natural gas to power McNeilus’ refuse collection vehicles and otherconcrete mixers, which reduces fuel costs and its significant leverage, theemissions; and
·The Light Combat All Terrain Vehicle (“L-ATV”), which incorporates field-proven technologies, advanced armor solutions and expeditionary levels of mobility to redefine safety and performance standards.
Emerging Market Expansion. The Company plans to continue its expansion into those specialty vehicle and vehicle body markets globally where it has or can acquire strong market positions over time and where it believes it can leverage synergies in purchasing, manufacturing, technology and distribution to focus on cost managementincrease sales and reduction as well as generating cash for debt reduction.profitability. Business development teams actively pursue new customers in targeted developing countries in Asia, Eastern Europe, the Middle East and Latin America. In late fiscal 2008 and fiscal 2009,pursuit of this strategy, the Company quickly and proactively took actions, including reducing its global workforce by approximately 20% and cutting discretionary spending, which resultedopened a 193,000 square foot facility in significant overhead and operating cost reductions. The Company expects to continue to focus on cost reduction initiativesTianjin, China in fiscal May 2010 to produce JLG access equipment for the Asian market. In fiscal 2011, the Company commenced concrete mixer manufacturing in Brazil and opened new sales and service offices in Russia,India, Saudi Arabia and China to pursue various opportunities in each of those countries. After the Company accomplishes its plan to further reduce its cost structuredebt, it would also consider selectively pursuing strategic acquisitions, primarily internationally, to enhance the Company’s product offerings and accelerate debt reduction, even as the Company is currently adding toexpand its workforce to appropriately staff for the M-ATV contract. The Company has also focused significant attention on reducing working capital to free up cash for debt reduction, primarily through tighter controls over productioninternational presence in specialty vehicle and inventory reduction programs.vehicle body markets.
Products
The Company is focused on the following core segments of the specialty vehicle and vehicle body markets:
Defense Segment.segment. The Company has sold products to the DoD for over 80years. The Company also exports tactical trucks to approved foreign customers. By successfully responding to the DoD’s changing vehicle requirements, the Company has become the leading manufacturer of severe-duty, heavy- and medium-payload tactical trucks for the DoD.DoD and is rapidly expanding its portfolio of light-payload tactical trucks. The Company manufactures vehicles that perform a variety of demanding tasks such as hauling tanks, missile systems, ammunition, fuel, troops and cargo for combat units. The Company’s proprietary military all-wheel drive product line of heavy-payload tactical trucks includes the HEMTT, the Heavy Equipment Transporter (“HET”), the Palletized Load System (“PLS”), the Common Bridge Transporter and the Logistic Vehicle System Replacement (“LVSR”). The Company’s proprietary military medium-payload tactical trucks include the Medium Tactical Vehicle Replacement (“MTVR”), the FMTV and the Medium Tactical Truck (“MTT”), a line of lower-cost, severe-duty, medium-payload tactical trucks suitable for less demanding requirements than the MTVR. The Company’s proprietary M-ATV and related variants is the Company’s first major entry into the light tactical vehicle market. The M-ATV was specially designed with superior survivability as well as extreme off-road mobility for use in small unit combat operations for the current conflict in Afghanistan. The defense segment also makes a multi-role light tactical vehicle, the SandCat. The SandCat is designed for high-speed, highly-protected, highly-maneuverable operations. It can be configured to fit various missions including, special operations, homeland defense, law enforcement and peace-keeping. In October2011, the Company introduced the L-ATV to continue to expand its light tactical vehicle offering. The affordable L-ATV incorporates field-proven technologies, advanced armor solutions and expeditionary levels of mobility to redefine safety and performance standards for the U.S. Armed Forces and international militaries. The L-ATV also exports severe-duty, heavy-is designed for future growth, with the ability to accept additional armor packages and medium-payload tactical trucks to approved foreign customers.technology upgrades as the mission requires.
In May 2006, the DoD awarded the Company a production contract for the LVSR vehicle and associated manuals, vehicle kits, test support and training for the U.S. Marine Corps. The Company estimates that this fixed-price indefinite delivery, indefinite quantity (“ID/IQ”) contract will approximate $740.2 million based on a production quantity of 1,592 units over a six-year period. The contract allows for the purchase of up to 1,900 cargo, wrecker and fifth-wheel LVSR variants. The Company delivered the first units under the contract in fiscal 2007.
In October 2008, the DoD awarded the Company a three-year, firm, fixed-priced requirements contract for the continued production of the Family of Heavy Tactical Vehicles (“FHTV”). To date, the Company has received orders totaling $3.1 billion under this contract. The contract includes the production of the HEMTT, HEMTT-ESP, PLS and PLS Trailer as well as associated logistics and configuration management support. The FHTV contract expired in September2011, with expected vehicle deliveries to continue through March2013. The Company is in negotiations with the U.S. Army regarding a bridge contract for the FHTV program under which it would continue producing FHTVs while the U.S. Army develops a path to conduct an open competition for the next contract relating to this program. The bridge contract could include the purchase of the design rights to the Company’s vehicles under this contract so that the U.S. Army could compete the program.
4
Table of Contents
In June 2009, the DoD awarded the Company a sole source contract for 2,244 M-ATVs and associated aftermarket parts packages, valued at $1.06 billion. Through November 18, 2009, the DoD awardedpackages. During fiscal 2011 and 2010, the Company an additional 3,975delivered M-ATVs and related aftermarket parts & service under the contract with a combined sales value of $1.25 billion and $4.49 billion, respectively. As of September 30, 2011, the defense segment had approximately $556 million of backlog related to the M-ATV program, including 441 vehicles. The Company expects that it will complete deliveries, under orders it has to date, of M-ATVs by November 2011 and associated aftermarket parts packages, valued at $2.23 billion. Unit deliveries under the contract are scheduled through April 2010, with aftermarket parts packagesby July 2012. The Company is actively marketing M-ATVs to be delivered through May 2010. Key attributes of the M-ATV include superior survivability and mobility required for the current conflict in Afghanistan. The M-ATV represents the Company’s first major entry into the market for vehicles used in small unit combat operations, which presents an opportunity to broaden and strengthen the Company’s defense business.approved foreign customers.
In August 2009, the DoD awarded the Company a contract valued at $280.9 million forto be the production and deliverysole producer of 2,571 trucks and trailersFMTVs under the U.S. Army’s FMTV Rebuy program. The FMTV Rebuy program is a five-year requirements contract award for the production of up to 23,000 vehicles and trailers as well as support services and engineering. Competitors have filed protests withthrough December 2015. After a lengthy protest period, the GAO regardingCompany began delivery of vehicles under this contract in the awardfirst quarter of the FMTV contract, and the DoD has issued a stop work order on the FMTV program pending resolution of the protests.fiscal2011. The Company expects the GAO to issue its decision on the protestshas received orders totaling $3.5billion under this contract, of which more than $2.8 billion remained in December 2009. The Company believes the U.S. Army conducted a fair and objective source selection process and believes that the contract award to the Company should be upheld. This contract would represent a significant expansion of the Company’s medium-payload tactical truck business.backlog at September 30, 2011.
In fiscal 2009,addition to retaining its current defense truck contracts, the Company received orders totaling $195 million to retrofit approximately 2,400 MRAP vehicles originally manufactured by other companies for the DoD with the Company’s patented TAK-4 independent suspension system. The Company is actively supporting the engineering and testing for retrofit installation of TAK-4 under other
4
Table of Contents
MRAP models that could lead to additional TAK-4 sales in the future. The existing MRAP fleet maintained by the U.S. military consists of over 16,000 vehicles.
The Company’s objective is to continue to diversify into other areas of the U.S. and international defense truck markets by expanding applications, uses, and vehicle body styles of its current tactical truck lines. As the Company enters tactical truck competitions in the defense market segment, the Company believes it has multiple competitive advantages, including:
· Truck engineering and testingtesting.. DoD and international truck contract competitions require significant defense truck engineering expertise to ensure that a company’s truck excelsdesigns excel under demanding test conditions. The Company has a teamteams of engineers and draftsmen and engages contract engineers to support current business and truck contract competitions. These personnel have significant expertise designing new trucks, using sophisticated computer-aided tools, supporting grueling testing programs at test sites and submitting detailed, comprehensive, successful contract proposals.
· Proprietary componentscomponents.. The Company’s patented TAK-4 independent suspension and proprietary transfer case enhance its trucks’truck off-road performance. In addition, because these are two of the higher cost components in a truck, the Company has a competitive cost-advantagecost advantage based on the in-house manufacturing of these two truck components. The Company’s Command Zone tool also simplifies maintenance troubleshooting.
· Past performanceperformance.. The Company has been building trucks for the DoD for over 80 years. The Company believes that its past success in delivering reliable, high quality trucks on time, within budget and meeting specifications is a competitive advantage in future defense truck procurement programs. The Company understands the special contract procedures used by the DoD and other foreign militaries and has developed substantial expertise in contract management and accounting.
· Flexible manufacturingmanufacturing.. The Company’s ability to produce a variety of truck models on the same moving assembly line permits it to avoid facilitationnew facility costs on most new contracts and maintain competitive manufacturing efficiencies. In addition, the Company is able to leverage its global manufacturing scale to supplement its existing defense truck manufacturing facilities in Oshkosh, Wisconsin. The Company’s decision to co-locate M-ATV production at its JLG manufacturing facility in McConnellsburg, Pennsylvania during fiscal 2010 provided the Company a competitive advantage.advantage to ramp up production quickly.
· LogisticsLogistics.. The Company has gained significant experience in the development of operators’ manuals and training and in the delivery of parts and services worldwide in accordance with the DoD’s expectations, which differ materially from commercial practices. The Company has logistics capabilities to permit the DoD to order parts, receive invoices and remit payments electronically.
Access Equipment Segment.equipment segment. The access equipment segmentJLG manufactures aerial work platforms and telehandlers used in a wide variety of construction, agricultural, industrial, institutional and general maintenance applications to position workers and materials at elevated heights. JLG has recently introduced new products such as the LiftPod personal aerial work platform and the ClearSky telematics solution for use by rental companies in managing access equipment fleets. In addition, through a long-term license with Caterpillar, JLG entered into a 20-year license to produceproduces Caterpillar-branded telehandlers through 2025 for distribution through the worldwide Caterpillar Inc. dealer network.network through 2025.
Access equipment customers include equipment rental companies, construction contractors, manufacturing companies, home improvement centers and the U.S. military. JLG’s products are marketed in over 3,500 locations worldwide through independent rental companies and distributors that purchase these products and then rent or sell them and provide service support, as well as through other sales and service branches or organizations in which the Company holds equity positions.
5
Table of Contents
JLG through its wholly-owned subsidiary Access Financial Solutions, Inc., also arranges equipment financing and leasing solutions for its customers, primarily through private-label arrangements with independent third-party financial companies, and provides credit support in connection with these financing and leasing arrangements. Financing arrangements that JLG offers or arranges through this segment include installment sale contracts, capital leases, operating leases and rental purchase guarantees. Terms of these arrangements vary depending on the type of transaction, but typically range between 36 and 72 months and generally require the customer to be responsible for insurance, taxes and maintenance of the equipment, and to bear the risk of damage to or loss of the equipment.
The Company, through its Jerr-Dan brand, is a leading manufacturer and marketer of towing and recovery equipment in the U.S. The Company believes Jerr-Dan is recognized as an industry leader in quality and innovation. Jerr-Dan offers a complete line of both carriers and wreckers. In addition to manufacturing equipment, Jerr-Dan provides its customers with one-stop service for carriers and wreckers and generates revenue from the installation of equipment, as well as the sale of chassis and service parts.
Fire& Emergency Segment.emergency segment. Through Pierce, the Company is athe leading domestic manufacturer of fire apparatus assembled on custom chassis, designed and manufactured by Pierce to meet the special needs of firefighters. Pierce also manufactures fire apparatus assembled on commercially available chassis, which are produced for multiple end-customer applications. Pierce’s engineering expertise allows it to design its vehicles to meet stringent industry guidelines and
5
Table of Contents
government regulations for safety and effectiveness. Pierce primarily serves domestic municipal customers, but also sells fire apparatus to the DoD, airports, universities and large industrial companies, and in international markets. Pierce’s history of innovation and research and development in consultation with firefighters has resulted in a broad product line that features a wide range of innovative, high-quality custom and commercial firefighting equipment with advanced fire suppression capabilities. In an effort to be a single-source supplier for its customers, Pierce offers a full line of custom and commercial fire apparatus and emergency vehicles, including pumpers, aerial and ladder trucks, tankers, light-, medium- and heavy-duty rescue vehicles, wildland rough terrain response vehicles, mobile command and control centers, bomb squad vehicles, hazardous materials control vehicles and other emergency response vehicles.
The Company, through its Oshkosh brand, is among the leaders in sales of ARFF vehicles to domestic and international airports. These highly specializedhighly-specialized vehicles are required to be in service at most airports worldwide to support commercial airlines in the event of an emergency. Many of the world’s largest airports, including LaGuardia International Airport, O’Hare International Airport, Hartsfield-Jackson International Airport (Atlanta), Denver International Airport and Dallas/Fort Worth International Airport in the U.S. and airports located in Montreal and Toronto, Canada; and Shanghai, Hangzhou, and Beijing, China, and Dubai, United Arab Emirates, are served by the Company’s ARFF vehicles. The Company believes that the performance and reliability of its ARFF vehicles contribute to the Company’s strong position in this market.
The Company, through its Oshkosh brand, is a global leader in airport snow removal vehicles. The Company’s specially designed airport snow removal vehicles can cast up to 5,000 tons of snow per hour and are used by some of the largest airports in the world, including Denver International Airport, LaGuardia International Airport, Minneapolis-St. Paul International Airport and O’Hare International Airport in the U.S. and Beijing, China, Montreal, Canada and St. Petersburg, Russia internationally. The Company believes that the reliability of its high performance snow removal vehicles and the speed with which they clear airport runways contribute to its strong position in this market.
Through JerrDan, the Company is a leading manufacturer and marketer of towing and recovery equipment in the U.S. The Company, believes JerrDan is recognized as an industry leader in quality and innovation. JerrDan offers a complete line of both roll-back carriers (“carriers”) and traditional tow trucks (“wreckers”). In addition to manufacturing equipment, JerrDan providesthrough its customers with one-stop service for carriers and wreckers and generates revenue from the installation of equipment, as well as the sale of chassis and service parts.
Through Medtec the Companybrand, is one of the leading U.S. manufacturers of custom ambulances for private and public transporters and fire departments. Medtec markets a full line of ambulances including smaller Type II van style ambulances, larger Type I and Type III ambulances, as well as large “Additional Duty” ambulances. Type I ambulances feature a conventional style, light- or medium-duty chassis with a modular patient transport body mounted separately behind the vehicle cab. Type II ambulances are smaller van style ambulance units typically targeted to value conscious and transport ambulance services. Type III ambulances are built on light-duty van chassis with a walk-through opening into the patient transport body which is mounted behind the vehicle cab.
ThroughThe Company, through its OSV the Companyand SMIT brands, is one of the leaders in the manufacturingleading manufactures of mobile medical vehiclestrailers for North American and European medical centers and service providers. OSV is the only mobile medical vehicletrailer manufacturer certified by all major original equipment manufacturers of medical diagnostic imaging equipment - - General Electric Company, Royal Philips Electronics and Siemens AG. OSV is also a leading manufacturer, system designer and integrator of custom vehicles for the broadcast industry, where the Company, under its Frontline brand, markets a full line of television broadcast, satellite news gathering and microwave transmission electronic news gathering vehicles to broadcasters, TV stations, broadcast production, radio stations and NASA. OSV also manufactures mobile command and control centers and simulation units for sale to police forces, fire departments, the DoD and other government agencies in the U.S.
6
Table of Contents
The Company, through its Frontline brand, is a leading manufacturer, system designer and integrator of television broadcast, satellite news gathering and microwave transmission electronic news gathering vehicles for broadcasters, TV stations, broadcast production and radio stations in the Americas and abroad. The Company’s vehicles have been used to broadcast the NFL Superbowl, the FIFA World Cup and the Olympics.
The Company offers three- to fifteen-year municipal lease financing programs to its fire & emergency segment customers in the U.S. through Oshkosh Equipment Finance, L.L.C., doing business as Oshkosh Capital (“Oshkosh Capital”). Programs include competitive lease financing rates, creative and flexible finance arrangements and the ease of one-stop shopping for customers’ equipment and financing. The lease financing transactions are executed through a private label arrangement with an independent third-party finance company.
Commercial Segment.segment. Through McNeilus, the Company is a leading North American manufacturer of refuse collection vehicles for the waste services industry.industry throughout the Americas. Through Oshkosh, McNeilus, London and CON-E-CO, the Company is a leading manufacturer of front- and rear-discharge concrete mixers and portable and stationary concrete batch plants for the concrete
6
Table of Contents
ready-mix industry throughout the Americas. Through IMT, the Company is a leading North American manufacturer of field service vehicles and truck-mounted cranes for the construction, equipment dealer, building supply, utility, tire service and mining industries. The Company believes its commercial segment vehicles and equipment have a reputation for efficient, cost-effective, dependable and low maintenance operation.
In March 2002, the Company introduced the rear-discharge Revolution concrete mixer drum, which is constructed of lightweight composite materials. In fiscal 2006, the Company launched the sale of front-discharge Revolution drums. Since the introduction of the first concrete mixer drum about 90 years ago, the Company believes all commercially successful drums worldwide had been produced utilizing steel until the launch of the Revolution. The Revolution drum offers improved concrete payload on a vehicle and longer drum life, which lowers the cost per yard of concrete delivered. The Company’s strategy has been to sell the Revolution drum as a premium-priced product as the Company believes the Revolution drum yields a quick payback to customers through increased productivity and lower operating costs. The Company is required to pay to its Australian partner royalty fees for each drum sold. The Company believes that the Revolution mixer drum will create an important competitive advantage over competitors that manufacture steel concrete mixer drums during the next economic upturn.
The Company, through Oshkosh/McNeilus Financial Services Partnership (“OMFSP”), an affiliated financial services partnership, offers three- to seven-year tax advantaged lease financing to concrete mixer customers, concrete batch plant customers and commercial waste haulers in the U.S. Offerings include competitive lease financing rates and the ease of one-stop shopping for customers’ equipment and financing.
Marketing, Sales, Distribution and Service
The Company believes it differentiates itself from many of its competitors by tailoring its distribution to the needs of its specialty vehicle and vehicle body markets and with its national and global sales and service capabilities. Distribution personnel showdemonstrate to customers how to use the Company’s vehicles and vehicle bodies properly. In addition, the Company’s flexible distribution is focused on meeting customers on their terms, whether on a job site, in an evening public meeting or at a municipality’s offices, compared to the showroom sales approach of the typical dealers of large vehicle manufacturers. The Company backs all products with same-day parts shipment, and its service technicians are available in person or by telephone to domestic customers 365 days a year. The Company believes its dedication to keeping its products in-service in demanding conditions worldwide has contributed to customer loyalty.
The Company provides its salespeople, representatives and distributors with product and sales training on the operation and specifications of its products. The Company’s engineers, along with its product managers, develop operating manuals and provide field support at vehicle delivery.
U.S. dealers and representatives enter into agreements with the Company that allow for termination by either party generally upon 90 days notice.notice, subject to applicable laws. Dealers and representatives, except for those utilized by JLG JerrDan, Medtec and IMT as well as Medtec-branded products, are generally not permitted to market and sell competitive products.
Defense Segmentsegment.. The Company sells substantially all of its domestic defense products directly to principal branches of the DoD. The Company maintains a liaison office in Washington, D.C. to represent its interests with the Pentagon, Congress, and the offices of the Executive Branch of the U.S. government and other national government agencies.agencies and the Pentagon. The Company locates business development and engineering professionals near the principal U.S. Army and Marine Corps Commands that it serves. The Company also sells and services defense products to approved foreign governments directly through a limited number of international sales offices, through dealers, consultants and representatives and through the U.S. Foreign Military Sales (“FMS”) program.
The Company maintains a business development staff and engages consultants to regularly meet with all branches of the Armed Services, Reserves and National Guard, with representatives of key military bases and with other defense contractors to determine their vehicle requirements and identify specialty truck variants and apparatus required to fulfill their missions.
In addition to marketing its current truck offerings and competing for new contracts in the heavy- and medium-payloadtactical wheeled vehicle segment, the Company actively works with the Armed Services to develop new applications for its vehicles and expand its services.
Logistics services are increasingly important to the DoD, especially following the commencement of Operation Iraqi Freedom and Operation Enduring Freedom. The Company believes that its proven worldwide logistics capabilities and
7
Table of Contents
Logistics services are increasingly important to the DoD. The Company believes that its proven worldwide logistics capabilities and internet-based ordering, invoicing and electronic payment systems have significantly contributed to the expansion of its defense parts and service business since fiscal 2002, following the commencement of Operation Iraqi Freedom and Operation Enduring Freedom. The Company maintains a large parts distribution warehouse network in Milwaukee, Wisconsin to fulfill stringent parts delivery schedule requirements, as well as satellite facilities near DoD bases in the U.S., Europe, Asia and the Middle East. The Company has been particularly active in recent years performing maintenance and armoring services for the DoD at areas near or in the theater of military conflicts. On October 21, 2011, the President announced that virtually all U.S. troops will be removed from Iraq by the end of 2011. Further, plans exist regarding a future drawdown of U.S. military involvement in Afghanistan, although DoD officials have said that they expect to maintain approximately 40,000 U.S. troops stationed across the Middle East after the Iraq and Afghanistan troop drawdown. While the troop drawdown is likely to reduce the DoD’s requirements, the Company believes that its proven capabilities in logistical services will continue to provide it a competitive advantage.
Access Equipment Segmentequipment segment.. JLG’s products are marketed in over 3,500 locations worldwideacross six continents through independent rental companies and distributors that purchase JLG products and then rent or sell them and provide service support, as well as through other sales and service branches or organizations in which the Company holds equity positions. North American customers are located in all 50 states in the U.S., as well as in Canada and Mexico. International customers are located in Europe, the Asia/Pacific region, Australia, Africa, the Middle East and Latin America. JLG’s sales force is comprised of approximately 100140 employees worldwide. In North America, teams of salesSales employees are dedicated to specific major customers, channels or geographic regions. JLG’s international sales employees in Europe and the rest of the world are spread among JLG’s approximately 20 international sales and service offices.
JLG produces telehandlers under an exclusive license from Caterpillar Inc. and sells the Caterpillar-branded telehandlers to the worldwide Caterpillar distribution network through a dedicated JLG sales and service team. JLG also produces a line of telehandlers for the agricultural market under a license from SAME Deutz-Fahr and sells SAME Deutz-Fahr-branded telehandlers directly to SAME Deutz-Fahr’s dealer network.
JLG and an unaffiliated third-party are joint venture partners in RiRent Europe, B.V. (“RiRent”). RiRent maintains a fleet of access equipment for short-term lease to rental companies throughout most of Europe. The re-rental fleet provides rental companies with equipment to support short notice rental requirements. RiRent does not provide rental services directly to end users.
The Company markets its Jerr-Dan branded carriers and wreckers through its network of approximately 55 independent distributors.
Fire & Emergency Segmentemergency segment.. The Company believes the geographic breadth, size and quality of its Pierce fire apparatus sales and service organization are competitive advantages in a market characterized by a few large manufacturers and numerous small, regional competitors. Pierce’s fire apparatus are sold through over 30 independent sales and service organizations with more than 275 sales representatives in the U.S., and Canada, which combine broad geographical reach with frequency of contact with fire departments and municipal government officials. These sales and service organizations are supported by approximately 75 product and marketing support professionals and contract administrators at Pierce. The Company believes frequency of contact and local presence are important to cultivate major, and typically infrequent, purchases involving the city or town council, fire department, purchasing, finance and mayoral offices, among others, that may participate in a fire apparatus bid and selection. After the sale, Pierce’s nationwide local parts and service capability is available to help municipalities maintain peak readiness for this vital municipal service. Pierce also sells directly to the DoD and other U.S. government agencies. Many of the Pierce fire apparatus sold to the DoD are placed in service at U.S. military bases, camps and stations overseas. Additionally, Pierce sells fire apparatus to numerous international municipal and industrial fire departments through a network of international dealers. The Company markets its Frontline-branded broadcast vehicles through sales representatives and its Frontline-branded command vehicles through both sales representatives and dealer organizations that are directed at government and commercial customers.
The Company markets its Oshkosh-branded ARFF vehicles through a combination of five direct sales representatives domestically and 30over 60 representatives and distributors in international markets. Certain of these international representatives and distributors also handle Pierce products. The Company has over 30 full-time sales and service representatives and 2019 distributor locations focused on the sale of snow removal vehicles, principally to airports, but also to municipalities, counties and other governmental entities in the U.S. and Canada. In addition, the Company maintains offices in Dubai, United Arab EmiratesEmirates; Beijing, China; Moscow, Russia; and Beijing, ChinaSingapore to support airport product vehicle sales in the Middle East, China, Russia and Southeast Asia.
Medtec sells8
Table of Contents
The Company markets its Medtec-branded ambulances through more than 20 independent distributor organizations with over 70 representatives focused on sales to the U.S. ambulance market. JerrDanThe Company markets its carriers and wreckers through its worldwide network of approximately 75 independent distributors, supported by JerrDan’s direct sales force. OSV markets itsOSV-branded mobile medical trailers and broadcast vehicles through 20five in-house sales and service representatives in the U.S. and threeSMIT markets its mobile medical trailers through one in-house sales and service representativesrepresentative in Europe.Europe and one in-house sales and service representative in the Middle East.
Commercial Segmentsegment.. The Company operates 20 distribution centers with over 150140 in-house sales and service representatives in the U.S. to sell and service refuse collection vehicles, rear- and front-discharge concrete mixers and concrete batch plants. These centers are in addition to sales and service activities at the Company’s manufacturing facilities, and they provide sales, service and parts distribution to customers in their geographic regions. ThreeTwo of the distribution centers also have paint facilities and can provide significant additional paint and mounting services during peak demand periods. The Company also uses overapproximately 30 independent sales and service organizations to market its CON-E-CO branded concrete batch plants. The Company believes this network represents one of the largest concrete mixer, concrete batch plant and refuse collection vehicle distribution networks in the U.S.
In Canada, the Company operates two distribution centers with eight outside and in-house sales and service representatives to sell and service its rear-discharge concrete mixers, refuse collection vehicles and concrete batch plants.
The Company believes its direct distribution to customers is a competitive advantage in concrete mixer and refuse collection vehicle markets, particularly in the U.S. waste services industry where principal competitors distribute through dealers, and to a lesser extent in the ready mix concrete industry, where several competitors and the Company in part use dealers. The Company believes direct distribution permits a more focused sales force in the U.S. concrete mixer and refuse
8
Table of Contents
collection vehicle markets, whereas dealers frequently offer a very broad and mixed product line, and accordingly, the time dealers tend to devote to concrete mixer and refuse collection vehicle sales activities is limited.
With respect to distribution, the Company has been applying Oshkosh’s and Pierce’s sales and marketing expertise in municipal markets to increase sales of McNeilus refuse collection vehicles to municipal customers. While the Company believes commercial customers represent a majority of the refuse collection vehicle market, many municipalities purchase their own refuse collection vehicles. The Company believes it is positioned to create an effective municipal distribution system in the refuse collection vehicle market by leveraging its existing commercial distribution capabilities and by opening service centers in major metropolitan markets. During fiscal 2009, the Company received its first order for refuse collection vehicles from the city of New York, which the Company believes has the largest municipal refuse collection vehicle fleet in the U.S.
The Company also has established an extensive network of representatives and dealers throughout the Americas for the sale of Oshkosh, McNeilus, CON-E-CO and London concrete mixers, concrete batch plants and refuse collection vehicles. The Company coordinates among its various businesses to respond to large international sales tenders with its most appropriate product offering for the tender.
IMT distributes its products through approximately 10090 dealers with a total of 110 locations worldwide, including approximately 30 international dealers. International dealers are primarily located in Central and South America, Australia and Asia and are primarily focused on mining and construction markets. The Company believes this network represents one
McNeilus owns a 49% interest in Mezcladores Trailers de Mexico, S.A. de C.V. (“Mezcladoras”), a manufacturer of concrete mixers and small refuse collection vehicle bodies for distribution in Mexico and Latin America. McNeilus also owns a 45% interest in McNeilus Equipamentos Do Brasil LTDA (“McNeilus Brazil”). McNeilus Brazil manufactures and distributes McNeilus-branded concrete mixers and batch plants in the most extensive networks in its market.Mercosur region (Argentina, Brazil, Paraguay and Uruguay).
Manufacturing
As of November 18, 2009,16, 2011, the Company manufactures vehicles and vehicle bodies at 5142 manufacturing facilities. To reduce production costs, the Company maintains a continuing emphasis on the development of proprietary components, self-sufficiency in fabrication, just-in-time inventory management, improvement in production flows, interchangeability and simplification of components among product lines, creation of jigs and fixtures to ensure repeatability of quality processes, utilization of robotics, and performance measurement to assure progress toward cost reduction targets. The Company encourages employee involvement to improve production processes and product quality. The Company is in the process
9
Table of adopting lean manufacturing management practices across all facilities.Contents
The Company educates and trains all employees at its facilities in quality principles. The Company encourages employees at all levels of the Company to understand customer and supplier requirements, measure performance, develop systems and procedures to prevent nonconformance with requirements and produce continuous improvement in all work processes. ISO 9001 is a set of internationally acceptedinternationally-accepted quality requirements established by the International Organization for Standardization. ISO 9001 certification indicates that a company has established and follows a rigorous set of requirements aimed at achieving customer satisfaction by preventing nonconformity in design, development, production, installation and servicing of products. Most of the Company’s facilities are ISO 9001 certified.
The Company has a team of employees dedicated to deploying the OOS. The team is comprised of process engineers, who drive efficiency gains through line balancing and plant layout design; operations/manufacturing experts who lead rationalization projects using overall business knowledge; facility and asset experts who reduce capital spend by optimizing overall utilization of key assets; and materials management personnel who establish methods to ensure parts availability and efficient delivery to production while minimizing inventory. The Company created the OOS to promote common practices across the Company to enhance its performance through continuous improvement and lean practices. To achieve this goal, the Company locates manufacturing in the plants that can ensure the maximum utilization of the Company’s assets, allowing for vertical alignment in core competences, irrespective of the segment in which the sale originates. Examples of this include the production of M-ATVs and SandCat Tactical Protector Vehicles at the Company’s access equipment segment manufacturing facilities, the relocation of certain defense and fire & emergency segment production to the Company’s facilities in Kewaunee, Wisconsin and the manufacturing of defense components at the Company’s commercial manufacturing facilities in Iowa.
Engineering, Research and Development
The Company believes its extensive engineering, research and development capabilities have been key drivers of the Company’s marketplace success. The Company maintains five facilities for new product development and testing with a staff of approximately 260285 engineers and technicians who are dedicated to improving existing products and development and testing of new vehicles, vehicle bodies and components. The Company prepares annualmulti-year new product development plans for each of its markets and measures progress against those plans each month.
Virtually all of the Company’s sales of fire apparatus, broadcast vehicles and mobile medical trailers require some custom engineering to meet the customer’s specifications and changing industry standards. Engineering is also a critical factor in defense vehicle markets due to the severe operating conditions under which the Company’s vehicles are utilized, new customer requirements and stringent government documentation requirements. In the access equipment and commercial segments, product innovation is highly important to meet customers’ changing requirements. Accordingly, in addition to new product development engineers and technicians, the Company maintains aan additional permanent staff of over 400425 engineers and engineering technicians, and it regularly outsources some engineering activities in connection with new product development projects.
9
Table of Contents
For fiscal 2009, 20082011, 2010 and 2007,2009, the Company incurred engineering, research and development expenditures of $73.3$142.0 million, $90.1$109.3 million and $73.5$72.7 million, respectively, portions of which were recoverable from customers, principally the U.S. government.
Competition
In all of the Company’s segments, competitors include smaller, specialized manufacturers as well as large, mass producers. The Company believes that, in its specialty vehicle and vehicle body markets, it has been able to effectively compete against large, mass producers due to its product quality, flexible manufacturing and tailored distribution systems. The Company believes that its competitive cost structure, strategic global purchasing capabilities, engineering expertise, product quality and global distribution and service systems have enabled it to compete effectively.
Certain of the Company’s competitors have greater financial, marketing, manufacturing, distribution and governmental affairs resources than the Company. There can be no assurance that the Company’s products will continue to compete successfully with the products of competitors or that the Company will be able to retain its customer base or improve or maintain its profit margins on sales to its customers, all of which could have a material adverse effect on the Company’s financial condition, results of operations and cash flows.
10
Table of Contents
Defense Segmentsegment.. The Company produces heavy-payload, medium-payload and medium-payloadlight-payload tactical wheeled vehicles for the U.S. and other militaries.militaries and for law enforcement applications. Competition for sales of these tactical wheeled vehicles includes, among others, BAE Systems plc, Man Group plc, Mercedes-Benz (a subsidiary of Daimler AG), Navistar Defense LLC (a subsidiary of Navistar International Corporation), The Volvo Group, Force Protection Inc. and General Dynamics Corp. The principal method of competition in the defense segment involves a competitive bid that takes into account factors as determined by the applicable military customer, such as price, product performance, small and disadvantaged business participation, product quality, adherence to bid specifications, production capability, project management capability, past performance and product support. Usually, the Company’s truck systems must also pass extensive testing. The Company believes that its competitive strengths include: strategic global purchasing capabilities leveraged across multiple business segments; extensive pricing/costing and defense contracting expertise; a significant installed base of vehicles currently in use throughout the world; large-scale, flexible and high-efficiency vertically-integrated manufacturing capabilities; patented and/or proprietary vehicle components such as TAK-4 independent suspension, Oshkosh power transfer cases and Command Zone vehicle diagnostics; ability to develop new and improved product capabilities responsive to the needs of its customers; product qualityquality; and after-market parts sales and service capabilities.
The current U.S. Administration has indicated that it supports increased competition for existing defense programs. The Weapon Systems Acquisition Reform Act also requires competition for defense programs in certain circumstances. Accordingly, it is possible that the U.S. Army and U.S. Marines will conduct competitions for programs for which the Company currently has contracts upon the expiration of the existing contracts. Competition for these and other DoD programs could result in future contracts being awarded based upon different competitive factors than those described above and would primarily include price, production capability and past performance. In addition, current economic conditions have put significant pressure on the U.S. federal budget. The Budget Control Act of 2011 contains an automatic sequestration feature that would order cuts to the defense budget if Congress fails to enact the specified $1.2 trillion in U.S. federal deficit reductions to be recommended by the Joint Committee. Budgetary concerns could result in future contracts being awarded more on price than the past competitive factors described above.
Access Equipment Segmentequipment segment.. JLG operates in the global construction, maintenance, industrial and agricultural equipment markets. JLG’s competitors range from some of the world’s largest multi-national construction equipment manufacturers to small single-product niche manufacturers. Within this global market, competition for sales of aerial work platform vehicles includes Genie Industries, Inc. (a subsidiary of Terex Corporation), Haulotte Group, Skyjack Inc. (a subsidiary of Linamar Corporation), Aichi Corporation (a subsidiary of Toyota Industries Corporation) and over 2040 smaller manufacturers. Global competition for sales of telehandler vehicles includes Genie Industries, Inc. (a subsidiary of Terex Corporation),the Manitou Group, J C Bamford Excavators Ltd., the Manitou Group, Merlo SpA and Genie Industries, Inc. and over 2030 smaller manufacturers. In addition, JLG faces competition from numerous manufacturers of other niche products such as boom vehicles, cherry pickers, skid steer loaders, mast climbers, straight mast and vehicle-mounted fork-lifts, rough-terrain and all-terrain cranes, vehicle-mounted cranes, portable material lifts, various types of material handling equipment, scaffolding and the common ladder that offer functionality that is similar to or overlaps that of JLG’s products. Principal methods of competition include brand awareness, product innovation and performance, quality, service and support, product availability and the extent to which a company offers single-source customer solutions. The Company believes its competitive strengths include: premium brand names; broad and single-source product offerings; product quality; worldwide distribution; safety record; service and support network; global procurement scalescale; and extensive manufacturing capabilities.
Fire & Emergency Segment. The Company produces and sells custom and commercial firefighting vehicles in the U.S. under the Pierce brand. Competitors include Rosenbauer International AG, Emergency One, Inc. (owned by American Industrial Partners), Kovatch Mobile Equipment Corp., and numerous smaller, regional manufacturers. Principal methods of competition include brand awareness, the extent to which a company offers single-source customer solutions, product quality, product innovation, dealer distribution, service and support and price. The Company believes that its competitive strengths include: recognized, premium brand name; nationwide network of independent Pierce dealers; extensive, high-quality and innovative product offerings, which include single-source customer solutions for aerials, pumpers and rescue units; large-
10
Table of Contents
scale and high-efficiency custom manufacturing capabilities; and proprietary technologies such as the PUC vehicle configuration, TAK-4 independent suspension, Hercules and Husky foam systems and Command Zone electronics.
Oshkosh manufactures ARFF vehicles for sale in the U.S. and abroad. Oshkosh’s principal competitors for ARFF sales are Rosenbauer International AG and Emergency One, Inc. Oshkosh also manufactures snow removal vehicles, principally for U.S. airports. The Company’s principal competitors for snow removal vehicle sales are Øveraasen AS and Schmidt Equipment & Engineering (a subsidiary of FWD/Seagrave Holdings LP). Principal methods of competition for airport products are product quality and innovation, product performance, price and service. The Company believes its competitive strengths in these airport markets include its high-quality, innovative products and low-cost manufacturing capabilities.
JerrDan produces carriers and wreckers, primarily for sale in the U.S. and Mexico. JerrDan’s principal competitor for Jerr-Dan branded products is Miller Industries, Inc. Principal methods of competition for carriers and wreckers include product quality and innovation, product performance, price and service. The Company believes its competitive strengths in this market include its high quality, innovative and high-performance product line and its low-cost manufacturing capabilities.
MedtecFire & emergency segment. The Company produces and sells custom and commercial firefighting vehicles in the U.S. and Canada under the Pierce brand and broadcast vehicles in the U.S. and abroad under the Frontline brand. Competitors include Rosenbauer International AG, Emergency One, Inc. (owned by Allied Specialty Vehicles), Kovatch Mobile Equipment Corp., and numerous smaller, regional manufacturers. Pierce’s principal competition for broadcast vehicles is from Accelerated Media Technologies and Television Engineering Corporation. Principal methods of competition include brand awareness, ability to meet or exceed customer specifications, price, the extent to which a manufacturercompany offers single-source customer solutions, product innovation, product quality, dealer distribution, and service and support. The Company believes that its competitive strengths include: recognized, premium brand name; nationwide network of independent Pierce dealers;
11
Table of Contents
extensive, high-quality and innovative product offerings, which include single-source customer solutions for aerials, pumpers and rescue units; large-scale and high-efficiency custom manufacturing capabilities; and proprietary technologies such as the PUC vehicle configuration, TAK-4 independent suspension, Hercules and Husky foam systems and Command Zone electronics.
Oshkosh manufactures ARFF vehicles for sale in the U.S. and abroad. Oshkosh’s principal competitor for ARFF sales is Rosenbauer International AG. Oshkosh also manufactures snow removal vehicles, principally for U.S. airports. The Company’s principal competitors for snow removal vehicle sales are Fortbrand Services, Inc., Wausau-Everest LP (a subsidiary of Specialized Industries LP) and M-B Companies, Inc. Principal methods of competition for airport products are price, product performance, service, product quality and innovation. The Company believes its competitive strengths in these airport markets include its high-quality, innovative products and low-cost manufacturing capabilities.
Pierce manufactures Medtec-branded ambulances, primarily for sale in the U.S. Medtec’sPierce’s principal competition for ambulance sales is from Halcore Group, Inc. (owned by TransOcean Capital, Inc.), Wheeled Coach Industries, (ownedAmerican Emergency Vehicles, Horton Emergency Vehicles, Leader Emergency Vehicles and Road Rescue (all brands owned by American Industrial Partners),Allied Specialty Vehicles) and Marque Inc./McCoy-Miller, LLC.LLC (owned by Thor Industries). Principal methods of competition are price, service and product quality. The Company believes its competitive strengths in the ambulance market include its high-quality, fully customizable and value-priced products.
OSV is a manufacturer ofThe Company manufacturers mobile medical trailers broadcast and command vehicles. OSV’s principalvehicles under the OSV and SMIT brand names. Principal competition for mobile medical trailers is from Med Coach, LLC and Ellis and Watts International, Inc. OSV’s principal competition for broadcast vehicles is from Wolf Coach (a subsidiary of L-3 Communication Holdings, Inc.) and Television Engineering Corporation. Principal methods of competition are product quality and availability, price and service. The Company believes its competitive strengths in OSV’sOSV and SMIT’s markets include its high-quality products, excellent relationships with manufacturers of equipment installed in its vehicles and low-cost manufacturing capabilities.
Commercial Segmentsegment.. The Company produces front- and rear-discharge concrete mixers and batch plants for the Americas under the Oshkosh, McNeilus, CON-E-CO and London brands. Competition for concrete mixer and batch plant sales includes Continental Manufacturing Co. (a subsidiary of Navistar International Corporation), Terex Corporation and Kimble Manufacturing Company (a subsidiary of The Hines Corporation). Principal methods of competition are price, service, product features, product quality and product availability and price.availability. The Company believes its competitive strengths includeinclude: strong brand recognition,recognition; large-scale and high-efficiency manufacturing,manufacturing; extensive product offerings,offerings; high product quality,quality; a significant installed base of concrete mixers in use in the marketplacemarketplace; and its nationwide, Company-owned network of sales and service centers.
McNeilus also produces refuse collection vehicles for the Americas.North America and international markets. Competitors include The Heil Company (a subsidiary of Dover Corporation), LaBrie Equipment Ltd. and New Way (a subsidiary of Scranton Manufacturing Company, Inc.). The principal methods of competition are service, product quality, product performance, service and price. Increasingly, the Company is competing for municipal business and large commercial business in the Americas, which is based on lowest qualified bid. The Company believes its competitive strengths in the Americas refuse collection vehicle markets includeinclude: strong brand recognition,recognition; comprehensive product offerings,offerings; a reputation for high-quality products,products; large-scale and high-efficiency manufacturingmanufacturing; and extensive networks of Company-owned sales and service centers located throughout the U.S.
IMT is a manufacturer of field service vehicles and truck-mounted cranes for the construction, equipment dealer, building supply, utility, tire service and mining industries. IMT’s principal field service competition is from Auto Crane Company (owned by Gridiron Capital), Stellar Industries, Inc., Maintainer Corporation of Iowa, Inc. and other regional companies. Competition in truck-mounted cranes comes primarily from European companies including Palfinger AG, Cargotec Corporation and Fassi Group SpA. Principal methods of competition are product quality, price and service. The Company believes its competitive strengths include its high-quality products, global distribution network and low-cost manufacturing capabilities.
11
Table of Contents
Customers and Backlog
Sales to the U.S. government comprised approximately 52%56% of the Company’s net sales in fiscal 2009.2011. No other single customer accounted for more than 10% of the Company’s net sales for this period. A substantial majority of the Company’s net sales are derived from customer orders prior to commencing production.
12
Table of Contents
The Company’s backlog as of September 30, 20092011 increased 138.6%19.9% to $5,615.4 million$6.48 billion compared to $2,353.8$5.40 billion at September 30, 2010. Defense segment backlog increased 8.5% to $5.13 billion at September 30, 2011 compared to $4.73 billion at September 30, 2010 due largely to additional delivery orders received under the FMTV contract, offset in part by the fulfillment of orders received for vehicles related to the FHTV program. Access equipment segment backlog increased 270.0% to $729.2 million at September 30, 2008. Defense segment backlog increased 307.2%2011 compared to $4,883.8$197.1 million at September 30, 2009 compared to $1,199.2 million at September 30, 2008 due largely to the award2010. Backlog increased in all access equipment product categories as demand rebounded from historical lows and large rental companies accelerated orders in anticipation of the M-ATV contractcapacity constraints in June 2009, the renewal of the FHTV contract in October 2008, including a supplemental FHTV award in August 2009, and the award of the FMTV contract in August 2009. The $266.8 million delivery order under the recently-awarded FMTV contract is under a government issued stop work order until resolution of protests filed with the GAO by the Company’s competitors under that competition. Access equipment segment backlog decreased 70.2% to $98.3 million at September 30, 2009 compared to $330.0 million at September 30, 2008 due to the global recession and related impact on credit markets.2012. Access equipment backlog as of September 30, 20092011 and 2010 included $46.5$62.5 million and $95.7 million, respectively, relating to telehandler orders from the DoD. Backlog figures reported for prior periods did not include amounts relating to telehandler orders from the DoD. The amount of these DoD orders on hand, but not included in backlog, as of September 30, 2008 was $42.7 million. Fire & emergency segment backlog decreased 11.8%increased 14.2% to $558.7$479.0 million at September 30, 20092011 compared to $633.2$419.4 million at September 30, 20082010 due in partlargely to weakening domestic municipal markets, the fulfillment of domestic fire apparatus orders in fiscal 2009 received in advance of price increases and new National Fire Protection Association standards that became effective January 1, 2009. Fire & emergencystrong broadcast equipment orders. Commercial segment backlog increased 138.6% to $140.0 million at September 30, 2011 compared to $58.7 million at September 30, 2010. Unit backlog for concrete mixers was up 28.6% compared to very low backlog at September 30, 2009 included $49.7 million related to BAI. BAI was sold in October 2009. Commercial segment backlog decreased 61.0% to $74.6 million at September 30, 2009 compared to $191.4 million at September 30, 2008. Backlog at September 30, 2008 included $70.7 million2010, primarily as a result of backlog for Geesink. Geesink was sold in July 2009.increased international orders. Unit backlog for domestic refuse collection vehicles was down 32.4%up 144.8% compared to September 30, 2008 partly2010 in large part due to the timing of orders to benefit from several large waste haulers. Unit backlogs for front-discharge and rear-discharge concrete mixers were down 54.5% and 77.2%, respectively, compared to September 30, 2008 as a result of continued weak construction markets inbonus depreciation tax deduction under the U.S as a result of the global recession and related impactU.S. tax code which expires on credit markets.December 31, 2011.
Reported backlog excludes purchase options and announced orders for which definitive contracts have not been executed. Additionally, backlog excludes unfunded portions of the FHTV, MTVR, ID/IQ,M-ATV, LVSR and FMTV contracts. Backlog information and comparisons thereof as of different dates may not be accurate indicators of future sales or the ratio of the Company’s future sales to the DoD versus its sales to other customers. Approximately 10.8%21% of the Company’s September 30, 20092011 backlog is not expected to be filled in fiscal 2010.2012.
Government Contracts
Approximately 52%56% of the Company’s net sales for fiscal 20092011 were made to the U.S. government, a substantial majority of which were under long-termmulti-year contracts and programs in the defense vehicle market. Accordingly, a significant portion of the Company’s sales are subject to risks specific to doing business with the U.S. government, including uncertainty of economic conditions, changes in government policies and requirements that may reflect rapidly changing military and political developments, the availability of funds and the ability to meet specified performance thresholds. Long-termMulti-year contracts may be conditioned upon continued availability of congressional appropriations, which could be impacted by the uncertainty regarding the future level of U.S. military involvement in Afghanistan, the President’s plan to remove virtually all U.S. troops from Iraq and Afghanistanby the end of 2011 and federal budget pressures arising from the federal bailout of financial institutions, insurance companies and others.pressures. Variances between anticipated budget and congressional appropriations may result in a delay, reduction or termination of these contracts. In addition, current weak economic conditions have put significant pressure on the U.S. federal budget. The Budget Control Act of 2011 contains an automatic sequestration feature that would order cuts to the defense budget if Congress fails to enact the specified $1.2 trillion in U.S. federal deficit reductions to be recommended by the Joint Committee. Budgetary concerns could result in future contracts being awarded more on price than the past competitive factors described above.
The Company’s sales into defense vehicle markets are substantially dependent upon periodic awards of new contracts and the purchase of base vehicle quantities and the exercise of options under existing contracts. The Company’s existing contracts with the DoD may be terminated at any time for the convenience of the government. Upon such termination, the Company would generally be entitled to reimbursement of its incurred costs and in general, to payment of a reasonable profit for work actually performed.
Defense truck contract awards that the Company receives may be subject to protests by competing bidders, which protests, if successful, could result in the DoD revoking part or all of any defense truck contract it awards to the Company and an inability of the Company to recover amounts the Company has expended during the protest period in anticipation of initiating productionwork under any such contract. In particular, the FMTV contract recently awarded to the Company is currently
12
Table of Contents
being protested by two unsuccessful bidders for that contract. The Company continues to invest in the start-up of the FMTV program. Should the FMTV protests be upheld, the Company is unlikely to be able to recover these program start-up costs.
Under firm, fixed-price contracts with the U.S. government, the price paid to the Company is generally not subject to adjustment to reflect the Company’s actual costs, except costs incurred as a result of contract changes ordered by the government. The Company generally attempts to negotiate with the government the amount of increased compensation to which the Company is entitled for government-ordered changes that result in higher costs. If the Company is unable to negotiate a satisfactory agreement to provide such increased compensation, then the Company may file an appeal with the Armed Services Board of Contract Appeals or the U.S. Claims Court. The Company has no such appeals pending. The Company seeks to mitigate risks with respect to fixed-price contracts by executing firm, fixed-price contracts with a substantial majority of its suppliers for the duration of the Company’s contracts.
13
Table of Contents
The Company, as a U.S. government contractor, is subject to financial audits and other reviews by the U.S. government of performance of, and the accounting and general practices relating to, U.S. government contracts. Like most large government contractors, the Company is audited and reviewed by the government on a continual basis. Costs and prices under such contracts may be subject to adjustment based upon the results of such audits and reviews. Additionally, such audits and reviews can lead and have led to civil, criminal or administrative proceedings. Such proceedings could involve claims by the government for fines, penalties, compensatory and treble damages, restitution and/or forfeitures. Under government regulations, a company or one or more of its subsidiaries can also be suspended or debarred from government contracts, or lose its export privileges based on the results of such proceedings. The Company believes that the outcome of all such audits reviews and proceedingsreviews that are now pending will not have a material adverse effect on its financial condition, results of operations or cash flows.
Suppliers
The Company is dependent on its suppliers and subcontractors to meet commitments to its customers, and many components are procured or subcontracted on a sole-source basis with a number of domestic and foreign companies. Components for the Company’s products are generally available from a number of suppliers, although the transition to a new supplier may require several months to conclude. The Company purchases chassis components, such as vehicle frames, engines, transmissions, radiators, axles, tires, drive motors, bearings and hydraulic components and vehicle body options, such as cranes, cargo bodies and trailers, from third-party suppliers. These body options may be manufactured specific to the Company’s requirements; however, most of the body options could be manufactured by other suppliers or the Company itself. Through reliance on this supply network for the purchase of certain components, the Company is able to reduce many of the preproduction and fixed costs associated with the manufacture of these components and vehicle body options. The Company purchases a large amount of fabrications and outsources certain manufacturing services, each generally from small companies located near its facilities. While providing low-cost services and product surge capability, such companies often require additional management attention during difficult economic conditions or contract start-up. The Company also purchases complete vehicle chassis from truck chassis suppliers in its commercial segment and, to a lesser extent, in its fire & emergency segment. Increasingly, the Company is sourcing components globally, which may involve additional inventory requirements and introduces additional foreign currency exposures. The Company maintains an extensive qualification, on-site inspection, assistance and performance measurement system to attempt to control risks associated with reliance on suppliers. The Company occasionally experiences problems with supplier and subcontractor performance and component, chassis and body availability and must identify alternate sources of supply and/or address related warranty claims from customers. During fiscal 2011, the Company experienced a number of parts shortages and cost increases at its access equipment segment as demand for certain components exceeded then current supplier capacity. In addition to manufacturing inefficiencies and material cost increases associated with inadequate supplier capacity, the Company’s sales were also limited by parts availability.
While the Company purchases many costly components such as chassis, engines, transmissions and axles, it manufactures certain proprietary components. These components include front drive and steer axles, transfer cases, cabs, the TAK-4 independent suspension system, the McNeilus Auto Reach arm, the Hercules compressed air foam system, the Command Zone vehicle control and diagnostic system technology, the Revolution composite concrete mixer drum, body structures and many smaller parts that add uniqueness and value to the Company’s products. The Company believes internal production of these components provides a significant competitive advantage and also serves to reduce the manufacturing costs of the Company’s products.
The credit crisis and rapidly escalating steel, fuel and other raw material costs in fiscal 2008 created additional risks for the Company’s supplier base. The ongoing global recession and continuing challenges in accessing financing in fiscal 2009 further challenged the Company’s supplier base. A limited number of small suppliers have discontinued business due to the
13
Table of Contents
global recession, tight credit conditions or the inability to either absorb cost increases or pass them on to their customers. In fiscal 2010, additional suppliers could face financial difficulties as a result of the global recession and tight credit conditions. The Company is actively monitoring its suppliers’ financial conditions, but to date has no significant concerns with the financial stability of any major suppliers.
The M-ATV contract requires that the Company ramp up M-ATV production levels to 1,000 vehicles per month by December 2009. The Company’s ability to meet the required production levels is largely dependent on procuring the necessary material and components in sufficient quantities and on a timely basis. The Company has previously experienced, and may in the future experience, significant disruption or termination of the supply of some of its parts, materials, components and final assemblies that it obtains from sole source suppliers or subcontractors. Should the Company’s suppliers not plan or execute appropriately, the Company may not achieve its planned rate of production. The Company may also incur a significant increase in the cost of these parts, materials, components or final assemblies.
Intellectual Property
Patents and licenses are important in the operation of the Company’s business, as one of management’s objectives is developing proprietary components to provide the Company’s customers with advanced technological solutions at attractive prices. The Company holds in excess of 550500 active domestic and foreign patents. The Company believes patents for the TAK-4 independent suspension system, which expire between 2016 and 2029, provide the Company with a competitive advantage in the defense and fire & emergency segments. In the defense segment, the TAK-4 independent suspension system was added to the U.S. Marine Corps’ MTVR and LVSR programs and is a key feature on the Company’s M-ATVs.M-ATV and L-ATV. The Company believes the TAK-4 independent suspension system provided a performance and cost advantage in the successful competition for the production contracts for these programs. The Company believes that patents for certain components of its ProPulse hybrid electric drive system, Command Zone electronics and TerraMax autonomous vehicle
14
Table of Contents
systems offer potential competitive advantages to product lines across all its segments. To a lesser extent, other proprietary components provide the Company a competitive advantage in each of the Company’s segments.
In fiscal 2002, the Company introduced the Revolution composite concrete mixer drum in the U.S. The Company has purchased exclusive, renewable licenses for the rights to manufacture and market this technologythe Revolution composite concrete mixer drum in the Americas and Europe. These licenses require the Company to make royalty fee payments to its Australian partner for each Revolution drum sold. The Company believes that the Revolution mixer drum has the potential to create an important competitive advantage over competitors that manufacture steel concrete mixer drums during the next economic upturn. The Revolution composite drum is substantially lighter than a comparable steel drum permitting greater payload capacity and is easier to clean, which together lower the cost of delivered concrete. The Company offers the Revolution composite drum at prices substantially higher than prices for steel drums.
As part of the Company’s 20-yearlong-term alliance with Caterpillar Inc., the Company acquired a non-exclusive, non-transferable worldwide license to use certain Caterpillar intellectual property through 2025 in connection with the design and manufacture of Caterpillar’s current telehandler products. Additionally, Caterpillar assigned to JLG certain patents and patent applications relating to the Caterpillar-branded telehandler products.
The Company holds trademarks for “Oshkosh,” “TAK-4,” “ProPulse,” “JLG,” “SkyTrak,” “Lull,” “Toucan,” “Pierce,” “McNeilus,” “Revolution,” “Medtec,“MEDTEC,” “Jerr-Dan,” “CON-E-CO,” “London,” “Frontline,” “SMIT” and “IMT” among others. These trademarks are considered to be important to the future success of the Company’s business.
Employees
As of September 30, 2009,2011, the Company had approximately 12,30013,100 employees. The United Auto Workers union (“UAW”) represented approximately 2,7003,100 production employees at the Company’s Oshkosh, Wisconsin facilities; the Boilermakers, Iron Shipbuilders, Blacksmiths, and Forgers Union (“Boilermakers”) represented approximately 230220 employees at the Company’s Kewaunee, Wisconsin facilities; and the International Brotherhood of Teamsters Union (“Teamsters”) represented approximately 75135 employees at the Company’s Garner, Iowa facilities. The Company’s recently ratified five-year agreement with the UAW extends through September 2011,2016, and the Company’s agreement with the Boilermakers extends through May 2012. The Company’s three-year agreement with the Teamsters extends throughexpired in October 2011. The Company is currently in negotiations regarding a new agreement with the Teamsters. In addition, the majority of the Company’s approximately 1,400 employees located outside the U.S. are represented by separate works councils or unions. The Company believes its relationship with employees is satisfactory.
14
Table of Contents
Seasonal Nature of Business
In the Company’s access equipment and commercial segments, business tends to be seasonal with an increase in sales occurring in the spring and summer months that constitute the traditional construction season.season in the northern hemisphere. In addition, sales are generally lower in the first fiscal quarter in all segments due to the relatively high number of holidays which reduce available shipping days.
Industry Segments
Financial information concerning the Company’s industry segments is included in Note 2123 to the Consolidated Financial Statements contained in Item 8 of this Form 10-K.
Foreign and Domestic Operations and Export Sales
The Company manufactures products in the U.S., Belgium, Canada, The Netherlands, France, Australia, Romania and RomaniaChina and through investments in joint ventures in Mexico and Brazil for sale throughout the world. Sales to customers outside of the U.S. were 15.3%17.2%, 28.0%9.8% and 22.7%14.6% of the Company’s consolidated sales for fiscal 2009, 20082011, 2010 and 2007,2009, respectively.
Financial information concerning the Company’s foreign and domestic operations and export sales is included in Note 2123 to the Consolidated Financial Statements contained in Item 8 of this Form 10-K.
15
Table of Contents
Available Information
The Company maintains a website with the address www.oshkoshcorporation.com.www.oshkoshcorporation.com. The Company is not including the information contained on the Company’s website as a part of, or incorporating it by reference into, this Annual Report on Form 10-K. The Company makes available free of charge (other than an investor’s own Internet access charges) through its website its Annual Report on Form 10-K, quarterly reports on Form 10-Q and current reports on Form 8-K, and amendments to these reports, as soon as reasonably practicable after the Company electronically files such materials with, or furnishes such materials to, the Securities and Exchange Commission (“SEC”).
ITEM 1A.RISK FACTORS
The Company’s financial position, results of operations and cash flows are subject to various risks, many of which are not exclusively within the Company’s control, thatwhich may cause actual performance to differ materially from historical or projected future performance. InformationInvestors should consider carefully information in this Form 10-K should be considered carefully by investors in light of the risk factors described below and the information set forth under the caption “Management’s Discussion and Analysis of Financial Condition and Results of Operations - Certain Assumptions.”
The M-ATV contract is a high profile and urgent priority for the DoD, which requires a significant and rapid increase in the rate of production of these vehicles. If we are not able to meet the required delivery schedule for this contract, our ability to secure future military business may be materially adversely impacted.
The M-ATV contract requires that we quickly ramp up M-ATV production levels to 1,000 vehicles per month by December 2009. Our ability to meet the required production levels is largely dependent on procuring the necessary material and components in sufficient quantities and on a timely basis.We may incur costs beyond our estimates to ramp up production. In addition, the DoD continues to perform significant levels of testing of the initial vehicles delivered by us. This testing could lead to material retrofits to vehicles that have already been produced or the need to change the configuration of vehicles yet to be built. Material retrofits could involve higher costs than we have estimated for the program.If we are unable to timely complete any of the foregoing items or if we are required to perform significant retrofits to existing vehicles or change the configuration of the vehicles, we may not be able to timely deliver the quantity of vehicles required by the contract. This could negatively impact our ability to win future business with the DoD or other foreign military customers, which, along with the other risks to our costs in this program, would adversely affect our future earnings and cash flows. See “Our dependency on contracts with U.S. and foreign government agencies subjects us to a variety of risks that could materially reduce our revenues or profits” and “A disruption or termination of the supply of parts, materials, components and
15
Table of Contents
final assemblies from third-party suppliers could delay sales of our vehicles and vehicle bodies” for additional risks associated with the M-ATV contract.below.
Certain of our markets are highly cyclical and the current or any further decline in these markets could have a material adverse effect on our operating performance.
The high levels of sales in our defense business in recent years have been due in significant part to demand for defense trucks, replacement parts and services (including armoring) and truck remanufacturing arising from the conflicts in Iraq and Afghanistan. Events such as these are unplanned, as is the demand for our products that arises out of such events. In addition, current economic conditions have put significant pressure on the U.S. federal budget, including the defense budget. Specifically, the President’s defense budget for fiscal 2011 and the budget request for fiscal 2012 include significantly lower funding for purchases of new military vehicles that we manufacture under our FHTV and FMTV contracts than in prior years. The fiscal 2012 defense budget request for FMTVs also was significantly less than we expected. In addition, the Budget Control Act of 2011 contains an automatic sequestration feature that would order cuts to the defense budget if Congress fails to enact the specified $1.2 trillion in U.S. federal deficit reductions to be recommended by the Joint Committee. As part of the budget process, the Defense Subcommittee of the Senate Appropriations Committee has proposed that the Joint Light Tactical Vehicle program be terminated in favor of upgrades to the current Humvee fleet. Moreover, on October 21, 2011, the President announced that virtually all U.S. troops will be removed from Iraq by the end of 2011 and plans exist regarding a future drawdown of U.S. military involvement in Afghanistan. The withdrawal of U.S. troops from Iraq will likely significantly reduce the level of defense funding allocated to support U.S. military involvement in Iraq, and uncertainty exists as to the level of defense funding that will be allocated to support U.S. military involvement in Afghanistan. The magnitude of the adverse impact that federal budget pressures, including the President’s recent request to reduce defense spending by $450 billion or any furthermore between 2012 and 2023 and the potential impact of the Budget Control Act of 2011 on the defense budget, expected reductions in future defense funding for U.S. military involvement in Iraq and Afghanistan and an uncertain DoD tactical wheeled vehicle strategy, will have on funding for Oshkosh defense programs is uncertain, but directionally, we expect such funding to decline, and such decline could be significant. Furthermore, our defense business may fluctuate significantly from time to time as a result of the start and completion of new contract awards that we may receive, such as the M-ATV contract that we received in fiscal year 2009 and substantially completed in fiscal year 2010 and the FMTV contract that we received in fiscal year 2010 and are in the process of completing.
The decline, compared to historical levels, in overall customer demand in our cyclical access equipment, and commercial markets and in our modestly cyclical fire & emergency markets that we have experienced since the start of the global economic downturn and any further decline could have a material adverse effect on our operating performance. The access equipment market thatin which JLG operates in is highly cyclical and impacted by the strength of economies in general, by prevailing mortgage and other interest rates, by residential and non-residential construction spending, by the ability of rental companies to obtain third party financing to purchase revenue generating assets, by capital expenditures of rental companies in general and by other factors. The ready-mix concrete market that we serve is highly cyclical and impacted by the strength of the economy generally, by prevailing mortgage and other interest rates, by the number of housing starts and by other factors that may have an effect on the level of concrete placement activity, either regionally or nationally. Refuse collection vehicle markets are also cyclical and impacted by the strength of economies in general, by municipal tax receipts and by capital expenditures of large waste haulers. Fire & emergency markets are modestly cyclical later in an economic downturn and are impacted by the economy generally and by municipal tax receipts and capital expenditures. Concrete mixer and access equipment sales also are seasonal with the majority of such
16
Table of Contents
sales occurring in the spring and summer months, which constitute the traditional construction season.season in the Northern hemisphere.
The global economy is currently experiencing a severe recession,continues to experience weakness, which has negatively impacted our sales volumes for our access equipment, commercial and to a lesser extent, fire & emergency products.products as compared to historical levels. In addition, the global economic weakness has caused lending institutions to tighten their credit lending standards, which has restricted our customers’ access to capital. Continued weakness in U.S. and European housing starts and non-residential construction spending in most geographical areas of the world are further contributing to the lower sales volumes. A lack of significant improvement in non-residential construction spending or continued low levels of construction activity generally may cause future weakness in demand for our products. In addition, many customers of ours have been reducing their expenditures for access equipment. Furthermore, municipalMunicipal tax revenues in the U.S. have weakened, which has negatively impacted demand for fire apparatus. The towingapparatus and refuse collection vehicles and delayed the recovery equipmentin these markets. Furthermore, it is possible that emerging market is also beinggrowth could slow, which could negatively impacted by the global economy and tight creditimpact our growth in those markets. We cannot provide any assurance that the global recessioneconomic weakness and tight credit markets will not continue or become more severe. In addition, we cannot provide any assurance that any economic recovery will not progress more slowly than what we or the market expect. If the global recessioneconomic weakness and tight credit markets continue or become more severe, or if any economic recovery progresses more slowly than what we or the market expect, then there could be a material adverse effect on our net sales, financial condition, profitability and/or cash flows.
The high levels of sales in our defense business in recent years have been due in significant part to demand for defense trucks, replacement parts and services (including armoring) and truck remanufacturing arising from the conflicts in Iraq and Afghanistan. Events such as these are unplanned, and we cannot predict how long these conflicts will last or the demand for our products that will arise out of such events. Accordingly, we cannot provide any assurance that the increased defense business as a result of these conflicts will continue. Furthermore, our defense business may fluctuate significantly from time to time as a result of the start and completion of new contract awards that we may receive, such as the M-ATV and FMTV contracts. New vehicle production under the M-ATV contract is currently scheduled to continue only through April 2010. In addition, the bailout of U.S. financial institutions, insurance companies and others as well as the U.S. economic stimulus package are expected to put significant pressure on the U.S. federal budget, including the defense budget. Moreover, uncertainty exists regarding the future level of U.S. military involvement in Iraq and Afghanistan and the related level of defense funding that will be allocated to support this involvement. It is too early to tell what the impact of federal budget pressures and future defense funding for U.S. military involvement in Iraq and Afghanistan will mean to funding for Oshkosh defense programs. As such, we cannot provide any assurance that funding for our defense programs will not be impacted by defense policies and federal budget pressures.
An impairment in the carrying value of goodwill and other indefinite-lived intangible assets could negatively affect our operating results.
We have a substantial amount of goodwill and purchased intangible assets on our balance sheet as a result of acquisitions we have completed. Approximately 85% of these intangibles are concentrated in the access equipment segment. The carrying value of goodwill represents the fair value of an acquired business in excess of identifiable assets and liabilities as of the acquisition date. The carrying value of indefinite-lived intangible assets represents the fair value of trademarks and trade names as of the acquisition date. Goodwill and indefinite-lived intangible assets that are expected to contribute indefinitely to our cash flows are not amortized, but instead are evaluated for impairment at least annually, or more frequently if potential
16
Table of Contents
interim indicators exist that could result in impairment. In testing for impairment, if the carrying value of a reporting unit exceeds its current fair value as determined based on the discounted future cash flows of the reporting unit, the goodwill or intangible asset is considered impaired and is reduced to fair value via a non-cash charge to earnings. Events and conditions that could result in impairment include a prolonged period for the current global recession and tight credit markets, further decline in economic conditions or a slow, weak economic recovery, as well as sustained declines in the price of our common stock, adverse changes in the regulatory environment, or other factors leading to reductions in expected long-term sales or profitability. Determination of the fair value of a reporting unit includes developing estimates which are highly subjective and incorporate calculations that are sensitive to minor changes in underlying assumptions. Management’s assumptions change as more information becomes available. Changes in these assumptions could result in an impairment charge in the future, which could have a significant adverse impact on our reported earnings. See “Management’s Discussion and Analysis of Financial Condition and Results of Operations — Critical Accounting Estimates — Goodwill” for more information regarding the potential impact of changes in assumptions.
Our dependency on contracts with U.S. and foreign government agencies subjects us to a variety of risks that could materially reduce our revenues or profits.
We are dependent on U.S. and foreign government contracts for a substantial portion of our business. That business is subject to the following risks, among others, that could have a material adverse effect on our operating performance:
· Our business is susceptible to changes in the U.S. defense budget, which may reduce revenues that we expect from our defense business, especially in light of federal budget pressures in part caused by U.S. economic weakness, the withdrawal of U.S. troops from Iraq, the uncertainty that exists regarding the future level of U.S. military involvement in Iraq and Afghanistan and the related level of defense funding that will be allocated to support this involvement.involvement, and the level of defense funding that will be allocated to the DoD’s tactical wheeled vehicle strategy generally.
· The U.S. government may not appropriate funding that we expect for our U.S. government contracts, which may prevent us from realizing revenues under current contracts or receiving additional orders that we anticipate we will receive.
· MostCertain of our government contracts are fixed-pricefor the U.S. Army and U.S. Marines could be suspended, opened for competition or terminated, and all such contracts expire in the future and may not be replaced, which could reduce revenues that we expect under the contracts and negatively affect margins in our actual costs ondefense segment.
·The current U.S. Administration has indicated that it supports increased competition for existing defense programs. The Weapon Systems Acquisition Reform Act also requires competition for defense programs in certain circumstances. Accordingly, it is possible that there will be competition for any M-ATV orders for units above the 10,000 unit ceiling in the initial contract award. Also, it is possible that the U.S. Army and U.S. Marines will conduct an open competition for programs for which we currently have contracts upon the expiration of the existing contracts. Our FHTV contract expired in September 2011, with expected vehicle deliveries to continue through March 2013. We are in negotiations with the U.S. Army regarding our receipt of a bridge contract for the FHTV program under which we would continue producing FHTVs while the U.S. Army develops a path to conduct an open competition for the next contract relating to this program. The bridge contract could include the purchase of the design rights to our vehicles under this contract so that the U.S. Army could compete the program. The U.S. Army may decide to forgo the issuance of this bridge contract, which may prevent us from realizing these contracts may exceed our projected costs, whichrevenues. Likewise, the U.S. Army and Marine Corps have, in the past, inquired about purchasing the design rights to the
M-ATV and MTVR that we produce, respectively. Competition for these and other DoD programs we currently have could result in profitsthe U.S. government awarding future contracts to another manufacturer or the U.S. government awarding the contracts to us at lower than historically realized orprices and operating margins than we anticipate or net lossesexperience under thesethe current contracts.
· We are required to spend significant sums on product development and testing, bid and proposal activities and pre-contract engineering, tooling and design activities in competitions to have the opportunity to be awarded these contracts.
· Competitions for the award of defense truck contracts are intense, and we cannot provide any assurance that we will be successful in the defense truck procurement competitions in which we participate.
·Defense truck contract awards that we receive may be subject to protests by competing bidders, which protests, if successful, could result in the DoD revoking part or all of any defense truck contract it awards to us and our inability to recover amounts we have expended in anticipation of initiating production under any such contract. In particular,
17
Table of Contents
·Most of our government contracts, including the FMTV contract, recently awardedare fixed-price contracts with price escalation factors included for those contracts that extend beyond one year. Our actual costs on any of these contracts may exceed our projected costs, which could result in profits lower than historically realized or than we anticipate or net losses under these contracts. In addition, if the timing and size of orders received from the U.S. government differ significantly from the assumptions that we used to us is currently being protested by certain unsuccessful bidders forprice the contract, we may incur unanticipated start-up costs or expend more capital to start up production under the contract, and we may not benefit as we expected from contractual price increases, which could also result in lower than anticipated margins or net losses under these contracts. In particular, we bid the FMTV program at very aggressive margins. We have received orders to date under this program significantly in excess of the quantities that bidders were asked to use to prepare their pricing for this program in the original request for proposal. While the timing and extent of FMTV orders have created opportunities to leverage higher orders to reduce our material costs, they have adversely impacted manufacturing start-up and capital costs under the contract and product pricing relative to what we had originally anticipated as we do not benefit from certain price escalation factors. In addition, the higher order rate for FMTVs caused us to devote more attention to increasing our FMTV production capacity, which delayed our focus on reducing manufacturing costs as compared to our original plans. Collectively, these items have caused us to incur losses under the FMTV program to date, and we expect to continue to investincur losses through the first quarter of fiscal 2012. Although we expect sales for the FMTV contract to be profitable starting in the start-upsecond quarter of fiscal 2012, this program. We mayexpectation is based on certain assumptions, including estimates for future increases in the costs of raw materials, targeted cost savings and our ability to achieve certain production efficiencies. There are inherent uncertainties related to these factors and management’s judgment in applying them to the analysis of profitability. For example, a 1% escalation in material costs over our projection for FMTV orders currently in backlog would increase the cost of materials by approximately $24 million. Although we do not be ablebelieve that such an increase would result in a loss on future sales under this contract, it would significantly reduce our expected future gross margins on orders currently in backlog. It is possible that other assumptions underlying the analysis could change in such a manner that we would determine in the future that this is a loss contract, which could result in a material charge to recover these amounts if the protests are upheld.earnings.
· Certain of our government contracts couldWe are required to spend significant sums on product development and testing, bid and proposal activities and pre-contract engineering, tooling and design activities in competitions to have the opportunity to be suspended, opened for competition or terminated and all such contracts expire in the future and may not be replaced, which could reduce expected revenues fromawarded these contracts.
· The amountCompetitions for the award of orders for defense trucks or componentstruck contracts are intense, and we cannot provide any assurance that we may receive under certain of our government contracts is uncertain, andwill be successful in the defense truck procurement competitions in which we may not receive additional or follow-on orders relating to contract awards we have received, including for M-ATVs, FMTVs or TAK-4 independent suspension retrofits.participate.
· Our defense products undergo rigorous testing by the customer and are subject to highly technical requirements. Any failure to pass these testsor to comply with these requirements could result in unanticipated retrofit costs, delayed acceptance of trucks,vehicles, late or no payments under such contracts or cancellation of the contract to provide vehicles to the government.
· Our government contracts are subject to audit, which could result in adjustments of our costs and prices under these contracts.
· Our defense truck contracts are large in size and require significant personnel and production resources, and when such contracts end, we must make adjustments to personnel and production resources. In particular, orders for M-ATVs are requiring substantial personnel and production resources at several of our facilities to enable us to quickly ramp up production to meet the delivery requirements for such orders.
17
Table of Contents
· We have historically received payments in advance of product deliveries, or performance-based payments (“PBP”), on a number of our U.S. government contracts. In the event that we are not able to meet contractual delivery requirements on these contracts, the U.S. government may discontinue providing PBPs, which could have an adverse effect on our ability to repay debt and cause us to incur higher interest rates on our outstanding debt.
·In the event of component availability constraints, the U.S. government has the ability to unilaterally divert the supply of components used on multiple government programs to those programs rated most urgent (DX-rated programs). Specifically, the U.S. government has notified us that the supply of tires used on a number of our FHTV variants is constrained and tires that we currently have on order with our supplier to meet our FHTV production requirements will be diverted to other DX-rated programs. We expect that this issue could affect us through much of 2012 and will delay the timing of a portion of our expected FHTV sales into fiscal 2013. The delay in our FHTV production as a result of the tire shortage could result in incremental production costs and delays in the timing of PBPs that we expect to receive under the program, which would adversely affect our cash flows.
·We periodically experience difficulties with sourcing sufficient vehicle carcasses to maintain our defense truck remanufacturing schedule, which can create uncertainty and inefficiencies for this area of our business.
18
Table of Contents
We may not be able to execute on our MOVE strategy and meet our long-term financial goals.
We have announced a roadmap, our MOVE strategy, to deliver long-term growth and earnings for our shareholders and to meet our long-term financial goals. The long-term financial goals that we expect to achieve as a result of our MOVE strategy are based on certain assumptions we have made, which assumptions may prove to be incorrect. We cannot provide any assurance we will be able to successfully execute our MOVE strategy, which is subject to a variety of risks, including the following:
·A lower or slower than expected recovery in housing starts and non-residential construction spending;
·Greater than expected declines in DoD tactical wheeled vehicle spending;
·Greater than expected pressure on municipal budgets;
·The possibility that commodity cost escalations could erode profits;
·Low cost competitors aggressively entering one or more of our markets with significantly lower pricing;
·Primary competitors vying for share gains through aggressive price competition;
·The failure of the U.S. government to take actions to ensure the sustainability of defense industry production facilities;
·Our inability to obtain and retain adequate resources to support production ramp-ups, including management personnel;
·The inability of our supply base to keep pace with the economic recovery;
·Our failure to realize procurement, facility optimization and other cost reduction targets;
·Our inability to achieve targeted profitability on the FMTV contract;
·Not winning key large defense contracts, such as the Modernized Expanded Capability Vehicle and the Canadian Tactical Armor Protected Vehicle and Medium Support Vehicle System;
·Our inability to innovate effectively and rapidly to expand sales and margins; and
·Slow adoption of our products in emerging markets and/or our inability to successfully execute our emerging market growth strategy.
An impairment in the carrying value of goodwill and other indefinite-lived intangible assets could negatively affect our operating results.
We have a substantial amount of debt. goodwill and purchased intangible assets on our balance sheet as a result of acquisitions we have completed. At September 30, 2011, approximately 88% of these intangibles are concentrated in the access equipment segment. The carrying value of goodwill represents the fair value of an acquired business in excess of identifiable assets and liabilities as of the acquisition date. The carrying value of indefinite-lived intangible assets represents the fair value of trademarks and trade names as of the acquisition date. We do not amortize goodwill and indefinite-lived intangible assets that we expect to contribute indefinitely to our cash flows, but instead we evaluate these assets for impairment at least annually, or more frequently if potential interim indicators exist that could result in impairment. In testing for impairment, if the carrying value of a reporting unit exceeds its current fair value as determined based on the discounted future cash flows of the reporting unit and market comparable sales and earnings multiples, the goodwill or intangible asset is considered impaired and is reduced to fair value via a non-cash charge to earnings. Events and conditions that could result in impairment include a prolonged period of global economic weakness and tight credit markets, further decline in economic conditions or a slow, weak economic recovery, as well as sustained declines in the price of our common stock, adverse changes in the regulatory environment, adverse changes in interest rates, or other factors leading to reductions in the long-term sales or profitability that we expect. Determination of the fair value of a reporting unit includes developing estimates which are highly subjective and incorporate calculations that are sensitive to minor changes in underlying assumptions. Management’s assumptions change as more information becomes available. Changes in these assumptions could result in an impairment charge in the future, which could have a significant adverse impact on our reported earnings.
19
Table of Contents
Our current debt levels, including the associated financing costs and restrictive covenants, could limit our flexibility in managing our business and increase our vulnerability to general adverse economic and industry conditions.
As a result of the JLG acquisition, we have a substantial amount of debt. Our credit agreement contains financial and restrictive covenants which, among other things, require us to satisfy quarter-end financial ratios, including a leverage ratio, a senior secured leverage ratio and an interest coverage ratio. The global recession and credit crisis and related decline in our earnings have increased the leverage ratios under which we operate. As a result, the financial and restrictive covenants may limit our ability to, among other things, borrow under our credit agreement to take advantage of business opportunities. Our ability to meet the financial ratios in such covenants may be affected by a number of risks or events, including the risks described in this Report on Form 10-K and events beyond our control. AThe indenture governing our senior notes also contains restrictive covenants. Any failure by us to comply with suchthese restrictive covenants or the financial and restrictive covenants in our credit agreement could have a material adverse effect on our financial condition, results of operations and debt service capability.
Our access to debt financing at competitive risk-based interest rates is partly a function of our credit ratings. Our current long-term debt ratings are B+BB with “stable” outlook from Standard & Poor’s Rating Services and B2Ba3 with negative“stable” outlook from Moody’s Investors Service. AnyA downgrade to our credit ratings such as the downgrades that occurred in the first half of fiscal 2009, could increase our interest rates, could limit our access to public debt markets, could limit the institutions willing to provide us credit facilities, and could make any future credit facilities or credit facility amendments more costly and/or difficult to obtain. In particular, under the terms of our credit agreement, we would incur a usage fee equal to 0.50% per annum on the aggregate principal amount of all outstanding loans under the credit agreement for any day on which we have a corporate family rating from Moody’s Investors Service of B3 with “negative” watch or lower or a corporate credit rating from Standard & Poor’s Rating Services of B- with “negative” watch or lower.
We had approximately $2.0$1.1 billion of debt outstanding as of September 30, 2009,2011, which consisted primarily of a $560 million term loan under our credit agreement maturing in October 2015 and $500 million of senior notes, $250 million of which $1.9 billion maturesmature in fiscal 2014.March 2017 and $250 million of which mature in March 2020. Our ability to make required payments of principal and interest on our debt will depend on our future performance, which, to a certain extent, is subject to general economic, financial, competitive, political and other factors, some of which are beyond our control. WhileWe expect that we havewill experience modestly negative free cash flow in fiscal 2012 as we adjust working capital requirements in our defense and access equipment segments to new sales levels. As we discuss above, our dependency on contracts with U.S. and foreign government agencies, such as the FMTV contract, subjects us to a favorable near term outlook for earningsvariety of risks that, if realized, could materially reduce our revenues, profits and cash flow, the global recessionflows. In addition, among other risks that we face that could affect our revenues, profits and cash flows, current continued weak economic conditions, declining U.S. defense budgets and tight credit markets could become more severe or prolonged, government funding levels for our military programs could decline significantly or changes could occur that alter our ability to effectively compete in our markets. Should one or more of these events occur,prolonged. Accordingly, conditions could arise whichthat could limit our ability to generate sufficient cash flows or access borrowings to enable us to fund our liquidity needs, further limit our financial flexibility or impair our ability to obtain alternative financing sufficient to repay our debt at maturity.
The covenants that are contained in our credit agreement and the indenture governing our senior notes, our credit rating, our substantial amount ofcurrent debt levels and the current credit market conditions could have important consequences for our operations, including:
· Render us more vulnerable to general adverse economic and industry conditions in our highly cyclical markets or economies generally;
· Require us to dedicate a substantial portion of our cash flow from operations to higher interest costs or higher required payments on debt, thereby reducing the availability of such cash flow to fund working capital, capital expenditures, research and development, stock repurchases, dividends and other general corporate activities;
· Limit our ability to obtain additional financing in the future to fund growth working capital, capital expenditures, new product development expenses and other general corporate requirements;
· Limit our ability to enter into additional foreign currency and interest rate derivative contracts;
· Make us vulnerable to increases in interest rates as a portion of our debt under our credit agreement is at variable rates;
· Limit our flexibility in planning for, or reacting to, changes in our business and the markets we serve;
· Place us at a competitive disadvantage compared to less leveraged competitors; and
· Limit our ability to pursue strategic acquisitions that may become available in our markets or otherwise capitalize on business opportunities if we had additional borrowing capacity.
18Raw material price fluctuations may adversely affect our results.
We purchase, directly and indirectly through component purchases, significant amounts of steel, petroleum based products and other raw materials annually. Steel, fuel and other commodity prices have historically been highly volatile. Commodity costs rose significantly early in our fiscal year 2011, and there are indications that these costs may increase further in the future due to one or more of the following: a sustained economic recovery, political unrest in certain countries or a weakening U.S. dollar. Increases in commodity costs negatively impact the profitability of orders in backlog as prices on
20
Table of Contents
those orders are usually fixed, which we experienced in the access equipment segment in the fourth quarter of fiscal 2011. Furthermore, we largely do business in the defense segment under annual firm, fixed-price contracts with the DoD. We attempt to limit the risk related to raw material price fluctuations in the defense segment by obtaining firm pricing from suppliers at the time a contract is awarded. However, if these suppliers do not honor their contracts, then we could face margin pressure in our defense business. If we are not able to recover commodity cost increases through price increases to our customers on new orders, then such increases will have an adverse effect on our results of operations. Additionally, if we are unable to negotiate timely component cost decreases commensurate with any decrease in commodity costs, our higher component prices could put us at a material disadvantage as compared to our competition.
We expect to incur costs and charges as a result of measures such as facilities and operations consolidations and workforce reductions that we expect will reduce costs, and those measures also may be disruptive to our business and may not result in anticipated cost savings.
We have been consolidating facilities and operations in an effort to make our business more efficient and expect to continue to review our overall manufacturing footprint. For example, we closed a facility and integrated our mobile medical business into our Clearwater, Florida operations during the first quarter of fiscal 2011, and we moved manufacturing production of our Medtec ambulances to our Bradenton, Florida operations during the second quarter of fiscal 2011. Also during the first quarter of fiscal 2011, we announced workforce reductions and other cost reduction measures in our fire & emergency and commercial segments and the consolidation of an access equipment segment facility in Belgium into a Romanian facility, which was largely executed in the fourth quarter of fiscal 2011. During the fourth quarter of fiscal 2011, we closed our Oakes, North Dakota manufacturing plant and consolidated the work performed at that facility into other Oshkosh facilities. We have incurred, and expect in the future to incur, additional costs and restructuring charges in connection with such consolidations, workforce reductions and other cost reduction measures that have adversely affected and, to the extent incurred in the future would adversely affect, our future earnings and cash flows. Furthermore, such actions may be disruptive to our business, as we experienced with the facility consolidations into our Bradenton, Florida operations. This may result in production inefficiencies, product quality issues, late product deliveries or lost orders as we begin production at consolidated facilities, which would adversely impact our sales levels, operating results and operating margins. In addition, we may not realize the cost savings that we expect to realize as a result of such actions.
We may experience losses in excess of our recorded reserves for doubtful accounts, finance receivables, notes receivable and guarantees of indebtedness of others.
As of September 30, 2009,2011, we had consolidated gross receivables of $679.0 million.$1.14 billion. In addition, we were a party to agreements in the access equipment segment whereby we have maximum exposure of $137.9$52.8 million under guarantees of customer indebtedness to third parties aggregating approximately $290.8$141.1 million. We evaluate the collectability of open accounts, finance and pledged finance receivables, notes receivable and our guarantees of indebtedness of others based on a combination of factors and establish reserves based on our estimates of potential losses. In circumstances where we believe it is probable that a specific customer will have difficulty meeting its financial obligations, a specific reserve is recorded to reduce the net recognized receivable to the amount we expect to collect, and/or we recognize a liability for a guarantee we expect to pay, taking into account any amounts that we would anticipate realizing if we are forced to repossess the equipment that supports the customer’s financial obligations to us. We also establish additional reserves based upon our perception of the quality of the current receivables, the current financial position of our customers and past collections experience. The level of specific reserves recorded in fiscal 2009, primarily related to JLG’s customers, was significantly higher than historically recorded as a result of the impact of the global recession and tight credit markets. Continued economic weakness and tight credit markets may result in additional requirements for specific reserves. During a recession,periods of economic weakness, the collateral underlying our guarantees of indebtedness of customers or receivables can decline sharply, thereby increasing our exposure to losses. We also face a concentration of credit risk as JLG’s ten largest debtors at September 30, 20092011 represented approximately 23% of our consolidated gross receivables. Some of these customers are highly leveraged. In fiscal 2009, we recorded $50.1 million in charges for credit losses, the vast majority of which was in the access equipment segment, reflecting the economic weakness throughout the world. In the future, we may incur losses in excess of our recorded reserves if the financial condition of our customers were to deteriorate further or the full amount of any anticipated proceeds from the sale of the collateral supporting our customers’ financial obligations is not realized. Our cash flows and overall liquidity may be materially adversely affected if any of the financial institutions that finance our customer receivables become unable or unwilling, due to current economic conditions, a weakening of our or their financial position or otherwise, to continue providing such credit.
21
Table of Contents
Systemic failures that the customer may identify could exceed recorded reserves or negatively affect our ability to win future business with the DoD or other foreign military customers.
As a result of the accelerated timetable from product design to full-scale production, the accelerated production schedule and limited field testing under the M-ATV contract and our ramp up to full-scale production of FMTVs, these vehicles could encounter systemic failures during fielding and use of the vehicles for which we may have responsibility. Additionally, we did not design the FMTV portfolio of trucks and trailers, and the design for this portfolio includes requirements that have caused us to implement manufacturing processes that we have not used extensively under previous contracts. If we do not implement these manufacturing processes correctly, then there could be systemic failures for which we may have responsibility. We have established reserves for the estimated cost of such systemic-type repairs based upon historical warranty rates of other defense programs in which we participate. If systemic issues arise, rectification costs could be in excess of the established reserves. If the DoD identifies systemic issues, this situation could impact our ability to win future business with the DoD or other foreign military customers, which would adversely affect our future earnings and cash flows.
A disruption or termination of the supply of parts, materials, components and final assemblies from third-party suppliers could delay sales of our vehicles and vehicle bodies.
We have experienced, and may in the future experience, significant disruption or termination of the supply of some of our parts, materials, components and final assemblies that we obtain from sole source suppliers or subcontractors. We may also incur a significant increase in the cost of these parts, materials, components or final assemblies. These risks are increased in the current difficulta weak economic environment andwith tight credit conditions and when demand increases coming out of an economic downturn. Specifically, we have recently experienced a number of parts shortages at our access equipment segment as demand for contracts like the M-ATV contract where we are expected to quickly ramp up to a very high rate of production.certain components currently exceeds suppliers’ capacity. Such disruptions, terminations or cost increases could result in manufacturing inefficiencies due to having to wait for parts to arrive on the production line, could delay sales of our vehicles and vehicle bodies and could result in a material adverse effect on our net sales, financial condition, profitability and/or cash flows. These risks are particularly serious with respect to our suppliers who participate in the automotive industry, from whom we obtain a significant portion of our parts, materials, components and final assemblies. Suppliers to the automotive industry have been severely impacted by the financial difficulties of auto manufacturers, the economic environment and credit conditions and face potential failure if the auto manufacturers’ businesses, the economic environment and credit conditions do not improve. These risks are also serious for suppliers for our M-ATV contract who must quickly ramp up to very high rates of production. Should they or their suppliers not plan or execute appropriately, we may not achieve our planned rate of production.
Raw material price fluctuations may adversely affect our results.
We purchase, directly and indirectly through component purchases, significant amounts of steel, petroleum based products and other raw materials annually. During fiscal 2008, steel and fuel prices increased significantly resulting in us paying higher prices for these items. Although fuel and steel prices declined during the first quarter of fiscal 2009, the cost of fuel has fluctuated and there are indications that the costs of fuel and steel may continue to fluctuate significantly in the future. Although we have firm, fixed-price contracts for some steel requirements and have some firm pricing contracts for components, we may not be able to hold all of our steel and component suppliers to pre-negotiated prices or negotiate timely component cost decreases commensurate with any steel and fuel cost decreases. Without limitation, these conditions could impact us in the following ways:
19
Table of Contents
· In the access equipment, fire & emergency and commercial segments, we implemented selling price increases to recover increased steel, component and fuel costs experienced in fiscal 2008. However, any such new product prices applied only to new orders, and we were not able to recover all cost increases from customers due to the amount of orders in our backlog prior to the effective dates of new selling prices. In the access equipment segment, some customers reacted adversely to these price increases in light of the subsequent declines in fuel and steel prices, and competitive conditions limited price increases in a time of global recession. Given the current global recession, it is possible that any price increases in any of our markets in response to rising costs could face unfavorable reaction from our customers. Price increases implemented in response to significantly higher fuel and steel prices were largely removed during the second half of fiscal 2009. If fuel and steel costs increase significantly again in the future, there are no assurances that we will be able to raise prices sufficiently to fully offset the impact of the higher fuel and steel costs.
· In the defense business, we are generally limited in our ability to raise prices in response to rising steel, component and fuel costs as we largely do business under annual firm, fixed-price contracts with the DoD. We attempt to limit this risk by obtaining firm pricing from suppliers at the time a contract is awarded. However, if these suppliers, including steel suppliers, do not honor their contracts, then we could face margin pressure in our defense business.
Our objective is to expand international operations, the conduct of which subjects us to risks that may have a material adverse effect on our business.
Expanding international sales is a part of our growth strategy. Our outlookdepends in part upon increases in international orders and sales that may not materialize. International operations and sales are subject to various risks, including political, religious and economic instability, local labor market conditions, the imposition of foreign tariffs and other trade barriers, the impact of foreign government regulations and the effects of income and withholding taxes, governmental expropriation and differences in business practices. We may incur increased costs and experience delays or disruptions in product deliveries and payments in connection with international manufacturing and sales that could cause loss of revenues and earnings. In addition, expansion into foreign markets requires the establishment of distribution networks and may require modification of products to meet local requirements or preferences. Establishment of distribution networks or modification to the design of our products to meet local requirements and preferences may take longer or be more costly than we anticipate and could have a material adverse effect on our ability to achieve international sales growth. In addition, our entry into certain markets that we wish to enter may require us to establish a joint venture. Identifying an appropriate joint venture partner and creating a joint venture could be more time consuming, more costly and more difficult than we anticipate.
As a result of our international operations and sales, we are subject to the Foreign Corrupt Practices Act (“FCPA”) and other laws that prohibit improper payments or offers of payments to foreign governments and their officials for the purpose of obtaining or retaining business. Our international activities create the risk of unauthorized payments or offers of payments in violation of the FCPA by one of our employees, consultants, sales agents or distributors, because these parties are not always subject to our control. Any violations of the FCPA could result in significant fines, criminal sanctions against us or our employees, and prohibitions on the conduct of our business, including our business with the U.S. government. We are also increasingly subject to export control regulations, including, without limitation, the United States Export Administration Regulations and the International Traffic in Arms Regulations. Unfavorable changes in the political, regulatory and business climate could have a material adverse effect on our net sales, financial condition, profitability and/or cash flows.
22
Table of Contents
We are subject to fluctuations in exchange rates and other risks associated with our non-U.S. operations that could adversely affect our results of operations and may significantly affect the comparability of our results between financial periods.
For the fiscal year ended September 30, 2009,2011, approximately 15%17% of our net sales were attributable to products sold outside of the United States, including approximately 10%14% that involved export sales from the United States. The majority of export sales are denominated in U.S. dollars. Sales outside the United States are typically made in the local currencies of those countries. Fluctuations in foreign currency can have an adverse impact on our sales and profits as amounts that are measured in foreign currency are translated back to U.S. dollars. We have sales of inventory denominated in U.S. dollars to certain of our subsidiaries that have functional currencies other than the U.S. dollar. The exchange rates between many of these currencies and the U.S. dollar have fluctuated significantly in recent years and may fluctuate significantly in the future. Such fluctuations, in particular those with respect to the Euro, the U.K. pound sterling,Chinese Renminbi, the Canadian dollar and the Australian dollar, may have a material effect on our net sales, financial condition, profitability and/or cash flows and may significantly affect the comparability of our results between financial periods. Any appreciation in the value of the U.S. dollar in relation to the value of the local currency will adversely affect our revenues from our foreign operations when translated into U.S. dollars. Similarly, any appreciation in the value of the U.S. dollar in relation to the value of the local currency of those countries where our products are sold will increase our costs in our foreign operations, to the extent such costs are payable in foreign currency, when translated into U.S. dollars.
Changes in regulations could adversely affect our business.
Both our products and the operation of our manufacturing facilities are subject to statutory and regulatory requirements. These include environmental requirements applicable to manufacturing and vehicle emissions, government contracting regulations and domestic and international trade regulations. A significant change to these regulatory requirements could substantially increase manufacturing costs or impact the size or timing of demand for our products, all of which could make our business results more variable.
20In particular, climate change is receiving increasing attention worldwide. Many scientists, legislators and others attribute climate change to increased levels of greenhouse gases, including carbon dioxide, which has led to significant legislative and regulatory efforts to limit greenhouse gas emissions. Congress has previously considered and may in the future implement restrictions on greenhouse gas emissions through a cap-and-trade system under which emitters would be required to buy allowances to offset emissions of greenhouse gas. In addition, several states, including states where we have manufacturing plants, are considering various greenhouse gas registration and reduction programs. Our manufacturing plants use energy, including electricity and natural gas, and certain of our plants emit amounts of greenhouse gas that may be affected by these legislative and regulatory efforts. Greenhouse gas regulation could increase the price of the electricity we purchase, increase costs for our use of natural gas, potentially restrict access to or the use of natural gas, require us to purchase allowances to offset our own emissions or result in an overall increase in our costs of raw materials, any one of which could increase our costs, reduce our competitiveness in a global economy or otherwise negatively affect our business, operations or financial results. While additional regulation of emissions in the future appears likely, it is too early to predict how this regulation will ultimately affect our business, operations or financial results.
Disruptions within our dealer network could adversely affect our business.
Although we sell the majority of our products directly to the end user, we market, sell and service products through a network of independent dealers in the fire & emergency segment and in a limited number of markets for the access equipment and commercial segments. As a result, our business with respect to these products is influenced by our ability to establish and manage new and existing relationships with dealers. While we have relatively low turnover of dealers, from time to time, we or a dealer may choose to terminate the relationship as a result of difficulties that our independent dealers experience in operating their businesses due to economic conditions or other factors, or as a result of an alleged failure by us or an independent dealer to comply with the terms of our dealer agreement. We do not believe our business is dependent on any single dealer, the loss of which would have a sustained material adverse effect upon our business. However, disruption of dealer coverage within a specific state or other geographic market could cause difficulties in marketing, selling or servicing our products and have an adverse effect on our business, operating results or financial condition.
23
Table of Contents
The mobile medical equipment market continuesIn addition, our ability to be negatively impacted by previously implemented reductionsterminate our relationship with a dealer is limited due to Medicare reimbursement rates. There currently are proposalsstate dealer laws, which generally provide that a manufacturer may not terminate or refuse to renew a dealer agreement unless it has first provided the dealer with required notices. Under many state laws, dealers may protest termination notices or petition for relief from termination actions. Responding to these protests and petitions may cause us to incur costs and, in Congresssome instances, could lead to change Medicare reimbursement rates,litigation resulting in lost opportunities with other dealers or lost sales opportunities, which if enacted, could further reduce demand for mobile medical equipment.may have an adverse effect on our business, operating results or financial condition.
We are the defendant inOur business could be negatively affected as a purported class action lawsuit.
On September 19, 2008, a purported shareholder of ours filed a complaint seeking certificationresult of a class action lawsuit in the United States District Court for the Eastern Districtthreatened proxy fight and other actions of Wisconsin docketed as Iron Workers Local No. 25 Pension Fund on behalf of itself and all others similarly situated v. Oshkosh Corporation and Robert G. Bohn. The lawsuit alleges, among other things, that we violated the Securities Exchange Act of 1934 by making materially inadequate disclosures and material omissions leading to our issuance of revised earnings guidance and announcement of an impairment charge on June 26, 2008. Since the initial lawsuit, other suits containing substantially similar allegations were filed. These lawsuits have been consolidated and an amended complaint has been filed. The amended complaint substantially expands the class period in which securities law violations are alleged to have occurred and names Charles L. Szews, David M. Sagehorn and our independent auditor as additional defendants. On July 24, 2009, the defendants filed their motions to dismiss the lawsuit, and the motions have been fully briefed. The motions are currently pending before the court. The uncertainty associated with this substantial unresolved lawsuit could harm our business, financial condition and reputation. The defense of the lawsuit diverts management’s time and attention away from business operations, and negative developments with respect to the lawsuit could cause a decline in the price of our stock. In addition, although we believe the lawsuit is entirely without merit and we intend to continue to vigorously defend against it, the outcome of the lawsuit cannot be predicted and ultimately may have a material adverse effect on our financial condition, profitability and/or cash flows.
Competition in our industries is intense and we may not be able to continue to compete successfully.activist shareholders.
We operate in highly competitive industries. Several of our competitors have greater financial, marketing, manufacturing and distribution resources than us and we are facing competitive pricingrecently received a notice from new entrants in certain markets. Our products may not continuefunds affiliated with Carl Icahn that discloses their intent to compete successfully with the products of competitors, and we may not be able to retain or increase our customer base or to improve or maintain our profit margins on salesnominate six individuals for election to our customers, allBoard of whichDirectors. If a proxy contest results from this notice or if other activist activities ensue, our business could be adversely affected because:
·Responding to proxy contests and other actions by activist shareholders can be costly and time-consuming, disrupt our operations and divert the attention of management and our employees;
·Perceived uncertainties as to our future direction may result in the loss of potential business opportunities and may make it more difficult to attract and retain qualified personnel and business partners; and
·If individuals are elected to our Board of Directors with a specific agenda, it may adversely affect our net sales, financial condition, profitability and/or cash flows.ability to effectively and timely implement our strategic plan.
ITEM 1B.
These actions could also cause our stock price to experience periods of volatility. | UNRESOLVED STAFF COMMENTS
|
None.ITEM 1B.UNRESOLVED STAFF COMMENTS
The Company has no unresolved staff comments regarding its periodic or current reports from the staff of the SEC that were issued 180 days or more preceding September 30, 2011. ITEM 2. PROPERTIES | PROPERTIES
|
The Company believes its equipment and buildings are well maintained and adequate for its present and anticipated needs. As of November 18, 2009,16, 2011, the Company operated in 5142 manufacturing facilities. The location, size and focus of the Company’s manufacturing facilities are provided in the table below:
| | Approximate | | | | Approximate | | |
| | Square Footage | | Principal | | Square Footage | | Principal |
Location (# of facilities) | | Owned | | Leased | | Products Manufactured | | Owned | | Leased | | Products Manufactured |
| | | | | | | | | | | | |
Defense | | | | | | | | | | | | |
Oshkosh, Wisconsin (8)(9) | | 967,000 | | 14,000 | | Defense Trucks; Front-Discharge Mixers; Snow Removal Vehicles | | 1,100,000 | | 119,000 | | Defense Trucks; Front-Discharge Mixers; Snow Removal Vehicles |
Killeen, Texas (1) | | 238,000 | | | | Defense Aftermarket Components | |
Oakes, North Dakota (1) | | | | 78,000 | | Defense Vehicle Components | |
Appleton, Wisconsin (1) | | | | 80,000 | | Defense Trucks | |
Appleton, Wisconsin (2) | | | | | 196,000 | | Defense Vehicle Components |
| | | | | | | |
Access Equipment | | | | | | | |
McConnellsburg, Pennsylvania (4) | | | 560,000 | | 35,000 | | Boom Lifts; Telehandlers; Carriers; Wreckers |
Shippensburg, Pennsylvania (1) | | | 330,000 | | | | Boom Lifts; Scissor Lifts; Trailer Boom Lifts; Telehandlers; Carriers; Wreckers |
Bedford, Pennsylvania (2) | | | 216,000 | | | | Boom Lifts; After-Sales Service and Support |
Greencastle, Pennsylvania (1) | | | 110,000 | | | | Fabrications |
Riverside, California (1) | | | | | 55,000 | | Trailers; After-Sales Service and Support |
Maasmechelen, Belgium (1) | | | | | 80,000 | | Scissor Lifts; Telehandlers; After-Sales Service and Support |
Orrville, Ohio (1) | | | 333,000 | | | | Telehandler and Boom Lift Subassemblies; Telehandlers; Vertical Mast Lifts |
2124
Table of Contents
| | Approximate | | | | Approximate | | |
| | Square Footage | | Principal | | Square Footage | | Principal |
Location (# of facilities) | | Owned | | Leased | | Products Manufactured | | Owned | | Leased | | Products Manufactured |
| | | | | | | | | | | | |
Access Equipment | | | | | | | |
McConnellsburg, Pennsylvania (3) | | 560,000 | | 27,000 | | Boom Lifts; Telehandlers; M-ATVs | |
Shippensburg, Pennsylvania (1) | | 330,000 | | | | Boom Lifts; Scissor Lifts; Trailer Boom Lifts; Telehandlers | |
Bedford, Pennsylvania (1) | | 133,000 | | | | Boom Lifts; After-Sales Service and Support | |
Riverside, California (1) | | | | 55,000 | | Trailers; After-Sales Service and Support | |
Maasmechelen, Belgium (1) | | | | 80,000 | | Boom Lifts; Scissor Lifts; Telehandlers; After-Sales Service and Support | |
Orrville, Ohio (1) | | 333,000 | | | | Telehandler and Boom Lift Subassemblies; Telehandlers; Vertical Mast Lifts | |
Access Equipment (continued) | | | | | | | |
Tonneins, France (1) | | 38,000 | | | | Vertical Mast Lifts | | | | 65,000 | | Vertical Mast Lifts |
Fauillett, France (2) | | | | 91,000 | | Vertical Mast Lifts; After-Sales Service and Support | |
Port Macquarie, Australia (1) | | 102,000 | | | | Light Towers; After-Sales Service and Support | | 25,000 | | | | Light Towers; After-Sales Service and Support |
Medias, Romania (1) | | | | 126,000 | | Heavy Steel Fabrications | | | | 249,000 | | Boom Lifts; Heavy Steel Fabrications |
Tianjin, China (1) | | | 193,000 | | | | Boom Lifts; Scissor Lifts |
| | | | | | | | | | | | |
Fire & Emergency | | | | | | | | | | | | |
Appleton, Wisconsin (3) | | 557,000 | | 16,000 | | Fire Apparatus; ARFF Vehicles | | 557,000 | | 16,000 | | Fire Apparatus; ARFF Vehicles; Trailers; Simulators |
Bradenton, Florida (1) | | 300,000 | | | | Fire Apparatus | | 300,000 | | | | Fire Apparatus; Ambulances |
Kewaunee, Wisconsin (1) | | 292,000 | | | | Aerial Devices and Heavy Steel Fabrication | | 216,000 | | | | Aerial Devices; Heavy Steel Fabrications |
Greencastle, Pennsylvania (3) | | 136,000 | | 142,000 | | Carriers and Wreckers | |
Goshen, Indiana (5) | | 87,000 | | | | Ambulances | |
White Pigeon, Michigan (1) | | 64,000 | | | | Ambulances | |
Calumet City, Illinois (1) | | 87,000 | | | | Mobile Medical Trailers | |
Harvey, Illinois (1) | | 78,000 | | | | Mobile Medical Trailers | |
Oud-Beijerland, Holland (1) | | | | 98,000 | | Mobile Medical Trailers | | | | 98,000 | | Mobile Medical Trailers |
Clearwater, Florida (1) | | | | 96,000 | | Broadcast Equipment | | | | 96,000 | | Broadcast Equipment; Mobile Medical Trailers |
| | | | | | | | | | | | |
Commercial | | | | | | | | | | | | |
Dodge Center, Minnesota (1) | | 711,000 | | | | Rear-Discharge Mixers; Refuse Collection Vehicles | | 711,000 | | | | Rear-Discharge Mixers; Refuse Collection Vehicles |
Dexter, Minnesota (1) | | | | 53,000 | | Revolution Composite Concrete Mixer Drums | | | | 53,000 | | Revolution Composite Concrete Mixer Drums |
Riceville, Iowa (1) | | 108,000 | | | | Components for Rear-Discharge Mixers, Concrete Batch Plants and Refuse Collection Vehicles | | 108,000 | | | | Components for Rear-Discharge Mixers; Concrete Batch Plants and Refuse Collection Vehicles |
McIntire, Iowa (1) | | 28,000 | | | | Components for Load Handling Systems | | 28,000 | | | | Components for Load Handling Systems |
Blair, Nebraska (2) | | 91,000 | | 20,000 | | Concrete Batch Plants | | 91,000 | | 20,000 | | Concrete Batch Plants |
Audubon, Iowa (1) | | 15,000 | | | | Components for Concrete Batch Plants | | 15,000 | | | | Components for Concrete Batch Plants |
London, Canada (1) | | | | 110,000 | | Rear-Discharge Mixers | | | | 156,000 | | Rear-Discharge Mixers |
Garner, Iowa (1) | | 262,000 | | | | Field Service Vehicles and Articulating Cranes | | 262,000 | | | | Field Service Vehicles; Articulating Cranes |
The Company’s manufacturing facilities generally operate five days per week on one or two shifts, except for seasonal shutdowns for one to three week periods. The Company implemented additional periodic shutdowns in multiple businesses in fiscal 2009 in response to lower demand resulting from the global recession.continued weak economic conditions. The Company expects periodic shutdowns to continue in fiscal 2010.2012. The Company believes its manufacturing capacity could be significantly increased with limited capital spending by working an additional shift at each facility.
The Company also performs contract maintenance services out of multiple warehousing and service facilities owned and/or operated by the U.S. government and third parties, including locations in the U.S., Japan, Kuwait, Iraq, Afghanistan and multiple other countries in Europe and the Middle East.
In addition to sales and service activities at the Company’s manufacturing facilities, the Company maintains 2021 sales and service centers in the U.S. These facilities are used primarily for sales and service of concrete mixers and refuse collection vehicles.
22
Table of Contents
JLG The access equipment segment also leases executive offices in Hagerstown, Maryland and a number of small distribution, engineering, administration or service facilities throughout the world.
ITEM 3.LEGAL PROCEEDINGS | LEGAL PROCEEDINGS
|
The Company is subject to environmental matters and legal proceedings and claims, including patent, antitrust, shareholder, product liability, warranty and state dealership regulation compliance proceedings that arise in the ordinary course of business. Although the final results of all such matters and claims cannot be predicted with certainty, the Company believes that the ultimate resolution of all such matters and claims will not have a material adverse effect on the Company’s financial condition, results of operations or cash flows.
Securities Class Action -Environmental matters. On September 19, 2008, a purported shareholder of the Company filed a complaint seeking certification of a class action lawsuit in the United States District Court for the Eastern District of Wisconsin docketed as Iron Workers Local No. 25 Pension Fund on behalf of itself and all others similarly situated v. Oshkosh Corporation and Robert G. Bohn. The lawsuit alleges, among other things, that the Company violated the Securities Exchange Act of 1934 by making materially inadequate disclosures and material omissions leading to the Company’s issuance of revised earnings guidance and announcement of an impairment charge on June 26, 2008. Since the initial lawsuit, other suits containing substantially similar allegations were filed. These lawsuits have been consolidated and an amended complaint has been filed. The amended complaint substantially expands the class period in which securities law violations are alleged to have occurred and names Charles L. Szews, David M. Sagehorn and the Company’s independent auditor as additional defendants. On July 24, 2009, the defendants filed their motions to dismiss the lawsuit, and the motions have been fully briefed. The motions are currently pending before the court. The Company believes the lawsuit to be entirely without merit and plans to continue to vigorously defend against the lawsuit.
Environmental Matters - As part of its routine business operations, the Company disposes of and recycles or reclaims certain industrial waste materials, chemicals, and solvents at third-party disposal and recycling facilities, which are licensed by appropriate governmental agencies. In some instances, these facilities have been and may be designated by the United States Environmental Protection Agency (“EPA”) or a state environmental agency for remediation. Under the
25
Table of Contents
Comprehensive Environmental Response, Compensation, and Liability Act and similar state laws, each potentially responsible party (“PRP”) that contributed hazardous substances may be jointly and severally liable for the costs associated with cleaning up these sites. Typically, PRPs negotiate a resolution with the EPA and/or the state environmental agencies. PRPs also negotiate with each other regarding allocation of the cleanup cost. The Company has been named a PRP with regard to three multiple-party sites. Based on current estimates, the Company believes its liability at these sites will not be material and any responsibility of the Company is adequately covered through established reserves.
The Company has been addressing a regional trichloroethylene (“TCE”) groundwater plume on the south side of Oshkosh, Wisconsin. The Company believes there may be multiple sources of TCE in the area. TCE was detected at the Company’s North Plant facility with testing showing the highest concentrations in a monitoring well located on the upgradient property line. In July 2009, upon completion of additional testing with favorable results at the Company’s North Plant facility, the State of Wisconsin Department of Natural Resources (“WDNR”) agreed to close its investigation of the North Plant facility and not to require any remediation at the North Plant facility at this time provided that the Company and any subsequent owner of the North Plant facility comply with certain conditions. The WDNR may reopen its investigation of the matter if additional evidence of contamination at the North Plant facility is discovered. Also, as part of the regional TCE groundwater investigation, the Company conducted a groundwater investigation of a former landfill located on Company property. The landfill, acquired by the Company in 1972, is approximately 2.0 acres in size and is believed to have been used for the disposal of household waste. Based on the investigation, the Company believes, and the WDNR has concurred, that the landfill is not one of the sources of the TCE contamination. As such, in March 2009, the WDNR agreed to close its investigation of the landfill as a possible source of the TCE and not to require any remediation at the landfill at this time, provided that the Company and any subsequent owner of the landfill comply with certain conditions. The landfill will remain on the State of Wisconsin’s registry of former landfills. The WDNR may reopen its investigation of the matter if additional evidence of contamination at the landfill is discovered. Based upon current knowledge, the Company believes its liability associated with the TCE issue will not be material and is adequately covered through reserves established by the Company. However, this may change as investigations by unrelated property owners and the government proceed.
23
Table of Contents
The Company had reserves of $2.1 million for environmental matters at September 30, 20092011 for losses that were probable and estimable. The amount recorded for identified contingent liabilities is based on estimates. Amounts recorded are reviewed periodically and adjusted to reflect additional technical and legal information that becomes available. Actual costs to be incurred in future periods may vary from the estimates, given the inherent uncertainties in evaluating certain exposures. Subject to the imprecision in estimating future contingent liability costs, the Company does not expect that any sum it may have to pay in connection with these matters in excess of the amounts recorded will have a materiallymaterial adverse effect on itsthe Company’s financial position, results of operations or liquidity.cash flows.
Personal Injury Actionsinjury actions and Other — other.At September 30, 2009,2011, the Company had product and general liability reserves of $46.8$41.7 million. Although the final results of all such matters and claims cannot be predicted with certainty, the Company believes that the ultimate resolution of all such matters and claims, after taking into account the liabilities accrued with respect to all such matters and claims, will not have a material adverse effect on the Company’s financial condition, results of operations or cash flows. Actual results could vary, among other things, due to the uncertainties involved in litigation.
Since all of these matters areOn January 8, 2010, Control Solutions LLC (“Control Solutions”) brought suit against the Company in the preliminary stages,United States District Court for the Northern District of Illinois for breach of express contract, breach of implied-in-fact contract, unjust enrichment and promissory estoppel related to the Company’s contract to supply the DoD with M-ATVs. Control Solutions has asserted damages in the amount of $190.3 million. On October 3, 2011, following written and oral discovery, the Company moved for summary judgment. On that same date, Control Solutions filed a cross-motion for summary judgment. The Company’s and Control Solutions’ response briefs have been filed with the Court. While this case is unable to predictin the scope orearly stages of litigation and its outcome or quantify their eventual impact, if any,cannot be predicted with certainty, the Company believes that the ultimate resolution of this claim will not have a material adverse effect on the Company. At this time,Company’s financial condition, results of operations or cash flows. Actual results could vary, among other things, due to the Company is also unable to estimate associated expenses or possible losses. The Company maintains insurance that may limit its financial exposure for defense costs and liability for an unfavorable outcome, should it not prevail, for claims covered by the insurance coverage.
ITEM 4.
| SUBMISSION OF MATTERS TO A VOTE OF SECURITY HOLDERS
|
No matters were submitted to a vote of security holders during the three months ended September 30, 2009.uncertainties involved in litigation.
EXECUTIVE OFFICERS OF THE REGISTRANT
The following table sets forth certain information as of November 18, 200916, 2011 concerning the Company’s executive officers. All of the Company’s officers serve terms of one year and until their successors are elected and qualified.
Name | | Age | | Title |
Robert G. Bohn
| | 56
| | Chairman and Chief Executive Officer
|
Charles L. Szews | | 5254
| | President and Chief OperatingExecutive Officer |
Bryan J. Blankfield | | 4850
| | Executive Vice President, General Counsel and Secretary |
Thomas D. FennerGregory L. Fredericksen
| | 5350
| | Executive Vice President, Global Manufacturing ServicesChief Procurement Officer |
R. Andrew HoveJames W. Johnson
| | 47
| | Executive Vice President and President, Defense Business
|
Wilson R. Jones
| | 4846
| | Executive Vice President and President, Fire & Emergency Segment |
Wilson R. Jones | | 50 | | Executive Vice President and President, Access Equipment Segment |
Joseph H. Kimmitt | | 5961
| | Executive Vice President, Government Operations and Industry Relations |
Craig E. PaylorJosef Matosevic
| | 40 | | Executive Vice President, Global Manufacturing Operations |
Colleen R. Moynihan* | | 51 | | Senior Vice President, Total Quality Management |
Frank R. Nerenhausen | | 47 | | Executive Vice President and President, Commercial Segment |
Thomas J. Polnaszek | | 54 | | Senior Vice President, Finance and Controller |
Mark M. Radue | | 47 | | Senior Vice President, Business Development |
Michael K. Rohrkaste | | 53 | | Executive Vice President, and President, JLG Industries, Inc. |
Michael K. Rohrkaste
| | 51
| | Executive Vice President, Chief Administration Officer-Electand Human Resources Officer
|
David M. Sagehorn | | 4648
| | Executive Vice President and Chief Financial Officer |
Donald H. Verhoff
| | 63
| | Executive Vice President, Technology
|
Michael J. WuestGary W. Schmiedel
| | 50 | | Executive Vice President, and President, Commercial SegmentTechnology |
Matthew J. ZolnowskiJohn M. Urias
| | 5658
| | Executive Vice President Chief Administration Officerand President, Defense Segment |
Robert G. Bohn*. Mr. Bohn joinedMs. Moynihan is a recent hire and is not yet deemed to be an executive officer as defined under the Company in 1992 as Vice President-Operations. He was appointed Presidentapplicable rules and Chief Operating Officer in 1994. He was appointed Chief Executive Officer in 1997 and Chairmanregulations of the Board in 2000. Mr. Bohn��s title was changed to Chairman and Chief Executive Officer in 2007. Mr. Bohn was elected a DirectorSecurities Exchange Commission.
26
Table of the Company in 1995. He is a director of Carlisle Companies Inc. and Menasha Corporation.Contents
Charles L. Szews.Mr. Szews joined the Company in 1996 as Vice President and Chief Financial Officer. He served as Executive Vice President and Chief Financial Officer from 1997 until 2007, at which time he was appointed President and Chief Operating Officer. Effective January 1, 2011, Mr. Szews assumed the position of President and Chief Executive Officer. Mr. Szews was elected a Director of the Company in 2007. He is a director of Gardner Denver, Inc.
24
Table of Contents
Bryan J. BlankfieldBlankfield.. Mr. Blankfield joined the Company in 2002 as Vice President, General Counsel and Secretary and was appointed to his present position of Executive Vice President, General Counsel and Secretary in 2003.
Thomas D. FennerGregory L. Fredericksen.. Mr. FennerFredericksen joined the Company in 19822008 as a scheduler and has served in various assignments, including Plant Manager, Vice President — Manufacturing of McNeilus, Vice President — Manufacturing Operations, Vice President and General Manager of Operations of Pierce andSenior Vice President, Chief Procurement Officer and was appointed to his present position of Executive Vice President, Chief Procurement Officer in 2010. He previously served as Executive Director, Global Purchasing and Supply Chain - Current/Future Business, Business Process at General Manager, Airport Business.Motors Corporation from 2005 to 2006 and Executive Director, Global Purchasing and Supply Chain - Current/Future Business, Business Process, Structures & Closures at General Motors Corporation from 2006 to 2008.
James W. Johnson. Mr. Johnson joined the Company in 2007 as the Director of Dealer Development for Pierce. He was appointed Executiveto Senior Vice President of Sales and President, Fire & Emergency GroupMarketing for Pierce in 20072009 and was appointed to his current position in 2008.
R. Andrew Hove. Mr. Hove joined the Company’s defense business in 2009 as Executive Vice President and President, Defense.2010. He previously served as Vice President — Corporate Internal AuditDealer Development Manager at BAE Systems from 2008 to 2009. He served as Vice PresidentForest River, Inc. (a manufacturer primarily of Combat Systems Programs at BAE Systemsrecreational vehicles) from 2006 to 2008, where he was responsible for a portfolio of domestic and international ground combat vehicle programs. Prior to that, he served as Director of Bradley Programs at BAE Systems from 2002 to 2006. He also serves on the National Defense Industrial Association national board of directors and is a member of its Ethics Committee.2007.
Wilson R. JonesJones. . Mr. Jones joined the Company in 2005 as Vice President and General Manager of the Airport Products business. He was appointed President, Pierce in 2007, was appointed Executive Vice President and President, Fire & Emergency Segment in 2008, and was appointed to his current position in 2008. Prior to joining the Company, Mr. Jones was theExecutive Vice President of Sales and Marketing for Akron Brass Company from 2002 to 2005.President, Access Equipment Segment in 2010.
Joseph H. Kimmitt. Mr. Kimmitt joined the Company in 2001 as Vice President, Government Operations and was appointed to his current position in 2006. He previously served as a Professional Staff Member of the U.S. House and Senate Appropriations Committees from 1984 to 2001. He was appointed Deputy Staff Director of the Senate Appropriations Committee in 1997.
Craig E. Paylor.Josef Matosevic. Mr. PaylorMatosevic joined the Company in 2006 with2008 as Vice President of Global Lean Deployment. He was appointed Vice President of Operations for the acquisition of JLGDefense Segment in January 2009, was appointed Senior Vice President, Global Operating Systems and Lean Deployment in May 2009, and was appointed to his current position in 2010. He previously served as Vice President of Global Operations from 2005 to 2007 and Chief Operating Officer from 2007 to 2008 at Wynnchurch Capital/Android Industries (a sub-assembler and sequencer of complex modules for automotive OEM’s).
Colleen R. Moynihan. Ms. Moynihan joined the Company in July 2011 as the Senior Vice President, Total Quality Management. She previously served as the Director of Global Quality at Caterpillar Inc. from 2007 to 2011 and Director of Powertrain Quality — Global Quality at Ford Motor Company from 2003 to 2007.
Frank R. Nerenhausen. Mr. PaylorNerenhausen joined JLGthe Company in 19831986 and has served in various assignments, including Vice President Concrete Placement from 2005 to 2008 and Vice President of Concrete & Refuse Sales & Marketing from 2008 to 2010 for McNeilus. He was appointed to his current position in 2010.
Thomas J. Polnaszek. Mr. Polnaszek joined the Company in 1998 as a sales representative.Controller. He was promoted to Vice President and Controller in 1998 and appointed to his present position in 2007.
Mark M. Radue. Mr. Paylor became an officerRadue joined the Company in 2005 as Senior Director of JLGFinancial Planning and Analysis. He was promoted to Vice President of Business Development in 19962005 and was appointed Senior Vice President of Sales and Market Developmentto his present position in 1999. In 2002, he was appointed JLG’s Senior Vice President, Sales, Marketing and Customer Support. In 2006, he was appointed JLG’s Senior Vice President, Marketing. In 2007, he was appointed as a Senior Vice President of the Company and President of JLG.2011.
Michael K. Rohrkaste. Mr. Rohrkaste joined the Company in 2003 as Vice President—President, Human Resources in 2003. Effective December 31, 2009, Mr. Rohrkaste will be promoted to the position ofResources. He was appointed Executive Vice President, Chief Administration Officer.Officer in 2009 and was appointed to his current position in January 2010.
27
Table of Contents
David M. SagehornSagehorn.. Mr. Sagehorn joined the Company in 2000 as Senior Manager —- Mergers & Acquisitions and has served in various assignments, including Director—Director - Business Development, Vice President—President - Defense Finance, Vice President-McNeilusPresident - McNeilus Finance and Vice President-BusinessPresident - Business Development. In 2005, he was appointed Vice President and Treasurer, and he was appointed to his presentcurrent position in 2007.
Donald H. Verhoff.Gary W. Schmiedel. Mr. VerhoffSchmiedel joined the Company in 19731983 and has served in various engineering assignments, including Director Test and Development/New Product Development, Director CorporateSenior Vice President - Defense Engineering and Technology. He was appointed Executive Vice President, of Technology. Mr. Verhoff was appointed to his present positionTechnology in 1998.February 2011.
Michael J. WuestJohn M. Urias. Mr. WuestUrias joined the Company in 1981October 2011 as an analyst and has served in various assignments, including Senior Buyer, Director of Purchasing, Vice President — Manufacturing Operations,the Executive Vice President and General Manager of Operations of Pierce and ExecutivePresident, Defense Segment. He previously served as Vice President Chief Procurement Officerof Programs in 2011; Vice President, Programs and UAE Surface Launched AMRAAM Capture Lead, National and Theater Strategic Programs from 2010 to 2011 and Vice President, Force Application Programs for Integrated Defense Systems from 2009 to 2010, in each case at Raytheon Company. From 2006 to 2007, he served as Vice President and Sector Manager, Defense Systems Sector for Quantum Research International, Inc. Mr. Urias retired from the U.S. Army with the rank of Major General Manager, Airport Business. Mr. Wuest was appointed to his present position in 2004.2005.
Matthew J. Zolnowski.28 Mr. Zolnowski joined the Company as Vice President—Human Resources in 1992, was appointed Vice President, Administration in 1994 and was appointed to his present position in 1999. Mr. Zolnowski intends to retire from the Company and, in connection with his retirement, to resign from his present position effective December 31, 2009.
25
Table of Contents
PART II
ITEM 5.MARKET FOR REGISTRANT’S COMMON EQUITY, RELATED STOCKHOLDER MATTERS AND ISSUER PURCHASES OF EQUITY SECURITIES | MARKET FOR REGISTRANT’S COMMON EQUITY, RELATED STOCKHOLDER MATTERS AND ISSUER PURCHASES OF EQUITY SECURITIES
|
The information relating to dividends included in Notes 15 and 22Note 25 of the Notes to Consolidated Financial Statements contained herein under Item 8 and the information relating to dividends per share contained herein under Item 6 are hereby incorporated by reference in answer to this item.
In July 1995, the Company’s Board of Directors authorized the repurchase of up to 6,000,000 shares of Common Stock. The Company did not repurchase any shares under this authorization during fiscal 2009.2011. As of September 30, 2009,2011, the Company had repurchased 2,769,210 shares under this program at a cost of $6.6 million, leaving the Company with authority to repurchase 3,230,790 shares of Common Stock under this program. There is no expiration date associated with the Board authorization.
Dividends and Common Stock Price
The Company suspended the payment ofdid not pay dividends on its Common Stock effective April 2009.in fiscal 2011 or fiscal 2010. The payment of future dividends is at the discretion of the Company’s Board of Directors and will depend upon, among other things, future earnings and cash flows, capital requirements, the Company’s general financial condition, general business conditions or other factors. In addition, the Company’s credit agreement limits the amount of dividends it may pay. Underpay to $50 million during any fiscal year; plus the most restrictive limitation, when the Company’s Leverage Ratio (as defined in the credit agreement) asexcess of (a) 25% of the endcumulative net income of a fiscal quarter is greater than 4.0 to 1.0, the Company may not make a dividend payment if,and its consolidated subsidiaries for all fiscal quarters ending after giving effect to such dividend payment,September 27, 2010, over (b) the aggregatecumulative amount of all such dividend paymentsdividends and other distributions made in any fiscal year ending after such date that exceed $50 million, plus (c) for each of the first four fiscal quarters ending after September 27, 2010, $25 million per fiscal quarter, would exceedin each case provided that the sum of $0.01 per outstanding shareleverage ratio (as defined) as of the Company’s Common Stocklast day of the most recently ended fiscal quarter was less than 2.0 to 1.0; plus $250,000 or(d) for the aggregate amountperiod of allfour fiscal quarters ending September 30, 2011 and for each period of four fiscal quarters ending thereafter, $100 million during such dividend payments and other distributions madeperiod, in each case provided that the applicableleverage ratio (as defined) as of the last day of the most recently ended fiscal year would exceed $3.85 million.quarter was less than 2.0 to 1.0. See “Management’s Discussion and Analysis of Financial Condition and Results of Operations — Liquidity and Capital Resources” for further discussion about the Company’s financial covenants under its credit agreement.
The Company’s Common Stock is listed on the New York Stock Exchange (“NYSE”) under the symbol OSK. As of November 16, 2009,11, 2011, there were 1,4641,343 holders of record of the Common Stock. The following table sets forth prices reflecting actual sales of the Common Stock as reported on the NYSE and dividends paid for the periods indicated.
| | Fiscal 2009 | | Fiscal 2008 | | | Fiscal 2011 | | Fiscal 2010 | |
Quarter Ended | | High | | Low | | Dividends | | High | | Low | | Dividends | | | High | | Low | | High | | Low | |
| | | | | | | | | | | | | | | | | | | | | | |
September 30 | | $ | 34.99 | | $ | 17.80 | | $ | — | | $ | 20.95 | | $ | 9.05 | | $ | 0.10 | | | $ | 33.78 | | $ | 15.65 | | $ | 36.14 | | $ | 24.63 | |
June 30 | | 15.76 | | 6.35 | | — | | 42.59 | | 19.75 | | 0.10 | | | 36.73 | | 25.25 | | 44.57 | | 31.07 | |
March 31 | | 12.23 | | 4.74 | | 0.10 | | 48.21 | | 35.00 | | 0.10 | | | 40.11 | | 32.37 | | 41.78 | | 34.24 | |
December 31 | | 13.09 | | 3.85 | | 0.10 | | 63.55 | | 44.85 | | 0.10 | | | 35.98 | | 27.35 | | 41.99 | | 28.13 | |
|
Item 12 of this Annual Report on Form 10-K contains certain information relating to the Company’s equity compensation plans.
The following information in this Item 5 is not deemed to be “soliciting material” or to be “filed” with the SEC or subject to Regulation 14A or 14C under the Securities Exchange Act of 1934 (“Exchange Act”) or to the liabilities of Section 18 of the Exchange Act, and will not be deemed to be incorporated by reference into any filing under the Securities Act of 1933 or the Exchange Act, except to the extent the Company specifically incorporates it by reference into such a filing: thefiling. The SEC requires the Company to include a line graph presentation comparing cumulative five year Common Stock returns with a broad-based stock index and either a nationally recognized industry index or an index of peer companies selected by the Company. The Company has chosen to use the Standard & Poor’s MidCap 400 market index as the broad-based index and the companies currently in the Standard Industry Classification Code 371 Index (motor vehicles and equipment) (the “SIC Code 371 Index”) as a more specific comparison.
2629
Table of Contents
The comparisons assume that $100 was invested on September 30, 20042006 in each of: ourthe Company’s Common Stock, the SIC Code 371 Index and the Standard & Poor’s MidCap 400 market index.index and the SIC Code 371 Index. The total return assumes reinvestment of dividends and is adjusted for stock splits. The fiscal 20092011 return listed in the charts below is based on closing prices per share on September 30, 2009.2011. On that date, the closing price for the Company’s Common Stock was $30.93.
COMPARISON OF 5 YEAR CUMULATIVE TOTAL RETURN*
Among Oshkosh Corporation, The S&P Midcap 400 Index
And SIC Code 371 Index$15.74.
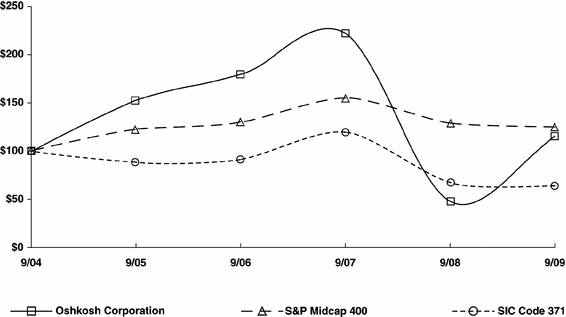
*$100 $100 invested on September 30, 20042006 in stock or index, including reinvestment of dividends.
Fiscal year ended September 30, | | 2004 | | 2005 | | 2006 | | 2007 | | 2008 | | 2009 | | | 2006 | | 2007 | | 2008 | | 2009 | | 2010 | | 2011 | |
| | | | | | | | | | | | | | | | | | | | | | | | | | |
Oshkosh Corporation | | $ | 100.00 | | $ | 152.19 | | $ | 179.27 | | $ | 221.77 | | $ | 47.70 | | $ | 115.20 | | | $ | 100.00 | | 123.70 | | 26.61 | | 64.26 | | 57.14 | | 32.70 | |
S&P Midcap 400 market index | | $ | 100.00 | | $ | 122.16 | | $ | 130.17 | | $ | 154.59 | | $ | 128.81 | | $ | 124.80 | | | $ | 100.00 | | 118.76 | | 98.95 | | 95.87 | | 112.92 | | 111.47 | |
SIC Code 371 Index | | $ | 100.00 | | $ | 88.35 | | $ | 91.13 | | $ | 119.27 | | $ | 67.25 | | $ | 63.71 | | | $ | 100.00 | | 137.64 | | 91.14 | | 91.51 | | 131.20 | | 113.97 | |
2730
Table of Contents
ITEM 6.
| SELECTED FINANCIAL DATA
|
Fiscal YearITEM 6.SELECTED FINANCIAL DATA
(In millions, except per share amounts) | | 2009 (3) | | 2008 | | 2007 (4) | | 2006 | | 2005 (5) (6) | |
Income Statement Data: | | | | | | | | | | | |
Net sales | | $ | 5,295.2 | | $ | 6,936.4 | | $ | 6,139.3 | | $ | 3,233.4 | | $ | 2,779.4 | |
Gross income | | 706.0 | | 1,178.3 | | 1,086.5 | | 577.9 | | 474.6 | |
Intangible asset impairment charges (1) | | 1,199.8 | | 1.0 | | — | | — | | — | |
Depreciation | | 75.7 | | 73.4 | | 54.7 | | 25.1 | | 19.8 | |
Amortization of purchased intangible assets, deferred financing costs and stock-based compensation | | 86.7 | | 91.0 | | 83.5 | | 19.4 | | 10.5 | |
Operating (loss) income | | (992.0 | ) | 615.0 | | 609.1 | | 322.5 | | 275.8 | |
(Loss) income from continuing operations | | (1,172.3 | ) | 286.9 | | 285.3 | | 204.4 | | 168.6 | |
Per share assuming dilution | | (15.33 | ) | 3.83 | | 3.81 | | 2.75 | | 2.29 | |
(Loss) income from discontinued operations | | 73.5 | | (207.6 | ) | (17.2 | ) | 1.1 | | (8.4 | ) |
Per share assuming dilution | | 0.96 | | (2.77 | ) | (0.23 | ) | 0.01 | | (0.11 | ) |
Net (loss) income | | (1,098.8 | ) | 79.3 | | 268.1 | | 205.5 | | 160.2 | |
Per share assuming dilution | | (14.37 | ) | 1.06 | | 3.58 | | 2.76 | | 2.18 | |
Dividends per share: | | | | | | | | | | | |
Class A Common Stock (2) | | — | | — | | — | | — | | 0.0750 | |
Common Stock | | 0.2000 | | 0.4000 | | 0.4000 | | 0.3675 | | 0.2213 | |
Balance Sheet Data: | | | | | | | | | | | |
Total assets (1) | | 4,768.0 | | 6,081.5 | | 6,399.8 | | 2,110.9 | | 1,718.3 | |
Net working capital | | 484.6 | | 689.2 | | 646.9 | | 121.4 | | 178.8 | |
Long-term debt (including current maturities) | | 2,024.3 | | 2,757.7 | | 3,022.0 | | 2.9 | | 3.1 | |
Shareholders’ equity | | 514.1 | | 1,388.6 | | 1,393.6 | | 1,061.9 | | 818.7 | |
Other Financial Data: | | | | | | | | | | | |
Expenditures for property, plant and equipment | | 46.2 | | 75.8 | | 83.0 | | 56.0 | | 43.2 | |
Backlog | | 5,615.4 | | 2,353.8 | | 3,177.8 | | 1,914.3 | | 1,944.1 | |
Book value per share | | 5.75 | | 18.66 | | 18.78 | | 14.40 | | 11.16 | |
| | | | | | | | | | | | | | | | |
Fiscal Year | | | | | | | | | | | |
(In millions, except per share amounts) | | 2011 (1) (2) | | 2010 (1) | | 2009 (3) (4) | | 2008 | | 2007 (5) | |
Income Statement Data: | | | | | | | | | | | |
Net sales | | $ | 7,584.7 | | $ | 9,842.4 | | $ | 5,253.1 | | $ | 6,877.7 | | $ | 6,089.9 | |
Gross income | | 1,079.7 | | 1,970.0 | | 703.3 | | 1,170.0 | | 1,081.7 | |
Intangible asset impairment charges | | 4.8 | | 25.6 | | 1,190.2 | | 1.0 | | — | |
Depreciation | | 78.5 | | 83.8 | | 75.1 | | 72.8 | | 54.3 | |
Amortization of purchased intangibles, deferred financing costs and stock-based compensation (6) | | 81.4 | | 103.8 | | 86.6 | | 90.8 | | 83.3 | |
Operating income (loss) | | 500.9 | | 1,394.1 | | (979.5 | ) | 617.4 | | 610.5 | |
Income (loss) attributable to Oshkosh Corporation common shareholders: | | | | | | | | | | | |
From continuing operations | | 273.4 | | 792.9 | | (1,167.0 | ) | 288.9 | | 286.4 | |
From discontinued operations (7) | | — | | (2.9 | ) | 68.2 | | (209.6 | ) | (18.3 | ) |
Net income (loss) | | 273.4 | | 790.0 | | (1,098.8 | ) | 79.3 | | 268.1 | |
Income (loss) attributable to Oshkosh Corporation common shareholders per share assuming dilution: | | | | | | | | | | | |
From continuing operations | | $ | 2.99 | | $ | 8.72 | | $ | (15.26 | ) | $ | 3.86 | | $ | 3.83 | |
From discontinued operations | | — | | (0.03 | ) | 0.89 | | (2.80 | ) | (0.25 | ) |
Net income (loss) | | 2.99 | | 8.69 | | (14.37 | ) | 1.06 | | 3.58 | |
Dividends per share | | $ | — | | $ | — | | $ | 0.20 | | $ | 0.40 | | $ | 0.40 | |
| | | | | | | | | | | |
Balance Sheet Data: | | | | | | | | | | | |
Total assets | | $ | 4,826.9 | | $ | 4,708.6 | | $ | 4,768.0 | | $ | 6,081.5 | | $ | 6,399.8 | |
Net working capital | | 762.8 | | 403.9 | | 484.6 | | 689.2 | | 646.9 | |
Long-term debt (including current maturities) | | 1,060.1 | | 1,152.1 | | 2,024.3 | | 2,757.7 | | 3,022.0 | |
Oshkosh Corporation shareholders’ equity | | 1,596.5 | | 1,326.6 | | 514.1 | | 1,388.6 | | 1,393.6 | |
| | | | | | | | | | | |
Other Financial Data: | | | | | | | | | | | |
Expenditures for property, plant and equipment | | $ | 82.3 | | $ | 83.2 | | $ | 46.2 | | $ | 75.8 | | $ | 83.0 | |
Backlog | | 6,478.4 | | 5,401.4 | | 5,615.4 | | 2,353.8 | | 3,177.8 | |
Book value per share | | $ | 17.48 | | $ | 14.63 | | $ | 5.75 | | $ | 18.66 | | $ | 18.78 | |
(1)In the fourth quarter of fiscal 2009, the Company began production on a sole source contract awarded by the DoD for
M-ATVs. During fiscal 2011 and 2010, the Company delivered 645 and 7,539 M-ATV units, respectively, and related aftermarket parts & service under this contract with a combined sales value of $1.25 billion and $4.49 billion, respectively. (2)The increase in working capital from September 30, 2010 to September 30, 2011 was primarily the result of a decrease in borrowings under the Company’s revolving line of credit and higher accounts receivable in the access equipment segment as a result of increased sales. (3)In the second quarter of fiscal 2009, the Company recorded in continuing operations non-cash charges totaling $1.19 billion pre-tax ($15.26 per share, net of taxes) to record impairment of goodwill and other long-lived assets. (4)On August 12, 2009, the Company completed a public equity offering of 14,950,000 shares of Common Stock, which included the exercise of the underwriters’ over-allotment option for 1,950,000 shares of Common Stock, at a price of $25.00 per share. The Company paid $15.1 million in underwriting discounts and commissions and approximately $0.6 million of offering expenses. The net proceeds of the equity offering of approximately $358.1 million, along with cash flow from operations, allowed the Company to repay $731.6 million of debt in fiscal 2009. (5)On December 6, 2006, the Company acquired all of the issued and outstanding capital stock of JLG for $3.1 billion in cash. Amounts include acquisition costs and are net of cash acquired. Fiscal 2007 results included sales of $2.5 billion and operating income of $268.4 million related to JLG following its acquisition. (6)Includes amortization of deferred financing costs of $5.1 million in fiscal 2011, $28.6 million in fiscal 2010, $13.4 million in fiscal 2009, $7.2 million in fiscal 2008 and $5.5 million in fiscal 2007. | In the second quarter of fiscal 2009, the Company recorded non-cash charges totaling $1.20 billion pre-tax ($15.38 per share, net of taxes) to record impairment of goodwill and other long-lived assets.
|
| |
(2)
| In May 2005, a sufficient number of shareholders of unlisted Class A Common Stock converted their shares to New York Stock Exchange — listed Common Stock, on a share-for-share basis, which resulted in the remaining Class A shares automatically converting into shares of Common Stock on the same basis. As a result of this conversion to a single class of stock, shares of Common Stock that previously had limited voting rights now carry full voting rights.
|
| |
(3)
| On August 12, 2009, the Company completed a public equity offering of 14,950,000 shares of Common Stock, which included the exercise of the underwriters’ over-allotment option for 1,950,000 shares of Common Stock, at a price of $25.00 per share. The Company paid $15.1 million in underwriting discounts and commissions and approximately $0.6 million of offering expenses. The net proceeds of the equity offering of approximately $358.1 million, along with cash flow from operations, allowed the Company to repay $731.6 million of debt in fiscal 2009, which substantially strengthened the Company’s capital structure.
|
| |
(4)
| On December 6, 2006, the Company acquired all of the issued and outstanding capital stock of JLG for $3.1 billion in cash. Amounts include acquisition costs and are net of cash acquired. Fiscal 2007 results included sales of $2.5 billion and operating income of $268.4 million related to JLG following its acquisition.
|
2831
Table of Contents
(5)
(7)In fiscal 2010, the Company completed the sale of its 75% interest in BAI Brescia Antincendi International S.r.l. and its wholly-owned subsidiary (“BAI’), the Company’s European fire apparatus and equipment business. In fiscal 2009, the Company sold its European refuse collection vehicle business, Geesink Group B.V., Norba A.B. and Geesink Norba Limited (together, “Geesink”). | In fiscal 2006, the Company adopted the fair value recognition provisions of Statement of Financial Accounting Standards (“SFAS”) No. 123 (revised 2004), “Share-Based Payment,” requiring the Company to recognize expense related to the fair value of the Company’s stock-based compensation awards. Had SFAS No. 123(R) been in effect for the earliest period presented, results would have been as follows for fiscal 2005: operating income - $272.3 million; income from continuing operations - $165.1 million; earnings from continuing operations per share - $2.24; net income - $156.7 million; earnings per share - $2.13.
|
| |
(6)
| In fiscal 2005, the Company recorded cumulative life-to-date adjustments to increase the overall margin percentage on the MTVR base contract by 2.5 percentage points as a result of contract modifications and favorable cost performance compared to previous estimates. This change in estimate, recorded as a cumulative life-to-date adjustment, increased operating income, income from continuing operations, net income, earnings per share from continuing operations and earnings per share by $24.7 million, $15.1 million, $15.1 million, $0.21 and $0.21 in fiscal 2005, including $23.1 million, $14.2 million, $14.2 million, $0.20 and $0.20 in fiscal 2005 relating to prior year revenues.
|
2932
Table of Contents
ITEM 7.MANAGEMENT’S DISCUSSION AND ANALYSIS OF FINANCIAL CONDITION AND RESULTS OF OPERATIONS | MANAGEMENT’S DISCUSSION AND ANALYSIS OF FINANCIAL CONDITION AND RESULTS OF OPERATIONS
|
General
The Company is a leading designer, manufacturer and marketer of a wide range of specialty vehicles and vehicle bodies, including defense trucks, access equipment, fire & emergency vehicles and concrete mixers and refuse collection vehicles. The Company manufactures defense trucks under the “Oshkosh” brand name and is a leading manufacturer of severe-duty, heavy- and medium-payload tactical truckswheeled vehicles for the DoD. The Company is a leading global manufacturer of aerial work platforms under the “JLG” brand name. The Company is among the worldwide leaders in the manufacturing of telehandlers under the “JLG,” “SkyTrak” and “Lull” brand names. Under the “Pierce” brand name, the Company is among the leading domestic manufacturers of fire apparatus assembled on both custom and commercial chassis. Under the “Jerr-Dan” brand name, the Company is a leading domestic manufacturer and marketer of towing and recovery equipment. Under the “Pierce” brand name, the Company is among the leading global manufacturers of fire apparatus assembled on both custom and commercial chassis. Under the “Frontline” brand name, the Company is a leading domestic manufacturer and marketer of broadcast vehicles. The Company manufactures ARFF and airport snow removal vehicles under the “Oshkosh” brand name and ambulances under the “Medtec”“MEDTEC” brand name. The Company manufactures mobile medical trailers under the “Oshkosh Specialty Vehicles” and “SMIT” brand names. Under the “Frontline” brand name, the Company is a leading domestic manufacturer and marketer of broadcast vehicles. Under the “McNeilus,” “Oshkosh,” “London” and “CON-E-CO” brand names, the Company manufactures rear- and front-discharge concrete mixers and portable and stationary concrete batch plants. Under the “McNeilus” brand name, the Company manufactures a wide range of automated, rear, front, side and top loading refuse collection vehicles. Under the “IMT” brand name, the Company is a leading domestic manufacturer of field service vehicles and truck-mounted cranes.
Major products manufactured and marketed by each of the Company’s business segments are as follows:
Defense— heavy- and medium-payload tactical trucks and supply parts and services sold to the U.S. military and to other militaries around the world.
Access equipment— aerial work platforms and telehandlers used in a wide variety of construction, industrial, institutional and general maintenance applications to position workers and materials at elevated heights.heights, as well as wreckers and carriers. Access equipment customers include equipment rental companies, construction contractors, manufacturing companies, home improvement centers, and the U.S. military.military and towing companies in the U.S. and abroad.
Fire & emergency — custom and commercial firefighting vehicles and equipment, ARFF vehicles, snow removal vehicles, ambulances wreckers, carriers and other emergency vehicles primarily sold to fire departments, airports and other governmental units, and towing companies in the U.S. and abroad, mobile medical trailers sold to hospitals and third-party medical service providers, in the U.S. and Europe and broadcast vehicles sold to broadcasters and TV stations in North Americathe Americas and abroad.
Commercial— concrete mixers, refuse collection vehicles, portable and stationary concrete batch plants and vehicle components sold to ready-mix companies and commercial and municipal waste haulers in North Americathe Americas and other international markets and field service vehicles and truck-mounted cranes sold to mining, construction and other companies in the U.S. and abroad.
All estimates referred to in this “Management’s Discussion and Analysis of Financial Condition and Results of Operations” refer to the Company’s estimates as of November 18, 2009.16, 2011.
Recent Acquisitions and Dispositions
Since 1996, the Company has selectively pursued strategic acquisitions to enhance its product offerings and diversify its business. The Company has focused its acquisition strategy on providing a full range of products to customers in specialty vehicle and vehicle body markets that are growing and where it can develop strong market positions and achieve acquisition synergies. Acquisitions and dispositions completed during the past three fiscal years were as follows:
30
Table of Contents
In fiscal 2007, the Company acquired JLG for $3.1 billion, including transaction costs and the assumption of debt and net of cash acquired. JLG is the leading global manufacturer of access equipment based on gross revenues. The results of JLG’s operations are included in the consolidated results of the Company from December 6, 2006 (the date of acquisition).
In fiscal 2009, the Company sold its European refuse collection vehicle business, Geesink, to a third party for nominal cash consideration. In spite of aggressive actions during the previous three fiscal years to restructure this business and return it to profitability, the business continued to incur operating losses for the first nine months of fiscal 2009. The Company believesbelieved that its performance cancould be enhanced by redeploying its resources from Geesink to support the Company’s other businesses. The Company has reflected the financial results of Geesink as discontinued operations in the Consolidated Statements of Operations for all periods presented. The Company recorded a $33.8 million non-cash, pre-tax gain on the sale. In addition, in the fourth quarter
33
Table of fiscal 2009, the Company reorganized Geesink’s European parent holding company and claimed a worthless stock and bad debt deduction, which resulted in a $71.5 million tax benefit, of which $54.0 million was included in discontinued operations.Contents
In October 2009, the Company completed the sale of its 75% interest in BAI, the Company’s European fire apparatus and equipment business, to BAI’s management team for nominal cash consideration. BAI, which was included in the Company’s fire & emergency segment, had sales of $42.2 million $58.7 million and $49.9 million in fiscal 2009, 2008 and 2007, respectively. This business did not meet the criteria to be recorded as assets held for sale as of September 30, 2009 as the Company did not receive Board of Directors approval for the sale until October 2009. The Company expects to recordrecorded a small loss on the sale of BAI in the first quarter of fiscal 2010. The Company has reflected the financial results of BAI as discontinued operations in the Consolidated Statements of Operations for all periods presented.
In addition, in the fourth quarter of fiscal 2009, the Company reorganized Geesink’s European parent holding company and claimed a worthless stock and bad debt deduction, which resulted in a $71.5 million tax benefit, of which $61.0 million related to Geesink and BAI and was therefore included in discontinued operations.
Executive Overview
DuringAs expected, fiscal 2011 sales and operating income decreased following a year of record sales and profitability in fiscal 2010 when the Company delivered 7,539 urgently needed, life-saving M-ATVs to the DoD. While M-ATV sales, including related parts & services sales, decreased $3.24 billion from fiscal 2010 to fiscal 2011, an increase in access equipment sales to external customers and the start-up of FMTV production during fiscal 2011 offset some of the M-ATV sales decrease. As a result, consolidated net sales decreased $2.26 billion, or 22.9%, to $7.58 billion compared to fiscal 2010. Although the increase in sales to external customers in the access equipment segment and the ramp-up of FMTV production in the defense segment offset some of the decrease in M-ATV sales, the incremental access equipment sales were at lower margins than M-ATV sales. In addition, the Company incurred $43.0 million of start-up costs on the ramp-up of the FMTV contract which drove costs to exceed revenues by $44.4 million on this program during fiscal 2011. As a result of the lower M-ATV sales, lower margins on the incremental access equipment sales and cost challenges on the FMTV program, operating income in fiscal 2011 decreased $893.2 million, or 64.1%, from fiscal 2010, to $500.9 million.
In August 2009, economies worldwide were impacted by what has comethe DoD awarded the Company the contract to be known as the “Great Recession” and credit crisis, as evidenced by lower residential and non-residential construction, lower municipal and consumer spending, increased unemployment levels and lower manufacturing utilization. The impactsole producer of FMTVs under the U.S. Army’s FMTV Rebuy program. This was an important contract for the Company to win due to high unfulfilled requirements of the Great Recession and credit crisis on a number ofDoD’s authorized acquisition objective (or maximum acquisition quantity) under the FMTV program, while the Company’s businessesFHTV program was severe, ultimately leading to large non-cash impairment charges described below. For instance, the Company’s access equipment and domestic concrete placement products businesses each experienced sales declines of more than 60% compared to the prior year. In the midst of the greatest financial crisis since the Great Depression, the Company’s defense, domestic fire apparatus and airports products businesses delivered strong results, partially offsetting the downturns experienced in its other businesses. During fiscal 2009, the Company took numerous actions to address the impact of the Great Recession and credit crisis on its businesses and aggressively pursued new business. These actions, coupled with major defense contract wins, have significantly improved the Company’s outlook for fiscal 2010.
As order intake for a numbernearing fulfillment of its businesses deterioratedauthorized acquisition objective. After a lengthy protest, the DoD ordered trucks in fiscal 2009,the first contract year at a level approximately three times higher than the likely amount communicated by the DoD in the request for proposal due to favorable pricing on the program and prior to a scheduled contractual price increase. As a result, when the Company initiated production, the Company incurred higher than planned costs to hire and train more than 500 additional cost reductions beyond actions taken in fiscal 2008employees than anticipated and was required to partially offset the earnings impact ofpurchase additional equipment and tooling, as well as deliver vehicles at lower demand. These actions included significant reductions in staffing, salary cuts for all domestic salaried employees, elimination of 401(k) contribution matches for most employees, periodic furloughs for a large percentage of employees and additional reductions in other discretionary spending.pricing than expected. The Company also dramatically reduced capital spending. Lateexperienced issues associated with building to the DoD’s technical data package, which did not accurately reflect the current configuration of the trucks and trailers, and complying with new requirements in the contract, among other issues. The Company began delivering vehicles under this contract in the first quarter of fiscal 2011. While the Company worked through these issues, it incurred unplanned start-up costs of $43.0 million in fiscal 2009, as2011 and reported a resulttotal loss on the contract for the year of an improved financial outlook for$44.4 million. The Company expects to continue to incur costs in excess of revenues on the FMTV contract through the first quarter of fiscal 2010, the Company restored a portion of the compensation adjustments for those employees subject to reductions.
Due largely to the downturn2012, although at amounts lower than in the Company’s businesses with exposure to construction markets, the Company amendedfiscal 2011, but expects its credit agreementFMTV sales beginning in the second quarter of fiscal 20092012 to avoidbe profitable. The Company has eleven integrated project teams working to improve its performance on this contract. This is a potential financial covenant violation. top priority for management and is increasingly important as FMTV sales rise as a percentage of total defense sales in fiscal years 2012 and 2013.
The amendment provided additional roomCompany expects that FMTV program revenues for production beyond September 30, 2011 on orders received to-date will exceed expected costs and, therefore, has not recorded a charge for a loss contract. In evaluating the profitability under the financial covenantsFMTV contract, it is necessary to estimate future material and production costs. Management cost assumptions include estimates for future increases in the remaindercosts of materials, reductions in ramp-up costs, targeted cost savings and production efficiencies. There are inherent uncertainties related to these estimates. Small changes in estimates can have a significant impact on profitability under the termcontract. For example, a 1% escalation in material costs over the Company’s projection for FMTV orders currently in backlog would increase the cost of materials by approximately $24 million. Although this amount is less than the credit agreement. In exchange forexpected future profitability, it would significantly reduce the changes toexpected future gross margins on orders currently in backlog. It is possible that other assumptions underlying the financial covenants,analysis could change in such a manner that the Company incurred significant up-front fees and increased interest spreads forwould determine in the remaining term of the agreement. The Company also agreed, among other things,future that this is a loss contract, which could result in a material charge to limitations on capital expenditures, dividends, investments and acquisitions. The Company’s Board of Directors subsequently elected to suspend the payment of dividends.earnings.
During the second quarter of fiscal 2009, the Company also determined that goodwill and other long-lived assets were impaired at certain of the Company’s reporting units, with the vast majority of the impairments concentrated in the access equipment segment. This determination was based upon a sustained decline in the price of the Company’s Common Stock subsequent to the Company’s fiscal 2008 year end when its share price approximated book value, depressed order rates during the second quarter, which historically has been a strong period for orders in advance of the North American construction season, as well as further deterioration in credit markets and the macro-economic environment. Following the completion of the impairment assessment, which was performed with the assistance of a third-party valuation firm, the Company recorded pre-tax, non-cash impairment charges of $1.20 billion in the second quarter of
3134
Table of Contents
fiscal 2009. These charges were driven by current projections and valuation assumptions that reflected the Company’s belief that the current recession would be deeper and longer than previously expected, that credit markets would remain tight and that costs of capital had risen significantly since the Company last performed its annual impairment testing. Despite the requirement to record this impairment charge, the Company continues to believe the long-term prospects for its businesses remain strong.
In June 2009, the DoD awarded the Company a sole source contract for 2,244 M-ATVs and associated aftermarket parts packages, valued at $1.06 billion. Through November 18, 2009, the DoD awarded the Company an additional 3,975 M-ATVs and associated aftermarket parts packages, valued at $2.23 billion. Unit deliveries under the contract are scheduled through April 2010, with aftermarket parts packages to be delivered through May 2010. Key attributes of the M-ATV include superior survivability and mobility required for the current conflict in Afghanistan. The M-ATV represents the Company’s first major entry into the market for vehicles used in small unit combat operations.
In fiscal 2009, the Company received orders totaling $195 million to retrofit approximately 2,400 MRAP vehicles originally manufactured by other companies for the DoD with the Company’s patented TAK-4 independent suspension system. The Company is actively supporting the engineering and testing for retrofit installation of TAK-4 under other MRAP models that could lead to additional TAK-4 sales in the future.
In August 2009,2011, the Company completed a public equity offeringcomprehensive strategic planning process to, among other things, assess the outlook for each of 14,950,000 shares of Common Stock,its markets, consider strategic alternatives and develop strategic initiatives to address the current difficult market forces then facing the Company. Those difficult market forces involved non-defense markets which includedwere down 40% to more than 90% from peak, an uncertain economic recovery and a likely sharp downturn in U.S. defense spending beginning as early as 2013. The study culminated in the exercisecreation of the underwriters’ over-allotment optionCompany’s planned roadmap to deliver superior long-term earnings growth and increased shareholder value over the next business cycle and beyond. The Company’s roadmap, named MOVE, requires aggressive cost reduction and prudent organic growth initiatives until a market recovery provides an opportunity for significant earnings leverage, estimated at levels approaching $500 million of 1,950,000 sharesoperating income to return to prior peak earnings, in its non-defense markets. The MOVE strategy consists of Common Stock, at a price of $25.00 per share.four key strategic initiatives:
·Market recovery and growth — The Company paid $15.1 million in underwriting discountsbelieves that many of its non-defense markets will begin to recover after fiscal 2012. The Company plans to capture or improve its historic share of a market recovery.
·Optimize cost and commissionscapital structure — The Company plans to optimize its cost and approximately $0.6 million of offering expenses.capital structure to provide value for customers and shareholders by aggressively attacking its product, process and operating costs. The net proceeds of the equity offering of approximately $358.1 million, along with cash flow from operations, allowedexpected savings and process improvement achieved are expected to enable the Company to repay $731.6 million of debt in fiscal 2009,further reduce its debt.
·Value innovation — The Company plans to further strengthen its multi-generational product plans, which substantially strengthenedincorporate its newest technologies and drive the Company’s capital structure.ability to benefit its customers and the Company’s performance.
·Emerging market expansion — The Company plans to drive international growth in targeted geographies where it believes that there are significant opportunities for growth.
In August 2009,The Company is in the DoD awardedearly stages of implementing the required initiatives to support this new roadmap and expects that the roadmap will benefit the Company and its shareholders in the years to come.
The Company believes fiscal 2012 will continue to be a transitional period for the Company as a contract valued at $280.9 million forresult of the production and deliverydifficult market forces described above. Specifically, the Company expects a continued rebound in sales to external customers in the access equipment segment, which the Company believes will be more than offset by a significant sales mix shift in the defense segment toward an increased percentage of 2,571 trucks and trailers under the U.S. Army’slow-margin FMTV Rebuy program. The FMTV Rebuy program is a five-year requirements contract award for the production of up to 23,000 medium-payload tactical trucks and trailerssales as well as support serviceslower sales of higher margin M-ATVs and engineering. Competitors have filed protests with the GAO regarding the award of the FMTV contract, and the DoD has issuedFHTVs. As a stop work order on the program pending resolution of the protests, which is expected to occur in mid-December 2009. The Company believes the U.S. Army conducted a fair and objective source selection process and further believes that the contract award to the Company should be upheld. This contract would represent a significant expansion of the Company’s medium-payload tactical truck business.
While not providing specific quantitative guidance for fiscal 2010,result, the Company expects that operating income and net income will be significantly lower in fiscal 2010 financial results to be solidly profitable and significantly improved2012 as compared to fiscal 2009.2011.
In mid-July 2011, the Company was informed by the DoD and its tire supplier that recent orders for military vehicles, including orders received by the Company for M-ATV Underbody Improvement Kits, may cause a constraint in the supply of a certain size and specification of tire. The Company uses these same tires on many of its heavy tactical vehicles. Since that time, insufficient supplier capacity to accommodate this spike in demand has caused the DoD to use its sovereign authority to direct tires currently scheduled for delivery to the Company for FHTV production to be re-routed for use on contracts with the “DX” designation. The “DX” designation process is essentially a process that enables the DoD to prioritize use of materials for national defense purposes. In the fourth quarter of fiscal 2011, the Company began engaging in regular discussions with the DoD and the tire supplier. The Company now expects that the tire shortage will negatively impact the timing of its production and delivery schedule through much of fiscal 2012 and will negatively impact the timing of its FHTV sales. The Company continues to assess the matter and is working to minimize any impact this situation may have on its operations and its results. Based on the most recent information received from the tire supplier and the DoD, the Company has removed approximately $225 million of sales from its fiscal 2012 expectations communicated in its Form 10-Q filed for its third quarter of fiscal 2011. Revenue on these units is expected to move to fiscal 2013. The Company expects significant sales growth in fiscal 2010 in the defense segment due largely to the significant quantity of M-ATVs orderedit would be reimbursed by the DoD for delivery in fiscal 2010. any additional costs that it incurs due to the re-direction of these specialty tires.
The Company expects minimal FMTVthat sales volume in fiscal 2010 as deliveries of significant quantities of vehicles under this contract are not scheduled until early in fiscal 2011, assuming a successful resolution of the protests. The Company is incurring costs on the FMTV program during the protest phase so that it is ready to move forward quickly if, as the Company expects, the GAO denies the protests. The Company does not expect to sustain the margins it experienced in its defense segment in the fourth quarterfiscal 2012 will decline by approximately 15% compared to fiscal 2011. The Company also expects to experience a significant shift in sales mix with FMTV sales comprising approximately 40% of fiscal 2009segment sales in fiscal 2010 as the Company does not expect the reoccurrence of a LIFO inventory benefit.2012 compared to approximately 13% in fiscal 2011. In addition, the Company expects an adverselower aftermarket sales mix and increased investment in future business opportunities to more than offset the absorption benefits of increased volume. Sales in the Company’s access equipment segment remain soft, and the Company does not expectfiscal 2012 as a significant changeamount of M-ATV related parts sales occurred in this market until fiscal 2011. The Company expects that operating income margins on JLG’s traditional access equipment business will improvein the defense segment in fiscal 20102012 will be below 5% due in large part to the significant change in sales mix between and within the Company’s different defense programs. The Company does not expect the FMTV program to be profitable until the second quarter of fiscal 2012, but it does expect that full year FMTV margins will be slightly above breakeven due to the expectation that charges for increased bad debt reserves and restructuringreduction of start-up costs, along with the impact from higher material costs in inventory, will not be as significant in the segment as they were in fiscal 2009. The access equipment segment will also benefit in fiscal 2010 from M-ATV production volume. The Company expects lower sales in its fire & emergency segment in fiscal 2010 as a resultin-sourcing of ongoing municipal spending weakness due to the impact of the recession on tax receipts. However, this segment is traditionally the Company’s least cyclical,work and the Company believes that the percentage decrease in its sales for fiscal 2010 compared to fiscal 2009 will be significantly less than the Company experienced in the access equipment and commercial segments in fiscal 2009. The Company believes that its concrete placement products businesses will remain soft in fiscal 2010 until a modest pickup that the Company expects to begin in the middleimplementation of calendar 2010. The Company estimates that refuse collection vehicle sales will be flat to up modestly in fiscalmaterial cost reductions.
3235
Table of Contents
2010The Company believes that the access equipment segment will experience sales growth of approximately 20% in fiscal 2012 as compared to fiscal 2011 largely as a result of higher replacement demand in North America and in parts of Europe and continued growth in emerging markets. The Company believes that operating income margins in the access equipment segment will be in the mid to upper single digit range as a percentage of sales in fiscal 2012 depending on the speed with which the Company executes its cost reduction initiatives. The higher material costs experienced in this segment in the fourth quarter of fiscal 2011 are expected to continue to impact the segment in fiscal 2012, but the Company expects recently announced price increases to offset much of the increased material costs beginning in the second fiscal quarter.
The Company believes that fire & emergency segment sales in fiscal 2012 will be flat compared to fiscal 2011 driven by continued weak municipal spending. The Company expects that fire & emergency segment operating income margins will improve compared to fiscal 2011 to the low single digit range as it expects benefits from previously announced restructuring actions and reduced restructuring related costs.
The Company believes that sales in the commercial segment will be slightly higher in fiscal 2012 compared to fiscal 2011. The Company expects domestic concrete mixer sales will remain weak as a result of continued weakness in housing starts and other construction activity. The Company estimates that refuse collection vehicle sales in fiscal 2012 will be slightly higher compared with fiscal 2011, but that sales in fiscal 2012 will be concentrated early in the fiscal year as customers purchase vehicles prior to the end of calendar 2011, when a U.S. bonus depreciation tax deduction is scheduled to expire. The Company expects that operating income margins in the commercial segment in fiscal 2012 will be approximately flat with fiscal 2011.
The Company expects that corporate expenses will be flat to slightly higher in fiscal 2012 compared to fiscal 2011, in part to support new business initiatives to sustain long-term growth. The Company expects modestly lower interest expense in fiscal 2012 due to lower debt levels and the timingexpiration of deliveries for certain large national waste haulersan interest rate swap agreement in December 2011. The Company believes that its fiscal 2012 effective income tax rate will approximate 33% to 35%.
The Company believes that it will experience modestly negative free cash flow (defined as cash flow from operations less capital expenditures) in fiscal 2010.2012. The Company expects that the cash usage will be largely driven by lower earnings, lower performance-based payments from the U.S. government as a result of an expected continued decline in defense segment sales, higher working capital requirements as sales to external customers continue to rebound in the access equipment segment, and anticipated capital expenditures in fiscal 2012 of $85 million to $95 million.
The Company expects that fiscal 2012 will be its trough earnings year in this business cycle as it expects its MOVE strategic initiatives will have greater impact on earnings in fiscal 2013 and as the global economy continues its slow recovery.
The Company expects relatively strong performance in the defense segment in the first quarter of fiscal 2012, driven by the expected sale of more than 400 M-ATVs. The Company expects that seasonally weak sales and high material costs not yet offset by the recently announced price increase will impact access equipment results in the first quarter of fiscal 2012. The Company expects lower sales and an operating loss in the fire & emergency segment in the first quarter of fiscal 2012, as it continues to improve efficiencies at its Florida operations. The Company also expects relatively strong performance in the first quarter of fiscal 2012 in the commercial segment led by demand for refuse collection vehicles driven by the scheduled expiration of a U.S. bonus depreciation tax deduction at the end of calendar 2011. The Company believes fiscal 2012 first quarter earnings will approximate one fourth of its earnings for the full fiscal year, whereas the Company typically experiences a seasonally weaker first quarter.
36
Table of Contents
Results of Operations
Consolidated Net Sales –— Three Years Ended September 30, 20092011
The following table presents net sales (see definition of net sales contained in Note 2 of the Notes to Consolidated Financial Statements) by business segment (in millions):
| | Fiscal Year Ended September 30, | | | Fiscal Year Ended September 30, | |
| | 2009 | | 2008 | | 2007 | | | 2011 | | 2010 | | 2009 | |
Net sales | | | | | | | | | | | | | | |
Defense | | $ | 2,594.8 | | $ | 1,891.9 | | $ | 1,416.5 | | | $ | 4,365.2 | | $ | 7,161.7 | | $ | 2,594.8 | |
Access equipment | | 1,139.4 | | 3,085.9 | | 2,539.5 | | | 2,052.1 | | 3,011.9 | | 1,225.5 | |
Fire & emergency | | 1,169.0 | | 1,192.8 | | 1,142.2 | | | 800.3 | | 916.0 | | 1,042.3 | |
Commercial | | 590.0 | | 835.1 | | 1,080.3 | | | 564.9 | | 622.1 | | 590.0 | |
Intersegment eliminations | | (198.0 | ) | (69.3 | ) | (39.2 | ) | | (197.8 | ) | (1,869.3 | ) | (199.5 | ) |
Consolidated | | $ | 5,295.2 | | $ | 6,936.4 | | $ | 6,139.3 | | | $ | 7,584.7 | | $ | 9,842.4 | | $ | 5,253.1 | |
The following table presents net sales by geographic region based on product shipment destination (in millions):
| | Fiscal Year Ended September 30, | | | Fiscal Year Ended September 30, | |
| | 2009 | | 2008 | | 2007 | | | 2011 | | 2010 | | 2009 | |
Net sales | | | | | | | | | | | | | | |
United States | | $ | 4,487.1 | | $ | 4,997.2 | | $ | 4,745.5 | | | $ | 6,281.5 | | $ | 8,882.6 | | $ | 4,487.1 | |
Other North America | | 89.7 | | 180.6 | | 212.8 | | | 179.7 | | 111.0 | | 89.7 | |
Europe, Africa and the Middle East | | 510.7 | | 1,342.2 | | 915.7 | | | 706.2 | | 508.6 | | 468.6 | |
Rest of the world | | 207.7 | | 416.4 | | 265.3 | | | 417.3 | | 340.2 | | 207.7 | |
Consolidated | | $ | 5,295.2 | | $ | 6,936.4 | | $ | 6,139.3 | | | $ | 7,584.7 | | $ | 9,842.4 | | $ | 5,253.1 | |
Fiscal 20092011 Compared to Fiscal 20082010
Consolidated net sales decreased 23.7%$2.26 billion, or 22.9%, to $5.30$7.58 billion in fiscal 20092011 compared to fiscal 2008. The2010 largely due to the expected decrease in sales was a result of unprecedented reductionsunder the M-ATV contract, offset in the Company’spart by increased demand for access equipment segmentand sales and continued reductions inunder the Company’s commercial segment sales as a resultstart-up of the global recession and credit crisis. These decreases were partially offset by increased sales in the Company’s defense and domestic fire apparatus businesses.FMTV program.
Defense segment net sales increased 37.2%decreased $2.80 billion, or 39.0%, to $2.59$4.37 billion in fiscal 20092011 compared to fiscal 2008.2010. The increasedecrease in sales was attributableprimarily due to higherthe completion of the initial M-ATV production. The start-up of FMTV production added $548.8 million in sales during fiscal 2011, offsetting some of heavy-payload tactical vehiclesthe M-ATV sales decrease. Combined vehicle and parts & serviceservices sales to fulfill the continuing requirements of the Company’s largest customer, the DoD. Sales of new and remanufactured heavy-payload tactical vehiclesrelated to the U.S. Army were up significantlyM-ATV program totaled $1.25 billion in fiscal 20092011, a decrease of $3.24 billion compared to the prior year. Defense segment sales in fiscal 2009 also benefited from the sale and installation of reducible-height armor kits for MTVR trucks for the U.S. Marine Corps and the sale of TAK-4 independent suspension systems to third-party MRAP original equipment manufacturers.
Access equipment segment net sales decreased 63.1%$959.8 million, or 31.9%, to $1.14$2.05 billion in fiscal 20092011 compared to fiscal 2008.2010. Sales reflected substantially lower demand globally arising from recessionary economies and tight credit markets. European, African and Middle East and North American new machine sales each declined approximately 75% in fiscal 2009, while the rest of world equipment2011 included $0.11 billion in intersegment M-ATV related sales were down about 45%. Access equipment salescompared to $1.73 billion in fiscal 2009 included $86.7 million of intercompany2010. Sales to external customers totaled $1.94 billion in fiscal 2011, a 53.5% increase compared to fiscal 2010. The increase in sales to external customers compared with the defense segment related to the M-ATV program.prior year period was primarily a result of higher replacement of aged equipment in North America (up 88%) and parts of Europe (up 44%).
33Fire & emergency segment net sales decreased $115.7 million, or 12.6%, to $800.3 million in fiscal 2011 compared to fiscal 2010. The decrease in sales reflected a $120.3 million decrease in fire apparatus volume due to soft demand attributable to weak municipal spending in the U.S.
Commercial segment net sales decreased $57.2 million, or 9.2%, to $564.9 million in fiscal 2011 compared to fiscal 2010. The decrease in sales was primarily the result of a $56.1 million decline in refuse collection vehicles volume due to lower volume with large waste haulers.
37
Table of Contents
Fire & emergency segment net sales decreased 2.0% to $1.17 billion in fiscal 2009 compared to fiscal 2008. Increased shipments of domestic fire apparatus as well as a favorable sales mix in the segment’s airport products business offset in part lower sales in other businesses in this segment. Lower sales in fiscal 2009 were driven by weak demand for towing & recovery equipment as a result of the global recession and the inability of end customers to obtain adequate financing, a shift in component production from the fire & emergency segment to the commercial segment, and a decrease in international fire apparatus shipments as a result of production delays.
Commercial segment net sales declined 29.3% to $0.59 billion in fiscal 2009 compared to fiscal 2008. The decrease in sales was largely the result of a 60.4% decline in sales of concrete placement products due to continued weakness in U.S. residential and nonresidential construction activity, and a 15.0% decrease in refuse collection vehicle sales. The decline in refuse collection vehicle sales was primarily the result of lower international sales as well as the timing of deliveries to large fleet customers. This was offset in part by a shift in component production from the fire & emergency segment to the commercial segment.
Fiscal 20082010 Compared to Fiscal 20072009
Consolidated net sales increased 13.0%87.4% to $6.94$9.84 billion in fiscal 20082010 compared to fiscal 2007.2009. The inclusionincrease in sales was primarily the result of JLGthe M-ATV contract in the results for the entire fiscal year in 2008 as compared to only ten months in fiscal 2007, strong access equipment sales in Europe, significantly higher defense sales and favorable foreign currency exchange rates drove the increase in consolidated net sales.segment.
Defense segment net sales increased 33.6%176.0% to $1.89$7.16 billion in fiscal 20082010 compared to fiscal 2007.2009. The increase was attributableprimarily due to an increase in salesthe sale of new7,539 M-ATV units and remanufactured trucks, as well as higherrelated aftermarket parts & service sales. Salesunder a contract which began initial production in the fourth quarter of newfiscal 2009. Combined vehicle and remanufactured trucks were up 32.3% versus the prior year as an increase in sales of new and remanufactured heavy-payload trucks was partially offset by a decrease in medium-payload truck sales and international truck sales. Partsparts & service sales increased nearly 40%related to the M-ATV program totaled $4.49 billion in fiscal 2008 on significantly higher armor kit shipments and service work.2010, an increase of $4.39 billion over fiscal 2009 levels.
Access equipment segment net sales increased 21.5%145.8% to $3.09$3.0 billion in fiscal 20082010 compared to fiscal 2007. The increase was driven by2009. Sales in fiscal 2010 included $1.7 billion in intersegment M-ATV related sales to the inclusion of JLG sales for the entire yeardefense segment. Sales to external customers increased 12.0% to $1.3 billion in fiscal 2010 compared to the Company’s ownership for ten months in the prior year period and significantly strongerfiscal 2009. Sales to external customers reflected relatively strong demand for aerial work platforms outsidenew equipment in North America. FavorableAmerica (up 21%) and Latin America (up 130%), offset in part by substantially lower demand in Europe, Africa and the Middle East (down 29%). In addition to the higher volumes experienced during fiscal 2010, the increase in sales as compared to fiscal 2009 was the result of improved pricing, primarily related to long-term U.S. government contracts with annual price escalation clauses ($20.1 million), favorable foreign currency exchange rates also increased sales by $130.0 million. These increases were offset in part by lower demand in North America in fiscal 2008 compared to the prior year as a result of slowing non-residential construction markets. Access equipment sales in the prior year represented sales of JLG from December 6, 2006, the date of acquisition, through the end of the fiscal year.($17.4 million) and improved product mix ($15.1 million).
Fire & emergency segment net sales increased 4.4%decreased 12.1% to $1.19 billion$916.0 million in fiscal 20082010 compared to fiscal 2007.2009. The increasedecrease in sales reflected higher domesticlower shipments of fire apparatus sales as a result of continued market share gains and higher airport product sales,($116.3 million reduction) due partially to higher international sales, offset in part by weakersofter demand for towing equipment as well as mobile medical trailers and broadcast vehicles. The towing equipment vehicle market was negatively impacted by lower demand as a result of rising fuel prices and uncertaintyattributable to declining municipal budgets in the U.S. economy. Aand continued weak demand for mobile medical equipment ($25.9 million reduction). In addition, the mobile medical equipment market has been adversely impacted by a reduction in medicalMedicare reimbursement rates byand the U.S. government to providers of mobile medical imaging services had a negative effect on sales of mobile medical trailers, and duringuncertain health care environment in the first half of fiscal 2008, a writers’ strike reducing television networks’ advertising revenues negatively impacted the broadcast vehicle market.U.S.
Commercial segment net sales decreased 22.7%increased 5.4% to $0.84 billion$622.1 million in fiscal 20082010 compared to fiscal 2007. The decrease was largely2009. A $29.9 million increase in intersegment production of heavy tactical vehicle components for the result of lower domesticdefense segment and a 38.6% increase in concrete placement productvehicle shipments off of historical lows were offset by a 3.5% decrease in domestic refuse collection vehicle shipments.
Consolidated Cost of Sales — Three Years Ended September 30, 2011
Fiscal 2011 Compared to Fiscal 2010
Consolidated cost of sales were $6.50 billion, or 85.8% of sales, in fiscal 20082011 compared to $7.87 billion, or 80.0% of sales, in fiscal 20072010. The 580 basis point increase in cost of sales as a percentage of sales in fiscal 2011 compared to the prior year was generally due to adverse product mix (290 basis points), under absorption of fixed costs and inefficiencies associated with lower sales and restructuring actions (100 basis points) and higher new product development spending (90 basis points).
Fiscal 2010 Compared to Fiscal 2009
Consolidated cost of sales increased to $7.87 billion, or 80.0% of sales, in fiscal 2010 compared to $4.55 billion, or 86.6% of sales, in fiscal 2009. The 660 basis point decrease in cost of sales as a slowdown in U.S. residential construction and low volume subsequentpercentage of sales was due to the pre-buy aheadimpact of the January 2007 diesel engine emissions standards changes.M-ATV related sales (260 basis points), relatively fixed overhead costs spread over a higher sales base (190 basis points), improved pricing (90 basis points) and lower material costs (60 basis points).
3438
Table of Contents
Consolidated Operating Income (Loss) Income –— Three Years Ended September 30, 20092011
The following table presents operating income (loss) income by business segment (in millions):
| | Fiscal Year Ended September 30, | | | Fiscal Year Ended September 30, | |
| | 2009 | | 2008 | | 2007 | | | 2011 | | 2010 | | 2009 | |
Operating income (expense): | | | | | | | | |
Operating income (loss): | | | | | | | | |
Defense | | $ | 403.3 | | $ | 265.2 | | $ | 245.0 | | | $ | 543.0 | | $ | 1,320.7 | | $ | 403.3 | |
Access equipment | | (1,105.6 | ) | 360.1 | | 268.4 | | | 65.3 | | 97.3 | | (1,159.1 | ) |
Fire & emergency | | (14.7 | ) | 93.9 | | 107.5 | | | (8.2 | ) | 57.6 | | 51.2 | |
Commercial | | (183.7 | ) | 4.7 | | 76.5 | | | 3.9 | | 19.4 | | (183.7 | ) |
Corporate and other | | (91.3 | ) | (108.9 | ) | (88.3 | ) | |
Corporate | | | (107.1 | ) | (99.0 | ) | (89.6 | ) |
Intersegment eliminations | | | 4.0 | | (1.9 | ) | (1.6 | ) |
Consolidated | | $ | (992.0 | ) | $ | 615.0 | | $ | 609.1 | | | $ | 500.9 | | $ | 1,394.1 | | $ | (979.5 | ) |
Fiscal 20092011 Compared to Fiscal 20082010
The Company incurred a consolidatedConsolidated operating lossincome decreased $893.2 million, or 64.1%, to $500.9 million, or 6.6% of $992.0 millionsales, in fiscal 2009 as2011 compared to operating income$1.39 billion, or 14.2% of $615.0 millionsales, in fiscal 2008. The operating loss2010. Operating income in fiscal 2009 was driven by $1.20 billion of2011 and 2010 included pre-tax, non-cash charges for the impairment of goodwill and other long-lived assets. Sharply lower sales volume in the access equipmentassets of $8.2 million and commercial segments also contributed to the$34.1 million, respectively. The decrease in operating resultsincome was primarily the result of lower sales volumes and a shift from higher margin M-ATV sales to loss generating FMTV sales in fiscal 2009.the defense segment.
In accordance with the provisions of Financial Accounting Standards Board (“FASB”) Accounting Standards Codification (“ASC”) Topic 350-20, Goodwill, the Company reviews goodwill annually for impairment, or more frequently if potential interim indicators exist that could result in impairment. At February 28, 2009, givenFollowing the sustained decline in the price of the Company’s Common Stock subsequent to the Company’s fiscal 2008 year end when its share price approximated book value, depressed order rates during the second quarter which historically has been a strong period for orders in advance of the North American construction season, as well as further deterioration in credit markets and the macro-economic environment,impairment testing, the Company determined that the appropriate triggers had been reached to perform additional impairment testing on goodwill and its long-lived intangible assets. Accordingly, the Company conducted an assessment of the fair values of the Company’s reporting units. The results of that assessment indicated that impairment charges to the values of goodwill and other long-lived assets were required in the Company’s access equipment, fire & emergency and commercial segments.
Defense segment operating income increased 52.1% to $403.3 million, or 15.5% of sales, in fiscal 2009 compared to $265.2 million, or 14.0% of sales, in fiscal 2008. The increase in operating income as a percent of sales compared to fiscal 2008 reflected better absorption of fixed costs, lower material costs, improved performance on service work and favorable LIFO inventory adjustments of $8.7 million as compared with a charge of $5.7 million in fiscal 2008.
The access equipment segment incurred an operating loss of $1,105.6 million, including $892.5 million in pre-tax, non-cashrecorded impairment charges for goodwill and other long-lived intangible assets of $4.8 million in the fire & emergency segment during the fourth quarter of fiscal 2011.
Defense segment operating income decreased 58.9% to $543.0 million, or 12.4% of sales, in fiscal 20092011 compared to $1.32 billion, or 18.4% of sales, in fiscal 2010. The decrease in operating income compared to the prior year reflected the lower sales volume as well as adverse product mix as a result of the shift from higher margin M-ATV sales to loss generating FMTV sales and ramp-up costs on the FMTV contract.
Access equipment segment operating income decreased 32.9% to $65.3 million, or 3.2% of sales, in fiscal 2011 compared to $97.3 million, or 3.2% of sales, in fiscal 2010. The decline in operating results was due to the decrease in intersegment M-ATV related sales and higher material costs ($37.0 million), offset in part by higher sales to external customers and the reversal of provisions for credit losses of $11.2 million, primarily related to a customer settlement, compared to a provision for credit losses of $13.3 million in the prior year. In the prior year, the access equipment segment recognized $1.73 billion of intersegment M-ATV related sales at mid single-digit margins compared to intersegment M-ATV related sales of $0.11 billion at similar margins in fiscal 2011.
The fire & emergency segment reported an operating loss of $8.2 million, or 1.0% of sales, in fiscal 2011 compared to operating income of $360.1$57.6 million, or 6.3% of sales, in fiscal 2008. In addition to the non-cash impairment charges, the decline in operating income was due to the impact of sharply lower sales volume, sale of units comprised of higher cost materials purchased2010. Operating results in fiscal 2008 when steel costs were high,2011 and an increase in the provision for credit losses. The impact of these factors was reduced by lower operating expenses as a result of aggressive cost reduction efforts.
The fire & emergency segment incurred an operating loss of $14.7 million, including $123.0 million in2010 included pre-tax, non-cash impairment charges for the impairment of goodwill and other long-lived assets in fiscal 2009 compared to operating income of $93.9$4.8 million in fiscal 2008. The impairment charges more than offset otherwise favorable operating results for the segment due to a favorable product mix and improved performance at the Company’s domestic fire apparatus and airport product businesses as well as lower operating expenses throughout the segment as a result of cost reduction initiatives.
The commercial segment incurred an operating loss in fiscal 2009 of $183.7$27.0 million, including $184.3 million in pre-tax, non-cash impairment charges for goodwill and other long-lived assets, compared to operating income of $4.7 million in fiscal 2008.respectively. The decrease in operating resultsincome largely reflected lower sales volumes along with restructuring charges and other costs related to the Company’s plans to rationalize and optimize its global manufacturing footprint ($12.8 million).
Commercial segment operating income decreased 79.8% to $3.9 million, or 0.7% of sales, in fiscal 2011 compared to $19.4 million, or 3.1% of sales, in fiscal 2010. The decrease in operating income was thelargely a result of the non-cash impairment charges and the impact of sharply lower concrete placement products sales volume, offset in part by reductions in operating expenses due to cost reduction efforts andvolumes, a LIFO inventory benefitcharge of $5.9$2.5 million in fiscal 2011 compared to a $1.7 million LIFO credit in fiscal 2010 and the restoration of some employee pay and benefits.
Corporate operating expenses increased $8.1 million to $107.1 million in fiscal 2011 compared to fiscal 2010, largely due to significant reductions in inventory levels.the Company’s investments to support its growth initiatives for fiscal 2012 and beyond.
3539
Table of Contents
Corporate operating expenses and inter-segment Intersegmentprofit elimination decreased $17.6 of$4.0million to $91.3 million infiscal 2009 compared to fiscal 2008 2011resultedfromprofitonintersegmentsalesbetweensegments(largely due to focused cost reduction efforts, including lower outside professional services, travel and recruiting costs.
Consolidated selling, general and administrative expenses decreased $57.7 million to $435.8 million, or 8.2% ofM-ATV related sales in fiscal 2009 compared to $493.5 million, or 7.1% of sales, in fiscal 2008 as a result of focused cost reduction efforts, including reductions in staffing, salary reductions and furloughs, the elimination of 401(k) contribution matches and other cost reductions. Selling, general and administrative expenses in fiscal 2009 included provisions for credit losses of $50.1 million, or 0.9% of sales, compared to $1.0 million in fiscal 2008, with the increase in provisions principally concentrated in thebetween access equipment and defense). When the purchasing segment duesells the inventory to the effects of the global recession on the financial health of its customers and due to reductions in the underlying collateral value of the equipment.
Fiscal 2008 Compared to Fiscal 2007
Consolidated operating income increased 1.0% to $615.0 million, or 8.9% of sales, in fiscal 2008 compared to $609.1 million, or 9.9% of sales, in fiscal 2007. The increase in operating income in fiscal 2008 was principally due to the inclusion of JLG for the entire fiscal year and favorable results in the defense segment as a result of higher sales, offset in part by a decrease in operating income in the commercial segment due to a drop in concrete placement product sales, lower operating performance for certain operating units within the fire & emergency segment as a result of lower sales and higher corporate costs.
Defense segment operating income increased 8.2% to $265.2 million, or 14.0% of sales, in fiscal 2008 compared to $245.0 million, or 17.3% of sales, in fiscal 2007. The decrease in operating income as a percentage of sales during fiscal 2008 reflected a higher mix of lower-margin truck sales, lower negotiated margins on the FHTV contract and inefficiencies on the start-up of a contract, offset in partan outside party, profits earned by the reduction of a warranty reserve upon the expiration of a systemic warranty.
Access equipmentselling segment operating income increased 34.1% to $360.1 million, or 11.7% of sales,are recorded in fiscal 2008 compared to $268.4 million, or 10.6% of sales, in fiscal 2007. Operating income margins in the prior year were negatively affected by the timing of the JLG acquisition just prior to JLG’s seasonal holiday shut-down and charges of $14.0 million related to the revaluation of inventory at the acquisition date of JLG. In addition, operating income for fiscal 2008 benefited from favorable foreign currency exchange rates and a favorable product and customer mix.
Fire & emergency segment operating income decreased 12.6% to $93.9 million, or 7.9% of sales, in fiscal 2008 compared to $107.5 million, or 9.4% of sales, in fiscal 2007. The decrease in both operating income and operating income margin was the result of softness in the towing equipment market and adverse product mix as well as operating losses at OSV, the Company’s domestic mobile medical trailer and broadcast vehicle business.
Commercial segment operating income decreased 93.8% to $4.7 million, or 0.6% of sales, in fiscal 2008 compared to $76.5 million, or 7.1% of sales, in fiscal 2007. Operating income performance was negatively impacted by significantly lower domestic concrete mixer sales as a result of a slowdown in the U.S. residential construction market combined with lower unit volumes subsequent to the pre-buy ahead of the January 2007 diesel engine emissions standards changes.
Corporate operating expenses and inter-segmentconsolidated earnings through intersegment profit eliminations increased $20.6 million to $108.9 million, or 1.5% of consolidated sales, in fiscal 2008 compared to $88.3 million, or 1.4% of consolidated sales, in fiscal 2007. The increase was largely due to higher personnel costs and additional information technology spending to support the Company’s growth objectives and the reduction of litigation expense reserves in the prior year period.eliminations.
Consolidated selling, general and administrative expenses increased 19.8%4.8% to $493.5$513.2 million, or 7.1%6.8% of sales, in fiscal 20082011 compared to $411.9$489.8 million, or 6.7%5.0% of sales, in the prior yearfiscal 2010. The increase in selling, general and administrative expenses was due largelyprimarily to inclusionhigher salaries and fringe benefits in part due to elimination of JLGcertain employee furloughs and restoration of employee benefits ($21.1 million), outside services ($20.3 million) and travel ($6.8 million), offset in part by a lower provision for a full twelve months in fiscal 2008.credit losses ($25.3 million). Consolidated selling, general and administrative expenses as a percentage of sales increased largely due to increased corporate expenses.lower sales in fiscal 2011.
36Fiscal 2010 Compared to Fiscal 2009
The Company reported consolidated operating income of $1.39 billion, or 14.2% of sales, in fiscal 2010 compared to an operating loss of $979.5 million, or 18.6% of sales, in fiscal 2009. Operating results in fiscal 2010 and 2009 included non-cash charges for the impairment of goodwill and other long-lived assets of $34.1 million and $1.19 billion, respectively. The lower impairment charges in fiscal 2010 combined with significantly improved defense segment and access equipment segment performance led to the increase in operating income.
Defense segment operating income increased 227.5% to $1.32 billion, or 18.4% of sales, in fiscal 2010 compared to $403.3 million, or 15.5% of sales, in fiscal 2009. The increase in operating income as a percent of sales compared to the prior year reflected the impact of the significant increase in production and sales volume related to the M-ATV contract (280 basis points) and relatively fixed engineering and administrative expenses relative to higher sales (140 basis points), offset in part by a reduced LIFO benefit (40 basis points).
The access equipment segment reported operating income of $97.3 million, or 3.2% of sales, in fiscal 2010 compared to an operating loss of $1.16 billion in fiscal 2009, which included $944.0 million in non-cash impairment charges for goodwill and other long-lived assets. The improvement in operating results was primarily the result of the impact of the impairment charges recorded in prior year results and recognition of $1.73 billion of intersegment M-ATV sales at mid-single digit margins in fiscal 2010 as the Company leveraged under-utilized facilities and its workforce from its access equipment segment to produce crew capsules for the M-ATV and to perform vehicle assembly. Operating results related to sales to external customers in the access equipment segment in fiscal 2010 also benefited from lower material costs ($48.2 million), lower provisions for credit losses ($34.3 million), improved pricing ($22.9 million) and favorable foreign currency exchange rates ($13.1 million).
The fire & emergency segment reported operating income of $57.6 million, or 6.3% of sales, in fiscal 2010 compared to $51.2 million, or 4.9% of sales, in fiscal 2009. Fiscal 2010 and 2009 included $27.0 million and $64.2 million in non-cash impairment charges for goodwill and other long-lived assets, respectively. The improvement in operating results was due to a decrease in impairment charges in fiscal 2010, offset in part by the impact of lower sales volumes across the segment ($32.2 million).
The commercial segment generated operating income of $19.4 million, or 3.1% of sales, in fiscal 2010 compared to an operating loss of $183.7 million in fiscal 2009, which included $184.3 million in non-cash impairment charges for goodwill and other long-lived assets. The increase in operating results in fiscal 2010 was largely due to the recognition of impairment charges in the prior year and profit on increased intersegment manufacturing activities for the defense segment, offset in part by lower LIFO inventory benefits ($3.6 million).
Corporate operating expenses increased $9.4 million to $99.0 million in fiscal 2010 compared to fiscal 2009 largely due to higher incentive compensation, including higher share-based compensation expense.
Intersegment profit eliminations of $1.9 million in fiscal 2010 resulted from profit on intersegment sales between segments (largely M-ATV related sales between access equipment and defense). To the extent that the purchasing segment has not sold the inventory to an outside party, the profits earned by the selling segment are eliminated from consolidated earnings through intersegment profit eliminations.
40
Table of Contents
Consolidated selling, general and administrative expenses increased $59.5 million to $489.8 million, or 5.0% of sales, in fiscal 2010 compared to $430.3 million, or 8.2% of sales, in fiscal 2009. The increase in selling, general and administrative expenses as compared to the prior year was primarily related to higher compensation ($56.8 million), including higher incentive and share-based compensation expense, higher consulting services ($10.9 million) and promotional expenses ($8.0 million) and other increases associated with the higher sales, offset in part by lower provisions for doubtful accounts and credits losses ($34.7 million). Consolidated selling, general and administrative expenses as a percentage of sales decreased largely due to substantially higher defense segment sales on a relatively fixed cost base.
Non-Operating Income –— Three Years Ended September 30, 20092011
Fiscal 20092011 Compared to Fiscal 20082010
Interest expense net of interest income increased $3.0decreased $97.6 million to $208.0$86.0 million in fiscal 20092011 compared to fiscal 2008 on lower average outstanding debt, as a result of higher interest rates after the effective date of an amendment of the Company’s Credit Agreement. In March 2009, the Company amended its Credit Agreement to provide additional room under its financial covenants to address lower earnings2010, largely as a result of the effect of lower borrowings, the impact of the global recession and tight credit markets. In connection with this amendment,scheduled reduction of an interest rate spreadsswap and a write-off of deferred financing costs in the prior year period associated with debt pre-payment. Average debt outstanding decreased from $1.61 billion during fiscal 2010 to $1.10 billion during fiscal 2011. Included within fiscal 2011 and 2010 interest expense were increased significantly. See “Liquidity”$0.1 million and Note 11$20.4 million, respectively, related to the Notes to Consolidated Financial Statements for further information regardingwrite-off of deferred financing fees associated with the amendment to the Credit Agreement.early repayment and refinancing of debt.
Other miscellaneous income of $8.5$1.6 million in fiscal 20092011 related primarily to net foreign currency transaction gains.
Fiscal 20082010 Compared to Fiscal 20072009
Interest expense net of interest income increased $10.4decreased $23.9 million to $205.0$183.6 million in fiscal 20082010 compared to fiscal 2007,2009 largely as a result of the effect of lower borrowings, offset in part by the write-off of debt issuance costs as a result of the repayment of debt. Average debt outstanding decreased from $2.55 billion during fiscal 2009 to $1.61 billion during fiscal 2010. In addition to debt reduction as a result of strong cash flow generation during the past two years, the Company completed a common stock offering early in the fourth quarter of fiscal 2009, which provided $358.1 million of net proceeds that the Company applied to reduce outstanding debt. Included within fiscal 2010 and 2009 interest on borrowings incurred in connectionexpense were $20.4 million and $5.0 million, respectively, related to the write-off of deferred financing fees associated with the JLG acquisition for a full year in fiscal 2008 compared to approximately ten months in the prior fiscal year.early repayment and refinancing of debt.
Other miscellaneous lossincome of $9.3$1.0 million in fiscal 20082010 related primarily to net foreign currency transaction losses.gains.
(Benefit from) Provision for (Benefit from) Income Taxes –— Three Years Ended September 30, 20092011
Fiscal 20092011 Compared to Fiscal 20082010
The Company recorded a $19.7provision for income taxes of 34.5% of pre-tax income in fiscal 2011 compared to 34.2% for fiscal 2010. The fiscal 2011 effective tax rate included discrete tax benefits resulting from a decision to repatriate earnings previously fully reinvested (100 basis points), the December 2010 reinstatement of the U.S. research and development tax credit (60 basis points) and reductions of tax reserves associated with expiration of statutes of limitations (110 basis points), offset in part by unbenefited foreign losses (140 basis points) due to cumulative net operating losses. The fiscal 2010 effective tax rate benefited from a favorable income tax audit settlement (130 basis point reduction).
Fiscal 2010 Compared to Fiscal 2009
The Company recorded a $414.3 million tax benefitprovision in fiscal 2009,2010, or 1.7%34.2% of pre-tax income from continuing operations, compared to a tax benefit of $12.6 million, or 1.1% of pre-tax losses compared tofrom continuing operations, in fiscal 2009. The fiscal 2010 income tax expense of $120.8 million, or 30.1% of pre-tax earnings, for fiscal 2008. The expectedprovision benefited from a favorable income tax benefit for fiscal 2009, at the U.S. federal rate of 35%audit settlement (130 basis point reduction in effective tax rate), of $417.0 millionwhich was reducedpartially offset by the tax effect of non-deductible impairment charges of $396.2 million and by $17.3 million related to the reduction in accrued benefits previously recorded under a European tax incentive due to losses in the period (60 basis point increase in rate). The fiscal 2010 effective income tax rate was unfavorably impacted by a pre-tax intangible asset impairment charge of $25.6 million, of which only $6.3 million was deductible. The 2009 income tax benefit of $412.4 million at the U.S. federal rate on the pre-tax loss of $1,178.2 million was reduced by the tax effect of non-deductible intangible asset impairment charges of $394.0 million and $17.3 million related to
41
Table of Contents
the reduction in accrued benefits previously recorded under a European tax incentive due to cumulative losses incurred during the period, offset in part by a worthless stock deduction and other tax benefits.
Fiscal 2008 Compared to Fiscal 2007
The effective income tax rate for fiscal 2008 was 30.1% compared to 33.1% in fiscal 2007. The fiscal 2008 effective tax rate was positively impacted by a European tax incentive which benefited the effective rate by 5.2 percentage points. Increased benefitsbenefit of the domestic manufacturing deduction was more than offset by lower research and development tax credits due to the expiration of the credit in December 2007.$10.5 million.
Equity in Earnings (Losses) Earnings of Unconsolidated Affiliates –— Three Years Ended September 30, 20092011
Fiscal 20092011 Compared to Fiscal 20082010
The Company recorded a loss of $1.4 million related to equityEquity in earnings (losses) earnings of unconsolidated affiliates net of income taxes,$0.5 million in fiscal 2011 and $(4.3) million in fiscal 2010 primarily represented the Company’s equity interest in a lease financing partnership, a commercial entity in Mexico and a joint venture in Europe.
Fiscal 2010 Compared to Fiscal 2009
Equity in losses of unconsolidated affiliates of $4.3 million in fiscal 2010 and $1.4 million in fiscal 2009 compared to $6.3 million of income in fiscal 2008. The Company hasprimarily represented the Company’s equity interestsinterest in a lease financing partnership, a commercial entity in Mexico and a joint venture in Europe. Earnings for these entities decreased due to lower financing activity and increased credit losses due to the impact of thecontinued global recession.
Fiscal 2008 Compared to Fiscal 2007
Equity in earnings of unconsolidated affiliates, net of income taxes, of $6.3 million in fiscal 2008 and $7.3 million in fiscal 2007 primarily represent the Company’s equity interest in a lease financing partnership, a commercial entity in Mexico and a joint venture in Europe.
37
Table of Contents
Analysis of Discontinued Operations – Three Years Ended September 30, 2009
On July 1, 2009, the Company completed the sale of its ownership in Geesink to a third party for nominal cash consideration. Geesink, a European refuse collection vehicle manufacturer, was previously included in the Company’s commercial segment. Due to the reclassification of $92.0 million of cumulative translation adjustments out of shareholders’ equity, the Company recorded a pre-tax gain on the sale of Geesink of $33.8 million. The historical results of operations of Geesink have been reclassified in the Company’s Consolidated Statements of Operations and are included in “Income (loss) from discontinued operations,” for all periods presented.
Fiscal 2009 Compared to Fiscal 2008
Geesink sustained a pre-tax loss of $14.8 million in fiscal 2009 compared to a loss of $210.3 million in fiscal 2008. Fiscal 2009 includes the nine month period ended July 1, 2009 (the date of the sale). During fiscal 2009, Geesink continued to incur high costs related to the rationalization of manufacturing facilities and inefficiencies associated with the relocation and start-up of production of Norba-branded products in The Netherlands. In fiscal 2008, the Company recorded pre-tax, non-cash charges for the impairment of intangible assets of $174.2 million which were largely non-deductible for local tax purposes. Geesink recorded a tax benefit for operating losses of $0.5 million in fiscal 2009 compared to $2.7 million in fiscal 2008. A valuation allowance was recorded against a majority of the non-impairment losses incurred by Geesink as the Company determined that it was unlikely that the foreign tax benefits would be realized. In the fourth quarter of fiscal 2009, the Company made a “check-the-box” election to treat its foreign subsidiary, the European holding company parent of Geesink, as a disregarded entity for U.S. federal income tax purposes. As a result of the election, the Company recorded a $71.5 million worthless stock and bad debt income tax benefit, of which $54.0 million related to Geesink and has been recorded in discontinued operations.
Fiscal 2008 Compared to Fiscal 2007
Sales at the Company’s European refuse collection vehicle business were $201.9 million in fiscal 2008, up 20.2% as compared to the prior year, due largely to stronger demand in The Netherlands and favorable foreign currency exchange rates. Geesink sustained a pre-tax loss of $210.3 million in fiscal 2008 compared with a pre-tax loss of $19.7 million in fiscal 2007. The increase in the operating loss was primarily due to non-cash charges for the impairment of intangible assets of $174.2 million, costs associated with the rationalization of manufacturing facilities, inefficiencies associated with the relocation and start-up of production of Norba-branded products from Sweden to The Netherlands and increased material and warranty costs. In June 2008, it became evident that synergies related to Geesink’s facility rationalization program would be lower than expected and costs to execute the rationalization would be higher than anticipated. The resulting slower than expected and more difficult return to profitability of Geesink’s business, further escalation of raw material costs and a reduction in fabrication volume for the Company’s access equipment segment at Geesink’s Romania facility due to a slowdown in the European access equipment market led to the Company’s conclusion that the charges for impairment were required. With the assistance of a third-party valuation firm, the Company determined that Geesink goodwill and non-amortizable intangible assets were impaired and the Company recorded non-cash impairment charges of $174.2 million in the third quarter of fiscal 2008.economic weakness.
Liquidity and Capital Resources
Financial Condition at September 30, 20092011
The Company’s capitalization was as follows (in millions):
| | September 30, | |
| | 2009 | | 2008 | |
Cash and cash equivalents | | $ | 530.4 | | $ | 88.2 | |
Total debt | | 2,038.2 | | 2,774.0 | |
Shareholders’ equity | | 514.1 | | 1,388.6 | |
Total capitalization (debt plus equity) | | 2,552.3 | | 4,162.6 | |
Debt to total capitalization | | 79.9 | % | 66.6 | % |
| | | | | | | |
38
Table of Contents
Debt decreased $735.8 million during fiscal 2009 as the Company utilized cash flows from operations and the proceeds from a public equity offering in August 2009 to pay down outstanding debt. The decrease in shareholders’ equity was primarily the result of $1.20 billion of pre-tax, non-cash charges for the impairment of goodwill and other long-lived assets recorded in the second quarter of fiscal 2009, offset in part by the proceeds from the Company’s public equity offering in August 2009.
| | September 30, | |
| | 2011 | | 2010 | |
Cash and cash equivalents | | $ | 428.5 | | $ | 339.0 | |
Total debt | | 1,060.1 | | 1,302.3 | |
Oshkosh Corporation shareholders’ equity | | 1,596.5 | | 1,326.6 | |
Total capitalization (debt plus equity) | | 2,656.6 | | 2,628.9 | |
Debt to total capitalization | | 39.9 | % | 49.5 | % |
| | | | | | | |
The Company entered into a performance-based payments agreement on the M-ATV programrepaid $241.4 million of debt during the fourth quarterfiscal 2011. The Company’s primary use of fiscal 2009. This resulted in a significant cash paymentgenerated from operations continued to the Company near the endbe debt reduction.
Approximately 12% of the fiscal year which contributed toCompany’s cash on hand of $530.4 millionand cash equivalents at September 30, 2009. In October 2009,2011 were located outside the United States. The Company prepaid $117.7 million of debt (all remaining outstanding Term Loan A debt)does not anticipate any requirements to utilize foreign cash and utilized much of its cash as of September 30, 2009equivalents to pay M-ATV suppliers.
meet liquidity needs in the United States during fiscal 2012. In addition to cash and cash equivalents, the Company had $515.9$522.1 million of unused available capacity under the Revolving Credit Facility (as defined in “Liquidity”) as of September 30, 2009.2011. Borrowings under the Revolving Credit Facility could, as discussed below, be limited by the financial covenants contained within the Credit Agreement.Agreement (as defined in “Liquidity”).
Cash Flows
Operating Cash Flows
The Company generated $898.9$387.7 million of cash from operating activities during fiscal 20092011 compared to $390.4$619.7 million forduring fiscal 2008. While the Company incurred a loss from continuing operations2010. The decrease in fiscal 2009 compared to income in fiscal 2008, the loss resulted from non-cash impairment charges. The higher generation of cash from operating activities in fiscal 20092011 was the result of a substantial reduction in working capital, particularly relatedprimarily due to trade accounts receivable, inventory, accounts payable and customer advances. The changes in receivables, inventories and accounts payable were primarily driven by the decrease in sales during fiscal 2009 versus fiscal 2008. A significant increasenet income, offset in customer advancespart by lower working capital requirements than in fiscal 2009 was due to the timing2010.
42
Table of performance-based payments from the U.S. government on the FHTV contract awarded in October 2008 and, more significantly, the M-ATV contract awarded in June 2009. In September 2009, after receipt of a M-ATV performance-based payment, the Company prepaid a supplier $100.0 million for inventory deliveries scheduled to occur beginning in early fiscal 2010. The pre payment is recorded with in “Other current assets” in the Consolidated Balance Sheets.Contents
Cash generated (used)generation (use) from changes in significant working capital accounts were as follows (in millions):
| | Fiscal Year Ended | | | Fiscal Year Ended | |
| | September 30, | | | September 30, | |
| | 2009 | | 2008 | | | 2011 | | 2010 | |
| | | | | | | | | | |
Receivables, net | | $ | 377.2 | | $ | 65.6 | | | $ | (210.0 | ) | $ | (339.6 | ) |
Inventories, net | | 112.6 | | (38.7 | ) | | 58.8 | | (82.7 | ) |
Accounts payable | | (55.8 | ) | 15.6 | | | 54.2 | | 169.4 | |
Customer advances | | 435.6 | | (41.3 | ) | | 95.4 | | (356.4 | ) |
Payroll-related obligations | | | (16.6 | ) | 55.7 | |
| | $ | 869.6 | | $ | 1.2 | | | $ | (18.2 | ) | $ | (553.6 | ) |
The changes in receivables and accounts payable in fiscal 2011 were primarily driven by increases in production and sales to external customers in the access equipment segment, offset in part by reductions in M-ATV production in the defense segment. The change in inventories in fiscal 2011 was primarily driven by reductions in M-ATV production in the defense segment, offset in part by higher inventories in the access equipment segment as a result of increases in production and sales to external customers. The change in customer advances was primarily driven by the timing of FMTV and M-ATV orders in the defense segment. The change in payroll-related obligations was primarily the result of the payment of fiscal 2010 year-end incentive compensation in the first quarter of fiscal 2011 compared to a lower payout in fiscal 2010.
The Company’s cash flow from operations has fluctuated, and will likely continue to fluctuate, significantly from quarter to quarter due to the start-up or conclusion of large defense contracts and the timing of receipt of individually large performance-based payments from the DoD, as well as changes in working capital requirements arising principally from seasonal fluctuations in sales.
Consolidated days sales outstanding decreased to 33(defined as “Trade Receivables” divided by “Net Sales” for the most recent quarter multiplied by 90 days) increased from 37 days at September 30, 2009 from 432010 to 45 days at September 30, 2008 as a result of a higher proportion of consolidated sales concentrated in segments with shorter payment terms, offset in part by a 18-day deterioration2011. The increase in days sales outstanding was primarily due to the increase in the access equipment segment sales to external customers, which was driven in part by the granting oftend to have longer payment terms than defense sales. Days sales outstanding on newnon-defense sales for competitive reasons.was 57 days at September 30, 2011, up from 49 days at September 30, 2010. Consolidated inventory turns (defined as “Cost of Sales” divided by the average “Inventory” as of the previous five quarter end periods) decreased from 5.06.7 times at September 30, 20082010 to 4.35.5 times at September 30, 2009 largely as2011. The decrease in inventory turns was primarily related to the scheduled completion of M-ATV production in fiscal 2011, which had a resultpositive impact on inventory turns in the prior year due to the velocity of access equipment segment sales declining at a faster pace than inventory.
39
Table of Contentsthe program.
Investing Cash Flows
Cash flows relating to investing activities consist primarily of cash used for capital expenditures. Net cash used in investing activities in fiscal 20092011 was $56.1$68.3 million compared to $100.2$83.9 million in fiscal 2008.2010. Capital spending, excluding equipment held for rental, of $46.2 million in fiscal 2009 was down $29.6 million compared to capital spending in2011 remained relatively consistent with fiscal 2008.2010. In fiscal 2009, the Company sharply curtailed capital spending in response to the global recession. In fiscal 2010,2012, the Company expects capital spending to increaseapproximate $85 million to approximately $90 to $100 million as it continues to invest in the M-ATV production ramp-up, the JLG manufacturing facility in China, and as it prepares for FMTV full rate production in fiscal 2011.$95 million.
Financing Cash Flows
Financing activities consists primarily of proceeds from the issuance of long-term debt and equity, and cash used by financing activities consists primarily of repayments of indebtedness and payments of dividends to shareholders.indebtedness. Financing activities resulted in a net use of cash of $408.1$231.5 million during fiscal 20092011 compared to $273.6$722.5 million during fiscal 2008.
On August 12, 2009, the Company completed a public equity offering of 14,950,000 shares of Common Stock, which included the exercise of the over-allotment option of 1,950,000 shares of Common Stock, at a price of $25.00 per share.2010. The Company paid $15.1 million in underwriting discounts and commissions and approximately $0.6 million of offering expenses. The Company used the $358.1 million in net proceeds from the offering to repay debt under the Company’s credit agreement.
The Company repaid $731.6 millionrepayment of debt slowed in fiscal 2009 compared to $250.0 million in fiscal 2008. In addition, the Company incurred $20.1 million of debt amendment costs and paid dividends totaling $14.9 million in fiscal 2009. The Company suspended dividend payments in April 2009 resulting in a $14.9 million reduction in cash used for dividend payments in fiscal 20092011 as compared to fiscal 2008.2010 as a result of the decrease in cash provided by operating activities. The Company expects modest debt repayment in fiscal 2012.
43
Table of Contents
Liquidity
The Company’s primary sources of liquidity are the cash flowflows generated from operations,income, availability under the $550.0 million Revolving Credit Facility (as defined below) and available cash and cash equivalents. In addition to cash and cash equivalents of $530.4$428.5 million, the Company had $515.9$522.1 million of unused availability under the terms of its Revolving Credit Facility as of September 30, 2009.2011. These sources of liquidity are needed to fund the Company’s working capital requirements, debt service requirements and capital expenditures. Based onThe Company believes that it will experience modestly negative free cash flow (defined as cash flow from operations less capital expenditures) in fiscal 2012. The Company expects that the Company’s current outlook forcash usage will be largely driven by lower earnings, lower performance-based payments from the DoD as a result of an expected continued decline in defense segment sales, higher working capital requirements as sales to external customers continue to rebound in the access equipment segment, and anticipated capital expenditures in fiscal 2010, the2012 of $85 million to $95 million. The Company expects to have sufficient liquidity to finance its operations over the next twelve months.
Senior Secured Credit Agreement
In December 2006,On September 27, 2010, the Company entered intoreplaced its existing credit agreement with a syndicatednew senior secured credit agreement (“Credit Agreement”) with various financial institutions, which consisted oflenders (the “Credit Agreement”). The Credit Agreement provides for (i) a five-year $550.0 million revolving credit facility (“Revolving Credit Facility”) that matures in October 2015 with an initial maximum aggregate amount of availability of $550 million and two(ii) a $650 million term loan facilities (“Term Loan”) facility due in quarterly principal installments of $16.25 million commencing December 31, 2010 with a balloon payment of $341.25 million due at maturity in October 2015. During the fourth quarter of fiscal 2011, the Company prepaid the principal installment under the Term Loan A”which was originally due December 31, 2011 and “Term Loan B,” and collectively,$8.75 million of the “Term Loan Facility”).principal installment which was originally due March 31, 2012. In March 2009,October 2011, the Company entered into a second amendment (the “Amendment”) toprepaid $40.0 million of current maturities of long-term debt, which represented the remaining principal amount due under the Term Loan during fiscal 2012.
The Company’s obligations under the Credit Agreement are guaranteed by certain of its domestic subsidiaries, and the Company will guarantee the obligations of certain of its subsidiaries under the Credit Agreement to provide reliefthe extent such subsidiaries borrow directly under its Leverage Ratio (as defined in the Credit Agreement) financial covenant. The Company believed that the Amendment was requiredAgreement. Subject to avoid a potential financial covenant violation at the end of its second quarter of fiscal 2009 as a result of lower demand for certain of the Company’s products due to continued weakening in the global economy and tight credit. The Amendment also included an increase in the margin on LIBOR loans to 600 basis points, compared with 150 basis points immediately prior to the Amendment, and a requirement that the Company prepay $14.5 million and $86.0 million of debt related to Term Loan A and Term Loan B, respectively. The Amendment also involved other changes toexceptions, the Credit Agreement including placing limitations on capital expenditures, dividends, investmentsis secured by (i) a first-priority perfected lien and acquisitions, an increasesecurity interests in substantially all of the frequencypersonal property of mandatory prepayments, adding a Senior Secured Leverage Ratio (as defined in the Credit Agreement),Company, each material subsidiary of the Company and requiring the grant of mortgage liens oneach subsidiary guarantor, (ii) mortgages upon certain real estate owned byproperty of the Company and certain of its subsidiaries.domestic subsidiaries and (iii) a pledge of the equity of each material subsidiary and each subsidiary guarantor.
The Amendment also added a usageCompany must pay (i) an unused commitment fee equalranging from 0.40% to an annualized rate0.50% per annum of 50 basis points onthe average daily unused portion of the aggregate principal amount of all outstanding loansrevolving credit commitments under the Credit Agreement and (ii) a fee ranging from 1.125% to 3.50% per annum of the maximum amount available to be drawn for any day on whicheach letter of credit issued and outstanding under the Company has a corporate family rating from Moody’s Investors Service of B3 with “negative” watch or lower or a corporate credit rating from Standard & Poor’s Rating Services of B- with “negative” watch or lower. The Company’s credit ratings are reviewed regularly by these major debtCredit Agreement.
40
Table of Contents
rating agencies. In January 2009, Standard & Poor’s Rating Services lowered the Company’s long-term debt rating from BB- to B and credit watch “negative” citing weaker-than-expected operating results and the Company’s need to seek an amendment of the financial covenants contained in the Credit Agreement. Likewise, in January 2009, Moody’s Investors Service lowered the Company’s long-term debt rating from Ba3 to B2 with ratingsBorrowings under review for possible downgrade pending resolution of the negotiations with its bank, citing expectations of further erosion in the Company’s credit metrics due to the deterioration in several of the Company’s businesses, particularly the access equipment segment. In March 2009, following the Amendment, both Standard & Poor’s Rating Services and Moody’s Investors Service lowered the Company’s long-term debt ratings to “negative” outlook. In August 2009, following the Company’s Common Stock offering and award of the M-ATV contract, Standard & Poor’s Rating Services upgraded the Company’s long-term debt rating to B+ with a “stable” outlook citing improved covenant headroom and good near-term prospects for the Company’s defense segment.
The Company accounted for the Amendment in accordance with ASC Topic 470-50, Debt Modifications and Extinguishments. As the terms of the Credit Agreement both prior to and after the Amendment allowed for the prepayment of the amounts due withoutbear interest at a penalty, the Company determined that the debt was callable on the date of the Amendment. As such, the present value of the cash flows both prior to and after the Amendment was not determined to be substantially different. Accordingly, fees of $20.1 million paid by the Company to the parties to the Credit Agreement were capitalized in connection with the Amendment, along with the existing unamortized debt fees, and will be amortized as an adjustment of interest expense over the remaining term of the Credit Agreement using the interest method. Furthermore, in accordance with ASC Topic 470-50, costs incurred with third parties of $0.5 million were expensed as incurred.
Term Loan A required principal payments of $12.5 million, plus interest, due quarterly from December 2009 through September 2011, with a final principal payment of $248.0 million due December 6, 2011. As a result of excess available cash, through September 30, 2009, the Company prepaid all of the quarterly principal payments related to Term Loan A as well as $130.3 million of the final principal payment under Term Loan A. The remaining outstanding balance under Term Loan A of $117.7 million at September 30, 2009 was prepaid in full in October 2009. The outstanding balance under Term Loan B at September 30, 2009 of $1,902.6 million is due December 6, 2013.
Interest rates on borrowings under the Revolving Credit Facility and Term Loan Facility are variable and arerate equal to (i) LIBOR plus a specified margin, which may be adjusted upward or downward depending on whether certain criteria are satisfied, or (ii) for dollar-denominated loans only, the “Base Rate”base rate (which is equal to the higherhighest of a bank’s reference(a) the administrative agent’s prime rate, and(b) the federal funds rate plus 0.5%, a bank’s “Prime Rate”0.50% or (c) the sum of 1.0%1% plus the “Off-Shore” rate that would be applicable for an interest period of one month beginning on such day) or the “Off-Shore” or “LIBOR Rate” (which is a bank’s inter-bank offered rate for U.S. dollars in off-shore markets)one-month LIBOR) plus a specified margin. The margins on the Revolving Credit Facility and Term Loan A are subject to adjustment, upmargin, which may be adjusted upward or down, baseddownward depending on whether certain financial criteria are met.satisfied. At September 30, 2009,2011, the interest rate spread on the Revolving Credit Facility and Term Loan Facility was 600250 basis points. The weighted-average interest rate on borrowings outstanding under the Term Loan at September 30, 20092011, prior to consideration of the interest rate swap, was 6.60% and 6.42% for Term Loans A and B, respectively.2.77%.
To manage a portion of the Company’s exposure to changes in LIBOR-based interest rates on its variable-rate debt, the Company entered into an amortizing interest rate swap agreement on January 11,in 2007 that effectively fixes the interest payments on a portion of the Company’s variable-rate debt. The swap, which has a termination date of December 6, 2011, effectively fixes the LIBOR-based interest rate on the debt in the amount of the notional amount of the swap at 5.105% plus the applicable spread based on the terms of the Credit Agreement as amended (11.105%(7.605% at September 30, 2009)2011). The notional amount of the swap at September 30, 20092011 was $1.25 billion and reduces to $750 million on December 7, 2009 and $250 million on December 6, 2010. Neither the Company nor the counterparty is required to collateralize its obligations under these swaps. The Company is exposed to loss if the counterparty defaults. However, as of the date of this filing, the counterparty is a large Aa1 rated global financial institution and the Company believes that the risk of default is remote.million.
44
Table of Contents
Covenant Compliance
The Credit Agreement as amended, contains various restrictions and covenants, including requirements that the Company maintain certain financial ratios at prescribed levels and restrictions on the ability of the Company and certain of its subsidiaries to among other things, consolidate or merge, create liens, incur additional indebtedness, and dispose of assets.assets, consummate acquisitions and make investments in joint ventures and foreign subsidiaries. The Credit Agreement as amended, also requires the Company to maintaincontains the following financial ratios:covenants:
·Leverage Ratio: The· | Leverage Ratio: A maximum leverage ratio (defined as, with certain adjustments, the ratio of the Company’s consolidated indebtedness to consolidated net income before interest, taxes, depreciation, amortization, non-cash charges and certain other items (“EBITDA”)) as of the last day of any fiscal quarter of 4.50 to 1.0. |
· | Interest Coverage Ratio: A minimum interest coverage ratio (defined as, with certain adjustments, the ratio of the Company’s consolidated EBITDA to the Company’s consolidated cash interest expense) as of the last day of any fiscal quarter of 2.50 to 1.0. |
· | Senior Secured Leverage Ratio: A maximum senior secured leverage ratio (defined as, with certain adjustments, the ratio of the Company’s consolidated secured indebtedness to the Company’s consolidated EBITDA) of Consolidated Indebtedness outstanding at quarter-end to Consolidated Earnings Before Interest, Taxes, Depreciation and Amortization (“EBITDA”) for the most recently ended four fiscal quarters, as such terms are defined in the Credit Agreement, as amended. 41
Table of Contents
The Leverage Ratio is not permitted to be greater than the following:
|
Fiscal Quarters Ending | | | |
September 30, 20092011 | | 7.253.25 to 1.0
| |
December 31, 2009 | | 7.00 to 1.0
| |
March 31, 2010
| | 6.75 to 1.0
| |
June 30, 2010 through June 30, 2011
| | 6.50 to 1.0
| |
September 30, 2011 through JuneSeptember 30, 2012
| | 5.50 to 1.0
| |
September 30, 2012 through June 30, 2013
| | 4.253.00 to 1.0
| |
Thereafter | | 3.75 to 1.0
| |
As of September 30, 2009, the Company was in compliance with the Leverage Ratio with a ratio of 4.68 to 1.0.
·Interest Coverage Ratio: The ratio of Consolidated EBITDA for the most recently ended four fiscal quarters to Cash Interest Expense for the most recently ended four fiscal quarters, as such terms are defined in the Credit Agreement, as amended. The Interest Coverage Ratio is not permitted to be less than the following:
Fiscal Quarters Ending
|
|
|
|
September 30, 2009
| | 1.58 to 1.0
| |
December 31, 2009
| | 1.49 to 1.0
| |
March 31, 2010
| | 1.52 to 1.0
| |
June 30, 2010 through December 31, 2010
| | 1.56 to 1.0
| |
March 31, 2011 and June 30, 2011
| | 1.70 to 1.0
| |
September 30, 2011 through June 30, 2012
| | 1.88 to 1.0
| |
September 30, 2012 through June 30, 2013
| | 2.48 to 1.0
| |
Thereafter
| | 2.47 to 1.0
| |
As of September 30, 2009, the Company was in compliance with the Interest Coverage Ratio with a ratio of 2.43 to 1.0.
·Senior Secured Leverage Ratio: The ratio of outstanding Loans under the Credit Agreement, as amended, at quarter-end to Consolidated EBITDA for the most recently ended four fiscal quarters, as such terms are defined in the Credit Agreement, as amended. The Senior Secured Leverage Ratio is not permitted to be greater than the following:
Fiscal Quarters Ending
|
|
|
|
June 30, 2011
| | 5.00 to 1.0
| |
September 30, 2011 through June 30, 2012
| | 4.50 to 1.0
| |
September 30, 2012 through June 30, 2013
| | 3.25 to 1.0
| |
September 30, 2013
| | 3.002.75 to 1.0
| |
The Senior Secured Leverage Ratio limitation is not applicable until June 30, 2011.
TheCompany was in compliance with the financial covenants contained in the Credit Agreement as amended, limits the amount of dividends, stock repurchasesSeptember 30, 2011 and other types of distributions during any fiscal year in excess of certain limits based upon the Leverage Ratio as of the end of the fiscal quarter preceding the proposed distribution. When the Leverage Ratio as of the end of a fiscal quarter is greater than 4.0 to 1.0, then no such distribution may be made if, after giving effect to such distribution, the aggregate amount of all such payments made in such fiscal quarter would exceed the sum of $0.01 per outstanding share of the Company’s Common Stock plus $250,000 or the aggregate amount of all such payments made in the applicable fiscal year would exceed $3.85 million. The Company suspended payment of dividends effective April 2009.
Based on the Company’s current outlook for fiscal 2010, the Company expects to be able to meet the financial covenants contained in the Credit Agreement over the next twelve months.
Additionally, with certain exceptions, the Credit Agreement limits the ability of the Company to pay dividends and other distributions. However, so long as no event of default exists under the Credit Agreement or would result from such payment, the Company may pay dividends and other distributions in an aggregate amount not exceeding the sum of:
(i) | $50 million during any fiscal year; plus |
(ii) | the excess of (a) 25% of the cumulative net income of the Company and its consolidated subsidiaries for all fiscal quarters ending after September 27, 2010, over (b) the cumulative amount of all such dividends and other distributions made in any fiscal year ending after such date that exceed $50 million; plus |
(iii) | for each of the first four fiscal quarters ending after September 27, 2010, $25 million per fiscal quarter, in each case provided that the leverage ratio (as defined) as of the last day of the most recently ended fiscal quarter was less than 2.0 to 1.0; plus |
(iv) | for the period of four fiscal quarters ending September 30, 2011 and for each period of four fiscal quarters ending thereafter, $100 million during such period, in each case provided that the leverage ratio (as defined) as of the last day of the most recently ended fiscal quarter was less than 2.0 to 1.0. |
Senior Notes
In March 2010, the Company issued $250.0 million of 8¼% unsecured senior notes due March 1, 2017 and $250.0 million of 8½% unsecured senior notes due March 1, 2020 (collectively, the “Senior Notes”). The Senior Notes were issued pursuant to an indenture (the “Indenture”) among the Company, the subsidiary guarantors named therein and a trustee. The Indenture contains customary affirmative and negative covenants. The Company has the option to redeem the Senior Notes due 2017 and Senior Notes due 2020 for a premium after March 1, 2014 and March 1, 2015, respectively. Certain of the Company’s subsidiaries fully, unconditionally, jointly and severally guarantee the Company’s obligations under the Senior Notes. See Note 24 of the Notes to Consolidated Financial Statements for separate financial information of the subsidiary guarantors.
Refer to Note 11 of the Notes to Consolidated Financial Statements for additional information regarding the Company’s outstanding debt as of September 30, 2009.2011.
4245
Table of Contents
Contractual Obligations, Commercial Commitments and Off-Balance Sheet Arrangements
Following is a summary of the Company’s contractual obligations and payments due by period following September 30, 20092011 (in millions):
| | | Payments Due by Period | |
| | Payments Due by Period | | | | | Less Than | | | | | | More Than | |
| | | | Less Than | | | | | | More Than | | | Total | | 1 Year | | 1-3 Years | | 3-5 Years | | 5 Years | |
Contractual Obligations | | Total | | 1 Year | | 1-3 Years | | 3-5 Years | | 5 Years | | | | | | | | | | | | |
| | | | | | | | | | | | | | | | | | | | | | |
Long-term debt (including interest) | | $ | 2,638.8 | | $ | 162.4 | | $ | 408.0 | | $ | 2,068.4 | | $ | — | | |
Long-term debt (including interest)(1) | | | $ | 1,402.4 | | $ | 97.4 | | $ | 239.8 | | $ | 484.0 | | $ | 581.2 | |
Leases: | | | | | | | | | | | | | | | | | | | | | | |
Capital | | 2.4 | | 0.6 | | 0.8 | | 1.0 | | — | | | 0.2 | | 0.2 | | — | | — | | — | |
Operating | | 92.6 | | 24.4 | | 35.6 | | 14.5 | | 18.1 | | | 117.6 | | 33.1 | | 48.1 | | 21.3 | | 15.1 | |
Purchase obligations(1) | | 1,351.9 | | 1,350.5 | | 1.4 | | — | | — | | |
Purchase obligations(2) | | | 2,774.9 | | 2,773.7 | | 1.2 | | — | | — | |
Other long-term liabilities: | | | | | | | | | | | | | | | | | | | | | | |
Uncertain tax positions(2) | | — | | — | | — | | — | | — | | |
Fair value of derivatives | | 51.1 | | 36.8 | | 14.3 | | — | | — | | |
Uncertain tax positions(3) | | | — | | — | | — | | — | | — | |
Derivatives (at fair value) | | | 2.3 | | 2.3 | | — | | — | | — | |
Other | | 2.3 | | 0.4 | | 0.7 | | 0.4 | | 0.8 | | | 5.7 | | 5.0 | | 0.5 | | 0.1 | | 0.1 | |
Total contractual obligations | | $ | 4,139.1 | | $ | 1,575.1 | | $ | 460.8 | | $ | 2,084.3 | | $ | 18.9 | | | $ | 4,303.1 | | $ | 2,911.7 | | $ | 289.6 | | $ | 505.4 | | $ | 596.4 | |
(1)Interest is calculated based upon the interest rate in effect at September 30, 2011. (2)The Company utilizes blanket purchase orders to communicate expected annual requirements to many of its suppliers or contractors. Requirements under blanket purchase orders generally do not become “firm” until four weeks prior to the Company’s scheduled unit production. The purchase obligations amount included above represents the value of commitments considered firm, plus the value of all outstanding subcontracts. (3)Due to the uncertainty of the timing of settlement with taxing authorities, the Company is unable to make reasonably reliable estimates of the period of cash settlement of unrecognized tax benefits for the remaining uncertain tax liabilities. Therefore, $53.3 million of unrecognized tax benefits as of September 30, 2011 have been excluded from the Contractual Obligations table above. See Note 20 of the Notes to Consolidated Financial Statements for additional information regarding the Company’s unrecognized tax benefits as of September 30, 2011. | The Company utilizes blanket purchase orders to communicate expected annual requirements to many of its suppliers or contractors. Requirements under blanket purchase orders generally do not become “firm” until four weeks prior to the Company’s scheduled unit production. The purchase obligations amount included above represents the value of commitments considered firm, plus the value of all outstanding subcontracts.
|
| |
(2)
| Due to the uncertainty of the timing of settlement with taxing authorities, the Company is unable to make reasonably reliable estimates of the period of cash settlement of unrecognized tax benefits for the remaining uncertain tax liabilities. Therefore, $63.8 million of unrecognized tax benefits as of September 30, 2009 have been excluded from the Contractual Obligations table above. See Note 19 of the Notes to Consolidated Financial Statements for additional information regarding the Company’s unrecognized tax benefits as of September 30, 2009.
|
The Company incurs contingent limited recourse liabilities with respect to customer financing activities in the access equipment segment. For additional information relative to guarantees, see Note 1213 of the Notes to Consolidated Financial Statements.
The following is a summary of the Company’s commercial commitments (in millions):
| | | Amount of Commitment Expiration Per Period | |
| | Amount of Commitment Expiration Per Period | | | | | Less Than | | | | | | More Than | |
| | | | Less Than | | | | | | More Than | | | Total | | 1 Year | | 1-3 Years | | 3-5 Years | | 5 Years | |
Commercial Commitments | | Total | | 1 Year | | 1-3 Years | | 3-5 Years | | 5 Years | | | | | | | | | | | | |
| | | | | | | | | | | | | | | | | | | | | | |
Customer financing guarantees to third parties | | $ | 76.0 | | $ | 7.8 | | $ | 20.0 | | $ | 20.2 | | $ | 28.0 | | | $ | 102.2 | | $ | 26.8 | | $ | 26.1 | | $ | 14.5 | | $ | 34.8 | |
Standby letters of credit | | 34.1 | | 25.2 | | 8.9 | | — | | — | | | 27.9 | | 19.3 | | 8.5 | | 0.1 | | — | |
Corporate guarantees | | 3.2 | | 3.0 | | 0.2 | | — | | — | | | 3.3 | | 3.3 | | — | | — | | — | |
Total commercial commitments | | $ | 113.3 | | $ | 36.0 | | $ | 29.1 | | $ | 20.2 | | $ | 28.0 | | | $ | 133.4 | | $ | 49.4 | | $ | 34.6 | | $ | 14.6 | | $ | 34.8 | |
4346
Table of Contents
Critical Accounting Policies
The Company’s significant accounting policies are described in Note 2 of the Notes to Consolidated Financial Statements. The Company considers the following policies to be the most critical in understanding the judgments that are involved in the preparation of the Company’s consolidated financial statements and the uncertainties that could impact the Company’s financial condition, results of operations and cash flows.
Revenue Recognition:Recognition. The Company recognizes revenue on equipment and parts sales when contract terms are met, collectability is reasonably assured and a product is shipped or risk of ownership has been transferred to and accepted by the customer. Revenue from service agreements is recognized as earned, when services have been rendered. Appropriate provisions are made for discounts, returns and sales allowances. Sales are recorded net of amounts invoiced for taxes imposed on the customer such as excise or value-added taxes.
Sales to the U.S. government of non-commercial products manufactured to the government’s specifications are recognized using the units-of-delivery measure under the percentage-of-completion accounting method as units are accepted by the government. The Company includes amounts representing contract change orders, claims or other items in sales only when they can be reliably estimated and realization is probable. The Company charges anticipated losses on contracts or programs in progress to earnings when identified. Approximately 37% of the Company’s revenues for fiscal 2011 were recognized under the percentage-of-completion accounting method.
The Company accounts for certain equipment lease contracts as sales-type leases. The present value of all payments, net of executory costs (such as legal fees), is recorded as revenue, the related cost of the equipment is charged to cost of sales, certain profit is deferred in accordance with lease accounting rules and interest income is recognized over the terms of the leases using the effective interest method.
The Company enters into rental purchase guarantee agreements with some of its customers. These agreements are normally for a term of no greater than twelve months and provide for rental payments with a guaranteed purchase at the end of the agreement. At the inception of the agreement, the Company records the full amount due under the agreement as revenue and the related cost of the equipment is charged to cost of sales.
Sales Incentives:Incentives. The terms for sales transactions with some of the Company’s distributors and customers may include specific volume-based incentives, which are calculated and paid or credited on account as a percentage of actual sales. The Company accounts for these incentives as sales discounts at the time of revenue recognition, which are recorded as a direct reduction of sales. The Company reviews its accrual for sales incentives on a quarterly basis and any adjustments are reflected in current earnings.
Impairment of Long-Lived and Amortized Intangible AssetsAssets. : The Company performs impairment evaluations of its long-lived assets, including property, plant and equipment and intangible assets with finite lives, whenever business conditions or events indicate that those assets may be impaired. When the estimated future undiscounted cash flows to be generated by the assets are less than the carrying value of the long-lived assets, the assets are written down to fair market value and a charge is recorded to current operations.
Impairment ofGoodwill and Indefinite-Lived Intangible Assets:Assets. Goodwill and indefinite-lived intangible assets are tested for impairment annually, or more frequently if events or changes in circumstances indicate that the assets might be impaired. The Company performs its annual review at the beginning of the fourth quarter of each fiscal year.
The Company evaluates the recoverability of goodwill by estimating the future discounted cash flows of the businesses to which the goodwill relates.relates, supplemented by the market approach. Estimated cash flows and related goodwill are grouped at the reporting unit level. A reporting unit is an operating segment or, under certain circumstances, a component of an operating segment that constitutes a business. When estimated future discounted cash flows are less than the carrying value of the net assets and related goodwill, an impairment test is performed to measure and recognize the amount of the impairment loss, if any. Impairment losses, limited to the carrying value of goodwill, represent the excess of the carrying amount of a reporting unit’s goodwill over the implied fair value of that goodwill. In determining the estimated future cash flows, the Company considers current and projected future levels of income as well as business trends, prospects and market and economic conditions.
4447
Table of Contents
The Company evaluates the recoverability of indefinite-lived trade names, based upon a “relief from royalty” method. This methodology determines the fair value of each trade name through use of a discounted cash flow model that incorporates an estimated “royalty rate” the Company would be able to charge a third party for the use of the particular trade name. In determining the estimated future cash flows, the Company considers projected future sales, a fair market royalty rate for each applicable trade name and an appropriate discount rate to measure the present value of the anticipated cash flows.
The Company cannot predict the occurrence of certain events that might adversely affect the carrying value of goodwill and indefinite-lived intangible assets. Such events may include, but are not limited to, the impact of the economic environment, a material negative change in relationships with significant customers, or strategic decisions made in response to economic and competitive conditions. See “Critical Accounting Estimates.”
Guarantees of the Indebtedness of Others:Others. The Company enters into agreements with finance companies whereby the Company will guarantee the indebtedness of third-party end-users to whom the finance company lends to purchase the Company’s equipment. In some instances, the Company retains an obligation to the finance companies in the event the customer defaults on the financing. In accordance with FASB ASC Topic 460, Guarantees, the Company recognizes the greater of the fair value of the guarantee or the contingent liability required by FASB ASC Topic 450, Contingencies. Reserves are initially established related to these guarantees at the fair value of the guarantee based upon the Company’s understanding of the current financial position of the underlying customers and based on estimates and judgments made from information available at that time. If the Company becomes aware of deterioration in the financial condition of the customer/borrower or of any impairment of the customer/borrower’s ability to make payments, additional allowances are considered. Although the Company may be liable for the entire amount of a customer/borrower’s financial obligation under guarantees, its losses would generally be mitigated by the value of any underlying collateral including financed equipment, the finance company’s inability to provide clear title of foreclosed equipment to the Company, loss pools established in accordance with the agreements and other conditions. During periods of economic downturn, the value of the underlying collateral supporting these guarantees can decline sharply to further increase losses in the event of a customer/borrower’s default.
Critical Accounting Estimates
The Company prepares its consolidated financial statements in conformity with generally accepted accounting principles in the United States of America (“U.S. GAAP”). Preparation of financial statements in accordance with U.S. GAAP requires management to make estimates and judgments that affect reported amounts and related disclosures. Actual results could differ from those estimates. Management of the Company has discussed the development and selection of the following critical accounting estimates with the Audit Committee of the Company’s Board of Directors, and the Audit Committee has reviewed the Company’s disclosures relating to such estimates in this “Management’s Discussion and Analysis of Financial Condition and Results of Operations.”
Definitization of Undefinitized Contracts. The Company recognizes revenue on undefinitized contracts to the extent that it can reasonably and reliably estimate the expected final contract price and when collectability is reasonably assured. To the extent that contract definitization results in changes to previously estimated costs or revenues, the Company records those adjustments as a change in estimate. The Company updated its estimated costs under several undefinitized change orders related to M-ATVs and recorded $1.8 million related to such updates during fiscal 2011. As all costs associated with these contracts had been previously expensed, the change increased net income by $1.2 million or $0.01 per share.
Allowance for Doubtful Accounts:Accounts. The allowance for doubtful accounts requires management to estimate a customer’s ability to satisfy its obligations. The estimate of the allowance for doubtful accounts is particularly critical in the Company’s access equipment segment where the majority of the Company’s trade receivables are recorded. The Company evaluates the collectability of receivables based on a combination of factors. In circumstances where the Company is aware of a specific customer’s inability to meet its financial obligations, a specific reserve is recorded against amounts due to reduce the net recognized receivable to the amount reasonably expected to be collected. Additional reserves are established based upon the Company’s perception of the quality of the current receivables, including the length of time the receivables are past due, past experience of collectability and underlying economic conditions. If the financial condition of the Company’s customers were to deteriorate resulting in an impairment of their ability to make payments, additional reserves would be required.
48
Table of Contents
Goodwill:Goodwill and Indefinite-Lived Intangible Assets. In evaluating the recoverability of goodwill, it is necessary to estimate the fair value of the reporting units. The estimate of fair value of intangible assets is generally determined on the basis of discounted future cash flows. The estimate of fair value of the reporting units is generally determined on the basis of discounted future cash flows supplemented by the market approach. In estimating the fair value, management must make assumptions and projections regarding such items as future cash flows, future revenues, future earnings and other factors. The assumptions used in the estimate of fair value are generally consistent with the past performance of each reporting unit and are also consistent with the projections and assumptions that are used in current operating plans. Such assumptions are subject to change as a result of changing economic and competitive conditions. The rate used to discount estimated cash flows is a rate corresponding to the Company’s cost of capital, adjusted for risk where appropriate, and is dependent upon interest rates at a point in time. The Company weighted the income approach more heavily (75%) as the income approach uses long-term estimates that consider the expected operating profit of each reporting unit during periods where residential and non-residential construction and other macroeconomic indicators are nearer historical averages. The Company believes the income approach more accurately considers the expected recovery in the U.S. and European construction markets than the market approach. There are inherent uncertainties related to these factors and management’s judgment in applying them to the analysis of goodwill impairment. It is possible that assumptions underlying the impairment analysis will change in such a manner to cause further impairment of goodwill, which could have a material impact on the Company’s results of operations.
45
Table of Contents
At February 28, 2009, given the sustained decline in the priceJuly 1, 2011, approximately 88% of the Company’s Common Stock subsequent to the Company’s fiscal 2008 year end when its share price approximated book value, depressed order rates during the second fiscal quarter which historically has been a strong period for orders in advance of the North American construction season, as well as further deterioration in credit markets and the macro-economic environment, the Company determined that the appropriate triggers had been reached to perform additional impairment testing onrecorded goodwill and its indefinite-lived intangible assets.
To derivepurchased intangibles were concentrated within the fair value of itsJLG reporting units, the Company performed extensive valuation analyses with the assistance of a third-party valuation advisor, utilizing both income and market approaches. Under the income approach, the Company determined fair value based on estimated future cash flows discounted by an estimated weighted-average cost of capital, which reflects the overall level of inherent risk of a reporting unit and the rate of return an outside investor would expect to earn. Estimated future cash flows were based on the Company’s internal projection models, industry projections and other assumptions deemed reasonable by management. The sum of the fair values of the reporting units was reconciled to the Company’s market capitalization as of February 28, 2009 plus an estimated control premium. For the second quarter of fiscal 2009 impairment analysis, the Company used a weighted-average cost of capital of 14.5% and a terminal growth rate of 3%. This resulted in a control premium of 67%, based upon the relatively low price of the Company’s Common Stock on February 28, 2009 of $6.26 per share. Under the market approach, the Company derived the fair value of its reporting units based on revenue multiples of comparable publicly-traded companies. Changes in estimates or the application of alternative assumptions could produce significantly different results.
As a result of this analysis, $1,167.8 million of goodwill and $25.8 million of other long-lived intangible assets, including tradenames, technology and customer relationships, were written off during the second quarter of fiscal 2009. An increase in the discount rate of 50 basis points would have resulted in an additional impairment charge of approximately $100 million. These charges were driven by current projections and valuation assumptions that reflected the Company’s belief that the current recession would be deeper and longer than previously expected, that credit markets would remain tight and that costs of capital had risen significantly since the Company last performed its annual impairment testing.
Throughout the third quarter of fiscal 2009, access equipment order rates remained very weak and did not reflect a normal seasonal uptick. Further, during the quarter it became apparent to the Company that federal stimulus actions would not contribute to access equipment orders in the near term, that credit availability to the Company’s access equipment customers would continue to be constrained, that U.S. residential and nonresidential spending could remain at very low levels for an extended period beyond the Company’s previous estimates and that the global economic recovery would occur at a slower pace than previously expected. These factors all contributed to the Company’s belief that this business would experience lower orders in fiscal 2010 and beyond than previously estimated. As a result, the Company initiated actions to further reduce its costs in its access equipment segment, including reductions in workforce and plant closings. The Company considered these factors together to be an indicator of potential impairment of goodwill in the access equipment reporting unit which comprises the entire access equipment segment. The Company therefore performed a detailed Step 1 analysis of the access equipment segment utilizing a discounted cash flow model that employed a 14.5% discount rate and a terminal growth rate of 3%. As a result of the Company’s receipt of a contract award and related large delivery order for M-ATVs from the DoD on June 30, 2009 and the Company’s decision to subcontract component manufacture and assembly of many M-ATVs to JLG, this model included expected cash flows related to this subcontract. The resulting estimated fair value of JLG calculated in the impairment analysis was in excess of net book value of JLG. Based on this analysis, the Company concluded that no additional impairment charge was required in the third quarter of fiscal 2009.
During the fourth quarter of fiscal 2009,2011 impairment analysis exceeded JLG’s net book value by approximately 40%, or $900 million. The impairment model assumes that the Company performed its annual impairment review relative to goodwillU.S. economy and indefinite-lived intangible assets (principally tradenames) utilizing a discounted cash flow model that employed a 14.5% discount rate and a terminal growth rate of 3%. This resultedconstruction spending (and hence access equipment demand) will improve beginning in a control premium of 59%, based on the price of the Company’s Common Stock on July 1, 2009 of $18.43 per share. As a result of this testing, the Company recorded impairment charges of $1.4 million and $0.6 million for goodwill and tradenames, respectively, within the fire & emergency segment. In addition, based on this analysis, the Company concluded that impairment charges were not required for any other reporting units.fiscal 2013. Assumptions utilized in the impairment analysis are highly judgmental, especially given the severity and global scale of the current recession.economic uncertainty. Changes in estimates or the application of alternative assumptions could have produced significantly different results. For example, a discount rate of approximately 15% would have likely resulted in further impairment charges at JLG, OSV and IMT.
46
Table of Contents
Approximately 85% of the Company’s recorded goodwill and purchased intangibles are concentrated in the access equipment segment. The access equipment segment consists of only one reporting unit, JLG. The estimated fair value of JLG calculated in the fourth quarter of fiscal 2009 impairment analysis exceeded JLG’s net book value by approximately 4.0%. The impairment model assumes that the U.S. economy and construction spending (and hence access equipment demand) will show marked improvement beginning in fiscal 2011. Assumptions utilized in the impairment analysis are highly judgmental, especially given the severity and global scale of the current recession. Changes in estimates or the application of alternative assumptions could have produced significantly different results. A discount rate of approximately 15% would have resulted in the fair value of the access equipment segment being $20 million lower than its net book value. For each additional 50 basis point increase in the discount rate, above 15%, the fair value of the access equipment segmentJLG would decrease by approximately $95$150 million. Furthermore, if the Company had used cash flows which were 5% lower than used in its impairment testing of goodwill, the fair value of the access equipment segment would be approximately $25 million lower than its net book value at September 30, 2009. Events and conditions that could result in the impairment of intangibles at JLG include a further decline in economic conditions, a slower or weaker economic recovery than currently estimated by the Company or other factors leading to reductions in expected long-term sales or profitability at JLG. The Company has no other reporting units that have material amounts of goodwill and indefinite-lived intangible assets that are at risk of impairment.
Loss Contracts. During fiscal 2011, the Company incurred ramp-up costs of $43.0 million on production of FMTVs which resulted in costs in excess of revenues under the FMTV contract during each quarter of the fiscal year. The Company expects to continue to incur costs in excess of revenues on the FMTV contract through the first quarter of fiscal 2012, although at amounts lower than in fiscal 2011. The Company expects that FMTV program revenues for production beyond September 30, 2011 on orders received to-date will exceed expected costs and, therefore, has not recorded a charge for a loss contract. In evaluating the profitability under the FMTV contract, it is necessary to estimate future material and production costs. Management cost assumptions include estimates for future increases in the costs of materials, reductions in ramp-up costs, targeted cost savings and production efficiencies. There are inherent uncertainties related to these estimates. Small changes in estimates can have a significant impact on profitability under the contract. For example, an additional 1% escalation in material costs above the Company’s estimates would increase the cost of materials by approximately $24 million. Although this amount is less than the expected future profitability, it would significantly reduce the expected future gross margins on orders currently in backlog. It is possible that other assumptions underlying the analysis could change in such a manner that the Company would determine in the future that this is a loss contract, which could result in a material charge to earnings.
Guarantees of the Indebtedness of Others:Others. The reserve for guarantees of the indebtedness of others requires management to estimate a customer’s ability to satisfy its obligations. The estimate is particularly critical in the Company’s access equipment segment where the majority of the Company’s guarantees are granted. The Company evaluates the reserve based on a combination of factors. In circumstances where the Company is aware of a specific customer’s inability to meet its financial obligations, a specific reserve is recorded in accordance with FASB ASC Topic 450, Contingencies. In most cases, the financing company is required to provide clear title to the equipment under the financing program. The Company considers the residual value of the equipment to reduce the amount of exposure. Residual values are estimated based upon recent auctions, used equipment sales and periodic studies performed by a third-party. Additional reserves, based upon historical loss percentages, are established at the time of sale of the equipment based upon the requirement of ASC Topic 460, Guarantees. If the financial condition of the Company’s customers were to deteriorate resulting in an impairment of their ability to make payments, additional reserves would be required.
49
Table of Contents
Product Liability:Liability. Due to the nature of the Company’s products, the Company is subject to product liability claims in the normal course of business. A substantial portion of these claims and lawsuits involve the Company’s access equipment, concrete placement and refuse collection vehicle businesses, while such lawsuits in the Company’s defense and fire & emergency businesses have historically been limited. To the extent permitted under applicable law, the Company maintains insurance to reduce or eliminate risk to the Company. Most insurance coverage includes self-insured retentions that vary by business segment and by year. As of September 30, 2009,2011, the Company was generally self-insured for future claims up to $3.0 million per claim.
The Company establishes product liability reserves for its self-insured retention portion of any known outstanding matters based on the likelihood of loss and the Company’s ability to reasonably estimate such loss. There is inherent uncertainty as to the eventual resolution of unsettled matters due to the unpredictable nature of litigation. The Company makes estimates based on available information and the Company’s best judgment after consultation with appropriate experts. The Company periodically revises estimates based upon changes to facts or circumstances. The Company also utilizes actuarial methodologies to calculate reserves required for estimated incurred but not reported claims as well as to estimate the effect of the adverse development of claims over time.
Warranty:Warranty. Sales of the Company’s products generally carry typical explicit manufacturers’ warranties based on terms that are generally accepted in the Company’s marketplaces. The Company records provisions for estimated warranty and other related costs at the time of sale based on historical warranty loss experience and periodically adjusts these provisions to reflect actual experience. Certain warranty and other related claims involve matters of dispute that ultimately are resolved by negotiation, arbitration or litigation. At times, warranty issues arise that are beyond the scope of the Company’s historical experience. The Company provides for any such warranty issues as they become known and estimable. It is reasonably possible that from time to time additional warranty and other related claims could arise from disputes or other matters beyond the scope of the Company’s historical experience.
The Company’s products generally carry explicit warranties that extend from six months to five years, based on terms that are generally accepted in the marketplace. Selected components included in the Company’s end products (such as engines, transmissions, tires, etc.) may include manufacturers’ warranties. These manufacturers’ warranties are generally
47
Table of Contents
passed on to the end customer of the Company’s products and the customer would generally deal directly with the component manufacturer.
The Company’s policy is to record a liability for the expected cost of warranty-related claims at the time of the sale. The amount of warranty liability accrued reflects management’s best estimate of the expected future cost of honoring the Company’s obligations under the warranty plans. The Company believes that the warranty accounting estimate is a “critical accounting estimate” because changes in the warranty provision can materially affect net income; the estimate requires management to forecast estimated product usage levels by customers; in the case of new models, components or technology may be different, resulting in higher levels of warranty claims experience than with existing, mature products; and certain warranty and other related claims involve matters of dispute that ultimately are resolved by negotiation, arbitration or litigation. The estimate for warranty obligations is a critical accounting estimate for each of the Company’s operating segments.
Historically, the cost of fulfilling the Company’s warranty obligations has principally involved replacement parts, labor and sometimes travel for any field retrofit campaigns. Over the past three fiscal years, the Company’s warranty cost as a percentage of sales has ranged from 0.85%0.41% of sales to 0.92%0.90% of sales. Warranty costs tend to be higher shortly after new product introductions, especially those introductions involving new technologies, when field warranty campaigns may be necessary to correct or retrofit certain items. Accordingly, the Company must make assumptions about the number and cost of anticipated field warranty campaigns. The Company’s estimates are based on historical experience, the extent of pre-production testing, the number of units involved and the extent of new features/components included in new product models.
Each quarter, the Company reviews actual warranty claims experience to determine if there are any systemic defects that would require a field campaign. Also, based upon historical experience, warranty provision rates on new product introductions are established at higher than standard rates to reflect increased expected warranty costs associated with any new product introduction.
50
Table of Contents
At times, warranty issues can arise which are beyond the scope of the Company’s historical experience. If the estimate of warranty costs in fiscal 20092011 increased or decreased by 50 basis points, the Company’s accrued warranty costs, costs of sales and operating income would each change by $26.5$37.9 million or 36.4%50.6%, 0.6% and 2.7%7.6%, respectively.
Benefit Plans:Plans. The pension benefit obligation and related pension income are calculated in accordance with ASC Topic 715, Compensation — Retirement Benefits, and are impacted by certain actuarial assumptions, including the discount rate and the expected rate of return on plan assets. The Company’s benefit plan assumptions are determined by using a benchmark approach as well as currently available actuarial data. These rates are evaluated on an annual basis considering such factors as market interest rates and historical asset performance. Actuarial valuations at September 30, 20092011 used a weighted-average discount rate of 5.25%4.70% and an expected return on plan assets of 7.75%7.00%. A 0.5% decrease in the discount rate would increase annual pension expense by $2.3$4.0 million. A 0.5% decrease in the expected return on plan assets would increase the Company’s annual pension expense by $0.8$1.0 million.
The Company’s other postretirement benefits obligation and related expenses are calculated in accordance ASC Topic 715, Compensation — Retirement Benefits, and are impacted by certain actuarial assumptions, including health care trend rates. An increase of one percentage point in health care costs would increase the accumulated postretirement benefit obligation by $6.6$10.4 million and would increase the annual service and interest cost by $1.2$1.9 million. A corresponding decrease of one percentage point would decrease the accumulated postretirement benefit obligation by $5.5$8.6 million and decrease the annual service and interest cost by $1.0$1.6 million.
The Company’s benefit plan assumptions are determined by using a benchmark approach as well as currently available actuarial data.
Income Taxes:Taxes. The Company records deferred income tax assets and liabilities for differences between the book basis and tax basis of the related net assets. The Company records a valuation allowance, when appropriate, to adjust deferred tax asset balances to the amount management expects to realize. Management considers, as applicable, the amount of taxable income available in carryback years, future taxable income and potential tax planning strategies in assessing the need for a valuation allowance. The Company will require future taxable income in The Netherlands in order to fully realize the net deferred tax asset in that jurisdiction.
48
Table of Contents
On October 1, 2007, theThe Company adoptedaccounts for uncertain tax positions in accordance with FASB Interpretation No. 48, Accounting for Uncertainty in Income Taxes, an interpretation of FASB Statement No. 109 (ASCASC Topic 740, Income Taxes). ASC Topic 740 prescribes a recognition threshold and measurement attribute for the financial statement recognition and measurement of a tax position taken or expected to be taken in a tax return. ASC Topic 740 also provides guidance on derecognition, classification, interest and penalties, disclosure and transition. The evaluation of a tax position in accordance with ASC Topic 740 is a two-step process. The first step is recognition, where the Company evaluates whether an individual tax position has a likelihood of greater than 50% of being sustained upon examination based on the technical merits of the position, including resolution of any related appeals or litigation processes. For tax positions that are currently estimated to have a less than 50% likelihood of being sustained, zero tax benefit is recorded. For tax positions that have met the recognition threshold in the first step, the Company performs the second step of measuring the benefit to be recorded. The actual benefits ultimately realized may differ from the Company’s estimates. In future periods, changes in facts and circumstances and new information may require the Company to change the recognition and measurement estimates with regard to individual tax positions. Changes in recognition and measurement estimates are recorded in results of operations and financial position in the period in which such changes occur. As of September 30, 2009,2011, the Company had liabilities for unrecognized tax benefits pertaining to uncertain tax positions totaling $63.8$53.3 million.
New Accounting Standards
Refer to Note 2 of the Notes to Consolidated Financial Statements for a discussion of the impact of new accounting standards on the Company’s consolidated financial statements.
Customers and Backlog
Sales to the U.S. government comprised approximately 52%56% of the Company’s net sales in fiscal 2009.2011. No other single customer accounted for more than 10% of the Company’s net sales for this period. A substantial majority of the Company’s net sales are derived from customer orders prior to commencing production.
51
Table of Contents
The Company’s backlog as of September 30, 20092011 increased 138.6%19.9% to $5,615.4 million$6.48 billion compared to $2,353.8$5.40 billion at September 30, 2010. Defense segment backlog increased 8.5% to $5.13 billion at September 30, 2011 compared to $4.73 billion at September 30, 2010 due largely to additional delivery orders received under the FMTV contract, offset in part by the fulfillment of orders received for vehicles related to the FHTV program. Access equipment segment backlog increased 270.0% to $729.2 million at September 30, 2008. Defense segment backlog increased 307.2%2011 compared to $4,883.8$197.1 million at September 30, 2009 compared to $1,199.2 million at September 30, 2008 due largely to the award2010. Backlog increased in all access equipment product categories as demand rebounded from historical lows and large rental companies accelerated orders in anticipation of the M-ATV contractcapacity constraints in June 2009, the renewal of the FHTV contract in October 2008, including a supplemental FHTV award in August 2009, and the award of the FMTV contract in August 2009. The $266.8 million delivery order under the recently-awarded FMTV contract is under a government issued stop work order until resolution of protests filed with the GAO by the Company’s competitors under that competition. Access equipment segment backlog decreased 70.2% to $98.3 million at September 30, 2009 compared to $330.0 million at September 30, 2008 due to the global recession and related impact on credit markets.2012. Access equipment backlog as of September 30, 20092011 and 2010 included $46.5$62.5 million and $95.7 million, respectively, relating to telehandler orders from the DoD. Backlog figures reported for prior periods did not include amounts relating to telehandler orders from the DoD. The amount of these DoD orders on hand, but not included in backlog, as of September 30, 2008 was $42.7 million. Fire & emergency segment backlog decreased 11.8%increased 14.2% to $558.7$479.0 million at September 30, 20092011 compared to $633.2$419.4 million at September 30, 20082010 due in partlargely to weakening domestic municipal markets, the fulfillment of domestic fire apparatus orders in fiscal 2009 received in advance of price increases and new National Fire Protection Association standards that became effective January 1, 2009. Fire & emergencystrong broadcast equipment orders. Commercial segment backlog increased 138.6% to $140.0 million at September 30, 2011 compared to $58.7 million at September 30, 2010. Unit backlog for concrete mixers was up 28.6% compared to very low backlog at September 30, 2009 included $49.7 million related to BAI. BAI was sold in October 2009. Commercial segment backlog decreased 61.0% to $74.6 million at September 30, 2009 compared to $191.4 million at September 30, 2008. Backlog at September 30, 2008 included $70.7 million2010, primarily as a result of backlog for Geesink. Geesink was sold in July 2009.increased international orders. Unit backlog for domestic refuse collection vehicles was down 32.4%up 144.8% compared to September 30, 2008 partly2010 in large part due to the timing of orders to benefit from several large waste haulers. Unit backlogs for front-discharge and rear-discharge concrete mixers were down 54.5% and 77.2%, respectively, compared to September 30, 2008 as a result of continued weak construction markets inbonus depreciation tax deduction under the U.S as a result of the global recession and related impactU.S. tax code which expires on credit markets.December 31, 2011.
Reported backlog excludes purchase options and announced orders for which definitive contracts have not been executed. Additionally, backlog excludes unfunded portions of the FHTV, MTVR, ID/IQ,M-ATV, LVSR and FMTV contracts. Backlog information and comparisons thereof as of different dates may not be accurate indicators of future sales or the ratio of the Company’s future sales to the DoD versus its sales to other customers. Approximately 10.8%21% of the Company’s September 30, 20092011 backlog is not expected to be filled in fiscal 2010.
49
Table of Contents2012.
Financial Market Risk
The Company is exposed to market risk from changes in interest rates, certain commodity prices and foreign currency exchange rates. To reduce the risk from changes in foreign currency exchange and interest rates, the Company selectively uses financial instruments. All hedging transactions are authorized and executed pursuant to clearly defined policies and procedures, which strictly prohibit the use of financial instruments for speculative purposes.
Interest Rate RiskRisk.
The Company’s earnings exposure related to adverse movements in interest rates is primarily derived from outstanding floating rate debt instruments that are indexed to short-term market interest rates. The Company, as needed, uses interest rate swaps to modify its exposure to interest rate movements. In January 2007, the Company entered into an interest rate swap to reduce the risk of interest rate changes associated with the Company’s variable rate debt issued to finance the acquisition of JLG. The swap effectively fixes the variable portion of the interest rate on debt in the amount of the notional amount of the swap at 5.105% plus the applicable spread based on the terms of the Credit Agreement. The notional amount of the swap at September 30, 20092011 was $1.25 billion and reduces to $750 million on December 7, 2009 and $250 million on December 6, 2010.million. The swap terminates on December 6, 2011.
The portion of the Company’s interest expense not effectively fixed in the interest rate swap remains sensitive to changes in the interest rates in the U.S. and off-shore markets. In this regard, changes in U.S. and off-shore interest rates affect interest payable on the Company’s borrowings under its Credit Agreement. ABased on debt outstanding at September 30, 2011, a 100 basis point increase or decrease in the average cost of the Company’s variable rate debt, including outstanding swaps, would have resulted in a change in fiscal 2009increase or decrease annual pre-tax interest expense ofby approximately $11.9$5.1 million. These amounts are determined on an annual basis by considering the impact of the hypothetical interest rates on average borrowings during fiscal 2009, after consideration of the interest rate swap.
52
Table of Contents
The table below provides information about the Company’s derivative financial instruments and other financial instruments that are sensitive to changes in interest rates, including interest rate swaps and debt obligations (dollars(dollars in millions):
| | | Expected Maturity Date | | | | | |
| | Expected Maturity Date | | | | Fair | | | | | | | | | | | | | | | | | Fair | |
| | 2010 | | 2011 | | 2012 | | 2013 | | 2014 | | Thereafter | | Total | | Value | | | 2012 | | 2013 | | 2014 | | 2015 | | 2016 | | Thereafter | | Total | | Value | |
Liabilities | | | | | | | | | | | | | | | | | | | | | | | | | | | | | | | | | | |
Long-term debt: | | | | | | | | | | | | | | | | | | | | | | | | | | | | | | | | | | |
Variable rate ($US) | | $ | — | | $ | — | | $ | 117.7 | | $ | — | | $ | 1,902.6 | | $ | — | | $ | 2,020.3 | | $ | 2,016.7 | | | $ | 40.0 | | $ | 65.0 | | $ | 65.0 | | $ | 48.8 | | $ | 341.2 | | $ | — | | $ | 560.0 | | $ | 560.0 | |
Average interest rate | | | 3.0013 | % | 3.0701 | % | 3.2441 | % | 3.5312 | % | 3.8605 | % | — | | 3.6072 | % | | |
Fixed rate ($US) | | | $ | — | | $ | — | | $ | — | | $ | — | | $ | — | | $ | 500.0 | | $ | 500.0 | | $ | 501.3 | |
Average interest rate | | — | | — | | 7.4283 | % | — | | 8.5319 | % | — | | 8.4676 | % | | | | — | | — | | — | | — | | — | | 8.3750 | % | 8.3750 | % | | |
| | | | | | | | | | | | | | | | | | | | | | | | | | | | | | | | | | |
Interest Rate Derivatives | | | | | | | | | | | | | | | | | | | | | | | | | | | | | | | | | | |
Interest rate swaps: | | | | | | | | | | | | | | | | | | | | | | | | | | | | | | | | | | |
Variable to fixed ($US) | | $ | 36.6 | | $ | 12.8 | | $ | 1.5 | | $ | — | | $ | — | | $ | — | | $ | 50.9 | | $ | 50.9 | | | $ | 2.1 | | $ | — | | $ | — | | $ | — | | $ | — | | $ | — | | $ | 2.1 | | $ | 2.1 | |
Average pay rate | | 5.1050 | % | 5.1050 | % | 5.1050 | % | — | | — | | — | | 5.1050 | % | | | | 5.1050 | % | — | | — | | — | | — | | — | | 5.1050 | % | | |
Average receive rate | | 0.5149 | % | 1.6778 | % | 2.6190 | % | — | | — | | — | | 0.9473 | % | | | | 0.3290 | % | — | | — | | — | | — | | — | | 0.3290 | % | | |
For debt obligations, the table presents principal cash flows and related weighted-average interest rates by expected maturity dates. For interest rate swaps, the table presents the notional amounts and weighted-average interest rates by expected (contractual) maturity dates. Notional amounts are used to calculate the contractual payments to be exchanged under the contract. Weighted-average variable rates are based on implied forward rates in the yield curve at the reporting date.
50
Table of Contents
Commodity Price RiskRisk.
The Company is a purchaser of certain commodities, including steel, aluminum and composites. In addition, the Company is a purchaser of components and parts containing various commodities, including steel, aluminum, rubber and others which are integrated into the Company’s end products. The Company generally buys these commodities and components based upon market prices that are established with the vendor as part of the purchase process. The Company does not use commodity financial instruments to hedge commodity prices.
The Company generally obtains firm quotations from its suppliers for a significant portion of its orders under firm, fixed-price contracts in its defense segment. In the Company’s access equipment, fire & emergency and commercial segments, the Company generally attempts to obtain firm pricing from most of its suppliers, consistent with backlog requirements and/or forecasted annual sales. To the extent that commodity prices increase and the Company does not have firm pricing from its suppliers, or its suppliers are not able to honor such prices, then the Company may experience margin declines to the extent it is not able to increase selling prices of its products.
Foreign Currency RiskRisk.
The Company’s operations consist of manufacturing in the U.S., Belgium, Canada, The Netherlands, France, Australia, Romania and RomaniaChina and sales and limited vehicle body mounting activities on six continents. In addition, the Company manufactures products through investments in joint ventures in Mexico and Brazil. International sales werecomprised approximately 15%17% of overall net sales in fiscal 2009,2011, including approximately 10%14% that involved export sales from the U.S. The majority of export sales in fiscal 20092011 were denominated in U.S. dollars. As a result of the manufacture and sale of the Company’s products in foreign markets, the Company’s earnings are affected by fluctuations in the value of the U.S. dollar, as compared to foreign currencies in which certain of the Company’s transactions in foreign markets are denominated. The Company’s operating results are principally exposed to changes in exchange rates between the U.S. dollar and the European currencies, primarily the Euro and the U.K. pound sterling, changes between the U.S. dollar and the Australian dollar, changes between the U.S. dollar and the Brazilian real and changes between the U.S. dollar and the Brazilian real.Chinese Renminbi. Through the Company’s foreign currency hedging activities, the Company seeks to minimize the risk that cash flows resulting from the sales of the Company’s products will be affected by changes in exchange rates.
The Company enters into certain forward foreign currency exchange contracts to mitigate the Company’s foreign currency exchange risk. These contracts qualify as derivative instruments under FASB ASC Topic 815, Derivatives and Hedging;Hedging; however, the Company has not designated all of these instruments as hedge transactions under ASC Topic 815. Accordingly, the mark-to-market impact of these derivatives is recorded each period to current earnings along with the offsetting foreign currency transaction gain/loss recognized on the related balance sheet exposure. At September 30, 2009, 2011,
53
Table of Contents
the Company was managing $81.5$154.5 million (notional) of foreign currency contracts, allnone of which were not designated as accounting hedges and all of which settle within 60 days.
The following table quantifies outstanding forward foreign exchange contracts intended to hedge non-U.S. dollar denominated cash, receivables and payables and the corresponding impact on the value of these instruments assuming a 10% appreciation/depreciation of the U.S. dollar relative to all other currencies on September 30, 20092011 (dollars in millions):
| | | | | | | | Foreign Exchange | | | | | | | | | Foreign Exchange | |
| | | | | | | | Gain/(Loss) From: | | | | | | | | | Gain/(Loss) From: | |
| | Notional
Amount | | Average
Contractual
Exchange Rate | | Fair Value | | 10%
Appreciation of
U.S. Dollar | | 10%
Depreciation of
U.S. Dollar | | | Notional
Amount | | Average
Contractual
Exchange Rate | | Fair Value | | 10%
Appreciation of
U.S. Dollar | | 10%
Depreciation of
U.S. Dollar | |
Sell Euro / Buy USD | | $ | 69.6 | | 1.4614 | | $ | (0.1 | ) | $ | 6.9 | | $ | (6.9 | ) | | $ | 69.1 | | 1.3490 | | $ | 0.6 | | $ | 6.9 | | $ | (6.9 | ) |
Sell AUD / Buy USD | | 3.5 | | 0.8633 | | (0.1 | ) | 0.4 | | (0.4 | ) | | 65.0 | | 0.9694 | | 0.2 | | 6.5 | | (6.5 | ) |
Sell GBP / Buy USD | | | 2.2 | | 1.5558 | | — | | 0.2 | | (0.2 | ) |
Sell GBP / Buy Euro | | 5.4 | | 0.9200 | | — | | — | | — | | | 18.2 | | 0.8678 | | (0.2 | ) | — | | — | |
Sell PLN / Buy Euro | | 3.0 | | 4.2086 | | — | | — | | — | | |
|
As previously noted, the Company’s policy prohibits the trading of financial instruments for speculative purposes or the use of leveraged instruments. It is important to note that gains and losses indicated in the sensitivity analysis would be offset by gains and losses on the underlying receivables and payables.
51
Table of Contents
ITEM 7A.QUANTITATIVE AND QUALITATIVE DISCLOSURES ABOUT MARKET RISK
The information under the caption “Management’s Discussion and Analysis of Financial Condition and Results of Operations — Financial Market Risk” contained in Item 7 of this Form 10-K is hereby incorporated by reference in answer to this item.
5254
Table of Contents
ITEM 8.FINANCIAL STATEMENTS AND SUPPLEMENTARY DATA
REPORT OF INDEPENDENT REGISTERED PUBLIC ACCOUNTING FIRM
To the Board of Directors and Shareholders of
Oshkosh Corporation
Oshkosh, Wisconsin
We have audited the accompanying consolidated balance sheets of Oshkosh Corporation and subsidiaries (the “Company”) as of September 30, 20092011 and 2008,2010, and the related consolidated statements of operations, shareholders’ equity, and cash flows for each of the three years in the period ended September 30, 2009.2011. Our audits also included the consolidated financial statement schedule listed in the Table of Contents at Item 15. These financial statements and financial statement schedule are the responsibility of the Company’s management. Our responsibility is to express an opinion on the financial statements and financial statement schedule based on our audits.
We conducted our audits in accordance with the standards of the Public Company Accounting Oversight Board (United States). Those standards require that we plan and perform the audit to obtain reasonable assurance about whether the financial statements are free of material misstatement. An audit includes examining, on a test basis, evidence supporting the amounts and disclosures in the financial statements. An audit also includes assessing the accounting principles used and significant estimates made by management, as well as evaluating the overall financial statement presentation. We believe that our audits provide a reasonable basis for our opinion.
In our opinion, such consolidated financial statements presentspresent fairly, in all material respects, the financial position of the CompanyOshkosh Corporation and subsidiaries at September 30, 20092011 and 2008,2010, and the results of their operations and their cash flows for each of the three years in the period ended September 30, 2009,2011, in conformity with accounting principles generally accepted in the United States of America. Also, in our opinion, such consolidated financial statement schedule, when considered in relation to the basic consolidated financial statements taken as a whole, presentpresents fairly, in all material respects, the information set forth therein.
As described in Note 2 to the Consolidated Financial Statements, the Company adopted new accounting guidance on the accounting for uncertainty in income taxes, on October 1, 2007.
We have also audited, in accordance with the standards of the Public Company Accounting Oversight Board (United States), the Company’s internal control over financial reporting as of September 30, 2009,2011, based on the criteria established in Internal Control — Control—Integrated Framework issued by the Committee of Sponsoring Organizations of the Treadway Commission and our report dated November 18, 2009,15, 2011, expressed an unqualified opinion on the Company’s internal control over financial reporting.
/S/ DELOITTEDeloitte & TOUCHETouche LLP
Milwaukee, Wisconsin
November 18, 200915, 2011
5355
Table of Contents
REPORT OF INDEPENDENT REGISTERED PUBLIC ACCOUNTING FIRM
To the Board of Directors and Shareholders of
Oshkosh Corporation
Oshkosh, Wisconsin
We have audited the internal control over financial reporting of Oshkosh Corporation and subsidiaries (the “Company”) as of September 30, 2009,2011, based on criteria established in Internal Control — Integrated Framework issued by the Committee of Sponsoring Organizations of the Treadway Commission. The Company’s management is responsible for maintaining effective internal control over financial reporting and for its assessment of the effectiveness of internal control over financial reporting, included in the accompanying management report (Management’sManagement’s Report on Internal Control over Financial Reporting).Reporting. Our responsibility is to express an opinion on the Company’s internal control over financial reporting based on our audit.
We conducted our audit in accordance with the standards of the Public Company Accounting Oversight Board (United States). Those standards require that we plan and perform the audit to obtain reasonable assurance about whether effective internal control over financial reporting was maintained in all material respects. Our audit included obtaining an understanding of internal control over financial reporting, assessing the risk that a material weakness exists, testing and evaluating the design and operating effectiveness of internal control based on the assessed risk, and performing such other procedures as we considered necessary in the circumstances. We believe that our audit provides a reasonable basis for our opinion.
A company’s internal control over financial reporting is a process designed by, or under the supervision of, the company’s principal executive and principal financial officers, or persons performing similar functions, and effected by the company’s board of directors, management, and other personnel to provide reasonable assurance regarding the reliability of financial reporting and the preparation of consolidated financial statements for external purposes in accordance with generally accepted accounting principles. A company’s internal control over financial reporting includes those policies and procedures that (1) pertain to the maintenance of records that, in reasonable detail, accurately and fairly reflect the transactions and dispositions of the assets of the company; (2) provide reasonable assurance that transactions are recorded as necessary to permit preparation of consolidated financial statements in accordance with generally accepted accounting principles, and that receipts and expenditures of the company are being made only in accordance with authorizations of management and directors of the company; and (3) provide reasonable assurance regarding prevention or timely detection of unauthorized acquisition, use, or disposition of the company’s assets that could have a material effect on the consolidated financial statements.
Because of the inherent limitations of internal control over financial reporting, including the possibility of collusion or improper management override of controls, material misstatements due to error or fraud may not be prevented or detected on a timely basis. Also, projections of any evaluation of the effectiveness of the internal control over financial reporting to future periods are subject to the risk that the controls may become inadequate because of changes in conditions, or that the degree of compliance with the policies or procedures may deteriorate.
In our opinion, the Company maintained, in all material respects, effective internal control over financial reporting as of September 30, 2009,2011, based on the criteria established in Internal Control — Integrated Framework issued by the Committee of Sponsoring Organizations of the Treadway Commission.
We have also audited, in accordance with the standards of the Public Company Accounting Oversight Board (United States), the consolidated financial statements and consolidated financial statement schedule as of and for the year ended September 30, 2009,2011 of the Company and our report dated November 18, 2009, expresses15, 2011 expressed an unqualified opinion on those consolidated financial statements and consolidated financial statement schedule.
/S/ DELOITTEDeloitte & TOUCHETouche LLP
Milwaukee, Wisconsin
November 18, 200915, 2011
5456
Table of Contents
OSHKOSH CORPORATION
CONSOLIDATED STATEMENTS OF OPERATIONS
(In millions, except per share amounts)
| | Fiscal Year Ended September 30, | | | Fiscal Year Ended September 30, | |
| | 2009 | | 2008 | | 2007 | | | 2011 | | 2010 | | 2009 | |
| | | | | | | | | | | | | | |
Net sales | | $ | 5,295.2 | | $ | 6,936.4 | | $ | 6,139.3 | | | $ | 7,584.7 | | $ | 9,842.4 | | $ | 5,253.1 | |
Cost of sales | | 4,589.2 | | 5,758.1 | | 5,052.8 | | | 6,505.0 | | 7,872.4 | | 4,549.8 | |
Gross income | | 706.0 | | 1,178.3 | | 1,086.5 | | | 1,079.7 | | 1,970.0 | | 703.3 | |
| | | | | | | | | | | | | | |
Operating expenses: | | | | | | | | | | | | | | |
Selling, general and administrative | | 435.8 | | 493.5 | | 411.9 | | | 513.2 | | 489.8 | | 430.3 | |
Amortization of purchased intangibles | | 62.4 | | 68.8 | | 65.5 | | | 60.8 | | 60.5 | | 62.3 | |
Intangible assets impairment charges | | 1,199.8 | | 1.0 | | — | | |
Intangible asset impairment charges | | | 4.8 | | 25.6 | | 1,190.2 | |
Total operating expenses | | 1,698.0 | | 563.3 | | 477.4 | | | 578.8 | | 575.9 | | 1,682.8 | |
| | | | | | | | |
Operating (loss) income | | (992.0 | ) | 615.0 | | 609.1 | | |
Operating income (loss) | | | 500.9 | | 1,394.1 | | (979.5 | ) |
| | | | | | | | | | | | | | |
Other income (expense): | | | | | | | | | | | | | | |
Interest expense | | (212.8 | ) | (212.1 | ) | (200.8 | ) | | (90.7 | ) | (187.1 | ) | (211.4 | ) |
Interest income | | 4.8 | | 7.1 | | 6.2 | | | 4.7 | | 3.5 | | 3.9 | |
Miscellaneous, net | | 8.5 | | (9.3 | ) | 0.9 | | | 1.6 | | 1.0 | | 8.8 | |
| | (199.5 | ) | (214.3 | ) | (193.7 | ) | |
| | | | | | | | |
(Loss) income from continuing operations before income taxes, equity in earnings of unconsolidated affiliates and minority interest, net | | (1,191.5 | ) | 400.7 | | 415.4 | | |
(Benefit from) provision for income taxes | | (19.7 | ) | 120.8 | | 137.7 | | |
| | | | | | | | |
(Loss) income from continuing operations before equity in earnings of unconsolidated affiliates and minority interest, net | | (1,171.8 | ) | 279.9 | | 277.7 | | |
| | | | | | | | |
Equity in (losses) earnings of unconsolidated affiliates, net of income taxes of $(0.8), $2.7 and $3.1 | | (1.4 | ) | 6.3 | | 7.3 | | |
Minority interest, net of income taxes of $0.0, $0.1 and $0.1 | | 0.9 | | 0.7 | | 0.3 | | |
(Loss) income from continuing operations | | (1,172.3 | ) | 286.9 | | 285.3 | | |
| | | | | | | | |
Income (loss) from continuing operations before income taxes and equity in earnings (losses) of unconsolidated affiliates | | | 416.5 | | 1,211.5 | | (1,178.2 | ) |
Provision for (benefit from) income taxes | | | 143.6 | | 414.3 | | (12.6 | ) |
Income (loss) from continuing operations before equity in earnings (losses) of unconsolidated affiliates | | | 272.9 | | 797.2 | | (1,165.6 | ) |
Equity in earnings (losses) of unconsolidated affiliates | | | 0.5 | | (4.3 | ) | (1.4 | ) |
Income (loss) from continuing operations, net of tax | | | 273.4 | | 792.9 | | (1,167.0 | ) |
Discontinued operations (Note 3): | | | | | | | | | | | | | | |
Income (loss) from discontinued operations | | 19.0 | | (210.3 | ) | (19.7 | ) | | — | | (2.9 | ) | 5.7 | |
Income tax benefit | | (54.5 | ) | (2.7 | ) | (2.5 | ) | | — | | — | | (61.6 | ) |
Income (loss) from discontinued operations, net of tax | | 73.5 | | (207.6 | ) | (17.2 | ) | | — | | (2.9 | ) | 67.3 | |
Net income (loss) | | | 273.4 | | 790.0 | | (1,099.7 | ) |
Net loss attributable to noncontrolling interest | | | — | | — | | 0.9 | |
Net income (loss) attributable to Oshkosh Corporation | | | $ | 273.4 | | $ | 790.0 | | $ | (1,098.8 | ) |
| | | | | | | | | | | | | | |
Net (loss) income | | $ | (1,098.8 | ) | $ | 79.3 | | $ | 268.1 | | |
| | | | | | | | |
(Loss) earnings per share-basic: | | | | | | | | |
Earnings (loss) per share attributable to Oshkosh Corporation common shareholders-basic: | | | | | | | | |
From continuing operations | | $ | (15.33 | ) | $ | 3.88 | | $ | 3.88 | | | $ | 3.01 | | $ | 8.81 | | $ | (15.26 | ) |
From discontinued operations | | 0.96 | | (2.81 | ) | (0.24 | ) | | — | | (0.03 | ) | 0.89 | |
| | $ | (14.37 | ) | $ | 1.07 | | $ | 3.64 | | | $ | 3.01 | | $ | 8.78 | | $ | (14.37 | ) |
(Loss) earnings per share-diluted: | | | | | | | | |
| | | | | | | | |
Earnings (loss) per share attributable to Oshkosh Corporation common shareholders-diluted: | | | | | | | | |
From continuing operations | | $ | (15.33 | ) | $ | 3.83 | | $ | 3.81 | | | $ | 2.99 | | $ | 8.72 | | $ | (15.26 | ) |
From discontinued operations | | 0.96 | | (2.77 | ) | (0.23 | ) | | — | | (0.03 | ) | 0.89 | |
| | $ | (14.37 | ) | $ | 1.06 | | $ | 3.58 | | | $ | 2.99 | | $ | 8.69 | | $ | (14.37 | ) |
The accompanying notes are an integral part of these financial statements
5557
Table of Contents
OSHKOSH CORPORATION
CONSOLIDATED BALANCE SHEETS
(In millions, except share and per share amounts)
| | September 30, | | | September 30, | |
| | 2009 | | 2008 | | | 2011 | | 2010 | |
Assets | | | | | | | | | | |
Current assets: | | | | | | | | | | |
Cash and cash equivalents | | $ | 530.4 | | $ | 88.2 | | | $ | 428.5 | | $ | 339.0 | |
Receivables, net | | 563.8 | | 997.8 | | | 1,089.1 | | 889.5 | |
Inventories, net | | 789.7 | | 941.6 | | | 786.8 | | 848.6 | |
Deferred income taxes | | 75.5 | | 66.6 | | | 72.9 | | 86.7 | |
Other current assets | | 183.8 | | 58.2 | | | 77.3 | | 52.1 | |
Total current assets | | 2,143.2 | | 2,152.4 | | | 2,454.6 | | 2,215.9 | |
Investment in unconsolidated affiliates | | 37.3 | | 38.1 | | | 31.8 | | 30.4 | |
Property, plant and equipment, net | | 410.2 | | 453.3 | | | 388.7 | | 403.6 | |
Goodwill | | 1,077.3 | | 2,274.1 | | | 1,041.5 | | 1,049.6 | |
Purchased intangible assets, net | | 967.8 | | 1,059.9 | | | 838.7 | | 896.3 | |
Other long-term assets | | 132.2 | | 103.7 | | | 71.6 | | 112.8 | |
Total assets | | $ | 4,768.0 | | $ | 6,081.5 | | | $ | 4,826.9 | | $ | 4,708.6 | |
| | | | | | | | | | |
Liabilities and Shareholders’ Equity | | | | | | |
Liabilities and Equity | | | | | | |
Current liabilities: | | | | | | | | | | |
Revolving credit facility and current maturities of long-term debt | | $ | 15.0 | | $ | 93.5 | | | $ | 40.1 | | $ | 215.9 | |
Accounts payable | | 555.8 | | 639.9 | | | 768.9 | | 717.7 | |
Customer advances | | 731.9 | | 296.8 | | | 468.6 | | 373.2 | |
Payroll-related obligations | | 74.5 | | 104.8 | | | 110.7 | | 127.5 | |
Income taxes payable | | 3.1 | | 11.1 | | | 5.3 | | 1.3 | |
Accrued warranty | | 72.8 | | 88.3 | | | 75.0 | | 90.5 | |
Deferred revenue | | | 38.4 | | 76.9 | |
Other current liabilities | | 205.5 | | 228.8 | | | 184.8 | | 209.0 | |
Total current liabilities | | 1,658.6 | | 1,463.2 | | | 1,691.8 | | 1,812.0 | |
Long-term debt, less current maturities | | 2,023.2 | | 2,680.5 | | | 1,020.0 | | 1,086.4 | |
Deferred income taxes | | 239.6 | | 308.9 | | | 171.3 | | 189.6 | |
Other long-term liabilities | | 330.3 | | 237.0 | | | 347.2 | | 293.8 | |
Commitments and contingencies | | | | | | | | | | |
Minority interest | | 2.2 | | 3.3 | | |
Shareholders’ equity: | | | | | | |
Preferred stock ($.01 par value; 2,000,000 shares authorized; none issued and outstanding) | | — | | — | | |
Common Stock ($.01 par value; 300,000,000 shares authorized; 89,495,337 and 74,545,337 shares issued, respectively) | | 0.9 | | 0.7 | | |
Equity: | | | | | | |
Preferred Stock ($.01 par value; 2,000,000 shares authorized; none issued and outstanding) | | | — | | — | |
Common Stock ($.01 par value; 300,000,000 shares authorized; 91,330,019 and 90,662,377 shares issued, respectively) | | | 0.9 | | 0.9 | |
Additional paid-in capital | | 619.5 | | 250.7 | | | 685.6 | | 659.7 | |
(Accumulated deficit) retained earnings | | (30.8 | ) | 1,082.9 | | |
Accumulated other comprehensive (loss) income | | (74.7 | ) | 55.7 | | |
Common Stock in treasury, at cost (64,215 and 116,499 shares, respectively) | | (0.8 | ) | (1.4 | ) | |
Total shareholders’ equity | | 514.1 | | 1,388.6 | | |
Total liabilities and shareholders’ equity | | $ | 4,768.0 | | $ | 6,081.5 | | |
Retained earnings | | | 1,032.7 | | 759.2 | |
Accumulated other comprehensive loss | | | (122.6 | ) | (93.2 | ) |
Common Stock in treasury, at cost (6,956 shares at September 30, 2011) | | | (0.1 | ) | — | |
Total Oshkosh Corporation shareholders’ equity | | | 1,596.5 | | 1,326.6 | |
Noncontrolling interest | | | 0.1 | | 0.2 | |
Total equity | | | 1,596.6 | | 1,326.8 | |
Total liabilities and equity | | | $ | 4,826.9 | | $ | 4,708.6 | |
The accompanying notes are an integral part of these financial statements
5658
Table of Contents
OSHKOSH CORPORATION
CONSOLIDATED STATEMENTS OF SHAREHOLDERS’ EQUITY
(In millions, except per share amounts)
| | | | | | (Accumulated | | Accumulated | | Common | | Compre- | | | Oshkosh Corporation’s Shareholders | | | | | |
| | | | Additional | | Deficit) | | Other | | Stock in | | hensive | | | | | | | Retained | | Accumulated | | Common | | | | | |
| | Common | | Paid-In | | Retained | | Comprehensive | | Treasury | | (Loss) | | | | | Additional | | Earnings | | Other | | Stock in | | Non- | | Comprehensive | |
| | Stock | | Capital | | Earnings | | (Loss) Income | | at Cost | | Income | | | Common | | Paid-In | | (Accumulated | | Comprehensive | | Treasury | | Controlling | | Income | |
Balance at September 30, 2006 | | $ | 0.7 | | $ | 205.2 | | $ | 797.8 | | $ | 59.2 | | $ | (1.0 | ) | | | |
Comprehensive income (loss): | | | | | | | | | | | | | | |
Net income | | — | | — | | 268.1 | | — | | — | | $ | 268.1 | | |
Change in fair value of derivative instruments, net of tax of $7.0 | | — | | — | | — | | (12.0 | ) | — | | (12.0 | ) | |
Losses reclassified into earnings from other comprehensive income, net of tax of $3.3 | | — | | — | | — | | 5.7 | | — | | 5.7 | | |
Minimum pension liability adjustment, net of tax of $4.9 | | — | | — | | — | | (7.9 | ) | — | | (7.9 | ) | |
Currency translation adjustments, net | | — | | — | | — | | 110.2 | | — | | 110.2 | | |
Total comprehensive income | | | | | | | | | | | | $ | 364.1 | | |
Cash dividends ($0.40 per share) | | — | | — | | (29.6 | ) | — | | — | | | | |
Exercise of stock options | | — | | 5.5 | | — | | — | | 1.0 | | | | |
Tax benefit related to stock-based compensation | | — | | 6.8 | | — | | — | | — | | | | |
Repurchase of Common Stock | | — | | — | | — | | — | | (1.6 | ) | | | |
Stock-based compensation and award of nonvested shares | | — | | 11.7 | | — | | — | | — | | | | |
Adjustment to initially adopt Financial Accounting Standard No. 158 | | — | | — | | — | | (26.2 | ) | — | | | | |
Balance at September 30, 2007 | | 0.7 | | 229.2 | | 1,036.3 | | 129.0 | | (1.6 | ) | | | |
Comprehensive income (loss): | | | | | | | | | | | | | | |
Net income | | — | | — | | 79.3 | | — | | — | | $ | 79.3 | | |
Change in fair value of derivative instruments, net of tax of $19.2 | | — | | — | | — | | (29.9 | ) | — | | (29.9 | ) | |
Losses reclassified into earnings from other comprehensive income, net of tax of $9.1 | | — | | — | | — | | 14.6 | | — | | 14.6 | | |
Minimum pension liability adjustment, net of tax of $11.1 | | — | | — | | — | | (17.4 | ) | — | | (17.4 | ) | |
Currency translation adjustments, net | | — | | — | | — | | (40.6 | ) | — | | (40.6 | ) | |
Total comprehensive income | | | | | | | | | | | | $ | 6.0 | | |
Cash dividends ($0.40 per share) | | — | | — | | (29.8 | ) | — | | — | | | | |
Exercise of stock options | | — | | 2.9 | | — | | — | | 1.6 | | | | |
Tax benefit related to stock-based compensation | | — | | 3.6 | | — | | — | | — | | | | |
Repurchase of Common Stock | | — | | — | | — | | — | | (1.4 | ) | | | |
Stock-based compensation and award of nonvested shares | | — | | 15.0 | | — | | — | | — | | | | |
Adjustment to initially adopt Financial Accounting Standards Interpretation No. 48 - See Note 19 | | — | | — | | (2.9 | ) | — | | — | | | | |
| | | Stock | | Capital | | Deficit) | | Income (Loss) | | at Cost | | Interest | | (Loss) | |
| | | | | | | | | | | | | | | | |
Balance at September 30, 2008 | | 0.7 | | 250.7 | | 1,082.9 | | 55.7 | | (1.4 | ) | | | | $ | 0.7 | | $ | 250.7 | | $ | 1,082.9 | | $ | 55.7 | | $ | (1.4 | ) | $ | 3.3 | | | |
Comprehensive income (loss): | | | | | | | | | | | | | | | | | | | | | | | | | | | | |
Net loss | | — | | — | | (1,098.8 | ) | — | | — | | $ | (1,098.8 | ) | | — | | — | | (1,098.8 | ) | — | | — | | (0.9 | ) | $ | (1,099.7 | ) |
Change in fair value of derivative instruments, net of tax of $21.3 | | — | | — | | — | | (34.0 | ) | — | | (34.0 | ) | | — | | — | | — | | (34.0 | ) | — | | — | | (34.0 | ) |
Losses reclassified into earnings from other comprehensive income, net of tax of $18.6 | | — | | — | | — | | 29.7 | | — | | 29.7 | | | — | | — | | — | | 29.7 | | — | | — | | 29.7 | |
Minimum pension liability adjustment, net of tax of $19.2 | | — | | — | | — | | (31.8 | ) | — | | (31.8 | ) | |
Employee pension and postretirement benefits, net of tax of $19.2 | | | — | | — | | — | | (31.8 | ) | — | | — | | (31.8 | ) |
Currency translation adjustments reclassified into earnings from other comprehensive income, net | | — | | — | | — | | (92.0 | ) | — | | (92.0 | ) | | — | | — | | — | | (92.0 | ) | — | | — | | (92.0 | ) |
Currency translation adjustments, net | | — | | — | | — | | (2.3 | ) | — | | (2.3 | ) | | — | | — | | — | | (2.3 | ) | — | | (0.2 | ) | (2.5 | ) |
Total comprehensive loss | | | | | | | | | | | | $ | (1,229.2 | ) | | | | | | | | | | | | | | $ | (1,230.3 | ) |
Issuance of shares for public equity offering - See Note 15 | | 0.2 | | 357.9 | | — | | — | | — | | | | |
Issuance of shares for public equity offering - See Note 16 | | | 0.2 | | 357.9 | | — | | — | | — | | — | | | |
Cash dividends ($0.20 per share) | | — | | — | | (14.9 | ) | — | | — | | | | | — | | — | | (14.9 | ) | — | | — | | — | | | |
Exercise of stock options | | — | | (0.1 | ) | — | | — | | 0.7 | | | | | — | | (0.1 | ) | — | | — | | 0.7 | | — | | | |
Stock-based compensation and award of nonvested shares | | — | | 10.9 | | — | | — | | — | | | | | — | | 10.9 | | — | | — | | — | | — | | | |
Other | | — | | 0.1 | | — | | — | | (0.1 | ) | | | | — | | 0.1 | | — | | — | | (0.1 | ) | — | | | |
Balance at September 30, 2009 | | $ | 0.9 | | $ | 619.5 | | $ | (30.8 | ) | $ | (74.7 | ) | $ | (0.8 | ) | | | | 0.9 | | 619.5 | | (30.8 | ) | (74.7 | ) | (0.8 | ) | 2.2 | | | |
Sale of discontinued operations (see Note 3) | | | — | | — | | — | | — | | — | | (2.2 | ) | | |
Comprehensive income (loss): | | | | | | | | | | | | | | | | |
Net income | | | — | | — | | 790.0 | | — | | — | | — | | $ | 790.0 | |
Change in fair value of derivative instruments, net of tax of $1.2 | | | — | | — | | — | | (5.6 | ) | — | | — | | (5.6 | ) |
Losses reclassified into earnings from other comprehensive income, net of tax of $14.9 | | | — | | — | | — | | 26.6 | | — | | — | | 26.6 | |
Employee pension and postretirement benefits, net of tax of $3.2 | | | — | | — | | — | | (12.6 | ) | — | | — | | (12.6 | ) |
Currency translation adjustments reclassified into earnings from other comprehensive income, net | | | — | | — | | — | | (0.8 | ) | — | | — | | (0.8 | ) |
Currency translation adjustments, net | | | — | | — | | — | | (26.1 | ) | — | | — | | (26.1 | ) |
Total comprehensive income | | | | | | | | | | | | | | | $ | 771.5 | |
Exercise of stock options | | | — | | 18.2 | | — | | — | | 0.8 | | — | | | |
Stock-based compensation and award of nonvested shares | | | — | | 14.7 | | — | | — | | — | | — | | | |
Tax benefit related to stock-based compensation | | | — | | 7.0 | | — | | — | | — | | — | | | |
Other | | | — | | 0.3 | | — | | — | | — | | 0.2 | | | |
Balance at September 30, 2010 | | | 0.9 | | 659.7 | | 759.2 | | (93.2 | ) | — | | 0.2 | | | |
Comprehensive income (loss): | | | | | | | | | | | | | | | | |
Net income | | | — | | — | | 273.4 | | — | | — | | — | | $ | 273.4 | |
Change in fair value of derivative instruments, net of tax of $0.7 | | | — | | — | | — | | (1.4 | ) | — | | — | | (1.4 | ) |
Losses reclassified into earnings from other comprehensive income, net of tax of $6.0 | | | — | | — | | — | | 10.6 | | — | | — | | 10.6 | |
Employee pension and postretirement benefits, net of tax of $19.8 | | | — | | — | | — | | (33.8 | ) | — | | — | | (33.8 | ) |
Currency translation adjustments, net | | | — | | — | | — | | (4.8 | ) | — | | — | | (4.8 | ) |
Total comprehensive income | | | | | | | | | — | | | | | | $ | 244.0 | |
Exercise of stock options | | | — | | 7.8 | | — | | — | | 0.2 | | — | | | |
Stock-based compensation and award of nonvested shares | | | — | | 15.5 | | — | | — | | — | | — | | | |
Tax benefit related to stock-based compensation | | | — | | 2.5 | | — | | — | | — | | — | | | |
Other | | | — | | 0.1 | | 0.1 | | — | | (0.3 | ) | (0.1 | ) | | |
Balance at September 30, 2011 | | | $ | 0.9 | | $ | 685.6 | | $ | 1,032.7 | | $ | (122.6 | ) | $ | (0.1 | ) | $ | 0.1 | | | |
The accompanying notes are an integral part of these financial statements
5759
Table of Contents
OSHKOSH CORPORATION
CONSOLIDATED STATEMENTS OF CASH FLOWS
(In millions)
| | Fiscal Year Ended September 30, | | | Fiscal Year Ended September 30, | |
| | 2009 | | 2008 | | 2007 | | | 2011 | | 2010 | | 2009 | |
Operating activities: | | | | | | | | | | | | | | |
Net (loss) income | | $ | (1,098.8 | ) | $ | 79.3 | | $ | 268.1 | | |
Intangible assets impairment charges | | 1,199.8 | | 175.2 | | — | | |
Gain on sale of Geesink | | (33.8 | ) | — | | — | | |
Net income (loss) | | | $ | 273.4 | | $ | 790.0 | | $ | (1,099.7 | ) |
Intangible asset impairment charges | | | 4.8 | | 25.6 | | 1,199.8 | |
Loss (gain) on sale of discontinued operations | | | — | | 2.9 | | (33.8 | ) |
Depreciation and amortization | | 152.0 | | 152.9 | | 129.0 | | | 144.4 | | 172.9 | | 152.0 | |
Stock-based compensation expense | | 10.9 | | 15.0 | | 11.7 | | | 15.5 | | 14.7 | | 10.9 | |
Deferred income taxes | | (51.2 | ) | (10.4 | ) | 13.6 | | | 10.0 | | (70.7 | ) | (51.2 | ) |
Equity in losses (earnings) of unconsolidated affiliates | | 2.2 | | (4.0 | ) | (6.7 | ) | | (0.8 | ) | 5.1 | | 2.2 | |
Minority interest | | (0.9 | ) | (0.7 | ) | (0.4 | ) | |
Gain on sale of assets | | (2.5 | ) | (1.3 | ) | (1.4 | ) | | (3.8 | ) | (1.1 | ) | (2.5 | ) |
Foreign currency transaction losses (gains) | | 1.1 | | 5.7 | | (9.4 | ) | |
Foreign currency transaction losses | | | 6.9 | | 10.9 | | 1.1 | |
Changes in operating assets and liabilities: | | | | | | | | | | | | | | |
Receivables, net | | 377.2 | | 65.6 | | (408.9 | ) | | (210.0 | ) | (339.6 | ) | 377.2 | |
Inventories, net | | 112.6 | | (38.7 | ) | 116.0 | | | 58.8 | | (82.7 | ) | 112.6 | |
Other current assets | | (89.0 | ) | (8.8 | ) | 42.9 | | | (6.1 | ) | 101.0 | | (89.0 | ) |
Accounts payable | | (55.8 | ) | 15.6 | | 137.8 | | | 54.2 | | 169.4 | | (55.8 | ) |
Customer advances | | 435.6 | | (41.3 | ) | 70.5 | | | 95.4 | | (356.4 | ) | 435.6 | |
Income taxes | | (26.4 | ) | (22.1 | ) | 34.7 | | | (8.4 | ) | 20.8 | | (26.4 | ) |
Other current liabilities | | (50.3 | ) | (29.2 | ) | 31.6 | | | (82.5 | ) | 180.0 | | (50.3 | ) |
Other long-term assets and liabilities | | 16.2 | | 37.6 | | (23.1 | ) | | 35.9 | | (23.1 | ) | 16.2 | |
Net cash provided by operating activities | | 898.9 | | 390.4 | | 406.0 | | | 387.7 | | 619.7 | | 898.9 | |
| | | | | | | | | | | | | | |
Investing activities: | | | | | | | | | | | | | | |
Acquisitions of businesses, net of cash acquired | | — | | — | | (3,140.5 | ) | |
Additions to property, plant and equipment | | (46.2 | ) | (75.8 | ) | (83.0 | ) | | (82.3 | ) | (83.2 | ) | (46.2 | ) |
Additions to equipment held for rental | | (15.4 | ) | (42.5 | ) | (19.0 | ) | | (3.9 | ) | (6.3 | ) | (15.4 | ) |
Proceeds from sale of property, plant and equipment | | 3.9 | | 4.0 | | 3.4 | | | 1.5 | | 0.8 | | 3.9 | |
Proceeds from sale of equipment held for rental | | 6.1 | | 13.0 | | 11.2 | | | 20.2 | | 10.3 | | 6.1 | |
Other | | (4.5 | ) | 1.1 | | 1.3 | | |
Other investing activities | | | (3.8 | ) | (5.5 | ) | (4.5 | ) |
Net cash used by investing activities | | (56.1 | ) | (100.2 | ) | (3,226.6 | ) | | (68.3 | ) | (83.9 | ) | (56.1 | ) |
| | | | | | | | | | | | | | |
Financing activities: | | | | | | | | | | | | | | |
Repayment of long-term debt | | | (91.4 | ) | (2,020.9 | ) | (682.2 | ) |
Proceeds from issuance of long-term debt | | — | | — | | 3,100.0 | | | — | | 1,150.0 | | — | |
Debt issuance costs | | (20.1 | ) | — | | (34.9 | ) | |
Repayment of long-term debt | | (682.2 | ) | (304.7 | ) | (96.8 | ) | |
Net (repayments) borrowings under revolving credit facility | | (49.4 | ) | 54.7 | | (79.9 | ) | |
Proceeds from issuance of Common Stock, net | | 358.1 | | — | | — | | | — | | — | | 358.1 | |
Proceeds (repayments) under revolving credit facility | | | (150.0 | ) | 150.0 | | (49.4 | ) |
Debt issuance/amendment costs | | | (0.1 | ) | (26.3 | ) | (20.1 | ) |
Proceeds from exercise of stock options | | 0.6 | | 4.5 | | 6.5 | | | 8.0 | | 19.0 | | 0.6 | |
Purchase of Common Stock | | (0.2 | ) | (1.4 | ) | (1.6 | ) | |
Excess tax benefits from stock-based compensation | | — | | 3.1 | | 6.0 | | | 2.3 | | 5.8 | | — | |
Dividends paid | | (14.9 | ) | (29.8 | ) | (29.6 | ) | | — | | — | | (14.9 | ) |
Net cash (used) provided by financing activities | | (408.1 | ) | (273.6 | ) | 2,869.7 | | |
Other financing activities | | | (0.3 | ) | (0.1 | ) | (0.2 | ) |
Net cash used by financing activities | | | (231.5 | ) | (722.5 | ) | (408.1 | ) |
| | | | | | | | | | | | | | |
Effect of exchange rate changes on cash | | 7.5 | | (3.6 | ) | 4.1 | | | 1.6 | | (4.7 | ) | 7.5 | |
Increase in cash and cash equivalents | | 442.2 | | 13.0 | | 53.2 | | |
Increase (decrease) in cash and cash equivalents | | | 89.5 | | (191.4 | ) | 442.2 | |
Cash and cash equivalents at beginning of year | | 88.2 | | 75.2 | | 22.0 | | | 339.0 | | 530.4 | | 88.2 | |
Cash and cash equivalents at end of year | | $ | 530.4 | | $ | 88.2 | | $ | 75.2 | | | $ | 428.5 | | $ | 339.0 | | $ | 530.4 | |
| | | | | | | | | | | | | | |
Supplemental disclosures: | | | | | | | | | | | | | | |
Cash paid for interest | | $ | 183.8 | | $ | 211.2 | | $ | 179.4 | | | $ | 86.1 | | $ | 180.7 | | $ | 183.8 | |
Cash paid for income taxes | | 5.5 | | 138.2 | | 82.3 | | | 128.2 | | 457.1 | | 5.5 | |
The accompanying notes are an integral part of these financial statements
5860
Table of Contents
OSHKOSH CORPORATION
NOTES TO CONSOLIDATED FINANCIAL STATEMENTS
1.Nature of Operations
Oshkosh Corporation and its subsidiaries (the “Company”), are leading manufacturers of a wide variety of specialty vehicles and vehicle bodies predominately for the North AmericanAmericas and, Europeanto a lesser extent, global markets. “Oshkosh” refers to Oshkosh Corporation, not including its subsidiaries. The Company sells its products into four principal vehicle markets — defense, access equipment, fire & emergency and commercial. The defense business is conducted through the operations of Oshkosh. The access equipment business is conducted through its wholly-owned subsidiary, JLG Industries, Inc. and its wholly-owned subsidiaries (“JLG”) and JerrDan Corporation (“JerrDan”). JLG holds, along with an unaffiliated third-party, a 50% interest in a joint venture in The Netherlands, RiRent Europe, B.V. (“RiRent”). The Company’s fire & emergency business is principally conducted through its wholly-owned subsidiaries Pierce Manufacturing Inc. (“Pierce”), the airport products division of Oshkosh, JerrDan Corporation (“JerrDan”), Kewaunee Fabrications, LLC (“Kewaunee”), Medtec Ambulance Corporation (“Medtec”),and Oshkosh Specialty Vehicles Inc.(UK), Limited and AK Specialty Vehicles B.V. and their wholly-owned subsidiaries (together “OSV”) and the Company’s 75%-owned subsidiary BAI Brescia Antincendi International S.r.l. and its wholly-owned subsidiary (“BAI”(together “SMIT”). In October 2009, the Company sold its 75% interest in BAI to the BAI management team. The Company’s commercial business is principally conducted through its wholly-owned subsidiaries, McNeilus Companies, Inc. (“McNeilus”), Concrete Equipment Company, Inc. and its wholly-owned subsidiary (“CON-E-CO”), London Machinery Inc. and its wholly-owned subsidiary (“London”), Iowa Mold Tooling Co,Co., Inc. (“IMT”) and the commercial division of Oshkosh. McNeilus is one of two general partners in Oshkosh/McNeilus Financial Services Partnership (“OMFSP”), which provides lease financing to the Company’s commercial customers. McNeilus owns a 49% interest in Mezcladores Trailers de Mexico, S.A. de C.V. (“Mezcladores”), which manufactures and markets concrete mixers, concrete batch plants and refuse collection vehicles in Mexico. McNeilus also owns a 45% interest in McNeilus Equipamentos Do Brasil LTDA (“McNeilus Brazil”), which manufactures and distributes McNeilus branded concrete mixers and batch plants in the Mercosur region (Argentina, Brazil, Paraguay and Uruguay).
OnIn July 1, 2009, the Company completed the sale of its ownership in Geesink Group B.V., Geesink Norba Limited and Norba A. B. (collectively, “Geesink”). Geesink, a European refuse collection vehicle manufacturer, was previously included in the Company’s commercial segment. In October 2009, the Company sold its 75% ownership interest in BAI Brescia Antincendi International S.r.l. (“BAI”) to the BAI management team. BAI, a European fire apparatus manufacturer, was previously included in the Company’s fire & emergency segment. The historical operating results of these businesses have been reclassified and are now presented in “Income (loss) from discontinued operations,” net of tax” in the Consolidated Statements of Operations for all periods. See Note 3 of the Notes to Consolidated Financial Statements for further information regarding the sales of Geesink and BAI.
2.Summary of Significant Accounting Policies
Principles of Consolidation and Presentation— The consolidated financial statements include the accounts of Oshkosh and all of its majority-owned or controlled subsidiaries and are prepared in conformity with generally accepted accounting principles in the United States of America (“U.S. GAAP”). All significant intercompany accounts and transactions have been eliminated in consolidation. The 25% historical book value of BAI at the date of acquisition and 25% of subsequent operating results related to that portion of BAI not owned by the Company have been reflected as minority interest on the Company’s consolidated balance sheets and consolidated statements of operations, respectively. The Company accounts for its 50% voting interestinterests in OMFSP and RiRent, and its 49% interest in Mezcladores and its 45% interest in McNeilus Brazil under the equity method.
Use of Estimates — The preparation of financial statements in conformity with U.S. GAAP requires management to make estimates and assumptions that affect the reported amounts of assets and liabilities and disclosure of contingent assets and liabilities at the date of the financial statements and the reported amounts of revenues and expenses during the reporting period. Actual results could differ from those estimates.
Revenue Recognition — The Company recognizes revenue on equipment and parts sales when contract terms are met, collectability is reasonably assured and a product is shipped or risk of ownership has been transferred to and accepted by the customer. Revenue from service agreements is recognized as earned when services have been rendered. Appropriate provisions are made for discounts, returns and sales allowances. Sales are recorded net of amounts invoiced for taxes imposed on the customer such as excise or value-added taxes.
59
Table of Contents
OSHKOSH CORPORATION
NOTES TO CONSOLIDATED FINANCIAL STATEMENTS
Sales to the U.S. government of non-commercial productswhole goods manufactured to the government’s specifications are recognized using the units-of-delivery measure under the percentage-of-completion accounting method as units are accepted by the government. The Company includes amounts representing contract change orders, claims or other items in sales only
61
Table of Contents
OSHKOSH CORPORATION
NOTES TO CONSOLIDATED FINANCIAL STATEMENTS
when they can be reliably estimated and realization is probable. The Company charges anticipated losses on contracts or programs in progress to earnings when identified. Bid and proposal costs are expensed as incurred.
Shipping and Handling Fees and Costs — Revenue received from shipping and handling fees is reflected in net sales. Shipping and handling fee revenue was not significant for all periods presented. Shipping and handling costs are included in cost of sales.
Warranty— Provisions for estimated warranty and other related costs are recorded in cost of sales at the time of sale and are periodically adjusted to reflect actual experience. The amount of warranty liability accrued reflects management’s best estimate of the expected future cost of honoring Company obligations under the warranty plans. Historically, the cost of fulfilling the Company’s warranty obligations has principally involved replacement parts, labor and sometimes travel for any field retrofit campaigns. The Company’s estimates are based on historical experience, the extent of pre-production testing, the number of units involved and the extent of features/components included in product models. Also, each quarter, the Company reviews actual warranty claims experience to determine if there are systemic defects that would require a field campaign.
Research and Development and Similar Costs— Except for customer sponsored research and development costs incurred pursuant to contracts, research and development costs are expensed as incurred and included as part of cost of sales. Research and development costs charged to expense amounted to $73.3$142.0 million, $90.1$109.3 million and $73.5$72.7 million during fiscal 2009, 20082011, 2010 and 2007,2009, respectively. Customer sponsored research and development costs incurred pursuant to contracts are accounted for as contract costs.
Advertising — Advertising costs are included in selling, general and administrative expense and are expensed as incurred. These expenses totaled $11.8$15.5 million, $21.9$15.4 million and $16.5$11.7 million in fiscal 2009, 20082011, 2010 and 2007,2009, respectively.
Environmental Remediation Costs — The Company accrues for losses associated with environmental remediation obligations when such losses are probable and reasonably estimable. The liabilities are developed based on currently available information and reflect the participation of other potentially responsible parties, depending on the parties’ financial condition and probable contribution. The accruals are recorded at undiscounted amounts and are reflected as liabilities on the accompanying consolidated balance sheets. Recoveries of environmental remediation costs from other parties are recorded as assets when their receipt is deemed probable. The accruals are adjusted as further information develops or circumstances change.
Stock-Based Compensation — The Company recognizes stock-based compensation using the fair value provisions prescribed by Financial Accounting Standards Board (“FASB”) Accounting Standards Codification (“ASC”) Topic 718, Compensation — Stock Compensation. Accordingly, compensation costs for stock options, restricted stock and performance shares are calculated based on the fair value of the stock-based instrument at the time of grant and are recognized as expense over the vesting period of the stock-based instrument. See Note 1617 of the Notes to Consolidated Financial Statements for information regarding the Company’s stock-based incentive plan.plans.
Income Taxes — Deferred income taxes are provided to recognize temporary differences between the financial reporting basis and the income tax basis of the Company’s assets and liabilities using currently enacted tax rates and laws. Valuation allowances are established when necessary to reduce deferred tax assets to the amount expected to be realized. In assessing the realizability of deferred tax assets, management considers whether it is more likely than not that some portion or all of the deferred tax assets will not be realized. The ultimate realization of deferred tax assets is dependent upon the generation of future taxable income during the periods in which those temporary differences become deductible. Management considers the scheduled reversal of deferred tax liabilities, projected future taxable income, and tax planning strategies in making this assessment.
60
Table of Contents
OSHKOSH CORPORATION
NOTES TO CONSOLIDATED FINANCIAL STATEMENTS
Effective October 1, 2007, theThe Company adopted a new accounting standard on accounting for uncertaintyevaluates uncertain income tax positions in income taxes. The new standard prescribed a recognition threshold and measurement attribute for the financial statement recognition and measurement of a tax position taken or expected to be taken in a tax return. The new standard also provided guidance on derecognition, classification, interest and penalties, disclosure and transition. The evaluation of a tax position in accordance with the new standard is a two-step process. The first step is recognition, where the Company evaluates whether an individual tax position has a likelihood of greater than 50% of being sustained upon examination based on the technical merits of the position, including resolution of any related appeals or litigation processes. For tax positions that are currently estimated to have a less than 50% likelihood of being sustained, zero tax benefit is recorded. For tax positions that have met the recognition threshold in the first step, the Company performs the second step of measuring the benefit to be recorded. The actual benefits ultimately realized may differ from the Company’s estimates. In future periods, changes in facts and circumstances and new information may require the Company to change the recognition
62
Table of Contents
OSHKOSH CORPORATION
NOTES TO CONSOLIDATED FINANCIAL STATEMENTS
and measurement estimates with regard to individual tax positions. Changes in recognition and measurement estimates are recorded in results of operations and financial position in the period in which such changes occur. Upon adoption of the new standard, the Company recognized a $2.9 million charge to retained earnings and the reclassification of $30.0 million in liabilities related to uncertain tax positions in the Company’s Consolidated Balance Sheet from income taxes payable to other long-term assets ($6.2 million) and long-term liabilities ($36.2 million).
Income taxes are provided on financial statement earnings of non-U.S. subsidiaries expected to be repatriated. The Company determines annually the amount of undistributed non-U.S. earnings to invest indefinitely in its non-U.S. operations. As a result of anticipated cash requirements in the foreign subsidiaries, the Company currently believes that all earnings of non-U.S. subsidiaries will be reinvested indefinitely to finance foreign activities. Accordingly, no deferred income taxes have been provided for the repatriation of those earnings.
Fair Value of Financial Instruments — Based on Company estimates, the carrying amounts of cash equivalents, receivables, accounts payable and accrued liabilities approximated fair value as of September 30, 20092011 and 2008.2010.
Cash and Cash Equivalents — The Company considers all highly liquid investments with a maturity of three months or less when purchased to be cash equivalents. Cash equivalents at September 30, 20092011 consisted principally of bank deposits and money market instruments and bank deposits.instruments.
Receivables — Receivables consist of amounts billed and currently due from customers and unbilled costs and accrued profits related to revenues on long-term contracts with the U.S. government that have been recognized for accounting purposes but not yet billed to customers. The Company extends credit to customers in the normal course of business and maintains an allowance for estimated losses resulting from the inability or unwillingness of customers to make required payments. The accrual for estimated losses is based on itsthe Company’s historical experience, existing economic conditions and any specific customer collection issues the Company has identified.
Concentration of Credit Risk — Financial instruments whichthat potentially subject the Company to significant concentrations of credit risk consist principally of cash equivalents, trade accounts receivable, OMFSP lease receivables and guarantees of certain customers’ obligations under deferred payment contracts and lease purchase agreements.
The Company maintains cash and cash equivalents, and other financial instruments, with various major financial institutions. The Company performs periodic evaluations of the relative credit standing of these financial institutions and limits the amount of credit exposure with any institution.
Concentration of credit risk with respect to trade accounts and leases receivable is limited due to the large number of customers and their dispersion across many geographic areas. However, a significant amount of trade and lease receivables are with the U.S. government, with rental companies globally, with companies in the ready-mix concrete industry, with municipalities and with several large waste haulers in the United States. The Company continues to monitor credit risk associated with its trade receivables, especially during thethis period of continued global recession.economic weakness.
Inventories— Inventories are stated at the lower of cost or market. Cost has been determined using the last-in, first-out (“LIFO”) method for 80.6%85.4% of the Company’s inventories at September 30, 20092011 and 68.9%86.2% at September 30, 2008.2010. For the remaining inventories, cost has been determined using the first-in, first-out (“FIFO”) method.
61
Table of Contents
OSHKOSH CORPORATION
NOTES TO CONSOLIDATED FINANCIAL STATEMENTS
Performance-Based Payments — The Company’s contracts with the U.S. Department of Defense (“DoD”) to deliver heavy-payload tactical vehicles (Family of Heavy Tactical Vehicles and Logistic Vehicle System Replacement), medium-payload tactical vehicles (Medium(Family of Medium Tactical Vehicles and Medium Tactical Vehicle Replacement) and MRAP-All Terrain Vehicles (“M-ATVs”), as well as certain other defense-related contracts, include requirements for “performance-based payments.” The performance-based payment provisions in the contracts require the DoD to pay the Company based on the completion of certain pre-determined events in connection with the production under these contracts. Performance-based payments received are first applied to reduce outstanding receivables for units accepted in accordance with contractual terms, with any remaining amount recorded as an offset to inventory to the extent of related inventory on hand. Amounts received in excess of receivables and inventories are included in liabilities as customer advances.
Property, Plant and Equipment — Property, plant and equipment are recorded at cost. Depreciation is provided over the estimated useful lives of the respective assets using accelerated and straight-line methods. The estimated useful lives range from 10 to 5040 years for buildings and improvements, from 4 to 25 years for machinery and equipment and from 3 to 10 years for capitalized software and related costs. The Company capitalizes interest on borrowings during the active construction
63
Table of Contents
OSHKOSH CORPORATION
NOTES TO CONSOLIDATED FINANCIAL STATEMENTS
period of major capital projects. Capitalized interest is immaterial for all periods presented. All capitalized interest has been added to the cost of the underlying assets and is amortized over the useful lives of the assets.
Goodwill — Goodwill reflects the cost of an acquisition in excess of the aggregate fair valuesvalue assigned to identifiable net assets acquired. Goodwill is not amortized; however, it is assessed for impairment at least annually and as triggering events or “indicators of potential impairment” occur. The Company performs its annual impairment test in the fourth quarter of its fiscal year. The Company evaluates the recoverability of goodwill by estimating the future discounted cash flows of the businesses to which the goodwill relates. Estimated cash flows and related goodwill are grouped at the reporting unit level. A reporting unit is an operating segment or, under certain circumstances, a component of an operating segment that constitutes a business. When estimated future discounted cash flows are less than the carrying value of the net assets and related goodwill, an impairment test is performed to measure and recognize the amount of the impairment loss, if any. Impairment losses, limited to the carrying value of goodwill, represent the excess of the carrying amount of a reporting unit’s goodwill over the implied fair value of that goodwill. In fiscal 20092011, 2010 and 2008,2009, the Company recorded non-cash impairment charges of $4.3 million, $16.8 million and $1,169.2 million, and $167.4respectively, of which $8.1 million respectively.related to discontinued operations in fiscal 2009. See Note 8 of the Notes to Consolidated Financial Statements for a discussion of the fiscal 2009these charges. The majority of the fiscal 2008 charges related to discontinued operations (see Note 3 of the Notes to Consolidated Financial Statements for further information).
In evaluating the recoverability of goodwill, it is necessary to estimate the fair value of the reporting units. The Company evaluates the recoverability of goodwill primarily utilizing the income approach and, to a lesser extent, the market approach. The Company weighted the income approach more heavily (75%) as the income approach uses long-term estimates that consider the expected operating profit of each reporting unit during periods where residential and non-residential construction and other macroeconomic indicators are nearer historical averages. The Company believes that the use of thisincome approach is appropriate as it provides a fair value estimate based uponmore accurately considers the reporting unit’s expected long-term operating cash flow performance. This approach also mitigates the impact of cyclical trends that occurrecovery in the reporting unit’s industry.U.S. and European construction markets than the market approach. Under the income approach, the Company determines fair value based on estimated future cash flows discounted by an estimated weighted-average cost of capital, which reflects the overall level of inherent risk of a reporting unit and the rate of return an outside investor would expect to earn. Estimated future cash flows wereare based on the Company’s internal projection models, industry projections and other assumptions deemed reasonable by management. Rates used to discount estimated cash flows correspond to the Company’s cost of capital, adjusted for risk where appropriate, and are dependent upon interest rates at a point in time. There are inherent uncertainties related to these factors and management’s judgment in applying them to the analysis of goodwill impairment. Under the market approach, the Company derives the fair value of its reporting units based on revenue multiples of comparable publicly-traded companies. It is possible that assumptions underlying the impairment analysis will change in such a manner that impairment in value may occur in the future.
Impairment of Long-Lived Assets — Property, plant and equipment and amortizable intangible assets are reviewed for impairment whenever events or changes in circumstances indicate that the carrying amount may not be recoverable. Non-amortizable tradenamestrade names are assessed for impairment at least annually and as triggering events or “indicators of potential impairment” occur. If the sum of the expected undiscounted cash flows is less than the carrying value of the related asset or group of assets, a loss is recognized for the difference between the fair value and carrying value of the asset or group of assets. Such analyses necessarily involve significant judgment. In fiscal 20092011, 2010 and 2008,2009, the Company recorded non-cash impairment charges of $30.6$0.5 million, $8.8 million and $7.8$30.6 million, respectively, related to long-lived assets.assets, of which $1.5 million related to discontinued operations in fiscal 2009.
Floor Plan Notes Payable — Floor plan notes payable represent liabilities related to the purchase of commercial vehicle chassis upon which the Company mounts its manufactured vehicle bodies. Floor plan notes payable are non-interest bearing for terms ranging up to 120 days and must be repaid upon the sale of the vehicle to a customer. The Company’s practice is to repay all floor plan notes for which the non-interest bearing period has expired without sale of the vehicle to a customer.
62
Table of Contents
OSHKOSH CORPORATION
NOTES TO CONSOLIDATED FINANCIAL STATEMENTS
Customer Advances — Customer advances include amounts received in advance of the completion of fire & emergency and commercial vehicles. Most of these advances bear interest at variable rates approximating the prime rate. Advances also include any performance-based payments received from the DoD in excess of the value of related inventory. Advances from the DoD are non-interest bearing. See precedingthe discussion onabove regarding performance-based payments.
Accumulated Other Comprehensive Income (Loss) Income — Comprehensive income (loss) income is a more inclusive financial reporting method that includes disclosure of financial information that historically has not been recognized in the calculation of net income. The Company has chosen to report Comprehensive (Loss) Incomecomprehensive income (loss) and Accumulated Other Comprehensive (Loss) Income,accumulated other comprehensive income (loss), which encompasses net income (loss), cumulative translation adjustments, employee pension and postretirement benefits, and unrealized gains (losses) on derivatives and minimum pension liability adjustments in the Consolidated Statements of Shareholders’ Equity.
64
Table of Contents
OSHKOSH CORPORATION
NOTES TO CONSOLIDATED FINANCIAL STATEMENTS
The components of Accumulated Other Comprehensive (Loss) Incomeaccumulated other comprehensive income (loss) are as follows (in millions):
| | | | Minimum | | | | Accumulated | | | | | Employee | | | | | |
| | Cumulative | | Pension | | | | Other | | | | | Pension and | | | | Accumulated | |
| | Translation | | Liability | | Gains (Losses) | | Comprehensive | | | Cumulative | | Postretirement | | Gains (Losses) | | Other | |
| | Adjustments | | Adjustments | | on Derivatives | | Income (Loss) | | | Translation | | Benefits, Net | | on Derivatives, | | Comprehensive | |
| | | | | | | | | | | Adjustments | | of Tax | | Net of Tax | | Income (Loss) | |
Balance at September 30, 2006 | | $ | 65.9 | | $ | (1.0 | ) | $ | (5.7 | ) | $ | 59.2 | | |
Fiscal year change | | 110.2 | | (34.1 | ) | (6.3 | ) | 69.8 | | |
Balance at September 30, 2007 | | 176.1 | | (35.1 | ) | (12.0 | ) | 129.0 | | |
Fiscal year change | | (40.6 | ) | (17.4 | ) | (15.3 | ) | (73.3 | ) | |
| | | | | | | | | | |
Balance at September 30, 2008 | | 135.5 | | (52.5 | ) | (27.3 | ) | 55.7 | | | $ | 135.5 | | $ | (52.5 | ) | $ | (27.3 | ) | $ | 55.7 | |
Fiscal year change | | (94.3 | ) | | (31.8 | ) | (4.3 | ) | (130.4 | ) | | (94.3 | ) | (31.8 | ) | (4.3 | ) | (130.4 | ) |
Balance at September 30, 2009 | | $ | 41.2 | | $ | (84.3 | ) | $ | (31.6 | ) | $ | (74.7 | ) | | 41.2 | | (84.3 | ) | (31.6 | ) | (74.7 | ) |
Fiscal year change | | | (26.9 | ) | (12.6 | ) | 21.0 | | (18.5 | ) |
Balance at September 30, 2010 | | | 14.3 | | (96.9 | ) | (10.6 | ) | (93.2 | ) |
Fiscal year change | | | (4.8 | ) | (33.8 | ) | 9.2 | | (29.4 | ) |
Balance at September 30, 2011 | | | $ | 9.5 | | $ | (130.7 | ) | $ | (1.4 | ) | $ | (122.6 | ) |
Foreign Currency Translation — All balance sheet accounts have been translated into U.S. dollars using the exchange rates in effect at the balance sheet date. Income statement amounts have been translated using the average exchange rate during the period in which the transactions occurred. Resulting translation adjustments are included in “Accumulated other comprehensive income (loss) income..” Foreign currency transactions gains or losses are included in “Miscellaneous, net” in the Consolidated Statements of Operations. The Company recorded net foreign currency transaction gains (losses)related to continuing operations of $5.7$0.3 million, $(9.3)$1.4 million and $2.1$5.6 million in fiscal 2009, 20082011, 2010 and 2007,2009, respectively.
Derivative Financial Instruments — The Company recognizes all derivative financial instruments, such as foreign exchange contracts, in the consolidated financial statements at fair value regardless of the purpose or intent for holding the instrument. Changes in the fair value of derivative financial instruments are either recognized periodically in income or in shareholders’ equity as a component of comprehensive income depending on whether the derivative financial instrument qualifies for hedge accounting, and if so, whether it qualifies as a fair value hedge or cash flow hedge. Generally, changes in fair values of derivatives accounted for as fair value hedges are recorded in income along with the portions of the changes in the fair values of the hedged items that relate to the hedged risks. Changes in fair values of derivatives accounted for as cash flow hedges, to the extent they are effective as hedges, are recorded in other comprehensive income, net of deferred income taxes. Changes in fair value of derivatives not qualifying as hedges are reported in income. Cash flows from derivatives that are accounted for as cash flow or fair value hedges are included in the Consolidated Statements of Cash Flows in the same category as the item being hedged.
Subsequent Events — The Company evaluated subsequent events after the balance sheet date through November 18, 2009, which is the date the Company filed its Form 10-K, for appropriate accounting and disclosure.
63
Table of Contents
OSHKOSH CORPORATION
NOTES TO CONSOLIDATED FINANCIAL STATEMENTS
Recent Accounting Pronouncements — In September 2007,June 2009, the FASB issued a new standard on fair value measurements, which defined fair value, established a framework for measuring fair value and expanded disclosures about fair value measurements. The fair value standard clarified the definition of exchange price as the price between market participants in an orderly transaction to sell an asset or transfer a liability in the market in which the reporting entity would transact business for the asset or liability, that is, the principal or most advantageous market for the asset or liability. Effective October 1, 2008, the Company partially adopted the fair value standard but did not adopt it for non-financial assets and liabilities which are not recognized or disclosed at fair value on a recurring basis. See Note 14 of the Notes to Consolidated Financial Statements for additional information regarding fair value measurement disclosures. The Company will be required to adopt the fair value standard for non-financial assets and liabilities which are not recognized or disclosed at fair value on a recurring basis on October 1, 2009. The adoption of the remaining provisions of the fair value standard is not expected to have a material impact on the Company’s consolidated financial position, results of operations or cash flows.
In December 2007, the FASB issued a new standard on business combinations, which requires an acquirer to recognize the assets acquired, the liabilities assumed, and any noncontrolling interest in the acquiree at the acquisition date, at their fair values as of that date. Acquisition-related transaction and restructuring costs will be expensed rather than treated as acquisition costs and included in the amount recorded for assets acquired. The new business combination standard will be effective for the Company on a prospective basis for all business combinations for which the acquisition date is on or after October 1, 2009. The new business combination standard also amends ASC Topic 740, Income Taxes, such that adjustments made to valuation allowances on deferred taxes and acquired tax contingencies associated with acquisitions that closed prior to October 1, 2009 would also apply the provision of the new business combination standard. At September 30, 2009, the Company had $20.1 million of tax contingencies associated with acquisitions that closed prior to October 1, 2009. Any adjustments required upon resolution of these contingencies will be reflected in “(Benefit from) provision for income taxes” in the Consolidated Statements of Operations.
In December 2007, the FASB issued a new standard on noncontrolling interests in consolidated financial statements, which clarified that a noncontrolling interest in a subsidiary is an ownership interest in the consolidated entity that should be reported as equity in the consolidated financial statements. The Company will be required to adopt the new noncontrolling interests standard as of October 1, 2009. The adoption of the new noncontrolling interests standard is not expected to have a material impact on the Company’s financial condition, results of operations and cash flows.
In June 2009, the FASB issued Statement of Financial Accounting Standards (“SFAS”) No. 167, Amendments to FASB Interpretation No. 46(R), to address the elimination of the concept of a qualifying special purpose entity. SFAS No. 167The new variable interest standard also replaces the quantitative-based risks and rewards calculation for determining which enterprise has a controlling financial interest in a variable interest entity with an approach focused on identifying which enterprise has the power to direct the activities of a variable interest entity and the obligation to absorb losses of the entity or the right to receive benefits from the entity. Additionally, SFAS No. 167 providesthe new variable interest standard requires disclosure of more timely and useful information about an enterprise’s involvement with a variable interest entity. The Company will be required to adopt SFAS No. 167adopted the new variable interest standard as of October 1, 2010. The Company is currently evaluatingadoption of the new variable interest standard did not have a material impact of SFAS No. 167 on the Company’s financial condition, results of operations andor cash flows.
In June 2009,July 2010, the FASB issued SFAS No. 168,amended ASC Topic 310, Receivables, to require more robust and disaggregated disclosures about the credit quality of an entity’s financing receivables and its allowances for credit losses. The new disclosures require additional information for nonaccrual and past due accounts, the allowance for credit losses, impaired loans, credit quality and account modifications. The Company adopted the new disclosure requirements as of October 1, 2010. See Note 4 of the Notes to Consolidated Financial Statements for additional information.
65
Table of Contents
OSHKOSH CORPORATION
NOTES TO CONSOLIDATED FINANCIAL STATEMENTS
In June 2011, the FASB Accounting Standards Codification™amended ASC Topic 220, Comprehensive Income, to require all non-owner changes in shareholders’ equity to be presented in either a single continuous statement of comprehensive income or in two separate but consecutive statements. Under this amendment, an entity is required to present each component of net income along with total net income, each component of other comprehensive income along with a total for other comprehensive income, and a total amount for comprehensive income. An entity is required to present on the face of the financial statements reclassification adjustments for items that are reclassified from other comprehensive income to net income in the statement(s) where the components of net income and the Hierarchycomponents of Generally Accepted Accounting Principles, a replacementother comprehensive income are presented. An entity will no longer be permitted to present the components of FASB Statement No. 162, which establishes the FASB ASCother comprehensive income as the source of authoritative accounting principles recognized by the FASB to be applied in the preparation of financial statements in conformity with U.S. GAAP. SFAS No. 168 explicitly recognizes rules and interpretive releasespart of the Securities and Exchange Commission (“SEC”) under federal securities laws as authoritative U.S. GAAP for SEC registrants.statement of equity. The Company waswill be required to adopt SFAS No. 168the new presentation requirements as of September 30, 2009.October 1, 2012. The adoption of SFAS No. 168 didthe new presentation will not have a material impact on the Company’s financial condition, results of operations or cash flows.
3. Discontinued Operations
OnIn July 1, 2009, the Company sold Geesink to a third party for nominal cash consideration. Following reclassification of $92.0 million of cumulative translation adjustments out of shareholders’ equity, the Company recorded a pretax gain on the sale of $33.8 million, which was recognized in the fourth quarter of fiscal 2009. As a result of the sale, the historical results of Geesink, which were previously included in the Company’s commercial segment, have been reclassified and are now included in discontinued operations in the Company’s Consolidated Statements of Operations.
64
TableIn October 2009, the Company sold its 75% ownership interest in BAI to BAI’s management team for nominal cash consideration. Following reclassification of Contents
OSHKOSH CORPORATION
NOTES TO CONSOLIDATED FINANCIAL STATEMENTS
Due to rationalization$0.8 million of manufacturing facilities, inefficiencies associated withcumulative translation adjustments out of equity, the relocation and start-up of production of Norba-branded products from Sweden to The Netherlands and increased material costs and product warranties,Company recorded a small after tax loss on the Company’s European refuse collection vehicle business, Geesink, sustained a loss related to its operations of $27.5 millionsale, which was recognized in the first nine months of fiscal 2008. The loss was significantly more than estimated in the Company’s financial projections supporting its fiscal 2007 fourth quarter impairment test.
The Company had taken steps during fiscal 2007 and the first six months of fiscal 2008 to turn around the Geesink business, including selling an unprofitable facility in The Netherlands during the first quarter of fiscal 2008, reaching an agreement with the Works Council2010. BAI, a European fire apparatus manufacturer, was previously included in Sweden regarding rationalizing a facility in that country in order to consolidate Norba-branded production in The Netherlands, reducing its work force, installing new executive leadership, integrating operations with JLG, implementing lean manufacturing practices, introducing new products and outsourcing components to lower cost manufacturing sites. In June 2008, it became evident that synergies related to Geesink’s facility rationalization program would be lower than expected and costs to execute the rationalization would be higher than anticipated. The resulting slower than expected and more difficult return to profitability of Geesink’s business, further escalation of raw material costs, a softening of economies in Western Europe and a reduction in fabrication volume for the Company’s access equipment segment at Geesink’s Romania facility due to a slowdown in the European access equipment market led the Company to the conclusion that a charge for impairment was required. During the third quarter of fiscal 2008, the Company took these factors into account in developing its fiscal 2009 and long-term forecast for this business. With the assistance of a third-party valuation firm, the Company determined that Geesink goodwill and non-amortizable intangible assets were impaired and the Company recorded non-cash, pre-tax impairment charges of $174.2 million in the third quarter of fiscal 2008. The evaluation was based upon a discounted cash flow analysis of the historical and forecasted operating results of this business.fire & emergency segment.
The following amounts related to Geesink’sthe operations of Geesink and BAI were derived from historical financial information and have been segregated from continuing operations and reported as discontinued operations in the Consolidated Statements of Operations (in millions):
| | Fiscal Year Ended September 30, | | | Fiscal Year Ended
September 30, | |
| | 2009 | | 2008 | | 2007 | | | 2010 | | 2009 | |
| | | | | | | | | | | | |
Net sales | | $ | 138.1 | | $ | 201.9 | | $ | 168.0 | | | $ | — | | $ | 180.2 | |
Cost of sales | | 130.0 | | 196.9 | | 151.7 | | | — | | 169.4 | |
Gross income | | 8.1 | | 5.0 | | 16.3 | | | — | | 10.8 | |
Operating expenses: | | | | | | | | | | | | |
Selling, general and administrative | | 22.0 | | 39.0 | | 34.7 | | | — | | 27.5 | |
Amortization of purchased intangibles | | 0.3 | | 0.5 | | 0.4 | | | — | | 0.4 | |
Intangible assets impairment charges | | — | | 174.2 | | — | | |
Intangible asset impairment charges | | | — | | 9.6 | |
Total operating expenses | | 22.3 | | 213.7 | | 35.1 | | | — | | 37.5 | |
Operating loss | | (14.2 | ) | (208.7 | ) | (18.8 | ) | | — | | (26.7 | ) |
Other expense | | (0.6 | ) | (1.6 | ) | (0.9 | ) | | — | | (1.4 | ) |
Loss before income taxes | | (14.8 | ) | (210.3 | ) | (19.7 | ) | | — | | (28.1 | ) |
Benefit from income taxes | | (54.5 | ) | (2.7 | ) | (2.5 | ) | | — | | (61.6 | ) |
Income (loss) from operations, net of tax | | 39.7 | | (207.6 | ) | (17.2 | ) | |
Gain on sale of Geesink | | 33.8 | | — | | — | | |
Income from operations, net of tax | | | — | | 33.5 | |
Gain (loss) on sale of discontinued operations | | | (2.9 | ) | 33.8 | |
Income (loss) from discontinued operations, net of tax | | $ | 73.5 | | $ | (207.6 | ) | $ | (17.2 | ) | | $ | (2.9 | ) | $ | 67.3 | |
The Fiscalfiscal 2009 benefit from income taxes includes $54.0$61.0 million related to a worthless stock/bad debt deduction claimed by the Company related to the Geesink discontinued operations. See Note 1920 of the Notes to Consolidated Financial Statements.Statements for additional information.
65
66Table of Contents
OSHKOSH CORPORATION
NOTES TO CONSOLIDATED FINANCIAL STATEMENTS
The Company has elected not to reclassify Geesink balances in the Consolidated Balance Sheets. The following is a summary of the assets and liabilities of Geesink’s operations. The amounts presented below were derived from historical financial information and adjusted to exclude intercompany receivables and payables between Geesink and the Company (in millions):
| | July 1, | | September 30, | |
| | 2009 | | 2008 | |
| | | | | |
Receivables, net | | $ | 45.9 | | $ | 49.2 | |
Inventories, net | | 41.8 | | 54.0 | |
Deferred income taxes | | 3.0 | | 3.2 | |
Other current assets | | 3.3 | | 3.3 | |
Total current assets | | 94.0 | | 109.7 | |
| | | | | |
Property, plant and equipment, net | | 17.4 | | 18.0 | |
Purchased intangible assets, net | | 2.8 | | 3.2 | |
Other long-term assets | | 1.9 | | 0.7 | |
Total non-current assets | | 22.1 | | 21.9 | |
| | | | | |
Accounts payable | | (29.8 | ) | (36.0 | ) |
Accrued and other current liabilities | | (31.6 | ) | (27.7 | ) |
Total current liabilities | | (61.4 | ) | (63.7 | ) |
| | | | | |
Deferred income taxes | | (1.4 | ) | (1.9 | ) |
Other long-term liabilities | | (0.9 | ) | (0.2 | ) |
Total non-current liabilities | | (2.3 | ) | (2.1 | ) |
Net assets | | $ | 52.4 | | $ | 65.8 | |
Accumulated other comprehensive income included $92.0 million and $93.2 million of cumulative currency translation adjustments at July 1, 2009 and September 30, 2008, respectively. Cumulative currency translation adjustments were reclassified out of shareholders’ equity against the Company’s recorded interest in the book value of the net assets of Geesink upon its sale, giving rise to a $33.8 million gain on sale in the fourth quarter of fiscal 2009.
66
Table of Contents
OSHKOSH CORPORATION
NOTES TO CONSOLIDATED FINANCIAL STATEMENTS
4. Receivables
Receivables consisted of the following (in millions):
| | September 30, | |
| | 2009 | | 2008 | |
U.S. government: | | | | | |
Amounts billed | | $ | 243.1 | | $ | 199.4 | |
Cost and profits not billed | | 5.9 | | 6.1 | |
| | 249.0 | | 205.5 | |
Other trade receivables | | 289.9 | | 738.7 | |
Finance receivables | | 46.7 | | 26.4 | |
Pledged finance receivables | | — | | 3.9 | |
Notes receivables | | 66.5 | | 61.8 | |
Other receivables | | 26.9 | | 43.6 | |
| | 679.0 | | 1,079.9 | |
Less allowance for doubtful accounts | | (42.0 | ) | (24.8 | ) |
| | $ | 637.0 | | $ | 1,055.1 | |
| | | | | |
Current receivables | | $ | 563.8 | | $ | 997.8 | |
Long-term receivables | | 73.2 | | 57.3 | |
| | $ | 637.0 | | $ | 1,055.1 | |
The Company recorded provisions for credit losses of $50.1 million in fiscal 2009, including a $24.4 million accrual for losses on customer guarantees, which is recorded as a liability in the Consolidated Balance Sheets. The provisions were concentrated in the access equipment segment due to the effects of the global recession on the financial health of its customers and due to reductions in the underlying collateral value of the equipment.
| | September 30, | |
| | 2011 | | 2010 | |
U.S. government: | | | | | |
Amounts billed | | $ | 318.8 | | $ | 380.1 | |
Cost and profits not billed | | 172.3 | | 75.2 | |
| | 491.1 | | 455.3 | |
Other trade receivables | | 568.8 | | 401.8 | |
Finance receivables | | 23.6 | | 65.6 | |
Notes receivables | | 33.7 | | 52.1 | |
Other receivables | | 27.4 | | 19.5 | |
| | 1,144.6 | | 994.3 | |
Less allowance for doubtful accounts | | (29.5 | ) | (42.0 | ) |
| | $ | 1,115.1 | | $ | 952.3 | |
Costs and profits not billed generally will become billable uponresult from undefinitized change orders on existing long-term contracts and “not-to-exceed” undefinitized contracts whereby the Company achieving certaincannot invoice the customer the full price under the contract milestones.or contract change order until such contract or change order is definitized and agreed to with the customer following a review of costs under such a contract award even though the contract deliverables may have been met. Cost and profits not billed increased in fiscal 2011 as a result of costs incurred under undefinitized contracts. Definitization of a change order on an existing long-term contract or a sole source contract begins when the U.S. government customer undertakes a detailed review of the Company’s submitted costs related to the contract, with the final change order or contract price subject to review. The Company recognizes revenue on undefinitized contracts to the extent that it can reasonably and reliably estimate the expected final contract price and when collectability is reasonably assured. To the extent that contract definitization results in changes to previously estimated incurred costs or revenues, the Company records those adjustments as a change in estimate. The Company updated its estimated costs under several undefinitized change orders related to M-ATVs and recorded $1.8 million related to such updates during fiscal 2011. As all costs associated with these contracts had been previously expensed, the change increased net income by $1.2 million or $0.01 per share, for fiscal 2011.
Classification of receivables in the Consolidated Balance Sheets consisted of the following (in millions):
| | September 30, | |
| | 2011 | | 2010 | |
| | | | | |
Current receivables | | $ | 1,089.1 | | $ | 889.5 | |
Long-term receivables | | 26.0 | | 62.8 | |
| | $ | 1,115.1 | | $ | 952.3 | |
Finance Receivables: Finance receivables represent sales-type leases resulting from the sale of the Company’s products.products and the purchase of finance receivables from lenders pursuant to customer defaults under program agreements with finance companies. Finance receivables originated by the Company generally include a residual value component. Residual values are determined based on the expectation that the underlying equipment will have a minimum fair market value at the end of the lease term. This residual value accrues to the Company at the end of the lease. The Company uses its experience and knowledge as an original equipment manufacturer and participant in end markets for the related products along with third-party studies to estimate residual values. The Company monitors these values for impairment on a periodic basis and reflects any resulting reductions in value in current earnings. As of September 30, 2009, approximately 72% ofFinance receivables are written down once management determines that the finance receivables were due from four parties. Finance and pledged finance receivables consisted ofspecific borrower does not have the following (in millions):ability to repay the loan in full.
| | September 30, | |
| | 2009 | | 2008 | |
| | | | | |
Finance receivables | | $ | 52.0 | | $ | 28.8 | |
Pledged finance receivables | | — | | 3.9 | |
| | 52.0 | | 32.7 | |
Estimated residual value | | 2.1 | | 2.0 | |
Less unearned income | | (7.4 | ) | (4.4 | ) |
Net finance and pledged finance receivables | | 46.7 | | 30.3 | |
Less allowance for doubtful accounts | | (11.8 | ) | (1.2 | ) |
| | $ | 34.9 | | $ | 29.1 | |
67
Table of Contents
OSHKOSH CORPORATION
NOTES TO CONSOLIDATED FINANCIAL STATEMENTS
The contractualFinance receivables consisted of the following (in millions):
| | September 30, | |
| | 2011 | | 2010 | |
| | | | | |
Finance receivables | | $ | 27.9 | | $ | 74.7 | |
Estimated residual value | | — | | 2.1 | |
Less unearned income | | (4.3 | ) | (11.2 | ) |
Net finance receivables | | 23.6 | | 65.6 | |
Less allowance for doubtful accounts | | (11.5 | ) | (20.9 | ) |
| | $ | 12.1 | | $ | 44.7 | |
Contractual maturities of the Company’s finance receivables at September 30, 20092011 were as follows: 2010 - $11.1 million; 2011 - $9.8 million; 2012 - $9.9 million; 2013 - $10.6$7.2 million; 2014 - $6.3$5.6 million; 2015 - $3.6 million; 2016 - $0.9 million; and thereafter - $4.3$0.7 million. Historically, finance receivables have been paid off prior to their contractual due dates, although that may change inactual repayment timing is impacted by a number of factors, including the current economic environment.environment at the time. As a result, contractual maturities are not to be regarded as a forecast of future cash flows. Provisions
Delinquency is the primary indicator of credit quality of finance receivables. The Company maintains a general allowance for losses on finance receivables considered doubtful of future collection based upon historical experience. Additional allowances are charged to income in amounts sufficient to maintainestablished based upon the allowance at a level considered adequate to cover losses in the existing receivable portfolio.
Notes receivable include refinancing of trade accounts and finance receivables. As of September 30, 2009, approximately 85%Company’s perception of the notesquality of the finance receivables, including the length of time the receivables are past due, past experience of collectability and underlying economic conditions. In circumstances where the Company believes collectability is no longer reasonably assured, a specific allowance is recorded to reduce the net recognized receivable were due from two parties.to the amount reasonably expected to be collected. The terms of the finance agreements generally give the Company routinely evaluates the creditworthinessability to take possession of its customers and establishes reserves if required under the circumstances. Certain notes receivable are collateralized by a security interest in the underlying assets and/or other assets owned by the debtor.collateral. The Company may incur losses in excess of recorded reservesallowances if the financial condition of its customers were to deteriorate or the full amount of any anticipated proceeds from the sale of the collateral supporting its customers’ financial obligations is not realized. As of September 30, 2011, approximately 53% of the finance receivables were due from one party.
Notes Receivable: Notes receivable include refinancing of trade accounts and finance receivables. As of September 30, 2011, approximately 88% of the notes receivable balance outstanding was due from three parties. The Company routinely evaluates the creditworthiness of its customers and establishes reserves where the Company believes collectability is no longer reasonably assured. Notes receivables are written down once management determines that the specific borrower does not have the ability to repay the loan in full. Certain notes receivable are collateralized by a security interest in the underlying assets and/or other assets owned by the debtor. The Company may incur losses in excess of recorded allowances if the financial condition of its customers were to deteriorate or the full amount of any anticipated proceeds from the sale of the collateral supporting its customers’ financial obligations is not realized.
Quality of Finance and Notes Receivable: The Company does not accrue interest income on finance and notes receivables in circumstances where the Company believes collectability is no longer reasonably assured. Any cash payments received on nonaccrual finance and notes receivable are applied first to principal balances. The Company does not resume accrual of interest income until the customer has shown that it is capable of meeting its financial obligations by making timely payments over a sustained period of time. The Company determines past due or delinquency status based upon the due date of the receivable.
68
Table of Contents
OSHKOSH CORPORATION
NOTES TO CONSOLIDATED FINANCIAL STATEMENTS
Finance and notes receivable aging and accrual status consisted of the following (in millions):
| | September 30, | |
| | Finance Receivables | | Notes Receivables | |
| | 2011 | | 2010 | | 2011 | | 2010 | |
Aging of receivables that are past due: | | | | | | | | | |
Greater than 30 days and less than 60 days | | $ | 0.5 | | $ | 3.3 | | $ | — | | $ | — | |
Greater than 60 days and less than 90 days | | 0.1 | | — | | — | | — | |
Greater than 90 days | | 6.5 | | 20.7 | | 0.5 | | 2.6 | |
| | | | | | | | | |
Receivables on nonaccrual status | | 17.6 | | 57.7 | | 0.5 | | 2.6 | |
Receivables past due 90 days or more and still accruing | | — | | — | | — | | — | |
| | | | | | | | | |
Receivables subject to general reserves - | | 0.4 | | 3.9 | | 8.6 | | 21.5 | |
Allowance for doubtful accounts | | — | | (0.1 | ) | (0.1 | ) | (0.4 | ) |
Receivables subject to specific reserves - | | 23.2 | | 61.7 | | 25.1 | | 30.6 | |
Allowance for doubtful accounts | | (11.5 | ) | (20.8 | ) | (8.8 | ) | (9.0 | ) |
| | | | | | | | | | | | | |
Receivables subject to specific reserves also include loans that have been modified in troubled debt restructurings as a concession to customers experiencing financial difficulty. To minimize the economic loss, the Company may modify certain finance and notes receivable. Modifications generally consist of restructured payment terms and time frames in which no payments are required. At September 30, 2011, restructured finance receivables and notes receivables were $21.7 million and $12.3 million, respectively. Losses on troubled debt restructurings were not significant during fiscal 2011.
Changes in the Company’s allowance for doubtful accounts were as follows (in millions):
| | Fiscal Year Ended September 30, 2011 | |
| | | | | | Trade and | | | |
| | Finance | | Notes | | Other | | | |
| | Receivables | | Receivable | | Receivables | | Total | |
| | | | | | | | | |
Allowance for doubtful accounts at beginning of year | | $ | 20.9 | | $ | 9.4 | | $ | 11.7 | | $ | 42.0 | |
Provision for doubtful accounts, net of recoveries | | (0.5 | ) | 1.9 | | 0.6 | | 2.0 | |
Charge-off of accounts | | (8.9 | ) | (2.5 | ) | (3.1 | ) | (14.5 | ) |
Foreign currency translation | | — | | 0.1 | | (0.1 | ) | — | |
Allowance for doubtful accounts at end of year | | $ | 11.5 | | $ | 8.9 | | $ | 9.1 | | $ | 29.5 | |
69
Table of Contents
OSHKOSH CORPORATION
NOTES TO CONSOLIDATED FINANCIAL STATEMENTS
5. Inventories
Inventories consisted of the following (in millions):
| | September 30, | | | | September 30, | |
| | 2009 | | 2008 | | | | 2011 | | 2010 | |
| | | | | | | | | | | |
Raw materials | | $ | 513.4 | | $ | 474.0 | | Raw materials | | $ | 587.4 | | $ | 658.6 | |
Partially finished products | | 326.3 | | 275.5 | | Partially finished products | | 377.7 | | 332.2 | |
Finished products | | 325.2 | | 419.5 | | Finished products | | 237.8 | | 227.3 | |
Inventories at FIFO cost | | 1,164.9 | | 1,169.0 | | Inventories at FIFO cost | | 1,202.9 | | 1,218.1 | |
Less: Progress/performance-based payments on U.S. government contracts | | (317.3 | ) | (154.3 | ) | |
Excess of FIFO cost over LIFO cost | | (57.9 | ) | (73.1 | ) | |
Less: | | Progress/performance-based payments on U.S. government contracts | | (341.7 | ) | (308.7 | ) |
| | $ | 789.7 | | $ | 941.6 | | Excess of FIFO cost over LIFO cost | | (74.4 | ) | (60.8 | ) |
| | | | $ | 786.8 | | $ | 848.6 | |
Title to all inventories related to government contracts, which provide for progress or performance-based payments, vests with the government to the extent of unliquidated progress or performance-based payments.
Inventory includes costs which are amortized to expense as sales are recognized under certain contracts. At September 30, 20092011 and 2008,2010, unamortized costs related to long-term contracts of $3.5$0.3 million and $3.3$4.1 million, respectively, were included in inventory.
During fiscal 2011, 2010 and 2009, reductions in FIFO inventory levels resulted in liquidations of LIFO inventory layers carried at lower costs prevailing in prior years as compared with the cost of current-year purchases. The effect of the LIFO inventory liquidations on fiscal 2011, 2010 and 2009 results was to decrease costs of goods sold by $1.8 million, $5.6 million and $6.0 million, respectively, and increase earnings from continuing operations by $1.1 million ($0.01 per share), $3.4 million ($0.04 per share) and $3.7 million ($0.05 per share). The Company recognized pre-tax income from continuing operations of $15.2 million and expense of $26.7 million and $10.6 million as a result of LIFO inventory adjustments in fiscal 2009, 2008 and 2007,, respectively.
68
Table of Contents
OSHKOSH CORPORATION
NOTES TO CONSOLIDATED FINANCIAL STATEMENTS
6. Investments in Unconsolidated Affiliates
Investments in unconsolidated affiliates are accounted for under the equity method and consisted of the following (in millions):
| | Percent- | | September 30, | | | Percent- | | September 30, | |
| | owned | | 2009 | | 2008 | | | owned | | 2011 | | 2010 | |
| | | | | | | | | | | | | | |
OMFSP (U.S.) | | 50% | | $ | 14.7 | | $ | 16.0 | | | 50% | | $ | 13.4 | | $ | 12.9 | |
RiRent (The Netherlands) | | 50% | | 15.7 | | 15.4 | | | 50% | | 10.9 | | 11.1 | |
Mezcladoras (Mexico) | | 49% | | 6.9 | | 6.7 | | |
Other | | | | | 7.5 | | 6.4 | |
| | | | $ | 37.3 | | $ | 38.1 | | | | | $ | 31.8 | | $ | 30.4 | |
The investmentRecorded investments generally representsrepresent the Company’s maximum exposure to loss as a result of the Company’s ownership interest. Earnings andor losses net of related income taxes, are reflected in “Equity in earnings (losses) earnings of unconsolidated affiliates.”affiliates” in the Consolidated Statements of Operations.
In February 1998, concurrent with the Company’s acquisition of McNeilus, theThe Company and an unaffiliated third-party BA Leasing & Capital Corporation, formedare partners in OMFSP, a general partnership formed for the purpose of offering lease financing to certain customers of the Company. Each partner contributed existing lease assets (and, in the case of the Company, related notes payable to third-party lenders, which were secured by such leases) to capitalize the partnership. Leases and related notes payable contributed by the Company were originally acquired in connection with the McNeilus acquisition.
OMFSP manages the contributed assets and liabilities and engages in new vendor lease business providing financing to certain customers of the Company. The Company sells vehicles, vehicle bodies and concrete batch plants to OMFSP for lease to user-customers. The Company’s sales to OMFSP were $14.7$0.2 million, $39.7$9.5 million and $72.6$14.7 million in fiscal 2009, 20082011, 2010 and 2007,2009, respectively. Banks and other financial institutions lend to OMFSP a portion of the purchase price, with recourse solely to OMFSP, secured by a pledge of lease payments due from the user-lessees. Each partner funds one-half of
70
Table of Contents
OSHKOSH CORPORATION
NOTES TO CONSOLIDATED FINANCIAL STATEMENTS
the approximate 4.0% to 8.0% equity portion of the cost of new equipment purchases. Customers typically provide a 2.0% to 6.0% down payment. Each partner is allocated its proportionate share of OMFSP’s cash flow and taxable income in accordance with the partnership agreement. Indebtedness of OMFSP is secured by the underlying leases and assets of, and is with recourse solely to, OMFSP. All such OMFSP indebtedness is non-recourse to the Company and its partner. Each of the two general partners has identical voting, participating and protective rights and responsibilities, and each general partner materially participates in the activities of OMFSP. For these and other reasons, the Company has determined that OMFSP is a voting interest entity. Accordingly, the Company accounts for its equity interest in OMFSP under the equity method. The Company received cash distributions from OMFSP of $5.5 million and $4.7 million in fiscal 2008 and 2007, respectively. No cash distributions were received in fiscal 2009.
The Company and an unaffiliated third-party are joint venture partners in RiRent. RiRent maintains a fleet of access equipment for short-term lease to rental companies throughout most of Europe. The re-rental fleet provides rental companies with equipment to support requirements on short notice. RiRent does not provide services directly to end users. The Company’s sales to RiRent were $4.4$6.5 million, $49.3$4.2 million and $31.5$4.4 million in fiscal 2009, 20082011, 2010 and 2007,2009, respectively. The Company recognizes income on sales to RiRent at the time of shipment in proportion to the outside third-party interest in RiRent and recognizes the remaining income ratably over the estimated useful life of the equipment, which is generally five years. Indebtedness of RiRent is secured by the underlying leases and assets of RiRent. All such RiRent indebtedness is non-recourse to the Company and its partner. Under RiRent’s €55.0€15.0 million bank credit facility, the partners of RiRent have committed to maintain an overall equity to asset ratio of at least 30.0% (40.6%(72.9% as of JuneSeptember 30, 2009)2011).
69
Table of Contents
OSHKOSH CORPORATION
NOTES TO CONSOLIDATED FINANCIAL STATEMENTS
7. Property, Plant and Equipment
Property, plant and equipment consisted of the following (in millions):
| | September 30, | | | September 30, | |
| | 2009 | | 2008 | | | 2011 | | 2010 | |
| | | | | | | | | | |
Land and land improvements | | $ | 44.2 | | $ | 47.3 | | | $ | 46.2 | | $ | 46.7 | |
Buildings | | 210.4 | | 219.0 | | | 243.8 | | 237.2 | |
Machinery and equipment | | 442.3 | | 433.1 | | | 521.5 | | 490.2 | |
Equipment on operating lease to others | | 56.8 | | 57.0 | | | 23.0 | | 46.0 | |
Construction in progress | | 9.7 | | — | | | — | | 0.9 | |
| | 763.4 | | 756.4 | | | 834.5 | | 821.0 | |
Less accumulated depreciation | | (353.2 | ) | (303.1 | ) | | (445.8 | ) | (417.4 | ) |
| | $ | 410.2 | | $ | 453.3 | | | $ | 388.7 | | $ | 403.6 | |
Depreciation expense recorded in continuing operations was $75.7$78.5 million, $73.4$83.8 million and $54.7$75.1 million in fiscal 2011, 2010 and 2009, 2008respectively. Included in depreciation expense from continuing operations in fiscal 2011, 2010 and 2007, respectively. 2009 were charges of $3.4 million, $8.5 million and $2.7 million, respectively, related to the impairment of long-lived assets. To better align the Company’s cost structure with global market conditions, the Company has announced several plant closures during the past three fiscal years. Impairment of long-lived assets associated with the plant closures was determined using fair value based on a discounted cash flow analysis or appraisals.
Capitalized interest was insignificant in fiscal 2009, 2008 and 2007.for all reported periods. Equipment on operating lease to others represents the cost of equipment soldshipped to customers for whom the Company has guaranteed the residual value and equipment on short-term leases. These transactions are accounted for as operating leases with the related assets capitalized and depreciated over their estimated economic lives of five to ten years. Cost less accumulated depreciation for equipment on operating lease at September 30, 20092011 and 20082010 was $38.7$6.5 million and $41.1$25.2 million, respectively.
8. Goodwill and Purchased Intangible Assets
Goodwill and other indefinite-lived intangible assets are not amortized, but are reviewed for impairment annually, or more frequently if potential interim indicators exist that could result in impairment. The Company performs its annual impairment test in the fourth quarter of its fiscal year. During the fourth quarter of fiscal 2008, the Company performed its annual impairment review relative to goodwill and indefinite-lived intangible assets (principally tradenames) and concluded that no impairment was required.
At February 28, 2009, given a sustained decline in the price of the Company’s Common Stock subsequent to the Company’s fiscal 2008 year end when its share price approximated book value, depressed order rates during the second fiscal quarter which historically has been a strong period for orders in advance of the North American construction season, as well as further deterioration in credit markets and the macro-economic environment, the Company determined that the appropriate triggers had been reached to perform additional impairment testing on goodwill and its long-lived intangible assets.
To derive the fair value of its reporting units, the Company performed extensive valuation analyses with the assistance of a third-party valuation advisor, utilizing both income and market approaches. Under the income approach, the Company determined fair value based on estimated future cash flows discounted by an estimated weighted-average cost of capital, which reflects the overall level of inherent risk of a reporting unit and the rate of return an outside investor would expect to earn. Estimated future cash flows were based on the Company’s internal projection models, industry projections and other assumptions deemed reasonable by management. The sum of the fair values of the reporting units was reconciled to the Company’s market capitalization as of February 28, 2009 plus an estimated control premium. For the second quarter of fiscal 2009 impairment analysis, the Company used a weighted-average cost of capital of 14.5% and a terminal growth rate of 3%. This resulted in a control premium of 67%, based upon the relatively low price of the Company’s Common Stock on February 28, 2009 of $6.26 per share. Under the market approach, the Company derived the fair value of its reporting units based on revenue multiples of comparable publicly-traded companies. The final valuation was more heavily weighted towards the income approach as the Company believed the data available to apply the market approach at the time of the testing was not reliable as a result of the extreme volatility in stock prices due to the global recession and credit crisis. Changes in estimates or the application of alternative assumptions could have produced significantly different results.
7071
Table of Contents
OSHKOSH CORPORATION
NOTES TO CONSOLIDATED FINANCIAL STATEMENTS
As a result of this analysis, $1,167.8 million of goodwill and $25.8 million of other long-lived intangible assets were considered impaired and were written off duringDuring the secondfourth quarter of fiscal 2009. These impairment charges were driven by projections and valuation assumptions that reflected2011, the Company’s belief that the current recession would be deeper and longer than previously expected, that credit markets would remain tight and that costs of capital had risen significantly since the Company last performed its annual impairment testing.
Throughoutreview relative to goodwill and indefinite-lived intangible assets (principally trade names). The Company performed the thirdvaluation analyses with the assistance of a third-party valuation advisor. To derive the fair value of its reporting units, the Company utilized both the income and market approaches. For the annual impairment testing in the fourth quarter of fiscal 2009, access equipment order rates remained very weak and did not reflect a normal seasonal uptick. Further, during the quarter it became apparent to2011, the Company that federal stimulus actions would not contribute to access equipment orders inused a weighted-average cost of capital, depending on the near term, that credit availability to the Company’s access equipment customers would continue to be constrained, that U.S. residential and nonresidential spending could remain at very low levels for an extended period beyond the Company’s previous estimates and that the global economic recovery would occur at a slower pace than previously expected. These factors all contributed to the Company’s belief that this business would experience lower orders in fiscal 2010 and beyond than previously estimated. As a result, the Company initiated actions to further reduce its costs in its access equipment segment, including reductions in workforce and plant closings. The Company considered these factors together to be an indicator of potential impairment of goodwill in the access equipment reporting unit, which comprises the entire access equipment segment. The Company therefore performed a detailed Step 1 analysis of the access equipment segment utilizing a discounted cash flow model that employed a 14.5% discount rate13.5% to 15.0% and a terminal growth rate of 3%. Under the market approach, the Company derived the fair value of its reporting units based on revenue multiples of comparable publicly-traded companies. As a resultcorroborative source of information, the Company reconciles its estimated fair value to within a reasonable range of its market capitalization, which includes an assumed control premium (an adjustment reflecting an estimated fair value on a control basis), to verify the reasonableness of the fair value of its reporting units obtained through the aforementioned methods. The control premium is estimated based upon control premiums observed in comparable market transactions. The Company’s analysis resulted in a control premium of 10%, based on the price of the Company’s awardCommon Stock on July 1, 2011 of a large delivery order for M-ATVs from$32.95 per share. To derive the DoD in June 2009 and its decision to assemble many M-ATVs in access equipment segment facilities, this model included expected cash flows related to this contract. The resulting estimated fair value calculated inof its trade names, the impairment analysis was in excessCompany utilized the “relief from royalty” approach.
At July 1, 2011, approximately 88% of the net book value ofCompany’s recorded goodwill and purchased intangibles were concentrated within the JLG reporting unit in the access equipment segment. Based on this analysis, the Company concluded that no additional impairment charge was requiredThe estimated fair value of JLG calculated in the thirdfourth quarter of fiscal quarter.2011 impairment analysis exceeded JLG’s net book value by approximately 40%, or $900 million. The impairment model assumes that the U.S. economy and construction spending (and hence access equipment demand) will improve beginning in fiscal 2013. Assumptions utilized in the impairment analysis are highly judgmental, especially given the severity and global scale of the current recession.economic uncertainty. Changes in estimates or the application of alternative assumptions could have produced significantly different results. For each additional 50 basis point increase in the discount rate, the fair value of JLG would decrease by approximately $150 million. Events and conditions that could result in the impairment of intangibles at JLG include a further decline in economic conditions, a slower or weaker economic recovery than currently estimated by the Company or other factors leading to reductions in expected long-term sales or profitability at JLG.
As a result of the Company’s annual impairment testing, the Company recorded an impairment charge of $4.8 million of goodwill and trade names within the fire & emergency segment in fiscal 2011. Based on the Company’s annual impairment review, the Company concluded that no other goodwill or indefinite-lived intangible asset impairment charges were required. Assumptions utilized in the impairment analysis are highly judgmental, especially given the current period of economic uncertainty. Changes in estimates or the application of alternative assumptions could have produced significantly different results.
DuringThe Company continued to monitor the fourth quarter of fiscal 2009, the Company performed its annual impairment review relative to goodwill and indefinite-lived intangible assets (principally tradenames) utilizing a discounted cash flow model that employed a 14.5% discount rate and a terminal growth rate of 3%. This resultedmovement in a control premium of 59%, based on the price of theits Common Stock subsequent to its annual goodwill impairment testing date. The Company’s Common Stock closed at $15.74 and $20.86 per share on July 1, 2009 of $18.43 per share. As a result of this testing,September 30, 2011 and October 31, 2011, respectively. The Company believes that the Company recorded impairment charges of $1.4 million and $0.6 million for goodwill and tradenames, respectively, within the fire & emergency segment. In addition, based on this analysis, the Company concluded that impairment charges were not required for any other reporting units. Assumptions utilized in the impairment analysis are highly judgmental, especially given the severity and global scale of the current recession. Changes in estimates or the application of alternative assumptions could have produced significantly different results. For example, a discount rate of approximately 15% would have likely resulted in further impairment charges at JLG, OSV and IMT.
The following two tables present the changes in goodwill during fiscal 2009 and 2008 allocated to the reportable segments (in millions):
| | September 30, | | | | | | | | September 30, | |
| | 2008 | | Acquisition | | Impairment | | Translation | | 2009 | |
| | | | | | | | | | | |
Access equipment | | $ | 1,845.9 | | $ | (11.3 | ) | $ | (892.5 | ) | $ | (13.1 | ) | $ | 929.0 | |
Fire & emergency | | 231.0 | | — | | (100.8 | ) | (3.2 | ) | 127.0 | |
Commercial | | 197.2 | | — | | (175.9 | ) | — | | 21.3 | |
Total | | $ | 2,274.1 | | $ | (11.3 | ) | $ | (1,169.2 | ) | $ | (16.3 | ) | $ | 1,077.3 | |
In fiscal 2009, the settlement of pre-acquisition tax contingencies and other items resulted in a decrease in the goodwillprice of its Common Stock from the July 1, 2011 annual impairment testing date primarily related to the market’s expectation relative to the Company’s defense segment given the uncertainty surrounding future defense spending levels by the U.S. government and market concerns related to the profitability of the access equipment segment.Company’s FMTV contract. The defense segment contains no goodwill or indefinite lived intangible assets. Therefore the Company does not believe that the decrease in the price of its Common Stock is indicative of an interim triggering event for interim goodwill impairment testing in any reporting unit with goodwill.
7172
Table of Contents
OSHKOSH CORPORATION
NOTES TO CONSOLIDATED FINANCIAL STATEMENTS
| | September 30, | | | | | | | | September 30, | |
| | 2007 | | Acquisition | | Impairment | | Translation | | 2008 | |
| | | | | | | | | | | |
Access equipment | | $ | 1,853.7 | | $ | 14.0 | | $ | — | | $ | (21.8 | ) | $ | 1,845.9 | |
Fire & emergency | | 230.8 | | — | | — | | 0.2 | | 231.0 | |
Commercial | | 350.9 | | — | | (167.4 | ) | 13.7 | | 197.2 | |
Total | | $ | 2,435.4 | | $ | 14.0 | | $ | (167.4 | ) | $ | (7.9 | ) | $ | 2,274.1 | |
The following table presents changes in goodwill during fiscal 2011 and 2010 (in millions):
Adjustments made in the first quarter of fiscal 2008 upon finalization of certain appraisals for JLG resulted in an increase in the goodwill of the access equipment segment in fiscal 2008.
| | Access
Equipment | | Fire &
Emergency | | Commercial | | Total | |
| | | | | | | | | |
Net goodwill at September 30, 2009 | | $ | 929.0 | | $ | 127.0 | | $ | 21.3 | | $ | 1,077.3 | |
Impairment | | — | | (16.8 | ) | — | | (16.8 | ) |
Translation | | (13.0 | ) | 0.1 | | 0.1 | | (12.8 | ) |
Other | | — | | 1.9 | | — | | 1.9 | |
Net goodwill at September 30, 2010 | | 916.0 | | 112.2 | | 21.4 | | 1,049.6 | |
Impairment | | — | | (4.3 | ) | — | | (4.3 | ) |
Translation | | (3.8 | ) | 0.1 | | — | | (3.7 | ) |
Other | | — | | (0.1 | ) | — | | (0.1 | ) |
Net goodwill at September 30, 2011 | | $ | 912.2 | | $ | 107.9 | | $ | 21.4 | | $ | 1,041.5 | |
The following table presents details of the Company’s goodwill allocated to the reportable segments (in millions):
| | September 30, 2011 | | September 30, 2010 | |
| | Gross | | Accumulated
Impairment | | Net | | Gross | | Accumulated
Impairment | | Net | |
| | | | | | | | | | | | | |
Access Equipment | | $ | 1,844.3 | | $ | (932.1 | ) | $ | 912.2 | | $ | 1,848.1 | | $ | (932.1 | ) | $ | 916.0 | |
Fire & Emergency | | 182.1 | | (74.2 | ) | 107.9 | | 182.1 | | (69.9 | ) | 112.2 | |
Commerical | | 197.3 | | (175.9 | ) | 21.4 | | 197.3 | | (175.9 | ) | 21.4 | |
| | $ | 2,223.7 | | $ | (1,182.2 | ) | $ | 1,041.5 | | $ | 2,227.5 | | $ | (1,177.9 | ) | $ | 1,049.6 | |
The following two tables present the changes in gross purchased intangible assets during fiscal 20092011 and 2010 (in millions):
| | September 30, | | | | | | | | September 30, | | | September 30, | | | | | | | | | | September 30, | |
| | 2008 | | Disposition | | Impairment | | Translation | | 2009 | | | 2010 | | Disposition | | Impairment | | Translation | | Other | | 2011 | |
Amortizable intangible assets: | | | | | | | | | | | | | | | | | | | | | | | | |
Distribution network | | $ | 55.4 | | $ | — | | $ | — | | $ | — | | $ | 55.4 | | | $ | 55.4 | | $ | — | | $ | — | | $ | — | | $ | — | | $ | 55.4 | |
Non-compete | | 57.2 | | (0.2 | ) | — | | — | | 57.0 | | | 56.3 | | — | | — | | — | | 0.6 | | 56.9 | |
Technology-related | | 113.1 | | (6.2 | ) | (2.4 | ) | (0.1 | ) | 104.4 | | | 104.0 | | — | | — | | — | | 0.8 | | 104.8 | |
Customer relationships | | 595.3 | | — | | (8.8 | ) | 1.7 | | 588.2 | | | 577.2 | | — | | — | | (1.9 | ) | 1.4 | | 576.7 | |
Other | | 16.7 | | — | | (2.7 | ) | — | | 14.0 | | | 15.7 | | — | | — | | 0.1 | | 0.7 | | 16.5 | |
| | 837.7 | | (6.4 | ) | (13.9 | ) | 1.6 | | 819.0 | | | 808.6 | | — | | — | | (1.8 | ) | 3.5 | | 810.3 | |
Non-amortizable tradenames | | 413.4 | | — | | (12.5 | ) | (0.3 | ) | 400.6 | | |
Total | | $ | 1,251.1 | | $ | (6.4 | ) | $ | (26.4 | ) | $ | 1.3 | | $ | 1,219.6 | | |
Non-amortizable trade names | | | 397.3 | | — | | (0.5 | ) | — | | 0.8 | | 397.6 | |
| | | $ | 1,205.9 | | $ | — | | $ | (0.5 | ) | $ | (1.8 | ) | $ | 4.3 | | $ | 1,207.9 | |
| | September 30,
2009 | | Disposition | | Impairment | | Translation | | Other | | September 30,
2010 | |
Amortizable intangible assets: | | | | | | | | | | | | | |
Distribution network | | $ | 55.4 | | $ | — | | $ | — | | $ | — | | $ | — | | $ | 55.4 | |
Non-compete | | 57.0 | | (0.7 | ) | — | | — | | — | | 56.3 | |
Technology-related | | 104.4 | | — | | (0.3 | ) | (0.1 | ) | — | | 104.0 | |
Customer relationships | | 588.2 | | (0.6 | ) | (5.3 | ) | (6.6 | ) | 1.5 | | 577.2 | |
Other | | 14.0 | | — | | — | | — | | 1.7 | | 15.7 | |
| | 819.0 | | (1.3 | ) | (5.6 | ) | (6.7 | ) | 3.2 | | 808.6 | |
Non-amortizable trade names | | 400.6 | | — | | (3.2 | ) | (0.1 | ) | — | | 397.3 | |
| | $ | 1,219.6 | | $ | (1.3 | ) | $ | (8.8 | ) | $ | (6.8 | ) | $ | 3.2 | | $ | 1,205.9 | |
Details of the Company’s total purchased intangible assets were as follows (in millions):
| | September 30, 2009 | |
| | Weighted- | | | | | | | |
| | Average | | | | Accumulated | | | |
| | Life | | Gross | | Amortization | | Net | |
Amortizable intangible assets: | | | | | | | | | |
Distribution network | | 39.1 | | $ | 55.4 | | $ | (17.9 | ) | $ | 37.5 | |
Non-compete | | 10.5 | | 57.0 | | (49.0 | ) | 8.0 | |
Technology-related | | 11.8 | | 104.4 | | (35.9 | ) | 68.5 | |
Customer relationships | | 12.6 | | 588.2 | | (138.9 | ) | 449.3 | |
Other | | 12.4 | | 14.0 | | (10.1 | ) | 3.9 | |
| | 14.2 | | 819.0 | | (251.8 | ) | 567.2 | |
Non-amortizable tradenames | | | | 400.6 | | — | | 400.6 | |
Total | | | | $ | 1,219.6 | | $ | (251.8 | ) | $ | 967.8 | |
7273
Table of Contents
OSHKOSH CORPORATION
NOTES TO CONSOLIDATED FINANCIAL STATEMENTS
| | September 30, 2008 | |
| | Weighted- | | | | | | | |
| | Average | | | | Accumulated | | | |
| | Life | | Gross | | Amortization | | Net | |
Amortizable intangible assets: | | | | | | | | | |
Distribution network | | 39.1 | | $ | 55.4 | | $ | (16.5 | ) | $ | 38.9 | |
Non-compete | | 10.4 | | 57.2 | | (45.9 | ) | 11.3 | |
Technology-related | | 11.9 | | 113.1 | | (29.6 | ) | 83.5 | |
Customer relationships | | 12.6 | | 595.3 | | (90.4 | ) | 504.9 | |
Other | | 12.0 | | 16.7 | | (8.8 | ) | 7.9 | |
| | 14.1 | | 837.7 | | (191.2 | ) | 646.5 | |
Non-amortizable tradenames | | | | 413.4 | | — | | 413.4 | |
Total | | | | $ | 1,251.1 | | $ | (191.2 | ) | $ | 1,059.9 | |
Details of the Company’s total purchased intangible assets were as follows (in millions):
| | September 30, 2011 | |
| | Weighted-
Average
Life | | Gross | | Accumulated
Amortization | | Net | |
Amortizable intangible assets: | | | | | | | | | |
Distribution network | | 39.1 | | $ | 55.4 | | $ | (20.8 | ) | $ | 34.6 | |
Non-compete | | 10.5 | | 56.9 | | (53.0 | ) | 3.9 | |
Technology-related | | 11.7 | | 104.8 | | (53.3 | ) | 51.5 | |
Customer relationships | | 12.7 | | 576.7 | | (229.9 | ) | 346.8 | |
Other | | 16.5 | | 16.5 | | (12.2 | ) | 4.3 | |
| | 14.3 | | 810.3 | | (369.2 | ) | 441.1 | |
Non-amortizable trade names | | | | 397.6 | | — | | 397.6 | |
| | | | $ | 1,207.9 | | $ | (369.2 | ) | $ | 838.7 | |
| | September 30, 2010 | |
| | Weighted-
Average
Life | | Gross | | Accumulated
Amortization | | Net | |
Amortizable intangible assets: | | | | | | | | | |
Distribution network | | 39.1 | | $ | 55.4 | | $ | (19.3 | ) | $ | 36.1 | |
Non-compete | | 10.5 | | 56.3 | | (50.6 | ) | 5.7 | |
Technology-related | | 11.8 | | 104.0 | | (44.6 | ) | 59.4 | |
Customer relationships | | 12.7 | | 577.2 | | (183.8 | ) | 393.4 | |
Other | | 16.6 | | 15.7 | | (11.3 | ) | 4.4 | |
| | 14.3 | | 808.6 | | (309.6 | ) | 499.0 | |
Non-amortizable trade names | | | | 397.3 | | — | | 397.3 | |
| | | | $ | 1,205.9 | | $ | (309.6 | ) | $ | 896.3 | |
When determining the value of customer relationships for purposes of allocating the purchase price of an acquisition, the Company looks at existing customer contracts of the acquired business to determine if they represent a reliable future source of income and hence, a valuable intangible asset for the Company. The Company determines the fair value of the customer relationships based on the estimated future benefits the Company expects from the acquired customer contracts. In performing its evaluation and estimation of the useful lives of customer relationships, the Company looks to the historical growth rate of revenue of the acquired company’s existing customers as well as the historical attrition rates.
In connection with the valuation of intangible assets, a 40-year life was assigned to the value of the Pierce distribution network ($53.0 million)(net book value of $33.1 million at September 30, 2011). The Company believes Pierce maintains the largest North American fire apparatus distribution network. Pierce has exclusive contracts with each distributor related to the fire apparatus product offerings manufactured by Pierce. The useful life of the Pierce distribution network was based on a historical turnover analysis. Non-compete intangible asset lives are based on terms of the applicable agreements.
Total amortization expense recorded in continuing operations was $62.4$60.8 million, $68.8$60.5 million and $65.5$62.3 million in fiscal 2009, 20082011, 2010 and 2007,2009, respectively. The estimated future amortization expense of purchased intangible assets for the five years succeeding September 30, 20092011 are as follows: 2010 - $61.0 million; 2011 - $60.4 million; 2012 - $60.1$59.0 million; 2013 - $58.3$56.5 million; 2014 - $55.1 million; 2015 - $54.3 million and 20142016 - $56.6$53.7 million.
74
Table of Contents
OSHKOSH CORPORATION
NOTES TO CONSOLIDATED FINANCIAL STATEMENTS
9. Other Long-Term Assets
Other long-term assets consisted of the following (in millions):
| | September 30, | | | September 30, | |
| | 2009 | | 2008 | | | 2011 | | 2010 | |
| | | | | | | | | | |
Customer notes receivable and other investments | | $ | 48.9 | | $ | 38.6 | | | $ | 24.1 | | $ | 32.4 | |
Deferred finance costs | | 29.5 | | 22.4 | | | 21.8 | | 26.9 | |
Long-term finance receivables, less current portion | | 31.2 | | 20.3 | | | 9.4 | | 34.4 | |
Other | | 29.5 | | 24.0 | | | 23.9 | | 23.1 | |
| | 139.1 | | 105.3 | | | 79.2 | | 116.8 | |
Less allowance for doubtful notes receivable | | (6.9 | ) | (1.6 | ) | | (7.6 | ) | (4.0 | ) |
| | $ | 132.2 | | $ | 103.7 | | | $ | 71.6 | | $ | 112.8 | |
Deferred financingfinance costs are amortized using the interest method over the term of the debt. Amortization expense was $5.1 million (including $0.1 million of amortization related to early debt retirement), $28.6 million (including $20.4 million of amortization related to early debt retirement) and $13.4 million (including $5.0 million of amortization related to early debt retirement), $7.2 million (including $0.9 million of amortization related to early debt retirement) and $5.5 million in fiscal 2011, 2010 and 2009, 2008 and 2007, respectively.
73
Table of Contents
OSHKOSH CORPORATION
NOTES TO CONSOLIDATED FINANCIAL STATEMENTS
10. Leases
Certain administrative and production facilities and equipment are leased under long-term agreements. Most leases contain renewal options for varying periods, and certain leases include options to purchase the leased property during or at the end of the lease term. Leases generally require the Company to pay for insurance, taxes and maintenance of the property. Leased capital assets included in net property, plant and equipment, which consist primarily of buildings and improvements, were $2.8$0.1 million and $3.8$2.5 million at September 30, 20092011 and 2008,2010, respectively.
Other facilities and equipment are leased under arrangements that are accounted for as noncancelable operating leases. Total rental expense for property, plant and equipment charged to continuing operations under noncancelable operating leases was $34.8$42.9 million, $34.2$41.1 million and $25.2$34.8 million in fiscal 2011, 2010 and 2009, 2008 and 2007, respectively. In addition, included in cost of sales in fiscal 2010 were charges of $2.9 million related to the idling of a leased facility at JerrDan. As a result of the Company’s plan to put a leased facility back into use, the previously accrued liability for lease termination costs of $2.8 million was reversed to income in the second quarter of fiscal 2011.
Future minimum operating and capital lease payments due under operating leases and the related present value of minimum capital lease payments at September 30, 20092011 were as follows (in millions):
| | Capital | | Operating | | | |
| | Leases | | Leases | | Total | |
| | | | | | | |
2010 | | $ | 0.6 | | $ | 24.4 | | $ | 25.0 | |
2011 | | 0.4 | | 21.7 | | 22.1 | |
2012 | | 0.4 | | 13.9 | | 14.3 | |
2013 | | 0.7 | | 8.2 | | 8.9 | |
2014 | | 0.3 | | 6.3 | | 6.6 | |
Thereafter | | — | | 18.1 | | 18.1 | |
Total minimum lease payments | | 2.4 | | $ | 92.6 | | $ | 95.0 | |
Interest | | (0.3 | ) | | | | |
Present value of net minimum lease payments | | $ | 2.1 | | | | | |
follows: 2012 - $33.1 million; 2013 - $27.1 million; 2014 - $21.0 million; 2015 - $11.2 million; 2016 - $10.1 million; and thereafter - $15.1 million. Minimum rental payments include $1.2 million due annually under variable rate leases.variable-rate leases through January 2013.
75
Table of Contents
OSHKOSH CORPORATION
NOTES TO CONSOLIDATED FINANCIAL STATEMENTS
11. Credit Agreements
The Company was obligated under the following debt instruments (in millions):
| | September 30, | |
| | 2009 | | 2008 | |
| | | | | |
Senior secured facility: | | | | | |
Revolving line of credit | | $ | — | | $ | 47.3 | |
Term loan A | | 117.7 | | 387.5 | |
Term loan B | | 1,902.6 | | 2,314.0 | |
Limited recourse debt from finance receivables monetizations | | — | | 3.9 | |
Other long-term facilities | | 4.0 | | 5.0 | |
| | 2,024.3 | | 2,757.7 | |
Less current portion | | (1.1 | ) | (77.2 | ) |
| | $ | 2,023.2 | | $ | 2,680.5 | |
| | September 30, | |
| | 2011 | | 2010 | |
| | | | | |
Senior Secured Term Loan | | $ | 560.0 | | $ | 650.0 | |
8¼% Senior notes due March 2017 | | 250.0 | | 250.0 | |
8½% Senior notes due March 2020 | | 250.0 | | 250.0 | |
Other long-term facilities | | 0.1 | | 2.1 | |
| | 1,060.1 | | 1,152.1 | |
Less current maturities | | (40.1 | ) | (65.7 | ) |
| | $ | 1,020.0 | | $ | 1,086.4 | |
| | | | | |
Revolving line of credit | | $ | — | | $ | 150.0 | |
Current maturities of long-term debt | | 40.1 | | 65.7 | |
Other short-term facilities | | — | | 0.2 | |
| | $ | 40.1 | | $ | 215.9 | |
74On September 27, 2010, the Company replaced its existing credit agreement with a new senior secured credit agreement with various lenders (the “Credit Agreement”). The Credit Agreement provides for (i) a revolving credit facility (“Revolving Credit Facility”) that matures in October 2015 with an initial maximum aggregate amount of availability of $550 million and (ii) a $650 million term loan (“Term Loan”) facility due in quarterly principal installments of $16.25 million commencing December 31, 2010 with a balloon payment of $341.25 million due at maturity in October 2015. During the fourth quarter of fiscal 2011, the Company prepaid the principal installment under the Term Loan which was originally due December 31, 2011 and $8.75 million of the principal installment which was originally due March 31, 2012. In October 2011, the Company prepaid $40.0 million of current maturities of long-term debt, which represented the remaining principal amount due under the Term Loan during fiscal 2012. At September 30, 2011, outstanding letters of credit of $27.9 million reduced available capacity under the Revolving Credit Facility to $522.1 million.
The Company’s obligations under the Credit Agreement are guaranteed by certain of its domestic subsidiaries, and the Company will guarantee the obligations of certain of its subsidiaries under the Credit Agreement to the extent such subsidiaries borrow directly under the Credit Agreement. Subject to certain exceptions, the Credit Agreement is secured by (i) a first-priority perfected lien and security interests in substantially all of the personal property of the Company, each material subsidiary of the Company and each subsidiary guarantor, (ii) mortgages upon certain real property of the Company and certain of its domestic subsidiaries and (iii) a pledge of the equity of each material subsidiary and each subsidiary guarantor.
The Company must pay (i) an unused commitment fee ranging from 0.40% to 0.50% per annum of the average daily unused portion of the aggregate revolving credit commitments under the Credit Agreement and (ii) a fee ranging from 1.125% to 3.50% per annum of the maximum amount available to be drawn for each letter of credit issued and outstanding under the Credit Agreement.
Borrowings under the Credit Agreement bear interest at a variable rate equal to (i) LIBOR plus a specified margin, which may be adjusted upward or downward depending on whether certain criteria are satisfied, or (ii) for dollar-denominated loans only, the base rate (which is the highest of (a) the administrative agent’s prime rate, (b) the federal funds rate plus 0.50% or (c) the sum of 1% plus one-month LIBOR) plus a specified margin, which may be adjusted upward or downward depending on whether certain criteria are satisfied. At September 30, 2011, the interest spread on the Revolving Credit Facility and Term Loan was 250 basis points. The weighted-average interest rate on borrowings outstanding under the Term Loan at September 30, 2011, prior to consideration of the interest rate swap, was 2.77%.
76
Table of Contents
OSHKOSH CORPORATION
NOTES TO CONSOLIDATED FINANCIAL STATEMENTS
| | September 30, | |
| | 2009 | | 2008 | |
| | | | | |
Current portion of long-term debt | | $ | 1.1 | | $ | 77.2 | |
Other short-term facilities | | 13.9 | | 16.3 | |
| | $ | 15.0 | | $ | 93.5 | |
In December 2006, the Company entered into a syndicated senior secured credit agreement (“Credit Agreement”) with various financial institutions, which consisted of a five-year $550.0 million revolving credit facility (“Revolving Credit Facility”) and two term loan facilities (“Term Loan A” and “Term Loan B,” and collectively, the “Term Loan Facility”). In March 2009, the Company entered into a second amendment (the “Amendment”) to the Credit Agreement to provide relief under its Leverage Ratio (as defined in the Credit Agreement) financial covenant. The Company believed that the Amendment was required to avoid a potential financial covenant violation at the end of its second quarter of fiscal 2009 as a result of lower demand for certain of the Company’s products due to continued weakening in the global economy and tight credit. The Amendment also included an increase in the margin on LIBOR loans to 600 basis points, compared with 150 basis points immediately prior to the Amendment, and a requirement that the Company prepay $14.5 million and $86.0 million of debt related to Term Loan A and Term Loan B, respectively. The Amendment also involved other changes to the Credit Agreement, including placing limitations on capital expenditures, dividends, investments and acquisitions, an increase in the frequency of mandatory prepayments, adding a Senior Secured Leverage Ratio (as defined in the Credit Agreement), and requiring the grant of mortgage liens on certain real estate owned by the Company and certain of its subsidiaries.
The Amendment also added a usage fee equal to an annualized rate of 50 basis points on the aggregate principal amount of all outstanding loans under the Credit Agreement for any day on which the Company has a corporate family rating from Moody’s Investors Service of B3 with “negative” watch or lower or a corporate credit rating from Standard & Poor’s Rating Services of B- with “negative” watch or lower. The Company’s credit ratings are reviewed regularly by these major debt rating agencies. In January 2009, Standard & Poor’s Rating Services lowered the Company’s long-term debt rating from BB- to B and credit watch “negative” citing weaker-than-expected operating results and the Company’s need to seek an amendment of the financial covenants contained in the Credit Agreement. Likewise, in January 2009, Moody’s Investors Service lowered the Company’s long-term debt rating from Ba3 to B2 with ratings under review for possible downgrade pending resolution of the negotiations with its banks, citing expectations of further erosion in the Company’s credit metrics due to the deterioration in several of the Company’s businesses, particularly the access equipment segment. In March 2009, following the Amendment, both Standard & Poor’s Rating Services and Moody’s Investors Service lowered the Company’s long-term debt ratings to “negative” outlook. In August 2009, following the Company’s Common Stock offering and award of the M-ATV contract, Standard & Poor’s Rating Services upgraded the Company’s long-term debt rating to B+ with a “stable” outlook citing improved covenant headroom and good near-term prospects for the Company’s defense segment.
The Company accounted for the Amendment in accordance with ASC Topic 470-50, Debt Modifications and Extinguishments. As the terms of the Credit Agreement both prior to and after the Amendment allowed for the prepayment of the amounts due without a penalty, the Company determined that the debt was callable on the date of the Amendment. As such, the present value of the cash flows both prior to and after the Amendment was not determined to be substantially different. Accordingly, fees of $20.1 million paid by the Company to the parties to the Credit Agreement were capitalized in connection with the Amendment, along with the existing unamortized debt fees, and will be amortized as an adjustment of interest expense over the remaining term of the Credit Agreement using the interest method. Furthermore, in accordance with ASC Topic 470-50, costs incurred with third parties of $0.5 million were expensed as incurred.
Term Loan A required principal payments of $12.5 million, plus interest, due quarterly from December 2009 through September 2011, with a final principal payment of $248.0 million due December 6, 2011. As a result of excess available cash, through September 30, 2009, the Company prepaid all of the quarterly principal payments related to Term Loan A as well as $130.3 million of the final principal payment under Term Loan A. The remaining outstanding balance under Term Loan A of $117.7 million at September 30, 2009 was prepaid in full in October 2009. The outstanding balance under Term Loan B at September 30, 2009 of $1,902.6 million is due December 6, 2013. At September 30, 2009, the Company had no borrowings outstanding under the Revolving Credit Facility, and outstanding letters of credit of $34.1 million reduced available capacity under the Revolving Credit Facility to $515.9 million.
75
Table of Contents
OSHKOSH CORPORATION
NOTES TO CONSOLIDATED FINANCIAL STATEMENTS
Interest rates on borrowings under the Revolving Credit Facility and Term Loan Facility are variable and are equal to the “Base Rate” (which is equal to the higher of a bank’s reference rate and the federal funds rate plus 0.5%, a bank’s “Prime Rate” or the sum of 1.0% plus the “Off-Shore” rate that would be applicable for an interest period of one month beginning on such day) or the “Off-Shore” or “LIBOR Rate” (which is a bank’s inter-bank offered rate for U.S. dollars in off-shore markets) plus a specified margin. The margins on the Revolving Credit Facility and Term Loan A are subject to adjustment, up or down, based on whether certain financial criteria are met. At September 30, 2009, the interest rate spread on the Revolving Credit Facility and Term Loan Facility was 600 basis points. The weighted-average interest rate on borrowings outstanding at September 30, 2009 was 6.60% and 6.42% for Term Loans A and B, respectively.
The fair value of the long-term debt is estimated based upon the market rate of the Company’s debt. At September 30, 2009, the fair values of Term Loans A and B were estimated to be $117.1 million and $1,899.6 million, respectively.
To manage a portion of the Company’s exposure to changes in LIBOR-based interest rates on its variable-rate debt, the Company entered into an amortizing interest rate swap agreement on January 11,in 2007 that effectively fixes the interest payments on a portion of the Company’s variable-rate debt. The swap, which has a termination date of December 6, 2011, effectively fixes the LIBOR-based interest rate on the debt in the amount of the notional amount of the swap at 5.105% plus the applicable spread based on the terms of the Credit Agreement as amended (11.105%(7.605% at September 30, 2009)2011). The notional amount of the swap at September 30, 20092011 was $1.25 billion and reduces to $750 million on December 7, 2009 and $250 million on December 6, 2010.million.
TheA portion of the swap has been designated as a cash flow hedge of 3-month LIBOR-based interest payments. The effective portion of the change in fair value of the derivative will behas been recorded in “Accumulated other comprehensive income (loss) income,” whilein the Consolidated Balance Sheets with any ineffective portion is recorded as an adjustment to interestmiscellaneous expense. At September 30, 2009,2011, a loss of $50.9$2.1 million ($31.31.4 million net of tax), representing the fair value of the interest rate swap, was recorded in “Accumulated other comprehensive income (loss) income..” The differential paid or received on the designated portion of the interest rate swap will be recognized as an adjustment to interest expense when the hedged, forecasted interest is recorded. Net gains or losses related to hedge ineffectiveness on the interest rate swap were insignificant for all periods presented.
Under this swap agreement, the Company will pay the counterparty interest on the notional amount at a fixed rate of 5.105% and the counterparty will pay the Company interest on the notional amount at a variable rate equal to 3-month LIBOR. The 3-month LIBOR rate applicable to this agreement was 0.29%0.37% at September 30, 2009.2011. The notional amounts do not represent amounts exchanged by the parties, and thus are not a measure of exposure of the Company. The amounts exchanged are normally based on the notional amounts and other terms of the swaps. The variable rates are subject to change over time as 3-month LIBOR fluctuates. Neither the Company nor the counterparty is required to collateralize its obligations under these swaps. The Company is exposed to loss if the counterparty defaults. However, as of the date of this filing, the counterparty is a large Aa1 rated global financial institution, and the Company believes that the risk of default is remote.
The Company’s obligations under the Credit Agreement, as amended, are guaranteed by certain of its domestic subsidiaries, and the Company guarantees the obligations of certain of its subsidiaries under the Credit Agreement, as amended, to the extent such subsidiaries borrow directly under the Credit Agreement, as amended. The Credit Agreement, as amended, is also secured by a first-priority, perfected lien and security interests in all of the equity interests of the Company’s active domestic subsidiaries, 65% of the equity interests of certain foreign subsidiaries of the Company and certain real property; subject to customary permitted lien exceptions, substantially all other personal property of the Company and certain subsidiaries; and all proceeds thereof.
The Credit Agreement as amended, contains various restrictions and covenants, including requirements that the Company maintain certain financial ratios at prescribed levels and restrictions on the ability of the Company and certain of its subsidiaries to among other things, consolidate or merge, create liens, incur additional indebtedness, and dispose of assets.assets, consummate acquisitions and make investments in joint ventures and foreign subsidiaries. The Credit Agreement contains the following financial covenants:
· | Leverage Ratio: A maximum leverage ratio (defined as, with certain adjustments, the ratio of the Company’s consolidated indebtedness to consolidated net income before interest, taxes, depreciation, amortization, non-cash charges and certain other items (“EBITDA”)) as of the last day of any fiscal quarter of 4.50 to 1.0. |
· | Interest Coverage Ratio: A minimum interest coverage ratio (defined as, with certain adjustments, the ratio of the Company’s EBITDA to the Company’s consolidated cash interest expense) as of the last day of any fiscal quarter of 2.50 to 1.0. |
· | Senior Secured Leverage Ratio: A maximum senior secured leverage ratio (defined as, with certain adjustments, the ratio of the Company’s consolidated secured indebtedness to the Company’s EBITDA) of the following: |
Fiscal Quarter Ending |
|
|
|
September 30, 2011 | | 3.25 to 1.0 | |
December 31, 2011 through September 30, 2012 | | 3.00 to 1.0 | |
Thereafter | | 2.75 to 1.0 | |
The Company was in compliance with the financial covenants contained in the Credit Agreement as amended, also requiresof September 30, 2011 and expects to be able to meet the financial covenants contained in the Credit Agreement over the next twelve months.
Additionally, with certain exceptions, the Credit Agreement limits the ability of the Company to maintainpay dividends and other distributions. However, so long as no event of default exists under the following financial ratios:Credit Agreement or would result from such payment, the Company may pay dividends and other distributions in an aggregate amount not exceeding the sum of:
(i) | $50 million during any fiscal year; plus |
(ii) | the excess of (a) 25% of the cumulative net income of the Company and its consolidated subsidiaries for all fiscal quarters ending after September 27, 2010, over (b) the cumulative amount of all such dividends and other distributions made in any fiscal year ending after such date that exceed $50 million; plus |
(iii) | for each of the first four fiscal quarters ending after September 27, 2010, $25 million per fiscal quarter, in each case provided that the leverage ratio (as defined) as of the last day of the most recently ended fiscal quarter was less than 2.0 to 1.0; plus |
76
77
Table of Contents
OSHKOSH CORPORATION
NOTES TO CONSOLIDATED FINANCIAL STATEMENTS
·Leverage Ratio: The ratio of Consolidated Indebtedness outstanding at quarter-end to Consolidated Earnings Before Interest, Taxes, Depreciation and Amortization (“EBITDA”) for the most recently ended four fiscal quarters, as such terms are defined in the Credit Agreement, as amended. The Leverage Ratio is not permitted to be greater than the following:
Fiscal Quarters Ending(iv)
|
|
|
|
September 30, 2009
| | 7.25 to 1.0
| |
December 31, 2009
| | 7.00 to 1.0
| |
March 31, 2010
| | 6.75 to 1.0
| |
June 30, 2010 through June 30, 2011
| | 6.50 to 1.0
| |
for the period of four fiscal quarters ending September 30, 2011 through June 30, 2012 | | 5.50and for each period of four fiscal quarters ending thereafter, $100 million during such period, in each case provided that the leverage ratio (as defined) as of the last day of the most recently ended fiscal quarter was less than 2.0 to 1.0
| |
September 30, 2012 through June 30, 2013
| | 4.25 to 1.0
| |
Thereafter
| | 3.75 to 1.0
| 1.0. |
As of September 30, 2009,In March 2010, the Company was in compliance withissued $250.0 million of 8¼% unsecured senior notes due March 1, 2017 and $250.0 million of 8½% unsecured senior notes due March 1, 2020 (collectively, the Leverage Ratio with a ratio of 4.68“Senior Notes”). The Senior Notes were issued pursuant to 1.0.
·Interest Coverage Ratio: The ratio of Consolidated EBITDA for the most recently ended four fiscal quarters to Cash Interest Expense for the most recently ended four fiscal quarters, as such terms are defined in the Credit Agreement, as amended. The Interest Coverage Ratio is not permitted to be less than the following:
Fiscal Quarters Ending
|
|
|
|
September 30, 2009
| | 1.58 to 1.0
| |
December 31, 2009
| | 1.49 to 1.0
| |
March 31, 2010
| | 1.52 to 1.0
| |
June 30, 2010 through December 31, 2010
| | 1.56 to 1.0
| |
March 31, 2011 and June 30, 2011
| | 1.70 to 1.0
| |
September 30, 2011 through June 30, 2012
| | 1.88 to 1.0
| |
September 30, 2012 through June 30, 2013
| | 2.48 to 1.0
| |
Thereafter
| | 2.47 to 1.0
| |
As of September 30, 2009,an indenture (the “Indenture”) among the Company, was in compliance with the Interest Coverage Ratio withsubsidiary guarantors named therein and a ratiotrustee. The Indenture contains customary affirmative and negative covenants. The Company has the option to redeem the Senior Notes due 2017 and Senior Notes due 2020 for a premium after March 1, 2014 and March 1, 2015, respectively. Certain of 2.43 to 1.0.
·Senior Secured Leverage Ratio: The ratio of outstanding Loansthe Company’s subsidiaries fully, unconditionally, jointly and severally guarantee the Company’s obligations under the Credit Agreement, as amended, at quarter-endSenior Notes. See Note 24 of the Notes to Consolidated EBITDAFinancial Statements for separate financial information of the most recently ended four fiscal quarters, as such terms are defined in the Credit Agreement, as amended. The Senior Secured Leverage Ratio is not permitted to be greater than the following:
Fiscal Quarters Ending
|
|
|
|
June 30, 2011
| | 5.00 to 1.0
| |
September 30, 2011 through June 30, 2012
| | 4.50 to 1.0
| |
September 30, 2012 through June 30, 2013
| | 3.25 to 1.0
| |
September 30, 2013
| | 3.00 to 1.0
| |
The Senior Secured Leverage Ratio limitation is not applicable until June 30, 2011.subsidiary guarantors.
The Credit Agreement, as amended, limitsfair value of the amount of dividends, stock repurchases and other types of distributions during any fiscal year in excess of certain limitslong-term debt is estimated based upon the Leverage Ratio as of the end of the fiscal quarter preceding the proposed distribution. When the Leverage Ratio as of the end of a fiscal quarter is greater than 4.0 to 1.0, then no such distribution may be made if, after giving effect to such distribution, the aggregate amount of all such payments made in such fiscal quarter would exceed the sum of $0.01 per outstanding sharemarket rate of the Company’s Common Stock plus $250,000 ordebt. At September 30, 2011, the aggregate amount of all such payments made in the applicable fiscal year would exceed $3.85 million. The Company suspended payment of dividends effective April 2009.
The Company is charged a 0.50% annual commitment fee with respect to any unused commitment under its Revolving Credit Facility and a 5.00% to 6.00% annual fee with respect to commercial letters of credit issued under the Revolving
77
Table of Contents
OSHKOSH CORPORATION
NOTES TO CONSOLIDATED FINANCIAL STATEMENTS
Credit Facility based on the Company’s Leverage Ratio. For performance letters of credit, the annual fee is 50%fair value of the annual fee applicableSenior Notes was estimated to commercial lettersbe $501 million and the fair value of credit.the Term Loan approximated book value.
12. Warranty and Guarantee ArrangementsWarranties
The Company’s products generally carry explicit warranties that extend from six months to five years, based on terms that are generally accepted in the marketplace. Selected components (such as engines, transmissions, tires, etc.) included in the Company’s end products may include manufacturers’ warranties. These manufacturers’ warranties are generally passed on to the end customer of the Company’s products, and the customer would generally deal directly with the component manufacturer. Warranty costs recorded in continuing operations were $48.5$31.1 million, $59.9$83.8 million and $52.3$47.5 million in fiscal 2009, 20082011, 2010 and 2007,2009, respectively.
Changes in the Company’s warranty liability during fiscal 2009 and fiscal 2008 were as follows (in millions):
| | Fiscal Year Ended
September 30, | | | Fiscal Year Ended
September 30, | |
| | 2009 | | 2008 | | | 2011 | | 2010 | |
| | | | | | | | | | |
Balance at beginning of year | | $ | 88.3 | | $ | 88.2 | | | $ | 90.5 | | $ | 72.8 | |
Warranty provisions | | 48.3 | | 71.1 | | | 42.6 | | 83.8 | |
Settlements made | | (55.4 | ) | (67.7 | ) | | (46.8 | ) | (68.2 | ) |
Changes in liability for pre-existing warranties, net | | 0.1 | | (3.2 | ) | | (11.5 | ) | 3.6 | |
Disposition of Geesink | | (8.5 | ) | — | | |
Disposition of business | | | — | | (1.6 | ) |
Foreign currency translation adjustment | | — | | (0.1 | ) | | 0.2 | | 0.1 | |
Balance at end of year | | $ | 72.8 | | $ | 88.3 | | | $ | 75.0 | | $ | 90.5 | |
Provisions for estimated warranty and other related costs are recorded at the time of sale and are periodically adjusted to reflect actual experience. Actual M-ATV warranty claims have been lower than the Company expected on the M-ATV product launch, which resulted in reductions in liabilities for pre-existing warranties in fiscal 2011. Certain warranty and other related claims involve matters of dispute that ultimately are resolved by negotiation, arbitration or litigation. At times, warranty issues arise that are beyond the scope of the Company’s historical experience. For example, accelerated programs to design, test, manufacture and deploy products such as the M-ATV in war-time conditions carry with them an increased level of inherent risk of product or component failure. It is reasonably possible that additional warranty and other related claims could arise from disputes or other matters beyond the scopein excess of amounts accrued; however, any such amounts, while not determinable, would not be expected to have a material adverse effect on the Company’s historical experience.consolidated financial condition, result of operations or cash flows.
78
Table of Contents
OSHKOSH CORPORATION
NOTES TO CONSOLIDATED FINANCIAL STATEMENTS
13.Guarantee Arrangements
In the fire & emergency segment, the Company provides guarantees of certain customers’ obligations under deferred payment contracts and lease payment agreements to third parties. Guarantees provided prior to February 1, 2008 are limited to $1.0 million per year in total. In January 2008, the Company entered into a new guarantee arrangement. Under this arrangement, guarantees are limited to $3.0 million per year for contracts signed after February 1, 2008. These guarantees are mutually exclusive and, until the portfolio under the $1.0 million guarantee is repaid, the Company has exposure of up to $4.0 million per year. Both guarantees are supported by the residual value of the underlying equipment. The Company’s actual losses under these guarantees over the last ten years have been negligible. In accordance with FASB ASC Topic 460, Guarantees, the Company has recorded the fair value of all such guarantees issued after January 1, 2003 as a liability and a reduction of the initial revenue recognized on the sale of equipment. Liabilities accrued since January 1, 2003 for such guarantees for all periods presented were not significant.insignificant.
In the access equipment segment, the Company is party to multiple agreements whereby it guarantees an aggregate of $290.8$141.1 million in indebtedness of others, including $135.3$125.2 million under loss pool agreements. The Company estimated that its maximum loss exposure under loss pool agreements.these contracts was $52.8 million at September 30, 2011. Under the terms of these and various related agreements and upon the occurrence of certain events, the Company generally has the ability to, among other things, to take possession of the underlying collateral. At September 30, 2009 and 2008, the Company had recorded liabilities related to these agreements of $26.7 million and $4.7 million, respectively. If the financial condition of the customers were to deteriorate and result in their inability to make payments, then additional accruals may be required. While the Company does not expect to experience losses under these agreements that are materially in excess of the amounts reserved, it cannot provide any assurance that the financial condition of the third parties will not deteriorate resulting in the customers’third party’s inability to meet their obligations. In the event that this occurs, the Company cannot guarantee that the collateral underlying the agreements will be sufficient to avoid losses materially in excess of the amounts reserved. Any losses under these guarantees would generally be mitigated by the value of any underlying collateral, including financed
78
Table of Contents
OSHKOSH CORPORATION
NOTES TO CONSOLIDATED FINANCIAL STATEMENTS
equipment, and are generally subject to the finance company’s ability to provide the Company clear title to foreclosed equipment and other conditions. During anperiods of economic downturn,weakness, collateral values generally decline and can contribute to higher exposure to losses.
Changes in the Company’s credit guarantee liability were as follows (in millions):
| | Fiscal Year Ended
September 30, | |
| | 2011 | | 2010 | |
| | | | | |
Balance at beginning of year | | $ | 22.8 | | $ | 26.7 | |
Provision for new credit guarantees | | 0.3 | | 0.5 | |
Settlements made | | (3.0 | ) | (0.6 | ) |
Changes for pre-existing guarantees, net | | (12.7 | ) | (2.7 | ) |
Amortization of previous guarantees | | (1.2 | ) | (1.0 | ) |
Foreign currency translation adjustment | | (0.1 | ) | (0.1 | ) |
Balance at end of year | | $ | 6.1 | | $ | 22.8 | |
In the first quarter of fiscal 2011, the Company reached a settlement with a customer that resulted in the customer’s repayment of $28.3 million of loans supported by Company guarantees for which the Company had established specific credit loss reserves. Upon release of the guarantees, the Company reduced previously accrued reserves and increased pre-tax income by $8.1 million.
13.14. Derivative Financial Instruments and Hedging Activities
The Company has used forward foreign currency exchange contracts (“derivatives”) to reduce the exchange rate risk of specific foreign currency denominated transactions. These derivatives typically require the exchange of a foreign currency for U.S. dollars at a fixed rate at a future date. At times, the Company has designated these hedges as either cash flow hedges or fair value hedges under FASB ASC Topic 815,Derivatives and Hedging,, as follows:
79
Table of Contents
OSHKOSH CORPORATION
NOTES TO CONSOLIDATED FINANCIAL STATEMENTS
Fair Value Hedging Strategy — The Company enters into forward foreign exchange contracts to hedge certain firm commitments denominated in foreign currencies, primarily the Euro. The purpose of the Company’s foreign currency hedging activities is to protect the Company from risk that the eventual U.S. dollar-equivalent cash flows from the sale of products to international customers will be adversely affected by changes in the exchange rates.
Cash Flow Hedging Strategy — To protect against an increase in the cost of forecasted purchases of foreign-sourced component parts payable in Euro, the Company has a foreign currency cash flow hedging program. The Company hedges portions of its forecasted purchases denominated in Euro with forward contracts. When the U.S. dollar weakens against the Euro, increased foreign currency payments are offset by gains in the value of the forward contracts. Conversely, when the U.S. dollar strengthens against the Euro, reduced foreign currency payments are offset by losses in the value of the forward contracts.
At September 30, 2009,2011 and 2010, the Company had no forward foreign exchange contracts designated as hedges were insignificant.hedges.
To manage a portion of the Company’s exposure to changes in LIBOR-based interest rates on its variable-rate debt, the Company entered into an amortizing interest rate swap agreement that effectively fixes the interest payments on a portion of the Company’s variable-rate debt. The swap has been designated as a cash flow hedge of 3-month LIBOR-based interest payments and, accordingly, derivative gains or losses are reflected as a component of accumulated other comprehensive income (loss) income and are amortized to interest expense over the respective lives of the borrowings. During the years ended September 30,fiscal 2011, 2010 and 2009, $16.6 million, $41.6 million and 2008, $48.3 million of expense and $23.3 million of expense, respectively, was recorded in the Consolidated Statements of Operations as amortization of interest rate derivative gains and losses. At September 30, 2009, $50.92011, $2.1 million of net unrealized losses remained deferred in “Accumulated other comprehensive income (loss) income..” See Note 11 of the Notes to Consolidated Financial Statements for information regarding the interest rate swap.
The Company has entered into forward foreign currency exchange contracts to create an economic hedge to manage foreign exchange risk exposure associated with non-functional currency denominated payables resulting from global sourcing activities. The Company has not designated these derivative contracts as hedge transactions under ASC Topic 815, and accordingly, the mark-to-market impact of these derivatives is recorded each period in current earnings. The fair value of foreign currency related derivatives is included in the Consolidated Balance Sheets in “Other current assets” and “Other current liabilities.” At September 30, 2009,2011, the U.S. dollar equivalent of these outstanding forward foreign exchange contracts totaled $81.5$154.5 million in notional amounts, including $69.6$69.1 million in contracts to sell Euro, $65.0 million in contracts to sell Australian dollars, $18.2 million in contracts to sell U.K. pounds sterling and buy Euro with the remaining contracts covering a variety of foreign currencies.
79
Table of Contents
OSHKOSH CORPORATION
NOTES TO CONSOLIDATED FINANCIAL STATEMENTS
Fair Market Value of Financial Instruments — The fair values of all open derivative instruments in the Consolidated Balance Sheets were as follows (in millions):
| | September 30, 2009 | | September 30, 2008 | | |
| | Other | | Other | | Other | | Other | | Other | | Other | | |
| | Current | | Current | | Long-term | | Current | | Current | | Long-term | | | September 30, 2011 | | September 30, 2010 | |
| | Assets | | Liabilities | | Liabilities | | Assets | | Liabilities | | Liabilities | | | Other
Current
Assets | | Other
Current
Liabilities | | Other
Long-term
Liabilities | | Other
Current
Assets | | Other
Current
Liabilities | | Other
Long-term
Liabilities | |
Designated as hedging instruments: | | | | | | | | | | | | | | | | | | | | | | | | | | |
Interest rate contracts | | $ | — | | $ | 36.6 | | $ | 14.3 | | $ | — | | $ | 26.7 | | $ | 17.7 | | | $ | — | | $ | 2.1 | | $ | — | | $ | — | | $ | 15.6 | | $ | 2.8 | |
Foreign exchange contracts | | — | | — | | — | | — | | — | | — | | |
| | | | | | | | | | | | | | | | | | | | | | | | | | |
Not designated as hedging instruments: | | | | | | | | | | | | | | | | | | | | | | | | | | |
Foreign exchange contracts | | 0.1 | | 0.3 | | — | | 3.5 | | 3.4 | | — | | | 0.8 | | 0.2 | | — | | 0.3 | | 0.8 | | — | |
Total derivatives | | $ | 0.1 | | $ | 36.9 | | $ | 14.3 | | $ | 3.5 | | $ | 30.1 | | $ | 17.7 | | |
| | | $ | 0.8 | | $ | 2.3 | | $ | — | | $ | 0.3 | | $ | 16.4 | | $ | 2.8 | |
80
Table of Contents
OSHKOSH CORPORATION
NOTES TO CONSOLIDATED FINANCIAL STATEMENTS
The pre-tax effects of derivative instruments on the Consolidated Statements of Operations consisted of the following (in millions):
|
|
|
| Fiscal Year
|
|
|
|
|
| Ended
|
|
|
| Classification of
|
| September 30,
|
|
|
| Gains (Losses)
|
| 2009
|
|
Cash flow hedges:
| | | | | |
Reclassified from other comprehensive income (effective portion):
| | | | | |
Interest rate contracts
| | Interest expense
| | $
| (48.3
| )
|
| | | | | |
Reclassified from other comprehensive income (effective portion):
| | | | | |
Foreign exchange contracts
| | Cost of sales
| | (0.5
| )
|
| | | | | |
Recognized directly in income (ineffective portion):
| | | | | |
Foreign exchange contracts
| | Miscellaneous, net
| | (0.7
| )
|
| | | | | |
Not designated as hedges:
| | | | | |
Foreign exchange contracts
| | Miscellaneous, net
| | 16.9
| |
Total
| | | | $
| (32.6
| )
|
| | | | Fiscal Year Ended | |
| | Classification of | | September 30, | |
| | Gains (Losses) | | 2011 | | 2010 | |
Cash flow hedges: | | | | | | | |
Reclassified from other comprehensive income (effective portion): | | | | | | | |
Interest rate contracts | | Interest expense | | $ | (16.6 | ) | $ | (40.7 | ) |
Foreign exchange contracts | | Cost of sales | | — | | (0.3 | ) |
| | | | | | | |
Not designated as hedges: | | | | | | | |
Interest rate contracts | | Interest expense | | — | | (0.9 | ) |
Foreign exchange contracts | | Miscellaneous, net | | 2.0 | | 2.8 | |
| | | | $ | (14.6 | ) | $ | (39.1 | ) |
14.15. Fair Value Measurement
FASB ASC Topic 820, Fair Value Measurements and Disclosures, defines fair value as the price that would be received to sell an asset or paid to transfer a liability (i.e., exit price) in an orderly transaction between market participants at the measurement date. FASB ASC Topic 820 requires disclosures that categorize assets and liabilities measured at fair value into one of three different levels depending on the assumptions (i.e., inputs) used in the valuation. Level 1 provides the most reliable measure of fair value, while Level 3 generally requires significant management judgment. The three levels are defined as follows:
Level 1: Unadjusted quoted prices in active markets for identical assets or liabilities.
Level 2: Observable inputs other than quoted prices other than those included in Level 1, such as quoted prices for similar assets or liabilities in active markets or quoted prices for identical assets or liabilities in inactive markets.
80
Table of Contents
OSHKOSH CORPORATION
NOTES TO CONSOLIDATED FINANCIAL STATEMENTS
Level 3: Unobservable inputs reflecting management’s own assumptions about the inputs used in pricing the asset or liability.
As of September 30, 2009,2011, the fair values of the Company’s financial assets and liabilities were as follows (in millions):
| | Level 1 | | Level 2 | | Level 3 | | Total | | | Level 1 | | Level 2 | | Level 3 | | Total | |
Assets: | | | | | | | | | | | | | | | | | | |
Foreign currency exchange derivatives (a) | | $ | — | | $ | 0.1 | | $ | — | | $ | 0.1 | | | $ | — | | $ | 0.8 | | $ | — | | $ | 0.8 | |
Total assets at fair value | | $ | — | | $ | 0.1 | | $ | — | | $ | 0.1 | | |
| | | | | | | | | | | | | | | | | | |
Liabilities: | | | | | | | | | | | | | | | | | | |
Foreign currency exchange derivatives (a) | | $ | — | | $ | 0.3 | | $ | — | | $ | 0.3 | | | $ | — | | $ | 0.2 | | $ | — | | $ | 0.2 | |
Interest rate swaps (b) | | — | | 50.9 | | — | | 50.9 | | | — | | 2.1 | | — | | 2.1 | |
Total liabilities at fair value | | $ | — | | $ | 51.2 | | $ | — | | $ | 51.2 | | |
| | | $ | — | | $ | 2.3 | | $ | — | | $ | 2.3 | |
(a) Based on observable market transactions of forward currency prices.
(b) Based on observable market transactions of forward LIBOR rates.
Items Measured at Fair Value on a Nonrecurring Basis
In addition to items that are measured at fair value on a recurring basis, the Company also has assets and liabilities in its balance sheet that are measured at fair value on a nonrecurring basis. As these assets and liabilities are not measured at fair value on a recurring basis, they are not included in the tables above. Assets and liabilities that are measured at fair value on a
81
Table of Contents
15.OSHKOSH CORPORATION
NOTES TO CONSOLIDATED FINANCIAL STATEMENTS
nonrecurring basis include long-lived assets, including investments in affiliates, which are written down to fair value as a result of impairment (see Note 7 of the Notes to Consolidated Financial Statements for impairments of long-lived assets and Note 8 of the Notes to Consolidated Financial Statements for impairments of intangible assets). The Company has determined that the fair value measurements related to each of these assets rely primarily on Company-specific inputs and the Company’s assumptions about the use of the assets, as observable inputs are not available. As such, the Company has determined that each of these fair value measurements reside within Level 3 of the fair value hierarchy.
16. Oshkosh Corporation Shareholders’ Equity
On August 12, 2009, the Company completed a public equity offering of 14,950,000 shares of Common Stock, which included the exercise of the underwriters’ over-allotment option for 1,950,000 shares of Common Stock, at a price of $25.00 per share. The Company paid $15.1 million in underwriting discounts and commissions and approximately $0.6 million of offering expenses. The Company used the net proceeds from the offering of approximately $358.1 million to repay debt under the Credit Agreement.
On February 1, 1999, the Board of Directors of the Company adopted a shareholder rights plan and declared a rights dividend of one-sixth of one Preferred Share Purchase Right (“Right”) for each share of Common Stock outstanding on February 8, 1999, and provided that one-sixth of one Right would be issued with each share of Common Stock, thereafter issued. The Rights are exercisable only if a person or group acquires 15% or more of the Common Stock or announces a tender offer for 15% or more of the Common Stock. Each Right entitles the holder thereof to purchase from the Company one one-hundredth share of the Company’s Series A Junior Participating Preferred Stock at an initial exercise price of $145 per one one-hundredth of a share (subject to adjustment), or upon the occurrence of certain events, Common Stock or common stock of an acquiring company having a market value equivalent to two times the exercise price. Subject to certain conditions, the Rights are redeemable by the Board of Directors for $.01 per Right and are exchangeable for shares of Common Stock. The Board of Directors is also authorized to reduce the 15% thresholds referred to above to not less than 10%. The Rights have no voting power and expired on February 1, 2009.debt.
In July 1995, the Company authorized the buyback of up to 6,000,000 shares of the Company’s Common Stock. As of September 30, 20092011 and 2008,2010, the Company had purchased 2,769,210 shares of its Common Stock at an aggregate cost of $6.6 million. The Company is restricted by its Credit Agreement from buying back shares in certain situations. See Note 11 of the Notes to Consolidated Financial Statements for information regarding these restrictions. The Company does not expect to buy back any shares under this authorization in fiscal 2010.
16.17. Stock Options, Nonvested Stock, Performance Shares and Common Stock Reserved
In February 2009, the Company’s shareholders approved the 2009 Incentive Stock and Awards Plan, as amended (the “2009 Stock Plan”). The 2009 Stock Plan replaced the 2004 Incentive Stock and Awards Plan, as amended (the “2004 Stock Plan”) and 1990 Incentive Stock Plan, as amended (the “1990 Stock Plan”). While no new awards will be granted under the 2004 Stock Plan and 1990 Stock Plan, awards previously made under these two plans that remained outstanding as of the approval date of the 2009 Stock Plan will remain outstanding and continue to be governed by the provisions of those plans.
81
Table of Contents
OSHKOSH CORPORATION
NOTES TO CONSOLIDATED FINANCIAL STATEMENTS
Under the 2009 Stock Plan, officers, directors, including non-employee directors, and employees of the Company may be granted stock options, stock appreciation rights (“SAR”), performance shares, performance units, shares of Common Stock, restricted stock, restricted stock units (“RSU”) or other stock-based awards. The 2009 Stock Plan provides for the granting of options to purchase shares of the Company’s Common Stock at not less than the fair market value of such shares on the date of grant. Stock options granted under the 2009 Stock Plan become exercisable in equal installments over a three-year period, beginning with the first anniversary of the date of grant of the option, unless a shorter or longer duration is established by the Human Resources Committee of the Board of Directors at the time of the option grant. Stock options terminate not more than seven years from the date of grant. Except for performance shares and performance units, vesting is based solely on continued service as an employee of the Company and generally vest upon retirement. The maximum number of shares of stock reserved for all awards under the 2009 Stock Plan is 4,000,000. At September 30, 2009,2011, the Company had reserved 8,483,5765,863,898 shares of Common Stock to provide for the exercise of outstanding stock options and the issuance of Common Stock under incentive compensation awards, including awards issued prior to the effective date of the 2009 Stock Plan.
The Company recognizes compensation expense for stock option, nonvested stock and performance share awards over the requisite service period for vesting of the award, or to an employee’s eligible retirement date, if earlier and applicable. Total stock-based compensation expense included in the Company’s Consolidated Statements of Operations for fiscal 2011, 2010 and 2009 2008was $15.5 million ($9.8 million net of tax), $14.7 million ($9.3 million net of tax) and 2007 was $10.9 million ($6.9 million net of tax), $15.0 million ($9.7 million netrespectively.
82
Table of tax) and $11.7 million ($8.4 million net of tax), respectively.Contents
OSHKOSH CORPORATION
NOTES TO CONSOLIDATED FINANCIAL STATEMENTS
Information related to the Company’s equity-based compensation plans in effect as of September 30, 20092011 is as follows:
| | Number of Securities | | | | Number of | | | Number of Securities | | | | Number of | |
| | to be Issued Upon | | Weighted-Average | | Securities Remaining | | | to be Issued Upon | | Weighted-Average | | Securities Remaining | |
| | Exercise of Outstanding | | Exercise Price of | | Available for Future | | | Exercise of Outstanding | | Exercise Price of | | Available for Future | |
| | Options or Vesting of | | Outstanding | | Issuance Under Equity | | | Options or Vesting of | | Outstanding | | Issuance Under Equity | |
Plan Category | | Performance Share Awards | | Options | | Compensation Plans | | | Performance Share Awards | | Options | | Compensation Plans | |
| | | | | | | | | | | | | | |
Equity compensation plans approved by security holders | | 5,795,109 | | $ | 28.03 | | 2,688,467 | | | 5,518,314 | | $ | 30.72 | | 345,584 | |
Equity compensation plans not approved by security holders | | — | | n/a | | — | | | — | | n/a | | — | |
Total | | 5,795,109 | | $ | 28.03 | | 2,688,467 | | |
| | | 5,518,314 | | $ | 30.72 | | 345,584 | |
Stock Options — For fiscal 2009, 20082011, 2010 and 2007,2009, the Company recorded $10.0$11.4 million, $11.8$12.4 million and $7.1$10.0 million, respectively, of stock-based compensation expense in selling, general and administrative expense in the accompanying Consolidated Statements of Operations associated with outstanding stock options.
A summary of the Company’s stock option activity for the fiscal years ended September 30, 2009, 20082011, 2010 and 20072009 is as follows:
| | Fiscal Year Ended September 30, | |
| | 2009 | | 2008 | | 2007 | |
| | | | Weighted- | | | | Weighted- | | | | Weighted- | |
| | | | Average | | | | Average | | | | Average | |
| | | | Exercise | | | | Exercise | | | | Exercise | |
| | Options | | Price | | Options | | Price | | Options | | Price | |
| | | | | | | | | | | | | |
Options outstanding, beginning of the year | | 4,324,372 | | $ | 26.90 | | 3,141,994 | | $ | 32.71 | | 2,937,594 | | $ | 25.30 | |
Options granted | | 1,200,000 | | 30.82 | | 1,565,450 | | 12.75 | | 640,750 | | 54.60 | |
Options forfeited | | (138,934 | ) | 23.59 | | (37,734 | ) | 52.06 | | (3,000 | ) | 19.75 | |
Options exercised | | (55,329 | ) | 11.25 | | (345,338 | ) | 12.88 | | (433,350 | ) | 14.92 | |
Options outstanding, end of the year | | 5,330,109 | | $ | 28.03 | | 4,324,372 | | $ | 26.90 | | 3,141,994 | | $ | 32.71 | |
Options exercisable, end of the year | | 2,930,946 | | $ | 30.46 | | 2,234,658 | | $ | 30.56 | | 2,094,472 | | $ | 23.27 | |
82
Table of Contents
OSHKOSH CORPORATION
NOTES TO CONSOLIDATED FINANCIAL STATEMENTS
| | Fiscal Year Ended September 30, | |
| | 2011 | | 2010 | | 2009 | |
| | | | Weighted- | | | | Weighted- | | | | Weighted- | |
| | | | Average | | | | Average | | | | Average | |
| | | | Exercise | | | | Exercise | | | | Exercise | |
| | Options | | Price | | Options | | Price | | Options | | Price | |
| | | | | | | | | | | | | |
Options outstanding, beginning of year | | 5,158,370 | | $ | 30.32 | | 5,330,109 | | $ | 28.03 | | 4,324,372 | | $ | 26.90 | |
Options granted | | 411,575 | | 20.90 | | 954,350 | | 28.96 | | 1,200,000 | | 30.82 | |
Options forfeited | | (173,009 | ) | 27.22 | | (39,836 | ) | 27.46 | | (138,934 | ) | 23.59 | |
Options expired | | (118,199 | ) | 47.46 | | (9,499 | ) | 54.12 | | — | | — | |
Options exercised | | (504,023 | ) | 15.94 | | (1,076,754 | ) | 17.66 | | (55,329 | ) | 11.25 | |
Options outstanding, end of year | | 4,774,714 | | $ | 30.72 | | 5,158,370 | | $ | 30.32 | | 5,330,109 | | $ | 28.03 | |
Options exercisable, end of year | | 3,478,310 | | $ | 32.13 | | 2,955,909 | | $ | 33.49 | | 2,930,946 | | $ | 30.46 | |
The Company uses the Black-Scholes valuation model to value stock options utilizing the following weighted-average assumptions:
| | Fiscal Year Ended September 30, | | | Fiscal Year Ended September 30, | |
Options Granted During | | 2009 | | 2008 | | 2007 | | | 2011 | | 2010 | | 2009 | |
| | | | | | | | | | | | | | |
Assumptions: | | | | | | | | | | | | | | |
Risk-free interest rate | | 2.34% | | 2.64% | | 4.23% | | | 0.95% | | 1.45% | | 2.34% | |
Expected volatility | | 61.19% | | 43.85% | | 32.02% | | | 63.88% | | 61.98% | | 61.19% | |
Expected dividend yield | | 0.02% | | 1.77% | | 0.75% | | | 0.00% | | 0.00% | | 0.02% | |
Expected term (in years) | | 5.23% | | 5.46% | | 5.44% | | | 5.23 | | 5.28 | | 5.23 | |
The Company used the Company’sits historical stock prices as the basis for the Company’s volatility assumption. The assumed risk-free interest rates were based on U.S. Treasury rates in effect at the time of grant. The expected option term represents the period of time that the options granted are expected to be outstanding and was based on historical experience. The weighted-average per share fair values for stock option grants during fiscal 2011, 2010 and 2009 2008were $11.42, $15.69 and 2007 were $16.67, $4.64 and $18.78, respectively.
As of September 30, 2009,2011, the Company had $16.7$9.6 million of unrecognized compensation expense related to outstanding stock options, which will be recognized over a weighted-average period of 2.82.2 years.
83
Table of Contents
OSHKOSH CORPORATION
NOTES TO CONSOLIDATED FINANCIAL STATEMENTS
Stock options outstanding as of September 30, 20092011 were as follows (in millions, except share and per share amounts):
| | | | | | | | | Weighted-Average | | | | | | | | | | | | | Weighted-Average | | | | | |
| | | | | | | | | Remaining | | | | Aggregate | | | | | | | | | Remaining | | | | Aggregate | |
| | | | | | | Number | | Contractual | | Weighted-Average | | Intrinsic | | | | | | | Number | | Contractual | | Weighted-Average | | Intrinsic | |
Price Range | Price Range | | Outstanding | | Life (in years) | | Exercise Price | | Value | | Price Range | | Outstanding | | Life (in years) | | Exercise Price | | Value | |
| | | | | | | | | | | | | | | | | | | | | | | | | | | |
$ | 5.19 | | - | | $ | 7.95 | | 94,400 | | 5.9 | | $ | 7.06 | | $ | 2.3 | | 5.19 | - | | $ | 7.95 | | 27,467 | | 7.4 | | $ | 7.28 | | $ | 0.2 | |
$ | 11.00 | | - | | $ | 19.75 | | 2,349,171 | | 6.9 | | 14.11 | | 39.5 | | 12.04 | - | | $ | 19.75 | | 1,415,948 | | 6.2 | | 14.65 | | 3.3 | |
$ | 28.27 | | - | | $ | 36.95 | | 1,496,267 | | 6.5 | | 31.37 | | 0.8 | | 28.27 | - | | $ | 38.93 | | 2,059,394 | | 5.2 | | 30.59 | | — | |
$ | 39.91 | | - | | $ | 59.58 | | 1,390,271 | | 7.1 | | 49.38 | | — | | 39.91 | - | | $ | 54.63 | | 1,271,905 | | 5.1 | | 49.32 | | — | |
| | | | | | | 5,330,109 | | 6.8 | | 28.03 | | $ | 42.6 | | | | | | | 4,774,714 | | 5.5 | | $ | 30.72 | | $ | 3.5 | |
|
Stock options exercisable as of September 30, 20092011 were as follows (in millions, except share and per share amounts):
| | | | | | | | | Weighted-Average | | | | | | | | | | | | | Weighted-Average | | | | | |
| | | | | | | | | Remaining | | | | Aggregate | | | | | | | | | Remaining | | | | Aggregate | |
| | | | | | | Number | | Contractual | | Weighted-Average | | Intrinsic | | | | | | | Number | | Contractual | | Weighted-Average | | Intrinsic | |
Price Range | Price Range | | Exercisable | | Life (in years) | | Exercise Price | | Value | | Price Range | | Exercisable | | Life (in years) | | Exercise Price | | Value | |
| | | | | | | | | | | | | | | | | | | | | | | | | | | |
$ | 5.19 | | - | | $ | 7.95 | | 36,000 | | 0.3 | | $ | 7.25 | | $ | 0.9 | | 5.19 | - | | $ | 7.95 | | 14,731 | | 7.3 | | $ | 7.95 | | $ | 0.1 | |
$ | 11.00 | | - | | $ | 19.75 | | 1,358,798 | | 5.4 | | 15.62 | | 20.8 | | 12.04 | - | | $ | 19.75 | | 1,047,948 | | 5.9 | | 13.03 | | 3.3 | |
$ | 28.27 | | - | | $ | 36.95 | | 357,267 | | 4.8 | | 29.07 | | 0.8 | | 28.27 | - | | $ | 38.93 | | 1,143,726 | | 4.8 | | 30.81 | | — | |
$ | 39.91 | | - | | $ | 59.58 | | 1,178,881 | | 7.0 | | 48.69 | | — | | 39.91 | - | | $ | 54.63 | | 1,271,905 | | 5.1 | | 49.32 | | — | |
| | | | | | | 2,930,946 | | 5.9 | | 30.46 | | $ | 22.5 | | | | | | | 3,478,310 | | 5.3 | | $ | 32.13 | | $ | 3.4 | |
|
The aggregate intrinsic values in the tables above represent the total pre-tax intrinsic value (difference between the Company’s closing stock price on the last trading day of fiscal 20092011 and the exercise price, multiplied by the number of in-the-money options) that would have been received by the option holders had all option holders exercised their options on September 30, 2009.2011. This amount changes based on the fair market value of the Company’s Common Stock. TotalThe total intrinsic value of options exercised for fiscal 2011, 2010 and 2009 2008was $9.6 million, $22.8 million and 2007 was $0.7 million, $9.0 million and $17.3 million, respectively.
83
Table of Contents
OSHKOSH CORPORATION
NOTES TO CONSOLIDATED FINANCIAL STATEMENTS
Net cash proceeds from the exercise of stock options were $0.3$8.0 million, $3.5$19.0 million and $6.5$0.6 million for fiscal 2009, 20082011, 2010 and 2007,2009, respectively. The actual income tax benefit realized totaled $0.3 million, $3.5 million, $8.4 million and $6.7$0.3 million for those same periods.
Nonvested Stock Awards — Compensation expense related to nonvested stock awards of $0.3$3.0 million, $2.6$0.9 million and $4.6$0.3 million in fiscal 2009, 20082011, 2010 and 2007,2009, respectively, was recorded in selling, general and administrative expense in the accompanying Consolidated Statements of Operations. As of September 30, 2011, the Company had $4.1 million of unrecognized compensation expense related to nonvested stock awards, which will be recognized over a weighted-average period of 2.6 years.
84
Table of Contents
OSHKOSH CORPORATION
NOTES TO CONSOLIDATED FINANCIAL STATEMENTS
A summary of the Company’s nonvested stock activity for the three years ended September 30, 20092011 is as follows:
| | Fiscal Year Ended September 30, | | | Fiscal Year Ended September 30, | |
| | 2009 | | 2008 | | 2007 | | | 2011 | | 2010 | | 2009 | |
| | | | Weighted- | | | | Weighted- | | | | Weighted- | | | | | Weighted- | | | | Weighted- | | | | Weighted- | |
| | Number | | Average | | Number | | Average | | Number | | Average | | | | | Average | | | | Average | | | | Average | |
| | of | | Grant Date | | of | | Grant Date | | of | | Grant Date | | | Number of | | Grant Date | | Number of | | Grant Date | | Number of | | Grant Date | |
| | Shares | | Fair Value | | Shares | | Fair Value | | Shares | | Fair Value | | | Shares | | Fair Value | | Shares | | Fair Value | | Shares | | Fair Value | |
| | | | | | | | | | | | | | | | | | | | | | | | | | |
Nonvested, beginning of the year | | 63,816 | | $ | 51.91 | | 407,210 | | $ | 25.78 | | 438,796 | | $ | 24.43 | | |
Nonvested, beginning of year | | | 128,907 | | $ | 30.22 | | 2,935 | | $ | 53.40 | | 63,816 | | $ | 51.91 | |
Granted | | 11,000 | | 7.95 | | 11,825 | | 41.47 | | 55,825 | | 54.14 | | | 166,412 | | 21.99 | | 141,682 | | 30.93 | | 11,000 | | 7.95 | |
Forfeited | | (542 | ) | 54.85 | | (16,035 | ) | 54.30 | | — | | — | | | (5,000 | ) | 28.73 | | — | | — | | (542 | ) | 54.85 | |
Vested | | (71,339 | ) | 45.04 | | (339,184 | ) | 20.06 | | (87,411 | ) | 37.13 | | | (61,704 | ) | 32.12 | | (15,710 | ) | 40.91 | | (71,339 | ) | 45.04 | |
Nonvested, end of the year | | 2,935 | | $ | 53.40 | | 63,816 | | $ | 51.91 | | 407,210 | | $ | 25.78 | | |
Nonvested, end of year | | | 228,615 | | $ | 23.75 | | 128,907 | | $ | 30.22 | | 2,935 | | $ | 53.40 | |
The total fair value of shares vested during fiscal 2011, 2010 and 2009 2008 and 2007 was $1.0$1.5 million, $4.7$0.6 million and $4.9$1.0 million, respectively.
Performance Share Awards— In fiscal 2009, 20082011, 2010 and 2007,2009, the Company granted certain executives awards for an aggregate of 134,500, 50,100144,000, 75,000 and 50,500134,500 performance shares, respectively, that vest at the end of the third fiscal year following the grant date. Executives earn performance shares only if the Company’s total shareholder return over the three years compares favorably to that of a comparator group of companies. As of September 30, 2011, 371,800 performance shares remain outstanding. Potential payouts range from zero to 200 percent of the target awards.
The grant date fair values of the 2009 performance share awards were estimated using a Monte Carlo simulation model utilizing the following weighted-average assumptions:
| | Fiscal Year Ended September 30, | | | Fiscal Year Ended September 30, | |
Performance Shares Granted During | | 2009 | | 2008 | | 2007 | | | 2011 | | 2010 | | 2009 | |
| | | | | | | | | | | | | | |
Assumptions: | | | | | | | | | | | | | | |
Risk-free interest rate | | 1.48 | % | 2.08 | % | 4.95 | % | | 0.29% | | 0.73% | | 1.48% | |
Expected volatility | | 77.70 | % | 35.53 | % | 27.97 | % | | 76.98% | | 79.86% | | 77.70% | |
Expected term (in years) | | 3.00 | | 3.00 | | 3.00 | | | 3.00 | | 3.00 | | 3.00 | |
The Company used the Company’sits historical stock prices as the basis for the Company’s volatility assumption. The assumed risk-free rates were based on U.S. Treasury rates in effect at the time of grant. The expected term is based on the vesting period. The weighted-average fair value for performance share awards granted during fiscal 2011, 2010 and 2009 2008was $9.75, $13.88 and 2007 was $17.26 $7.04 and $35.12 per award, respectively. Compensation expense of $0.6$1.1 million, $0.6$1.4 million and $0.1$0.6 million related to performance share awards was recorded in fiscal 2009, 20082011, 2010 and 2007,2009, respectively, in selling, general and administrative expense in the accompanying Consolidated Statements of Operations.
84Stock Appreciation Rights —In fiscal 2011, the Company granted 441,000 cash-settled SARs to employees. Each SAR award represents the right to receive cash equal to the excess of the per share price of the Company’s Common Stock on the date that a participant exercises such right over the grant date price of the Company’s Common Stock. Compensation cost for SARs is remeasured at each reporting period based on the estimated fair value on the date of grant using the Black Scholes option-pricing model, utilizing assumptions similar to stock option awards and is recognized as an expense over the requisite service period. SARs are subsequently remeasured at each interim reporting period based on a revised Black Scholes value. Upon vesting, the fair value of outstanding SARs will be equal to its intrinsic value.
Compensation expense related to SAR awards of $0.2 million in fiscal 2011 was recorded in selling, general and administrative expense in the accompanying Consolidated Statements of Operations. As of September 30, 2011, the Company had $3.5 million of unrecognized compensation expense related to SAR awards, which will be recognized over a weighted-average period of 1.5 years.
85
Table of Contents
OSHKOSH CORPORATION
NOTES TO CONSOLIDATED FINANCIAL STATEMENTS
17.Cash-Settled Restricted Stock Units (Loss) Earnings Per Share
The following table sets forth—In fiscal 2011, the computationCompany granted 269,000 cash-settled RSUs to employees. Each RSU award provides recipients the right to receive cash equal to the value of basica share of the Company’s Common Stock at predetermined vesting dates. Compensation cost for RSUs is remeasured at each reporting period and diluted weighted-average shares usedis recognized as an expense over the requisite service period. Compensation expense related to RSUs of $0.1 million in fiscal 2011 was recorded in selling, general and administrative expense in the denominatoraccompanying Consolidated Statements of Operations. As of September 30, 2011, the per share calculations:
| | Fiscal Year Ended September 30, | |
| | 2009 | | 2008 | | 2007 | |
| | | | | | | |
Basic weighted average shares outstanding | | 76,473,930 | | 74,007,989 | | 73,562,307 | |
Effect of dilutive stock options and incentive compensation awards | | — | | 828,207 | | 1,268,524 | |
Diluted weighted average shares outstanding | | 76,473,930 | | 74,836,196 | | 74,830,831 | |
OptionsCompany had $4.1 million of unrecognized compensation expense related to purchase 4,327,116 sharesRSUs, which will be recognized over a weighted-average period of Common Stock and 190,175 nonvested shares were outstanding during fiscal 2009, but were excluded from the computation of diluted (loss) earnings per share because the net loss for the period caused all potentially dilutive shares to be anti-dilutive. Options to purchase 1,446,598 and 749,750 shares of Common Stock were outstanding in fiscal 2008 and 2007, respectively, but were not included in the computation of diluted (loss) earnings per share because the exercise price of the options was greater than the average market price of the shares of Common Stock and therefore would have been anti-dilutive.1.5 years.
18. Restructuring and Other Charges
As part of the Company’s actions to rationalize and optimize its global manufacturing footprint and in an effort to streamline operations, the Company announced in September 2010 that it was closing two JerrDan manufacturing facilities and relocating towing and recovery equipment production to other underutilized access equipment segment facilities. The Company largely completed these actions in the fourth quarter of fiscal 2010 and the first quarter of fiscal 2011. As a result of the Company’s plan to put a leased facility back into use, the previously accrued liability for lease termination costs of $2.8 million was reversed to income in the second quarter of fiscal 2011.
In October 2010, the Company announced that its fire & emergency segment would be closing its Oshkosh Specialty Vehicles manufacturing facilities and integrating those operations into existing operations in Florida. The Company largely completed this action in the first quarter of fiscal 2011.
In January 2011, the Company initiated a plan to address continued weak market conditions in its access equipment segment in Europe. The plan included the consolidation of certain facilities and other cost reduction initiatives resulting in reductions in its workforce in Europe. In connection with this plan, the Company recorded statutorily or contractually required termination benefit costs in the first quarter of fiscal 2011. During the second quarter of fiscal 2011, the Company reached an agreement with the works councils on certain details of the plan, including the number of employees that will ultimately receive severance. As a result of employees voluntarily leaving the Company, the accrual was reduced throughout the remainder of fiscal 2011.
In January 2011, the Company announced that its fire & emergency segment would close its Medtec Ambulance Corporation manufacturing facilities and integrate those operations into existing operations in Florida. The Company largely completed this action in the third quarter of fiscal 2011.
In June 2011, the Company announced that its defense segment was closing its Oakes, North Dakota fabrication facility and consolidating operations into other existing Oshkosh facilities. Operations at Oakes concluded in the fourth quarter of fiscal 2011.
86
Table of Contents
OSHKOSH CORPORATION
NOTES TO CONSOLIDATED FINANCIAL STATEMENTS
Pre-tax restructuring charges for fiscal years ended September 30 were as follows (in millions):
| | | | Selling, | | | |
| | Cost of | | General and | | | |
| | Sales | | Administrative | | Total | |
Fiscal 2011: | | | | | | | |
Defense | | $ | 3.7 | | $ | — | | $ | 3.7 | |
Access equipment | | 1.0 | | 0.7 | | 1.7 | |
Fire & emergency | | 0.3 | | 1.6 | | 1.9 | |
Commercial | | 0.1 | | 0.3 | | 0.4 | |
| | $ | 5.1 | | $ | 2.6 | | $ | 7.7 | |
Fiscal 2010: | | | | | | | |
Defense | | $ | 0.5 | | $ | — | | $ | 0.5 | |
Access equipment | | 8.3 | | 0.3 | | 8.6 | |
Fire & emergency | | 3.8 | | — | | 3.8 | |
Commercial | | — | | — | | — | |
| | $ | 12.6 | | $ | 0.3 | | $ | 12.9 | |
Changes in the Company’s restructuring reserves, included within “Other current liabilities” in the Consolidated Balance Sheets, were as follows (in millions):
| | Employee | | Property, | | | | | |
| | Severance and | | Plant and | | | | | |
| | Termination | | Equipment | | | | | |
| | Benefits | | Impairment | | Other | | Total | |
| | | | | | | | | |
Original reserve | | $ | 5.3 | | $ | — | | $ | — | | $ | 5.3 | |
Restructuring provisions | | 1.2 | | 8.5 | | 3.2 | | 12.9 | |
Utilized - cash | | (4.5 | ) | — | | — | | (4.5 | ) |
Utilized - noncash | | — | | (8.5 | ) | — | | (8.5 | ) |
Currency | | (0.4 | ) | — | | — | | (0.4 | ) |
Balance at September 30, 2010 | | 1.6 | | — | | 3.2 | | 4.8 | |
Restructuring provisions | | 6.8 | | 3.4 | | (2.5 | ) | 7.7 | |
Utilized - cash | | (5.4 | ) | — | | (0.7 | ) | (6.1 | ) |
Utilized - noncash | | — | | (3.4 | ) | — | | (3.4 | ) |
Currency | | 0.6 | | — | | — | | 0.6 | |
Balance at September 30, 2011 | | $ | 3.6 | | $ | — | | $ | — | | $ | 3.6 | |
19. Employee Benefit Plans
Pension Plans - The Company — Oshkosh and certain of its subsidiaries sponsor multiple defined benefit pension plans covering certain Oshkosh, JLG and Pierce employees. The benefits provided are based primarily on average compensation, years of service and date of birth. Hourly plans are generally based uponon years of service and a benefit dollar multiplier. The Company periodically amends the hourly plans, changing the benefit dollar multipliers. Plan amendments in fiscal 2011 to the U.S. pension plan include the impact of an increase in the monthly benefit multiplier agreed to under a new five-year contract with the United Auto Workers union in October 2011.
87
Table of Contents
OSHKOSH CORPORATION
NOTES TO CONSOLIDATED FINANCIAL STATEMENTS
Postretirement Plans - The Company — Oshkosh and certain of its subsidiaries sponsor multiple postretirement benefit plans covering Oshkosh, JLG and Kewaunee retirees and their spouses. The plans generally provide health benefits based on years of service and date of birth. These plans are unfunded.
The changechanges in benefit obligations and plan assets as well as the funded status of the Company’s defined benefit pension plans and postretirement benefit plans were as follows (in millions):
| | Pension Benefits | | Postretirement | | | Pension Benefits | | Postretirement | |
| | U.S. Plans | | Non-U.S. Plans | | Health and Other | | | U.S. Plans | | Non-U.S. Plans | | Health and Other | |
| | 2009 | | 2008 | | 2009 | | 2008 | | 2009 | | 2008 | | | 2011 | | 2010 | | 2011 | | 2010 | | 2011 | | 2010 | |
| | | | | | | | | | | | | | |
Accumulated benefit obligation | | | $ | 308.1 | | $ | 246.2 | | $ | 13.6 | | $ | 13.8 | | $ | 77.7 | | $ | 64.8 | |
| | | | | | | | | | | | | | |
Change in benefit obligation | | | | | | | | | | | | | | | | | | | | | | | | | | |
Benefit obligation at October 1 | | $ | 189.4 | | $ | 169.5 | | $ | 20.3 | | $ | 25.1 | | $ | 36.7 | | $ | 31.6 | | | $ | 269.7 | | $ | 227.3 | | $ | 13.9 | | $ | 11.7 | | $ | 64.8 | | $ | 55.0 | |
Disposition | | — | | — | | (9.6 | ) | — | | (0.4 | ) | — | | |
Service cost | | 10.3 | | 11.1 | | 0.7 | | 1.5 | | 2.0 | | 1.9 | | | 16.0 | | 13.0 | | 0.6 | | 0.6 | | 4.5 | | 4.1 | |
Interest cost | | 11.1 | | 10.1 | | 1.0 | | 1.4 | | 2.2 | | 1.8 | | | 13.2 | | 11.8 | | 0.7 | | 0.6 | | 3.0 | | 2.8 | |
Actuarial loss (gain) | | 21.8 | | 0.2 | | 2.9 | | (4.4 | ) | 15.9 | | 3.5 | | | 34.5 | | 18.7 | | (1.3 | ) | 1.4 | | 6.5 | | 3.9 | |
Participant contributions | | — | | — | | 0.1 | | 0.4 | | — | | — | | | — | | — | | 0.1 | | 0.1 | | — | | — | |
Plan amendments | | 3.3 | | 0.9 | | — | | — | | — | | — | | | 10.9 | | 3.0 | | — | | — | | — | | — | |
Curtailments | | 0.9 | | 4.0 | | — | | — | | — | | — | | | — | | 0.6 | | — | | — | | — | | — | |
Benefits paid | | (9.5 | ) | (6.4 | ) | (0.2 | ) | (0.9 | ) | (1.4 | ) | (2.1 | ) | | (5.4 | ) | (4.7 | ) | (0.2 | ) | (0.4 | ) | (1.1 | ) | (1.0 | ) |
Currency translation adjustments | | — | | — | | (3.5 | ) | (2.8 | ) | — | | — | | | — | | — | | (0.1 | ) | (0.1 | ) | — | | — | |
Benefit obligation at September 30 | | $ | 227.3 | | $ | 189.4 | | $ | 11.7 | | $ | 20.3 | | $ | 55.0 | | $ | 36.7 | | | $ | 338.9 | | $ | 269.7 | | $ | 13.7 | | $ | 13.9 | | $ | 77.7 | | $ | 64.8 | |
| | | | | | | | | | | | | | |
Change in plan assets | | | | | | | | | | | | | | |
Fair value of plan assets at October 1 | | | $ | 176.7 | | $ | 137.5 | | $ | 15.4 | | $ | 10.3 | | $ | — | | $ | — | |
Actual return on plan assets | | | 0.8 | | 13.5 | | 0.7 | | 1.2 | | — | | — | |
Company contributions | | | 25.5 | | 30.4 | | 0.4 | | 4.3 | | 1.1 | | 1.0 | |
Participant contributions | | | — | | — | | 0.1 | | 0.1 | | — | | — | |
Benefits paid | | | (5.4 | ) | (4.7 | ) | (0.2 | ) | (0.4 | ) | (1.1 | ) | (1.0 | ) |
Currency translation adjustments | | | — | | — | | (0.1 | ) | (0.1 | ) | — | | — | |
Fair value of plan assets at September 30 | | | $ | 197.6 | | $ | 176.7 | | $ | 16.3 | | $ | 15.4 | | $ | — | | $ | — | |
Funded status of plan - (under) over funded | | | $ | (141.3 | ) | $ | (93.0 | ) | $ | 2.6 | | $ | 1.5 | | $ | (77.7 | ) | $ | (64.8 | ) |
| | | | | | | | | | | | | | |
Recognized in consolidated balance sheet at September 30 | | | | | | | | | | | | | | |
Prepaid benefit cost (long-term asset) | | | $ | — | | $ | — | | $ | 2.6 | | $ | 1.5 | | $ | — | | $ | — | |
Accrued benefit liability (current liability) | | | (5.2 | ) | (0.4 | ) | — | | — | | (2.8 | ) | (2.4 | ) |
Accrued benefit liability (long-term liability) | | | (136.1 | ) | (92.6 | ) | — | | — | | (74.9 | ) | (62.4 | ) |
| | | $ | (141.3 | ) | $ | (93.0 | ) | $ | 2.6 | | $ | 1.5 | | $ | (77.7 | ) | $ | (64.8 | ) |
| | | | | | | | | | | | | | |
Recognized in accumulated other comprehensive income (loss) as of September 30 (net of taxes) | | | | | | | | | | | | | | |
Net actuarial (loss) gain | | | $ | (96.4 | ) | $ | (71.0 | ) | $ | 0.4 | | $ | (0.3 | ) | $ | (18.5 | ) | $ | (15.1 | ) |
Prior service cost | | | (16.2 | ) | (10.5 | ) | — | | — | | — | | — | |
| | | $ | (112.6 | ) | $ | (81.5 | ) | $ | 0.4 | | $ | (0.3 | ) | $ | (18.5 | ) | $ | (15.1 | ) |
| | | | | | | | | | | | | | |
Weighted-average assumptions as of September 30 | | | | | | | | | | | | | | |
Discount rate | | | 4.70 | % | 4.75 | % | 5.20 | % | 5.10 | % | 4.45 | % | 4.75 | % |
Expected return on plan assets | | | 7.00 | % | 7.75 | % | 5.80 | % | 6.50 | % | n/a | | n/a | |
Rate of compensation increase | | | 3.69 | % | 3.81 | % | 4.20 | % | 4.20 | % | n/a | | n/a | |
85
88Table of Contents
OSHKOSH CORPORATION
NOTES TO CONSOLIDATED FINANCIAL STATEMENTS
| | Pension Benefits | | Postretirement | |
| | U.S. Plans | | Non-U.S. Plans | | Health and Other | |
| | 2009 | | 2008 | | 2009 | | 2008 | | 2009 | | 2008 | |
Change in plan assets | | | | | | | | | | | | | |
Fair value of plan assets at October 1 | | $ | 129.5 | | $ | 153.7 | | $ | 20.4 | | $ | 23.0 | | $ | — | | $ | — | |
Disposition | | — | | — | | (9.0 | ) | — | | — | | — | |
Actual return on plan assets | | 1.7 | | (20.9 | ) | 0.9 | | (2.5 | ) | — | | — | |
Company contributions | | 15.8 | | 3.1 | | 1.6 | | 3.1 | | 1.4 | | 2.1 | |
Participant contributions | | — | | — | | 0.1 | | 0.4 | | — | | — | |
Benefits paid | | (9.5 | ) | (6.4 | ) | (0.2 | ) | (0.9 | ) | (1.4 | ) | (2.1 | ) |
Currency translation adjustments | | — | | — | | (3.5 | ) | (2.7 | ) | — | | — | |
Fair value of plan assets at September 30 | | $ | 137.5 | | $ | 129.5 | | $ | 10.3 | | $ | 20.4 | | $ | — | | $ | — | |
Funded status of plan - (under) over funded | | $ | (89.8 | ) | $ | (59.9 | ) | $ | (1.4 | ) | $ | 0.1 | | $ | (55.0 | ) | $ | (36.7 | ) |
| | | | | | | | | | | | | |
Recognized in consolidated balance sheet at September 30 | | | | | | | | | | | | | |
Prepaid benefit cost (long-term asset) | | $ | — | | $ | — | | $ | — | | $ | 0.7 | | $ | — | | $ | — | |
Accrued benefit liability (current liability) | | (0.5 | ) | (6.0 | ) | — | | — | | (2.0 | ) | (2.5 | ) |
Accrued benefit liability (long-term liability) | | (89.3 | ) | (53.9 | ) | (1.4 | ) | (0.6 | ) | (53.0 | ) | (34.2 | ) |
| | $ | (89.8 | ) | $ | (59.9 | ) | $ | (1.4 | ) | $ | 0.1 | | $ | (55.0 | ) | $ | (36.7 | ) |
| | | | | | | | | | | | | |
Recognized in accumulated other comprehensive (loss) income as of September 30 (net of taxes) | | | | | | | | | | | | | |
Net actuarial loss (gain) | | $ | 62.7 | | $ | 44.9 | | $ | (0.4 | ) | $ | (3.4 | ) | $ | 12.8 | | $ | 3.0 | |
Prior service cost | | 9.2 | | 8.0 | | — | | — | | — | | — | |
| | $ | 71.9 | | $ | 52.9 | | $ | (0.4 | ) | $ | (3.4 | ) | $ | 12.8 | | $ | 3.0 | |
| | | | | | | | | | | | | |
Weighted-average assumptions as of September 30 | | | | | | | | | | | | | |
Discount rate | | 5.25 | % | 6.00 | % | 5.50 | % | 7.00 | % | 5.25 | % | 6.00 | % |
Expected return on plan assets | | 7.75 | % | 7.75 | % | 6.50 | % | 6.00 | % | n/a | | n/a | |
Rate of compensation increase | | 4.12 | % | 4.20 | % | 4.30 | % | 4.40 | % | n/a | | n/a | |
The accumulated benefit obligation for all defined benefit pension plans was $271.2 million and $228.1 million at September 30, 2009 and 2008, respectively.
As a result of a dramatic decrease in the equity markets in the fourth quarter of fiscal 2008, the number of the Company’s pension benefit plans with accumulated benefit obligations greater than plan assets increased. Pension benefit plans with accumulated benefit obligations in excess of plan assets consisted of the following (in millions):
| | September 30, | |
| | U.S. Plans | | Non-U.S. Plans | |
| | 2009 | | 2008 | | 2009 | | 2008 | |
| | | | | | | | | |
Projected benefit obligation | | $ | 227.3 | | $ | 189.4 | | $ | 11.7 | | $ | 8.8 | |
Accumulated benefit obligation | | 204.5 | | 171.3 | | 11.7 | | 8.7 | |
Fair value of plan assets | | 137.5 | | 129.5 | | 10.3 | | 8.3 | |
| | | | | | | | | | | | | |
86
Table of Contents
OSHKOSH CORPORATION
NOTES TO CONSOLIDATED FINANCIAL STATEMENTS
Pension benefit plans with accumulated benefit obligations in excess of plan assets consisted of the following as of September 30 (in millions):
| | U.S. Plans | | Non-U.S. Plans | |
| | 2011 | | 2010 | | 2011 | | 2010 | |
| | | | | | | | | |
Projected benefit obligation | | $ | 338.9 | | $ | 269.7 | | $ | — | | $ | — | |
Accumulated benefit obligation | | 308.1 | | 246.2 | | — | | — | |
Fair value of plan assets | | 197.6 | | 176.7 | | — | | — | |
| | | | | | | | | | | | | |
The components of net periodic benefit cost for fiscal years ended September 30 were as follows (in millions):
| | Pension Benefits | | Postretirement | | | Pension Benefits | | Postretirement | |
| | U.S. Plans | | Non-U.S. Plans | | Health and Other | | | U.S. Plans | | Non-U.S. Plans | | Health and Other | |
| | 2009 | | 2008 | | 2007 | | 2009 | | 2008 | | 2007 | | 2009 | | 2008 | | 2007 | | | 2011 | | 2010 | | 2009 | | 2011 | | 2010 | | 2009 | | 2011 | | 2010 | | 2009 | |
Components of net periodic benefit cost | | | | | | | | | | | | | | | | | | | | | | | | | | | | | | | | | | | | | | |
Service cost | | $ | 10.3 | | $ | 11.1 | | $ | 9.9 | | $ | 0.4 | | $ | 0.9 | | $ | 0.6 | | $ | 2.0 | | $ | 1.9 | | $ | 1.7 | | | $ | 17.4 | | $ | 15.4 | | $ | 10.3 | | $ | 0.6 | | $ | 0.6 | | $ | 0.4 | | $ | 4.5 | | $ | 4.1 | | $ | 2.0 | |
Interest cost | | 11.1 | | 10.1 | | 9.1 | | 0.5 | | 0.7 | | 0.5 | | 2.2 | | 1.8 | | 1.8 | | | 13.2 | | 11.8 | | 11.1 | | 0.7 | | 0.6 | | 0.5 | | 3.0 | | 2.8 | | 2.2 | |
Expected return on plan assets | | (11.2 | ) | (12.0 | ) | (11.5 | ) | (0.5 | ) | (0.6 | ) | (0.4 | ) | — | | — | | — | | | (14.9 | ) | (12.3 | ) | (11.2 | ) | (1.0 | ) | (0.7 | ) | (0.5 | ) | — | | — | | — | |
Amortization of prior service cost | | 1.3 | | 1.3 | | 1.2 | | — | | — | | — | | — | | — | | — | | | 1.9 | | 2.1 | | 1.3 | | — | | — | | — | | — | | — | | — | |
Curtailment | | 0.9 | | 4.0 | | — | | — | | — | | — | | — | | — | | — | | | 1.5 | | 0.6 | | 0.9 | | — | | — | | — | | — | | — | | — | |
Amortization of net actuarial loss (gain) | | 2.5 | | 2.0 | | 2.7 | | (0.1 | ) | (0.1 | ) | — | | — | | 3.8 | | 0.4 | | | 5.6 | | 4.1 | | 2.5 | | — | | — | | (0.1 | ) | 1.1 | | 0.9 | | — | |
Net periodic benefit cost | | $ | 14.9 | | $ | 16.5 | | $ | 11.4 | | $ | 0.3 | | $ | 0.9 | | $ | 0.7 | | $ | 4.2 | | $ | 7.5 | | $ | 3.9 | | | $ | 24.7 | | $ | 21.7 | | $ | 14.9 | | $ | 0.3 | | $ | 0.5 | | $ | 0.3 | | $ | 8.6 | | $ | 7.8 | | $ | 4.2 | |
| | | | | | | | | | | | | | | | | | | | | | | | | | | | | | | | | | | | | | |
Other changes in plan assets and benefit obligation recognized in other comprehensive income | | | | | | | | | | | | | | | | | | | | | | | | | | | | | | | | | | | | | | |
Net actuarial loss (gain) | | $ | 32.3 | | $ | 20.0 | | $ | 26.8 | | $ | 2.1 | | $ | (0.3 | ) | $ | (3.3 | ) | $ | 15.9 | | $ | — | | $ | 3.3 | | | $ | 47.2 | | $ | 15.6 | | $ | 32.3 | | $ | (1.0 | ) | $ | 1.0 | | $ | 2.1 | | $ | 6.5 | | $ | 3.9 | | $ | 15.9 | |
Prior service costs | | 3.3 | | 1.1 | | 8.3 | | — | | — | | — | | — | | — | | — | | |
Prior service cost | | | 10.9 | | 3.0 | | 3.3 | | — | | — | | — | | — | | — | | — | |
Amortization of prior service cost | | (1.3 | ) | (1.3 | ) | — | | — | | — | | — | | — | | — | | — | | | (1.9 | ) | (2.0 | ) | (1.3 | ) | — | | — | | — | | — | | — | | — | |
Amortization of net actuarial (gain) loss | | (2.5 | ) | (2.0 | ) | — | | 0.1 | | 0.2 | | — | | (0.1 | ) | (0.3 | ) | — | | | (7.1 | ) | (4.7 | ) | (2.5 | ) | — | | — | | 0.1 | | (1.1 | ) | (0.9 | ) | (0.1 | ) |
| | $ | 31.8 | | $ | 17.8 | | $ | 35.1 | | $ | 2.2 | | $ | (0.1 | ) | $ | (3.3 | ) | $ | 15.8 | | $ | (0.3 | ) | $ | 3.3 | | | $ | 49.1 | | $ | 11.9 | | $ | 31.8 | | $ | (1.0 | ) | $ | 1.0 | | $ | 2.2 | | $ | 5.4 | | $ | 3.0 | | $ | 15.8 | |
| | | | | | | | | | | | | | | | | | | | | | | | | | | | | | | | | | | | | | |
Weighted-average assumptions as of September 30 | | | | | | | | | | | | | | | | | | | | |
Weighted-average assumptions | | | | | | | | | | | | | | | | | | | | |
Discount rate | | 6.00 | % | 6.00 | % | 5.76 | % | 7.00 | % | 5.90 | % | 5.00 | % | 6.00 | % | 6.00 | % | 5.75 | % | | 4.75 | % | 5.25 | % | 6.00 | % | 5.10 | % | 5.50 | % | 7.00 | % | 4.75 | % | 5.25 | % | 6.00 | % |
Expected return on plan assets | | 7.75 | % | 8.00 | % | 8.25 | % | 6.00 | % | 6.20 | % | 6.00 | % | n/a | | n/a | | n/a | | | 7.75 | % | 7.75 | % | 7.75 | % | 6.50 | % | 6.50 | % | 6.00 | % | n/a | | n/a | | n/a | |
Rate of compensation increase | | 4.20 | % | 4.39 | % | 4.57 | % | 4.40 | % | 4.20 | % | 4.20 | % | n/a | | n/a | | n/a | | | 3.93 | % | 4.29 | % | 4.20 | % | 4.20 | % | 4.30 | % | 4.40 | % | n/a | | n/a | | n/a | |
Included in accumulated other comprehensive income (loss) income at September 30, 20092011 are prior service costs of $1.5$2.3 million ($0.91.5 million net of tax) and unrecognized net actuarial losses of $4.2$7.3 million ($2.64.6 million net of tax) expected to be recognized in pension and Supplemental Employee Retirement Plan (“SERP”)supplemental employee retirement plan net periodic benefit costs during the fiscal year ended September 30, 2010.2012.
The assumed health care cost trend rate used in measuring the accumulated postretirement benefit obligation for the Company was 9.0% in fiscal 2009,2011, declining to 5.5% in fiscal 2016.2018. If the health care cost trend rate was increased by 1%,100 basis points, the accumulated postretirement benefit obligation at September 30, 20092011 would increase by $6.6$10.4 million and net periodic postretirement benefit cost for fiscal 20092011 would increase by $1.2$1.9 million. A corresponding decrease of 1%100 basis points would decrease the accumulated postretirement benefit obligation at September 30, 20092011 by $5.5$8.6 million and net periodic postretirement benefit cost for fiscal 20092011 would decrease by $1.0$1.6 million.
The Company’s Board of Directors has appointed an Investment Committee (“Committee”) to manage the investment of the Company’s pension plan assets. The Committee has established and operates under an Investment Policy. The Committee determines the asset allocation and target ranges based upon periodic asset/liability studies and capital market projections. The Committee retains external investment managers to invest the assets and an advisor to monitor the performance of the investment managers. The Investment Policy prohibits certain investment transactions, such as commodity contracts, margin transactions, short selling and investments in Company securities, unless the Committee gives prior approval.
8789
Table of Contents
OSHKOSH CORPORATION
NOTES TO CONSOLIDATED FINANCIAL STATEMENTS
The weighted-average of the Company’s and its subsidiaries’ pension plan asset allocations and target allocations at September 30, 2009 and 2008, by asset category, were as follows:
| | Target % | | 2009 | | 2008 | | | Target % | | 2011 | | 2010 | |
Asset Category | | | | | | | | | | | | | | |
Fixed income | | 30% - 40% | | 47 | % | 45 | % | | 30% - 40% | | 43 | % | 46 | % |
Large-cap growth | | 25% - 35% | | 25 | % | 24 | % | | 25% - 35% | | 30 | % | 26 | % |
Large-cap value | | 5% - 15% | | 8 | % | 9 | % | | 5% - 15% | | 9 | % | 8 | % |
Mid-cap value | | 5% - 15% | | 10 | % | 11 | % | | 5% - 15% | | 8 | % | 10 | % |
Small-cap value | | 5% - 15% | | 10 | % | 11 | % | | 5% - 15% | | 10 | % | 10 | % |
Venture capital | | 0% - 5% | | 0 | % | 0 | % | | 0% - 5% | | 0 | % | 0 | % |
| | | | 100 | % | 100 | % | | | | 100 | % | 100 | % |
| | Target % | | 2009 | | 2008 | | | Target % | | 2011 | | 2010 | |
Asset Category | | | | | | | | | | | | | | |
Fixed income | | | 0% | | 3 | % | 0 | % |
Government bonds | | | 20% | | 21 | % | 10 | % |
Corporate bonds | | | 15% | | 16 | % | 8 | % |
UK equities | | 25% | | 39 | % | 29 | % | | 25% | | 27 | % | 40 | % |
Non-UK equities | | 25% | | 42 | % | 29 | % | | 35% | | 28 | % | 42 | % |
Government bonds | | 35% | | 10 | % | 27 | % | |
Corporate bonds | | 15% | | 9 | % | 15 | % | |
UK real estate | | | 5% | | 5 | % | 0 | % |
| | | | 100 | % | 100 | % | | | | 100 | % | 100 | % |
The plans’ investment strategy is based on an expectation that, over time, equity securities will provide higher total returns than debt securities. The plans primarily minimize the risk of large losses through diversification of investments by asset class, by investing in different styles of investment management within the classes and by using a number of different investment managers. The Committee monitors the asset allocation and investment performance monthly, with a more comprehensive quarterly review with its advisor and annual reviews with each investment manager.
The plans’ expected return on assets is based on management’s and the Committee’s expectations of long-term average rates of return to be achieved by the plans’ investments. These expectations are based on the plans’ historical returns and expected returns for the asset classes in which the plans are invested.
The fair value of plan assets by major category and level within the fair value hierarchy was as follows (in millions):
| | | | Significant | | | | | |
| | Quoted Prices | | Other | | Significant | | | |
| | for Identical | | Observable | | Unobservable | | | |
| | Assets | | Inputs | | Inputs | | | |
| | (Level 1) | | (Level 2) | | (Level 3) | | Total | |
| | | |
September 30, 2011: | | | | | | | | | |
Common stocks | | | | | | | | | |
U.S. companies | | $ | 104.2 | | $ | — | | $ | — | | $ | 104.2 | |
International companies | | — | | 14.6 | | — | | 14.6 | |
Government and agency bonds | | 3.8 | | 35.6 | | — | | 39.4 | |
Municipal bonds | | — | | 0.1 | | — | | 0.1 | |
Corporate bonds and notes | | — | | 43.8 | | — | | 43.8 | |
Money market funds | | 11.7 | | — | | — | | 11.7 | |
Venture capital closely held limited partnership | | — | | — | | 0.1 | | 0.1 | |
| | $ | 119.7 | | $ | 94.1 | | $ | 0.1 | | $ | 213.9 | |
| | | | | | | | | |
September 30, 2010: | | | | | | | | | |
Common stocks | | | | | | | | | |
U.S. companies | | $ | 90.5 | | $ | — | | $ | — | | $ | 90.5 | |
International companies | | — | | 15.1 | | — | | 15.1 | |
Government and agency bonds | | 13.1 | | 18.7 | | — | | 31.8 | |
Municipal bonds | | — | | 0.1 | | — | | 0.1 | |
Corporate bonds and notes | | — | | 25.8 | | — | | 25.8 | |
Money market funds | | 28.7 | | — | | — | | 28.7 | |
Venture capital closely held limited partnership | | — | | — | | 0.1 | | 0.1 | |
| | $ | 132.3 | | $ | 59.7 | | $ | 0.1 | | $ | 192.1 | |
90
Table of Contents
OSHKOSH CORPORATION
NOTES TO CONSOLIDATED FINANCIAL STATEMENTS
The change in the fair value of the Master Pension Trust’s Level 3 investment assets during fiscal 2011 was not significant.
The Company’s policy is to fund the pension plans in amounts that comply with contribution limits imposed by law. The Company expects to contribute approximately $10.0 million to $20.0$40.0 million to its pension plans and an additional $2.5$3.0 million to its postretirement benefit plans in fiscal 2010.2012. However, based on returns on the plans’ investments and the Company’s cash flows, the Company may contribute more than these ranges in fiscal 20102012 to reduce the underfunded status of certain plans.
The Company’s estimated future benefit payments under Company sponsored plans were as follows (in millions):
| | | | | | | | Other | | | | | | | | | Other | |
Fiscal Year Ending | | Pension Benefits | | Postretirement | | | Pension Benefits | | Postretirement | |
September 30, | | U.S. Plans | | Non-U.S. Plans | | Non-Qualified | | Benefits | | | U.S. Plans | | Non-U.S. Plans | | Non-Qualified | | Benefits | |
| | | | | | | | | | | | | | | | | | |
2010 | | $ | 5.0 | | $ | 0.1 | | $ | 0.5 | | $ | 2.0 | | |
2011 | | 5.7 | | 0.1 | | 0.4 | | 2.4 | | |
2012 | | 6.4 | | 0.2 | | 0.4 | | 2.7 | | | $ | 6.0 | | $ | 0.2 | | $ | 5.2 | | $ | 2.8 | |
2013 | | 7.1 | | 0.2 | | 1.2 | | 2.7 | | | 6.8 | | 0.2 | | 1.3 | | 3.1 | |
2014 | | 7.9 | | 0.2 | | 1.5 | | 2.9 | | | 7.6 | | 0.2 | | 1.3 | | 2.9 | |
2015-2019 | | 55.4 | | 2.0 | | 9.8 | | 20.5 | | |
2015 | | | 8.5 | | 0.2 | | 1.3 | | 3.4 | |
2016 | | | 9.7 | | 0.2 | | 1.3 | | 4.1 | |
2017-2021 | | | 71.6 | | 1.2 | | 9.2 | | 31.3 | |
|
401(k) Plans - The Company has defined contribution 401(k) plans covering substantially all domestic employees. The plans allow employees to defer 2% to 19%100% of their income on a pre-tax basis. Each employee who elects to participate is eligible to receive Company matching contributions which are based on employee contributions to the plans, subject to certain limitations. Amounts expensed for Company matching and discretionary contributions were $18.8$10.6 million and $13.7$5.1 million in 2008fiscal 2011 and 2007,2010, respectively. The Company recognized income of $1.0 million in fiscal 2009 as actual payments under the discretionary portion of the plan were less than amounts accrued in the previous year and as a result of the Company’s discontinuation of matching contributions in March 2009 for most employees. In April 2010, the Company reinstituted matching contributions for most employees.
8820. Income Taxes
Pre-tax income (loss) from continuing operations was taxed in the following jurisdictions (in millions):
| | Fiscal Year Ended September 30, | |
| | 2011 | | 2010 | | 2009 | |
| | | | | | | |
Domestic | | $ | 416.9 | | $ | 1,252.7 | | $ | (925.3 | ) |
Foreign | | (0.4 | ) | (41.2 | ) | (252.9 | ) |
| | $ | 416.5 | | $ | 1,211.5 | | $ | (1,178.2 | ) |
91
Table of Contents
OSHKOSH CORPORATION
NOTES TO CONSOLIDATED FINANCIAL STATEMENTS
19.Income Taxes
Pre-tax (loss) income from continuing operations was taxed in the following jurisdictions (in millions):
| | Fiscal Year Ended September 30, | |
| | 2009 | | 2008 | | 2007 | |
| | | | | | | |
Domestic | | $ | (925.3 | ) | $ | 274.0 | | $ | 354.2 | |
Foreign | | (266.2 | ) | 126.7 | | 61.2 | |
| | $ | (1,191.5 | ) | $ | 400.7 | | $ | 415.4 | |
Significant components of the provision for (benefit from) provision for income taxes were as follows (in millions):
| | Fiscal Year Ended September 30, | | | Fiscal Year Ended September 30, | |
| | 2009 | | 2008 | | 2007 | | | 2011 | | 2010 | | 2009 | |
Allocated to (Loss) Income From Continuing Operations Before Equity in Earnings of Unconsolidated Affiliates and Minority Interest | | | | | | | | |
Allocated to Income (Loss) From Continuing Operations Before Equity in Earnings (Losses) of Unconsolidated Affiliates | | | | | | | | |
Current: | | | | | | | | | | | | | | |
Federal | | $ | 31.1 | | $ | 104.3 | | $ | 99.1 | | | $ | 149.2 | | $ | 463.4 | | $ | 37.8 | |
Foreign | | 1.9 | | 18.1 | | 12.3 | | | 0.7 | | 7.8 | | 1.9 | |
State | | 1.4 | | 6.1 | | 11.0 | | | 3.7 | | 13.8 | | 1.7 | |
Total current | | 34.4 | | 128.5 | | 122.4 | | | 153.6 | | 485.0 | | 41.4 | |
Deferred: | | | | | | | | | | | | | | |
Federal | | (40.0 | ) | (1.7 | ) | 16.0 | | | (14.2 | ) | (59.5 | ) | (40.0 | ) |
Foreign | | (12.3 | ) | (5.9 | ) | (2.5 | ) | | 4.6 | | (9.4 | ) | (12.2 | ) |
State | | (1.8 | ) | (0.1 | ) | 1.8 | | | (0.4 | ) | (1.8 | ) | (1.8 | ) |
Total deferred | | (54.1 | ) | (7.7 | ) | 15.3 | | | (10.0 | ) | (70.7 | ) | (54.0 | ) |
| | $ | (19.7 | ) | $ | 120.8 | | $ | 137.7 | | | $ | 143.6 | | $ | 414.3 | | $ | (12.6 | ) |
| | | | | | | | | | | | | | |
Allocated to Other Comprehensive (Loss) Income | | | | | | | | |
Allocated to Other Comprehensive Income (Loss) | | | | | | | | |
Deferred federal, state and foreign | | $ | (21.9 | ) | $ | (21.2 | ) | $ | (25.3 | ) | | $ | (14.5 | ) | $ | 10.5 | | $ | (21.9 | ) |
The reconciliation of income tax computed at the U.S. federal statutory tax rates to income tax expense was:
| | Fiscal Year Ended September 30, | | | Fiscal Year Ended September 30, | |
| | 2009 | | 2008 | | 2007 | | | 2011 | | 2010 | | 2009 | |
Effective Rate Reconciliation | | | | | | | | | | | | | | |
U.S. federal tax / benefit rate | | 35.0 | % | 35.0 | % | 35.0 | % | | 35.0 | % | 35.0 | % | 35.0 | % |
Non-deductible intangible assets impairment charges | | (33.3 | ) | — | | — | | |
Non-deductible intangible asset impairment charges | | | 0.1 | | 0.3 | | (33.1 | ) |
State income taxes, net | | (0.3 | ) | 1.5 | | 1.4 | | | 0.8 | | 1.0 | | (0.3 | ) |
Foreign taxes | | (0.1 | ) | (1.1 | ) | (1.2 | ) | | (0.6 | ) | (0.1 | ) | (0.4 | ) |
Tax audit settlements | | | — | | (1.3 | ) | — | |
European tax incentive | | (1.5 | ) | (5.2 | ) | (1.8 | ) | | (0.9 | ) | 0.6 | | (1.5 | ) |
Worthless stock deduction | | 1.5 | | — | | — | | | — | | — | | 0.9 | |
Valuation allowance | | (0.3 | ) | 0.5 | | 0.7 | | | 1.4 | | 0.3 | | (0.2 | ) |
Tax credits | | 0.3 | | (0.1 | ) | (1.7 | ) | |
Domestic tax credits | | | (1.5 | ) | (0.1 | ) | 0.3 | |
Manufacturing deduction | | 0.2 | | (1.3 | ) | (0.8 | ) | | (1.1 | ) | (2.0 | ) | 0.2 | |
Other, net | | 0.2 | | 0.8 | | 1.5 | | | 1.3 | | 0.5 | | 0.2 | |
| | 1.7 | % | 30.1 | % | 33.1 | % | | 34.5 | % | 34.2 | % | 1.1 | % |
89
TableIn fiscal 2011, the Company recorded a $2.7 million benefit due to the reinstatement of Contents
OSHKOSH CORPORATION
NOTES TO CONSOLIDATED FINANCIAL STATEMENTSthe U.S. research & development tax credit for periods prior to fiscal 2011. The fiscal 2010 research & development tax credit included only one-fourth of the annual benefit because of the timing of the credit reinstatement. During fiscal 2010, the Company settled a number of income tax audits which resulted in a $15.4 million reduction in fiscal 2010 income tax expense, of which $11.5 million related to acquisition tax contingencies.
The Company is party to a tax incentive agreement (“incentive”) covering certain of its European operations. The incentive provides for a reduction in the Company’s effective income tax rate through allowable deductions that are subject to recapture to the extent that certain conditions are not met, including a requirement to have minimum cumulative operating income over a multiple-year period ending in fiscal 2013. The Company recorded (income recapture) tax deductions (income) under thisthe incentive agreement of €(38.7)€7.8 million, €40.2€(15.9) million and €16.5€(38.7) million in fiscal 2009, 20082011, 2010 and 2007,2009, respectively, which resulted in additional (tax) benefit of $(17.3)$3.7 million, $20.9$(7.3) million and $7.5$(17.3) million in fiscal 2009, 20082011, 2010 and 2007,2009, respectively. Life-to-date, the Company has recorded €18.0€10.0 million of cumulative net deductions which are subject to recapture provisions
92
Table of Contents
OSHKOSH CORPORATION
NOTES TO CONSOLIDATED FINANCIAL STATEMENTS
should certain minimum income and other requirements not be met. Should the Company reach the maximum level of cumulative operating income under thisthe incentive, aggregate additional unbenefitted deductions of €95.5€103.5 million would be available to offset the Company’s future taxable income, although the amount of deductions allowed in any particular tax year are limited by the incentive.
In fiscal 2009, the Company made an election with the U.S. Internal Revenue Service to treat Windmill Ventures, the Company’s European holding Companycompany parent of Geesink, as a disregarded entity for U.S. federal income tax purposes. As a result of this election, the Company recorded a $71.5 million worthless stock/bad debt income tax benefit, of which $17.5$10.5 million related to Windmill Ventures continuing operations and $54.0$61.0 million related to Geesink and BAI and has been included in discontinued operations.
Deferred income tax assets and liabilities were comprised of the following (in millions):
| | September 30, | | | September 30, | |
| | 2009 | | 2008 | | | 2011 | | 2010 | |
Deferred Tax Assets and Liabilities | | | | | | | | | | |
Deferred tax assets: | | | | | | | | | | |
Other long-term liabilities | | $ | 78.6 | | $ | 77.2 | | | $ | 112.6 | | $ | 86.6 | |
Net operating losses | | 57.3 | | 40.7 | | | 57.4 | | 63.6 | |
Accrued warranty | | 21.8 | | 26.6 | | | 23.8 | | 28.2 | |
Other current liabilities | | 34.7 | | 25.3 | | | 20.8 | | 28.9 | |
Other long-term assets | | 10.6 | | — | | | — | | 8.2 | |
Payroll-related obligations | | 12.1 | | 10.5 | | | 15.7 | | 19.5 | |
Receivables | | 12.0 | | 6.1 | | | 15.2 | | 16.2 | |
Other | | 0.5 | | 0.6 | | | 0.4 | | 0.4 | |
Gross deferred tax assets | | 227.6 | | 187.0 | | | 245.9 | | 251.6 | |
Less valuation allowance | | (37.7 | ) | (27.6 | ) | | (39.5 | ) | (36.4 | ) |
Deferred tax assets | | 189.9 | | 159.4 | | | 206.4 | | 215.2 | |
Deferred tax liabilities: | | | | | | | | | | |
Intangible assets | | 294.8 | | 332.2 | | | 241.2 | | 259.1 | |
Investment in unconsolidated partnership | | 14.3 | | 18.7 | | | 5.3 | | 9.1 | |
Property, plant and equipment | | 40.4 | | 45.8 | | | 48.8 | | 44.2 | |
Other | | 4.5 | | 5.0 | | | 9.5 | | 5.7 | |
Deferred tax liabilities | | 354.0 | | 401.7 | | | 304.8 | | 318.1 | |
Net deferred tax liability | | $ | (164.1 | ) | $ | (242.3 | ) | | $ | (98.4 | ) | $ | (102.9 | ) |
The net deferred tax liability is classified in the Consolidated Balance Sheets as follows (in millions):
| | September 30, | | | September 30, | |
| | 2009 | | 2008 | | | 2011 | | 2010 | |
| | | | | | | | | | |
Current net deferred tax asset | | $ | 75.5 | | $ | 66.6 | | | $ | 72.9 | | $ | 86.7 | |
Non-current net deferred tax liability | | (239.6 | ) | (308.9 | ) | | (171.3 | ) | (189.6 | ) |
| | $ | (164.1 | ) | $ | (242.3 | ) | | $ | (98.4 | ) | $ | (102.9 | ) |
As of September 30, 2009,2011, the Company had $172.5$178.0 million of net operating loss carryforwards available to reduce future taxable income of certain foreign subsidiaries that are primarily from countries with carryforward periods ranging from eightfive years to an unlimited period. In addition, the Company had $222.0$169.9 million of state net operating loss carryforwards, which are subject to expiration from 20102014 to 2029.2031. The deferred tax assets for foreign and state net operating loss carryforwards were $44.8$48.1 million and $12.5$9.3 million, respectively, and are reviewed for recoverability based on historical taxable income, the expected reversals of existing temporary differences, tax-planning strategies and projections of future
9093
Table of Contents
OSHKOSH CORPORATION
NOTES TO CONSOLIDATED FINANCIAL STATEMENTS
taxable income. As a result of this analysis, the Company carriescarried a valuation allowance as of September 30, 20092011 against the foreign and state deferred tax assets of $33.6$35.3 million and $4.1$4.2 million, respectively.
The Company does not provide for U.S. income taxes on undistributed earnings of its foreign operations that are intended to be permanently reinvested. At September 30, 2009,2011, these earnings amounted to $157.9$42.0 million. If these earnings were repatriated to the United States, the Company would be required to accrue and pay U.S. Federalfederal income taxes and foreign withholding taxes, as adjusted for foreign tax credits. Determination of the amount of any unrecognized deferred income tax liability on these earnings is not practicable.
The Company adopted the provisions of ASC Topic 740 on October 1, 2007. The adoption of ASC Topic 740 resulted in a $2.9 million charge to retained earnings as of October 1, 2007 and the reclassification of $30.0 million in liabilities related to uncertain tax positions in the Company’s Consolidated Balance Sheet from income taxes payable to other long-term assets and long-term liabilities of $6.2 million and $36.2 million, respectively. As of September 30, 2009,2011, the Company’s liability for gross uncertainunrecognized tax positions,benefits, excluding related interest and penalties, was $54.4 million. As of September 30, 2011, net unrecognized tax benefits, excluding interest and penalties, was $72.8 million. Excluding interest and penalties, net unrecognized tax benefits of $36.8$43.4 million would affect the Company’s net income if recognized, $21.6$23.3 million of which would impact net income from continuing operations. As of September 30, 2010, net unrecognized tax benefits, excluding interest and penalties, of $44.0 million would have affected the effective tax rate onCompany’s net income if recognized, $23.9 million of which would have impacted net income from continuing operations. A reconciliation of the beginning and ending amount of unrecognized tax benefits during fiscal 20092011 and fiscal 20082010 were as follows (in millions):
| | | Fiscal Year Ended | |
| | Fiscal Year Ended
September 30, | | | September 30, | |
| | 2009 | | 2008 | | | 2011 | | 2010 | |
| | | | | | | | | | |
Balance at beginning of year | | $ | 48.8 | | $ | 48.0 | | | $ | 52.1 | | $ | 63.8 | |
Additions for tax positions related to current year | | 20.3 | | 7.3 | | | 4.0 | | 5.1 | |
Additions for tax positions related to prior years | | 2.7 | | 8.9 | | | 4.0 | | 11.5 | |
Reductions for tax positions of prior years | | (3.2 | ) | (7.3 | ) | | (0.3 | ) | (2.8 | ) |
Settlements | | (2.4 | ) | (7.1 | ) | | (2.0 | ) | (19.7 | ) |
Lapse of statute of limitations | | (2.4 | ) | (1.0 | ) | | (4.5 | ) | (5.8 | ) |
Balance at end of year | | $ | 63.8 | | $ | 48.8 | | | $ | 53.3 | | $ | 52.1 | |
The Company recognizes accrued interest and penalties, if any, related to unrecognized tax benefits in the provision“Provision for (benefit from) income taxestaxes” in the Company’s Consolidated Statements of Operations. During the fiscal years ended September 30, 2009, 20082011, 2010 and 2007,2009, the Company recognized $2.4$(1.7) million, $2.7$(0.9) million and $0.8$2.4 million in interest and penalties, respectively. At September 30, 20092011 and 2008,2010, the Company had accruals for the payment of interest and penalties of $12.9$14.1 million and $12.2$12.0 million, respectively. The amount ofDuring the next twelve months, it is reasonably possible that federal, state and foreign tax audit resolutions could reduce unrecognized tax benefits is expected to change by approximately $3.6$13.4 million, ineither because the next twelve months.Company’s tax positions are sustained on audit, because the Company agrees to their disallowance or the statute of limitations closes.
The Company files federal income tax returns, as well as multiple state, local and non-U.S. jurisdiction tax returns. The Company is regularly audited by federal, state and foreign tax authorities. The Company’sDuring fiscal 2011, the Company was under audit by the U.S. Internal Revenue Service for the taxable years ended September 30, 20062008 and 2007 are currently2009. As of September 30, 2011, tax years open for examination under audit by the Internal Revenue Service.applicable statutes were as follows:
Prior to its acquisition by the Company, JLG had received notices of audit adjustments totaling $7.1 million from the Pennsylvania Department of Revenue (“PA”) in connection with audits of income tax returns filed by JLG for fiscal years 1999 through 2003. The adjustments proposed by PA consist primarily of the disallowance of a royalty deduction taken on JLG’s income tax returns. The Company made a $2.3 million payment on May 27, 2008 to PA in complete satisfaction of the audit, inclusive of interest.
Tax Jurisdiction |
| Open Tax Years |
|
Australia | | 2007 — 2011 | |
Belgium | | 2010 — 2011 | |
Brazil | | 2005 — 2011 | |
Canada | | 2006 — 2011 | |
Romania | | 2006 — 2011 | |
The Netherlands | | 2005 — 2011 | |
United States (federal) | | 2008 — 2011 | |
United States (state and local) | | 2002 — 2011 | |
20.94Contingencies, Significant Estimates and Concentrations
Securities Class Action - - On September 19, 2008, a purported shareholder of the Company filed a complaint seeking certification of a class action lawsuit in the United States District Court for the Eastern District of Wisconsin docketed as Iron Workers Local No. 25 Pension Fund on behalf of itself and all others similarly situated v. Oshkosh Corporation and Robert G. Bohn. The lawsuit alleges, among other things, that the Company violated the Securities Exchange Act of 1934 by making materially inadequate disclosures and material omissions leading to the Company’s issuance of revised earnings guidance and announcement of an impairment charge on June 26, 2008. Since the initial lawsuit, other suits containing
91
Table of Contents
OSHKOSH CORPORATION
NOTES TO CONSOLIDATED FINANCIAL STATEMENTS
substantially similar allegations21. Earnings (Loss) Per Share
The computation of basic and diluted weighted-average shares used in the denominator of the per share calculations was as follows:
| | Fiscal Year Ended September 30, | |
| | 2011 | | 2010 | | 2009 | |
| | | | | | | |
Basic weighted-average shares outstanding | | 90,888,253 | | 89,947,873 | | 76,473,930 | |
Effect of dilutive stock options and equity-based compensation awards | | 685,107 | | 1,006,868 | | — | |
Diluted weighted-average shares outstanding | | 91,573,360 | | 90,954,741 | | 76,473,930 | |
Options to purchase 2,294,124 and 1,425,155 shares of Common Stock were filed. These lawsuitsoutstanding in fiscal 2011 and 2010, respectively, but were not included in the computation of diluted earnings (loss) per share attributable to Oshkosh Corporation common shareholders because the exercise price of the options were greater than the average market price of the shares of Common Stock and therefore would have been consolidatedanti-dilutive. Options to purchase 4,327,116 shares of Common Stock and an amended complaint has been filed. The amended complaint substantially expands190,175 nonvested shares were outstanding during fiscal 2009, but were excluded from the classcomputation of diluted earnings (loss) per share attributable to Oshkosh Corporation common shareholders because the net loss for the period in which securities law violations are alleged to have occurred and names Charles L. Szews, David M. Sagehorn and the Company’s independent auditor as additional defendants. On July 24, 2009, the defendants filed their motions to dismiss the lawsuit, and the motions have been fully briefed. The motions are currently pending before the court. The Company believes the lawsuitcaused all potentially dilutive shares to be entirely without meritanti-dilutive.
Income (loss) attributable to Oshkosh Corporation common shareholders was as follows (in millions):
| | Fiscal Year Ended September 30, | |
| | 2011 | | 2010 | | 2009 | |
| | | | | | | |
Continuing operations, net of tax | | $ | 273.4 | | $ | 792.9 | | $ | (1,167.0 | ) |
Discontinued operations, net of tax | | — | | (2.9 | ) | 68.2 | |
| | $ | 273.4 | | $ | 790.0 | | $ | (1,098.8 | ) |
22. Contingencies, Significant Estimates and plans to continue to vigorously defend against the lawsuit.Concentrations
Environmental- As part of its routine business operations, the Company disposes of and recycles or reclaims certain industrial waste materials, chemicals and solvents at third-party disposal and recycling facilities, which are licensed by appropriate governmental agencies. In some instances, these facilities have been and may be designated by the United States Environmental Protection Agency (“EPA”) or a state environmental agency for remediation. Under the Comprehensive Environmental Response, Compensation, and Liability Act and similar state laws, each potentially responsible party (“PRP”) that contributed hazardous substances may be jointly and severally liable for the costs associated with cleaning up these sites. Typically, PRPs negotiate a resolution with the EPA and/or the state environmental agencies. PRPs also negotiate with each other regarding allocation of the cleanup costs. The Company has been named a PRP with regard to three multiple-party sites. Based on current estimates, the Company believes its liability at these sites will not be material and any responsibility of the Company is adequately covered through established reserves.
The Company has been addressing a regional trichloroethylene (“TCE”) groundwater plume on the south side of Oshkosh, Wisconsin. The Company believes there may be multiple sources of TCE in the area. TCE was detected at the Company’s North Plant facility with testing showing the highest concentrations in a monitoring well located on the upgradient property line. In July 2009, upon completion of additional testing with favorable results at the Company’s North Plant facility, the State of Wisconsin Department of Natural Resources (“WDNR”) agreed to close its investigation of the North Plant facility and not to require any remediation at the North Plant facility at this time provided that the Company and any subsequent owner of the North Plant facility comply with certain conditions. The WDNR may reopen its investigation of the matter if additional evidence of contamination at the North Plant facility is discovered. Also, as part of the regional TCE groundwater investigation, the Company conducted a groundwater investigation of a former landfill located on Company property. The landfill, acquired by the Company in 1972, is approximately 2.0 acres in size and is believed to have been used for the disposal of household waste. Based on the investigation, the Company believes, and the WDNR has concurred, that the landfill is not one of the sources of the TCE contamination. As such, in March 2009, the WDNR agreed to close its investigation of the landfill as a possible source of the TCE and not to require any remediation at the landfill at this time, provided that the Company and any subsequent owner of the landfill comply with certain conditions. The landfill will remain on the State of Wisconsin’s registry of former landfills. The WDNR may reopen its investigation of the matter if additional evidence of contamination at the landfill is discovered. Based upon current knowledge, the Company believes its liability associated with the TCE issue will not be material and is adequately covered through reserves established by the Company. However, this may change as investigations by unrelated property owners and the government proceed.
At September 30, 2009 and 2008, the Company had reserves of $2.1 million and $3.9$1.9 million respectively, for losses related to environmental matters that were probable and estimable.estimable at September 30, 2011 and 2010, respectively. The amount recorded for identified contingent liabilities is based on estimates. Amounts recorded are reviewed periodically and adjusted to reflect additional technical and legal information that becomes available. Actual costs to be incurred in future periods may vary from the estimates, given the inherent uncertainties in evaluating certain exposures. Subject to the imprecision in estimating future contingent liability costs, the Company does not expect that any sum it may have to pay in connection with these matters in excess of the amounts recorded will have a materiallymaterial adverse effect on the Company’s financial position, results of operations or cash flows.
95
Table of Contents
OSHKOSH CORPORATION
NOTES TO CONSOLIDATED FINANCIAL STATEMENTS
Personal Injury Actions and Other - Product and general liability claims arise against the Company from time to time in the ordinary course of business. The Company is generally self-insured for future claims up to $3.0 million per claim. Accordingly, a reserve is maintained for the estimated costs of such claims. At September 30, 20092011 and 2008,2010, the reserve for product and general liability claims was $46.8$41.7 million and $47.3$44.4 million, respectively, based on available information. There is inherent uncertainty as to the eventual resolution of unsettled claims. Management, however, believes that any losses in excess of established reserves will not have a material adverse effect on the Company’s financial condition, results of operations or cash flows.
92
Table of Contents
OSHKOSH CORPORATION
NOTES TO CONSOLIDATED FINANCIAL STATEMENTS
Market Risks - The Company iswas contingently liable under bid, performance and specialty bonds totaling $217.8$284.0 million and open standby letters of credit issued by the Company’s banks in favor of third parties totaling $34.1$27.9 million at September 30, 2009.2011.
Other Matters - The Company is subject to other environmental matters and legal proceedings and claims, including patent, antitrust, product liability, warranty and state dealership regulation compliance proceedings that arise in the ordinary course of business. Although the final results of all such matters and claims cannot be predicted with certainty, management believes that the ultimate resolution of all such matters and claims will not have a material adverse effect on the Company’s financial condition, results of operations or cash flows. Actual results could vary, among other things, due to the uncertainties involved in litigation.
On January 8, 2010, Control Solutions LLC (“Control Solutions”) brought suit against the Company in the United States District Court for the Northern District of Illinois for breach of express contract, breach of implied-in-fact contract, unjust enrichment and promissory estoppel related to the Company’s contract to supply the DoD with M-ATVs. Control Solutions has asserted damages in the amount of $190.3 million. On October 3, 2011, following written and oral discovery, the Company moved for summary judgment. On that same date, Control Solutions filed a cross-motion for summary judgment. The Company’s and Control Solutions’ response briefs have been filed with the Court. While this case is in the early stages of litigation and its outcome cannot be predicted with certainty, the Company believes that the ultimate resolution of this claim will not have a material adverse effect on the Company’s financial condition, results of operations or cash flows. Actual results could vary, among other things, due to the uncertainties involved in litigation.
At September 30, 2009,2011, approximately 28%26% of the Company’s workforce was covered under collective bargaining agreements.
The Company derived a significant portion of its revenue from the DoD, as follows (in millions):
| | Fiscal Year Ended September 30, | | | Fiscal Year Ended September 30, | |
| | 2009 | | 2008 | | 2007 | | | 2011 | | 2010 | | 2009 | |
| | | | | | | | | | | | | | |
DoD | | $ | 2,738.9 | | $ | 2,051.3 | | $ | 1,435.4 | | | $ | 4,136.8 | | $ | 7,054.7 | | $ | 2,738.9 | |
Foreign military sales | | 26.8 | | 17.5 | | 22.1 | | | 74.3 | | 28.3 | | 26.8 | |
Total DoD sales | | $ | 2,765.7 | | $ | 2,068.8 | | $ | 1,457.5 | | | $ | 4,211.1 | | $ | 7,083.0 | | $ | 2,765.7 | |
No other customer represented more than 10% of sales for fiscal 2009, 20082011, 2010 and 2007.2009.
Certain risks are inherent in doing business with the DoD, including technological changes and changes in levels of defense spending. All DoD contracts contain a provision that they may be terminated at any time at the convenience of the government. In such an event, the Company is entitled to recover allowable costs plus a reasonable profit earned to the date of termination.
Major contracts for military systems are performed over extended periods of time and are subject to changes in scope of work and delivery schedules. Pricing negotiations on changes and settlement of claims often extend over prolonged periods of time. The Company’s ultimate profitability on such contracts may depend on the eventual outcome of an equitable settlement of contractual issues with the Company’s customers.
96
Table of Contents
OSHKOSH CORPORATION
NOTES TO CONSOLIDATED FINANCIAL STATEMENTS
Because the Company is a relatively large defense contractor, the Company’s government contract operations are subject to extensive annual audit processes and to U.S. government investigations of business practices and cost classifications from which legal or administrative proceedings can result. Based on government procurement regulations, under certain circumstances the Company could be fined, as well as suspended or debarred from government contracting. In that event,During a suspension or debarment, the Company would also be prohibited from selling equipment or services to customers that depend on loans or financial commitments from the Export Import Bank, Overseas Private Investment Corporation and similar government agencies duringagencies.
In August 2009, the DoD awarded the Company the contract to be the sole producer of FMTVs under the U.S. Army’s FMTV Rebuy program. This was an important contract for the Company to win due to high unfulfilled requirements of the DoD’s authorized acquisition objective (or maximum acquisition quantity) under the FMTV program, while the Company’s FHTV program was nearing fulfillment of its authorized acquisition objective. After a suspension or debarment.lengthy protest, the DoD ordered trucks in the first contract year at a level approximately three times higher than the likely amount communicated by the DoD in the request for proposal due to favorable pricing on the program and prior to a scheduled contractual price increase. As a result, when the Company initiated production, the Company incurred higher than planned costs to hire and train more than 500 additional employees than anticipated and was required to purchase additional equipment and tooling, as well as deliver vehicles at lower pricing than expected. The Company also experienced issues associated with building to the DoD’s technical data package, which did not accurately reflect the current configuration of the trucks and trailers, and complying with new requirements in the contract, among other issues. The Company began delivering vehicles under this contract in the first quarter of fiscal 2011. While the Company worked through these issues, it incurred unplanned start-up costs of $43.0 million in fiscal 2011 and reported a total loss on the contract for the year of $44.4 million. The Company expects to continue to incur costs in excess of revenues on the FMTV contract through the first quarter of fiscal 2012, although at amounts lower than in fiscal 2011, but expects its FMTV sales beginning in the second quarter of fiscal 2012 to be profitable. The Company has eleven integrated project teams working to improve its performance on this contract. This is a top priority for management and is increasingly important as FMTV sales rise as a percentage of total defense sales in fiscal years 2012 and 2013.
The Company expects that FMTV program revenues for production beyond September 30, 2011 on orders received to-date will exceed expected costs and, therefore, has not recorded a charge for a loss contract. In evaluating the profitability under the FMTV contract, it is necessary to estimate future material and production costs. Management cost assumptions include estimates for future increases in the costs of materials, reductions in ramp-up costs, targeted cost savings and production efficiencies. There are inherent uncertainties related to these estimates. Small changes in estimates can have a significant impact on profitability under the contract. For example, a 1% escalation in material costs over the Company’s projection for FMTV orders currently in backlog would increase the cost of materials by approximately $24 million. Although this amount is less than the expected future profitability, it would significantly reduce the expected future gross margins on orders currently in backlog. It is possible that other assumptions underlying the analysis could change in such a manner that the Company would determine in the future that this is a loss contract, which could result in a material charge to earnings.
21.23. Business Segment Information
The Company is organized into four reportable segments based on the internal organization used by management for making operating decisions and measuring performance and based on the similarity of customers served, common management, common use of facilities and economic results attained. The Company’s segments are as follows:
Defense: This segment consists of a division of Oshkosh that manufactures heavy- and medium-payload tactical trucks and supply parts and services for the U.S. military and for other militaries around the world. Sales to the DoD accounted for 96.9%93.5%, 96.0%96.9% and 92.0%96.9% of the segment’s sales for the years ended September 30, 2011, 2010 and 2009, 2008 and 2007, respectively.
93
Table of Contents
OSHKOSH CORPORATION
NOTES TO CONSOLIDATED FINANCIAL STATEMENTS
Access Equipment: This segment consists of JLG.JLG and JerrDan. JLG manufactures aerial work platforms and telehandlers used in a wide variety of construction, industrial, institutional and general maintenance applications to position workers and materials at elevated heights for sale worldwide. Access equipment customers include equipment rental companies, construction contractors, manufacturing companies, home improvement centers and the U.S. military. Sales to one customer accounted for 14.8%JerrDan manufactures and markets towing and recovery equipment in the U.S. and abroad.
97
Table of the segment’s sales for the year ended September 30, 2007.Contents
OSHKOSH CORPORATION
NOTES TO CONSOLIDATED FINANCIAL STATEMENTS
Fire & Emergency: This segment includes Pierce, the aircraft rescue and firefighting and snow removal divisions of Oshkosh, JerrDan, Medtec, Kewaunee BAI and OSV.SMIT. These units manufacture and market commercial and custom fire vehicles, broadcast vehicles and emergency vehicles primarily for fire departments, airports, other governmental units, hospitals and other care providers and broadcast stations and towing companies in the U.S. and abroad.
Commercial: This segment includes McNeilus, CON-E-CO, London, IMT and the commercial division of Oshkosh. McNeilus, CON-E-CO, London and Oshkosh manufacture, market and distribute concrete mixers, portable concrete batch plants and vehicle and vehicle body components. McNeilus manufactures, markets and distributes refuse collection vehicles and components. IMT is a manufacturer of field service vehicles and truck-mounted cranes for niche markets. Sales are made primarily to commercial and municipal customers in the Americas and Europe.Americas.
In accordance with FASB ASC Topic 280, Segment Reporting, for purposes of business segment performance measurement, the Company does not allocate to individual business segments costs or items that are of a non-operating nature or organizational or functional expenses of a corporate nature. The caption “Corporate and other”“Corporate” includes corporate office expenses, including share-based compensation and results of insignificant operations, intersegment eliminations and income and expense not allocated to reportable segments.operations. Identifiable assets of the business segments exclude general corporate assets, which principally consist of cash and cash equivalents, certain property, plant and equipment and certain other assets pertaining to corporate activities. Intersegment sales generally include amounts invoiced by a segment for work performed for another segment. Amounts are based on actual work performed and agreed-upon pricing which is intended to be reflective of the contribution made by the supplying business segment. The accounting policies of the reportable segments are the same as those described in Note 2 of the Notes to Consolidated Financial Statements.
Selected financial information concerning the Company’s product lines and reportable segments is as follows (in millions):
| | Fiscal Year Ended September 30, | | | Fiscal Year Ended September 30, | |
| | 2009 | | 2008 | | 2007 | | | 2011 | | 2010 | | 2009 | |
| | External | | Inter- | | Net | | External | | Inter- | | Net | | External | | Inter- | | Net | | | External | | Inter- | | Net | | External | | Inter- | | Net | | External | | Inter- | | Net | |
| | Customers | | segment | | Sales | | Customers | | segment | | Sales | | Customers | | segment | | Sales | | | Customers | | segment | | Sales | | Customers | | segment | | Sales | | Customers | | segment | | Sales | |
| | | | | | | | | | | | | | | | | | | | | | | | | | | | | | | | | | | | | | |
Defense | | $ | 2,585.9 | | $ | 8.9 | | $ | 2,594.8 | | $ | 1,882.2 | | $ | 9.7 | | $ | 1,891.9 | | $ | 1,412.1 | | $ | 4.4 | | $ | 1,416.5 | | | $ | 4,359.9 | | $ | 5.3 | | $ | 4,365.2 | | $ | 7,151.3 | | $ | 10.4 | | $ | 7,161.7 | | $ | 2,585.9 | | $ | 8.9 | | $ | 2,594.8 | |
| | | | | | | | | | | | | | | | | | | | | | | | | | | | | | | | | | | | | | |
Access equipment(a) | | | | | | | | | | | | | | | | | | | | | | | | | | | | | | | | | | | | | | |
Aerial work platforms | | 470.2 | | — | | 470.2 | | 1,997.9 | | — | | 1,997.9 | | 1,493.7 | | — | | 1,493.7 | | | 978.5 | | — | | 978.5 | | 561.1 | | — | | 561.1 | | 470.2 | | — | | 470.2 | |
Telehandlers | | 289.8 | | — | | 289.8 | | 747.0 | | — | | 747.0 | | 796.8 | | — | | 796.8 | | | 552.4 | | — | | 552.4 | | 342.8 | | — | | 342.8 | | 289.8 | | — | | 289.8 | |
Other(b)(a) | | 292.7 | | 86.7 | | 379.4 | | 341.0 | | — | | 341.0 | | 249.0 | | — | | 249.0 | | | 413.2 | | 108.0 | | 521.2 | | 362.9 | | 1,745.1 | | 2,108.0 | | 371.6 | | 93.9 | | 465.5 | |
Total access equipment | | 1,052.7 | | 86.7 | | 1,139.4 | | 3,085.9 | | — | | 3,085.9 | | 2,539.5 | | — | | 2,539.5 | | | 1,944.1 | | 108.0 | | 2,052.1 | | 1,266.8 | | 1,745.1 | | 3,011.9 | | 1,131.6 | | 93.9 | | 1,225.5 | |
| | | | | | | | | | | | | | | | | | | | | | | | | | | | | | | | | | | | | | |
Fire & emergency | | 1,138.0 | | 31.0 | | 1,169.0 | | 1,146.5 | | 46.3 | | 1,192.8 | | 1,107.4 | | 34.8 | | 1,142.2 | | | 782.3 | | 18.0 | | 800.3 | | 892.9 | | 23.1 | | 916.0 | | 1,017.0 | | 25.3 | | 1,042.3 | |
| | | | | | | | | | | | | | | | | | | | | | | | | | | | | | | | | | | | | | |
Commercial | | | | | | | | | | | | | | | | | | | | | | | | | | | | | | | | | | | | | | |
Concrete placement | | 144.9 | | 1.1 | | 146.0 | | 367.2 | | 1.4 | | 368.6 | | 619.3 | | — | | 619.3 | | | 169.6 | | — | | 169.6 | | 174.1 | | — | | 174.1 | | 144.9 | | 1.1 | | 146.0 | |
Refuse collection | | 317.6 | | 9.0 | | 326.6 | | 374.3 | | 10.1 | | 384.4 | | 359.4 | | — | | 359.4 | | | 249.6 | | — | | 249.6 | | 305.7 | | — | | 305.7 | | 317.6 | | 9.0 | | 326.6 | |
Other | | 56.1 | | 61.3 | | 117.4 | | 80.3 | | 1.8 | | 82.1 | | 101.6 | | — | | 101.6 | | | 79.2 | | 66.5 | | 145.7 | | 51.6 | | 90.7 | | 142.3 | | 56.1 | | 61.3 | | 117.4 | |
Total commercial | | 518.6 | | 71.4 | | 590.0 | | 821.8 | | 13.3 | | 835.1 | | 1,080.3 | | — | | 1,080.3 | | | 498.4 | | 66.5 | | 564.9 | | 531.4 | | 90.7 | | 622.1 | | 518.6 | | 71.4 | | 590.0 | |
Intersegment eliminations | | — | | (198.0 | ) | (198.0 | ) | — | | (69.3 | ) | (69.3 | ) | — | | (39.2 | ) | (39.2 | ) | | — | | (197.8 | ) | (197.8 | ) | — | | (1,869.3 | ) | (1,869.3 | ) | — | | (199.5 | ) | (199.5 | ) |
Consolidated | | $ | 5,295.2 | | $ | — | | $ | 5,295.2 | | $ | 6,936.4 | | $ | — | | $ | 6,936.4 | | $ | 6,139.3 | | $ | — | | $ | 6,139.3 | | | $ | 7,584.7 | | $ | — | | $ | 7,584.7 | | $ | 9,842.4 | | $ | — | | $ | 9,842.4 | | $ | 5,253.1 | | $ | — | | $ | 5,253.1 | |
(a) Fiscal 2007 accessAccess equipment disclosures include the results of JLG subsequent to December 6, 2006, the date of acquisition.
(b) Fiscal 2009 JLG intersegment sales are comprised of assembly of MRAP All Terrain VehicleM-ATV crew capsules and complete vehicles for the defense segment. JLGThe access equipment segment invoices the defense segment for work under this contract, which was initiated in the fourth quarter of fiscal 2009. These sales are eliminated in consolidation.
9498
Table of Contents
OSHKOSH CORPORATION
NOTES TO CONSOLIDATED FINANCIAL STATEMENTS
| | Fiscal Year Ended September 30, | | | Fiscal Year Ended September 30, | |
| | 2009 | | 2008 | | 2007 | | | 2011 | | 2010 | | 2009 | |
Operating income (expense) from continuing operations: | | | | | | | | |
Operating income (loss) from continuing operations: | | | | | | | | |
Defense | | $ | 403.3 | | $ | 265.2 | | $ | 245.0 | | | $ | 543.0 | | $ | 1,320.7 | | $ | 403.3 | |
Access equipment (a) | | (1,105.6 | ) | 360.1 | | 268.4 | | | 65.3 | | 97.3 | | (1,159.1 | ) |
Fire & emergency (b) | | (14.7 | ) | 93.9 | | 107.5 | | | (8.2 | ) | 57.6 | | 51.2 | |
Commercial (c) | | (183.7 | ) | 4.7 | | 76.5 | | | 3.9 | | 19.4 | | (183.7 | ) |
Corporate and other | | (91.3 | ) | (108.9 | ) | (88.3 | ) | |
Corporate | | | (107.1 | ) | (99.0 | ) | (89.6 | ) |
Intersegment eliminations | | | 4.0 | | (1.9 | ) | (1.6 | ) |
Consolidated | | (992.0 | ) | 615.0 | | 609.1 | | | 500.9 | | 1,394.1 | | (979.5 | ) |
Interest expense net of interest income | | (208.0 | ) | (205.0 | ) | (194.6 | ) | | (86.0 | ) | (183.6 | ) | (207.5 | ) |
Miscellaneous other income (expense) | | 8.5 | | (9.3 | ) | 0.9 | | |
| | | | | | | | |
(Loss) income before income taxes, equity in earnings of unconsolidated affiliates and minority interest | | $ | (1,191.5 | ) | $ | 400.7 | | $ | 415.4 | | |
Miscellaneous other income | | | 1.6 | | 1.0 | | 8.8 | |
Income (loss) from continuing operations before income taxes and equity in earnings (losses) of unconsolidated affiliates | | | $ | 416.5 | | $ | 1,211.5 | | $ | (1,178.2 | ) |
(a) Fiscal 2009 results include non-cash goodwill and long-lived asset impairment charges of $892.5$941.7 million.
(b) Fiscal 2011, 2010 and 2009 results include non-cash goodwill and long-lived asset impairment charges of $123.0 million.$4.8 million, $23.3 million and $64.2 million, respectively.
(c) Fiscal 20092010 and fiscal 20082009 results include non-cash goodwill and long-lived asset impairment charges of $2.3 million and $184.3 million, and $1.0 million, respectively.
| | Fiscal Year Ended September 30, | | | Fiscal Year Ended September 30, | |
| | 2009 | | 2008 | | 2007 | | | 2011 | | 2010 | | 2009 | |
Depreciation and amortization: | | | | | | | | | | | | | | |
Defense | | $ | 12.5 | | $ | 10.2 | | $ | 7.1 | | | $ | 26.7 | | $ | 17.6 | | $ | 12.5 | |
Access equipment | | 89.3 | | 91.4 | | 76.1 | | | 84.1 | | 95.4 | | 91.7 | |
Fire & emergency | | 16.8 | | 18.6 | | 17.2 | | | 13.0 | | 16.2 | | 14.4 | |
Commercial (a) | | 19.9 | | 25.3 | | 22.1 | | |
Corporate and other | | 13.5 | | 7.4 | | 6.5 | | |
Commercial | | | 15.4 | | 15.1 | | 19.9 | |
Corporate (b) | | | 5.2 | | 28.6 | | 13.5 | |
Consolidated | | $ | 152.0 | | $ | 152.9 | | $ | 129.0 | | | $ | 144.4 | | $ | 172.9 | | $ | 152.0 | |
| | | | | | | | | | | | | | |
Capital expenditures: | | | | | | | | | | | | | | |
Defense | | $ | 13.0 | | $ | 18.9 | | $ | 17.6 | | | $ | 36.4 | | $ | 48.0 | | $ | 13.0 | |
Access equipment (b)(c) | | 36.6 | | 63.9 | | 46.1 | | | 26.0 | | 24.7 | | 36.7 | |
Fire & emergency | | 6.6 | | 9.3 | | 16.1 | | | 17.7 | | 10.0 | | 6.5 | |
Commercial | | 5.4 | | 26.2 | | 22.2 | | | 5.9 | | 6.8 | | 5.4 | |
| | | | | | | | |
Corporate | | | 0.2 | | — | | — | |
Consolidated | | $ | 61.6 | | $ | 118.3 | | $ | 102.0 | | | $ | 86.2 | | $ | 89.5 | | $ | 61.6 | |
(a) Includes $0.5 million, $3.5 million and $2.5$1.2 million in fiscal 2009 2008related to discontinued operations.
(b)Includes $0.1 million, $20.4 million and 2007,$5.0 million in fiscal 2011, 2010 and 2009, respectively, related to Geesink which is included in discontinued operations.the write-off of deferred financing fees due to the early extinguishment of the related debt.
(b) (c)Capital expenditures include both the purchase of property, plant and equipment and equipment held for rental.
9599
Table of Contents
OSHKOSH CORPORATION
NOTES TO CONSOLIDATED FINANCIAL STATEMENTS
| | September 30, | | | September 30, | |
| | 2009 (d) | | 2008 | | 2007 | | | 2011 | | 2010 | | 2009 | |
Identifiable assets: | | | | | | | | | | | | | | |
Defense - U.S. | | $ | 527.5 | | $ | 299.0 | | $ | 251.5 | | | $ | 762.3 | | $ | 876.4 | | $ | 527.5 | |
Access equipment: | | | | | | | | | | | | | | |
U.S. | | 1,972.2 | | 2,757.4 | | 2,845.0 | | | 1,779.8 | | 1,766.5 | | 2,035.4 | |
Europe (a) | | 764.9 | | 1,108.4 | | 1,032.1 | | | 694.0 | | 794.0 | | 764.9 | |
Rest of the world | | 131.9 | | 123.0 | | 282.5 | | | 248.9 | | 186.7 | | 131.9 | |
Total access equipment | | 2,869.0 | | 3,988.8 | | 4,159.6 | | | 2,722.7 | | 2,747.2 | | 2,932.2 | |
Fire & emergency: | | | | | | | | | | | | | | |
U.S. | | 604.4 | | 756.2 | | 761.3 | | | 518.9 | | 529.9 | | 541.2 | |
Europe | | 82.4 | | 123.8 | | 119.0 | | | 12.9 | | 15.6 | | 82.4 | |
Total fire & emergency | | 686.8 | | 880.0 | | 880.3 | | | 531.8 | | 545.5 | | 623.6 | |
Commercial: | | | | | | | | | | | | | | |
U.S. | | 334.5 | | 631.2 | | 670.3 | | | 321.4 | | 316.4 | | 334.5 | |
Other North America (a) | | 34.0 | | 32.5 | | 34.5 | | | 41.5 | | 38.7 | | 34.0 | |
Europe (b) | | — | | 170.0 | | 306.8 | | |
Total Commercial | | 368.5 | | 833.7 | | 1,011.6 | | |
Corporate and other - U.S. (c) | | 316.2 | | 80.0 | | 96.8 | | |
Total commercial | | | 362.9 | | 355.1 | | 368.5 | |
Corporate: | | | | | | | | |
U.S. (b) | | | 441.2 | | 183.1 | | 315.0 | |
Rest of the world | | | 6.0 | | 1.3 | | 1.2 | |
Total corporate | | | 447.2 | | 184.4 | | 316.2 | |
Consolidated | | $ | 4,768.0 | | $ | 6,081.5 | | $ | 6,399.8 | | | $ | 4,826.9 | | $ | 4,708.6 | | $ | 4,768.0 | |
(a) Includes investment in unconsolidated affiliates.
(b) September 30, 2009 balances reflect the sale of Geesink. September 30, 2008 assets reflect the June 2008 goodwill impairment charge of $167.4 million and long-lived asset impairment charges of $7.8 million. See Note 3 of the Notes to Consolidated Financial Statements for a discussion of the charges.
(c)Primarily includes cash and short-term investments.
(d) September 30, 2009 assets reflect the 2009 goodwill impairment charges of $1,169.2 million and long-lived asset impairment charges of $30.6 million. See Note 8 of the Notes to Consolidated Financial Statements for a discussion of the charges.
The following table presents net sales by geographic region based on product shipment destination (in millions):
| | Fiscal Year Ended September 30, | | | Fiscal Year Ended September 30, | |
| | 2009 | | 2008 | | 2007 | | | 2011 | | 2010 | | 2009 | |
Net sales: | | | | | | | | | | | | | | |
United States | | $ | 4,487.1 | | $ | 4,997.2 | | $ | 4,745.5 | | | $ | 6,281.5 | | $ | 8,882.6 | | $ | 4,487.1 | |
Other North America | | 89.7 | | 180.6 | | 212.8 | | | 179.7 | | 111.0 | | 89.7 | |
Europe, Africa and Middle East | | 510.7 | | 1,342.2 | | 915.7 | | | 706.2 | | 508.6 | | 468.6 | |
Rest of the world | | 207.7 | | 416.4 | | 265.3 | | | 417.3 | | 340.2 | | 207.7 | |
Consolidated | | $ | 5,295.2 | | $ | 6,936.4 | | $ | 6,139.3 | | | $ | 7,584.7 | | $ | 9,842.4 | | $ | 5,253.1 | |
9624. Separate Financial Information of Subsidiary Guarantors of Indebtedness
The Senior Notes are jointly, severally and unconditionally guaranteed on a senior unsecured basis by all of the Company’s existing and future subsidiaries that from time to time guarantee obligations under the Company’s senior credit facility, with certain exceptions (the “Guarantors”).
100
Table of Contents
OSHKOSH CORPORATION
NOTES TO CONSOLIDATED FINANCIAL STATEMENTS
The following condensed supplemental consolidating financial information reflects the summarized financial information of Oshkosh, the Guarantors on a combined basis and Oshkosh’s non-guarantor subsidiaries on a combined basis (in millions):
Condensed Consolidating Statement of Operations
For the Year Ended September 30, 2011
| | Oshkosh | | Guarantor | | Non-Guarantor | | | | | |
| | Corporation | | Subsidiaries | | Subsidiaries | | Eliminations | | Total | |
| | | | | | | | | | | |
Net sales | | $ | 4,540.2 | | $ | 2,409.4 | | $ | 893.1 | | $ | (258.0 | ) | $ | 7,584.7 | |
Cost of sales | | 3,873.3 | | 2,106.5 | | 787.4 | | (262.2 | ) | 6,505.0 | |
Gross income | | 666.9 | | 302.9 | | 105.7 | | 4.2 | | 1,079.7 | |
Selling, general and administrative expenses | | 212.0 | | 181.8 | | 119.4 | | — | | 513.2 | |
Amortization of purchased intangibles | | 0.1 | | 39.8 | | 20.9 | | — | | 60.8 | |
Intangible asset impairment charges | | — | | — | | 4.8 | | — | | 4.8 | |
Operating income (loss) | | 454.8 | | 81.3 | | (39.4 | ) | 4.2 | | 500.9 | |
Interest expense | | (200.2 | ) | (82.2 | ) | (3.9 | ) | 195.6 | | (90.7 | ) |
Interest income | | 2.9 | | 26.4 | | 171.0 | | (195.6 | ) | 4.7 | |
Miscellaneous, net | | 10.7 | | (120.5 | ) | 111.4 | | — | | 1.6 | |
Income (loss) from continuing operations before income taxes | | 268.2 | | (95.0 | ) | 239.1 | | 4.2 | | 416.5 | |
Provision for (benefit from) income taxes | | 93.9 | | (30.0 | ) | 78.3 | | 1.4 | | 143.6 | |
Income (loss) from continuing operations before equity in earnings (losses) of affiliates | | 174.3 | | (65.0 | ) | 160.8 | | 2.8 | | 272.9 | |
Equity in earnings (losses) of consolidated subsidiaries | | 99.2 | | 56.0 | | (52.5 | ) | (102.7 | ) | — | |
Equity in earnings (losses) of unconsolidated affiliates | | (0.1 | ) | — | | 0.6 | | — | | 0.5 | |
Income (loss) from continuing operations | | 273.4 | | (9.0 | ) | 108.9 | | (99.9 | ) | 273.4 | |
Discontinued operations, net of tax | | — | | — | | — | | — | | — | |
Net income (loss) | | 273.4 | | (9.0 | ) | 108.9 | | (99.9 | ) | 273.4 | |
Net loss attributable to the noncontrolling interest | | — | | — | | — | | — | | — | |
Net income (loss) attributable to Oshkosh Corporation | | $ | 273.4 | | $ | (9.0 | ) | $ | 108.9 | | $ | (99.9 | ) | $ | 273.4 | |
Condensed Consolidating Statement of Operations
For the Year Ended September 30, 2010
| | Oshkosh | | Guarantor | | Non-Guarantor | | | | | |
| | Corporation | | Subsidiaries | | Subsidiaries | | Eliminations | | Total | |
| | | | | | | | | | | |
Net sales | | $ | 7,341.9 | | $ | 3,559.1 | | $ | 835.6 | | $ | (1,894.2 | ) | $ | 9,842.4 | |
Cost of sales | | 5,892.1 | | 3,119.5 | | 753.0 | | (1,892.2 | ) | 7,872.4 | |
Gross income | | 1,449.8 | | 439.6 | | 82.6 | | (2.0 | ) | 1,970.0 | |
Selling, general and administrative expenses | | 196.9 | | 164.4 | | 128.5 | | — | | 489.8 | |
Amortization of purchased intangibles | | — | | 40.2 | | 20.3 | | — | | 60.5 | |
Intangible asset impairment charges | | — | | — | | 25.6 | | — | | 25.6 | |
Operating income (loss) | | 1,252.9 | | 235.0 | | (91.8 | ) | (2.0 | ) | 1,394.1 | |
Interest expense | | (276.4 | ) | (170.6 | ) | (2.5 | ) | 262.4 | | (187.1 | ) |
Interest income | | 2.4 | | 18.6 | | 244.9 | | (262.4 | ) | 3.5 | |
Miscellaneous, net | | 12.7 | | (94.9 | ) | 83.2 | | — | | 1.0 | |
Income (loss) from continuing operations before income taxes | | 991.6 | | (11.9 | ) | 233.8 | | (2.0 | ) | 1,211.5 | |
Provision for (benefit from) income taxes | | 328.4 | | (1.5 | ) | 88.1 | | (0.7 | ) | 414.3 | |
Income (loss) from continuing operations before equity in earnings (losses) of affiliates | | 663.2 | | (10.4 | ) | 145.7 | | (1.3 | ) | 797.2 | |
Equity in earnings (losses) of consolidated subsidiaries | | 125.4 | | (1.9 | ) | 0.2 | | (123.7 | ) | — | |
Equity in earnings (losses) of unconsolidated affiliates | | — | | — | | (4.3 | ) | — | | (4.3 | ) |
Income (loss) from continuing operations | | 788.6 | | (12.3 | ) | 141.6 | | (125.0 | ) | 792.9 | |
Discontinued operations, net of tax | | 1.4 | | — | | (4.3 | ) | — | | (2.9 | ) |
Net income (loss) | | 790.0 | | (12.3 | ) | 137.3 | | (125.0 | ) | 790.0 | |
Net loss attributable to the noncontrolling interest | | — | | — | | — | | — | | — | |
Net income (loss) attributable to Oshkosh Corporation | | $ | 790.0 | | $ | (12.3 | ) | $ | 137.3 | | $ | (125.0 | ) | $ | 790.0 | |
101
Table of Contents
OSHKOSH CORPORATION
NOTES TO CONSOLIDATED FINANCIAL STATEMENTS
22. Condensed Consolidating Statement of Operations
For the Year Ended September 30, 2009
| | Oshkosh | | Guarantor | | Non-Guarantor | | | | | |
| | Corporation | | Subsidiaries | | Subsidiaries | | Eliminations | | Total | |
| | | | | | | | | | | |
Net sales | | $ | 2,796.5 | | $ | 1,811.1 | | $ | 836.3 | | $ | (190.8 | ) | $ | 5,253.1 | |
Cost of sales | | 2,304.2 | | 1,629.3 | | 805.3 | | (189.0 | ) | 4,549.8 | |
Gross income | | 492.3 | | 181.8 | | 31.0 | | (1.8 | ) | 703.3 | |
Selling, general and administrative expenses | | 141.5 | | 136.3 | | 152.5 | | — | | 430.3 | |
Amortization of purchased intangibles | | — | | 40.8 | | 21.5 | | — | | 62.3 | |
Intangible asset impairment charges | | — | | 702.1 | | 488.1 | | — | | 1,190.2 | |
Operating income (loss) | | 350.8 | | (697.4 | ) | (631.1 | ) | (1.8 | ) | (979.5 | ) |
Interest expense | | (289.5 | ) | (153.5 | ) | (5.5 | ) | 237.1 | | (211.4 | ) |
Interest income | | 4.4 | | 28.2 | | 208.4 | | (237.1 | ) | 3.9 | |
Miscellaneous, net | | 12.9 | | (78.8 | ) | 74.7 | | — | | 8.8 | |
Income (loss) from continuing operations before income taxes | | 78.6 | | (901.5 | ) | (353.5 | ) | (1.8 | ) | (1,178.2 | ) |
Provision for (benefit from) income taxes | | 17.4 | | (32.1 | ) | 2.8 | | (0.7 | ) | (12.6 | ) |
Income (loss) from continuing operations before equity in earnings (losses) of affiliates | | 61.2 | | (869.4 | ) | (356.3 | ) | (1.1 | ) | (1,165.6 | ) |
Equity in earnings (losses) of consolidated subsidiaries | | (1,257.3 | ) | (239.7 | ) | 0.2 | | 1,496.8 | | — | |
Equity in earnings (losses) of unconsolidated affiliates | | — | | — | | (1.4 | ) | — | | (1.4 | ) |
Income (loss) from continuing operations | | (1,196.1 | ) | (1,109.1 | ) | (357.5 | ) | 1,495.7 | | (1,167.0 | ) |
Discontinued operations, net of tax | | 97.3 | | — | | (30.0 | ) | — | | 67.3 | |
Net income (loss) | | (1,098.8 | ) | (1,109.1 | ) | (387.5 | ) | 1,495.7 | | (1,099.7 | ) |
Net loss attributable to the noncontrolling interest | | — | | — | | 0.9 | | — | | 0.9 | |
Net income (loss) attributable to Oshkosh Corporation | | $ | (1,098.8 | ) | $ | (1,109.1 | ) | $ | (386.6 | ) | $ | 1,495.7 | | $ | (1,098.8 | ) |
Condensed Consolidating Balance Sheet
As of September 30, 2011
| | Oshkosh | | Guarantor | | Non-Guarantor | | | | | |
| | Corporation | | Subsidiaries | | Subsidiaries | | Eliminations | | Total | |
Assets | | | | | | | | | | | |
Current assets: | | | | | | | | | | | |
Cash and cash equivalents | | $ | 376.3 | | $ | 13.5 | | $ | 38.7 | | $ | — | | $ | 428.5 | |
Receivables, net | | 525.8 | | 521.4 | | 135.8 | | (93.9 | ) | 1,089.1 | |
Inventories, net | | 194.0 | | 336.8 | | 257.9 | | (1.9 | ) | 786.8 | |
Other current assets | | 86.0 | | 34.8 | | 29.4 | | — | | 150.2 | |
Total current assets | | 1,182.1 | | 906.5 | | 461.8 | | (95.8 | ) | 2,454.6 | |
Investment in and advances to consolidated subsidiaries | | 2,506.5 | | (1,402.6 | ) | 2,902.4 | | (4,006.3 | ) | — | |
Intangible assets, net | | 2.7 | | 1,131.4 | | 746.1 | | — | | 1,880.2 | |
Other long-term assets | | 167.4 | | 156.6 | | 168.1 | | — | | 492.1 | |
Total assets | | $ | 3,858.7 | | $ | 791.9 | | $ | 4,278.4 | | $ | (4,102.1 | ) | $ | 4,826.9 | |
| | | | | | | | | | | |
Liabilities and Equity | | | | | | | | | | | |
Current liabilities: | | | | | | | | | | | |
Accounts payable | | $ | 498.6 | | $ | 298.7 | | $ | 61.3 | | $ | (89.7 | ) | $ | 768.9 | |
Customer advances | | 334.8 | | 120.2 | | 13.6 | | — | | 468.6 | |
Other current liabilities | | 208.3 | | 167.1 | | 85.0 | | (6.1 | ) | 454.3 | |
Total current liabilities | | 1,041.7 | | 586.0 | | 159.9 | | (95.8 | ) | 1,691.8 | |
Long-term debt, less current maturities | | 1,020.0 | | — | | — | | — | | 1,020.0 | |
Other long-term liabilities | | 200.4 | | 172.4 | | 145.7 | | — | | 518.5 | |
Equity: | | | | | | | | | | | |
Oshkosh Corporation shareholders’ equity | | 1,596.5 | | 33.5 | | 3,972.7 | | (4,006.2 | ) | 1,596.5 | |
Noncontrolling interest | | 0.1 | | — | | 0.1 | | (0.1 | ) | 0.1 | |
Total equity | | 1,596.6 | | 33.5 | | 3,972.8 | | (4,006.3 | ) | 1,596.6 | |
Total liabilities and equity | | $ | 3,858.7 | | $ | 791.9 | | $ | 4,278.4 | | $ | (4,102.1 | ) | $ | 4,826.9 | |
102
Table of Contents
OSHKOSH CORPORATION
NOTES TO CONSOLIDATED FINANCIAL STATEMENTS
Condensed Consolidating Balance Sheet
As of September 30, 2010
| | Oshkosh | | Guarantor | | Non-Guarantor | | | | | |
| | Corporation | | Subsidiaries | | Subsidiaries | | Eliminations | | Total | |
Assets | | | | | | | | | | | |
Current assets: | | | | | | | | | | | |
Cash and cash equivalents | | $ | 202.2 | | $ | 2.5 | | $ | 134.3 | | $ | — | | $ | 339.0 | |
Receivables, net | | 481.8 | | 364.1 | | 147.4 | | (103.8 | ) | 889.5 | |
Inventories, net | | 348.4 | | 257.2 | | 244.8 | | (1.8 | ) | 848.6 | |
Other current assets | | 78.8 | | 31.0 | | 29.0 | | — | | 138.8 | |
Total current assets | | 1,111.2 | | 654.8 | | 555.5 | | (105.6 | ) | 2,215.9 | |
Investment in and advances to consolidated subsidiaries | | 2,602.3 | | (1,367.1 | ) | 3,535.1 | | (4,770.3 | ) | — | |
Intangible assets, net | | — | | 1,170.9 | | 775.0 | | — | | 1,945.9 | |
Other long-term assets | | 168.0 | | 163.1 | | 215.7 | | — | | 546.8 | |
Total assets | | $ | 3,881.5 | | $ | 621.7 | | $ | 5,081.3 | | $ | (4,875.9 | ) | $ | 4,708.6 | |
| | | | | | | | | | | |
Liabilities and Equity | | | | | | | | | | | |
Current liabilities: | | | | | | | | | | | |
Accounts payable | | $ | 588.6 | | $ | 144.7 | | $ | 85.3 | | $ | (100.9 | ) | $ | 717.7 | |
Customer advances | | 251.5 | | 106.7 | | 15.0 | | — | | 373.2 | |
Other current liabilities | | 468.3 | | 141.7 | | 115.8 | | (4.7 | ) | 721.1 | |
Total current liabilities | | 1,308.4 | | 393.1 | | 216.1 | | (105.6 | ) | 1,812.0 | |
Long-term debt, less current maturities | | 1,086.4 | | — | | — | | — | | 1,086.4 | |
Other long-term liabilities | | 159.9 | | 179.2 | | 144.3 | | — | | 483.4 | |
Equity: | | | | | | | | | | | |
Oshkosh Corporation shareholders’ equity | | 1,326.8 | | 49.4 | | 4,720.7 | | (4,770.3 | ) | 1,326.6 | |
Noncontrolling interest | | — | | — | | 0.2 | | — | | 0.2 | |
Total equity | | 1,326.8 | | 49.4 | | 4,720.9 | | (4,770.3 | ) | 1,326.8 | |
Total liabilities and equity | | $ | 3,881.5 | | $ | 621.7 | | $ | 5,081.3 | | $ | (4,875.9 | ) | $ | 4,708.6 | |
Condensed Consolidating Statement of Cash Flows
For the Year Ended September 30, 2011
| | Oshkosh | | Guarantor | | Non-Guarantor | | | | | |
| | Corporation | | Subsidiaries | | Subsidiaries | | Eliminations | | Total | |
| | | | | | | | | | | |
Net cash provided (used) by operating activities | | $ | 259.9 | | $ | (35.5 | ) | $ | 163.3 | | $ | — | | $ | 387.7 | |
| | | | | | | | | | | |
Investing activities: | | | | | | | | | | | |
Additions to property, plant and equipment | | (42.2 | ) | (27.4 | ) | (12.7 | ) | — | | (82.3 | ) |
Additions to equipment held for rental | | — | | — | | (3.9 | ) | — | | (3.9 | ) |
Intercompany investing | | 191.9 | | 100.4 | | (283.5 | ) | (8.8 | ) | — | |
Other investing activities | | (3.0 | ) | 0.8 | | 20.1 | | — | | 17.9 | |
Net cash provided (used) by investing activities | | 146.7 | | 73.8 | | (280.0 | ) | (8.8 | ) | (68.3 | ) |
| | | | | | | | | | | |
Financing activities: | | | | | | | | | | | |
Repayment of long-term debt | | (91.1 | ) | (0.3 | ) | — | | — | | (91.4 | ) |
Net repayments under revolving credit facilities | | (150.0 | ) | — | | — | | — | | (150.0 | ) |
Intercompany financing | | (1.3 | ) | (26.0 | ) | 18.5 | | 8.8 | | — | |
Other financing activities | | 9.9 | | — | | — | | — | | 9.9 | |
Net cash provided (used) by financing activities | | (232.5 | ) | (26.3 | ) | 18.5 | | 8.8 | | (231.5 | ) |
| | | | | | | | | | | |
Effect of exchange rate changes on cash | | — | | (1.0 | ) | 2.6 | | — | | 1.6 | |
Increase (decrease) in cash and cash equivalents | | 174.1 | | 11.0 | | (95.6 | ) | — | | 89.5 | |
Cash and cash equivalents at beginning of year | | 202.2 | | 2.5 | | 134.3 | | — | | 339.0 | |
Cash and cash equivalents at end of year | | $ | 376.3 | | $ | 13.5 | | $ | 38.7 | | $ | — | | $ | 428.5 | |
103
Table of Contents
OSHKOSH CORPORATION
NOTES TO CONSOLIDATED FINANCIAL STATEMENTS
Condensed Consolidating Statement of Cash Flows
For the Year Ended September 30, 2010
| | Oshkosh | | Guarantor | | Non-Guarantor | | | | | |
| | Corporation | | Subsidiaries | | Subsidiaries | | Eliminations | | Total | |
| | | | | | | | | | | |
Net cash provided (used) by operating activities | | $ | 379.2 | | $ | 17.9 | | $ | 222.6 | | $ | — | | $ | 619.7 | |
| | | | | | | | | | | |
Investing activities: | | | | | | | | | | | |
Additions to property, plant and equipment | | (56.5 | ) | (6.7 | ) | (20.0 | ) | — | | (83.2 | ) |
Additions to equipment held for rental | | — | | — | | (6.3 | ) | — | | (6.3 | ) |
Intercompany investing | | 262.2 | | 39.8 | | (253.9 | ) | (48.1 | ) | — | |
Other investing activities | | — | | (7.8 | ) | 13.4 | | — | | 5.6 | |
Net cash provided (used) by investing activities | | 205.7 | | 25.3 | | (266.8 | ) | (48.1 | ) | (83.9 | ) |
| | | | | | | | | | | |
Financing activities: | | | | | | | | | | | |
Repayment of long-term debt | | (2,020.4 | ) | (0.3 | ) | (0.2 | ) | — | | (2,020.9 | ) |
Net borrowings under revolving credit facilities | | 150.0 | | — | | — | | — | | 150.0 | |
Proceeds from issuance of long term debt | | 1,150.0 | | — | | — | | — | | 1,150.0 | |
Debt issuance/amendment costs | | (26.3 | ) | — | | — | | — | | (26.3 | ) |
Intercompany financing | | (1.3 | ) | (46.0 | ) | (0.8 | ) | 48.1 | | — | |
Other financing activities | | 24.7 | | — | | — | | — | | 24.7 | |
Net cash provided (used) by financing activities | | (723.3 | ) | (46.3 | ) | (1.0 | ) | 48.1 | | (722.5 | ) |
| | | | | | | | | | | |
Effect of exchange rate changes on cash | | — | | — | | (4.7 | ) | — | | (4.7 | ) |
Increase (decrease) in cash and cash equivalents | | (138.4 | ) | (3.1 | ) | (49.9 | ) | — | | (191.4 | ) |
Cash and cash equivalents at beginning of year | | 340.6 | | 5.6 | | 184.2 | | — | | 530.4 | |
Cash and cash equivalents at end of year | | $ | 202.2 | | $ | 2.5 | | $ | 134.3 | | $ | — | | $ | 339.0 | |
Condensed Consolidating Statement of Cash Flows
For the Year Ended September 30, 2009
| | Oshkosh | | Guarantor | | Non-Guarantor | | | | | |
| | Corporation | | Subsidiaries | | Subsidiaries | | Eliminations | | Total | |
| | | | | | | | | | | |
Net cash provided (used) by operating activities | | $ | 591.7 | | $ | (91.7 | ) | $ | 398.9 | | $ | — | | $ | 898.9 | |
| | | | | | | | | | | |
Investing activities: | | | | | | | | | | | |
Additions to property, plant and equipment | | (16.2 | ) | (12.9 | ) | (17.1 | ) | — | | (46.2 | ) |
Additions to equipment held for rental | | — | | (2.8 | ) | (12.6 | ) | — | | (15.4 | ) |
Intercompany investing | | 144.7 | | 154.6 | | (263.5 | ) | (35.8 | ) | — | |
Other investing activities | | — | | 0.7 | | 4.8 | | — | | 5.5 | |
Net cash provided (used) by investing activities | | 128.5 | | 139.6 | | (288.4 | ) | (35.8 | ) | (56.1 | ) |
| | | | | | | | | | | |
Financing activities: | | | | | | | | | | | |
Repayment of long-term debt | | (681.2 | ) | (0.3 | ) | (0.7 | ) | — | | (682.2 | ) |
Net repayments under revolving credit facilities | | (47.3 | ) | — | | (2.1 | ) | — | | (49.4 | ) |
Proceeds from issuance of Common Stock, net | | 358.1 | | — | | — | | — | | 358.1 | |
Intercompany financing | | (1.3 | ) | (46.0 | ) | 11.5 | | 35.8 | | — | |
Other financing activities | | (34.6 | ) | — | | — | | — | | (34.6 | ) |
Net cash provided (used) by financing activities | | (406.3 | ) | (46.3 | ) | 8.7 | | 35.8 | | (408.1 | ) |
| | | | | | | | | | | |
Effect of exchange rate changes on cash | | — | | 1.1 | | 6.4 | | — | | 7.5 | |
Increase (decrease) in cash and cash equivalents | | 313.9 | | 2.7 | | 125.6 | | — | | 442.2 | |
Cash and cash equivalents at beginning of year | | 26.7 | | 2.9 | | 58.6 | | — | | 88.2 | |
Cash and cash equivalents at end of year | | $ | 340.6 | | $ | 5.6 | | $ | 184.2 | | $ | — | | $ | 530.4 | |
104
Table of Contents
OSHKOSH CORPORATION
NOTES TO CONSOLIDATED FINANCIAL STATEMENTS
25.Unaudited Quarterly Results (in millions, except per share amounts)
| | Fiscal Year Ended September 30, 2009 | | Fiscal Year Ended September 30, 2008 | | | Fiscal Year Ended September 30, 2011 | |
| | 4th Quarter(a) | | 3rd Quarter | | 2nd Quarter (b) | | 1st Quarter | | 4th Quarter | | 3rd Quarter(c) | | 2nd Quarter | | 1st Quarter | | | 4th Quarter | | 3rd Quarter | | 2nd Quarter | | 1st Quarter | |
| | | | | | | | | | | | | | | | | | | | | | | | | | |
Net sales | | $ | 1,486.9 | | $ | 1,226.2 | | $ | 1,247.8 | | $ | 1,334.3 | | $ | 1,854.1 | | $ | 1,920.1 | | $ | 1,719.9 | | $ | 1,442.3 | | | $ | 2,115.4 | | $ | 2,022.9 | | $ | 1,745.6 | | $ | 1,700.8 | |
Gross income | | 242.3 | | 176.2 | | 137.2 | | 150.3 | | 279.0 | | 328.0 | | 322.8 | | 248.5 | | | 217.6 | | 272.0 | | 281.1 | | 309.0 | |
Operating income (loss) | | 118.1 | | 38.3 | | (1,172.9 | ) | 24.5 | | 132.4 | | 193.0 | | 175.9 | | 113.7 | | |
Operating income | | | 73.8 | | 126.0 | | 132.4 | | 168.7 | |
Net income | | | 38.1 | | 68.6 | | 67.7 | | 99.0 | |
| | | | | | | | | | | | | | | | | | | | | | | | | | |
Income (loss) from continuing operations | | $ | 52.4 | | $ | (22.0 | ) | $ | (1,190.3 | ) | $ | (12.4 | ) | $ | 62.4 | | $ | 102.0 | | $ | 81.0 | | $ | 41.5 | | |
Income (loss) from discontinued operations | | 87.9 | | (4.6 | ) | (1.6 | ) | (8.2 | ) | (8.7 | ) | (186.3 | ) | (8.4 | ) | (4.2 | ) | |
Net income (loss) | | $ | 140.3 | | $ | (26.6 | ) | $ | (1,191.9 | ) | $ | (20.6 | ) | $ | 53.7 | | $ | (84.3 | ) | $ | 72.6 | | $ | 37.3 | | |
| | | | | | | | | | | | | | | | | | |
Earnings (loss) per share-basic | | | | | | | | | | | | | | | | | | |
Earnings (loss) attributable to Oshkosh | | | | | | | | | | |
Corporation common shareholders | | | | | | | | | | |
From continuing operations | | $ | 0.64 | | $ | (0.30 | ) | $ | (16.00 | ) | $ | (0.17 | ) | $ | 0.84 | | $ | 1.38 | | $ | 1.10 | | $ | 0.56 | | | $ | 37.5 | | $ | 68.4 | | $ | 67.9 | | $ | 99.6 | |
From discontinued operations | | 1.06 | | (0.06 | ) | (0.02 | ) | (0.11 | ) | (0.12 | ) | (2.52 | ) | (0.12 | ) | (0.05 | ) | | — | | — | | — | | — | |
| | $ | 1.70 | | $ | (0.36 | ) | $ | (16.02 | ) | $ | (0.28 | ) | $ | 0.72 | | $ | (1.14 | ) | $ | 0.98 | | $ | 0.51 | | | $ | 37.5 | | $ | 68.4 | | $ | 67.9 | | $ | 99.6 | |
| | | | | | | | | | | | | | | | | | | | | | | | | | |
Earnings (loss) per share-diluted | | | | | | | | | | | | | | | | | | |
Earnings (loss) per share attributable to Oshkosh | | | | | | | | | | |
Corporation common shareholders-basic | | | | | | | | | | |
From continuing operations | | | $ | 0.41 | | $ | 0.75 | | $ | 0.75 | | $ | 1.10 | |
From discontinued operations | | | — | | — | | — | | — | |
| | | $ | 0.41 | | $ | 0.75 | | $ | 0.75 | | $ | 1.10 | |
| | | | | | | | | | |
Earnings (loss) per share attributable to Oshkosh | | | | | | | | | | |
Corporation common shareholders-diluted | | | | | | | | | | |
From continuing operations | | $ | 0.63 | | $ | (0.30 | ) | $ | (16.00 | ) | $ | (0.17 | ) | $ | 0.84 | | $ | 1.36 | | $ | 1.08 | | $ | 0.55 | | | $ | 0.41 | | $ | 0.75 | | $ | 0.74 | | $ | 1.09 | |
From discontinued operations | | 1.05 | | (0.06 | ) | (0.02 | ) | (0.11 | ) | (0.12 | ) | (2.48 | ) | (0.11 | ) | (0.05 | ) | | — | | — | | — | | — | |
| | $ | 1.68 | | $ | (0.36 | ) | $ | (16.02 | ) | $ | (0.28 | ) | $ | 0.72 | | $ | (1.12 | ) | $ | 0.97 | | $ | 0.50 | | | $ | 0.41 | | $ | 0.75 | | $ | 0.74 | | $ | 1.09 | |
| | | | | | | | | | | | | | | | | | | | | | | | | | |
Common Stock per share dividends | | $ | — | | $ | — | | $ | 0.10 | | $ | 0.10 | | $ | 0.10 | | $ | 0.10 | | $ | 0.10 | | $ | 0.10 | | | $ | — | | $ | — | | $ | — | | $ | — | |
(a) Included within discontinued operations for the fourth quarter of fiscal 2009 was a non cash pre-tax gain of $33.8 million on the sale of Geesink. See Note 3 of the Notes to the Consolidated Financial Statements for additional details.
(b) Results for the second quarter of fiscal 2009 include goodwill impairment charges of $1,167.8 million and long-lived asset impairment charges of $30.0 million. See Note 8 of the Notes to Consolidated Financial Statements for a discussion of the charges.
(c) Results for the third quarter of fiscal 2008 include a goodwill impairment charge of $167.4 million and a long-lived asset impairment charge of $6.8 million within discontinued operations. See Note 3 of the Notes to Consolidated Financial Statements for a discussion of the charges.
| | Fiscal Year Ended September 30, 2010 | |
| | 4th Quarter | | 3rd Quarter | | 2nd Quarter | | 1st Quarter | |
| | | | | | | | | |
Net sales | | $ | 2,105.1 | | $ | 2,439.0 | | $ | 2,864.2 | | $ | 2,434.1 | |
Gross income | | 381.4 | | 481.6 | | 627.8 | | 479.2 | |
Operating income | | 233.6 | | 340.5 | | 494.3 | | 325.7 | |
Net income | | 116.6 | | 211.2 | | 292.6 | | 169.6 | |
| | | | | | | | | |
Earnings (loss) attributable to Oshkosh | | | | | | | | | |
Corporation common shareholders | | | | | | | | | |
From continuing operations | | $ | 116.6 | | $ | 211.2 | | $ | 292.6 | | $ | 172.5 | |
From discontinued operations | | — | | — | | — | | (2.9 | ) |
| | $ | 116.6 | | $ | 211.2 | | $ | 292.6 | | $ | 169.6 | |
| | | | | | | | | |
Earnings (loss) per share attributable to Oshkosh | | | | | | | | | |
Corporation common shareholders-basic | | | | | | | | | |
From continuing operations | | $ | 1.29 | | $ | 2.34 | | $ | 3.27 | | $ | 1.93 | |
From discontinued operations | | — | | — | | — | | (0.03 | ) |
| | $ | 1.29 | | $ | 2.34 | | $ | 3.27 | | $ | 1.90 | |
| | | | | | | | | |
Earnings (loss) per share attributable to Oshkosh | | | | | | | | | |
Corporation common shareholders-diluted | | | | | | | | | |
From continuing operations | | $ | 1.28 | | $ | 2.31 | | $ | 3.22 | | $ | 1.90 | |
From discontinued operations | | — | | — | | — | | (0.03 | ) |
| | $ | 1.28 | | $ | 2.31 | | $ | 3.22 | | $ | 1.87 | |
| | | | | | | | | |
Common Stock per share dividends | | $ | — | | $ | — | | $ | — | | $ | — | |
23. Subsequent Events105
In October 2009, the Company completed the sale of its 75% interest in BAI, the Company’s European fire apparatus and equipment business, to BAI’s management team for nominal cash consideration. BAI, which was included in the Company’s fire & emergency segment, had sales of $42.2 million, $58.7 million and $49.9 million in fiscal 2009, 2008 and 2007, respectively. This business did not meet criteria to be recorded as assets held for sale as of September 30, 2009 as the Company did not receive Board of Directors approval for the sale until October 2009. The Company expects to record a small loss on the sale of BAI in the first quarter of fiscal 2010.
97
Table of Contents
ITEM 9. |
| CHANGES IN AND DISAGREEMENTS WITH ACCOUNTANTS ON ACCOUNTING AND FINANCIAL DISCLOSURE |
None.
ITEM 9A.CONTROLS AND PROCEDURES | CONTROLS AND PROCEDURES
|
Evaluation of Disclosure Controls and ProceduresProcedures.. In accordance with Rule 13a-15(b) of the Exchange Act, the Company’s management evaluated, with the participation of the Company’s Chairman of the BoardPresident and Chief Executive Officer and Executive Vice President and Chief Financial Officer, the effectiveness of the design and operation of the Company’s disclosure controls and procedures (as defined in Rule 13a-15(e) under the Exchange Act) as of September 30, 2009.2011. Based upon their evaluation of these disclosure controls and procedures, the Chairman of the BoardPresident and Chief Executive Officer and the Executive Vice President and Chief Financial Officer concluded that the disclosure controls and procedures were effective as of September 30, 20092011 to ensure that information required to be disclosed by the Company in the reports it files or submits under the Exchange Act is recorded, processed, summarized and reported, within the time period specified in the Securities and Exchange Commission rules and forms, and to ensure that information required to be disclosed by the Company in the reports it files or submits under the Exchange Act is accumulated and communicated to the Company’s management, including its principal executive and principal financial officers, as appropriate, to allow timely decisions regarding required disclosure.
Management’s Report on Internal Control Over Financial Reporting. The Company’s management is responsible for establishing and maintaining adequate internal control over financial reporting, as such term is defined in Rule 13a-15(f) of the Exchange Act. The Company’s internal control over financial reporting is designed to provide reasonable assurance regarding the reliability of financial reporting and the preparation of published financial statements in accordance with generally accepted accounting principles.
The Company’s management, with the participation of the Company’s ChairmanPresident and Chief Executive Officer and Executive Vice President and Chief Financial Officer, has assessed the effectiveness of the Company’s internal control over financial reporting based on the framework in Internal Control-Integrated Framework issued by the Committee of Sponsoring Organizations of the Treadway Commission. Based on this assessment, the Company’s management has concluded that, as of September 30, 2009,2011, the Company’s internal controls over financial reporting were effective based on that framework.
Because of its inherent limitations, internal control over financial reporting may not prevent or detect misstatements. Also, projections of any evaluation of the effectiveness to future periods are subject to the risk that the controls may become inadequate because of changes in conditions, or that the degree of compliance with the policies or procedures may deteriorate.
Deloitte & Touche LLP, the Company’s independent registered public accounting firm, issued an attestation report on the effectiveness of the Company’s internal control over financial reporting as of September 30, 2009,2011, which is included herein.
Attestation Report of Independent Registered Public Accounting Firm. The attestation report required under this Item 9A is contained in Item 8 of Part II of this Annual Report on Form 10-K under the heading “Report of Independent Registered Public Accounting Firm on Internal Control over Financial Reporting.Firm.”
Changes in Internal Control over Financial ReportingReporting.. There were no changes in the Company’s internal control over financial reporting that occurred during the quarter ended September 30, 20092011 that have materially affected, or are reasonably likely to materially affect, the Company’s internal control over financial reporting.
ITEM 9B.OTHER INFORMATION | OTHER INFORMATION
|
The Company has no information to report pursuant to Item 9B.
98106
Table of Contents
PART III
ITEM 10.DIRECTORS, EXECUTIVE OFFICERS AND CORPORATE GOVERNANCE | DIRECTORS, EXECUTIVE OFFICERS AND CORPORATE GOVERNANCE
|
The information to be included under the captions “Governance of the Company — The Board of Directors,” “Governance of the Company — Committees of the Board of Directors — Audit Committee” and “Stock Ownership — Section 16(a) Beneficial Ownership Reporting Compliance” in the Company’s definitive proxy statement for the 2012 annual meeting of shareholders, on February 4, 2010, to be filed with the Securities and Exchange Commission, is hereby incorporated by reference in answer to this item. Reference is also made to the information under the heading “Executive Officers of the Registrant” included under Part I of this report.
The Company has adopted the Oshkosh Corporation Code of Ethics Applicable to Directors and Senior Executives, that applies to the Company’s Directors, the Company’s Chairman of the Board and Chief Executive Officer,including, the Company’s President and Chief OperatingExecutive Officer, the Company’s Executive Vice President and Chief Financial Officer, the Company’s Executive Vice President, General Counsel and Secretary, the Company’s Senior Vice President Finance and Controller and the Presidents, Vice Presidents of Finance and Controllers of the Company’s business units, or persons holding positions with similar responsibilities at business units, and other persons performing similar functions.officers elected by the Company’s Board of Directors at the vice president level or higher. The Company has posted a copy of the Oshkosh Corporation Code of Ethics Applicable to Directors and Senior Executives on the Company’s website at www.oshkoshcorporation.com,, and any such Code of Ethics is available in print to any shareholder who requests it from the Company’s Secretary. The Company intends to satisfy the disclosure requirements under Item 10 of Form 8-K regarding amendments to, or waivers from, the Oshkosh Corporation Code of Ethics Applicable to Directors and Senior Executives by posting such information on its website at www.oshkoshcorporation.com.
The Company is not including the information contained on its website as part of, or incorporating it by reference into, this report.
ITEM 11.EXECUTIVE COMPENSATION | EXECUTIVE COMPENSATION
|
The information to be included under the captions “Report of the Human Resources Committee,” “Executive Compensation” and “Director Compensation” contained in the Company’s definitive proxy statement for the 2012 annual meeting of shareholders, on February 4, 2010, to be filed with the Securities and Exchange Commission, is hereby incorporated by reference in answer to this item.
ITEM 12. |
| SECURITY OWNERSHIP OF CERTAIN BENEFICIAL OWNERS AND MANAGEMENT AND RELATED STOCKHOLDER MATTERS |
The information to be included under the caption “Stock Ownership — Stock Ownership of Directors, Executive Officers and Other Large Shareholders” in the Company’s definitive proxy statement for the 2012 annual meeting of shareholders, on February 4, 2010, to be filed with the Securities and Exchange Commission, is hereby incorporated by reference in answer to this item.
99107
Table of Contents
Equity Compensation Plan Information
The following table provides information about the Company’s equity compensation plans as of September 30, 2009.2011.
Plan category | | Number of securities to
be issued upon the
exercise of outstanding
options, warrants, rights
and performance share
awards (1) | | Weighted-average
exercise price of
outstanding options,
warrants and rights | | Number of securities
remaining available for
future issuance under
equity compensation plans
(excluding securities
reflected in the first
column) (2) | | |
| | | Number of Securities
to be Issued Upon | | Weighted-Average | | Number of
Securities Remaining | |
| | | Exercise of Outstanding | | Exercise Price of | | Available for Future | |
| | | Options or Vesting of | | Outstanding | | Issuance Under Equity | |
Plan Category | | | Performance Share Awards(1) | | Options | | Compensation Plans | |
| | | | | | | | |
Equity compensation plans approved by security holders | | 5,795,109 | | $ | 28.03 | | 2,688,467 | | | 5,518,314 | | $ | 30.72 | | 345,584 | |
| | | | | | | | |
Equity compensation plans not approved by security holders | | — | | n/a | | — | | | — | | n/a | | — | |
| | | | | | | | | 5,518,314 | | $ | 30.72 | | 345,584 | |
Total | | 5,795,109 | | $ | 28.03 | | 2,688,467 | | |
(1) Represents options to purchase the Company’s Common Stock granted under the Company’s 1990 Incentive Stock Plan, as amended, 2004 Incentive Stock and Awards Plan, and 2009 Incentive Stock and Awards Plan, as amended, all of which were approved by the Company’s shareholders.
(2) Excludes 2,935 shares of nonvested Common Stock subject to a three-year vesting period, previously issued under the Company’s 2004 Incentive Stock and Awards Plan.
ITEM 13. | CERTAIN RELATIONSHIPS AND RELATED TRANSACTIONS AND DIRECTOR INDEPENDENCE
|
CERTAIN RELATIONSHIPS AND RELATED TRANSACTIONS AND DIRECTOR INDEPENDENCEThe information to be included under the caption “Governance of the Company — The Board of Directors,” “Executive Compensation — Pension Benefits,” “Executive Compensation — Potential Payments Upon Termination or Change in Control”Directors” and “Governance of the Company — Policies and Procedures Regarding Related Person Transactions” in the Company’s definitive proxy statement for the 2012 annual meeting of shareholders, on February 4, 2010, to be filed with the Securities and Exchange Commission, is hereby incorporated by reference in answer to this item.
ITEM 14.PRINCIPAL ACCOUNTING FEES AND SERVICES | PRINCIPAL ACCOUNTING FEES AND SERVICES
|
The information to be included under the caption “Report of the Audit Committee” in the Company’s definitive proxy statement for the 2012 annual meeting of shareholders, on February 4, 2010, to be filed with the Securities and Exchange Commission, is hereby incorporated by reference in answer to this item.
100108
Table of Contents
PART IV
ITEM 15. EXHIBITS AND FINANCIAL STATEMENT SCHEDULE
(a) 1.Financial Statements: The following consolidated financial statements of the Company and the report of the Independent Registered Public Accounting Firm included in the Annual Report to Shareholders for the fiscal year ended September 30, 2009,2011, are contained in Item 8:
Report of Deloitte & Touche LLP, Independent Registered Public Accounting Firm |
Consolidated Statements of Operations for the years ended September 30, 2009, 20082011, 2010 and 20072009 |
Consolidated Balance Sheets at September 30, 20092011 and 20082010 |
Consolidated Statements of Shareholders’ Equity for the years ended September 30, 2009, 20082011, 2010 and 20072009 |
Consolidated Statements of Cash Flows for the years ended September 30, 2009, 20082011, 2010 and 20072009 |
Notes to Consolidated Financial Statements |
2. Financial Statement Schedule:
All other schedules are omitted because they are not applicable, or the required information is included in the consolidated financial statements or notes thereto.
3. Exhibits:
Refer to the Exhibit Index incorporated herein by reference. Each management contract or compensatory plan or arrangement required to be filed as an exhibit to this report is identified in the Exhibit Index by an asterisk following the Exhibit Number.
101109
Table of Contents
SIGNATURES
Pursuant to the requirements of Section 13 or 15(d) of the Securities Exchange Act of 1934, the registrant has duly caused this report to be signed on its behalf by the undersigned, thereunto duly authorized.
| | OSHKOSH CORPORATION | |
| | | |
November 18, 200916, 2011 | By | /S/ Robert G. BohnCharles L. Szews | |
| | Robert G. Bohn, ChairmanCharles L. Szews, President and Chief Executive Officer
| |
110
Table of Contents
Pursuant to the requirements of the Securities Exchange Act of 1934, this report has been signed below by the following persons on behalf of the registrant and in the capacities on the dates indicated.
November 18, 200916, 2011 | By | /S/ Robert G. BohnCharles L. Szews | |
| | Robert G. Bohn, Chairman andCharles L. Szews, President, Chief Executive Officer and Director
(Principal Executive Officer)
| |
| | | |
November 18, 200916, 2011 | By | /S/ David M. Sagehorn | |
| | David M. Sagehorn, Executive Vice President and Chief Financial Officer
(Principal Financial Officer) | |
| | | |
November 18, 200916, 2011 | By | /S/ Thomas J. Polnaszek | |
| | Thomas J. Polnaszek, Senior Vice President Finance and Controller
(Principal Accounting Officer) | |
| | | |
November 18, 2009 | By
| /S/ J. William Andersen
| |
| | J. William Andersen, Director
| |
| | | |
November 18, 200916, 2011
| By | /S/ Richard M. Donnelly | |
| | Richard M. Donnelly, DirectorChairman of the Board | |
| | | |
November 18, 2009 | By
| /S/ Frederick M. Franks, Jr.
| |
| | Frederick M. Franks, Jr., Director
| |
| | | |
November 18, 200916, 2011
| By | /S/ Michael W. Grebe | |
| | Michael W. Grebe, Director | |
| | | |
November 18, 200916, 2011 | By: | /S/ Peter B. Hamilton | |
| | Peter B. Hamilton, Director | |
| | | |
November 16, 2011 | By: | /S/ John J. Hamre | |
| | John J. Hamre, Director | |
| | | |
November 18, 200916, 2011 | By | /S/ Kathleen J. Hempel | |
| | Kathleen J. Hempel, Director | |
| | | |
November 18, 200916, 2011 | By | /S/ Leslie F. Kenne | |
| | Leslie F. Kenne, Director | |
| | | |
November 16, 2011 | By | /S/ Harvey N. Medvin | |
| | Harvey N. Medvin, Director | |
| | | |
November 18, 200916, 2011 | By | /S/ J. Peter Mosling, Jr. | |
| | J. Peter Mosling, Jr., Director | |
| | | |
November 18, 200916, 2011 | By | /S/ Craig P. Omtvedt | |
| | Craig P. Omtvedt, Director | |
| | | |
November 18, 200916, 2011 | By | /S/ Duncan J. Palmer | |
| | Duncan J. Palmer, Director | |
| | | |
November 16, 2011 | By | /S/ Richard G. Sim | |
| | Richard G. Sim, Director | |
| | | |
November 18, 200916, 2011 | By | /S/ Charles L. SzewsWilliam S. Wallace | |
| | Charles L. Szews,William S. Wallace, Director President and Chief Operating Officer
| |
102111
Table of Contents
SCHEDULE II
OSHKOSH CORPORATION
VALUATION AND QUALIFYING ACCOUNTS
Allowance for Doubtful Accounts
Years Ended September 30, 2009, 20082011, 2010 and 20072009
(In millions)
Fiscal
Year | | Balance at
Beginning of
Year | | Acquisitions
of
Businesses | | Additions
Charged to
Expense | | Reductions* | | Balance at
End of Year | | | Balance at
Beginning of
Year | | Additions
Charged to
Expense | | Reductions* | | Balance at
End of Year | |
| | | | | | | | | | | | | | | | | | | | |
2007 | | $ | 7.0 | | $ | 14.8 | | $ | 9.9 | | $ | (0.7 | ) | $ | 31.0 | | |
2009 | | | $ | 24.8 | | $ | 25.7 | | $ | (8.5 | ) | $ | 42.0 | |
| | | | | | | | | | | | | | | | | | | | |
2008 | | $ | 31.0 | | $ | (4.0 | ) | $ | 2.3 | | $ | (4.5 | ) | $ | 24.8 | | |
2010 | | | $ | 42.0 | | $ | 16.6 | | $ | (16.6 | ) | $ | 42.0 | |
| | | | | | | | | | | | | | | | | | | | |
2009 | | $ | 24.8 | | $ | — | | $ | 25.7 | | $ | (8.5 | ) | $ | 42.0 | | |
2011 | | | $ | 42.0 | | $ | 2.0 | | $ | (14.5 | ) | $ | 29.5 | |
* Represents amounts written off to the reserve, net of recoveries and foreign currency translation adjustments. Fiscal 2009 also includes a $3.2 million reduction related to the disposition of Geesink. Fiscal 2010 also includes a $1.9 million reduction related to the disposition of BAI.
103112
Table of Contents
OSHKOSH CORPORATION
EXHIBIT INDEX
20092011 ANNUAL REPORT ON FORM 10-K
3.1 | | Amended and Restated Articles of Incorporation of Oshkosh Corporation (incorporated by reference to Exhibit 3.1 to the Company’s Quarterly Report on Form 10-Q for the quarter ended March 31, 2008 (File No. 1-31371)). |
| | |
3.2 | | By-Laws of Oshkosh Corporation, as amended and restated effective September 20, 2010 (incorporated by reference to Exhibit 3.1 to the Company’s Current Report on Form 8-K, dated September 23, 2010 (File No. 1-31371)). |
| | |
4.1 | | Credit Agreement, dated September 27, 2010, among Oshkosh Corporation, various subsidiaries of Oshkosh Corporation party thereto as borrowers and various lenders and agents party thereto (incorporated by reference to Exhibit 4.1 to the Company’s Current Report on Form 8-K, dated September 29, 2010 (File No. 1-31371)). |
| | |
4.2 | | Indenture, dated March 3, 2010, among the Company, the Guarantors party thereto and Wells Fargo Bank, National Association, as trustee (incorporated by reference to Exhibit 4.1 to the Company’s Current Report on Form 8-K, dated March 3, 2010 (File No. 1-31371)). |
| | |
4.3 | | First Supplemental Indenture, dated September 27, 2010, among the Company, the Guarantors party thereto and Wells Fargo Bank, National Association, as trustee (incorporated by reference to Exhibit 4.3 to the Company’s Annual Report on Form 10-K for the year ended September 30, 2010 (File No. 1-31371)). |
| | |
10.1 | | Oshkosh Corporation 1990 Incentive Stock Plan, as amended through September 15, 2008 (incorporated by reference to Exhibit 10.1 to the Company’s Annual Report on Form 10-K for the year ended September 30, 2008 (File No. 1-31371)).* |
| | |
10.2 | | Form of Oshkosh Corporation 1990 Incentive Stock Plan Nonqualified Stock Option Agreement (incorporated by reference to Exhibit 4.2 to the Company’s Registration Statement on Form S-8 (Reg. No. 33-62687)).* |
| | |
10.3 | | Form of Oshkosh Corporation 1990 Incentive Stock Plan Nonqualified Director Stock Option Agreement (incorporated by reference to Exhibit 4.3 to the Company’s Registration Statement on Form S-8 (Reg. No. 33-62687)).* |
| | |
10.4 | | First Amended and Restated Employment Agreement, effective as of January 1, 2008, between Oshkosh Corporation and Robert G. Bohn (incorporated by reference to Exhibit 10.1 to the Company’s Quarterly Report on Form 10-Q for the quarter ended December 31, 2008 (File No. 1-31371)).* |
| | |
10.5 | | Retirement Agreement, dated September 21, 2010, between Oshkosh Corporation and Robert G. Bohn (incorporated by reference to Exhibit 10.6 to the Company’s Annual Report on Form 10-K for the year ended September 30, 2010 (File No. 1-31371)).* |
| | |
10.6 | | Oshkosh Corporation Executive Retirement Plan, amended and restated effective December 31, 2008 (incorporated by reference to Exhibit 10.7 to the Company’s Annual Report on Form 10-K for the year ended September 30, 2008 (File No. 1-31371)).* |
| | |
10.7 | | Form of Key Executive Employment and Severance Agreement between Oshkosh Corporation and each of Bryan J. Blankfield, Joseph H. Kimmitt, David M. Sagehorn and Charles L. Szews (each of the persons identified has signed this form or a form substantially similar) (incorporated by reference to Exhibit 10.2 to the Company’s Quarterly Report on Form 10-Q for the quarter ended March 31, 2011 (File No. 1-31371)).* |
| | |
10.8 | | Form of Key Executive Employment and Severance Agreement between Oshkosh Corporation and each of Gregory L. Fredericksen, James W. Johnson, Wilson R. Jones, Josef Matosevic, Frank R. Nerenhausen, Michael K. Rohrkaste and Gary W. Schmiedel (each of the persons identified has signed this form or a form substantially similar) (incorporated by reference to Exhibit 10.3 to the Company’s Quarterly Report on Form 10-Q for the quarter ended March 31, 2011 (File No. 1-31371)).* |
| | |
10.9 | | Form of Key Executive Employment and Severance Agreement between Oshkosh Corporation and each of Thomas J. Polnaszek and Mark M. Radue (each of the persons identified has signed this form or a form substantially similar).* |
| | |
10.10 | | Oshkosh Corporation 2004 Incentive Stock and Awards Plan, as amended through September 15, 2008 (incorporated by reference to Exhibit 10.11 to the Company’s Annual Report on Form 10-K for the year ended September 30, 2008 (File No. 1-31371)).* |
3.1113 Amended and Restated Articles of Incorporation of Oshkosh Corporation (incorporated by reference to Exhibit 3.1 to the Company’s Quarterly Report on Form 10-Q for the quarter ended March 31, 2008 (File No. 1-31371)).
3.2 By-Laws of Oshkosh Corporation, as amended effective February 3, 2009 (incorporated by reference to Exhibit 3.1 to the Company’s Current Report on Form 8-K, dated February 6, 2009 (File No. 1-31371)).
4.1 Credit Agreement, dated December 6, 2006, among Oshkosh Corporation, the financial institutions party thereto and Bank of America, N.A., as administrative agent (incorporated by reference to Exhibit 4.1 to the Company’s Current Report on Form 8-K, dated December 6, 2006 (File No. 1-31371)).
4.2 Second Amendment, dated as of March 6, 2009, entered into by Oshkosh Corporation, Bank of America, N.A., as administrative agent and the lenders party thereto (incorporated by reference to Exhibit 4.1 to the Company’s Current Report on Form 8-K, dated March 9, 2009 (File No. 1-31371)).
10.1 Oshkosh Corporation 1990 Incentive Stock Plan, as amended through September 15, 2008 (incorporated by reference to Exhibit 10.1 to the Company’s Annual Report on Form 10-K for the year ended September 30, 2008 (File No. 1-31371)).*
10.2 Form of Oshkosh Corporation 1990 Incentive Stock Plan Nonqualified Stock Option Agreement (incorporated by reference to Exhibit 4.2 to the Company’s Registration Statement on Form S-8 (Reg. No. 33-62687)).*
10.3 Form of Oshkosh Corporation 1990 Incentive Stock Plan Nonqualified Director Stock Option Agreement (incorporated by reference to Exhibit 4.3 to the Company’s Registration Statement on Form S-8 (Reg. No. 33-62687)).*
10.4 First Amended and Restated Employment Agreement, effective as of January 1, 2008, between Oshkosh Corporation and Robert G. Bohn (incorporated by reference to Exhibit 10.1 to the Company’s Quarterly Report on Form 10-Q for the quarter ended December 31, 2008 (File No. 1-31371)).*
10.5 Amendment, effective February 1, 2009, to Amended and Restated Employment Agreement between Oshkosh Corporation and Robert G. Bohn (incorporated by reference to Exhibit 10.2 to the Company’s Quarterly Report on Form 10-Q for the quarter ended March 31, 2009 (File No. 1-31371)).*
10.6 Oshkosh Corporation Executive Retirement Plan, amended and restated effective December 31, 2008 (incorporated by reference to Exhibit 10.7 to the Company’s Annual Report on Form 10-K for the year ended September 30, 2008 (File No. 1-31371)).*
10.7 Form of Key Executive Employment and Severance Agreement between Oshkosh Corporation and each of Robert G. Bohn and Charles L. Szews (each of the persons identified have signed this form or a form substantially similar) (incorporated by reference to Exhibit 10.3 to the Company’s Quarterly Report on Form 10-Q for the quarter ended December 31, 2008 (File No. 1-31371)).*
10.8 Form of Key Executive Employment and Severance Agreement between Oshkosh Corporation and each of Bryan J. Blankfield, R. Andy Hove, Joseph H. Kimmitt, Craig E. Paylor, David M. Sagehorn, Donald H. Verhoff, Michael J. Wuest and Matthew J. Zolnowski (each of the persons identified have signed this form or a form substantially similar) (incorporated by reference to Exhibit 10.9 to the Company’s Annual Report on Form 10-K for the year ended September 30, 2008 (File No. 1-31371)).*
104
Table of Contents
10.9 Form of Key Executive Employment and Severance Agreement between Oshkosh Corporation and each of Thomas D. Fenner and Wilson R. Jones (each of the persons indentified has signed this form or a form substantially similar) (incorporated by reference to Exhibit 10.10
10.11 | | Form of Oshkosh Corporation 2004 Incentive Stock and Awards Plan Stock Option Agreement for awards granted prior to September 19, 2005 (incorporated by reference to Exhibit 4.2 to the Company’s Registration Statement on Form S-8 (Reg. No. 333-114939)).* |
| | |
10.12 | | Form of Oshkosh Corporation 2004 Incentive Stock and Awards Plan Stock Option Agreement for awards granted on and after September 19, 2005 (incorporated by reference to Exhibit 10.13 to the Company’s Annual Report on Form 10-K for the fiscal year ended September 30, 2005 (File No. 1-31371)).* |
| | |
10.13 | | Form of Oshkosh Corporation 2004 Incentive Stock and Awards Plan Non-Employee Director Stock Option Award Agreement, for awards granted prior to September 19, 2005 (incorporated by reference to Exhibit 4.3 of the Company’s Registration Statement on Form S-8 (Reg. No. 333-114939)).* |
| | |
10.14 | | Form of Oshkosh Corporation 2004 Incentive Stock and Awards Plan Non-Employee Director Stock Option Award Agreement, for awards granted on and after September 19, 2005 (incorporated by reference to Exhibit 10.15 to the Company’s Annual Report on Form 10-K for the fiscal year ended September 30, 2005 (File No. 1-31371)).* |
| | |
10.15 | | Form of Oshkosh Corporation 2004 Incentive Stock and Awards Plan Restricted Stock Award Agreement (incorporated by reference to Exhibit 10.1 to the Company’s Current Report on Form 8-K, dated September 14, 2004 (File No. 1-31371)).* |
| | |
10.16 | | Form of Oshkosh Corporation 2004 Incentive Stock and Awards Plan Non-Employee Director Restricted Stock Award Agreement (incorporated by reference to Exhibit 10.1 to the Company’s Current Report on Form 8-K, dated February 1, 2005 (File No. 1-31371)).* |
| | |
10.17 | | Summary of Cash Compensation for Non-Employee Directors.* |
| | |
10.18 | | Confidentiality and Loyalty Agreement, dated March 20, 2007, between Oshkosh Corporation and Charles L. Szews (incorporated by reference to Exhibit 10.2 to the Company’s Current Report on Form 8-K, dated March 20, 2007 (File No. 1-31371)).* |
| | |
10.19 | | Second Amended and Restated Employment Agreement, effective as of April 26, 2011, between Oshkosh Corporation and Charles L. Szews (incorporated by reference to Exhibit 10.1 to the Company’s Quarterly Report on Form 10-Q for the quarter ended March 31, 2011 (File No. 1-31371)).* |
| | |
10.20 | | Resolutions of the Human Resources Committee of the Board of Directors of Oshkosh Corporation, adopted September 17, 2007, approving terms of performance share awards under the Oshkosh Corporation 2004 Incentive Stock and Awards Plan (incorporated by reference to Exhibit 10.24 to the Company’s Annual Report on Form 10-K for the year ended September 30, 2007 (File No. 1-31371)).* |
| | |
10.21 | | Form of Oshkosh Corporation 2004 Incentive Stock and Awards Plan Stock Appreciation Rights Award Agreement (incorporated by reference to Exhibit 10.1 to the Company’s Quarterly Report on Form 10-Q for the quarter ended March 31, 2008 (File No. 1-31371)).* |
| | |
10.22 | | Oshkosh Corporation Deferred Compensation Plan for Directors and Executive Officers (incorporated by reference to Exhibit 10.2 to the Company’s Quarterly Report on Form 10-Q for the quarter ended March 31, 2008 (File No. 1-31371)).* |
| | |
10.23 | | Oshkosh Corporation 2009 Incentive Stock and Awards Plan, as amended through September 19, 2011.* |
| | |
10.24 | | Framework for Awards of Performance Shares under the Oshkosh Corporation 2009 Incentive Stock and Awards Plan (incorporated by reference to Exhibit 10.1 to the Company’s Current Report on Form 8-K, dated September 18, 2009 (File No. 1-31371)).* |
| | |
10.25 | | Form of Oshkosh Corporation 2009 Incentive Stock and Awards Plan Stock Option Award Agreement (incorporated by reference to Exhibit 10.2 to the Company’s Current Report on Form 8-K, dated September 18, 2009 (File No. 1-31371)).* |
| | |
10.26 | | Form of Oshkosh Corporation 2009 Incentive Stock and Awards Plan Stock Appreciation Rights Award Agreement for awards granted prior to September 19, 2011 (incorporated by reference to Exhibit 10.3 to the Company’s Current Report on Form 8-K, dated September 18, 2009 (File No. 1-31371)).* |
| | |
10.27 | | Form of Oshkosh Corporation 2009 Incentive Stock and Awards Plan Stock Appreciation Rights Award Agreement for awards granted on or after September 19, 2011.* |
10.10114 Oshkosh Corporation 2004 Incentive Stock and Awards Plan, as amended through September 15, 2008 (incorporated by reference to Exhibit 10.11 to the Company’s Annual Report on Form 10-K for the year ended September 30, 2008 (File No. 1-31371)).*
10.11 Form of Oshkosh Corporation 2004 Incentive Stock and Awards Plan Stock Option Agreement for awards prior to September 19, 2005 (incorporated by reference to Exhibit 4.2 to the Company’s Registration Statement on Form S-8 (Reg. No. 333-114939)).*
10.12 Form of Oshkosh Corporation 2004 Incentive Stock and Awards Plan Stock Option Agreement for awards on and after September 19, 2005 (incorporated by reference to Exhibit 10.13 to the Company’s Annual Report on Form 10-K for the fiscal year ended September 30, 2005 (File No. 1-31371)).*
10.13 Form of Oshkosh Corporation 2004 Incentive Stock and Awards Plan Non-Employee Director Stock Option Award Agreement, for awards prior to September 19, 2005 (incorporated by reference to Exhibit 4.3 of the Company’s Registration Statement on Form S-8 (Reg. No. 333-114939)).*
10.14 Form of Oshkosh Corporation 2004 Incentive Stock and Awards Plan Non-Employee Director Stock Option Award Agreement, for awards on and after September 19, 2005 (incorporated by reference to Exhibit 10.15 to the Company’s Annual Report on Form 10-K for the fiscal year ended September 30, 2005 (File No. 1-31371)).*
10.15 Form of Oshkosh Corporation 2004 Incentive Stock and Awards Plan Restricted Stock Award Agreement (incorporated by reference to Exhibit 10.1 to the Company’s Current Report on Form 8-K, dated September 14, 2004 (File No. 1-31371)).*
10.16 Form of Oshkosh Corporation 2004 Incentive Stock and Awards Plan Non-Employee Director Restricted Stock Award Agreement (incorporated by reference to Exhibit 10.1 to the Company’s Current Report on Form 8-K, dated February 1, 2005 (File No. 1-31371)).*
10.17 Summary of Cash Compensation for Non-Employee Directors (incorporated by reference to Exhibit 10.19 to the Company’s Annual Report on Form 10-K for the fiscal year ended September 30, 2005 (File No. 1-31371)).*
10.18 Confidentiality and Loyalty Agreement, dated as of March 20, 2007, between Oshkosh Corporation and Charles L. Szews (incorporated by reference to Exhibit 10.2 to the Company’s Current Report on Form 8-K, dated March 20, 2007 (File No. 1-31371)).*
10.19 First Amended and Restated Employment Agreement, effective as of January 1, 2008, between Oshkosh Corporation and Charles L. Szews (incorporated by reference to Exhibit 10.2 to the Company’s Quarterly Report on Form 10-Q for the quarter ended December 31, 2008 (File No. 1-31371)).*
10.20 Amendment, effective February 1, 2009, to Amended and Restated Employment Agreement between Oshkosh Corporation and Charles L. Szews (incorporated by reference to Exhibit 10.3 to the Company’s Quarterly Report on Form 10-Q for the quarter ended March 31, 2009 (File No. 1-31371)).*
10.21 Resolutions of the Human Resources Committee of the Board of Directors of Oshkosh Corporation, adopted September 17, 2007, approving terms of performance share awards under the Oshkosh Corporation 2004 Incentive Stock and Awards Plan (incorporated by reference to Exhibit 10.24 to the Company’s Annual Report on Form 10-K for the year ended September 30, 2007 (File No. 1-31371)).*
10.22 Form of Oshkosh Corporation 2004 Incentive Stock and Awards Plan Stock Appreciation Rights Award Agreement (incorporated by reference to Exhibit 10.1 to the Company’s Quarterly Report on Form 10-Q for the quarter ended March 31, 2008 (File No. 1-31371)).*
105
Table of Contents
10.23 Oshkosh Corporation Deferred Compensation Plan for Directors and Executive Officers (incorporated by reference to Exhibit 10.2 to the Company’s Quarterly Report on Form 10-Q for the quarter ended March 31, 2008 (File No. 1-31371)).*
10.24 Oshkosh Corporation 2009 Incentive Stock and Awards Plan (incorporated by reference to Attachment A to the Company’s definitive proxy statement on Schedule 14A for the Oshkosh Corporation Annual Meeting of Shareholders held on February 3, 2009).*
10.25 Framework for Awards of Performance Shares under the Oshkosh Corporation 2009 Incentive Stock and Awards Plan (incorporated by reference to Exhibit 10.1 to the Company’s Current Report on Form 8-K, dated September 18, 2009 (File No. 1-31371)).*
10.26 Form of Oshkosh Corporation 2009 Incentive Stock and Awards Plan Stock Option Award Agreement (incorporated by reference to Exhibit 10.2 to the Company’s Current Report on Form 8-K, dated September 18, 2009 (File No. 1-31371)).*
10.27 Form of Oshkosh Corporation 2009 Incentive Stock and Awards Plan Stock Appreciation Rights Award Agreement (incorporated by reference to Exhibit 10.3 to the Company’s Current Report on Form 8-K, dated September 18, 2009 (File No. 1-31371)).*
10.28 JLG Industries, Inc. Supplemental Executive Retirement Plan, as amended effective December 31, 2008 (incorporated by reference to Exhibit 10.24 to the Company’s Annual Report on Form 10-K for the year ended September 30, 2008 (File No. 1-31371)).* 10.29 JLG Industries, Inc. Executive Deferred Compensation Plan, as amended effective December 31, 2008 (incorporated by reference to Exhibit 10.25 to the Company’s Annual Report on Form 10-K for the year ended September 30, 2008 (File No. 1-31371)).*
10.30 JLG Industries, Inc. Executive Severance Plan, as amended and restated effective October 15, 2006 (incorporated by reference to Exhibit 10.26 to the Company’s Annual Report on Form 10-K for the year ended September 30, 2008 (File No. 1-31371)).*
10.31 JLG Industries, Inc. Executive Severance Plan Participation Agreement, dated as of October 14, 2006, between JLG Industries, Inc. and Craig E. Paylor (incorporated by reference to Exhibit 10.27 to the Company’s Annual Report on Form 10-K for the year ended September 30, 2008 (File No. 1-31371)).*
11 Computation of per share earnings (contained in Note 17 of “Notes to Consolidated Financial Statements” of the Company’s Annual Report on Form 10-K for the fiscal year ended September 30, 2009).
21 Subsidiaries of Registrant.
23 Consent of Deloitte & Touche LLP.
31.1 Certification by the Chairman and Chief Executive Officer, pursuant to Section 302 of the Sarbanes-Oxley Act, dated November 18, 2009.
31.2 Certification by the Executive Vice President and Chief Financial Officer, pursuant to Section 302 of the Sarbanes-Oxley Act, dated November 18, 2009.
32.1 Written Statement of the Chairman and Chief Executive Officer, pursuant to 18 U.S.C. ss. 1350, dated November 18, 2009.
32.2 Written Statement of the Executive Vice President and Chief Financial Officer, pursuant to 18 U.S.C. ss. 1350, dated November 18, 2009.
| | Form of Oshkosh Corporation 2009 Incentive Stock and Awards Plan Restricted Stock Award for awards granted prior to September 19, 2011 (incorporated by reference to Exhibit 10.1 to the Company’s Quarterly Report on Form 10-Q for the quarter ended December 31, 2009 (File No. 1-31371)).* |
| | |
10.29 | | Form of Oshkosh Corporation 2009 Incentive Stock and Awards Plan Restricted Stock Award for awards granted on or after September 19, 2011.* |
| | |
10.30 | | Form of Oshkosh Corporation 2009 Incentive Stock and Awards Plan Non-Employee Director Stock Option Award (incorporated by reference to Exhibit 10.2 to the Company’s Quarterly Report on Form 10-Q for the quarter ended December 31, 2009 (File No. 1-31371)).* |
| | |
11 | | Computation of per share earnings (contained in Note 21 of “Notes to Consolidated Financial Statements” of the Company’s Annual Report on Form 10-K for the year ended September 30, 2011). |
| | |
21 | | Subsidiaries of Registrant. |
| | |
23 | | Consent of Deloitte & Touche LLP. |
| | |
31.1 | | Certification by the President and Chief Executive Officer, pursuant to Section 302 of the Sarbanes-Oxley Act, dated November 16, 2011. |
| | |
31.2 | | Certification by the Executive Vice President and Chief Financial Officer, pursuant to Section 302 of the Sarbanes-Oxley Act, dated November 16, 2011. |
| | |
32.1 | | Written Statement of the President and Chief Executive Officer, pursuant to 18 U.S.C. ss. 1350, dated November 16, 2011. |
| | |
32.2 | | Written Statement of the Executive Vice President and Chief Financial Officer, pursuant to 18 U.S.C. ss. 1350, dated November 16, 2011. |
| | |
101 | | The following materials from Oshkosh Corporation’s Annual Report on Form 10-K for the year ended September 30, 2011 are furnished herewith, formatted in XBRL (Extensible Business Reporting Language): (i) the Consolidated Statements of Operations, (ii) the Consolidated Balance Sheets, (iii) the Consolidated Statements of Equity, (iv) the Consolidated Statements of Cash Flows, and (v) Notes to Consolidated Financial Statements. |
*Denotes a management contract or compensatory plan or arrangement.
106115