Table of Contents
UNITED STATES
SECURITIES AND EXCHANGE COMMISSION
Washington, D.C. 20549
FORM 10-K
(Mark One)x
xANNUAL REPORT PURSUANT TO SECTION 13 OR 15(d) OF THE SECURITIES EXCHANGE ACT OF 1934
| ANNUAL REPORT PURSUANT TO SECTION 13 OR 15(d) OF THE SECURITIES EXCHANGE ACT OF 1934
|
For the fiscal year endedended: December 31, 2011
OR2012
oTRANSITION REPORT PURSUANT TO SECTION 13 OR 15(d) OF THE SECURITIES EXCHANGE ACT OF 1934 For the transition period from to | TRANSITION REPORT PURSUANT TO SECTION 13 OR 15(d) OF THE SECURITIES EXCHANGE ACT OF 1934
|
Commission File Numberfile number: 1-31987
Hilltop Holdings Inc.
(Exact name of registrant as specified in its charter)
MARYLANDMaryland
| | 84-1477939 |
(State or other jurisdiction of
incorporation or organization)
| | (I.R.S. Employer
Identification No.)
|
200 Crescent Court, Suite 1330
| | |
200 Crescent Court, Suite 1330 Dallas, TexasTX | |
75201 |
(Address of principal executive offices) | | (zip code)Zip Code) |
(214) 855-2177
(Registrant’s telephone number, including area code)
Securities registered pursuant to Section 12(b) of the Act:
Title of each class | | Name of each exchange on which registered |
Common Stock, par value $0.01 per share | | New York Stock Exchange |
Securities registered pursuant to Section 12(g) of the Act: None
Indicate by check mark if the registrant is a well-known seasoned issuer, as defined in Rule 405 of the Securities Act. Yes o NoYes x No
Indicate by check mark if the registrant is not required to file reports pursuant to Section 13 or Section 15(d) of the Act. Yes o NoYes x No
Indicate by check mark whether the registrant (1) has filed all reports required to be filed by Section 13 or 15(d) of the Securities Exchange Act of 1934 during the preceding 12 months (or for such shorter period that the registrant was required to file such reports), and (2) has been subject to such filing requirements for the past 90 days. Yes x NoYes o No
Indicate by check mark whether the registrant has submitted electronically and posted on its corporate Web site,Website, if any, every Interactive Data File required to be submitted and posted pursuant to Rule 405 of Regulation S-T (§232.405 of this chapter) during the preceding 12 months (or for such shorter period that the registrant was required to submit and post such files). Yes x NoYes o No
Indicate by check mark if disclosure of delinquent filers pursuant to Item 405 of Regulation S-K (§229.405 of this chapter) is not contained herein, and will not be contained, to the best of registrant’s knowledge, in definitive proxy or information statements incorporated by reference in Part III of this Form 10-K or any amendment to this Form 10-K. x
Indicate by check mark whether the registrant is a large accelerated filer, an accelerated filer, a non-accelerated filer, or a smaller reporting company. See the definitions of “large accelerated filer,” “accelerated filer” and “smaller reporting company” in Rule 12b-2 of the Exchange Act.
Large accelerated filer o | | Accelerated filer x |
| | |
Non-accelerated filer o |
(Do not check if a smaller reporting company)
| Smaller reporting company o |
(Do not check if smaller reporting company)
| | |
Indicate by check mark whether the registrant is a shell company (as defined in Rule 12b-2 of the Act). Yes o NoYes x No
The aggregateAggregate market value of the voting and non-voting common stock of the registrantequity held by non-affiliates, of the registrant, computed by reference to the price at which the common stock was last sold on the New York Stock Exchange on June 30, 2011,2012, was approximately $350$408 million. For the purposes of this computation, all officers, directors and 10% stockholders were deemed to be affiliates. This determination should not be construed as an admission that such officers, directors and 10% stockholders are affiliates. The number of shares of the registrant’s common stock outstanding at March 9, 201214, 2013 was 56,502,246.83,487,340.
DOCUMENTS INCORPORATED BY REFERENCE
The Registrant’s definitive Proxy Statement pertaining to the 20122013 Annual Meeting of Stockholders, filed or to be filed not later than 120 days after the end of the fiscal year pursuant to Regulation 14A, is incorporated herein by reference into Part III.
Table of Contents
Table of ContentsTABLE OF CONTENTS
MARKET AND INDUSTRY DATA AND FORECASTS
Market and industry data and other statistical information and forecasts used throughout this Annual Report on Form 10-K (this “Annual Report”) are based on independent industry publications, government publications and reports by market research firms or other published independent sources. We have not sought or obtained the approval or endorsement of the use of this third-party information. Some data also is based on our good faith estimates, which are derived from our review of internal surveys, as well as independent sources. Forecasts are particularly likely to be inaccurate, especially over long periods of time.
Table of Contents
Unless the context otherwise indicates, all references in this Annual Report on Form 10-K to the “Company,” “Hilltop,” “HTH,” “we,” “us,” “our” or “ours” or similar words are to Hilltop Holdings Inc.(formerly known as Affordable Residential Communities Inc.) and its direct and indirect wholly-ownedwholly owned subsidiaries, references to “PlainsCapital” refer to PlainsCapital Corporation (a wholly owned subsidiary of Hilltop), references to the “Bank” refer to PlainsCapital Bank (a wholly owned subsidiary of PlainsCapital), references to “First Southwest” refer to First Southwest Holdings, LLC (a wholly owned subsidiary of the Bank) and its subsidiaries as a whole, references to “FSC” refer to First Southwest Company (a wholly owned subsidiary of First Southwest), references to “PrimeLending” refer to PrimeLending, a PlainsCapital Company (a wholly owned subsidiary of the Bank) and its subsidiaries as a whole and references to “NLASCO” refer to NLASCO, Inc. (a wholly owned subsidiary of Hilltop Holdings Inc.) and its subsidiaries as a whole. In addition, unless the context otherwise requires, references to “stockholders” are to the holders of our voting securities, which consist of our Common Stock, par value $0.01 per share..
FORWARD-LOOKING STATEMENTS
This Annual Report on Form 10-K and the documents incorporated by reference into this report include “forward-looking statements” within the meaning of Section 27A of the Securities Act of 1933, or the Securities Act, and Section 21E of the Securities Exchange Act of 1934, or the Exchange Act, as amended by the Private Securities Litigation Reform Act of 1995. All statements, other than statements of historical fact, included in this Annual Report on Form 10-K that address results or developments that we expect or anticipate will or may occur in the future, where statements are preceded by, followed by or include the words “believes,” “expects,” “may,” “will,” “would,” “could,” “should,” “seeks,” “approximately,” “intends,” “plans,” “projects,” “estimates” or “anticipates” or the negative of these words and phrases or similar words or phrases, including such things as our business strategy, our financial condition, our litigation, our efforts to make strategic acquisitions, our revenue, our liquidity and sources of funding, our capital expenditures, our products, market trends, operations and business, expectations concerning mortgage loan origination volume, expectations concerning the hiring of additional mortgage bankers, anticipated changes in our revenues or earnings, the effects of government regulation applicable to our operations, expectations concerning deposit insurance premiums, the appropriateness of our allowance for loan losses and provision for loan losses, and the collectability of margin loans are forward-looking statements.
These forward-looking statements are based on our beliefs, assumptions and expectations of our future performance taking into account all information currently available to us. These beliefs, assumptions and expectations are subject to risks and uncertainties and can change as a result of many possible events or factors, not all of which are known to us. If an event occurs, or further changes, our business, business plan, financial condition, liquidity and results of operations may vary materially from those expressed in our forward-looking statements. Certain factors that could cause actual results to differ include, among others:
·(1) changes in the acquisition market;default rate of our loans and risks associated with concentration in real estate related loans;
·our ability to find and complete strategic acquisitions with suitable merger or acquisition candidates or find other suitable ways in which to invest our capital;
·the adverse impact of external factors, such as(2) changes in general economic, market and business conditions in areas or markets where we compete;
(3) changes in the interest rates, inflationrate environment;
(4) cost and consumer confidence;availability of capital;
·
(5) changes in state and federal laws, regulations or policies affecting one or more of our business segments, including changes in regulatory fees, deposit insurance premiums, capital requirements and the conditionDodd-Frank Wall Street Reform and Consumer Protection Act (the “Dodd-Frank Act”);
(6) our participation in governmental programs, including the Small Business Lending Fund (“SBLF”);
(7) severe catastrophic events in our geographic area;
(8) failure of capital markets;our insurance segment reinsurers to pay obligations under reinsurance contracts;
·actual outcome
(9) changes in key management;
(10) approval of the resolution of any conflict;new, or changes in, accounting policies and practices;
·
(11) our ability to use net operating loss carryforwardscarry forwards to reduce future tax payments;
·the impact of the tax code
(12) competition for our banking, mortgage origination, financial advisory and rules oninsurance segments from other banks and financial institutions as well as insurance companies, mortgage bankers, investment banking and financial advisory firms, asset-based non-bank lenders and government agencies; and
(13) our financial statements;
·failure of NLASCO, Inc.’s insurance subsidiariesability to maintain their respective A.M. Best ratings;
·failure to maintain NLASCO, Inc.’s current agents;
·lack of demand for insurance products;
·cost or availability of adequate reinsurance;
·changesuse excess cash in key management;
·severe catastrophic events in our geographic area;
·failure of NLASCO, Inc.’s reinsurers to pay obligations under reinsurance contracts;
·failure of NLASCO, Inc. to maintain sufficient reserves for losses on insurance policies;
·failure to successfully implement NLASCO, Inc.’s new information technology system; and
·failure of NLASCO, Inc. to maintain appropriate insurance licenses.an effective manner.
For a furthermore detailed discussion of these and other risksfactors that may affect our business and uncertainties that could cause the actual results to differ materially from those containedanticipated in ourthese forward-looking statements, please refersee Item 1A, “Risk Factors,” and Item 7, “Management’s Discussion and Analysis of Financial Condition and Results of Operations,” herein. We caution that the foregoing list of factors is not exhaustive, and new factors may emerge, or changes to “Risk Factors” in this report. Consequently, all of the foregoing factors may occur, that could impact our business. All subsequent written and oral forward-looking statements madeconcerning our business attributable to us or any person acting on our behalf are expressly qualified in this report are qualifiedtheir entirety by thesethe cautionary statements and there can be no assurance that the actual results or developments anticipated by us will be realized, or even substantially realized, and that they will have the expected consequences to, or effects on, us and our business or operations. Forward-looking statements made in this report speak as of the date of this report or as of the date specifically referenced inabove. We do not undertake any such statement set forth in this report. Except as required by law, we undertake no obligation to update or revise any forward-looking statementsstatement, whether written or oral, relating to the matters discussed in this report.Annual Report except to the extent required by federal securities laws.
13
Table of Contents
PART I
ITEMItem 1. BUSINESSBusiness.
General Information
We are a holding company that is endeavoringhas endeavored, and continues to endeavor, to make opportunistic acquisitions or effect a business combination.combinations. In connection with thatthis strategy, on May 8, 2012 we are identifyingentered into a definitive agreement and evaluating potential targets across all industriesplan of merger with PlainsCapital Corporation, or the Merger Agreement, pursuant to which we acquired PlainsCapital Corporation on an ongoing basis. At December 31, 2011,November 30, 2012, or the Merger. Concurrent with the consummation of the Merger, we had approximately $533 million aggregate available cash and cash equivalents that may be used for this purpose. No assurances, however, can be given that we will be able to identify suitable targets, consummate acquisitions or effectbecame a combination or, if consummated, successfully integrate or operatefinancial holding company registered under the acquired business.Bank Holding Company Act of 1956 (as amended, the “Bank Holding Company Act”), as amended by the Gramm-Leach-Bliley Act of 1999 (the “Gramm-Leach-Bliley Act”).
On July, 29, 2011, we extended SWS Group, Inc, or SWS, a $50 million term loan, which bears interest at 8% per annum, is prepayable by SWS subjectPrior to certain conditions after three years, and has a maturitythe consummation of five years. SWS issued us a warrantthe Merger with PlainsCapital Corporation, our primary operations were to purchase 8,695,652 shares of SWS common stock, $0.10 par value per share, exercisable at a price of $5.75 per share subject to anti-dillution adjustments. If the warrant was fully exercised, we would own 17.4% of SWS. Additionally, we have purchased 1,475,387 shares of SWS common stock on the open market.
We also provide fire and homeowners insurance to low value dwellings and manufactured homes primarily in Texas and other areas of the south, southeastern and southwestern United States through our wholly-ownedwholly owned property and casualty insurance holding company, NLASCO, Inc., or NLASCO. We acquired NLASCO in January 2007. NLASCO operates through its wholly-ownedwholly owned subsidiaries, National Lloyds Insurance Company (NLIC),(“NLIC”) and American Summit Insurance Company (ASIC)(“ASIC”).
NLASCO targets underserved markets that require underwritingFollowing the Merger on November 30, 2012, our primary line of business is our wholly owned bank subsidiary, PlainsCapital Bank (the “Bank”). The Bank provides business and consumer banking services from offices located throughout central, north and west Texas. The Bank’s subsidiaries have specialized areas of expertise that many larger carriers have been unwilling to develop given the relatively small volume of premiums produced by local agents. Within these markets, NLASCO attempts to capitalize on its superior local knowledge to identify profitable underwriting opportunities. NLASCO believes that it distinguishes itself from competitors by delivering products that are not provided by many larger carriers, providing a high level of customer service and responding quickly to the needs of its agents and policyholders. NLASCO applies a high level of selectivity in the risks it underwrites and uses a risk-adjusted return approach to capital allocation, which NLASCO believes allows it to generate underwriting profits.
NLIC and ASIC carry a financial strength rating of “A” (Excellent) by A.M. Best. An “A” rating is the third highest of 16 rating categories used by A.M. Best. Many insurance buyers, agents and brokers use the ratings assigned by A.M. Best and other rating agencies to assist them in assessing the financial strength and overall quality of the companies from which they purchase insurance. This rating is intendedallow us to provide an independent opinionarray of an insurer’s ability to meet its obligations to policyholdersfinancial products and is not an evaluation directed at investors. This rating assignment is subject to the ability to meet A.M. Best’s expectationsservices such as to performancemortgage origination and capitalization on an ongoing basis, including with respect to management of liabilities for losses and loss adjustment expenses, and is subject to revocation or revision at any time at the sole discretion of A.M. Best.financial advisory services.
Our common stock is listed on the New York Stock Exchange, or NYSE, under the symbol “HTH.”
Our principal office is located at 200 Crescent Court, Suite 1330, Dallas, Texas 75201, and our telephone number at that location is (214) 855-2177. Our internet address is www.hilltop-holdings.com.
We currently are subject to the reporting requirements of the Exchange Act and, therefore, file annual, quarterly and current reports, proxy statements and other information with the Securities and Exchange Commission, or the SEC. These filings, and amendments to these filings, may be accessed, free of charge, on the investor relations page of our website as soon as reasonably practicable after they are electronically filed with, or furnished to, the SEC. Additionally, any materials that we file with, or furnish to, the SEC may be read and copied at the SEC’s Public Reference Room at 100 F Street, NE, Washington, D.C. 20549. Please call the SEC at 1-800-SEC-0330 for more information regarding the operations of the SEC Public Reference Room. The SEC also maintains a website, www.sec.gov, which contains reports, proxy and information statements and other information regarding issuers, such as ourselves, that file electronically with the SEC. Our codes of conduct and ethics, including amendments to, and waivers of, those codes, our corporate governance guidelines, director independence criteria and board committee charters can be accessed, free of charge, on our website, as well. We will provide, at no cost, a copy of these documents upon request by telephone or in writing at the above phone number or address, attention: Investor Relations. The references to our website address do not constitute incorporation by reference of the information contained on our website into, and should not be considered a part of, this Annual Report on Form 10-K.
2
Table of Contents
In 2011, our Chief Executive Officer certified to the NYSE, pursuant to Section 303A.12 of the NYSE’s listing standards, and that he is unaware of any violation by us of the NYSE’s corporate governance listing standards.
Company Background
We were formed in 1998 under the name “Affordable Residential Communities Inc.” as a Maryland corporation that elected to be taxed as a real estate investment trust, or REIT. Until July 2007, we primarily engaged in the acquisition, renovation, repositioning and operation of all-age manufactured home communities, the retail sale and financing of manufactured homes, the rental of manufactured homes and other related businesses, including acting as agent in the sale of homeowners’ insurance and related products, to residents and prospective residents of those communities. Our primary operations previously were conducted through an operating partnership, in which we owned a general partnership interest.
On February 18, 2004, we completed our initial public offering, or IPO.offering. Through the year ended December 31, 2005, we operated as a fully integrated, self-administered and self-managed equity REIT for U.S. federal income tax purposes. In 2006, we revoked our election as a REIT for U.S. federal income tax purposes.
In January 2007, we acquired NLASCO. NLASCO was incorporated in Delaware in 2000, but its origins trace back to 1948 through one of its subsidiaries, NLIC.
On July 31, 2007, we sold substantially all of the operating assets used in our manufactured home communities business and our retail sales and financing business to American Residential Communities LLC. We intend to make opportunistic acquisitions with certain of the remaining proceeds from this transaction and, if necessary or appropriate, from additional equity or debt financing sources. In conjunction with this transaction, we transferred to the buyer the rights to the “Affordable Residential Communities” name, changed our name to Hilltop Holdings Inc., and moved our headquarters to Dallas, Texas.
On November 30, 2012, we acquired PlainsCapital Corporation through a plan of merger, whereby PlainsCapital Corporation became our wholly owned subsidiary.
We intend to make acquisitions with certain of the remaining proceeds from the American Residential Communities transaction and, if necessary or appropriate, from additional equity or debt financing sources.
4
Table of Contents
Following the completion of the sale of our manufactured home communities businesses, our current operations havethrough November 30, 2012 consisted solely of those of NLASCO and its subsidiaries. Therefore,Given the significant recent acquisition of PlainsCapital, the remainder of our discussion focuses onincludes details concerning the banking, mortgage origination and financial advisory operations of PlainsCapital and its subsidiaries, as well as the property and casualty insurance operations of NLASCO and its subsidiaries.
Insurance OperationsOrganizational Structure
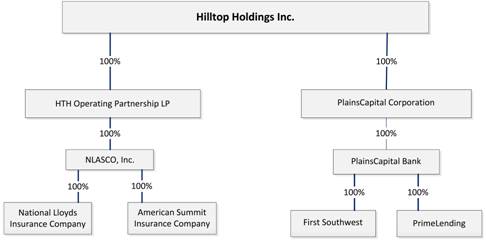
Our organizational structure is comprised of two primary operating business units, NLASCO, Inc. (insurance) and PlainsCapital Corporation (financial services and products). Within the PlainsCapital unit are three primary wholly owned subsidiaries: PlainsCapital Bank, PrimeLending and First Southwest. Under U.S. GAAP, our business units are comprised of four reportable business segments: banking, mortgage origination, insurance and financial advisory. Prior to the Merger with PlainsCapital, Hilltop operated as a single segment through its insurance subsidiary, NLASCO, given the integrated monitoring, control and management of its fire and homeowners insurance business lines. The following provides additional details regarding our updated organizational structure at December 31, 2012.
Geographic Dispersion of our Businesses
At December 31, 2012, we had $4.7 billion in deposits. The following table summarizes the geographic dispersion of our deposit portfolio at December 31, 2012 (dollars in thousands).
| | West Texas (1) | | DFW (2) | | Central/South (3) | | Other (4) | | Total | |
Demand deposits | | $ | 160,158 | | $ | 103,241 | | $ | 53,999 | | $ | 81,277 | | $ | 398,675 | |
NOW accounts | | 57,127 | | 41,162 | | 7,948 | | 325 | | 106,562 | |
Money market deposit accounts | | 804,240 | | 1,181,915 | | 370,547 | | 407 | | 2,357,109 | |
Brokered money market deposit accounts | | — | | — | | — | | 263,193 | | 263,193 | |
Other savings deposits | | 46,455 | | 52,949 | | 80,635 | | 328 | | 180,367 | |
Time deposits | | 398,908 | | 689,480 | | 84,251 | | 2,793 | | 1,175,432 | |
Brokered time deposits | | — | | — | | — | | 219,123 | | 219,123 | |
Total deposits | | 1,466,888 | | 2,068,747 | | 597,380 | | 567,446 | | 4,700,461 | |
| | | | | | | | | | | |
Percentage of total deposits | | 31.2 | % | 44.0 | % | 12.7 | % | 12.1 | % | 100.0 | % |
| | | | | | | | | | | | | | | | |
(1)“West Texas” consists of deposits originated in Lubbock, Texas.
(2)“DFW” primarily consists of deposits originated in the Dallas/Fort Worth, Texas metroplex area.
(3)“Central/South” primarily consists of deposits originated in Austin, Texas and San Antonio, Texas.
(4)“Other” consists of deposits that are not managed on a regional basis.
5
Table of Contents
At December 31, 2012, we had $3.2 billion in loans held for investment. The following table summarizes the geographic dispersion of our loan portfolio at December 31, 2012 (dollars in thousands).
| | West Texas (1) | | DFW (2) | | Central/South (3) | | Other (4) | | Total | |
Commercial and industrial | | $ | 319,234 | | $ | 729,492 | | $ | 308,686 | | $ | 302,881 | | $ | 1,660,293 | |
Real estate | | 215,553 | | 609,596 | | 359,088 | | — | | 1,184,237 | |
Construction and land development | | 23,558 | | 156,379 | | 100,537 | | — | | 280,474 | |
Consumer | | 11,886 | | 10,906 | | 4,600 | | — | | 27,392 | |
Total loans | | 570,231 | | 1,506,373 | | 772,911 | | 302,881 | | 3,152,396 | |
| | | | | | | | | | | |
Percentage of total loans | | 18.1 | % | 47.8 | % | 24.5 | % | 9.6 | % | 100.0 | % |
| | | | | | | | | | | | | | | | |
(1)“West Texas” consists of loans originated from Lubbock, Texas.
(2)“DFW” primarily consists of loans originated in the Dallas/Fort Worth, Texas metroplex area.
(3)“Central/South” primarily consists of loans originated from Austin, Texas and San Antonio, Texas.
(4)“Other” consists of margin loans held by FSC and lease financing.
For the month of December 2012, approximately 60% of PrimeLending’s origination volume was concentrated in seven states (no other state had volume of 4% or more). The following table is a summary of the origination volume by state (in thousands).
| | | | % of | |
| | Volume | | Total | |
Texas | | $ | 275,739 | | 21.4 | % |
California | | 217,100 | | 16.9 | % |
North Carolina | | 78,881 | | 6.1 | % |
Virginia | | 56,387 | | 4.4 | % |
Maryland | | 55,870 | | 4.3 | % |
Tennessee | | 53,783 | | 4.2 | % |
Arizona | | 47,507 | | 3.7 | % |
All other states | | 501,688 | | 39.0 | % |
| | $ | 1,286,955 | | 100.0 | % |
We distribute our insurance products through a broad network of independent agents in 27 states and a select number of managing general agents, referred to as MGAs. The following table sets forth our total gross written premiums by state for the periods shown (in thousands).
| | Year Ended December 31, | |
| | | | % of | | | | % of | | | | % of | |
| | 2012 | | Total | | 2011 | | Total | | 2010 | | Total | |
Texas | | $ | 118,361 | | 69.5 | % | $ | 117,046 | | 73.0 | % | $ | 107,992 | | 74.8 | % |
Oklahoma | | 15,398 | | 9.0 | % | 10,804 | | 6.7 | % | 6,777 | | 4.7 | % |
Arizona | | 13,914 | | 8.2 | % | 12,376 | | 7.7 | % | 11,268 | | 7.8 | % |
Tennessee | | 10,527 | | 6.2 | % | 9,489 | | 5.9 | % | 8,562 | | 5.9 | % |
Georgia | | 5,454 | | 3.2 | % | 4,380 | | 2.7 | % | 3,297 | | 2.3 | % |
Louisiana | | 3,081 | | 1.8 | % | 2,973 | | 1.9 | % | 3,022 | | 2.1 | % |
Missouri | | 1,244 | | 0.7 | % | 1,170 | | 0.7 | % | 1,230 | | 0.9 | % |
Nevada | | 991 | | 0.6 | % | 1,015 | | 0.6 | % | 1,015 | | 0.7 | % |
All other states | | 1,231 | | 0.7 | % | 1,188 | | 0.7 | % | 1,205 | | 0.8 | % |
Total | | $ | 170,201 | | 100.0 | % | $ | 160,441 | | 100.0 | % | $ | 144,368 | | 100.0 | % |
FSC, a diversified investment banking firm and a registered broker-dealer, competes for business nation-wide. Over 70% of its public finance financial advisory revenues are from entities located in Texas.
6
Table of Contents
Business Segments
We operate in four business segments: banking, mortgage origination, insurance and financial advisory. For more financial information about each of these business segments, see Item 7, “Management’s Discussion and Analysis of Financial Condition and Results of Operations,” herein. See also Note 27 in the notes to our consolidated financial statements included under Item 8, “Financial Statements and Supplementary Data.”
Banking
The operations of the Bank comprise our banking segment. At December 31, 2012, our banking segment had $6.2 billion in assets and total deposits of $4.7 billion. The primary sources of our deposits are residents and businesses located in the Texas markets we serve.
Business Banking. Our business banking customers primarily consist of agribusiness, energy, health care, institutions of higher education, real estate (including construction and land development) and wholesale/retail trade companies. We provide these customers with extensive banking services, such as Internet banking, business check cards and other add-on services as determined on a customer-by-customer basis. Our treasury management services, which are designed to reduce the time, burden and expense of collecting, transferring, disbursing and reporting cash, are also available to our business customers. We offer these business customers lines of credit, equipment loans and leases, letters of credit, agricultural loans, commercial real estate loans and other loan products.
The table below sets forth a distribution of the banking segment’s business loans, by type, and all other loans at December 31, 2012 (dollars in thousands). The commercial and industrial loans category includes a $1.6 billion warehouse line of credit extended to PrimeLending, of which $1.3 billion was drawn at December 31, 2012. Amounts advanced against the warehouse line are included in the table below, but are eliminated from the consolidated balance sheet.
| | | | % of Total | |
| | Amount | | Loans | |
Loans: | | | | | |
Commercial and industrial | | $ | 2,649,158 | | 64.0 | % |
Real estate | | 1,184,885 | | 28.5 | % |
Construction and land development | | 280,474 | | 6.8 | % |
Total business loans | | 4,114,517 | | 99.3 | % |
| | | | | |
All other loans | | 27,392 | | 0.7 | % |
Total loans | | $ | 4,141,909 | | 100.0 | % |
Commercial and industrial loans are primarily made within our market areas in Texas and are underwritten on the basis of the borrower’s ability to service the debt from income. In general, commercial and industrial loans involve more credit risk than residential and commercial mortgage loans and, therefore, usually yield a higher return. The increased risk in commercial and industrial loans results primarily from the type of collateral securing these loans, which typically includes commercial real estate, accounts receivable, equipment and inventory. Additionally, increased risk arises from the expectation that commercial and industrial loans generally will be serviced principally from the operations of the business, and those operations may not be successful. Historical trends have shown these types of loans to have higher delinquencies than mortgage loans. As a result of the additional risk and complexity associated with commercial and industrial loans, such loans require more thorough underwriting and servicing than loans to individuals. To manage these risks, our policy is to attempt to secure commercial and industrial loans with both the assets of the borrowing business and other additional collateral and guarantees that may be available. In addition, depending on the size of the credit, we actively monitor certain fiscal measures of the borrower, including cash flow, collateral value and other appropriate credit factors. We also have processes in place to analyze and evaluate on a regular basis our exposure to industries, products, market changes and economic trends.
The Bank also offers term financing on commercial real estate properties that include retail, office, multi-family, industrial, warehouse and non-owner occupied single family residences. Commercial mortgage lending can involve high principal loan amounts, and the repayment of these loans is dependent, in large part, on a borrower’s on-going business operations or on income generated from the properties that are leased to third parties. As a general practice, the Bank requires its commercial mortgage loans to be secured with first lien positions on the underlying property, to generate adequate equity
7
Table of Contents
margins, to be serviced by businesses operated by an established management team, and to be guaranteed by the principals of the borrower. The Bank seeks lending opportunities where cash flow from the collateral provides adequate debt service coverage and/or the guarantor’s net worth is comprised of assets other than the project being financed.
The Bank offers construction financing for (i) commercial, retail, office, industrial, warehouse and multi-family developments, (ii) residential developments and (iii) single family residential properties. Loans to finance these transactions are generally secured by first liens on the underlying real property. We generally require that the subject property of a construction loan for commercial real estate be pre-leased. The Bank conducts periodic completion inspections, either directly or through an agent, prior to approval of periodic draws on these loans. Construction loans involve additional risks because loan funds are advanced upon the security of a project under construction, and the project is of uncertain value prior to its completion. Because of uncertainties inherent in estimating construction costs, the market value of the completed project and the effects of governmental regulation on real property, it can be difficult to accurately evaluate the total funds required to complete a project and the related loan-to-value ratio. As a result of these uncertainties, construction lending often involves the disbursement of substantial funds with repayment dependent, in part, on the success of the ultimate project rather than the ability of a borrower or guarantor to repay the loan. If the Bank is forced to foreclose on a project prior to completion, it may not be able to recover the entire unpaid portion of the loan. Additionally, it may be required to fund additional amounts to complete a project and may have to hold the property for an indeterminate period of time.
In addition to the real estate lending activities described above, a portion of the Bank’s real estate portfolio consists of single family residential mortgage loans typically collateralized by owner occupied properties located in its market areas. These residential mortgage loans are generally secured by a first lien on the underlying property and have maturities of five years or less. Longer term mortgage financing is provided for certain customers within the Bank’s private banking group. At December 31, 2012, the Bank had $199.1 million in one-to-four family residential loans, which represented 4.80% of its total loans held for investment.
Personal Banking. We offer a broad range of personal banking products and services for individuals. Similar to our business banking operations, we also provide our personal banking customers with a variety of add-on features such as check cards, safe deposit boxes, Internet banking, bill pay, overdraft privilege services, gift cards and access to automated teller machine (ATM) facilities throughout the United States. We offer a variety of deposit accounts to our personal banking customers including savings, checking, interest-bearing checking, money market and certificates of deposit.
We loan to individuals for personal, family and household purposes, including lines of credit, home improvement loans, home equity loans, credit cards and loans for purchasing and carrying securities. At December 31, 2012, we had $27.4 million of loans for these purposes, which are shown in the previous table as “All other loans.”
Wealth and Investment Management. Our private banking team personally assists high net worth individuals and their families with their banking needs, including depository, credit, asset management, and trust and estate services. We offer trust and asset management services in order to assist these customers in managing, and ultimately transferring, their wealth. Our wealth management services provide personal trust, investment management and employee benefit plan administration services, including estate planning, management and administration, investment portfolio management, employee benefit accounts and individual retirement accounts.
Mortgage Origination
Our mortgage origination segment operates through a wholly owned subsidiary of the Bank, PrimeLending. Founded in 1986, PrimeLending is a residential mortgage banker licensed to originate and close loans in all 50 states and the District of Columbia. At December 31, 2012, it operated from 280 locations in 42 states, originating approximately 21% of its mortgages from its Texas locations and approximately 17% of its mortgages from locations in California. The mortgage lending business is subject to seasonality, as we typically experience increased loan origination volume from purchases of homes during the spring and summer, when more people tend to move and buy or sell homes, and the overall demand for mortgage loans is driven largely by the applicable interest rates at any given time.
PrimeLending handles loan processing, underwriting and closings in-house. Mortgage loans originated by PrimeLending are funded through a warehouse line of credit maintained with the Bank. PrimeLending sells substantially all mortgage loans it originates to various investors in the secondary market, servicing released, although PrimeLending may retain servicing under certain conditions. As these mortgage loans are sold in the secondary market, PrimeLending pays down its warehouse line of credit with the Bank. Loans sold are subject to certain standard indemnification provisions with investors, including the repurchase of loans sold and the repayment of sales proceeds to investors under certain conditions.
8
Table of Contents
Our mortgage lending underwriting strategy, driven in large measure by secondary market investor standards, seeks to originate substantially only conforming loans. Our underwriting practices include:
·granting loans on a sound and collectible basis;
·obtaining a balance between maximum yield and minimum risk;
·ensuring that primary and secondary sources of repayment are adequate in relation to the amount of the loan; and
·ensuring that each loan is properly documented and, if appropriate, adequately insured.
In addition to its branch office network, PrimeLending, through PrimeLending Ventures, LLC, establishes “affiliated business arrangements” to originate residential mortgages for customers of referring business partners and for other customers not associated with business partners. At December 31, 2012, PrimeLending Ventures, LLC had two active affiliated business arrangements.
Since its inception in 1986, PrimeLending has grown from originating approximately $80 million in mortgage loans annually with a staff of 20 individuals to originating $13.7 billion in loans in 2012 with approximately 2,650 employees. PrimeLending offers a variety of loan products catering to the specific needs of borrowers seeking purchase or refinancing options, including 30-year and 15-year fixed rate conventional mortgages, adjustable rate mortgages, jumbo loans, and Federal Housing Administration (FHA) and Veteran Affairs (VA) loans. Mortgage loans originated by PrimeLending are secured by a first lien on the underlying property. PrimeLending does not currently originate subprime loans (which we define to be loans to borrowers having a Fair Isaac Corporation (FICO) score lower than 620 or that do not comply with applicable agency or investor-specific underwriting guidelines).
Insurance
The operations of NLASCO comprise our insurance segment. NLASCO specializes in providing fire and limited homeowners insurance for low value dwellings and manufactured homes primarily in Texas and other areas of the south, southeastern and southwestern United States. NLASCO has expanded itsNLASCO’s product line to includealso includes enhanced homeowners products offering higher coverage limits.limits with distribution restricted to select agents. NLASCO targets underserved markets thatthrough a broad network of independent agents in 27 states and a select number of MGAs, which require underwriting expertise that many larger carriers have been unwilling to develop given the relatively small volume of premiums produced by local agents. Within these markets, NLASCO attempts to capitalize on its superior local knowledge to identify profitable underwriting opportunities. NLASCO believes that it distinguishes itself from competitors by delivering products that are not provided by many larger carriers, providing a high level of customer service and responding quickly to the needs of its agents and policyholders. NLASCO applies a high level of selectivity in the risks it underwrites, which we believe will generate underwriting profits.
Ratings. Many insurance buyers, agents and brokers use the ratings assigned by A.M. Best and other rating agencies to assist them in assessing the financial strength and overall quality of the companies from which they purchase insurance. BothThe ratings for NLIC and ASIC carry a financial strength rating of “A” (Excellent) were affirmed by A.M. Best in April 2012. An “A” rating is the third highest of 16 rating categories used by A.M. Best.
The Insurance Industry
The property In evaluating a company’s financial and casualty insurance industry provides protection from pre-specifiedoperating performance, A.M. Best reviews a company’s profitability, leverage and liquidity, as well as its book of business, the adequacy and soundness of its reinsurance, the quality and estimated market value of its assets, the adequacy of its liabilities for losses and loss events, suchadjustment expenses (“LAE”), the adequacy of its surplus, its capital structure, the experience and competence of its management and its market presence. This rating assignment is subject to the ability to meet A.M. Best’s expectations as damage to propertyperformance and capitalization on an ongoing basis, and is subject to revocation or liability claims by third parties. Propertyrevision at any time at the sole discretion of A.M. Best. NLASCO cannot ensure that NLIC and casualty insurance can be broadly classified into two lines; personal lines, in which insurance is provided to individuals, and commercial lines, in which insurance is provided to business enterprises. In the U.S., personal and commercial insurance products are written in admitted and non-admitted markets, also known as the excess and surplus lines market. NLASCO provides insurance products in the personal line and the commercial line markets.
3
Table of ContentsASIC will maintain their present ratings.
In the admitted market, insurers are authorized by state insurance departments to doProduct Lines. NLASCO’s business insurance ratesis conducted in two product lines: personal lines and forms are generally highly regulated and coverage tends to be standardized. Within the admitted market, NLASCO focuses on underserved segments that do not fit into the standard underwriting criteria of national insurance companies due to several factors, such as type of business, location and the amount of premium per policy. This portion of the market tends to have limited competition. Therefore, NLASCO believes it has greater flexibility in pricing and product design relative to most admitted market risks.
commercial lines. The non-admitted market focuses on harder-to-place risks that admitted insurers typically do not write. In this market, risks are underwritten with more flexible policy forms and rates, resulting in more restrictive and expensive coverage. NLASCO writes in this market for itspersonal lines include homeowners, dwelling fire, homeowner,manufactured home, flood and mobile home business in Louisiana.
vacant policies. The propertycommercial lines include commercial, builders risk, builders risk renovation, sports liability and casualty insurance industry, historically, has been subject to cyclical fluctuations in pricing and availability of insurance coverage. “Soft” markets are often characterized by excess underwriting capital and involve intense price competition, erosion of underwriting discipline and poor operating performance. These market conditions usually lead to a period of diminished underwriting capacity after insurance companies exit unprofitable lines and exhibit greater underwriting discipline and increase premium rates. This latter market condition is called a “hard” market. The insurance market may not always be hard or soft; rather, it could be hard for one line of business and soft for another. The market at the start of 2012 is likely to be characterized as soft for property risks in NLASCO’s operating area; however, in coastal areas, due to the hurricane activity in recent years, those markets are considered hard.
Product Linesinland marine policies.
Personal and Commercial Lines
The NLASCO companies specialize in writing fire and homeowners insurance coverage for low value dwellings and manufactured homes. The vast majority of NLASCO’s property coverage is written on policies that provide actual cash value payments, as opposed to replacement cost. Under actual cash value policies, the insured is entitled to receive only the cost of replacing or repairing damaged or destroyed property with comparable new property, less depreciation. Additionally, most of NLASCO’s property policies exclude coverage for water and mold damage.
In 2010, NLASCO expanded its homeowners insurance products to include replacement cost coverage, which also includes limited water coverage. These new products are being marketed and sold primarily in various states; however, the primary market is Texas. The development and implementation of these new products has contributed to the premium growth at NLASCO in 2011.2011 and 2012.
NLASCO’s business is conducted with two product lines, its personal lines and its commercial lines. The personal lines include homeowners, dwelling fire, manufactured home, flood and vacant policies. The commercial lines include commercial, builders risk, builders risk renovation, sports liability and inland marine policies.
4
Table of Contents
Set forth below is certain financial data broken down by line of business (in millions):
| | For The Year Ended December 31, | |
| | 2011 | | 2010 | | 2009 | |
Gross Premiums Written | | | | | | | |
Personal lines | | $ | 151.7 | | $ | 136.5 | | $ | 129.5 | |
Commerical lines | | 8.7 | | 7.9 | | 6.7 | |
Total | | $ | 160.4 | | $ | 144.4 | | $ | 136.2 | |
| | | | | | | |
Net Operating income | | | | | | | |
Personal lines | | $ | 0.1 | | $ | 4.9 | | $ | 5.9 | |
Commerical lines | | — | | 2.3 | | 0.8 | |
Total | | $ | 0.1 | | $ | 7.2 | | $ | 6.7 | |
| | | | | | | |
Total Assets | | | | | | | |
Personal lines | | $ | 290.2 | | $ | 297.5 | | $ | 256.3 | |
Commerical lines | | 26.7 | | 27.4 | | 23.6 | |
Total | | $ | 316.9 | | $ | 324.9 | | $ | 279.9 | |
Geographic Markets
The following table sets forth NLASCO’s total gross written premiums by state for the periods shown (in millions):
| | For The Year Ended December 31, | |
| | 2011 | | 2010 | | 2009 | |
Gross Written Premiums | | | | | | | |
Texas - Flood | | $ | 6.1 | | $ | 5.9 | | $ | 5.9 | |
Texas - North | | 24.9 | | 26.2 | | 20.7 | |
Texas - South | | 30.6 | | 29.6 | | 34.4 | |
Texas - Central | | 16.0 | | 9.6 | | 9.4 | |
Texas - West | | 14.0 | | 15.5 | | 13.0 | |
Texas - Panhandle | | 7.3 | | 7.1 | | 6.8 | |
Texas - East | | 18.0 | | 14.1 | | 13.4 | |
| | | | | | | |
Texas - Total | | 116.9 | | 108.0 | | 103.7 | |
| | | | | | | |
Arizona | | 12.4 | | 11.3 | | 11.3 | |
Tennessee | | 9.5 | | 8.6 | | 7.8 | |
Oklahoma | | 10.8 | | 6.8 | | 5.1 | |
Georgia | | 4.4 | | 3.3 | | 1.6 | |
Louisiana | | 3.0 | | 3.0 | | 3.0 | |
Missouri | | 1.2 | | 1.2 | | 1.4 | |
Nevada | | 1.0 | | 1.0 | | 1.1 | |
All other states | | 1.2 | | 1.2 | | 1.2 | |
TOTAL | | $ | 160.4 | | $ | 144.4 | | $ | 136.2 | |
NLASCO underwrites insurance coverage primarily in Texas. It also underwrites in other states in the south and southwest regions.
5
Table of Contents
Distribution
NLASCO distributes its insurance products through a broad network of independent agents in 23 states and a select number of managing general agents, referred to as MGAs. NLASCO has a preference for doing business with agents that desire a long-term relationship that will result in mutual profitability and value for both parties. NLASCO believes that “relationship” agents are more oriented to the long-term and desire a meaningful relationship with their customers and the insurers they represent. NLASCO’s top ten agents accounted for only 10.8%, 9.9% and 9.9% of direct premiums written in 2011, 2010 and 2009, respectively, and as of December 31, 2011, the average tenure of the top 25 agencies was over 13 years.
Underwriting and Pricing
. NLASCO applies its regional expertise, underwriting discipline and a risk-adjusted, return-on-equity basedreturn-on-equity-based approach to capital allocation to primarily offer short-tail insurance products in its target markets. NLASCO’s
9
Table of Contents
underwriting process involves securing an adequate level of underwriting information from its independent agents, identifying and evaluating risk exposures and then pricing the risks it chooses to accept.
NLASCO employs a disciplined underwriting approach that incorporates the continuously refined stratification of its target markets to permit it to tailor its policies to individual risks and adopt pricing structures that will be supported in the applicable market. NLASCO utilizes underwriting principles and processes that reflect the knowledge and experience it has acquired during its 40-plus year history of underwriting risks. NLASCO believes that this comprehensive process capitalizes on its knowledge and expertise and results in better underwriting decisions.
Pricing levels are established by NLASCO’s senior management with the assistance of a consulting actuary. Pricing balances NLASCO’s return requirements along with the legal/regulatory environment in each particular geographic region. Management reviews pricing on an ongoing basis to monitor any emerging issues. NLASCO’s statistical database allows this analysis to be performedissues on a specific coverage or geographic territory. In 2011, ASIC increased premium rates in Arizona and NLIC increased rates in Georgia, Oklahoma, Texas and Tennessee.
Catastrophe ExposureExposure.
NLASCO maintains a comprehensive risk management strategy, which includes actively monitoring its catastrophe prone territories by zip code to ensure a diversified book of risks. NLASCO utilizes software and risk support from its reinsurance brokers to analyze its portfolio and catastrophe exposure. Biannually, NLASCO has its entire portfolio analyzed by its reinsurance broker who utilizes hurricane models to predict risk. Based on this information and management’s active role in risk management, NLASCO makes decisions on what geographic areas to write risks. Over the years, NLASCO has adjusted its business based on its perceived risk of catastrophe losses. For example, in 2005, ASIC withdrew from the Mississippi market to mitigate its catastrophe exposure in that area, and in 2006, it stopped writing new policies that cover wind damage along the seacoast of Louisiana. In 2009, NLASCO decided not to renew wind policies for properties within the Texas seacoast. All policies in coastal areas excluded wind by the end of February 2011.
In recent years, NLASCO’s catastrophe exposure primarily resulted from property policies in Cameron, Harris, Jefferson and Nueces Counties in Texas, which include the densely populated Houston metropolitan area and the cities extending from the northern tip to the southern point on the Texas Gulf Coast. All of this territory is exposed to potential wind storm activity from the Gulf of Mexico. By not renewing wind policies on the Texas seacoast, which is exposed to the majority of potential wind storm activity, NLASCO’s primary catastrophe exposure will be limited to property policies in Harris County. NLASCO also is exposed to hail and other catastrophic events in the Texas panhandle and plains states.
6
Table of Contents
Terrorism Risk Insurance Act of 2002, Terrorism Risk Insurance Extension Act of 2005 and Terrorism Risk Insurance Program Reauthorization Act of 2007Reinsurance.
On November 26, 2002, the Terrorism Risk Insurance Act of 2002 was enacted into Federal law and established the Terrorism Risk Insurance Program, or the Program. The Program is a Federal program that provides for a system of shared public and private compensation for insured losses resulting from acts of terrorism or war. The Program was scheduled to terminate on December 31, 2005. On December 22, 2005, the Terrorism Risk Insurance Extension Act of 2005 was enacted into Federal law, reauthorizing the Program through December 31, 2007, while reducing the Federal role under the Program. On December 26, 2007, the Terrorism Risk Insurance Program Reauthorization Act, or the Reauthorization Act, was enacted into Federal law, reauthorizing the Program through December 31, 2014 and implementing several changes to the Program.
In order for a loss to be covered under the Program, as presently constituted, aggregate industry losses of $100 million must be satisfied. Further, the losses must be the result of an event that is certified as an act of terrorism by the U.S. Secretary of the Treasury, Secretary of State and Attorney General. The original Program excluded from participation certain of the following types of insurance: Federal crop insurance, private mortgage insurance, financial guaranty insurance, medical malpractice insurance, health or life insurance, flood insurance and reinsurance. The 2005 Act exempted from coverage certain additional types of insurance, including commercial automobile, professional liability (other than directors and officers), surety, burglary and theft and farm-owners multi-peril. In the case of a war declared by Congress, only workers’ compensation losses are covered by the Program. The Program generally requires that all commercial property and casualty insurers licensed in the United States participate in the Program. Under the Program, a participating insurer is entitled to be reimbursed by the Federal government for a percentage of subject losses, after an insurer deductible, subject to an annual cap. The Federal reimbursement percentage was fixed by the Reauthorization Act at 85%. The deductible is calculated by applying the deductible percentage to the insurer’s direct earned premiums for covered lines. The deductible under the Program is fixed at 20%. NLASCO’s deductible under the Program was $1.6 million for 2011 and is estimated to be $1.6 million in 2012. The annual cap limits the amount of aggregate subject losses for all participating insurers to $100 billion. Once subject losses have reached $100 billion aggregate amount during a Program year, there is no additional reimbursement from the U.S. Treasury and an insurer that has met its deductible for the program year is not liable for any losses that exceed the $100 billion cap. When insured losses under the Program exceed the $100 billion cap, the insured losses are subject to pro-rata sharing based upon regulations promulgated by the U.S. Treasury. Additionally, under the Reauthorization Act, the timing of mandatory recoupment of the Federal reimbursement through policyholder surcharges was accelerated.
On December 14, 2009, two final rules with respect to the Program were published in the Federal Register. The first rule describes how the Treasury will calculate the amounts to be recouped from insurers and establishes procedures for insurers to use in collecting Federal Terrorism Policy Surcharges and remitting them to the Treasury. The second rule describes how the Treasury intends to determine the pro rata share of insurance losses under the Program when losses otherwise would exceed the annual monetary cap. NLASCO had no terrorism-related losses in 2011.
Reinsurance
NLASCO purchases reinsurance to reduce its exposure to liability on individual risks and claims and to protect against catastrophe losses. NLASCO’s management believes that less volatile, yet reasonable returns are in the long-term interest of NLASCO and, as a result, maintains a conservative reinsurance program. NLASCO generated direct premiums written totaling $154.3 million, net of flood policies, in 2011 and paid approximately $11.8 million in catastrophe reinsurance premiums prior to any reinstatement premiums.NLASCO.
Reinsurance involves an insurance company transferring, or ceding, a portion of its risk to another insurer, the reinsurer. The reinsurer assumes the exposure in return for a portion of the premium. The ceding of risk to a reinsurer does not legally discharge the primary insurer from its liability for the full amount of the policies on which it obtains reinsurance. Accordingly, the primary insurer remains liable for the entire loss if the reinsurer fails to meet its obligations under the reinsurance agreement, and as a result, the primary insurer is exposed to the risk of non-payment by its reinsurers.
We believe that NLASCO’s financial stability is substantially protected from catastrophic events through several excess of loss reinsurance contracts that combine to provide a mix of coverage against various types and combinations of catastrophe losses. As noted in the section titled “Risk Factors,” NLASCO is exposed to catastrophic losses that could exceed the limits of reinsurance and negatively impact its financial position and results of operations. The Company purchases catastrophe excess of loss reinsurance to a limit that exceeds the Hurricane 200-year return time as modeled by RMS Risk Link v. 11.0 and exceeds the Hurricane 500-year return time as modeled by AIR Classic v 13.0.
7
Table of Contents
In formulating its reinsurance programs, NLASCO believes that it is selective in its choice of reinsurers and considers numerous factors, the most important of which are the financial stability of the reinsurer, its history of responding to claims and its overall reputation. In an effort to minimize exposure to the insolvency of reinsurers, NLASCO evaluates the acceptability, and continuously monitors the financial condition, of each reinsurer. NLASCO enters into reinsurance agreements only with reinsurers that have an A.M. Best financial strength rating of “A- (Excellent)” (fourth highest of 16 categories) or better, or at least an “A” rating by Standard & Poors. If a reinsurer rating subsequently drops below “A- (Excellent),” NLASCO can cancel or replace the reinsurer. As of December 31, 2011, 100% of NLASCO’s paid loss recoverables were from reinsurers rated “A- (Excellent)” or better by A.M. Best. To further minimize exposure to reinsurer insolvency, NLASCO spreads reinsurance treaties among many reinsurers. NLASCO reviews retention levels each year to maintain a balance between the growth in surplus and the cost of reinsurance. NLASCO had no losses from unrecoverable reinsurance in 2011.
NLASCO’s ten largest net receivable balances from reinsurers as of, and for the year ended, December 31, 2011 were as follows (in millions):
| | Year Ended December 31, 2011 | |
| | A.M. Best | | | | Balances | | | | | |
| | Financial | | | | Due from | | Prepaid | | Net | |
| | Strength | | Ceded | | Reinsurance | | Reinsurance | | Receivable | |
| | Rating | | Premiums | | Companies | | Premiums | | Balance(1) | |
Federal Emergency Management Agency | | N/A | | $ | 6.1 | | $ | 1.1 | | $ | 5.1 | | $ | 6.2 | |
Endurance Specialty Insurance Ltd | | A | | — | | 3.3 | | — | | 3.3 | |
Ariel Reinsurance Company Limited | | A- | | 0.6 | | 1.1 | | — | | 1.1 | |
Platinum Underwriters Reinsurance, Inc. | | A | | 0.4 | | 2.4 | | — | | 2.4 | |
Munich Reinsurance America, Inc. | | A+ | | 1.1 | | 1.6 | | — | | 1.6 | |
MS Frontier Reinsurance Limited | | A | | 0.1 | | 1.6 | | — | | 1.6 | |
Arch Reinsurance Company | | A | | 1.4 | | 1.3 | | — | | 1.3 | |
Validus Reinsurance Ltd | | A | | — | | 1.2 | | — | | 1.2 | |
Paladin Catastrophe Management LLC | | A+ | | — | | 1.1 | | — | | 1.1 | |
Amlin AG | | A | | 0.7 | | 1.1 | | — | | 1.1 | |
| | | | | | | | | | | | | | | |
(1) The net receivable balance includes balances due from reinsurance companies, contingent commissions, prepaid reinsurance premiums and ceded contingent commissions, less balances due to reinsurance companies.
As of December 31, 2011, NLASCO had five layers of catastrophicpurchases catastrophe excess of loss reinsurance coverage up to $170 million of losses per event in excess of $1 million retentiona limit that exceeds the Hurricane 250-year return time as modeled by ASICRMS Risk Link v.11.0 and $8 million retentionexceeds the Hurricane 500-year return time as modeled by NLIC. The reinsurance from $8 million to $50 million loss is comprised of two layers of protection: $17 million in excess of $8 million loss; $25 million in excess of $25 million loss. The third layer provides coverage for $50 million in excess of $50 million loss; the fourth layer provides coverage of $50 million in excess of $100 million loss and the fifth layer provides coverage of $20 million in excess of $150 million loss. The fifth layer is not fully subscribed, with participants accounting for 79% of the total layer. Accordingly, NLASCO retains 21% of the losses in the fifth layer. NLIC and ASIC retain no participation in any of the other layers, beyond the first $8 million and $1.0 million, respectively.AIR Classic v.14.0.
As of January 1, 2012, the Company renewed its reinsurance contract for its first and second layers of reinsurance. Per the contract renewal, NLASCO changed its underlying coverage at ASIC to $6.5 million in excess of $1.5 million retention. The reinsurance in excess of $8 million is comprised of five layers of protection: $17 million in excess of $8 million retention; $25 million in excess of $25 million loss; $50 million in excess of $50 million loss; $50 million in excess of $100 million loss and $20 million in excess of $150 million loss. The fifth layer is not fully subscribed, with participants accounting for 79% of the total layer. NLIC and ASIC retain no participation in any of the layers, other than the first $8 million and $1.5 million retention, respectively. The projected premiums on these treaties for NLIC and ASIC are $10.1and $2.8 million, respectively, in 2012.
As of December 31, 2011, total retention for any one catastrophe that affects both NLIC and ASIC is limited to $8 million in the aggregate.
8
Table of Contents
In addition to the catastrophe reinsurance noted above, both NLIC and ASIC participate in an excess of loss program with General Reinsurance Corporation. The General Reinsurance Corporation program is limited to each risk with respect to property and liability in the amount of $800,000 for each of NLIC and ASIC. Each of NLIC and ASIC retain $200,000 in this program. On January 1, 2012, the program will limit each risk for property and liability in the amount of $775,000 for each NLIC and ASIC, with the retention increasing to $225,000.
Liabilities for Unpaid Losses and Loss Adjustment ExpensesExpenses.
NLASCO’s liabilities for losses and loss adjustment expenses include liabilities for reported losses, liabilities for incurred but not reported, or IBNR, losses and liabilities for loss adjustment expenses, or LAE, less a reduction for reinsurance recoverables related to those liabilities. The amount of liabilities for reported claims is based primarily on a claim-by-claim evaluation of coverage, liability, injury severity or scope of property damage, and any other information considered relevant to estimating exposure presented by the claim. The amounts of liabilities for IBNR losses and LAE are estimated on the basis of historical trends, adjusted for changes in loss costs, underwriting standards, policy provisions, product mix and other factors. Estimating the liability for unpaid losses and LAE is inherently judgmental and is influenced by factors that are subject to significant variation. Liabilities for LAE are intended to cover the ultimate cost of settling claims, including investigation and defense of lawsuits resulting from such claims. Based upon the contractual terms of the reinsurance agreements, reinsurance recoverables offset, in part, NLASCO’s gross liabilities.
Significant periods of time can elapse between the occurrence of an insured loss, the reporting of the loss to the insurer and the insurer’s payment of that loss. NLASCO’s liabilities for unpaid losses represent the best estimate at a given point in time of what it expects to pay claimants, based on facts, circumstances and historical trends then known. During the loss settlement period, additional facts regarding individual claims may become known and, consequently, it often becomes necessary to refine and adjust the estimates of liability.
The table below presents one-year development information on changes in the liability for losses and LAE and a reconciliation of liabilities on a direct premiums written and net premiums written basis for the twelve months ended December 31, 2011 and 2010 (in thousands):
| | 2011 | | 2010 | |
| | | | | |
Balance at January 1, | | $ | 58,882 | | $ | 33,780 | |
Less reinsurance recoverables | | (43,773 | ) | (21,102 | ) |
Net balance at January 1, | | 15,109 | | 12,678 | |
| | | | | |
Incurred related to: | | | | | |
Current Year | | 97,742 | | 69,044 | |
Prior Period | | (1,008 | ) | 1,899 | |
Total incurred | | 96,734 | | 70,943 | |
| | | | | |
Payments related to: | | | | | |
Current Year | | (83,266 | ) | (59,560 | ) |
Prior Year | | (8,825 | ) | (8,952 | ) |
Total payments | | (92,091 | ) | (68,512 | ) |
| | | | | |
Net balance at December 31, | | 19,752 | | 15,109 | |
Plus reinsurance recoverables | | 25,083 | | 43,773 | |
Balance at December 31, | | $ | 44,835 | | $ | 58,882 | |
The decrease in reserves for the twelve months ended December 31, 2011, as compared to the same period in 2010, of $14.0 million is due to a decrease in reinsurance recoverables of $18.7 million. Reinsurance recoverables decreased due to settling reserves and paying claims related to Hurricane Ike, Hurricane Dolly and the 2010 Arizona Storm. Incurred related to current year increased $28.7 million for the twelve months ended December 31, 2011, as compared to the same period in 2010, due to increases in frequency and severity of fire losses and wind and hail losses, as well as the effects of five storms that occurred in Texas in April and May 2011. Incurred amounts related to prior years indicate that we had favorable IBNR development as of December 31, 2010, resulting in a benefit in the twelve months ended December 31, 2011. This redundancy is due to favorable development on our homeowners and fire products for the 2008 and 2009 accident years, offset by unfavorable development for the 2010 accident year.
9
Table of Contents
For the twelve months ended December 31, 2011 and 2010, the reserve for losses and loss adjustment expenses includes amounts related to losses incurred prior to the purchase of NLASCO. All losses and payments related to events that occurred prior to the purchase of NLASCO were the responsibility of the sellers. In March 2011, we made a final settlement with the sellers and going forward all losses are the responsibility of the Company.
Loss Development
NLASCO estimates the aggregate amount of losses and LAE ultimately required to settle all claims for a given period. The following tables presentset forth the development of estimated liability for losses and LAE, net of reinsurance, for the years 2001 through 2010annual calendar year-end reserves of NLIC and ASIC.ASIC since 2003 and the subsequent development of these reserves through December 31, 2012. These tables present accident or policy year development data. The first line of the table shows, for the years indicated, net liability, including IBNR, as originally estimated. For example, as of December 31, 2002, NLIC estimated that $18.1 million would be a sufficient net liability to settle all unsettled claims retained by it that had occurred prior to December 31, 2002, whether reported or unreported. The next section of the table sets forth the re-estimates in later years of incurred losses, including payments, for the years indicated. For example, as indicated in that section of the table, the original net liability of $18.1 million was re-estimated to be $17.3 million at December 31, 2006 (four years later). The decreasechanges in the original estimate isare caused by a combination of factors, including: (1) claims being settled for amounts different than originally estimated; (2) the net liability being increased or decreased for claims remaining open as more information becomes known about those individual claims; and (3) more or fewer claims being reported after December 31, 20022003 than had occurred prior to that date. The bottom section of the table shows, by year, the cumulative amounts of net losses and LAE paid as of the end of each succeeding year. For example, with respect to the liability for net losses and LAE
10
Table of $18.1 million as of December 31, 2002, by the end of 2006 (four years later), $17.2 million had actually been paid in settlement of the claims.Contents
The “net cumulative redundancy (deficiency)” represents, as of December 31, 2011,2012, the difference between the latest re-estimated net liability and the net liability as originally estimated for losses and LAE retained by us. A redundancy means the original estimate was higher than the current estimate; and a deficiency means that the original estimate was lower than the current estimate. For example, as of December 31, 2011 and based upon updated information, NLIC re-estimated that the net liability that was established as of December 31, 2002 was $0.8 million redundant.
10
Table of Contents
The following tables are presented net of reinsurance recoverable.
National Lloyds Insurance Company
Analysis of Loss Reserve Development
(Dollars in Thousands)thousands)
| | Year Ended December 31, | | |
| | 2002 | | 2003 | | 2004 | | 2005 | | 2006 | | 2007 | | 2008 | | 2009 | | 2010 | | 2011 | | | Year Ended December 31, | |
| | | | | | | | | | | | | | | | | | | | | | | 2003 | | 2004 | | 2005 | | 2006 | | 2007 | | 2008 | | 2009 | | 2010 | | 2011 | | 2012 | |
Original Reserve* | | 18,141 | | 35,061 | | 33,951 | | 41,282 | | 47,684 | | 44,613 | | 65,592 | | 60,392 | | 55,482 | | 81,589 | | | $ | 35,061 | | $ | 33,951 | | $ | 41,282 | | $ | 47,684 | | $ | 44,613 | | $ | 65,592 | | $ | 60,392 | | $ | 55,482 | | $ | 81,589 | | $ | 87,943 | |
| | | | | | | | | | | | | | | | | | | | | | | | | | | | | | | | | | | | | | | | | | |
1 year later | | 17,852 | | 32,887 | | 28,106 | | 36,332 | | 43,640 | | 44,064 | | 64,864 | | 62,337 | | 54,987 | | | | | 32,887 | | 28,106 | | 36,332 | | 43,640 | | 44,064 | | 64,864 | | 62,337 | | 54,987 | | 82,065 | | | |
2 years later | | 17,281 | | 32,559 | | 27,593 | | 40,391 | | 43,465 | | 44,134 | | 65,070 | | 62,014 | | | | | | | 32,559 | | 27,593 | | 40,391 | | 43,465 | | 44,134 | | 65,070 | | 62,014 | | 54,672 | | | | | |
3 years later | | 17,357 | | 31,614 | | 25,747 | | 41,231 | | 43,394 | | 43,950 | | 64,702 | | | | | | | | | 31,614 | | 25,747 | | 41,231 | | 43,394 | | 43,950 | | 64,702 | | 61,759 | | | | | | | |
4 years later | | 17,340 | | 31,030 | | 25,712 | | 39,735 | | 43,387 | | 43,788 | | | | | | | | | | | 31,030 | | 25,712 | | 39,735 | | 43,387 | | 43,788 | | 64,569 | | | | | | | | | |
5 years later | | 17,312 | | 31,088 | | 25,579 | | 39,699 | | 43,366 | | | | | | | | | | | | | 31,088 | | 25,579 | | 39,699 | | 43,366 | | 43,649 | | | | | | | | | | | |
6 years later | | 17,332 | | 31,072 | | 25,582 | | 39,675 | | | | | | | | | | | | | | | 31,072 | | 25,582 | | 39,675 | | 43,365 | | | | | | | | | | | | | |
7 years later | | 17,321 | | 31,066 | | 25,568 | | | | | | | | | | | | | | | | | 31,066 | | 25,568 | | 39,674 | | | | | | | | | | | | | | | |
8 years later | | 17,307 | | 31,056 | | | | | | | | | | | | | | | | | | | 31,054 | | 25,566 | | | | | | | | | | | | | | | | | |
9 years later | | 17,306 | | | | | | | | | | | | | | | | | | | | | 31,048 | | | | | | | | | | | | | | | | | | | |
| | | | | | | | | | | | | | | | | | | | | | | | | | | | | | | | | | | | | | | | | | |
Net cumulative redundancy (deficiency) | | 835 | | 4,005 | | 8,383 | | 1,607 | | 4,318 | | 825 | | 890 | | (1,622 | ) | 495 | | | | | 4,013 | | 8,385 | | 1,608 | | 4,319 | | 964 | | 1,023 | | (1,367 | ) | 810 | | (476 | ) | | |
| | | | | | | | | | | | | | | | | | | | | | | | | | | | | | | | | | | | | | | | | | |
Cumulative amount of net liability paid as of: | | | | | | | | | | | | | | | | | | | | | | | | | | | | | | | | | | | | | | | | | | |
| | | | | | | | | | | | | | | | | | | | | | | | | | | | | | | | | | | | | | | | | | |
1 year later | | 16,836 | | 30,867 | | 24,747 | | 32,871 | | 42,301 | | 42,478 | | 63,761 | | 59,977 | | 53,387 | | | | | 30,867 | | 24,747 | | 32,871 | | 42,301 | | 42,478 | | 63,761 | | 59,977 | | 53,387 | | 79,853 | | | |
2 years later | | 17,160 | | 30,818 | | 25,149 | | 34,625 | | 42,668 | | 43,245 | | 64,203 | | 60,517 | | | | | | | 30,818 | | 25,149 | | 34,625 | | 42,668 | | 43,245 | | 64,203 | | 60,517 | | 53,872 | | | | | |
3 years later | | 17,209 | | 30,875 | | 25,388 | | 36,157 | | 43,140 | | 43,495 | | 64,391 | | | | | | | | | 30,875 | | 25,388 | | 36,157 | | 43,140 | | 43,495 | | 64,391 | | 61,081 | | | | | | | |
4 years later | | 17,231 | | 30,989 | | 25,462 | | 39,533 | | 43,361 | | 43,563 | | | | | | | | | | | 30,989 | | 25,462 | | 39,533 | | 43,361 | | 43,563 | | 64,477 | | | | | | | | | |
5 years later | | 17,287 | | 31,026 | | 25,521 | | 39,646 | | 43,365 | | | | | | | | | | | | | 31,026 | | 25,521 | | 39,646 | | 43,365 | | 43,648 | | | | | | | | | | | |
6 years later | | 17,300 | | 31,030 | | 25,538 | | 39,674 | | | | | | | | | | | | | | | 31,030 | | 25,538 | | 37,674 | | 43,365 | | | | | | | | | | | | | |
7 years later | | 17,301 | | 31,029 | | 25,564 | | | | | | | | | | | | | | | | | 31,029 | | 25,564 | | 39,674 | | | | | | | | | | | | | | | |
8 years later | | 17,302 | | 31,051 | | | | | | | | | | | | | | | | | | | 31,051 | | 25,565 | | | | | | | | | | | | | | | | | |
9 years later | | 17,302 | | | | | | | | | | | | | | | | | | | | | 31,048 | | | | | | | | | | | | | | | | | | | |
|
* Including amounts paid in respective year.
11
Table of Contents
American Summit Insurance Company
Analysis of Loss Reserve Development
(Dollars in Thousands)thousands)
| | Year Ended December 31, | | |
| | 2002 | | 2003 | | 2004 | | 2005 | | 2006 | | 2007 | | 2008 | | 2009 | | 2010 | | 2011 | | | Year Ended December 31, | |
| | | | | | | | | | | | | | | | | | | | | | | 2003 | | 2004 | | 2005 | | 2006 | | 2007 | | 2008 | | 2009 | | 2010 | | 2011 | | 2012 | |
Original Reserve* | | 11,873 | | 6,235 | | 8,297 | | 11,041 | | 13,003 | | 9,351 | | 12,769 | | 9,773 | | 12,486 | | 14,829 | | | $ | 6,235 | | $ | 8,297 | | $ | 11,041 | | $ | 13,003 | | $ | 9,351 | | $ | 12,769 | | $ | 9,773 | | $ | 12,486 | | $ | 14,829 | | $ | 13,547 | |
| | | | | | | | | | | | | | | | | | | | | | | | | | | | | | | | | | | | | | | | | | |
1 year later | | 11,983 | | 5,322 | | 7,388 | | 9,932 | | 13,014 | | 9,154 | | 12,009 | | 9,423 | | 13,153 | | | | | 5,322 | | 7,388 | | 9,932 | | 13,014 | | 9,154 | | 12,009 | | 9,423 | | 13,153 | | 14,126 | | | |
2 years later | | 11,963 | | 5,512 | | 6,999 | | 9,918 | | 12,998 | | 9,335 | | 11,943 | | 9,088 | | | | | | | 5,512 | | 6,999 | | 9,918 | | 12,998 | | 9,335 | | 11,943 | | 9,088 | | 12,974 | | | | | |
3 years later | | 11,554 | | 5,563 | | 6,859 | | 9,918 | | 13,435 | | 9,235 | | 11,880 | | | | | | | | | 5,563 | | 6,859 | | 9,918 | | 13,435 | | 9,235 | | 11,880 | | 9,023 | | | | | | | |
4 years later | | 11,749 | | 5,401 | | 6,772 | | 9,797 | | 13,216 | | 9,200 | | | | | | | | | | | 5,401 | | 6,772 | | 9,797 | | 13,216 | | 9,200 | | 12,048 | | | | | | | | | |
5 years later | | 11,775 | | 5,396 | | 6,714 | | 9,820 | | 13,195 | | | | | | | | | | | | | 5,396 | | 6,714 | | 9,820 | | 13,195 | | 9,197 | | | | | | | | | | | |
6 years later | | 11,799 | | 5,394 | | 6,787 | | 9,815 | | | | | | | | | | | | | | | 5,394 | | 6,787 | | 9,815 | | 13,188 | | | | | | | | | | | | | |
7 years later | | 11,804 | | 5,396 | | 6,743 | | | | | | | | | | | | | | | | | 5,396 | | 6,743 | | 9,812 | | | | | | | | | | | | | | | |
8 years later | | 11,833 | | 5,417 | | | | | | | | | | | | | | | | | | | 5,417 | | 6,730 | | | | | | | | | | | | | | | | | |
9 years later | | 11,821 | | | | | | | | | | | | | | | | | | | | | 5,417 | | | | | | | | | | | | | | | | | | | |
| | | | | | | | | | | | | | | | | | | | | | | | | | | | | | | | | | | | | | | | | | |
Net cumulative redundancy (deficiency) | | 52 | | 818 | | 1,554 | | 1,226 | | (192 | ) | 151 | | 889 | | 685 | | (667 | ) | | | | 818 | | 1,567 | | 1,229 | | (185 | ) | 154 | | 721 | | 750 | | (488 | ) | 703 | | | |
| | | | | | | | | | | | | | | | | | | | | | | | | | | | | | | | | | | | | | | | | | |
Cumulative amount of net liability paid as of: | | | | | | | | | | | | | | | | | | | | | | | | | | | | | | | | | | | | | | | | | | |
| | | | | | | | | | | | | | | | | | | | | | | | | | | | | | | | | | | | | | | | | | |
1 year later | | 10,909 | | 4,987 | | 6,566 | | 9,341 | | 12,429 | | 8,732 | | 11,560 | | 8,800 | | 12,390 | | | | | 4,987 | | 6,566 | | 9,341 | | 12,429 | | 8,732 | | 11,560 | | 8,800 | | 12,390 | | 13,511 | | | |
2 years later | | 11,284 | | 5,612 | | 6,610 | | 9,578 | | 12,639 | | 9,095 | | 11,637 | | 8,803 | | | | | | | 5,612 | | 6,610 | | 9,578 | | 12,639 | | 9,095 | | 11,637 | | 8,803 | | 12,632 | | | | | |
3 years later | | 11,647 | | 5,756 | | 6,682 | | 9,679 | | 13,326 | | 9,193 | | 11,726 | | | | | | | | | 5,756 | | 6,682 | | 9,679 | | 13,326 | | 9,193 | | 11,726 | | 8,917 | | | | | | | |
4 years later | | 11,727 | | 5,393 | | 6,699 | | 9,740 | | 13,161 | | 9,196 | | | | | | | | | | | 5,393 | | 6,699 | | 9,740 | | 13,161 | | 9,196 | | 12,040 | | | | | | | | | |
5 years later | | 11,747 | | 5,393 | | 6,714 | | 9,813 | | 13,188 | | | | | | | | | | | | | 5,393 | | 6,714 | | 9,813 | | 13,188 | | 9,196 | | | | | | | | | | | |
6 years later | | 11,759 | | 5,394 | | 6,720 | | 9,813 | | | | | | | | | | | | | | | 5,394 | | 6,720 | | 9,813 | | 13,188 | | | | | | | | | | | | | |
7 years later | | 11,764 | | 5,394 | | 6,723 | | | | | | | | | | | | | | | | | 5,394 | | 6,723 | | 9,812 | | | | | | | | | | | | | | | |
8 years later | | 11,821 | | 5,417 | | | | | | | | | | | | | | | | | | | 5,417 | | 6,730 | | | | | | | | | | | | | | | | | |
9 years later | | 11,821 | | | | | | | | | | | | | | | | | | | | | 5,417 | | | | | | | | | | | | | | | | | | | |
|
* Including amounts paid in respective year.
Please refer to Note 825 in the notes to consolidated financial statements for a reconciliation of the reserves presented in the tables above to the reserves for losses and loss adjustment expenses set forth in the consolidated balance sheetsheets at December 31, 20112012 and 2010.2011.
Current loss reserve development has been favorable with the exception of accident years 2009 and 2010.year 2009. In the accident years 2007 and 2008, the developed reserves as of December 31, 20112012 were $1.0$1.1 million and $1.8 million, respectively, less than the initial carried reserve for each year. During accident year 2009, however, loss development was unfavorable by $0.9$0.6 million due to unfavorable development at NLIC of $1.6$1.4 million. The unfavorable development at NLIC in accident year 2009 iswas due to adverse development on our homeowners and fire productsproduct of $1.0 million and $0.5 million, respectively.$0.6 million. During accident year 2010, the loss development was unfavorablefavorable by $0.2$0.3 million due to favorable development at NLIC of $0.8 million, offset by unfavorable development at ASIC of $0.7$0.5 million. The unfavorable development at ASIC in accident year 2010 is due to adverse development on homeowners products of $0.4 million. The favorable development of $0.2 million during accident year 2011 was due to favorable development of $0.7 million at ASIC, offset by unfavorable development of $0.5 million at NLIC. For the accident years 20022003 through 2006,2007, the reserves were $22.6$22.9 million favorable. Starting in 2002, IBNR loss reserves were strengthened, contributing to the favorable development in accident years 2002, 2003, 2004 and 2004.2005. This strengthening of reserves was due to increases in direct premium written and increased net premium written from reductions in quota share reinsurance, a form of pro rata insurance.
12
Table of Contents
The following table is a reconciliation of the gross liability to net liability for losses and loss adjustment expenses (dollars in(in thousands).
| | | December 31, * | |
| | Year Ended December 31, * | | | 2007 | | 2008 | | 2009 | | 2010 | | 2011 | | 2012 | |
| | 2002 | | 2003 | | 2004 | | 2005 | | 2006 | | 2007** | | 2008 | | 2009 | | 2010 | | 2011 | | | | | | | | | | | | | | |
Gross unpaid losses | | | | | | | | | | | | | | | | | | | | | | | $ | 18,091 | | $ | 34,023 | | $ | 33,780 | | $ | 58,882 | | $ | 44,835 | | $ | 34,012 | |
| | | | | | | | | | | | | | | | | | | | | | |
Consolidated balance sheet | | n/a | | n/a | | n/a | | n/a | | n/a | | $ | 18,091 | | $ | 34,023 | | $ | 33,780 | | $ | 58,882 | | $ | 44,835 | | |
| | | | | | | | | | | | | | | | | | | | | | |
Reinsurance recoverable | | n/a | | n/a | | n/a | | n/a | | n/a | | (2,692 | ) | (14,613 | ) | (21,102 | ) | (43,773 | ) | (25,083 | ) | | (2,692 | ) | (14,613 | ) | (21,102 | ) | (43,773 | ) | (25,083 | ) | (10,385 | ) |
| | | | | | | | | | | | | | | | | | | | | | | | | | | | | | | | | | |
Net unpaid losses | | n/a | | n/a | | n/a | | n/a | | n/a | | $ | 15,399 | | $ | 19,410 | | $ | 12,678 | | $ | 15,109 | | $ | 19,752 | | | $ | 15,399 | | $ | 19,410 | | $ | 12,678 | | $ | 15,109 | | $ | 19,752 | | $ | 23,627 | |
*Information is not presented for the periods ended prior to January 31, 2007, as that is the date Hilltop Holdings Inc. acquired the insurance operations.
** Only includes eleven months, as the insurance operations were acquired on January 31, 2007.
RatingsFinancial Advisory
Many insurance buyers, agentsOur financial advisory segment operates through First Southwest. FSC, a wholly owned subsidiary of First Southwest, is a diversified investment banking firm and brokers usea registered broker-dealer with the ratings assigned by A.M. BestSecurities and Exchange Commission (the “SEC”) and the Financial Industry Regulatory Authority (“FINRA”). First Southwest’s primary focus is on providing public finance services.
At December 31, 2012, First Southwest employed approximately 400 people and maintained 26 locations nationwide, nine of which are in Texas. At December 31, 2012, First Southwest maintained $114.4 million in equity capital and had more than 1,600 public sector clients. At December 31, 2012, it had consolidated assets of $592.0 million.
First Southwest has five primary lines of business: (i) public finance, (ii) capital markets, (iii) correspondent clearing services, (iv) asset management and (v) corporate finance.
Public Finance. First Southwest’s public finance group represents its largest department. This group advises cities, counties, school districts, utility districts, tax increment zones, special districts, state agencies and other ratinggovernmental entities nationwide. In addition, the group provides specialized advisory and investment banking services for airports, convention centers, healthcare institutions, institutions of higher education, housing, industrial development agencies, toll road authorities, and public power and utility providers.
Capital Markets. Through its capital markets group, First Southwest trades fixed income securities to assist them in assessing the financial strengthsupport sales and overall quality of the companies from which they purchase insurance. The ratings for NLICother customer activities, underwrites tax-exempt and ASIC of “A” (Excellent) were affirmed by A.M. Best in April 2011. An “A” rating is the third highest of 16 rating categories used by A.M. Best. In evaluating a company’s financialtaxable fixed income securities and operating performance, A.M. Best reviews a company’s profitability, leverage and liquidity, as well as its book of business, the adequacy and soundnesstrades equities on an agency basis on behalf of its reinsurance,retail and institutional clients. In addition, First Southwest provides asset and liability management advisory services to community banks.
Correspondent Clearing Services. The correspondent clearing services group offers omnibus and fully disclosed clearing services to FINRA member firms for trade executing, clearing and back office services. Services are provided to approximately 75 correspondent firms.
Asset Management. First Southwest Asset Management is an investment advisor registered under the qualityInvestment Advisors Act of 1940 providing state and estimated market value of its assets, the adequacy of its liabilities for losseslocal governments with advice and LAE, the adequacy of its surplus, its capital structure, the experience and competence of its management and its market presence. This rating is intended to provide an independent opinion of an insurer’s ability to meet its obligations to policyholders and is not an evaluation directed at investors. This rating assignment is subject to the ability to meet A.M. Best’s expectations as to performance and capitalization on an ongoing basis, includingassistance with respect to arbitrage rebate compliance, portfolio management and local government investment pool administration. In the area of liabilitiesarbitrage rebate, First Southwest Asset Management advises municipalities with respect to the emerging regulations relating to arbitrage rebates. Further, First Southwest Asset Management assists governmental entities with the complexities of investing public funds in the fixed income markets. As an investment adviser registered with the SEC, First Southwest Asset Management promotes cash management-based investment strategies that seek to adhere to the standards imposed by the fiduciary responsibilities of investment officers of public funds. At December 31, 2012, First Southwest Asset Management served as administrator for losseslocal government investment pools totaling $8.3 billion, investment manager of $6.2 billion in short-term fixed income portfolios of municipal governments and LAE, and is subject to revocation or revision at any time at the sole discretion of A.M. Best. NLASCO cannot ensure that NLIC and ASIC will maintain their present ratings.investment advisor for $6.2 billion invested by municipal governments.
InvestmentsCorporate Finance
HTH’s primary. First Southwest’s corporate finance group provides focused and tailored investment objectives, as a holding company, arebanking services to preserveinstitutions and corporations. These services include capital raising, advisory services and possess available cash resources to utilize in making opportunistic acquisitions. Accordingly, HTH, parent only, has $533.4 million in short-term cash equivalents, $10.1 million in equity securities and $60.4 million in other investments as of December 31, 2011. HTH’s management regularly monitors investment performance.
Our insurance operating subsidiary, NLASCO, has primary investment objectives to preserve capital and manage for a total rate of return. The investment strategy of NLASCO’s insurance subsidiaries is to purchase securities in sectors that represent what is expected to possess the most attractive relative value. Bonds, cash and short-term investments constituted $197.2 million, or 95.7%, of NLASCO’s investments at December 31, 2011, of which $7.3 million represents an investment in HTH Senior Exchangeable Notes, and is, therefore, eliminated in consolidation. NLASCO insurance subsidiaries have custodial agreements with A.G. Edwards and Wells Fargo Bank and an investment management agreement with DTF Holdings, LLC.
NLASCO’s investment guidelines reflect the desire and intent to assure the prudent investment of capital and surplus, keeping in mind the long-term nature of some insurance reserves, while recognizing the uncertainty of expected cash flows, the shorter term characteristics of and the desire to supplement insurance underwriting gains and offset losses with portfolio income and realized gains in order to maintain adequate capital and surplus. All investments are made in compliance with all state and Federal laws and regulations applicable to such investments and the company involved. State insurance laws and regulations limit the amount of investments in asset classes below certain “quality” levels. NLASCO currently maintains a quality structure exceeding the minimum requirements imposed on the portfolio by state insurance laws and regulations, which is known as the Investment of Insurer’s Model Act, or National Association of Insurance Commissioners Act. Currently, NLASCO has no investments in subprime mortgages.corporate restructuring.
13
Table of Contents
Liquidity and preservation of policyholder surplus can be limiting factors in achieving a favorable return on invested assets, as sufficient funds need to be maintained to meet ongoing near term financial obligations. Funds not immediately needed to offset withdrawals may be invested in short-term securities on a continuous basis. A maturity structure must be maintained to invest cash flows from operations and reinvest investment income, as well as to provide a source of liquidity and flexibility to meet changing market, tax and other operating considerations.
Notwithstanding the above, the underlying objective of NLASCO’s investment policy is to obtain a favorable total return on invested assets to augment the growth of surplus from operations. Total return comes both from income and capital growth, so a portion of the funds are invested in assets other than fixed income securities, including common stocks and growth oriented preferred stocks. In managing these investment choices, market volatility, the absolute level of NLASCO’s capital and surplus relative both to existing liabilities and the level of premium revenue, as well as to total assets, are the limiting factors that influence the portion of assets invested in assets other than fixed income investments.
Performance is measured by comparing the total return, for each period, of each major sector of NLASCO’s investment portfolio to an appropriate market index, as well as comparing the total return of NLASCO’s investment portfolio to an average of the market indices, weighted by the portfolio’s average exposure to each other particular sector during the period. The assets are managed with volatility of return similar to or less than the indices.
HTH’s investment committee meets regularly to review the portfolio performance and investment markets in general. NLASCO’s management generally meets monthly to review the performance of investments and monitor market conditions for investments that would warrant any revision to investment guidelines.
The following table sets forth information concerning the composition of the investment portfolio at December 31, 2011 (in thousands):
| | December 31, 2011 | |
| | Cost/Amortized | | Fair | | Carrying | | Percent of | |
| | Cost | | Value | | Value | | Carrying Value | |
| | | | | | | | | |
Available-for-sale securities: | | | | | | | | | |
Fixed maturities: | | | | | | | | | |
Government securities | | $ | 27,729 | | $ | 29,165 | | $ | 29,165 | | 13.0 | % |
Residential mortgage-backed securities | | 11,708 | | 12,652 | | 12,652 | | 5.6 | % |
Commercial mortgage-backed securities | | 2,277 | | 2,303 | | 2,303 | | 1.0 | % |
Corporate debt securities | | 93,452 | | 100,681 | | 100,681 | | 44.9 | % |
| | 135,166 | | 144,801 | | 144,801 | | | |
| | | | | | | | | |
Equity securities | | 16,813 | | 19,022 | | 19,022 | | 8.5 | % |
| | 151,979 | | 163,823 | | 163,823 | | | |
| | | | | | | | | |
Other investments: | | | | | | | | | |
Note receivable | | 38,641 | | 38,588 | | 38,588 | | 17.2 | % |
Warrants | | 12,068 | | 21,789 | | 21,789 | | 9.7 | % |
| | $ | 202,688 | | $ | 224,200 | | $ | 224,200 | | 100.0 | % |
At December 31, 2011, NLASCO’s fixed maturity portfolio had a fair value of approximately $144.8 million. All of the fixed maturity investments are rated as investment grade. As a result, the market value of these investments may fluctuate in response to changes in interest rates. In addition, we may experience investment losses to the extent our liquidity needs require disposition of fixed maturity securities in unfavorable interest rate environments.
The equity securities of $19.0 million consist of $10.1 million in common stocks held by HTH and $8.9 million in common and preferred stocks held by NLASCO. Other investments represent the value of the note receivable and warrants held at HTH.
14
Table of Contents
The amortized cost (original cost for equity securities and other investments), gross unrealized holding gains and losses, and fair value of available-for-sale securities by major security type and class of security at December 31, 2011 for the investment portfolio were as follows (in thousands).
| | December 31, 2011 | |
| | | | Gross | | Gross | | | |
| | | | Unrealized | | Unrealized | | | |
| | Cost/Amortized | | Holding | | Holding | | Fair | |
| | Cost | | Gains | | Losses | | Value | |
Available-for-sale securities: | | | | | | | | | |
Fixed maturities: | | | | | | | | | |
Government securities | | $ | 27,729 | | $ | 1,439 | | $ | (3 | ) | $ | 29,165 | |
Residential mortgage-backed securities | | 11,708 | | 944 | | — | | 12,652 | |
Commercial mortgage-backed securities | | 2,277 | | 36 | | (10 | ) | 2,303 | |
Corporate debt securities | | 93,452 | | 7,406 | | (177 | ) | 100,681 | |
| | 135,166 | | 9,825 | | (190 | ) | 144,801 | |
| | | | | | | | | |
Equity securities | | 16,813 | | 2,462 | | (253 | ) | 19,022 | |
| | 151,979 | | 12,287 | | (443 | ) | 163,823 | |
| | | | | | | | | |
Other investments: | | | | | | | | | |
Note receivable | | 38,641 | | — | | (53 | ) | 38,588 | |
Warrants | | 12,068 | | 9,721 | | — | | 21,789 | |
| | $ | 202,688 | | $ | 22,008 | | $ | (496 | ) | $ | 224,200 | |
For the twelve months ended December 31, 2011, the Company did not record any other-than-temporary impairments. While all of the investments are monitored for potential other-than-temporary impairment, our analysis and experience indicate that these investments generally do not present a great risk of other-than-temporary-impairment, as fair value should recover over time. Factors considered in our analysis include the reasons for the unrealized loss position, the severity and duration of the unrealized loss position, credit worthiness, and forecasted performance of the investee. While some of the securities held in the investment portfolio have decreased in value since the date of acquisition, the severity of loss and the duration of the loss position are not believed to be significant enough to warrant other-than-temporary impairment of the securities. The Company does not intend, nor is it likely that the Company will be required, to sell these securities before the recovery of the cost basis; and, therefore, we do not believe any other-than-temporary impairment exist as of December 31, 2011.
During 2010 and 2009, the Company took other-than-temporary impairments and recognized a loss in earnings of $70,000 and $0.8 million, respectively.
15
Table of Contents
The following table presents the maturity profile of the fixed maturity investments as of December 31, 2011. Actual maturities may differ from contractual maturities because certain borrowers may have the right to call or prepay obligations with or without penalties. The schedule of fixed maturities available-for-sale at December 31, 2011 by contractual maturity is as follows (in thousands).
| | December 31, 2011 | |
| | Amortized | | Fair | |
| | Cost | | Value | |
Available-for-sale fixed maturities: | | | | | |
Due within one year | | $ | 12,608 | | $ | 12,942 | |
Due after one year through five years | | 69,594 | | 73,300 | |
Due six years through ten years | | 38,065 | | 42,766 | |
Due after ten years | | 914 | | 838 | |
Mortgage-backed securities | | 13,985 | | 14,955 | |
| | $ | 135,166 | | $ | 144,801 | |
| | | | | |
Other Investments: | | | | | |
Due after one year through five years | | $ | 50,709 | | $ | 60,377 | |
| | $ | 50,709 | | $ | 60,377 | |
We are subject to various market risk exposures, including interest rate risk and equity price risk. Our primary risk exposure is to changes in interest rates. We manage market risk through our investment committee and through the use of an outside professional investment management firm. We are vulnerable to interest rate changes, like other insurance companies, because we invest primarily in fixed maturity securities, which are interest-sensitive assets. Mortgage-backed securities, which make up approximately 10.3% of our available-for-sale fixed maturities, are particularly susceptible to interest rate changes.
The value of our equity investments is dependent upon general conditions in the securities markets and the business and financial performance of the individual companies in the portfolio. Values are typically based on future economic prospects that are perceived by investors in the equity market.
Competition
NLASCOWe face significant competition with respect to the business segments in which we operate and the geographic markets we serve. Our lending and mortgage origination competitors include commercial banks, savings banks, savings and loan associations, credit unions, finance companies, pension trusts, mutual funds, insurance companies, mortgage bankers and brokers, brokerage and investment banking firms, asset-based non-bank lenders, government agencies and certain other non-financial institutions. Competition for deposits and in providing lending and mortgage origination products and services to businesses in our market area is intense and pricing is important. Other factors encountered in competing for savings deposits are convenient office locations, interest rates and fee structures of products offered. Direct competition for savings deposits also comes from other commercial bank and thrift institutions, money market mutual funds and corporate and government securities that may offer more attractive rates than insured depository institutions are willing to pay. Competition for loans includes such additional factors as interest rate, loan origination fees and the range of services offered by the provider. We seek to distinguish ourselves from our competitors through our commitment to personalized customer service and responsiveness to customer needs while providing a range of competitive loan and deposit products and other services.
Our insurance business competes with a large number of other companies in its selected lines of business, including major U.S. and non-U.S. insurers, regional companies, mutual companies, specialty insurance companies, underwriting agencies and diversified financial services companies. The personal lines market in Texas is dominated by a few large carriers and their subsidiaries and affiliates, including State Farm, Zurich Insurance Group, Allstate and USAA. According to the Texas Department of Insurance, the top ten insurers writing homeowners insurance accounted for approximately 81.6% of the market for the trailing twelve months at September 30, 2011. NLASCO competes for business on the basis of a number of factors, including price, coverages offered, customer service, relationships with agents (including ease of doing business, service provided and commission rates paid), size and financial strength ratings. In its personal lines business, NLASCO’s competitors include Republic Companies Group, Inc., Columbia Lloyds, Foremost, American Modern Home Group and American Reliable. In its commercial lines business, NLASCO’s competitors include Travelers, Safeco and Republic. NLASCO seeksaffiliates. We seek to distinguish itselfourselves from itsour competitors by targeting underserved market segments that provide NLASCOus with the best opportunity to obtain favorable policy terms, conditions and pricing.
We also face significant competition for financial advisory services on a number of factors such as price, perceived expertise, range of services, and local presence. Our financial advisory business competes directly with numerous other financial advisory and investment banking firms, broker-dealers and banks, including large national and major regional firms and smaller niche companies, some of whom are not broker-dealers and, therefore, are not subject to the broker-dealer regulatory framework. Many of our competitors have substantially greater financial resources, lending limits and larger branch networks than we do, and offer a broader range of products and services. Our financial advisory business competes on the basis of a number of factors, including the quality of advice and service, innovation, reputation and price.
Employees
At December 31, 2012, we employed approximately 3,950 persons, substantially all of which are full-time. None of our employees are represented by any collective bargaining unit or a party to any collective bargaining agreement.
Government Supervision and Regulation
General
We are subject to extensive regulation under federal and state laws. The regulatory framework is intended primarily for the protection of customers and clients of our financial advisory services, depositors, borrowers, the insurance funds of the FDIC and SIPC and the banking system as a whole, and not for the protection of our stockholders or creditors. In many cases, the applicable regulatory authorities have broad enforcement power over bank holding companies, banks and their subsidiaries, including the power to impose substantial fines and other penalties for violations of laws and regulations. The following discussion describes the material elements of the regulatory framework that applies to us and our subsidiaries. References in this Annual Report to applicable statutes and regulations are brief summaries thereof, do not purport to be complete, and are qualified in their entirety by reference to such statutes and regulations.
Recent Regulatory Developments. New regulations and statutes are regularly proposed and/or adopted that contain wide-ranging proposals for altering the structures, regulations and competitive relationships of financial institutions operating and doing business in the United States. Certain of these recent proposals and changes are described below.
On July 21, 2010, President Obama signed into law the Dodd-Frank Act. The Dodd-Frank Act aims to restore responsibility and accountability to the financial system by significantly altering the regulation of financial institutions and the financial services industry. Most of the provisions contained in the Dodd-Frank Act have delayed effective dates. Full implementation of the Dodd-Frank Act will require many new rules to be issued by federal regulatory agencies over the next several years, which will profoundly affect how financial institutions will be regulated in the future. The ultimate effect of the Dodd-Frank Act and its implementing regulations on the financial services industry in general, and on us in particular, is uncertain at this time.
14
Table of Contents
The Dodd-Frank Act, among other things:
·Established the Consumer Financial Protection Bureau (the “CFPB”), an independent organization within the Federal Reserve which has the authority to promulgate consumer protection regulations applicable to all entities offering consumer financial products or services, including banks and mortgage originators. The CFPB has broad rule-making authority for a wide range of consumer protection laws, including the authority to prohibit “unfair, deceptive or abusive” acts and practices.
·Established the Financial Stability Oversight Council, tasked with the authority to identify and monitor institutions and systems which pose a systemic risk to the financial system, and to impose standards regarding capital, leverage, liquidity, risk management, and other requirements for financial firms.
·Changed the base for FDIC insurance assessments.
·Increased the minimum reserve ratio for the Deposit Insurance Fund from 1.15% to 1.35% (the FDIC subsequently increased it by regulation to 2.00%).
·Permanently increased the deposit insurance coverage amount from $100,000 to $250,000.
·Directed the Federal Reserve to establish interchange fees for debit cards pursuant to a restrictive “reasonable and proportional cost” per transaction standard.
·Limits the ability of banking organizations to sponsor or invest in private equity and hedge funds and to engage in proprietary trading in a provision known as the “Volcker Rule”.
·Grants the U.S. government authority to liquidate or take emergency measures with respect to troubled nonbank financial companies that fall outside the existing resolution authority of the FDIC, including the establishment of an orderly liquidation fund.
·Increases regulation of asset-backed securities, including a requirement that issuers of asset-backed securities retain at least 5% of the risk of the asset-backed securities.
·Increases regulation of consumer protections regarding mortgage originations, including banker compensation, minimum repayment standards, and prepayment consideration.
·Establishes new disclosure and other requirements relating to executive compensation and corporate governance.
On June 21, 2010, the Federal Reserve Board, the Office of the Comptroller of the Currency, the Office of Thrift Supervision and the FDIC jointly issued comprehensive final guidance on incentive compensation policies (the “Incentive Compensation Guidance”) intended to ensure that the incentive compensation policies of banking organizations do not undermine the safety and soundness of such organizations by encouraging excessive risk-taking. The Incentive Compensation Guidance sets expectations for banking organizations concerning their incentive compensation arrangements and related risk-management, control and governance processes. The Incentive Compensation Guidance, which covers all employees that have the ability to materially affect the risk profile of an organization, either individually or as part of a group, is based upon three primary principles: (i) balanced risk-taking incentives, (ii) compatibility with effective controls and risk management, and (iii) strong corporate governance. Any deficiencies in compensation practices that are identified may be incorporated into the organization’s supervisory ratings, which can affect its ability to make acquisitions or perform other actions. In addition, under the Incentive Compensation Guidance, a banking organization’s federal supervisor may initiate enforcement action if the organization’s incentive compensation arrangements pose a risk to the safety and soundness of the organization.
On April 14, 2011, the Federal Reserve Board and various other federal agencies published a notice of proposed rulemaking implementing provisions of the Dodd-Frank Act that would require reporting of incentive-based compensation arrangements by a covered financial institution and prohibit incentive-based compensation arrangements at a covered financial institution that provide excessive compensation or that could expose the institution to inappropriate risks that could lead to material financial loss. The Dodd-Frank Act defines “covered financial institution” to include, among other entities, a depository institution or depository institution holding company that has $1 billion or more in assets. There are
15
Table of Contents
enhanced requirements for institutions with more than $50 billion in assets. The proposed rule states that it is consistent with the Incentive Compensation Guidance.
On January 10, 2013, the CFPB issued a final rule to implement the “qualified mortgage”, or “QM” provisions of the Dodd-Frank Act requiring mortgage lenders to consider consumers’ ability to repay home loans before extending them credit. The final rule describes certain minimum requirements for creditors making ability-to-repay determinations, but does not dictate that they follow particular underwriting models. Lenders will be presumed to have complied with the ability-to-repay rule if they issue “qualified mortgages”, which are generally defined as mortgage loans prohibiting or limiting certain risky features. Loans that do not meet the ability-to-repay standard can be challenged in court by borrowers who default and the absence of ability-to-repay status can be used against a creditor in foreclosure proceedings. The CFPB’s QM rule will take effect on January 10, 2014.
We cannot predict whether or in what form any proposed regulation or statute will be adopted or the extent to which our business may be affected by any new regulation or statute.
Hilltop Holdings Inc.
Hilltop is a legal entity separate and distinct from PlainsCapital and its other subsidiaries. On November 30, 2012, concurrent with the consummation of the Merger with PlainsCapital Corporation, Hilltop became a financial holding company registered under the Bank Holding Company Act, as amended by the Gramm-Leach-Bliley Act. Accordingly, it is subject to supervision, regulation and examination by the Federal Reserve Board. The Dodd-Frank Act, Gramm-Leach-Bliley Act, the Bank Holding Company Act and other federal laws subject financial and bank holding companies to particular restrictions on the types of activities in which they may engage and to a range of supervisory requirements and activities, including regulatory enforcement actions for violations of laws and regulations.
Changes of control. Federal and state laws impose additional notice, approval and ongoing regulatory requirements on any investor that seeks to acquire direct or indirect “control” of a regulated holding company, such as Hilltop. These laws include the Bank Holding Company Act, the Change in Bank Control Act and the Texas Insurance Code. Among other things, these laws require regulatory filings by an investor that seeks to acquire direct or indirect “control” of a regulated holding company. The determination whether an investor “controls” a regulated holding company is based on all of the facts and circumstances surrounding the investment. As a general matter, an investor is deemed to control a depository institution or other company if the investor owns or controls 25% or more of any class of voting stock. Subject to rebuttal, an investor may be presumed to control the regulated holding company if the investor owns or controls 10% or more of any class of voting stock.Accordingly, these laws would apply to a person acquiring 10% or more of Hilltop’s common stock. Furthermore, these laws may discourage potential acquisition proposals and may delay, deter or prevent change of control transactions, including those that some or all of our stockholders might consider to be desirable.
Regulatory Restrictions on Dividends; Source of Strength. It is the policy of the Federal Reserve Board that bank holding companies should pay cash dividends on common stock only out of income available over the past year and only if prospective earnings retention is consistent with the organization’s expected future needs and financial condition. The policy provides that bank holding companies should not maintain a level of cash dividends that undermines the bank holding company’s ability to serve as a source of strength to its banking subsidiaries.
Under Federal Reserve Board policy, a bank holding company is expected to act as a source of financial strength to each of its banking subsidiaries and commit resources to their support. Such support may be required at times when, absent this Federal Reserve Board policy, a holding company may not be inclined to provide it. As discussed herein, a bank holding company, in certain circumstances, could be required to guarantee the capital plan of an undercapitalized banking subsidiary.
Scope of Permissible Activities. Under the Bank Holding Company Act, Hilltop and PlainsCapital generally may not acquire a direct or indirect interest in, or control of more than 5% of, the voting shares of any company that is not a bank or bank holding company. Additionally, the Bank Holding Company Act may prohibit Hilltop from engaging in activities other than those of banking, managing or controlling banks or furnishing services to, or performing services for, its subsidiaries, except that it may engage in, directly or indirectly, certain activities that the Federal Reserve Board has determined to be closely related to banking or managing and controlling banks as to be a proper incident thereto. In approving acquisitions or the addition of activities, the Federal Reserve Board considers, among other things, whether the acquisition or the additional activities can reasonably be expected to produce benefits to the public, such as greater convenience, increased competition, or gains in efficiency, that outweigh such possible adverse effects as undue concentration of resources, decreased or unfair competition, conflicts of interest or unsound banking practices.
16
Table of Contents
Notwithstanding the foregoing, the Gramm-Leach-Bliley Act, effective March 11, 2000, eliminated the barriers to affiliations among banks, securities firms, insurance companies and other financial service providers and permits bank holding companies to become financial holding companies and thereby affiliate with securities firms and insurance companies and engage in other activities that are financial in nature. The Gramm-Leach-Bliley Act defines “financial in nature” to include: securities underwriting; dealing and market making; sponsoring mutual funds and investment companies; insurance underwriting and agency; merchant banking activities; and activities that the Federal Reserve Board has determined to be closely related to banking. Prior to enactment of the Dodd-Frank Act, regulatory approval was not required for a financial holding company to acquire a company, other than a bank or savings association, engaged in activities that were financial in nature or incidental to activities that were financial in nature, as determined by the Federal Reserve Board.
Under the Gramm-Leach-Bliley Act, a bank holding company may become a financial holding company by filing a declaration with the Federal Reserve Board if each of its subsidiary banks is “well capitalized” under the Federal Deposit Insurance Corporation Improvement Act prompt corrective action provisions, is “well managed”, and has at least a “satisfactory” rating under the Community Reinvestment Act of 1977 (the “CRA”). The Dodd-Frank Act underscores the criteria for becoming a financial holding company by amending the Bank Holding Company Act to require that bank holding companies be “well capitalized” and “well managed” in order to become financial holding companies. Hilltop became a financial holding company on December 1, 2012.
Safe and Sound Banking Practices. Bank holding companies are not permitted to engage in unsafe and unsound banking practices. The Federal Reserve Board’s Regulation Y, for example, generally requires a holding company to give the Federal Reserve Board prior notice of any redemption or repurchase of its equity securities, if the consideration to be paid, together with the consideration paid for any repurchases or redemptions in the preceding year, is equal to 10% or more of the company’s consolidated net worth. In addition, bank holding companies are required to consult with the Federal Reserve Board prior to making any redemption or repurchase, even within the foregoing parameters. The Federal Reserve Board may oppose the transaction if it believes that the transaction would constitute an unsafe or unsound practice or would violate any law or regulation. Depending upon the circumstances, the Federal Reserve Board could take the position that paying a dividend would constitute an unsafe or unsound banking practice.
The Federal Reserve Board has broad authority to prohibit activities of bank holding companies and their nonbanking subsidiaries that represent unsafe and unsound banking practices or that constitute violations of laws or regulations, and can assess civil money penalties for certain activities conducted on a knowing and reckless basis, if those activities caused a substantial loss to a depository institution. The penalties can be as high as $1.425 million for each day the activity continues. In addition, the Dodd-Frank Act authorizes the Federal Reserve Board to require reports from and examine bank holding companies and their subsidiaries, and to regulate functionally regulated subsidiaries of bank holding companies.
Anti-tying Restrictions. Subject to various exceptions, bank holding companies and their affiliates are generally prohibited from tying the provision of certain services, such as extensions of credit, to certain other services offered by a bank holding company or its affiliates.
Capital Adequacy Requirements. The Federal Reserve Board has adopted a system using risk-based capital guidelines to evaluate the capital adequacy of bank holding companies. Under the guidelines, a risk weight factor of 0% to 100% is assigned to each category of assets based generally on the perceived credit risk of the asset class. The risk weights are then multiplied by the corresponding asset balances to determine a “risk-weighted” asset base. At least half of the risk-based capital must consist of core (Tier 1) capital, which is comprised of:
·common stockholders’ equity (includes common stock and any related surplus, undivided profits, disclosed capital reserves that represent a segregation of undivided profits and foreign currency translation adjustments, excluding changes in other comprehensive income (loss));
·certain noncumulative perpetual preferred stock and related surplus; and
·minority interests in the equity capital accounts of consolidated subsidiaries (excludes goodwill and various intangible assets).
17
Table of Contents
The remainder, supplementary (Tier 2) capital, may consist of:
·allowance for loan losses, up to a maximum of 1.25% of risk-weighted assets;
·certain perpetual preferred stock and related surplus;
·hybrid capital instruments;
·perpetual debt;
·mandatory convertible debt securities;
·term subordinated debt;
·intermediate term preferred stock; and
·certain unrealized holding gains on equity securities.
Total capital is the sum of Tier 1 and Tier 2 capital. The guidelines require a minimum ratio of total capital to total risk-weighted assets of 8.0% (of which at least 4.0% is required to consist of Tier 1 capital elements). At December 31, 2012, our ratio of Tier 1 capital to total risk-weighted assets was 17.72% and our ratio of total capital to total risk-weighted assets was 17.81%.
In addition to the risk-based capital guidelines, the Federal Reserve Board uses a leverage ratio as an additional tool to evaluate the capital adequacy of bank holding companies. The leverage ratio is a company’s Tier 1 capital divided by its average total consolidated assets. We are required to maintain a leverage ratio of 4.0%, and, at December 31, 2012, our leverage ratio was 13.08%. The Tier 1 Capital (to average assets) ratio was calculated using the average assets for the month of December 2012.
The federal banking agencies’ risk-based and leverage ratios are minimum supervisory ratios generally applicable to banking organizations that meet certain specified criteria, assuming that they have the highest regulatory rating. Banking organizations not meeting these criteria are expected to operate with capital positions well above the minimum ratios. The federal bank regulatory agencies may set capital requirements for a particular banking organization that are higher than the minimum ratios when circumstances warrant. Federal Reserve Board guidelines also provide that banking organizations experiencing internal growth or making acquisitions will be expected to maintain strong capital positions substantially above the minimum supervisory levels, without significant reliance on intangible assets.
The Dodd-Frank Act directs federal banking agencies to establish minimum leverage capital requirements and minimum risk-based capital requirements for insured depository institutions, depository institution holding companies, and nonbank financial companies supervised by the Federal Reserve Board. These minimum capital requirements may not be less than the “generally applicable leverage and risk-based capital requirements” applicable to insured depository institutions, in effect applying the same leverage and risk-based capital requirements that apply to insured depository institutions to most bank holding companies. The Dodd-Frank Act, for the first time, embeds in the law a leverage capital requirement as opposed to leaving it to the regulators to use a risk-based capital requirement. However, it is left to the discretion of the agencies to set the leverage ratio requirement through the rulemaking process.
Imposition of Liability for Undercapitalized Subsidiaries. Bank regulators are required to take “prompt corrective action” to resolve problems associated with insured depository institutions whose capital declines below certain levels. In the event an institution becomes “undercapitalized,” it must submit a capital restoration plan. The capital restoration plan will not be accepted by the regulators unless each company having control of the undercapitalized institution guarantees the subsidiary’s compliance with the capital restoration plan up to a certain specified amount. Any such guarantee from a depository institution’s holding company is entitled to a priority of payment in bankruptcy.
The aggregate liability of the holding company of an undercapitalized bank is limited to the lesser of 5% of the institution’s assets at the time it became undercapitalized or the amount necessary to cause the institution to be “adequately capitalized.” The bank regulators have greater power in situations where an institution becomes “significantly” or “critically” undercapitalized or fails to submit a capital restoration plan. For example, a bank holding company controlling such an institution can be required to obtain prior Federal Reserve Board approval of proposed dividends, or might be required to consent to a consolidation or to divest the troubled institution or other affiliates.
Acquisitions by Bank Holding Companies. The Bank Holding Company Act requires every bank holding company to obtain the prior approval of the Federal Reserve Board before it may acquire all or substantially all of the assets of any bank, or
18
Table of Contents
ownership or control of any voting shares of any bank, if after such acquisition it would own or control, directly or indirectly, more than 5% of the voting shares of such bank. In approving bank acquisitions by bank holding companies, the Federal Reserve Board is required to consider, among other things, the financial and managerial resources and future prospects of the bank holding company and the banks concerned, the convenience and needs of the communities to be served, and various competitive factors. In addition, the Dodd-Frank Act requires the Federal Reserve Board to consider “the risk to the stability of the U.S. banking or financial system” when evaluating acquisitions of banks and nonbanks under the Bank Holding Company Act. With respect to interstate acquisitions, the Dodd-Frank Act amends the Bank Holding Company Act by raising the standard by which interstate bank acquisitions are permitted from a standard that the acquiring bank holding company be “adequately capitalized” and “adequately managed”, to the higher standard of being “well capitalized” and “well managed”.
Control Acquisitions. The Change in Bank Control Act prohibits a person or group of persons from acquiring “control” of a bank holding company unless the Federal Reserve Board has been notified and has not objected to the transaction. Under a rebuttable presumption established by the Federal Reserve Board, the acquisition of 10% or more of a class of voting stock of a bank holding company with a class of securities registered under Section 12 of the Exchange Act, would, under the circumstances set forth in the presumption, constitute acquisition of control of such company.
In addition, an entity is required to obtain the approval of the Federal Reserve Board under the Bank Holding Company Act before acquiring 25% (5% in the case of an acquiror that is a bank holding company) or more of any class of our outstanding common stock, or otherwise obtaining control or a “controlling influence” over us.
Emergency Economic Stabilization Act of 2008 and the Small Business Jobs Act of 2010. The U.S. Congress, the U.S. Department of the Treasury (“U.S. Treasury”) and the federal banking regulators have taken broad action since early September 2008 to address volatility in the U.S. banking system. The Emergency Economic Stabilization Act of 2008 (“EESA”) authorized the U.S. Treasury to purchase from financial institutions and their holding companies up to $700 billion in mortgage loans, mortgage-backed securities and certain other financial instruments, including debt and equity securities issued by financial institutions and their holding companies in the Troubled Asset Relief Program (“TARP”). The Dodd-Frank Act reduced the TARP authorization contained in the EESA to $475 billion.
The stated purpose of TARP was to restore confidence and stability to the U.S. banking system and to encourage financial institutions to increase their lending to customers and to each other. The U.S. Treasury allocated $250 billion towards the TARP Capital Purchase Program. Under the Capital Purchase Program, the U.S. Treasury purchased debt or equity securities from eligible participating institutions. The TARP also provided for the direct purchases or guarantees of troubled assets of financial institutions.
On December 19, 2008, PlainsCapital sold 87,631 shares of its Fixed Rate Cumulative Perpetual Stock, Series A and a warrant to purchase, upon net exercise, 4,382 shares of its Fixed Rate Cumulative Perpetual Stock, Series B to the U.S. Treasury for $87.6 million pursuant to the Capital Purchase Program. The U.S. Treasury immediately exercised its warrant on December 19, 2008, and PlainsCapital issued the underlying shares of its Series B Preferred Stock to the U.S. Treasury. On September 27, 2011, PlainsCapital entered into a Securities Purchase Agreement with the Secretary of the Treasury (the “Purchase Agreement”) pursuant to which PlainsCapital issued 114,068 shares of its newly designated Non-Cumulative Perpetual Preferred Stock, Series C for a total purchase price of $114,068,000. The proceeds from the sale of PlainsCapital’s Series C Preferred Stock were used to redeem and repurchase PlainsCapital’s Series A and Series B Preferred Stock. PlainsCapital’s Series C Preferred Stock was issued pursuant to the Small Business Lending Fund program, a $30 billion fund established under the Small Business Jobs Act of 2010 that was created to encourage lending to small businesses by providing capital to qualified community banks with assets of less than $10 billion. In connection with the Merger, Hilltop assumed PlainsCapital’s obligations under the Purchase Agreement and redeemed PlainsCapital’s outstanding Series C Preferred Stock in exchange for the Hilltop Series B Preferred Stock.
On November 29, 2012, Hilltop filed with the State Department of Assessments and Taxation of the State of Maryland articles supplementary for the Hilltop Series B Preferred Stock, setting forth its terms. Holders of the Hilltop Series B Preferred Stock are entitled to noncumulative cash dividends at a fluctuating dividend rate based on the Bank’s level of qualified small business lending. The Hilltop Series B Preferred Stock is non-voting, except in limited circumstances, and ranks senior to Hilltop’s common stock with respect to the payment of dividends and distribution of assets upon any liquidation, dissolution or winding up of Hilltop.
The terms of the Hilltop Series B Preferred Stock restrict Hilltop’s ability to pay dividends on, make distributions with respect to, or redeem, purchase or acquire, or make a liquidation payment on its common stock and other Hilltop capital stock ranking junior to the Hilltop Series B Preferred Stock, and on other preferred stock and other stock ranking on a
19
Table of Contents
parity with the Hilltop Series B Preferred Stock, in the event that Hilltop does not declare dividends on the Hilltop Series B Preferred Stock during any dividend period.
The Series B Preferred Stock qualifies as Tier 1 capital and is entitled to receive non-cumulative dividends, payable quarterly, on each January 1, April 1, July 1 and October 1. The dividend rate, as a percentage of the liquidation amount, fluctuates on a quarterly basis during the first 10 quarters from its original issuance by PlainsCapital is outstanding, based upon changes in the level of “Qualified Small Business Lending” (“QSBL”) at the Bank. Until December 31, 2013, the dividend rate we pay on any outstanding shares of Series B Preferred Stock will fluctuate on a quarterly basis between one percent (1%) and five percent (5%) per annum, based upon changes in the level of qualified small business lending by the Bank measured against the Baseline. From January 1, 2014 through March 26, 2016, if we have not sufficiently increased our small business lending we may become subject to a dividend rate as high as seven percent (7%) per annum, and may be required to pay a dividend rate penalty of 0.5% per quarter. Beginning March 27, 2016, the dividend rate on any outstanding shares of Series B Preferred Stock will be fixed at nine percent (9%) per annum.
Except as noted in the next sentence, the Series B Preferred Stock may be redeemed at any time at the Company’s option, at a redemption price of 100 percent of the liquidation amount plus accrued but unpaid dividends to the date of redemption for the current period, subject to approval of the Federal Reserve Board. In the Merger Agreement, Hilltop agreed not to redeem or otherwise acquire the Company’s Series B Preferred prior to the second anniversary of the closing date of the Merger, or November 30, 2014. For more information, see “Risk Factors—The Treasury’s investment in us imposes restrictions and obligations upon us that could adversely affect the rights of our common stockholders.”
Governmental Monetary Policies. Our earnings are affected by domestic economic conditions and the monetary and fiscal policies of the U.S. government and its agencies. The monetary policies of the Federal Reserve Board have had, and are likely to continue to have, an important impact on the operating results of commercial banks through its power to implement national monetary policy in order, among other things, to curb inflation or combat a recession. The monetary policies of the Federal Reserve Board affect the levels of bank loans, investments and deposits through its influence over the issuance of U.S. government securities, its regulation of the discount rate applicable to member banks and its influence over reserve requirements to which member banks are subject. We cannot predict the nature or impact of future changes in monetary and fiscal policies.
PlainsCapital Bank
The Bank is subject to various requirements and restrictions under the laws of the United States, and to regulation, supervision and regular examination by the Texas Department of Banking. The Bank, as a state member bank, is also subject to regulation and examination by the Federal Reserve Board. As a bank with less than $10 billion in assets, the Bank became subject to the regulations issued by the CFPB on July 21, 2011, although the Federal Reserve Board continues to examine the Bank for compliance with federal consumer protection laws. The Bank is also an insured depository institution and, therefore, subject to regulation by the FDIC, although the Federal Reserve Board is the Bank’s primary federal regulator. The Federal Reserve Board, the Texas Department of Banking, the CFPB and the FDIC have the power to enforce compliance with applicable banking statutes and regulations. Such requirements and restrictions include requirements to maintain reserves against deposits, restrictions on the nature and amount of loans that may be made and the interest that may be charged thereon and restrictions relating to investments and other activities of the Bank. In July 2010, the FDIC voted to revise its Memorandum of Understanding with the primary federal regulators to enhance the FDIC’s existing backup authorities over insured depository institutions that the FDIC does not directly supervise. As a result, the Bank may be subject to increased supervision by the FDIC.
Restrictions on Transactions with Affiliates. Transactions between the Bank and its nonbanking affiliates, including Hilltop and PlainsCapital, are subject to Section 23A of the Federal Reserve Act. In general, Section 23A imposes limits on the amount of such transactions, and also requires certain levels of collateral for loans to affiliated parties. It also limits the amount of advances to third parties that are collateralized by the securities or obligations of Hilltop or its subsidiaries. Among other changes, the Dodd-Frank Act expands the definition of “covered transactions” and clarifies the amount of time that the collateral requirements must be satisfied for covered transactions, and amends the definition of “affiliate” in Section 23A to include “any investment fund with respect to which a member bank or an affiliate thereof is an investment advisor.”
Affiliate transactions are also subject to Section 23B of the Federal Reserve Act, which generally requires that certain transactions between the Bank and its affiliates be on terms substantially the same, or at least as favorable to the Bank, as those prevailing at the time for comparable transactions with or involving other nonaffiliated persons. The Federal Reserve
20
Table of Contents
has also issued Regulation W, which codifies prior regulations under Sections 23A and 23B of the Federal Reserve Act and interpretive guidance with respect to affiliate transactions.
Loans to Insiders. The restrictions on loans to directors, executive officers, principal stockholders and their related interests (collectively referred to herein as “insiders”) contained in the Federal Reserve Act and Regulation O apply to all insured institutions and their subsidiaries and holding companies. These restrictions include limits on loans to one borrower and conditions that must be met before such a loan can be made. There is also an aggregate limitation on all loans to insiders and their related interests. These loans cannot exceed the institution’s total unimpaired capital and surplus, and the Federal Reserve Board may determine that a lesser amount is appropriate. Insiders are subject to enforcement actions for knowingly accepting loans in violation of applicable restrictions. The Dodd-Frank Act amends the statutes placing limitations on loans to insiders by including credit exposures to the person arising from a derivatives transaction, repurchase agreement, reverse repurchase agreement, securities lending transaction, or securities borrowing transaction between the member bank and the person within the definition of an extension of credit.
Restrictions on Distribution of Subsidiary Bank Dividends and Assets. Dividends paid by the Bank have provided a substantial part of PlainsCapital’s operating funds and for the foreseeable future it is anticipated that dividends paid by the Bank to PlainsCapital will continue to be PlainsCapital’s and Hilltop’s principal source of operating funds. Capital adequacy requirements serve to limit the amount of dividends that may be paid by the Bank. Pursuant to the Texas Finance Code, a Texas banking association may not pay a dividend that would reduce its outstanding capital and surplus unless it obtains the prior approval of the Texas Banking Commissioner. Additionally, the FDIC and the Federal Reserve Board have the authority to prohibit Texas state banks from paying a dividend when they determine the dividend would be an unsafe or unsound banking practice. As a member of the Federal Reserve System, the Bank must also comply with the dividend restrictions with which a national bank would be required to comply. Those provisions are generally similar to those imposed by the state of Texas. Among other things, the federal restrictions require that if losses have at any time been sustained by a bank equal to or exceeding its undivided profits then on hand, no dividend may be paid.
In the event of a liquidation or other resolution of an insured depository institution, the claims of depositors and other general or subordinated creditors are entitled to a priority of payment over the claims of holders of any obligation of the institution to its stockholders, including any depository institution holding company (such as PlainsCapital and Hilltop) or any stockholder or creditor thereof.
Branching. The establishment of a branch must be approved by the Texas Department of Banking and the Federal Reserve Board, which consider a number of factors, including financial history, capital adequacy, earnings prospects, character of management, needs of the community and consistency with corporate powers. The regulators will also consider the applicant’s CRA record.
Interstate Branching. Effective June 1, 1997, the Riegle-Neal Interstate Banking and Branching Efficiency Act of 1994 amended the Federal Deposit Insurance ActivitiesAct and certain other statutes to permit state and national banks with different home states to merge across state lines, with approval of the appropriate federal banking agency, unless the home state of a participating bank had passed legislation prior to May 31, 1997 expressly prohibiting interstate mergers. Under the Riegle-Neal Act amendments, once a state or national bank has established branches in a state, that bank may establish and acquire additional branches at any location in the state at which any bank involved in the interstate merger transaction could have established or acquired branches under applicable federal or state law. If a state opted out of interstate branching within the specified time period, no bank in any other state may establish a branch in the state which has opted out, whether through an acquisition or de novo. Under the Dodd-Frank Act, de novo interstate branching by national banks is permitted if, under the laws of the state where the branch is to be located, a state bank chartered in that state would have been permitted to establish a branch.
Prompt Corrective Action. The Federal Deposit Insurance Corporation Improvement Act of 1991 establishes a system of prompt corrective action to resolve the problems of undercapitalized financial institutions. Under this system, the federal banking regulators have established five capital categories (“well capitalized,” “adequately capitalized,” “undercapitalized,” “significantly undercapitalized” and “critically undercapitalized”) in which all institutions are placed. Federal banking regulators are required to take various mandatory supervisory actions and are authorized to take other discretionary actions with respect to institutions in the three undercapitalized categories. The severity of the action depends upon the capital category in which the institution is placed. Generally, subject to a narrow exception, the banking regulator must appoint a receiver or conservator for an institution that is critically undercapitalized. The federal banking agencies have specified by regulation the relevant capital level for each category.
21
Table of Contents
An institution that is categorized as “undercapitalized”, “significantly undercapitalized” or “critically undercapitalized” is required to submit an acceptable capital restoration plan to its appropriate federal banking agency. A bank holding company must guarantee that a subsidiary depository institution meets its capital restoration plan, subject to various limitations. The controlling holding company’s obligation to fund a capital restoration plan is limited to the lesser of 5% of an undercapitalized subsidiary’s assets at the time it became undercapitalized or the amount required to meet regulatory capital requirements. An undercapitalized institution is also generally prohibited from increasing its average total assets, making acquisitions, establishing any branches or engaging in any new line of business, except under an accepted capital restoration plan or with FDIC approval. The regulations also establish procedures for downgrading an institution to a lower capital category based on supervisory factors other than capital.
FDIC Insurance Assessments. The FDIC has adopted a risk-based assessment system for insured depository institutions that takes into account the risks attributable to different categories and concentrations of assets and liabilities. The system assigns an institution to one of three capital categories: (1) “well capitalized;” (2) “adequately capitalized;” or (3) “undercapitalized.” These three categories are substantially similar to the prompt corrective action categories described above, with the “undercapitalized” category including institutions that are undercapitalized, significantly undercapitalized and critically undercapitalized for prompt corrective action purposes. The FDIC also assigns an institution to one of three supervisory subgroups based on a supervisory evaluation that the institution’s primary federal regulator provides to the FDIC and information that the FDIC determines to be relevant to the institution’s financial condition and the risk posed to the deposit insurance funds. The FDIC may terminate its insurance of deposits if it finds that the institution has engaged in unsafe and unsound practices, is in an unsafe or unsound condition to continue operations, or has violated any applicable law, regulation, rule, order or condition imposed by the FDIC.
In 2009, the FDIC adopted a final rule requiring a special assessment on insured institutions as part of its effort to rebuild the FDIC deposit insurance fund (“DIF”). The FDIC administers the DIF, and all insured depository institutions are required to pay assessments to the FDIC that fund the DIF. The Dodd-Frank Act broadens the base for FDIC insurance assessments. Assessments will now be based on the average consolidated total assets less tangible equity capital of a financial institution during the assessment period. On February 7, 2011, the FDIC issued a final rule implementing revisions to the assessment system mandated by the Dodd-Frank Act. The new regulation was effective April 1, 2011 and was reflected in the June 30, 2011 FDIC DIF balance and the invoices for assessments due September 30, 2011. Accruals for DIF assessments were $0.2 million for the month ended December 31, 2012.
The FDIC is required to maintain a designated reserve ratio of the DIF to insured deposits in the United States. The Dodd-Frank Act requires the FDIC to assess insured depository institutions to achieve a DIF ratio of at least 1.35 percent by September 30, 2020. Pursuant to its authority in the Dodd-Frank Act, the FDIC on December 20, 2010, published a final rule establishing a higher long-term target DIF ratio of greater than 2%. Deposit insurance assessment rates are subject to change by the FDIC and will be impacted by the overall economy and the stability of the banking industry as a whole. The FDIC will notify the Bank concerning an assessment rate that we will be charged for the assessment period. As a result of the new regulations, we expect to incur higher annual deposit insurance assessments, which could have a significant adverse impact on our financial condition and results of operations.
The Dodd-Frank Act permanently increased the standard maximum deposit insurance amount from $100,000 to $250,000. The FDIC insurance coverage limit applies per depositor, per insured depository institution for each account ownership category.
The Dodd-Frank Act instituted, for all insured depository institutions, unlimited deposit insurance on noninterest-bearing transaction accounts for the period from December 31, 2010 through December 31, 2012 for all depositors, including consumers, businesses and government entities. This unlimited insurance coverage, which expired on December 31, 2012, was separate from, and in addition to, the insurance coverage provided to a depositor’s other deposit accounts held at an FDIC-insured institution up to the permissible limit of $250,000.
Community Reinvestment Act. The CRA requires, in connection with examinations of financial institutions, that federal banking regulators (in the Bank’s case, the Federal Reserve Board) evaluate the record of each financial institution in meeting the credit needs of its local community, including low and moderate-income neighborhoods. These facts are also considered in evaluating mergers, acquisitions and applications to open a branch or facility. Failure to adequately meet these criteria could impose additional requirements and limitations on the Bank. Additionally, the Bank must publicly disclose the terms of various CRA-related agreements.
During the fourth quarter of 2011, the Bank received a “satisfactory” CRA rating in connection with its most-recent CRA Performance Evaluation. A CRA rating of less than “satisfactory” adversely affects a bank’s ability to establish new
22
Table of Contents
branches and impairs a bank’s ability to commence new activities that are “financial in nature” or acquire companies engaged in these activities. See “Risk factors—We are subject to extensive supervision and regulation that could restrict our activities and impose financial requirements or limitations on the conduct of our business and limit our ability to generate income.”
Privacy. Under the Gramm-Leach-Bliley Act, financial institutions are required to disclose their policies for collecting and protecting confidential information. Customers generally may prevent financial institutions from sharing nonpublic personal financial information with nonaffiliated third parties except under narrow circumstances, such as the processing of transactions requested by the consumer or when the financial institution is jointly sponsoring a product or service with a nonaffiliated third party. Additionally, financial institutions generally may not disclose consumer account numbers to any nonaffiliated third party for use in telemarketing, direct mail marketing or other marketing to consumers. The Bank and all of its subsidiaries have established policies and procedures to comply with the privacy provisions of the Gramm-Leach-Bliley Act.
Federal Laws Applicable to Credit Transactions. The loan operations of the Bank are also subject to federal laws applicable to credit transactions, such as the:
·Truth-In-Lending Act, governing disclosures of credit terms to consumer borrowers;
·Home Mortgage Disclosure Act of 1975, requiring financial institutions to provide information to enable the public and public officials to determine whether a financial institution is fulfilling its obligation to help meet the housing needs of the community it serves;
·Equal Credit Opportunity Act, prohibiting discrimination on the basis of race, creed or other prohibited factors in extending credit;
·Fair Credit Reporting Act of 1978, governing the use and provision of information to credit reporting agencies and preventing identity theft;
·Fair Debt Collection Practices Act, governing the manner in which consumer debts may be collected by collection agencies;
·Service Members Civil Relief Act, which amended the Soldiers’ and Sailors’ Civil Relief Act of 1940, governing the repayment terms of, and property rights underlying, secured obligations of persons in military service;
·The Dodd-Frank Act, which establishes the CFPB, an independent entity within the Federal Reserve, dedicated to promulgating and enforcing consumer protection laws applicable to all entities offering consumer financial services or products; and
·The rules and regulations of the various federal agencies charged with the responsibility of implementing these federal laws.
Interest and other charges collected or contracted for by the Bank are subject to state usury laws and federal laws concerning interest rates.
Federal Laws Applicable to Deposit Operations. The deposit operations of the Bank are subject to:
·Right to Financial Privacy Act, which imposes a duty to maintain confidentiality of consumer financial records and prescribes procedures for complying with administrative subpoenas of financial records;
·Truth in Savings Act, which requires the Bank to disclose the terms and conditions on which interest is paid and fees are assessed in connection with deposit accounts; and
·Electronic Funds Transfer Act and Regulation E issued by the Federal Reserve Board and the CFPB to implement that act, which govern automatic deposits to and withdrawals from deposit accounts and customers’ rights and liabilities arising from the use of ATMs and other electronic banking services. The Dodd-Frank Act amends the Electronic Funds Transfer Act to, among other things, give the Federal Reserve Board the authority to establish rules regarding interchange fees charged for electronic debit transactions by payment card issuers having assets over $10 billion and to enforce a new statutory requirement that such fees be reasonable and proportional to the actual cost of a transaction to the issuer.
23
Table of Contents
Capital Requirements. The Federal Reserve Board and the Texas Department of Banking monitor the capital adequacy of the Bank by using a combination of risk-based guidelines and leverage ratios. The agencies consider the Bank’s capital levels when taking action on various types of applications and when conducting supervisory activities related to the safety and soundness of individual banks and the banking system.
Under the regulatory capital guidelines, the Bank must maintain a total risk-based capital to risk-weighted assets ratio of at least 8.0%, a Tier 1 capital to risk-weighted assets ratio of at least 4.0%, and a Tier 1 capital to average total assets ratio of at least 4.0% (3.0% for banks receiving the highest examination rating) to be considered “adequately capitalized.” See the discussion herein under “The FDIC Improvement Act.” At December 31, 2012, the Bank’s ratio of total risk-based capital to risk-weighted assets was 11.93%, the Bank’s ratio of Tier 1 capital to risk-weighted assets was 11.83% and the Bank’s ratio of Tier 1 capital to average total assets was 8.84%. The Tier 1 Capital (to average assets) ratio was calculated using the average assets for the month of December 2012.
BASEL III. In December 2010 and January 2011, the Basel Committee on Banking Supervision (“BCBS”) published the final texts of reforms on capital and liquidity generally referred to as “Basel III”. Although Basel III is intended to be implemented by participating countries for large, internationally active banks, its provisions are likely to be considered by the U.S. banking regulators in developing new regulations applicable to other banks in the United States. For banks in the United States, among the most significant provisions of Basel III concerning capital are the following:
·a minimum ratio of common equity to risk-weighted assets reaching 4.5%, plus an additional 2.5% as a capital conservation buffer, after a phase-in period;
·a minimum ratio of Tier 1 capital to risk-weighted assets reaching 6.0% after a phase-in period;
·a minimum ratio of total capital to risk-weighted assets of 8.0%, plus the additional 2.5% capital conservation buffer, reaching 10.5% after a phase-in period;
·a minimum Tier 1 leverage ratio of 4.0%;
·an additional countercyclical capital buffer to be imposed by applicable banking regulators periodically at their discretion, with advance notice;
·restrictions on capital distributions and discretionary bonuses applicable when capital ratios fall within the buffer zone;
·deduction from common equity of deferred tax assets that depend on future profitability to be realized;
·increased capital requirements for counterparty credit risk relating to over-the-counter derivatives, repos and securities financing activities;
·for capital instruments issued on or after January 13, 2013 (other than common equity), a loss-absorbency requirement such that the instrument must be written off or converted to common equity if a trigger event occurs, either pursuant to applicable law or at the direction of the banking regulator. A trigger event is an event under which the banking entity would become nonviable without the write-off or conversion, or without an injection of capital from the public sector. The issuer must maintain authorization to issue the requisite shares of common equity if conversion were required;
·increased capital requirements for holding 1 to 4 family residential mortgages; and
·increased capital requirements for the representations and warranties associated with originating and selling 1 to 4 family residential mortgages.
The Basel III provisions on liquidity include complex criteria establishing: (i) a method to ensure that a bank maintains adequate unencumbered, high quality liquid assets to meet its liquidity needs for 30 days under a severe liquidity stress scenario; and (ii) a method to promote more medium and long-term funding of assets and activities, using a one-year horizon.
24
Table of Contents
Although Basel III is described as a “final text,” it is subject to the resolution of certain issues and to further guidance and modification, as well as to adoption by United States banking regulators, including decisions as to whether and to what extent it will apply to United States banks that are not large, internationally active banks. On June 7, 2012, the Federal Reserve Board released notices of proposed rulemaking to implement the capital reforms of Basel III and to implement certain aspects of the “standardized approach” in the BCBS’s final text on risk-based capital generally referred to as “Basel II”. Although the Basel III notice of proposed rulemaking did not specify an effective date or implementation schedule, it was originally contemplated that implementation would coincide with the Basel III implementation schedule, which commenced on January 1, 2013. However, in light of the volume of comments received and the wide range of issues expressed during the comment period, the Federal Reserve issued a press release on November 9, 2012 clarifying that it did not expect that any of the proposed rules would become effective on January 1, 2013 and will take operational and other considerations into account when determining appropriate implementation dates and associated transition periods. On January 6, 2013, the Group of Governors and Heads of Supervision, the oversight body of the Basel Committee, met and unanimously endorsed a 4 year delay in the Basel Committee’s rules establishing a liquidity coverage ratio (“LCR”). Under the revised liquidity requirements, banks would be required to meet 60 percent of the LCR obligations by 2015, and the full rule would be phased in annually through 2019. At this time, it is unclear how these provisions will be implemented in the United States and what impact these delays in the effective dates will have on the capital proposals. We continue to monitor all developments related to Basel III.
FIRREA. The Financial Institutions Reform, Recovery and Enforcement Act of 1989, or FIRREA, includes various provisions that affect or may affect the Bank. Among other matters, FIRREA generally permits bank holding companies to acquire healthy thrifts as well as failed or failing thrifts. FIRREA removed certain cross marketing prohibitions previously applicable to thrift and bank subsidiaries of a common holding company. Furthermore, a multi-bank holding company may now be required to indemnify the DIF against losses it incurs with respect to such company’s affiliated banks, which in effect makes a bank holding company’s equity investments in healthy bank subsidiaries available to the FDIC to assist such company’s failing or failed bank subsidiaries.
In addition, pursuant to FIRREA, any depository institution that has been chartered less than two years, is not in compliance with the minimum capital requirements of its primary federal banking regulator, or is otherwise in a troubled condition must notify its primary federal banking regulator of the proposed addition of any person to its board of directors or the employment of any person as a senior executive officer of the institution at least 30 days before such addition or employment becomes effective. During such 30 day period, the applicable federal banking regulatory agency may disapprove of the addition of or employment of such director or officer. The Bank is not subject to any such requirements. FIRREA also expanded and increased civil and criminal penalties available for use by the appropriate regulatory agency against certain “institution affiliated parties” primarily including: (i) management, employees and agents of a financial institution; (ii) independent contractors such as attorneys and accountants and others who participate in the conduct of the financial institution’s affairs and who caused or are likely to cause more than minimum financial loss to or a significant adverse effect on the institution, who knowingly or recklessly violate a law or regulation, breach a fiduciary duty or engage in unsafe or unsound practices. Such practices can include the failure of an institution to timely file required reports or the submission of inaccurate reports. Furthermore, FIRREA authorizes the appropriate banking agency to issue cease and desist orders that may, among other things, require affirmative action to correct any harm resulting from a violation or practice, including restitution, reimbursement, indemnifications or guarantees against loss. A financial institution may also be ordered to restrict its growth, dispose of certain assets or take other action as determined by the ordering agency to be appropriate.
The FDIC Improvement Act. The Federal Deposit Insurance Corporation Improvement Act of 1991, or FDICIA, made a number of reforms addressing the safety and soundness of the deposit insurance system, supervision of domestic and foreign depository institutions, and improvement of accounting standards. This statute also limited deposit insurance coverage, implemented changes in consumer protection laws and provided for least-cost resolution and prompt regulatory action with regard to troubled institutions.
FDICIA requires every bank with total assets in excess of $500 million to have an annual independent audit made of the bank’s financial statements by a certified public accountant to verify that the financial statements of the bank are presented in accordance with generally accepted accounting principles (“GAAP”) and comply with such other disclosure requirements as prescribed by the FDIC.
25
Table of Contents
FDICIA also places certain restrictions on activities of banks depending on their level of capital. FDICIA divides banks into five different categories, depending on their level of capital. Under regulations adopted by the FDIC:
·a bank is deemed to be “well capitalized” if it has a total Risk-Based Capital Ratio of 10.0% or more, a Tier 1 Capital Ratio of 6.0% or more, a Leverage Ratio of 5.0% or more, and the bank is not subject to an order or capital directive to meet and maintain a certain capital level;
·a bank is deemed to be “adequately capitalized” if it has a total Risk-Based Capital Ratio of 8.0% or more, a Tier 1 Capital Ratio of 4.0% or more and a Leverage Ratio of 4.0% or more (unless it receives the highest composite rating at its most recent examination and is not experiencing or anticipating significant growth, in which instance it must maintain a Leverage Ratio of 3.0% or more);
·a bank is deemed to be “undercapitalized” if it has a total Risk-Based Capital Ratio of less than 8.0%, a Tier 1 Capital Ratio of less than 4.0% or a Leverage Ratio of less than 4.0%;
·a bank is deemed to be “significantly undercapitalized” if it has a Risk-Based Capital Ratio of less than 6.0%, a Tier 1 Capital Ratio of less than 3.0% and a Leverage Ratio of less than 3.0%; and
·a bank is deemed to be “critically undercapitalized” if it has a Leverage Ratio of less than or equal to 2.0%.
In addition, the FDIC has the ability to downgrade a bank’s classification (but not to “critically undercapitalized”) based on other considerations even if the bank meets the capital guidelines. According to these guidelines, the Bank was classified as “well capitalized” at December 31, 2012.
In addition, if a bank is classified as “undercapitalized,” the bank is required to submit a capital restoration plan to the federal banking regulators. Pursuant to FDICIA, an “undercapitalized” bank is prohibited from increasing its assets, engaging in a new line of business, acquiring any interest in any company or insured depository institution, or opening or acquiring a new branch office, except under certain circumstances, including the acceptance by the federal banking regulators of a capital restoration plan for the bank.
Furthermore, if a bank is classified as “undercapitalized,” the federal banking regulators may take certain actions to correct the capital position of the bank; if a bank is classified as “significantly undercapitalized” or “critically undercapitalized,” the federal banking regulators would be required to take one or more prompt corrective actions. These actions would include, among other things, requiring: sales of new securities to bolster capital, improvements in management, limits on interest rates paid, prohibitions on transactions with affiliates, termination of certain risky activities and restrictions on compensation paid to executive officers. If a bank is classified as “critically undercapitalized,” FDICIA requires the bank to be placed into conservatorship or receivership within 90 days, unless the federal banking regulators determines that other action would better achieve the purposes of FDICIA regarding prompt corrective action with respect to undercapitalized banks.
The capital classification of a bank affects the frequency of examinations of the bank and impacts the ability of the bank to engage in certain activities and affects the deposit insurance premiums paid by such bank. Under FDICIA, the federal banking regulators are required to conduct a full-scope, on-site examination of every bank at least once every 12 months. An exception to this rule is made, however, that provides that banks (i) with assets of less than $100 million, (ii) that are categorized as “well capitalized,” (iii) that were found to be well managed and composite rating was outstanding and (iv) have not been subject to a change in control during the last 12 months, need only be examined once every 18 months.
Brokered Deposits. Under FDICIA, banks may be restricted in their ability to accept brokered deposits, depending on their capital classification. “Well capitalized” banks are permitted to accept brokered deposits, but banks that are not “well capitalized” are not permitted to accept such deposits. The FDIC may, on a case-by-case basis, permit banks that are “adequately capitalized” to accept brokered deposits if the FDIC determines that acceptance of such deposits would not constitute an unsafe or unsound banking practice with respect to the bank. At December 31, 2012, the Bank was “well capitalized” and therefore not subject to any limitations with respect to its brokered deposits. Brokered deposits are the subject of a study under the Dodd-Frank Act.
Federal limitations on activities and investments. The equity investments and activities, as a principle of FDIC-insured state-chartered banks, are generally limited to those that are permissible for national banks. Under regulations dealing with equity investments, an insured state bank generally may not directly or indirectly acquire or retain any equity investment of a type, or in an amount, that is not permissible for a national bank.
26
Table of Contents
Check Clearing for the 21st Century Act. The Check Clearing for the 21st Century Act, also known as Check 21, gives “substitute checks,” such as a digital image of a check and copies made from that image, the same legal standing as the original paper check.
Federal Home Loan Bank System. The Federal Home Loan Bank, or FHLB, system, of which the Bank is a member, consists of 12 regional FHLBs governed and regulated by the Federal Housing Finance Board. The FHLBs serve as reserve or credit facilities for member institutions within their assigned regions. The reserves are funded primarily from proceeds derived from the sale of consolidated obligations of the FHLB system. The FHLBs make loans (i.e., advances) to members in accordance with policies and procedures established by the FHLB and the boards of directors of each regional FHLB.
As a system member, according to currently existing policies and procedures, the Bank is entitled to borrow from the FHLB of its respective region and is required to own a certain amount of capital stock in the FHLB. The Bank is in compliance with the stock ownership rules with respect to such advances, commitments and letters of credit and home mortgage loans and similar obligations. All loans, advances and other extensions of credit made by the FHLB to the Bank are secured by a portion of the respective mortgage loan portfolio, certain other investments and the capital stock of the FHLB held by the Bank.
Anti-terrorism and Money Laundering Legislation. The Bank is subject to the Uniting and Strengthening America by Providing Appropriate Tools Required to Intercept and Obstruct Terrorism of 2001 (the “USA PATRIOT Act”), the Bank Secrecy Act and rules and regulations of the Office of Foreign Assets Control. These statutes and related rules and regulations impose requirements and limitations on specific financial transactions and account relationships intended to guard against money laundering and terrorism financing. The Bank has established a customer identification program pursuant to Section 326 of the USA PATRIOT Act and the Bank Secrecy Act, and otherwise has implemented policies and procedures intended to comply with the foregoing rules.
PrimeLending
PrimeLending and the Bank are subject to the rules and regulations of the CFPB, FHA, VA, the Federal National Mortgage Association, the Federal Home Loan Mortgage Corporation and Government National Mortgage Association with respect to originating, processing, selling and servicing mortgage loans and the issuance and sale of mortgage-backed securities. Those rules and regulations, among other things, prohibit discrimination and establish underwriting guidelines which include provisions for inspections and appraisals, require credit reports on prospective borrowers and fix maximum loan amounts, and, with respect to VA loans, fix maximum interest rates. Mortgage origination activities are subject to, among others, the Equal Credit Opportunity Act, Federal Truth-in-Lending Act, Secure and Fair Enforcement of Mortgage Licensing Act, Home Mortgage Disclosure Act, Fair Credit Reporting Act and the Real Estate Settlement Procedures Act and the regulations promulgated thereunder which, among other things, prohibit discrimination and require the disclosure of certain basic information to borrowers concerning credit terms and settlement costs. PrimeLending and the Bank are also subject to regulation by the Texas Department of Banking with respect to, among other things, the establishment of maximum origination fees on certain types of mortgage loan products. PrimeLending and the Bank are also subject to the provisions of the Dodd-Frank Act. Among other things, the Dodd-Frank Act established the CFPB and provides mortgage reform provisions regarding a customer’s ability to repay, restrictions on variable-rate lending, loan officers’ compensation, risk retention, and new disclosure requirements. The Dodd-Frank Act also clarifies that applicable state laws, rules and regulations related to the origination, processing, selling and servicing of mortgage loans continue to apply to PrimeLending. The additional regulatory requirements affecting our mortgage origination operations will result in increased compliance costs and may impact revenue.
On August 16, 2010, the Federal Reserve Board published a final rule on loan banker compensation, pursuant to the Dodd-Frank Act, which prohibits certain compensation payments to loan bankers and the practice of steering consumers to loans not in their interest when it will result in greater compensation for a loan banker. This final rule became effective on April 1, 2011, however, the Federal Reserve Board noted in the final rule that the CFPB may clarify the rule in the future pursuant to the CFPB’s authority granted under the Dodd-Frank Act. In addition, the Dodd-Frank Act directed the Federal Reserve Board to promulgate regulations requiring lenders and securitizers to retain an economic interest in the credit risk relating to loans the lender sells and other asset-backed securities that the securitizer issues if the loans have not complied with the ability to repay standards spelled out in the Dodd-Frank Act and its implementing regulations. The risk retention requirement has not become effective to date but is expected to be 5%, subject to increase or decrease by regulation. Final regulations have not yet been issued.
27
Table of Contents
On March 2, 2011, the Federal Reserve Board published a final rule implementing a provision in the Dodd-Frank Act that provides a separate, higher rate threshold for determining when the escrow requirements apply to higher-priced mortgage loans that exceed the maximum principal obligation eligible for purchase by Freddie Mac.
In January 2013, the CFPB published a series of very detailed and complex final rules that will impact mortgage origination and servicing once they become effective, generally in January 2014 unless noted below. Had these final rules not been published, many of the statutory requirements in Title XIV of the Dodd-Frank Act would have become effective on January 21, 2013 without any implementing regulations.
The final rules concerning mortgage origination and servicing address the following topics:
Ability to Repay. This final rule implements the Dodd-Frank Act provisions requiring that for residential mortgages, creditors must make a reasonable and good faith determination based on verified and documented information that the consumer has a reasonable ability to repay the loan according to its terms. The final rule also establishes a presumption of compliance with the ability to repay determination for a certain category of mortgages called “qualified mortgages” meeting a series of detailed requirements. The final rule also provides a rebuttable presumption for higher-priced mortgage loans.
High-Cost Mortgage. This final rule strengthens consumer protections for high-cost mortgages (generally bans balloon payments and prepayment penalties, subject to exceptions and bans or limits certain fees and practices) and requires consumers to receive information about homeownership counseling prior to taking out a high-cost mortgage.
Appraisals for High-Risk Mortgages. The final rule permits a creditor to extend a higher-priced (subprime) mortgage loan (“HPML) only if the following conditions are met (subject to exceptions): (i) the creditor obtains a written appraisal; (ii) the appraisal is performed by a certified or licensed appraiser; and (iii) the appraiser conducts a physical property visit of the interior of the property. The rule also requires that during the application process, the applicant receives a notice regarding the appraisal process and their right to receive a free copy of the appraisal.
Copies of Appraisals. This final rule amends Regulation B that implements the Equal Credit Opportunity Act. It requires a creditor to provide a free copy of appraisal or valuation reports prepared in connection with any closed-end loan secured by a first lien on a dwelling. The final rule requires notice to applicants of the right to receive copies of any appraisal or valuation reports and creditors must send copies of the reports whether or not the loan transaction is consummated. Creditors must provide the copies of the appraisal or evaluation reports for free, however, the creditors may charge reasonable fees for the cost of the appraisal or valuation unless applicable law provides otherwise.
Escrow Requirements. This final rule implements Dodd-Frank Act changes that generally extend the required duration of an escrow account on certain higher-priced mortgage loans from a minimum of one year to a minimum of five years, subject to certain exemptions for loans made by certain creditors that operate predominantly in rural or underserved areas, as long as certain other criteria are met. This final rule is effective on June 1, 2013.
Servicing. Two final rules were published to implement laws to protect consumers from detrimental actions by mortgage servicers and to provide consumers with better tools and information when dealing with mortgage servicers. One final rule amends Regulation Z, which implements the Truth in Lending Act, and a second final rule amends Regulation X, which implements the Real Estate Settlement Procedures Act. The rules cover nine major topics implementing the Dodd-Frank Act provisions related to mortgage servicing. The final rules include a number of exemptions and other adjustments for small servicers, defined as servicers that service 5,000 or fewer mortgage loans and service only mortgage loans that they or an affiliate originated or own.
Mortgage Loan Originator Compensation. This final rule implements Dodd-Frank Act requirements, as well as revises and clarifies existing regulations and commentary on loan originator compensation. The rule also prohibits, among other things: (i) certain arbitration agreements; (ii) financing certain credit insurance in connection with a mortgage loan; (iii) compensation based on a term of a transaction or a proxy for a term of a transaction; and (iv) dual compensation from a consumer and another person in connection with the transaction. The final rule also imposes a duty on individual loan officers, mortgage brokers and creditors to be “qualified” and, when applicable, registered or licensed to the extent required under applicable State and Federal law.
28
Table of Contents
Additional rules and regulations are expected including risk retention rules which would require lenders and securitizers to retain an economic interest in the credit risk relating to loans the lender sells and other asset-backed securities that the securitizer issues if the loans have not complied with the ability to repay standards spelled out in the Dodd-Frank Act and its implementing regulations. The risk retention requirement has not become effective to date but is expected to be 5%, subject to increase or decrease by regulation. Any additional regulatory requirements affecting PrimeLending mortgage origination operations will result in increased compliance costs and may impact revenue.
NLASCO
NLASCO’s insurance subsidiaries, NLIC and ASIC, are subject to regulation and supervision in each state where they are licensed to do business. This regulation and supervision is vested in state agencies having broad administrative power over the various aspects of the business of NLIC and ASIC.
16
Table of Contents
State insurance holding company regulationregulation.
NLASCO controls two operating insurance companies, NLIC and ASIC, and is subject to the insurance holding company laws of Texas, the state in which those insurance companies are domiciled. These laws generally require NLASCO to register with the Texas Department of Insurance and periodically to furnish financial and other information about the operations of companies within its holding company structure. Generally under these laws, all transactions between an insurer and an affiliated company in its holding company structure, including sales, loans, reinsurance agreements and service agreements, must be fair and reasonable and, if satisfying a specified threshold amount or of a specified category, require prior notice and approval or non-objection by the Texas Department of Insurance.
Changes of control
Before a person can acquire control of an insurance company domiciled in Texas, prior written approval must be obtained from the Texas Department of Insurance. Prior to granting approval of an application to acquire control of an insurer, the Texas Department of Insurance will consider the following factors, among others:
·the financial strength of the applicant;
·the integrity and management experience of the applicant’s board of directors and executive officers;
·the acquirer’s plans for the management of the domestic insurer;
·the acquirer’s plans to declare dividends, sell assets or incur debt;
·the acquirer’s plans for the future operations of the domestic insurer;
·the impact of the acquisition on continued licensure of the domestic insurer;
·the impact on the interests of Texas policyholders; and
·any anti-competitive results that may arise from the consummation of the acquisition of control.
Pursuant to the Texas insurance holding company statutes, “control” means the possession, direct or indirect, of the power to direct, or cause the direction of, the management and policies of the company, whether through the ownership of voting securities, by contract (except a commercial contract for goods or non-management services) or otherwise. Control is presumed to exist if any person directly or indirectly owns, controls or holds with the power to vote 10% or more of the voting securities of the company; however, the state’s insurance department, after notice and a hearing, may determine that a person or entity that directly or indirectly owns, controls or holds with the power to vote less than 10% of the voting securities of the company nonetheless “controls” the company. Because a person acquiring 10% or more of HTH’s common stock would indirectly control the same percentage of the stock of ASIC and two affiliated corporations controlling NLIC, the change of control laws of the State of Texas would apply to such a transaction.
These laws may discourage potential acquisition proposals and may delay, deter or prevent change of control transactions, including those that some or all of the Company’s stockholders might consider to be desirable.
National Association of Insurance CommissionersCommissioners.
The National Association of Insurance Commissioners, or NAIC, is a group consisting of state insurance commissioners that discuss issues and formulatesformulate policy with respect to regulation, reporting and accounting for insurance companies. Although the NAIC has no legislative authority and insurance companies are at all times subject to the laws of their respective domiciliary states and, to a lesser extent, other states in which they conduct business, the NAIC is influential in determining the form in which such laws are enacted. Certain Model Insurance Laws, Regulations and Guidelines, or Model Laws, have been promulgated by the NAIC as a minimum standard by which state regulatory systems and regulations are measured. Adoption of state laws that provide for substantially similar regulations to those described in the Model Laws is a requirement for accreditation by the NAIC.
The NAIC provides authoritative guidance to insurance regulators on current statutory accounting issues by promulgating and updating a codified set of statutory accounting practices in its Accounting Practices and Procedures Manual. The Texas Department of Insurance has generally adopted these codified statutory accounting practices.
17
Table of Contents
Texas also has adopted laws substantially similar to the NAIC’s risk based capital, or RBC laws, which require insurers to maintain minimum levels of capital based on their investments and operations. Domestic property and casualty insurers are required to report their RBC based on a formula that attempts to measure statutory capital and surplus needs based on the risks in the insurer’s mix of products and investment portfolio. The formula is designed to allow the Texas Department of Insurance to identify potential inadequately capitalized companies. Under the formula, a company determines its RBC by taking into account certain risks related to its assets (including risks related to its investment portfolio and ceded reinsurance) and its liabilities (including underwriting risks related to the nature and experience of its insurance business). Among other requirements, an insurance company must maintain capital and surplus of at least 200% of the RBC computed by the NAIC’s RBC model (known as the “Authorized Control Level” of RBC). At December 31, 2011,2012, NLIC and ASIC capital and surplus levels exceeded the minimum RBC requirements that would trigger regulatory attention. In their 20112012 statutory financial statements, both NLIC and ASIC complied with the NAIC’s RBC reporting requirements.
The NAIC’s Insurance Regulatory Information System, or IRIS, was developed to assist state insurance departments in executing their statutory mandates to oversee the financial condition of insurance companies. IRIS identifies twelve industry ratios and specifies a range of “usual values” for each ratio. Departure from the usual values on four or more of these ratios can lead to inquiries from state insurance commissioners as to certain aspects of an insurer’s business. For 2011,2012, all ratios for both NLIC and ASIC were within the usual values.values, with two exceptions. Both companies fell below the indicated minimum investment yield range of 3%, with NLIC at 2.8% and ASIC at 1.9%, due to the concentration in cash at each company. We expect improvement in the yields at both companies as appropriate investment opportunities are identified. Additionally, NLIC’s two-year operating ratio was calculated at 101%, which is above the threshold of 100%, primarily due to the weather events experienced over the past two year period.
The NAIC adopted an amendment to its “Model Audit Rule” in response to the passage of the Sarbanes-Oxley Act of 2002, or SOX. The amendment is effective for financial statements for accounting periods after January 1, 2010. This amendment addresses auditor independence, corporate governance and, most notably, the application of certain provisions of Section 404 of SOX regarding internal control reporting. The rules relating to internal controls apply to insurers with gross direct and assumed written premiums of $500 million or more, measured at the legal entity level (rather than at the insurance holding company level), and to insurers that the domiciliary commissioner selects from among those identified as in hazardous condition, but exempts SOX compliant entities. Neither NLIC nor ASIC currently has direct and assumed written premiums of at least $500 million, but it is conceivable that this may change in the future; however, NLASCO must be SOX compliant because it is wholly-ownedwholly owned by HTH, a public company subject to SOX.
29
Table of Contents
Legislative changeschanges.
From time to time, various regulatory and legislative changes have been, or are, proposed that would adversely affect the insurance industry. Among the proposals that have been, or are being, considered are the possible introduction of Federal regulation in addition to, or in lieu of, the current system of state regulation of insurers and proposals in various state legislatures (some of which proposals have been enacted) to conform portions of their insurance laws and regulations to various Model Laws adopted by the NAIC. NLASCO is unable to predict whether any of these laws and regulations will be adopted, the form in which any such laws and regulations would be adopted, or the effect, if any, these developments would have on its financial condition or results of operations.
In November 2002, in response to the tightening supply in certain insurance and reinsurance markets resulting from, among other things, the September 11, 2001 terrorist attacks, the Terrorism Risk Insurance Act, or TRIA, was enacted. TRIA was modified and extended by the Terrorism Risk Insurance Extension Act of 2005 and extended again by the Terrorism Risk Insurance Program Reauthorization Act of 2007. These Acts created a Federal Program designed to ensure the availability of commercial insurance coverage for terrorist acts in the United States. This Program helped the commercial property and casualty insurance industry cover claims related to terrorism-related losses and requires such companies to offer coverage for certain acts of terrorism. As a result, NLASCO is prohibited from adding certain terrorism exclusions to the policies written by its insurance company subsidiaries. The 2005 Act extended the Program through 2007, but eliminated commercial auto, farm-owners and certain other commercial coverages from its scope. The Reauthorization Act further extended the Program through December 31, 2014 and fixed the reimbursement percentage at 85% and the deductible at 20%. Although NLASCO is protected by federally funded terrorism reinsurance as provided for in the TRIA, there is a substantial deductible that must be met, the payment of which could have an adverse effect on its financial condition and results of operations. NLASCO’s deductible for 2011under the Program was $1.6 million.million for 2012 and is estimated to be $1.7 million in 2013. Potential future changes to the TRIA could also adversely affect NLASCO by causing its reinsurers to increase prices or withdraw from certain markets where terrorism coverage is required. NLASCO had no terrorism-related losses in 2012.
18
Table of Contents
In 2003, legislation was passed in Texas that significantly changed the regulation of homeowners insurance, and, to a lesser extent, automobile insurance. Prior to 2003, certain types of insurers, including insurance companies that participate in Lloyd’s, reciprocals, county mutuals and farm mutuals that wrote these lines of insurance were generally exempt from rate regulation. The 2003 legislation eliminated, or severely reduced, these exemptions, and imposed a new rate regulation regime for all insurers writing these lines of insurance. This legislation also included limitations on the use of credit scoring and territorial distinctions in underwriting and rating risks. Further, the Texas Commissioner of Insurance has been given broader authority under the law to order refunds to policyholders when rates charged have been deemed excessive or unfairly discriminatory.
State insurance regulations
. State insurance authorities have broad powers to regulate U.S. insurance companies. The primary purposes of these powers are to promote insurer solvency and to protect individual policyholders. The extent of regulation varies, but generally has its source in statutes that delegate regulatory, supervisory and administrative power to state insurance departments. These powers relate to, among other things, licensing to transact business, accreditation of reinsurers, admittance of assets to statutory surplus, regulating unfair trade and claims practices, establishing actuarial requirements and solvency standards, regulating investments and dividends, and regulating policy forms, related materials and premium rates. State insurance laws and regulations require insurance companies to file financial statements prepared in accordance with accounting principles prescribed by insurance departments in states in which they conduct insurance business, and their operations are subject to examination by those departments.
As part of the broad authority that state insurance commissioners hold, they may impose periodic rules or regulations related to local issues or events. An example is the State of Louisiana’s prohibition on the cancellation of policies for nonpayment of premium in the wake of Hurricane Katrina. Due to the extent of damage and displacement of people, inability of mail to reach policyholders and inaccessibility of entire neighborhoods, the State of Louisiana prohibited insurance companies from canceling policies for a period of time following that named storm.
Periodic financial and market conduct examinations
. The insurance departments in every state in which NLASCO’s insurance companies do business may conduct on-site visits and examinations of its insurance companies at any time to review the insurance companies’ financial condition, market conduct and relationships and transactions with affiliates. In addition, the Texas Department of Insurance will conduct comprehensive examinations of insurance companies domiciled in Texas every three to five years. Examinations are generally carried out in cooperation with the insurance departments of other licensing states under guidelines promulgated by the NAIC.
The Texas Department of Insurance completed their last examinations of NLIC and ASIC through December 31, 20062010 in an examination reportsreport dated June 13, 2008 and June 1, 2008, respectively. TheseMay 12, 2012. This examination report contained no information of any significant compliance issues. In 2010, ASIC and NLIC were notified by the Texas Department of Insurance that a statutory examination had been scheduled to be performed during the calendar years 2011/2012. The examinations are as of December 31, 2010, and cover the period since the last examination, which was as of December 31, 2006. We have received drafts of the examination reportsissues and there is no indication of any significant changes to our financial statements as a result of the examinationsexamination by the domiciliary state.
1930
Table of Contents
State dividend limitationslimitations.
The Texas Department of Insurance must approve any dividend declared or paid by an insurance company domiciled in the state if the dividend, together with all dividends declared or distributed by that insurance company during the preceding twelve months, exceeds the greater of (1) 10% of its policyholders’ surplus as of December 31 of the preceding year or (2) 100% of its net income for the preceding calendar year. The greater number is known as the insurer’s extraordinary dividend limit. As ofAt December 31, 2011,2012, the extraordinary dividend limit for NLIC and ASIC is $9.4$9.5 million and $2.5$2.6 million, respectively. In addition, NLASCO’s insurance companies may only pay dividends out of their earned surplus.
Statutory accounting principlesprinciples.
Statutory accounting principles, or SAP, are a comprehensive basis of accounting developed to assist insurance regulators in monitoring and regulating the solvency of insurance companies. SAP rules are different from generally accepted accounting principles in the United States of America, or GAAP, and are intended to reflect a more conservative view of the insurer. SAP is primarily concerned with measuring an insurer’s surplus to policyholders. Accordingly, SAP focuses on valuing assets and liabilities of insurers at financial reporting dates in accordance with insurance laws and regulatory provisions applicable in each insurer’s domiciliary state.
While GAAP is concerned with a company’s solvency, it also stresses other financial measurements, such as income and cash flows. Accordingly, GAAP gives more consideration to appropriate matching of revenues and expenses and accounting for management’s stewardship of assets than does SAP. As a direct result, different assets and liabilities and different amounts of assets and liabilities will be reflected in financial statements prepared in accordance with GAAP as opposed to SAP. SAP, as established by the NAIC and adopted by Texas regulators, determines the statutory surplus and statutory net income of the NLASCO insurance companies and, thus, determines the amount they have available to pay dividends.
Guaranty associationsassociations.
In Texas, and in all of the jurisdictions in which NLIC and ASIC are, or in the future may be, licensed to transact business, there is a requirement that property and casualty insurers doing business within the jurisdiction must participate in guaranty associations, which are organized to pay limited covered benefits owed pursuant to insurance policies issued by impaired, insolvent or failed insurers. These associations levy assessments, up to prescribed limits, on all member insurers in a particular state on the basis of the proportionate share of the premiums written by member insurers in the lines of business in which the impaired, insolvent or failed insurer was engaged. States generally permit member insurers to recover assessments paid through full or partial premium tax offsets.
NLASCO did not incur any levies in 2012, 2011 2010 or 2009.2010. Property and casualty insurance company insolvencies or failures may, however, result in additional guaranty fund assessments at some future date. At this time NLASCO is unable to determine the impact, if any, that these assessments may have on its financial condition or results of operations. NLASCO has established liabilities for guaranty fund assessments with respect to insurers that are currently subject to insolvency proceedings.
National Flood Insurance ProgramProgram.
NLASCO voluntarily participates as a Write Your Own carrier in the National Flood Insurance Program, or NFIP. The NFIP is administered and regulated by the Federal Emergency Management Agency (FEMA). NLASCO operates as a fiscal agent of the Federal government in the selling and administering of the Standard Flood Insurance Policy. This involves writing the policy, the collection of premiums and the paying of covered claims. All pricing is set by FEMA and all collections are made by the Company.
The Company cedes 100% of the policies written by the Company on the Standard Flood Insurance Policy to FEMA; however, if FEMA were unable to perform, the Company would have a legal obligation to the policyholders. The terms of the reinsurance agreement are standard terms, which require the Company to maintain its rating criteria, determine policyholder eligibility, issue policies on the Company’s paper, endorse and cancel policies, collect from insureds and process claims. NLASCO receives ceding commissions from NFIP for underwriting administration, claims management, commission and adjuster fees.
20
Table of Contents
Participation in involuntary risk plansplans.
NLASCO’s insurance companies are required to participate in residual market or involuntary risk plans in various states where they are licensed that provide insurance to individuals or entities that otherwise would be unable to purchase coverage from private insurers. If these plans experience losses in excess of their capitalization, they may assess participating insurers for proportionate shares of their financial deficit. These plans include the Georgia Underwriting Association, Texas FAIR Plan Association, Texas Windstorm Insurance Agency, or TWIA, the Louisiana Citizens Property Insurance Corporation, the Mississippi Residential Property Insurance Underwriting Association and the Mississippi Windstorm Underwriting Association. For example in 2005, following Hurricanes Katrina and Rita, the above plans levied collective assessments totaling $10.4 million on NLASCO’s insurance subsidiaries. Additional assessments, including emergency assessments, may follow. In some of these instances, NLASCO’s insurance companies should be able to recover these assessments through policyholder surcharges, higher rates or reinsurance. The ultimate impact hurricanes have on the Texas and Louisiana facilities is currently uncertain and future assessments can occur whenever the involuntary facilities experience financial deficits.
OtherOther.
Insurance activities are subject to state insurance laws and regulations as determined by the particular insurance commissioner for each state in accordance with the McCarran-Ferguson Act, as well as subject to the Gramm-Leach-Bliley Act and the privacy regulations promulgated by the Federal Trade Commission.
Changes in any of the laws governing our conduct could have an adverse impact on our ability to conduct our business or could materially affect our financial position, operating income, expense or cash flow.
SWS Group, Inc.
SWS Group, Inc., or SWS, is a Dallas-based company offering a broad range of investment and financial services through its subsidiaries. SWS’s common stock is listed on the New York Stock Exchange under the symbol SWS. SWS subsidiaries include Southwest Securities, Inc., a national clearing firm, registered investment adviser and registered broker-dealer; SWS Financial Services, Inc., a registered investment adviser and a registered broker-dealer serving independent securities brokers and their clients; and Southwest Securities, FSB, one of the largest banks headquartered in the Dallas-Fort Worth metropolitan area.
On March 20, 2011, Hilltop entered into a Funding Agreement with SWS, Oak Hill Capital Partners III, L.P. and Oak Hill Capital Management Partners III, L.P. (together, “Oak Hill” and, collectively with Hilltop, the “Investors”). As contemplated by the Funding Agreement, on July 29, 2011, the Investors entered into a Credit Agreement with SWS that provides for a five-year unsecured term loan of $100 million in the aggregate. The loan proceeds were deposited in an account at SWS for further credit to Southwest Securities, FSB, unless otherwise agreed by the Investors. Interest is payable at 8% per year, and SWS is permitted to prepay all or a portion of the loans under certain circumstances after three years.
In connection with the Funding Agreement and the loans made by the Investors under the Credit Agreement, on July 29, 2011, SWS issued a warrant to Hilltop to purchase up to 8,695,652 shares of common stock of SWS (“Warrant”). The Warrant represents approximately a 17% equity interest in SWS (assuming each Investor exercises its respective Warrant in full). The Warrant is exercisable for five years, but will expire to the extent that SWS makes prepayments on the loans and the Investors do not promptly exercise a corresponding portion of the Warrants. To the extent that the exercise of a Warrant by a holder would cause the holder to be deemed to control SWS under applicable regulations, SWS will issue the holder newly issued non-voting Series A Preferred Stock (the “Series A Preferred Stock”). Subject to applicable regulations, in limited circumstances, shares of Series A Preferred Stock will be convertible into shares of SWS common stock.
On July 29, 2011, the Investors also entered into an Investor Rights Agreement with SWS that provides the Investors with certain rights with respect to the common stock that may be issued upon the exercise of the Warrants or upon the conversion of the Series A Preferred Stock if a holder exercises its Warrants for shares of Series A Preferred Stock instead of common stock, including certain preemptive rights and registration rights. Pursuant to the Investor Rights Agreement, each Investor was granted the right to designate one representative to the SWS’s Board of Directors for so long as that Investor continues to beneficially own 9.9% of SWS’s outstanding common stock. SWS’s Board of Directors elected Mr. Gerald J. Ford and Mr. J. Taylor Crandall as directors of the Company, effective July 29, 2011. In addition, under the Investor Rights Agreement each Investor was granted the right to appoint an observer to attend all meetings of the Board of Directors of SWS for so long as that Investor continues to beneficially own 4.9% of SWS’s outstanding common stock. Hilltop has designated Mr. Jeremy Ford as its observer, effective July 29, 2011.
21
Table of Contents
Additionally, from September 2011 through November 2011, Hilltop purchased additional shares of SWS common stock in open market and block transactions. Accordingly, as of March 1, 2012, Hilltop beneficially owns 10,171,039 shares of SWS common stock, or 24.6% of the outstanding common stock of SWS.
Employees
As of December 31 2011, we had 135 full-time equivalent employees. Of these 135 employees, five work for HTH, and the remaining 130 work for NLASCO. The NLASCO employees perform underwriting, claims, marketing, and administrative functions for the insurance business. We consider our employee relations to be good.
22
Table of Contents
ITEMFirst Southwest
FSC is a broker-dealer registered with the SEC, FINRA, all 50 U.S. states, the District of Columbia and Puerto Rico. Much of the regulation of broker-dealers, however, has been delegated to self-regulatory organizations, principally FINRA, the Municipal Securities Rulemaking Board and national securities exchanges. These self-regulatory organizations adopt rules (which are subject to approval by the SEC) for governing its members and the industry. Broker-dealers are also subject to the laws and rules of the states in which a broker-dealer conducts business. FSC is a member of, and is primarily subject to regulation, supervision and regular examination by, FINRA.
The regulations to which broker-dealers are subject cover all aspects of the securities business, including sales and trade practices, capital structure, record keeping and the conduct of registered persons, directors, officers and employees. Broker-dealers are also subject to the privacy and anti-money laundering laws and regulations discussed previously. Additional legislation, changes in rules promulgated by the SEC and by self-regulatory organizations or changes in the interpretation or enforcement of existing laws and rules often directly affect the method of operation and profitability of broker-dealers. The SEC, the self-regulatory organizations and states may conduct administrative and enforcement proceedings that can result in censure, fine, suspension or expulsion of a broker-dealer, its registered persons, officers or employees. The principal purpose of regulation and discipline of broker-dealers is the protection of customers and the securities markets rather than protection of creditors and stockholders of broker-dealers.
Limitation on Businesses. The businesses that FSC may conduct are limited by its agreements with, and its oversight by, FINRA and by federal and state law. Participation in new business lines, including trading of new products or participation on new exchanges or in new countries often requires governmental and/or exchange approvals, which may take significant time and resources. In addition, FSC is an operating subsidiary of the Bank, which means its activities are further limited by those that are permissible for the Bank. As a result, FSC may be prevented from entering new businesses that may be profitable in a timely manner, if at all.
Net Capital Requirements. The SEC, FINRA and various other regulatory authorities have stringent rules and regulations with respect to the maintenance of specific levels of net capital by regulated entities. Rule 15c3-1 of the Exchange Act (the “Net Capital Rule”) requires that a broker-dealer maintain minimum net capital. Generally, a broker-dealer’s net capital is net worth plus qualified subordinated debt less deductions for non-allowable (or non-liquid) assets and other adjustments and operational charges. At December 31, 2012, FSC was in compliance with applicable net capital requirements.
The SEC and FINRA impose rules that require notification when net capital falls below certain predefined criteria. These rules also dictate the ratio of debt-to-equity in the regulatory capital composition of a broker-dealer, and constrain the ability of a broker-dealer to expand its business under certain circumstances. If a broker-dealer fails to maintain the required net capital, it may be subject to suspension or revocation of registration by the SEC or applicable regulatory authorities, and suspension or expulsion by these regulators could ultimately lead to the broker-dealer’s liquidation. Additionally, the Net Capital Rule and certain FINRA rules impose requirements that may have the effect of prohibiting a broker-dealer from distributing or withdrawing capital and requiring prior notice to and approval from the SEC and FINRA for certain capital withdrawals.
Securities Investor Protection Corporation. FSC is required by federal law to belong to the SIPC, whose primary function is to provide financial protection for the customers of failing brokerage firms. SIPC provides protection for clients up to $500,000, of which a maximum of $250,000 may be in cash.
Changing Regulatory Environment. The regulatory environment in which FSC operates is subject to frequent change. Its business, financial condition and operating results may be adversely affected as a result of new or revised legislation or regulations imposed by the U.S. Congress, the SEC or other U.S. and state governmental regulatory authorities, or FINRA. FSC’s business, financial condition and operating results also may be adversely affected by changes in the interpretation and enforcement of existing laws and rules by these governmental and regulatory authorities. In the current era of heightened regulation of financial institutions, FSC can expect to incur increasing compliance costs, along with the industry as a whole.
32
Table of Contents
Item 1A. RISK FACTORSRisk Factors.
The following risk factors identify important factors, including material risks and uncertainties, which could cause actual results to differ materially from those reflected in forward-looking statements or in our historical results. Each of the following risk factors, among others, could adversely affect our ability to meet the current expectations of our management.
Risks Related to our Business
We may fail to realize all of the anticipated benefits of our recent Merger with PlainsCapital.
On November 30, 2012, we acquired PlainsCapital pursuant to the Merger. The success of the Merger will depend, in part, on our ability to successfully combine PlainsCapital Corporation’s business with our own. We expect to incur substantial expenses in connection with the integration of the business, operations, networks, systems, technologies, policies and procedures of the two previously independent companies. Achieving the anticipated cost savings and financial benefits of the Merger will depend in part on whether we integrate PlainsCapital Corporation’s businesses in an efficient and effective manner. It is possible that the integration process could result in the loss of key employees, the disruption of ongoing business or inconsistencies in standards, controls, procedures and policies that adversely affect our ability to maintain relationships with clients, customers, depositors and employees. In addition, the integration of certain operations will require the dedication of significant management resources, which may temporarily distract management’s attention from our day-to-day business. Any inability to realize the full extent, or any, of the anticipated cost savings and financial benefits of the Merger, as well as any delays encountered in the integration process, could have an adverse effect on our business and results of operations, which could affect our financial condition and cause a decrease in our earnings per share or decrease or delay the expected accretive effect of the Merger and contribute to a decrease in the price of our common stock.
An adverse change in real estate market values may result in losses in our banking segment and otherwise adversely affect our profitability.
At December 31, 2012, approximately 29% of the loan portfolio of our banking segment was comprised of loans with real estate as the primary component of collateral. The real estate collateral in each case provides an alternate source of repayment in the event of default by the borrower and may deteriorate in value during the time the credit is extended. A decline in real estate values generally and in Texas specifically could impair the value of our collateral and our ability to sell the collateral upon any foreclosure. In the event of a default with respect to any of these loans, the amounts we receive upon sale of the collateral may be insufficient to recover the outstanding principal and interest on the loan. As a result, our profitability and financial condition may be adversely affected by a decrease in real estate market values.
If our allowance for loan losses is insufficient to cover actual loan losses, our banking segment earnings will be adversely affected.
As a lender, we are exposed to the risk that we could sustain losses because our borrowers may not repay their loans in accordance with the terms of their loans. We have historically accounted for this risk by maintaining an allowance for loan losses in an amount intended to cover Bank management’s estimate of losses inherent in the loan portfolio. As a result of the Merger, we were required under GAAP to estimate the fair value of the loan portfolio after the consummation of the Merger and write-down the recorded value of the portfolio to that estimate. For most loans, this process was accomplished by computing the net present value of estimated cash flows to be received from borrowers of these loans. PlainsCapital’s allowance for loan losses that had been maintained prior to the Merger was eliminated in this accounting process. A new allowance for loan losses has been established for loans made subsequent to consummation of the Merger and for any subsequent decrease in the estimate of cash flows to be received from the loans held at the time of the Merger.
The estimate of fair value as of the consummation of the Merger was based on economic conditions at such time and on Bank management’s projections concerning both future economic conditions and the ability of the Bank’s borrowers to continue to repay their loans. If management’s assumptions and projections prove to be incorrect, however, the estimate of fair value may be higher than the actual fair value and we may suffer losses in excess of those estimated. Further, the allowance for loan losses established for new loans or for revised estimates may prove to be inadequate to cover actual losses, especially if economic conditions worsen.
While management will endeavor to estimate the allowance to cover anticipated losses, no underwriting and credit monitoring policies and procedures that we could adopt to address credit risk could provide complete assurance that we will not incur unexpected losses. These losses could have a material adverse effect on our business, financial condition, results of operations and cash flows. In addition, federal regulators periodically evaluate the adequacy of the allowance for loan losses and may require us to increase its provision for loan losses or recognize further loan charge-offs based on judgments different from those of our Bank management.
33
Table of Contents
Our geographic concentration may magnify the adverse effects and consequences of any regional or local economic downturn.
We conduct our banking operations primarily in Texas. Substantially all of the real estate loans in our loan portfolio are secured by properties located in Texas, with more than 82% secured by properties located in the Dallas/Fort Worth and Austin/San Antonio markets at December 31, 2012. Adverse economic conditions in Texas may result in a reduction in the value of the collateral securing these loans. Likewise, substantially all of the real estate loans in our loan portfolio are made to borrowers who live and conduct business in Texas. In addition, mortgage origination fee income is dependent to a significant degree on economic conditions in Texas and California. During 2012, approximately 21% and 17% by dollar volume of our mortgage loans originated were collateralized by properties located in Texas and California, respectively. Texas insureds accounted for approximately 70% and 73% of our insurance segment’s gross premiums written in 2012 and 2011, respectively. Any regional or local economic downturn that affects Texas or, to a lesser extent, California, may affect us and our profitability more significantly and more adversely than our competitors that are less geographically concentrated.
Our geographic concentration may also exacerbate the adverse effects on our insurance segment of inherently unpredictable catastrophic events.
Our insurance segment expects to have large aggregate exposures to inherently unpredictable natural and man-made disasters of great severity, such as hurricanes, hail, tornados, windstorms, wildfires and acts of terrorism. Hurricanes Ike, Katrina and Rita highlighted the challenges inherent in predicting the impact of catastrophic events. The catastrophe models utilized by our insurance segment to assess its probable maximum insurance losses generally failed to adequately project the financial impact of these hurricanes. Although our insurance segment may attempt to exclude certain losses, such as terrorism and other similar risks, from some coverage that our insurance segment writes, it may be prohibited from, or may not be successful in, doing so. The occurrence of losses from catastrophic events may have a material adverse effect on our insurance segment’s ability to write new business and on its financial condition and results of operations. Increases in the values and geographic concentrations of policyholder property and the effects of inflation have resulted in increased severity of industry losses in recent years, and our insurance segment expects that these factors will increase the severity of losses in the future. Factors that may influence our insurance segment’s exposure to losses from these types of events, in addition to the routine adjustment of losses, include, among others:
·exhaustion of reinsurance coverage;
·increases in reinsurance rates;
·unanticipated litigation expenses;
·unrecoverability of ceded losses;
·impact on independent agent operations and future premium income in areas affected by catastrophic events;
·unanticipated expansion of policy coverage or reduction of premium due to regulatory, legislative and/or judicial action following a catastrophic event; and
·unanticipated demand surge related to other recent catastrophic events.
Our insurance segment writes insurance primarily in the states of Texas, Arizona, Tennessee, Oklahoma, Georgia and Louisiana. In 2012, Texas accounted for 69.5%, Arizona accounted for 8.2%, Oklahoma accounted for 9.0%, Tennessee accounted for 6.2%, Georgia accounted for 3.2%, and Louisiana accounted for 1.8% of our premiums. As a result, a single catastrophe, destructive weather pattern, wildfire, terrorist attack, regulatory development or other condition or general economic trend affecting these regions or significant portions of these regions could adversely affect our insurance segment’s financial condition and results of operations more significantly than other insurance companies that conduct business across a broader geographic area. Although our insurance segment purchases catastrophe reinsurance to limit its exposure to these types of catastrophes, in the event of one or more major catastrophes resulting in losses to it in excess of $170.0 million, our insurance segment’s losses would exceed the limits of its reinsurance coverage.
Our business is subject to interest rate risk, and fluctuations in interest rates may adversely affect our earnings, capital levels and overall results.
The majority of our assets are monetary in nature and, as a result, we are subject to significant risk from changes in interest rates. Changes in interest rates may impact our net interest income in our banking segment as well as the valuation of our
34
Table of Contents
assets and liabilities in each of our segments. Earnings in our banking segment are significantly dependent on our net interest income, which is the difference between interest income on interest-earning assets, such as loans and securities, and interest expense on interest-bearing liabilities, such as deposits and borrowings. We expect to periodically experience “gaps” in the interest rate sensitivities of our banking segment’s assets and liabilities, meaning that either our interest-bearing liabilities will be more sensitive to changes in market interest rates than our interest-earning assets, or vice versa. In either event, if market interest rates should move contrary to our position, this “gap” may work against us, and our earnings may be adversely affected.
An increase in the general level of interest rates may also, among other things, adversely affect the demand for loans and our ability to originate loans. In particular, if mortgage interest rates increase, the demand for residential mortgage loans and the refinancing of residential mortgage loans will likely decrease, which will have an adverse effect on our income generated from mortgage origination activities. Conversely, a decrease in the general level of interest rates, among other things, may lead to prepayments on our loan and mortgage-backed securities portfolios and increased competition for deposits. Accordingly, changes in the general level of market interest rates may adversely affect our net yield on interest-earning assets, loan origination volume and our overall results.
Our insurance segment invested over 91% of its invested assets in fixed maturity assets such as bonds and mortgage-backed securities during the year ended December 31, 2012. Because bond trading prices decrease as interest rates rise, a significant increase in interest rates could have a material adverse effect on our insurance segment’s financial condition and results of operations. On the other hand, decreases in interest rates could have an adverse effect on our insurance segment’s investment income and results of operations. For example, if interest rates decline, investment of new premiums received and funds reinvested will earn less. Additionally, mortgage-backed securities typically are prepaid more quickly when interest rates fall and the holder must reinvest the proceeds at lower interest rates. In periods of increasing interest rates, mortgage-backed securities typically are prepaid more slowly, which may require our insurance segment to receive interest payments that are below the then prevailing interest rates for longer time periods than expected.
Market interest rates are affected by many factors outside of our control, including inflation, recession, unemployment, money supply, international disorder and instability in domestic and foreign financial markets. We may not be able to accurately predict the likelihood, nature and magnitude of such changes or how and to what extent such changes may affect our business. We also may not be able to adequately prepare for, or compensate for, the consequences of such changes. Any failure to predict and prepare for changes in interest rates, or adjust for the consequences of these changes, may adversely affect our earnings and capital levels and overall results of operations.
The investment performance of our insurance segment has suffered, and may further suffer, as a result of adverse capital market developments and other factors, which affect its financial results.
Our insurance segment invests the premiums it receives from policyholders until they are needed to pay policyholder claims or other expenses. At December 31, 2012, our insurance segment’s invested assets consisted of $134.1 million in fixed maturity securities and $12.6 million in equity securities. During the year ended December 31, 2012, our insurance segment realized $6.3 million of net investment income, representing 3.9% of our insurance segment’s total revenues. Although our insurance segment’s investment policies stress diversification of risks, conservation of principal and liquidity, its investments are subject to a variety of investment risks, including those relating to general economic conditions, market volatility, interest rate fluctuations, liquidity risk and credit and default risk. In particular, the volatility of our insurance segment’s claims may force it to liquidate securities, which may cause it to incur capital losses. If our insurance segment’s investment portfolio is not appropriately matched with its insurance liabilities, it may be forced to liquidate investments prior to maturity at a significant loss to cover these liabilities. In addition, if we experience market disruption and volatility, such as that experienced in 2009 and 2010, we may experience additional losses on our investments and reductions in our earnings. Investment losses could significantly decrease the asset base and statutory surplus of our insurance segment, thereby adversely affecting its ability to conduct business and potentially its A.M. Best financial strength rating.
Our banking segment is subject to funding risks associated with its high deposit concentration and reliance on brokered deposits.
At December 31, 2012, our fifteen largest depositors, excluding First Southwest, our indirect wholly owned subsidiary, accounted for 19.2% of our total deposits, and our five largest depositors, excluding First Southwest, accounted for 11.2% of our total deposits. Brokered deposits at December 31, 2012 accounted for 10.3% of our total deposits. The loss of one or more of our largest Bank customers, a significant decline in our deposit balances due to ordinary course fluctuations related to these customers’ businesses, or the loss of a significant amount of our brokered deposits could adversely affect our liquidity. Additionally, such circumstances could require us to raise deposit rates in an attempt to attract new deposits, or purchase federal funds or borrow funds on a short-term basis at higher rates, which would adversely affect our results of operations. Under applicable regulations, if the Bank were no longer “well capitalized,” the Bank would not be able to accept brokered deposits without the approval of the FDIC.
35
Table of Contents
We are heavily dependent on dividends from our subsidiaries.
We are a financial holding company engaged in the business of managing, controlling and operating our subsidiaries, including NLASCO and its two insurance company subsidiaries, NLIC and ASIC, as well as the Bank and the Bank’s subsidiaries, PrimeLending and First Southwest. We conduct no material business or other activity other than activities incidental to holding stock in NLASCO and the Bank. As a result, we rely substantially on the profitability of, and dividends from, these subsidiaries to pay our operating expenses, to satisfy our obligations and to pay dividends on our preferred stock. As with most financial institutions, the profitability of the Bank is subject to the fluctuating cost and availability of money, changes in interest rates and in economic conditions in general. PrimeLending and First Southwest contribute to the Bank’s profitability and, in turn, on its ability to pay dividends to us. If the Bank, however, is unable to make cash distributions to us, then we may also be unable to obtain funds from PrimeLending and First Southwest, and we may be unable to satisfy our obligations or make distributions on our preferred stock.
Likewise, our insurance segment also operates as a holding company. Dividends and other permitted payments from its operating subsidiaries are expected to be its primary source of funds to meet ongoing cash requirements, including any future debt service payments and other expenses, and to pay dividends, if any, to us. NLIC and ASIC are subject to significant regulatory restrictions and limitations under debt agreements limiting their ability to declare and pay dividends, including the indenture governing NLASCO’s LIBOR plus 3.40% notes due 2035 and the surplus indentures governing NLIC’s two LIBOR plus 4.10% and 4.05% notes due 2033 and ASIC’s LIBOR plus 4.05% notes due 2034. Together these restrictions could, in turn, limit NLASCO’s ability to pay dividends.
We are subject to extensive supervision and regulation that could restrict our activities and impose financial requirements or limitations on the conduct of our business and limit our ability to generate income.
We are subject to extensive federal and state regulation and supervision, including that of the Federal Reserve Board, the Texas Department of Banking, the Texas Department of Insurance, the FDIC, the CFPB, the SEC and FINRA. Banking regulations are primarily intended to protect depositors’ funds, federal deposit insurance funds and the banking system as a whole, not stockholders. Insurance regulations promulgated by state insurance departments are primarily intended to protect policyholders rather than stockholders. Likewise, regulations promulgated by FINRA are primarily intended to protect customers of broker-dealer businesses rather than stockholders.
These regulations affect our lending practices, capital structure, capital requirements, investment practices, dividend policy and growth, among other things. Failure to comply with laws, regulations or policies could result in damages, civil money penalties or reputational damage, as well as sanctions and supervisory actions by regulatory agencies that could subject us to significant restrictions on our business and our ability to expand through acquisitions or branching. While we have implemented policies and procedures designed to prevent any such violations of laws and regulations, such violations may occur from time to time, which could have a material adverse effect on our financial condition and results of operations.
The U.S. Congress and federal regulatory agencies frequently revise banking and securities laws, regulations and policies. On July 21, 2010, President Obama signed into law the Dodd-Frank Act, which significantly alters the regulation of financial institutions and the financial services industry. The Dodd-Frank Act establishes the CFPB and requires the CFPB and other federal agencies to implement many provisions of the Dodd-Frank Act. We expect that several aspects of the Dodd-Frank Act may affect our business, including, without limitation, increased capital requirements, increased mortgage regulation, restrictions on proprietary trading in securities, restrictions on investments in hedge funds and private equity funds, executive compensation restrictions and disclosure and reporting requirements. At this time, it is difficult to predict the extent to which the Dodd-Frank Act or the resulting rules and regulations will affect our business. Compliance with these new laws and regulations likely will result in additional costs, which could be significant and may adversely impact our results of operations, financial condition, and liquidity.
During the fourth quarter of 2011, the Bank received a “satisfactory” CRA rating in connection with its most-recent CRA Performance Evaluation. A CRA rating of less than “satisfactory” adversely affects a bank’s ability to establish new branches and impairs a bank’s ability to commence new activities that are “financial in nature” or acquire companies engaged in these activities. Other regulatory exam ratings or findings also may otherwise impact our ability to branch, commence new activities or make acquisitions.
36
Table of Contents
We cannot predict whether or in what form any other proposed regulations or statutes will be adopted or the extent to which our business may be affected by any new regulation or statute. Such changes could subject our business to additional costs, limit the types of financial services and products we may offer and increase the ability of non-banks to offer competing financial services and products, among other things.
We may be unable to increase or maintain our level of qualified small business lending from our banking segment, which could subject us to higher dividend rates on our outstanding preferred stock.
We sold $114.1 million of our Series B Preferred Stock to the Secretary of the United States Treasury Department (“Treasury”) pursuant to the SBLF. The SBLF encourages participant banks to increase their lending to small businesses by offering banks reduced dividend rates on the senior preferred shares they issued to the Secretary of the Treasury if they meet certain thresholds of increased small business lending. We could become subject to higher dividend rates and penalties in the future depending upon our future level of qualified lending to small businesses relative to our defined “baseline” level. Until December 31, 2013, the dividend rate we pay on any outstanding shares of Series B Preferred Stock will fluctuate on a quarterly basis between one percent (1%) and five percent (5%) per annum, based upon changes in the level of qualified small business lending by the Bank measured against the Baseline. From January 1, 2014 through March 26, 2016, if we have not sufficiently increased our small business lending we may become subject to a dividend rate as high as seven percent (7%) per annum, and may be required to pay a dividend rate penalty of 0.5% per quarter. Beginning March 27, 2016, the dividend rate on any outstanding shares of Series B Preferred Stock will be fixed at nine percent (9%) per annum. The future demands for additional lending are unclear and uncertain, and our ability to make qualifying small business loans depends on a number of factors, many of which may be outside of our control. These factors include, among other things, general economic conditions, demand for loans, the effectiveness of our marketing efforts, the ability of borrowers to meet our lending standards, competition from other lenders, the lending policies of our competitors and regulatory restrictions. If we fail to maintain or increase our level of qualified small business lending from our Baseline, the resulting increase in the dividend rate on the Series B Preferred Stock could increase our cost of capital and adversely affect our results of operations and financial condition.
Our mortgage origination segment is subject to investment risk on loans that it originates.
We intend to sell, and not hold for investment, substantially all residential mortgage loans that we originate through PrimeLending. At times, however, we may originate a loan or execute an interest rate lock commitment (“IRLC”) with a customer pursuant to which we agree to originate a mortgage loan on a future date at an agreed-upon interest rate without having identified a purchaser for such loan or the loan underlying such IRLC. An identified purchaser may also decline to purchase a loan for a variety of reasons. In these instances, we will bear interest rate risk on an IRLC until, and unless, we are able to find a buyer for the loan underlying such IRLC and the risk of investment on a loan until, and unless, we are able to find a buyer for such loan. In addition, if a customer defaults on a mortgage payment shortly after the loan is originated, the purchaser of the loan may have a put right, whereby the purchaser can require us to repurchase the loan at the full amount that it paid. During periods of market downturn, we have at times chosen to hold mortgage loans when the identified purchasers have declined to purchase such loans because we could not obtain an acceptable substitute bid price for such loan. The failure of mortgage loans that we hold on our books to perform adequately could have a material adverse effect on our financial condition, liquidity and results of operations.
Our financial advisory business is subject to various risks associated with the securities industry, particularly those impacting the public finance industry.
Our financial advisory business is subject to uncertainties that are common in the securities industry. These uncertainties include:
·intense competition in the public finance and other sectors of the securities industry;
·the volatility of domestic and international financial, bond and stock markets;
·extensive governmental regulation;
·litigation; and
·substantial fluctuations in the volume and price level of securities.
As a result, the revenues and operating results of our financial advisory segment may vary significantly from quarter to quarter and from year to year. Unfavorable financial or economic conditions could reduce the number and size of transactions in which we provide financial advisory, underwriting and other services. Disruptions in fixed income and equity markets could lead to a decline in the volume of transactions executed for customers and therefore, to declines in revenues from commissions and clearing services. First Southwest is much smaller and has much less capital than many competitors in the securities industry. In addition, First Southwest is an operating subsidiary of the Bank, which means that its activities are limited to those that are permissible for the Bank.
37
Table of Contents
We ultimately may write-off goodwill and other intangible assets resulting from our acquisitions of NLASCO and PlainsCapital.
As a result of purchase accounting for our acquisitions of NLASCO and PlainsCapital, our consolidated balance sheet at December 31, 2012, contained goodwill and other intangible assets aggregating $331.5 million. On an ongoing basis, we evaluate whether facts and circumstances indicate any impairment of value of intangible assets. As circumstances change, the value of these intangible assets may not be realized by us. If we determine that a material impairment has occurred, we will be required to write-off the impaired portion of intangible assets, which could have a material adverse effect on our results of operations in the period in which the write-off occurs.
The accuracy of our financial statements and related disclosures could be affected if we are exposed to actual conditions different from the judgments, assumptions or estimates used in our critical accounting policies.
The preparation of financial statements and related disclosure in conformity with GAAP requires us to make judgments, assumptions and estimates that affect the amounts reported in our consolidated financial statements and accompanying notes. Our critical accounting policies, which are included in this Annual Report, describe those significant accounting policies and methods used in the preparation of our consolidated financial statements that are considered “critical” by us because they require judgments, assumptions and estimates that materially impact our consolidated financial statements and related disclosures. As a result, if future events differ significantly from the judgments, assumptions and estimates in our critical accounting policies, such events or assumptions could have a material impact on our audited consolidated financial statements and related disclosures.
We are dependent on our management team, and the loss of our senior executive officers or other key employees could impair our relationship with customers and adversely affect our business and financial results.
Our success is dependent, to a large degree, upon the continued service and skills of our existing management team and other key employees with long-term customer relationships. Our business and growth strategies are built primarily upon our ability to retain employees with experience and business relationships within their respective segments. The loss of one or more of these key personnel could have an adverse impact on our business because of their skills, knowledge of the market, years of industry experience and the difficulty of finding qualified replacement personnel. In addition, we currently do not have non-competition agreements with certain members of management and other key employees. If any of these personnel were to leave and compete with us, our business, financial condition, results of operations and growth could suffer.
A decline in the market for advisory services could adversely affect our business and results of operations.
Our financial advisory segment has historically earned a significant portion of its revenues from advisory fees paid to it by its clients, in large part upon the successful completion of the client’s transaction. Financial advisory revenues from the public finance group of First Southwest represented the largest component of our financial advisory segment’s net revenues for the year ended December 31, 2012. Unlike other investment banks, First Southwest earns most of its revenues from its advisory fees and, to a lesser extent, from other business activities such as commissions and underwriting. New issuances in the municipal market by cities, counties, school districts, state and other governmental agencies, airports, healthcare institutions, institutions of higher education and other clients that First Southwest’s public finance group serves can be subject to significant fluctuations based on by factors such as changes in interest rates, property tax bases, budget pressures on certain issuers caused by uncertain economic times and other factors. We expect that the reliance of our financial advisory segment on advisory fees will continue for the foreseeable future, and a decline in public finance advisory engagements or the market for advisory services generally would have an adverse effect on our business and results of operations.
Negative publicity regarding us, or financial institutions in general, could damage our reputation and adversely impact our business and results of operations.
Our ability to attract and retain customers and conduct our business could be adversely affected to the extent our reputation is damaged. Reputational risk, or the risk to our business, earnings and capital from negative public opinion regarding our company, or financial institutions in general, is inherent in our business. Adverse perceptions concerning our reputation could lead to difficulties in generating and maintaining accounts as well as in financing them. In particular, negative perceptions concerning our reputation could lead to decreases in the level of deposits that consumer and commercial
38
Table of Contents
customers and potential customers choose to maintain with us. Negative public opinion could result from actual or alleged conduct in any number of activities or circumstances, including lending or foreclosure practices; sales practices; corporate governance and potential conflicts of interest; ethical failures or fraud, including alleged deceptive or unfair lending or pricing practices; regulatory compliance; protection of customer information; cyber-attacks, whether actual, threatened, or perceived; negative news about us or the financial institutions industry generally; general company performance; or from actions taken by government regulators and community organizations in response to such activities or circumstances. Furthermore, our failure to address, or the perception that we have failed to address, these issues appropriately could impact our ability to keep and attract customers and/or employees and could expose us to litigation and/or regulatory action, which could have an adverse effect on our business and results of operations.
Our operational systems and networks have been, and will continue to be, subject to an increasing risk of continually evolving cybersecurity or other technological risks, which could result in a loss of customer business, financial liability, regulatory penalties, damage to our reputation or the disclosure of confidential information.
We rely heavily on communications and information systems to conduct our business and maintain the security of confidential information and complex transactions, which subjects us to an increasing risk of cyber incidents from these activities due to a combination of new technologies and the increasing use of the Internet to conduct financial transactions, as well as a potential failure of interruption or breach in the security of these systems, including those that could result from attacks or planned changes, upgrades and maintenance of these systems. Such cyber incidents could result in failures or disruptions in our customer relationship management, securities trading, general ledger, deposits, computer systems, electronic underwriting servicing or loan origination systems. Third parties with which we do business may also be sources of cybersecurity or other technological risks.
Although we devote significant resources to maintain and regularly upgrade our systems and networks with measures such as intrusion and detection prevention systems and monitoring firewalls to safeguard critical business applications, there is no guarantee that these measures or any other measures can provide absolute security. Our computer systems, software and networks may be adversely affected by cyber incidents such as unauthorized access; loss or destruction of data (including confidential client information); account takeovers; unavailability of service; computer viruses or other malicious code; cyber attacks; and other events. These threats may derive from human error, fraud or malice on the part of employees or third parties, or may result from accidental technological failure. Additional challenges are posed by external extremist parties, including foreign state actors, in some circumstances, as a means to promote political ends. If one or more of these events occurs, it could result in the disclosure of confidential client information, damage to our reputation with our clients and the market, customer dissatisfaction, additional costs such as repairing systems or adding new personnel or protection technologies, regulatory penalties, exposure to litigation and other financial losses to both us and our clients and customers. Such events could also cause interruptions or malfunctions in our operations.
We have been the subject of denial of services attacks from external sources that have limited or interrupted the availability of our online banking services. Although to date we are not aware of any material losses relating to cyber attacks or other information security breaches, we may suffer such losses in the future. We have taken steps to improve and upgrade the security of our systems in response to such threats, such incidents could occur again, but they could occur more frequently or on a more significant scale.
We face strong competition from other financial institutions and financial service and insurance companies, which may adversely affect our operations and financial condition.
Our banking and mortgage origination businesses face vigorous competition from banks and other financial institutions, including savings and loan associations, savings banks, finance companies and credit unions. A number of these banks and other financial institutions have substantially greater resources and lending limits, larger branch systems and a wider array of banking services than we do. We also compete with other providers of financial services, such as money market mutual funds, brokerage firms, consumer finance companies, insurance companies and governmental organizations, each of which may offer more favorable financing than we are able to provide. In addition, some of our non-bank competitors are not subject to the same extensive regulations that govern us. The banking business in Texas, particularly in the Austin, Dallas/Fort Worth, Lubbock and San Antonio metropolitan and surrounding areas, has become increasingly competitive over the past several years, and we expect the level of competition we face to further increase. Our profitability depends on our ability to compete effectively in these markets. This competition may reduce or limit our margins on banking services, reduce our market share and adversely affect our results of operations and financial condition.
39
Table of Contents
The insurance industry also is highly competitive and has, historically, been characterized by periods of significant price competition, alternating with periods of greater pricing discipline during which competitors focus on other factors. In the current market environment, competition in our insurance business’ industry is based primarily on products offered, service, experience, the strength of agent and policyholder relationships, reputation, speed and accuracy of claims payment, perceived financial strength, ratings, scope of business, commissions paid and policy and contract terms and conditions. Our insurance business competes with many other insurers, including large national companies who have greater financial, marketing and management resources than our insurance segment. Many of these competitors also have better ratings and market recognition than our insurance business. Our insurance segment seeks to distinguish itself from its competitors by providing a broad product line and targeting those market segments that provide the best opportunity to earn an underwriting profit.
In addition, a number of new, proposed or potential industry developments also could increase competition in our insurance business’ industry. These developments include changes in practices and other effects caused by the Internet (including direct marketing campaigns by our insurance segment’s competitors in established and new geographic markets), which have led to greater competition in the insurance business and increased expectations for customer service. These developments could prevent our insurance business from expanding its book of business. Our insurance business also faces competition from new entrants into the insurance market. New entrants do not have historic claims or losses to address and, therefore, may be able to price policies on a basis that is not favorable to our insurance business. New competition could reduce the demand for our insurance segment’s insurance products, which could have a material adverse effect on its financial condition and results of operations.
The financial advisory and investment banking industries also are intensely competitive industries and will likely remain competitive. Our financial advisory business competes directly with numerous other financial advisory and investment banking firms, broker-dealers and banks, including large national and major regional firms and smaller niche companies, some of whom are not broker-dealers and, therefore, not subject to the broker-dealer regulatory framework. In addition to competition from firms currently in the industry, there has been increasing competition from others offering financial services, including automated trading and other services based on technological innovations. Our financial advisory business competes on the basis of a number of factors, including the quality of advice and service, innovation, reputation and price. Many of our financial advisory segment’s competitors in the investment banking industry have a greater range of products and services, greater financial and marketing resources, larger customer bases, greater name recognition, more managing directors to serve their clients’ needs, greater global reach and more established relationships with their customers than our financial advisory business. Additionally, certain competitors of our financial advisory business have reorganized or plan to reorganize from investment banks into bank holding companies which may provide them with a competitive advantage. These larger and better capitalized competitors may be more capable of responding to changes in the investment banking market, to compete for skilled professionals, to finance acquisitions, to fund internal growth and to compete for market share generally. Increased pressure created by any current or future competitors, or by competitors of our financial advisory business collectively, could materially and adversely affect our business and results of operations. Increased competition may result in reduced revenue and loss of market share. Further, as a strategic response to changes in the competitive environment, our financial advisory business may from time to time make certain pricing, service or marketing decisions that also could materially and adversely affect our business and results of operations.
Our mortgage origination and insurance businesses are subject to seasonal fluctuations and, as a result, our results of operations for any given quarter may not be indicative of the results that may be achieved for the full fiscal year.
Our mortgage origination business is subject to several variables that can impact loan origination volume, including seasonal and interest rate fluctuations. We typically experience increased loan origination volume from purchases of homes during the second and third quarters, when more people tend to move and buy or sell homes. In addition, an increase in the general level of interest rates may, among other things, adversely affect the demand for mortgage loans and our ability to originate mortgage loans. In particular, if mortgage interest rates increase, the demand for residential mortgage loans and the refinancing of residential mortgage loans will likely decrease, which will have an adverse effect on our mortgage origination activities. Conversely, a decrease in the general level of interest rates, among other things, may lead to increased competition for mortgage loan origination business. As a result of these variables, our results of operations for any single quarter are not necessarily indicative of the results that may be achieved for a full fiscal year.
Generally, our insurance segment’s insured risks exhibit higher losses in the second and third quarters due to a seasonal concentration of weather-related events in its primary geographic markets. Although weather-related losses (including hail, high winds, tornadoes and hurricanes) can occur in any calendar quarter, the second calendar quarter, historically, has experienced the highest frequency of losses associated with these events. Hurricanes, however, are more likely to occur in the third calendar quarter of the year.
40
Table of Contents
If the actual losses and loss adjustment expenses of our insurance segment exceed its loss and expense estimates, its financial condition and results of operations could be materially adversely affected.
The financial condition and results of operations of our insurance segment depend upon its ability to assess accurately the potential losses associated with the risks that it insures. Our insurance segment establishes reserve liabilities to cover the payment of all losses and loss adjustment expenses incurred under the policies that it writes. These liability estimates include case estimates, which are established for specific claims that have been reported to our insurance segment, and liabilities for claims that have been incurred but not reported (“IBNR”). Loss adjustment expenses represent expenses incurred to investigate and settle claims. To the extent that losses and loss adjustment expenses exceed estimates, NLIC and ASIC will be required to increase their reserve liabilities and reduce their income in the period in which the deficiency is identified. In addition, increasing reserves causes a reduction in policyholders’ surplus and could cause a downgrade in the ratings of NLIC and ASIC. This, in turn, could diminish our ability to sell insurance policies.
The liability estimation process for our insurance segment’s casualty insurance coverage possesses characteristics that make case and IBNR reserving inherently less susceptible to accurate actuarial estimation than is the case with property coverages. Unlike property losses, casualty losses are claims made by third-parties of which the policyholder may not be aware and, therefore, may be reported a significant time after the occurrence, including sometimes years later. As casualty claims most often involve claims of bodily injury, assessment of the proper case estimates is a far more subjective process than claims involving property damage. In addition, in determining the case estimate for a casualty claim, information develops slowly over the life of the claim and can subject the case estimation to substantial modification well after the claim was first reported. Numerous factors impact the casualty case reserving process, such as venue, the amount of monetary damage, legislative activity, the permanence of the injury and the age of the claimant.
The effects of inflation could cause the severity of claims from catastrophes or other events to rise in the future. Increases in the values and geographic concentrations of policyholder property and the effects of inflation have resulted in increased severity of industry losses in recent years, and our insurance segment expects that these factors will increase the severity of losses in the future. As NLASCO observed in 2008, the severity of some catastrophic weather events, including the scope and extent of damage and the inability to gain access to damaged properties, and the ensuing shortages of labor and materials and resulting demand surge, provide additional challenges to estimating ultimate losses. Our insurance segment’s liabilities for losses and loss adjustment expenses include assumptions about future payments for settlement of claims and claims handling expenses, such as medical treatments and litigation costs. To the extent inflation causes these costs to increase above liabilities established for these costs, our insurance segment expects to be required to increase its liabilities, together with a corresponding reduction in its net income in the period in which the deficiency is identified.
Estimating an appropriate level of liabilities for losses and loss adjustment expense is an inherently uncertain process. Accordingly, actual loss and loss adjustment expenses paid will likely deviate, perhaps substantially, from the liability estimates reflected in our insurance segment’s consolidated financial statements. Claims could exceed our insurance segment’s estimate for liabilities for losses and loss adjustment expenses, which could have a material adverse effect on its financial condition and results of operations.
If our insurance segment cannot obtain adequate reinsurance protection for the risks it underwrites or its reinsurers do not pay losses in a timely fashion, or at all, our insurance segment will suffer greater losses from these risks or may reduce the amount of business it underwrites, which may materially adversely affect its financial condition and results of operations.
Our insurance segment purchases reinsurance to protect itself from certain risks and to share certain risks it underwrites. During 2012 and 2011, our insurance segment’s personal lines ceded 12.1% and 12.0%, respectively, of its direct insurance premiums written (primarily through excess of loss, quota share and catastrophe reinsurance treaties) and its commercial lines ceded 4.9% and 4.9%, respectively, of its direct insurance premiums written (primarily through excess of loss and catastrophe reinsurance treaties). The total cost of reinsurance, inclusive of per risk excess and catastrophe, increased 9.0% in the year ended December 31, 2012, which is partially attributable to higher reinstatement premiums in 2012 of $0.4 million. Reinsurance cost generally increases as a result of hurricanes or any diminished capacity in the reinsurance market.
From time to time, market conditions have limited, and in some cases have prevented, insurers from obtaining the types and amounts of reinsurance that they have considered adequate for their business needs. Accordingly, our insurance segment may not be able to obtain desired amounts of reinsurance. Even if our insurance segment is able to obtain adequate reinsurance, it may not be able to obtain it from entities with satisfactory creditworthiness or negotiate terms that it deems appropriate or acceptable. Although the cost of reinsurance is, in some cases, reflected in our insurance segment’s premium
41
Table of Contents
rates, our insurance segment may have guaranteed certain premium rates to its policyholders. Under these circumstances, if the cost of reinsurance were to increase with respect to policies for which our insurance segment guaranteed the rates, our insurance segment would be adversely affected. In addition, if our insurance segment cannot obtain adequate reinsurance protection for the risks it underwrites, it may be exposed to greater losses from these risks or it may be forced to reduce the amount of business that it underwrites for such risks, which will reduce our insurance segment’s revenue and may have a material adverse effect on its results of operations and financial condition.
At December 31, 2012, our insurance segment had $18.6 million in reinsurance recoverables, including ceded paid loss recoverables, ceded losses and loss adjustment expense recoverables and ceded unearned insurance premiums. Our insurance segment expects to continue to purchase substantial reinsurance coverage in the foreseeable future. Because our insurance segment remains primarily liable to its policyholders for the payment of their claims, regardless of the reinsurance it has purchased relating to those claims, in the event that one of its reinsurers becomes insolvent or otherwise refuses to reimburse our insurance segment for losses paid, or delays in reimbursing our insurance segment for losses paid, its liability for these claims could materially and adversely affect its financial condition and results of operations.
We are subject to legal claims and litigation that could have a material adverse effect on our business.
We face significant legal risks in each of the business segments in which we operate, and the volume of legal claims and amount of damages and penalties claimed in litigation and regulatory proceedings against financial service companies remains high. These risks often are difficult to assess or quantify, and their existence and magnitude often remain unknown for substantial periods of time. Substantial legal liability or significant regulatory action against us or any of our subsidiaries could have a material adverse effect on our results of operations or cause significant reputational harm to us, which could seriously harm our business and prospects. Further, regulatory inquiries and subpoenas, other requests for information, or testimony in connection with litigation may require incurrence of significant expenses, including fees for legal representation and fees associated with document production. These costs may be incurred even if we are not a target of the inquiry or a party to the litigation. Any financial liability or reputational damage could have a material adverse effect on our business, which, in turn, could have a material adverse effect on our financial condition and results of operations.
We may be subject to environmental liabilities in connection with the foreclosure on real estate assets securing the loan portfolio of our banking segment.
Hazardous or toxic substances or other environmental hazards may be located on the real estate that secures our loans. If we acquire such properties as a result of foreclosure, or otherwise, we could become subject to various environmental liabilities. For example, we could be held liable for the cost of cleaning up or otherwise addressing contamination at or from these properties. We could also be held liable to a governmental entity or third party for property damage, personal injury or other claims relating to any environmental contamination at or from these properties. In addition, we could be held liable for costs relating to environmental contamination at or from our current or former properties. We may not detect all environmental hazards associated with these properties. If we ever became subject to significant environmental liabilities, our business, financial condition, liquidity and results of operations could be harmed.
If we fail to maintain an effective system of internal controls over financial reporting, the accuracy and timing of our financial reporting may be adversely affected.
Effective internal controls are necessary for us to provide timely and reliable financial reports and effectively prevent fraud. Any inability to provide reliable financial reports or prevent fraud could harm our business. If we fail to maintain the adequacy of our internal controls, our financial statements may not accurately reflect our financial condition. Inadequate internal controls over financial reporting could impact the reliability and timeliness of our financial reports and could cause investors to lose confidence in our reported financial information, which could have a negative effect on our business and the value of our securities.
The debt agreements of our insurance segment and its controlled affiliates contain financial covenants and impose restrictions on its business.
The indenture governing NLASCO’s LIBOR plus 3.40% notes due 2035 contains restrictions on its ability to, among other things, declare and pay dividends and merge or consolidate. In addition, this indenture contains a change of control provision, which provides that (i) if a person or group becomes the beneficial owner, directly or indirectly, of 50% or more of NLASCO’s equity securities and (ii) if NLASCO’s ratings are downgraded by a nationally recognized statistical rating organization (as defined in the Exchange Act), then each holder of the notes governed by such indenture has the right to require that NLASCO purchase such holder’s notes, in whole or in part, at a price equal to 100% of the then outstanding principal amount.
42
Table of Contents
Likewise, the surplus indentures governing NLIC’s two LIBOR plus 4.10% and 4.05% notes due 2033 and ASIC’s LIBOR plus 4.05% notes due 2034 contain restrictions on dividends and mergers and consolidations. In addition, NLASCO has other credit arrangements with its affiliates and other third-parties.
NLASCO’s ability to comply with these covenants may be affected by events beyond its control, including prevailing economic, financial and industry conditions. The breach of any of these restrictions could result in a default under the loan agreements or indentures governing the notes or under its other debt agreements. An event of default under its debt agreements would permit some of its lenders to declare all amounts borrowed from them to be due and payable, together with accrued and unpaid interest. If NLASCO were unable to repay debt to its secured lenders, these lenders could proceed against the collateral securing that debt. In addition, acceleration of its other indebtedness may cause NLASCO to be unable to make interest payments on the notes. Other agreements that NLASCO or its insurance company subsidiaries may enter into in the future may contain covenants imposing significant restrictions on their respective businesses that are similar to, or in addition to, the covenants under their respective existing agreements. These restrictions may affect NLASCO’s ability to operate its business and may limit its ability to take advantage of potential business opportunities as they arise.
Risks Related to our Substantial Cash Position and Related Strategies for its Use
WeBecause we intend to use a substantial portion of our remaining available cash to make acquisitions or effect a business combination, we may become subject to risks inherent in pursuing and completing any such acquisitions or business combination.
We are endeavoring to make opportunistic acquisitions or effect a business combinationcombinations with a substantial portion of our remaining available cash. No assurances,We may not, however, can be given that we will be able to identify suitable targets, consummate acquisitions or effect a combination on commercially acceptable terms or, if consummated, successfully integrate personnel and operations. Even if we identify suitable targets, we may not be able to make acquisitions or effect a combination on commercially acceptable terms, if at all.
The success of any acquisition or business combination will depend upon, among other things, the ability of management and our employees to integrate personnel, operations, products and technologies effectively, to retain and motivate key personnel and to retain customers and clients of targets. In addition, any acquisition or business combination we undertake may involve certain other risks, including consumption ofconsume available cash resources, result in potentially dilutive issuances of equity securities and the diversion ofdivert management’s attention from other business concerns. WeEven if we conduct extensive due diligence on a target business that we acquire or with which we merge, our diligence may not surface all material issues that may adversely affect a particular target business, and we may be forced to later write-down or write-off assets, restructure our operations or incur impairment or other charges that could result in our reporting losses. Consequently, we also may need to make further investments to support the acquired or combined company and may have difficulty identifying and acquiring the appropriate resources. There can be no assurance that any acquisition or combination we undertake will perform as expected.
We may enter, on our own and through acquisitions or a business combination, into new lines of business or initiate new service offerings whether related or unrelatedsubject to our insurance business. Our success in any such endeavor will dependthe restrictions imposed upon among other things, the ability of management to identify suitable opportunities, successfully implement sound business strategies and avoid the legal and business risks of any new line of business or service offering and/or an acquisition related thereto. There can be no assurance that we will be able to do any of the foregoing. In addition, any such undertakings may result in additional costs without an immediate increase in revenues and may divert management’s attention from the operation and growth of our current lines of business.
Since we have not definitively selectedus as a particular target business to acquire or combine with, you will be unable to ascertain the merits or risks of the industry or business in which we may ultimately primarily operate.
We may consummate an acquisition of, or effect a business combination with, a company in any industry and are not limited to any particular type of business.regulated financial holding company. Accordingly, there is no basis for you to evaluate the possible merits or risks of the particular industry intarget business with which we may ultimately conduct our primary ongoing operationscombine or the target business that we may ultimately acquire. To the extent that we complete an acquisition of, or effect a business combination with, a financially unstable company or an entity in its development stage, we may be affected by numerous risks inherent in the business operations of those entities. If we complete an acquisition of, or effect a business combination with, an entity in an industry characterized by a high level of risk, we may be affected by the unascertainable risks of that industry. Although our management will endeavor to evaluate the risks inherent in a particular industry or target business, we cannot assure you that we will properly ascertain or assess all of the significant risk factors. Even if we properly assess those risks, some of them may be outside of our control or ability to affect.
We may change our primary lines of business without stockholder approval, which may result in riskier lines of business than our current lines of business.
Depending on the structure of an acquisition or business combination, it may result in us conducting our primary operations in lines of business that are different from, and possibly more risky than, our current business without stockholder approval.
Resources could be expended in researching acquisitions that are not consummated, which could materially adversely affect subsequent attempts to locate and acquire or merge with another business.
It is anticipated that the investigation of each specific target business and the negotiation, drafting and execution of relevant agreements, disclosure documents and other instruments will require substantial management time and attention and substantial costs for accountants, attorneys and others. If a decision is made not to complete a specific acquisition or business combination, the costs incurred up to that point for the proposed transaction likely would not be recoverable. Furthermore, even if an agreement is reached relating to a specific target business, we may fail to consummate our acquisition or combination for any number of reasons, including those beyond our control, such as if the target’s stockholders do not approve the transaction. Any such event will result in a loss to us of the related costs incurred, which could materially adversely affect subsequent attempts to locate and acquire or merge with another business.
23
Table of Contents
Existing circumstances may result in several of our directors having interests that may conflict with our interests.
A director who has a conflict of interest with respect to an issue presented to our board will have no inherent legal obligation to abstain from voting upon that issue. We do not have provisions in our bylaws or charter that require an interested director to abstain from voting upon an issue, and we do not expect to add provisions in our charter and bylaws to this effect. Although each director has a duty to act in good faith and in a manner he or she reasonably believes to be in our best interests, there is a risk that, should interested directors vote upon an issue in which they or one of their affiliates has an interest, their vote may reflect a bias that could be contrary to our best interests. In addition, even if an interested director abstains from voting, the director’s participation in the meeting and discussion of an issue in which they have, or companies with which they are associated have, an interest could influence the votes of other directors regarding the issue.
Difficult market conditions have adversely affected the yield on our available cash.
Our primary objective is to preserve and maintain the liquidity of our available cash, while at the same time maximizing yields without significantly increasing risk. The capital and credit markets have been experiencing volatility and disruption for a prolonged period. This volatility and disruption reached unprecedented levels, resulting in dramatic declines in interest
43
Table of Contents
rates and other yields relative to risk. This downward pressure has negatively affected the yields we receive on our available cash. If current levels of market disruption and volatility continue or worsen, there can be no assurance that we will receive any significant yield on our available cash. Further, given current market conditions, no assurance can be given that we will be able to preserve our available cash.
Competition from other motivated purchasers may hinder our abilityIf regulators determine that we control SWS Group, Inc., we will be required to consummate an acquisition infile appropriate reports with the near term.Federal Reserve Board and potentially provide financial support.
We expectAs a general matter, an investor is deemed to encounter intense competitioncontrol a depository institution or other company if the investor owns or controls 25% or more of any class of voting stock. Subject to rebuttal, an investor may be presumed to control a depository institution or other company if the investor owns or controls ten percent or more of any class of voting stock. At December 31, 2012, we beneficially owned 24.6% of the outstanding common stock of SWS Group, Inc. (“SWS”). In connection with the transactions entered into with SWS, we filed a Rebuttal of Control, which the Office of Thrift Supervision, now a part of the Office of the Comptroller of the Currency, accepted based upon the facts represented by us. The transaction documents also provide for mechanisms to prevent us from entities havingbeing deemed to “control” SWS through our ownership of voting securities. Notwithstanding this finding by the Office of Thrift Supervision, in the event that we were determined to “control” SWS, we would be required to file appropriate reports as a business objective similarfinancial holding company regulated by the Federal Reserve Board reflecting our controlling interest in SWS. In connection with our transaction with PlainsCapital, we provided certain passivity commitments to ours, including venture capital funds, special purpose acquisitionthe Federal Reserve Board related to SWS. These passivity commitments provide that we cannot take certain actions, namely exercising any controlling influence over management or policies, without the prior approval of the Federal Reserve Bank.
In addition, it is a policy of the Federal Reserve Board that a bank holding company should serve as a source of financial and managerial strength to the depository institutions that it controls. The Dodd-Frank Act requires by statute that all holding companies private equity funds, leveraged buyout funds, opportunity fundsserve as a source of financial strength for any subsidiary of the holding company. The Federal Reserve Board and the other banking agencies have not published a proposed rule implementing these “source of strength” requirements. Given that the Federal Reserve Board became the primary federal regulator of savings and loan holding companies (“SLHCs”), such as SWS, the policy for SLHCs on this subject likely will be altered to align more closely with those for bank holding companies. The regulators may require certain financial and other operating businesses competing for acquisitions. Manyaction by a regulated holding company in support of these entities are well established and have extensive experience in identifying and effecting acquisitions or business combinations directly or through affiliates. Many of these competitors possess greater technical, human and other resources than we do and our financial resources may be relatively limited when contrasted with those of many of these competitors. While we believe that there are numerous potential target businesses that we could acquire with our available cash, our ability to compete in acquiring certain sizable target businesses may be limited by our available financial resources. This inherent competitive limitation gives others an advantage in pursuing the acquisition of certain target businesses. For these reasons, we cannot assure you that we will be able to effectuate an acquisition or business combinationcontrolled depository institutions even if such action is not in the near term.best interests of the regulated holding company or its stockholders.
Following the consummation of an acquisition or business combination, we may be requiredRisks Related to take write-downs or write-offs or restructuring, impairment or other charges that could have a significant negative effect on our financial condition, results of operations and our stock price.Our Common Stock
Even if we conduct extensive due diligence on a target business that we acquire or with which we merge, we cannot assure you that this diligence will surface all material issues that may be present inside a particular target business, that it would be possible to uncover all material issues through a customary amount of due diligence, or that factors outside of the target business and outside of our control will not later arise. As a result of these factors, we may be forced to later write-down or write-off assets, restructure our operations or incur impairment or other charges that could result in us reporting losses. Even if our due diligence successfully identifies certain risks, unexpected risks may arise and previously known risks may materialize in a manner inconsistent with our preliminary risk analysis. Even though these charges may be non-cash items and not have an immediate impact on our liquidity, the fact that we report charges of this nature could contribute to negative market perceptions about us or our securities.
24
Table of Contents
We may issue shares of preferred stock or additional shares of common stock to complete an acquisition or effect a combination or under an employee incentive plan after consummation of an acquisition or combination, which would dilute the interests of our stockholders and likely present other risks.
The issuance of shares of preferred stock or additional shares of common stock:
· may significantly dilute the equity interest of our stockholders;
· may subordinate the rights of holders of common stock if preferred stock is issued with rights senior to those afforded our common stock;
· could cause a change in control if a substantial number of shares of common stock are issued, which may affect, among other things, our ability to use our net operating loss carry forwards; and
· may adversely affect prevailing market prices for our common stock.
We may be unableOur authorized capital stock includes ten million shares of preferred stock, and we currently have 114,068 shares of Series B Preferred Stock issued and outstanding, liquidation preference $1,000 per share, to obtain additional financing to complete an acquisition or business combination or to fund the operations and growth of a target business, which could compel us to restructure or abandon a particular acquisition or business combination.
Although we believe that our available cash will be sufficient to allow us to consummate an acquisition or effect a business combination, we cannot ascertain the exact capital requirements for any particular transaction because we have not yet definitively selected a target business. If our available cash is insufficient, either becauseSecretary of the sizeTreasury pursuant to the SBLF. Our board of directors, in its sole discretion, may designate and issue one or more additional series of preferred stock from the authorized and unissued shares of preferred stock. Subject to limitations imposed by law or our articles of incorporation, our board of directors is empowered to determine the designation and number of shares constituting each series of preferred stock, as well as any designations, qualifications, privileges, limitations, restrictions or special or relative rights of additional series. The rights of preferred stockholders may supersede the rights of common stockholders. Preferred stock could be issued with voting and conversion rights that could adversely affect the voting power of the acquisition or business combination orshares of our common stock. The issuance of preferred stock could also result in a series of securities outstanding that would have preferences over the depletion of available funds in search of a target business, we may be required to seek additional financing. We cannot assure you that such financing will be available on acceptable terms, if at all. To the extent that additional financing proves to be unavailable, if and when needed, to consummate an acquisition or effect a business combination, we would be compelled to either restructure the transaction or abandon that particular acquisition or business combination and seek an alternative target business candidate. Even if we do not need additional financing to consummate an acquisition or effect a business combination, we may require such financing to fund the operations or growth of the target business. The failure to secure additional financing could have a material adverse effect on the continued development or growth of the target.
There may be tax consequencescommon stock with respect to an acquisition or business combination that adversely affect us.
While we expect to undertake any merger or acquisition so as to minimize taxes, both to the acquired business and/or assetdividends and us, such acquisition or business combination might not meet the statutory requirements of a tax-free reorganization, or the parties might not obtain the intended tax-free treatment upon a transfer of shares or assets. A non-qualifying reorganization could result in the imposition of substantial taxes.
Our net operating loss and other carryovers may be limited if we undergo an ownership change. Generally, an ownership change occurs if certain persons or groups increase their aggregate ownership in us by more than 50 percentage points looking back over the prior three-year period. If an ownership change occurs, our ability to use our net operating losses, or NOLs, to reduce income taxes is limited to an annual amount, or a Section 382 limitation, equal to the fair market value of our common stock immediately prior to the ownership change multiplied by the long term tax-exempt interest rate, which is published monthly by the Internal Revenue Service, or IRS. In the event of an ownership change, NOLs that exceed the Section 382 limitation in any year will continue to be allowed as carryforwards for the remainder of the carryforward period and such excess NOLs can be used to offset taxable income for years within the carryforward period subject to the Section 382 limitation in each year. Whether or not an ownership change occurs, the carryforward period for NOLs is either 15 or 20 years from the year in which the losses giving rise to the NOLs were incurred. If the carryforward period for any NOL were to expire before that NOL had been fully utilized, the unused portion of that NOL would be lost.
Based on our knowledge of stockholder ownership of Hilltop, we do not believe that an ownership change has occurred since our initial public offering, or IPO, that would limit our post-IPO NOLs. Accordingly, we believe that there is not a Section 382 limitation imposed on our use of post-IPO NOLs to reduce future taxable income.liquidation.
2544
Table of Contents
The determination of whether an ownership change has occurred, or will occur, is complicated, and therefore, no assurance can be provided as to whether an ownership change has occurred or will occur. We have not obtained, and currently do not plan to obtain, an IRS ruling or opinion of counsel regarding our conclusions as to whether the pre-IPO NOLs or post-IPO NOLs are subject to any such limitations. In addition, limitations imposed by Section 382 may prevent us from issuing additional shares of common stock to raise capital or to acquire businesses or properties. To the extent not prohibited by our charter, we may decide in the future that it is necessary or in our best interest to take certain actions that could result in an ownership change.
If Hilltop is determined to control SWS Group, Inc., Hilltop will be required to become a regulated holding company.
As a general matter, an investor is deemed to control a depository institution or other company if the investor owns or controls 25% or more of any class of voting stock. Subject to rebuttal, an investor may be presumed to control a depository institution or other company if the investor owns or controls ten percent or more of any class of voting stock. As of March 1, 2012, Hilltop beneficially owned 24.6% of the outstanding common stock of SWS Group, Inc. In connection with the transactions entered into with SWS Group, Inc., Hilltop filed a Rebuttal of Control, which the Office of Thrift Supervision accepted based upon the facts represented by Hilltop. The transaction documents also provide for mechanisms to prevent Hilltop from being deemed to “control” SWS Group, Inc. through voting control. Notwithstanding, in the event that Hilltop was determined to “control” SWS Group, Inc., Hilltop would have to register as a savings and loan holding company and become subject to the laws and regulations thereof, including, without limitation, supervision, examination, permissible activities, capital requirements and dividend restrictions.
In addition, it is a policy of the Board of Governors of the Federal Reserve System, or Federal Reserve, that a bank holding company should serve as a source of financial and managerial strength to the depository institutions that it controls. This was not a policy of the Office of Thrift Supervision, the primary regulator of thrifts and savings and loan holding companies, or SLHCs, prior to July 2011, with respect to the obligations of a SLHC to a depository institution that it controls. Given that the Federal Reserve became the primary federal regulator of SLHCs, the policy for SLHCs on this subject likely will be altered to align more closely with those for bank holding companies. The regulators may require certain financial and other action by a regulated holding company in support of controlled depository institutions even if such action is not in the best interests of the regulated holding company or its shareholders.
If we are deemed to be an investment company, we may be required to institute burdensome compliance requirements and our activities may be restricted, which may make it difficult for us to complete strategic acquisitions or effect combinations.
We do not plan to operate as an investment fund or investment company, or to be engaged in the business of investing, reinvesting or trading in securities. Our primary plan is to acquire, hold, operate and grow for the long-term, one or more operating businesses.
If we were deemed to be an investment company under the Investment Company Act of 1940, or the 1940 Act, we would be required to become registered under the 1940 Act (or liquidate) and our activities would be subject to a number of restrictions, including, among others:
·corporate governance requirements and requirements regarding mergers and share exchanges;
·restrictions on the nature of our investments;
·restrictions on our capital structure and use of multiple classes of securities; and
·restrictions on our use of leverage and collateral, each of which may make it difficult for us to consummate strategic acquisitions or effect a combination.
In addition, we may have imposed upon us burdensome requirements, including:
·registration as an investment company;
·adoption of a specific form of corporate structure; and
·reporting, record keeping, voting, proxy and disclosure requirements and other rules and regulations,
·compliance with which would reduce the funds that we have available to consummate strategic acquisitions or a combination.
26
Table of Contents
In order not to be regulated as an investment company under the 1940 Act, unless we can qualify for an exclusion, we must ensure that we are engaged primarily in an initial business other than investing, reinvesting or trading of securities and that our activities do not include investing, reinvesting, owning, holding or trading “investment securities.” Our primary business, in addition to our insurance operations, will be to identify and consummate an acquisition or effect a business combination and, thereafter, to operate the acquired business or businesses for the long term. We do not believe that our anticipated principal activities will subject us to the 1940 Act. If we were deemed to be subject to the 1940 Act, compliance with these additional regulatory burdens would require additional expense for which we have not accounted.
If we fail to maintain an effective system of internal controls over financial reporting, the accuracy and timing of our financial reporting may be adversely affected.
Effective internal controls are necessary for us to provide timely and reliable financial reports and effectively prevent fraud. Any inability to provide reliable financial reports or prevent fraud could harm our business. If we fail to maintain the adequacy of our internal controls, our financial statements may not accurately reflect our financial condition. Inadequate internal controls over financial reporting could impact the reliability and timeliness of our financial reports and could cause investors to lose confidence in our reported financial information, which could have a negative effect on our business and the value of our securities.
Risks Related to NLASCO’s Business and NLASCO’s Industry
The occurrence of severe catastrophic events may have a material adverse effect on NLASCO, particularly because NLASCO conducts business in a concentrated geographic area.
NLASCO expects to have large aggregate exposures to natural and man-made disasters, such as hurricanes, hail, tornados, windstorms, wildfires and acts of terrorism. NLASCO expects that its loss experience, generally, will include infrequent events of great severity. Hurricanes Dolly, Gustav and Ike, which occurred in 2008, are examples. The risks associated with natural and man-made disasters are inherently unpredictable, and it is difficult to predict the timing of these events with statistical certainty or estimate the amount of loss any given occurrence will generate. Although NLASCO may attempt to exclude certain losses, such as terrorism and other similar risks, from some coverage that NLASCO writes, it may be prohibited from, or may not be successful in, doing so. The extent of losses from a catastrophe is a function of both the total amount of policyholder exposure in the geographic area affected by the event and the severity of the event. The occurrence of losses from catastrophic events may have a material adverse effect on NLASCO’s ability to write new business and on its financial condition and results of operations. Increases in the values and geographic concentrations of policyholder property and the effects of inflation have resulted in increased severity of industry losses in recent years, and NLASCO expects that these factors will increase the severity of losses in the future. Factors that may influence NLASCO’s exposure to losses from these types of events, in addition to the routine adjustment of losses, include, among others:
·exhaustion of reinsurance coverage;
·increases in reinsurance rates;
·unanticipated litigation expenses;
·unrecoverability of ceded losses;
·impact on independent agent operations and future premium income in areas affected by catastrophic events;
·unanticipated expansion of policy coverage or reduction of premium due to regulatory, legislative and/or judicial action following a catastrophic event; and
·unanticipated demand surge related to other recent catastrophic events.
NLASCO’s insurance subsidiaries write insurance primarily in the States of Texas, Arizona, Tennessee, Oklahoma, Georgia and Louisiana. In 2011, Texas accounted for 72.0%, Arizona accounted for 8.0%, Oklahoma accounted for 7.0%, Tennessee accounted for 6.1%, Georgia accounted for 2.8%, Louisiana accounted for 1.9% and the other states we do business in accounted for the other 2.2% of our premiums. As a result, a single catastrophe, destructive weather pattern, wildfire, terrorist attack, regulatory development or other condition or general economic trend affecting these regions or significant portions of these regions could adversely affect NLASCO’s financial condition and results of operations more significantly than other insurance companies that conduct business across a broader geographic area. Although NLASCO purchases catastrophe reinsurance to limit its exposure to these types of catastrophes, in the event of one or more major catastrophes resulting in losses to it in excess of $170.0 million, NLASCO’s losses would exceed the limits of its reinsurance coverage.
27
Table of Contents
NLASCO is exposed to claims related to severe weather and the occurrence of severe weather may result in an increase in claims frequency and exposure amount that could materially adversely affect its financial condition.
NLASCO is subject to claims arising out of severe weather, such as hurricanes, tornados, rainstorms, snowstorms, hailstorms, windstorms and ice storms, which may have a significant effect on its financial condition and results of operations. The majority of its business is written in Texas, Arizona, Tennessee and Oklahoma, and Texas experienced two major hurricanes in 2008. The incidence and severity of weather conditions are inherently unpredictable. Some forecasters predict that the world is currently in a cycle of increased frequency of, and more severe, hurricanes and destructive weather patterns.
Generally, NLASCO’s insured risks exhibit higher losses in the second and third calendar quarters due to a seasonal concentration of weather-related events in its primary geographic markets. Although weather-related losses (including hail, high winds, tornadoes and hurricanes) can occur in any calendar quarter, the second calendar quarter, historically, has experienced the highest frequency of losses associated with these events. For the last five years, the contribution of weather-related catastrophes to the second quarter loss ratio was on average approximately 25 percentage points greater than the average contribution of such catastrophes in the other three quarters. Hurricanes, however, are more likely to occur in the third calendar quarter of the year.
NLASCO experienced redundancy of $7.0 million (including loss adjustment expenses) in gross catastrophic related losses for the year ended December 31, 2011. During 2011, NLASCO’s net catastrophic loss experience was $0.1 million after reinsurance and decreases in net premiums earned due to reinsurance reinstatement premiums. NLASCO incurred $33.4 million (including loss adjustment expenses) in gross catastrophic related losses for the year ended December 31, 2010. During 2010, NLASCO’s net catastrophic loss experience was $3.5 million after reinsurance and decreases in net premiums earned due to reinsurance reinstatement premiums. A substantial portion of the expense in 2010 relates to claims being paid or reserved on hail and windstorms occurring in Oklahoma and Arizona, respectively.
Due to the inherent inability to accurately predict the severity and frequency of catastrophic losses, higher than expected catastrophic losses could materially adversely affect NLASCO’s financial condition.
NLASCO utilizes catastrophe modeling to assess its probable maximum insurance losses from hurricane and other wind/hail perils and to structure its catastrophe reinsurance program to minimize its exposure to high severity/high frequency types of losses. Hurricanes Ike, Katrina and Rita highlighted the challenges inherent in predicting the impact of catastrophic events. The catastrophe models, generally, failed to adequately project the financial impact of Hurricanes Ike, Katrina and Rita. This experience highlights the limitations inherent in the use of modeling as a means of risk assessment/abatement. If the exposure amount and frequency of catastrophe losses are higher than predicted under NLASCO’s modeling, NLASCO’s financial condition may be materially adversely affected.
NLASCO’s investment performance has suffered, and may further suffer, as a result of adverse capital market developments and other factors, which affect its financial results.
NLASCO invests the premiums it receives from policyholders until they are needed to pay policyholder claims or other expenses. At December 31, 2011, NLASCO’s invested assets consisted of $152.1 million in fixed maturity securities and $8.9 million in equity securities. During the year ended December 31, 2011, NLASCO had $6.3 million of net investment income, representing 4.3% of NLASCO’s total revenues. Although NLASCO’s investment policies stress diversification of risks, conservation of principal and liquidity, its investments are subject to a variety of investment risks, including those relating to general economic conditions, market volatility, interest rate fluctuations, liquidity risk and credit and default risk. In particular, the volatility of NLASCO’s claims may force it to liquidate securities, which may cause it to incur capital losses. If NLASCO’s investment portfolio is not appropriately matched with its insurance liabilities, it may be forced to liquidate investments prior to maturity at a significant loss to cover these liabilities. Investment losses could significantly decrease its asset base and statutory surplus, thereby adversely affecting its ability to conduct business and potentially its A.M. Best financial strength rating. Further, developments in the world’s financial and capital markets have adversely impacted the performance of NLASCO’s investments. Additionally, inflation could increase beyond investment income.
The capital and credit markets have been experiencing volatility and disruption for more than three years. This volatility and disruption has reached unprecedented levels, resulting in dramatic declines in prices. This downward pressure has negatively affected the performance of NLASCO’s investments, which has resulted in the write down of several of those investments in 2010 and 2009. These write-downs, when determined to be other-than-temporary, reduce NLASCO’s earnings for that period. If current levels of market disruption and volatility continue or worsen, there can be no assurances that we will not experience additional losses on our investments and reductions in our earnings.
28
Table of Contents
NLASCO’s investment results may be adversely affected by interest rate changes.
NLASCO’s operating results are affected, in part, by the performance of its investment portfolio. NLASCO’s investment portfolio contains instruments, such as bonds, that may be adversely affected by increases in interest rates. Because bond trading prices decrease as interest rates rise, a significant increase in interest rates could have a material adverse effect on NLASCO’s financial condition and results of operations. On the other hand, decreases in interest rates could have an adverse effect on NLASCO’s investment income and results of operations. For example, if interest rates decline, investment of new premiums received and funds reinvested will earn less. Interest rates are highly sensitive to many factors, including governmental monetary policies, domestic and international economic and political conditions and other factors beyond NLASCO’s control.
With respect to fixed-income investments, the fair market value of these securities fluctuates depending on market and other general economic conditions and the interest rate environment. Changes in interest rates can expose NLASCO to prepayment risks on these investments. When interest rates fall, mortgage-backed securities typically are prepaid more quickly and the holder must reinvest the proceeds at lower interest rates. NLASCO’s mortgage-backed securities currently consist of securities with features that reduce the risk of prepayment, but NLASCO can make no assurances that it will invest in other mortgage-backed securities that contain this protection. In periods of increasing interest rates, mortgage-backed securities typically are prepaid more slowly, which may require NLASCO to receive interest payments that are below the then prevailing interest rates for longer time periods than expected.
If NLASCO cannot price its business accurately, its profitability and the profitability of its insurance companies could be materially adversely affected.
NLASCO’s results of operations and financial condition depend on its ability to underwrite and set premium rates accurately for a wide variety of risks. Adequate rates are necessary to generate premiums sufficient to pay losses, loss adjustment expenses and underwriting expenses and to earn a profit. To price its products accurately, NLASCO must:
·collect and properly analyze a substantial amount of data;
·develop, test and apply appropriate pricing techniques;
·closely monitor and recognize changes in trends in a timely manner; and
·project both severity and frequency of losses with reasonable accuracy.
NLASCO’s ability to undertake these efforts successfully, and price its products accurately, is subject to a number of risks and uncertainties, some of which are outside its control, including:
·the availability of sufficient reliable data and NLASCO’s ability to properly analyze available data;
·changes in applicable legal liability standards and in the civil litigation system generally;
·NLASCO’s selection and application of appropriate pricing techniques;
·NLASCO’s ability to obtain regulatory approval, where necessary;
·the uncertainties that inherently characterize estimates and assumptions; and
·NLASCO’s ability to obtain adequate premium rates to offset higher reinsurance costs.
Consequently, NLASCO could under-price risks, which would adversely affect its profit margins, or it could overprice risks, which could reduce its competitiveness and sales volume. In either case, its profitability and the profitability of its insurance companies could be materially adversely affected.
If NLASCO’s actual losses and loss adjustment expenses exceed its loss and expense estimates, its financial condition and results of operations could be materially adversely affected.
NLASCO’s financial condition and results of operations depend upon its ability to assess accurately the potential losses associated with the risks that it insures. NLASCO establishes reserve liabilities to cover the payment of all losses and loss adjustment expenses incurred under the policies that it writes. These liability estimates include case estimates, which are established for specific claims that have been reported to NLASCO, and liabilities for claims that have been incurred but not reported, or IBNR. Loss adjustment expenses represent expenses incurred to investigate and settle claims. To the extent that losses and loss adjustment expenses exceed estimates, NLIC and ASIC will be required to increase their reserve liabilities and reduce their income before income taxes in the period in which the deficiency is identified. In addition, increasing reserves causes a reduction in policyholders’ surplus and could cause a downgrade in the ratings of NLIC and ASIC. This, in turn, could diminish its ability to sell insurance policies.
29
Table of Contents
The liability estimation process for NLASCO’s casualty insurance coverage possesses characteristics that make case and IBNR reserving inherently less susceptible to accurate actuarial estimation than is the case with property coverages. Unlike property losses, casualty losses are claims made by third-parties of which the policyholder may not be aware and, therefore, may be reported a significant time after the occurrence, including sometimes years later. As casualty claims most often involve claims of bodily injury, assessment of the proper case estimates is a far more subjective process than claims involving property damage. In addition, in determining the case estimate for a casualty claim, information develops slowly over the life of the claim and can subject the case estimation to substantial modification well after the claim was first reported. Numerous factors impact the casualty case reserving process, such as venue, the amount of monetary damage, legislative activity, the permanence of the injury and the age of the claimant.
The effects of inflation could cause the severity of claims from catastrophes or other events to rise in the future. Increases in the values and geographic concentrations of policyholder property and the effects of inflation have resulted in increased severity of industry losses in recent years, and NLASCO expects that these factors will increase the severity of losses in the future. As NLASCO observed in 2008, the severity of some catastrophic weather events, including the scope and extent of damage and the inability to gain access to damaged properties, and the ensuing shortages of labor and materials and resulting demand surge, provide additional challenges to estimating ultimate losses. NLASCO’s liabilities for losses and loss adjustment expenses include assumptions about future payments for settlement of claims and claims handling expenses, such as medical treatments and litigation costs. To the extent inflation causes these costs to increase above liabilities established for these costs, NLASCO expects to be required to increase its liabilities, together with a corresponding reduction in its net income in the period in which the deficiency is identified.
Estimating an appropriate level of liabilities for losses and loss adjustment expense is an inherently uncertain process. Accordingly, actual loss and loss adjustment expenses paid will likely deviate, perhaps substantially, from the liability estimates reflected in NLASCO’s consolidated financial statements. Claims could exceed NLASCO’s estimate for liabilities for losses and loss adjustment expenses, which could have a material adverse effect on its financial condition and results of operations.
If NLASCO cannot obtain adequate reinsurance protection for the risks it underwrites, NLASCO may be exposed to greater losses from these risks or may reduce the amount of business it underwrites, which may materially adversely affect its financial condition and results of operations.
NLASCO uses reinsurance to protect itself from certain risks and to share certain risks it underwrites. During 2011 and 2010, NLASCO’s personal lines ceded 12.0% and 16.3%, respectively, of its direct premiums written (primarily through excess of loss, quota share and catastrophe reinsurance treaties) and its commercial lines ceded 4.9% and 7.3%, respectively, of its direct premiums written (primarily through excess of loss and catastrophe reinsurance treaties). The total cost of reinsurance, inclusive of per risk excess and catastrophe, decreased 26.6% in the year ended December 31, 2011, which is primarily attributable to lower reinstatement premiums in 2011 of $2.4 million. Reinsurance cost will likely materially increase, in part due to the frequency and severity of hurricanes and the lack of capacity in the reinsurance market.
From time to time, market conditions have limited, and in some cases have prevented, insurers from obtaining the types and amounts of reinsurance that they have considered adequate for their business needs. Accordingly, NLASCO may not be able to obtain desired amounts of reinsurance. Even if NLASCO is able to obtain adequate reinsurance, it may not be able to obtain it from entities with satisfactory creditworthiness or negotiate terms that it deems appropriate or acceptable. Although the cost of reinsurance is, in some cases, reflected in NLASCO’s premium rates, NLASCO may have guaranteed certain premium rates to its policyholders. Under these circumstances, if the cost of reinsurance were to increase with respect to policies for which NLASCO guaranteed the rates, NLASCO would be adversely affected. In addition, if NLASCO cannot obtain adequate reinsurance protection for the risks it underwrites, it may be exposed to greater losses from these risks or it may be forced to reduce the amount of business that it underwrites for such risks, which will reduce NLASCO’s revenue and may have a material adverse effect on its results of operations and financial condition.
NLASCO could face unanticipated losses from war, terrorism and political unrest, and these or other unanticipated losses could have a material adverse effect on NLASCO’s financial condition and results of operations.
NLASCO has exposure to unexpected losses resulting from future man-made catastrophic events, such as acts of terrorism and political instability. These risks are inherently unpredictable. It is difficult to predict the timing of such events with statistical certainty or to estimate the amount of loss that any given occurrence will generate. In certain instances, NLASCO specifically insures risks resulting from acts of terrorism. Even in cases where NLASCO attempts to exclude losses from terrorism and certain other similar risks from some coverage it writes, NLASCO may be prohibited from, or may not be successful in, doing so. Irrespective of the clarity and inclusiveness of policy language, a court or arbitration panel may limit the enforceability of policy language or otherwise issue a ruling adverse to NLASCO. Accordingly, while NLASCO believes that its reinsurance programs, together with the coverage provided under the Terrorism Risk Insurance Act of 2002, the
30
Table of Contents
Terrorism Risk Insurance Extension Act of 2005 and the Terrorism Risk Insurance Program Reauthorization Act of 2007, or, collectively, the Terrorism Act, are sufficient to reasonably limit its net losses relating to potential future terrorist attacks, its reserves may not be adequate to cover losses when they materialize. Under the Terrorism Act, after an act of terrorism is certified by the Secretary of the Treasury, NLASCO may be entitled to be reimbursed by the Federal government for a percentage of subject losses, after an insurer deductible and subject to an annual cap. The Terrorism Act covers an insurance company’s operations for up to 85% of its losses, subject to certain mandatory deductibles. The deductible is calculated by applying the deductible percentage to the insurer’s direct earned premiums for covered lines from the calendar year immediately prior to the applicable year. Although the Terrorism Act provides benefits in the event of certain acts of terrorism for losses in 2005 through 2014, the Terrorism Act may not be extended beyond 2014 or its benefits may be reduced. It is not possible to completely eliminate NLASCO’s exposure to unforecasted or unpredictable events, and to the extent that losses from such risks occur, NLASCO’s financial condition and results of operations could be materially adversely affected.
If NLASCO’s reinsurers do not pay losses in a timely fashion, or at all, NLASCO may incur substantial losses that could materially adversely affect its financial condition and results of operations.
At December 31, 2011, NLASCO had $25.9 million in reinsurance recoverables, including ceded paid loss recoverables, ceded losses and loss adjustment expense recoverables and ceded unearned premiums. NLASCO expects to continue to purchase substantial reinsurance coverage in the foreseeable future. Since NLASCO remains primarily liable to its policyholders for the payment of their claims, regardless of the reinsurance it has purchased relating to those claims, in the event that one of its reinsurers becomes insolvent or otherwise refuses to reimburse NLASCO for losses paid, or delays in reimbursing NLASCO for losses paid, its liability for these claims could materially and adversely affect its financial condition and results of operations. As an example, if one of NLASCO’s catastrophe reinsurers experienced financial difficulties following one of the major hurricanes in 2005 and had been unable to meet its obligations to NLASCO, NLASCO could have experienced difficulty in meeting its obligations to its policyholders.
NLASCO relies on independent insurance agents to distribute its products, and if the agents do not promote NLASCO’s products successfully, NLASCO’s results of operations and financial condition could be adversely affected.
NLASCO’s business depends, in large part, on the efforts of independent insurance agents to market its insurance products and on its ability to offer insurance products and services that meet the requirements of their customers. While NLASCO strives to offer products that its agents require, NLASCO competes for business with other carriers based on the scope of coverage provided in its products, services, commissions and rates. NLASCO’s competitors may offer coverage that is more attractive to particular customers than it offers for a specific product, may price their insurance products more aggressively, may offer higher agent commissions and may devote additional resources to improve their services. Accordingly, NLASCO’s agents may find it easier to promote the programs of NLASCO’s competitors rather than NLASCO’s. If NLASCO’s agents fail to, or choose not to, market NLASCO’s insurance products successfully, NLASCO’s growth may be limited and its financial condition and results of operations may be adversely affected. Additionally, rather than utilizing an independent agent to buy their insurance, consumers may elect to deal with direct-writers or mass marketers that utilize the Internet to advertise and/or underwrite their business. Industry developments that centralize and commoditize insurance products could be detrimental to NLASCO’s agency distribution model of doing business.
Because NLASCO relies on managing general agents to underwrite some of its products and to administer claims, such managing general agents could expose NLASCO to liability or allocate business away from NLASCO, which could cause NLASCO’s financial condition and results of operations to be adversely affected.
NLASCO has developed programs with managing general agents, or MGAs, whereby the MGA will, within the guidelines established by NLASCO, underwrite insurance policies on NLASCO’s insurance subsidiaries’ behalf with oversight by NLASCO. A MGA is a person, firm or corporation that has supervisory responsibility for the local agency and field operations of an insurer in the state where it is organized or that is authorized by an insurer to accept or process, on the insurer’s behalf, insurance policies produced and sold by other agents. While NLASCO exercises care in the selection of its MGA relationships and regularly audits the performance of its MGAs, NLASCO is at risk for their conduct as a result of the authority it has delegated to them. If one of NLASCO’s MGAs binds NLASCO’s insurance subsidiaries to policies that expose it to unexpected losses or fails to appropriately report claims, NLASCO’s financial condition and results of operations could be adversely affected. For example, if a terminated MGA fails to continue to appropriately report claims during the runoff period, then liabilities for losses and loss adjustment expenses could be deficient, which would impact NLASCO’s results of operations in future periods. Furthermore, subject to contractual limitations, MGAs have the ability to change carriers or increase or decrease the allocation to a particular carrier. A MGA might choose to change carriers or allocations for many reasons, such as pricing, service, conditions in the reinsurance market or a change in ownership of an MGA.
31
Table of Contents
A decline in NLIC’s or ASIC’s financial strength ratings by A.M. Best could cause either of their sales or earnings, or both, to decrease.
Ratings have become an increasingly important factor in establishing the competitive position of insurance companies. A.M. Best maintains a letter scale rating system ranging from “A++ (Superior)” to “F (In Liquidation)” to rate the financial strength of insurance enterprises. NLIC and ASIC have been rated “A (Excellent)” by A.M. Best, which is the third highest of sixteen rating levels.
Each of NLIC’s and ASIC’s financial strength rating is subject to periodic review by, and may remain the same, be revised downward or upward or be revoked at the sole discretion of, A.M. Best. A decline in either NLIC’s or ASIC’s rating or an announced negative outlook on the rating can cause concern about their viability among agents, brokers and policyholders, resulting in a movement of business away from NLASCO and its insurance company subsidiaries to more highly-rated carriers. In addition, the errors and omissions insurance coverage of many of NLASCO’s independent agents does not provide coverage if the covered agents sell policies from insurers with an A.M. Best financial strength rating of “B+ (Very Good)” or below. As a result, the loss of NLIC’s or ASIC’s A.M. Best financial strength rating, or a reduction to “B+ (Very Good)” or worse, may adversely impact NLASCO’s ability to retain or expand its policyholder base. Periodically, A.M. Best changes its rating methodology and practices. Any change to the methodologies and practices could result in a reduction of NLIC’s or ASIC’s A.M. Best rating.
The failure of any of the loss limitation methods NLASCO employs could have a material adverse effect on its financial condition and results of operations.
At the present time, NLASCO employs a variety of endorsements to its policies that limit its exposure to known risks, such as exclusions for mold losses and water damage. NLASCO’s policies also are not designed to provide coverage for claims related to exposure to potentially harmful products or substances, including, among others, lead paint and silica. NLASCO’s homeowners’ policies, other than policies specifically written for flood coverage, specifically exclude coverage for losses caused by flood, but generally provide coverage for damage caused by wind. In addition, NLASCO’s policies contain conditions requiring the prompt reporting of claims and its right to decline coverage due to late claim reporting. NLASCO’s policies also include limitations restricting the period during which a policyholder may bring a breach of contract or other claim against it, which in many cases is shorter than the applicable statutory limitations for such claims. It is possible that a court or regulatory authority could nullify or void, or legislation could be enacted modifying or barring, the use of endorsements and limitations in a way that would adversely affect NLASCO’s loss experience, which could have a material adverse effect on its financial condition and results of operations.
The effects of emerging claim and coverage issues on NLASCO’s business are uncertain.
As industry practices and legal, judicial, social and other environmental conditions change, unexpected and unintended issues related to claims and coverage may emerge. These issues may adversely affect NLASCO’s business by either extending coverage beyond its underwriting intent or by increasing the number or size of claims. In some instances, these changes may not become apparent until long after NLASCO has issued insurance policies that are affected by the changes. As a result, the full extent of liability under NLASCO’s insurance policies may not be known until after a contract is issued. Changes in other legal theories of liability under NLASCO’s insurance policies or the failure of any loss limitation it applies also could adversely impact NLASCO’s financial condition and results of operations.
Because NLASCO’s main source of premiums written is in Texas, unfavorable changes in the economic or regulatory environment in that state may have a material adverse effect on its financial condition and results of operations.
Texas accounted for approximately 72.0% and 73.2% of NLASCO’s direct premiums written in 2011 and 2010, respectively. The Texas legislature, frequently reviews insurance regulation, which will likely result in changes to those regulations. The loss of a significant amount of NLASCO’s premiums written in Texas, whether due to an economic downturn, competitive changes, regulatory or legislative developments or other reasons, could have a material adverse effect on its financial condition and results of operations.
32
Table of Contents
If NLASCO is unsuccessful in competing against other competitors in the insurance industry, its financial condition and results of operations could be adversely affected.
The insurance industry is highly competitive and has, historically, been characterized by periods of significant price competition, alternating with periods of greater pricing discipline during which competitors focus on other factors. In the current market environment, competition in NLASCO’s industry is based primarily on the following:
·products offered;
·service;
·experience;
·the strength of agent and policyholder relationships;
·reputation;
·speed and accuracy of claims payment;
·perceived financial strength;
·ratings;
·scope of business;
·commissions paid; and
·policy and contract terms and conditions.
NLASCO competes with many other insurers, including large national companies who have greater financial, marketing and management resources than NLASCO. Many of these competitors also have better ratings and market recognition than NLASCO. NLASCO seeks to distinguish itself from its competitors by providing a broad product line and targeting those market segments that provide the best opportunity to earn an underwriting profit.
NLASCO also faces competition from entities that self-insure, primarily in the commercial insurance market. From time to time, established and potential customers may examine the benefits and risks of self-insurance and other alternatives to traditional insurance.
In addition, a number of new, proposed or potential industry developments also could increase competition in NLASCO’s industry. These developments include, but are not necessarily limited to, changes in practices and other effects caused by the Internet (including direct marketing campaigns by NLASCO’s competitors in established and new geographic markets), which have led to greater competition in the insurance business and increased expectations for customer service. These developments could prevent NLASCO from expanding its book of business.
NLASCO also faces competition from new entrants into the insurance market. New entrants do not have historic claims or losses to address and, therefore, may be able to price policies on a basis that is not favorable to NLASCO. New competition could reduce the demand for NLASCO’s insurance products, which could have a material adverse effect on its financial condition and results of operations.
The debt agreements of NLASCO and its controlled affiliates contain financial covenants and impose restrictions on its business.
The indenture governing NLASCO’s LIBOR plus 3.40% notes due 2035 contains restrictions on its ability to, among other things, declare and pay dividends and merge or consolidate. In addition, this indenture contains a change of control provision, which provides that (i) if a person or group becomes the beneficial owner, directly or indirectly, of 50% or more of NLASCO’s equity securities and (ii) if NLASCO’s ratings are downgraded by a nationally recognized statistical rating organization (as defined in the Securities Exchange Act of 1934), then each holder of the notes governed by such indenture has the right to require that NLASCO purchase such holder’s notes, in whole or in part, at a price equal to 100% of the then outstanding principal amount.
The surplus indentures governing NLIC’s LIBOR plus 4.10% notes due 2033 and ASIC’s LIBOR plus 4.05% notes due 2034 contain restrictions on dividends and mergers and consolidations. In addition, NLASCO has other credit arrangements with its affiliates and other third-parties.
33
Table of Contents
NLASCO’s ability to comply with these covenants may be affected by events beyond its control, including prevailing economic, financial and industry conditions. The breach of any of these restrictions could result in a default under the loan agreements or indentures governing the notes or under its other debt agreements. An event of default under its debt agreements would permit some of its lenders to declare all amounts borrowed from them to be due and payable, together with accrued and unpaid interest. If NLASCO were unable to repay debt to its secured lenders, these lenders could proceed against the collateral securing that debt. In addition, acceleration of its other indebtedness may cause NLASCO to be unable to make interest payments on the notes.
Other agreements that NLASCO or its insurance company subsidiaries may enter into in the future may contain covenants imposing significant restrictions on their respective businesses that are similar to, or in addition to, the covenants under their respective existing agreements. These restrictions may affect NLASCO’s ability to operate its business and may limit its ability to take advantage of potential business opportunities as they arise.
The regulatory system under which NLIC and ASIC operate, and potential changes to that system, could have a material adverse effect on their respective business activities.
NLIC and ASIC are subject to comprehensive regulation and supervision in those states in which they are domiciled and write insurance policies. Though NLIC and ASIC currently write most of their policies in Texas, Arizona, Tennessee, Oklahoma, Georgia and Louisiana, as of December 31, 2011, NLIC is licensed in 24 states and ASIC is licensed in 37 states. Laws and regulations pertaining to NLIC and ASIC are generally administered by state insurance departments and relate to, among other things:
·standards of solvency, including risk-based capital measurements;
·restrictions on the nature, quality and concentration of investments;
·required methods of accounting;
·rate and policy form regulation and other market conduct; and
·potential assessments for the provision of funds necessary for covered claims under certain policies provided by impaired, insolvent or failed insurance companies.
These state insurance departments also conduct periodic examinations of insurance companies and require the filing of annual and other reports relating to financial condition, holding company issues and other matters. Current or future regulatory requirements may adversely affect or inhibit each of the insurance company’s ability to achieve some or all of its business objectives.
NLIC and ASIC may not be able to obtain or maintain necessary licenses, permits, authorizations or accreditations in states where they are currently licensed or in new states they intend to enter, or they may be able to do so only at a significant cost. In addition, they may not be able to comply fully with, or obtain appropriate exemptions from, the wide variety of laws and regulations applicable to insurance companies and insurance holding companies, which could result in restrictions on their operating flexibility and could subject them to fines and other sanctions that may have a material adverse effect on their business.
Significant changes in the political and regulatory climate could result in changes in applicable laws and regulations and could make it more expensive or less profitable to manage our business. In recent years, the United States insurance regulatory framework has come under increased federal scrutiny, and some state legislators have considered, or enacted, laws that may alter or increase state regulation of insurance and reinsurance companies and holding companies. Moreover, the National Association of Insurance Commissioners, or NAIC, and state insurance regulators regularly reexamine existing laws and regulations and develop new laws. Changes in laws and regulations, or their interpretation, could have a material adverse effect on the insurance companies’ financial condition and results of operations.
The activities of the insurance companies’ MGAs are subject to licensing requirements and regulation under the laws of the states in which they operate. The insurance companies’ MGAs’ businesses depend on the validity of, and continued good standing under, the licenses and approvals pursuant to which they operate, as well as compliance with pertinent laws and regulations.
34
Table of Contents
Licensing laws and regulations vary from jurisdiction to jurisdiction. In all jurisdictions, the applicable licensing laws and regulations are subject to amendment or interpretation by regulatory authorities. Generally, these authorities are vested with relatively broad discretion to grant, renew and revoke licenses and approvals for various reasons, including the violation of law and conviction of crimes. Other sanctions may include the suspension of individual employees, limitations on engaging in a particular business for specified periods of time, revocation of licenses, censures, redress to policyholders and fines. Although NLASCO and its insurance subsidiaries endeavor to follow practices based on good faith interpretations of laws and regulations, or those generally followed by the industry, these practices may prove to be different from those that the regulatory authorities require.
If the states in which NLIC and ASIC write insurance increase the assessments that insurance companies are required to pay, NLASCO’s and their financial condition and results of operations will suffer.
NLIC and ASIC are subject to a variety of taxes, fines, levies, license fees, tariffs and other assessments that may, from time to time, be material. These assessments are made by the states in which NLIC and ASIC operate and include participation in residual market or involuntary risk plans in various states that provide insurance coverage to individuals or entities that otherwise are unable to purchase such coverage from private insurers. Due to this participation, NLIC and ASIC may be exposed to material losses. They also are subject to assessments in the states in which they write insurance for various purposes, including the provision of funds necessary to fund the operations of various insurance guaranty associations, which pay covered claims under certain policies issued by impaired, insolvent or failed insurance companies. These assessments are generally set based on an insurer’s percentage of the total premiums written in the relevant state within a particular line of business for the relevant time period. For the years ended December 31, 2011, 2010 and 2009, NLASCO paid no assessments. If NLIC’s and ASIC’s total premiums written grow, NLASCO’s share of any assessments may increase, as well. NLASCO, however, cannot predict with certainty the amount of future assessments, because these assessments depend on factors outside NLASCO’s control, such as the insolvencies of other insurance companies, the market shares of other insurance companies writing in a particular state and the degree to which other companies write in coastal areas.
NLASCO is subject to assessments from the Georgia Underwriting Association, Louisiana Citizens Property Insurance Corporation, or LCPIC, Mississippi Windstorm Underwriting Association, or MWUA, the Texas FAIR Plan Association and the Texas Windstorm Insurance Association, or TWIA.
LCPIC, MWUA and TWIA have estimated plan losses from the hurricanes that struck Louisiana and Texas in the third quarter of 2005 and 2008, and are thereby able to levy regular and emergency assessments to participating companies and policyholders, respectively. NLASCO does not expect that these assessments will have a net financial statement impact, as all these assessments are recoverable (subject to treaty limits) under its reinsurance treaties. Further, NLASCO may be able to recoup a regular assessment through a surcharge to policyholders. These recoupments will be refunded to reinsurers as the related premiums are written and collected. NLASCO is required to collect emergency assessments directly from residential property policyholders and remit them to LCPIC as they are collected.
NLASCO continues to monitor developments with respect to various state facilities, such as the Georgia Underwriting Association, LCPIC, MWUA, the Texas FAIR Plan Association and the TWIA. The ultimate impact of Hurricanes Katrina, Rita, Dolly and Ike on these facilities is currently uncertain, but could result in the facilities recognizing a financial deficit different than the level currently estimated. They may, in turn, have the ability to assess participating insurers when financial deficits occur. NLASCO will not, however, incur any net expense or loss from any of these assessments due to reinsurance recoveries.
NLASCO may be subject to high retaliatory taxes in several states as a result of its multistate operations, which could have a material adverse impact on its financial condition and results of operations.
Nearly all states impose a retaliatory tax on insurers operating in their state that are domiciled in another state. Retaliatory taxes are based on the principle that if the aggregate taxes, fees and obligations imposed by an insurer’s domiciliary state are greater than the aggregate taxes, fees and obligations imposed by the taxing state, then the difference is payable to the taxing state as a retaliatory tax. For example, the State of Texas imposes various premium-based taxes that, in the aggregate, total approximately 2.0% of gross written premiums in Texas. The State of Illinois imposes various premium-based taxes that, in the aggregate, total approximately 0.5% of gross written premiums in Illinois. The Illinois retaliatory tax provisions would require a Texas-domiciled insurer operating in Illinois to pay the 0.5% aggregate Illinois taxes plus a 1.5% incremental amount, which represents the difference between the Texas effective rate and the Illinois effective rate. Thus, a Texas-domiciled insurer would pay a 2.0% effective tax in Illinois, while an Illinois-domiciled insurer would only pay a 0.5% effective tax. Insurance companies with multistate operations, like NLASCO, may find themselves subject to high retaliatory taxes in several states, which could have a material adverse impact on NLASCO’s financial condition and results of operations.
35
Table of Contents
NLASCO’s ability to meet ongoing cash requirements and pay dividends may be limited by its holding company structure and regulatory constraints.
NLASCO operates as a holding company. Dividends and other permitted payments from its operating subsidiaries are expected to be its primary source of funds to meet ongoing cash requirements, including any future debt service payments and other expenses, and to pay dividends, if any, to Hilltop. NLIC and ASIC are subject to significant regulatory restrictions and limitations under debt agreements limiting their ability to declare and pay dividends, which could, in turn, limit NLASCO’s ability to meet its ongoing cash requirements, including any future debt service payments and other expenses, or to pay dividends.
Current legal and regulatory activities, investigations, litigation proceedings or other activities relating to the insurance industry could affect NLASCO’s business, financial condition and results of operations.
The insurance industry has experienced share price volatility as a result of litigation, investigations and regulatory activity by various insurance, governmental and enforcement authorities concerning certain practices within the insurance industry. NLASCO is unable to predict the potential effects, if any, that these investigations may have upon the insurance markets and industry business practices in general or what, if any, changes may be made to laws and regulations regarding the industry and financial reporting. Any of the foregoing could materially and adversely affect its business, financial condition and results of operations.
NLIC and ASIC are subject to periodic financial and market conduct examinations by state insurance departments. If these examinations identify significant findings or recommend significant changes to its operations, either insurance company could lose its licenses or its financial condition and results of operations could be affected.
The insurance departments in every state in which NLASCO’s insurance companies do business may conduct on-site visits and examinations at any time and generally for any purpose, including the review of NLASCO’s insurance companies’ financial condition, market conduct and relationships and transactions with affiliates. In addition, the Texas Department of Insurance will conduct comprehensive examinations of NLASCO’s insurance companies every three to five years. The Texas Department of Insurance completed their last examinations of NLIC and ASIC through December 31, 2006 in examination reports dated June 13, 2008 and June 1, 2008, respectively, which contained no information of any significant compliance issues. In 2010, ASIC and NLIC were notified by the Texas Department of Insurance that a statutory examination had been scheduled to be performed during the calendar years 2011/2012. The examinations are as of December 31, 2010, and cover the period since the last examination, which was as of December 31, 2006. We have received drafts of the examination reports and there is no indication of any significant changes to our financial statements as a result of the examinations by the domiciliary state.
While there were no material adverse findings or recommended changes to NLASCO’s or its insurance company subsidiaries’ operations identified in the last completed or draft report of financial examinations conducted by the departments of insurance, there can be no assurance that there will not be adverse findings or recommended changes identified by other state insurance departments in future examinations. In addition, significant adverse findings could lead to a revocation of NLASCO’s or its insurance company subsidiaries’ licenses. Any adverse findings or recommended changes resulting from such financial examinations, or from any future examinations, could have a material adverse effect on NLASCO’s or its insurance company subsidiaries’ financial condition and results of operations.
Departure of key personnel would deprive us of the institutional knowledge, expertise and leadership they provide.
Operating an insurance company is complex. The insurance industry is highly competitive and has historically been characterized by periods of significant price competition, alternating with periods of greater pricing discipline during which competitors focus on other factors. In addition, insurance companies are subject to comprehensive regulation and supervision in those states in which they write insurance policies and in which they are domiciled. Significant changes in the political and regulatory climate could result in changes in these laws and regulations and could make it more expensive or less profitable for us to manage an insurance company. The loss of key personnel may result in us encountering difficulties in operating an insurance company and complying with regulatory requirements applicable to insurance companies.
36
Table of Contents
NLASCO is in the process of implementing a new information technology system that could cause substantial business interruption.
We are in the process of designing and implementing a new information technology system and are investing significant financial and personnel resources into this project. There is no assurance, however, that the design will meet our current and future business needs or that it will operate as designed. We are heavily dependent on computer systems, and any significant failure or delay in the system implementation, if encountered, would cause a substantial interruption to our business and additional expense that could result in an adverse impact on our operating results, cash flows and financial condition.
Failures in NLASCO’s current electronic underwriting system could adversely affect its financial condition and results of operations.
NLASCO’s Internet-based Policy Agency Claim System, or PACS, was primarily developed in-house. PACS is fully integrated and is able to process quotes, policy issuance, billings, payments and claims. The system is designed for ease of use by agents and employees. PACS has been an integral part of NLASCO’s success. Almost all applications are submitted online. Problems or errors of which NLASCO is not currently aware may have occurred in connection with the installation, upgrading or maintenance of this system or any of its other systems or may result from a major physical disaster or other calamity that causes damage to NLASCO’s systems generally. A loss of PACS or any of NLASCO’s other systems for a sustained period of time could have an adverse impact on its financial condition and results of operations.
Failure to develop an adequate knowledge transfer or a succession plan for NLASCO’s information technology personnel could adversely affect its financial condition and results of operations.
The success of PACS and NLASCO’s new and other systems depend heavily on the incumbent information technology team that developed or implemented the system. A loss of key members of this team without adequate knowledge transfer or a succession plan could disrupt NLASCO’s operations and adversely affect its results of operations.
Security breaches, cyber attacks or fraudulent activity could result in damage to the Company’s operations or lead to reputational damage.
A security breach or cyber attack of the Company’s computer systems could interrupt or damage the Company’s operations or harm its reputation. Despite the implementation of security measures, the Company’s systems may still be vulnerable to data theft, computer viruses, programming errors, attacks by third parties or similar disruptive problems.
If the Company were to experience a security breach or cyber attack, it could be required to incur substantial costs and liabilities, including, among other things, the following:
· expenses to rectify the consequences of the security breach or cyber attack;
· liability for stolen assets or information;
· costs of repairing damage to the Company’s systems;
· lost revenue and income resulting from any system downtime caused by such breach or attack;
· increased costs of cyber security protection;
·costs of incentives the Company may be required to offer to its policyholders to retain their business, and
·damage to the Company’s reputation causing policyholders, acquisition targets and investors to lose confidence in the Company.
In addition, any compromise of security or a cyber attack could deter consumers from entering into transactions that involve transmitting confidential information to the Company’s systems. Further, if confidential policyholder information or information belonging to persons other than the Company is misappropriated from the Company’s computer systems, the Company could be sued by those who assert the Company did not take adequate precautions to safeguard its systems and confidential data, which could subject the Company to liability and result in significant legal fees and expenses of defending these claims. As a result, any compromise of security of the Company’s computer systems or cyber attack could have a material adverse effect on the Company’s business, prospects, results of operations and financial condition.
37
Table of Contents
Claims by third-parties that NLASCO infringes their proprietary technology could adversely affect NLASCO’s financial condition and results of operations.
If NLASCO discovers that any of its products, or technology that it licenses from third-parties, violates third-party proprietary rights, NLASCO may not be able to reengineer its products or obtain a license on commercially reasonable terms to continue using the products or technology without substantial reengineering, or to otherwise modify programs. In addition, product and technology development is inherently uncertain in a rapidly evolving technology environment in which there may be numerous patent applications pending for similar technologies, many of which are confidential when filed. In addition, much of the software used by NLASCO may be used subject to a licensing agreement, and NLASCO’s failure to comply with the terms for usage under any such licensing agreement could subject it to claims that could adversely impact its business. Although NLASCO sometimes may be indemnified by third-parties against claims that licensed third-party technology infringes proprietary rights of others, this indemnity may be limited, unavailable or, where the third party lacks sufficient assets or insurance, ineffective. NLASCO currently does not have liability insurance to protect against the risk that its technology or future licensed third-party technology infringes the proprietary rights of others. Any claim of infringement, even if invalid, could cause NLASCO to incur substantial costs defending against the claim and could distract its management from the business. Furthermore, a party making such a claim could secure a judgment that requires NLASCO to pay substantial damages. A judgment also could include an injunction or other court order that could prevent NLASCO from using the products and technologies. Any of these events could have a material adverse effect on NLASCO’s business, operating results and financial condition.
Acquisitions could result in operating difficulties and other harmful consequences.
From time to time, NLASCO may engage in discussions regarding potential acquisitions, including potential acquisitions that could be material to its financial condition and results of operations. NLASCO may acquire whole businesses or books of business that fit its underwriting competencies from insurance companies, MGAs and other agents. In addition, NLASCO may expand its business, product offerings and policyholder base by acquiring businesses in areas in which NLASCO has limited operating experience. The process of integrating an acquired company or book of business may create unforeseen operating difficulties and expenditures. In particular:
·NLASCO has achieved its prior success by applying a disciplined approach to underwriting and pricing in select markets that are not well served by its competitors. NLASCO may not be able to successfully implement its underwriting, claims management, pricing and product strategies in companies or books of business it acquires;
·NLASCO may not be able to retain the agents associated with acquired businesses and, as a result, may fail to realize the anticipated potential benefits of the acquisition;
·NLASCO could be required to implement or remediate controls, procedures and policies for an acquired privately-held company that prior to acquisition may not have been required;
·An acquisition could present cultural challenges associated with integrating employees from the acquired company into the organization, which could result in a loss of employees from the businesses NLASCO acquires and other adverse consequences;
·NLASCO’s management may have to divert its time and energy from operating the business to integration challenges;
·NLASCO could have no prior experience operating the type of business that it acquires, which could create difficulties and result in NLASCO failing to realize many of the anticipated potential benefits of the acquisition; and
·An acquisition could dilute NLASCO’s book value per share or after-tax return on average equity.
The anticipated benefits of any acquisition may not materialize. Future acquisitions could result in the incurrence of debt or an assumption of inadequate liabilities for losses and loss adjusted expenses or claims management structures, any of which could harm NLASCO’s financial condition. Future acquisitions may require NLASCO to obtain additional financing, which may not be available on favorable terms or at all.
Risks Related to the Securities Markets and Ownership of Our Common Stock
Our charter and insurance laws contain provisions that could discourage acquisition bids or merger proposals, which may adversely affect the market price of our common stock.
Ownership Limit. In order to reduce the risk of an ownership change in the future, our charter restricts certain acquisitions of our securities in order to preserve the benefit of our NOLs. The charter generally prohibits any direct or indirect sale, transfer, assignment, conveyance, pledge or other disposition of shares of our stock or warrants, rights or options to purchase
38
Table of Contents
our stock or any other interests that would be treated as our stock under the income tax regulations promulgated under the Internal Revenue Code of 1986, as amended, if as a result of such sale, transfer, assignment, conveyance, pledge or other disposition any person or group would beneficially own five percent or more of the market value of the total outstanding shares of our common stock or the percentage of our common stock owned by a five percent or greater stockholder would be increased. Beneficial ownership is determined utilizing Treasury Regulation Section 1.382-2T(g). The transfer restrictions were implemented in January 2007, and we expect to maintain these provisions for the foreseeable future. We cannot assure you, however, that these restrictions will prevent an ownership change. If any of our stockholders increase their beneficial ownership percentage in our common stock through future acquisitions, there is an increased possibility that the provisions under the charter may be triggered. Any attempted transfer of shares in violation of the charter prohibitions will be void, and the intended transferee will not acquire any right in those shares. We have the right to take any lawful action that we believe is necessary or advisable to ensure compliance with these ownership and transfer restrictions, including refusing to recognize any transfer of stock in violation of our charter. These ownership and transfer restrictions of our charter may have the effect of discouraging or preventing a third party from attempting to gain control of us without the approval of our board of directors. Accordingly, it is less likely that a change in control, even if beneficial to stockholders, could be effected without the approval of our board of directors.
Authority to Issue Additional Shares. Under our charter, our board of directors may issue up to an aggregate of ten million shares of preferred stock without stockholder action. The preferred stock may be issued, in one or more series, with the preferences and other terms designated by our board of directors that may delay or prevent a change in control of us, even if the change is in the best interests of stockholders. As of December 31, 2010, no shares of preferred stock were designated or outstanding.
Insurance Laws. NLIC and ASIC are domiciled in the State of Texas. Before a person can acquire control of an insurance company domiciled in Texas, prior written approval must be obtained from the Texas Department of Insurance. Acquisition of control would be presumed on the acquisition, directly or indirectly, of ten percent or more of Hilltop’s outstanding voting stock, unless the regulators determine otherwise. Prior to granting approval of an application to acquire control of a domestic insurer, the Texas Department of Insurance will consider several factors, such as:
·the financial strength of the acquirer;
·the integrity and management experience of the acquirer’s board of directors and executive officers;
·the acquirer’s plans for the management of the insurer;
·the acquirer’s plans to declare dividends, sell assets or incur debt;
·the acquirer’s plans for the future operations of the domestic insurer;
·the impact of the acquisition on continued licensure of the domestic insurer;
·the impact on the interests of Texas policyholders; and
·any anti-competitive results that may arise from the consummation of the acquisition of control.
These laws may discourage potential acquisition proposals of Hilltop and may delay, deter or prevent a change of control of Hilltop, including transactions that some or all of our stockholders might consider desirable.
We previously announced a stock repurchase program approved by our board of directors whereby we are authorized to repurchase shares of our common stock.
Such purchases may be limited, suspended, or terminated at any time without prior notice. There can be no assurance that we will buy shares of our common stock under our stock repurchase program or that any future repurchases will have a positive impact on the trading price of our common stock or earnings per share. Important factors that could cause us to limit, suspend or terminate our stock repurchase program include, among others, unfavorable market conditions, the trading price of our common stock, the nature of other investment or strategic opportunities presented to us from time to time, the rate of dilution of our equity compensation programs and the availability of adequate funds, our ability to make appropriate, timely, and beneficial decisions as to when, how, and whether to purchase shares under the stock repurchase program. If we limit, suspend or terminate our stock repurchase program, our stock price may be negatively affected.
Future issuances of shares of common stock may adversely affect the price of our common stock.
The future issuance of a substantial number of shares of common stock into the public market, or the perception that such issuance could occur, could adversely affect the prevailing market price of our common stock. A decline in the price of our common stock could make it more difficult to raise funds through future offerings of our common stock or securities convertible into common stock.
39
Table of Contents
Our common stock price may experience substantial volatility, which may affect your ability to sell our common stock at an advantageous price.
Price volatility of our common stock may affect your ability to sell our common stock at an advantageous price. Market price fluctuations in our common stock may arise due to acquisitions, dispositions or other material public announcements, including those regarding dividends or changes in management, along with a variety of additional factors, including, without limitation, other risks identified in “Forward-looking Statements” and these “Risk Factors.” In addition, the stock markets in general, including the NYSE, have experienced extreme price and trading fluctuations. These fluctuations have resulted in volatility in the market prices of securities that often have been unrelated or disproportionate to changes in operating performance. These broad market fluctuations may adversely affect the market price of our common stock.
Our rights and the rights of our stockholders to take action against our directors and officers are limited.
We are organized under Maryland law, which provides that a director or officer has no liability in that capacity if he or she performs his or her duties in good faith, in a manner he or she reasonably believes to be in our best interests and with the care that an ordinarily prudent person in a like position would use under similar circumstances. In addition, our charter eliminates our directors’ and officers’ liability to us and our stockholders for money damages, except for liability resulting from actual receipt of an improper benefit or profit in money, property or services or active and deliberate dishonesty established by a final judgment and that is material to the cause of action. Our bylaws require us to indemnify our directors and officers for liability resulting from actions taken by them in those capacities to the maximum extent permitted by Maryland law. As a result, our stockholders and we may have more limited rights against our directors and officers than might otherwise exist under common law. In addition, we may be obligated to fund the defense costs incurred by our directors and officers.
ITEMThe Treasury’s investment in us imposes restrictions and obligations upon us that could adversely affect the rights of our common stockholders.
We have sold 114,068 shares of our Series B Preferred Stock, liquidation preference $1,000 per share, for $114.1 million, to the Secretary of the Treasury pursuant to the SBLF. The shares of Series B Preferred Stock are senior to shares of our common stock with respect to dividends and liquidation preference. The terms of the Series B Preferred Stock provided for the payment of non-cumulative dividends on a quarterly basis. The dividend rate, as a percentage of the liquidation amount, fluctuates while the Series B Preferred Stock is outstanding based upon changes in the level of qualified small business lending by the Bank from its Baseline. As long as shares of Series B Preferred Stock remain outstanding, we may not pay dividends to our common stockholders (nor may we repurchase or redeem any shares of our common stock) during any quarter in which we fail to declare and pay dividends on the Series B Preferred Stock and for the next three quarters following such failure. In addition, under the terms of the Series B Preferred Stock, we may only declare and pay dividends on our common stock (or repurchase shares of our common stock), if, after payment of such dividend, the dollar amount of our Tier 1 capital would be at least ninety percent (90%) of Tier 1 capital as of September 27, 2011, excluding any charge-offs and redemptions of the Series B Preferred Stock (the “Tier 1 Dividend Threshold”). The Tier 1 Dividend Threshold is subject to reduction, beginning January 1, 2014, based upon the extent by which, if at all, the Bank’s qualified small business lending at September 30, 2013 has increased over the Baseline.
Our charter and laws contain provisions that could discourage acquisition bids or merger proposals, which may adversely affect the market price of our common stock.
Authority to Issue Additional Shares. Under our charter, our board of directors may issue up to an aggregate of ten million shares of preferred stock without stockholder action. The preferred stock may be issued, in one or more series, with the preferences and other terms designated by our board of directors that may delay or prevent a change in control of us, even if the change is in the best interests of stockholders. At December 31, 2012, 114,068 shares of preferred stock were designated or outstanding.
Banking Laws. Any change in control of our company is subject to prior regulatory approval under the Bank Holding Company Act or the Change in Bank Control Act, which may delay, discourage or prevent an attempted acquisition or change in control of us.
Insurance Laws. NLIC and ASIC are domiciled in the State of Texas. Before a person can acquire control of an insurance company domiciled in Texas, prior written approval must be obtained from the Texas Department of Insurance. Acquisition of control would be presumed on the acquisition, directly or indirectly, of ten percent or more of our outstanding voting
45
Table of Contents
stock, unless the regulators determine otherwise. Prior to granting approval of an application to acquire control of a domestic insurer, the Texas Department of Insurance will consider several factors, such as:
·the financial strength of the acquirer;
·the integrity and management experience of the acquirer’s board of directors and executive officers;
·the acquirer’s plans for the management of the insurer;
·the acquirer’s plans to declare dividends, sell assets or incur debt;
·the acquirer’s plans for the future operations of the domestic insurer;
·the impact of the acquisition on continued licensure of the domestic insurer;
·the impact on the interests of Texas policyholders; and
·any anti-competitive results that may arise from the consummation of the acquisition of control.
These laws may discourage potential acquisition proposals for us and may delay, deter or prevent a change of control of us, including transactions that some or all of our stockholders might consider desirable.
Restrictions on Calling Special Meeting, Cumulative Voting and Director Removal. Our bylaws includes a provision prohibiting the holders of less than a majority of the voting power represented by all of our shares issued, outstanding and entitled to be voted at a proposed meeting, from calling a special meeting of stockholders. Our charter does not provide for the cumulative voting in the election of directors. In addition, our charter provides that our directors may only be removed for cause and then only by an affirmative vote of at least two-thirds of the votes entitled to be cast in the election of directors. Any amendment to our charter relating to the removal of directors requires the affirmative vote of two-thirds of all of the votes entitled to be cast on the matter. These provisions of our bylaws and charter may delay, discourage or prevent an attempted acquisition or change in control of us.
An investment in our common stock is not an insured deposit.
An investment in our common stock is not a bank deposit and is not insured or guaranteed by the FDIC, SIPC, the Texas Department of Insurance or any other government agency. Accordingly, you should be capable of affording the loss of any investment in our common stock.
Item 1B. UNRESOLVED STAFF COMMENTSUnresolved Staff Comments.
Not applicable.None.
ITEMItem 2. PROPERTIESProperties.
Not applicable.We lease office space for our principle executive offices in Dallas, Texas. In addition to our principal office, our various business segments conduct business at various locations.
Banking. At December 31, 2012, our banking segment conducted business at 36 locations, including two operations centers. Our banking segment’s principal executive offices are located in Dallas, Texas, in space leased by PlainsCapital. In addition to the principal office, we operate the following banking locations. We have options to renew leases at most locations.
| | Owned | | Leased | | Total | |
Lubbock market | | 7 | | 7 | | 14 | |
Dallas/Fort Worth market | | — | | 14 | | 14 | |
Austin market | | — | | 5 | | 5 | |
San Antonio market | | — | | 3 | | 3 | |
Total | | 7 | | 29 | | 36 | |
Mortgage Origination. Our mortgage origination segment is headquartered in Dallas, Texas and at December 31, 2012 conducted business at 280 locations in 42 states. Each of these locations is leased by PrimeLending.
Insurance. At December 31, 2012, NLASCO leases office space in Waco, Texas for all corporate, claims, customer service and data center operations.
Financial Advisory. Our financial advisory segment is headquartered in Dallas, Texas and at December 31, 2012 conducted business at 26 locations in 14 states and the District of Columbia. Each of these offices is leased by First Southwest.
46
Table of Contents
ITEMItem 3. LEGAL PROCEEDINGSLegal Proceedings.
We are a party to various legal actions resulting from our operating activities. These actions consist of litigation and administrative proceedings arising in the ordinary course of business, some of which are covered by liability insurance, and none of which is expected to have a material adverse effect on our consolidated financial condition, results of operations or cash flows taken as a whole.
ITEM 4. MINE SAFETYIn November 2006, FSC received subpoenas from the SEC and the U.S. Department of Justice (the “DOJ”) in connection with an investigation of possible antitrust and securities law violations, including bid-rigging, in the procurement of guaranteed investment contracts and other investment products for the reinvestment of bond proceeds by municipalities. The investigation is industry-wide and includes approximately 30 or more firms, including some of the largest U.S. investment firms.
As a result of these SEC and DOJ investigations into industry-wide practices, FSC was initially named as a co-defendant in cases filed in several different federal courts by various state and local governmental entities suing on behalf of themselves and a purported class of similarly situated governmental entities and a similar set of lawsuits filed by various California local governmental entities suing on behalf of themselves and a purported class of similarly situated governmental entities. All claims asserted against FSC in these purported class actions were subsequently dismissed. However, the plaintiffs in these purported class actions have filed amended complaints against other entities, and FSC is identified in these complaints not as a defendant, but as an alleged co-conspirator with the named defendants.
Additionally, as a result of these SEC and DOJ investigations into industry-wide practices, FSC has been named as a defendant in 20 individual lawsuits. These lawsuits have been brought by several California public entities and two New York non-profit corporations that do not seek to certify a class. The Judicial Panel on Multidistrict Litigation has transferred these cases to the United States District Court, Southern District of New York. The California plaintiffs allege violations of Section 1 of the Sherman Act and the California Cartwright Act. The New York plaintiffs allege violations of Section 1 of the Sherman Act and the New York Donnelly Act. The allegations against FSC are very limited in scope. FSC has filed answers in each of the twenty lawsuits denying the allegations and asserting several affirmative defenses. FSC intends to defend itself vigorously in these individual actions. The relief sought is unspecified monetary damages.
Like other financial institutions, we are subject to various federal, state and local laws and regulations relating to environmental matters. Under these laws and regulations, we could be held liable for costs relating to environmental contamination at or from properties that secure our loan portfolio. With respect to our borrower’s properties, the potential liabilities may far exceed the original amount of the loan made by us and secured by the property. Currently, we are not a defendant in any environmental legal proceeding.
Item 4.Mine Safety Disclosures.
Not applicable.
4047
Table of Contents
PART II
ITEMItem 5. MARKET FOR THE REGISTRANT’S COMMON EQUITY, RELATED STOCKHOLDER MATTERS AND ISSUER PURCHASES OF EQUITY SECURITIESMarket for Registrant’s Common Equity, Related Stockholder Matters and Issuer Purchases of Equity Securities.
Securities, Stockholder and Dividend Information
Our common stock is listed on the New York Stock Exchange under the symbol “HTH”. Our common stock has no public trading history prior to February 12, 2004. The initial public offering price of our common stock on February 12, 2004 was $19.00 per share. Our common stock closed at $8.00$13.03 on March 8, 2012. As of14, 2013. At March 9, 2012,14, 2013, there were 56,502,24683,487,340 shares of our common stock outstanding with approximately 170644 stockholders of record.
Prior to full redemptionOn November 29, 2012, we filed with the State Department of ourAssessments and Taxation of the State of Maryland articles supplementary for Series A Cumulative RedeemableB Preferred Stock, on September 6, 2010, it was listedsetting forth its terms. Holders of the Series B Preferred Stock are entitled to noncumulative cash dividends at a fluctuating dividend rate based on the New YorkBank’s level of qualified small business lending. The Series B Preferred Stock Exchange underis non-voting, except in limited circumstances, and ranks senior to our common stock with respect to the symbol “HTHPRA”. Our Series A preferred stock has no public trading history prior to February 12, 2004.payment of dividends and distribution of assets upon any liquidation, dissolution or winding up of Hilltop.
We have not paid,Subject to the restrictions discussed below, our stockholders are entitled to receive dividends when, as, and do not intendif declared by our Board of Directors out of funds legally available for that purpose. Our Board of Directors exercises discretion with respect to whether we will pay dividends and the amount of such dividend, if any. Factors that affect our ability to pay dividends on our common stock in the foreseeable future cashinclude, without limitation, our earnings and financial condition, liquidity and capital resources, the general economic and regulatory climate, our ability to service any equity or debt obligations senior to our common stock and other factors deemed relevant by our Board of Directors. Hilltop has not declared or paid any dividends over the past two completed fiscal years.
As a holding company, we are ultimately dependent upon our subsidiaries to provide funding for our operating expenses, debt service and dividends. Various laws limit the payment of dividends and other distributions by our subsidiaries to us, and may therefore limit our ability to pay dividends on our common stock. Any declarationIn addition, as long as shares of Series B Preferred Stock remain outstanding, we may not pay dividends to our common stockholders (nor may we repurchase or redeem any shares of our common stock) during any quarter in which we fail to declare and pay dividends on the Series B Preferred Stock and for the next three quarters following such failure. In addition, under the terms of the Series B Preferred Stock, we may only declare and pay dividends on our common stock will(or repurchase shares of our common stock), if, after payment of such dividend, the dollar amount of our Tier 1 capital would be at least ninety percent (90%) of Tier 1 capital as of September 27, 2011, excluding any charge-offs and redemptions of the discretionSeries B Preferred Stock. The Tier 1 Dividend Threshold is subject to reduction, beginning January 1, 2014, based upon the extent by which, if at all, the our qualified small business lending at September 30, 2013 has increased over the Baseline.
If required payments on our outstanding junior subordinated debentures held by our unconsolidated subsidiary trusts are not made or suspended, we may be prohibited from paying dividends on our common stock. Regulatory authorities could impose administratively stricter limitations on the ability of our Board of Directors and will depend on the earnings, financial condition,subsidiaries to pay dividends to us if such limits were deemed appropriate to preserve certain capital requirements, contractual restrictions with respect to payment of dividends and other factors.adequacy requirements. See Item 7, “Management’s Discussion and Analysis of Financial Condition and Results of Operations — Liquidity and Capital Resources — Restrictions on Dividends and Distributions.”
The following table sets forth the cash dividends declared and paid in 2010 with respect to our Series A Preferred Stock:
| | First Quarter | | Second Quarter | | Third Quarter | | Fourth Quarter | |
Series A Preferred Stock | | | | | | | | | |
2010 | | | | | | | | | |
Date of declaration | | March 17, 2010 | | July 8, 2010 | | August 6, 2010 | | N/A | |
Date of record | | April 15, 2010 | | July 15, 2010 | | September 6, 2010 | | N/A | |
Date paid | | April 30, 2010 | | July 30, 2010 | | September 6, 2010 | | N/A | |
Distribution per unit | | $ | 0.5156 | | $ | 0.5156 | | $ | 0.2063 | | N/A | |
Total dollars (in thousands) | | $ | 2,578 | | $ | 2,578 | | $ | 1,032 | | N/A | |
41
Table of Contents
The following table discloses the high and low sales prices per quarter for our common and preferred stock during 20112012 and 2010.2011. Quotations reflect inter-dealer prices, without retail mark-up, mark-down or commission and may not represent actual transactions.
| | Common | | Series A | |
| | Stock | | Preferred Stock | |
December 31, 2011 | | High | | Low | | High | | Low | |
First Quarter | | $ | 10.13 | | $ | 9.01 | | N/A | | N/A | |
Second Quarter | | $ | 10.09 | | $ | 8.60 | | N/A | | N/A | |
Third Quarter | | $ | 9.01 | | $ | 7.12 | | N/A | | N/A | |
Fourth Quarter | | $ | 8.60 | | $ | 6.88 | | N/A | | N/A | |
December 31, 2010 | | High | | Low | | High | | Low | | |
| | | Price Range | |
| | | High | | Low | |
Year Ended December 31, 2012 | | | | | | |
First Quarter | | $ | 12.41 | | $ | 11.29 | | $ | 25.86 | | $ | 24.48 | | | $ | 9.10 | | $ | 7.87 | |
Second Quarter | | $ | 12.20 | | $ | 9.90 | | $ | 26.58 | | $ | 24.90 | | | $ | 10.89 | | $ | 7.75 | |
Third Quarter | | $ | 10.77 | | $ | 9.31 | | $ | 26.70 | | $ | 25.08 | | | $ | 12.80 | | $ | 10.21 | |
Fourth Quarter | | $ | 10.52 | | $ | 9.47 | | N/A | | N/A | | | $ | 14.49 | | $ | 12.57 | |
| | | | | | |
Year Ended December 31, 2011 | | | | | | |
First Quarter | | | $ | 10.13 | | $ | 9.01 | |
Second Quarter | | | $ | 10.09 | | $ | 8.60 | |
Third Quarter | | | $ | 9.01 | | $ | 7.12 | |
Fourth Quarter | | | $ | 8.60 | | $ | 6.88 | |
As48
Table of December 31, 2011, we had no warrants outstanding.Contents
Issuances of Unregistered Securities Authorized for Issuance under Equity Compensation Plans
All issuancesThe following table sets forth information at December 31, 2012 with respect to compensation plans under which shares of unregistered securities have previously been reported.our common stock may be issued. Additional information concerning our stock-based compensation plans is presented in Note 18, Stock-Based Compensation, in the notes to our consolidated financial statements.
Equity Compensation Plan Information
The following table sets forth as of December 31, 2011, information concerning our equity compensation plans, including the number of shares issued and available for issuances under our plans, options, warrants and rights; weighted average exercise price of outstanding options, warrants and rights; and the number of securities remaining available for future issuance.
Equity Compensation Plan Information | | |
Plan Category | | Number of securities to be
issued upon exercise of
outstanding options,
warrants and rights | | Weighted-average exercise
price of outstanding options,
warrants and rights | | Number of securities
remaining available for
future issuance under equity
compensation plans
(excluding securities
reflected in first column) | | | Number of securities
to be issued upon
exercise of
outstanding options,
warrants and rights | | Weighted-average
exercise price of
outstanding options,
warrants and rights | | Number of securities
remaining available for
future issuance under
equity compensation plans
(excluding securities
reflected in first column) | |
Equity compensation plans approved by security holders* | | | 600,000 | | $ | 7.70 | | 4,000,000 | |
| | | | | | | | | | | | | | |
Equity compensation plans approved by security holders* | | 700,000 | | $ | 8.32 | | 423,831 | | |
Total | | 700,000 | | $ | 8.32 | | 423,831 | | | 600,000 | | $ | 7.70 | | 4,000,000 | |
*Excludes shares of restricted stock granted under the 2003 equity incentive plan, as all of these shares are vested. No exercise price is required to be paid upon the vesting of the restricted shares of common stock granted. TheseAll shares are issuableissued as of December 31, 2012 were issued under our 2003 equity incentive plan. In September 2012, the stockholders approved the 2012 equity incentive plan, which providesallows for the grantgranting of equity-based incentives, includingnonqualified stock options, stock appreciation rights, restricted stock, restricted stock units, performance awards, dividend equivalent rights and other awards to employees of Hilltop, its subsidiaries and outside directors of Hilltop. Upon the effectiveness of the 2012 equity incentive plan, no additional awards are permissible under the 2003 equity incentive plan. In the aggregate, 4,000,000 shares of our common stock stock options, grants of shares and other equity-basedmay be delivered pursuant to awards to our directors, officers and other employees and those of our subsidiaries selected by our Compensation Committee for participation ingranted under the 2012 equity incentive plan. At inception, 1,992,387 shares were authorized for grantDecember 31, 2012, no awards had been granted pursuant to thisthe 2012 equity incentive plan. All shares outstanding, whether vested or unvested, are entitled to receive dividends and to vote, unless forfeited. No participant in our 20032012 equity incentive plan may be granted awards in any fiscal year covering more than 500,0001,250,000 shares of our common stock.
42Issuer Repurchases of Equity Securities
The following table details our repurchases of shares of common stock during the three months ended December 31, 2012.
Period | | Total
Number of
Shares
Purchased | | Average
Price Paid
per Share | | Total Number
of Shares
Purchased as
Part of
Publicly
Announced | | Approximate
Dollar Value of
Shares that May
Yet Be Purchased
Under the Plans or
Programs (1) | |
October 1 – October 31, 2012 | | 10,134 | (2) | $ | 13.42 | | $ | — | | $ | 98,837,692 | |
November 1 – November 30, 2012 | | — | | — | | — | | — | |
December 1 – December 31, 2012 | | — | | — | | — | | — | |
| | | | | | | | | | | | |
Table(1)On November 2, 2011, our Board of ContentsDirectors approved a share repurchase plan that authorized us to purchase up to $100 million of our outstanding shares of common stock. This repurchase plan permitted the purchase of shares of common stock from time to time in open market purchases in accordance with Rule 10b-18 promulgated by the SEC under the Exchange Act or pursuant to privately negotiated transactions. This repurchase plan expired pursuant to its terms on November 1, 2012.
(2)Represents 10,134 shares of common stock surrendered to the Company upon the net exercise of options in addition to the number of shares necessary to pay taxes or satisfy the exercise price thereof.
ITEMRecent Sales of Unregistered Securities
All issuances of unregistered securities have previously been reported.
Item 6. SELECTED FINANCIAL AND OPERATING DATASelected Financial Data.
Our historical consolidated balance sheet data as ofat December 31, 20112012 and 20102011 and our consolidated statementstatements of operations data for the years ended December 31, 2012, 2011 2010 and 20092010 have been derived from our audited historical consolidated financial statements included elsewhere in this Form 10-K.Annual Report. The following table shows our selected historical financial data for the periods indicated (in thousands, except per share data).indicated. You should read our selected historical financial data, together with the notes thereto, in conjunction with the more detailed information contained in our consolidated financial statements and related notes and “Management’s Discussion and Analysis of Financial Condition and Results of Operations” included in this Form 10-K.Annual Report. The operating results of PlainsCapital are included in the tables below for the month of December 2012 and the balance sheet reflects the combined company at December 31, 2012, respectively (in thousands, except per share data and weighted average shares outstanding).
| | Year Ended December 31, | |
| | 2011 | | 2010 | | 2009 | | 2008 | | 2007 | |
Income Statement Data: | | | | | | | | | | | |
Direct premium written | | $ | 155,054 | | $ | 139,290 | | $ | 131,309 | | $ | 132,642 | | $ | 122,708 | |
Net premium written | | 141,737 | | 121,691 | | 114,743 | | 113,285 | | 118,357 | |
| | | | | | | | | | | |
Net premium earned | | 134,048 | | 117,192 | | 115,153 | | 115,247 | | 96,804 | |
Net investment income | | 10,538 | | 7,664 | | 6,458 | | 27,143 | | 24,829 | |
Net realized gain (loss) | | 817 | �� | 137 | | 307 | | (45,992 | ) | 3,205 | |
Other income, net | | 6,785 | | 6,744 | | 6,917 | | 6,147 | | 6,445 | |
Total revenue | | 152,188 | | 131,737 | | 128,835 | | 102,545 | | 131,283 | |
Net loss and loss adjustment expense | | 96,734 | | 70,943 | | 70,295 | | 80,435 | | 52,074 | |
Policy acquisition and other expense | | 58,008 | | 53,378 | | 52,333 | | 53,726 | | 42,397 | |
Interest expense | | 8,985 | | 8,971 | | 9,668 | | 10,528 | | 11,539 | |
Total expenses | | 163,728 | | 133,292 | | 132,296 | | 144,689 | | 106,010 | |
(Loss) Income from continuing operations before federal income tax expense | | (11,540 | ) | (1,555 | ) | (3,461 | ) | (42,144 | ) | 25,273 | |
Federal income taxes benefit (expense) for continuing operations | | 5,009 | | 1,007 | | 1,349 | | 19,559 | | (10,635 | ) |
Net (loss) income from continuing operations | | $ | (6,531 | ) | $ | (548 | ) | $ | (2,112 | ) | $ | (22,585 | ) | $ | 14,638 | |
Selected Balance Sheet Data: | | | | | | | | | | | |
Total investments | | 224,200 | | 148,965 | | 129,968 | | 138,568 | | 191,024 | |
Total assets | | 925,424 | | 939,641 | | 1,040,752 | | 1,048,770 | | 1,085,491 | |
Total liabilities | | 270,042 | | 286,586 | | 256,975 | | 257,315 | | 261,306 | |
Stockholders’ equity | | 655,382 | | 653,055 | | 783,777 | | 791,455 | | 824,185 | |
Other Data: | | | | | | | | | | | |
Net loss and LAE ratio | | 72.2 | % | 60.5 | % | 61.0 | % | 69.8 | % | 53.8 | % |
Expense ratio | | 34.0 | % | 36.0 | % | 35.7 | % | 35.6 | % | 29.2 | % |
GAAP Combined ratio | | 106.2 | % | 96.5 | % | 96.8 | % | 105.4 | % | 83.0 | % |
Statutory surplus | | $ | 118,708 | | $ | 119,297 | | $ | 117,063 | | $ | 108,478 | | $ | 124,892 | |
Statutory premiums to surplus ratio | | 119.4 | % | 102.0 | % | 98.0 | % | 104.4 | % | 94.8 | % |
Per Share Data: | | | | | | | | | | | |
Basic (loss) earnings per share attributable to common stockholders | | $ | (0.12 | ) | $ | (0.24 | ) | $ | (0.22 | ) | $ | (0.58 | ) | $ | 5.10 | |
Diluted (loss) earnings per share attributable to common stockholders | | $ | (0.12 | ) | $ | (0.24 | ) | $ | (0.22 | ) | $ | (0.58 | ) | $ | 5.02 | |
| | | | | | | | | | | |
Weighted average share information | | | | | | | | | | | |
Basic shares outstanding | | 56,499 | | 56,492 | | 56,474 | | 56,453 | | 55,421 | |
Diluted shares outstanding | | 56,511 | | 56,492 | | 56,474 | | 56,453 | | 56,326 | |
| | | | | | | | | | | |
Cash dividends declared per share of unit: | | | | | | | | | | | |
Series A preferred stock dividends | | $ | — | | $ | 1.24 | | $ | 2.06 | | $ | 2.06 | | $ | 2.06 | |
49
Table of Contents
| | 2012 | | 2011 | | 2010 | | 2009 | | 2008 | |
Statement of Operations Data: | | | | | | | | | | | |
Total interest income | | $ | 39,038 | | $ | 11,049 | | $ | 8,154 | | $ | 6,866 | | $ | 27,553 | |
Total interest expense | | 10,196 | | 8,985 | | 8,971 | | 9,668 | | 10,528 | |
Net interest income (loss) | | 28,842 | | 2,064 | | (817 | ) | (2,802 | ) | 17,025 | |
Provision for loan losses | | 3,800 | | — | | — | | — | | — | |
Net interest income (loss) after provision for loan losses | | 25,042 | | 2,064 | | (817 | ) | (2,802 | ) | 17,025 | |
Total noninterest income | | 224,232 | | 141,650 | | 124,073 | | 122,377 | | 75,402 | |
Total noninterest expense | | 255,517 | | 155,254 | | 124,811 | | 123,036 | | 134,571 | |
Loss before income taxes | | (6,243 | ) | (11,540 | ) | (1,555 | ) | (3,461 | ) | (42,144 | ) |
Income tax benefit | | (1,145 | ) | (5,009 | ) | (1,007 | ) | (1,349 | ) | (19,559 | ) |
Net loss | | (5,098 | ) | (6,531 | ) | (548 | ) | (2,112 | ) | (22,585 | ) |
Less: Net income attributable to noncontrolling interest | | 494 | | — | | — | | — | | — | |
Net loss attributable to Hilltop Holdings | | (5,592 | ) | (6,531 | ) | (548 | ) | (2,112 | ) | (22,585 | ) |
Dividends on preferred stock and other (1) | | 259 | | — | | 12,939 | | 10,313 | | 10,313 | |
Loss applicable to Hilltop Holdings common stockholders | | $ | (5,851 | ) | $ | (6,531 | ) | $ | (13,487 | ) | $ | (12,425 | ) | $ | (32,898 | ) |
| | | | | | | | | | | |
Per Share Data: | | | | | | | | | | | |
Net loss - basic | | $ | (0.10 | ) | $ | (0.12 | ) | $ | (0.24 | ) | $ | (0.22 | ) | $ | (0.58 | ) |
Weighted average shares outstanding - basic | | 58,754 | | 56,499 | | 56,492 | | 56,474 | | 56,453 | |
Net loss - diluted | | $ | (0.10 | ) | $ | (0.12 | ) | $ | (0.24 | ) | $ | (0.22 | ) | $ | (0.58 | ) |
Weighted average shares outstanding - diluted | | 58,754 | | 56,499 | | 56,492 | | 56,474 | | 56,453 | |
Book value per common share | | $ | 12.34 | | $ | 11.60 | | $ | 11.56 | | $ | 11.77 | | $ | 11.91 | |
Tangible book value per common share | | $ | 8.35 | | $ | 11.01 | | $ | 10.95 | | $ | 11.13 | | $ | 11.24 | |
| | | | | | | | | | | |
Balance Sheet Data: | | | | | | | | | | | |
Total assets | | $ | 7,286,865 | | $ | 925,425 | | $ | 939,641 | | $ | 1,040,752 | | $ | 1,048,770 | |
Cash and due from banks | | 720,741 | | 578,520 | | 649,439 | | 790,013 | | 767,876 | |
Securities | | 1,081,066 | | 224,200 | | 148,965 | | 129,968 | | 138,568 | |
Loans held for sale | | 1,399,944 | | — | | — | | — | | — | |
Loans, net of unearned income | | 3,152,396 | | — | | — | | — | | — | |
Allowance for loan losses | | (3,409 | ) | — | | — | | — | | — | |
Goodwill and other intangible assets, net | | 331,508 | | 33,062 | | 34,587 | | 36,229 | | 37,990 | |
Total deposits | | 4,700,461 | | — | | — | | — | | — | |
Notes payable | | 141,539 | | 131,450 | | 138,350 | | 138,350 | | 138,368 | |
Junior subordinated debentures | | 67,012 | | — | | — | | — | | — | |
Total stockholders’ equity | | 1,146,550 | | 655,383 | | 653,055 | | 783,777 | | 791,455 | |
| | | | | | | | | | | |
Performance Ratios (2): | | | | | | | | | | | |
Return on average stockholders’ equity | | -0.62 | % | | | | | | | | |
Return on average assets | | -0.08 | % | | | | | | | | |
Net interest margin (taxable equivalent) (3) | | 2.35 | % | | | | | | | | |
Efficiency ratio (4)(5) | | NM | | | | | | | | | |
| | | | | | | | | | | |
Asset Quality Ratios (2): | | | | | | | | | | | |
Total nonperforming assets to total loans and other real estate (5) | | NM | | | | | | | | | |
Allowance for loan losses to nonperforming loans (5) | | NM | | | | | | | | | |
Allowance for loan losses to total loans (5) | | NM | | | | | | | | | |
Net charge-offs to average loans outstanding (5) | | NM | | | | | | | | | |
| | | | | | | | | | | |
Capital Ratios: | | | | | | | | | | | |
Equity to assets ratio | | 15.73 | % | 70.82 | % | 69.50 | % | 75.31 | % | 75.47 | % |
Tangible common equity to tangible assets | | 10.02 | % | 69.74 | % | 68.33 | % | 62.56 | % | 62.76 | % |
| | | | | | | | | | | |
Regulatory Capital Ratios (2): | | | | | | | | | | | |
Hilltop - Leverage ratio (6) | | 13.08 | % | | | | | | | | |
Hilltop - Tier 1 risk-based capital ratio | | 17.72 | % | | | | | | | | |
Hilltop - Total risk-based capital ratio | | 17.81 | % | | | | | | | | |
Bank - Leverage ratio (6) | | 8.84 | % | | | | | | | | |
Bank - Tier 1 risk-based capital ratio | | 11.83 | % | | | | | | | | |
Bank - Total risk-based capital ratio | | 11.93 | % | | | | | | | | |
| | | | | | | | | | | |
Other Data (7): | | | | | | | | | | | |
Net loss and LAE ratio | | 74.4 | % | 72.2 | % | 60.5 | % | 61.0 | % | 69.8 | % |
Expense ratio | | 34.4 | % | 34.0 | % | 36.0 | % | 35.7 | % | 35.6 | % |
GAAP combined ratio | | 108.8 | % | 106.2 | % | 96.5 | % | 96.8 | % | 105.4 | % |
Statutory surplus (8) | | $ | 120,319 | | $ | 118,708 | | $ | 119,297 | | $ | 117,063 | | $ | 108,478 | |
Statutory premiums to surplus ratio | | 125.0 | % | 119.4 | % | 102.0 | % | 98.0 | % | 104.4 | % |
(1)Series A preferred stock was redeemed in September 2010. (2)All years have been adjusted to reflect the disposal of our manufactured home community properties and related business, except for NLASCO.
(3)Statutory surplus includes combined surplus of NLIC and ASIC.
| Series A preferred stock was redeemed in September 2010. |
| |
(2) | Noted measures are typically used for measuring the performance of banking and financial institutions. Our operations prior to the acquisition of PlainsCapital are limited to our insurance operations. Therefore, noted measures for periods prior to 2012 are not a useful measure and have been excluded. |
| |
(3) | Taxable equivalent net interest income divided by average interest-earning assets. |
| |
(4) | Noninterest expenses divided by the sum of total noninterest income and net interest income for the year. |
| |
(5) | Noted measures are typically used for measuring the performance of banking and financial institutions. Our operations prior to the acquisition of PlainsCapital are limited to our insurance operations. Additionally, noted measure is not meaningful (“NM”) in 2012. |
| |
(6) | Ratio was calculated using the average assets for the month of December. |
| |
(7) | Only considers operations of insurance segment. |
| |
(8) | Statutory surplus includes combined surplus of NLIC and ASIC. |
4350
Table of Contents
ITEMGAAP Reconciliation and Management’s Explanation of Non-GAAP Financial Measures
We present two measures in our selected financial data that are not measures of financial performance recognized by GAAP.
“Tangible book value per common share” is defined as our total stockholders’ equity, excluding preferred stock, reduced by goodwill and other intangible assets, divided by total common shares outstanding. “Tangible common stockholders’ equity to tangible assets” is defined as our total stockholders’ equity, excluding preferred stock, reduced by goodwill and other intangible assets divided by total assets reduced by goodwill and other intangible assets.
These measures are important to investors interested in changes from period to period in tangible common equity per share exclusive of changes in intangible assets. For companies such as ours that have engaged in business combinations, purchase accounting can result in the recording of significant amounts of goodwill and other intangible assets related to those transactions.
You should not view this disclosure as a substitute for results determined in accordance with GAAP, and our disclosure is not necessarily comparable to that of other companies that use non-GAAP measures. The following table reconciles these non-GAAP financial measures to the most comparable GAAP financial measures, “book value per common share” and “Hilltop Holdings stockholders’ equity to total assets” (in thousands, except per share data).
| | December 31, | |
| | 2012 | | 2011 | | 2010 | | 2009 | | 2008 | |
| | | | | | | | | | | |
Book value per common share | | $ | 12.34 | | $ | 11.60 | | $ | 11.56 | | $ | 11.77 | | $ | 11.91 | |
Effect of goodwill and intangible assets per share | | $ | (3.99 | ) | $ | (0.59 | ) | $ | (0.61 | ) | $ | (0.64 | ) | $ | (0.67 | ) |
Tangible book value per common share | | $ | 8.35 | | $ | 11.01 | | $ | 10.95 | | $ | 11.13 | | $ | 11.24 | |
| | | | | | | | | | | |
Hilltop Holdings stockholders’ equity | | $ | 1,144,496 | | $ | 655,383 | | $ | 653,055 | | $ | 783,777 | | $ | 791,455 | |
Less: preferred stock | | 114,068 | | — | | — | | 119,108 | | 119,108 | |
Less: goodwill and intangible assets, net | | 331,508 | | 33,062 | | 34,587 | | 36,229 | | 37,990 | |
Tangible common equity | | 698,920 | | 622,321 | | 618,468 | | 628,440 | | 634,357 | |
| | | | | | | | | | | |
Total assets | | 7,286,865 | | 925,425 | | 939,641 | | 1,040,752 | | 1,048,770 | |
Less: goodwill and intangible assets, net | | 331,508 | | 33,062 | | 34,587 | | 36,229 | | 37,990 | |
Tangible assets | | 6,955,357 | | 892,363 | | 905,054 | | 1,004,523 | | 1,010,780 | |
| | | | | | | | | | | |
Equity to assets | | 15.71 | % | 70.82 | % | 69.50 | % | 75.31 | % | 75.47 | % |
Tangible common equity to tangible assets | | 10.05 | % | 69.74 | % | 68.33 | % | 62.56 | % | 62.76 | % |
Item 7. MANAGEMENT’S DISCUSSION AND ANALYSIS OF FINANCIAL CONDITION AND RESULTS OF OPERATIONSManagement’s Discussion and Analysis of Financial Condition and Results of Operations.
The following discussion is intended to help the reader understand our results of operations and financial condition and is provided as a supplement to, and should be read in conjunction with, theour audited consolidated historical financial statements and the accompanying notes appearingthereto commencing on page F-1. In addition to historical financial information, the following discussion and analysis contains forward-looking statements that involve risks, uncertainties and assumptions. Our results and the timing of selected events may differ materially from those anticipated in these forward-looking statements as a result of many factors, including those discussed under “Item 1A. Risk Factors” and elsewhere in this Form 10-K and the financial information set forth in the tables below.Annual Report. See “Forward-Looking Statements.” All dollar amounts in the following discussion are in thousands, except per share amounts.
Unless the context otherwise indicates, all references in this Management’s Discussion and Analysis of Financial Condition and Results of Operations, or MD&A, to the “Company,”“Hilltop, “Hilltop,” “HTH,” “we,” “us,” “our” or “ours” or similar words are to Hilltop Holdings Inc.(formerly known as Affordable Residential Communities Inc.) and its direct and indirect wholly-ownedwholly owned subsidiaries , references to “PlainsCapital” refer to PlainsCapital Corporation (a wholly owned subsidiary of Hilltop), references to the “Bank” refer to PlainsCapital Bank (a wholly owned subsidiary of PlainsCapital), references to “First Southwest” refer to First Southwest Holdings, LLC (a wholly owned subsidiary of the Bank) and its subsidiaries as a whole, references to “FSC” refer to First Southwest Company (a wholly owned subsidiary of First Southwest), references to “PrimeLending” refer to PrimeLending, a PlainsCapital Company (a wholly owned subsidiary of the Bank) and its subsidiaries as a whole and references to “NLASCO” refer to NLASCO, Inc. (a wholly owned subsidiary of Hilltop Holdings Inc.) and its subsidiaries as a whole.
.51
Table of Contents
OUR GENERAL STRUCTURE
At December 31, 2011, HTH is a holding company that owns all of the outstanding shares of NLASCO, Inc., or NLASCO. NLASCO, in turn, owns National Lloyds Insurance Company, or NLIC,and American Summit Insurance Company, or ASIC, both of which are licensed property and casualty insurers operating in multiple states. In addition, NLASCO also owns the NALICO GA, a general agency that operates in Texas. NLIC commenced business in 1949 and currently operates in 15 states, with its largest market being the state of Texas. NLIC carries a financial strength rating of “A” (Excellent) by A.M. Best. ASIC was formed in 1955 and currently operates in 13 states, its largest market being the state of Arizona. ASIC carries a financial strength rating of “A” (Excellent) by A.M. Best. Both of these companies are regulated by the Texas Department of Insurance.
Beginning in 1995, we were founded as several companies under the name “Affordable Residential Communities” or “ARC,” now known as Hilltop Holdings Inc., for the purpose of engaging in the business of acquiring, renovating, repositioning and operating manufactured home communities, as well as certain related businesses. In 1998 we formed a Maryland corporation for the purpose of acting as the investment vehicle for, and a co-general partner of, our operating partnership, HTH Operating Partnership LP, formerly known as Affordable Residential Communities LP. In May 2002, we completed a reorganization in which we acquired substantially all the other real property partnerships and other related businesses we had previously organized and operated.
Through the year ended December 31, 2005, we were organized as a fully-integrated, self-administered and self-managed equity real estate investment trust, or REIT, for U.S. Federal income tax purposes. In 2006, we revoked our election as a REIT for U. S. Federal income tax purposes.
In January 2007, we acquired NLASCO. NLASCO, in turn, owns National Lloyds Insurance Company, or NLIC,and American Summit Insurance Company, or ASIC, both of which are licensed property and casualty insurers operating in multiple states. In addition, NLASCO also owns the NALICO GA, a general agency that operates in Texas. NLIC commenced business in 1949 and currently operates in 14 states, with its largest market being the state of Texas. NLIC carries a financial strength rating of “A” (Excellent) by A.M. Best. ASIC was incorporatedformed in Delaware1955 and currently operates in 2000 but13 states, its origins trace back to 1948 through onelargest market being the state of its subsidiaries, NLIC. In 1964, C. Clifton Robinson, who is currentlyArizona. ASIC carries a financial strength rating of “A” (Excellent) by A.M. Best. Both of these companies are regulated by the ChairmanTexas Department of NLASCO and a member of our Board of Directors, along with other investors, purchased NLIC and moved its headquarters from San Antonio, Texas to Waco, Texas. Following various acquisitions and dispositions of equity in NLIC by Mr. Robinson and others, including the re-acquisition of NLIC along with the acquisition of ASIC in 2000, Mr. Robinson held 100% of NLASCO and its subsidiaries, NLIC and ASIC, from 2001 until we acquired NLASCO in 2007.Insurance.
On July 31, 2007, we sold substantially all of the operating assets used in our manufactured home communities business and our retail sales and financing business to American Residential Communities LLC. We received gross proceeds of approximately $890 million in cash, which represents the aggregate purchase price of $1.794$1.8 billion, less the indebtedness assumed by the buyer. After giving effect to expenses, taxes and our continued outstanding preferred stock and senior notes, our net cash balance was approximately $550 million. We used
In connection with our strategy to make acquisitions or effect business combinations, on May 8, 2012 we entered into a portiondefinitive agreement and plan of merger with PlainsCapital Corporation, a diversified financial institution which provides an array of financial products and services through its business and consumer banking, lending and financial advisory subsidiaries. On November 30, 2012, concurrent with the consummation of the proceeds from this transaction for general working capital, liquidationMerger, we became a financial holding company registered under the Bank Holding Company Act of our operating partnership units and to repay certain outstanding obligations. We intend to make opportunistic acquisitions with certain1956, as amended by the Gramm-Leach-Bliley Act of the remaining proceeds from this transaction, and, if necessary or appropriate, from additional equity or debt financing sources.
44
Table of Contents1999.
DEVELOPMENTS DURING 2011
We extended a senior unsecured loan to SWS Group, Inc .OVERVIEW
On July, 29, 2011,November 30, 2012, Hilltop acquired PlainsCapital Corporation in a stock and cash transaction, whereby PlainsCapital Corporation merged with and into Meadow Corporation, a wholly owned subsidiary of Hilltop Holdings Inc., with Meadow Corporation continuing as the Company extended SWS Group, Inc., or SWS, a $50surviving entity under the name “PlainsCapital Corporation” (the “Merger”). Based on Hilltop’s closing stock price on November 30, 2012, the total purchase price was $813.5 million, term loan, which bears interest at 8% per annum, is prepayable by SWS subject to certain conditions after three years, and has a maturityconsisting of five years. SWS issued us a warrant to purchase 8,695,65227.1 million shares of SWS common stock, $0.10 par$311.8 million in cash and the issuance of 114,068 shares of Series B Preferred Stock. The fair market value per share, exercisable at a price of $5.75 per share subject to anti-dillution adjustments.assets acquired, excluding goodwill, totaled $6.5 billion, including $3.2 billion of loans, $730.8 million of investment securities and $70.7 million of identifiable intangibles. The fair market value of the liabilities assumed was $5.9 billion, including $4.5 billion of deposits.
We had an extension to our loan agreement.
On October 27, 2011, NLASCO renewed its lineAs a result of credit with a financial institution. The line allows for borrowings by NLASCO up to $5.0 million and is secured by substantially allthe Merger, the operating results of NLASCO’s assets. The line of credit bears interest equal to a base rate, plus 3.75% (5.01% at December 31, 2011), which is due quarterly. This line of credit will expire in October 2012. As of December 31, 2011, there was no outstanding balance on the note.
OVERVIEW OF RESULTS
For the year ended December 31, 2011, net loss attributable to common stockholders was $6.5 million, or $0.12 per share, as compared to a net loss attributable to common stockholders of $13.5 million, or $0.24 per share,Hilltop for the year ended December 31, 2010,2012 include the results from the operations acquired in the PlainsCapital Corporation transaction since December 1, 2012. Accordingly, our operating results and financial condition will not be comparable between 2012 and prior years. Additionally, the presentation of Hilltop’s historical consolidated financial statements have been modified and certain items have been reclassified to conform to 2012 presentation which is more consistent with that of a net loss attributablefinancial institution that provides an array of financial products and services. Prior to common stockholders of $12.4 million, or $0.22 per share, for the year ended December 31, 2009.
Segments
NLASCO operates through its wholly-owned subsidiaries, NLIC and ASIC. Given the homogenous nature of our products, the regulatory environments in which we operate, the nature of our customers and our distribution channels, we now monitor, control and manage our business lines as an integrated entity offeringMerger with PlainsCapital Corporation, Hilltop’s primary operations were to provide fire and homeowners insurance to low value dwellings and manufactured homes primarily in Texas and other areas of the south, southeastern and southwestern United States. Accordingly, we only have insurance company segment information to disclose.
At December 31, 2012, on a consolidated basis, we had total assets of $7.3 billion, total deposits of $4.7 billion, total loans, including loans held for sale, of $4.6 billion and stockholders’ equity of $1.1 billion. The Bank, one of our wholly owned subsidiaries, provides a broad array of financial products and services, including commercial banking, personal banking, wealth management and treasury management, from offices located throughout central, north and west Texas. In addition to
CRITICAL ACCOUNTING POLICIES AND ESTIMATES52
Table of Contents
the Bank, we have various subsidiaries with specialized areas of expertise that also offer an array of financial products and services such as mortgage origination, insurance and financial advisory services.
Historically, we have derived our revenue from a single insurance segment. The Merger with PlainsCapital Corporation on November 30, 2012 has resulted in an increase to four reportable segments that are organized primarily by the core products offered to the segments’ respective customers. We anticipate that future revenues will be driven primarily from the banking and mortgage origination segments, with the remainder being generated by our insurance and financial advisory segments. Based on historical results of PlainsCapital Corporation, the relative share of total revenue provided by our banking and mortgage origination segments fluctuates depending on market conditions, and operating results for the mortgage origination segment tend to be more volatile than operating results for the banking segment.
The banking segment includes the operations of the Bank. The banking segment primarily provides business banking and personal banking products and services and generates revenue from its portfolio of earning assets. The Bank’s results of operations are primarily dependent on net interest income, while also deriving revenue from other sources, including service charges on customer deposit accounts and trust fees. The operations of PrimeLending comprise the mortgage origination segment, which offers a variety of loan products from offices in 42 states and generates revenue predominantly from fees charged on the origination of loans and from selling these loans in the secondary market. The insurance segment includes the operations of NLASCO, which operates through its wholly owned subsidiaries, National Lloyds Insurance Company, (“NLIC”), and American Summit Insurance Company, (“ASIC”). Insurance segment revenues are primarily generated from net insurance premiums earned, less loss and loss adjustment expenses (“LAE”) and policy acquisition and other underwriting expenses in Texas and other areas of the south, southeastern and southwestern United States. The financial advisory segment generates a majority of its revenues from fees and commissions earned from investment advisory and securities brokerage services at First Southwest. The principal subsidiaries of First Southwest are FSC, a broker-dealer registered with the Securities and Exchange Commission and Financial Industry Regulatory Authority, and First Southwest Asset Management, Inc., a registered investment advisor under the Investment Advisors Act of 1940. Additional information concerning our reportable segments is presented in Note 27, Segment and Related Information, in the notes to our consolidated financial statements.
We have preparedgenerate revenue from net interest income and from noninterest income. Net interest income represents the difference between the income earned on our consolidated financial statementsassets, including our loans and investment securities, and our cost of funds, including the interest paid on the deposits and borrowings that are used to support our assets. Net interest income is a significant contributor to our operating results. Fluctuations in accordanceinterest rates, as well as the amounts and types of interest-earning assets and interest-bearing liabilities we hold, affect net interest income. We generated $28.8 million in net interest income during the year ended December 31, 2012, compared with accounting principles generally acceptednet interest income of $2.1 million in 2011 and net interest expense of $0.8 million in 2010. The significant increase in net interest income during 2012 was primarily due to $25.0 million in net interest income for the month ended December 31, 2012 from our banking segment that we acquired as a part of the Merger.
The other component of our revenue is noninterest income, which is primarily comprised of the following:
(i)Net gains from sale of loans and mortgage loan origination fees. Through our wholly owned subsidiary, PrimeLending, we generate noninterest income by originating and selling mortgage loans. During the month ended December 31, 2012, we generated $57.6 million in net gains from sale of loans and mortgage loan origination fees.
(ii)Investment advisory fees and commissions and securities brokerage fees and commissions. Through our wholly owned subsidiary, First Southwest, we provide public finance advisory and various investment banking and brokerage services. We generated $11.2 million in investment advisory fees and commissions and securities brokerage fees and commissions during the month ended December 31, 2012.
(iii)Net insurance premiums earned. Through our wholly owned insurance subsidiary, NLASCO, we provide fire and limited homeowners insurance for low value dwellings and manufactured homes. We generated $146.7 million, $134.0 million and $117.2 million in net insurance premiums earned during the years ended December 31, 2012, 2011 and 2010, respectively.
In the aggregate, we generated $224.2 million, $141.7 million and $124.1 million in noninterest income during the years ended December 31, 2012, 2011 and 2010, respectively. The significant increase in noninterest income during 2012 was primarily due to the mortgage operations that we acquired as a part of the Merger.
53
Table of Contents
We also incur noninterest expenses in the United Statesoperation of America,our businesses. Our businesses engage in labor intensive activities and, consequently, employees’ compensation and benefits represent the majority of our noninterest expenses.
Operating Results
The net loss applicable to common stockholders for the year ended December 31, 2012 was $5.9 million, or GAAP, which requires us$0.10 per diluted share, compared to make certain estimatesnet losses applicable to common stockholders of $6.5 million, or $0.12 per diluted share, for the year ended December 31, 2011, and assumptions that affect$13.5 million, or $0.24 per diluted share, for the recorded amountyear ended December 31, 2010. As a result of the Merger on November 30, 2012, the net income of PlainsCapital for the month ended December 31, 2012 is included in the operating results of Hilltop for the year ended December 31, 2012.
Certain items included in net loss for 2012 resulted from purchase accounting, compensation expense related to retention agreements with two PlainsCapital executive officers and specific merger related expenses associated with the PlainsCapital transaction. The pre-tax effects of these items include net accretion on acquired earning assets and liabilities atof $6.1 million, amortization of identifiable intangibles of $0.8 million, compensation expense of $8.9 million and the datespecific merger related expenses of $6.6 million. The after tax impact of these items was to increase the net loss by $7.7 million.
Our insurance segment’s underwriting gain or loss consists of net insurance premiums earned, less loss, LAE and policy acquisition and other underwriting expenses. Underwriting performance is one of the most important factors in evaluating the overall results of our insurance operations given the fluctuations that can occur in loss and LAE due to weather related events, as well as the uncertainties involved in the process of estimating reserves for losses and LAE. The underwriting results and fluctuations in other noninterest income and expense line items specific to our insurance operations are discussed in greater detail below. The following table shows the underwriting gain or loss, as well as other income and expense line items specific to the financial results of NLASCO (in thousands).
Summary of Insurance Operations
| | Year Ended December 31, | | Variance | |
| | 2012 | | 2011 | | 2010 | | 2012 vs 2011 | | 2011 vs 2010 | |
Underwriting gain (loss): | | | | | | | | | | | |
Homeowners | | $ | (9,137 | ) | $ | (123 | ) | $ | (2,564 | ) | $ | (9,014 | ) | $ | 2,441 | |
Fire | | (4,517 | ) | (2,057 | ) | 1,844 | | (2,460 | ) | (3,901 | ) |
Mobile Home | | (1,637 | ) | (5,811 | ) | 845 | | 4,174 | | (6,656 | ) |
Commercial | | 60 | | (2,305 | ) | 1,779 | | 2,365 | | (4,084 | ) |
Other | | 187 | | 185 | | 188 | | 2 | | (3 | ) |
Total underwriting loss | | $ | (15,044 | ) | $ | (10,111 | ) | $ | 2,092 | | $ | (4,933 | ) | $ | (12,203 | ) |
| | | | | | | | | | | |
Other revenue (expense) items: | | | | | | | | | | | |
Net investment income | | 6,308 | | 6,306 | | 5,873 | | 2 | | 433 | |
Net realized gains on investments | | 112 | | 817 | | 137 | | (705 | ) | 680 | |
Other income | | 7,334 | | 6,785 | | 6,744 | | 549 | | 41 | |
Depreciation and amortization | | (1,361 | ) | (1,714 | ) | (1,788 | ) | 353 | | 74 | |
Interest expense | | (2,057 | ) | (1,904 | ) | (1,961 | ) | (153 | ) | 57 | |
Total other revenue (expense) items | | 10,336 | | 10,290 | | 9,005 | | 46 | | 1,285 | |
Operating income (loss) before federal income taxes | | (4,708 | ) | 179 | | 11,097 | | (4,887 | ) | (10,918 | ) |
Federal income tax expense (benefit) on operating income (loss) | | (2,385 | ) | 129 | | 3,934 | | (2,514 | ) | (3,805 | ) |
Net income (loss) from continuing operations of NLASCO | | $ | (2,323 | ) | $ | 50 | | $ | 7,163 | | $ | (2,373 | ) | $ | (7,113 | ) |
54
Table of Contents
The insurance segment’s underwriting gain or loss consists of net insurance premiums earned, less loss, LAE and policy acquisition and other underwriting expenses. As presented in this exhibit, policy acquisition and other underwriting expenses encompass all expenses incurred relative to insurance segment operations, and include elements of multiple categories of expense otherwise reported as noninterest expense in the consolidated statements of operations. The insurance underwriting results are presented in the table below (in thousands).
| | Year Ended December 31, | | Variance | |
| | 2012 | | 2011 | | 2010 | | 2012 vs 2011 | | 2011 vs 2010 | |
Direct insurance premiums written | | $ | 163,780 | | $ | 155,054 | | $ | 139,290 | | $ | 8,726 | | $ | 15,764 | |
Net insurance premiums written | | $ | 150,451 | | $ | 141,737 | | $ | 121,691 | | $ | 8,714 | | $ | 20,046 | |
| | | | | | | | | | | |
Net insurance premiums earned | | $ | 146,701 | | $ | 134,048 | | $ | 117,192 | | $ | 12,653 | | $ | 16,856 | |
Loss and LAE | | 109,159 | | 96,734 | | 70,943 | | 12,425 | | 25,791 | |
Policy acquisition and other underwriting expenses | | 52,586 | | 47,425 | | 44,157 | | 5,161 | | 3,268 | |
Underwriting income (loss) | | $ | (15,044 | ) | $ | (10,111 | ) | $ | 2,092 | | $ | (4,933 | ) | $ | (12,203 | ) |
| | | | | | | | | | | |
Agency expenses | | $ | (2,073 | ) | $ | (1,789 | ) | $ | (1,966 | ) | $ | (284 | ) | $ | 177 | |
Loss and LAE ratio | | 74.4 | % | 72.2 | % | 60.5 | % | 2.2 | % | 11.7 | % |
Policy acquisition and other underwriting less agency expense ratio | | 34.4 | % | 34.0 | % | 36.0 | % | 0.4 | % | -2.0 | % |
Combined ratio | | 108.8 | % | 106.2 | % | 96.5 | % | 2.6 | % | 9.7 | % |
The loss and LAE ratio is loss and LAE divided by net insurance premiums earned for the same period. The underwriting expense ratio is policy acquisition and other underwriting expense less agency expenses,divided by net insurance premiums earned for the same period. The combined ratio is the sum of the loss and LAE ratio and the reported amountunderwriting expense ratio.
Loss and LAE increased $12.4 million for the year ended December 31, 2012, as compared to the same period in 2011. This increase is primarily due to the increased frequency and severity of revenuescurrent accident year wind and expenseshail losses. Wind and hail losses increased $12.8 million during the reporting period. Actual results may differyear ended December 31, 2012 as compared to the same period in 2011. Net insurance premiums earned increased 9.4% in the year ended December 31, 2012, as compared to the same period in 2011, due to an $8.7 million increase in volume of written premiums over the last twelve months. Loss and LAE expenses increased 12.8% in the year ended December 31, 2012, as compared to 2011, due to higher incurred losses associated with wind and hail storms that occurred in Texas and Oklahoma and additional losses associated with a 9.4% increase in earned premiums. Policy acquisition and other underwriting expenses increased 10.9% for the year ended December 31, 2012, as compared to 2011, primarily due to increased direct written premiums.
The Company seeks to generate underwriting profitability. Management evaluates NLASCO’s loss and LAE ratio by bifurcating the losses to derive catastrophic and non-catastrophic loss ratios. The non-catastrophic loss ratio excludes Property Claims Services events that exceed $1.0 million of losses to NLASCO. Catastrophic events, including those that do not exceed our reinsurance retention, affect the Company’s loss ratios. For the year ended December 31, 2012, catastrophic events that did not exceed our reinsurance retention accounted for $23.3 million of the total loss and loss adjustment expense, as compared to $20.3 million and $12.3 million for the same periods in 2011 and 2010, respectively. Excluding catastrophic events, our combined ratios for the year ended December 31, 2012, 2011 and 2010 would have been 93.0%, 91.0% and 86.0%, respectively.
For the year ended December 31, 2012, the Company had net unfavorable development in losses related to two 2008 catastrophes, Hurricane Ike and Hurricane Dolly. The Company also incurred losses in 2012 related to a catastrophic wind and hail storm in Arizona from October of 2010. Gross losses incurred from these estimates. Weprior storms was $0.8 million for the year ended December 31, 2012, compared to favorable development of $7.0 million for the same period in 2011. These losses have providedno effect on net loss and LAE incurred because the catastrophic events exceeded our retention and are fully recoverable. In 2012, NLIC incurred an $8.3 million loss from a summary of our significant accounting policies in Note 1Texas hail storm. The $8 million retention for catastrophic losses applied to the accompanying consolidatedTexas hailstorm, and affected 2012 loss and LAE. The primary financial statementseffect beyond the reinsurance retention is additional reinstatement premium payable to the affected reinsurers. For the year ended December 31, 2012 and 2011, the Company recorded reinstatement premiums of $0.5 million and $0.1 million, respectively.
Our combined ratio for the year ended December 31, 2012 is 108.8%, as compared to 106.2% and 96.5% for the same periods in 2011 and 2010, respectively. The 2.6% increase in combined ratio from 2011 to 2012 is primarily due to the 2.2% increase in loss and LAE ratio for the year ended December 31, 2012. Net insurance premiums earned increased 9.4% in the year ended December 31, 2012, as compared to the same period in 2011, due to an $8.7 million increase in the volume of written premiums over the last 12 months. Loss and LAE expenses increased 12.8% in the year ended December 31, 2012, as compared to 2011, due to higher incurred losses associated with wind and hail losses and storms that occurred
55
Table of Contents
in Texas and additional losses associated with a 9.4% increase in earned premiums. Policy acquisition and other underwriting expenses increased 10.9% for the twelve months ended December 31, 2012, as compared to 2011, which is a result of increased direct written premiums in Texas and the write-off of the policy administration system.
The 9.7% increase in combined ratio in 2011 compared to 2010, was primarily due to the 11.7% increase in loss and LAE ratio for the year ended December 31, 2011. Loss and LAE expenses increased 36.4% in 2011, as compared to 2010, due to higher incurred losses associated with wind and hail storms in Texas and additional losses associated with a 14.4% increase in earned premiums. Texas typically experiences seasonal tornado and hail storms; however, NLASCO suffered a dramatic increase in losses from five storms in April and May 2011 that created $19.3 million in incurred losses. Additionally, there were fifteen days of widely dispersed, exceptional weather related losses experienced during the three months ended June 30, 2011, which resulted in losses of $8.1 million. NLASCO also experienced an increase in the frequency and severity of fire losses, which resulted in $7.1 million in incurred losses above prior year. Policy acquisition and other underwriting expenses increased 7.4% for the year ended December 31, 2011, as compared to 2010, which is a direct result of an 11.3% increase in direct written premiums.
Net Interest Income
On a consolidated basis, net interest income increased $26.8 million in 2012 compared with 2011 primarily due to the PlainsCapital acquisition on November 30, 2012. Net interest income increased $2.9 million in 2011 compared with 2010, primarily due to higher investment income at the parent of $2.5 million and $0.4 million within our insurance segment.
The taxable equivalent net interest margin for the banking segment was 5.83% for the month of December 2012. The taxable equivalent net interest margin was impacted by accretion of discount on loans of $6.3 million, amortization of premium on acquired securities of $0.7 million and amortization of premium on acquired time deposits of $0.4 million. As a result of these items, the taxable equivalent interest margin increased by 140 basis points.
We have summarizedconsider our banking segment to be the primary generator of our net interest income. The banking segment provides business banking and personal banking products and services and generates revenue from its portfolio of interest earning assets. The banking segment’s results are primarily dependent on net interest income.
56
Table of Contents
The table below those accounting policies that requireprovides additional details regarding our most difficult, subjective or complex judgments and that havebanking segment’s net interest income for the most significant impact on our financial condition and results of operations. Our management evaluates these estimates on an ongoing basis. These estimatesmonth ended December 31, 2012 (dollars in thousands).
| | Month Ended | |
| | December 31, 2012 | |
| | | | Interest | | | |
| | Average | | Earned or | | Yield or | |
| | Balance | | Paid | | Rate | |
Assets | | | | | | | |
Interest-earning assets | | | | | | | |
Loans, gross (1) | | $ | 4,148,317 | | $ | 25,212 | | 7.29 | % |
Investment securities - taxable | | 494,285 | | 444 | | 1.08 | % |
Investment securities - non-taxable (2) | | 175,850 | | 479 | | 3.27 | % |
Federal funds sold and securities purchased under agreements to resell | | 33,180 | | 48 | | 1.74 | % |
Interest-bearing deposits in other financial institutions | | 299,464 | | 68 | | 0.27 | % |
Other | | 33,594 | | 57 | | 2.04 | % |
Interest-earning assets, gross | | 5,184,690 | | 26,308 | | 6.09 | % |
Allowance for loan losses | | 248 | | | | | |
Interest-earning assets, net | | 5,184,938 | | | | | |
Noninterest-earning assets | | 814,461 | | | | | |
Total assets | | $ | 5,999,399 | | | | | |
| | | | | | | |
Liabilities and Stockholders’ Equity | | | | | | | |
Interest-bearing liabilities | | | | | | | |
Interest-bearing deposits | | $ | 4,267,736 | | $ | 1,009 | | 0.28 | % |
Notes payable and other borrowings | | 560,572 | | 123 | | 0.26 | % |
Total interest-bearing liabilities (3) | | 4,828,308 | | 1,132 | | 0.28 | % |
Noninterest-bearing liabilities | | | | | | | |
Noninterest-bearing deposits | | 289,871 | | | | | |
Other liabilities | | 58,492 | | | | | |
Total liabilities | | 5,176,671 | | | | | |
Stockholders’ equity | | 822,728 | | | | | |
Total liabilities and stockholders’ equity | | $ | 5,999,399 | | | | | |
| | | | | | | |
Net interest income (2) | | | | $ | 25,176 | | | |
Net interest spread (2) | | | | | | 5.81 | % |
Net interest margin (2) | | | | | | 5.83 | % |
(1) Average loans include non-accrual loans.
(2) Taxable equivalent adjustments are based on information currently availablea 35% tax rate. The adjustment to managementinterest income was $0.2 million at December 31, 2012.
(3) Excludes the allocation of interest expense on PlainsCapital Corporation debt totaling $0.1 million at December 31, 2012.
Our consolidated net interest margin includes the yields and on variouscosts associated with certain items within interest-earning assets and interest-bearing liabilities in the financial advisory segment, as well as the borrowing costs of Hilltop at the holding company level, both of which reduce our consolidated net interest margin.
The insurance segment contributed $4.7 million of net interest income for the year ended December 31, 2012, compared to $4.9 million for the same period in 2011.
The financial advisory segment had net interest income of $1.2 million during the month ended December 31, 2012, consisting of securities lending activity, customer margin loan balances and investment securities used to support sales, underwriting, and other assumptions management believes are reasonable.customer activities.
4557
Table of Contents
Noninterest Income
Noninterest income was $224.2 million in 2012 compared with $141.7 million in 2011, an increase of $82.6 million. Noninterest income increased by $17.6 million in 2011, from $124.1 million in 2010. The increase in 2012 was primarily due to the acquisition of PlainsCapital and the inclusion of $68.5 million in noninterest income related to activities within its mortgage origination and financial advisory segments, while the increase from 2010 to 2011 related to growth in net insurance premiums earned within our insurance segment.
Our insurance segment had net insurance premiums earned of $146.7 million in 2012, compared to $134.0 million for 2011. The higher volume of earned premiums of $12.7 million is primarily attributable to our marketing efforts directed at homeowners products, offset by an increase in the cost of catastrophe reinsurance. Net realized gains decreased $0.7 million during the year ended December 31, 2012 due to decreased levels of securities sales. Other income was $8.6 million for the year ended December 31, 2012, as compared to $6.8 million for the same period in 2011.
Direct insurance premiums written by major product line are presented in the table below (in thousands).
| | Year Ended December 31, | | Variance | |
| | 2012 | | 2011 | | 2010 | | 2012 vs 2011 | | 2011 vs 2010 | |
Direct Insurance Premiums Written: | | | | | | | | | | | |
Homeowners | | $ | 73,943 | | $ | 70,177 | | $ | 63,413 | | $ | 3,766 | | $ | 6,764 | |
Fire | | 51,345 | | 49,812 | | 45,637 | | 1,533 | | 4,175 | |
Mobile Home | | 30,123 | | 26,353 | | 22,344 | | 3,770 | | 4,009 | |
Commercial | | 8,043 | | 8,380 | | 7,537 | | (337 | ) | 843 | |
Other | | 326 | | 332 | | 359 | | (6 | ) | (27 | ) |
| | $ | 163,780 | | $ | 155,054 | | $ | 139,290 | | $ | 8,726 | | $ | 15,764 | |
Total direct insurance premiums written increased for the years ended December 31, 2012 and 2011, for our three largest insurance product lines, due to expanded distribution of insurance products and growth on existing insurance products. Higher value homeowners and commercial insurance products generated $1.6 million in direct written premiums for the year ended December 31, 2012, while new products generated $9.0 million in direct written premiums in 2011. Direct insurance premiums written in Texas, Oklahoma, Georgia, Arizona and Tennessee increased $6.7 million on existing products in the year ended December 31, 2012, as compared to the same period in 2011. Similarly, our existing products in these same states grew by $6.8 million in the year ended December 31, 2011, as compared to the same period in 2010.
Net insurance premiums written by major product line are presented in the table below (in thousands).
| | Year Ended December 31, | | Variance | |
| | 2012 | | 2011 | | 2010 | | 2012 vs 2011 | | 2011 vs 2010 | |
Net Insurance Premiums Written: | | | | | | | | | | | |
Homeowners | | $ | 67,926 | | $ | 64,150 | | $ | 55,401 | | $ | 3,776 | | $ | 8,749 | |
Fire | | 47,166 | | 45,534 | | 39,871 | | 1,632 | | 5,663 | |
Mobile Home | | 27,672 | | 24,090 | | 19,521 | | 3,582 | | 4,569 | |
Commercial | | 7,388 | | 7,660 | | 6,585 | | (272 | ) | 1,075 | |
Other | | 299 | | 303 | | 313 | | (4 | ) | (10 | ) |
| | $ | 150,451 | | $ | 141,737 | | $ | 121,691 | | $ | 8,714 | | $ | 20,046 | |
Total net insurance premiums written increased for the year ended December 31, 2012 for our three largest insurance product lines of business due to higher direct written premiums of $8.7 million and increases of $1.0 million in both assumed and ceded premiums in 2012. In 2011, total net insurance premiums written increased for our largest insurance product lines due to higher direct written premiums of $15.8 million and a decrease in ceded premiums of $4.0 million. Ceded premiums increased primarily as a result of higher reinstatement premiums and increased reinsurance costs due to higher gross premiums written.
58
Table of Contents
Net insurance premiums earned by major product line are presented in the table below (in thousands).
| | Year Ended December 31, | | Variance | |
| | 2012 | | 2011 | | 2010 | | 2012 vs 2011 | | 2011 vs 2010 | |
Net Insurance Premiums Earned: | | | | | | | | | | | |
Homeowners | | $ | 66,233 | | $ | 60,671 | | $ | 53,353 | | $ | 5,562 | | $ | 7,318 | |
Fire | | 45,990 | | 43,063 | | 38,397 | | 2,927 | | 4,666 | |
Mobile Home | | 26,982 | | 22,783 | | 18,799 | | 4,199 | | 3,984 | |
Commercial | | 7,204 | | 7,244 | | 6,341 | | (40 | ) | 903 | |
Other | | 292 | | 287 | | 302 | | 5 | | (15 | ) |
| | $ | 146,701 | | $ | 134,048 | | $ | 117,192 | | $ | 12,653 | | $ | 16,856 | |
Net insurance premiums earned for the year ended December 31, 2012 and 2011 were up as compared to the same periods in 2011 and 2010, respectively, primarily due to the increases in net insurance premiums written of $8.7 million and $20.0 million, respectively. These increases were offset by increases in unearned insurance premiums during 2012 and 2011 compared to their respective prior years of $3.9 million and $3.2 million, respectively.
The banking segment’s noninterest income was $9.3 million during the month ended December 31, 2012 and primarily related to intercompany financing charges associated with the lending commitment on the PrimeLending warehouse line of credit.
The mortgage origination segment’s noninterest income was $57.6 million for the month ended December 31, 2012 and was generated by net gains from sale of loans and mortgage loan origination fees.
Additionally, the majority of noninterest income generated by our financial advisory segment of $10.9 million for the month ended December 31, 2012 was from fees and commissions earned from investment advisory and securities brokerage activities.
Noninterest Expense
Noninterest expense in 2012 increased $100.3 million compared with the year ended December 31, 2011, while noninterest expense in 2011 increased $30.4 million compared with the year ended December 31, 2010. The primary driver of the increase during 2012 was the inclusion of employees’ compensation and benefits, occupancy and equipment and other expenses specifically attributable to expenses for those segments acquired as a part of the PlainsCapital acquisition. Additionally, loss and loss adjustment expenses associated with the insurance segment increased $12.4 million in 2012 compared to 2011, and $25.8 million when comparing 2011 to 2010. Further discussion regarding these increases follows.
Within the insurance segment, noninterest expense includes both loss and LAE expenses and policy acquisition and other underwriting expenses, as well as other noninterest expenses. Loss and LAE are recognized based on formula and case basis estimates for losses reported with respect to direct business, estimates of unreported losses based on past experience and deduction of amounts for reinsurance placed with reinsurers. Loss and LAE for the year ended December 31, 2012 was $109.2 million, as compared to $96.7 million for the same period in 2011. This increase was primarily a result of increased severity of wind and hail storms from April, May and June 2012 weather events and the increased exposure related to premium growth. Loss and LAE for the year ended December 31, 2011 increased $25.8 million from $70.9 million for the same period in 2010, and was a result of wind and hail storms that occurred in 2011 in Texas, in which five storms resulted in incurred losses of $19.3 million, and fifteen days of widely dispersed, exceptional weather related losses resulted in losses of $8.1 million.
The loss and LAE ratio is calculated by taking the ratio of incurred losses and LAE to net insurance premiums earned for the same period. The loss and LAE ratio for the years ended December 31, 2012, 2011 and 2010 was 74.4%, 72.2% and 60.5%, respectively.
59
Table of Contents
The Company’s net loss and LAE and the gross loss and LAE ratios are shown in the table below.
| | Year Ended December 31, | |
| | 2012 | | 2011 | | 2010 | |
Loss and LAE (in thousands): | | | | | | | |
Homeowners | | $ | 51,628 | | $ | 39,329 | | $ | 35,814 | |
Fire | | 34,022 | | 29,885 | | 22,085 | |
Mobile Home | | 18,947 | | 20,534 | | 10,871 | |
Commercial | | 4,562 | | 6,986 | | 2,173 | |
| | $ | 109,159 | | $ | 96,734 | | $ | 70,943 | |
| | | | | | | |
Incurred Claim Count: | | | | | | | |
Homeowners | | 10,000 | | 6,838 | | 8,010 | |
Fire | | 8,333 | | 8,413 | | 6,273 | |
Mobile Home | | 4,853 | | 9,518 | | 4,870 | |
Commercial | | 1,110 | | 1,162 | | 998 | |
| | 24,296 | | 25,931 | | 20,151 | |
Average Loss and LAE per Claim: | | | | | | | |
Homeowners | | $ | 5,163 | | $ | 5,752 | | $ | 4,471 | |
Fire | | 4,083 | | 3,552 | | 3,521 | |
Mobile Home | | 3,904 | | 2,157 | | 2,232 | |
Commercial | | 4,110 | | 6,012 | | 2,177 | |
| | | | | | | |
Loss and LAE Ratio: | | | | | | | |
Homeowners | | 77.9 | % | 64.8 | % | 67.1 | % |
Fire | | 74.0 | % | 69.4 | % | 57.5 | % |
Mobile Home | | 70.2 | % | 90.1 | % | 57.8 | % |
Commercial | | 63.3 | % | 96.4 | % | 34.3 | % |
As previously noted, policy acquisition and other underwriting expenses encompass all expenses incurred relative to insurance segment operations, and include elements of multiple categories of expense otherwise reported as noninterest expense in the consolidated statements of operations. Policy acquisition and other underwriting expenses were as follows (in thousands).
| | Year Ended December 31, | | Variance | |
| | 2012 | | 2011 | | 2010 | | 2012 vs 2011 | | 2011 vs 2010 | |
Amortization of deferred policy acquisition costs | | $ | 38,757 | | $ | 34,755 | | $ | 31,256 | | $ | 4,002 | | $ | 3,499 | |
Other underwriting expenses | | 13,829 | | 12,670 | | 12,901 | | 1,159 | | (231 | ) |
Total policy acquisition and other underwriting expenses | | 52,586 | | 47,425 | | 44,157 | | 5,161 | | 3,268 | |
Agency expenses | | (2,073 | ) | (1,789 | ) | (1,966 | ) | (284 | ) | 177 | |
Total policy acquisition and other underwriting expenses less agency expenses | | $ | 50,513 | | $ | 45,636 | | $ | 42,191 | | $ | 4,877 | | $ | 3,445 | |
Net insurance premiums earned | | $ | 146,701 | | $ | 134,048 | | $ | 117,192 | | $ | 12,653 | | $ | 16,856 | |
Expense ratio | | 34.4 | % | 34.0 | % | 36.0 | % | 0.4 | % | -2.0 | % |
Total policy acquisition and other underwriting expenses, excluding agency expenses, for the year ended December 31, 2012 were up $4.9 million due to the increase in amortization of deferred policy acquisition costs (“DAC”) of $4.0 million and an increase in other underwriting expenses of $1.2 million. The increase in other underwriting expenses during 2012 included the write down of the policy administration system the Company was unable to successfully implement of $1.8 million. The increase in amortization of DAC is a result of $8.7 million higher direct written premiums. Total policy acquisition and other underwriting expenses, less agency expenses, for the year ended December 31, 2011 were up $3.5 million, as compared to the same period in 2010, primarily due to higher amortization of DAC.
Other noninterest expenses, including employees’ compensation and benefits, occupancy and equipment, increased $84.8 million in 2012 compared to 2011, and $1.5 million when comparing 2011 to 2010. The 2012 increase was primarily due to the inclusion of $77.4 million in aggregate noninterest expenses within those segments acquired as a part of the PlainsCapital acquisition, as well as increases in professional services and other administrative expenses. Included in
60
Table of Contents
employee’s compensation and benefits expense is an $8.9 million charge related to the Merger and associated with separate retention agreements between Hilltop and two executive officers of PlainsCapital. The increases in professional fees are due to increases in acquisition activities related to due diligence activities in both 2011 and 2012.
Income Taxes
The Company had a $1.1 million income tax benefit for the year ended December 31, 2012, compared to an income tax benefit of $5.0 million for the same period in 2011. The reduction in income tax benefit during 2012 was primarily due the operating income generated by PlainsCapital. The effective income tax rate for the year ended December 31, 2012 is not indicative of future effective income tax rates as a result of current period tax adjustments related to the Merger.
During the year ended December 31, 2011, the Company had a $5.0 million income tax benefit, compared to $1.0 million for 2010. The benefit increased in 2011 due to a pre-tax loss of $11.5 million for the year ended December 31, 2011, compared with a $1.6 million pre-tax loss for the same period in 2010. Also contributing to the benefit in 2011 was the release of the allowance for uncertain tax positions on the state tax receivable at the parent of $1.0 million. We allocate income taxes in accordance with ASC 740.
Preferred Stock Dividends
As a result of the Merger, the outstanding shares of PlainsCapital Non-Cumulative Perpetual Preferred Stock, Series C, all of which are held by the U.S. Department of the Treasury, were converted on a one-for-one basis into shares of Hilltop Non-Cumulative Perpetual Preferred Stock, Series B (the “Hilltop Series B Preferred Stock”). Holders of the Hilltop Series B Preferred Stock are entitled to noncumulative cash dividends at a fluctuating dividend rate based on the Bank’s level of qualified small business lending. The terms of the Series B Preferred Stock provide for the payment of non-cumulative dividends on a quarterly basis. The dividend rate, as a percentage of the liquidation amount, fluctuates while the Series B Preferred Stock is outstanding based upon changes in the level of qualified small business lending by the Bank from its Baseline. The shares of Series B Preferred Stock are senior to shares of our common stock with respect to dividends and liquidation preference. At December 31, 2012, $114.1 million of our Series B Preferred Stock was outstanding. For the year ended December 31, 2012, we paid dividends of $0.3 million.
On March 11, 2010 and June 10, 2010, the Hilltop board of directors declared quarterly cash dividends of $0.5156 per share on each of the 5,000,000 outstanding shares of our Series A Preferred Stock, payable April 30, 2010 and July 30, 2010, amounting to $2.6 million on each disbursement date. On August 6, 2010, the Company called for redemption all of the outstanding shares of its Series A Preferred Stock. The Series A Preferred Stock was redeemed on September 6, 2010, at a cash redemption price of $25.2063 per share, representing the liquidation preference of $25.00 per share, plus accrued and unpaid dividends to, and including, the date of redemption. For the year ended December 31, 2010, the dividend was $1.2375 per share.
Financial Condition
The following discussion contains a more detailed analysis of our financial condition for the years ended December 31, 2012, 2011 and 2010.
Securities Portfolio
At December 31, 2012, investment securities consisted of U.S. government and its agencies, obligations of municipalities in the State of Texas, mortgage-backed, corporate debt, and equity securities, a note payable and warrants. We have the ability to categorize investments as trading, available-for-sale, and held-to-maturity. We classify our fixed maturities and equity securities as available-for-sale. Trading securities are bought and held principally for the purpose of selling them in the near term.
The securities portfolio plays a role in the management of our interest rate sensitivity and generates additional interest income. In addition, the securities portfolio is used to meet collateral requirements for public and trust deposits, securities sold under agreements to repurchase and other purposes. The available for sale securities portfolio serves as a source of liquidity. Historically, our policy has been to invest primarily in securities of the U.S. government and its agencies, obligations of municipalities in the State of Texas and other high grade fixed income securities to minimize credit risk.
The securities portfolio consists of two major components: trading securities and securities available for sale. Trading securities are carried at fair value, marked to market through operations and held at the Bank and First Southwest.
61
Table of Contents
Securities that may be sold in response to changes in market interest rates, changes in securities’ prepayment risk, increases in loan demand, general liquidity needs and other similar factors are classified as available for sale and are carried at estimated fair value, with unrealized gains and losses recorded in accumulated other comprehensive income.
The table below summarizes our securities portfolio (in thousands).
| | December 31, | |
| | 2012 | | 2011 | | 2010 | |
Trading securities, at fair value | | $ | 90,113 | | $ | — | | $ | — | |
| | | | | | | |
Securities available for sale, at fair value | | | | | | | |
U.S. government agencies: | | | | | | | |
Bonds | | 533,422 | | 29,165 | | 16,001 | |
Residential mortgage-backed securities | | 23,581 | | 12,652 | | 13,641 | |
Collateralized mortgage obligations | | 96,049 | | — | | — | |
Corporate debt securities | | 87,189 | | 100,681 | | 90,926 | |
States and political subdivisions | | 172,934 | | — | | — | |
Commercial mortgage-backed securities | | 1,073 | | 2,303 | | 2,594 | |
Equity securities | | 20,428 | | 19,022 | | 8,768 | |
Note receivable | | 44,160 | | 38,588 | | — | |
Warrants | | 12,117 | | 21,789 | | — | |
| | 990,953 | | 224,200 | | 131,930 | |
| | | | | | | |
Securities held to maturity, at amortzied cost | | | | | | | |
U.S. government agencies: | | | | | | | |
Bonds | | — | | — | | 17,035 | |
Total securities portfolio | | $ | 1,081,066 | | $ | 224,200 | | $ | 148,965 | |
We had a net unrealized gain of $12.5 million related to the available for sale investment portfolio at December 31, 2012.
62
Table of Contents
The following table sets forth the estimated maturities of securities, excluding trading and available for sale equity securities. Contractual maturities may be different (dollar amounts in thousands, yields are tax-equivalent).
| | December 31, 2012 | |
| | One Year | | One Year to | | Five Years to | | Greater Than | | | |
| | Or Less | | Five Years | | Ten Years | | Ten Years | | Total | |
U.S. government agencies | | | | | | | | | | | |
Bonds | | | | | | | | | | | |
Amortized cost | | $ | 6,999 | | $ | 30,469 | | $ | — | | $ | 494,466 | | $ | 531,934 | |
Fair value | | 7,076 | | 31,472 | | — | | 494,874 | | 533,422 | |
Weighted average yield | | 3.03 | % | 1.86 | % | — | | 1.60 | % | 1.63 | % |
Residential mortgage-backed securities | | | | | | | | | | | |
Amortized cost | | 32 | | 6,693 | | 84 | | 16,215 | | 23,024 | |
Fair value | | 32 | | 6,706 | | 83 | | 16,760 | | 23,581 | |
Weighted average yield | | -0.65 | % | 1.86 | % | 6.07 | % | 4.98 | % | 4.07 | % |
Collateralized mortgage obligations | | | | | | | | | | | |
Amortized cost | | 34,952 | | 47,558 | | — | | 13,564 | | 96,074 | |
Fair value | | 34,921 | | 47,566 | | — | | 13,562 | | 96,049 | |
Weighted average yield | | 0.80 | % | 1.02 | % | — | | 4.31 | % | 1.40 | % |
Corporate debt securities | | | | | | | | | | | |
Amortized cost | | 14,154 | | 40,249 | | 24,282 | | 915 | | 79,600 | |
Fair value | | 14,282 | | 43,888 | | 28,024 | | 995 | | 87,189 | |
Weighted average yield | | 3.71 | % | 3.89 | % | 4.65 | % | 6.23 | % | 4.12 | % |
States and political subdivisions | | | | | | | | | | | |
Amortized cost | | — | | 5,372 | | 17,098 | | 152,534 | | 175,004 | |
Fair value | | — | | 5,369 | | 17,042 | | 150,523 | | 172,934 | |
Weighted average yield | | — | | 2.25 | % | 2.41 | % | 3.31 | % | 3.19 | % |
Commercial mortgage-backed securities | | | | | | | | | | | |
Amortized cost | | — | | — | | — | | 1,001 | | 1,001 | |
Fair value | | — | | — | | — | | 1,073 | | 1,073 | |
Weighted average yield | | — | | — | | — | | 5.99 | % | 5.99 | % |
Note receivable | | | | | | | | | | | |
Amortized cost | | — | | 40,508 | | — | | — | | 40,508 | |
Fair value | | — | | 44,160 | | — | | — | | 44,160 | |
Weighted average yield | | — | | 12.64 | % | — | | — | | 12.64 | % |
Warrants | | | | | | | | | | | |
Amortized cost | | — | | 12,068 | | — | | — | | 12,068 | |
Fair value | | — | | 12,117 | | — | | — | | 12,117 | |
Weighted average yield | | — | | 0.36 | % | — | | — | | 0.36 | % |
Total securities portfolio | | | | | | | | | | | |
Amortized cost | | $ | 56,137 | | $ | 182,917 | | $ | 41,464 | | $ | 678,695 | | $ | 959,213 | |
Fair value | | 56,311 | | 191,278 | | 45,149 | | 677,787 | | 970,525 | |
Weighted average yield | | 1.81 | % | 4.39 | % | 3.73 | % | 2.13 | % | 2.61 | % |
63
Table of Contents
Loan Portfolio
Consolidated loans held for investment at December 31, 2012 are detailed in the table below (in thousands) and classified by type.
| | Acquired | | Acquired | | Total Acquired | | | | Total | |
| | Impaired | | Performing | | Loans | | Originated | | Loans | |
Commercial and industrial | | $ | 71,386 | | $ | 1,492,072 | | $ | 1,563,458 | | $ | 96,835 | | $ | 1,660,293 | |
Real estate | | 62,247 | | 1,031,379 | | 1,093,626 | | 90,611 | | 1,184,237 | |
Construction and land development | | 33,070 | | 235,777 | | 268,847 | | 11,627 | | 280,474 | |
Consumer | | 77 | | 25,061 | | 25,138 | | 2,254 | | 27,392 | |
Loans, gross | | 166,780 | | 2,784,289 | | 2,951,069 | | 201,327 | | 3,152,396 | |
Allowance for loan losses | | — | | — | | — | | (3,409 | ) | (3,409 | ) |
Loans, net of allowance | | $ | 166,780 | | $ | 2,784,289 | | $ | 2,951,069 | | $ | 197,918 | | $ | 3,148,987 | |
Banking Segment
The loan portfolio constitutes the major earning asset of the banking segment and typically offers the best alternative for obtaining the maximum interest spread above the banking segment’s cost of funds. The overall economic strength of the banking segment generally parallels the quality and yield of its loan portfolio. The banking segment’s total loans, net of the allowance for loan losses, were $4.1 billion at December 31, 2012. The banking segment’s loan portfolio includes a $1.6 billion warehouse line of credit extended to PrimeLending, of which $1.3 billion was drawn at December 31, 2012 and is eliminated from net loans on our consolidated balance sheets.
The banking segment does not generally participate in syndicated loan transactions and has no foreign loans in its portfolio. At December 31, 2012, the banking segment had loan concentrations (loans to borrowers engaged in similar activities) that exceeded 10% of total loans in its real estate loan portfolio. The areas of concentration within our real estate portfolio were construction and land development loans and non-construction commercial real estate loans. At December 31, 2012, construction and land development loans were 9.64% of total loans, while non-construction commercial real estate loans were 28.98% of total loans. The banking segment’s loan concentrations were within regulatory guidelines at December 31, 2012.
The following table provides information regarding the maturities of the banking segment’s commercial and real estate loans held for investment, net of unearned income (in thousands).
| | December 31, 2012 | |
| | Due Within | | Due From One | | Due After | | | |
| | One Year | | To Five Years | | Five Years | | Total | |
Commercial and industrial | | $ | 2,067,087 | | $ | 464,088 | | $ | 117,983 | | $ | 2,649,158 | |
Real estate (including construction and land development) | | 224,254 | | 586,022 | | 655,083 | | 1,465,359 | |
Total | | $ | 2,291,341 | | $ | 1,050,110 | | $ | 773,066 | | $ | 4,114,517 | |
| | | | | | | | | |
Fixed rate loans | | $ | 2,186,665 | | $ | 1,030,085 | | $ | 772,140 | | $ | 3,988,890 | |
Floating rate loans | | 104,676 | | 20,025 | | 926 | | 125,627 | |
Total | | $ | 2,291,341 | | $ | 1,050,110 | | $ | 773,066 | | $ | 4,114,517 | |
In the table above, floating rate loans that have reached their applicable rate floor or ceiling are classified as fixed rate loans rather than floating rate loans. The majority of floating rate loans carry an interest rate tied to The Wall Street Journal Prime Rate, as published in The Wall Street Journal.
Mortgage Origination Segment
The loan portfolio of the mortgage origination segment consists of loans held for sale, primarily single-family residential mortgages funded through PrimeLending, and pipeline loans, which are loans in various stages of the application process,
64
Table of Contents
but not yet closed and funded. Pipeline loans may not close if potential borrowers elect in their sole discretion not to proceed with the loan application. Total loans held for sale was $1.4 billion at December 31, 2012.
The components of the mortgage origination segment’s loans held for sale and pipeline loans at December 31, 2012 are shown in the following table (in thousands).
Loans held for sale: | | | |
Unpaid principal balance | | $ | 1,358,267 | |
Fair value adjustment | | 40,908 | |
| | $ | 1,399,175 | |
| | | |
Pipeline loans: | | | |
Unpaid principal balance | | $ | 968,083 | |
Fair value adjustment | | 15,150 | |
| | $ | 983,233 | |
Financial Advisory Segment
The loan portfolio of the financial advisory segment consists primarily of margin loans to customers and correspondents. These loans are collateralized by the securities purchased or by other securities owned by the clients and, because of collateral coverage ratios, are believed to present minimal collectibility exposure. Additionally, these loans are subject to a number of regulatory requirements as well as First Southwest’s internal policies. The financial advisory segment’s total loans, net of the allowance for loan losses, were $277.0 million at December 31, 2012.
Allowance for Loan Losses
The allowance for loan losses is a reserve established through a provision for loan losses charged to expense, which represents management’s best estimate of probable losses inherent in the existing portfolio of loans held for investment. Our management has responsibility for determining the level of the allowance for loan losses, subject to review by the Audit Committee of our Board of Directors and the Directors’ Loan Review Committee of the Bank’s Board of Directors.
It is our management’s responsibility at the end of each quarter, or more frequently as deemed necessary, to analyze the level of the allowance for loan losses to ensure that it is appropriate for the estimated credit losses in the portfolio consistent with the Interagency Policy Statement on the Allowance for Loan and Lease Losses and the Receivables and Contingencies Topics of the ASC. Estimated credit losses are the probable current amount of loans that we will be unable to collect given facts and circumstances as of the evaluation date. When management determines that a loan, or portion thereof, is uncollectible, the loan, or portion thereof, is charged off against the allowance for loan losses. Any subsequent recovery of charged-off loans is added back to the allowance for loan losses.
We have developed a methodology that seeks to determine an allowance within the scope of the Receivables and Contingencies Topics of the ASC. Each of the loans that has been determined to be impaired is within the scope of the Receivables Topic and is individually evaluated for impairment using one of three impairment measurement methods as of the evaluation date: (1) the present value of expected future discounted cash flows on the loan, (2) the loan’s observable market price, or (3) the fair value of the collateral if the loan is collateral dependent. Specific reserves are provided in our estimate of the allowance based on the measurement of impairment under these three methods, except for collateral dependent loans, which require the fair value method. All non-impaired loans are within the scope of the Contingencies Topic. Estimates of loss for the Contingencies Topic are calculated based on historical loss experience by loan portfolio segment adjusted for changes in trends, conditions, and other relevant factors that affect repayment of loans as of the evaluation date. While historical loss experience provides a reasonable starting point for the analysis, historical losses, or recent trends in losses, are not the sole basis upon which to determine the appropriate level for the allowance for loan losses. Management considers recent qualitative or environmental factors that are likely to cause estimated credit losses associated with the existing portfolio to differ from historical loss experience, including but not limited to: changes in lending policies and procedures; changes in underwriting standards; changes in economic and business conditions and developments that affect the collectibility of the portfolio; the condition of various market segments; changes in the nature and volume of the portfolio and in the terms of loans; changes in lending management and staff; changes in the volume and severity of past due loans, the volume of non-accrual loans, and the volume and severity of adversely classified or graded loans; changes in the loan review system; changes in the value of underlying collateral for collateral-dependent loans; and any concentrations of credit and changes in the level of such concentrations.
65
Table of Contents
We design our loan review program to identify and monitor problem loans by maintaining a credit grading process, ensuring that timely and appropriate changes are made to the loans with assigned risk grades and coordinating the delivery of the information necessary to assess the appropriateness of the allowance for loan losses. Loans are evaluated for impairment when: (i) payments on the loan are delayed, typically by 90 days or more (unless the loan is both well secured and in the process of collection), (ii) the loan becomes classified, (iii) the loan is being reviewed in the normal course of the loan review scope, or (iv) the loan is identified by the servicing officer as a problem. We review on an individual basis all loan relationships over $0.5 million that exhibit probable or observed credit weaknesses, the top 25 loan relationships by dollar amount in each market we serve, and additional relationships necessary to achieve adequate coverage of our various lending markets.
Homogenous loans, such as consumer installment loans, residential mortgage loans and home equity loans, are not individually reviewed and are generally risk graded at the same levels. The risk grade and reserves are established for each homogenous pool of loans based on the expected net charge-offs from current trends in delinquencies, losses or historical experience and general economic conditions. At December 31, 2012, we had no material delinquencies in these types of loans.
The allowance is subject to regulatory examinations and determinations as to adequacy, which may take into account such factors as the methodology used to calculate the allowance and the size of the allowance. While we believe we have an appropriate allowance for our existing portfolio at December 31, 2012, additional provisions for losses on existing loans may be necessary in the future. We recorded net charge-offs in the amount of $0.4 million for the month ended December 31, 2012. Our allowance for loan losses totaled $3.4 million at December 31, 2012.
In connection with the acquisition of PlainsCapital, Hilltop acquired loans both with and without evidence of credit quality deterioration since origination. The acquired loans were initially recorded at fair value with no carryover of any allowance for loan losses.
Provisions for loan losses are charged to operations to record the total allowance for loan losses at a level deemed appropriate by the banking segment’s management based on such factors as the volume and type of lending it conducted, the amount of non-performing loans and related collateral security, the present level of the allowance for loan losses, the results of recent regulatory examinations, generally accepted accounting principles, general economic conditions and other factors related to the ability to collect loans in its portfolio. The provision for loan losses, primarily in the banking segment, was $3.8 million for the month ended December 31, 2012.
The following table presents the activity in our allowance for loan losses for the month ended December 31, 2012 (dollars in thousands). Substantially all of the activity shown below occurred within the banking segment, which was acquired as a part of the PlainsCapital transaction.
Balance, December 1, 2012 | | $ | — | |
Provisions charged to operating expenses | | 3,800 | |
Recoveries of loans previously charged off: | | | |
Commercial and industrial | | — | |
Real estate | | — | |
Construction and land development | | — | |
Consumer | | — | |
Total recoveries | | — | |
Loans charged off: | | | |
Commercial and industrial | | 391 | |
Real estate | | — | |
Construction and land development | | — | |
Consumer | | — | |
Total charge-offs | | 391 | |
Net charge-offs | | (391 | ) |
Balance, end of year | | $ | 3,409 | |
66
Table of Contents
The distribution of the allowance for loan losses among loan types and the percentage of the loans for that type to gross loans, excluding unearned income, at December 31, 2012 are presented in the table below (dollars in thousands).
| | | | % of | |
| | | | Gross | |
| | Reserve | | Loans | |
Commercial and industrial | | $ | 1,845 | | 52.69 | % |
Real estate (including construction and land development) | | 1,559 | | 46.44 | % |
Consumer | | 5 | | 0.87 | % |
Total | | $ | 3,409 | | 100.00 | % |
Potential Problem Loans
Potential problem loans consist of loans that are performing in accordance with contractual terms but for which management has concerns about the ability of an obligor to continue to comply with repayment terms because of the obligor’s potential operating or financial difficulties. Management monitors these loans and reviews their performance on a regular basis. At December 31, 2012, we had 8 credit relationships totaling $8.7 million of potential problem loans, which are assigned a grade of special mention within our risk grading matrix. Potential problem loans contain potential weaknesses that could improve, persist or further deteriorate. If such potential weaknesses persist without improving, the loan is subject to downgrade, typically to substandard, in three to six months.
Non-Performing Assets
The following table presents our components of non-performing assets at December 31, 2012 (dollars in thousands).
Non-performing loans as a percentage of total loans | | 0.04 | % |
| | | |
Other real estate owned | | $ | 11,098 | |
| | | |
Other repossessed assets | | $ | 557 | |
| | | |
Non-performing assets | | $ | 13,411 | |
| | | |
Non-performing assets as a percentage of total assets | | 0.18 | % |
At December 31, 2012, non-performing loans totaled $1.8 million all of which were loans secured by residential real estate. Loans past due 90 days and still accruing were $2.0 million at December 31, 2012, all of which were secured commercial and industrial loans. There were no troubled debt restructurings at December 31, 2012.
Other real estate owned was $11.1 million at December 31, 2012 and included commercial properties of $6.8 million, commercial real estate property consisting of parcels of unimproved land of $3.1 million and residential lots under development of $1.2 million.
Insurance Losses and Loss Adjustment Expenses.Expenses
The liability for insurance losses and loss adjustment expenses represents estimates of the ultimate unpaid cost of all losses incurred, including losses for claims that have not yet been reported. Separately for each of NLIC and ASIC and each line of business, our actuaries estimate the liability for unpaid losses and loss adjustment expenses, or LAE by first estimating ultimate losses and LAE amounts for each year, prior to recognizing the impact of reinsurance. There are severalThe methods that our actuaries utilize to estimate ultimate loss and LAE amounts including:are paid and reported loss development methods and paid and reported Bornhuetter-Ferguson methods.
·Paid Loss Development Method;
·Reported Loss Development Method;
·Paid Bornhuetter-Ferguson Method; and
·Reported Bornhuetter-Ferguson Method.
Paid and Reported Loss Development Methods. Insured losses for a given accident year change in value over time as additional information on claims areis received, as claim conditions change and as new claims are reported. This process is commonly referred to as “lossloss development.” To project ultimate losses and LAE, our actuaries examine the paid and reported (paid, plus case) losses and LAE for each accident year and multiply these values by a loss development factor. The selected loss development factors are based upon a review of the loss
67
Table of Contents
development patterns indicated in the companies’ historical loss triangles and applicable insurance industry loss development factors.
Paid and Reported Bornhuetter-Ferguson Methods. The Bornhuetter-Ferguson, or BF, Method is a procedure that weights an expected ultimate loss and LAE amount, and the result of the loss development method. This method is useful when loss data is immature or sparse because it is not as sensitive as the loss development method to unusual variations in the paid or reported amounts. The BF method requires an initial estimate of expected ultimate losses and LAE. For each year, the expected ultimate losses and LAE is based on a review of the ultimate loss ratios indicated in the companies’ historical data and applicable insurance industry ultimate loss ratios. Each loss development factor, paid or reported, implies a certain percent of the ultimate losses and LAE is still unpaid or unreported. The amounts of unpaid or unreported losses and LAE by year are estimated as the percentage unpaid or unreported, times the expected ultimate loss and LAE amounts. To project ultimate losses and LAE, the actual paid or reported losses and LAE to date are added to the estimated unpaid or unreported amounts.
The results of each actuarial method performed by year are reviewed to select an ultimate loss and LAE amount for each accident year. In general, more weight is given to the loss development projections for more mature accident periods and more weight is given to the BF methods for less mature accident periods.
The combination of the methodologies described above is used for all insurance lines of business, regardless of whether the line is a short-tailed or long-tailed line of business, though specific parameter selections within the methods vary to reflect the nature of the underlying line of business. ASIC and NLIC specialize in writing fire and extended coverage for low-value dwellings, mobile homes and homeowners, which generally are considered short-tailed coverages. In addition, ASIC and NLIC write a small amount of commercial risks, which are still predominantly property coverages, along with some low-limit liability coverages.
The methodology used by our actuaries is directly dependent upon the unique development characteristics of each line of business. For those lines of business with significant volume (homeowners, special property and commercial multiple peril), the selected loss development factors are derived from the historical development data for that line. For lines of business where the loss volume is small, insurance industry statistics regarding loss development for that line also are considered in selecting the loss development factors.
The estimated unpaid losses and LAE equal the estimated ultimate loss and LAE amounts, described above, less the cumulative paid amounts on known claims for each year. This estimate of unpaid losses and LAE is further segmented into case reserves on known claims and incurred-but-not-reported, or IBNR, reserves. IBNR reserves are calculated by reducing the estimate of unpaid losses and LAE by the case reserve amounts. In the normal course of operations, each case reserve is initially set at a standard amount determined from past payments for that type of loss. Individual case reserves may be adjusted based on information indicating that the loss amount is actually over, or under, the standard amount. Most case reserves are not adjusted until the receipt of documentation concerning the amount to be paid on the loss. This usually occurs within seven days of the reporting of the claim, longer in the case of large scale catastrophic events.
46
Table of Contents
The reserve analysis performed by our actuaries provides preliminary central estimates of the unpaid losses and LAE. At each quarter-end, the results of the reserve analysis are summarized and discussed with our senior management. The senior management group considers many factors in determining the amount of reserves to record for financial statement purposes. These factors include the extent and timing of any recent catastrophic events, historical pattern and volatility of the actuarial indications, the sensitivity of the actuarial indications to changes in paid and reported loss patterns, the consistency of claims handling processes, the consistency of case reserving practices, changes in our pricing and underwriting, and overall pricing and underwriting trends in the insurance market.
Our recorded reserves reflect our best estimate as of a particular point in time based upon known facts, current law and our judgment. The carried reserve may differ from the actuarial central estimate as the result of our consideration of the factors noted above, as well as other factors impacting claims costs that may not be quantifiable through actuarial analysis. This process results in management’s best estimate, which is then recorded as the reserve for unpaid losses and LAE.
The level of loss and LAE reserves we maintain represents our best estimate, as of a particular point in time, of the ultimate cost to settle and administer all claims based on our assessment of facts and circumstances known at that time. Reserves are not an exact calculation of liability, but instead are complex estimates that we derive, generally utilizing a variety of actuarial reserve estimation techniques, with numerous underlying assumptions and expectations about future events, both internal and external, many of which are highly uncertain.
The key assumptions fundamental to the reserving process are often different for various reserve categories and accident years. Some of these assumptions are explicit assumptions that are required of a particular method, but many assumptions are implicit and cannot be precisely quantified. An example of an explicit assumption is the pattern employed in the paid loss development method. However, the assumed pattern is itself based on several implicit assumptions, such as the impact of inflation on medical costs and the rate at which claim professionals close claims. Loss frequency is a measure of the number of claims per unit of insured exposure, and loss severity is a measure of the average size of claims. Each reserve segment has an implicit frequency and severity for each accident year as a result of the various assumptions made. As a result, the effect on reserve estimates of a particular change in assumptions usually cannot be specifically quantified, and changes in these assumptions cannot generally be tracked over time.
In light of the many uncertainties associated with establishing the estimates of ultimate losses and LAE, and making the assumptions necessary to establish recorded reserve levels, we review our reserve estimates on a regular basis and make adjustments in the period that the need for such adjustments is identified. The anticipated future emergence underlying our current estimates continues to reflect the historical patterns, and the selected development patterns have not changed significantly over the past few years.
Reserve estimates are subject to uncertainty from various sources, including, among others, changes in claim reporting patterns, claim settlement patterns, judicial decisions, legislation and economic conditions. In estimating the reserves for unpaid losses and LAE, it is necessary to project future loss and LAE payments. Actual future losses and LAE will not develop exactly as projected and may, in fact, vary significantly from the actuarially indicated projections. Further, these projections make no provision for extraordinary future emergence of new classes of losses or types of losses, which are not sufficiently represented in the companies’ historical data or that are not yet quantifiable. Extraordinary future emergence can arise from an unforeseen broadening of coverage instigated by regulatory actions, judicial decisions or similar developments.
The underlying process of establishing our best estimate of the liability for unpaid losses and LAE require the use of estimates, actuarial judgment and management considerations and, therefore, is an inherently uncertain process. The recorded reserves for the companies’ liability for unpaid losses and LAE are estimates based on long term averages. Actual loss experience in any given year may differ from what is suggested by these averages. For some lines of business, the written premium volume is small and actual results are therefore subject to an exceptionally high degree of variability. While the recorded reserves are our best estimate as of a particular point in time, these reserves should be considered best estimates within a wide range of possible outcomes.
In arriving at our best estimate of the unpaid losses and LAE, and based on management discussion with our actuaries, we would consider reasonably likely changes in the key assumptions, such as the underlying loss development pattern or the expected loss ratio, to have an impact on our best estimate by +/- 10%. As ofAt December 31, 2011,2012, this equates to approximately +/- $1.9$2.4 million, which represents approximately 0.3%or 2% of insurance segment equity, and 30.2%2.2% of calendar year 20112012 insurance losses.
47
Table of Contents
The following table presents our gross loss and LAE reserve amounts at December 31, 2011 and 2010 for each of NLIC and ASIC by line of business (dollars in(in thousands):.
For the year ended December 31, 2011
Company | | Homeowners | | Special
Property | | Commercial
Multiple Peril | | Other
Liability | | All Lines | |
| | | | | | | | | | | |
ASIC | | $ | 2,217 | | $ | 255 | | $ | 5 | | $ | 1,316 | | $ | 3,793 | |
NLIC | | 26,275 | | 11,913 | | 1,832 | | 1,022 | | 41,042 | |
| | | | | | | | | | | |
Consolidated | | $ | 28,492 | | $ | 12,168 | | $ | 1,837 | | $ | 2,338 | | $ | 44,835 | |
For the year ended December 31, 2010
Company | | Homeowners | | Special
Property | | Commercial
Multiple Peril | | Other
Liability | | All Lines | |
| | | | | | | | | | | |
ASIC | | $ | 1,558 | | $ | 325 | | $ | 14 | | $ | 1,021 | | $ | 2,918 | |
NLIC | | 37,708 | | 15,655 | | 1,467 | | 1,134 | | 55,964 | |
| | | | | | | | | | | |
Consolidated | | $ | 39,266 | | $ | 15,980 | | $ | 1,481 | | $ | 2,155 | | $ | 58,882 | |
Investment Securities. At December 31, 2011, investment securities consist of U.S. Government, mortgage-backed, corporate debt and equity securities. Also included in our investment portfolio are other investments, which consist of a note receivable and warrants, held by the parent, HTH. We have the ability to categorize investments as trading, available-for-sale, and held-to-maturity. We classify our fixed maturities as either available-for-sale or held-to-maturity and equity securities as available-for-sale. Trading securities are bought and held principally for the purpose of selling them in the near term. As of December 31, 2011, all securities were classified as available-for-sale.
Trading and available-for-sale securities are recorded at fair value. Unrealized holding gains and losses on trading securities are included in earnings. Unrealized holding gains and losses, net of the related tax effect, on available-for-sale securities are excluded from earnings and are reported as a separate component of other comprehensive income until realized. Realized gains and losses from the sale of trading and available-for-sale securities are determined on a specific-identification basis.
We regularly review our investment securities to assess whether the security is impaired and if impairment is other-than-temporary. A decline in the market value of any available-for-sale security below cost that is deemed to be other-than-temporary results in a reduction in carrying amount to fair value. The impairment is charged to earnings and a new cost basis for the security is established. To determine whether impairment is other-than-temporary, we consider whether we are more likely than not to hold an investment until a market price recovery and consider whether evidence indicating the cost of the investment is recoverable outweighs evidence to the contrary. Evidence considered in this assessment includes the reasons for the impairment, the severity and duration of the impairment, changes in value subsequent to period end, and forecasted performance of the investee.
Premiums and discounts are amortized or accreted over the life of the related held-to-maturity or available-for-sale security as an adjustment to yield using the effective-interest method. Dividend and interest income are recognized when earned.
December 31, 2012 | | Homeowners | | Special
Property | | Commercial
Multiple Peril | | Other
Liability | | All Lines | |
| | | | | | | | | | | |
ASIC | | $ | 2,151 | | $ | 394 | | $ | — | | $ | 810 | | $ | 3,355 | |
NLIC | | 18,825 | | 9,310 | | 1,449 | | 1,073 | | 30,657 | |
Consolidated | | $ | 20,976 | | $ | 9,704 | | $ | 1,449 | | $ | 1,883 | | $ | 34,012 | |
| | | | | | | | | | | |
December 31, 2011 | | Homeowners | | Special
Property | | Commercial
Multiple Peril | | Other
Liability | | All Lines | |
| | | | | | | | | | | |
ASIC | | $ | 2,217 | | $ | 255 | | $ | 5 | | $ | 1,316 | | $ | 3,793 | |
NLIC | | 26,275 | | 11,913 | | 1,832 | | 1,022 | | 41,042 | |
Consolidated | | $ | 28,492 | | $ | 12,168 | | $ | 1,837 | | $ | 2,338 | | $ | 44,835 | |
48
Table of Contents
Fair Value Measurements. The Company’s estimates of fair value for financial assets and financial liabilities are based on the framework established in ASC 820, Fair Value Measurements and Disclosures. The framework is based on the inputs used in valuation and gives the highest priority to quoted prices in active markets and requires that observable inputs be used in the valuations when available. The disclosure of fair value estimates is based on whether the significant inputs into the valuation are observable. In determining the level of the hierarchy in which the estimate is disclosed, the highest priority is given to unadjusted quoted prices in active markets and the lowest priority to unobservable inputs that reflect the Company’s significant market assumptions. The three levels of the hierarchy are as follows:
·Level 1 - Unadjusted quoted market prices for identical assets or liabilities in active markets that the Company has the ability to access.
·Level 2 - Quoted prices for similar assets or liabilities in active markets; quoted prices for identical or similar assets or liabilities in inactive markets; or valuations based on models where the significant inputs are observable (e.g., interest rates, yield curves, prepayment speeds, default rates, loss severities, etc.) or can be corroborated by observable market data. Based on management’s understanding of the methodologies used by our pricing service, all applicable investments have been valued in accordance with GAAP valuation principles.
·Level 3 - Valuations based on models where significant inputs are not observable. The unobservable inputs reflect the Company’s own assumptions about the assumptions that market participants would use.
Fixed maturities
The Company utilizes a pricing service to estimate fair value measurements for its fixed maturities. The pricing service utilizes market quotations for fixed maturity securities that have quoted prices in active markets. Since fixed maturities other than U.S. Treasury securities generally do not trade on a daily basis, the pricing service prepares estimates of fair value measurements for these securities using its proprietary pricing applications, which include available relevant market information, benchmark curves, benchmarking of like securities, sector groupings and matrix pricing.
The pricing service evaluates each asset class based on relevant market information, relevant credit information, perceived market movements and sector news. The market inputs utilized in the pricing evaluation, listed in the approximate order of priority, include: benchmark yields, reported trades, broker/dealer quotes, issuer spreads, two-sided markets, benchmark securities, bids, offers, reference data, and industry and economic events. The extent of the use of each market input depends on the asset class and the market conditions. Depending on the security, the priority of the use of inputs may change or some market inputs may not be relevant. For some securities, additional inputs may be necessary.
The pricing service utilized by the Company has indicated that they will only produce an estimate of fair value if there is objectively verifiable information to produce a valuation. If the pricing service discontinues pricing an investment, the Company would be required to produce an estimate of fair value using some of the same methodologies as the pricing service but would have to make assumptions for market-based inputs that are unavailable due to market conditions.
The fair value estimates of most fixed maturity investments are based on observable market information rather than market quotes. Accordingly, the estimates of fair value for such fixed maturities, other than U.S. Treasury securities, provided by the pricing service are included in the amount disclosed in Level 2 of the hierarchy. The estimated fair value of U.S. Treasury securities is included in the amount disclosed in Level 1 as the estimates are based on unadjusted market prices.
The Company reviews the estimates of fair value provided by the pricing service and compares the estimates to the Company’s knowledge of the market to determine if the estimates obtained are representative of the prices in the market. In addition, the Company has periodic discussions with the pricing service to discuss any changes in their process and reactions to overall markets. These processes have not highlighted any significant issues with the fair value estimates received from the pricing service.
Non-Fixed Maturities and Other Investments
Equities—Public Common and Preferred
For public common and preferred stocks, the Company receives prices from a nationally recognized pricing service that are based on observable market transactions and includes these estimates in the amount disclosed in Level 1.
49
Table of Contents
Other Investments
The Company holds investments in SWS as a note receivable and warrants, which are reported in other investments. The $60.4 million fair value of these investments at December 31, 2011 was disclosed in Level 3. The fair value estimate is determined based on recent filings, operating results, balance sheet stability, growth and other business and market sector fundamentals. Due to the significant unobservable inputs in these valuations, the Company includes the total fair value estimate for all of these investments at December 31, 2011 in the amount disclosed in Level 3.
Deferred Acquisition Costs. Costs of acquiring insurance vary with, and are related to, the production of new and renewal business, primarily consisting of commissions, premium taxes and underwriting expenses. These costs are deferred and amortized over the terms of the policies or reinsurance treaties to which they relate. Proceeds from reinsurance transactions that represent recovery of acquisition costs reduce applicable unamortized acquisition costs in a manner that net acquisition costs are capitalized and charged to expense in proportion to net revenue recognized. Future investment income is considered in determining the recoverability of deferred acquisition costs. The Company regularly reviews the categories of acquisition costs that are deferred and assesses the recoverability of this asset. A premium deficiency, and a corresponding charge to income, is recognized if the sum of the expected loss and loss adjustment expenses, unamortized acquisition costs, and maintenance costs exceed related unearned premiums and anticipated investment income. At December 31, 2011, there was no premium deficiency.
Revenue Recognition.Property and liability premiums are recognized as revenue on a pro rata basis over the policy term. The portion of premiums that will be earned in the future are deferred and reported as unearned premiums. The Company routinely evaluates the premium receivable balance to determine if an allowance for uncollectible accounts is necessary.
Other income consists of premium installment charges, which are recognized when earned, and other miscellaneous income.
Reinsurance. In the normal course of business, NLASCO seeks to reduce losses that may arise from catastrophes or other events that cause unfavorable underwriting results by reinsuring certain levels of risk in various areas of exposure with other insurance enterprises or reinsurers. Net premiums earned, losses and LAE and policy acquisition and other underwriting expenses are reported net of the amounts related to reinsurance ceded to other companies. Amounts recoverable from reinsurers related to the portions of the liability for losses and LAE are reported as assets. Amounts recoverable from reinsurers are estimated in a manner consistent with the reinsured policy.
The Company accounts for reinsurance contracts under the provisions of GAAP in accounting and reporting for reinsurance. Reinsurance assumed from other companies, including assumed premiums written and earned and losses and LAE, is accounted for in the same manner as direct insurance written.
Income Taxes. We have been in a taxable loss position since our inception and, as a result, we have substantial net operating loss carry-forwards to offset taxable income and capital gains from the sale of discontinued operations. We have established a tax provision beginning on January 1, 2006.
Income taxes are accounted for under the asset and liability method. Deferred tax assets and liabilities are recorded for the estimated future tax effects related to the temporary difference between the tax basis and book basis of assets and liabilities reported in the accompanying consolidated balance sheets. The provision for income tax expense or benefit differs from the amounts of income taxes currently payable because certain items of income and expense included in the consolidated financial statements are recognized in different time periods by taxing authorities.
ASC 740, specifically 740-10-25, Recognition, clarifies the accounting for uncertainty in income taxes recognized in financial statements and prescribes a recognition threshold and measurement attribute for the financial statement recognition and measurement of a tax position taken or expected to be taken in a tax return. ASC 740 requires that we determine whether the benefits of our tax positions are more likely than not of being sustained upon audit based on the technical merits of the tax position. For tax positions that are more likely than not of being sustained upon audit, we recognize the largest amount of the benefit that is more likely than not of being sustained in our consolidated financial statements. For tax positions that are not more likely than not of being sustained upon audit, we do not recognize any portion of the benefits in our consolidated financial statements.
Deferred tax assets, including net operating loss and tax credit carry forwards, are reduced by a valuation allowance when, in the opinion of management, it is more likely than not that any portion of these tax attributes will not be realized. Valuation allowances on deferred tax assets are established, if necessary, to reduce deferred tax assets to an amount expected to be recognized. In accordance with ASC 740, the Company considered all negative and positive evidence available including our cumulative pre-tax loss position since the quarter ending December 31, 2008, less any abnormal occurrences during that period,
50
Table of Contents
as well as future taxable income and reversals of existing taxable temporary differences. We expect to realize our current deferred tax assets through core earnings, reversal of timing differences, and to the extent necessary, through the implementation of certain tax planning strategies surrounding the Company’s cash holdings. Therefore, the Company concluded there was sufficient positive evidence to outweigh the negative evidence of the prior year cumulative losses. There is no valuation allowance as of December 31, 2011.
From time to time, management must assess the need to accrue or disclose a possible loss contingency for proposed adjustments from various Federal, state and foreign tax authorities that regularly audit the company in the normal course of business. In making these assessments, management often must analyze complex tax laws of multiple jurisdictions.
Goodwill and Other Indefinite Lived Intangible Assets. HTH performs our annual goodwill impairment analysis for our reporting units during the fourth quarter of each year. Management determined that HTH has two reporting units, which are the Parent (the holding company) and NLASCO (the insurance company). Goodwill for HTH represents the excess of the cost over the fair value of the assets of NLASCO of $24.0 million. Goodwill is tested annually for impairment but is tested more frequently if events and circumstances indicate that the asset might be impaired. An impairment loss is recognized to the extent that the carrying amount exceeds the asset’s fair value.
The goodwill impairment analysis is a two-step test. The first step (Step #1), used to identify potential impairment involves comparing each reporting unit’s estimated fair value to its carrying value, including goodwill. If the estimated fair value of a reporting unit exceeds its carrying value, goodwill is considered not to be impaired. If the carrying value exceeds estimated fair value, there is an indication of potential impairment and the second step is performed to measure the amount of impairment. The Company has estimated fair values of reporting units based on a discounted cash flow analysis and market approach using historic, normalized actual and forecast results. The discounted cash flow analysis utilizes thirty years of projected cash flows for the insurance company operations. The projected financial results are created from critical assumptions and estimates based upon management’s business plan and historical trends, while giving consideration to the overall economic environment. Determining fair value requires the exercise of significant judgments about appropriate discount rates, business growth rates, the amount and timing of expected future cash flows and market information relevant to our overall company value.
The second step (Step #2) involves calculating an implied fair value of goodwill for each reporting unit for which the first step indicated impairment. The implied fair value of goodwill is determined in a manner similar to the amount of goodwill calculated in a business combination, by measuring the excess of the estimated fair value of the reporting unit, as determined in the first step, over the aggregate estimated fair values of the individual assets, liabilities and identifiable intangibles as if the reporting unit was being acquired in a business combination. If the implied fair value of goodwill exceeds the carrying value of goodwill assigned to the reporting unit, there is no impairment. If the carrying value of goodwill assigned to a reporting unit exceeds the implied fair value of the goodwill, an impairment charge is recorded for the excess. An impairment loss cannot exceed the carrying value of goodwill assigned to a reporting unit, and the loss establishes a new basis in the goodwill. Subsequent reversal of goodwill impairment losses is not permitted.
Next the Company reviewed the intangible assets both definite and indefinite lived. The definite lived intangibles relate to customer relationships, agency relationships, trade name and software. We believe our customer relationships to be consistent with the value given to them based on the current renewal rate being approximately 90%, slightly higher than when NLASCO was purchased. Our agent relationships remain valuable and we have experienced less than 3% turnover in our agent base since 2007. Our trade names, NLIC and ASIC, are both “A” rated companies with NLIC increased from “A-” in 2007 and ASIC in 2010. Our internally developed software, PACs, is still the main operating system of the company.
At December 31, 2011, we determined that the estimated fair value of NLASCO exceeded its carrying values and, therefore, we did not perform the second step as described above. Our fair value exceeded carrying value by 10.9% as of December 31, 2011. Consequently, we determined that no impairment existed with respect to goodwill and intangible assets at December 31, 2011.
The goodwill impairment analysis is subject to impact from uncertainties arising from such events as changes in economic or competitive conditions, the current general economic environment, material changes in the weather and hard and soft markets within the insurance industry that could positively or negatively impact anticipated future operating conditions and cash flows, and the impact of strategic decisions. If any of these factors were to material change it may require a reevaluation of our Goodwill.
5168
Table of Contents
RESULTS OF OPERATIONSDeposits
ComparisonThe Company’s major source of funds and liquidity is its deposit base. Deposits provide funding for its investment in loans and securities. Interest paid for deposits must be managed carefully to control the level of interest expense and overall net interest margin. The composition of the Year Ended December 31, 2011deposit base (time deposits versus interest-bearing demand deposits and savings) is constantly changing due to the Year Ended December 31, 2010
Results of insurance operations. NLASCO’s underwriting gain or loss consists of net premiums earned, less lossbanking segment’s needs and LAE and policy acquisition and other underwriting expenses. NLASCO’s underwriting performance is one of the most important factors in evaluating the overall results of operations given the fluctuations that can occur in loss and LAE due to weather related events, as well as the uncertainties involved in the process of estimating reserves for losses and LAE. The underwriting results and fluctuations in other revenue and expense items of NLASCO are discussed in greater detail below. The following table shows the underwriting gain or loss, as well as other revenue and expense items included in the financial results of NLASCOmarket conditions. Overall, average deposits totaled $4.6 billion for the yearmonth ended December 31, 20112012. The table below presents the average balance of deposits and 2010 (inthe average rate paid on those deposits (dollars in thousands).
| | Year Ended December 31, | | | | | |
NLASCO Summary of Insurance Operations | | 2011 | | 2010 | | Dollar | | Percentage | |
Underwriting gain (loss) | | | | | | | | | |
Homeowners | | $ | (123 | ) | $ | (2,564 | ) | $ | 2,441 | | 95.2 | % |
Fire | | (2,057 | ) | 1,844 | | (3,901 | ) | -211.6 | % |
Mobile Home | | (5,811 | ) | 845 | | (6,656 | ) | -787.7 | % |
Commercial | | (2,305 | ) | 1,779 | | (4,084 | ) | -229.6 | % |
Other | | 185 | | 188 | | (3 | ) | -1.6 | % |
Total underwriting (loss) gain | | $ | (10,111 | ) | $ | 2,092 | | $ | (12,203 | ) | -583.3 | % |
| | | | | | | | | |
Other revenue (expense items) | | | | | | | | | |
Net investment income | | 6,306 | | 5,873 | | 433 | | 7.4 | % |
Net realized gains on investments | | 817 | | 137 | | 680 | | 496.5 | % |
Other income | | 6,785 | | 6,744 | | 41 | | 0.6 | % |
Depreciation and amortization | | (1,714 | ) | (1,788 | ) | 74 | | 4.2 | % |
Interest (expense) | | (1,904 | ) | (1,961 | ) | 57 | | 2.9 | % |
Total other revenue (expense) items | | 10,290 | | 9,005 | | 1,285 | | 14.3 | % |
Operating income before federal income taxes | | 179 | | 11,097 | | (10,918 | ) | -98.4 | % |
Federal income tax expense on operating income | | 129 | | 3,934 | | (3,805 | ) | -96.7 | % |
Net income from continuing operations of NLASCO | | $ | 50 | | $ | 7,163 | | $ | (7,113 | ) | -99.3 | % |
Revenue. Revenue for the year ended December 31, 2011 was $152.5 million, compared to $131.7 million for the year ended 2010. This increase is due to net premiums earned of $134.0 for the year ended 2011, compared to $117.2 million for the year ended 2010, $10.8 million of net investment income for the year ended 2011 compared to $7.7 million for the year ended 2010, $6.8 million of other income for the year ended 2011 compared to $6.7 million in 2010 and $0.8 million in net realized investment gains for the year ended 2011 as compared to $0.1 million for the year ended 2010.
Net premiums earned are up $16.9 million for the year ended 2011 as compared to the year ended 2010 due to higher written premiums of $16.1 million and lower reinsurance costs of $4.0 million, offset by increase in unearned premiums of $3.2 million. Net investment income increased $2.9 million for the year ended 2011 as compared to the year ended 2010 due to higher investment income at the parent (HTH) of $2.5 million and $0.4 million at NLASCO.
Underwriting Results. The following table shows the components of NLASCO’s underwriting gain for the year ended December 31, 2011 and 2010. NLASCO’s underwriting gain or loss consists of net premiums earned, less loss and LAE and policy acquisition and other underwriting expenses. The underwriting results are discussed below (in thousands).
| | Year Ended December 31, | | | | | |
| | 2011 | | 2010 | | Dollar | | Percentage | |
Direct premiums written | | $ | 155,054 | | $ | 139,290 | | $ | 15,764 | | 11.3 | % |
Net premiums written | | $ | 141,737 | | $ | 121,691 | | $ | 20,046 | | 16.5 | % |
| | | | | | | | | |
Net premiums earned | | $ | 134,048 | | $ | 117,192 | | $ | 16,856 | | 14.4 | % |
Loss and LAE | | 96,734 | | 70,943 | | 25,791 | | 36.4 | % |
Policy acquisition and other underwriting expenses | | 47,425 | | 44,157 | | 3,268 | | 7.4 | % |
Underwriting (loss) gain | | $ | (10,111 | ) | $ | 2,092 | | $ | (12,203 | ) | -583.3 | % |
| | | | | | | | | |
Agency expenses | | $ | (1,789 | ) | $ | (1,966 | ) | $ | 177 | | 9.0 | % |
Loss and LAE ratio | | 72.2 | % | 60.5 | % | 11.7 | % | | |
Policy acquisition and other underwriting less agency expense ratio | | 34.0 | % | 36.0 | % | -2.1 | % | | |
Combined ratio | | 106.2 | % | 96.5 | % | 9.7 | % | | |
52
Table of Contents
The loss and LAE ratio is loss and LAE expenses divided by net premiums earned for the same period. The policy acquisition and other underwriting expense ratio is policy acquisition and other underwriting expensedivided by net premiums earned for the same period. Combined ratio gives you the sum of both previous ratios.
Our combined ratio for the twelve months ended December 31, 2011 is 106.2%, as compared to 96.5% for the same period in 2010. The 9.7% increase in combined ratio in 2011 is primarily due to the 11.7% increase in loss and LAE ratio for the twelve months ended December 31, 2011, as compared to 2010. Loss and LAE expenses increased 36.4% in the twelve months ended 2011, as compared to 2010, due to higher incurred losses associated with wind and hail storms in Texas and additional losses associated with a 14.4% increase in earned premiums. Texas typically experiences seasonal tornado and hail storms; however, NLASCO suffered a dramatic increase in losses from five storms in April and May 2011 that created $19.3 million in incurred losses. Additionally, there were fifteen days of widely dispersed, exceptional weather related losses experienced during the three months ended June 30, 2011, which had incurred losses of $8.1 million. NLASCO also experienced an increase in the frequency and severity of fire losses, which resulted in $7.1 million in incurred losses above prior year. Policy acquisition and other underwriting expenses increased 7.4% for the twelve months ended December 31, 2011, as compared to 2010, which is a direct result of an 11.3% increase in direct written premiums.
| | Average | | Average | |
| | Balance | | Rate Paid | |
Noninterest-bearing demand deposits | | $ | 214,586 | | 0.00 | % |
Interest-bearing demand deposits | | 2,806,690 | | 0.01 | % |
Savings deposits | | 177,803 | | 0.03 | % |
Certificates of deposit | | 1,355,435 | | 0.04 | % |
| | $ | 4,554,514 | | 0.02 | % |
The Company seeks to consistently generate underwriting profitability. Management evaluates NLASCO’s loss and LAE ratio by bifurcating the losses to derive catastrophic and non-catastrophic loss ratios. The non-catastrophic loss ratio excludes Property Claim Services (PCS) events that exceed $1.0 millionmaturity of losses to NLASCO. Catastrophic events, including those that do not exceed our reinsurance retention, affect the Company’s loss ratios. For the twelve months endedinterest-bearing time deposits of $100,000 or more at December 31, 2011, catastrophic events that did not exceed our reinsurance retention accounted for $19.3 million of the total loss and loss adjustment expense, as compared to $12.3 million for the same period in 2010. Excluding catastrophic events, our combined ratios for the twelve months ended December 31, 2011 and 2010 would have been 90.9% and 86.0%, respectively.
For the twelve months ended December 31, 2011 and 2010, the Company had incurred losses related to two 2008 catastrophes, Hurricane Ike and Hurricane Dolly. The Company also incurred losses in 2011 related to a catastrophic wind and hail storm in Arizona from October 2010. Gross losses incurred from these storms had favorable development of $7.0 million for the year ended December 31, 2011, compared to $28.9 million of development for the same period in 2010. The redundancy in 20112012 is primarily due to decreases in ultimate losses for Hurricane Ike and Hurricane Dolly of $9.3 million and $1.0 million, respectively, which were offset by development on the Arizona storm of $3.3 million. The losses in the year ended December 31, 2010 relate primarily to lawsuits filed in response to the pending expiration of the statute of limitations. These losses have no effect on net loss and LAE incurred because the catastrophic events exceeded our retention and are fully recoverable. The primary financial effect is additional reinstatement premium payable to the affected reinsurers. For the year ended December 31, 2011 and 2010, the Company incurred reinstatement premiums of $0.1 million and $2.5 million, respectively.
Premiums. The property and casualty insurance industry is affected by soft and hard market business cycles. During a soft market, price competition tends to increase as insurers are willing to reduce premium rates in order to maintain growth in premium volume. The soft market makes it more difficult to attract new business, as well as retain exposures that are adequately priced. Although we recognize the need to remain competitive in the marketplace, the Company remains committed to its disciplined underwriting philosophy, accepting only risks that are appropriately priced, while declining risks which are under priced for the level of coverage provided.
Direct premiums written by major product line for the year ended December 31, 2011 and 2010 are presentedset forth in the table below (in thousands):.
| | Year Ended December 31, | | | | | |
| | 2011 | | 2010 | | Dollar | | Percentage | |
Direct Premiums Written: | | | | | | | | | |
Homeowners | | $ | 70,177 | | $ | 63,413 | | $ | 6,764 | | 10.7 | % |
Fire | | 49,812 | | 45,637 | | 4,175 | | 9.1 | % |
Mobile Home | | 26,353 | | 22,344 | | 4,009 | | 17.9 | % |
Commercial | | 8,380 | | 7,537 | | 843 | | 11.2 | % |
Other | | 332 | | 359 | | (27 | ) | -7.5 | % |
| | $ | 155,054 | | $ | 139,290 | | $ | 15,764 | | 11.3 | % |
Months to maturity: | | | |
3 months or less | | $ | 154,064 | |
3 months to 6 months | | 316,401 | |
6 months to 12 months | | 230,550 | |
Over 12 months | | 280,236 | |
| | $ | 981,251 | |
Total direct premiums written increased for the year endedAt December 31, 2011 for all insurance products except for other due to expanded distribution of additional insurance products and growth on existing insurance products. New homeowners and commercial insurance products generated $9.02012, there were $701.0 million in direct written premiums for the twelve months ended December 31, 2011. Our existing products grew by $6.8 million in Texas, Oklahoma, Georgia, Tennessee and Arizona in the twelve months ended December 31, 2011, as comparedinterest-bearing time deposits scheduled to the same period in 2010.mature within one year.
53Borrowings
Table of Contents
Net premiums written by major product line for the year endedOur borrowings at December 31, 2011 and 20102012 are presentedshown in the table below (in thousands):
| | Year Ended December 31, | | | | | |
| | 2011 | | 2010 | | Dollar | | Percentage | |
Net Premiums Written: | | | | | | | | | |
Homeowners | | $ | 64,150 | | $ | 55,401 | | $ | 8,749 | | 15.8 | % |
Fire | | 45,534 | | 39,871 | | 5,663 | | 14.2 | % |
Mobile Home | | 24,090 | | 19,521 | | 4,569 | | 23.4 | % |
Commercial | | 7,660 | | 6,585 | | 1,075 | | 16.3 | % |
Other | | 303 | | 313 | | (10 | ) | -3.2 | % |
| | $ | 141,737 | | $ | 121,691 | | $ | 20,046 | | 16.5 | % |
Total net premiums written increased for the year ended December 31, 2011 for all lines of business, except other, due to higher direct written premiums of $15.8 million, and a decrease in ceded premiums of $4.0 million. Ceded premiums decreased primarily as a result of lower reinstatement premiums of $2.4 million and lower reinsurance costs of $1.9 million in 2011 as compared to 2010. Reinsurance costs decreased in the year ended December 31, 2011, due to the Company increasing retention by $2.0 million.
Net premiums earned by major product line for the year ended December 31, 2011 and 2010 are presented in the table below (in thousands):
| | Year Ended December 31, | | | | | |
| | 2011 | | 2010 | | Dollar | | Percentage | |
Net Premiums Earned: | | | | | | | | | |
Homeowners | | $ | 60,671 | | $ | 53,353 | | $ | 7,318 | | 13.7 | % |
Fire | | 43,063 | | 38,397 | | 4,666 | | 12.2 | % |
Mobile Home | | 22,783 | | 18,799 | | 3,984 | | 21.2 | % |
Commercial | | 7,244 | | 6,341 | | 903 | | 14.2 | % |
Other | | 287 | | 302 | | (15 | ) | -5.0 | % |
| | $ | 134,048 | | $ | 117,192 | | $ | 16,856 | | 14.4 | % |
Net premiums earned for the year ended December 31, 2011 increased $16.9 million as compared to 2010 due to an increase in net premiums written of $20.0 million, offset by an increase in unearned premiums of $3.2 million.
Loss and Loss Adjustment Expenses. Loss and LAE are recognized based on formula and case basis estimates for losses reported with respect to direct business, estimates of unreported losses based on past experience and deduction of amounts for reinsurance placed with reinsurers. Loss and LAE for the twelve months ended December 31, 2011 was $96.7 million, as compared to $70.9 million for the same period in 2010. The $25.8 million increase is a result of wind and hail storms that occurred in 2011 in Texas, in which five storms incurred losses of $19.3 million, and fifteen days of widely dispersed, exceptional weather related losses had incurred losses of $8.1 million.
The loss and LAE ratio is calculated by taking the ratio of incurred losses and LAE to net premiums earned. The loss and LAE ratio for the year ended December 31, 2011 and 2010 was 72.2% and 60.5%, respectively.
| | | | Average | |
| | Balance | | Rate Paid | |
Short-term borrowings | | $ | 728,250 | | 0.33 | % |
Notes payable | | 141,539 | | 5.89 | % |
Junior subordinated debentures | | 67,012 | | 3.53 | % |
| | $ | 936,801 | | 1.40 | % |
54
TableShort-term borrowings consist of Contents
The Company’s net lossfederal funds purchased, securities sold under agreements to repurchase, borrowings at the FHLB and LAEshort-term bank loans. Notes payable is comprised of borrowings under term notes and the gross lossa revolving line of credit with JPMorgan Chase and LAE ratios for the year endednonrecourse notes owed by First Southwest. At December 31, 2011 and 2010 are shown in the tables below:
| | Year Ended | | Year Ended | |
| | December 31, 2011 | | December 31, 2010 | |
Loss and LAE (in thousands): | | | | | |
Homeowners | | $ | 39,329 | | $ | 35,814 | |
Fire | | 29,885 | | 22,085 | |
Mobile Home | | 20,534 | | 10,871 | |
Commercial | | 6,986 | | 2,173 | |
| | $ | 96,734 | | $ | 70,943 | |
| | | | | |
Incurred Claim Count: | | | | | |
Homeowners | | 6,838 | | 8,010 | |
Fire | | 8,413 | | 6,273 | |
Mobile Home | | 9,518 | | 4,870 | |
Commercial | | 1,162 | | 998 | |
| | 25,931 | | 20,151 | |
Average Loss and LAE per Claim: | | | | | |
Homeowners | | $ | 5,752 | | $ | 4,471 | |
Fire | | 3,552 | | 3,521 | |
Mobile Home | | 2,157 | | 2,232 | |
Commercial | | 6,012 | | 2,177 | |
| | | | | |
Loss and LAE Ratio: | | | | | |
Homeowners | | 64.8 | % | 67.1 | % |
Fire | | 69.4 | % | 57.5 | % |
Mobile Home | | 90.1 | % | 57.8 | % |
Commercial | | 96.4 | % | 34.3 | % |
Policy Acquisition and Other Underwriting Expenses. Policy acquisition and other underwriting expenses for the year ended December 31, 2011 and 2010 were as follows (in thousands):
| | Twelve Months Ended December 31, | | | | | |
| | 2011 | | 2010 | | Dollar | | Percentage | |
Amortization of deferred policy acquisition costs | | $ | 34,755 | | $ | 31,256 | | $ | 3,499 | | 11.2 | % |
Other underwriting expenses | | 12,670 | | 12,901 | | (231 | ) | -1.8 | % |
Total policy acquisition and other underwriting expenses | | 47,425 | | 44,157 | | 3,268 | | 7.4 | % |
Agency expenses | | (1,789 | ) | (1,966 | ) | 177 | | 9.0 | % |
Total policy acquisition and other underwriting expenses less agency expenses | | $ | 45,636 | | $ | 42,191 | | $ | 3,445 | | 8.2 | % |
Net premiums earned | | $ | 134,048 | | $ | 117,192 | | $ | 16,856 | | 14.4 | % |
Expense ratio | | 34.0 | % | 36.0 | % | -2.0 | % | | |
Total policy acquisition and other underwriting expenses, less agency expenses, are up $3.5 million for the twelve months ended December 31, 2011, as compared to the same period in 2010, due to higher amortization2012, PrimeLending had a revolving line of deferred policy acquisition costs (DAC). DAC increased during the year ended December 31, 2011 due to increases in direct written premiums, as compared to the year ended 2010.
General and Administrative Expense. General and administrative expense for 2011 was $8.9 million, as compared to $7.4 million for 2010, an increase of $1.5 million, or 20.3%. This increase is primarily due to increases in professional servicescredit with JPMorgan Chase which had availability of $1.0 million and other administrative expenses of $0.5 million. The increase in professional fees is due to an increase in acquisition activities related to due diligence activities in 2011. Other administrative expenses increased due to the premium of $0.5 million paid on the repurchase of $6.9 million of our senior exchangeable notes.
Depreciation and Amortization Expense. Depreciation and amortization expense was $1.7 million for the year ended December 31, 2011, as compared to $1.8 million in 2010.
Interest Expense. Interest expense was $9.0 million for the twelve months ended 2011 and 2010.
55
Table of Contents
Income Taxes. The Company had a $5.0 million income tax benefit for the year ended December 31, 2011, compared to $1.0 million for 2010. The benefit increased in 2011 due to pre-tax losses of $11.5 million for the year ended December 31, 2011 as compared to $1.6 million loss for the same period in 2010. Also contributing to the benefit in 2011 was the release of the allowance for uncertain tax positions on the state tax receivable at the parent of $1.0 million. We allocate income taxes in accordance with ASC 740.
Preferred Stock Dividend. On March 11, 2010 and June 10, 2010, the HTH board of directors declared quarterly cash dividends of $0.5156 per share on each of the 5,000,000 outstanding shares of our Series A Preferred Stock, payable April 30, 2010 and July 30, 2010, amounting to $2.6 million on each disbursement date. On August 6, 2010, the Company called for redemption all of the outstanding shares of its Series A Preferred Stock. The Series A Preferred Stock was redeemed on September 6, 2010, at a cash redemption price of $25.2063 per share, representing the liquidation preference of $25.00 per share, plus accrued and unpaid dividends to, and including, the date of redemption. For the twelve months ended December 31, 2011, the dividend was $0.00 per share as compared to $1.2375 per share in the twelve months ended December 31, 2010.
Net Loss Attributable to Common Stockholders. As a result of the foregoing, our net loss attributable to common stockholders was $6.5 million for 2011, as compared to $13.5 million for 2010, a decrease of $7.0 million. The majority of this difference is due to the lower underwriting profit of $12.2 million for the twelve months ended December 31, 2011, as compared to 2010.not been drawn against.
Comparison of the Year Ended December 31, 2010 to the Year Ended December 31, 2009Liquidity and Capital Resources
Results of insurance operations. NLASCO’s underwriting gain or loss consists of net premiums earned, less loss and LAE and policy acquisition and other underwriting expenses. NLASCO’s underwriting performance is one of the most important factors in evaluating the overall results of operations given the fluctuations that can occur in loss and LAE due to weather related events, as well as the uncertainties involved in the process of estimating reserves for losses and LAE. The underwriting results and fluctuations in other revenue and expense items of NLASCO are discussed in greater detail below. The following table shows the underwriting gain or loss, as well as other revenue and expense items included in the financial results of NLASCO for the year ended December 31, 2010 and 2009 (in thousands).
| | Year Ended December 31, | | | | | |
NLASCO Summary of Insurance Operations | | 2010 | | 2009 | | Dollar | | Percentage | |
Underwriting gain (loss) | | | | | | | | | |
Homeowners | | $ | (2,564 | ) | $ | (4,227 | ) | $ | 1,663 | | 39.3 | % |
Fire | | 1,844 | | 3,556 | | (1,712 | ) | -48.1 | % |
Mobile Home | | 845 | | 1,155 | | (310 | ) | -26.8 | % |
Commercial | | 1,779 | | 967 | | 812 | | 84.0 | % |
Other | | 188 | | 209 | | (21 | ) | -10.0 | % |
Total underwriting gain(loss) | | $ | 2,092 | | $ | 1,660 | | $ | 432 | | -26.0 | % |
| | | | | | | | | |
Other revenue (expense items) | | | | | | | | | |
Net investment income | | 5,873 | | 6,165 | | (292 | ) | -4.7 | % |
Net realized gains (losses) on investments | | 137 | | 83 | | 54 | | 65.1 | % |
Other income | | 6,744 | | 6,917 | | (173 | ) | -2.5 | % |
Depreciation and amortization | | (1,788 | ) | (1,981 | ) | 193 | | 9.7 | % |
Interest (expense) | | (1,961 | ) | (2,601 | ) | 640 | | 24.6 | % |
Total other revenue (expense) items | | 9,005 | | 8,583 | | 422 | | 4.9 | % |
Operating income (loss) before federal income taxes | | 11,097 | | 10,243 | | 854 | | 8.3 | % |
Federal income tax expense on operating income | | 3,934 | | 3,578 | | 356 | | -9.9 | % |
Net income (loss) from continuing operations of NLASCO | | $ | 7,163 | | $ | 6,665 | | $ | 498 | | 7.5 | % |
Revenue. Revenue for the year ended December 31, 2010 was $131.7 million, compared to $128.8 million for the year ended 2009. This increase is due to net premiums earned of $117.2 for the year ended 2010, compared to $115.2 million for the year ended 2009, $7.7 million of net investment income for the year ended 2010 compared to $6.5 million for the year ended 2009, $6.7 million of other income for the year ended 2010 compared to $6.9 million in 2009 and $0.1 million in net realized investment gains for the year ended 2010 as compared to $0.3 million for the year ended 2009.
Net premiums earned are up $2.0 million for the year ended 2010 as compared to the year ended 2009 due to higher net written premiums offset by greater change in net unearned premiums. Net investment income increased $1.2 million for the year ended 2010 as compared to the year ended 2009 due to higher yields on the cash held at the parent (HTH).
56
Table of Contents
Underwriting Results. The following table shows the components of NLASCO’s underwriting gain for the year ended December 31, 2010 and 2009. NLASCO’s underwriting gain or loss consists of net premiums earned, less loss and LAE and policy acquisition and other underwriting expenses. The underwriting results are discussed below (in thousands).
| | Year Ended December 31, | | | | | |
| | 2010 | | 2009 | | Dollar | | Percentage | |
Direct premiums written | | $ | 139,290 | | $ | 131,309 | | $ | 7,981 | | 6.1 | % |
Net premiums written | | $ | 121,691 | | $ | 114,743 | | $ | 6,948 | | 6.1 | % |
| | | | | | | | | |
Net premiums earned | | $ | 117,192 | | $ | 115,153 | | $ | 2,039 | | 1.8 | % |
Loss and LAE | | 70,943 | | 70,295 | | 648 | | 0.9 | % |
Policy acquisition and other underwriting expenses | | 44,157 | | 43,198 | | 959 | | 2.2 | % |
Underwriting gain | | $ | 2,092 | | $ | 1,660 | | $ | 432 | | 26.0 | % |
| | | | | | | | | |
Agency expenses | | $ | (1,966 | ) | $ | (2,051 | ) | $ | 85 | | 4.1 | % |
Loss and LAE ratio | | 60.5 | % | 61.0 | % | -0.5 | % | | |
Policy acquisition and other underwriting less agency expense ratio | | 36.0 | % | 35.7 | % | 0.3 | % | | |
Combined ratio | | 96.5 | % | 96.7 | % | -0.2 | % | | |
The loss and LAE ratio is loss and LAE expenses divided by net premiums earned for the same period. The policy acquisition and other underwriting expense ratio is policy acquisition and other underwriting expensedivided by net premiums earned for the same period. Combined ratio gives you the sum of both previous ratios.
Our combined ratio for the twelve months ended December 31, 2010 is 96.5%, as compared to 96.8% for the same period in 2009. The decrease in loss and LAE ratio in 2010 is due to lower average loss per claim, offset in part by the emergence of prior year claims in 2010. The higher loss and LAE ratio in 2009 is primarily due to the incurred losses related to non-catastophic claims, specifically the wind and hail losses, which tended to be more significant than current experience.
The Company seeks to consistently generate underwriting profitability. Management evaluates NLASCO’s loss and LAE ratio by bifurcating the losses to derive catastrophic and non-catastrophic loss ratios. The non-catastrophic loss ratio excludes Property Claim Services (PCS) events that exceed $250,000 of losses to NLASCO. Catastrophic events, including those that do not exceed our reinsurance retention, affect the Company’s loss ratios. For the twelve months ended December 31, 2010, catastrophic events that did not exceed our reinsurance retention accounted for $12.3 million of the total loss and loss adjustment expense, as compared to $9.8 million for the same period in 2009. Excluding catastrophic events, our combined ratios for the twelve months ended December 31, 2010 and 2009 would have been 86.0% and 88.2%, respectively.
For the twelve months ended December 30, 2010 and 2009, the Company had incurred losses related to two 2008 catastrophes, Hurricane Ike and Hurricane Dolly. Gross losses incurred from these storms were $26.0 million for the year ended December 31, 2010, compared to $24.3 million for the same period in 2009. The losses in the year ended December 31, 2010 relate primarily to lawsuits filed in response to the pending expiration of the statute of limitations. These losses have no effect on net loss and LAE incurred because the catastrophic events exceeded our retention and are fully recoverable. The primary financial effect is additional reinstatement premium payable to the affected reinsurers. For the year ended December 31, 2010 and 2009, the Company incurred reinstatement premiums of $2.5 million and $1.0 million, respectively.
Premiums. The property and casualty insurance industry is affected by soft and hard market business cycles. During a soft market, price competition tends to increase as insurers are willing to reduce premium rates in order to maintain growth in premium volume. The soft market makes it more difficult to attract new business, as well as retain exposures that are adequately priced. Although we recognize the need to remain competitive in the marketplace, the Company remains committed to its disciplined underwriting philosophy, accepting only risks that are appropriately priced, while declining risks which are under priced for the level of coverage provided.
57
Table of Contents
Direct premiums written by major product line for the year ended December 31, 2010 and 2009 are presented in the table below (in thousands):
| | Year Ended December 31, | | | | | |
| | 2010 | | 2009 | | Dollar | | Percentage | |
Direct Premiums Written: | | | | | | | | | |
Homeowners | | $ | 63,413 | | $ | 57,356 | | $ | 6,057 | | 10.6 | % |
Fire | | 45,637 | | 46,815 | | (1,178 | ) | -2.5 | % |
Mobile Home | | 22,344 | | 20,439 | | 1,905 | | 9.3 | % |
Commercial | | 7,537 | | 6,318 | | 1,219 | | 19.3 | % |
Other | | 359 | | 381 | | (22 | ) | -5.8 | % |
| | $ | 139,290 | | $ | 131,309 | | $ | 7,981 | | 6.1 | % |
Total direct premiums written increased for the year ended December 31, 2010 for all insurance products except for fire and other due to the development of additional insurance products and a new channel of distribution in Oklahoma for our products. New homeowners insurance products generated $8.3 million in direct written premiums for the twelve months ended December 31, 2010. For the same period in 2010, direct written premiums in Oklahoma increased $1.7 million. In 2010, the Company began non-renewing policies in the first tier of the Texas sea coast and no longer writes full wind coverage along the Texas sea coast due to high losses and reinsurance costs. This has caused a decrease in homeowners and fire direct premiums written of $4.4 million for the twelve months ended December 31, 2010. Mobile home products increased $1.9 million due to increased production in Oklahoma, Georgia, Tennessee and Texas. Commercial products increased $1.2 million due to new insurance product for owners of rental property. Most of the growth associated with this new commercial product occurred in the Texas market.
Net premiums written by major product line for the year ended December 31, 2010 and 2009 are presented in the table below (in thousands):
| | Year Ended December 31, | | | | | |
| | 2010 | | 2009 | | Dollar | | Percentage | |
Net Premiums Written: | | | | | | | | | |
Homeowners | | $ | 55,401 | | $ | 50,119 | | $ | 5,282 | | 10.5 | % |
Fire | | 39,871 | | 40,909 | | (1,038 | ) | -2.5 | % |
Mobile Home | | 19,521 | | 17,861 | | 1,660 | | 9.3 | % |
Commercial | | 6,585 | | 5,521 | | 1,064 | | 19.3 | % |
Other | | 313 | | 333 | | (20 | ) | -6.0 | % |
| | $ | 121,691 | | $ | 114,743 | | $ | 6,948 | | 6.1 | % |
Total net premiums written increased for the year ended December 31, 2010 for all lines of business, except fire and other, due to higher direct written premiums of $8.0 million, offset in part by an increase in ceded premiums of $1.2 million. Ceded premiums increased as a result of higher reinstatement premiums of $1.5 million in 2010 as compared to 2009.
Net premiums earned by major product line for the year ended December 31, 2009 and 2008 are presented in the table below (in thousands):
| | Year Ended December 31, | | | | | |
| | 2010 | | 2009 | | Dollar | | Percentage | |
Net Premiums Earned: | | | | | | | | | |
Homeowners | | $ | 53,353 | | $ | 50,299 | | $ | 3,054 | | 6.1 | % |
Fire | | 38,397 | | 41,055 | | (2,658 | ) | -6.5 | % |
Mobile Home | | 18,799 | | 17,924 | | 875 | | 4.9 | % |
Commercial | | 6,341 | | 5,540 | | 801 | | 14.5 | % |
Other | | 302 | | 335 | | (33 | ) | -9.9 | % |
| | $ | 117,192 | | $ | 115,153 | | $ | 2,039 | | 1.8 | % |
Net premiums earned for the year ended December 31, 2010 increased as compared to 2009 due to an increase in net premiums written of $6.9 million, offset by an increase in unearned premiums of $4.9 million.
58
Table of Contents
Loss and Loss Adjustment Expenses. Loss and LAE are recognized based on formula and case basis estimates for losses reported with respect to direct business, estimates of unreported losses based on past experience and deduction of amounts for reinsurance placed with reinsurers. The loss and LAE ratio is calculated by taking the ratio of incurred losses and LAE to net premiums earned. The loss and LAE ratio for the year ended December 31, 2010 and 2009 was 60.5% and 61.0%, respectively. The decrease in loss and LAE ratio in 2010 is due to lower average loss per claim for the 2010 accident year, offset in part by the emergence of prior year claims in 2010.
The Company’s net loss and LAE and the gross loss and LAE ratios for the year ended December 31, 2010 and 2009 are shown in the tables below (in thousands, except claim count figures):
| | Year Ended | | Year Ended | |
| | December 31, 2010 | | December 31, 2009 | |
Loss and LAE (in thousands): | | | | | |
Homeowners | | $ | 35,814 | | $ | 35,657 | |
Fire | | 22,085 | | 22,098 | |
Mobile Home | | 10,871 | | 10,045 | |
Commercial | | 2,173 | | 2,495 | |
| | $ | 70,943 | | $ | 70,295 | |
| | | | | |
Incurred Claim Count: | | | | | |
Homeowners | | 8,010 | | 10,417 | |
Fire | | 6,273 | | 7,775 | |
Mobile Home | | 4,870 | | 4,083 | |
Commercial | | 998 | | 387 | |
| | 20,151 | | 22,662 | |
Average Loss and LAE per Claim: | | | | | |
Homeowners | | $ | 4,471 | | $ | 3,423 | |
Fire | | 3,521 | | 2,842 | |
Mobile Home | | 2,232 | | 2,460 | |
Commercial | | 2,177 | | 6,447 | |
| | | | | |
Loss and LAE Ratio: | | | | | |
Homeowners | | 67.1 | % | 70.9 | % |
Fire | | 57.5 | % | 53.8 | % |
Mobile Home | | 57.8 | % | 56.0 | % |
Commercial | | 34.3 | % | 45.0 | % |
Policy Acquisition and Other Underwriting Expenses. Policy acquisition and other underwriting expenses for the year ended December 31, 2010 and 2009 were as follows (in thousands):
| | Twelve Months Ended December 31, | | | | | |
| | 2010 | | 2009 | | Dollar | | Percentage | |
Amortization of deferred policy acquisition costs | | $ | 31,256 | | $ | 30,354 | | $ | 902 | | 3.0 | % |
Other underwriting expenses | | 12,901 | | 12,844 | | 57 | | 0.4 | % |
Total policy acquisition and other underwriting expenses | | 44,157 | | 43,198 | | 959 | | 2.2 | % |
Agency expenses | | (1,966 | ) | (2,051 | ) | 85 | | 4.1 | % |
Total policy acquisition and other underwriting expenses less agency expenses | | $ | 42,191 | | $ | 41,147 | | $ | 1,044 | | 2.5 | % |
Net premiums earned | | $ | 117,192 | | $ | 115,153 | | $ | 2,039 | | 1.8 | % |
Expense ratio | | 36.0 | % | 35.7 | % | 0.3 | % | | |
Total policy acquisition and other underwriting expenses, less agency expenses, are up $1.0 million for the twelve months ended December 31, 2010, as compared to the same period in 2009, due to higher amortization of deferred policy acquisition costs (DAC). DAC increased during the year ended December 31, 2010 due to increases in direct written premiums, as compared to the year ended 2009.
General and Administrative Expense. General and administrative expense for 2010 was $7.4 million, as compared to $7.1 million for 2009, an increase of $0.3 million, or 3.9%. This increase is primarily due to an increase in professional fees of $0.9 million, offset by decreases in salaries and benefits and management fees. The increase in professional fees is due to an increase in acquisition costs related to due diligence costs in 2010.
59
Table of Contents
Depreciation and Amortization Expense. Depreciation and amortization expense was $1.8 million for the year ended December 31, 2010, as compared to $2.0 million in 2009.
Interest Expense. Interest expense was $9.0 million for 2010, as compared to $9.7 million for 2009, a decrease of $0.7 million, or 7.2%. The decrease in interest expense is due to a decrease in the payable to the prior owner for redundant reserves as a result of a payment in February 2010.
Income Taxes. The Company had a $1.0 million income tax benefit for the year ended December 31, 2010, compared to $1.3 million for 2009. The benefit decreased in 2010 due pre-tax losses of $1.6 million for the year ended December 31, 2010 as compared to $3.5 million loss for the same period in 2009 and the recoupment of $0.6 million of state income taxes due to resolution of open state tax audits. We allocate income taxes in accordance with ASC 740, specifically 740-10-20.
Preferred Stock Dividend. On March 11, 2010 and June 10, 2010, the HTH board of directors declared quarterly cash dividends of $0.5156 per share on each of the 5,000,000 outstanding shares of our Series A Preferred Stock, payable April 30, 2010 and July 30, 2010, amounting to $2.6 million on each disbursement date. On August 6, 2010, the Company called for redemption all of the outstanding shares of its Series A Preferred Stock. The Series A Preferred Stock was redeemed on September 6, 2010, at a cash redemption price of $25.2063 per share, representing the liquidation preference of $25.00 per share, plus accrued and unpaid dividends to, and including, the date of redemption. For the twelve months ended December 31, 2010, the dividend was $1.2375 per share as compared to $2.0625 per share in the twelve months ended December 31, 2009.
Net Loss Attributable to Common Stockholders. As a result of the foregoing, our net loss attributable to common stockholders was $13.5 million for 2010, as compared to $12.4 million for 2009, an increase of $1.1 million. The majority of this difference is due higher loss and LAE of $0.6 million, higher policy acquisition and other underwriting expenses of $1.0 million and loss on redemption of preferred stock of $5.9 million, offset by higher revenues of $2.9 million and lower preferred stock dividend of $3.3 million.
LIQUIDITY AND CAPITAL RESOURCES
HTHHilltop is a holding company whose assets primarily consist of the stock of its subsidiaries and invested assets with a combined value of $925 million$7.3 billion at December 31, 2011. HTH’s2012. Hilltop’s primary investment objectives, as a holding company, are to preserve capital and have available cash resources to utilize in making opportunistic acquisitions, and, if necessary or appropriate, from additional equity or debt financing sources. Liquidity refers to the measure of our ability to meet our customers’ short-term and long-term deposit withdrawals and anticipated and unanticipated increases in loan demand without penalizing earnings. Interest rate sensitivity involves the relationships between rate-sensitive assets and liabilities and is an indication of the probable effects of interest rate fluctuations on our net interest income. We discuss our management of interest rate and other risks in Item 7A, “Quantitative and Qualitative Disclosures about Market Risk,” herein.
As69
Table of Contents
Our asset and liability group is responsible for continuously monitoring our liquidity position to ensure that assets and liabilities are managed in a manner that will meet our short-term and long-term cash requirements. Funds invested in short-term marketable instruments, the continuous maturing of other interest-earning assets, cash flows from self-liquidating investments such as mortgage-backed securities and collateralized mortgage obligations, the possible sale of available for sale securities, and the ability to securitize certain types of loans provide sources of liquidity from an asset perspective. The liability base provides sources of liquidity through deposits and the maturity structure of short-term borrowed funds. For short-term liquidity needs, we utilize federal fund lines of credit with correspondent banks, securities sold under agreements to repurchase, borrowings from the Federal Reserve and borrowings under lines of credit with other financial institutions. For intermediate liquidity needs, we utilize advances from the FHLB. To supply liquidity over the longer term, we have access to brokered certificates of deposit, term loans at the FHLB and borrowings under lines of credit with other financial institutions.
At December 31, 2012, $114.1 million of our Series B Preferred Stock was outstanding under the SBLF. The Series B Preferred Stock has an aggregate liquidation preference of $114.1 million and qualifies as Tier 1 Capital for regulatory purposes.
The terms of the Series B Preferred Stock provide for the payment of non-cumulative dividends on a quarterly basis. The dividend rate, as a percentage of the liquidation amount, fluctuates while the Series B Preferred Stock is outstanding based upon changes in the level of “qualified small business lending” (“QSBL”) by the Bank from its historical average level of QSBL at each of the four quarter ends leading up to June 30, 2010 (the “Baseline”). Until March 2016, the dividend rate will generally decrease if we increase our level of QSBL from the Baseline and increase if we decrease our level of QSBL from the Baseline, subject to certain limitations described in the Certificate of Designations.
The dividend rate on the Series B Preferred stock was 2.730% at December 31, 2012. The dividend rate for the period from January 1, 2013 to March 31, 2013 is 2.468%.
We are subject to various regulatory capital requirements administered by the federal banking agencies. Failure to meet minimum capital requirements may prompt certain actions by regulators that, if undertaken, could have a direct material adverse effect on our financial condition and results of operations. Under capital adequacy guidelines and the regulatory framework for prompt corrective action, we must meet specific capital guidelines that involve quantitative measures of our assets, liabilities, and certain off-balance sheet items as calculated under regulatory accounting practices. Our capital amounts and classification are also subject to qualitative judgments by the regulators about components, risk weightings and other factors.
At December 31, 2012, Hilltop exceeded all regulatory capital requirements with a total capital to risk weighted assets ratio of 17.81%, Tier 1 capital to risk weighted assets ratio of 17.72% and a Tier 1 capital to average assets, or leverage, ratio of 13.08%. The Tier 1 Capital (to average assets) ratio was calculated using the average assets for the month of December 2012. At December 31, 2011, we had $578.5 million2012, the Bank was also considered to be “well-capitalized.” We discuss regulatory capital requirements in cashmore detail in Note 19 to our consolidated financial statements.
Cash and cash equivalents consisting(consisting of $533.4cash and due from banks and federal funds sold), totaled $725.2 million heldat December 31, 2012, an increase of $146.7 million from $578.5 million at December 31, 2011. Deposit flows, calls of investment securities and borrowed funds, and prepayments of loans and mortgage-backed securities are strongly influenced by interest rates, general and local economic conditions and competition in the marketplace. These factors reduce the predictability of the timing of these sources of funds.
Cash provided by operations during 2012 was $113.9 million, an increase in cash flow of $117.2 million compared with 2011. Cash provided by operations increased primarily due to the PlainsCapital acquisition on November 30, 2012 and inclusion of operating activities of the banking, mortgage origination and financial advisory segments for the month ended December 31, 2012.
We use cash primarily to originate loans and purchase securities for our investment portfolio. During 2012, the amount of cash used by lending activities decreased by $60.7 million compared with 2011. Our investment securities portfolio was $1.1 billion at December 31, 2012. Cash used in our investment activities included net purchases of securities for our investment portfolio during 2012, which were $147.4 million compared to net purchases of $10.4 million during 2011. We sold approximately $4.9 million and $5.5 million of available for sale securities during the years ended December 31, 2012 and 2011, respectively.
70
Table of Contents
Cash provided by financing activities during 2012 was $19.9 million, an increase in cash provided of $26.8 million compared with 2011. The increase in cash provided was due primarily to the PlainsCapital acquisition on November 30, 2012 and the inclusion of financing activities of the banking segment for the month ended December 31, 2012
We had deposits of $4.7 billion at December 31, 2012, all of which resulted from the PlainsCapital acquisition. Deposit flows are affected by the parent companylevel of market interest rates, the interest rates and $45.1 million heldproducts offered by NLASCOcompetitors, the volatility of equity markets and its subsidiaries.other factors. At December 31, 2011, we had total investments of $224.2 million, consisting of investments in available-for-sale equities with a fair value of $19.0 million, $144.8 million in fair value of fixed maturities securities2012, money market deposits, including brokered deposits, were $2.6 billion; time deposits, including brokered deposits, were $1.4 billion and other investments consisting of a note receivable and warrants with a combined fair value of $60.4noninterest bearing demand deposits were $323.4 million. HTH held $10.1 million of the investments in available-for-sale equities and $60.4 million of other investments. NLASCO held $152.1 million in available-for-sale fixed maturity securities and $8.9 million in available-for-sale equity securities.
On July, 29, 2011, the Company extended SWS a $50 million term loan, which bears interest of 8% per annum. SWS issued us warrants to purchase 8,695,652 shares of SWS common stock, $0.10 par value per share, exercisable at a price of $5.75 per share subject to anti-dillution adjustments. HTH began purchasing SWS common stock during the quarter ended September 30, 2011 and, as of December 31, 2011, has accumulated $10.1 million of the common stock at fair value.
In November 2011, NLASCO purchased $6.9 million of the HTH senior exchangeable notes at a premium of $0.5 million. In accordance with GAAP, this purchase was eliminated in consolidation. Therefore, as of December 31, 2011, we had $131.5 million of debt, consisting of $84.0 million of senior exchangeable notes and $47.5 million of debt owed by NLASCO and its subsidiaries.
Our short-term liquidity needs as15 largest depositors, excluding our indirect wholly owned subsidiary, First Southwest and PrimeLending, accounted for approximately 19.23% of our total deposits, and our five largest depositors, excluding First Southwest, accounted for approximately 11.19% of our total deposits at December 31, 2011 include (a)2012. The loss of one or more of our largest customers, or a significant decline in the deposit balances due to ordinary course fluctuations related to these customers’ businesses, could adversely affect our liquidity and might require us to raise deposit rates to attract new deposits, purchase federal funds or borrow funds on a short-term basis to payreplace such deposits. We have not experienced any liquidity issues to date with respect to brokered deposits or our insurance claimsother large balance deposits, and we believe alternative sources of NLASCOfunding are available to more than compensate for the loss of one or more of these customers.
PrimeLending funds the mortgage loans it originates through a warehouse line of credit of up to $1.6 billion maintained with the Bank. At December 31, 2012, PrimeLending had outstanding borrowings of $1.3 billion against the warehouse line of credit. PrimeLending sells substantially all mortgage loans it originates to various investors in the secondary market with servicing released, although it may retain servicing in limited circumstances. As these mortgage loans are sold in the secondary market, PrimeLending pays down its warehouse line of credit with the Bank. In addition, PrimeLending has an available line of credit with an unrelated commercial bank of up to $1.0 million. At December 31, 2012, PrimeLending had no borrowings under this line of credit.
FSC relies on its equity capital, short-term bank borrowings, interest-bearing and subsidiariesnon-interest-bearing client credit balances, correspondent deposits, securities lending arrangements, repurchase agreement financings and (b) fundsother payables to service our total debtfinance its assets and operations. FSC has credit arrangements with three unaffiliated banks of $131.5 million.up to $215.0 million, which are used to finance securities owned, securities held for correspondent accounts and receivables in customer margin accounts. These credit arrangements are provided on an “as offered” basis and are not committed lines of credit. At December 31, 2012, FSC had borrowed $122.9 million under these credit arrangements.
Our insurance operating subsidiary NLASCO, has primary investment objectives to preserve capital and manage for a total rate of return. NLASCO’sOur strategy is to purchase securities in sectors that represent the most attractive relative value. Bonds, cash, and short-term investments constituted $197.2$190.8 million, or 95.7%93.8%, of NLASCO’s $206.1$203.4 million in investments at
60
Table of Contents
December 31, 2011.2012. NLASCO had $8.9$12.6 million, or 4.3%6.2% of its investments, in equity investments as ofat December 31, 2011.2012. We currently do not have any significant concentration in both direct and indirect guarantor exposure. NLASCO has no investments in subprime mortgages. NLASCO has custodial agreements with A.G. Edwards and Wells Fargo, Bank and an investment management agreement with DTF Holdings, LLC.
NLASCO’s liquidity requirements are met primarily by positive cash flow from operations and investment activity. Primary sources of cash from insurance operations are premiums and other considerations, net investment income and investment sales and maturities. Primary uses of cash include payments of claims, operating expenses and income taxes, funds to service $47.5 million of debt and purchases of investments. NLASCO’s insurance subsidiaries have regulatory restrictions on the amount of dividends they can declare.
We believe that existing cash and investment balances, when combined with anticipated cash flows from operations and dividends from our insurance companies, will be adequate to meet our expected liquidity needs for the reasonably foreseeable future. We will continue to pursue and investigate possible strategic opportunities. In that regard, we may need to secure external financing. We cannot assure you that we will be successful in obtaining any such financing or in the implementation of our business plan. See “Item 1A. Risk Factors” starting on page 22.
Restrictions on Dividends and Distributions
Aside from available cash and investment income on our invested assets, as a holding company we rely on dividends and other permitted distributions from our subsidiaries. The payment of dividends from our insurance subsidiaries, NLIC and ASIC, is subject to significant regulatory restrictions and limitations under debt agreements limiting their ability to declare and pay dividends.
Under Texas State Insurance Law for property and casualty companies, all dividends must be distributed out of earned surplus only. Furthermore, without the prior approval of the Commissioner, dividends cannot be declared or distributed that exceed the greater of ten percent of the company’s surplus, as shown by its last statement on file with the Commissioner, or one hundred percent of net income for such period. The subsidiaries paid no dividends to NLASCO in 2009, $6.0 million in March 2010 and no dividends in 2011. At December 31, 2011, the maximum dividend that may be paid to NLASCO in 2012 without regulatory approval is approximately $11.9 million.
Regulations of the Texas Department of Insurance require insurance companies to maintain minimum levels of statutory surplus to ensure their ability to meet their obligations to policyholders. At December 31, 2011, NLASCO’s insurance subsidiaries had statutory surplus in excess of the minimum required.
Also, the National Association of Insurance Commissioners, or NAIC, has adopted risk-based capital, or RBC, requirements for insurance companies that establish minimum capital requirements relating to insurance risk, credit risk, interest rate risk and business risk. The formula is used by the NAIC and certain state insurance regulators as an early warning tool to identify companies that require additional scrutiny or regulatory action. At December 31, 2011, the Company’s insurance subsidiaries’ RBC ratio exceeded the level at which regulatory action would be required.
We believe that restrictions on liquidity resulting from restrictions on the payments of dividends by our subsidiary companies will not have a material impact on our ability to carry out our normal business activities, including debt payments on our senior exchangeable notes.
CASH FLOWS
Comparison of the Year Ended December 31, 2011 to the Year Ended December 31, 2010
Cash used in operations was $3.3 million in 2011, as compared to cash provided by operation of $9.9 million in 2010. The Company used $13.2 million more cash in 2011 due to higher loss from operations of $6.0 million, lower income tax receivable of $2.3 million, lower deferred income taxes of $5.4 million, changes in operating assets and liabilities of $9.1 million and lower loss and LAE reserves of $39.1 million. These negative operating results were offset by a decrease in reinsurance recoverables of $43.7 million, an increase in unearned premiums of $3.2 million, and a decrease in payable to related party of $3.4 million.
6171
Table of Contents
Loss and LAE reserves and reinsurance recoverables decreased $39.1 million and $43.7 million, respectively, primarily due to settlement of claims relating to Hurricane Ike. Unearned premiums increased $3.2 million due to an increase in direct written premiums in 2011 of $15.8 million. Changes in operating assets and liabilities decreased $9.1 million due to a decrease in accounts payable and accrued expenses of $8.1 million. This is due to the changes in the reinsurance payable of $7.4 million.
Cash used in investing activities was $60.7 million in 2011, as compared to $16.7 million in 2010. The increase in cash used by investing activities of $44.0 million was primarily due to purchases of available-for-sale securities and other investments of $11.5 million and $50.0 million, respectively, lower proceeds from sales of available-for-sale securities of $11.2 million, offset by proceeds from sales of held-to-maturity securities of $7.4 million.
Cash used in financing activities was $6.9 million in 2011, as compared with $133.8 million in 2010. The decrease in cash used in financing activities was primarily due to the redemption of preferred stock in 2010 of $125 million. The cash used in 2011 is related to the repurchase of the parent held senior exchangeable notes by NLASCO.
Comparison of the Year Ended December 31, 2010 to the Year Ended December 31, 2009Contractual Obligations
Cash provided by operations was $9.9 million in 2010, as comparedThe following table presents information regarding our contractual obligations at December 31, 2012 (in thousands). Payments related to $18.9 million in 2009. Cash provided by operations decreased $9.0 million primarily due to increase in deferred acquisition costs of $1.7 million, decrease in cash received from income taxes of $20.2 million, decrease in payable to related party of $4.4 million, offset by decrease in net loss of $1.6 million, increase in deferred income taxes of $0.5 million, increase in unearned premiums of $5.0 million and changes in operating assets and liabilities of $10.2 million.
The increase in deferred acquisition costs is attributable to increases in higher written premiumsleases are based on actual payments specified in the year ended December 2010 as compared to 2009. The decrease in income taxes payable is due to receiving $1.9 million in refunds on income taxes in 2010 as compared to receiving $23.4 million in refunds in 2009. Changes in operating assetsunderlying contracts. Our reserve for losses and liabilities increased $10.2 million due to increases in loss and LAE reserves of $6.3 million, increases in reinstatement premiums payable of $5.4 million, decreases in investments of $0.5 million and decreases in premium and agents’ balances of $1.0 million.
Cash used in investing activities was $16.7 million in 2010, as compared to cash provided by investing activities of $32.1 million in 2009. The decrease in cash provided by investing activities of $48.8 million was primarily due to proceeds from maturities and purchases of available-for-sale securities decreasing $26.1 million and a decrease in restricted cash of $18.5 million.
Cash used in financing activities was $133.8 million in 2010, as compared with $10.3 million in 2009. The increase in cash used in financing activities primarily was due to the redemption of preferred stock in 2010 of $125 million.
INFLATION
Inflation in the U.S. has been relatively low in recent years and did not have a material impact on our results of operations for the years ended December 31, 2011, 2010 and 2009. Although the impact of inflation has been relatively insignificant in recent years, it remains a factor in the U.S. economy and may increase the cost of labor and utilities.
COMMITMENTS
At December 31, 2011, we had $131.5 million of outstanding indebtedness. It consists of the following: $84 million, or 64%, of our total indebtedness is fixed rate and $47.5 million, or 36%, is variable rate. At December 31, 2011, we had the following indebtedness outstanding with the following repayment obligations (in thousands):
| | Principal Commitments | | Interest Commitments | | Total Debt Commitments | |
| | Fixed | | Variable | | Total | | Fixed | | Variable(1) | | Total | | Fixed | | Variable | | Total | |
| | | | | | | | | | | | | | | | | | | |
2012 | | $ | — | | $ | — | | $ | — | | $ | 6,296 | | $ | 1,865 | | $ | 8,161 | | $ | 6,296 | | $ | 1,865 | | $ | 8,161 | |
2013 | | — | | — | | — | | 6,296 | | 2,203 | | 8,499 | | 6,296 | | 2,203 | | 8,499 | |
2014 | | — | | — | | — | | 6,296 | | 2,564 | | 8,860 | | 6,296 | | 2,564 | | 8,860 | |
2015 | | — | | — | | — | | 6,296 | | 2,934 | | 9,230 | | 6,296 | | 2,934 | | 9,230 | |
2016 | | — | | — | | — | | 6,296 | | 3,143 | | 9,439 | | 6,296 | | 3,143 | | 9,439 | |
Thereafter | | 83,950 | | 47,500 | | 131,450 | | 50,370 | | 59,717 | | 110,087 | | 134,320 | | 107,217 | | 241,537 | |
Commitments | | $ | 83,950 | | $ | 47,500 | | $ | 131,450 | | $ | 81,851 | | $ | 72,426 | | $ | 154,277 | | $ | 165,801 | | $ | 119,926 | | $ | 285,727 | |
(1) For variable rate debt, interest commitments were calculated as expected interest payments based on the weighted average of current interest rates.
62
Table of Contents
At December 31, 2011 the following table shows our outstanding commitments for leases (in thousands).
| | Payments Due by Period | |
| | Less than | | 1-3 | | | |
Lease Obligations | | 1 year | | years | | Total | |
Total lease obligations | | $ | 519 | | $ | 1,558 | | $ | 2,077 | |
| | | | | | | | | | |
NLASCO’s loss reserves doadjustment expenses does not have contractual maturity dates. BasedHowever, based on historical payment patterns, however, the following table estimates when management expectsamounts presented are management’s estimate of the loss reserves to be paid.expected timing of these payments. The timing of payments is subject to significant uncertainty. NLASCO maintains a portfolio of investments with varying maturities to provide adequate cash flows for such payments.
| | Payments Due by Period | |
| | | | More than 1 | | 3 Years or | | | | | |
| | 1 year | | Year but Less | | More but Less | | 5 Years | | | |
| | or Less | | than 3 Years | | than 5 Years | | or More | | Total | |
Reserve for losses and loss adjustment expenses | | $ | 19,694 | | $ | 11,292 | | $ | 2,857 | | $ | 169 | | $ | 34,012 | |
Short-term borrowings | | 730,632 | | — | | — | | — | | 730,632 | |
Long-term debt obligations | | 11,696 | | 32,613 | | 14,360 | | 355,814 | | 414,483 | |
Capital lease obligations | | 1,063 | | 2,170 | | 2,232 | | 10,680 | | 16,145 | |
Operating lease obligations | | 19,308 | | 29,602 | | 19,416 | | 34,608 | | 102,934 | |
Total | | $ | 782,393 | | $ | 75,677 | | $ | 38,865 | | $ | 401,271 | | $ | 1,298,206 | |
Impact of Inflation and Changing Prices
The Company’s consolidated financial statements included herein have been prepared in accordance with GAAP, which presently requires the Company to measure financial position and operating results primarily in terms of historic dollars. Changes in the relative value of money due to inflation or recession are generally not considered. The primary effect of inflation on the operations of the Company is reflected in increased operating costs. In management’s opinion, changes in interest rates affect the financial condition of a financial institution to a far greater degree than changes in the inflation rate. While interest rates are greatly influenced by changes in the inflation rate, they do not necessarily change at the same rate or in the same magnitude as the inflation rate. Interest rates are highly sensitive to many factors that are beyond the control of the Company, including changes in the expected rate of inflation, the influence of general and local economic conditions and the monetary and fiscal policies of the U.S. government, its agencies and various other governmental regulatory authorities.
Off-Balance Sheet Arrangements; Commitments; Guarantees
In the normal course of business, we enter into various transactions, which, in accordance with accounting principles generally accepted in the United States, are not included in our consolidated balance sheets. We enter into these transactions to meet the financing needs of our customers. These transactions include commitments to extend credit and standby letters of credit, which involve, to varying degrees, elements of credit risk and interest rate risk in excess of the amounts recognized in our consolidated balance sheets.
We enter into contractual loan commitments to extend credit, normally with fixed expiration dates or termination clauses, at specified rates and for specific purposes. Substantially all of our commitments to extend credit are contingent upon customers maintaining specific credit standards until the time of loan funding. We minimize our exposure to loss under these commitments by subjecting them to credit approval and monitoring procedures. We assess the credit risk associated with certain commitments to extend credit and have recorded a liability related to such credit risk in our consolidated financial statements.
Standby letters of credit are written conditional commitments issued by us to guarantee the performance of a customer to a third party. In the event the customer does not perform in accordance with the terms of the agreement with the third party, we would be required to fund the commitment. The maximum potential amount of future payments we could be required to make is represented by the contractual amount of the commitment. If the commitment is funded, we would be entitled to seek recovery from the customer. Our policies generally require that standby letter of credit arrangements contain security and debt covenants similar to those contained in loan agreements.
In the normal course of business, FSC executes, settles and finances various securities transactions that may expose FSC to off-balance sheet risk in the event that a customer or counterparty does not fulfill its contractual obligations. Examples of such transactions include the sale of securities not yet purchased by customers or for the account of FSC, clearing
72
Table of Contents
agreements between FSC and various clearinghouses and broker-dealers, secured financing arrangements that involve pledged securities, and when-issued underwriting and purchase commitments.
Critical Accounting Policies and Estimates
We have prepared our consolidated financial statements in accordance with accounting principles generally accepted in the United States of America, or GAAP, which requires us to make certain estimates and assumptions that affect amounts reported in the consolidated financial statements. As more information is becomes known, these estimates and assumptions could change, thus having an impact on the amounts reported in the future. We have provided a summary of our significant accounting policies in Note 1 to the accompanying consolidated financial statements. The followings are considered to be our critical accounting estimates.
Our accounting policies are integral to understanding the results reported. Our accounting policies are described in detail in Note 1 to our consolidated financial statements, which are included in this Annual Report. You are encouraged to read in its entirety Note 1 to our consolidated financial statements for additional insight into management’s approach and methodology in estimating the allowance for loan losses. We believe that the following are our significant accounting policies, the allowance for loan losses and our reserve for losses and loss adjustment expenses involve a higher degree of judgment and complexity.
Allowance for Loan Losses
The allowance for loan losses is a valuation allowance for probable losses inherent in the loan portfolio. Loans are charged to the allowance when the loss is confirmed or when a determination is made that a probable loss has occurred on a specific loan. Recoveries are credited to the allowance at the time of recovery. Throughout the year, management estimates the probable level of losses to determine whether the allowance for credit losses is appropriate to absorb losses in the existing portfolio. Based on these estimates, an amount is charged to the provision for loan losses and credited to the allowance for loan losses in order to adjust the allowance to a level determined to be appropriate to absorb losses. Management’s judgment regarding the appropriateness of the allowance for loan losses involves the consideration of current economic conditions and their estimated effects on specific borrowers; an evaluation of the existing relationships among loans, potential loan losses and the present level of the allowance; results of examinations of the loan portfolio by regulatory agencies; and management’s internal review of the loan portfolio. In determining the ability to collect certain loans, management also considers the fair value of any underlying collateral. The amount ultimately realized may differ from the carrying value of these assets because of economic, operating or other conditions beyond our control. For additional discussion of allowance for loan losses and provisions for loan losses, see the section entitled “Allowance for Loan Losses” earlier in this Item 7.
Reserve for Losses and Loss Adjustment Expenses
The reserve for losses and loss adjustment expenses represent our best estimate of our ultimate liability for losses and loss adjustment expenses relating to events that occurred prior to the end of any given accounting period but have not been paid. Months and potentially years may elapse between the occurrence of a loss covered by one of our insurance policies, the reporting of the loss and the payment of claims.the claim. We record a liability for estimates of losses that will be paid for claims that have been reported, which is referred to as case reserves. As claims are not always reported when they occur, we estimate liabilities for claims that have occurred but have not been reported (“IBNR”).
| | Reserves | |
| | in thousands | |
| | | |
2012 | | $ | 24,660 | |
2013 | | 10,178 | |
2014 | | 6,232 | |
2015 | | 3,138 | |
2016 | | 359 | |
Thereafter | | 268 | |
| | $ | 44,835 | |
Each of our insurance company subsidiaries establishes a reserve for all of its unpaid losses, including case reserves and IBNR reserves, and estimates for the cost to settle the claims. We estimate our IBNR reserves by estimating our ultimate liability for loss and loss adjustment expense reserves first, and then reducing that amount by the amount of cumulative paid claims and by the amount of our case reserves. The reserve analysis performed by our actuaries provides preliminary central estimates of the unpaid losses and LAE. At each quarter-end, the results of the reserve analysis are summarized and discussed with our senior management. The senior management group considers many factors in determining the amount of reserves to record for financial statement purposes. These factors include the extent and timing of any recent catastrophic events, historical pattern and volatility of the actuarial indications, the sensitivity of the actuarial indications to changes in paid and reported loss patterns, the consistency of claims handling processes, the consistency of case reserving practices, changes in our pricing and underwriting, and overall pricing and underwriting trends in the insurance market. As experience develops or new information becomes known, we increase or decrease the level of our reserves in the period in which changes to the estimates are determined. Accordingly, the actual losses and loss adjustment expenses may differ materially from the estimates we have recorded. See “Loss and Loss Adjustment Expense Reserves” earlier in this Item 7 for additional discussion.
The following table sets forth certain information73
Table of Contents
Goodwill and Identifiable Intangible Assets
Goodwill and other identifiable intangible assets were initially recorded at their estimated fair values at the date of acquisition. Goodwill and other intangible assets having an indefinite useful life are not amortized for financial statement purposes. In the event that facts and circumstances indicate that the goodwill and other identifiable intangible assets may be impaired, an interim impairment test would be required. Intangible assets with respect tofinite lives have been fully amortized over their useful lives. We perform required annual impairment tests of our indebtedness outstandinggoodwill and other intangible assets as of December 31 2011st for our insurance reporting unit, while the acquired banking, mortgage origination and 2010 excluding indebtedness related to assets heldfinancial advisory reporting units will be tested for sale (in thousands):
| | Year Ended December 31, | |
| | 2011 | | 2010 | |
| | | | | |
Senior exchangeable notes due 2025, 7.50% per annum | | $ | 83,950 | | $ | 90,850 | |
Insurance company line of credit due October 2011, base rate less 0.5% per annum | | — | | — | |
NLIC note payable due May 2033, three-month LIBOR plus 4.10% (4.66% at December 31, 2011) | | 10,000 | | 10,000 | |
NLIC note payable due September 2033, three-month LIBOR plus 4.05% (4.61% at December 31, 2011) | | 10,000 | | 10,000 | |
ASIC note payable due April 2034, three-month LIBOR plus 4.05% (4.61% at December 31, 2011) | | 7,500 | | 7,500 | |
Insurance company note payable due March 2035, three-month LIBOR plus 3.40% (3.96% at December 31, 2011) | | 20,000 | | 20,000 | |
| | $ | 131,450 | | $ | 138,350 | |
impairment annually as of October 1RECENT ACCOUNTING PROCOUNCEMENTSst.
Please referThe goodwill impairment test is a two-step process that requires us to make judgments in determining what assumptions to use in the calculation. The first step of the process consists of estimating the fair value of each reporting unit based on valuation techniques, including a discounted cash flow model using revenue and profit forecasts and recent industry transaction and trading multiples of our peers, and comparing those estimated fair values with the carrying values of the assets and liabilities of the reporting unit, which includes the allocated goodwill. If the estimated fair value is less than the carrying value, a second step is performed to compute the amount of the impairment, if any, by determining an “implied fair value” of goodwill. The determination of the “implied fair value” of goodwill of a reporting unit requires us to allocate the estimated fair value of the reporting unit to the assets and liabilities of the reporting unit. Any unallocated fair value represents the “implied fair value” of goodwill, which is compared to its corresponding carrying value.
Our evaluation includes multiple assumptions, including estimated discounted cash flows and other estimates that may change over time. If future discounted cash flows become less than those projected by us, future impairment charges may become necessary that could have a materially adverse impact on our results of operations and financial statement footnotes for accounting pronouncements.condition in the period in which the write-off occurs.
Loan Indemnification Liability
63The mortgage origination segment may be responsible for errors or omissions relating to its representations and warranties that the loans sold meet certain requirements, including representations as to underwriting standards and the validity of certain borrower representations in connection with the loan. If determined to be at fault, the mortgage origination segment either repurchases the loans from the investors or reimburses the investors’ losses (a “make-whole” payment). The mortgage origination segment has established an indemnification liability for such probable losses based upon, among other things, the level of current unresolved repurchase requests, the volume of estimated probable future repurchase requests, our ability to cure the defects identified in the repurchase requests, and the severity of the estimated loss upon repurchase. Although we consider this reserve to be appropriate, there can be no assurance that the reserve will prove to be appropriate overtime to cover ultimate losses, due to unanticipated adverse changes in the economy and historical loss patterns, discrete events adversely affecting specific borrowers or industries, and/or actions taken by institutions or investors. The impact of such matters will be considered in the reserving process when known.
Acquisition Accounting
We account for business combinations using the acquisition method, which requires an allocation of the purchase price of an acquired entity to the assets acquired, including identifiable intangibles, and liabilities assumed based on their estimated fair values at the date of acquisition. Management applies various valuation methodologies to these acquired assets and assumed liabilities which often involve a significant degree of judgment, particularly when liquid markets do not exist for the particular item being valued. Examples of such items include loans, deposits, identifiable intangible assets and certain other assets and liabilities acquired or assumed in business combinations. Management uses significant estimates and assumptions to value such items, including, among others, projected cash flows, prepayment and default assumptions, discount rates, and realizable collateral values. The purchase date valuations, which are considered preliminary and are subject to change for up to one year after the acquisition date, determine the amount of goodwill recognized in connection with the business combination. While we are in the process of finalizing our purchase price allocation, significant changes are not anticipated. Certain assumptions and estimates must be updated regularly in connection with the ongoing accounting for purchased loans. Valuation assumptions and estimates may also have to be revisited in connection with periodic assessments of possible value impairment, including impairment of goodwill, intangible assets and certain other long-lived assets. The use of different assumptions could produce significantly different valuation results, which could have material positive or negative effects on the Company’s results of operations.
74
Table of Contents
ITEMItem 7A. QUANTITATIVE AND QUALITATIVE DISCLOSURES ABOUT MARKET RISKQuantitative and Qualitative Disclosures About Market Risk.
Some of the information below contains forward-looking statements. The primary objective of the following information is to provide forward-looking quantitative and qualitative information about our potential exposure to market risks. The disclosure is not meant to be a precise indicator of expected future losses, but rather an indicator of reasonably possible losses, and therefore our actual results may differ from any of the following projections. This forward-looking information provides an indicator of how we view and manage our ongoing market risk exposures.
We are engaged primarily in the business of investing funds obtained from deposits and borrowings in interest-earning loans and investments, and our primary component of market risk is interest rate risk volatility. Consequently, our earnings depend to a significant extent on our net interest income, which is the difference between interest income on loans and investments and our interest expense on deposits and borrowing. To the extent that our interest-bearing liabilities do not reprice or mature at the same time as our interest-bearing assets, we are subject to interest rate risk and corresponding fluctuations in net interest income.
Interest rate risk is the potential of economic losses due to future interest rate changes. These economic losses can be reflected as a loss of future net interest income and/or a loss of current fair market values. The magnitude of the change in earnings and market value of equity resulting from interest rate changes is impacted by the time remaining to maturity on fixed-rate obligations, the contractual ability to adjust rates prior to maturity, competition, the general level of interest rates and customer actions. Our futureobjective is to measure the effect of interest rate changes on net interest income cash flows and fair values relevant to financial instrumentsadjust the balance sheet to minimize the inherent risk while at the same time maximizing income.
There are dependent upon prevalent marketseveral common sources of interest rates. Marketrate risk that must be effectively managed if there is to be minimal impact on our earnings and capital. Repricing risk arises largely from timing differences in the pricing of assets and liabilities. Reinvestment risk refers to the reinvestment of cash flows from interest payments and maturing assets at lower or higher rates. Basis risk exists when different yield curves or pricing indices do not change at precisely the same time or in the same magnitude such that assets and liabilities with the same maturity are not all affected equally. Yield curve risk refers to unequal movements in interest rates across a full range of lossmaturities.
We have employed asset/liability management policies that attempt to manage our interest-earning assets and interest-bearing liabilities, thereby attempting to control the volatility of net interest income, without having to incur unacceptable levels of credit or investment risk. We manage our exposure to interest rates by structuring our balance sheet in the ordinary course of business. In addition, the asset/liability management policies permit the use of various derivative instruments to manage interest rate risk or hedge specified assets and liabilities.
An interest rate sensitive asset or liability is one that, within a defined time period, either matures or experiences an interest rate change in line with general market interest rates. The management of interest rate risk is performed by analyzing the maturity and repricing relationships between interest-earning assets and interest-bearing liabilities at specific points in time (“GAP”) and by analyzing the effects of interest rate changes on net interest income over specific periods of time by projecting the performance of the mix of assets and liabilities in varied interest rate environments. Interest rate sensitivity reflects the potential effect on net interest income resulting from adversea movement in interest rates. A company is considered to be asset sensitive, or have a positive GAP, when the amount of its interest-earning assets maturing or repricing within a given period exceeds the amount of its interest-bearing liabilities also maturing or repricing within that time period. Conversely, a company is considered to be liability sensitive, or have a negative GAP, when the amount of its interest-bearing liabilities maturing or repricing within a given period exceeds the amount of its interest-earning assets also maturing or repricing within that time period. During a period of rising interest rates, a negative GAP would tend to affect net interest income adversely, while a positive GAP would tend to result in an increase in net interest income. During a period of falling interest rates, a negative GAP would tend to result in an increase in net interest income, while a positive GAP would tend to affect net interest income adversely. However, it is our intent to achieve a proper balance so that incorrect rate forecasts should not have a significant impact on earnings.
Interest rate sensitivity analysis presents the amount of assets and liabilities that are estimated to reprice through specified periods. The interest rate sensitivity analysis in the table below reflects changes in banking segment earnings and costs resulting from changes in assets and liabilities on December 31, 2012 that will either be repriced in accordance with market rates, mature or are estimated to mature early within the periods indicated. This is a one-day position that is continually changing and is not necessarily indicative of our position at any other time.
As illustrated in the table below, the banking segment is asset sensitive overall. Loans that adjust daily or monthly to the Wall Street Journal Prime rate comprise a large percentage of interest sensitive assets and are the primary cause of the
75
Table of Contents
banking segment’s asset sensitivity. To help neutralize interest rate sensitivity, the banking segment has kept the terms of most of its borrowings under one year (dollars in thousands).
| | December 31, 2012 | |
| | 3 Months or | | > 3 Months to | | > 1 Year to | | > 3 Years to | | | | | |
| | Less | | 1 Year | | 3 Years | | 5 Years | | > 5 Years | | Total | |
Interest sensitive assets: | | | | | | | | | | | | | |
Loans | | $ | 2,870,366 | | $ | 407,975 | | $ | 397,517 | | $ | 155,692 | | $ | 310,359 | | $ | 4,141,909 | |
Securities | | 10,579 | | 34,871 | | 44,626 | | 13,995 | | 684,184 | | 788,255 | |
Federal funds sold and securities purchased under agreements to resell | | 4,421 | | — | | — | | — | | — | | 4,421 | |
Other interest sensitive assets | | 322,016 | | — | | — | | — | | — | | 322,016 | |
Total interest sensitive assets | | 3,207,382 | | 442,846 | | 442,143 | | 169,687 | | 994,543 | | 5,256,601 | |
| | | | | | | | | | | | | |
Interest sensitive liabilities: | | | | | | | | | | | | | |
Interest bearing checking | | $ | 1,700,656 | | $ | — | | $ | — | | $ | — | | $ | — | | $ | 1,700,656 | |
Savings | | 180,367 | | — | | — | | — | | — | | 180,367 | |
Time deposits | | 566,130 | | 629,567 | | 136,675 | | 18,504 | | 43,680 | | 1,394,556 | |
Notes payable & other borrowings | | 605,581 | | 705 | | 2,008 | | 1,077 | | 7,650 | | 617,021 | |
Total interest sensitive liabilities | | 3,052,734 | | 630,272 | | 138,683 | | 19,581 | | 51,330 | | 3,892,600 | |
| | | | | | | | | | | | | |
Interest sensitivity gap | | $ | 154,648 | | $ | (187,426 | ) | $ | 303,460 | | $ | 150,106 | | $ | 943,213 | | $ | 1,364,001 | |
| | | | | | | | | | | | | |
Cumulative interest sensitivity gap | | $ | 154,648 | | $ | (32,778 | ) | $ | 270,682 | | $ | 420,788 | | $ | 1,364,001 | | | |
| | | | | | | | | | | | | |
Percentage of cumulative gap to total interest sensitive assets | | 2.94 | % | -0.62 | % | 5.15 | % | 8.00 | % | 25.95 | % | | |
The positive GAP in the interest rate sensitivity analysis indicates that banking segment net interest income would generally rise if rates increase. Because of inherent limitations in interest rate sensitivity analysis, the banking segment uses multiple interest rate risk measurement techniques. Simulation analysis is used to subject the current repricing conditions to rising and falling interest rates in increments and decrements of 1%, 2% and 3% to determine the effect on net interest income changes for the next 12 months. The banking segment also measures the effects of changes in interest rates on market value of equity by discounting projected cash flows of deposits and loans. Market value changes in the investment portfolio are estimated by discounting future cash flows and using duration analysis. Investment security prepayments are estimated using current market information. We believe the simulation analysis presents a more accurate picture than the GAP analysis. Simulation analysis recognizes that deposit products may not react to changes in interest rates as quickly or with the same magnitude as earning assets contractually tied to a market rate index. The sensitivity to changes in market pricesrates varies across deposit products. Also, unlike GAP analysis, simulation analysis takes into account the effect of embedded options in the securities and interest rates. We currently do not use derivative financial instruments to manage, or hedge, interest rate risks related to our borrowings. We do not use derivatives for trading or speculative purposes and only enter into contracts with major financial institutions based on their credit rating and other factors.loan portfolios as well as any off-balance-sheet derivatives.
AsThe table below shows the estimated impact of increases of 1%, 2% and 3% and a decrease of 0.5% in interest rates on net interest income and on market value of portfolio equity for the banking segment at December 31, 20112012 (dollars in thousands).
December 31, 2012 | |
Change in | | Changes in | | Changes in | |
Interest Rates | | Net Interest Income | | Market Value of Equity | |
(basis points) | | Amount | | Percent | | Amount | | Percent | |
+300 | | $ | (11,305 | ) | -5.18 | % | $ | 60,424 | | 7.50 | % |
+200 | | $ | (10,859 | ) | -4.97 | % | $ | 47,418 | | 5.88 | % |
+100 | | $ | (8,713 | ) | -3.99 | % | $ | 34,474 | | 4.28 | % |
-50 | | $ | 1,516 | | 0.69 | % | $ | (45,321 | ) | -5.62 | % |
The projected changes in net interest income and market value of equity to changes in interest rates at December 31, 2012 were in compliance with established internal policy guidelines. These projected changes are based on numerous assumptions of growth and changes in the mix of assets or liabilities.
The historically low level of interest rates, combined with the existence of rate floors that are in effect for a significant portion of the loan portfolio, are projected to cause yields on our earning assets to rise more slowly than increases in market
76
Table of Contents
interest rates. As a result, in a rising interest rate environment, our interest rate margins are projected to compress until the rise in market interest rates is sufficient to allow our loan portfolio to reprice above applicable rate floors.
At December 31, 2012, total debt outstanding on our consolidated balance sheet was $131.5$141.5 million, and was comprised of approximately $83.9 million of indebtedness subject to fixed interest rates. Approximately $47.5rates and approximately $57.5 million, or 36%41%, of our total consolidated debt issubject to variable rate debt.
interest rates. If LIBOR and the prime rate were to increase by one eighth of one percent (0.125%), the increase in interest expense on the variable rate debt would decrease future earnings and cash flows by approximately $59,000 annually.
Interest risk amounts were determined by considering thenot have a significant impact of hypothetical interest rates on our financial instruments. These analyses do not consider the effect of any change in overall economic activity that could occur in that environment. Further, in the event of a change of that magnitude, we may take actions to further mitigate our exposure to the change. However, due to the uncertainty of the specific actions that would be taken and their possible effects, these analyses assume no changes in our financial structure.
The fair value of debt outstanding as of December 31, 2011 was approximately $130.0 million.future consolidated earnings or cash flows.
ITEMItem 8. FINANCIAL STATEMENTS AND SUPPLEMENTARY DATA Financial Statements and Supplementary Data.
Our financial statements required by this item are submitted as a separate section of this Annual Report on Form 10-K. Report. See “Financial Statements,” commencing on page F-1 hereof.
ITEMItem 9. CHANGES IN AND DISAGREEMENTS WITH ACCOUNTANTS ON ACCOUNTING AND FINANCIAL DISCLOSUREChanges in and Disagreements With Accountants on Accounting and Financial Disclosure.
NoneNone.
ITEMItem 9A. CONTROLS AND PROCEDURESControls and Procedures.
CONCLUSION REGARDING THE EFFECTIVENESS OF DISCLOSURE CONTROLS AND PROCEDURESConclusion Regarding the Effectiveness of Disclosure Controls and Procedures
Our management, with the participation of our Chief Executive Officer and principal financial officer, has evaluated the effectiveness of our disclosure controls and procedures (as such term is defined in Rules 13a-15(e) and 15d-15(e) under the Securities Exchange Act of 1934)Act) as of the end of the period covered by this Form 10-K.Annual Report. Based on such evaluation, our Chief Executive Officer and principal financial officer have concluded that, as of the end of such period, our disclosure controls and procedures were effective in recording, processing, summarizing and reporting, on a timely basis, information required to be disclosed by us in the reports that we file or submit under the Exchange Act and are effective in ensuring that information required to be disclosed by us in the reports that we file or submit under the Exchange Act is accumulated and communicated to our management, including our Chief Executive Officer and principal financial officer, as appropriate to allow timely decisions regarding required disclosure.
64Management’s Report on Internal Control Over Financial Reporting
Table of Contents
MANAGEMENT’S REPORT ON INTERNAL CONTROL OVER FINANCIAL REPORTING
Our management is responsible for establishing and maintaining adequate internal control over financial reporting. Internal control over financial reporting is defined in Rules 13a-15(f) and 15d-15(f) under the Exchange Act, as a process designed by, or under the supervision of, our principal executive and principal financial officers and effected by our board of directors, management and other personnel to provide reasonable assurance regarding the reliability of financial reporting and the preparation of financial statements for external purposes in accordance with generally accepted accounting principles and includes those policies and procedures that:
· pertain to the maintenance of records that in reasonable detail accurately and fairly reflect the transactions and dispositions of our assets;
· provide reasonable assurance that transactions are recorded as necessary to permit preparation of financial statements in accordance with generally accepted accounting principles, and that our receipts and expenditures are being made only in accordance with authorization of our management and directors; and
· provide reasonable assurance regarding prevention or timely detection of unauthorized acquisition, use or disposition of our assets that could have a material effect on the financial statements.
Because of its inherent limitations, internal control over financial reporting may not prevent or detect misstatements. Projections of any evaluation of effectiveness to future periods are subject to the risks that controls may become inadequate because of changes in conditions, or that the degree of compliance with the policies or procedures may deteriorate.
Management assessed the effectiveness of our internal control over financial reporting as ofat December 31, 2011.2012. In making this assessment, management used the criteria set forth by the Committee of Sponsoring Organizations of the Treadway Commission (COSO) in Internal Control-Integrated Framework. We have excluded from our evaluation the internal controls over financial reporting of PlainsCapital Corporation, which was acquired on November 30, 2012. The total assets and total income before income taxes of the excluded business represent
77
Table of Contents
$6.7 billion and $12.9 million, respectively, of the related consolidated financial statement amounts as of and for the year ended December 31, 2012. Based on our assessment, management concluded that, as ofat December 31, 2010,2012, our internal control over financial reporting is effective.
The effectiveness of our internal control over financial reporting as of December 31, 2011, has been audited by PricewaterhouseCoopers LLP, an independent registered public accounting firm as statedChanges in their report, which appears on Page F-2 of this Annual Report on Form 10-K.
CHANGES IN INTERNAL CONTROL OVER FINANCIAL REPORTINGInternal Control Over Financial Reporting
There have not been any changes in our internal controlscontrol over financial reporting during the year ended December 31, 20112012 that have materially affected, or are reasonably likely to materially affect our internal controls over financial reporting.
ITEMItem 9B. OTHER INFORMATIONOther Information.
NoneNone.
PART III
ITEMItem 10. DIRECTORS, EXECUTIVE OFFICERS AND CORPORATE GOVERNANCEDirectors, Executive Officers and Corporate Governance.
The information called for by this Item is contained in our definitive Proxy Statement for our 2013 Annual Meeting of Stockholders, and is incorporated herein by reference.
Item 11.Executive Compensation.
The information called for by this Item is contained in our definitive Proxy Statement for our 20112013 Annual Meeting of Stockholders, and is incorporated herein by reference.
ITEM 11. EXECUTIVE COMPENSATIONItem 12.Security Ownership of Certain Beneficial Owners and Management and Related Stockholder Matters.
The information called for by this Item is contained in our definitive Proxy Statement for our 2013 Annual Meeting of Stockholders, or in Item 5 of this Annual Report for the year ended December 31, 2012, and is incorporated herein by reference.
Item 13.Certain Relationships and Related Transactions, and Director Independence.
The information called for by this Item is contained in our definitive Proxy Statement for our 2013 Annual Meeting of Stockholders, and is incorporated herein by reference.
Item 14.Principal Accounting Fees and Services.
The information called for by this Item is contained in our definitive Proxy Statement for our 20112013 Annual Meeting of Stockholders, and is incorporated herein by reference.
ITEM 12.SECURITY OWNERSHIP OF CERTAIN BENEFICIAL OWNERS AND MANAGEMENT AND RELATED STOCKHOLDER MATTERS.
The information called for by this Item is contained in our definitive Proxy Statement for our 2012 Annual Meeting of Stockholders, or in Item 5 of this Annual Report on Form 10-K for the year ended December 31, 2011, and is incorporated herein by reference.
65
Table of Contents
ITEM 13. CERTAIN RELATIONSHIPS AND RELATED TRANSACTIONS, AND DIRECTOR INDEPENDENCE.
The information called for by this Item is contained in our definitive Proxy Statement for our 2012 Annual Meeting of Stockholders, and is incorporated herein by reference.
ITEM 14. PRINCIPAL ACCOUNTING FEES AND SERVICES.
The information called for by this Item is contained in our definitive Proxy Statement for our 2012 Annual Meeting of Stockholders, and is incorporated herein by reference.
6678
Table of Contents
PART IV
ITEMItem 15. EXHIBITS AND FINANCIAL STATEMENT SCHEDULESExhibits, Financial Statement Schedules.
(a) | The following documents are filed herewith as part of this Form 10-K. |
| | Page |
1. | Financial Statements. | |
| | |
Hilltop Holdings Inc. | |
| Report of Independent Registered Public Accounting Firm (PricewaterhouseCoopers LLP) for Hilltop Holdings Inc. | F-2 |
| Consolidated Balance Sheets asReport of December 31, 2011 and 2010Independent Registered Public Accounting Firm (Ernst & Young LLP) for PrimeLending
| F-3 |
| Consolidated StatementsReport of OperationsIndependent Registered Public Accounting Firm (Ernst & Young LLP) for the Years Ended December 31, 2011, 2010, and 2009First Southwest Company
| F-4 |
| Consolidated Statements of Stockholders’ Equity for the Years Ended December 31, 2011, 2010 and 2009Balance Sheets | F-5 |
| Consolidated Statements of Cash Flows for the Years Ended December 31, 2011, 2010, and 2009Operations | F-6 |
| Consolidated Statements of Comprehensive Income (Loss) | F-7 |
| Consolidated Statements of Stockholders’ Equity | F-8 |
| Consolidated Statements of Cash Flows | F-9 |
| Notes to Consolidated Financial Statements | F-7F-10
|
| | |
2. | Financial Statement Schedules. | |
| Schedule I
| Summary of Investments — Other Than Investments in Related Parties
| |
| Schedule IV
| ReinsuranceThe financial statement schedules have been omitted because they are not required, not applicable or the information has been included in our consolidated financial statements.
| |
| | |
3. | Exhibits. See the Exhibit Index following the signature page hereto. | |
6779
Table of Contents
SIGNATURES
Pursuant to the requirements of Section 13 or 15(d) of the Securities Exchange Act of 1934, the Registrantregistrant has duly caused this report to be signed on its behalf by the undersigned, thereunto duly authorized.
| HILLTOP HOLDINGS INC. |
| |
Date: March 15, 2013 | By: | /s/ Jeremy B. Ford |
| | |
By:
| /s/ JEREMYJeremy B. FORD
| | Ford |
| Jeremy B. Ford
| | President and Chief Executive Officer |
| Chief Executive Officer
| | |
| (Principal Executive Officer and duly authorized officer) | |
| | | | |
MARCH 9, 2012
| | |
Pursuant to the requirements of the Securities Exchange Act of 1934, this report has been signed below by the following persons on behalf of the registrant and in the capacities and on the date indicated:dates indicated.
Signature | | TitleCapacity in which Signed
| | Date |
|
|
|
|
|
|
|
/s/ JEREMYJeremy B. FORDFord | | President, Chief Executive Officer and Director | | March 9, 2012 | 15, 2013 |
Jeremy B. Ford | | (Principal Executive Officer) | | | |
| | | | | |
/s/ DARREN PARMENTERDarren Parmenter | | Senior Vice President (Principal Financial and— Finance | | March 9, 2012 | 15, 2013 |
Darren Parmenter | | (Principal Financial and Accounting Officer) | | | |
| | | | | |
/s/ RHODES BOBBITTCharlotte Jones Anderson | | Director and Audit Committee Member | | March 9, 2012 | 15, 2013 |
Rhodes Bobbitt
| Charlotte Jones Anderson | | | | |
| | | | | |
/s/ W. JORIS BRINKERHOFFRhodes Bobbitt | | Director | | March 9, 2012 | 15, 2013 |
W. Joris Brinkerhoff
| Rhodes Bobbitt | | | | |
| | | | | |
/s/ CHARLES R. CUMMINGSTracy A. Bolt | | Director and Chairman of Audit Committee Member | | March 9, 2012 | 15, 2013 |
Charles R. Cummings
| Tracy A. Bolt | | | | |
| | | | | |
/s/ J. MARKHAM GREENW. Joris Brinkerhoff | | Director and Audit Committee Member | | March 9, 2012 | 15, 2013 |
J. Markham Green
| W. Joris Brinkerhoff | | | | |
| | | | | |
/s/ JESS T. HAYCharles R. Cummings | | Director and Chairman of Audit Committee | | March 9, 2012 | 15, 2013 |
Jess T. Hay
| Charles R. Cummings | | | | |
| | | | | |
/s/ WILLIAM T. HILL, JR.Hill A. Feinberg | | Director | | March 9, 2012 | 15, 2013 |
William T. Hill Jr.
| A. Feinberg | | | | |
| | | | | |
/s/ W. ROBERT NICHOLS, IIIGerald J. Ford | | Director | | March 9, 2012 | 15, 2013 |
W. Robert Nichols, III
| Gerald J. Ford | | | | |
| | | | | |
/s/ C. CLIFTON ROBINSONJ. Markham Green | | Director and Audit Committee Member | | March 9, 2012 | 15, 2013 |
C. Clifton Robinson
| J. Markham Green | | | | |
| | | | | |
/s/ KENNETH D. RUSSELLJess T. Hay | | Director | | March 9, 2012 | 15, 2013 |
Kenneth D. Russell
| Jess T. Hay | | | | |
| | | | | |
/s/ CARL B. WEBBWilliam T. Hill, Jr. | | Director | | March 9, 201215, 2013 |
William T. Hill, Jr. | | | | |
| | | | |
/s/ James R. Huffines | | Director | | March 15, 2013 |
James R. Huffines | | | | |
| | | | |
/s/ Lee Lewis | | Director | | March 15, 2013 |
Lee Lewis | | | | |
| | | | |
/s/ Andrew J. Littlefair | | Director | | March 15, 2013 |
Andrew J. Littlefair | | | | |
80
Table of Contents
Signature |
| Capacity in which Signed |
| Date |
| | | | |
/s/ W. Robert Nichols, III | | Director | | March 15, 2013 |
W. Robert Nichols, III | | | | |
| | | | |
/s/ C. Clifton Robinson | | Director | | March 15, 2013 |
C. Clifton Robinson | | | | |
| | | | |
/s/ Kenneth D. Russell | | Director | | March 15, 2013 |
Kenneth D. Russell | | | | |
| | | | |
/s/ A. Haag Sherman | | Director | | March 15, 2013 |
A. Haag Sherman | | | | |
| | | | |
/s/ Robert Taylor, Jr. | | Director | | March 15, 2013 |
Robert Taylor, Jr. | | | | |
| | | | |
/s/ Carl B. Webb | | Director | | March 15, 2013 |
Carl B. Webb | | | | |
| | | | |
/s/ Alan B. White | | Director | | March 15, 2013 |
Alan B. White | | | | |
6881
Table of Contents
Exhibit
Number | | Description of Exhibit |
| | |
3.12.1
| | Agreement and Plan of Merger, dated May 8, 2012, by and among Hilltop Holdings Inc., Meadow Corporation and PlainsCapital Corporation (filed as Exhibit 2.1 to the Registrant’s Current Report on Form 8-K filed on May 11, 2012 (File No. 001-31987) and incorporated herein by reference). |
| | |
3.1* | | Articles of Amendment and Restatement of Affordable Residential Communities Inc., dated February 16, 2004, as amended or supplemented by: Articles Supplementary, dated February 16, 2004; Corporate Charter Certificate of Notice, dated June 6, 2005; Articles of Amendment, dated January 23, 2007; Articles of Amendment, dated July 31, 2007; Corporate Charter Certificate of Notice, dated September 23, 2008; and Articles Supplementary, dated December 15, 2010 (filed2010; Articles Supplementary, dated as Exhibit 3.1of November 29, 2012 relating to the Registrant’s Annual Report on Form 10-K for the year ended December 31, 2010,Subtitle 8 election; and incorporated herein by reference).Articles Supplementary relating to Non-Cumulative Perpetual Preferred Stock, Series B, of Hilltop Holdings Inc.. |
| | |
3.2 | | Second Amended and Restated Bylaws of Hilltop Holdings Inc. (filed as Exhibit 3.2 to the Registrant’s Current Report on Form 8-K filed on March 16, 2009 (File No. 001-31987) and incorporated herein by reference). |
| | |
4.1 | | Form of Certificate of Common Stock of Hilltop Holdings Inc. (filed as Exhibit 4.1 to the Registrant’s Annual Report on Form 10-K for the year ended December 31, 2007 (File No. 001-31987) and incorporated herein by reference). |
| | |
4.24.2*
| | Form of Certificate of Non-Cumulative Perpetual Preferred Stock, Series B, of Hilltop Holdings Inc. |
| | |
4.3 | | Corporate Charter Certificate of Notice, dated June 6, 2005 (filed as Exhibit 3.2 to the Registrant’s Registration Statement on Form S-3 (File No. 333-12585)333-125854) and incorporated herein by reference). |
| | |
4.3.14.4.1
| | Indenture, dated August 9, 2005, by and between Affordable Residential Communities LP and U.S. Bank National Association, as Trustee, regarding the 7½% Senior Exchangeable Notes Due 2025 of Affordable Residential Communities LP (filed as Exhibit 4.7.1 to the Registrant’s Annual Report on Form 10-K for the year ended December 31, 2009 (File No. 001-31987) and incorporated herein by reference). |
| | |
4.4.2 | | Form of Waiver to the Indenture, dated August 9, 2005, by and between Affordable Residential Communities LP and U.S. Bank National Association, as Trustee, with respect to the 7½% Senior Exchangeable Notes Due 2025 (filed as Exhibit 10.1 to the Registrant’s Current Report on Form 8-K filed on July 17, 2007 (File No. 001-31987) and incorporated herein by reference). |
| | |
4.5.1 | | Amended and Restated Declaration of Trust, dated as of July 31, 2001, by and among U.S. Bank National Association (successor in interest to State Street Bank and Trust Company of Connecticut, National Association), as Institutional Trustee, PlainsCapital Corporation (successor by merger to Plains Capital Corporation), and Alan B. White, George McCleskey, and Jeff Isom, as Administrators (filed as Exhibit 4.2 to the Registration Statement on Form 10 filed by PlainsCapital Corporation on April 17, 2009 (File No. 000-53629) and incorporated herein by reference). |
| | |
4.5.2 | | First Amendment to Amended and Restated Declaration of Trust, dated as of August 7, 2006, by and between PlainsCapital Corporation (successor by merger to Plains Capital Corporation) and U.S. Bank National Association, as Institutional Trustee (filed as Exhibit 4.3 to the Registration Statement on Form 10 filed by PlainsCapital Corporation on April 17, 2009 (File No. 000-53629) and incorporated herein by reference). |
82
Table of Contents
4.5.3 | | Indenture, dated as of July 31, 2001, by and between PlainsCapital Corporation (successor by merger to Plains Capital Corporation) and U.S. Bank National Association (successor in interest to State Street Bank and Trust Company of Connecticut, National Association), as Trustee (filed as Exhibit 4.4 to the Registration Statement on Form 10 filed by PlainsCapital Corporation on April 17, 2009 (File No. 000-53629) and incorporated herein by reference). |
| | |
4.5.4 | | First Supplemental Indenture, dated as of August 7, 2006, by and between PlainsCapital Corporation (successor by merger to Plains Capital Corporation) and U.S. Bank National Association, as Trustee (filed as Exhibit 4.5 to the Registration Statement on Form 10 filed by PlainsCapital Corporation on April 17, 2009 (File No. 000-53629) and incorporated herein by reference). |
| | |
4.5.5* | | Second Supplemental Indenture, dated as of November 30, 2012, by and among U.S. Bank National Association, as Trustee, PlainsCapital Corporation (f/k/a Meadow Corporation) and PlainsCapital Corporation. |
| | |
4.5.6 | | Amended and Restated Floating Rate Junior Subordinated Deferrable Interest Debenture of Plains Capital Corporation, dated as of August 7, 2006, by PlainsCapital Corporation (successor by merger to Plains Capital Corporation) in favor of U.S. Bank National Association, as Institutional Trustee for PCC Statutory Trust I (filed as Exhibit 4.6 to the Registration Statement on Form 10 filed by PlainsCapital Corporation on April 17, 2009 (File No. 000-53629) and incorporated herein by reference). |
| | |
4.5.7 | | Guarantee Agreement, dated as of July 31, 2001, by and between PlainsCapital Corporation (successor by merger to Plains Capital Corporation) and U.S. Bank National Association (successor in interest to State Street Bank and Trust Company of Connecticut, National Association), as Trustee (filed as Exhibit 4.7 to the Registration Statement on Form 10 filed by PlainsCapital Corporation on April 17, 2009 (File No. 000-53629) and incorporated herein by reference). |
| | |
4.5.8 | | First Amendment to Guarantee Agreement, dated as of August 7, 2006, by and between PlainsCapital Corporation (successor by merger to Plains Capital Corporation) and U.S. Bank National Association, as Guarantee Trustee (filed as Exhibit 4.8 to the Registration Statement on Form 10 filed by PlainsCapital Corporation on April 17, 2009 (File No. 000-53629) and incorporated herein by reference). |
| | |
4.6.1 | | Amended and Restated Declaration of Trust, dated as of March 26, 2003, by and among U.S. Bank National Association, as Institutional Trustee, PlainsCapital Corporation (successor by merger to Plains Capital Corporation), and Alan B. White, George McCleskey, and Jeff Isom, as Administrators (filed as Exhibit 4.9 to the Registration Statement on Form 10 filed by PlainsCapital Corporation on April 17, 2009 (File No. 000-53629) and incorporated herein by reference). |
| | |
4.6.2 | | Indenture, dated as of March 26, 2003, by and between PlainsCapital Corporation (successor by merger to Plains Capital Corporation) and U.S. Bank National Association, as Trustee (filed as Exhibit 4.10 to the Registration Statement on Form 10 filed by PlainsCapital Corporation on April 17, 2009 (File No. 000-53629) and incorporated herein by reference). |
| | |
4.6.3* | | First Supplemental Indenture, dated as of November 30, 2012, by and among U.S. Bank National Association, as Trustee, PlainsCapital Corporation (f/k/a Meadow Corporation) and PlainsCapital Corporation. |
83
Table of Contents
4.6.4 | | Floating Rate Junior Subordinated Deferrable Interest Debenture of Plains Capital Corporation, dated as of March 26, 2003, by PlainsCapital Corporation (successor by merger to Plains Capital Corporation) in favor of U.S. Bank National Association, as Institutional Trustee for PCC Statutory Trust II (filed as Exhibit 4.11 to the Registration Statement on Form 10 filed by PlainsCapital Corporation on April 17, 2009 (File No. 000-53629) and incorporated herein by reference). |
| | |
4.6.5 | | Guarantee Agreement, dated as of March 26, 2003, by and between PlainsCapital Corporation (successor by merger to Plains Capital Corporation) and U.S. Bank National Association, as Guarantee Trustee (filed as Exhibit 4.12 to the Registration Statement on Form 10 filed by PlainsCapital Corporation on April 17, 2009 (File No. 000-53629) and incorporated herein by reference). |
| | |
4.7.1 | | Amended and Restated Declaration of Trust, dated as of September 17, 2003, by and among U.S. Bank National Association, as Institutional Trustee, PlainsCapital Corporation (successor by merger to Plains Capital Corporation), and Alan B. White, George McCleskey, and Jeff Isom, as Administrators (filed as Exhibit 4.13 to the Registration Statement on Form 10 filed by PlainsCapital Corporation on April 17, 2009 (File No. 000-53629) and incorporated herein by reference). |
| | |
4.7.2 | | Indenture, dated as of September 17, 2003, by and between PlainsCapital Corporation (successor by merger to Plains Capital Corporation) and U.S. Bank National Association, as Trustee (filed as Exhibit 4.14 to the Registration Statement on Form 10 filed by PlainsCapital Corporation on April 17, 2009 (File No. 000-53629) and incorporated herein by reference). |
| | |
4.7.3* | | First Supplemental Indenture, dated as of November 30, 2012, by and among U.S. Bank National Association, as Trustee, PlainsCapital Corporation (f/k/a Meadow Corporation) and PlainsCapital Corporation. |
| | |
4.7.4 | | Floating Rate Junior Subordinated Deferrable Interest Debenture of Plains Capital Corporation, dated as of September 17, 2003, by PlainsCapital Corporation (successor by merger to Plains Capital Corporation) in favor of U.S. Bank National Association, as Institutional Trustee for PCC Statutory Trust III (filed as Exhibit 4.15 to the Registration Statement on Form 10 filed by PlainsCapital Corporation on April 17, 2009 (File No. 000-53629) and incorporated herein by reference). |
| | |
4.7.5 | | Guarantee Agreement, dated as of September 17, 2003, by and between PlainsCapital Corporation (successor by merger to Plains Capital Corporation) and U.S. Bank National Association, as Guarantee Trustee (filed as Exhibit 4.16 to the Registration Statement on Form 10 filed by PlainsCapital Corporation on April 17, 2009 (File No. 000-53629) and incorporated herein by reference). |
| | |
4.8.1 | | Amended and Restated Trust Agreement, dated as of February 22, 2008, by and among PlainsCapital Corporation (successor by merger to Plains Capital Corporation), Wells Fargo Bank, N.A., as Property Trustee, Wells Fargo Delaware Trust Company, as Delaware Trustee, and Alan B. White, DeWayne Pierce, and Jeff Isom, as Administrative Trustees (filed as Exhibit 4.17 to the Registration Statement on Form 10 filed by PlainsCapital Corporation on April 17, 2009 (File No. 000-53629) and incorporated herein by reference). |
| | |
4.8.2 | | Junior Subordinated Indenture, dated as of February 22, 2008, by and between PlainsCapital Corporation (successor by merger to Plains Capital Corporation) and Wells Fargo Bank, N.A., as Trustee (filed as Exhibit 4.18 to the Registration Statement on Form 10 filed by PlainsCapital Corporation on April 17, 2009 (File No. 000-53629) and incorporated herein by reference). |
84
Table of Contents
4.8.3* | | First Supplemental Indenture, dated as of November 30, 2012, by and between PlainsCapital Corporation and Wells Fargo Bank, National Association, as Trustee. |
| | |
4.8.4 | | Plains Capital Corporation Floating Rate Junior Subordinated Note due 2038, dated as of February 22, 2008, by PlainsCapital Corporation (successor by merger to Plains Capital Corporation) in favor of Wells Fargo Bank, N.A., as Property Trustee of PCC Statutory Trust IV (filed as Exhibit 4.19 to the Registration Statement on Form 10 filed by PlainsCapital Corporation on April 17, 2009 (File No. 000-53629) and incorporated herein by reference). |
| | |
4.8.5 | | Guarantee Agreement, dated as of February 22, 2008, by and between PlainsCapital Corporation (successor by merger to Plains Capital Corporation) and Wells Fargo Bank, N.A., as Guarantee Trustee (filed as Exhibit 4.20 to the Registration Statement on Form 10 filed by PlainsCapital Corporation on April 17, 2009 (File No. 000-53629) and incorporated herein by reference). |
| | |
10.1.1 | | First Amended and Restated Agreement of Limited Partnership of Affordable Residential Communities LP, dated February 11, 2004 (filed as Exhibit 10.1.1 to the Registrant’s Annual Report on Form 10-K for the year ended December 31, 2007 (File No. 001-31987) and incorporated herein by reference). |
| | |
10.1.2 | | Amendment to the First Amended and Restated Agreement of Limited Partnership of Affordable Residential Communities LP, dated July 3, 2007 (filed as Exhibit 10.1 to the Registrant’s Current Report on Form 8-K filed on July 6, 2007 (File No. 001-31987) and incorporated herein by reference). |
| | |
10.2.1† | | Affordable Residential Communities Inc. 2003 Equity Incentive Plan (filed as Exhibit 10.5 to the Registrant’s Registration Statement on Form S-11 (File No. 333-109816) and incorporated herein by reference). |
| | |
10.2.2† | | Form of Restricted Stock Grant Agreement for use under the Affordable Residential Communities Inc. 2003 Equity Incentive Plan (filed as Exhibit 10.2.2 to the Registrant’s Annual Report on Form 10-K for the year ended December 31, 2009 (File No. 001-31987) and incorporated herein by reference). |
| | |
10.2.3† | | Form of Affordable Residential Communities Inc. 2003 Equity Incentive Plan Non-Qualified Stock Option Agreement (filed as Exhibit 10.2.3 to the Registrant’s Annual |
69
Table of Contents
| | Report on Form 10-K for the year ended December 31, 2010 (File No. 001-31987) and incorporated herein by reference). |
| | |
10.3† | | Affordable Residential Communities Inc. Management Incentive Plan (filed as Exhibit 10.6 to the Registrant’s Registration Statement on Form S-11 (File No. 333-109816) and incorporated herein by reference). |
| | |
10.4 | | Registration Rights Agreement, dated August 9, 2005, among Affordable Residential Communities LP, Affordable Residential Communities Inc. and Merrill Lynch, Pierce, Fenner & Smith Incorporated (filed as Exhibit 10.5 to the Registrant’s Annual Report on Form 10-K for the year ended December 31, 2009 (File No. 001-31987) and incorporated herein by reference). |
| | |
10.5 | | Common Stock Delivery Agreement, dated August 9, 2005, by and between Affordable Residential Communities LP and Affordable Residential Communities Inc. (filed as Exhibit 10.6 to the Registrant’s Annual Report on Form 10-K for the year ended December 31, 2009 (File No. 001-31987) and incorporated herein by reference). |
| | |
10.6 | | Registration Rights Agreement, dated January 31, 2007, by and between Affordable Residential Communities Inc. and C. Clifton Robinson. (filed as Exhibit 10.1 to the Registrant’s Current Report on Form 8-K filed on February 5, 2007 (File No. 001-31987) and incorporated herein by reference). |
|
85
Table of Contents
| | 10.7 | | Stock Purchase Agreement, dated October 6, 2006, by and between Affordable Residential Communities Inc. and Flexpoint Fund, L.P. (filed as Exhibit 4.1 to the Registrant’s Current Report on Form 8-K filed on February 5, 2007 (File No. 001-31987) and incorporated herein by reference). |
| | |
10.8 | | Registration Rights Agreement, dated January 31, 2007, by and between Affordable Residential Communities Inc. and Flexpoint Fund, L.P. (filed as Exhibit 10.2 to the Registrant’s Current Report on Form 8-K filed on February 5, 2007 (File No. 001-31987) and incorporated herein by reference). |
| | |
10.9.1† | | Management Services Agreement, dated April 28, 2008, but effective as of January 1, 2008, by and between Hilltop Holdings Inc. and Diamond A Administration Company LLC (filed as Exhibit 10.17 to the Registrant’s Current Report on Form 8-K filed on April 30, 2008 (File No. 001-31987) and incorporated herein by reference). |
| | |
10.9.2† | | First Amendment to Management Services Agreement, dated as of March 15, 2010, by and between Hilltop Holdings Inc. and Diamond A Administration Company LLC (filed as Exhibit 10.14.2 to the Registrant’s Current Report on Form 8-K filed on March 17, 2010 (File No. 001-31987) and incorporated herein by reference). |
| | |
10.9.3† | | Second Amendment to Management Services Agreement, dated as of April 30, 2010, by and between Hilltop Holdings Inc. and Diamond A Administration Company LLC (filed as Exhibit 10.14.3 to the Registrant’s Current Report on Form 8-K filed on May 5, 2010 (File No. 001-31987) and incorporated herein by reference). |
| | |
10.10† | | Employment Agreement, dated January 31, 2007, by and between NLASCO, Inc. and Greg Vanek (filed as Exhibit 10.15 to the Registrant’s Annual Report on Form 10-K for the year ended December 31, 2009 (File No. 001-31987) and incorporated herein by reference). |
| | |
10.11† | | Retirement and Release Agreement, dated December 1, 2009, by and between Hilltop Holdings Inc. and Larry D. Willard (filed as Exhibit 10.16 to the Registrant’s Annual Report on Form 10-K for the year ended December 31, 2009 and incorporated herein by reference).
|
70
Table of Contents
10.12†
| | Compensation arrangement with Jeremy B. Ford (filed as Exhibit 10.17 to the Registrant’s Current Report on Form 8-K/A (Amendment No. 1) filed on May 5, 2010 (File No. 001-31987) and incorporated herein by reference). |
| | |
10.13.110.12.1
| | Funding Agreement, dated as of March 20, 2011, betweenby and among SWS Group, Inc., Hilltop Holdings Inc., Oak Hill Capital Partners III, L.P. and Oak Hill Capital Management Partners III, L.P. (filed as Exhibit 10.1 to the Registrant’s Current Report on Form 8-K filed on March 21, 2011 (File No. 001-31987) and incorporated herein by reference). |
| | |
10.13.210.12.2
| | Credit Agreement, dated as of July 29, 2011, by and among SWS Group, Inc., Hilltop Holdings Inc., Oak Hill Capital Partners III, L.P. and Oak Hill Capital Management Partners III, L.P. (filed as Exhibit 10.1 to the Current Report on Form 8-K filed by SWS Group, Inc. on August 1, 2011 (File No. 000-19483) and incorporated herein by reference). |
| | |
10.13.310.12.3
| | Investor Rights Agreement, dated as of July 29, 2011, by and among SWS Group, Inc., Hilltop Holdings Inc., Oak Hill Capital Partners III, L.P. and Oak Hill Capital Management Partners III, L.P. (filed as Exhibit 4.4 to the Current Report on Form 8-K filed by SWS Group, Inc. on August 1, 2011 (File No. 000-19483) and incorporated herein by reference). |
| | |
10.13.410.12.4
| | Warrant to purchase up to 8,695,652 shares of SWS Group, Inc. common stock issued to Hilltop Holdings Inc. on July 29, 2011 (filed as Exhibit 4.1 to the Current Report on Form 8-K filed by SWS Group, Inc. on August 1, 2011 (File No. 000-19483) and incorporated herein by reference). |
86
Table of Contents
10.13† | | Retention Agreement, dated May 8, 2012, but effective as of November 30, 2012, by and among Alan B. White, Hilltop Holdings Inc. and PlainsCapital Corporation (f/k/a Meadow Corporation) (filed as Exhibit 10.1 to the Registrant’s Current Report on Form 8-K filed on May 11, 2012 (File No. 001-31987) and incorporated herein by reference). |
| | |
10.14.1† | | Employment Agreement, dated December 18, 2008, but effective as of December 31, 2008, by and among First Southwest Holdings, LLC, PlainsCapital Corporation (successor by merger to Plains Capital Corporation) and Hill A. Feinberg (filed as Exhibit 10.6 to the Registration Statement on Form 10 filed by PlainsCapital Corporation on April 17, 2009 (File No. 000-53629) and incorporated herein by reference). |
| | |
10.14.2† | | First Amendment to Employment Agreement, dated as of March 2, 2009, by and among First Southwest Holdings, LLC, PlainsCapital Corporation (successor by merger to Plains Capital Corporation) and Hill A. Feinberg (filed as Exhibit 10.7 to the Registration Statement on Form 10 filed by PlainsCapital Corporation on April 17, 2009 (File No. 000-53629) and incorporated herein by reference). |
| | |
10.14.3† | | Waiver of Executive’s 2011 Bonus, dated as of March 7, 2012, by Hill A. Feinberg in favor of First Southwest Holdings, LLC (filed as Exhibit 10.8 to the Quarterly Report on Form 10-Q for the quarter ended March 31, 2012 filed by PlainsCapital Corporation (File No. 000-53629) and incorporated herein by reference). |
| | |
10.14.4*† | | Second Amendment to Employment Agreement, dated as of September 12, 2012, by and among First Southwest Holdings, LLC, PlainsCapital Corporation (successor by merger to PlainsCapital Corporation) and Hill A. Feinberg. |
| | |
10.15† | | Retention Agreement, dated May 8, 2012, but effective as of November 30, 2012, by and among Jerry L. Schaffner, Hilltop Holdings Inc. and PlainsCapital Corporation (f/k/a Meadow Corporation) (filed as Exhibit 10.2 to the Registrant’s Current Report on Form 8-K filed on May 11, 2012 (File No. 001-31987) and incorporated herein by reference). |
| | |
10.16.1† | | Employment Agreement, dated as of January 1, 2009, by and between James R. Huffines and PlainsCapital Corporation (successor by merger to PlainsCapital Corporation) (filed as Exhibit 10.1 to the Current Report on Form 8-K filed by PlainsCapital Corporation on November 16, 2010 (File No. 000-53629) and incorporated herein by reference). |
| | |
10.16.2† | | First Amendment to Employment Agreement, dated as of March 2, 2009, by and between James R. Huffines and PlainsCapital Corporation (successor by merger to PlainsCapital Corporation) (filed as Exhibit 10.2 to the Current Report on Form 8-K filed by PlainsCapital Corporation on November 16, 2010 (File No. 000-53629) and incorporated herein by reference). |
| | |
10.16.3† | | Second Amendment to Employment Agreement, dated as of November 15, 2010, by and between James R. Huffines and PlainsCapital Corporation (successor by merger to PlainsCapital Corporation) (filed as Exhibit 10.3 to the Current Report on Form 8-K filed by PlainsCapital Corporation on November 16, 2010 (File No. 000-53629) and incorporated herein by reference). |
| | |
10.16.4*† | | Third Amendment to Employment Agreement, dated as of September 12, 2012, by and between PlainsCapital Corporation (successor by merger to PlainsCapital Corporation) and James R. Huffines. |
87
Table of Contents
10.17.1† | | Employment Agreement, dated as of April 1, 2010, by and between Todd Salmans and PlainsCapital Corporation (successor by merger to PlainsCapital Corporation) (filed as Exhibit 10.21 to the Annual Report on Form 10-K for the year ended December 31, 2010, filed by PlainsCapital Corporation (File No. 000-53629) and incorporated herein by reference). |
| | |
10.17.2*† | | First Amendment to Employment Agreement, dated as of September 11, 2012, by and between PlainsCapital Corporation (successor by merger to PlainsCapital Corporation) and Todd Salmans. |
| | |
10.18*† | | Hilltop Holdings Inc. 2012 Equity Incentive Plan, effective September 20, 2012. |
| | |
10.19*† | | Hilltop Holdings Inc. Annual Incentive Plan, effective September 20, 2012. |
| | |
10.20 | | Securities Purchase Agreement, dated as of September 27, 2011, by and between PlainsCapital Corporation (successor by merger to PlainsCapital Corporation) and the Secretary of the Treasury (filed as Exhibit 10.1 to the Current Report on Form 8-K filed by PlainsCapital Corporation on September 28, 2011 (File No. 000-53629) and incorporated herein by reference). |
| | |
10.21 | | Repurchase Letter, dated as of September 27, 2011, by and between PlainsCapital Corporation (successor by merger to PlainsCapital Corporation) and the United Stated Department of the Treasury (filed as Exhibit 10.2 to the Current Report on Form 8-K filed by PlainsCapital Corporation on September 28, 2011 (File No. 000-53629) and incorporated herein by reference). |
| | |
14.1 | | Hilltop Holdings, Inc. Code of Business Conduct and Ethics (filed as Exhibit 14.1 to the Registrant’s Annual Report on Form 10-K for the year ended December 31, 2008 (File No. 001-31987) and incorporated herein by reference). |
| | |
21.1* | | List of subsidiaries of the Registrant. |
| | |
23.1* | | Consent of PricewaterhouseCoopers LLP. |
| | |
23.2* | | Consent of Ernst & Young LLP. |
| | |
31.1* | | Certification of ChiefPrincipal Executive Officer pursuant to Rule 13a-14(a) of the Securities Exchange Act of 1934, as amended. |
| | |
31.2* | | Certification of ChiefPrincipal Financial Officer pursuant to Rule 13a-14(a) of the Securities Exchange Act of 1934, as amended. |
| | |
32.1* | | Certification of ChiefPrincipal Executive Officer of Affordable Residential Communities Inc.,and Principal Financial Officer, pursuant to 18 U.S.C. Section 1350, as adopted pursuant to Section 906 of the Sarbanes-Oxley Act of 2002. |
| | |
32.2*
| | Certification of Chief Accounting Officer of Hilltop Holdings Inc., pursuant to 18 U.S.C. Section 1350, as adopted pursuant to Section 906 of the Sarbanes-Oxley Act of 2002.
|
| | |
101.INS*101 – **
| | XBRL Instance Document |
| | |
101.SCH*
| | XBRL Taxonomy Extension Schema Document
|
| | |
101.CAL*
| | XBRL Taxonomy Extension Calculation Linkbase Document
|
| | |
101.DEF*
| | XBRL Taxonomy Extension Definition Linkbase Document
|
| | |
101.LAB*
| | XBRL Taxonomy Extension Labels Linkbase Document
|
| | |
101.PRE*
| | XBRL Taxonomy Extension Presentation Linkbase Document
|
* Filed herewith.
† Exhibit is a management contract or compensatory plan.
** In accordance with Rule 406T of Regulation S-T, the information in these exhibits is “furnished” and shall not be deemed to be “filed” for purposes of Section 18 of the Securities Exchange Act of 1934, as amended, or otherwise subject to liability under that section, and shall not be incorporated by reference into any registration statement or other document filed under the Securities Act of 1933, as amended, except as expressly set forth by specific reference in such filing.
7188
Table of Contents
INDEX TO CONSOLIDATED FINANCIAL STATEMENTS AND FINANCIAL STATEMENT SCHEDULESIndex to Consolidated Financial Statements
Hilltop Holdings Inc.
F-1
Table of Contents
Report of Independent Registered Public Accounting Firm
To The Board of Directors and Stockholders of Hilltop Holdings Inc.:
In our opinion, based on our audits and the reports of other auditors, the consolidated financial statements listed in the index appearing under Item 15(a)(1) present fairly, in all material respects, the financial position of Hilltop Holdings Inc. and its subsidiaries (the “Company”) at December 31, 20112012 and 2010,2011, and the results of their operations and their cash flows for each of the three years in the period ended December 31, 20112012 in conformity with accounting principles generally accepted in the United States of America. In addition, in our opinion, the financial statement schedules listed in the index appearing under Item 15(a)(2) present fairly, in all material respects, the information set forth therein when read in conjunction with the related consolidated financial statements. Also in our opinion, the Company maintained, in all material respects, effective internal control over financial reporting as of December 31, 2011,2012, based on criteria established in Internal Control - Integrated Framework issued by the Committee of Sponsoring Organizations of the Treadway Commission (COSO). The Company’s management is responsible for these financial statements and financial statement schedules, for maintaining effective internal control over financial reporting and for its assessment of the effectiveness of internal control over financial reporting, included in Management’s Report on Internal Control over Financial Reporting appearing under Item 9A. Our responsibility is to express opinions on these financial statements on the financial statement schedules, and on the Company’s internal control over financial reporting based on our integrated audits. We did not audit the financial statements of PrimeLending and First Southwest Company, both wholly owned subsidiaries of the Company, which statements reflect total assets of approximately $1.5 billion and $0.5 billion, respectively, of the related consolidated total as of December 31, 2012 and total net income before tax of approximately $5.7 million and $1.6 million, respectively, of the related consolidated total for the year ended December 31, 2012. The 2012 financial statements of PrimeLending and First Southwest Company were audited by other auditors whose reports thereon have been furnished to us, and our opinion on the financial statements expressed herein, insofar as it relates to the amounts included for PrimeLending and First Southwest Company, is based solely on the reports of the other auditors. We conducted our audits in accordance with the standards of the Public Company Accounting Oversight Board (United States). Those standards require that we plan and perform the audits to obtain reasonable assurance about whether the financial statements are free of material misstatement and whether effective internal control over financial reporting was maintained in all material respects. Our audits of the financial statements included examining, on a test basis, evidence supporting the amounts and disclosures in the financial statements, assessing the accounting principles used and significant estimates made by management, and evaluating the overall financial statement presentation. Our audit of internal control over financial reporting included obtaining an understanding of internal control over financial reporting, assessing the risk that a material weakness exists, and testing and evaluating the design and operating effectiveness of internal control based on the assessed risk. Our audits also included performing such other procedures as we considered necessary in the circumstances. We believe that our audits and the reports of other auditors provide a reasonable basis for our opinions.
A company’s internal control over financial reporting is a process designed to provide reasonable assurance regarding the reliability of financial reporting and the preparation of financial statements for external purposes in accordance with generally accepted accounting principles. A company’s internal control over financial reporting includes those policies and procedures that (i) pertain to the maintenance of records that, in reasonable detail, accurately and fairly reflect the transactions and dispositions of the assets of the company; (ii) provide reasonable assurance that transactions are recorded as necessary to permit preparation of financial statements in accordance with generally accepted accounting principles, and that receipts and expenditures of the company are being made only in accordance with authorizations of management and directors of the company; and (iii) provide reasonable assurance regarding prevention or timely detection of unauthorized acquisition, use, or disposition of the company’s assets that could have a material effect on the financial statements.
Because of its inherent limitations, internal control over financial reporting may not prevent or detect misstatements. Also, projections of any evaluation of effectiveness to future periods are subject to the risk that controls may become inadequate because of changes in conditions, or that the degree of compliance with the policies or procedures may deteriorate.
As described in Management’s Report on Internal Control over Financial Reporting appearing under Item 9A, management has excluded consolidated PlainsCapital Corporation from its assessment of internal control over financial reporting as of December 31, 2012 because it was acquired by the Company in a purchase business combination consummated on November 30, 2012. We have also excluded PlainsCapital Corporation from our audit of internal control over financial reporting. PlainsCapital Corporation is a wholly owned subsidiary whose total assets and total net income before income taxes represent $6.7 billion and $12.9 million, respectively, of the related consolidated financial statement amounts as of and for the year ended December 31, 2012.
/s/ PricewaterhouseCoopers LLP
Dallas, Texas
March 9, 201215, 2013
F-2
Table of Contents
HILLTOP HOLDINGS INC.
CONSOLIDATED BALANCE SHEETSReport of Independent Registered Public Accounting Firm
AS OF DECEMBER
The Board of Directors and Stockholder
PrimeLending, a PlainsCapital Company
We have audited the consolidated financial statements of PrimeLending, a PlainsCapital Company (the Company), which comprise the consolidated balance sheet as of December 31, 20112012 (Successor), and 2010the related consolidated statement of income, stockholder’s equity, and cash flows for the period from December 1, 2012 through December 31, 2012 (Successor) and the period from January 1, 2012 through November 30, 2012 (Predecessor), and the related consolidated notes to the financial statements (not presented separately herein).
(in thousands except share and per share data)Management’s Responsibility for the Financial Statements
| | December 31, | | December 31, | |
| | 2011 | | 2010 | |
Assets | | | | | |
Investments | | | | | |
Fixed maturities | | | | | |
Available for sale securities, at fair value (amortized cost of $135,166 and $115,344 respectively) | | $ | 144,801 | | $ | 123,162 | |
Held-to-maturity securities, at amortized cost (fair value of $0 and $18,059, respectively) | | — | | 17,035 | |
Equity securities | | | | | |
Available for sale securities, at fair value (cost of $16,813 and $8,478, respectively) | | 19,022 | | 8,768 | |
Other investments | | | | | |
Notes receivable, at fair value (amortized cost of $38,641 and $0, respectively) | | 38,588 | | — | |
Warrants, at fair value (cost of $12,068 and $0, respectively) | | 21,789 | | — | |
Total investments | | 224,200 | | 148,965 | |
| | | | | |
Cash and cash equivalents | | 578,520 | | 649,439 | |
Accrued interest and dividends | | 1,576 | | 1,519 | |
Premiums receivable | | 24,390 | | 22,490 | |
Deferred acquisition costs | | 19,182 | | 17,237 | |
Reinsurance receivable, net of uncollectible amounts | | 25,861 | | 45,655 | |
Prepaid reinsurance premiums | | 5,056 | | 4,898 | |
Income tax receivable | | 77 | | — | |
Deferred income taxes | | 8,354 | | 9,115 | |
Goodwill | | 23,988 | | 23,988 | |
Intangible assets, definite life | | 6,074 | | 7,599 | |
Intangible assets, indefinite life | | 3,000 | | 3,000 | |
Property and equipment, net | | 2,128 | | 2,021 | |
Loan origination costs, net | | 2,471 | | 2,871 | |
Other assets | | 548 | | 844 | |
Total Assets | | $ | 925,425 | | $ | 939,641 | |
| | | | | |
Liabilities and Stockholders’ Equity | | | | | |
Liabilities | | | | | |
Reserve for losses and loss adjustment expenses | | $ | 44,835 | | $ | 58,882 | |
Unearned premiums | | 80,661 | | 72,814 | |
Reinsurance payable | | 2,845 | | 5,666 | |
Accounts payable and accrued expenses | | 8,121 | | 8,600 | |
Income taxes payable | | — | | 78 | |
Notes payable | | 131,450 | | 138,350 | |
Other liabilities | | 2,130 | | 2,196 | |
Total liabilities | | 270,042 | | 286,586 | |
| | | | | |
Commitments and Contingencies (see Note 16) | | | | | |
| | | | | |
Stockholders’ Equity | | | | | |
Common stock, $0.01 par value, 100,000,000 shares authorized, 56,500,828 and 56,495,410 shares issued and outstanding at December 31, 2011 and 2010, respectively | | 565 | | 565 | |
Additional paid-in capital | | 918,192 | | 918,046 | |
Accumulated other comprehensive gain | | 13,983 | | 5,270 | |
Accumulated deficit | | (277,357 | ) | (270,826 | ) |
Total stockholders’ equity | | 655,383 | | 653,055 | |
Total liabilities and stockholders’ equity | | $ | 925,425 | | $ | 939,641 | |
The accompanying notes are an integral partManagement is responsible for the preparation and fair presentation of these consolidated financial statements in conformity with U.S. generally accepted accounting principles; this includes the design, implementation, and maintenance of internal control relevant to the preparation and fair presentation of consolidated financial statements that are free of material misstatement, whether due to fraud or error.
Auditor’s Responsibility
Our responsibility is to express an opinion on these consolidated financial statements based on our audit. We conducted our audit in accordance with auditing standards generally accepted in the United States and in accordance with the standards of the Public Company Accounting Oversight Board (United States). Those standards require that we plan and perform the audit to obtain reasonable assurance about whether the consolidated financial statements are free of material misstatement.
An audit involves performing procedures to obtain audit evidence about the amounts and disclosures in the consolidated financial statements. The procedures selected depend on the auditor’s judgment, including the assessment of the risks of material misstatement of the consolidated financial statements, whether due to fraud or error. In making those risk assessments, the auditor considers internal control relevant to the entity’s preparation and fair presentation of the consolidated financial statements in order to design audit procedures that are appropriate in the circumstances, but not for the purpose of expressing an opinion on the effectiveness of the entity’s internal control. Accordingly, we express no such opinion. An audit also includes evaluating the appropriateness of accounting policies used and the reasonableness of significant accounting estimates made by management, as well as evaluating the overall presentation of the consolidated financial statements.
We believe that the audit evidence we have obtained is sufficient and appropriate to provide a basis for our audit opinion.
Opinion
In our opinion, the consolidated financial statements referred to above present fairly, in all material respects, the financial position of PrimeLending, a PlainsCapital Company at December 31, 2012 (Successor), and the results of its operations and its cash flows for the period from December 1, 2012 through December 31, 2012 (Successor) and the period from January 1, 2012 through November 30, 2012 (Predecessor) in conformity with U.S. generally accepted accounting principles.
/s/ Ernst & Young LLP
Dallas, Texas
March 15, 2013
F-3
Table of Contents
HILLTOP HOLDINGS INC.
CONSOLIDATED STATEMENTS OF OPERATIONSReport of Independent Registered Public Accounting Firm
FOR THE YEARS ENDED DECEMBER
Board of Directors
First Southwest Company
We have audited the financial statements of First Southwest Company (the Company), which comprise the statement of financial condition as of December 31, 2011, 20102012 (Successor), and 2009the related statements of income, changes in stockholder’s equity, and cash flows for the period from December 1, 2012 through December 31, 2012 (Successor) and the period from January 1, 2012 through November 30, 2012 (Predecessor) that are filed pursuant to Rule 17a-5 under the Securities Exchange Act of 1934, and the related notes to the financial statements (not presented separately herein).
(in thousands except per share data)Management’s Responsibility for the Financial Statements
| | 2011 | | 2010 | | 2009 | |
Revenue: | | | | | | | |
Net premiums earned | | $ | 134,048 | | $ | 117,192 | | $ | 115,153 | |
Net investment income | | 10,538 | | 7,664 | | 6,458 | |
Other income | | 6,785 | | 6,744 | | 6,917 | |
Net realized gains (losses) on investments | | | | | | | |
Other-than-temporary impairments on fixed maturity securities | | — | | (70 | ) | (841 | ) |
Other realized investment gains, net | | 817 | | 207 | | 1,148 | |
Total realized investment gains, net | | 817 | | 137 | | 307 | |
Total revenue | | 152,188 | | 131,737 | | 128,835 | |
Expenses: | | | | | | | |
Loss and loss adjustment expenses | | 96,734 | | 70,943 | | 70,295 | |
Policy acquisition and other underwriting expenses | | 47,425 | | 44,157 | | 43,198 | |
General and administrative expenses | | 8,870 | | 7,433 | | 7,154 | |
Depreciation and amortization | | 1,714 | | 1,788 | | 1,981 | |
Interest expense | | 8,985 | | 8,971 | | 9,668 | |
Total expenses | | 163,728 | | 133,292 | | 132,296 | |
| | | | | | | |
Loss before income tax benefit | | (11,540 | ) | (1,555 | ) | (3,461 | ) |
Income tax benefit | | 5,009 | | 1,007 | | 1,349 | |
Net loss | | (6,531 | ) | (548 | ) | (2,112 | ) |
Preferred stock dividend | | — | | (7,047 | ) | (10,313 | ) |
Loss on redemption of preferred stock | | — | | (5,892 | ) | — | |
Net loss attributable to common stockholders | | $ | (6,531 | ) | $ | (13,487 | ) | $ | (12,425 | ) |
| | | | | | | |
Loss per share from operations less preferred dividends | | | | | | | |
Basic loss per share | | $ | (0.12 | ) | $ | (0.13 | ) | $ | (0.22 | ) |
Diluted loss per share | | $ | (0.12 | ) | $ | (0.13 | ) | $ | (0.22 | ) |
| | | | | | | |
Loss per share attributable to common stockholders | | | | | | | |
Basic loss per share | | $ | (0.12 | ) | $ | (0.24 | ) | $ | (0.22 | ) |
Diluted loss per share | | $ | (0.12 | ) | $ | (0.24 | ) | $ | (0.22 | ) |
| | | | | | | |
Weighted average share information | | | | | | | |
Basic shares outstanding | | 56,499 | | 56,492 | | 56,474 | |
Diluted shares outstanding | | 56,511 | | 56,492 | | 56,474 | |
Management is responsible for the preparation and fair presentation of these financial statements in conformity with U.S. generally accepted accounting principles; this includes the design, implementation, and maintenance of internal control relevant to the preparation and fair presentation of financial statements that are free from material misstatement, whether due to fraud or error.
The accompanying notesAuditor’s Responsibility
Our responsibility is to express an opinion on these financial statements based on our audit. We conducted our audit in accordance with auditing standards generally accepted in the United States and in accordance with the standards of the Public Company Accounting Oversight Board (United States). Those standards require that we plan and perform the audit to obtain reasonable assurance about whether the financial statements are an integral partfree of these consolidatedmaterial misstatement.
An audit involves performing procedures to obtain audit evidence about the amounts and disclosures in the financial statements. The procedures selected depend on the auditor’s judgment, including the assessment of the risks of material misstatement of the financial statements, whether due to fraud or error. In making those risk assessments, the auditor considers internal control relevant to the Company’s preparation and fair presentation of the financial statements in order to design audit procedures that are appropriate in the circumstances, but not for the purpose of expressing an opinion on the effectiveness of the Company’s internal control. Accordingly, we express no such opinion. An audit also includes evaluating the appropriateness of accounting policies used and the reasonableness of significant accounting estimates made by management, as well as evaluating the overall presentation of the financial statements.
We believe that the audit evidence we have obtained is sufficient and appropriate to provide a basis for our audit opinion.
Opinion
In our opinion, the financial statements referred to above present fairly, in all material respects, the financial position of First Southwest Company as of December 31, 2012 (Successor), and the results of its operations and its cash flows for the period from December 1, 2012 through December 31, 2012 (Successor), and the period from January 1, 2012 through November 30, 2012 (Predecessor) in conformity with U.S. generally accepted accounting principles.
/s/ Ernst & Young LLP
Dallas, Texas
February 28, 2013
F-4
Table of Contents
HILLTOP HOLDINGS INC. AND SUBSIDIARIES
CONSOLIDATED BALANCE SHEETS
(in thousands, except share and per share data)
| | December 31, | |
| | 2012 | | 2011 | |
Assets | | | | | |
Cash and due from banks | | $ | 720,741 | | $ | 578,520 | |
Federal funds sold and securities purchased under agreements to resell | | 4,421 | | — | |
Securities: | | | | | |
Trading, at fair value | | 90,113 | | — | |
Available for sale, at fair value (amortized cost of $978,502 and $202,688, respectively) | | 990,953 | | 224,200 | |
| | 1,081,066 | | 224,200 | |
| | | | | |
Loans held for sale | | 1,399,944 | | — | |
Loans, net of unearned income | | 3,152,396 | | — | |
Allowance for loan losses | | (3,409 | ) | — | |
Loans, net | | 3,148,987 | | — | |
| | | | | |
Broker-dealer and clearing organization receivables | | 145,564 | | — | |
Insurance premiums receivable | | 24,615 | | 24,390 | |
Deferred policy acquisition costs | | 19,812 | | 19,182 | |
Reinsurance receivable, net of uncollectible amounts | | 18,567 | | 25,861 | |
Premises and equipment, net | | 111,381 | | 2,128 | |
Other assets | | 280,259 | | 18,082 | |
Goodwill | | 253,770 | | 23,988 | |
Other intangible assets, net | | 77,738 | | 9,074 | |
Total assets | | $ | 7,286,865 | | $ | 925,425 | |
| | | | | |
Liabilities and Stockholders’ Equity | | | | | |
Deposits: | | | | | |
Noninterest-bearing | | $ | 323,367 | | $ | — | |
Interest-bearing | | 4,377,094 | | — | |
Total deposits | | 4,700,461 | | — | |
| | | | | |
Broker-dealer and clearing organization payables | | 187,990 | | — | |
Reserve for losses and loss adjustment expenses | | 34,012 | | 44,835 | |
Unearned insurance premiums | | 82,598 | | 80,661 | |
Short-term borrowings | | 728,250 | | — | |
Notes payable | | 141,539 | | 131,450 | |
Junior subordinated debentures | | 67,012 | | — | |
Other liabilities | | 198,453 | | 13,096 | |
Total liabilities | | 6,140,315 | | 270,042 | |
Commitments and contingencies | | | | | |
Stockholders’ equity: | | | | | |
Hilltop Holdings stockholders’ equity: | | | | | |
Preferred stock, $0.01 par value, 10,000,000 shares authorized; Series B, liquidation value per share of $1,000; 114,068 and 0 shares issued and outstanding, respectively | | 114,068 | | — | |
Common stock, $0.01 par value, 100,000,000 shares authorized; 83,487,340 and 56,500,828 shares issued and outstanding, respectively | | 835 | | 565 | |
Additional paid-in capital | | 1,304,707 | | 918,192 | |
Accumulated other comprehensive income | | 8,094 | | 13,983 | |
Accumulated deficit | | (283,208 | ) | (277,357 | ) |
Total Hilltop Holdings stockholders’ equity | | 1,144,496 | | 655,383 | |
Noncontrolling interest | | 2,054 | | — | |
Total stockholders’ equity | | 1,146,550 | | 655,383 | |
Total liabilities and stockholders’ equity | | $ | 7,286,865 | | $ | 925,425 | |
See accompanying notes.
F-5
Table of Contents
HILLTOP HOLDINGS INC. AND SUBSIDIARIES
CONSOLIDATED STATEMENTS OF STOCKHOLDERS’ EQUITYOPERATIONS
FOR THE YEARS ENDED DECEMBER 31, 2011, 2010 and 2009(in thousands, except per share data)
| | Year Ended December 31, | |
| | 2012 | | 2011 | | 2010 | |
Interest income: | | | | | | | |
Loans, including fees | | $ | 23,900 | | $ | — | | $ | — | |
Securities: | | | | | | | |
Taxable | | 13,116 | | 11,049 | | 8,154 | |
Tax-exempt | | 464 | | — | | — | |
Federal funds sold and securities purchased under agreements to resell | | 106 | | — | | — | |
Interest-bearing deposits with banks | | 801 | | — | | — | |
Other | | 651 | | — | | — | |
Total interest income | | 39,038 | | 11,049 | | 8,154 | |
| | | | | | | |
Interest expense: | | | | | | | |
Deposits | | 1,013 | | — | | — | |
Short-term borrowings | | 215 | | — | | — | |
Notes payable | | 8,613 | | 8,985 | | 8,971 | |
Junior subordinated debentures | | 212 | | — | | — | |
Other | | 143 | | — | | — | |
Total interest expense | | 10,196 | | 8,985 | | 8,971 | |
| | | | | | | |
Net interest income (expense) | | 28,842 | | 2,064 | | (817 | ) |
Provision for loan losses | | 3,800 | | — | | — | |
Net interest income (expense) after provision for loan losses | | 25,042 | | 2,064 | | (817 | ) |
| | | | | | | |
Noninterest income: | | | | | | | |
Net insurance premiums earned | | 146,701 | | 134,048 | | 117,192 | |
Net realized gains (losses) on securities | | 112 | | 817 | | 207 | |
Other-than-temporary impairment: | | | | | | | |
Total other-than-temporary impairment losses on securities | | — | | — | | (70 | ) |
Portion of loss recognized in other comprehensive income | | — | | — | | — | |
Net other-than-temporary impairment losses recognized in earnings | | — | | — | | (70 | ) |
Net gains from sale of loans | | 50,384 | | — | | — | |
Mortgage loan origination fees | | 7,224 | | — | | — | |
Investment and securities advisory fees and commissions | | 11,238 | | — | | — | |
Other | | 8,573 | | 6,785 | | 6,744 | |
Total noninterest income | | 224,232 | | 141,650 | | 124,073 | |
| | | | | | | |
Noninterest expense: | | | | | | | |
Loss and loss adjustment expenses | | 109,159 | | 96,734 | | 70,943 | |
Policy acquisition and other underwriting expenses | | 43,658 | | 40,196 | | 37,025 | |
Employees’ compensation and benefits | | 60,972 | | 7,743 | | 7,504 | |
Occupancy and equipment, net | | 7,360 | | 788 | | 849 | |
Other | | 34,368 | | 9,793 | | 8,490 | |
Total noninterest expense | | 255,517 | | 155,254 | | 124,811 | |
| | | | | | | |
Loss before income taxes | | (6,243 | ) | (11,540 | ) | (1,555 | ) |
Income tax benefit | | (1,145 | ) | (5,009 | ) | (1,007 | ) |
| | | | | | | |
Net loss | | (5,098 | ) | (6,531 | ) | (548 | ) |
Less: Net income attributable to noncontrolling interest | | 494 | | — | | �� | |
| | | | | | | |
Loss attributable to Hilltop Holdings | | (5,592 | ) | (6,531 | ) | (548 | ) |
Dividends on preferred stock and other | | 259 | | — | | 12,939 | |
Loss applicable to Hilltop Holdings common stockholders | | $ | (5,851 | ) | $ | (6,531 | ) | $ | (13,487 | ) |
| | | | | | | |
Loss per common share: | | | | | | | |
Basic | | $ | (0.10 | ) | $ | (0.12 | ) | $ | (0.24 | ) |
Diluted | | $ | (0.10 | ) | $ | (0.12 | ) | $ | (0.24 | ) |
| | | | | | | |
Weighted average share information: | | | | | | | |
Basic | | 58,754 | | 56,499 | | 56,492 | |
Diluted | | 58,754 | | 56,499 | | 56,492 | |
See accompanying notes.
F-6
Table of Contents
HILLTOP HOLDINGS INC. AND SUBSIDIARIES
CONSOLIDATED STATEMENTS OF COMPREHENSIVE INCOME (LOSS)
(in thousands)
| | | | | | | | | | | | Accumulated | | | | | |
| | | | | | | | | | Additional | | Other | | | | Total | |
| | Preferred Stock | | Common Stock | | Paid-in | | Comprehensive | | Accumulated | | Stockholders’ | |
| | Shares | | Amount | | Shares | | Amount | | Capital | | (Loss) Income | | Deficit | | Equity | |
Balance, December 31, 2008 | | 5,000 | | $ | 119,108 | | 56,456 | | $ | 564 | | $ | 917,682 | | $ | (985 | ) | $ | (244,914 | ) | $ | 791,455 | |
Net loss | | | | | | | | | | | | | | (2,112 | ) | (2,112 | ) |
Other comprehensive income, net of tax of $2,440 | | | | | | | | | | | | 4,532 | | | | 4,532 | |
Total comprehensive income | | | | | | | | | | | | | | | | 2,420 | |
Preferred stock dividends declared | | | | | | | | | | | | | | (10,313 | ) | (10,313 | ) |
Common stock issued to board members | | | | | | 12 | | 1 | | 136 | | | | | | 137 | |
Options exercised | | | | | | 17 | | | | | | | | | | — | |
Stock compensation expense | | | | | | | | | | 78 | | | | | | 78 | |
Balance, December 31, 2009 | | 5,000 | | $ | 119,108 | | 56,485 | | $ | 565 | | $ | 917,896 | | $ | 3,547 | | $ | (257,339 | ) | $ | 783,777 | |
Net loss | | | | | | | | | | | | | | (548 | ) | (548 | ) |
Other comprehensive income, net of tax of $928 | | | | | | | | | | | | 1,723 | | | | 1,723 | |
Total comprehensive income | | | | | | | | | | | | | | | | 1,175 | |
Preferred stock dividends declared | | | | | | | | | | | | | | (7,047 | ) | (7,047 | ) |
Redemption of Series A preferred stock | | (5,000 | ) | (119,108 | ) | | | | | | | | | (5,892 | ) | (125,000 | ) |
Common stock issued to board members | | | | | | 10 | | | | 111 | | | | | | 111 | |
Common stock retired | | | | | | | | | | (2 | ) | | | | | (2 | ) |
Stock compensation expense | | | | | | | | | | 41 | | | | | | 41 | |
Balance, December 31, 2010 | | — | | $ | — | | 56,495 | | $ | 565 | | $ | 918,046 | | $ | 5,270 | | $ | (270,826 | ) | $ | 653,055 | |
Net loss | | | | | | | | | | | | | | (6,531 | ) | (6,531 | ) |
Other comprehensive income, net of tax of $4,692 | | | | | | | | | | | | 8,713 | | | | 8,713 | |
Total comprehensive income | | | | | | | | | | | | | | | | 2,182 | |
Common stock issued to board members | | | | | | 6 | | | | 48 | | | | | | 48 | |
Stock compensation expense | | | | | | | | | | 98 | | | | | | 98 | |
Balance, December 31, 2011 | | — | | $ | — | | 56,501 | | $ | 565 | | $ | 918,192 | | $ | 13,983 | | $ | (277,357 | ) | $ | 655,383 | |
| | Year Ended December 31, | |
| | 2012 | | 2011 | | 2010 | |
Net loss | | $ | (5,098 | ) | $ | (6,531 | ) | $ | (548 | ) |
Other comprehensive income (loss): | | | | | | | |
Unrealized gains (losses) on securities available for sale, net of tax of $(3,172), $4,692 and $928 | | (5,889 | ) | 8,713 | | 1,723 | |
Comprehensive income (loss) | | (10,987 | ) | 2,182 | | 1,175 | |
Less: comprehensive income attributable to noncontrolling interest | | 494 | | — | | — | |
| | | | | | | |
Comprehensive income (loss) applicable to Hilltop Holdings | | $ | (11,481 | ) | $ | 2,182 | | $ | 1,175 | |
TheSee accompanying notes are an integral part of these consolidated financial statementsnotes.
F-5F-7
Table of Contents
HILLTOP HOLDINGS INC. AND SUBSIDIARIES
CONSOLIDATED STATEMENTS OF STOCKHOLDERS’ EQUITY
(In thousands)
| | | | | | | | | | | | Accumulated | | | | Total | | | | | |
| | | | | | | | | | Additional | | Other | | | | Hilltop Holdings | | | | Total | |
| | Preferred Stock | | Common Stock | | Paid-in | | Comprehensive | | Accumulated | | Stockholders’ | | Noncontrolling | | Stockholders’ | |
| | Shares | | Amount | | Shares | | Amount | | Capital | | Income | | Deficit | | Equity | | Interest | | Equity | |
Balance, December 31, 2009 | | 5,000 | | $ | 119,108 | | 56,485 | | $ | 565 | | $ | 917,896 | | $ | 3,547 | | $ | (257,339 | ) | $ | 783,777 | | $ | — | | $ | 783,777 | |
Net loss | | — | | — | | — | | — | | — | | — | | (548 | ) | (548 | ) | — | | (548 | ) |
Other comprehensive income | | — | | — | | — | | — | | — | | 1,723 | | — | | 1,723 | | — | | 1,723 | |
Dividends on preferred stock | | — | | — | | — | | — | | — | | — | | (7,047 | ) | (7,047 | ) | — | | (7,047 | ) |
Redemption of preferred stock | | (5,000 | ) | (119,108 | ) | — | | — | | — | | — | | (5,892 | ) | (125,000 | ) | — | | (125,000 | ) |
Common stock issued to board members | | — | | — | | 10 | | — | | 111 | | — | | — | | 111 | | — | | 111 | |
Common stock retired | | — | | — | | — | | — | | (2 | ) | — | | — | | (2 | ) | — | | (2 | ) |
Stock-based compensation expense | | — | | — | | — | | — | | 41 | | — | | — | | 41 | | — | | 41 | |
Balance, December 31, 2010 | | — | | — | | 56,495 | | 565 | | 918,046 | | 5,270 | | (270,826 | ) | 653,055 | | — | | 653,055 | |
Net loss | | — | | — | | — | | — | | — | | — | | (6,531 | ) | (6,531 | ) | — | | (6,531 | ) |
Other comprehensive income | | — | | — | | — | | — | | — | | 8,713 | | — | | 8,713 | | — | | 8,713 | |
Common stock issued to board members | | — | | — | | 6 | | — | | 48 | | — | | — | | 48 | | — | | 48 | |
Stock-based compensation expense | | — | | — | | — | | — | | 98 | | — | | — | | 98 | | — | | 98 | |
Balance, December 31, 2011 | | — | | — | | 56,501 | | 565 | | 918,192 | | 13,983 | | (277,357 | ) | 655,383 | | — | | 655,383 | |
Net loss | | — | | — | | — | | — | | — | | — | | (5,592 | ) | (5,592 | ) | 494 | | (5,098 | ) |
Other comprehensive loss | | — | | — | | — | | — | | — | | (5,889 | ) | — | | (5,889 | ) | — | | (5,889 | ) |
Issuance of preferred stock | | 114,068 | | 114,068 | | — | | — | | — | | — | | — | | 114,068 | | — | | 114,068 | |
Issuance of common stock | | — | | — | | 27,123 | | 271 | | 387,312 | | — | | — | | 387,583 | | — | | 387,583 | |
Common stock issued to board members | | — | | — | | 4 | | — | | 50 | | — | | — | | 50 | | — | | 50 | |
Repurchase and retirement of common stock | | — | | — | | (141 | ) | (1 | ) | (1,297 | ) | — | | — | | (1,298 | ) | — | | (1,298 | ) |
Stock-based compensation expense | | — | | — | | — | | — | | 450 | | — | | — | | 450 | | — | | 450 | |
Dividends on preferred stock | | — | | — | | — | | — | | — | | — | | (259 | ) | (259 | ) | — | | (259 | ) |
Acquired noncontrolling interest | | — | | — | | — | | — | | — | | — | | — | | — | | 1,789 | | 1,789 | |
Cash distributions to noncontrolling interest | | — | | — | | — | | — | | — | | — | | — | | — | | (229 | ) | (229 | ) |
Balance, December 31, 2012 | | 114,068 | | $ | 114,068 | | 83,487 | | $ | 835 | | $ | 1,304,707 | | $ | 8,094 | | $ | (283,208 | ) | $ | 1,144,496 | | $ | 2,054 | | $ | 1,146,550 | |
See accompanying notes.
F-8
Table of Contents
HILLTOP HOLDINGS INC. AND SUBSIDIARIES
CONSOLIDATED STATEMENTS OF CASH FLOWS
FOR THE YEARS ENDED
DECEMBER 31, 2011, 2010 and 2009
(inIn thousands)
| | For the Twelve Months Ended December 31 | |
| | 2011 | | 2010 | | 2009 | |
Cash flow from operating activities: | | | | | | | |
Net loss | | $ | (6,531 | ) | $ | (548 | ) | $ | (2,112 | ) |
Adjustments to reconcile net loss to net cash (used in) provided by operating activities: | | | | | | | |
Decrease (increase) in reinsurance recoverables | | 19,794 | | (23,886 | ) | (4,825 | ) |
Increase (decrease) in unearned premiums | | 7,847 | | 4,669 | | (306 | ) |
Depreciation and amortization | | 1,714 | | 1,788 | | 1,981 | |
Stock grant compensation expense | | 146 | | 150 | | 214 | |
Amortization of loan origination costs | | 400 | | 197 | | 197 | |
Decrease (increase) in income tax payable | | (78 | ) | 78 | | — | |
(Decrease) increase in payable to related party | | (263 | ) | (3,651 | ) | 761 | |
Realized gains on investments | | (817 | ) | (137 | ) | (307 | ) |
(Increase) decrease in income tax receivable | | (77 | ) | 2,187 | | 22,411 | |
Increase in premium and agents balances | | (1,900 | ) | (1,535 | ) | (492 | ) |
(Increase) decrease in deferred acquisition costs | | (1,945 | ) | (1,492 | ) | 190 | |
(Decrease) increase in deferred income taxes | | (3,930 | ) | 1,488 | | 995 | |
Changes in operating assets and liabilities | | (3,635 | ) | 5,441 | | 436 | |
(Decrease) increase in loss and loss adjustment expense reserves | | (14,047 | ) | 25,102 | | (243 | ) |
Net cash (used in) provided by operating activities | | $ | (3,322 | ) | $ | 9,851 | | $ | 18,900 | |
| | | | | | | |
Cash flow from investing activities: | | | | | | | |
Purchases of available-for-sale securities | | (31,583 | ) | (43,123 | ) | (1,094,906 | ) |
Purchase of other investments | | (50,000 | ) | — | | — | |
Purchases of held-to-maturity securities | | — | | (1,606 | ) | (331 | ) |
Proceeds from sales of available-for-sale securities | | 5,523 | | 16,726 | | 23,647 | |
Proceeds from sales of held-to-maturity securities | | 7,336 | | — | | — | |
Proceeds from maturities of available-for-sale securities | | 8,323 | | 8,316 | | 1,086,227 | |
Proceeds from maturities of held-to-maturity securities | | — | | 3,350 | | 646 | |
Purchases of fixed assets | | (296 | ) | (322 | ) | (1,715 | ) |
Decrease (increase) in restricted cash | | — | | — | | 18,500 | |
Net cash (used in) provided by investing activities | | $ | (60,697 | ) | $ | (16,659 | ) | $ | 32,068 | |
| | | | | | | |
Cash flow from financing activities: | | | | | | | |
Repayment of debt | | (6,900 | ) | — | | (18 | ) |
Payment of preferred dividends | | — | | (8,766 | ) | (10,313 | ) |
Redemption of preferred stock | | — | | (125,000 | ) | — | |
Net cash used in financing activities | | (6,900 | ) | (133,766 | ) | (10,331 | ) |
Net (decrease) increase in cash and cash equivalents | | (70,919 | ) | (140,574 | ) | 40,637 | |
Cash and cash equivalents, beginning of period | | 649,439 | | 790,013 | | 749,376 | |
Cash and cash equivalents, end of period | | $ | 578,520 | | $ | 649,439 | | $ | 790,013 | |
| | | | | | | |
Non-cash financing and investing transactions: | | | | | | | |
Dividends declared but unpaid | | $ | — | | $ | — | | $ | 1,719 | |
| | | | | | | |
Supplemental cash flow information: | | | | | | | |
Cash paid for interest | | $ | 8,780 | | $ | 8,799 | | $ | 9,209 | |
Cash paid for income taxes | | $ | (811 | ) | $ | (1,907 | ) | $ | (23,890 | ) |
| | Year Ended December 31, | |
| | 2012 | | 2011 | | 2010 | |
Operating Activities | | | | | | | |
Net loss | | $ | (5,098 | ) | $ | (6,531 | ) | $ | (548 | ) |
Adjustments to reconcile net loss to net cash provided by (used in) operating activities | | | | | | | |
Provision for loan losses | | 3,800 | | — | | — | |
Net losses on other real estate owned | | 7 | | — | | — | |
Depreciation amortization and accretion, net | | (2,533 | ) | 1,714 | | 1,788 | |
Stock-based compensation expense | | 500 | | 146 | | 150 | |
Amortization of debt issuance costs | | 182 | | 400 | | 197 | |
Net realized gains on securities | | (112 | ) | (817 | ) | (137 | ) |
Gain on sale of premises and equipment | | (51 | ) | — | | — | |
Stock dividends received on securities | | (26 | ) | — | | — | |
Deferred income taxes | | (6,426 | ) | (3,930 | ) | 1,488 | |
Net change in prepaid FDIC assessments | | 150 | | — | | — | |
Net change in assets segregated for regulatory purposes | | (19,000 | ) | — | | — | |
Net change in trading securities | | 12,900 | | �� | | — | |
Net change in broker-dealer and clearing organization receivables | | 43,309 | | — | | — | |
Net change in insurance premium and agents balance | | (225 | ) | (1,900 | ) | (1,535 | ) |
Net change in deferred acquisition costs | | (630 | ) | (1,945 | ) | (1,492 | ) |
Net change in reinsurance recoverables | | 7,294 | | 19,794 | | (23,886 | ) |
Net change in fee award receivable | | 711 | | — | | — | |
Net change in other assets | | 8,298 | | (3,712 | ) | 7,628 | |
Net change in unearned insurance premiums | | 1,937 | | 7,847 | | 4,669 | |
Net change in broker-dealer and clearing organization payables | | (46,509 | ) | — | | — | |
Net change in loss and loss adjustment expense reserve | | (10,823 | ) | (14,047 | ) | 25,102 | |
Net change in other liabilities | | 9,025 | | (341 | ) | (3,573 | ) |
Net gains from sale of loans | | (50,384 | ) | — | | — | |
Loans originated for sale | | (1,344,577 | ) | — | | — | |
Proceeds from loans sold | | 1,512,202 | | — | | — | |
Net cash provided by (used in) operating activities | | 113,921 | | (3,322 | ) | 9,851 | |
| | | | | | | |
Investing Activities | | | | | | | |
Proceeds from maturities and principal reductions of securities held to maturity | | — | | 7,336 | | 3,350 | |
Proceeds from sales, maturities and principal reductions of securities available for sale | | 77,445 | | 13,846 | | 25,042 | |
Purchases of securities held to maturity | | — | | — | | (1,606 | ) |
Purchases of securities available for sale | | (224,893 | ) | (31,583 | ) | (43,123 | ) |
Net change in loans | | 10,673 | | (50,000 | ) | — | |
Purchases of premises and equipment and other assets | | (17,412 | ) | (296 | ) | (322 | ) |
Proceeds from sales of premises and equipment and other real estate owned | | 1,377 | | — | | — | |
Net cash from acquisitions | | 165,679 | | — | | — | |
Net cash provided by (used in) investing activities | | 12,869 | | (60,697 | ) | (16,659 | ) |
| | | | | | | |
Financing Activities | | | | | | | |
Net change in deposits | | 207,997 | | — | | — | |
Net change in short-term borrowings | | (185,812 | ) | — | | — | |
Payments on notes payable | | (766 | ) | (6,900 | ) | — | |
Payments to repurchase common stock | | (1,298 | ) | — | | — | |
Dividends paid | | — | | — | | (8,766 | ) |
Redemption of preferred stock | | — | | — | | (125,000 | ) |
Net cash distributed to noncontrolling interest | | (229 | ) | — | | — | |
Other, net | | (40 | ) | — | | — | |
Net cash provided by (used in) financing activities | | 19,852 | | (6,900 | ) | (133,766 | ) |
| | | | | | | |
Net change in cash and cash equivalents | | 146,642 | | (70,919 | ) | (140,574 | ) |
Cash and cash equivalents, beginning of year | | 578,520 | | 649,439 | | 790,013 | |
Cash and cash equivalents, end of year | | $ | 725,162 | | $ | 578,520 | | $ | 649,439 | |
| | | | | | | |
Supplemental Disclosures of Cash Flow Information | | | | | | | |
Cash paid for interest | | $ | 10,371 | | $ | 8,780 | | $ | 8,799 | |
Cash paid for income taxes, net of refunds | | $ | (184 | ) | $ | (811 | ) | $ | (1,907 | ) |
Supplemental Schedule of Non-Cash Activities | | | | | | | |
Preferred stock issued in acquisition | | $ | 114,068 | | $ | — | | $ | — | |
Common stock issued in acquisition | | $ | 387,583 | | $ | — | | $ | — | |
TheSee accompanying notes are an integral part of these consolidated financial statementsnotes.
F-6F-9
Table of Contents
HILLTOP HOLDINGS INC.Hilltop Holdings Inc. and Subsidiaries
NOTES TO CONSOLIDATED FINANCIAL STATEMENTSNotes to Consolidated Financial Statements
DECEMBER 31, 2011, 2010 and 2009
1. Business, Basis of Presentation and Summary of Significant Accounting and Reporting Policies
BusinessNatureof Operations
Hilltop Holdings Inc., (“Hilltop”,”HTH”, or the “Company”), was organized in July 1998 as a Maryland corporation. HTHHilltop is a holding company that is endeavoringhas endeavored, and continues to endeavor, to make opportunistic transactions.acquisitions or effect business combinations. In connection with this strategy, we are identifyingon November 30, 2012, and evaluating potential targets on an ongoing basis.concurrent with the consummation of the merger with PlainsCapital Corporation (“PlainsCapital”), or the Merger, Hilltop became a financial holding company registered under the Bank Holding Company Act of 1956, as amended by the Gramm-Leach-Bliley Act of 1999.
NLASCO, Inc.PlainsCapital is a Delaware corporationfinancial holding company, headquartered in Dallas, Texas, that specializesprovides, through its subsidiaries, an array of financial products and services. In addition to traditional banking services, PlainsCapital provides residential mortgage lending, investment banking, public finance advisory, wealth and investment management, treasury management, capital equipment leasing, fixed income sales, asset management, and correspondent clearing services. The operating results of Hilltop for the year ended December 31, 2012 include the results from the operations acquired in providingthe PlainsCapital transaction for the month ended December 31, 2012. Certain disclosures within the notes to consolidated financial statements are specific to financial products and services of PlainsCapital and its subsidiaries and, therefore include information at December 31, 2012 and relating to the post-acquisition one month period ended December 31, 2012.
Prior to the consummation of the Merger with PlainsCapital, Hilltop’s primary operations were to provide fire and homeowners insurance to low value dwellings and manufactured homes primarily in Texas and other areas of the south, southeastern and southwestern United States. NLASCO operatesStates through its wholly-owned subsidiaries, National Lloyds Insurance Companywholly owned property and casualty insurance holding company, NLASCO, Inc., (“NLIC”NLASCO”) and American Summit Insurance Company (“ASIC”). Texas comprises approximately 72% of our business, with Arizona 8%, Oklahoma 7%, Tennessee 6%, Georgia 3%, Louisiana 2%, and the remaining states in which we do business makes up the other 2%.
OurHilltop’s common stock is listed on the New York Stock Exchange under the symbol “HTH”. We have, and has no public trading history prior to February 12, 2004.
Basis of Presentation
Hilltop owns 100% of the outstanding stock of PlainsCapital. PlainsCapital owns 100% of the outstanding stock of PlainsCapital Bank (the “Bank”) and 100% of the membership interest in PlainsCapital Equity, LLC. The accompanying consolidated financial statements have been prepared in conformity with generally accepted accounting principles inBank owns 100% of the United Statesoutstanding stock of AmericaPrimeLending, a PlainsCapital Company (“GAAP”PrimeLending”), PNB Aero Services, Inc. and PCB-ARC, Inc. The Bank has a 100% membership interest in conformityFirst Southwest Holdings, LLC (“First Southwest”) and PlainsCapital Securities, LLC, as well as a 51% voting interest in PlainsCapital Insurance Services, LLC.
Hilltop also owns 100% of NLASCO, a Delaware corporation, which operates through its wholly owned subsidiaries, National Lloyds Insurance Company (“NLIC”) and American Summit Insurance Company (“ASIC”).
PrimeLending owns a 100% membership interest in PrimeLending Ventures Management, LLC, the controlling and sole managing member of PrimeLending Ventures, LLC (“Ventures”). Through a series limited liability company structure, Ventures establishes separate operating divisions with the rules and regulationsselect business partners, such as home builders, to originate residential mortgage loans.
The principal subsidiaries of First Southwest are First Southwest Company (“FSC”), a broker-dealer registered with the Securities and Exchange Commission. Commission (the “SEC”) and the Financial Industry Regulatory Authority (“FINRA”), and First Southwest Asset Management, Inc., a registered investment advisor under the Investment Advisors Act of 1940.
The consolidated financial statements include the accounts of all wholly-owned subsidiaries of the Company.above-named entities. All significant intercompany accountstransactions and transactionsbalances have been eliminatedeliminated. Noncontrolling interests have been recorded for minority ownership in entities that are not wholly owned and are presented in compliance with the provisions of Noncontrolling Interest in Subsidiary Subsections of the Financial Accounting Standards Board (“FASB”) Accounting Standards Codification (“ASC”), as discussed below.
F-10
Table of Contents
Hilltop Holdings Inc. and Subsidiaries
Notes to Consolidated Financial Statements (continued)
PlainsCapital also owns 100% of the outstanding common stock of PCC Statutory Trusts I, II, III and IV (the “Trusts”), which are not included in the consolidated financial statements.statements under the requirements of the Variable Interest Entities Subsections of the ASC, because the primary beneficiaries of the Trusts are not within the consolidated group.
We are required by GAAPThe preparation of financial statements in conformity with accounting principles generally accepted in the United States (“GAAP”) requires management to make estimates and assumptions that affect ourthe reported amounts of assets and liabilities, andthe disclosure of contingent assets and liabilities at the date of ourthe financial statements, and ourthe reported amounts of revenues and expenses during the reporting period. Actual results could differ materially from those estimates. These estimates and assumptions are particularly important in determiningEstimates regarding the allowance for loan losses, the fair values of financial instruments, reserves for losses and loss adjustment expenses deferred policy acquisition costs, reinsurance receivables and the potential impairment of assets.assets are particularly subject to change.
The presentation of Hilltop’s historical consolidated financial statements have been modified and certain items in the 2011 and 2010 financial statements have been reclassified to conform to the 2012 presentation, which is more consistent with that of a financial institution that provides an array of financial products and services.
Summary of SignificantAcquisition Accounting Policies
Investment Securities
At December 31, 2011, investment securities consistAcquisitions are accounted for under the purchase method of U.S. Government, mortgage-backed, corporate debtaccounting. Purchased assets, including identifiable intangible assets, and equity securities. Also included in our investment portfolio are other investments, which consist of a note receivable and warrants held by the parent, HTH. We have the ability to categorize investments as trading, available-for-sale, and held-to-maturity. We classify our fixed maturities as either available-for-sale or held-to-maturity and equity securities as available-for-sale. Trading securities are bought and held principally for the purpose of selling them in the near term. Held-to-maturity debt securities are those securities in which we have the ability and intent to hold the security until maturity. As of December 31, 2011, all securities were classified as available-for-sale.
Trading and available-for-sale securitiesassumed liabilities are recorded at their respective acquisition date fair values. If the fair value of net assets purchased exceeds the consideration given, a “bargain purchase gain” is recognized. If the consideration given exceeds the fair value of the net assets received, goodwill is recognized.
Securities Purchased Under Agreements to Resell
Securities purchased under agreements to resell (reverse repurchase agreements or reverse repos) are treated as collateralized financings and are carried at the amounts at which the securities will subsequently be resold as specified in the agreements. PlainsCapital is in possession of collateral with a fair value equal to or in excess of the contract amounts.
Securities
Management classifies securities at the time of purchase and reassesses such designation at each balance sheet date. Transfers between categories from these reassessments are rare. Securities held for resale to facilitate principal transactions with customers, as well as certain securities acquired in the PlainsCapital acquisition, are classified as trading, and are carried at fair value, with changes in fair value reflected in the consolidated statements of operations. Hilltop reports interest income on trading securities as interest income on securities and other changes in fair value as other noninterest income.
Securities held but not intended to be held to maturity or on a long-term basis are classified as available for sale. Securities included in this category are those that management intends to use as part of its asset/liability management strategy and that may be sold in response to changes in interest rates, resultant prepayment risk, and other factors related to interest rate and resultant prepayment risk changes. Securities available for sale are carried at fair value. Held-to-maturity debt securities are recorded at amortized cost, adjusted for the amortization or accretion of premiums or discounts. Unrealized holding gains and losses on trading securities are included in earnings. Unrealized holding gains and losses,available for sale, net of the related tax effect, on available-for-sale securities are excluded from earnings andtaxes, are reported as a separate component ofin other comprehensive income until realized. Realized gainsPremiums and losses fromdiscounts are recognized in interest income using the saleeffective interest method and consider any optionality that may be embedded in the security.
Purchases and sales (and related gain or loss) of trading andsecurities are recorded on the trade date, based on specific identification. Declines in the fair value of available-for-sale securities are determined on a specific-identification basis.
We regularly review our investment securities to assess whether the security is impaired and if impairment is other-than-temporary. A decline in the market value of any available-for-sale security below their cost that isare deemed to be other than temporary are reflected in earnings as realized losses to the extent the other-than-temporary resultsimpairment (“OTTI”) is related to credit losses. The amount of the OTTI related to other factors is recognized in a reductionother comprehensive income. In estimating OTTI, management considers in carrying amountdeveloping its best estimate of cash flows, among other things, (i) the length of time and the extent to which the fair value. The impairment is charged to earningsvalue has been less than cost, (ii) the financial condition and a new cost basis fornear-term prospects of the issuer, (iii) the historic and implied volatility of the security, is established. To determine whether impairment is other-than-temporary, we consider whether we are more(iv) failure of the issuer to make scheduled interest payments and (v) changes to the rating of the security by a rating agency.
F-7F-11
Table of Contents
likelyHilltop Holdings Inc. and Subsidiaries
Notes to Consolidated Financial Statements (continued)
LoansHeld for Sale
Loans held for sale consist primarily of single-family residential mortgages funded through PrimeLending. These loans are generally on the consolidated balance sheet for no more than not30 days. Substantially all mortgage loans originated by PrimeLending are sold in the secondary market, servicing released, although it may retain servicing in limited circumstances. Mortgage loans held for sale are carried at fair value under the provisions of the Fair Value Option Subsections of the ASC (“Fair Value Option”). Changes in the fair value of the loans held for sale are recognized in earnings and fees and costs associated with origination are recognized as incurred. The specific identification method is used to determine realized gains and losses on sales of loans, which are reported as net gains (losses) in noninterest income. Loans sold are subject to certain indemnification provisions with investors, including the repurchase of loans sold and repayment of certain sales proceeds to investors under certain conditions. The Bank guarantees PrimeLending’s performance with respect to the indemnification provisions included in purchase agreements with certain third parties.
Loans
Originated Loans
Loans that management has the intent and ability to hold an investment until a market price recovery and consider whether evidence indicating the cost of the investment is recoverable outweighs evidence to the contrary. Evidence considered in this assessment includes the reasons for the impairment,foreseeable future or until maturity or payoff are stated at the severityamount of unpaid principal reduced by unearned income, net unamortized deferred fees and durationan allowance for loan losses. Unearned income on installment loans and interest on other loans is recognized using the effective interest method. Net fees received for providing loan commitments and letters of the impairment, changescredit that result in value subsequentloans are deferred and amortized to period end, and forecasted performance of the investee.
Premiums and discounts are amortized or accretedinterest income over the life of the related held-to-maturity or available-for-sale security as an adjustmentloan, beginning with the initial borrowing. Net fees on commitments and letters of credit that are not expected to yield usingbe funded are amortized to noninterest income over the effective-interest method. Dividendcommitment period. Income on direct financing leases is recognized on a basis that achieves a constant periodic rate of return on the outstanding investment.
Impaired loans include non-accrual loans, troubled debt restructurings and partially charged-off loans. The accrual of interest on impaired loans is discontinued when, in management’s opinion, there is a clear indication that the borrower’s cash flow may not be sufficient to meet principal and interest payments as they become due according to the terms of the loan agreement, which is generally when a loan is 90 days past due unless the loan is both well secured and in the process of collection. When a loan is placed on non-accrual status, all previously accrued and unpaid interest is charged against income. If the ultimate collectibility of principal, wholly or partially, is in doubt, any payment received on a loan on which the accrual of interest has been suspended is applied to reduce principal to the extent necessary to eliminate such doubt. Once the collection of the remaining recorded loan balance is fully expected, interest income is recognized on a cash basis.
The Bank originates loans to customers primarily in Dallas, Fort Worth, Arlington, Lubbock, Austin and San Antonio, Texas. Although the Bank has diversified loan and leasing portfolios and, generally, holds collateral against amounts advanced to customers, its debtors’ ability to honor their contracts is substantially dependent upon the general economic conditions of the region and of the industries in which its debtors operate, which consist primarily of energy, agribusiness, wholesale/retail trade, construction and real estate. PrimeLending originates loans to customers in its offices, which are recognized when earned.located throughout the United States. Substantially all mortgage loans originated by PrimeLending are sold in the secondary market, servicing released, although PrimeLending may retain servicing under certain conditions. FSC makes loans to customers through margin transactions. FSC controls risk by requiring customers to maintain margin collateral in compliance with various regulatory and internal guidelines, which may vary based upon market conditions. Securities owned by customers and held as collateral for margin loans are not included in the consolidated financial statements.
Cash and Cash EquivalentsAcquired Loans
CashManagement has defined the loans purchased in the PlainsCapital acquisition as acquired loans. Acquired loans are recorded at estimated fair value on their purchase date with no carryover of the related allowance for loan losses. Acquired loans were segregated between those considered to be credit impaired and those deemed performing. To make this determination, management considered such factors as past due status, nonaccrual status and credit risk ratings. The fair value of acquired performing loans was determined by discounting expected cash equivalents includeflows, both principal and interest, at
F-12
Table of Contents
Hilltop Holdings Inc. and Subsidiaries
Notes to Consolidated Financial Statements (continued)
prevailing market interest rates. The difference between the fair value and principal balances due at acquisition date, the fair value discount, is accreted into income over the estimated life of each loan.
Acquired impaired, or purchased credit impaired (“PCI”), loans showed evidence of credit deterioration that makes it probable that all contractually required principal and interest payments will not be collected. Their fair value was initially based on an estimate of cash flows, both principal and liquid investmentsinterest, expected to be collected, discounted at prevailing market rates of interest. Management estimated cash flows using key assumptions such as default rates, loss severity rates assuming default, prepayment speeds and estimated collateral values. The excess of cash flows expected to be collected from a loan over its estimated fair value at acquisition is referred to as the accretable yield and is recognized in interest income using an effective yield method over the remaining life of the loan. Subsequent to acquisition, management must update these estimates of cash flows expected to be collected at each reporting date. These updates require the continued use of key assumptions and estimates, similar to those used in the initial estimate of fair value.
PCI loans with maturities less than 90 days from the datean accretable yield are not classified as non-performing even though collection of purchase.contractual payments may be in doubt because income is accreted on a loan-by-loan basis.
Allowance for Loan Losses
Restricted CashOriginated Loans
On January 5, 2009,The allowance for loan losses is a reserve established through a provision for loan losses charged to expense, which represents management’s best estimate of probable losses inherent in the third partyexisting portfolio of loans. The allowance, in the judgment of management, is necessary to reserve for estimated loan losses inherent in the loan portfolio at the balance sheet date. The allowance for which we providedloan losses includes allowance allocations calculated in accordance with the Receivables and Contingencies Topics of the ASC. The level of the allowance reflects management’s continuing evaluation of industry concentrations, specific credit risks, loan loss experience, current loan portfolio quality, present economic, political and regulatory conditions, and unidentified losses inherent in the current loan portfolio. Portions of the allowance may be allocated for specific credits; however, the entire allowance is available for any credit that, in management’s judgment, should be charged off. While management utilizes its best judgment and information available, the ultimate adequacy of the allowance is dependent upon a guarantyvariety of factors beyond PlainsCapital’s control, including the performance of PlainsCapital’s loan portfolio, the economy and designated as restricted cashchanges in interest rates.
PlainsCapital’s allowance for loan losses consists of $18.5 million was repaid in full, thus relieving us of any further obligation. At December 31, 2011three elements: (i) specific valuation allowances established for probable losses on impaired loans; (ii) general historical valuation allowances calculated based on historical loan loss experience for homogenous loans with similar characteristics and 2010, we had no cashtrends; and cash equivalents designated as restricted.(iii) valuation allowances to adjust general reserves based on recent economic conditions and other qualitative risk factors both internal and external to PlainsCapital.
Premiums ReceivableAcquired Loans
Purchased loans acquired in a business combination are recorded at their estimated fair value on their purchase date with no carryover of the related allowance for loan losses. Performing acquired loans are subsequently evaluated for any required allowance at each reporting date. An allowance for loan losses is calculated using a methodology similar to that described above for originated loans. The allowance as determined for each loan is compared to the remaining fair value discount for that loan. If greater, the excess is recognized as an addition to the allowance through a provision for loan losses. If less than the discount, no additional allowance is recorded. Charge-offs and losses first reduce any remaining fair value discount for the loan and once the discount is depleted, losses are applied against the allowance established for that loan.
For PCI loans, cash flows expected to be collected are recast at each reporting date for each loan. These evaluations require the continued use and updating of key assumptions and estimates such as default rates, loss severity given default and prepayment speed assumptions, similar to those used for the initial fair value estimate. Management judgment must be applied in developing these assumptions. If expected cash flows for a loan decreases, an increase in the allowance for loan losses is made through a charge to the provision for loan losses. If expected cash flows for a loan increase, any previously established allowance for loan losses is reversed and any remaining difference increases the accretable yield which will be taken into income over the remaining life of the loan.
F-13
Table of Contents
Hilltop Holdings Inc. and Subsidiaries
Notes to Consolidated Financial Statements (continued)
Assets Segregated for Regulatory Purposes
Under certain conditions, FSC may be required to segregate cash and securities in a special reserve account for the benefit of customers under Rule 15c3-3 promulgated under the Securities Exchange Act of 1934, as amended (the “Exchange Act”). Assets segregated under the provisions of the Exchange Act are not available for general corporate purposes. FSC was required to segregate $19.0 million in cash and securities at December 31, 2012, which are included in other assets within the consolidated balance sheet. In addition, FSC was not required to segregate cash or securities in a special reserve account for the benefit of proprietary accounts of introducing broker-dealers at December 31, 2012.
Broker-Dealer and Clearing Organization Transactions
Amounts recorded in broker-dealer and clearing organization receivables and payables include securities lending activities, as well as amounts related to securities transactions for either FSC customers or for the account of FSC. Securities-borrowed and securities-loaned transactions are generally reported as collateralized financings except where letters of credit or other securities are used as collateral. Securities-borrowed transactions require FSC to deposit cash, letters of credit, or other collateral with the lender. With respect to securities loaned, FSC receives collateral in the form of cash or other assets in an amount generally in excess of the market value of securities loaned. FSC monitors the market value of securities borrowed and loaned on a daily basis, with additional collateral obtained or refunded as necessary. Interest income and interest expense associated with collateralized financings is included in the accompanying consolidated statements of operations.
Insurance Premiums Receivable
Insurance premiums receivable include premiums written and not yet collected. The companyNLASCO routinely evaluates the receivable balance to determine if an allowance for uncollectible amounts is necessary. At December 31, 2012 and 2011, and 2010, the CompanyNLASCO determined that no valuation allowance was necessary.
Deferred Policy Acquisition Costs
Costs of acquiring insurance vary with and are primarily related to the productionsuccessful acquisition of new and renewal business, primarily consisting of commissions, premium taxes and underwriting expenses, and are deferred and amortized over the terms of the policies or reinsurance treaties to which they relate. Proceeds from reinsurance transactions that represent recovery of acquisition costs reduce applicable unamortized acquisition costs in such a manner that net acquisition costs are capitalized and charged to expense in proportion to net revenue recognized. Future investment income is considered in determining the recoverability of deferred policy acquisition costs. The CompanyNLASCO regularly reviews the categories of acquisition costs that are deferred and assesses the recoverability of this asset. A premium deficiency and a corresponding charge to income is recognized if the sum of the expected loss and loss adjustment expenses, unamortized policy acquisition costs, and maintenance costs exceed related unearned insurance premiums and anticipated investment income. At December 31, 20112012 and 2010,2011, there was no premium deficiency.
Reinsurance
In the normal course of business, the CompanyNLASCO seeks to reduce the loss that may arise from catastrophes or other events that could cause unfavorable underwriting results by reinsuring certain levels of risk in various areas of exposure with other insurance enterprises or reinsurers. Amounts recoverable from reinsurers are estimated in a manner consistent with the reinsured policy. The CompanyNLASCO routinely evaluates the receivable balance to determine if any uncollectible balances exist.
Net insurance premiums earned, losses and LAEloss adjustment expenses (“LAE”) and policy acquisition and other underwriting expenses are reported net of the amounts related to reinsurance ceded to other companies. Amounts recoverable from reinsurers related to the portions of the liability for losses and LAE and unearned insurance premiums ceded to them are reported as assets. Reinsurance assumed from other companies, including assumed premiums written and earned and losses and LAE, is accounted for in the same manner as direct insurance written.
F-8F-14
Table of Contents
GoodwillHilltop Holdings Inc. and Other Intangible AssetsSubsidiaries
Notes to Consolidated Financial Statements (continued)
Premises and Equipment
Premises and equipment are stated at cost less accumulated depreciation and amortization computed principally on the straight-line method over the estimated useful lives of the assets, which range between 3 and 40 years. Gains or losses on disposals of premises and equipment are included in results of operations.
Other Real Estate Owned
Real estate acquired through foreclosure is included in other assets within the consolidated balance sheets and is carried at management’s estimate of fair value less costs to sell. Any excess of recorded investment over fair value less cost to sell is charged against the allowance for loan losses when property is initially transferred to other real estate. Subsequent to the initial transfer to other real estate, valuation adjustments are charged against earnings. Valuation adjustments, revenue and expenses from operations of the properties and resulting gains or losses on sale are included in other noninterest expense within the consolidated statements of operations.
Fee Award Receivable
In 2005, FSC participated in a monetization of future cash flows from several tobacco companies owed to a law firm under a settlement agreement (“Fee Award”). FSC estimated the amount and timing of the undiscounted expected cash flows from the receivable. The excess of the receivable’s cash flows expected to be collected over the amount paid is to be accreted into interest income over the remaining life of the receivable (accretable yield). Over the life of the Fee Award, FSC will continue to estimate cash flows expected to be collected and evaluate the receivable for possible impairment. The fee award receivable is included in other assets within the consolidated balance sheets.
Debt Issuance Costs
The Company capitalizes debt issuance costs associated with financing of debt. These costs are amortized on a straight-line basis, which approximates the effective interest method, over the repayment term of the loans. Debt issuance costs of $0.2 million were amortized for each of the years ended December 31, 2012, 2011, and 2010, which is included in interest expense within the consolidated statements of operations. In 2011, an additional $0.2 million of the unamortized balance was written down as a result of NLASCO purchasing $6.9 million of the Hilltop senior exchangeable notes in the open market. At December 31, 2012 and 2011, accumulated amortization was $1.6 million and $1.4 million, respectively.
Goodwill
Goodwill, iswhich represents the excess of cost over the fair value of the net assets acquired. Goodwillacquired, is allocated to reporting units and tested annually during the fourth quarter for impairment and is tested more frequently ifannually, or whenever events andor changes in circumstances indicate that the asset mightcarrying amount should be impaired. Anassessed. The Company performs required annual impairment losstests of its goodwill as of December 31st for its insurance reporting unit, while the acquired banking, mortgage origination and financial advisory reporting units will be tested for impairment annually as of October 1st. Prior to testing goodwill for impairment, the Company has the option to assess on a qualitative basis whether it is recognized to the extentmore likely than not that the fair value of a reporting unit is less than its carrying amount. If determined, based on its assessment of qualitative factors that it is more likely than not that fair value of a reporting unit is less than its carrying amount, exceeds the asset’s fair value. ForCompany will proceed to test goodwill thefor impairment determination is made at the reporting unit level and consistsas a part of two steps.a two-step process. First, the Company determines the fair value of a reporting unit and compares it to its carrying amount. Second, if the carrying amount of a reporting unit exceeds its fair value, an impairment loss is recognized for any excess of the carrying amount of the reporting unit’s goodwill over the implied fair value of that goodwill. The implied fair value of goodwill is determined by allocating the fair value of the reporting unit in a manner similar to a purchase price allocation. The residual fair value after this allocation is the implied fair value of the reporting unit goodwill. Management determined that HTH has two reporting units, which are the Parent (the holding company) and NLASCO (the insurance company).
Intangibles and Other indefinite livedLong-Lived Assets
Intangible assets are acquired assets that lack physical substance but can be distinguished from goodwill because of contractual or other legal rights or because the asset is capable of being sold or exchanged either on its own or in combination with a related contract, asset or liability. The Company’s intangible assets consist of $3.0 million of estimated fair value of state licenses acquired in the NLASCO purchase. The annual impairment test is conducted in conjunction with the annual impairment test of goodwill.
Finite Lived Intangible Assets
We record finite lived intangible assets at the estimated fair value of the assets acquired and amortize the assets over their estimated useful lives. The following finite lived intangible assets were acquired when the Company purchased NLASCO (in thousands).
| | Estimated | | Estimated | |
| | Fair Value | | Useful Life | |
| | | | | |
Customer relationships | | $ | 6,100 | | 12 years | |
Agent relationships | | 3,600 | | 13 years | |
Trade name | | 3,500 | | 15 years | |
Software | | 1,500 | | 5 years | |
| | | | | |
Total | | $ | 14,700 | | | |
| | | | | |
Less accumulated amortization | | (8,626 | ) | | |
Balance at December 31, 2011 | | $ | 6,074 | | | |
Customer and agent relationships are amortized using the sum of the years digits methodprimarily relate to approximate the non-renewal rate of customers and attrition of agents. The trade name and software are amortized using the straight-line method.
Property and Equipment
We carry property and equipment at cost, less accumulated depreciation. We expense maintenance and repairs as incurred. Depreciation is computed primarily using the straight-line method over the estimated useful lives of the assets. The estimated useful lives of the various classes of furniture and equipment assets are as follows:
Asset Class
|
| Estimated Useful
Lives (Years)
|
|
Furniture and other equipment
| | 5
| |
Computer software and hardware
| | 3
| |
Loan Origination Costs
We capitalize loan origination costs associated with financing of debt. These costs are amortized on a straight-line basis, which approximates the effective interest method, over the repayment term of the loans. We amortized $0.2 million of loan origination costs for the years ended December 31, 2011, 2010, and 2009, which is included in interest expense. We wrote down an additional $0.2 million of the unamortized balance in 2011 as a result of NLASCO purchasing $6.9 million of the HTH senior exchangeable notes in the open market. Accumulated amortization was $1.4 million, $1.0 million and $0.9 million as of December 31, 2011, 2010 and 2009, respectively.core deposits,
F-9F-15
Table of Contents
Other AssetsHilltop Holdings Inc. and Subsidiaries
Notes to Consolidated Financial Statements (continued)
Includedcustomer and agent relationships, trade names and non-compete agreements. Intangible assets with definite useful lives are generally amortized on the straight-line method over their estimated lives, although certain intangibles, including core deposits and customer and agent relationships, are amortized on an accelerated basis. Amortization of intangible assets is recorded in other noninterest expense within the consolidated statements of operations. Intangible assets with indefinite useful lives are not amortized until their lives are determined to be definite. Intangible assets, premises and equipment, and other long-lived assets are prepaid insurance and other miscellaneous prepaid expensestested for impairment whenever events or changes in circumstances indicate the carrying amount of $0.5 million and $0.8 million for the years ended December 31, 2011 and 2010, respectively.assets may not be recoverable from future undiscounted cash flows. If impaired, the assets are recorded at fair value.
Derivative Financial Instruments
PlainsCapital’s hedging policies permit the use of various derivative financial instruments to manage interest rate risk or to hedge specified assets and liabilities. In addition, PrimeLending executes interest rate lock commitments (“IRLCs”) with its customers, and FSC executes forward purchase commitments of mortgage-backed securities with its clients, that allow those customers to make mortgage loans at agreed upon rates. The IRLCs and forward purchase commitments meet the definition of a derivative under the provisions of the Derivatives and Hedging Topic of the ASC.
Derivatives are recorded at fair value in the consolidated balance sheets. To qualify for hedge accounting, derivatives must be highly effective at reducing the risk associated with the exposure being hedged and must be designated as a hedge at the inception of the derivative contract. If derivative instruments are designated as hedges of fair values, the change in the fair value of both the derivative instrument and the hedged item are included in current earnings. Changes in the fair value of derivatives designated as hedges of cash flows are recorded in other comprehensive income. Actual cash receipts and/or payments and related accruals on derivatives related to hedges are recorded as adjustments to the line item where the hedged item’s effect on earnings is recorded.
During the life of the hedge, management formally assesses whether derivatives designated as hedging instruments continue to be highly effective in offsetting changes in the fair value or cash flows of hedged items. If management determines that a hedge has ceased to be highly effective, the Company will discontinue hedge accounting prospectively. At such time, previous adjustments to the carrying value of the hedged item would be reversed into earnings, amounts recorded in other comprehensive income would be reclassified into earnings, the derivative instrument would be recorded at fair value and future changes in fair value would be reported in earnings.
Reserve for Losses and Loss Adjustment Expenses
The liability for losses and loss adjustment expensesLAE includes an amount determined from loss reports and individual cases and an amount, based on past experience, for losses incurred but not reported. Such liabilities are necessarily based on estimates and, while management believes that the amount is adequate, the ultimate liability may be in excess of or less than the amounts provided. The methods for making such estimates and for establishing the resulting liability are continually reviewed, and any adjustments are reflected in earnings currently. The liability for losses and loss adjustment expenses has not been reduced for reinsurance recoverable.
Loss Contingencies
Loss contingencies, including claims and legal actions arising in the ordinary course of business, are recorded as liabilities when the likelihood of loss is probable and an amount or range of loss can be reasonably estimated.
Stock-Based Compensation
Stock-based compensation expense for all share-based awards granted is based on the grant date fair value estimated in accordance with the provisions of the Stock Compensation Topic of the ASC. The Company recognizes these compensation costs for only those awards expected to vest over the service period of the award.
F-16
Table of Contents
Hilltop Holdings Inc. and Subsidiaries
Notes to Consolidated Financial Statements (continued)
Advertising
Advertising costs are expensed as incurred. Advertising expense totaled $0.4 million, $34 thousand and $0.1 million during the years ended December 31, 2012, 2011 and 2010, respectively.
Income Taxes
We have been in a taxable loss position since our inception and as a result we have net operating loss carry-forwards to offset operating profits and capital gains from profits from asset sales.
Income taxes are accounted for under the asset and liability method. Deferred tax assets and liabilities are recorded for the estimated future tax effects of the temporary difference between the tax basis and book basis of assets and liabilities reported in the accompanying consolidated balance sheets. The provision for income tax expense or benefit differs from the amounts of income taxes currently payable because certain items of income and expense included in the consolidated financial statements are recognized in different time periods by taxing authorities. Interest and penalties incurred related to tax matters are charged to other interest expense or other noninterest expense, respectively.
ASC 740, specifically 740-10-25, Recognition, clarifies the accounting for uncertainty in income taxes recognized in financial statements in accordance with GAAP. ASC 740 prescribes a recognition threshold and measurement attribute for the financial statement recognition and measurement of a tax position taken or expected to be taken in a tax return. We determine whether the benefits of ourBenefits from uncertain tax positions are more likely than not of being sustained upon audit based onrecognized in the technical merits of the tax position. For tax positions that are more likely than not of being sustained upon audit, we recognize the largest amount of the benefit thatconsolidated financial statements only when it is more likely than not that the tax position will be sustained upon examination by the appropriate taxing authority having full knowledge of all relevant information. A tax position that meets the more-likely-than-not recognition threshold is measured at the largest amount of cumulative benefit that is greater than fifty percent likely of being sustainedrealized upon ultimate settlement. Tax positions that previously failed to meet the more-likely-than-not recognition threshold are recognized in our consolidated financial statements. Forthe reporting period in which that threshold is met. Previously recognized tax positions that no longer meet the more-likely-than-not recognition threshold are derecognized in the reporting period in which that threshold is no longer met. The Company has not more likely than not of being sustained upon audit, we do not recognizerecorded any portion of the benefits in our consolidated financial statements.significant liabilities for uncertain tax positions.
Deferred tax assets, including net operating loss and tax credit carry forwards, are reduced by a valuation allowance when, in the opinion of management, it is more likely than notmore-likely-than-not that any portion of these tax attributes will not be realized. There was no valuation allowance recorded as ofat December 31, 20112012 or 2010.2011.
Convertible DebtCash Flow Reporting
For the purpose of presentation in the consolidated statements of cash flows, cash and cash equivalents are defined as the amount included in the consolidated balance sheets caption “Cash and due from banks” and the portion of the amount in the caption “Federal funds sold and securities purchased under agreements to resell” that represents federal funds sold. Cash equivalents have original maturities of three months or less.
Basic and Diluted Net Income (Loss) Per Share
Basic net income (loss) per share is computed by dividing net income (loss) available to common stockholders by the weighted average number of common shares, while diluted net income (loss) per share is computed by dividing net income (loss) available to common stockholders by the weighted average number of such common shares and dilutive share equivalents. Dilutive share equivalents result from the assumed exercise of employee stock options and redemption of senior exchangeable notes and are calculated using the treasury stock method.
In August 2005, our Operating Partnership, or OP issued $96.6 million aggregate principal amount of senior notes which are exchangeable at an initial rate of 69.8812 shares of common stock per $1,000 principal amount of the notes and callable under certain circumstances. The notes are treated as a combined instrument and not bifurcated to separately account for any embedded derivative instruments principally because, in accordance with ASC 815, Derivatives and Hedging, (i) the conversion feature is indexed to HTH’s common stock and would be classified in stockholders’ equity if it were a freestanding derivative and (ii) the put and call option features are clearly and closely related to the notes at fixed conversion amounts. As a result of our rights offering in January 2007, at which we offered shares of our common stock for sale at a below-market price of $8 per share, the exchangeable rate of our convertible debt was adjusted to 73.95 shares of common stock per $1,000 principal amount of the notes equal to an initial exchange rate of $13.52 per share. As of December 31, 2011, there is $84.0 million senior exchangeable notes outstanding.
F-10F-17
Table of Contents
Stock Based CompensationHilltop Holdings Inc. and Subsidiaries
Notes to Consolidated Financial Statements (continued)
Stock-based compensation expense2. Acquisition
After the close of business on November 30, 2012, Hilltop acquired PlainsCapital in a stock and cash transaction. PlainsCapital merged with and into Meadow Corporation, a wholly owned subsidiary of Hilltop, with Meadow Corporation continuing as the surviving entity under the name “PlainsCapital Corporation.”
As a result of the Merger, each outstanding share of PlainsCapital common stock was converted into the right to receive 0.776 shares of Hilltop common stock and $9.00 in cash, and each outstanding share of PlainsCapital Non-Cumulative Perpetual Preferred Stock, Series C, all the outstanding shares of which are held by the United States Department of the Treasury, was converted into one share of Hilltop Non-Cumulative Perpetual Preferred Stock, Series B (the “Hilltop Series B Preferred Stock”).
The components of the consideration paid are shown in the following table (in thousands).
Fair value of consideration paid: | | | |
Common stock issued | | $ | 387,584 | |
Preferred stock issued | | 114,068 | |
Cash | | 311,805 | |
Total consideration paid | | $ | 813,457 | |
The resulting fair values of the identifiable assets acquired, and liabilities assumed, of PlainsCapital at December 1, 2012 are summarized in the following table (in thousands).
Cash and due from banks | | $ | 393,132 | |
Federal funds sold and securities purchased agreements to resell | | 84,352 | |
Securities | | 730,779 | |
Loans held for sale | | 1,520,833 | |
Loans, net | | 3,195,309 | |
Broker-dealer and clearing organization receivables | | 149,457 | |
Premises and equipment | | 96,886 | |
Other intangible assets | | 70,650 | |
Other assets | | 241,876 | |
Total identifiable assets acquired | | 6,483,274 | |
| | | |
Deposits | | 4,463,069 | |
Broker-dealer and clearing organization payables | | 263,894 | |
Short-term borrowings | | 914,062 | |
Notes payable | | 10,855 | |
Junior subordinated debentures | | 67,012 | |
Other liabilities | | 180,998 | |
Total liabilities assumed | | 5,899,890 | |
| | | |
Net identifiable assets acquired | | 583,384 | |
Goodwill resulting from the acquisition | | 230,073 | |
Net assets acquired | | $ | 813,457 | |
The initial goodwill of $230.1 million resulting from the acquisition represents the inherent long-term value expected from the business opportunities created from combining PlainsCapital with Hilltop. The Company used significant estimates and assumptions to value the identifiable assets acquired and liabilities assumed. The purchase date valuations are considered preliminary and are subject to change for all share-based payment awards grantedup to one year after December 31, 2005the acquisition date. While the Company is based onin the grant date fair value estimatedprocess of finalizing its purchase price allocation, significant changes are not anticipated. The amount of goodwill recorded in accordanceconnection with the provisionsCompany’s acquisition of ASC 718. We recognize these compensation costsPlainsCapital is not deductible for only those awards expectedtax purposes. For further information regarding goodwill, refer to vest over the service period of the award.
We consider the number of vested shares issued under our 2003 equity incentive plan as common stock outstanding and include them in the denominator of our calculation of basic earnings per share. We also consider the total number of unvested restricted shares granted under our 2003 equity incentive plan in the denominator of our calculation of diluted earnings per share if they are dilutive. We return shares forfeited to the 2003 equity incentive plan as shares eligible for future grant and adjust any compensation expense previously recorded on such shares in the period the forfeiture occurs.
Accumulated Other Comprehensive IncomeNote 8.
Amounts recorded in accumulated other comprehensive income as of December 31, 2011 and 2010 represent unrealized gains or losses on our investment portfolio. Total accumulated other comprehensive gain as of December 31, 2011 and 2010 is $14.0 million and $5.3 million, respectively.
Revenue Recognition
Property and liability premiums are recognized as revenue on a pro rata basis over the policy term. The portion of premiums that will be earned in the future is deferred and reported as unearned premiums. Other income consists of premium installment charges, which are recognized when earned, and other miscellaneous income. The Company routinely evaluates the premium receivable balance to determine if an allowance for uncollectible accounts is necessary.
Statutory Accounting Practices
NLASCO is required to report its results of operations and financial position to insurance regulatory authorities based upon statutory accounting practices, or SAP. The significant differences between SAP and GAAP include: 1) under SAP, NLASCO is required to expense all sales and other policy acquisition costs as they are incurred rather than capitalizing and amortizing them over the expected life of the policy as required by GAAP. The immediate charge off of sales and acquisition expenses and other conservative valuations under SAP generally causes a lag between the sale of a policy and the emergence of reported earnings. Because this lag can reduce the Company’s gain from operations on a SAP basis, it can have the effect of reducing the amount of funds available for dividends from insurance companies; 2) under SAP, certain assets are designated as “non admitted” and are charged directly to unassigned surplus, whereas under GAAP, such assets are included in the balance sheet net of an appropriate valuation reserve; 3) under SAP, investments are generally carried at amortized book value and under GAAP, certain investments are carried at fair value; 4) surplus notes are classified as capital and surplus under SAP but classified as notes payable under GAAP; 5) ceded reinsurance receivables are netted against reserves under SAP, but are classified as assets under GAAP; 6) under SAP, while statutory deferred incomes taxes are provided on temporary differences between the statutory and tax basis of assets and liabilities, statutory deferred tax assets are limited based on admissibility tests and allowed deferred income taxes are recorded in unassigned statutory surplus rather than the income statement; and 7) under SAP, the statutory statement of cash flows follows a prescribed method included in the annual statement instructions issued by the National Association of Insurance Commissioners to present changes in amounts in balance sheet accounts which may not reflect actual cash flows from transactions or operations; whereas the cash flows presented in these financial statements are presented in accordance with GAAP.
Recently Adopted Accounting Pronouncements
In December 2010, the Financial Accounting Standards Board, or FASB, issued ASU-2010-29 to address diversity in practice relating to the interpretation of the pro forma revenue and earnings disclosure requirements for business combinations. The amendments in the update specify that if a public entity presents comparative financial statements, the entity should disclose revenue and earnings of the combined entity as though the business combination(s) that occurred during the current year had occurred as of the beginning of the comparable prior annual reporting period only. The amendments also expand the supplemental pro forma disclosures to include a description of the nature and amount of material, nonrecurring pro forma adjustments directly attributable to the business combination included in the reported pro forma revenue and earnings. The amendments in this update are effective prospectively for business combinations for which the acquisition date is on or after the beginning of the first annual reporting period beginning on or after December 15, 2010. The adoption of this guidance did not have a material impact on the Company’s financial statements.
F-11F-18
Table of Contents
InHilltop Holdings Inc. and Subsidiaries
Notes to Consolidated Financial Statements (continued)
The results of operations acquired in the PlainsCapital transaction have been included in Hilltop’s financial results since December 2010,1, 2012. The following table discloses the FASB issued ASU-2010-28 to modify Stepimpact of PlainsCapital (excluding the impact of acquisition-related merger and restructuring charges discussed below) since the acquisition date through December 31, 2012 (in thousands). The table also presents pro forma results had the acquisition taken place on January 1, 2011. The pro forma financial information combines the historical results of Hilltop and PlainsCapital and includes the estimated impact of purchase accounting adjustments. The purchase accounting adjustments reflect the impact of recording the acquired loans at fair value, including the estimated accretion of the goodwill impairment test.purchase discount on the loan portfolio and related adjustments to PlainsCapital’s provision for loan losses. Accretion estimates were based on the acquisition date purchase discount on the loan portfolio, as it was not practicable to determine the amount of discount that would have been recorded based on economic conditions that existed on January 1, 2011. The guidance affects all entities that have recognized goodwill and have one or more reporting units whose carrying amount for purposes of performing Step 1pro forma results do not include any potential operating cost savings as a result of the goodwill impairment test is zeroacquisition. Further, certain costs associated with any restructuring or negative.integration activities are also not reflected in the pro forma results. Pro forma results for 2011 and 2012 include the acquisition-related merger and restructuring charges incurred during the period. The amendments in this update modify Step 1 so that for those reporting units, an entity is required to perform Step 2pro forma results are not indicative of what would have occurred had the goodwill impairment test if it is more likely than not that a goodwill impairment exists. In determining whether it is more likely than not that a goodwill impairment exists, an entity should consider whether there are any adverse qualitative factors indicating that an impairment may exist. The qualitative factors are consistent with existing guidance, which requires that goodwill of a reporting unit be tested for impairment between annual tests if an event occurs or circumstances change that would more likely than not reduce the fair value of a reporting unit below its carrying amount. The amendments in this update are effective for fiscal years beginning after December 15, 2010. The adoption of this guidance did not have a material impactacquisition taken place on the Company’s financial statements.indicated date.
| | PlainsCapital | | Pro Forma Combined | |
| | Acquisition Date | | Twelve Months Ended | |
| | through | | December 31, | |
| | December 31, 2012 | | 2012 | | 2011 | |
Net interest income | | $ | 24,029 | | $ | 221,635 | | $ | 225,436 | |
Other revenues | | 70,085 | | 901,347 | | 616,582 | |
Net income | | 8,361 | | 75,138 | | 63,067 | |
| | | | | | | | | | |
Merger-related expenses of $6.6 million associated with the PlainsCapital acquisition are included in noninterest expense within the consolidated statements of operations for 2012. Such expenses were for professional services and other incremental costs associated with the integration of operations.
In September 2011,connection with the FASB issued ASU 2011-08 to simplify how entities test for goodwill impairment.acquisition of PlainsCapital, Hilltop acquired loans both with and without evidence of credit quality deterioration since origination. The amendments in this update allow an entity to first assess the qualitative factors to determine whether it is more likely than not that theacquired loans were initially recorded at fair value with no carryover of a reporting unit is less than its carrying amount as a basisany allowance for determining whether it is necessary to perform the two-step goodwill impairment test. The amendments are effective for annual and interim goodwill impairment tests performed for fiscal years beginning after December 15, 2011. The adoption of this guidance did not have a material impact onloan losses. For further information regarding the Company’s financial statements.accounting policies for loans acquired in business combinations, refer to Note 1.
Recently Issued Accounting PronouncementsAcquired loans at the acquisition date are presented in the following table (in thousands).
| | Acquired | | Acquired | | Total Acquired | |
Acquired Loans | | Impaired | | Performing | | Loans | |
Commercial and industrial | | $ | 74,911 | | $ | 1,684,706 | | $ | 1,759,617 | |
Real estate | | 63,866 | | 1,077,295 | | 1,141,161 | |
Construction and land development | | 34,008 | | 232,313 | | 266,321 | |
Consumer | | 79 | | 28,131 | | 28,210 | |
Total | | $ | 172,864 | | $ | 3,022,445 | | $ | 3,195,309 | |
In October 2010,
The following table presents information about the FASB issued ASU-2010-26 to address the diversity in practice for the accounting for costs associated with acquiring or renewing insurance contracts. This guidance modifies the definition ofPCI loans at acquisition costs to specify that a cost must be directly related to the successful acquisition of a new or renewal insurance contract in order to be deferred. If application of this guidance would result in the capitalization of acquisition costs that had not previously been capitalized by a reporting entity, the entity may elect not to capitalize those costs. The updated guidance is effective for periods beginning after December 15, 2011. The adoption of this guidance is not expected to have a material impact on the Company’s financial statements.(in thousands).
In May 2011, the FASB issued ASU-2011-04 to clarify ASC 820 and in some instances changed particular principles or requirements for measuring fair value or disclosing information about fair value measurements. The amendments in this update result in common fair value measurement and disclosure requirements in U.S. GAAP and International Financial Reporting Standards (“IFRS”). This updated guidance is effective for periods beginning after December 15, 2011. The adoption of this guidance is not expected to have a material impact on the Company’s financial statements.
In June 2011, the FASB issued ASU-2011-05, which eliminates the current option to report other comprehensive income and its components in the statement of changes in equity. The new standard allows companies to report net income and other comprehensive income in a single, continuous statement, or in two separate, but consecutive statements. The statement(s) would need to be presented with equal prominence as the other primary financial statements. This updated guidance is effective for periods beginning after December 15, 2011. The adoption of this guidance will change our current presentation of other comprehensive income; however, it is not expected to have a material impact on the Company’s financial statements.
In December 2011, the FASB issued ASU-2011-12, which amended ASU-2011-05 and defers guidance related to the presentation of reclassification adjustments out of accumulated other comprehensive income. All other requirements presented in ASU-2011-05 are not affected by this Update. This updated guidance is effective for periods beginning after December 15, 2011. The adoption of this guidance will change our current presentation of other comprehensive income; however, it is not expected to have a material impact on the Company’s financial statements.
Contractually required principal and interest payments | | $ | 252,818 | |
Nonaccretable difference | | 61,527 | |
Cash flows expected to be collected | | 191,291 | |
Accretable difference | | 18,427 | |
Fair value of loans acquired with a deterioration of credit quality | | $ | 172,864 | |
F-12F-19
Table of Contents
2.InvestmentsHilltop Holdings Inc. and Subsidiaries
Notes to Consolidated Financial Statements (continued)
The amortized cost (original cost for equity securities), gross unrealized holding gainsfollowing table presents information about the acquired performing loans at acquisition (in thousands).
Contractually required principal and interest payments | | $ | 3,498,554 | |
Contractual cash flows not expected to be collected | | 92,526 | |
Fair value at acquisition | | 3,022,445 | |
The following table presents the outstanding contractual balance and losses, and fairthe carrying value of available-for-sale and held-to-maturity securities by major security type and class of securitythe PCI loans at December 31, 2011 and 20102012 (in thousands).
Carrying amount | | $ | 166,780 | |
Oustanding balance | | 222,674 | |
Changes in the accretable yield for the PCI loans for the month ended December 31, 2012, were as follows (in thousands).
| | December 31, 2011 | |
| | | | Gross | | Gross | | | |
| | | | Unrealized | | Unrealized | | | |
| | Cost/Amortized | | Holding | | Holding | | Fair | |
| | Cost | | Gains | | Losses | | Value | |
Available-for-sale securities: | | | | | | | | | |
Fixed maturities: | | | | | | | | | |
Government securities | | $ | 27,729 | | $ | 1,439 | | $ | (3 | ) | $ | 29,165 | |
Residential mortgage-backed securities | | 11,708 | | 944 | | — | | 12,652 | |
Commercial mortgage-backed securities | | 2,277 | | 36 | | (10 | ) | 2,303 | |
Corporate debt securities | | 93,452 | | 7,406 | | (177 | ) | 100,681 | |
| | 135,166 | | 9,825 | | (190 | ) | 144,801 | |
| | | | | | | | | |
Equity securities | | 16,813 | | 2,462 | | (253 | ) | 19,022 | |
| | 151,979 | | 12,287 | | (443 | ) | 163,823 | |
| | | | | | | | | |
Other investments: | | | | | | | | | |
Note receivable | | 38,641 | | — | | (53 | ) | 38,588 | |
Warrants | | 12,068 | | 9,721 | | — | | 21,789 | |
| | $ | 202,688 | | $ | 22,008 | | $ | (496 | ) | $ | 224,200 | |
| | December 31, 2010 | |
| | | | Gross | | Gross | | | |
| | | | Unrealized | | Unrealized | | | |
| | Cost/Amortized | | Holding | | Holding | | Fair | |
| | Cost | | Gains | | Losses | | Value | |
Available-for-sale securities: | | | | | | | | | |
Fixed maturities: | | | | | | | | | |
Government securities | | $ | 14,883 | | $ | 1,118 | | $ | — | | $ | 16,001 | |
Residential mortgage-backed securities | | 12,563 | | 1,078 | | — | | 13,641 | |
Commercial mortgage-backed securities | | 2,496 | | 98 | | — | | 2,594 | |
Corporate debt securities | | 85,402 | | 5,564 | | (40 | ) | 90,926 | |
| | 115,344 | | 7,858 | | (40 | ) | 123,162 | |
| | | | | | | | | |
Equity securities | | 8,478 | | 290 | | — | | 8,768 | |
| | 123,822 | | 8,148 | | (40 | ) | 131,930 | |
| | | | | | | | | |
Held-to-maturity securities: | | | | | | | | | |
Fixed maturities: | | | | | | | | | |
Government securities | | 17,035 | | 1,024 | | — | | 18,059 | |
| | $ | 140,857 | | $ | 9,172 | | $ | (40 | ) | $ | 149,989 | |
Balance, December 1, 2012 | | $ | 18,427 | |
Disposals of loans | | 22 | |
Accretion | | 851 | |
Balance, December 31, 2012 | | $ | 17,554 | |
3. Fair Value Measurements
Fair Value Measurements and Disclosures
Hilltop determines fair values in compliance with The Fair Value Measurements and Disclosures Topic of the ASC (the “Fair Value Topic”). The Fair Value Topic defines fair value, establishes a framework for measuring fair value in GAAP and expands disclosures about fair value measurements. The Fair Value Topic defines fair value as the price that would be received to sell an asset or paid to transfer a liability in an orderly transaction between market participants. The Fair Value Topic assumes that transactions upon which fair value measurements are based occur in the principal market for the asset or liability being measured. Further, fair value measurements made under the Fair Value Topic exclude transaction costs and are not the result of forced transactions.
The Fair Value Topic creates a fair value hierarchy that classifies fair value measurements based upon the inputs used in valuing the assets or liabilities that are the subject of fair value measurements. The fair value hierarchy gives the highest priority to quoted prices in active markets for identical assets or liabilities and the lowest priority to unobservable inputs, as indicated below.
·Level 1 Inputs: Unadjusted quoted prices in active markets for identical assets or liabilities that the Company can access at the measurement date.
·Level 2 Inputs: Observable inputs other than Level 1 prices. Level 2 inputs include quoted prices for similar assets or liabilities in active markets, quoted prices for identical or similar assets or liabilities in markets that are not active, inputs other than quoted prices that are observable for the asset or liability (e.g., interest rates, yield curves, prepayment speeds, default rates, credit risks, loss severities, etc.), and inputs that are derived from or corroborated by market data, among others. Based on management’s understanding of the methodologies used by our pricing service, our applicable investments have been valued in accordance with GAAP valuation principles.
·Level 3 Inputs: Unobservable inputs that reflect an entity’s own assumptions about the assumptions that market participants would use in pricing the assets or liabilities. Level 3 inputs include pricing models and discounted cash flow techniques, among others.
F-20
Table of Contents
Hilltop Holdings Inc. and Subsidiaries
Notes to Consolidated Financial Statements (continued)
Fair Value Option
Hilltop has elected to measure substantially all of PrimeLending’s mortgage loans held for sale and certain time deposits at fair value under the provisions of the Fair Value Option. Hilltop elected to apply the provisions of the Fair Value Option to these items so that it would have the opportunity to mitigate volatility in reported earnings caused by measuring related assets and liabilities differently without having to apply complex hedge accounting provisions. Hilltop determines the fair value of the financial instruments accounted for under the provisions of the Fair Value Option in compliance with the provisions of the Fair Value Topic of the ASC discussed above.
At December 31, 2012, the aggregate fair value of PrimeLending loans held for sale accounted for under the Fair Value Option was $1.40 billion, while the unpaid principal balance of those loans was $1.36 billion. The interest component of fair value is reported as interest income on loans in the accompanying consolidated statements of operations.
Hilltop holds a number of financial instruments that are measured at fair value on a recurring basis, either by the application of Fair Value Option or other authoritative pronouncements. The fair values of those instruments are determined as described below.
Cash and Cash Equivalents — For cash and due from banks and federal funds sold, the carrying amount is a reasonable estimate of fair value.
Available For Sale Securities —Most securities available for sale are reported at fair value using Level 2 inputs. The Company obtains fair value measurements from independent pricing services. As the Company is responsible for the determination of fair value, control processes are designed to ensure that the fair values received from independent pricing services are reasonable and the valuation techniques and assumptions used appear reasonable and consistent with prevailing market conditions. The fair value measurements consider observable data that may include dealer quotes, market spreads, cash flows, the U.S. Treasury yield curve, live trading levels, trade execution data, market consensus prepayment speeds, credit information and the financial instruments’ terms and conditions, among other things. For public common and preferred equity stocks, the determination of fair value uses Level 1 inputs based on observable market transactions. Regarding the note receivable and warrants, the determination of fair value uses Level 3 inputs such as internal or external fund manager valuations based on unobservable inputs including recent filings, operating results, balance sheet stability, growth and other business and market sector fundamentals.
Trading Securities —Trading securities are reported at fair value using Level 2 inputs in the same manner as discussed previously for securities available for sale.
Loans Held for Sale — Mortgage loans held for sale are reported at fair value, as discussed above, using Level 2 inputs that consist of commitments on hand from investors or prevailing market prices. These instruments are held for relatively short periods, typically no more than 30 days. As a result, changes in instrument-specific credit risk are not a significant component of the change in fair value.
Deposits —As discussed previously, certain time deposits are reported at fair value by virtue of an election under the provisions of Fair Value Option. Fair values are determined using Level 2 inputs that consist of observable rates paid on instruments of the same tenor in the brokered certificate of deposit market.
Derivatives — Derivatives are reported at fair value using Level 2 inputs. PlainsCapital uses dealer quotes to determine the fair value of interest rate swaps used to hedge time deposits. PrimeLending and FSC use dealer quotes to value forward purchase commitments and forward sale commitments, respectively, executed for both hedging and non-hedging purposes. PrimeLending also issues IRLCs to its customers and FSC issues forward purchase commitments to its clients that are valued based on the change in the fair value of the underlying mortgage loan from inception of the IRLC or purchase commitment to the balance sheet date, adjusted for projected loan closing rates. PrimeLending determines the value of the underlying mortgage loan as discussed in “Loans Held for Sale”, above. FSC determines the value of the underlying mortgage loan from prices of comparable securities used to value forward sale commitments.
Mortgage servicing asset — The mortgage servicing asset is reported at fair value using Level 3 inputs. Fair value is determined by projecting net servicing cash flows, which are then discounted to estimate the fair value. The fair value of the mortgage servicing asset is impacted by a variety of factors, including prepayment assumptions, discount rates, delinquency rates, contractually specified servicing fees, servicing costs and underlying portfolio characteristics.
F-21
Table of Contents
Hilltop Holdings Inc. and Subsidiaries
Notes to Consolidated Financial Statements (continued)
The following table presents information regarding financial assets and liabilities measured at fair value on a recurring basis (in thousands).
| | December 31, 2012 | |
| | Level 1 | | Level 2 | | Level 3 | | Total | |
| | Inputs | | Inputs | | Inputs | | Fair Value | |
Cash and cash equivalents | | $ | 725,162 | | $ | — | | $ | — | | $ | 725,162 | |
Loans held for sale | | — | | 1,399,174 | | — | | 1,399,174 | |
Available for sale securities | | — | | 934,676 | | 56,277 | | 990,953 | |
Trading securities | | — | | 90,113 | | — | | 90,113 | |
Derivative assets | | — | | 15,697 | | — | | 15,697 | |
Mortgage servicing asset | | — | | — | | 2,080 | | 2,080 | |
Time deposits | | — | | 1,073 | | — | | 1,073 | |
Trading liabilities | | — | | 3,164 | | — | | 3,164 | |
Derivative liabilities | | — | | 1,080 | | — | | 1,080 | |
| | | | | | | | | | | | | |
| | December 31, 2011 | |
| | Level 1 | | Level 2 | | Level 3 | | Total | |
| | Inputs | | Inputs | | Inputs | | Fair Value | |
Cash and cash equivalents | | $ | 578,520 | | $ | — | | $ | — | | $ | 578,520 | |
Available for sale securities | | 19,022 | | 144,801 | | 60,377 | | 224,200 | |
| | | | | | | | | | | | | |
The following table includes a rollforward for those financial instruments measured at fair value using Level 3 inputs (in thousands).
| | | | | | | | Total Gains or Losses
(Realized or Unrealized) | |
| | Balance at
Beginning of
Period | | Purchases | | Sales | | Included in
Net Income (Loss) | | Included in Other
Comprehensive
Income (Loss) | | Balance at
End of Period | |
Year ended December 31, 2012 | | | | | | | | | | | | | |
Note receivable and warrants | | $ | 60,377 | | $ | — | | $ | — | | $ | — | | $ | (4,100 | ) | $ | 56,277 | |
Mortgage servicing asset | | — | | 1,890 | | — | | 190 | | — | | 2,080 | |
Total | | $ | 60,377 | | $ | 1,890 | | $ | — | | $ | 190 | | $ | (4,100 | ) | $ | 58,357 | |
| | | | | | | | | | | | | | | | | | | |
Year ended December 31, 2011 | | | | | | | | | | | | | |
Note receivable and warrants | | $ | — | | $ | 50,709 | | $ | — | | $ | — | | $ | 9,668 | | $ | 60,377 | |
Total | | $ | — | | $ | 50,709 | | $ | — | | $ | — | | $ | 9,668 | | $ | 60,377 | |
| | | | | | | | | | | | | | | | | | | |
Year ended December 31, 2010 | | | | | | | | | | | | | |
Note receivable and warrants | | $ | 115 | | $ | — | | $ | (17 | ) | $ | (101 | ) | $ | 3 | | $ | — | |
Total | | $ | 115 | | $ | — | | $ | (17 | ) | $ | (101 | ) | $ | 3 | | $ | — | |
All net unrealized gains in the table above are reflected in the accompanying consolidated financial statements. The unrealized gains for the years ended December 31, 2012 and 2011 relate to the securities still held at December 31, 2012. In July 2011, Hilltop made a $50.0 million term loan to SWS Group, Inc. (“SWS”), and in turn, SWS issued to Hilltop warrants to purchase its common stock. Both the term loan and the warrants are classified as a Level 3 investment.
The SWS term loan cash flow model utilizes yield estimates based on comparable securities in the market. Interest rate is the most significant unobservable input. An increase or decrease in the discount rate would result in an increase or decrease in the fair value measurement of the term loan.
The warrants are valued utilizing a binomial model. SWS common stock price and its related volatility, an unobservable input, are the most significant inputs into the model and, therefore, decreases or increases, respectively, to the stock price would result in a significant change in the fair value measurement of the warrants.
During the year ended December 31, 2010, the Company sold two Level 3 commercial mortgage-backed securities measured at fair value using Level 3 inputs. Realized losses relate to those financial instruments sold by the Company during the year ended December 31, 2010. The Company had no transfers between Levels 1 and 2 during the years ended December 31, 2012, 2011 and 2010.
F-22
Table of Contents
Hilltop Holdings Inc. and Subsidiaries
Notes to Consolidated Financial Statements (continued)
The following table presents the changes in fair value for instruments that are reported at fair value under an election under the Fair Value Option (in thousands).
| | Changes in Fair Value for Assets and Liabilities Reported at Fair Value under Fair Value Option | |
| | Year Ended December 31, 2012 | | Year Ended December 31, 2011 | |
| | | | Other | | Total | | | | Other | | Total | |
| | Net Gains from | | Noninterest | | Changes in | | Net Gains from | | Noninterest | | Changes in | |
| | Sale of Loans | | Income | | Fair Value | | Sale of Loans | | Income | | Fair Value | |
Loans held for sale | | $ | (3,297 | ) | $ | — | | $ | (3,297 | ) | $ | — | | $ | — | | $ | — | |
Other assets | | 190 | | — | | 190 | | — | | — | | — | |
Time deposits | | — | | 7 | | 7 | | — | | — | | — | |
| | | | | | | | | | | | | | | | | | | |
Hilltop also determines the fair value of certain assets and liabilities on a non-recurring basis. In particular, the fair value of all of the assets and liabilities purchased in the PlainsCapital transaction was determined at the acquisition date. In addition, facts and circumstances may dictate a fair value measurement when there is evidence of impairment. Assets and liabilities measured on a non-recurring basis include the items discussed below.
Impaired Loans — As discussed in Note 2, Hilltop reports impaired loans at fair value through allocations of the allowance for loan losses. Hilltop acquired PCI loans with a fair value of $172.9 million at acquisition. The fair value of PCI loans was determined using Level 3 inputs, including estimates of expected cash flows that incorporated assumptions regarding default rates, loss severity rates assuming default, prepayment speeds and estimated collateral values. At December 31, 2012, the carrying value of PCI loans was $166.8 million, which is a reasonable estimate of fair value given the short period of time since the acquisition date.
Other investmentsReal Estate Owned — Hilltop reports other real estate owned at fair value less estimated cost to sell. Any excess of recorded investment over fair value less cost to sell is charged against the allowance for loan losses when property is initially transferred to other real estate. Subsequent to the initial transfer to other real estate, valuation adjustments are charged against earnings. The Company primarily determines fair value using Level 2 inputs consisting of independent appraisals. At December 31, 2012, the estimated fair value of other real estate owned was $11.1 million.
The Fair Value of Financial Instruments Subsection of the ASC requires disclosure of the fair value of financial assets and liabilities, including the financial assets and liabilities previously discussed. The methods for determining estimated fair value for financial assets and liabilities measured at fair value on a recurring or non-recurring basis are discussed above. For other financial assets and liabilities, Hilltop utilizes quoted market prices, if available, to estimate the fair value of financial instruments. Because no quoted market prices exist for a significant portion of Hilltop’s financial instruments, the fair value of such instruments has been derived based on management’s assumptions with respect to future economic conditions, the amount and timing of future cash flows, and estimated discount rates. Different assumptions could significantly affect these estimates. Accordingly, the estimates provided herein do not necessarily indicate amounts which could be realized in a current transaction. Further, as it is management’s intent to hold a significant portion of its financial instruments to maturity, it is not probable that the fair values shown below will be realized in a current transaction.
Because of the wide range of permissible valuation techniques and the numerous estimates which must be made, it may be difficult to make reasonable comparisons of Hilltop’s fair value information to that of other financial institutions. The aggregate estimated fair value amount should in no way be construed as representative of the underlying value of Hilltop and its subsidiaries.
As noted above, the fair value of all of the assets and liabilities purchased in the PlainsCapital transaction was determined at the acquisition date. Given the relatively short period of time that has elapsed since the acquisition date, the fair value of the financial assets and liabilities shown as of December 31, 2012 is equal to its carrying value in most cases. The following methods and assumptions are typically used in estimating the fair value disclosures for financial instruments:
Loans Held for Sale — Estimated fair values of loans held for sale are based on commitments on hand from investors or prevailing market prices. The carrying amount of mortgage loans held for sale has been adjusted to fair value under the provisions of the Fair Value Option.
F-23
Table of Contents
Hilltop Holdings Inc. and Subsidiaries
Notes to Consolidated Financial Statements (continued)
Securities — For securities available for sale and trading securities, the carrying amount is a reasonable estimate of fair value.
Loans — The fair value of loans is estimated by discounting the future cash flows using the current rates at which similar loans would be made to borrowers with similar credit ratings and for the same remaining maturities.
Broker-Dealer and Clearing Organization Receivables — The carrying amount approximates their fair value.
Fee Award Receivable — The carrying amount approximates fair value.
Deposit Liabilities — The estimated fair value of demand deposits, savings accounts and NOW accounts is the amount payable on demand at the reporting date. The fair value of fixed-maturity certificates of deposit is estimated using the rates currently offered for deposits of similar remaining maturities. The carrying amount for variable-rate certificates of deposit approximates their fair values.
Broker-Dealer and Clearing Organization Payables — The carrying amount approximates their fair value.
Short-Term Borrowings — The carrying amounts of federal funds purchased, borrowings under repurchase agreements and other short-term borrowings approximate their fair values.
Debt — The fair values are estimated using discounted cash flow analysis based on current incremental borrowing rates for similar types of borrowing arrangements.
The following table presents the carrying values and estimated fair values of financial instruments are shown below (in thousands).
| | | | Estimated Fair Value | |
| | Carrying | | Level 1 | | Level 2 | | Level 3 | | | |
December 31, 2012 | | Amount | | Inputs | | Inputs | | Inputs | | Total | |
Financial assets | | | | | | | | | | | |
Cash and short-term investments | | $ | 725,162 | | $ | 725,162 | | $ | — | | $ | — | | $ | 725,162 | |
Securities | | 1,399,944 | | — | | 1,399,944 | | — | | 1,399,944 | |
Loans held for sale | | 1,081,066 | | — | | 1,081,066 | | — | | 1,081,066 | |
Loans, net | | 3,148,987 | | — | | — | | 3,148,987 | | 3,148,987 | |
Broker-dealer and clearing organization receivables | | 145,564 | | — | | 145,564 | | — | | 145,564 | |
| | | | | | | | | | | |
Fee award receivable | | 18,467 | | — | | 18,467 | | — | | 18,467 | |
Cash surrender value of life insurance policies | | 24,086 | | — | | 24,086 | | — | | 24,086 | |
Interest rate swaps, interest rate lock commitments (“IRLCs”) and forward purchase commitments | | 15,697 | | — | | 15,697 | | — | | 15,697 | |
Mortgage servicing asset | | 2,080 | | — | | — | | 2,080 | | 2,080 | |
Accrued interest receivable | | 15,185 | | — | | 15,185 | | — | | 15,185 | |
| | | | | | | | | | | |
Financial liabilities | | | | | | | | | | | |
Deposits | | 4,700,461 | | — | | 4,698,848 | | — | | 4,698,848 | |
Broker-dealer and clearing organization payables | | 187,990 | | — | | 187,990 | | — | | 187,990 | |
Other trading liabilities | | 3,164 | | — | | 3,164 | | — | | 3,164 | |
Short-term borrowings | | 728,250 | | — | | 728,250 | | — | | 728,250 | |
Debt | | 208,551 | | — | | 217,092 | | — | | 217,092 | |
| | | | | | | | | | | |
Forward purchase commitments | | 1,080 | | — | | 1,080 | | — | | 1,080 | |
Accrued interest payable | | 1,911 | | — | | 1,911 | | — | | 1,911 | |
| | | | | | | | | | | | | | | | |
December 31, 2011 | | | | | | | | | | | |
Financial assets | | | | | | | | | | | |
Cash and short-term investments | | $ | 578,520 | | $ | 578,520 | | $ | — | | $ | — | | $ | 578,520 | |
Securities | | 224,200 | | — | | 224,200 | | — | | 224,200 | |
| | | | | | | | | | | |
Financial liabilities: | | | | | | | | | | | |
Debt | | 131,450 | | — | | 129,989 | | — | | 129,989 | |
| | | | | | | | | | | | | | | | |
The deferred income amounts arising from unrecognized financial instruments are not significant. These financial instruments also have contractual interest rates at or above current market rates. Therefore, no fair value disclosure is provided for these items.
F-24
Table of Contents
Hilltop Holdings Inc. and Subsidiaries
Notes to Consolidated Financial Statements (continued)
4. Securities
The amortized cost and fair value of available for sale securities are summarized as follows (in thousands).
| | | | Gross | | Gross | | | |
| | Amortized | | Unrealized | | Unrealized | | | |
| | Cost | | Gains | | Losses | | Fair Value | |
December 31, 2012 | | | | | | | | | |
U. S. government agencies: | | | | | | | | | |
Bonds | | $ | 531,934 | | $ | 1,804 | | $ | (316 | ) | $ | 533,422 | |
Residential mortgage-backed securities | | 23,024 | | 627 | | (70 | ) | 23,581 | |
Collateralized mortgage obligations | | 96,074 | | 54 | | (79 | ) | 96,049 | |
Corporate debt securities | | 79,600 | | 7,589 | | — | | 87,189 | |
States and political subdivisions | | 175,004 | | 68 | | (2,138 | ) | 172,934 | |
Commercial mortgage-backed securities | | 1,001 | | 72 | | — | | 1,073 | |
Equity securities | | 19,289 | | 1,139 | | — | | 20,428 | |
Note receivable | | 40,508 | | 3,652 | | — | | 44,160 | |
Warrants | | 12,068 | | 49 | | — | | 12,117 | |
Totals | | $ | 978,502 | | $ | 15,054 | | $ | (2,603 | ) | $ | 990,953 | |
| | | | | | | | | |
December 31, 2011 | | | | | | | | | |
U. S. government agencies: | | | | | | | | | |
Bonds | | $ | 27,729 | | $ | 1,439 | | $ | (3 | ) | $ | 29,165 | |
Corporate debt securities | | 93,452 | | 7,406 | | (177 | ) | 100,681 | |
Residential mortgage-backed securities | | 11,708 | | 944 | | — | | 12,652 | |
Commercial mortgage-backed securities | | 2,277 | | 36 | | (10 | ) | 2,303 | |
Equity securities | | 16,813 | | 2,462 | | (253 | ) | 19,022 | |
Note receivable | | 38,641 | | — | | (53 | ) | 38,588 | |
Warrants | | 12,068 | | 9,721 | | — | | 21,789 | |
Totals | | $ | 202,688 | | $ | 22,008 | | $ | (496 | ) | $ | 224,200 | |
Included within the available for sale equity securities are 1,475,387 shares of SWS common stock. Furthermore, available for sale securities include a senior unsecured loan to SWS Group, Inc, or “SWS”, in a principal amount of $50.0 million pursuant to a credit agreement, which loan bears interest of 8.0% per annum, is prepayable by SWS subject to certain conditions after three years, and has a maturity of five years. SWS issued usHilltop warrants to purchase 8,695,652 shares of SWS common stock, $0.10 par value per share, exercisable at a price of $5.75 per share subject to anti-dilution adjustments. If the warrants were fully exercised, weHilltop would own 17.4%24.6% of SWS. The fair value of other investments includes the fair value of the note receivable and warrants as of December 31, 2011.
In the twelve months ended December 31, 2011, NLASCO sold portions of three held-to-maturity securities and reclassed the remaining held- to-maturity securities to available-for-sale. The sales resulted in a realized gain of $0.8 million and the subsequent reclass resulted in an other comprehensive income benefit of $0.4 million. The circumstances that led to the sale of the securities were the high realizable investment gains. Management believes this is an isolated, nonrecurring and unusual circumstance and did not taint future classification of additional held-to-maturity securities. Management decided to reclassify the remaining held-to-maturity investments as available-for-sale as management does not currently desire to utilize the held-to-maturity classification.
F-13F-25
Table of Contents
The following table summarizes the length of timeHilltop Holdings Inc. and Subsidiaries
Notes to Consolidated Financial Statements (continued)
Information regarding available for sale securities with unrealized losses at December 31, 2011 have beenthat were in an unrealized loss position (inis shown in the following tables (dollars in thousands).
| | Less than 12 Months | | 12 Months or More | | Total | |
| | Estimated | | Gross | | Estimated | | Gross | | Estimated | | Gross | |
| | Fair | | Unrealized | | Fair | | Unrealized | | Fair | | Unrealized | |
| | Value | | Losses | | Value | | Losses | | Value | | Losses | |
Available-for-sale securities: | | | | | | | | | | | | | |
Fixed maturities: | | | | | | | | | | | | | |
Government securities | | $ | 1,695 | | $ | (3 | ) | $ | — | | $ | — | | $ | 1,695 | | $ | (3 | ) |
Residential mortgage-backed securities | | | | | | | | | | | | | |
Commercial mortgage-backed securities | | 487 | | (10 | ) | — | | — | | 487 | | (10 | ) |
Corporate debt securities | | $ | 5,254 | | $ | (177 | ) | $ | — | | $ | — | | $ | 5,254 | | $ | (177 | ) |
| | 7,436 | | (190 | ) | — | | — | | 7,436 | | (190 | ) |
| | | | | | | | | | | | | |
Equity securities | | 8,476 | | (253 | ) | — | | — | | 8,476 | | (253 | ) |
| | $ | 15,912 | | $ | (443 | ) | $ | — | | $ | — | | $ | 15,912 | | $ | (443 | ) |
| | | | | | | | | | | | | |
Other Investments | | | | | | | | | | | | | |
Note receivable | | 38,588 | | (53 | ) | — | | — | | 38,588 | | (53 | ) |
Warrants | | — | | — | | — | | — | | — | | — | |
| | $ | 54,500 | | $ | (496 | ) | $ | — | | $ | — | | $ | 54,500 | | $ | (496 | ) |
| | December 31, 2012 | | December 31, 2011 | |
| | Number of | | | | Unrealized | | Number of | | | | Unrealized | |
| | Securities | | Fair Value | | Losses | | Securities | | Fair Value | | Losses | |
U. S. government agencies: | | | | | | | | | | | | | |
Bonds: | | | | | | | | | | | | | |
Unrealized loss for less than twelve months | | 16 | | $ | 238,732 | | $ | 316 | | 2 | | $ | 1,695 | | $ | 3 | |
Unrealized loss for twelve months or longer | | — | | — | | — | | — | | — | | — | |
| | 16 | | 238,732 | | 316 | | 2 | | 1,695 | | 3 | |
Mortgage-backed: | | | | | | | | | | | | | |
Unrealized loss for less than twelve months | | 7 | | 12,279 | | 70 | | — | | — | | — | |
Unrealized loss for twelve months or longer | | — | | — | | — | | — | | — | | — | |
| | 7 | | 12,279 | | 70 | | — | | — | | — | |
Collateralized mortgage obligations: | | | | | | | | | | | | | |
Unrealized loss for less than twelve months | | 8 | | 38,887 | | 79 | | — | | — | | — | |
Unrealized loss for twelve months or longer | | — | | — | | — | | — | | — | | — | |
| | 8 | | 38,887 | | 79 | | — | | — | | — | |
Corporate debt securities: | | | | | | | | | | | | | |
Unrealized loss for less than twelve months | | — | | — | | — | | 5 | | 5,254 | | 177 | |
Unrealized loss for twelve months or longer | | — | | — | | — | | — | | — | | — | |
| | — | | — | | — | | 5 | | 5,254 | | 177 | |
States and political subdivisions: | | | | | | | | | | | | | |
Unrealized loss for less than twelve months | | 224 | | 156,458 | | 2,136 | | — | | — | | — | |
Unrealized loss for twelve months or longer | | 1 | | 206 | | 2 | | — | | — | | — | |
| | 225 | | 156,664 | | 2,138 | | — | | — | | — | |
Commercial mortgage-backed securities: | | | | | | | | | | | | | |
Unrealized loss for less than twelve months | | — | | — | | — | | 1 | | 487 | | 10 | |
Unrealized loss for twelve months or longer | | — | | — | | — | | — | | — | | — | |
| | — | | — | | — | | 1 | | 487 | | 10 | |
Equity securities: | | | | | | | | | | | | | |
Unrealized loss for less than twelve months | | — | | — | | — | | 38 | | 8,476 | | 253 | |
Unrealized loss for twelve months or longer | | — | | — | | — | | — | | — | | — | |
| | — | | — | | — | | 38 | | 8,476 | | 253 | |
Note receivable: | | | | | | | | | | | | | |
Unrealized loss for less than twelve months | | — | | — | | — | | 1 | | 38,588 | | 53 | |
Unrealized loss for twelve months or longer | | — | | — | | — | | — | | — | | — | |
| | — | | — | | — | | 1 | | 38,588 | | 53 | |
Total available for sale: | | | | | | | | | | | | | |
Unrealized loss for less than twelve months | | 255 | | 446,356 | | 2,601 | | 47 | | 54,500 | | 496 | |
Unrealized loss for twelve months or longer | | 1 | | 206 | | 2 | | — | | — | | — | |
| | 256 | | $ | 446,562 | | $ | 2,603 | | 47 | | $ | 54,500 | | $ | 496 | |
ForDuring the twelve monthsyears ended December 31, 2012 and 2011, the Company did not record any other-than-temporary impairments. During 2010, the Company took other-than-temporary impairments and recognized a loss in earnings of $0.1 million. While all of the investments are monitored for potential other-than-temporary impairment, our analysis and experience indicate that these investments generally do not present a great risk of other-than-temporary-impairment, as fair value should recover over time. Factors considered in ourthe Company’s analysis include the reasons for the unrealized loss position, the severity and duration of the unrealized loss position, credit worthiness, and forecasted performance of the investee. While some of the securities held in the investment portfolio have decreased in value since the date of acquisition, the severity of loss and the duration of the loss position are not believed to be significant enough to warrant other-than-temporary impairment of the securities. The Company does not intend, nor is it likely that the Company will be required to sell these securities before the recovery of the cost basis; and, therefore, we domanagement does not believe any other-than-temporary impairments exist as ofat December 31, 2011.2012.
During 2010 and 2009, the Company took other-than-temporary impairments and recognized a loss in earnings of $70,000 and $0.8 million, respectively.
Gross realized investment gains and losses for the year ended December 31, 2011, 2010 and 2009 are summarized as follows (in thousands).
| | Twelve Months Ended December 31, | |
| | 2011 | | 2010 | | 2009 | |
| | Gross | | Gross | | | | Gross | | Gross | | | | Gross | | Gross | | | |
| | Gains | | Losses | | Total | | Gains | | Losses | | Total | | Gains | | Losses | | Total | |
| | | | | | | | | | | | | | | | | | | |
Fixed maturities | | $ | 868 | | $ | (51 | ) | $ | 817 | | $ | 267 | | $ | (130 | ) | $ | 137 | | $ | 503 | | $ | (1,226 | ) | $ | (723 | ) |
Equity securities | | — | | — | | — | | — | | — | | — | | 1,032 | | (2 | ) | 1,030 | |
| | $ | 868 | | $ | (51 | ) | $ | 817 | | $ | 267 | | $ | (130 | ) | $ | 137 | | $ | 1,535 | | $ | (1,228 | ) | $ | 307 | |
Sales of available-for-sale and previously mentioned held-to-maturity investment securities resulted in the following during the year ended December 31, 2011, 2010 and 2009 (in thousands).
| | 2011 | | 2010 | | 2009 | |
Proceeds | | $ | 12,859 | | $ | 16,726 | | $ | 23,647 | |
| | | | | | | | | | |
Gross gains | | $ | 868 | | $ | 267 | | $ | 1,535 | |
| | | | | | | | | | |
Gross losses | | $ | (51 | ) | $ | (130 | ) | $ | (1,228 | ) |
F-14F-26
Table of Contents
Hilltop Holdings Inc. and Subsidiaries
Notes to Consolidated Financial Statements (continued)
Expected maturities may differ from contractual maturities because certain borrowers may have the right to call or prepay obligations with or without penalties. The scheduleamortized cost and fair value of fixed maturities available-for-salesecurities, excluding trading and held-to-maturityavailable for sale equity securities, at December 31, 2011 and 20102012, are shown by contractual maturity is as followsbelow (in thousands).
| | December 31, 2011 | |
| | Amortized | | Fair | |
| | Cost | | Value | |
Available-for-sale fixed maturities: | | | | | |
Due within one year | | $ | 12,608 | | $ | 12,942 | |
Due after one year through five years | | 69,594 | | 73,300 | |
Due six years through ten years | | 38,065 | | 42,766 | |
Due after ten years | | 914 | | 838 | |
Mortgage-backed securities | | 13,985 | | 14,955 | |
| | $ | 135,166 | | $ | 144,801 | |
| | | | | |
Other Investments: | | | | | |
Due after one year through five years | | $ | 50,709 | | $ | 60,377 | |
| | $ | 50,709 | | $ | 60,377 | |
| | December 31, 2010 | |
| | Amortized | | Fair | |
| | Cost | | Value | |
Available-for-sale fixed maturities: | | | | | |
Due within one year | | $ | 8,228 | | $ | 8,420 | |
Due after one year through five years | | 58,959 | | 62,339 | |
Due six years through ten years | | 33,098 | | 36,168 | |
Mortgage-backed securities | | 15,059 | | 16,235 | |
| | $ | 115,344 | | $ | 123,162 | |
| | | | | |
Held-to-maturity debt securities: | | | | | |
Due within one year | | $ | 201 | | $ | 204 | |
Due after one year through five years | | 12,171 | | 12,749 | |
Due six years through ten years | | 4,663 | | 5,106 | |
| | $ | 17,035 | | $ | 18,059 | |
| | Amortized | | | |
| | Cost | | Fair Value | |
Due in one year or less | | $ | 28,357 | | $ | 28,562 | |
Due after one year through five years | | 132,568 | | 140,906 | |
Due after five years through ten years | | 39,769 | | 43,455 | |
Due after ten years | | 638,420 | | 636,899 | |
| | 839,114 | | 849,822 | |
| | | | | |
Mortgage-backed securities | | 23,024 | | 23,581 | |
Collateralized mortgage obligations | | 96,074 | | 96,049 | |
Commercial mortgage-backed securities | | 1,001 | | 1,073 | |
| | $ | 959,213 | | $ | 970,525 | |
Net investment income forFor the yearyears ended December 31, 2012, 2011, and 2010, Hilltop received proceeds from the sale of securities of $4.9 million, $12.9 million, and 2009 is as follows (in thousands).$16.7 million, respectively, and realized gross gains of $0.1 million, $0.9 million, and $0.3 million, respectively. Hilltop determines the cost of securities sold by specific identification.
| | Twelve Months Ended December 31, | |
| | 2011 | | 2010 | | 2009 | |
Cash equivalents | | $ | 1,886 | | $ | 1,803 | | $ | 457 | |
Fixed maturities | | 6,115 | | 6,190 | | 6,157 | |
Equity securities | | 661 | | 161 | | 252 | |
Other investments | | 2,387 | | — | | — | |
| | 11,049 | | 8,154 | | 6,866 | |
| | | | | | | |
Investment expenses | | 511 | | 490 | | 408 | |
| | | | | | | |
Net investment income | | $ | 10,538 | | $ | 7,664 | | $ | 6,458 | |
FSC realized net losses from its trading securities portfolio of $0.3 million during the month ended December 31, 2012. The net losses are recorded as a component of other noninterest income within the consolidated statements of operations.
Securities with a carrying amount of $635.2 million at December 31, 2012 (with a fair value of $633.4 million) were pledged to secure public and trust deposits, federal funds purchased and securities sold under agreements to repurchase, and for other purposes as required or permitted by law.
Mortgage-backed securities and collateralized mortgage obligations consist principally of Government National Mortgage Association (“GNMA”), Federal National Mortgage Association (“FNMA”) and Federal Home Loan Mortgage Corporation (“FHLMC”) pass-through and participation certificates. GNMA securities are guaranteed by the full faith and credit of the United States, while FNMA and FHLMC securities are fully guaranteed by those respective United States government-sponsored agencies, and conditionally guaranteed by the full faith and credit of the United States.
At December 31, 2012 and 2011, and 2010, the CompanyNLASCO had on deposit in custody for various State Insurance Departmentsstate insurance departments investments with carrying values of approximately $8.5$9.3 million and $8.4$8.5 million, respectively.
F-155. Loans and Allowance for Loan Losses
Loans summarized by category at December 31, 2012 are as follows (in thousands). There were no loans at December 31, 2011.
Commercial and industrial | | $ | 1,660,293 | |
Real estate | | 1,184,237 | |
Construction and land development | | 280,474 | |
Consumer | | 27,392 | |
| | 3,152,396 | |
Allowance for loan losses | | (3,409 | ) |
Total loans, net of allowance | | $ | 3,148,987 | |
F-27
Table of Contents
3.Fair Value MeasurementsHilltop Holdings Inc. and Subsidiaries
Notes to Consolidated Financial Statements (continued)
PlainsCapital has lending policies in place with the goal of establishing an asset portfolio that will provide a return on stockholders’ equity sufficient to maintain capital to assets ratios that meet or exceed established regulatory guidelines. Loans are underwritten with careful consideration of the borrower’s financial condition, the specific purpose of the loan, the primary sources of repayment and any collateral pledged to secure the loan.
Underwriting procedures address financial components based on the size or complexity of the credit. The financial components include but are not limited to current and projected global cash flows, shock analysis and/or stress testing, and trends in appropriate balance sheet and statement of operations ratios. Collateral analysis includes a complete description of the collateral, as well as determining values, monitoring requirements, loan to value ratios, concentration risk, appraisal requirements and other information relevant to the collateral being pledged. Guarantor analysis includes liquidity and global cash flow analysis based on the significance the guarantors are expected to serve as secondary repayment sources. PlainsCapital’s underwriting standards are governed by adherence to its loan policy. The loan policy provides for specific guidelines by portfolio segment, including commercial and industrial, real estate, construction and land development, and consumer loans. Within each individual portfolio segment, permissible and impermissible loan types are explicitly outlined. Within the loan types, minimum requirements for the underwriting factors listed above are provided.
PlainsCapital maintains a loan review department that reviews credit risk in response to both external and internal factors that potentially impact the performance of either individual loans or the overall loan portfolio. The loan review process reviews the creditworthiness of borrowers and determines compliance with the loan policy. The loan review process complements and reinforces the risk identification and assessment decisions made by lenders and credit personnel. Results of these reviews are presented to management and the Bank’s Board of Directors.
Impaired loans exhibit a clear indication that the borrower’s cash flow may not be sufficient to meet principal and interest payments, which is generally when a loan is 90 days past due unless the asset is both well secured and in the process of collection. Impaired loans include non-accrual loans, troubled debt restructurings (“TDRs”), PCI loans and partially charged-off loans.
PCI loans at December 31, 2012 are summarized by class in the following table (in thousands). There were no impaired loans at December 31, 2012 other than PCI loans. There were no impaired loans at December 31, 2011.
| | Unpaid | | | | | | Total | |
| | Contractual | | Nonaccretable | | Accretable | | Recorded | |
| | Principal Balance | | Difference | | Yield | | Investment | |
Commercial and industrial: | | | | | | | | | |
Secured | | $ | 91,633 | | $ | 24,982 | | $ | 6,114 | | $ | 67,967 | |
Unsecured | | 12,198 | | 8,707 | | 472 | | 3,419 | |
Real estate: | | | | | | | | | |
Secured by commercial properties | | 66,736 | | 15,816 | | 7,294 | | 55,519 | |
Secured by residential properties | | 8,690 | | 2,251 | | 557 | | 6,728 | |
Construction and land development: | | | | | | | | | |
Residential construction loans | | 14,787 | | 2,903 | | 1,165 | | 11,776 | |
Commercial construction loans and land development | | 28,538 | | 6,703 | | 1,942 | | 21,294 | |
Consumer | | 92 | | 16 | | 9 | | 77 | |
| | $ | 222,674 | | $ | 61,378 | | $ | 17,553 | | $ | 166,780 | |
Interest income recorded on accruing impaired loans was $0.9 million for the month ended December 31, 2012. Interest income recorded on non-accrual loans in 2012 was nominal. At December 31, 2012, PlainsCapital had no unadvanced commitments to borrowers whose loans have been restructured in troubled debt restructurings.
Non-accrual loans at December 31, 2012, were $1.8 million, all of which were real estate loans secured by residential properties that are classified as held for sale and carried at fair value. All PCI loans are considered to be performing due to the application of the accretion method. There were no non-accrual loans at December 31, 2011.
The Company’s estimates of fair value for financial assets and financial liabilities are based on the framework established in ASC 820, Fair Value Measurements and Disclosures. The framework is based on the inputs used in valuation and gives the highest priority to quoted prices in active markets and requires that observable inputs be used in the valuations when available. The disclosure of fair value estimates is based on whether the significant inputs into the valuation are observable. In determining the level of the hierarchy in which the estimate is disclosed, the highest priority is given to unadjusted quoted prices in active markets and the lowest priority to unobservable inputs that reflect the Company’s significant market assumptions. The three levels of the hierarchy are as follows:
·Level 1 - Unadjusted quoted market prices for identical assets or liabilities in active markets that the Company has the ability to access.
·Level 2 - Quoted prices for similar assets or liabilities in active markets; quoted prices for identical or similar assets or liabilities in inactive markets; or valuations based on models where the significant inputs are observable (e.g., interest rates, yield curves, prepayment speeds, default rates, loss severities, etc.) or can be corroborated by observable market data. Based on management’s understanding of the methodologies used by our pricing service, all applicable investments have been valued in accordance with GAAP valuation principles.
·Level 3 - Valuations based on models where significant inputs are not observable. The unobservable inputs reflect the Company’s own assumptions about the assumptions that market participants would use.
If the market were to worsen, there can be no assurance that we will not experience additional losses on our investments and reductions to earnings.
Fixed maturities
The Company utilizes a pricing service to estimate fair value measurements for its fixed maturities. The pricing service utilizes market quotations for fixed maturity securities that have quoted prices in active markets. Since fixed maturities other than U.S. Treasury securities generally do not trade on a daily basis, the pricing service prepares estimates of fair value measurements for these securities using its proprietary pricing applications, which include available relevant market information, benchmark curves, benchmarking of like securities, sector groupings and matrix pricing.
The pricing service evaluates each asset class based on relevant market information, relevant credit information, perceived market movements and sector news. The market inputs utilized in the pricing evaluation, listed in the approximate order of priority, include: benchmark yields, reported trades, broker/dealer quotes, issuer spreads, two-sided markets, benchmark securities, bids, offers, reference data, and industry and economic events. The extent of the use of each market input depends on the asset class and the market conditions. Depending on the security, the priority of the use of inputs may change or some market inputs may not be relevant. For some securities, additional inputs may be necessary.
The pricing service utilized by the Company has indicated that they will only produce an estimate of fair value if there is objectively verifiable information to produce a valuation. If the pricing service discontinues pricing an investment, the Company would be required to produce an estimate of fair value using some of the same methodologies as the pricing service but would have to make assumptions for market-based inputs that are unavailable due to market conditions.
The fair value estimates of most fixed maturity investments are based on observable market information rather than market quotes. Accordingly, the estimates of fair value for such fixed maturities, other than U.S. Treasury securities, provided by the pricing service are included in the amount disclosed in Level 2 of the hierarchy. The estimated fair value of U.S. Treasury securities is included in the amount disclosed in Level 1 as the estimates are based on unadjusted market prices.
The Company reviews the estimates of fair value provided by the pricing service and compares the estimates to the Company’s knowledge of the market to determine if the estimates obtained are representative of the prices in the market. In addition, the Company has periodic discussions with the pricing service to discuss any changes in their process and reactions to overall markets. These processes have not highlighted any significant issues with the fair value estimates received from the pricing service.
F-16F-28
Table of Contents
Non-Fixed MaturitiesHilltop Holdings Inc. and Other InvestmentsSubsidiaries
Notes to Consolidated Financial Statements (continued)
Equities—Public CommonPlainsCapital classifies loan modifications as TDRs when it concludes that it has both granted a concession to a debtor and Preferredthat the debtor is experiencing financial difficulties. Loan modifications are typically structured to create affordable payments for the debtor and can be achieved in a variety of ways. PlainsCapital modifies loans by reducing interest rates and/or lengthening loan amortization schedules. PlainsCapital also reconfigures a single loan into two or more loans (“A/B Note”). The typical A/B Note restructure results in a “bad” loan which is charged off and a “good” loan or loans the terms of which comply with the Bank’s customary underwriting policies. The debt charged off on the “bad” loan is not forgiven to the debtor.
For public common and preferred stocks,No acquired performing loans or loans originated subsequent to the Company receives prices fromacquisition date have been modified in a nationally recognized pricing service that are based on observable market transactions and includes these estimates in the amount disclosed in Level 1.TDR.
Other Investments
The Company holds investments in SWS as a note receivable and warrants, which are reported in other investments. The $60.4 million fair valueAn analysis of these investments at December��31, 2011 was disclosed in Level 3. The fair value estimate is determined either internally or by an external fund manager based on recent filings, operating results, balance sheet stability, growth and other business and market sector fundamentals. Due to the significant unobservable inputs in these valuations, the Company includes the total fair value estimate for allaging of these investmentsPlainsCapital’s loan portfolio at December 31, 20112012 is shown in the amount disclosed in Level 3.
The following table presents the hierarchy used by the Company by asset and liability type to determine their value at December 31, 2011 and 2010 (in thousands).
| | Twelve months ended December 31, 2011 | |
| | Total | | Level 1 | | Level 2 | | Level 3 | |
Financial assets: | | | | | | | | | |
| | | | | | | | | |
Cash and cash equivalents | | $ | 578,520 | | $ | 578,520 | | $ | — | | $ | — | |
Fixed Maturities | | | | | | | | | |
Government securities | | 29,165 | | | | 29,165 | | | |
Residential mortgage backed securities | | 12,652 | | | | 12,652 | | | |
Commercial mortgage backed securities | | 2,303 | | | | 2,303 | | | |
Corporate debt securities | | 100,681 | | | | 100,681 | | | |
Equity securities | | | | | | | | | |
Common stock | | 19,022 | | 19,022 | | | | | |
Other investments | | | | | | | | | |
Note receivable | | 38,588 | | | | | | 38,588 | |
Warrants | | 21,789 | | | | | | 21,789 | |
Total | | $ | 802,720 | | $ | 597,542 | | $ | 144,801 | | $ | 60,377 | |
| | | | | | | | | | | | Accruing Loans | |
| | Loans Past Due | | Loans Past Due | | Total | | Current | | Total | | Past Due | |
| | 30-89 Days | | 90 Days or More | | Past Due Loans | | Loans | | Loans | | 90 Days or More | |
Commercial and industrial: | | | | | | | | | | | | | |
Secured | | $ | 12,858 | | $ | 7,175 | | $ | 20,033 | | $ | 1,531,499 | | $ | 1,551,532 | | $ | 2,000 | |
Unsecured | | 3 | | — | | 3 | | 108,758 | | 108,761 | | — | |
Real estate: | | | | | | | | | | | | | |
Secured by commercial properties | | 2,616 | | 2,406 | | 5,022 | | 980,988 | | 986,010 | | — | |
Secured by residential properties | | 3,075 | | 199 | | 3,274 | | 194,953 | | 198,227 | | — | |
Construction and land development: | | | | | | | | | | | | | |
Residential construction loans | | 156 | | 2,435 | | 2,591 | | 99,825 | | 102,416 | | — | |
Commercial construction loans and land development | | 696 | | 2,374 | | 3,070 | | 174,988 | | 178,058 | | — | |
Consumer | | 84 | | — | | 84 | | 27,308 | | 27,392 | | — | |
| | $ | 19,488 | | $ | 14,589 | | $ | 34,077 | | $ | 3,118,319 | | $ | 3,152,396 | | $ | 2,000 | |
| | Twelve months ended December 31, 2010 | |
| | Total | | Level 1 | | Level 2 | | Level 3 | |
Financial assets: | | | | | | | | | |
| | | | | | | | | |
Cash and cash equivalents | | $ | 649,439 | | $ | 649,439 | | $ | — | | $ | — | |
Fixed Maturities | | | | | | | | | |
Government securities | | 16,001 | | | | 16,001 | | | |
Residential mortgage backed securities | | 13,641 | | | | 13,641 | | | |
Commercial mortgage backed securities | | 2,594 | | | | 2,594 | | | |
Corporate debt securities | | 90,926 | | | | 90,926 | | | |
Equity securities | | | | | | | | | |
Common stock | | 8,516 | | 8,516 | | | | | |
Non-redeemable preferred stock | | 252 | | 252 | | | | | |
Total | | $ | 781,369 | | $ | 658,207 | | $ | 123,162 | | $ | — | |
Management tracks credit quality trends on a quarterly basis related to: (i) past due levels, (ii) non-performing asset levels, (iii) classified loan levels, (iv) net charge-offs, and (v) general economic conditions in the state and local markets.
PlainsCapital utilizes a risk grading matrix to assign a risk grade to each of the loans in its portfolio. A risk rating is assigned based on an assessment of the borrower’s management, collateral position, financial capacity, and economic factors. The general characteristics of the various risk grades are described below.
Pass— “Pass” loans present a range of acceptable risks to the Bank. Loans that would be considered virtually risk-free are rated Pass — low risk. Loans that exhibit sound standards based on the grading factors above and present a reasonable risk to the Bank are rated Pass — normal risk. Loans that exhibit a minor weakness in one or more of the grading criteria but still present an acceptable risk to the Bank are rated Pass — high risk. Pass — high risk loans include PCI loans that are currently performing.
Special Mention— A “Special Mention” asset has potential weaknesses that deserve management’s close attention. If left uncorrected, these potential weaknesses may result in a deterioration of the repayment prospects for the asset and weaken the Bank’s credit position at some future date. Special Mention assets are not adversely classified and do not expose the Bank to sufficient risk to require adverse classification.
Substandard— “Substandard” loans are inadequately protected by the current sound worth and paying capacity of the obligor or the collateral pledged, if any. Loans so classified must have a well-defined weakness or weaknesses that jeopardize the liquidation of the debt. They are characterized by the distinct possibility that the Bank will sustain some loss if the deficiencies are not corrected. Many substandard loans are considered impaired.
F-17F-29
Table of Contents
Level 1 financial assetsHilltop Holdings Inc. and Subsidiaries
The Company’s Level 1 investments include cash and cash equivalent balances and actively-traded equity securities. Cash and cash equivalents are carried at amortized cost, which approximates fair value. Fair value of actively traded debt and equity securities are based on unadjusted quoted market prices. The Company receives the quoted market prices from a nationally recognized, third party pricing service.
Level 2 financial assets
When quoted market prices are unavailable, the Company utilizes a pricing serviceNotes to determine an estimate of fair value, which is mainly used for its fixed maturity investments that include private and corporate debt securities, federal agency and municipal bonds, non-government mortgage and asset-backed securities, and collateralized mortgage obligations. The observable inputs utilized by the pricing service include interest rates, using either a market or income valuation approach to determine fair market value. The extent of the use of each market input depends on the asset class and the market conditions; and, for some securities, additional inputs may be necessary. Based on management’s understanding of the methodologies used by this pricing service, all applicable investments have been valued in accordance with GAAP valuation principles.
Level 3 financial assets
The Company’s Level 3 investments include the term loan issued to SWS and the warrants issued to us by SWS. Fair values are based on inputs that are unobservable and significant to the overall fair value measurement, and involve management judgment. Inputs used to determine fair market value include market conditions, spread, volatility, structure and cash flows. The extent of the use of each market input depends on the asset class and the market conditions; and, for some securities, additional inputs may be necessary.Consolidated Financial Statements (continued)
The following table includes a rollforwardpresents the internal risk grades of loans, as previously described, in the amountsportfolio at December 31, 2011 and 20102012 by class (in thousands).
| | Pass | | Special Mention | | Substandard | | Total | |
Commercial and industrial: | | | | | | | | | |
Secured | | $ | 1,525,144 | | $ | 4,662 | | $ | 21,726 | | $ | 1,551,532 | |
Unsecured | | 106,691 | | 200 | | 1,870 | | 108,761 | |
Real estate: | | | | | | | | | |
Secured by commercial properties | | 970,525 | | 370 | | 15,115 | | 986,010 | |
Secured by residential properties | | 194,667 | | — | | 3,560 | | 198,227 | |
Construction and land development: | | | | | | | | | |
Residential construction loans | | 98,021 | | — | | 4,395 | | 102,416 | |
Commercial construction loans and land development | | 171,806 | | 3,482 | | 2,770 | | 178,058 | |
Consumer | | 27,392 | | — | | — | | 27,392 | |
| | $ | 3,094,246 | | $ | 8,714 | | $ | 49,436 | | $ | 3,152,396 | |
The allowance for financial instruments classified withinloan losses is a reserve established through a provision for loan losses charged to expense, which represents management’s best estimate of probable losses inherent in the existing portfolio of loans. Management has responsibility for determining the level 3. The classification of a financial instrument within level 3 is based upon the significance of the unobservable inputsallowance for loan losses, subject to review by the Audit Committee of our Board of Directors and the Directors’ Loan Review Committee of the Bank’s Board of Directors.
It is management’s responsibility at the end of each quarter, or more frequently as deemed necessary, to analyze the level of the allowance for loan losses to ensure that it is appropriate for the estimated credit losses in the portfolio consistent with the Interagency Policy Statement on the Allowance for Loan and Lease Losses and the Receivables and Contingencies Topics of the ASC. Estimated credit losses are the probable current amount of loans that the Company will be unable to collect given facts and circumstances as of the evaluation date. When management determines that a loan or portion thereof, is uncollectible, the loan, or portion thereof, is charged off against the allowance for loan losses. Any subsequent recovery of charged-off loans is added back to the overallallowance for loan losses. As a result of the Merger on November 30, 2012, PlainsCapital’s loan portfolio is now designated into two populations, acquired and originated loans. The allowance for loan losses is calculated separately for the purchased and originated loans.
Originated Loans
The Company has developed a methodology that seeks to determine an allowance within the scope of the Receivables and Contingencies Topics of the ASC. Each of the loans that has been determined to be impaired is within the scope of the Receivables Topic and is individually evaluated for impairment using one of three impairment measurement methods as of the evaluation date: (1) the present value of expected future discounted cash flows on the loan, (2) the loan’s observable market price, or (3) the fair value measurement.
| | Twelve Months Ended December 31, | |
| | 2011 | | 2010 | |
Balance at January 1, | | $ | — | | $ | 115 | |
| | | | | |
Transfers in | | — | | — | |
Transfers out | | — | | — | |
Purchases | | 50,709 | | — | |
Sales | | — | | (17 | ) |
Realized losses | | — | | (101 | ) |
Change in unrealized gains | | 9,668 | | 3 | |
Balance at December 31, | | $ | 60,377 | | $ | — | |
of the collateral if the loan is collateral dependent. Specific reserves are provided in our estimate of the allowance based on the measurement of impairment under these three methods, except for collateral dependent loans, which require the fair value method. All net unrealized gainsnon-impaired loans are within the scope of the Contingencies Topic. Estimates of loss for the Contingencies Topic are calculated based on historical loss experience by loan portfolio segment adjusted for changes in trends, conditions, and other relevant factors that affect repayment of loans as of the evaluation date. While historical loss experience provides a reasonable starting point for the analysis, historical losses, or recent trends in losses, are not the sole basis upon which to determine the appropriate level for the allowance for loan losses. Management considers recent qualitative or environmental factors that are likely to cause estimated credit losses associated with the existing portfolio to differ from historical loss experience, including but not limited to: changes in lending policies and procedures; changes in underwriting standards; changes in economic and business conditions and developments that affect the collectibility of the portfolio; the condition of various market segments; changes in the table above are reflectednature and volume of the portfolio and in the accompanying financial statements. The unrealized gains forterms of loans; changes in lending management and staff; changes in the year ended December 31, 2011 relate tovolume and severity of past due loans, the securities still held at December 31, 2011. The Company had no transfers between Levels 1 and 2 for the twelve months ended December 31, 2011. As discussed in Note 2, in July 2011, HTH made a $50 million term loan to SWS, and in turn, SWS issued to HTH warrants to purchase its common stock. Both the term loanvolume of non-accrual loans, and the warrants arevolume and severity of adversely classified as a Level 3 investment.
Duringor graded loans; changes in the year ended December 31, 2010,loan review system; changes in the Company sold two Level 3 commercial mortgage-backed securities. There were no transfers between Levels 1value of underlying collateral for collateral-dependent loans; and 2 duringany concentrations of credit and changes in the year ended December 31, 2010. Realized losses relate to those financial instruments sold by the Company during the year ended December 31, 2010.level of such concentrations.
F-18F-30
Table of Contents
Hilltop Holdings Inc. and Subsidiaries
Notes to Consolidated Financial Statements (continued)
The following table presentsloan review program is designed to identify and monitor problem loans by maintaining a credit grading process, ensuring that timely and appropriate changes are made to the loans with assigned risk grades and coordinating the delivery of the information necessary to assess the appropriateness of the allowance for loan losses. Loans are evaluated for impairment when: (i) payments on the loan are delayed, typically by 90 days or more (unless the loan is both well secured and in the process of collection), (ii) the loan becomes classified, (iii) the loan is being reviewed in the normal course of the loan review scope, or (iv) the loan is identified by the servicing officer as a problem.
Homogenous loans, such as consumer installment loans, residential mortgage loans and home equity loans, are not individually reviewed and are generally risk graded at the same levels. The risk grade and reserves are established for each homogenous pool of loans based on the expected net charge-offs from current trends in delinquencies, losses or historical experience and general economic conditions. At December 31, 2012, there were no material delinquencies in these types of loans.
Purchased Loans
Purchased loans acquired in a business combination are recorded at their estimated fair value on their purchase date and carrying valuewith no carryover of financial instruments not measuredthe related allowance for loan losses. Performing acquired loans are subsequently evaluated for any required allowance at each reporting date. An allowance for loan losses is calculated using a methodology similar to that described above for originated loans. The allowance as determined for each loan is compared to the remaining fair value discount for that loan. If greater, the excess is recognized as an addition to the allowance through a provision for loan losses. If less than the discount, no additional allowance is recorded. Charge-offs and losses first reduce any remaining fair value discount for the loan and once the discount is depleted, losses are applied against the allowance established for that loan.
For impaired acquired loans, cash flows expected to be collected are recast at each reporting date for each loan. These evaluations require the continued use and updating of key assumptions and estimates such as default rates, loss severity given default and prepayment speed assumptions, similar to those used for the initial fair value estimate. Management judgment must be applied in developing these assumptions. If expected cash flows for a loan decreases, an increase in the allowance for loan losses is made through a charge to the provision for loan losses. If expected cash flows for a loan increase, any previously established allowance for loan losses is reversed and any remaining difference increases the accretable yield which will be taken into income over the remaining life of the loan.
The allowance is subject to regulatory examinations and determinations as to appropriateness, which may take into account such factors as the methodology used to calculate the allowance and the size of the allowance.
Changes in the allowance for loan losses for the month ended December 31, 2012, distributed by portfolio segment, are shown below (in thousands). There was no allowance for loan losses at December 31, 2011 and 2010 (in thousands):2011.
| | December 31, 2011 | | December 31, 2010 | |
| | Carrying | | Fair | | Carrying | | Fair | |
| | Value | | Value | | Value | | Value | |
Financial assets | | | | | | | | | |
| | | | | | | | | |
Held to maturity fixed maturities | | $ | — | | $ | — | | $ | 17,035 | | $ | 18,059 | |
Financial liabilities | | | | | | | | | |
Notes payable | | $ | 131,450 | | $ | 129,989 | | $ | 138,350 | | $ | 136,659 | |
The fair value of notes payable is determined by market value and discounted cash flows.
4.Property and Equipment
The following summarizes property and other fixed assets as of December 31, 2011 and 2010 (in thousands).
| | December 31, | |
| | 2011 | | 2010 | |
| | | | | |
Other equipment | | $ | 824 | | $ | 824 | |
Software | | 2,389 | | 2,093 | |
Less accumulated depreciation | | (1,085 | ) | (896 | ) |
| | $ | 2,128 | | $ | 2,021 | |
5. Deferred Acquisition Costs
Policy acquisition expenses, primarily commissions, premium taxes and underwriting expenses related to issuing a policy incurred by NLASCO are deferred and charged against income ratably over the terms of the related policies. The activity in deferred acquisition costs for the twelve months ended December 31, 2011 and 2010 is as follows (in thousands).
| | Year Ended December 31, | |
| | 2011 | | 2010 | |
| | | | | |
Beginning of period deferred acquisition cost | | $ | 17,237 | | $ | 15,745 | |
Acquisition expenses capitalized | | 36,700 | | 32,748 | |
Amortization charged to income | | (34,755 | ) | (31,256 | ) |
| | | | | |
End of period deferred acquisition costs | | $ | 19,182 | | $ | 17,237 | |
Amortization is included in policy acquisition and other underwriting expenses on the face of the consolidated statements of operations.
| | Commercial and | | | | Construction and | | | | | |
| | Industrial | | Real Estate | | Land Development | | Consumer | | Total | |
Balance, December 1, 2012 | | $ | — | | $ | — | | $ | — | | $ | — | | $ | — | |
Provision charged to operations | | 2,236 | | 977 | | 582 | | 5 | | 3,800 | |
Loans charged off | | (391 | ) | — | | — | | — | | (391 | ) |
Recoveries on charged off loans | | — | | — | | — | | — | | — | |
Balance, end of year | | $ | 1,845 | | $ | 977 | | $ | 582 | | $ | 5 | | $ | 3,409 | |
F-19F-31
Table of Contents
Hilltop Holdings Inc. and Subsidiaries
Notes to Consolidated Financial Statements (continued)
At December 31, 2012, the loan portfolio was distributed by portfolio segment and impairment methodology as shown below (in thousands). There was no allowance for loan losses at December 31, 2011.
| | Commercial and | | | | Construction and | | | | | |
| | Industrial | | Real Estate | | Land Development | | Consumer | | Total | |
Acquired Loans: | | | | | | | | | | | |
Loans individually evaluated for impairment | | $ | 71,386 | | $ | 62,247 | | $ | 33,070 | | $ | 77 | | $ | 166,780 | |
Loans collectively evaluated for impairment | | 1,492,072 | | 1,031,379 | | 235,777 | | 25,061 | | 2,784,289 | |
| | $ | 1,563,458 | | $ | 1,093,626 | | $ | 268,847 | | $ | 25,138 | | $ | 2,951,069 | |
Originated Loans: | | | | | | | | | | | |
Loans individually evaluated for impairment | | $ | — | | $ | — | | $ | — | | $ | — | | $ | — | |
Loans collectively evaluated for impairment | | 96,835 | | 90,611 | | 11,627 | | 2,254 | | 201,327 | |
| | $ | 96,835 | | $ | 90,611 | | $ | 11,627 | | $ | 2,254 | | $ | 201,327 | |
Total Loans: | | | | | | | | | | | |
Loans individually evaluated for impairment | | $ | 71,386 | | $ | 62,247 | | $ | 33,070 | | $ | 77 | | $ | 166,780 | |
Loans collectively evaluated for impairment | | 1,588,907 | | 1,121,990 | | 247,404 | | 27,315 | | 2,985,616 | |
| | $ | 1,660,293 | | $ | 1,184,237 | | $ | 280,474 | | $ | 27,392 | | $ | 3,152,396 | |
At December 31, 2012, the allowance for loan losses was distributed by portfolio segment and impairment methodology as shown below (in thousands). There was no allowance for loan losses at December 31, 2011.
| | Commercial and | | | | Construction and | | | | | |
| | Industrial | | Real Estate | | Land Development | | Consumer | | Total | |
Acquired Loans: | | | | | | | | | | | |
Loans individually evaluated for impairment | | $ | — | | $ | — | | $ | — | | $ | — | | $ | — | |
Loans collectively evaluated for impairment | | — | | — | | — | | — | | — | |
| | $ | — | | $ | — | | $ | — | | $ | — | | $ | — | |
Originated Loans: | | | | | | | | | | | |
Loans individually evaluated for impairment | | $ | — | | $ | — | | $ | — | | $ | — | | $ | — | |
Loans collectively evaluated for impairment | | 1,845 | | 977 | | 582 | | 5 | | 3,409 | |
| | $ | 1,845 | | $ | 977 | | $ | 582 | | $ | 5 | | $ | 3,409 | |
Total Loans: | | | | | | | | | | | |
Loans individually evaluated for impairment | | $ | — | | $ | — | | $ | — | | $ | — | | $ | — | |
Loans collectively evaluated for impairment | | 1,845 | | 977 | | 582 | | 5 | | 3,409 | |
| | $ | 1,845 | | $ | 977 | | $ | 582 | | $ | 5 | | $ | 3,409 | |
6. GoodwillCash and Intangible AssetsDue from Banks
GoodwillCash and intangible assets for HTH represents the excessdue from banks consisted of the cost over the fair valuefollowing (in thousands).
| | December 31, | |
| | 2012 | | 2011 | |
Cash on hand | | $ | 18,903 | | $ | — | |
Clearings and collection items | | 95,424 | | — | |
Deposits at Federal Reserve Bank | | 312,667 | | — | |
Deposits at Federal Home Loan Bank | | 1,499 | | — | |
Deposits in FDIC-insured institutions | | 292,248 | | 578,520 | |
| | $ | 720,741 | | $ | 578,520 | |
The amounts above include interest-bearing deposits of the assets of NLASCO. There were no impairments to goodwill for the years ended$581.2 million and $567.5 million at December 31, 2012 and 2011, 2010respectively. Cash on hand and 2009. There were no changes indeposits at the carrying amount of goodwill and indefinite lived intangible assets for the year endedFederal Reserve Bank satisfy regulatory reserve requirements at December 31, 20112012.
F-32
Table of Contents
Hilltop Holdings Inc. and 2010Subsidiaries
Notes to Consolidated Financial Statements (continued)
7. Premises and Equipment
The components of premises and equipment are summarized as follows (in thousands).
| | For the year ended December 31, | |
| | 2011 | | 2010 | |
| | | | Indefinite | | | | Indefinite | |
| | | | Lived | | | | Lived | |
| | Goodwill | | Intangibles | | Goodwill | | Intangibles | |
Balance at beginning of period | | $ | 23,988 | | $ | 3,000 | | $ | 23,988 | | $ | 3,000 | |
Balance at end of period | | $ | 23,988 | | $ | 3,000 | | $ | 23,988 | | $ | 3,000 | |
| | December 31, | |
| | 2012 | | 2011 | |
Land and premises | | $ | 48,902 | | $ | — | |
Furniture and equipment | | 66,182 | | 3,213 | |
| | 115,084 | | 3,213 | |
Less accumulated depreciation and amortization | | (3,703 | ) | (1,085 | ) |
| | $ | 111,381 | | $ | 2,128 | |
AtThe amounts shown above include assets recorded under capital leases of $7.7 million, net of accumulated amortization of $0.1 million at December 31, 2012. There were no assets recorded under capital leases at December 31, 2011.
Occupancy expense was reduced by rental income of $0.1 million in 2012. Depreciation and amortization expense on premisesand equipment, which includes amortization of capital leases, amounted to $1.9 million, $1.7 million and $1.8 million in 2012, 2011 we determined that no impairment existedand 2010, respectively.
8. Goodwill and Other Intangible Assets
The carrying amount of goodwill was $253.8 million and $24.0 million at December 31, 2012 and 2011, respectively. As discussed in Note 2 to the consolidated financial statements, the Company recorded $230.1 million of goodwill during 2012 in connection with respectits acquisition of PlainsCapital. A summary of the activity in goodwill during 2012 is as follows (in thousands).
Balance, beginning of year | | $ | 23,988 | |
Goodwill from PlainsCapital acquisition | | 230,073 | |
Other | | (291 | ) |
Balance, end of year | | $ | 253,770 | |
Included within other intangible assets of $77.7 million and $9.1 million at December 31, 2012 and 2011, respectively, is an indefinite lived intangible asset with an estimated fair value of $3.0 million related to goodwill and intangible assets. state licenses acquired as a part of the NLASCO acquisition in January 2007.
The Company tests goodwill and other intangible assets having an indefinite useful life for impairment on an annual basis, on December 31, or more often if events or circumstances indicate there may be impairment. Goodwill impairment testing is performed at the reporting unit level, which is one level below an operating segment. Goodwill is assigned to reporting units at the date the goodwill is initially recorded. Once goodwill has been assigned to reporting units, it no longer retains its association with a particular acquisition, and all of the activities within a reporting unit, whether acquired or internally generated, are available to support the value of the goodwill. ManagementPrior to the acquisition of PlainsCapital on November 30, 2012, management determined that HTH hasit had two reporting units, which are the Parentparent (the holding company) and NLASCO (theinsurance. The acquisition of PlainsCapital has resulted in the addition of the banking, mortgage origination and financial advisory reporting units at December 31, 2012. The Company performs required annual impairment tests of its goodwill and other intangible assets as of December 31st for its insurance company)reporting unit, while the acquired banking, mortgage origination and financial advisory reporting units will be tested for impairment annually as of October 1st.
The goodwill impairment analysis is a two-step test. The first step, (“Step1”), used to identify potential impairment, involves comparing each reporting unit’s estimated fair value to its carrying value, including goodwill. If the estimated fair value of a reporting unit exceeds its carrying value, goodwill is considered not to be impaired. If the carrying value exceeds estimated fair value, there is an indication of potential impairment and the second step is performed to measure the amount
F-33
Table of Contents
Hilltop Holdings Inc. and Subsidiaries
Notes to Consolidated Financial Statements (continued)
of impairment. The Company has estimated fair values of reporting units based on both a market and income approach using historic, normalized actual and forecast results.
The second step (“Step 2”) involves calculating an implied fair value of goodwill for each reporting unit for which the first step indicated impairment. The implied fair value of goodwill is determined in a manner similar to the amount of goodwill calculated in a business combination, by measuring the excess of the estimated fair value of the reporting unit, as determined in the first step, over the aggregate estimated fair values of the individual assets, liabilities and identifiable intangibles as if the reporting unit was being acquired in a business combination. If the implied fair value of goodwill exceeds the carrying value of goodwill assigned to the reporting unit, there is no impairment. If the carrying value of goodwill assigned to a reporting unit exceeds the implied fair value of the goodwill, an impairment charge is recorded for the excess. An impairment loss cannot exceed the carrying value of goodwill assigned to a reporting unit, and the loss establishes a new basis in the goodwill. Subsequent reversal of goodwill impairment losses is not permitted.
At December 31, 2011, we2012, the Company determined that the estimated fair value of ourthe insurance reporting unitsunit exceeded theirits carrying valuesvalue and therefore we did not perform the second step as described above. Our fair value exceeded carrying value as of December 31, 2011. Consequently, we determinedabove was not performed. Based on this evaluation, the Company concluded that no impairment existed with respect tothe goodwill and other identifiable intangible assets were fully realizable at December 31, 2011.2012.
The Company’s evaluation includes multiple assumptions, including estimated discounted cash flows and other estimates that may change over time. If future discounted cash flows become less than those projected by the Company, future impairment charges may become necessary that could have a materially adverse impact on the Company’s results of operations and financial condition. As quoted market prices in active stock markets are relevant evidence of fair value, a significant decline in the Company’s common stock trading price may indicate an impairment of goodwill.
The carrying value of intangible assets subject to amortization was as follows (in thousands).
| | Gross | | | | Net | |
| | Intangible | | Accumulated | | Intangible | |
December 31, 2012 | | Assets | | Amortization | | Assets | |
Core deposits | | $ | 34,500 | | $ | (452 | ) | $ | 34,048 | |
Trademarks and trade names | | 20,000 | | (1,487 | ) | 18,513 | |
Noncompete agreements | | 11,650 | | (192 | ) | 11,458 | |
Customer contracts and relationships | | 14,100 | | (4,515 | ) | 9,585 | |
Agent relationships | | 3,600 | | (2,466 | ) | 1,134 | |
Technology | | 1,500 | | (1,500 | ) | — | |
| | $ | 85,350 | | $ | (10,612 | ) | $ | 74,738 | |
| | Gross | | | | Net | |
| | Intangible | | Accumulated | | Intangible | |
December 31, 2011 | | Assets | | Amortization | | Assets | |
Customer relationships | | $ | 6,100 | | $ | (3,858 | ) | $ | 2,242 | |
Agent relationships | | 3,600 | | (2,146 | ) | 1,454 | |
Trade names | | 3,500 | | (1,147 | ) | 2,353 | |
Technology | | 1,500 | | (1,475 | ) | 25 | |
| | $ | 14,700 | | $ | (8,626 | ) | $ | 6,074 | |
Other intangible assets are amortized over their estimated lives, which range from 3 to 15 years. Certain intangibles, including core deposits and customer contracts and relationships, are being amortized on an accelerated basis over periods ranging from 8 to 12 years. Amortization expense related to intangible assets for the years ended December 31, 2012, 2011 and 2010 was $2.0 million, $1.5 million and $1.6 million, respectively.
F-20F-34
Table of Contents
Hilltop Holdings Inc. and Subsidiaries
Notes to Consolidated Financial Statements (continued)
The following table reflects the balances of our definite livedestimated aggregate future amortization expense for intangible assets at December 31, 2011 and 20102012 is as follows (in thousands).
| | For the year ended December 31, | |
| | 2011 | | 2010 | |
| | Gross | | | | Gross | | | |
| | Carrying | | Accumulated | | Carrying | | Accumulated | |
| | Amount | | Amortization | | Amount | | Amortization | |
| | | | | | | | | |
Customer relationships | | $ | 6,100 | | $ | (3,858 | ) | $ | 6,100 | | $ | (3,226 | ) |
Agent relationships | | 3,600 | | (2,146 | ) | 3,600 | | (1,786 | ) |
Trade name | | 3,500 | | (1,147 | ) | 3,500 | | (914 | ) |
Software | | 1,500 | | (1,475 | ) | 1,500 | | (1,175 | ) |
| | | | | | | | | |
Total | | $ | 14,700 | | $ | (8,626 | ) | $ | 14,700 | | $ | (7,101 | ) |
2013 | | $ | 10,801 | |
2014 | | 10,116 | |
2015 | | 9,430 | |
2016 | | 8,655 | |
2017 | | 6,981 | |
Thereafter | | 28,755 | |
| | $ | 74,738 | |
Amortization for the year ended9. Deposits
Deposits at December 31, 2011 was $1.5 million. Future amortization of intangible assets for the next five years is2012 are summarized as follows (in thousands):. There were no deposits at December 31, 2011.
2012 | | 1,132 | |
2013 | | 989 | |
2014 | | 872 | |
2015 | | 754 | |
2016 | | 636 | |
| | 4,383 | |
Noninterest-bearing demand | | $ | 323,367 | |
Interest-bearing: | | | |
NOW accounts | | 106,562 | |
Money market | | 2,357,109 | |
Brokered - money market | | 263,193 | |
Demand | | 75,308 | |
Savings | | 180,367 | |
Time | | 1,175,432 | |
Brokered - time | | 219,123 | |
| | $ | 4,700,461 | |
At December 31, 2012, the scheduled maturities of interest-bearing time deposits are as follows (in thousands).
2013 | | $ | 1,029,678 | |
2014 | | 225,452 | |
2015 | | 60,977 | |
2016 | | 35,523 | |
2017 | | 42,925 | |
| | $ | 1,394,555 | |
No interest-bearing time deposits mature after 2017.
7. Notes Payable10. Short-term Borrowings
The following table sets forth certain information regarding our debt in thousands.Short-term borrowings at December 31, 2012 are summarized as follows (in thousands). There were no short-term borrowings at December 31, 2011.
| | Year Ended December 31, | |
| | 2011 | | 2010 | |
| | | | | |
Senior exchangeable notes due 2025, 7.50% per annum | | $ | 83,950 | | $ | 90,850 | |
Insurance company line of credit due October 2012, base rate less 0.5% per annum | | — | | — | |
NLIC note payable due May 2033, three-month LIBOR plus 4.10% (4.66% at December 31, 2011) | | 10,000 | | 10,000 | |
NLIC note payable due September 2033, three-month LIBOR plus 4.05% (4.61% at December 31, 2011) | | 10,000 | | 10,000 | |
ASIC note payable due April 2034, three-month LIBOR plus 4.05% (4.61% at December 31, 2011) | | 7,500 | | 7,500 | |
Insurance company note payable due March 2035, three-month LIBOR plus 3.40% (3.96% at December 31, 2011) | | 20,000 | | 20,000 | |
| | $ | 131,450 | | $ | 138,350 | |
Federal funds purchased | | $ | 269,625 | |
Securities sold under agreements to repurchase | | 85,725 | |
Federal Home Loan Bank (FHLB) notes | | 250,000 | |
Short-term bank loans | | 122,900 | |
| | $ | 728,250 | |
F-21F-35
Table of Contents
Hilltop Holdings Inc. and Subsidiaries
Notes to Consolidated Financial Statements (continued)
Federal funds purchased and securities sold under agreements to repurchase generally mature daily, on demand, or on some other short-term basis. The Bank and FSC execute transactions to sell securities under agreements to repurchase with both customers and broker-dealers. Securities involved in these transactions are held by the Bank, FSC or the dealer.
Information concerning federal funds purchased and securities sold under agreements to repurchase for the month ended December 31, 2012, is shown in the following table (dollars in thousands).
Average balance during the period | | $ | 277,470 | |
Average interest rate during the period | | 0.25 | % |
Maximum month-end balance during the period | | $ | 355,351 | |
Average interest rate at end of year | | 0.22 | % |
Securities underlying the agreements at end of year | | | |
Carrying value | | $ | 122,153 | |
Estimated fair value | | $ | 122,435 | |
FHLB notes mature over terms not exceeding 365 days and are collateralized by FHLB Dallas stock, nonspecified real estate loans and certain specific commercial real estate loans. At December 31, 2012, the Bank had available collateral of $1.5 billion, substantially all of which was blanket collateral. Other information regarding FHLB notes for the month ended December 31, 2012, is shown in the following table (dollars in thousands).
Average balance during the period | | $ | 301,613 | |
Average interest rate during the period | | 0.14 | % |
Maximum month-end balance during the period | | $ | 250,000 | |
Average interest rate at end of year | | 0.07 | % |
FSC uses short-term bank loans periodically to finance securities owned, customers’ margin accounts and underwriting activities. Interest on the borrowings varies with the federal funds rate. The weighted average interest rate on the borrowings at December 31, 2012 was 1.16%.
11. Notes Payable
Notes payable consisted of the following (in thousands).
| | December 31, | |
| | 2012 | | 2011 | |
Senior exchangeable notes due 2025, 7.50% per annum | | $ | 83,950 | | $ | 83,950 | |
NLIC note payable due May 2033, three-month LIBOR plus 4.10% (4.41% at December 31, 2012) with interest payable quarterly | | 10,000 | | 10,000 | |
NLIC note payable due September 2033, three-month LIBOR plus 4.05% (4.36% at December 31, 2012) with interest payable quarterly | | 10,000 | | 10,000 | |
ASIC note payable due April 2034, three-month LIBOR plus 4.05% (4.36% at December 31, 2012) with interest payable quarterly | | 7,500 | | 7,500 | |
First Southwest nonrecourse notes, due January 2035 with interest payable quarterly | | 10,089 | | — | |
Insurance company note payable due March 2035, three-month LIBOR plus 3.40% (3.71% at December 31, 2012) with interest payable quarterly | | 20,000 | | 20,000 | |
| | $ | 141,539 | | $ | 131,450 | |
F-36
Table of Contents
Hilltop Holdings Inc. and Subsidiaries
Notes to Consolidated Financial Statements (continued)
Senior Exchangeable Notes Due 2025
In August 2005, our OPOperating Partnership (“OP”) issued $96.6 million aggregate principal amount of 7.50% senior exchangeable notes due 2025 to qualified institutional buyers in a private transaction. As ofAt December 31, 2011,2012, $84.0 million were outstanding. The notes are senior unsecured obligations of the OP and are exchangeable, at the option of the holders, into shares of HTHHilltop common stock at an initial exchange rate of 69.8812 shares per $1,000 principal amount of the notes (equal to an initial exchange price of approximately $14.31 per share), subject to adjustment and, in the event of specified corporate transactions involving HTHHilltop or the OP, an additional make-whole premium. Upon exchange, the OP has the option to deliver, in lieu of shares of HTH common stock, cash or a combination of cash and shares of HTH common stock. The notes are treated as a combined instrument and not bifurcated to separately account for any embedded derivative instruments principally because, in accordance with ASC 815, Derivatives and Hedging, (i) the conversion feature is indexed to Hilltop’s common stock and would be classified in stockholders’ equity if it were a freestanding derivative and (ii) the put and call option features are clearly and closely related to the notes at fixed conversion amounts.
According to the terms of the notes, their initial exchange rate is adjusted for certain events, including the issuance to all holders of HTHHilltop common stock of rights entitling them to purchase HTHHilltop common stock at less than their current market price. Accordingly, as a result of oura rights offering in January 2007, in which we offered all holders of HTHHilltop common stock were offered the right to purchase shares at $8.00 per share, the initial exchange rate of the notes was adjusted to 73.95 shares per $1,000 principal amount of the notes (equal to an initial exchange rate of $13.52 per share).
Prior to August 20, 2015, the notes are not redeemable at the option of the OP. After August 20, 2015, the OP may redeem all or a portion of the notes at a redemption price equal to the principal amount plus accrued and unpaid interest, if any, on the notes, if the closing price of HTHHilltop common stock has exceeded 130% of the exchange price for at least 20 trading days in any consecutive 30-trading day period.
Holders of the notes may require the OP to repurchase all or a portion of the notes at a purchase price equal to the principal amount plus accrued and unpaid interest, if any, on the notes on each of August 15, 2010, August 15, 2015, and August 15, 2020, or after the occurrence of certain corporate transactions involving HTHHilltop or the OP. No Senior Notes were tendered to the Company prior to the expiration of the Put Right Purchase Offer, August 15, 2010.
In November 2011, NLASCO purchased $6.9 million, par value, of the HTHHilltop senior exchangeable notes in open market transactions at an average cost of 107.26.
Notes Payable
The NLIC and ASIC notes payable to unaffiliated companies are each subordinated in right of payment to all policy claims and other indebtedness of NLIC and ASIC, respectively. Further, all payments of principal and interest require the prior approval of the Insurance Commissioner of the State of Texas and are only payable to the extent that the statutory surplus of NLIC exceeds $30 million and ASIC exceeds $15 million.
The NLIC, ASIC and Insurance Company loan agreements relating to the notes payable contain various covenants pertaining to limitations on additional debt, dividends, officer and director compensation, and minimum capital requirements. The Company was in compliance with the covenants at December 31, 2012.
NLASCO has entered into an indenture relating to the NLIC, ASIC and Insurance Company notes payable which provides that (i) if a person or group becomes the beneficial owner directly or indirectly of 50% or more of its equity securities and (ii) if NLASCO’s ratings are downgraded by a nationally recognized statistical rating organization (as defined in the Securities Exchange Act of 1934, as amended, or the Exchange Act), then each holder of the notes governed by such indenture has the right to require that NLASCO purchase such holder’s notes in whole or in part at a price equal to 100% of the outstanding principal amount.
F-37
Table of Contents
Hilltop Holdings Inc. and Subsidiaries
Notes to Consolidated Financial Statements (continued)
First Southwest Nonrecourse Notes
In 2005, First Southwest participated in a monetization of future cash flows from the Fee Award totaling $95.3 million from several tobacco companies owed to a law firm under a settlement agreement. In connection with the transaction, a special purpose entity that is consolidated with First Southwest issued $30.3 million of nonrecourse notes to finance the purchase of the Fee Award, to establish a reserve account and to fund issuance costs. Cash flows from the settlement are the sole source of payment for the notes. The notes carry an interest rate of 8.58% that can increase to 10.08% under certain credit conditions.
Insurance Company Line of Credit
Our insurance subsidiary has a line of credit with a financial institution. The lineinstitution which allows for borrowings by NLASCO of up to $5.0 million and is securedcollateralized by substantially all of NLASCO’s assets. The line of credit bears interest equal to a base rate plus 3.75% (4.61%(4.51% at December 31, 2011)2012), which is due quarterly. This line is scheduled to mature in October 2012.2013. There was no activity for the year ended December 31, 2011,2012, nor was there an outstanding balance payable as ofat December 31, 2011.2012.
NLIC Notes Payable Principal Maturities
NLIC has two unsecured $10 million notesNotes payable to unaffiliated companies. The notes payable bear interest at three-month LIBOR plus 4.05% and three-month LIBOR plus 4.10% (4.61% and 4.66%outstanding at December 31, 2011). Interest is due quarterly2012 of $141.5 million have scheduled maturities of 2025 and principal is due at maturity in September 2033 and May 2033, respectively. The notes are subordinated in right of payment to all policy claims and other indebtedness of NLIC. Further, all payments of principal and interest require the prior approval of the Insurance Commissioner of the State of Texas and are only payable to the extent that the statutory surplus of NLIC exceeds $30 million.thereafter.
ASIC Note Payable12. Junior Subordinated Debentures and Trust Preferred Securities
ASICPlainsCapital has an unsecured $7.5 million notefour statutory Trusts, three of which were formed under the laws of the state of Connecticut and the fourth, PCC Statutory Trust IV, which was formed under the laws of the state of Delaware. The Trusts were created for the sole purpose of issuing and selling preferred securities and common securities, using the resulting proceeds to acquire junior subordinated debentures issued by PlainsCapital (the “Debentures”). Accordingly, the Debentures are the sole assets of the Trusts, and payments under the Debentures are the sole revenue of the Trusts. All of the common securities are owned by PlainsCapital; however, PlainsCapital is not the primary beneficiary of the Trusts. Accordingly, the Trusts are not included in PlainsCapital’s consolidated financial statements.
The Trusts have issued $65,000,000 of floating rate preferred securities and $2,012,000 of common securities and have invested theproceeds from the securities in floating rate Debentures of PlainsCapital. Information regarding the PlainsCapital Debentures is shown in the following table (in thousands).
Investor | | Issue Date | | Amount | |
PCC Statutory Trust I | | July 31, 2001 | | $ | 18,042 | |
PCC Statutory Trust II | | March 26, 2003 | | $ | 18,042 | |
PCC Statutory Trust III | | September 17, 2003 | | $ | 15,464 | |
PCC Statutory Trust IV | | February 22, 2008 | | $ | 15,464 | |
The stated term of the Debentures is 30 years with interest payable to an unaffiliated company.quarterly. The note payable bears interest at three-monthrate on the Debentures, which resets quarterly, is 3-month LIBOR plus 4.05% (4.57%an average spread of 3.22%. The total average interest rate at December 31, 2011)2012 was 3.53%. Interest is due quarterly and principal is due at maturity in April 2034. The note is subordinated in right of payment to all policy claimsterm, rate and other indebtedness of ASIC. Further, all payments of principal and interest require the prior approvalfeatures of the Insurance Commissionerpreferred securities are the same as the Debentures. PlainsCapital’s obligations under the Debentures and related documents, taken together, constitute a full and unconditional guarantee of the State of Texas and are only payable toTrust’s obligations under the extent that the statutory surplus of ASIC exceeds $15 million.
Insurance Company Notes Payable
NLASCO has an unsecured $20 million note payable to an unaffiliated company which bears interest equal to the three-month LIBOR plus 3.40% (3.96% at December 31, 2011). Interest is due quarterly and the principal is due at maturity in March 2035.preferred securities.
F-22F-38
Table of Contents
NLASCO’s loan agreements relatingHilltop Holdings Inc. and Subsidiaries
Notes to Consolidated Financial Statements (continued)
13. Income Taxes
The significant components of the income tax provision (benefit) are as follows (in thousands).
| | Year Ended December 31, | |
| | 2012 | | 2011 | | 2010 | |
Current: | | | | | | | |
Federal | | $ | 4,346 | | $ | (966 | ) | $ | (538 | ) |
State | | 935 | | — | | (587 | ) |
| | 5,281 | | (966 | ) | (1,125 | ) |
Deferred: | | | | | | | |
Federal | | (5,649 | ) | (4,043 | ) | 118 | |
State | | (777 | ) | — | | — | |
| | (6,426 | ) | (4,043 | ) | 118 | |
| | $ | (1,145 | ) | $ | (5,009 | ) | $ | (1,007 | ) |
The income tax benefit differs from the amount that would be computed by applying the statutory Federal income tax rate of 35% to loss before income taxes as a result of the following (in thousands).
| | Year Ended December 31, | |
| | 2012 | | 2011 | | 2010 | |
Computed tax at federal statutory rate | | $ | (2,185 | ) | $ | (4,039 | ) | $ | (544 | ) |
Tax effect of: | | | | | | | |
Life insurance | | (18 | ) | — | | — | |
Tax-exempt income, net | | (151 | ) | — | | — | |
State income taxes | | 103 | | — | | (587 | ) |
Nondeductible expenses | | 352 | | (970 | ) | 124 | |
Nondeductible transaction costs | | 1,151 | | — | | — | |
Minority interest | | (174 | ) | — | | — | |
Prior year return to provision adjustment | | (150 | ) | — | | — | |
Other | | (73 | ) | — | | — | |
| | $ | (1,145 | ) | $ | (5,009 | ) | $ | (1,007 | ) |
F-39
Table of Contents
Hilltop Holdings Inc. and Subsidiaries
Notes to Consolidated Financial Statements (continued)
The components of the tax effects of temporary differences that give rise to the notes payable contain various covenants pertainingnet deferred tax asset included in other assets within the consolidated balance sheets are as follows (in thousands).
| | December 31, | |
| | 2012 | | 2011 | |
Deferred tax assets: | | | | | |
Net operating loss carryforward | | $ | 16,377 | | $ | 19,598 | |
Purchase accounting adjustment - loans | | 50,752 | | — | |
Allowance for loan losses | | 1,235 | | — | |
Compensation and benefits | | 15,246 | | — | |
Indemnification agreements | | 8,242 | | — | |
Losses and LAE discounting | | 505 | | 482 | |
Unearned premiums | | 5,682 | | 5,424 | |
Non-accrual loan interest | | 1,497 | | — | |
Partnership investments | | 1,050 | | — | |
Foreclosed property | | 3,701 | | — | |
AMT credit carryforwards | | 769 | | 769 | |
Other | | 3,413 | | 1,095 | |
| | 108,469 | | 27,368 | |
| | | | | |
Deferred tax liabilities: | | | | | |
Premises and equipment | | 10,109 | | — | |
Intangible assets | | 30,068 | | 3,684 | |
Derivatives | | 12,213 | | — | |
Net other comprehensive income | | 4,337 | | — | |
Deferred policy acquisition costs | | 6,934 | | 6,714 | |
Securities | | 8,665 | | 8,616 | |
Other | | 3,110 | | — | |
| | 75,436 | | 19,014 | |
Net deferred tax asset | | $ | 33,033 | | $ | 8,354 | |
The Company has no valuation allowance on its deferred tax assets at December 31, 2012 and 2011. In assessing the realization of deferred tax assets, management considered whether it was more likely than not that some portion or all of the deferred tax assets will not be realized. The Company is required to assess whether a valuation allowance should be established against the Company’s net deferred tax assets based on the consideration of all available evidence using a more likely than not standard. In making such judgments, significant weight is given to evidence that can be objectively verified. In assessing the Company’s ability to support the realizability of its deferred tax assets, management considered both positive and negative evidence, including our cumulative pre-tax loss position since the quarter ending December 31, 2009, less any abnormal occurrences during that period, as well as future taxable income and reversals of existing taxable temporary differences. The Company expects to realize our current deferred tax assets through the implementation of certain tax planning strategies surrounding the acquisition of PlainsCapital, core earnings, and reversal of timing differences. Therefore, the Company concluded there was sufficient positive evidence to outweigh the negative evidence of the prior year cumulative losses.
At December 31, 2012, the Company had net operating loss carryforwards for Federal income tax purposes of $46.8 million and $50.4 million for regular income tax and alternative minimum tax, respectively. Substantially all net operating loss carryforwards are subject to separate return limitations on additional debt, dividends, officertheir usage. These net operating loss carry-forwards expire in 2023 and director compensation,later years. The net operating loss carry-forwards for alternative minimum Federal income taxes generally are limited to offsetting 90% of the alternative minimum taxable earnings for a taxable year.
F-40
Table of Contents
Hilltop Holdings Inc. and minimum capital requirements.Subsidiaries
Notes to Consolidated Financial Statements (continued)
GAAP requires the measurement of uncertain tax positions. Uncertain tax positions are the difference between a tax position taken, or expected to be taken in a tax return, and the benefit recognized for accounting purposes. There were no uncertain tax positions at December 31, 2012 and 2011. However, as a result of the resolution and the expiration of the statute of limitations on certain prior period state tax audits with associated uncertain tax positions, the Company recognized tax benefits of $1.0 million and $0.2 million during the years ended December 31, 2011 and 2010, respectively. The Company wasdoes not anticipate any significant liabilities for uncertain tax positions to arise in compliancethe next twelve months.
Hilltop files income tax returns in U.S. federal and several U.S. state jurisdictions. The Company is subject to tax audits in numerous jurisdictions in the U.S. until the applicable statute of limitation expire. Excluding those entities acquired as a part of the PlainsCapital Merger, Hilltop has been examined by U.S. tax authorities for U.S. federal income tax years prior to 2010, and is under no federal or state tax audits at December 31, 2012. PlainsCapital has been examined by U.S. tax authorities for U.S. federal income tax years prior to 2010, and is under no federal or state tax audits at December 31, 2012.
14. Employee Benefits
Hilltop and its subsidiaries have benefit plans that provide for elective deferrals by employees under Section 401(k) of the Internal Revenue Code. Employee contributions are determined by the level of employee participation and related salary levels per Internal Revenue Service regulations. Hilltop and its subsidiaries match a portion of employee contributions to the plan based on entity-specific factors including the level of normal operating earnings and the amount of eligible employees’ contributions and salaries. The amount charged to operating expense forthis matching contribution totaled $0.7 million in 2012, $0.2 million in 2011 and $0.1 million in 2010.
In connection with the covenants asMerger, PlainsCapital is in the process of terminating its employee stock ownership plan (“ESOP”) and distributing the assets held by the ESOP (consisting of cash and shares of Hilltop common stock) to ESOP participants.
Effective upon the completion of the Merger, the Company recorded a liability of $8.9 million associated with separate retention agreements entered into between Hilltop and two executive officers of PlainsCapital.
The Bank purchased $15.0 million of flexible premium universal life insurance in 2001 to help finance the annual expense incurred in providing various employee benefits. At December 31, 2011.2012, the carrying value of the policies included in other assets was $24.1 million. For the month ended December 31, 2012, the Bank recorded income of $0.1 million related to the policies that was reported in other noninterest income within the consolidated statement of operations.
NLASCO has entered into15. Related Party Transactions
Pursuant to a Management Services Agreement, as amended, Diamond A Administration Company LLC, or Diamond A, an indenture relating toaffiliate of Gerald J. Ford, the notes payable which provides that (i) if a person or group becomescurrent Chairman of the Board of Hilltop and the beneficial owner directlyof 18.0% of Hilltop common stock at December 31, 2012, provided certain management services to Hilltop and its subsidiaries, including, among others, financial and acquisition evaluation, and office space to Hilltop. The services and office space were provided at a cost of $91,500 per month, plus reasonable out-of-pocket expenses. The services provided under this agreement include those of several Hilltop’s directors, including Gerald J. Ford, Kenneth Russell and Carl B. Webb. Prior to Jeremy Ford assuming the role of Chief Executive Officer of Hilltop, he provided services to Hilltop under the Management Services Agreement. Hilltop also agreed to indemnify and hold harmless Diamond A for its performance or indirectlyprovision of 50%these services, except for gross negligence and willful misconduct. Further, Diamond A’s maximum aggregate liability for damages under this agreement is limited to the amounts paid to Diamond A under this agreement during twelve months prior to that cause of action. In connection with the Merger transaction with PlainsCapital on November 30, 2012, the Management Services Agreement was terminated. However, pursuant to a Sublease Agreement, Diamond A will provide office space to Hilltop at a cost of $18,303 per month. This Sublease Agreement continues in effect until June 30, 2015 or such earlier date that the base lease expires.
Jeremy B. Ford, a director and the Chief Executive Officer of Hilltop, is the beneficiary of a trust that owns a 49% limited partnership interest in Diamond A Financial, L.P. Diamond A Financial, L.P. owns 18.0% of the outstanding Hilltop common stock at December 31, 2012. He also is a director and the Secretary of Diamond A Administration Company, LLC, which has provided management services and office space to Hilltop as described the preceding paragraph. Diamond
F-41
Table of Contents
Hilltop Holdings Inc. and Subsidiaries
Notes to Consolidated Financial Statements (continued)
A Administration Company, LLC is owned by Hunter’s Glen/Ford, Ltd., a limited partnership in which a trust for the benefit of Jeremy B. Ford is a 46% limited partner.
Jeremy B. Ford is the son of Gerald J. Ford. Corey G. Prestidge, Hilltop’s General Counsel and Secretary, is the son-in-law of Gerald J. Ford. Accordingly, Messrs. Jeremy Ford and Corey Prestidge are brothers-in-law.
In the ordinary course of business, the Bank has granted loans to certain directors, executive officers and their affiliates (collectively referred to as related parties) totaling $23.2 million at December 31, 2012. These loans were made on substantially the same terms, including interest rates and collateral, as those prevailing at the time for comparable transactions with other unaffiliated persons and do not involve more than normal risk of collectibility. For such loans since the Merger with PlainsCapital on November 30, 2012, total principal additions were $0.7 million and total principal payments were $1.1 million.
At December 31, 2012, the Bank held deposits of related parties of $173.5 million.
A related party is the lessor in an operating lease with the Bank. The Bank’s minimum payment under the lease is $0.5 million annually through 2028, for an aggregate remaining obligation of $8.0 million.
The Bank purchases loans from a company for which a related party serves as a director, president and chief executive officer. At December 31, 2012, the outstanding balance of the purchased loans was $6.0 million. The loans were purchased with recourse to the company in the ordinary course of business and the related party had no direct financial interest in the transactions.
PlainsCapital Equity, LLC is a limited partner in certain limited partnerships that have received loans from the Bank. The Bank made those loans in the normal course of business, using underwriting standards and offering terms that are substantially the same as those used or offered to non-affiliated borrowers. At December 31, 2012, the Bank had outstanding loans of $4.2 million in which PlainsCapital Equity, LLC had a limited partnership interest. The investment of PlainsCapital Equity, LLC in these limited partnerships was $3.7 million at December 31, 2012.
16. Commitments and Contingencies
The Bank acts as agent on behalf of certain correspondent banks in the purchase and sale of federal funds that aggregated $16.0 million at December 31, 2012.
Legal Matters
In November 2006, FSC received subpoenas from the SEC and the United States Department of Justice (“DOJ”) in connection with an investigation of possible antitrust and securities law violations, including bid-rigging, in the procurement of guaranteed investment contracts and other investment products for the reinvestment of bond proceeds by municipalities. The investigation is industry-wide and includes approximately 30 or more firms, including some of the largest U.S. investment firms.
As a result of these SEC and DOJ investigations into industry-wide practices, FSC was initially named as a co-defendant in cases filed in several different federal courts by various state and local governmental entities suing on behalf of themselves and a purported class of similarly situated governmental entities and a similar set of lawsuits filed by various California local governmental entities suing on behalf of themselves and a purported class of similarly situated governmental entities. All claims asserted against FSC in these purported class actions were subsequently dismissed. However, the plaintiffs in these purported class actions have filed amended complaints against other entities, and FSC is identified in these complaints not as a defendant, but as an alleged co-conspirator with the named defendants.
Additionally, as a result of these SEC and DOJ investigations into industry-wide practices, FSC has been named as a defendant in 20 individual lawsuits. These lawsuits have been brought by several California public entities and two New York non-profit corporations that do not seek to certify a class. The Judicial Panel on Multidistrict Litigation has transferred these cases to the United States District Court, Southern District of New York. The California plaintiffs allege
F-42
Table of Contents
Hilltop Holdings Inc. and Subsidiaries
Notes to Consolidated Financial Statements (continued)
violations of Section 1 of the Sherman Act and the California Cartwright Act. The New York plaintiffs allege violations of Section 1 of the Sherman Act and the New York Donnelly Act. The allegations against FSC are very limited in scope. FSC has filed answers in each of the twenty lawsuits denying the allegations and asserting several affirmative defenses. FSC intends to defend itself vigorously in these individual actions. The relief sought is unspecified monetary damages.
Liabilities for loss contingencies arising from claims, assessments, litigation, fines and penalties and other sources are recorded when it is probable that a liability has been incurred and the amount of the assessment and/or remediation can be reasonably estimated.
Hilltopand its equitysubsidiaries are defendants in various other legal matters arising in the normal course of business. Management believes that the ultimate liability, if any, arising from these matters, and the matters discussed above will not materially affect our consolidated financial condition, results of operations or cash flows taken as a whole.
Other Contingencies
The mortgage origination segment may be responsible for errors or omissions relating to its representations and warranties that the loans sold meet certain requirements, including representations as to underwriting standards and the validity of certain borrower representations in connection with the loan. If determined to be at fault, the mortgage origination segment either repurchases the loans from the investors or reimburses the investors’ losses (a “make-whole” payment). The mortgage origination segment has established an indemnification liability for such probable losses based upon, among other things, the level of current unresolved repurchase requests, the volume of estimated probable future repurchase requests, our ability to cure the defects identified in the repurchase requests, and the severity of the estimated loss upon repurchase. At December 31, 2012, the liability for the indemnification reserve totaled $19.0 million. Although management considers this reserve to be appropriate, there can be no assurance that the reserve will prove to be appropriate over time to cover ultimate losses, due to unanticipated adverse changes in the economy and historical loss patterns, discrete events adversely affecting specific borrowers or industries, and/or actions taken by institutions or investors. The impact of such matters will be considered in the reserving process when known.
Effective upon completion of the Merger, Hilltop entered into separate retention agreements with two executive officers of PlainsCapital, one having an initial term of three years (with automatic one-year renewals at the end of two years and each anniversary thereof) and the other having an initial term of two years (with automatic one-year renewals at the end of the first year and each anniversary thereof). Each of these retention agreements provides for severance pay benefits if the executive officer’s employment is terminated without “cause”.
In addition to these retention agreements, PlainsCapital and its subsidiaries maintain employment contracts with certain executive officers and severance agreements with certain other senior officers that provide severance pay benefits in the event of a “change in control” as defined in these agreements. Each of these agreements will expire on the second anniversary following the effective date of the Merger. Given that the Merger constitutes a “change in control” of PlainsCapital, severance pay benefits will be payable if an officer subject to one of these employment or severance agreements is terminated without cause prior to the second anniversary of the effective date of the Merger. Prior to expiration of these agreements, similar severance pay benefits will be payable in the event of termination of such officer without “cause” following a change in control of Hilltop.
F-43
Table of Contents
Hilltop Holdings Inc. and Subsidiaries
Notes to Consolidated Financial Statements (continued)
Hilltopand its subsidiaries lease space, primarily for branch facilities and automated teller machines, under noncancelable operating leases with remaining terms, including renewal options, of 1 to 16 years and under capital leases with remaining terms of 12 to 16 years. Rental expense under the operating leases was $2.9 million, $0.5 million and $0.6 million in 2012, 2011 and 2010, respectively. Future minimum lease payments under these agreements follow (in thousands).
| | Operating Leases | | Capital Leases | |
2013 | | $ | 19,308 | | $ | 1,063 | |
2014 | | 16,517 | | 1,080 | |
2015 | | 13,085 | | 1,090 | |
2016 | | 10,440 | | 1,103 | |
2017 | | 8,976 | | 1,129 | |
Thereafter | | 34,608 | | 10,680 | |
Total minimum lease payments | | $ | 102,934 | | 16,145 | |
Amount representing interest | | | | (4,475 | ) |
Present value of minimum lease payments | | | | $ | 11,670 | |
17. Financial Instruments with Off-Balance Sheet Risk
The Bank is party to financial instruments with off-balance sheet risk in the normal course of business to meet the financing needs of their customers. These financial instruments include commitments to extend credit and standby letters of credit that involve varying degrees of credit and interest rate risk in excess of the amount recognized in the consolidated financial statements. Such financial instruments are recorded in the consolidated financial statements when they are funded or related fees are incurred or received. The contract amounts of those instruments reflect the extent of involvement (and therefore the exposure to credit loss) the Bank has in particular classes of financial instruments.
Commitments to extend credit are agreements to lend to a customer provided that the terms established in the contract are met. Commitments generally have fixed expiration dates and may require payment of fees. Because some commitments are expected to expire without being drawn upon, the total commitment amounts do not necessarily represent future cash requirements. Standby letters of credit are conditional commitments issued to guarantee the performance of a customer to a third party. These guarantees are primarily issued to support public and private borrowing arrangements. The credit risk involved in issuing letters of credit is essentially the same as that involved in extending loan commitments to customers.
The Bank had in the aggregate outstanding unused commitments to extend credit of $1.1 billion at December 31, 2012. The Bank had outstanding standby letters of credit of $36.5 million at December 31, 2012.
The Bank uses the same credit policies in making commitments and standby letters of credit as it does for on-balance sheet instruments. The amount of collateral obtained, if deemed necessary, upon extension of credit is based on management’s credit evaluation of the borrower. Collateral held varies but may include real estate, accounts receivable, marketable securities, interest-bearing deposit accounts, inventory, and property, plant and equipment.
In the normal course of business, FSC executes, settles, and finances various securities transactions that may expose FSC to off-balance sheet risk in the event that a customer or counterparty does not fulfill its contractual obligations. Examples of such transactions include the sale of securities not yet purchased by customers or for the account of FSC, clearing agreements between FSC and various clearinghouses and broker-dealers, secured financing arrangements that involve pledged securities, and (ii)when-issued underwriting and purchase commitments.
18. Stock-Based Compensation
On November 2, 2011, the Compensation Committee of our Board of Directors awarded two senior executives Stock Option Awards to purchase an aggregate of 600,000 shares of the Company’s common stock at an exercise price of $7.70 per share. These Stock Option Awards vest in five equal installments beginning on the grant date, with the remainder vesting on each grant date anniversary through 2015. Additionally, these Stock Option Awards expire on November 2, 2016. Compensation expense related to these Stock Option Awards was $0.9 million, of which $0.5 million was amortized
F-44
Table of Contents
Hilltop Holdings Inc. and Subsidiaries
Notes to Consolidated Financial Statements (continued)
through December 2012 and the remaining $0.4 million will be amortized through October 2015. The fair value for these Stock Option Awards granted was estimated using the Black-Scholes option pricing model with an expected volatility of 25%, a risk-free interest rate of 0.96%, a dividend yield rate of zero, a five-year expected life of the options and a forfeiture rate of 15%.
In September 2012, the stockholders approved the Hilltop Holdings 2012 Equity Incentive Plan (the “2012 Plan”). The 2012 Plan allows for the granting of nonqualified stock options, stock appreciation rights, restricted stock, restricted stock units, performance awards, dividend equivalent rights and other awards to employees of Hilltop, its subsidiaries and outside directors of Hilltop. In the aggregate, 4,000,000 shares of common stock may be delivered pursuant to awards granted under the 2012 Plan. At December 31, 2012, no awards had been granted pursuant to the 2012 Plan.
Compensation expense related to the plans was $0.5 million, $0.1 million and $0.1 million for the years ended December 31, 2012, 2011 and 2010, respectively.
During 2012, 2011 and 2010, Hilltop granted 5,183, 5,418 and 10,163 common shares, respectively, to independent members of our Board of Directors for service rendered to the Company during the respective periods.
19. Regulatory Matters
Bank
The Bank and Hilltop are subject to various regulatory capital requirements administered by the federal banking agencies. Failure to meet minimum capital requirements can initiate certain mandatory — and possibly additional discretionary — actions by regulators that, if NLASCO’s ratingsundertaken, could have a direct, material effect on the consolidated financial statements. The regulations require us to meet specific capital adequacy guidelines that involve quantitative measures of assets, liabilities and certain off-balance sheet items as calculated under regulatory accounting practices. The capital classifications are downgradedalso subject to qualitative judgments by a nationally recognized statistical rating organizationthe regulators about components, risk weightings and other factors.
Quantitative measures established by regulation to ensure capital adequacy require the companies to maintain minimum amounts and ratios (set forth in the following table) of Tier 1 capital (as defined in the Securities Exchange Actregulations) to total average assets (as defined), and minimum ratios of 1934, as amended, orTier 1 and total capital (as defined) to risk-weighted assets (as defined). The Tier 1 Capital (to average assets) ratio was calculated using the Exchange Act), then each holderaverage assets for the month of December 2012. A comparison of the notes governed by such indenture hasBank’s and Hilltop’s actual capital amounts and ratios to the right to require that NLASCO purchase such holder’s notesminimum requirements is as follows (dollars in whole or in part at a price equal to 100%thousands).
| | December 31, 2012 | |
| | Required | | Actual | |
| | Amount | | Ratio | | Amount | | Ratio | |
Bank: | | | | | | | | | |
Tier 1 capital (to average assets) | | $ | 245,495 | | 4 | % | $ | 542,307 | | 8.84 | % |
Tier 1 capital (to risk-weighted assets) | | 183,308 | | 4 | % | 542,307 | | 11.83 | % |
Total capital (to risk-weighted assets) | | 366,615 | | 8 | % | 546,598 | | 11.93 | % |
| | | | | | | | | |
Hilltop: | | | | | | | | | |
Tier 1 capital (to average assets) | | $ | 266,514 | | 4 | % | $ | 871,379 | | 13.08 | % |
Tier 1 capital (to risk-weighted assets) | | 196,670 | | 4 | % | 871,379 | | 17.72 | % |
Total capital (to risk-weighted assets) | | 393,340 | | 8 | % | 875,670 | | 17.81 | % |
F-45
Table of the outstanding principal amount.Contents
Note Payable Principal MaturitiesHilltop Holdings Inc. and Subsidiaries
Notes to Consolidated Financial Statements (continued)
The aggregate amountA reconciliation of annual principal maturities subsequentbook capital to December 31, 2011Tier 1 and total capital (as defined) is as follows (in thousands).
| | Principal Commitments | |
| | Fixed | | Variable | | Total | |
| | | | | | | |
2016 and Thereafter | | 83,950 | | 47,500 | | 131,450 | |
Commitments | | $ | 83,950 | | $ | 47,500 | | $ | 131,450 | |
| | | | | | | | | | |
| | December 31, 2012 | |
| | Bank | | Hilltop | |
Total capital per books | | $ | 831,677 | | $ | 1,144,496 | |
Add: | | | | | |
Minority interests | | 2,054 | | 2,054 | |
Trust preferred securities | | — | | 65,000 | |
Net unrealized holding losses on securities available for sale and held in trust | | 1,125 | | (8,094 | ) |
Deduct: | | | | | |
Goodwill and other disallowed intangible assets | | (292,341 | ) | (331,508 | ) |
Other | | (208 | ) | (569 | ) |
Tier 1 capital (as defined) | | 542,307 | | 871,379 | |
Add: Allowable Tier 2 capital | | | | | |
Allowance for loan losses | | 4,291 | | 4,291 | |
Total capital (as defined) | | $ | 546,598 | | $ | 875,670 | |
To be considered adequately capitalized (as defined) under the regulatory framework for prompt corrective action, the Bank must maintain minimum Tier 1 capital to total average assets and Tier 1 capital to risk-weighted assets ratios of 4%, and a total capital to risk-weighted assets ratio of 8%. Based on the actual capital amounts and ratios shown in the previous table, the Bank’s ratios place it in the well capitalized (as defined) capital category under the regulatory framework for prompt corrective action. The minimum required capital amounts and ratios for the well capitalized category are summarized as follows (dollars in thousands):
| | December 31, 2012 | |
| | Required | | Actual | |
| | Amount | | Ratio | | Amount | | Ratio | |
Bank: | | | | | | | | | |
Tier 1 capital (to average assets) | | $ | 306,869 | | 5 | % | $ | 542,307 | | 8.84 | % |
Tier 1 capital (to risk-weighted assets) | | 274,961 | | 6 | % | 542,307 | | 11.83 | % |
Total capital (to risk-weighted assets) | | 458,269 | | 10 | % | 546,598 | | 11.93 | % |
| | | | | | | | | | | |
Financial Advisory
Pursuant to the net capital requirements of the Exchange Act, FSC has elected to determine its net capital requirements using the alternative method. Accordingly, FSC is required to maintain minimum net capital, as defined in Rule 15c3-1, equal to the greater of $250,000 or 2% of aggregate debit balances, as defined in Rule 15c3-3. At December 31, 2012, FSC had net capital of $47.6 million; the minimum net capital requirement was $2.8 million; net capital maintained by FSC was 34% of aggregate debits; and net capital in excess of the minimum requirement was $44.8 million.
Mortgage Origination
As a mortgage originator, PrimeLending is subject to minimum net worth requirements established by the United States Department of Housing and Urban Development (“HUD”) and the Government National Mortgage Association (“GNMA”). On an annual basis, PrimeLending submits audited financial statements to HUD and GNMA documenting PrimeLending’s compliance with the minimum net worth requirements. In addition, PrimeLending monitors compliance on an ongoing basis and, as of December 31, 2012, PrimeLending’s net worth exceeded the amounts required by both HUD and GNMA.
F-46
Table of Contents
Hilltop Holdings Inc. and Subsidiaries
Notes to Consolidated Financial Statements (continued)
Insurance
The Company’s insurance subsidiaries’, which are domiciled in the State of Texas, statutory financial statements are presented on the basis of accounting practices prescribed or permitted by the Texas Department of Insurance. Texas had adopted the National Association of Insurance Commissioners’ statutory accounting practices as the basis of its statutory accounting practices with certain differences which are not significant to the company’s statutory equity.
Following is a summary of statutory capital and surplus and statutory net income (loss) of each insurance subsidiary (in thousands).
| | Year Ended December 31, | |
| | 2012 | | 2011 | | 2010 | |
National Lloyds Insurance Company: | | | | | | | |
Capital and surplus | | $ | 94,558 | | $ | 94,154 | | $ | 94,081 | |
Statutory net income (loss) | | $ | (3,858 | ) | $ | (133 | ) | $ | 7,010 | |
American Summit Insurance Company: | | | | | | | |
Capital and surplus | | $ | 25,761 | | $ | 24,554 | | $ | 25,216 | |
Statutory net income (loss) | | $ | 972 | | $ | (541 | ) | $ | 642 | |
The funding of the cash requirements (including debt service) of NLASCO is primarily provided by cash dividends from NLASCO’s wholly owned insurance subsidiaries. Dividends paid by the insurance subsidiaries are restricted by regulatory requirements of the Texas Department of Insurance. Under Texas State Insurance Law for property and casualty companies, all dividends must be distributed out of earned surplus only. Furthermore, without the prior approval of the Commissioner, dividends cannot be declared or distributed which exceed the greater of ten percent of NLASCO’s surplus, as shown by its last statement on file with the Commissioner, or one hundred percent of net income for such period. The subsidiaries paid $6.0 million in dividends to NLASCO in 2010, and no dividends in 2011 or 2012. At December 31, 2012, the maximum dividend that may be paid to NLASCO in 2013 without regulatory approval is approximately $12 million.
Regulations of the Texas Department of Insurance require insurance companies to maintain minimum levels of statutory surplus to ensure their ability to meet their obligations to policyholders. At December 31, 2012, the Company’s insurance subsidiaries had statutory surplus in excess of the minimum required.
Also, the NAIC has adopted the RBC formula for insurance companies that establishes minimum capital requirements relating to insurance risk, asset credit risk, interest rate risk and business risk. The formula is used by the NAIC and certain state insurance regulators as an early warning tool to identify companies that require additional scrutiny or regulatory action. At December 31, 2012, the Company’s insurance subsidiaries’ RBC ratio exceeded the level at which regulatory action would be required.
8.20. Stockholders’ Equity
The Bank is subject to certain restrictions on the amount of dividends it may declare without prior regulatory approval. At December 31, 2012, $13.9 million of its earnings was available for dividend declaration without prior regulatory approval.
Series B Preferred Stock
On November 29, 2012, Hilltop filed with the State Department of Assessments and Taxation of the State of Maryland articles supplementary for the Hilltop Series B Preferred Stock, setting forth its terms. Holders of the Hilltop Series B Preferred Stock are entitled to noncumulative cash dividends at a fluctuating dividend rate based on Hilltop’s level of qualified small business lending. The Hilltop Series B Preferred Stock is non-voting, except in limited circumstances, and ranks senior to Hilltop’s common stock with respect to the payment of dividends and distribution of assets upon any liquidation, dissolution or winding up of Hilltop.
F-47
Table of Contents
Hilltop Holdings Inc. and Subsidiaries
Notes to Consolidated Financial Statements (continued)
As discussed in Note 2, and as a result of the Merger, each outstanding share of PlainsCapital Non-Cumulative Perpetual Preferred Stock, Series C, all the outstanding shares of which are held by the United States Department of the Treasury, was converted into one share of Hilltop Series B Preferred Stock.
The terms of the Hilltop Series B Preferred Stock restrict Hilltop’s ability to pay dividends on, make distributions with respect to, or redeem, purchase or acquire, or make a liquidation payment on its common stock and other Hilltop capital stock ranking junior to the Hilltop Series B Preferred Stock, and on other preferred stock and other stock ranking on a parity with the Hilltop Series B Preferred Stock, in the event that Hilltop does not declare dividends on the Hilltop Series B Preferred Stock during any dividend period.
The terms of the Series B Preferred Stock provide for the payment of non-cumulative dividends on a quarterly basis. The dividend rate, as a percentage of the liquidation amount, fluctuates while the Series B Preferred Stock is outstanding based upon changes in the level of “qualified small business lending” (“QSBL”) by the Bank from its average level of QSBL at each of the four quarter ends leading up to June 30, 2010 (the “Baseline”).
The dividend rate on Series B Preferred Stock since December 1, 2012 is as follows.
Dividend Period | | Annualized |
|
Beginning |
| Ending |
| Dividend Rate |
|
December 1, 2012 | | December 31, 2012 | | 2.730% | |
January 1, 2013 | | March 31, 2013 | | 2.468% | |
April 1, 2013 | | December 31, 2013 | | 1.000% to 5.000% (1) | |
January 1, 2014 | | March 26, 2016 | | 1.000% to 5.000% (2) | |
March 27, 2016 | | Redemption | | 9.000% (3) | |
(1)Between April 1, 2013 and December 31, 2013, the dividend rate will adjust quarterly in such range based upon the level of percentage change in QSBL between the end of the quarter ending before the most recently completed quarter and the Baseline.
(2)Between January 1, 2014 and March 26, 2016, the dividend rate will be fixed at a rate in such range based upon the level of percentage change in QSBL between September 30, 2013 and the Baseline.
(3)Beginning on March 27, 2016, the dividend rate will be fixed at nine percent (9%) per annum.
The dividend rate on the Series B Preferred Stock was 2.730% at December 31, 2012. The dividend rate for the period from January 1, 2013 to March 31, 2013 is 2.468%.
In addition to the applicable dividend rates described above, beginning on January 1, 2014 and on all dividend payment dates thereafter ending on April 1, 2016, if the Bank fails to increase its level of QSBL compared to the Baseline, the Company will be required to pay a quarterly lending incentive fee of 0.5% of the liquidation value.
As long as shares of Series B Preferred Stock remain outstanding, Hilltop may not pay dividends to its common stockholders (nor may Hilltop repurchase or redeem any shares of its common stock) during any quarter in which the Company fails to declare and pay dividends on the Series B Preferred Stock and for the next three quarters following such failure. In addition, under the terms of the Series B Preferred Stock, Hilltop may only declare and pay dividends on its common stock (or repurchase shares of Hilltop common stock), if, after payment of such dividend, the dollar amount of Hilltop’s Tier 1 capital would be at least ninety percent (90%) of Tier 1 capital as of September 27, 2011, excluding any charge-offs and redemptions of the Series B Preferred Stock (the “Tier 1 Dividend Threshold”). The Tier 1 Dividend Threshold is subject to reduction, beginning January 1, 2014, based upon the extent by which, if at all, the QSBL at September 30, 2013 has increased over the Baseline.
The Company may redeem the Series B Preferred Stock at any time at its option, at a redemption price of 100% of the liquidation amount plus accrued but unpaid dividends, subject to the approval of the Company’s federal banking regulator.
F-48
Table of Contents
Hilltop Holdings Inc. and Subsidiaries
Notes to Consolidated Financial Statements (continued)
Series A Preferred Stock
In 2004, the Company issued 5,000,000 shares of Series A Preferred Stock at an initial public offering price of $25.00 per share that have no stated par value and a liquidation preference of $25.00 per share, plus all accumulated, accrued and unpaid dividends. The holders of our Series A Preferred Stock were entitled to receive cash dividends at a rate of 8.25% per annum on the $25.00 liquidation preference. The Series A Preferred Stock has no voting rights and no stated maturity. On and after February 18, 2009, Hilltop had the option to redeem its Series A Preferred Stock, in whole or from time to time in part, at a cash redemption price equal to $25.00 per share, plus all accumulated, accrued and unpaid dividends, if any, to and including the redemption date.
On August 6, 2010, the Company called for redemption of all the outstanding shares of its Series A Preferred Stock. The Series A Preferred Stock was redeemed on September 6, 2010, at a cash redemption price of $25.2063 per share, representing the liquidation preference of $25.00 per share, plus accrued and unpaid dividends to, and including, the date of redemption.
On December 20, 2010, the Company filed Articles Supplementary with the Department of Assessments and Taxation of the State of Maryland, which was effective upon filing. The Articles Supplementary reclassified and designated 750,000 authorized but unissued shares of the 8.25% Series A Cumulative Redeemable Preferred Stock of the Company as authorized but unissued shares of preferred stock of the Company.
Reserve21. Other Noninterest Income and Expense
The following tables show the components of other noninterest income and expense (in thousands).
| | Year Ended December 31, | |
| | 2012 | | 2011 | | 2010 | |
Other noninterest income: | | | | | | | |
Revenue from check and stored value cards | | $ | 275 | | $ | — | | $ | — | |
Net loss from trading securities portfolio | | (646 | ) | — | | — | |
Trust fees | | 411 | | — | | — | |
Service charges on depositor accounts | | 724 | | — | | — | |
Commission and insurance agency income | | 2,159 | | 2,645 | | 2,353 | |
Direct bill fees and insurance service fee income | | 4,109 | | 4,140 | | 4,391 | |
Other | | 1,541 | | — | | — | |
| | $ | 8,573 | | $ | 6,785 | | $ | 6,744 | |
| | | | | | | |
Other noninterest expense: | | | | | | | |
Marketing | | $ | 2,245 | | $ | — | | $ | — | |
Data processing | | 4,033 | | 434 | | 376 | |
Unreimbursed loan closing costs | | 5,944 | | — | | — | |
Amortization of intangible assets | | 1,986 | | 1,525 | | 1,643 | |
Acquisition costs | | 6,570 | | 2,603 | | 1,271 | |
Management fees | | 1,025 | | 1,098 | | 1,124 | |
Accounting fees | | 2,269 | | 852 | | 793 | |
Other professional services | | 5,004 | | 412 | | 693 | |
Other | | 5,292 | | 2,869 | | 2,590 | |
| | $ | 34,368 | | $ | 9,793 | | $ | 8,490 | |
F-49
Table of Contents
Hilltop Holdings Inc. and Subsidiaries
Notes to Consolidated Financial Statements (continued)
22. Derivative Financial Instruments
The Bank and PrimeLending use various derivative financial instruments to mitigate interest rate risk. The Bank’s interest rate risk management strategy involves effectively modifying the re-pricing characteristics of certain assets and liabilities so that changes in interest rates do not adversely affect the net interest margin. PrimeLending has interest rate risk relative to its inventory of mortgage loans held for sale and IRLCs. PrimeLending is exposed to such rate risk from the time an IRLC is made to an applicant to the time the related mortgage loan is sold.
Non-Hedging Derivative Instruments and the Fair Value Option
As discussed in Note 3, PrimeLending has elected to measure substantially all mortgage loans held for sale at fair value under the provisions of the Fair Value Option. The election provides PrimeLending the opportunity to mitigate volatility in reported earnings caused by measuring related assets and liabilities differently without applying complex hedge accounting provisions. PrimeLending and FSC provide IRLCs to their customers and execute forward purchase commitments to sell mortgage loans. The fair values of both IRLCs and purchase commitments are recorded in other assets or other liabilities, as appropriate. Changes in the fair values of these derivative instruments produced a net loss of $6.2 million for the month ended December 31, 2012, which was recorded as a component of gain on sale of loans within other noninterest income, as appropriate.
Derivative positions at December 31, 2012 are presented in the following table (in thousands).
| | Notional | | Estimated | |
| | Amount | | Fair Value | |
Derivative instruments | | | | | |
IRLCs | | $ | 1,133,211 | | $ | 15,616 | |
Interest rate swaps | | 1,969 | | 25 | |
Forward purchase commitments | | 1,586,930 | | (1,025 | ) |
| | | | | | | |
23. Broker-Dealer and Clearing Organization Receivables and Payables
Broker-dealer and clearing organization receivables and payables at December 31, 2012 consisted of the following (in thousands). There were no broker-dealer and clearing organization receivables and payables at December 31, 2011.
Receivables: | | | |
Securities borrowed | | $ | 103,936 | |
Securities failed to deliver | | 33,045 | |
Clearing organizations | | 8,543 | |
Due from dealers | | 40 | |
| | $ | 145,564 | |
| | | |
Payables: | | | |
Securities loaned | | $ | 115,102 | |
Correspondents | | 41,414 | |
Securities failed to receive | | 31,474 | |
| | $ | 187,990 | |
F-50
Table of Contents
Hilltop Holdings Inc. and Subsidiaries
Notes to Consolidated Financial Statements (continued)
24. Deferred Policy Acquisition Cost
Policy acquisition expenses, primarily commissions, premium taxes and underwriting expenses related to the successful issuance of a new or renewal policy incurred by NLASCO are deferred and charged against income ratably over the terms of the related policies. A summary of the activity in deferred policy acquisition costs is as follows (in thousands).
| | Year Ended December 31, | |
| | 2012 | | 2011 | |
Balance, beginning of year | | $ | 19,182 | | $ | 17,237 | |
Acquisition expenses capitalized | | 39,387 | | 36,700 | |
Amortization charged to income | | (38,757 | ) | (34,755 | ) |
Balance, end of year | | $ | 19,812 | | $ | 19,182 | |
Amortization is included in policy acquisition and other underwriting expenses in the accompanying consolidated statements of operations.
25. Reserves for Unpaid Losses and Loss Adjustment Expenses
A roll-forward ofInformation regarding the reserve for unpaid losses and loss adjustment expenses for the twelve months ended December 31, 2011 and 2010LAE are as follows (in thousands).
| | Year Ended December 31, | |
| | 2011 | | 2010 | |
| | | | | |
Balance at January 1, | | $ | 58,882 | | $ | 33,780 | |
Less reinsurance recoverables | | (43,773 | ) | (21,102 | ) |
Net balance at January 1, | | 15,109 | | 12,678 | |
| | | | | |
Incurred related to: | | | | | |
Current Year | | 97,742 | | 69,044 | |
Prior Period | | (1,008 | ) | 1,899 | |
Total incurred | | 96,734 | | 70,943 | |
| | | | | |
Payments related to: | | | | | |
Current Year | | (83,266 | ) | (59,560 | ) |
Prior Year | | (8,825 | ) | (8,952 | ) |
Total payments | | (92,091 | ) | (68,512 | ) |
| | | | | |
Net balance at December 31, | | 19,752 | | 15,109 | |
Plus reinsurance recoverables | | 25,083 | | 43,773 | |
Balance at December 31, | | $ | 44,835 | | $ | 58,882 | |
| | Year Ended December 31, | |
| | 2012 | | 2011 | | 2010 | |
| | | | | | | |
Balance, beginning of year | | $ | 44,835 | | $ | 58,882 | | $ | 33,780 | |
Less reinsurance recoverables | | (25,083 | ) | (43,773 | ) | (21,102 | ) |
Net balance, beginning of year | | 19,752 | | 15,109 | | 12,678 | |
| | | | | | | |
Incurred related to: | | | | | | | |
Current year | | 109,328 | | 97,742 | | 69,044 | |
Prior years | | (169 | ) | (1,008 | ) | 1,899 | |
Total incurred | | 109,159 | | 96,734 | | 70,943 | |
| | | | | | | |
Payments related to: | | | | | | | |
Current year | | (90,743 | ) | (83,266 | ) | (59,560 | ) |
Prior years | | (14,541 | ) | (8,825 | ) | (8,952 | ) |
Total payments | | (105,284 | ) | (92,091 | ) | (68,512 | ) |
| | | | | | | |
Net balance, end of year | | 23,627 | | 19,752 | | 15,109 | |
Plus reinsurance recoverables | | 10,385 | | 25,083 | | 43,773 | |
Balance, end of year | | $ | 34,012 | | $ | 44,835 | | $ | 58,882 | |
The decrease in reserves for the twelve monthsyear ended December 31, 2011,2012, as compared to the same period in 2010,2011, of $14.0$10.8 million is due to a decrease in reinsurance recoverable of $18.7 million. Reinsurance recoverables decreased dueprimarily to settling reserves and paying claims related to Hurricane Ike, Hurricane Dolly and the 2010 Arizona Storm. Incurred amounts related to current year increased $28.7$11.6 million for the year ended December 31, 2011,2012, as compared to the same period in 2010,2011, is due to an increase in frequency and severity of fire losses and wind and hail losses, as well as the effects of five storms that occurred in Texas in April and May 2011.losses. Incurred amounts related to prior years indicate that we hadindicates favorable development in incurred but not reported as ofat December 31, 2010,2011, resulting in a benefit in the year ended December 31, 2011.2012. This redundancy is due to favorable development on our homeowners and fire products for the 2008 and 2009 accident years, offset by unfavorable development for the 20102011 accident year. For the year ended December 31, 2011 and 2010, the reserve for losses and loss adjustment expenses includes amounts related to losses incurred prior to the purchase of NLASCO. All losses and payments related to events that occurred prior to the purchase of NLASCO were the responsibility of the sellers. In March 2011, we made a final settlement with the sellers and going forward all losses are now the responsibility of the Company.
F-23F-51
Table of Contents
Hilltop Holdings Inc. and Subsidiaries
Notes to Consolidated Financial Statements (continued)
9.26. Reinsurance Activity
NLASCO limits the maximum net loss that can arise from large risks or risks in concentrated areas of exposure by reinsuring (ceding) certain levels of risk. Substantial amounts of business are ceded, and these reinsurance contracts do not relieve NLASCO from its obligations to policyholders. Such reinsurance includes quota share, excess of loss, catastrophe, and other forms of reinsurance on essentially all property and casualty lines of insurance. Net insurance premiums earned, losses and LAE and policy acquisition and other underwriting expenses are reported net of the amounts related to reinsurance ceded to other companies. Amounts recoverable from reinsurers related to the portions of the liability for losses and LAE and unearned insurance premiums ceded to them are reported as assets. Failure of reinsurers to honor their obligations could result in losses to NLASCO; consequently, allowances are established for amounts deemed uncollectible as NLASCO evaluates the financial condition of its reinsurers and monitors concentrations of credit risk arising from similar geographic regions, activities, or economic characteristics of the reinsurers to minimize its exposure to significant losses from reinsurer insolvencies. At December 31, 2011,2012, reinsurance receivables have a carrying value of approximately $25.9$18.6 million. There was no allowance for uncollectible accounts as ofat December 31, 2011,2012, based on our quality requirements.
Reinsurers with a balance in excess of 5% of our outstanding reinsurance receivables at December 31, 20112012 are listed below (in thousands):.
| | | Balances | | | |
| | | Due From | | A.M. Best | |
| | Balances due from
Companies | | A.M. Best
Rating | | | Reinsurers | | Rating | |
| | | | | | | | | | |
Federal Emergency Management Agency | | $ | 6,152 | | N/A | | | $ | 3,706 | | N/A | |
Endurance Specialty Insurance Ltd | | 3,257 | | A | | | 2,142 | | A | |
Arden Reinsurance Co | | | 1,702 | | A- | |
Platinum Underwriters Reinsurance, Inc. | | 2,368 | | A | | | 1,415 | | A | |
Munich Reinsurance America, Inc. | | 1,649 | | A+ | | | 1,076 | | A+ | |
Arch Reinsurance Company | | | 1,066 | | A+ | |
MS Frontier Reinsurance Limited | | 1,617 | | A | | | 1,059 | | A | |
| | $ | 15,043 | | | | | $ | 12,166 | | | |
The effecteffects of reinsurance on premiums written and earned for the year ended December 31, 2011, 2010 and 2009 isare summarized as follows (in thousands):.
| | Year Ended | | Year Ended | | Year Ended | | | Year Ended December 31, | |
| | December 31, 2011 | | December 31, 2010 | | December 31, 2009 | | | 2012 | | 2011 | | 2010 | |
| | Written | | Earned | | Written | | Earned | | Written | | Earned | | | Written | | Earned | | Written | | Earned | | Written | | Earned | |
Premiums from direct business | | $ | 155,054 | | $ | 147,419 | | $ | 139,290 | | $ | 134,701 | | $ | 131,309 | | $ | 131,451 | | | $ | 163,780 | | $ | 162,383 | | $ | 155,054 | | $ | 147,419 | | $ | 139,290 | | $ | 134,701 | |
Reinsurance assumed | | 5,388 | | 5,176 | | 5,079 | | 4,998 | | 4,898 | | 5,061 | | | 6,422 | | 5,882 | | 5,388 | | 5,176 | | 5,079 | | 4,998 | |
Reinsurance ceded | | (18,705 | ) | (18,547 | ) | (22,678 | ) | (22,507 | ) | (21,464 | ) | (21,359 | ) | | (19,751 | ) | (21,564 | ) | (18,705 | ) | (18,547 | ) | (22,678 | ) | (22,507 | ) |
Net premiums | | $ | 141,737 | | $ | 134,048 | | $ | 121,691 | | $ | 117,192 | | $ | 114,743 | | $ | 115,153 | | | $ | 150,451 | | $ | 146,701 | | $ | 141,737 | | $ | 134,048 | | $ | 121,691 | | $ | 117,192 | |
The effecteffects of reinsurance on incurred losses wasare as follows:follows (in thousands).
| | Year Ended | | Year Ended | | Year Ended | | | Year Ended December 31, | |
| | December 31, 2011 | | December 31, 2010 | | December 31, 2009 | | | 2012 | | 2011 | | 2010 | |
Loss and Loss Adjustment (LAE) expense incurred | | $ | 92,655 | | $ | 109,882 | | $ | 96,477 | | |
Loss and LAE incurred | | | $ | 115,347 | | $ | 92,655 | | $ | 109,882 | |
Reinsurance recoverables | | 4,079 | | (38,939 | ) | (26,182 | ) | | (6,188 | ) | 4,079 | | (38,939 | ) |
Net loss and LAE incurred | | $ | 96,734 | | $ | 70,943 | | $ | 70,295 | | | $ | 109,159 | | $ | 96,734 | | $ | 70,943 | |
F-52
Table of Contents
Hilltop Holdings Inc. and Subsidiaries
Notes to Consolidated Financial Statements (continued)
Multi-line excess of loss coverage
In addition to the catastrophe reinsurance noted below, both NLIC and ASIC participate in an excess of loss program with General Reinsurance Corporation. The General Reinsurance Corporation program is limited to each risk with respect to property and liability in the amount of $800,000$775,000 for each of NLIC and ASIC. Each of NLIC and ASIC retain $200,000$225,000 in this program. OnEffective January 1, 2012,2013, the program will limitlimited each risk for property and liability in the amount of $775,000$700,000 for each NLIC and ASIC, with the retention increasing to $225,000.
F-24
Table of Contents$300,000.
Catastrophic coverage
NLASCO’s liabilities for losses and loss adjustment expenses include liabilities for reported losses, liabilities for incurred but not reported, or IBNR, losses and liabilities for loss adjustment expenses, or LAE, less a reduction for reinsurance recoverables related to those liabilities. The amount of liabilities for reported claims is based primarily on a claim-by-claim evaluation of coverage, liability, injury severity or scope of property damage, and any other information considered relevant to estimating exposure presented by the claim. The amounts of liabilities for IBNR losses and LAE are estimated on the basis of historical trends, adjusted for changes in loss costs, underwriting standards, policy provisions, product mix and other factors. Estimating the liability for unpaid losses and LAE is inherently judgmental and is influenced by factors that are subject to significant variation. Liabilities for LAE are intended to cover the ultimate cost of settling claims, including investigation and defense of lawsuits resulting from such claims. Based upon the contractual terms of the reinsurance agreements, reinsurance recoverables offset, in part, NLASCO’s gross liabilities.
As ofAt December 31, 2011,2012, NLASCO has fivefour layers of catastrophic excess of loss reinsurance coverage up to $170 million of losses per event in excess of $1 million retention by ASIC and $8 million retention by NLIC.NLIC and $1.5 million retention by ASIC. The reinsurance fromin excess of $8 million to $50 million loss is comprised of twofour layers of protection: $17 million in excess of $8 million loss;retention; $25 million in excess of $25 million loss. The third layer provides coverage forloss; $50 million in excess of $50 million loss; the fourth layer provides coverage of $50loss and $70 million in excess of $100 million loss and the fifth layer provides coverage of $20 million in excess of $150 million loss. The fifth layer is not fully subscribed, with participants accounting for 79% of the total layer. Accordingly, NLASCO retains 21% of the losses in the fifth layer. NLIC and ASIC do not retain no participation in any of the layers, beyond the first $8 million. During 2011, all five layers can be reinstatedmillion and $1.5 million, respectively. At December 31, 2012, total retention for any one time for 100% ofcatastrophe that affects both NLIC and ASIC is limited to $8 million in the original premium.
As ofaggregate. At January 1, 2012, the Company2013, NLASCO renewed its reinsurance contract for its first, second and secondthird layers of reinsurance. Per the contract renewal, the Company changed its underlying coverage at ASIC to $6.5 million in excess of $1.5 million retention. The Company has reinsurance for up to $162 million in losses per event in excess of the $8 million retention. The projected premiums on these treaties for NLIC and ASIC are $11.5$10.1 million and $1.4$2.8 million, respectively, in 2012.2013.
For the year ended December 31, 2011, the Company did not experience any2012, NLASCO experienced a catastrophe that resulted in losses in excess of retention. retention at NLIC, as compared to none during the year ended December 31, 2011. For the year ended December 31, 2010, the CompanyNLASCO experienced one significant catastrophe that resulted in losses in excess of retention at ASIC. For the year ended December 31, 2011, the total loss and LAE incurred associated with the 2010 catastrophe was $3.4 million, which when added to the 2010 incurred amount totals $7.1 million cumulatively; however, since the lossesThe Texas hail storm that exceeded retention net exposure to the Company was $1.0 million in retention at ASIC, and reinstatement premiums in the year ended December 31, 2012, had incurred losses of $8.3 million. Gross losses from the 2010 catastrophe and other prior year catastrophic events, including Hurricanes Ike and Dolly, was $0.8 million, as compared to favorable development of $7.0 million for the same period in 2011. These losses have no effect on net loss and LAE incurred because the catastrophic events exceeded our retention and are fully recoverable. The primary financial effect beyond the reinsurance retention is additional reinstatement premium payable to the affected reinsurers. Reinstatement premiums during the years ended December 31, 2012, 2011 and 2010 of $0.6$0.5 million, $0.1 million and $0.5$2.5 million, respectively. Reinstatement premiums are recorded as ceded premiums.
For the year ended December 31, 2012, the ultimate loss development related to Hurricane Ike increased $1.4 million, resulting in reinstatement premiums of $0.6 million. Total loss development was favorable $0.6 million on Hurricane Dolly, resulting in a benefit from reinstatement premiums of $0.1 million.
For the year ended December 31, 2011, the ultimate loss development related to Hurricane Ike decreased $9.3 million, resulting in a benefit from reinstatement premiums of $0.4 million. Total loss development was favorable $1.0 million on Hurricane Dolly, resulting in a benefit from reinstatement premiums of $0.3 million.
For the year ended December 31, 2010, the ultimate loss development related to Hurricane Ike increased $25.0 million, resulting in additional reinstatement premiums of $1.1 million. Total loss development on Hurricane Dolly increased $3.9 million, resulting in additional reinstatement premiums of $0.9 million.
For the year ended December 31, 2009, the ultimate reserves for incurred by not reported losses related to Hurricane Ike increased $22.0 million, resulting in additional reinstatement premiums of $0.9 million.
10. Income Taxes
At December 31, 2011, the Company had net operating loss carry-forwards for Federal income tax purposes, subject to certain limitations, of approximately $56.0 million and $59.7 million for regular income tax and alternative minimum tax, respectively. These net operating loss carry-forwards expire in 2018 through 2026. The net operating loss carry-forwards for alternative minimum Federal income taxes generally are limited to offsetting 90% of the alternative minimum taxable earnings for a taxable year.
As of December 31, 2011, we had a net deferred tax asset of $8.4 million. Our 35% statutory rate reflects the expectation that future taxable income of our insurance business will primarily be subject to Federal but not state income taxes. Our effective tax rate is subject to prior year state tax audit adjustments. The Company is generally not subject to state income taxes after 2007. Insurance companies are generally not taxed in most states on income taxes as they pay premium taxes in states where they generate premium revenue.
F-25F-53
Table of Contents
GAAP requiresHilltop Holdings Inc. and Subsidiaries
Notes to Consolidated Financial Statements (continued)
27. Segment and Related Information
Hilltop has four reportable segments that are organized primarily by the measurement of uncertain tax positions. Uncertain tax positions arecore products offered to the difference between a tax position taken, or expected to be taken in a tax return, andsegments’ respective customers. The banking segment includes the benefit recognized for accounting purposes. For the period ending December 31, 2011 we had the following uncertain tax benefit. The change in our unrecognized tax benefit is a resultoperations of the resolution andBank. The operations of PrimeLending comprise the expirationmortgage origination segment. The insurance segment is composed of the statuteNLASCO. The financial advisory segment is composed of limitations on state tax audits.
| | December 31, | | December 31, | |
| | 2011 | | 2010 | |
Balance at beginning of year | | $ | 960 | | $ | 1,167 | |
Tax positions of prior years | | (960 | ) | (207 | ) |
Balance at end of year | | $ | — | | $ | 960 | |
The Company has a net deferred tax asset of $8.4 million and $9.1 million at December 31, 2011 and 2010, respectively. The Company had no valuation allowance on the deferred tax assets of the December 31, 2011 and 2010. The Company had three years with cumulative losses as of December 31, 2011; therefore, management performed an analysis to determine if the Company would realize the deferred tax asset. Valuation allowances on deferred tax assets are established, if necessary, to reduce deferred tax assets to an amount expected to be recognized. In accordance with ASC 740, the Company considered all negative and positive evidence available including our cumulative pre-tax loss position since the quarter ending December 31, 2008, less any abnormal occurrences during that period, as well as future taxable income and reversals of existing taxable temporary differences. We expect to realize our current deferred tax assets through core earnings, reversal of timing differences, and to the extent necessary, through the implementation of certain tax planning strategies surrounding the Company’s cash holdings. Therefore, the Company concluded there was sufficient positive evidence to outweigh the negative evidence of the prior year cumulative losses.First Southwest.
We file tax returns as prescribed by the tax laws of the jurisdictions in which we operate. We are subject to tax audits in numerous jurisdictionsBalance sheet amounts for Hilltop and its remaining subsidiaries not discussed in the U.S. until the applicable statute of limitation expire. The following is a summary of the tax years open to examination:previous paragraph are included in “All Other and Eliminations.”
U.S. Federal—2008 through 2010
U.S. States—2007 through 2010
As of December 31, 2011discussed in Note 1 to the consolidated financial statements, the Company is under no Federal or State tax audits.
Under special IRS rules (the “Section 382 Limitation”), cumulative stock purchases by 5% shareholders exceeding 50% duringacquired PlainsCapital and its subsidiaries on November 30, 2012. Prior to this acquisition, Hilltop operated as a three year period can limit a company’s future usesingle segment through its insurance subsidiary, NLASCO, given the integrated monitoring, control and management of net operating losses (NOL’s). We had a Section 382 ownership change in February 2004 at the time of the IPO.its fire and homeowners insurance business lines.
The significant components offollowing tables present certain information about reportable segment revenues, operating results, goodwill and assets at and for the provision for income taxes are as followsyear ended December 31, 2012 (in thousands):.
| | For the Year Ended December 31, | |
| | 2011 | | 2010 | | 2009 | |
| | | | | | | |
Current tax benefit | | $ | 966 | | $ | 1,125 | | $ | 2,325 | |
Deferred tax expense | | 4,043 | | (118 | ) | (976 | ) |
| | | | | | | |
Income tax benefit | | $ | 5,009 | | $ | 1,007 | | $ | 1,349 | |
| | | | Mortgage | | | | Financial | | All Other and | | Hilltop | |
| | Banking | | Origination | | Insurance | | Advisory | | Eliminations | | Consolidated | |
Net interest income (expense) | | $ | 24,885 | | $ | (4,987 | ) | $ | 4,730 | | $ | 1,191 | | $ | 3,023 | | $ | 28,842 | |
Provision for loan losses | | 3,670 | | — | | — | | 130 | | — | | 3,800 | |
Noninterest income | | 4,601 | | 57,618 | | 154,147 | | 10,909 | | (3,043 | ) | 224,232 | |
Noninterest expense | | 16,130 | | 50,296 | | 163,585 | | 11,078 | | 14,428 | | 255,517 | |
Income (loss) before income taxes | | $ | 9,686 | | $ | 2,335 | | $ | (4,708 | ) | $ | 892 | | $ | (14,448 | ) | $ | (6,243 | ) |
| | | | | | | | | | | | | |
Goodwill | | $ | 209,703 | | $ | 13,071 | | $ | 23,988 | | $ | 7,008 | | $ | — | | $ | 253,770 | |
| | | | | | | | | | | | | |
Total assets | | $ | 6,195,775 | | $ | 1,548,384 | | $ | 305,699 | | $ | 592,017 | | $ | (1,355,010 | ) | $ | 7,286,865 | |
28. Earnings (Loss) per Common Share
The provision for income taxes differs fromfollowing table presents the amount that would be computed by applying the statutory Federal income tax ratecomputation of 35%basic and diluted loss per common share (in thousands, except per share data).
| | Year Ended December 31, | |
| | 2012 | | 2011 | | 2010 | |
Loss applicable to Hilltop Holdings common stockholders | | $ | (5,592 | ) | $ | (6,531 | ) | $ | (548 | ) |
Dividends on preferred stock | | (259 | ) | — | | (7,047 | ) |
Redemption of preferred stock | | — | | — | | (5,892 | ) |
Loss applicable to Hilltop Holdings common stockholders for basic loss per common share | | $ | (5,851 | ) | $ | (6,531 | ) | $ | (13,487 | ) |
| | | | | | | |
Basic shares outstanding | | 58,754 | | 56,499 | | 56,492 | |
Diluted shares outstanding | | 58,754 | | 56,499 | | 56,492 | |
| | | | | | | |
Basic loss per common share | | $ | (0.10 | ) | $ | (0.12 | ) | $ | (0.24 | ) |
Diluted loss per common share | | $ | (0.10 | ) | $ | (0.12 | ) | $ | (0.24 | ) |
| | | | | | | |
Weighted-average equivalent shares excluded from diluted loss: | | | | | | | |
Senior exchangeable notes | | 6,208 | | 6,208 | | 6,718 | |
Stock options | | 600 | | 700 | | 100 | |
Total | | 6,808 | | 6,908 | | 6,818 | |
F-54
Table of Contents
Hilltop Holdings Inc. and Subsidiaries
Notes to income before income taxes as a resultConsolidated Financial Statements (continued)
For each of the followingyears ended December 31, 2012, 2011 and 2010, the computation of diluted net loss per common share did not include the shares of senior exchangeable notes as their inclusion would have been anti-dilutive. Options to purchase common stock for the years ended December 31, 2012, 2011 and 2010 were not included in the computation of diluted net loss per common share as their exercise prices were in excess of the average stock prices for the periods presented.
29. Condensed Financial Statements of Parent
Condensed financial statements of Hilltop (parent only) follow (in thousands):. Investments in subsidiaries are determined using the equity method of accounting.
| | For the Year Ended December 31, | |
| | 2011 | | 2010 | | 2009 | |
| | | | | | | |
Tax benefit at statutory rate | | $ | 4,039 | | $ | 544 | | $ | 1,211 | |
Permanent differences | | 970 | | (124 | ) | (1 | ) |
State taxes | | — | | 587 | | 139 | |
| | | | | | | |
Income tax benefit | | $ | 5,009 | | $ | 1,007 | | $ | 1,349 | |
Condensed Statements of Operations
| | Year Ended December 31, | |
| | 2012 | | 2011 | | 2010 | |
Investment income | | $ | 7,035 | | $ | 4,284 | | $ | 1,791 | |
Interest expense | | 6,996 | | 7,135 | | 7,010 | |
General and administrative expense | | 14,488 | | 8,868 | | 7,433 | |
Loss before income taxes, equity in undistributed earnings of subsidiaries and preferred stock activity | | (14,449 | ) | (11,719 | ) | (12,652 | ) |
Income tax benefit | | (3,313 | ) | (5,138 | ) | (4,941 | ) |
Equity in undistributed earnings of subsidiaries | | 6,038 | | 50 | | 7,163 | |
Net loss | | $ | (5,098 | ) | $ | (6,531 | ) | $ | (548 | ) |
Condensed Statements of Comprehensive Income (Loss)
| | Year Ended December 31, | |
| | 2012 | | 2011 | | 2010 | |
Net loss | | $ | (5,098 | ) | $ | (6,531 | ) | $ | (548 | ) |
Other comprehensive income (loss), net of tax | | (4,900 | ) | 8,581 | | 1,723 | |
Comprehensive income (loss) | | $ | (9,998 | ) | $ | 2,050 | | $ | 1,175 | |
Condensed Balance Sheets
| | December 31, | |
| | 2012 | | 2011 | |
Assets | | | | | |
Cash and cash equivalents | | $ | 204,754 | | $ | 533,374 | |
Securities, available for sale | | 64,082 | | 70,513 | |
Investment in subsidiaries | | 944,546 | | 126,017 | |
Other assets | | 27,743 | | 24,884 | |
Total assets | | $ | 1,241,125 | | $ | 754,788 | |
| | | | | |
Liabilities and Stockholders’ Equity | | | | | |
Accounts payable and accrued expenses | | $ | 5,779 | | $ | 8,555 | |
Notes payable | | 90,850 | | 90,850 | |
Stockholders’ equity | | 1,144,496 | | 655,383 | |
Total liabilities and stockholders’ equity | | $ | 1,241,125 | | $ | 754,788 | |
F-26F-55
Table of Contents
Deferred income taxes reflect the net tax effects of temporary differences between the carrying amount of the assetsHilltop Holdings Inc. and liabilities for financial reporting purposes and the amounts used for income tax purposes. The tax effects of significant temporary differences that give riseSubsidiaries
Notes to the net deferred tax assets and liabilities are as follows (in thousands):Consolidated Financial Statements (continued)
| | December 31, | | December 31, | |
| | 2011 | | 2010 | |
Deferred Tax Assets | | | | | |
Net operating loss carryforwards | | $ | 19,598 | | $ | 15,851 | |
Accrued liabilities and other | | 726 | | 856 | |
Loss and loss adjustment expense discounting | | 482 | | 371 | |
Unearned premiums | | 5,424 | | 4,868 | |
Other | | 369 | | 377 | |
AMT credit carryforward | | 769 | | 769 | |
Total gross deferred tax assets | | $ | 27,368 | | $ | 23,092 | |
| | | | | |
Deferred Tax Liabilities | | | | | |
Intangible assets | | $ | 3,176 | | $ | 3,710 | |
Goodwill | | 508 | | 407 | |
Investments | | 1,087 | | 989 | |
Securities available for sale | | 7,529 | | 2,838 | |
Deferred policy acquisition costs | | 6,714 | | 6,033 | |
Total gross deferred tax liabilities | | $ | 19,014 | | $ | 13,977 | |
| | | | | |
Net Deferred Tax Asset | | $ | 8,354 | | $ | 9,115 | |
11. Common Stock, Preferred Stock, Dividends and Minority Interest Related TransactionsCondensed Statements of Cash Flows
| | Year Ended December 31, | |
| | 2012 | | 2011 | | 2010 | |
Operating Activities | | | | | | | |
Net loss | | $ | (5,098 | ) | $ | (6,531 | ) | $ | (548 | ) |
Adjustments to reconcile net loss to net cash used in operating activities: | | | | | | | |
Equity in undistributed earnings of subsidiaries | | (6,038 | ) | (50 | ) | (7,163 | ) |
Deferred income taxes | | (1,011 | ) | (3,756 | ) | 6,787 | |
Other, net | | (3,506 | ) | (204 | ) | (906 | ) |
Net cash used in operating activities | | (15,653 | ) | (10,541 | ) | (1,830 | ) |
| | | | | | | |
Investing Activities | | | | | | | |
Cash paid for acquisitions | | (311,805 | ) | — | | — | |
Purchases of securities available for sale | | — | | (57,489 | ) | — | |
Net cash used in investing activities | | (311,805 | ) | (57,489 | ) | — | |
| | | | | | | |
Financing Activities | | | | | | | |
Dividends paid | | (1,162 | ) | — | | (8,766 | ) |
Redemption of preferred stock | | — | | — | | (125,000 | ) |
Net cash used in financing activities | | (1,162 | ) | — | | (133,766 | ) |
| | | | | | | |
Net change in cash and cash equivalents | | (328,620 | ) | (68,030 | ) | (135,596 | ) |
Cash and cash equivalents, beginning of year | | 533,374 | | 601,404 | | 737,000 | |
Cash and cash equivalents, end of year | | $ | 204,754 | | $ | 533,374 | | $ | 601,404 | |
30. Recently Issued Accounting Standards
Deferred Policy Acquisition Costs
In October 2010, the FASB issued ASU-2010-26 to address the diversity in practice for the accounting for costs associated with acquiring or renewing insurance contracts. This guidance modifies the definition of policy acquisition costs to specify that a cost must be directly related to the successful acquisition of a new or renewal insurance contract in order to be deferred. If application of this guidance would result in the capitalization of policy acquisition costs that had not previously been capitalized by a reporting entity, the entity may elect not to capitalize those costs. The updated guidance is effective for periods beginning after December 15, 2011. The Company adopted this guidance prospectively on January 1, 2012, and it had no material impact on the Company’s consolidated financial statements.
Achieving Common StockFair Value Measurements and Disclosure Requirements in U.S. GAAP and IFRSs
In May 2011, the FASB amended the Fair Value Measurements and Disclosures Topic of the ASC to converge the fair value measurement guidance in U.S. GAAP and International Financial Reporting Standards. The amendments clarify the application of existing fair value measurement requirements, change certain principles in the Fair Value Measurements and Disclosure Topic and require additional fair value disclosures. The amendments became effective for Hilltop on January 1, 2012 and did not have a significant effect on the Company’s consolidated financial statements. Hilltop has included the additional disclosures required by the amendments in Note 3.
Comprehensive Income
In June 2011, the FASB amended the Comprehensive Income Topic of the ASC to revise the manner in which entities present comprehensive income in their financial statements. The amendments became effective for Hilltop on January 1, 2012. Accordingly, the Company has presented the components of comprehensive income in a separate statement of comprehensive income immediately following the statement of operations, rather than in the statement of stockholders’ equity. The adoption of the amendment did not have a significant effect on the Company’s consolidated financial statements.
In accordance with ASC 718, Compensation — Stock Compensation, total compensation expense recorded in general and administrative expenses for the years ended December 31, 2011, 2010 and 2009 related to stock-based compensation issued to board members was $48 thousand, $0.1 million and $0.1 million, respectively. Stock compensation expense related to stock options awarded to senior management was $0.1 million for the year ended December 31, 2011, due to 600,000 options awarded in November 2011 to two senior executives. Stock compensation expense is included as part of additional paid-in capital on the consolidated balance sheets.
On October 25, 2007, the Compensation Committee of our Board of Directors approved the grant of an aggregate 100,000 non-qualified stock option awards to two senior executive officers of the Company pursuant to our 2003 Equity Incentive Plan at an exercise price of $12.06 per share, the closing price of HTH’s common stock on the New York Stock Exchange on the date of grant. The options have a term of five years from the date of the award. Under the terms of the grants, 20% of the options vested on the grant date, and the balance of the options vest ratably over a four-year period with 20% of the award amount vesting on the first anniversary of the award and 20% each anniversary thereafter. Vesting is accelerated in certain circumstances, including in the event of the death of the award recipient or in the event of a change of control of the Company. The fair value for the stock options granted during the year ended December 31, 2007 were estimated using the Black-Scholes option pricing model with an expected volatility of 25%, a risk-free interest rate of 4.0%, a dividend yield rate of zero, a five-year expected life of the options, and a forfeiture rate of fifteen percent. Based on calculations using the Black-Scholes option pricing model, the grant date fair value of the options granted during the quarter approximated $3.10 per share. The expected volatility is based on the historical volatility in the price of our common stock since our IPO. The risk-free interest rate is the five-year Treasury rate, based on the term of the options. The dividend yield assumption is based on our history and expectation of dividend payments on common stock. The expected life of the stock options represents the period in which the stock options are expected to remain outstanding.
On November 2, 2011, the Compensation Committee of the Board of Directors of HTH awarded two senior executives stock options to purchase 600,000 shares of the Company common stock. These stock options have an exercise price of $7.70 per share, vest in five equal installments on each of November 2, 2011, 2012, 2013, 2014 and 2015 and expire on November 2, 2016. The description of these stock options is qualified by reference to the Form of the 2003 Equity Incentive Plan Non-Qualified Stock Option Agreement, a copy of which is filed as Exhibit 10.2.3 to this Annual Report 10-K for the year ended December 31, 2011.
During 2011, 2010 and 2009, we granted 5,418, 10,163 and 12,359 common shares, respectively, to independent members of our board of directors for service rendered to the Company during the periods.
F-27F-56
Table of Contents
Preferred StockHilltop Holdings Inc. and Subsidiaries
Notes to Consolidated Financial Statements (continued)
In 2004,February 2013, the CompanyFASB issued 5,000,000 sharesan additional amendment to the Comprehensive Income Topic to improve the reporting of Series A preferred stock at an initial public offering pricereclassifications out of $25.00 per share that have no stated par value and a liquidation preferencecomprehensive income. The amendments require entities to report the effect of $25.00 per share, plus allsignificant reclassifications out of accumulated accrued and unpaid dividends. The holders of our Series A preferred stock are entitled to receive cash dividends at a rate of 8.25% per annumother comprehensive income on the $25.00 liquidation preference.respective line items in net income (loss) if the amount being reclassified is required under GAAP to be reclassified out of accumulated other comprehensive income in its entirety to net income (loss). The Series A preferred stock has no votingamendment became effective for Hilltop on January 1, 2013, and its adoption is not expected to have a significant effect on the Company’s financial position, results of operations or cash flows.
Offsetting Asset and Liabilities
In December 2011, the FASB amended the Balance Sheet Topic of the ASC to require enhanced disclosures about the nature and effect or potential effect of an entity’s rights of setoff associated with its financial and no stated maturity. Onderivative instruments. In January 2013, the FASB issued an update to the amendments, which narrowed the scope of the financial instruments for which the enhanced disclosures are applicable. The amendments became effective for Hilltop on January 1, 2013, and after February 18, 2009, we hadits adoption is not expected to have a significant effect on the Company’s financial position, results of operations or cash flows.
Testing Indefinite-Lived Intangible Assets for Impairment
In July 2012, the FASB amended the Intangibles Topic of the ASC to simplify how entities test indefinite-lived intangible assets, other than goodwill, for impairment. Entities have the option to redeem our Series A preferred stock,qualitatively test whether it is more likely than not that the fair value of the indefinite-lived intangible asset is less than its carrying amount in whole or from time to timedetermining whether step one of the annual impairment test is necessary. The adoption of the amendment became effective for Hilltop in part, atthe fourth quarter of 2012 and did not have a cash redemption price equal to $25.00significant effect on the Company’s consolidated financial statements.
31. Selected Quarterly Financial Information (Unaudited)
Selected quarterly financial information for the years ended December 31, 2012 and 2011 is summarized as follows (in thousands, except per share plus all accumulated, accrued and unpaid dividends, if any, to and including the redemption date.data).
On August 6, 2010, the Company called for redemption of all the outstanding shares of its Series A Preferred Stock. The Series A Preferred Stock was redeemed on September 6, 2010, at a cash redemption price of $25.2063 per share, representing the liquidation preference of $25.00 per share, plus accrued and unpaid dividends to, and including, the date of redemption.
On December 20, 2010, the Company filed Articles Supplementary with the Department of Assessments and Taxation of the State of Maryland, which was effective upon filing. The Articles Supplementary reclassified and designated 750,000 authorized but unissued shares of the 8.25% Series A Cumulative Redeemable Preferred Stock of the Company as authorized but unissued shares of preferred stock of the Company. Accordingly, following the redemption and filing of the Articles Supplementary, the Company has 10,000,000 shares of authorized but unissued shares of preferred stock, none of which are classified or designated.
Dividends
The following table sets forth the cash dividends declared and paid in 2010:
| | First Quarter | | Second Quarter | | Third Quarter | | Fourth Quarter | |
Series A Preferred Stock | | | | | | | | | |
2010 | | | | | | | | | |
Date of declaration | | March 17, 2010 | | July 8, 2010 | | August 6, 2010 | | N/A | |
Date of record | | April 15, 2010 | | July 15, 2010 | | September 6, 2010 | | N/A | |
Date paid | | April 30, 2010 | | July 30, 2010 | | September 6, 2010 | | N/A | |
Distribution per unit | | $ | 0.5156 | | $ | 0.5156 | | $ | 0.2063 | | N/A | |
Total dollars (in thousands) | | $ | 2,578 | | $ | 2,578 | | $ | 1,032 | | N/A | |
| | Year Ended December 31, 2012 | |
| | Fourth | | Third | | Second | | First | |
| | Quarter | | Quarter | | Quarter | | Quarter | |
Interest income | | $ | 28,954 | | $ | 3,379 | | $ | 3,349 | | $ | 3,356 | |
Interest expense | | 3,786 | | 2,140 | | 2,131 | | 2,139 | |
Net interest income | | 25,168 | | 1,239 | | 1,218 | | 1,217 | |
Provision for loan losses | | 3,800 | | — | | — | | — | |
Noninterest income | | 109,691 | | 39,591 | | 38,063 | | 36,887 | |
Noninterest expense | | 115,934 | | 46,792 | | 55,233 | | 37,558 | |
Income (loss) before income taxes | | 15,125 | | (5,962 | ) | (15,952 | ) | 546 | |
Income tax provision (benefit) | | 5,809 | | (1,914 | ) | (5,243 | ) | 203 | |
Net income (loss) | | 9,316 | | (4,048 | ) | (10,709 | ) | 343 | |
Less: Net income attributable to noncontrolling interest | | 494 | | — | | — | | — | |
Net income (loss) attributable to Hilltop Holdings | | $ | 8,822 | | $ | (4,048 | ) | $ | (10,709 | ) | $ | 343 | |
Dividends on preferred stock | | 259 | | — | | — | | — | |
Income (loss) applicable to Hilltop Holdings common stockholders | | $ | 8,563 | | $ | (4,048 | ) | $ | (10,709 | ) | $ | 343 | |
| | | | | | | | | |
Earnings (loss) per common share: | | | | | | | | | |
Basic | | $ | 0.13 | | $ | (0.07 | ) | $ | (0.19 | ) | $ | 0.01 | |
Diluted | | $ | 0.13 | | $ | (0.07 | ) | $ | (0.19 | ) | $ | 0.01 | |
F-28F-57
Table of Contents
12.GeneralHilltop Holdings Inc. and Administrative ExpenseSubsidiaries
Notes to Consolidated Financial Statements (continued)
During the years ended December 31, 2011, 2010 and 2009, we incurred general and administrative expense as follows (in thousands):
| | Year Ended December 31, | |
| | 2011 | | 2010 | | 2009 | |
Salaries and benefits | | $ | 1,699 | | $ | 1,760 | | $ | 2,269 | |
Travel | | 97 | | 31 | | 46 | |
Professional services | | 4,676 | | 3,682 | | 2,753 | |
Management fees | | 1,098 | | 1,123 | | 1,224 | |
Insurance | | 563 | | 567 | | 566 | |
Rent | | 9 | | 10 | | 47 | |
Other administrative expense | | 728 | | 260 | | 249 | |
| | $ | 8,870 | | $ | 7,433 | | $ | 7,154 | |
13. Employee Savings Plan
We provide our employees a qualified retirement savings plan, or Plan, designed to qualify under Section 401 of the Internal Revenue Code. The Plan allows our employees and employees of our subsidiaries to defer a portion of their compensation on a pre-tax basis subject to certain maximum amounts. The Plan provides for matching contributions to be made by us to employee accounts at the rate of 100% of the first 4% of compensation and 50% of the next 2% of compensation. For the years ended December 31, 2011, 2010 and 2009, the Company match was $0.2 million, $0.1 million and $0.1 million.
14. Related Party Transactions
Pursuant to a Management Services Agreement, as amended, Diamond A Administration Company LLC, or Diamond A, an affiliate of Gerald J. Ford, the current Chairman of the Board of Hilltop and the beneficial owner of 26.6% of Hilltop common stock as of December 31, 2011, provides certain management services to Hilltop and its subsidiaries, including, among others, financial and acquisition evaluation, and office space to Hilltop. The services and office space are provided at a cost of $91,500 per month, plus reasonable out-of-pocket expenses. The services provided under this agreement include those of several Hilltop’s directors, including Gerald J. Ford, Kenneth Russell and Carl B. Webb. Prior to Jeremy Ford assuming the role of Chief Executive Officer of Hilltop, he provided services to Hilltop under the Management Services Agreement. The Management Services Agreement continues in effect until terminated by either party upon thirty days prior written notice to the other party for any or no reason whatsoever or at such time as may be mutually agreed by the parties. Hilltop also agreed to indemnify and hold harmless Diamond A for its performance or provision of these services, except for gross negligence and willful misconduct. Further, Diamond A’s maximum aggregate liability for damages under this agreement is limited to the amounts paid to Diamond A under this agreement during twelve months prior to that cause of action.
Jeremy B. Ford, a director and the Chief Executive Officer of Hilltop, is the beneficiary of a trust that owns a 49% limited partnership interest in Diamond A Financial, L.P. Diamond A Financial, L.P. owns 26.6% of the outstanding Hilltop common stock at December 31, 2011. He also is a director and the Secretary of Diamond A Administration Company, LLC, which provides management services to Hilltop under the Management Services Agreement described the preceding paragraph. Diamond A Administration Company, LLC is owned by Hunter’s Glen/Ford, Ltd., a limited partnership in which a trust for the benefit of Jeremy B. Ford is a 46% limited partner.
Jeremy B. Ford is the son of Gerald J. Ford. Corey G. Prestidge, Hilltop’s General Counsel and Secretary, is the son-in-law of Gerald J. Ford. Accordingly, Messrs. Jeremy Ford and Corey Prestidge are brothers-in-law.
In 2009, we negotiated a consulting agreement with a related party consultant, who performs income tax consulting and is being paid $80,000 per year instead of the original compensation that consisted of cash settled stock appreciation rights, or SARS, that vested ratably over a 5 year period and expires on December 12, 2012.
On March 8, 2007, the Company’s board of directors appointed C. Clifton Robinson as a director of the Company. Mr. Robinson is the former chief executive officer of NLASCO. At the closing of the NLASCO acquisition, C. Clifton Robinson and his son, Gordon Robinson, the former vice chairman and deputy chief executive officer of NLASCO, entered into employment agreements with NLASCO. C. Clifton Robinson’s employment agreement provides that he will serve as chairman of NLASCO and will be paid $100,000 per year. Gordon Robinson’s employment agreement provides that he will serve as a senior advisor to NLASCO and will be paid $100,000 per year. Both employment agreements are for a one-year term and were not extended past January 31, 2011, with final payment made in January 2011.
| | Year Ended December 31, 2011 | |
| | Fourth | | Third | | Second | | First | |
| | Quarter | | Quarter | | Quarter | | Quarter | |
Interest income | | $ | 3,243 | | $ | 3,233 | | $ | 2,357 | | $ | 2,216 | |
Interest expense | | 2,323 | | 2,241 | | 2,245 | | 2,176 | |
Net interest income | | 920 | | 992 | | 112 | | 40 | |
Noninterest income | | 37,259 | | 37,512 | | 34,303 | | 32,576 | |
Noninterest expense | | 30,392 | | 39,569 | | 54,864 | | 30,429 | |
Income (loss) before income taxes | | 7,787 | | (1,065 | ) | (20,449 | ) | 2,187 | |
Income tax provision (benefit) | | 2,743 | | (1,313 | ) | (7,216 | ) | 777 | |
Net income (loss) | | $ | 5,044 | | $ | 248 | | $ | (13,233 | ) | $ | 1,410 | |
| | | | | | | | | |
Earnings (loss) per common share: | | | | | | | | | |
Basic | | $ | 0.09 | | $ | 0.00 | | $ | (0.23 | ) | $ | 0.02 | |
Diluted | | $ | 0.09 | | $ | 0.00 | | $ | (0.23 | ) | $ | 0.02 | |
F-29
Table of Contents
As part of the NLASCO acquisition, there will be a settlement of the reserves for losses and loss adjustment expense based on the runoff of the actual NLASCO loss reserves that werediscussed in existence and recorded on the NLASCO books and records as of the transaction closing date - January 31, 2007. A preliminary settlement occurred in February 2010 and the Company paid Mr. Robinson $2.9 million net of taxes. The final settlement occurred in March 2011 and Mr. Robinson was paid $0.3 million, net of taxes. All losses are now the responsibility of the Company.
Prior to Mr. Robinson’s disposition of his office building on August 24, 2011, NLASCO and its affiliates in Waco, Texas leased office space from affiliates of Mr. Robinson, a member of Hilltop’s Board of Directors. There are three separate leases. The first lease is a month-to-month lease for office space at a rate of $900 per month. The second lease is a month-to-month lease at a monthly rental rate of $3,500 per month. The first and second leases were terminated in August 2010. The third lease, as amended, currently requires payments of $40,408 per month and expires on December 31, 2014, but does have renewal options at the discretion of the lessee. Aggregate office space under lease with regardNote 2 to the foregoing is approximately 28,863 square feet.
15. Commitments and Contingencies
At December 31, 2011 the following table shows our outstanding commitments for leases (in thousands).
| | Payments Due by Period | |
| | Less than | | 1-3 | | | |
Lease Obligations | | 1 year | | years | | Total | |
Total lease obligations | | $ | 519 | | $ | 1,558 | | $ | 2,077 | |
| | | | | | | | | | |
Liabilities for loss contingencies arising from claims, assessments, litigation, fines and penalties and other sources are recorded when it is probable that a liability has been incurred and the amount of the assessment and/or remediation can be reasonably estimated.
We are a party to various legal actions resulting from our operating activities. These actions consist of litigation and administrative proceedings arising in the ordinary course of business, some of which are covered by liability insurance, and none of which is expected to have a material adverse effect on our consolidated financial condition,statements, the operating results of operations or cash flows taken as a whole.
16. Statutory Net Income and Capital and Surplus
The Company’s insurance subsidiaries, which are domiciled in the State of Texas, prepare their statutory financial statements in accordance with accounting principles and practices prescribed or permitted by the Texas Department of Insurance, which Texas recognizes for determining solvency under Texas State Insurance Law. The Commissioner of the Texas Department of Insurance has the right to permit other practices that may deviate from prescribed practices. Prescribed statutory accounting practices are those practices that are incorporated directly or by reference in state laws, regulations, and general administrative rules applicable to all insurance enterprises domiciled in Texas. Permitted statutory accounting practices encompass all accounting practices that are not prescribed; such practices differ from state to state, may differ from company to company within a state, and may change in the future. The Company’s insurance subsidiaries have no such permitted statutory accounting practices.
The Company’s insurance subsidiaries’ statutory financial statements are presented on the basis of accounting practices prescribed or permitted by the Texas Department of Insurance. Texas had adopted the National Association of Insurance Commissioners’ statutory accounting practices as the basis of its statutory accounting practices with certain differences which are not significant to the company’s statutory equity.
F-30
Table of Contents
Following is a summary of statutory capital and surplus and statutory net income of each insurance subsidiaryHilltop for the year ended December 31, 2011, 2010 and 2009 (in thousands).
| | Year Ended December 31, | |
| | 2011 | | 2010 | | 2009 | |
| | | | | | | |
National Lloyds Insurance Company | | | | | | | |
Surplus | | $ | 94,154 | | $ | 94,081 | | $ | 89,767 | |
Statutory net income (loss) | | $ | (133 | ) | $ | 7,010 | | $ | 6,119 | |
American Summit Insurance Company | | | | | | | |
Capital and surplus | | $ | 24,554 | | $ | 25,216 | | $ | 27,555 | |
Statutory net income | | $ | (541 | ) | $ | 642 | | $ | 3,567 | |
On October 29, 2010 and November 1, 2010, ASIC and NLIC, respectively, were notified by the Texas Department of Insurance that a statutory examination has been scheduled in the calendar years 2011/2012. The examination will be as of December 31, 2010, and cover the period since the last examination, which was as of December 31, 2006. We do not expect any significant changes to our financial statements as a result of the examinations by the domiciliary state.
17. Capital and Dividend Restrictions
The funding of the cash requirements (including debt service) of NLASCO is primarily provided by cash dividends from NLASCO’s wholly-owned insurance subsidiaries. Dividends paid by the insurance subsidiaries are restricted by regulatory requirements of the Texas Department of Insurance. Under Texas State Insurance Law for property and casualty companies, all dividends must be distributed out of earned surplus only. Furthermore, without the prior approval of the Commissioner, dividends cannot be declared or distributed which exceed the greater of ten percent of NLASCO’s surplus, as shown by its last statement on file with the Commissioner, or one hundred percent of net income for such period. The subsidiaries paid no dividends in 2009, $6.0 million in dividends to NLASCO in 2010, and no dividends in 2011. At December 31, 2011, the maximum dividend that may be paid to NLASCO in 2012 without regulatory approval is approximately $11.9 million.
Regulations of the Texas Department of Insurance require insurance companies to maintain minimum levels of statutory surplus to ensure their ability to meet their obligations to policyholders. At December 31, 2011, the Company’s insurance subsidiaries had statutory surplus in excess of the minimum required.
Also, the NAIC has adopted the RBC formula for insurance companies that establishes minimum capital requirements relating to insurance risk, asset credit risk, interest rate risk and business risk. The formula is used by the NAIC and certain state insurance regulators as an early warning tool to identify companies that require additional scrutiny or regulatory action. At December 31, 2011, the Company’s insurance subsidiaries’ RBC ratio exceeded the level at which regulatory action would be required.
F-31
Table of Contents
18. (Loss) Income per Share
The following reflects the calculation of loss per share on a basic and diluted basis (in thousands, except per share information):
| | Year Ended December 31, | |
| | 2011 | | 2010 | | 2009 | |
| | | | | | | |
Loss per share available to common stockholders: | | | | | | | |
Loss from operations | | $ | (6,531 | ) | $ | (548 | ) | $ | (2,112 | ) |
Preferred stock dividends | | — | | (7,047 | ) | (10,313 | ) |
Redemption of preferred stock | | — | | (5,892 | ) | — | |
Loss available to common stockholders | | $ | (6,531 | ) | $ | (13,487 | ) | $ | (12,425 | ) |
| | | | | | | |
Basic loss per share to common stockholders | | $ | (0.12 | ) | $ | (0.24 | ) | $ | (0.22 | ) |
Diluted loss per share to common stockholders | | $ | (0.12 | ) | $ | (0.24 | ) | $ | (0.22 | ) |
| | | | | | | |
Weighted average share information: | | | | | | | |
Basic shares outstanding | | 56,499 | | 56,492 | | 56,474 | |
Diluted shares outstanding | | 56,511 | | 56,492 | | 56,474 | |
| | | | | | | |
Weighted average equivalent shares excluded from diluted loss | | | | | | | |
Stock warrants | | — | | — | | 1 | |
Senior exchangeable Notes | | 6,208 | | 6,718 | | 6,718 | |
Stock options | | 700 | | 100 | | 516 | |
Total | | 6,908 | | 6,818 | | 7,235 | |
19. Segments
NLASCO operates through its wholly-owned subsidiaries, NLIC and ASIC. Given the homogenous nature of our products, the regulatory environments in which we operate, the nature of our customers and our distribution channels, we now monitor, control and manage our business lines as an integrated entity providing fire and homeowners insurance to low value dwellings and manufactured homes primarily in Texas and other areas of the south, southeastern and southwestern United States. Accordingly, we only have insurance segment information to disclose.
F-32
Table of Contents
20. Quarterly Financial Information (Unaudited)
The following is quarterly financial information for the years ended December 31, 2011 and 2010 (in thousands except per share data):
| | Quarter ended | |
| | Mar 31 | | Jun 30 | | Sep 30 | | Dec 31 | |
For the quarters ended 2011: | | | | | | | | | |
Total revenue | | $ | 34,657 | | $ | 36,532 | | $ | 40,623 | | $ | 40,376 | |
Total expenses | | $ | 32,470 | | $ | 56,981 | | $ | 41,688 | | $ | 32,589 | |
Net income (loss) | | $ | 1,410 | | $ | (13,233 | ) | $ | 248 | | $ | 5,044 | |
Basic income (loss) per share | | $ | 0.02 | | $ | (0.23 | ) | $ | 0.00 | | $ | 0.09 | |
Diluted income (loss)per share | | $ | 0.02 | | $ | (0.23 | ) | $ | 0.00 | | $ | 0.09 | |
| | �� | | | | | | | |
For the quarters ended 2010: | | | | | | | | | |
Total revenue | | $ | 31,655 | | $ | 32,870 | | $ | 33,878 | | $ | 33,334 | |
Total expenses | | $ | 30,899 | | $ | 36,857 | | $ | 32,993 | | $ | 32,543 | |
Net (loss) income | | $ | (2,087 | ) | $ | (5,207 | ) | $ | (7,219 | ) | $ | 1,026 | |
Basic (loss) income per share | | $ | (0.04 | ) | $ | (0.09 | ) | $ | (0.13 | ) | $ | 0.02 | |
Diluted (loss) income per share | | $ | (0.04 | ) | $ | (0.09 | ) | $ | (0.13 | ) | $ | 0.02 | |
Total revenue for the three months ended March 31, 2011 and 2010 was $34.7 million and $31.7 million, respectively. Net premiums earned were $30.9 million for the first quarter in 2011, as compared to $28.1 million for the same period in 2010 primarily due to higher volume of earned premiums of $2.3 million and a decrease in the cost of catastrophe reinsurance of $0.5 million. Net investment income was $2.1 million for the first quarter of 2011, as compared to $1.6 million for the same period in 2010, primarily due to higher yields on cash balances in 2011. Other income was $1.6 million for the first quarter in 2011, as compared to $1.8 million for the first quarter in 2010, due to a decrease in service fees from policies that include wind coverage in hurricane prone areas and lower commission income from our agency operations.
Total expenses for the quarter ended March 31, 2011 were $32.5 million as compared to $30.9 million for the same period in 2010. The increase is due to loss and LAE expenses for the three months ended March 31, 2011 of $16.0 million, as compared to $15.3 million for the same period in 2010. The increase is a result of an increase in late reported claims from the 2010 accident year, contributing to the adverse development on 2010 accident year losses on homeowners, liability and fire and allied claims. Total policy acquisition and other underwriting expenses as of March 31, 2011 were $12.0 million, as compared to $11.1 million for the same period in 2010. Amortization of deferred policy acquisition costs increased $0.6 million due to unearned premiums increasing $1.3 million in the three months ending March 31, 2011, as compared to the same period in 2010. Other underwriting expenses increased $0.2 million in the first quarter of 2011, which is a direct result of the increase in net premiums earned during the same period.
Total revenue for the three months ended June 30, 2011 was $36.5 million, as compared to $32.9 million for the same period in 2010. Net premiums earned were $32.6 million for the three months ended June 30, 2011, as compared to $29.3 million for the same period in 2010. The higher volume of earned premiums of $3.3 million was largely from our marketing efforts and new homeowners insurance products, as well as a decrease in the cost of catastrophic reinsurance. Net investment income increased to $2.2 million for the three months ended June 30, 2011, as compared to $1.9 million for the same period in 2010, primarily due to higher yields on NLASCO cash and investment balances in 2011. Net realized gains on investments were $12,000 in the three months ended June 30, 2010, compared to a net realized loss of $51,000 for the same period in 2010. Other income was $1.7 million for the three months ended June 30, 2011, as compared to $1.8 million for the same period in 2010.
Total expenses for the quarter ended June 30, 2011 were $57.0 million as compared to $36.9 million for the quarter ended June 30, 2010. This increase was primarily due to the loss and LAE for the three months ended June 30, 2011 of $41.1 million, as compared to $20.5 million for the same period in 2010. The increase is primarily a result of wind and hail storms that occurred in 2011 in Texas, which had incurred losses of $14.6 million and fifteen days of widely dispersed, exceptional weather related losses that added $7.1 million in losses.
Total revenue for the three months ended September 30, 2011 was $40.6 million, as compared to $33.9 million for the same period in 2010. Net premiums earned were $34.9 million for the three months ended September 30, 2011, as compared to $30.1 million for 2010. The higher volume of earned premiums of $4.8 million was largely from our marketing efforts and new homeowners insurance products, as well as a decrease in the cost of catastrophic reinsurance of $1.3 million. Net investment income was $3.1 million for the three months ended September 2011, as compared to $2.0 million for the same period in 2010, primarily due to $1.1 million in earnings from the loan transaction with SWS Group, Inc. and higher yields on cash and investment
F-33
Table of Contents
balances in 2011. Net realized gains on investments were $0.8 million in the three months ended September 30, 2011, as compared to $0.1 million for the same period in 2010, primarily due to the sale of held-to-maturity securities in September 2011. Other income was $1.8 million for the three months ended September 30, 2011, as compared to $1.6 million for the same period in 2010.
Total expenses for the quarter ended September 30, 2011 were $41.7 million as compared to $33.0 million for the quarter ended 2010, primarily due to the loss and LAE for the three months ended September 30, 2011 of $23.8 million, as compared to $17.8 million for the same period in 2010. The increase is primarily a result of increased severity of fire losses and development attributable to late reporting of the wind and hail storms that occurred in 2011 in Texas.
Total revenue for the three months ended December 31, 2011 was $40.4 million as compared to $33.3 million for the same period in 2010. The increase is primarily due to increases in net premiums earned of $6.0 million, net investment income of $1.0 million and other income of $0.1 million. The increase in net premiums earned for the three months ended December 31, 2011 as compared to the same period in 2010 is due to higher written premiums of $3.3 million and lower ceded premiums of $2.1 million. Ceded premiums were high in the three months ended December 31, 2010, due to reinstatement premiums paid related to Hurricanes Ike and Dolly and the 2010 Arizona catastrophe.
Total expenses for thefourth quarter ended December 31, 2011 was $32.6 million as compared to $32.5 million2012 include the results from the operations acquired in the PlainsCapital transaction for the quartermonth ended December 31, 2010. This increase is due to an increase in loss and LAE expenses2012. PlainsCapital contributed $8.4 million of $1.5 million, offset by a decrease in policy acquisition and other underwriting expensesnet earnings during the fourth quarter of $1.7 million.2012.
F-34F-58
Table of Contents
Schedule I - Schedule of Investments - Other than Investments in Related Parties
(in thousands)
| | December 31, 2011 | |
| | | | Market | | Balance | |
Type of Investment | | Cost | | Value | | Sheet | |
| | | | | | | |
Fixed maturities: | | | | | | | |
Bonds: | | | | | | | |
Unites States Government and government agencies and authorities | | $ | 10,515 | | $ | 10,910 | | $ | 10,910 | |
States, municipalities and political subdivisions | | 33,396 | | 35,636 | | 35,636 | |
All other | | 91,255 | | 98,255 | | 98,255 | |
Total fixed maturities | | 135,166 | | 144,801 | | 144,801 | |
Equity securities: | | | | | | | |
Banks, trust and insurance companies | | 7,692 | | 10,136 | | 10,136 | |
Industrial, miscellaneous, and all other | | 8,870 | | 8,638 | | 8,638 | |
Preferred Stock | | 251 | | 248 | | 248 | |
Total equity securities | | 16,813 | | 19,022 | | 19,022 | |
Other Investments | | 50,709 | | 60,377 | | 60,377 | |
Total investments | | $ | 202,688 | | $ | 224,200 | | $ | 224,200 | |
F-35
Table of Contents
Schedule IV - Reinsurance
(in thousands)
| | For the | |
| | Year Ended | |
Premiums Earned | | December 31, 2011 | |
| | | |
Gross premiums | | $ | 147,419 | |
Ceded to other companies | | (18,547 | ) |
Assumed from other companies | | 5,176 | |
Net Premiums | | $ | 134,048 | |
| | | |
Percentage of amount assumed to net | | 3.86 | % |
| | For the | |
| | Year Ended | |
Premiums Earned | | December 31, 2010 | |
Gross premiums | | $ | 134,701 | |
Ceded to other companies | | (22,507 | ) |
Assumed from other companies | | 4,998 | |
Net Premiums | | $ | 117,192 | |
| | | |
Percentage of amount assumed to net | | 4.26 | % |
| | For the | |
| | Year Ended | |
Premiums Earned | | December 31, 2009 | |
Gross premiums | | $ | 131,451 | |
Ceded to other companies | | (21,359 | ) |
Assumed from other companies | | 5,061 | |
Net Premiums | | $ | 115,153 | |
| | | |
Percentage of amount assumed to net | | 4.40 | % |
F-36