Table of Contents
UNITED STATES
SECURITIES AND EXCHANGE COMMISSION
Washington, D.C. 20549
FORM 10-K
x ANNUAL REPORT PURSUANT TO SECTION 13 OR 15(d) OF THE SECURITIES EXCHANGE ACT OF 1934
For the fiscal year ended December 31, 20122014
o TRANSITION REPORT PURSUANT TO SECTION 13 or 15(d) OF THE SECURITIES EXCHANGE ACT OF 1934
For the transition period from ________________ to ________________
Commission file number 000-51446


CONSOLIDATED COMMUNICATIONS HOLDINGS, INC.
(Exact name of registrant as specified in its charter)
| Delaware | | 02-0636095 | |
| (State or other jurisdiction | | (I.R.S. Employer | |
| of incorporation or organization) | | Identification No.) | |
| | | | |
| 121 South 17th Street, Mattoon, Illinois | | 61938-3987 | |
| (Address of principal executive offices) | | (Zip Code) | |
Registrant’s telephone number, including area code (217) 235-3311
Securities registered pursuant to Section 12(b) of the Act:
| Title of each class | | Name of each exchange on which registered | |
| Common Stock—$0.01 par value | | The NASDAQ Global Select Market | |
Securities registered pursuant to Section 12(g) of the Act: None
Indicate by check mark if the registrant is a well-known seasoned issuer, as defined in Rule 405 of the Securities Act.
Yes o No x
Indicate by check mark if the registrant is not required to file reports pursuant to Section 13 or Section 15(d) of the Act.
Yes o No x
Indicate by check mark whether the registrant (1) has filed all reports required to be filed by Section 13 or 15(d) of the Securities Exchange Act of 1934 during the preceding 12 months (or for such shorter period that the registrant was required to file such reports), and (2) has been subject to such filing requirements for the past 90 days.
Yes x No o
Indicate by check mark whether the registrant has submitted electronically and posted on its corporate Web site, if any, every Interactive Data File required to be submitted and posted pursuant to Rule 405 of Regulation S-T (§232.405 of this chapter) during the preceding 12 months (or for such shorter period that the registrant was required to submit and post such files).
Yes x No o
Indicate by check mark if disclosure of delinquent filers pursuant to Item 405 of Regulation S-K (§229.405 of this chapter) is not contained herein, and will not be contained, to the best of registrant’s knowledge, in definitive proxy or information statements incorporated by reference in Part III of this Form 10-K or any amendment to this Form 10-K. o
Indicate by check mark whether the registrant is a large accelerated filer, an accelerated filer, a non-accelerated filer, or a small reporting company. See definitions of “large accelerated filer” “accelerated filer” and “smaller reporting company” in Rule 12b-2 of the Exchange Act.
Large accelerated filer ox | Accelerated filer xo | Non-accelerated filer o
(Do not check if a smaller
reporting company) | Smaller reporting companyo |
Indicate by check mark whether the registrant is a shell company (as defined in Rule 12b-2 of the Act).
Yes o No x
As of June 30, 2012,2014, the aggregate market value of the shares held by non-affiliates of the registrant’s common stock was $406,292,900$840,091,914 based on the closing price as reported on the NASDAQ Global Select Market. The market value calculations exclude shares held on the stated date by registrant’s directors and officers on the assumption such shares may be shares owned by affiliates. Exclusion from these public market value calculations does not necessarily conclude affiliate status for any other purpose.
On February 15, 2013,13, 2015, the registrant had 39,877,99850,364,473 shares of Common Stock outstanding.
DOCUMENTS INCORPORATED BY REFERENCE
Portions of the registrant’s Proxy Statement for the 20132015 Annual Meeting of Shareholders are incorporated herein by reference in Part III of this Annual Report on Form 10-K to the extent stated herein. Such proxy statement will be filed with the Securities and Exchange Commission within 120 days of the registrant’s fiscal year ended December 31, 2012.2014.
Table of Contents
PART I
Note About Forward-Looking Statements
The Securities and Exchange Commission (“SEC”) encourages companies to disclose forward-looking information so that investors can better understand a company’s future prospects and make informed investment decisions. Certain statements in this report,Annual Report on Form 10-K, including that which relates to the impact on future revenue sources, and potential sharing obligations of pending and future regulatory orders, continued expansion of the telecommunications network and expected changes in the sources of our revenue and cost structure resulting from our entrance into new communications markets, are forward-looking statements and are made pursuant to the safe harbor provisions of the Securities Litigation Reform Act of 1995. Forward-lookingThese forward-looking statements reflect, among other things, our current expectations, plans, strategies, and anticipated financial results. There are a number of risks, uncertainties, and conditions that may cause our actual results to differ materially from those expressed or implied by these forward-looking statements. Many of these circumstances are beyond our ability to control or predict. Moreover, forward lookingforward-looking statements necessarily involve assumptions on our part. These forward lookingforward-looking statements generally are identified by the words “believe”, “expect”, “anticipate”, “estimate”, “project”, “intend”, “plan”, “should”, “may”, “will”, “would”, “will be”, “will continue” or similar expressions. Such forward lookingforward-looking statements involve known and unknown risks, uncertainties and other factors that may cause actual results, performance or achievements of Consolidated Communications Holdings, Inc. and its subsidiaries (“Consolidated”, the “Company”, “we”, or “our”) to be different from those expressed or implied in the forward-looking statements. All forward-looking statements attributable to us or persons acting on our behalf are expressly qualified in their entirety by the cautionary statements that appear throughout this report. A detailed discussion of these and other risks and uncertainties that could cause actual results and events to differ materially from such forward—forward–looking statements is included in the section entitled “Risk Factors” (refer to Part I - Item 1A). Furthermore, forward-looking statements speak only as of the date they are made. Except as required under the federal securities laws or the rules and regulations of the Securities and Exchange Commission,SEC, we disclaim any intention or obligation to update or revise publicly any forward-looking statements. You should not place undue reliance on forward-looking statements.
Item 1. Business.
Consolidated Communications Holdings, Inc. (the “Company”, “we” or “our”) is a Delaware holding company with operating subsidiaries (collectively “Consolidated”) providing a wide range of communications services to residentialin consumer, commercial, and business customerscarrier channels in California, Illinois, Iowa, Kansas, Minnesota, Missouri, North Dakota, Pennsylvania, South Dakota, Texas, Pennsylvania, California, Kansas and Missouri.Wisconsin. We were founded in 1894 as the Mattoon Telephone Company by the great-grandfather of one of the members of our current Chairman,Board of Directors, Richard A. Lumpkin. After several acquisitions, the Mattoon Telephone Company was incorporated as the Illinois Consolidated Telephone Company (“ICTC”) on April 10, 1924. We were incorporated under the laws of Delaware in 2002, and through our predecessors we have provided telecommunications services for more than a century. Through strategic
In addition to our focus on organic growth on commercial and carrier channels, our acquisitions over the last eight years, wedecade have grown ourachieved business diversified ourgrowth, diversification of revenue and cash flow streams, and created a strong platform for future growth. Our acquisitions strategy includesstrategic approach in evaluating potential transactions include analysis of the market opportunity, the quality of the network, our ability to integrate the acquired company efficiently, and the potential for creating significant operating synergies associated withand a positive cash flow at the inception of each acquisition. TheseThe operating synergies are created through the use of consistent platforms, convergence of processes and functional management of the combined entities. We measure our synergies during the first two years following an acquisition. For example, the acquisition of our Texas properties in 2004 tripled the size of our business and gave us the requisite scale to make systemssystem and platform decisions that would facilitate future acquisitions. For theThe acquisition of our Pennsylvania properties wein 2007 achieved synergies in excess of $12.0 million in annualized savings, which at the time, represented about 20% of their operating expense. We have positioned our business to provide services in both rural and suburban markets with service territories spanning the country.
We offer a wide range of telecommunications services, including local and long-distance service, high-speed broadband Internet access, video services, digital telephone service (“VOIP”), custom calling features, private line services, carrier grade access services, network capacity services over our regional fiber optic networks, directory publishing and Competitive Local Exchange Carrier (“CLEC”) services. We also operate two non-core complementary businesses, prison services and equipment sales. We classify our operations into two reportable business segments: Telephone Operations and Other Operations.
Recent Developments in Our Business during 2012
SureWest Merger
On July 2, 2012, we completed the merger with SureWest Communications (“SureWest”), which resulted in the acquisition of 100% of all the outstanding shares of SureWest for $23.00 per share in a cash and stock transaction. The acquisition of SureWest provides additional diversification of the Company’s revenues and cash flows both geographically and by service type, which offers a platform for future growth and is expected to generate operational and capital cost synergies. SureWest provides a wide range of telecommunications, digital video, Internet, data and other facilities-based communications servicesCommunications in Northern California, primarily2012 achieved synergies totaling $29.5 million in the greater Sacramento region, and in the greater Kansas City, Kansas and Missouri areas. For the year ended December 31, 2011, SureWest reported $248.1 million in total operating revenues. For the six months ended June 30, 2012, SureWest generated $127.9 million in operating revenues. The total purchase price of $550.8 million, consisted of cash and assumed debt of $402.4 million and 9,965,983 shares of the Company’s common stock valued at the Company’s opening stock price on July 2, 2012 of $14.89, which totaled $148.4 million. The cash portion of the merger consideration and the funds required to repay SureWest outstanding debt was financed with the sale of $300.0 million in aggregate principal amount of 10.875% Senior Notes due 2020 (“Senior Notes”). The Company also used cash on hand and approximately $35.0 million in borrowings from its revolving credit facility. Because the acquisition closed on July 2, 2012, the Company’s financial information does not include any of the results of operations from SureWest priortwo years subsequent to the acquisition date. The financial results of SureWest are included in the Telephone Operations segment as of the date of the acquisition.
1
As parta result of the acquisition of SureWest,Enventis in October 2014 as described below, we expect to generate annual operating synergies of approximately $25.0$14.0 million, which will be phased in over the first two years after the closing date as integration projects are completed. Through these acquisitions, we have positioned our business to provide services in rural, suburban, and metropolitan markets, with service territories spanning the country.
We offer an array of integrated communications services to residential and business customers, including: high-speed broadband Internet access, video services, local and long distance service, Voice over Internet Protocol (“VoIP”) and custom calling features. Additionally, services to our business customers also include private line services, carrier grade access, network capacity services over our regional fiber optic networks, directory publishing, and equipment sales.
1
Table of Contents
Recent Business Developments
Enventis Merger
On October 16, 2014, we completed our merger with Enventis Corporation, a Minnesota corporation (“Enventis”), and acquired all the issued and outstanding shares of Enventis in exchange for shares of our common stock. As a result, Enventis became a wholly-owned subsidiary of the Company. Each share of common stock, no par value, of Enventis converted into and became the right to receive 0.7402 shares of common stock, par value of $0.01 per share, of our common stock plus cash in lieu of fractional shares as set forth in the merger agreement. Based on the closing price of our common stock at $25.40 per share on the date preceding the merger, the total value of the purchase consideration exchanged was $257.7 million, excluding $149.9 million paid to extinguish Enventis’ outstanding debt. On the date of the merger, we issued an aggregate total of 10.1 million shares of our common stock to the former Enventis shareholders.
In conjunction with the acquisition, we completed an offering of $200.0 million aggregate principal amount of 6.50% Senior Notes due in 2022 (the “2022 Notes”). The net proceeds from the issuance of the 2022 Notes were used to finance the acquisition of Enventis, including related fees and expenses and for the repayment of the existing indebtedness of Enventis. A portion of the proceeds, together with cash on hand, was also used to repurchase $46.8 million of our 10.875% Senior Notes due 2020 (the “2020 Notes”).
Enventis is an advanced communications provider, which services consumer, commercial and wholesale carrier customer channels primarily in the upper Midwest. The acquisition reflects our strategy to diversify revenue and cash flows amongst multiple products and to expand our network to new markets. The financial results for Enventis have been included in our consolidated financial statements as of the acquisition date. For a more complete discussion of the transaction, refer to Note 3 to the Consolidated Financial Statements.
Discontinued Operations
In September 2013, we completed the sale of the assets and contractual rights used to provide communications services to inmates in thirteen county jails located in Illinois for a total purchase price of $2.5 million. In accordance with the Financial Accounting Standards Board (“FASB”) Accounting Standards Codification (“ASC”) 205-20, “Discontinued Operations”, the financial results of the operations for Prison Services Contracthave been reported as discontinued operations in our consolidated financial statements for the years ended on or before December 31, 2013. For a more complete discussion of the transaction, refer to Note 3 to the Consolidated Financial Statements.
SureWest Merger
We currently provide telephone service to inmates incarcerated at facilities operated bycompleted the Illinois Departmentmerger with SureWest Communications on July 2, 2012. SureWest Communications’ results of Corrections throughoperations are included within our Prison Services business. On June 27, 2012,results following the Illinois Department of Central Management Services announced its intent to replace us as the provider of those services with a competitor. We have challenged our competitor’s bid and the State’s decision to accept that bid in a variety of different forums. Although we will continue to seek legal recourse to the State’s decision, our business plans and projections assume that our contract with the State of Illinois will end during 2013. During 2012, the prison services contract comprised 82% of the operating revenues in our Other Operations segment, 5% of consolidated operating revenues and approximately 2% of consolidated operating income, excluding financing and other transaction fees.acquisition date. For a more detailedcomplete discussion regardingof the legal actions we have taken with regardstransaction, refer to Note 3 to the prison services contract, see Part I – Item 3 – “Legal Proceedings”.Consolidated Financial Statements.
Available Information
Our Annual Reports on Form 10-K, Quarterly Reports on Form 10-Q, Current Reports on Form 8-K and amendments to reports filed or furnished pursuant to Sections 13(a) or 15(d) of the Securities Exchange Act of 1934, as amended, are available free of charge on our web site at www.consolidated.com, as soon as reasonably practicable after we electronically file such material with, or furnish it to, the Securities and Exchange Commission (“SEC”).SEC. Copies are also available free of charge upon request to Consolidated Communications, 121 S. 17th St,Street, Mattoon, IL 61938, Attn: Vice President Investor Relations and Treasurer. Our website also contains copies of our Corporate Governance Guidelines, Code of Business Conduct and Ethics and charter of each committee of our Board of Directors. The information found on our web site is not part of this or any other report we file with or furnish to the SEC. The public may read and copy any materials we file with the SEC at the SEC’s Public Reference Room at 100 F Street, NE.,NE, Washington, DC 20549.20549 on official business days during the hours of 10:00 am to 3:00 pm. The public may obtain information on the operation of the Public Reference Room by calling the SEC at 1-800-SEC-0330. The SEC maintains an Internet site that contains reports, proxy and information statements, and other information regarding our filings at http://www.sec.gov.
2
Table of Contents
Description of Our Business
We derive our revenue principally fromare an integrated communications services company that operates as both an Incumbent Local Exchange Carrier (“ILEC”) and a Competitive Local Exchange Carrier (“CLEC”) dependent upon the saleterritory served. We provide an array of advanced telecommunication services to residentialin consumer, commercial, and business customerscarrier channels in six11 states, including local and long-distance telephone service, high-speed broadband Internet VOIP,access, video services, VoIP, custom calling features, private line services, carrier grade access services, network capacity services over our regional fiber optic networks, data center and telephonemanaged services, directory publishing, equipment sales and cloud services.
We generate the majority of our consolidated operating revenues primarily from subscriptions to our video, data and Internet services (collectively “broadband services”) to residential and business customers. Revenues increased $34.1 million during 2014 compared to 2013, primarily from growth in data, video and Internet connections and the acquisition of Enventis. We expect our broadband services revenue to continue to grow as consumer and commercial demands for data based services increase.
We market services to our residential customers either individually or as a bundled package. Our “triple play” bundle includes our voice, video and data services. Data and Internet connections continue to increase as a result of consumer trends toward increased Internet usage and our enhanced product and service offerings, such as our progressively increasing consumer data speeds. In December 2014, we introduced data speeds of up to 1 Gbps to our fiber-to-the-home customers in our Telephone Operations segment. Kansas market, with other markets to follow in early 2015. Where 1 Gbps speeds are not yet offered, the maximum broadband speed is 100 Mbps, depending on the geographic market availability. As of December 31, 2014, approximately 31% of the homes in the areas we serve subscribe to our data service.
Our exceptional maximum consumer broadband speed allows us to continue to meet the needs of our customers and the demand for higher speed resulting from the growing trend of over-the-top (“OTT”) content viewing. The availability of 1 Gbps data speed also complements our wireless home networking (“Wi-Fi”) that supports our TV Everywhere service, which launched in 2013, and allows our subscribers to watch their favorite programs at home or away on a computer, smartphone or tablet. As of December 31, 2014, our video service was available to approximately 579,000 homes in the markets we serve, with an approximate 21% penetration rate. As of December 31, 2014, we had approximately 123,000 video subscribers, an 11% increase from 2013 primarily as a result of the Enventis acquisition.
We also derive revenues from two complementary non-core businesses, prisontailor our services and equipment sales. Prison services provides local and long-distance telephone service and automated calling service to inmates incarcerated at facilities operated by the Illinois Department of Corrections. Business systems sells and supports telecommunications equipment to business customers in Texasby developing solutions to fit their specific needs, providing services to a wide range of commercial enterprises from sole proprietors and Illinois. Prisonother small businesses to multi-location corporations and telecommunications carriers. Our business suite of services include local and long distance calling plans, hosted voice services using cloud network servers, the added capacity for multiple phone lines, scalable broadband Internet, online back-up and business systems are included in our Other Operations segment.directory listings.
Our Telephone Operations segment generatesFor larger businesses, we offer data services including dedicated Internet access through our Metro Ethernet network. Wide Area Network (“WAN”) products include point-to-point and multi-point deployments from 2.5 Mbps to 10 Gbps, accommodating the substantial majoritygrowth patterns of our revenuebusiness customers. Our data centers provide redundant, scalable bandwidth over a self-healing fiber-optic backbone that is protected by uninterrupted power supplies and operating incomegenerator back-ups with direct connection to broadband. We also offer wholesale services to regional and substantially all of our cash flow from operations. In 2012, the Telephone Operations segment generated 94% of our consolidated revenuenational interexchange and substantially all of our operating income before depreciationwireless carriers, including cellular backhaul and amortization.other fiber transport solutions.
A summary of net operating revenues, operating income, total assets and capital expenditures for each of the business segments can be found in Note 13 in the Notes to Consolidated Financial Statements, in Item 8, which is incorporated herein by reference. A discussion of factors potentially affecting our operations is set forth in Part I - Item 1A in “Risk Factors” in Item 1A,, which is incorporated herein by reference.
23
Table of Contents
Key Operating Statistics
| | As of December 31, | |
| | 2014 | | 2013 | | 2012 | |
ILEC access lines | | | | | | | |
Residential | | 151,359 | | 147,247 | | 153,855 | |
Business | | 118,149 | | 109,558 | | 114,742 | |
Total | | 269,508 | | 256,805 | | 268,597 | |
| | | | | | | |
Voice connections (1) | | | | | | | |
Residential | | 72,145 | | 73,219 | | 78,811 | |
Business | | 95,309 | | 50,214 | | 50,918 | |
Total | | 167,454 | | 123,433 | | 129,729 | |
| | | | | | | |
Data and Internet connections (2) | | 289,658 | | 255,231 | | 247,633 | |
Video connections (2) | | 122,832 | | 110,621 | | 106,137 | |
Total connections | | 849,452 | | 746,090 | | 752,096 | |
(1)Voice connections include voice lines outside the ILEC service areas and Voice-over-IP inside the ILEC service areas.
(2)These connections include both residential and business (excluding SureWest business metrics) for services both inside and outside the ILEC service areas.
The comparability of our consolidated results of operations and key operating statistics was impacted by the Enventis and SureWest acquisitions that closed on October 16, 2014 and July 2, 2012, respectively, as described above. Enventis and SureWest’s results are included in our consolidated financial statements as of the respective dates of the acquisitions. These acquisitions provide additional diversification of the Company’s revenues and cash flows both geographically and by service type.
Sources of Revenue
The following table summarizes our sources of revenue for each of our two business segments for the last three fiscal years:
| | 2012 | | 2011 | | 2010 | | | 2014 | | 2013 | | 2012 | |
(In millions, except for percentages) | | $ | | % of
Revenues | | $ | | % of
Revenues | | $ | | % of
Revenues | | | $ | | % of
Revenues | | $ | | % of
Revenues | | $ | | % of
Revenues | |
Telephone operations: | | | | | | | | | | | | | | |
Local calling services | | 93.5 | | 18.6 | | 84.2 | | 22.5 | | 91.0 | | 23.7 | | | $ | 108.3 | | 17.0 | % | $ | 106.5 | | 17.7 | % | $ | 93.5 | | 19.6 | % |
Network access services | | 98.6 | | 19.6 | | 80.5 | | 21.5 | | 81.7 | | 21.3 | | | 106.3 | | 16.7 | | 112.4 | | 18.7 | | 98.6 | | 20.6 | |
Video, Data and Internet services | | | 287.5 | | 45.2 | | 270.0 | | 44.9 | | 176.7 | | 37.0 | |
Subsidies | | 49.3 | | 9.8 | | 45.4 | | 12.1 | | 48.7 | | 12.7 | | | 53.2 | | 8.4 | | 52.0 | | 8.6 | | 49.3 | | 10.3 | |
Long-distance services | | 17.3 | | 3.4 | | 15.9 | | 4.2 | | 18.0 | | 4.7 | | | 19.6 | | 3.1 | | 19.3 | | 3.2 | | 17.3 | | 3.6 | |
Video, data and Internet services | | 176.7 | | 35.1 | | 83.0 | | 22.2 | | 76.1 | | 19.8 | | |
Other services | | 36.7 | | 7.3 | | 33.6 | | 9.0 | | 34.1 | | 8.9 | | | 60.8 | | 9.6 | | 41.4 | | 6.9 | | 42.5 | | 8.9 | |
Total telephone operations | | 472.1 | | 93.8 | | 342.6 | | 91.5 | | 349.6 | | 91.2 | | |
Other operations | | 31.4 | | 6.2 | | 31.7 | | 8.5 | | 33.8 | | 8.8 | | |
Total operating revenue | | 503.5 | | 100.0 | | 374.3 | | 100.0 | | 383.4 | | 100.0 | | | $ | 635.7 | | 100.0 | % | $ | 601.6 | | 100.0 | % | $ | 477.9 | | 100.0 | % |
All telecommunications providers continue to face increased competition as a result of technology changes and industry legislative and regulatory developments. In recent years, changes in the legislative and regulatory environmentconsumer demand and our recent acquisitionacquisitions of SureWest and Enventis have provided us with significant growth opportunities for our video, data and Internetbroadband services. As indicated by the table above, the percentage of operating revenues we receive from our video, data and Internet services has nearly doubledhave grown by more than 60% since 2010.2012, and currently represent over 45% of our total operating revenue. We anticipate that video, data and Internet revenuesrevenue will continue to increase as a total percentage of operating revenues, and offset the anticipated decline in traditional telephone services which continue to be impacted by the ongoing industry-wide declinereduction in residential access lines.
Telephone Operations
The following table provides the key operating statistics of our Telephone Operations segment as of December 31, 2012:
| | 2012 | | 2011 | | 2010 | |
ILEC access lines | | | | | | | |
Residential | | 153,855 | | 137,179 | | 140,660 | |
Business | | 114,742 | | 90,813 | | 96,481 | |
Total | | 268,597 | | 227,992 | | 237,141 | |
| | | | | | | |
Voice connections (1) | | | | | | | |
Residential | | 78,811 | | 2,388 | | 2,957 | |
Business | | 50,918 | | 52,424 | | 53,671 | |
Total | | 129,729 | | 54,812 | | 56,628 | |
| | | | | | | |
Data and internet connections (2) | | 247,633 | | 134,129 | | 125,678 | |
Video connections (2) | | 106,137 | | 34,356 | | 29,236 | |
Total connections | | 752,096 | | 451,289 | | 448,683 | |
(1)Voice connections include voice lines outside the Incumbent Local Exchange Carrier (“ILEC”) service areas and Voice-over-IP inside the ILEC service areas.
(2)These connections include both residential and business (excluding SureWest business metrics) for services both inside and outside the ILEC service areas.
Local calling services
Local calling services to both our residential and business customers include traditional wireline telephone service and other basic services. Our service plans include options for voicemail and other enhanced custom calling features including caller ID, call forwarding and call waiting. Our Centrex option for business customers can link multiple office locations allowing customers to call other offices within their business group without incurring usage charges. Services arecan be charged at a fixed monthly rate, a measured rate or can be bundled with selected services at a discounted rate.
34
We offer private lines that provide direct connections between two or more local locations at flat monthly rates. We provide a hosted VOIP package, which utilizes a soft switch and allows the customer the flexibilityTable of utilizing new telephone technology and features without investing in a new telephone system. The package bundles local service, calling features, Internet protocol (“IP”) business telephones and unified messaging, which integrates multiple messaging technologies into a single system, which allows the customer to receive and listen to voice messages through email.Contents
Network access services
Network access service revenues include interstate and intrastate switched access revenue and network special access services. Revenue from network access charges are received from long-distance and other carriers for customer’scustomers originating or terminating calls from/to our local exchanges. These services allow customers to make or receive calls in our service area. Our long-distance customers typically pay a monthly flat-rate fee for this service. In addition, other carriers pay network access charges for their originating or terminating calls within our service areas. These charges also apply to private lines that connect a customer in one of our service areas to a location outside of our service areas. Through these dedicated lines customers can transmit data and access external data networks.
We also provide, under contract, cell site backhaul services to wireless carriers. The demand for backhaul services continues to grow as wireless carriers are faced with escalating consumer and businesscommercial demands for wireless data. Certain of our network access revenues are based on rates set or approved by federal and state regulatory commissions or as directed by law that are subject to change at any time.
Subsidies
Subsidies consist of federal and state subsidies designed to promote widely available, quality telephone service at affordable prices in rural areas. Subsidies come from pools to which we and other telecommunications providers, including local, long-distance and wireless carriers, contribute on a monthly basis. Subsidies are allocated and distributed to participating carriers monthly based upon their respective costs for providing local service. Like access charges, subsidies are regulated by federal and state regulatory commissions. See Part I – Item 1 – “Regulatory Environment” below and Item 1A – “Risk Factors – Regulatory Risks”.
Long-distance services
Long-distance services include traditional domestic and international long distance which enables customers to make calls that terminate outside their local calling area. These services also include calling cards, toll free calls and conference calling. We offer a variety of long-distance plans, including unlimited flat-rate calling plans and offer a combination of subscription and usage fees.
Video, Data and Internet services
Video, data and Internet services include revenue from residential and business customers for subscriptions to our video and data products. Our dataconsumer Internet service can provide high-speed Internetprovides high speed access at various symmetrical speeds of up to 50 megabits per second (“Mbps”), depending on the nature of the network facilities that are available, the level of service selected and the geographic market availability. In our Kansas market, our maximum consumer Internet speed is 1 Gbps, with several other markets upgrading from their current 100 Mbps in early 2015, which will be instrumental in meeting current and future consumer needs of increasing WiFi connected devices and OTT content viewing.
Our digital phone and VoIP service is also available in certain markets as an alternative to the traditional telephone line. For our residential customers, we offer multiple voice service plans that provide for either usage based or unlimited calling plans, including options for long distance, voice mail and calling features such as caller ID, find me/follow me, call blocking, multiple directory numbers and conferencing.
We provide a hosted VoIP package for our business customers that utilizes our soft switching technology and enables our customers to have the flexibility of employing new telephone advances and features without investing in a new telephone system. The package bundles local service, calling features, Internet protocol (“IP”) business telephones and unified messaging, which integrates multiple messaging technologies into a single system and allows the customer to receive and listen to voice messages through email.
We also offer a variety of commercial data connectivity services in select markets to both small and large businesses, including private lines and Ethernet services capable of connecting multiple connections over our copper and fiber-based networks, virtual hosting, services, Wi-Ficolocation and collocationcloud services.
Depending on geographic market availability, our video services range from limited basic service to advanced digital television which includeswith several plansplan options, each with hundreds of local, national and music channels including premium and pay-per-view channels as well as video on demand service. Certain subscribersconsumers may also subscribe to our advanced video services, which consist of high-definition television, digital video recorders (“DVR”) and/or a whole home DVR. Our Whole Home DVR allows customers the ability to watch recorded shows on any television in the house, record multiple shows at one time and utilize an intuitive on-screen guide and user interface.
Our digital phone service, including VOIP, is also available in certain markets as an alternative to the traditional telephone line. We offer multiple voice service plans that provide for either usage based or unlimited calling plans, including options for long distance, voice mail and other calling features such as caller ID, call forwarding, call blocking, abbreviated dialing and conferencing.
4
Although we expect our revenues from video, data and Internetour broadband services to grow substantially, these products typically generate lower margins than our traditional wireline business. As a result, as we replace traditional wireline revenue with revenue from video, data and Internet services, our margins may decline.
Subsidies
We receive federal and state subsidies which are designed to promote widely available, quality telephone service at affordable prices in rural areas. Subsidies are funded by end user surcharges to which telecommunications providers, including local, long-distance and wireless carriers, contribute on a monthly basis. Subsidies are allocated and distributed to participating carriers monthly based upon their respective costs for providing local service. Similar to access charges, subsidies are regulated by federal and state regulatory commissions. See Part I – Item 1 - “Regulatory Environment” below and Item 1A – “Risk Factors – Risks Related to the Regulation of Our Business” for additional information regarding the subsidies we receive.
5
Table of Contents
Long-distance services
Long-distance services include traditional domestic and international long distance which enables customers to make calls that terminate outside their local calling area. These services also include toll free calls and conference calling. We offer a variety of long-distance plans, including unlimited flat-rate calling plans and offer a combination of subscription and usage fees.
Other services
Other services include revenues from telephone directory publishing, wholesale transport services on our fiber-optic network in Texas, billing and collection services, inside wiring service and maintenance.maintenance and equipment sales (“Business Systems”).
Other Operations
The Other Operations segment consists of two complementary non-core businesses:
·Prison Services provides localWe sell and long-distance servicessupport telecommunications equipment to medium and automated calling services for correctional facilities. In 2012, we lost our bid on continuing to provide service to the state of Illinois correctional facilities. We are continuing to determine if a legal recourse to the decision and selection of another provider is available. However, we believe that it is likely that, by the end of 2013, we will no longer be providing these services in Illinois.
·Business Systems sells and supports telecommunications equipment,large business customers, such as key, private branch exchange (“PBX”) and, IP-based telephone systems, to business customers.and other sophisticated hardware solutions. We are an Avaya and ShoreTel distributor.distributor, and through our acquisition of Enventis in 2014, we have a leading market relationship with Cisco Systems, Inc. and are an accredited Master Level Unified Communications and Gold Certified Cisco Partner. Our strategic relationship with Cisco (as the supplier) allows us to deploy a wide range of collaboration, data center and network technology solutions. We recently earned Cisco’s Master Cloud Builder Specialization and received the Data Center Interconnect designation. We maintain numerous Cisco specializations and authorizations as well as partner relationships with EMC, NetApp, VMware and other industry-leading vendors in order to provide integrated communication solutions that best fit our customers’ needs.
Prior to 2010, our Other Operations segment also included Market Response (telemarketing and order fulfillment) (“CMR”) and Operator Services. We sold both our CMR and Operator Services businesses during 2010.
Wireless partnerships
In addition to our core business, we also derive a significant portion of our cash flow and earnings from investments in five wireless partnerships. Wireless partnership investment income is included as a component of other income in the consolidated statements of income. Our wireless partnership investment consistedconsists of five cellular partnerships: GTE Mobilnet of South Texas, GTE Mobilnet of Texas RSA #17, Pittsburgh SMSA, Pennsylvania RSA 6(I) and Pennsylvania RSA 6(II).
We own 2.34% of GTE Mobilnet of South Texas Limited Partnership (“Mobilnet South Partnership”)., GTE Mobilnet of Texas #17 Limited Partnership, Pittsburgh SMSA, Pennsylvania RSA No. 6(I) Limited Partnership and Pennsylvania RSA No. 6(II) Limited Partnership.
We own 2.34% of the Mobilnet South Partnership. The principal activity of the Mobilnet South Partnership is providing cellular service in the Houston, Galveston and Beaumont, Texas metropolitan areas. Because we have a minor ownership interest and cannot influence operations, we account for this investment using the cost basis.method. Income is recognized only upon cash distributions of our proportionate earnings in the partnership.
We own 20.51% of GTE Mobilnet of Texas RSA #17 Limited Partnership, which serves areas in and around Conroe, Texas. In December 2012, we purchased additional ownership interest for $6.7 million which increased our ownership from 17.02% to 20.51%. Because we have some influence over the operating and financial policies of this partnership, we account for the investment under the equity method, recognizing income on our proportionate share of earnings. Cash distributions are recorded as a reduction in our investment.
San Antonio MTA, L.P., a wholly owned partnership of Cellco Partnership (doing business as Verizon Wireless), is the general partner for both GTEthe Mobilnet of South TexasPartnership and GTE Mobilnet of Texas RSA #17.#17 Limited Partnership.
We own 3.6%3.60% of Pittsburgh SMSA, 16.6725%16.67% of Pennsylvania RSA No. 6(I) and 23.67% of Pennsylvania RSA No. 6(II) wireless limited partnerships, all of which are majority owned and operated by Verizon Wireless. These partnerships cover territories that almost entirely overlap the markets served by our Pennsylvania ILEC and CLEC operations. Because of our limited influence over Pittsburgh SMSA, we account for the investment using the cost basis.method. The Pennsylvania RSA 6(I) and RSA 6(II) partnerships are accounted for under the equity method.
For the years ended December 31, 2012, 20112014, 2013 and 2010,2012, we recognized income of $30.2$34.4 million, $27.1$37.5 million and $27.4$30.2 million, respectively, and received cash distributions of $29.1$34.6 million, $28.3$34.8 million and $27.3$29.1 million, respectively, from these wireless partnerships.
6
Table of Contents
Employees
At December 31, 2012,2014, we employed approximately 1,6321,960 employees, including part-time employees. We also use temporary employees in the normal course of our business. As of December 31, 2012 we had an approximate 71% increase in the number of employees compared to December 31, 2011 which was primarily the result of the acquisition of SureWest in 2012.
5
Approximately 28%27% of our employees were covered by collective bargaining agreements as of December 31, 2012. We have approximately 184 employees covered under a collective bargaining agreement with the International Brotherhood of Electrical Workers (“IBEW”) that have been working without a contract since November 2012. Employees continue to work without a contract and we remain in contract negotiations with the IBEW.2014. For a more detailed discussion regarding how the collective bargaining agreements could affect our business, see Part I –- Item 1A – “Risk Factors – Risks Relating to Our Business”.
Customers and Markets
We operate as the ILECOur services are available to customers in foureleven states: Illinois, Texas, Pennsylvania, California, Kansas, Missouri, Minnesota, North Dakota, Iowa, South Dakota and California. We also operate as CLECs in each of these markets as well as Kansas and Missouri.Wisconsin. The geographic areas we serve are characterized by a balanced mix of growing suburban areas and stable, rural territories. The acquisition of SureWestEnventis in 20122014 further diversifies our operating revenues and cash flows across multiple business lines and markets.
Our Illinois local telephone markets consist of 35 geographically contiguous exchanges serving predominantly small towns and rural areas. We cover an area of 2,681 square miles, primarily in five central Illinois counties: Coles, Christian, Montgomery, Effingham and Shelby. As of December 31, 2012,2014, we had total connections of 102,870,104,552, which included 58,57953,757 local access lines (averaging 21.820.1 lines per square mile). Approximately 60.1%63.0% of our Illinois local access lines serve residential customers, with the remainder serving business customers. Our Illinois business customers are predominantly small retail, commercial, light manufacturing and service industry businesses, as well as universities and hospitals.
Our 21 exchanges in Texas serve three principal geographic markets—Lufkin, Conroe and Katy—in a 2,054 square mile area. This territory comprises 25% of our total connections and had 116,961107,591 local access lines (averaging 56.952.4 lines per square mile) and 74,264 data connections as of December 31, 2012.2014. Approximately 66.3%66.4% of our Texas local access lines serve residential customers, with the remainder serving business customers. Our Texas business customers predominately operate in the manufacturing and retail industries; our largest business customers are hospitals, local governments and school districts.
The Lufkin In 2014, we expanded our commercial services into the greater Dallas/Fort Worth market is centered primarily in Angelina County in east Texas, approximately 120 miles northeast of Houston, and extends into three neighboring counties. The Conroe market is located primarily in Montgomery County and is centered approximately 40 miles north of Houston. Parts of the Conroe operating territory extend south to within 28utilizing our existing 30,000 miles of downtown Houston,carrier-class fiber network in this area. This network previously was used to serve our wholesale and carrier customers. In 2014, we began offering fiber based services including parts of the affluent suburb of The Woodlands. The Katy market is locateddedicated Internet access, wide area networks and hosted iPBX to commercial customers in parts of Fort Bend, Harris, Waller and Brazoria Counties and is centered approximately 30 miles west of downtown Houston along the busy and expanding I-10 corridor. Most of the Katy market is considered part of metropolitan Houston.
Our Lufkin, Texas and central Illinois markets have experienced only nominal population growth over the past decade. These low growth, low customer density markets, along with the predominantly rural residential character of these areas, have limited the number of, and product offerings, from potential competitors in these areas. The Conroe and Katy markets have experienced above-average population and business employment growth over the past decade as compared to the remainder of Texas and the United States as a whole.this market.
The Pennsylvania ILEC territory consists of nine exchanges and covers 285 square miles, serving portions of Allegheny, Armstrong, Butler and WestmorlandWestmoreland Counties in western Pennsylvania. The southernmost point of the ILEC territory is 12 miles north of the city of Pittsburgh. As of December 31, 2012,2014, we had 46,49840,876 local access lines in this territory (averaging 163.2143.4 lines per square mile). The local access lines in this territory consist of approximately 53.2%56.7% business customers and 46.8%43.3% residential customers. The CLEC operations expand south to serve the city of Pittsburgh and north to serve the city of Butler and surrounding areas. Our Pennsylvania territory has benefited from favorable market demographics and growth in suburban communities. Business customers consist primarily of small to mid-sized businesses, educational institutions, and healthcare facilities.
Our California ILEC territory consists of approximately 83 square miles, covering Roseville and Citrus Heights, California and adjacent areas in Placer and Sacramento Counties. As of December 31, 2012,2014, we had 46,55938,484 local access lines (averaging 561.0463.7 lines per square mile), of which 58.5%63.6% consisted of business customers and 41.5%36.4% residential customers. This territory also included 63,645 data connections and 29,769 video connections at December 31, 2014. Our CLEC operations expand both north and south to serve primarily the greater Sacramento region. The California territory has experienced rapid growth during the past two decades, but the pace of growth has slowed in recent years as the area has become more developed. The rapid growth also attracted new competitors to the area. In this market, our business customers primarily include financial institutions, healthcare, manufacturing, local governments and school districts.
6
We also serve as a competitive provider to residential and business customers in the greater Kansas City, Kansas and Missouri areas. A significant portion of the market area is in Johnson County, Kansas, which includes the cities of Lenexa, Overland Park and Shawnee. The Kansas City market has favorable market demographics and has experienced growth in its metropolitan and suburban communities in recent years which has resulted in tremendous business opportunities in this market. Johnson County has the highest median household income and highest per-capita income in Kansas and is among the most affluent in the United States. Business customers consist primarily of small to medium sized businesses and local government entities. As of December 31, 2012,2014, the Kansas City territory had 113,737102,283 voice, video and data connections, or 15%12% of the Company’s total connections.
Our newly acquired operations in the upper mid-west include a fiber network spanning 4,200 fiber route miles with facilities-based operations in Minnesota and into Iowa, North Dakota, South Dakota and Wisconsin. The three ILEC territories in this region consist of 23 exchanges in south central Minnesota, specifically Mankato, Minnesota and surrounding communities as well as rural communities in northwest Iowa. We also provide competitive services in the regions of northern Minnesota and the Minneapolis-Saint Paul metropolitan area, southern Minnesota, Des Moines, Iowa and Fargo, North Dakota. Our extensive metro fiber optic rings directly connects our network to a wide range of customers, which include interexchange carriers, wireless carriers, enterprise and commercial retail customers and customers in the healthcare, government and education industries. At December 31, 2014, we had 116,856 connections in this territory.
7
Table of Contents
Sales and Marketing
The key components of our overall marketing strategy include:
·Organizing our sales and marketing activities around our consumer, enterprise and carrier customers; ·Positioning ourselves as a single point of contact for our customers’ communications needs; ·Providing customers with a broad array of voice, data and video services and bundling these services whenever possible; ·Identifying and broadening our commercial customer needs by developing solutions and providing integrated service offerings; ·Providing excellent customer service, including 24/7 centralized customer support to coordinate installation of new services, repair and maintenance functions; ·Developing and delivering new services to meet evolving customer needs and market demands; and ·Leveraging history and brand recognition across all market areas. | ·
| Organizing our sales and marketing activities around our consumer, enterprise, and carrier customers;
|
| | |
| ·
| Positioning ourselves as a single point of contact for our customers’ communications needs;
|
| | |
| ·
| Providing customers with a broad array of voice, data and video services and bundling these services whenever possible;
|
| | |
| ·
| Providing excellent customer service, including 24/7 centralized customer support to coordinate installation of new services, repair and maintenance functions;
|
| | |
| ·
| Developing and delivering new services to meet evolving customer needs and market demands; and
|
| | |
| ·
| Leveraging history and brand recognition across all market areas.
|
We currently offer our services through call centers, our website, communication centers and commissioned sales representatives. Our customer service call centers and dedicated sales teams serve as the primary sales channels for consumer, business enterprise customers and carrier services. Our sales efforts are supported by direct mail, bill inserts, newspaper, radio and television advertising, public relations activities, community events and website promotions.
We market our services both individually and as bundled services, including our triple-play offering of voice, data and video services. By bundling our service offerings, we are able to offer and sell a more complete and competitive package of services, which we believe simultaneously increases our average revenue per user (“ARPU”) and adds value for the consumer. We also believe that bundling leads to increased customer loyalty and retention.
Network Architecture and Technology
We have made significant investments in our technologically advanced telecommunications networks.networks and continue to enhance and expand our network by deploying technologies to provide additional capacity to our customers. As a result, we are able to deliver high-quality, reliable data, video data and voice services in allthe markets we serve. Our wide-ranging network and extensive use of fiber provide an easy reach into existing and new areas. By bringing the fiber network closer to the customer premises, we can increase our service offerings, quality and bandwidth services. Our existing network enables us to efficiently respond and adapt to changes in technology and is capable of supporting the rising customer demand for bandwidth in order to support the growing amount of wireless data devices in the home.
Our networks are supported by advanced 100% digital switches, with a fiber network connecting in all but one of our exchanges. These switches provide all of our local telephone customers with access to custom calling features, value-added services and dial-up Internet access. We continue to enhance our copper network to increase bandwidth in order to provide additional products and services to our marketable homes. In addition to our copper plant enhancements, we have deployed fiber-optic cable extensively throughout our network, resulting in a 100% fiber backbone network that supports all of the inter-office and host-remote links, as well as the majority of business parks within our ILEC and CLEC service areas. In addition, this fiber infrastructure provides the connectivity required to provide video service, Internet and long-distance services to all Consolidated residential and enterprise customers. Our fiber network utilizes fiber-to-the-home (“FTTH”) and fiber-to-the-node (“FTTN”) networks to offer bundled residential and commercial services.
As a result of our advanced networks, we provide data and video service in the markets we serve. We leverage our high definition head-end equipment to distribute content across our network allowing the Company to better manage costs of future channel additions and upgrades. As of December 31, 2012, video service was available to
7
approximately 524,019 homes in our markets up from 508,366 at December 31, 2011, which includes SureWest markets. Our video subscriber base continues to grow and now totals 106,137 connections at December 31, 2012 as compared to 100,753 at December 31, 2011, which includes the SureWest subscribers. We do not anticipate having to make any material capital upgrades to our network infrastructure in connection with the continued growth of our video product except for providing set-top boxes to future subscribers and additional high definition channel equipment. Our network provides 100% of our video marketable homes with bandwidth of at least 17 Mbps and approximately 56% with above 50 Mbps of bandwidth.
In our CLEC markets, we operate fiber networks which we own or have entered into long-term leases for fiber network access. Our CLEC’s operate approximately 3,0007,200 route-miles of fiber, which includes approximately 4,200 miles of fiber network in Minnesota and surrounding areas, 2,000 miles of fiber network in Texas, approximately 600 route-miles of fiber-optic facilities in the Pittsburgh metropolitan area, approximately 350 route-miles of fiber optic facilities in California that cover large parts of the greater Sacramento metropolitan area and over 60 route-miles of fiber optic facilities in Kansas City that service the greater Kansas City area including both Kansas and
8
Table of Contents
Missouri. Our CLEC operations provide both residential and commercial services. Residential service includes VOIP,VoIP, data and video service. For commercial services, we sell competitive wholesale capacity on our fiber network to other carriers, wireless providers, CLECs and large commercial customers. We also provide carrier hotel space and data center space in the various markets we serve.
In all the markets we serve, we have launched initiatives to support fiber backhaul services to cell sites. As of December 31, 2012,2014, we had 694879 cell sites under contract with 488803 connected and 20676 scheduled for completion in 2013.2015.
Business Strategies
Diversify revenues and increase revenues per customer
We continue to transform our business and diversify our revenue streams as we adapt to changes in the regulatory environment and advances in technology. As a result of acquisitions, our wireless partnerships and increases in the consumer and commercial demand for data services, we continue to reduce our reliance on subsidies and access revenue. Utilizing our existing network and strategic network expansion initiatives, we are able to acquire and serve a more diversified business customer base and create new long-term revenue streams such as wireless carrier backhaul services. We will continue to focus on growing our broadband and commercial services through the expansion and extension of our fiber network to communities and corridors near our primary fiber routes where we believe we can offer competitive services and increase market share.
We also continue to focus on increasing our revenue per customer, primarily by improving our data and video market penetration, by increasing the sale of other value-added services and by encouraging customers to subscribe to our service bundles.
Improve operating efficiency
We continue to seek to improve operating efficiency through technology, better practices and procedures and through cost containment measures. Our current focus is on the integration of SureWestEnventis into our existing operations and creating operating synergies for the combined company. In recent years, we have made significant operational improvements in our business through the centralization of work groups, processes and systems, which has resulted in significant cost savings and reductions in headcount. Because of these efficiencies, we are better able to deliver a consistent customer experience, service our customers in a more cost-effective manner and lower our cost structure. We continue to evaluate our operations in order to align our cost structure with operating revenues while continuing to launch new products and improve the overall customer experience.
Maintain capital expenditure discipline
Across all of our service territories, we have successfully managed capital expenditures to optimize returns through disciplined planning and targeted investment of capital. For example, investments in our networks allows significant flexibility to expand our commercial footprint, offer new service offerings and provide services in a cost-efficient manner while maintaining our reputation as a high-quality service provider. We will continue to invest in strategic growth initiatives to expand our fiber network to new markets and customers in order to optimize new business, backhaul and wholesale opportunities.
Pursue selective acquisitions
We have in the past taken, and expect to continue to take in the future, a disciplined approach in pursuing company acquisitions. When we evaluate potential transactions, important factorfactors include:
· The market;
· The quality of the network;
8
· The ability to integrate the acquired company efficiently;
· Significant potential operating synergies exist; and
· The transaction will be cash flow accretive from day one.
We believe all of the above criteria were met in connection with our acquisition of SureWest CommunicationsEnventis in 2012.2014. In the long term, we believe that this transaction gives us additional scale and better positions us financially, strategically and competitively to pursue additional acquisitions.
9
Table of Contents
Competition
The telecommunications industry is subject to extensive competition, andwhich has increased significantly in recent years. Technological advances have expanded the types and uses of services and products available. In addition, differences in the regulatory environment applicable to comparable alternative services have lowered costs for these competitors. As a result, we face heightened competition but also have new opportunities to grow our broadband business. Our competitors vary by market and may include other incumbent and competitive local telephone companies,companies; cable operators offering video, data and VOIP products,VoIP products; wireless carriers,carriers; long distance providers,providers; satellite companies,companies; Internet service providers and in some cases by new forms of providers who are able to offer a broad range of competitive services through software applications, requiring a small initial investment.services. We expect competition to remain a significant factor affecting our operating results and that the nature and extent of that competition will continue to increase. See Part I - Item 1A – “Risk Factors – Risks Relating to Our Business”.
Voice, data and video service
In recent years, competition in our incumbent service areas has increased significantly. Except for the traditional multichannel video delivery business, which requires significant capital investment to serve customers, the barriers to entry are not high and technology changes force rapid competitive adjustments. WeDepending on the market area, we compete against AT&T and a number of other carriers, as well as Comcast, Time Warner, Mediacom, Armstrong, Suddenlink and NewWave communications, in both the businesscommercial and residentialconsumer markets. Google also recently launched data and video services in a limited, but growing, number of service areas including the Kansas City market. Our competitors offer traditional telecommunications services as well as IP-based services and other emerging data-based services. Our competitors continue to add features and adopt aggressive pricing and packaging for services comparable to the services we offer.
We continue to face significant competition from wireless and other fiber data providers as the demand for substitute communication services, such as wireless phones and data devices, continues to increase. Customers are increasingly foregoing traditional telephone services and land-based Internet service and relying exclusively on wireless service. In addition, the expanded availability for free or lower cost services, such as video over the Internet, and complimentary Wi-Fi service in an increasing number of commercial venuesand other streaming devices has increased competition among other providers including online digital distributors for our video and data services.
In most cases, we have entered the cable television service markets as the operator of a second (or subsequent) cable system. Therefore, we face the challenge of drawing customers away from the incumbent cable service provider. Similarly, the possession of comparatively greater size and scale can give an incumbent cable competitor an advantage in both access to and pricing of the program content needed to operate a cable television business. Our competitors, in some cases, possess significantly greater size and scale than we do.
In order to meet the competition, we have responded in part by introducing new services and service bundles, offering services in convenient groupings with package discounts and billing advantages, providing excellent customer service and by continuing to invest in our network and business operations.
In our rural markets, services are more costly to provide than service in urban areas as a lower customer density necessitates higher capital expenditures on a per-customer basis. As a result, it generally is not economically viable for new entrants to overlap existing networks in rural territories. Despite the barriers to entry, rural telephone companies still face significant competition from wireless providers, cableand video providers and, to a lesser extent, competitive telephone companies.
Other competition
Our other lines of business are subject to substantial competition from local, regional and national competitors. In particular, our directory publishingwholesale and transport businesses operate inbusiness serves other interexchange carriers and we compete with a variety of service providers including incumbent and competitive markets. local telephone companies and other fiber data companies. For our business systems products, we compete with other equipment providers or value added resellers, network providers, incumbent and competitive local telephone companies and data hosting service providers.
We expect that competition in all of our businesses will continue to intensify as new technologies and new services are offered.changes in consumer behavior continue to emerge.
9
Regulatory Environment
The following summary does not describe all existing and proposed legislation and regulations affecting the telecommunications industry. Regulation can change rapidly, and ongoing proceedings and hearings could alter the manner in which the telecommunications industry operates. We cannot predict the outcome of any of these developments, nor their potential impact on us. See Part I —Item 1A—“Risk Factors—Regulatory Risks”Risks Related to the Regulation of Our Business”.
10
Table of Contents
Overview
The telecommunications industry is subject to extensive federal, state and local regulation. Under the Telecommunications Act of 1996 (“Telecommunications(the “Telecommunications Act”), federal and state regulators share responsibility for implementing and enforcing statutes and regulations designed to encourage competition and to preserve and advance widely available, quality telephone service at affordable prices.
At the federal level, the Federal Communications Commission (“FCC”) generally exercises jurisdiction over facilities and services of local exchange carriers, such as our rural telephone companies, to the extent they are used to provide, originate or terminate interstate or international communications. The FCC has the authority to condition, modify, cancel, terminate or revoke our operating authority for failure to comply with applicable federal laws or FCC rules, regulations and policies. Fines or penalties also may be imposed for any of these violations.
State regulatory commissions generally exercise jurisdiction over carriers’ facilities and services to the extent they are used to provide, originate or terminate intrastate communications. In particular, state regulatory agencies have substantial oversight over interconnection and network access by competitors of our rural telephone companies. In addition, municipalities and other local government agencies regulate the public rights-of-way necessary to install and operate our networks. State regulators can sanction our rural telephone companies or revoke our certifications if we violate relevant laws or regulations.
Federal regulation
Our rural telephone companies and competitive local exchange companies must comply with the Communications Act of 1934, which requires, among other things, that telecommunications carriers offer services at just and reasonable rates and on non-discriminatory terms and conditions. The 1996 amendments to the Communications Act (contained in the Telecommunications Act discussed below) dramatically changed, and likely will continue to change the landscape of the industry.
Removal of Entry Barriers
The central aim of the Telecommunications Act is to open local telecommunications markets to competition while enhancing universal service. Before the Telecommunications Act was enacted, many states limited the services that could be offered by a company competing with an incumbent telephone company. The Telecommunications Act preempts these state and local laws.
The Telecommunications Act imposes a number of interconnection and other requirements on all local communications providers. All telecommunications carriers have a duty to interconnect directly or indirectly with the facilities and equipment of other telecommunications carriers. Local exchange carriers, including our rural telephone companies, are required to:
· | Allow other carriers to resell their services; |
| |
· | Provide number portability where feasible; |
| |
· | Ensure dialing parity, meaning that consumers can choose their default local or long-distance telephone company without having to dial additional digits; |
| |
· | Ensure that competitors’ customers receive non-discriminatory access to telephone numbers, operator service, directory assistance and directory listings; |
| |
· | Afford competitors access to telephone poles, ducts, conduits, and rights-of-way; and |
| |
· | Establish reciprocal compensation arrangements with other carriers for the transport and termination of telecommunications traffic. |
10
Furthermore, the Telecommunications Act imposes on incumbent telephone companies (other than rural telephone companies that maintain their so-called “rural exemption” as our subsidiaries do) additional obligations to:
· | Negotiate interconnection agreements with other carriers in good faith; |
| |
· | Interconnect their facilities and equipment with any requesting telecommunications carrier, at any technically feasible point, at non-discriminatory rates and on non-discriminatory terms and conditions; |
| |
· | Offer their retail services to other carriers for resale at discounted wholesale rates; |
|
11
Table of Contents
| · | Provide reasonable notice of changes in the information necessary for transmission and routing of services over the incumbent telephone company’s facilities or in the information necessary for interoperability; and |
| |
· | Provide, at rates, terms, and conditions that are just, reasonable, and non-discriminatory, for the physical collocation of other carriers’ equipment necessary for interconnection or access to UNEsunbundled network elements (“UNEs”) at the premises of the incumbent telephone company. |
Access Charges
On November 18, 2011, the FCC released its comprehensive order on intercarrier compensation and universal service reform. For detailed discussion on the FCC order, see Part I1 – Item 1 –- Regulatory Environment – FCC Access Charge and Universal Service Reform Order below.
A significant portion of our rural telephone companies’ revenues come from network access charges paid by long-distance and other carriers for using our companies’ local telephone facilities for originating or terminating calls within our service areas. The amount of network access revenues our rural telephone companies receive is based on rates set or approved by federal and state regulatory commissions, and these rates are subject to change at any time.
Intrastate network access charges are regulated by state commissions. NetworkThe FCC order on intercarrier compensation and universal service reform required state access charges in our Illinois market currentlyto mirror interstate access charges, for everything except local switching. Illinois law requires that ourand as of July 1, 2013 all switched intrastate access charges may not exceed ourmirror interstate access charges established by the Illinois Commerce Commission (“ICC”). Interstate and intrastate network access charges in our Pennsylvania market are also very similar. In contrast, as required by Texas regulators, our Texas rural telephone companies impose significantly higher network access charges for intrastate calls than for interstate calls.charges.
The FCC regulates the prices we may charge for the use of our local telephone facilities to originate or terminate interstate and international calls. The FCC has structured these prices as a combination of flat monthly charges paid by customers and both usage-sensitive (per-minute) charges and flat monthly charges paid by long-distance or other carriers.
The FCC regulates interstate network access charges by imposing price caps on Regional Bell Operating Companies, referred to as RBOC’s, and other large incumbent telephone companies. These price caps can be adjusted based on various formulas, such as inflation and productivity, and otherwise through regulatory proceedings. Incumbent telephone companies, such as our local telephone companies, may elect to base network access charges on price caps, but are not required to do so.
Historically, all of our rural telephone companies had elected not to apply federal price caps. Instead, they employed a rate-of-return regulation for their network interstate access charges, whereby they earned a fixed return on their investment over and above operating costs. In December 2007, we filed a petition with the FCC seeking to permit our Illinois and Texas companies to convert to price cap regulation. Our petition was approved on May 6, 2008, and became effective on July 1, 2008. We converted our Pennsylvania property to price cap regulation in 2012 and our California property in 2013. The conversion to price cap regulation gives us greater pricing flexibility for interstate services, especially the increasingly competitive special access segment. It also provides us with the potential to increase our net earnings by becoming more productive and introducing new services. On the other hand,As we were requiredhave acquired new properties we have converted them to reduce our interstate access charges in Illinois significantly, and because our Illinois intrastate access charges mirror interstate rates, this conversion also resulted in lower intrastate revenues in Illinois. In addition, we now receive somewhat reduced subsidies from the interstate Universal Service Fund program.federal price cap regulation.
Our Pennsylvania rural telephone company was an average schedulerecently acquired Enventis ILEC properties are cost based rate-of-return company. On Marchcompanies. Effective January 1, 2012 we filed2015, they are treated as price cap companies for universal service purposes. We anticipate filing a petition for waiver in the first quarter of 2015 to exitkeep the National Exchange Carrier Association (“NECA”) settlement pools & tariff and become aEnventis ILECs as rate-of-return for switched access. If the petition is denied, they would convert to price cap company. The FCC approved our waiver request on December 13, 2012. The exit of the NECA settlement pools and tariff was retroactive tocompanies effective July 1, 2012 and the price cap waiver was effective January 1, 2013.
11
Our California rural telephone company is a cost based rate of return company. We are in the NECA Common Line pool for ICLS purposes and we file our own end user, switched access and special access tariff and rates. Under current federal rules, we will be required to convert our California property by July 1, 2013.2015.
Traditionally, regulators have allowed network access rates for rural areas to be set higher than the actual cost of terminating or originating long-distance calls as an implicit means of subsidizing the high cost of providing local service in rural areas. Following a series of federal court decisions ruling that subsidies must be explicit rather than implicit, the FCC adopted reforms in 2001 that reduced per-minute network access charges and shifted a portion of cost recovery, which historically was imposed on long-distance carriers, to flat-rate, monthly subscriber line charges imposed on end-user customers. While the FCC also increased explicit subsidies to rural telephone companies through the Universal Service Fund, the aggregate amount of interstate network access charges paid by long-distance carriers to access providers, such as our rural telephone companies, has decreased and may continue to decrease.
12
Table of Contents
Unlike the federal system, California and Illinois do not provide an explicit subsidy in the form of a universal service fund.fund for companies of our size. Therefore, while subsidies from the Federal Universal Service Fund offset the decrease in revenues resulting from the reduction in interstate network access rates, there was no corresponding offset for the decrease in revenues from the reduction in California or Illinois intrastate network access rates. In Iowa, Minnesota, Pennsylvania and Texas, the intrastate network access rate regime applicable to our rural telephone companies does not mirror the FCC regime, so the impact of the reforms was revenue neutral.
In recent years, carriers have become more aggressive in disputing the FCC’s interstate access charge rates and the application of access charges to their telecommunications traffic. We believe these disputes have increased in part because advances in technology have made it more difficult to determine the identity and jurisdiction of traffic, giving carriers an increased opportunity to challenge access costs for their traffic. For example, in September 2003, Vonage Holdings Corporation filed a petition with the FCC to preempt an order of the Minnesota Public Utilities Commission asserting jurisdiction over Vonage. The FCC determined that it was impossible to divide Vonage’s VOIPVoIP service into interstate and intrastate components without negating federal rules and policies. Accordingly, the FCC found it was an interstate service not subject to traditional state telephone regulation. While the FCC order did not specifically address whether intrastate access charges were applicable to Vonage’s VOIPVoIP service, the fact that the service was found to be solely interstate raises that concern. We cannot predict what other actions other long-distance carriers may take before the FCC or with their local exchange carriers, including our rural telephone companies, to challenge the applicability of access charges. Due to the increasing deployment of VOIPVoIP services and other technological changes, we believe these types of disputes and claims are likely to increase.
Unbundled Network Element Rules
The unbundling requirements have been some of the most controversial provisions of the Telecommunications Act. In its initial implementation of the law, the FCC generally required incumbent telephone companies to lease a wide range of UNE’s to CLECs. Those rules were designed to enable competitors to deliver services to their customers in combination with their existing networks or as recombined service offerings on an unbundled network elementa UNE platform commonly known as UNE-P,(“UNE-P”), which allowed competitors with no facilities of their own to purchase all the elements of local telephone service from the incumbent and resell them to customers. These unbundling requirements, and the duty to offer UNEs to competitors, imposed substantial costs on the incumbent telephone companies and made it easier for customers to shift their business to other carriers. After a court challenge and a decision vacating portions of the UNE rules, the FCC issued revised rules in February 2005 that reinstated some unbundling requirements for incumbent telephone companies that are not protected by the rural exemption, but eliminated the UNE-P option and certain other unbundling requirements.
Each of the subsidiaries through which we operate our local telephone businesses is an incumbent telephone company and provides service in rural areas. As discussed above, the Telecommunications Act exempts rural telephone companies from certain of the more burdensome interconnection requirements. However, the Telecommunications Act provides that the rural exemption will cease to apply as to competing cable companies if and when the rural carrier introduces video services in a service area. In that event, a competing cable operator providing video programming and seeking to provide telecommunications services in the area may interconnect. Since each of our subsidiaries now provides video services in their major service areas, the rural exemption no longer applies to cable company competitors in those service areas. Additionally, in Texas, the Public Utilities Commission of Texas (“PUCT”) has removed the rural exemption for our Texas subsidiaries with respect to telecommunications services furnished by Sprint Communications, L.P. on behalf of cable companies. Our ILEC subsidiaries in California, Illinois, Iowa, Minnesota and Pennsylvania still have the rural exemption in place. We believe the benefits of providing video services outweigh the loss of the rural exemptions to cable operators.
12
Under its current rules, the FCC has eliminated unbundling requirements for ILECs providing broadband services over fiber facilities, but continues to require unbundled access to mass-market narrowband loops. ILECs are no longer required to unbundle packet switching services. In addition, the FCC found that CLECs generally are not at a disadvantage at certain wire center locations in regard to high bandwidth (DS-1 and DS-3) loops, dark fiber loops and dedicated interoffice transport facilities. However, where a disadvantage persists, ILECs continue to be required to unbundle loops and transport facilities.
The FCC rules regarding the unbundling of network elements did not have an impact on our Illinois and Pennsylvania ILEC operations because these ILECs have rural exemptions. Our Pennsylvania CLEC operations were not significantly affected by the 2005 changes to the UNE rules because they use their own switching for business customers that are served by high capacity loops. In July 2011, ourOur Pennsylvania CLEC renewed, for a three-year term,has a commercial agreement with Verizon that sets the terms of the pricing and provisioning of lines previously served utilizing UNE-P, including Verizon switching service. Less than 5% of our Pennsylvania CLEC access lines are provisioned utilizing this
13
Table of Contents
commercial arrangement. Although the costs for this arrangement will increase over time pursuant to the terms of the agreement, our relatively low use of Verizon’s switching and our ability to migrate some of the lines to alternative provisioning sources will limit the overall impact on our current cost structure. The CLEC has experienced moderate increases in the overall cost to provision high-capacity loops, interoffice transport facilities and dark fiber as a result of the FCC’s changes to unbundling requirements for those facilities. In December 2012, our subsidiary Consolidated Communications Enterprise Services Inc. (“CCES”), entered into a 5-year wholesale special access agreement with AT&T, which moved us off the UNE platform, reduced cost and gave us greater flexibility. This agreement applies to our CLEC operations in California, Illinois, Kansas, Missouri and Texas.
In 2006, Verizon filed a petition requesting that the FCC refrain from applying a number of regulations to the Verizon operations in six major metropolitan markets, including the Pittsburgh market area. Among other things, Verizon urged the FCC to forbear from applying loop and transport unbundling regulations, claiming there was sufficient competition in the Pittsburgh market to mitigate the need for these rules. The FCC denied Verizon’s petition in December 2007, but a federal court of appeals remanded this decision to the FCC for further analysis in 2009. If the FCC grants this remanded petition or any similar forbearance petitions in markets in which our CLEC operates, our cost to obtain access to loop and transport facilities would increase substantially for the 5%, or less, of the lines provisioned under the commercial agreement discussed above. In 2013, AT&T filed to amend its interstate access tariff with the FCC to eliminate the 5-year term discounts on its special access services. We filed a petition to reject AT&T’s filing and on December 9, 2013 the FCC suspended AT&T’s filing pending investigation. The FCC has not yet issued a ruling in this matter.
Promotion of Universal Service
In general, telecommunications service in rural areas is more costly to provide than service in urban areas. The lower customer density means that switching and other facilities serve fewer customers and loops are typically longer, requiring greater expenditures per customer to build and maintain. By supporting the high cost of operations in rural markets, Federal Universal Service Fund subsidies promote widely available, quality telephone service at affordable prices in rural areas. We received $50.8$53.2 million and $46.2$52.0 million from the Federal Universal Service Fund, the Pennsylvania Universal Service Fund and the Texas Universal Service Fund in 20122014 and 2011,2013, respectively.
Federal Universal Service Fund subsidies are paid only to carriers that are designated eligible telecommunications carriers (“ETCs”), by a state commission. Each of our rural telephone companies have been designated an ETC. However, under FCC rules prior to 2008, competitors could obtain the same level of Federal Universal Service Fund subsidies as we do, per line served, if the applicable state regulator determined that granting such Federal Universal Service Fund subsidies to competitors would be in the public interest and the competitors offered and advertised certain services as required by the Telecommunications Act and the FCC. The ICCIllinois Commerce Commission (“ILCC”) has granted several petitions for ETC designations, but to date no other ETCs are operating in our Illinois service area. We are not aware that any carriers have filed petitions to be designated an ETC in our Pennsylvania or Texas service areas. In May 2008, the FCC adopted an interim cap on payments to ETCs that are not incumbent telephone companies, based on the payments received by such companies in March 2008, which reduces (but does not eliminate) the incentive for ETCs to seek to compete against our rural telephone companies.
In order for ETCs to receive high-cost support, the Universal Service Fund (“USF”)/intercarrier compensation (“ICC”) Transformation Order requires states to certify on an annual basis that USF support is used “only for the provision, maintenance, and upgrading of facilities and services for which the support is intended”. States, in turn, require that ETCs file certifications with them as the basis for the state filings with the FCC. Failure to meet the annual data and certification deadlines can result in reduced support to the ETC based on the length of the delay in certification. For the calendar year 2013, the California state certification was due to be filed with the FCC on or before October 1, 2012. We were notified in January 2013 that SureWest Communications (“SureWest”) did not submit the required certification to the California Public Utilities Commission (“CPUC”) in time to be included in its October 1, 2012, submission to the FCC. On January 24, 2013, we filed a certification with the CPUC and filed a petition with the FCC for a waiver of the filing deadline for the annual state certification. On February 19, 2013, the CPUC filed a certification with the FCC with respect to SureWest. On October 29, 2013, the Wireline Competition Bureau of the FCC denied our petition for a waiver of the annual certification deadline. On November 26, 2013, we applied for a review of the decision made by the FCC staff by the full Commission. Management is optimistic, based on the change in SureWest Telephone’s USF filing status caused by the change in the ownership of SureWest Telephone, the lack of formal notice by the FCC regarding this change in filing status, the fact that SureWest Telephone had a previously-filed certification of
14
Table of Contents
compliance in effect with the FCC for the two quarters for which USF was withheld, and the FCC’s past practice of granting waivers to accept late filings in similar situations, that the Company may prevail in its application to the Commission and receive USF funding for the period January 1, 2013, through June 30, 2013. However, due to the denial of our petition by the Wireline Competition Bureau and the uncertainty of the collectability of the previously recognized revenues, in December 2013, we reversed the $3.0 million of previously recognized revenues until such time that the Commission has the opportunity to reach a decision on our application for review.
FCC Access Charge and Universal Service Reform Order
In November 2011, the FCC released its comprehensive order on Access Charge and Universal Service Reform (the order”“Order”). The access charge portion of the orderOrder systematically reduces minute of use based interstate access, intrastate access and reciprocal compensation rates over a six to nine year period to an end state of Bill“Bill and Keep,Keep”, in which each carrier recovers the costs of its network through charges to its own subscribers, not through intercarrier
13
compensation. The reductions apply to terminating access rates and usage, while originating access will be addressed by the FCC in a later proceeding. To help with the transition to Bill and Keep, the FCC created two mechanisms. The first is an Access Recovery Mechanism (“ARM”) which is funded from the Connect America Fund (“CAF”), and the second is an Access Recovery Charge (“ARC”) which is recovered from the end users. The universal service portion of the orderOrder shifts the national policy goal from voice service to broadband and is now called the Connect America Fund (“CAF”). InCAF. The initial release of the Order mandated that, in order to receive CAF funding, carriers must agree to provide broadband capability to 100% of their customer base at a minimum speed of 4 Mbps downstream and 1Mbps upstream. The current high cost funding program is frozen at 2011 levels and will be eliminated upon development and implementation of a CAF census block model.
The order has already been appealed by state commissions and carriers including Consolidated. We filed our petition for review on January 18, 2012 and raised issues with the order pertaining to access rates, universal service and transition provisions. In addition, several other carriers and associations have filed petitions for reconsideration at the FCC. The timeframe and results of these appeals and petitions for reconsideration are not known at this time.
In the FCC order,Order, holding companies with price cap study areas and rate of return study areas are mandated to move all their interstate rate of return study areas to price cap for universal service purposes only. The intercarrier compensation rules will keep rate of return study areas under the rate of return intercarrier compensation transitions plan and the price cap study areas under the price cap intercarrier compensation transition.
Step 1In 2012, Phase I of the FCC’s intercarrier compensation and universalCAF was implemented, freezing USF support to price cap holding companies until the FCC implements Phase II, which incorporates a broadband cost model to shift support from voice service to broadband. The Order also modifies the methodology used for ICC for traffic exchanged between carriers. The initial phase of ICC reform order was implementedeffective on July 1, 2012, withbeginning the annual interstate tariff filing as well as intrastate filings, which reduced intrastatetransition of our terminating switched access rates towardto bill-and-keep over a seven year period. As a result of implementing the interstate rate, eliminated wireless reciprocal compensation chargesprovisions of the Order, our network access revenues decreased approximately $1.4 million and introduced$1.8 million in 2014 and 2013, respectively.
On December 19, 2014, the ARCFCC released a report and order that addresses the transition to CAF Phase II for price cap carriers, the acceptance criteria of CAF Phase II funding, the rules for the competitive bidding process, the annual reporting requirements, and introduces CAF Phase III. For companies that accept the CAF Phase II model based support, there will be a three year transition period in instances where their current Phase I frozen funding exceeds the Phase II funding. If Phase II support exceeds Phase I, then transitional support is waived and Phase II funding begins immediately. Companies are required to commit to a statewide build out requirement to 10 Mbps downstream and 1 Mbps upstream in funded locations, with funding received over six years beginning in mid-2015. The FCC is expected to release the final model support in the first quarter of 2015, with funding retroactive to January 2015.
Companies that do not accept the CAF Phase II funding will continue to receive Phase I frozen support amounts until funding for their service area is awarded to another carrier through the competitive bidding process, which is assessedexpected to end users. Step 2be completed in 2016. In addition, companies that do not accept the model based support will occur onbe eligible to participate in the competitive bidding process. There is no statewide commitment associated with the auction process; ILECs will only be required to build to the locations won, and funding will be received over 10 years. The broadband requirement at the onset of the funding period is 10Mbps/1Mbps, and is subject to change over the remaining years.
Upon acceptance of funding, annual reporting requirements include filings of annual certifications that the carrier is both meeting its public interest obligations and is offering comparable broadband rates and a Service Quality Improvement plan filing. The initial plan must be filed by July 1, 2013 which2016, with progress reports filed every year thereafter. The plan must include, among other things, the total amount of Phase II support used to fund capital expenditures in the previous year, and certification that the carrier is meeting the required interim deployment milestones. The Company is currently evaluating its options in these matters and acceptance of funding will bring intrastate switched access chargesdepend on the FCC’s final model support in parity with interstate and increase the ARC charges assessed to end users.first quarter of 2015.
15
Table of Contents
State Regulation
California
The California Public Utilities Commission (“CPUC”)CPUC has the power, among other things, to establish rates, terms and conditions for intrastate service, to prescribe uniform systems of accounts and to regulate the mortgaging or disposition of public utility properties.
In an ongoing proceeding relating to the New Regulatory Framework, the CPUC adopted Decision 06-08-030 in 2006, which grants carriers broader pricing freedom in the provision of telecommunications services, bundling of services, promotions and customer contracts. This decision adopted a new regulatory framework, the Uniform Regulatory Framework (“URF”), which among other things (i) eliminates price regulation and allows full pricing flexibility for all new and retail services, (ii) allows new forms of bundles and promotional packages of telecommunication services, (iii) allocates all gains and losses from the sale of assets to shareholders and (iv) eliminates almost all elements of rate of return regulation, including the calculation of shareable earnings. On December 31, 2010, the CPUC issued a ruling to initiate a new proceeding to assess whether, or to what extent, the level of competition in the telecommunications industry is sufficient to control prices for the four largest ILECs in the state. Subsequently, the CPUC issued a ruling temporarily deferring the proceeding. The status on when the CPUC may open this proceeding is unclear and on hold at this time. The CPUC’s actions in this and future proceedings could lead to new rules and an increase in government regulation. The Company will continue to monitor this matter.
Illinois
Our Illinois Telephone Operations’ long-distance and payphone services subsidiaryrural telephone company holds the necessary certifications in Illinois (and the other states in which it operates). This subsidiary isto provide long-distance and payphone services. We are required to file tariffs with the ICC,ILCC or post written service offerings on its website, but generally can change the prices, terms and conditions stated in its tariffs on one day’s notice, with prior notice of price increases to affected customers. Our Illinois Telephone Operations’ otherCLEC services are not subject to any significant state regulations in Illinois, and our Other Illinois Operations are not subject to any significant state regulation outside of any specific contractually imposed obligations.Illinois.
Our Illinois rural telephone company is certified by the ICCILCC to provide local telephone services. This entity operates as a distinct company from a regulatory standpointstandpoint. As described below, ICTC has elected the option under Illinois law to have its rates, terms and conditions of service subject to market regulation, that is, regulated under a rate of return system for intrastate revenues.by competition. Although, as explained above, the FCC has preempted certain state regulations pursuant to the Telecommunications Act, Illinois retains the authority to impose requirements on our Illinois rural telephone
14
company to preserve universal service, protect public safety and welfare, ensure quality of service and protect consumers. For instance, our Illinois rural telephone company must file tariffs setting forth the terms, conditions, and prices for its intrastate services; these tariffs may be challenged by third parties. Our Illinois rural telephone company has not had a general rate proceeding before the ICCILCC since 1983.
The ICCUnder Illinois law, the ILCC has broad authority to impose service quality and service offering requirements on our Illinois rural telephone company, including credit and collection policies and practices, and can require our Illinois rural telephone company to take actions to ensure that it meets its statutory obligation to provide reliable local exchange service. For example, as part of its approval of the reorganization we implemented in connection with our 2005 initial public offering, the ICC imposed various conditions, including (1) prohibitions on payment of dividends or other cash transfers from ICTC to us if ICTC fails to meet or exceed agreed benchmarks for a majority of seven service quality metrics, and (2) the requirement that ICTC have access to $5.0 million or its currently approved capital expenditure budget (whichever is higher) for each calendar year through a combination of available cash and credit facilities. During 2012, we satisfied each of the applicable Illinois regulatory requirements necessary to permit ICTC to pay dividends to us.
The Illinois General Assembly has made major revisions and added significant new provisions to the portions of the Illinois Public Utilities Act governing the regulation and obligations of telecommunications carriers on a number of occasions since 1985. In 2007, the Illinois legislature addressed competition for cable and video services and authorized statewide licensing by the ICCILCC to replace the existing system of individual town franchises. This legislation also imposed substantial state-mandated consumer service and consumer protection requirements on providers of cable and video services. The requirements generally became applicable to us on January 1, 2008, and we are operating in compliance with the new law. Although we have franchise agreements for cable and video services in all the towns we serve, this statewide franchising authority will simplify the process in the future. In
16
Table of Contents
2010, the Illinois General Assembly passed Public Act 96-0927, which updates the telecommunications statute, allowing ILECs, beginning January 1, 2011, to elect deregulation of local services. To date, ICTC has not made an election to deregulate its local services.elected this option effective April 1, 2014. Under this option, an ILECsICTC’s rates for local services would becomebecame “competitive” and no longer subject to rate of return regulation, and certain other service quality obligations would beare reduced. The electing ILECs would have obligationsICTC is obligated to make certain basic local exchange service packages available to customers. Public Act 96-0927 also specified that local exchange carriers may not charge intrastate access rates at levels higher than their interstate access rates. The Governor of Illinois signed the bill into law on June 15, 2010. In June 2013, the Illinois legislature approved additional amendments to the telecommunications statute. The Illinoisnew telecommunications legislation made minor changes to the telecommunications statute. The current telecommunications statute is currently scheduled to sunset in 2013. In the past, such sunset dates in telecommunication legislation have led to further amendments to reflect changing industry technological and competitive conditions.July 1, 2015.
Texas
Our Texas rural telephone companies are each certified by the PUCT to provide local telephone services in their respective territories. In addition, our Texas long-distance and transport subsidiaries are registered with the PUCT as interexchange carriers. The transport subsidiary also has obtained a service provider certificate of operating authority (“SPCOA”) to better assist the transport subsidiary with its operations in municipal areas. Recently, to assist with expanding services offerings, Consolidated Communications Enterprise Services, Inc. also obtained a SPCOA from the PUCT. While our Texas rural telephone company services are extensively regulated, our other services, such as long-distance and transport services, are not subject to any significant state regulation.
Our Texas rural telephone companies operate as distinct companies from a regulatory standpoint. Each is separately regulated by the PUCT in order to preserve universal service, protect public safety and welfare, ensure quality of service and protect consumers. Each Texas rural telephone company must file and maintain tariffs setting forth the terms, conditions and prices for its intrastate services.
Currently, both of our Texas rural telephone companies have immunity from adjustments to their rates, including their intrastate network access rates, because they elected “incentive regulation” under the Texas Public Utilities Regulatory Act (“PURA”). In order to qualify for incentive regulation, our rural telephone companies agreed to fulfill certain infrastructure requirements. In exchange, they are not subject to challenge by the PUCT regarding their rates, overall revenues, return on invested capital, or net income.
PURA prescribes two different forms of incentive regulation in Chapter 58 and Chapter 59. Under either election, the rates, including network access rates, an incumbent telephone company may charge for basic local services generally cannot be increased from the amount(s) on the date of election without PUCT approval. Even with PUCT
15
approval, increases can only occur in very specific situations. Pricing flexibility under Chapter 59 is extremely limited. In contrast, Chapter 58 allows greater pricing flexibility on non-basic network services, customer-specific contracts and new services.
Initially, both of our Texas rural telephone companies elected incentive regulation under Chapter 59 and fulfilled the applicable infrastructure requirements, but they changed their election status to Chapter 58 in 2003, which gives them some pricing flexibility for basic services, subject to PUCT approval. The PUCT could impose additional infrastructure requirements or other restrictions in the future. Any requirements or restrictions could limit the amount of cash that is available to be transferred from our rural telephone companies to the parent entities and could adversely affect our ability to meet our debt service requirements and repayment obligations.
In September 2005, the Texas legislature adopted significant additional telecommunications legislation. Among other things, this legislation created a statewide video franchise for telecommunications carriers, established a framework to deregulate the retail telecommunications services offered by incumbent local telecommunications carriers, imposed concurrent requirements to reduce intrastate access charges and directed the PUCT to initiate a study of the Texas Universal Service Fund. The PUCT study submitted to the legislature in 2007 recommended that the Small Company Area High-Cost Program, which covers our Texas telephone companies, should be reviewed by the PUCT from a policy perspective regarding basic local telephone service rates and lines eligible for support. The PUCT has only addressed the large company fund and has no immediate plans to conduct a small company review.
Texas Universal Service
The Texas Universal Service Fund is administered by NECA.the National Exchange Carrier Association. PURA, the governing law, directs the PUCT to adopt and enforce rules requiring local exchange carriers to contribute to a state universal service fund that helps telecommunications providers offer basic local telecommunications service at reasonable rates in high cost rural areas. The Texas Universal Service Fund is also used to reimburse
17
Table of Contents
telecommunications providers for revenues lost by providing Tel-Assistance and to reimburse carriers for providing lifeline service. Our Texas rural telephone companies receive disbursements from this fund. Our Texas ILECs receive two state funds, the small and rural incumbent local exchange company plan (“HCF”) and the high cost assistance fund (“HCAF”). The HCF is a line-based fund used to keep local rates low. The rate is applied on all residential lines and up to five single business lines. The amount we receive from the HCAF is a frozen monthly amount that was originally developed to offset high intrastate toll rates.
In September 2011, the Texas state legislature passed Senate Bill 985No. 980/House Bill No. 2603 which, requiresamong other things, mandated the PUCT to review the large and small company Texas Universal Service Funds in 2012Fund and report back to the legislatureissue recommendations by January 2013.1, 2013 with the intent to effectively reduce the size of the Universal Service Fund. This would be accomplished by implementing an urban floor to offset state funding reductions with a phase-in period of four years. The PUCT began a series of dockets in 2012 reviewing the Texas universal service high cost fund programs, for both largerecommended that (i) frozen line counts be lifted effective September 1, 2013 and small companies.(ii) rural and urban local rate benchmarks be developed. The large company docketsfund was completed in September 2012 and the PUCT addressed the small fund participants in Docket 41097 Rate Rebalancing (“Docket 41097”), as discussed below.
In June 2013, the Texas state legislature passed Senate Bill No. 583 (“SB 583”). The provisions of SB 583 were settledeffective September 1, 2013 and froze HCF and HCAF support for the remainder of 2013. As of January 1, 2014, our annual $1.4 million HCAF support was eliminated, and the frozen HCF support returned to funding on a per line basis. In July 2013, the Company entered into a settlement agreement with the PUCT on Docket 41097, which was approved by the PUCT on August 30, 2013. In accordance with the provisions of the settlement agreement, the HCF draw will be reduced by approximately $1.2 million annually, or approximately $4.8 million in late 2012.total, over a four year period beginning June 1, 2014 through 2018. However, we have the ability to fully offset this reduction with increases to residential rates where market conditions allow, which the Company filed for in April and implemented in June 2014.
In addition, the PUCT is required to develop a needs test for post-2017 funding and has held workshops on various proposals. The small company dockets will notPUCT issued its recommendation to the Texas state Commissioners in May 2014 which was approved in December 2014. The needs test allows for a one-time disaggregation of line rates from a per line flat rate, then a competitive test must be reviewed until aftermet to receive funding. Deadline for submission of the 2013 legislative session has been completed.needs test is December 31, 2016. We expect that any impact from these proceedings will most likely occur in 2014.to complete the needs test as required and file for continued funding by the 2016 deadline.
Pennsylvania
The Pennsylvania Public Utilities Commission (“PAPUC”) regulates the rates, the system of financial accounts for reporting purposes, and certain aspects of service quality, billing procedures and universal service funding, among other things, related to our rural telephone company and CLEC’s provision of intrastate services. In addition, the PAPUC sets the rates and terms for interconnection between carriers within the guidelines ordered by the FCC. Pennsylvania intrastate rates are regulated under a statutory framework referred to as Act 183. Under this statute, rates for non-competitive intrastate services are allowed to increase based on an index that measures economy-wide price increases. In return, we committed to continue to upgrade our network to ensure that all our customers would have access to broadband services, and to deploy a ubiquitous broadband (defined as 1.544 mbps)Mbps) network throughout our entire service area by December 31, 2008, which we did.
Pennsylvania Universal Service and Access Charges
On September 30, 1999, as part of a proceeding that resolved a number of pending issues, the PAPUC ordered ILECs, including our Pennsylvania property, to rebalance and reduce intrastate toll and switched access rates. In that same order, the PAPUC also created a Pennsylvania Universal Service Fund (“PAUSF”) to help offset the resulting loss of ILEC revenues. In 2003, the PAPUC ordered ILECs to further rebalance and reduce intrastate access charges and left the PAUSF in place pending further review. In 2008, our Pennsylvania ILECs annual receipts from and contributions to the PAUSF total $5.2 million and $0.3 million, respectively. Our Pennsylvania CLEC receives no funding from the PAUSF but currently contributes $0.2 million annually. Since Act 183 was adopted in 2004, the PAPUC may not require a local exchange carrier to reduce intrastate access rates except on a revenue neutral basis.
In 2011, the PAPUC issued an intrastate access reform order reducing intrastate access rates to interstate levels in a three step process, beginningwhich began in March 2012. With the release of the FCC order in OctoberNovember 2011, the PAPUC has temporarily issued a stay. A final stay was issued in 2012 to implement the FCC ordered intrastate access rate changes. The PAPUC hashad indicated that it will address state universal funding in 2013 but delayed conducting a proceeding pending any state legislative activity that may occur in the 20132015 legislative session.
16Enventis
Our subsidiaries, Crystal Communications, Inc., Enventis Telecom, Inc. and IdeaOne Telecom, Inc. are CLECs. A company must file for CLEC or interexchange authority to operate with the appropriate public utility commission in each state it serves. Our CLECs provide a variety of services to both residential and business customers in multiple jurisdictions for local and interexchange services. Our CLECs provide services with less regulatory oversight than our ILEC companies.
18
Table of Contents
Our subsidiaries Mankato Citizens Telephone Company (“MCTC”), Mid-Communications, Inc. (“Mid-Com”) and Heartland Telecommunications Company of Iowa (“Heartland”) are ILECs. MCTC and Mid-Com are public utilities operating pursuant to indeterminate permits issued by the Minnesota Public Utilities Commission (“MPUC”). Heartland is also a public utility, which operates pursuant to a certificate of public convenience and necessity issued by the Iowa Utilities Board (“IUB”). Due to the size of our ILEC companies, neither the MPUC nor the IUB regulates our rates of return or profits. In Minnesota, regulators monitor MCTC and Mid-Com price and service levels. In Iowa, Heartland is not rate-regulated. Our companies can change local rates by evaluating various factors including economic and competitive circumstances.
Local Government Authorizations
In Illinois, we historically have been required to obtain franchises from each incorporated municipality in which our rural telephone company operates. An Illinois state statute prescribes the fees that a municipality may impose for the privilege of originating and terminating messages and placing facilities within the municipality. Our Illinois Telephone Operationstelephone operations may also be required to obtain permits for street opening and construction, or for operating franchises to install and expand fiber optic facilities. These permits or other licenses or agreements typically require the payment of fees.
Similarly, Texas incumbent telephone companies had historically been required to obtain franchises from each incorporated municipality in which they operated. Texas law now provides that incumbent telephone companies do not need to obtain franchises or other licenses to use municipal rights-of-way for delivering services. Instead, payments to municipalities for rights-of-way are administered through the PUCT and through a reporting process by each telecommunications provider. Incumbent telephone companies are still required to obtain permits from municipal authorities for street opening and construction, but most burdens of obtaining municipal authorizations for access to rights-of-way have been streamlined or removed.
Our Texas rural telephone companies still operate pursuant to the terms of municipal franchise agreements in some territories served by Consolidated Communications of Fort Bend Company. As the franchises expire, they are not being renewed.
Like Illinois, California, Iowa, Minnesota and Pennsylvania operatesoperate under a structure in which each municipality may impose various fees.
Regulation of Broadband and Internet Services
Video Services
Our cable television subsidiaries each require a state or local franchise or other authorization in order to provide cable service to customers. Each of these subsidiaries is subject to regulation under a framework that exists in Title VI of the Communications Act.
Under this framework, the responsibilities and obligations of franchising bodies and cable operators have been carefully defined. The law addresses such issues as the use of local streets and rights of way; the carriage of public, educational and governmental channels; the provision of channel space for leased commercial access; the amount and payment of franchise fees; consumer protection; and similar issues. In addition, Federal laws place limits on the common ownership of cable systems and competing multichannel video distribution systems, and on the common ownership of cable systems and local telephone systems in the same geographic area. Many provisions of the Federal law have been implemented through FCC regulations. The FCC has expanded its oversight and regulation of the cable television-related matters recently. In some cases, it has acted to assure that new competitors in the cable television business are able to gain access to potential customers and can also obtain licenses to carry certain types of video programming.
The Communications Act also authorizes the licensing and operation of open video systems (“OVS”). An OVS is a form of multichannel video delivery that was initially intended to accommodate unaffiliated providers of video programming on the same network. The OVS regulatory structure also offered a means for a single provider to serve less than an entire community. Our Kansas City operations in Missouri utilize an OVS that allows us to operate in only a part of Kansas City.
A number of state and local provisions also affect the operation of our cable systems. The California legislature adopted the Digital Infrastructure and Video Competition Act of 2006 (“DIVCA”) to encourage further entrance of telephone companies and other new cable operators to compete against the large incumbent cable operators. DIVCA
19
Table of Contents
changed preexisting California law to require new franchise applicants to obtain franchise authorizations on the state level. In addition, DIVCA established a general set of state-defined terms and conditions to replace numerous terms and conditions that had applied uniquely in local municipalities, and it repealed a state law that had prohibited local governments from adopting terms for new competitive franchises that differed in any material way from the incumbent’s franchise, even if competitive circumstances were very different. Some portions of this law are also available to incumbent cable operators with existing local franchises who compete against us.
17
A state franchising law also has been enacted in Kansas. While these laws have reduced franchise burdens on our subsidiaries and have made it easier for them to seek out and enter new markets, they also have reduced the entry barriers for others who may want to enter our cable television markets.
Federal law and regulation also affects numerous issues related to video programming and other content.
Under Federal law, certain local television broadcast stations (both commercial and non-commercial) can elect, every three years, to take advantage of rules that require a cable operator to distribute the station’s content to the cable system’s customers without charge, or to forego this “must-carry” obligation and to negotiate for carriage on an arm’s length contractual basis, which typically involves the payment of a fee by the cable operator, and sometimes involves other consideration as well. The current three year cycle began on January 1, 2012. The company has successfully negotiated agreements with all of the local television broadcast stations that would have been eligible for “must carry” treatment in each of its markets. As anticipated, fees under retransmission consent agreements generally underwent marked increases for the 2012-2014 period.
Federal law and regulation regulate access to certain programming content that is delivered by satellite. The FCC has provisions in place to ban certain discriminatory practices and unfair acts, and include a presumption that the withholding of regional sports programming by content affiliates of incumbent cable operators is presumptively unlawful. The existing FCC complaint process for program access for both satellite and terrestrially-delivered content is governed on a case-by-case basis. The FCC currently is considering adopting rules that could make it less burdensome for competing multichannel video programming providers who are denied access to cable-affiliated satellite programming on reasonable terms and conditions to pursue and meet evidentiary standards with respect to program access complaints. That proceeding remains pending before the FCC.
The FCC recently adopted an order banning exclusive contracts between affiliates where the programming is sent via terrestrial media, and banning certain other unfair acts, making it clear that the withholding of regional sports programming and high definition television programming by content affiliates of incumbent cable operators would receive special attention. Unlike the satellite provisions, the new rules will not expire. The FCC’s order was upheld in an appeals court decision issued on March 12, 2010.
In connection with the FCC’s approval of a cable transaction involving Comcast and Time Warner in July 2006, the parties’ regional sports networks were subject to certain program access rules until July 2012. The FCC did not extend these obligations beyond July 2012. This does not change the existing Comcast/NBC Universal merger conditions which expire in 2018, as described below. It is unknown what, if any, impact this decision will have on us.
In early 2010, Comcast proposed to enter into a joint venture with NBC Universal, through which it would acquire control of numerous NBC properties, including both broadcast and cable television programming operations of NBC. In early 2011, the FCC and the Department of Justice (“DOJ”) approved the transaction, with a significant number of conditions designed to promote programming diversity, to limit the ability of the combined entity to affect competition adversely, and to protect newly emerging markets such as independent on-line (“over-the-top”)OTT video. These conditions include requirements for program access and carriage, non-discrimination in making programming available, limits on bundling that would affect competition, and the relationship of the joint venture to emerging on-line competition. In addition, conditions were imposed to maintain independence within the NBC unit in dealing with competing cable operators. The parties agreed to the conditions and the transaction was completed during 2011. Most of the conditions will have a duration of seven years.
The contractual relationships between cable operators and most providers of content who are not television broadcast stations generally are not subject to FCC oversight or other regulation. The majority of providers of content to our subsidiaries, including content providers affiliated with incumbent cable operators such as Comcast, but who are not subject to any FCC or DOJ conditions, do so through arm’s length contracts where the parties have mutually agreed upon the terms of carriage and the applicable fees.
20
Table of Contents
The transition to digital television (“DTV”) has led the FCC to adopt and implement new rules designed to ease the shift. These rules also can be expected to make broadcast content more accessible over the air to smartphones, personal computers and other non-television devices. Local television broadcast stations will also be able to offer more content over their assigned digital spectrum after the DTV transition, including additional channels.
The Company continues to monitor the emergence of video content options for customers that have become available over the Internet, and that may be made available for free, by individual subscription or in conjunction with a separate cable service agreement. In some cases, this involves the ability to watch episodes of desirable network television programming and to procure additional content related to programs carried on linear cable channels.
18
These options have increased significantly, and can lead cable television customers to terminate or reduce their level of services. At this time, “over-the-top”OTT programming options cannot duplicate the nature or extent of desirable programming carried by cable systems, and the market is still comparatively nascent, but in light of changing technology and events such as the Comcast-NBC transaction, the “over-the-top”OTT market will continue to grow and evolve rapidly.
Cable operators depend to some degree upon their ability to utilize the poles (and conduit) of electric and telephone utilities. The terms and conditions under which such attachments can be made were established in the Federal Pole Attachment Act of 1978, as amended. The Pole Attachment Act outlined the formula for calculating the fee to be charged for the use of utility poles, a formula that assesses fees based on the proportionate amount of space assigned for use and an allocation of certain qualified costs of the pole owner. The FCC has put in place a structure for pole attachment regulation that has covered cable operators and other types of providers. The FCC has adopted new rules that apply a single rate to all providers who use poles, whether they are cable operators, telecommunications providers, or Internet providers, even if they use the attachment to offer more than one service. These rules only affect attachments in states where the Federal rules apply. States have the option to opt out of the Federal formula and to regulate pole attachments independently. Illinois, Iowa, Kansas, Minnesota, Missouri, Texas, Pennsylvania and IllinoisTexas follow the FCC pole attachment framework. California has elected to separately regulate pole attachments and pole attachment rates. The FCC decision has been appealed, and the ultimate outcome of the appeal cannot be predicted.
Cable operators are subject to longstanding cable copyright obligations where they pay copyright fees for some types of programming that are considered secondary retransmissions. The copyright fees are updated from time to time, and are paid into a pool administered by the United States Copyright Office for distribution to qualifying recipients.
The FCC has so far declined to require that cable operators allow unaffiliated Internet service providers to gain access to customers by using the network of the operator’s cable system. The FCC also has considered the benefits of a requirement that cable operators offer programming on their systems on an a la carte or themed basis, but to date has not adopted regulations requiring such action. These matters may resurface in the future, particularly as the “over-the-top”OTT market grows. In light of the fact that programming is increasingly being made available through Internet connections, some cable operators have considered their own a la carte alternatives. Content owners with linear channels also are moving toward greater “on demand” programming, offerings that maintain the value of their linear channels for customers.
The outcome of pending matters cannot be determined at this time but can lead to increased costs for the Company in connection with our provision of cable services, and can affect our ability to compete in the markets we serve.
Internet Services
The provision of Internet access services is not significantly regulated by either the FCC or the state commissions. However, the FCC has been moving toward the imposition of some controls on the provision of Internet access. In 2002, in part to place cable modem service and Digital Subscriber Line (“DSL”) service on an equal competitive footing, the FCC asserted jurisdiction over these services as “information services” under Title I of the Communications Act, and removed them from treatment under Title II of the Act, but to date it has not determined what regulatory framework, if any, is appropriate for Internet services under Title I.
The FCC has also adopted policy principles to signal its objectives with respect to high speed Internet and related services. These principles are intended to encourage broad customer access to the content and applications of their choice, to promote the unrestricted use of lawful equipment by users of Internet services and to promote competition among providers.
21
Table of Contents
In 2009, the FCC proposed to enact rules related to Internet access services, relying in part on the policy principles that it had earlier adopted, but expanding their reach and adding additional provisions. The adoption of the rules as they have been proposed would prohibit discrimination with respect to applications providers, among other things, subject to reasonable network management by an Internet access service provider.
While this initiative was getting underway, a Federal appeals court decision in April 2010 assessed the FCC’s authority over Internet services under the Communications Act, and invalidated action taken by the FCC that was based on authority that the FCC thought it possessed. The FCC continues to assertasserted that it has jurisdictional authority in some areas related to the promotion of an open Internet.“open Internet” or “net neutrality”. Notwithstanding the court setback, the FCC elected to adopt rules in this regard in December 2010. That action also has beenwas appealed to a Federal appeals court. The extentcourt, and in January 2014, the U.S. Court of Appeals for the D.C. Circuit found that the FCC does have the authority to implement regulation of the FCC’s jurisdiction in connection withInternet, if those rules reasonably advance the Internet willpromotion of broadband deployment and do not be resolved for some time. We are unable to predict the outcome of current proceedings.violate other statutory requirements.
19As a result of the ruling, the FCC has indicated that it intends to reclassify broadband Internet services as a telecommunications service subject to regulation under Title II of the Communications Act, and will adopt regulations addressing Internet traffic exchange and peering arrangements. These regulations are anticipated to be released in the first quarter of 2015. It is uncertain what specific guidelines the FCC will adopt or how they might impact the Company.
The Federal Trade Commission (“FTC”) is currently assessing certain advertising and marketing practices of Internet-related companies, as well as the use of the Internet in connection with other businesses. FTC action can affect the manner of operation of some of our businesses. The outcome of pending matters cannot be determined at this time but can lead to increased costs for the Company in connection with our provision of Internet services, and can affect our ability to compete in the markets we serve.
Item 1A.Risk Factors.
Our operations and financial results are subject to various risks and uncertainties, including but not limited to those described below, that could adversely affect our business, financial condition, results of operations, cash flows and the trading price of our common stock.
Risks Relating to Current Economic Conditions
Unfavorable changes in financial markets could adversely affect pension plan investments resulting in material funding requirements to meet our pension obligations.We expect that we will continue to make future cash contributions to our pension plans, the amount and timing of which will depend on various factors including funding regulations, future investment performance, changes in future discount rates and changes in participant demographics. Our pension plans have investments in marketable securities, including marketable debt and equity securities, whose values are exposed to changes in the financial markets. Returns generated on plan assets have historically funded a large portion of the benefits paid under these plans. If the financial markets experience a downturn and returns fall below our the estimated long-term rate of return, as seen in recent years, our future funding requirements could increase significantly, which could adversely affect cash flows from operations.
Weak economic conditions may have a negative impact on our business, results of operations and financial condition. Downturns in the economic conditions in the markets and industries we serve could adversely affect demand for our products and services and have a negative impact on our results of operations. Economic weakness or uncertainty may make it difficult for us to obtain new customers and may cause our existing customers to reduce or discontinue their services to which they subscribe. This risk may be worsened by the expanded availability of free or lower cost services, such as video over the Internet, or substitute services, such as wireless phones and data devices. Weak economic conditions may also impact the ability of third parties to satisfy their obligations to us. If weak economic conditions were to continue or further deteriorate, the growth of our business, results of operations and financial condition may be adversely affected.
Risks Relating to Our Common Stock and Payment of Dividends
Our Board of Directors could, in its discretion, depart from or change our dividend policy at any time. Our Board of Directors maintains a current dividend practice for the payment of quarterly dividends at an annual rate of approximately $1.55 per share of common stock. We are not required to pay dividends and our stockholders do not have contractual or other legal rights to receive them. Our Board of Directors may decide at any time, in its discretion, to decrease the amount of dividends, change or revoke the dividend policy, or discontinue paying dividends entirely. Our ability to pay dividends is dependent on our earnings, capital requirements, financial condition, expected cash needs, debt covenant compliance and other factors considered relevant by our Board of Directors. If we do not pay dividends, for whatever reason, shares of our common stock could become less liquid and the market price of our common stock could decline.
We might not have sufficient cash to maintain current dividend levels. Our debt agreements, applicable state, legal and corporate law, regulatory requirements and other risk factors described in this section, could materially reduce the cash available from operations or significantly increase our capital expenditure requirements, and these outcomes could cause funds not to be available when needed in amount sufficient to support our current dividend practice.
If we continue to pay dividends at the level currently anticipated under our dividend policy, our ability to pursue growth opportunities may be limited. We believe that our dividend practice could limit, but not preclude, our ability to grow. If we continue paying dividends at the level currently anticipated, we may not retain a sufficient amount of cash to fund a material expansion of our business, including any acquisitions or growth opportunities requiring significant and unexpected capital expenditures. For that reason, our ability to pursue any material expansion of our business may depend on our ability to obtain third-party financing. We cannot guarantee that such financing will be available to us on reasonable terms or at all, particularly in the current economic environment.
20
Our organizational documents could limit or delay another party’s ability to acquire us and, therefore, could deprive our investors of a possible takeover premium for their shares. A number of provisions in our amended and restated certificate of incorporation and bylaws will make it difficult for another company to acquire us. Among other things, these provisions:
·
| Divide our Board of Directors into three classes, which results in roughly one-third of our directors being elected each year;
|
| |
·
| Provide that directors may only be removed for cause and then only upon the affirmative vote of holders of two-thirds or more of the voting power of our outstanding common stock;
|
| |
·
| Require the affirmative vote of holders of two-thirds or more of the voting power of our outstanding common stock to amend, alter, change, or repeal specified provisions of our amended and restated certificate of incorporation and bylaws;
|
| |
·
| Require stockholders to provide us with advance notice if they wish to nominate any candidates for election to our Board of Directors or if they intend to propose any matters for consideration at an annual stockholders meeting; and
|
| |
·
| Authorize the issuance of so-called “blank check” preferred stock without stockholder approval upon such terms as the Board of Directors may determine.
|
We also are subject to laws that may have a similar effect. For example, federal, Illinois, and Pennsylvania telecommunications laws and regulations generally prohibit a direct or indirect transfer of control over our business without prior regulatory approval. Similarly, Section 203 of the Delaware General Corporation Law restricts our ability to engage in a business combination with an “interested stockholder”. These laws and regulations make it difficult for another company to acquire us, and therefore could limit the price that investors might be willing to pay in the future for shares of our common stock. In addition, the rights of our common stockholders will be subject to, and may be adversely affected by, the rights of holders of any class or series of preferred stock that we may issue in the future.
Risks Relating to Our Indebtedness and Our Capital Structure
We have a substantial amount of debt outstanding and may incur additional indebtedness in the future, which could restrict our ability to pay dividends and fund working capital and planned capital expenditures. As of December 31, 2012, we had $1,217.8 million of debt outstanding. Our substantial level of indebtedness could adversely impact our business, including:
·
| We may be required to use a substantial portion of our cash flow from operations to make principal and interest payments on our debt, which will reduce funds available for operations, future business opportunities and dividends;
|
| |
·
| We may have limited flexibility to react to changes in our business and our industry;
|
| |
·
| It may be more difficult for us to satisfy our other obligations;
|
| |
·
| We may have a limited ability to borrow additional funds or to sell assets to raise funds if needed for working capital, capital expenditures, acquisitions, or other purposes;
|
| |
·
| We may become more vulnerable to general adverse economic and industry conditions, including changes in interest rates; and
|
| |
·
| We may be at a disadvantage compared to our competitors that have less debt.
|
We cannot guarantee that we will generate sufficient revenues to service our debt and have adequate funds left over to achieve or sustain profitability in our operations, meet our working capital and capital expenditure needs, compete successfully in our markets, or pay dividends to our stockholders.
Our credit agreement and the indenture governing the Senior Notes contain covenants that limit management’s discretion in operating our business and could prevent us from capitalizing on opportunities and taking other corporate actions. Among other things, our credit agreement limits or restricts our ability (and the ability of certain of our subsidiaries), and the indenture governing the Senior Notes limits the ability of our subsidiary, Consolidated Communications, Inc., and its restricted subsidiaries, to:
·
| Incur additional debt and issue preferred stock;
|
21
·
| Make restricted payments, including paying dividends on, redeeming, repurchasing, or retiring our capital stock;
|
| |
·
| Make investments and prepay or redeem debt;
|
| |
·
| Enter into agreements restricting our subsidiaries’ ability to pay dividends, make loans, or transfer assets to us;
|
| |
·
| Create liens;
|
| |
·
| Sell or otherwise dispose of assets, including capital stock of, or other ownership interests in, subsidiaries;
|
| |
·
| Engage in transactions with affiliates;
|
| |
·
| Engage in sale and leaseback transactions;
|
| |
·
| Engage in a business other than telecommunications; and
|
| |
·
| Consolidate or merge.
|
In addition, our credit agreement requires us to comply with specified financial ratios, including ratios regarding total leverage and interest coverage. Our ability to comply with these ratios may be affected by events beyond our control. These restrictions limit our ability to plan for or react to market conditions, meet capital needs, or otherwise constrain our activities or business plans. They also may adversely affect our ability to finance our operations, enter into acquisitions, or engage in other business activities that would be in our interest.
A breach of any of the covenants contained in our credit agreement, in any future credit agreement, or in the indenture governing the Senior Notes, or our inability to comply with the financial ratios could result in an event of default, which would allow the lenders to declare all borrowings outstanding to be due and payable. If the amounts outstanding under our credit facilities were to be accelerated, we cannot assure that our assets would be sufficient to repay in full the money owed. In such a situation, the lenders could foreclose on the assets and capital stock pledged to them.
We may not be able to refinance our existing debt if necessary, or we may only be able to do so at a higher interest expense. We may be unable to refinance or renew our credit facilities and our failure to repay all amounts due on the maturity dates would cause a default under the credit agreement. Alternatively, any renewal or refinancing may occur on less favorable terms. If we refinance our credit facilities on terms that are less favorable to us than the terms of our existing debt, our interest expense may increase significantly, which could impact our results of operations and impair our ability to use our funds for other purposes, such as to pay dividends.
Our variable-rate debt subjects us to interest rate risk, which could impact our cost of borrowing and operating results. Certain of our debt obligations are at variable rates of interest and expose us to interest rate risk. Increases in interest rates could negatively impact our results of operations and operating cash flows. To mitigate the risk of rising interest rates, we have entered into interest rate swap agreements that convert a portion of our variable-rate debt to a fixed-rate basis. However, we do not maintain interest rate hedging agreements for all of our variable-rate debt and our existing hedging agreements may not fully mitigate our interest rate risk, may prove disadvantageous or may create additional risks. Changes in fair value of cash flow hedges that have been determined to be ineffective are recognized in earnings. Significant increases or decreases in the fair value of ineffective cash flow hedges could cause favorable or adverse fluctuations in our results of operations.
Risks Relating to Our Business
We expect to continue to face significant competition in all parts of our business and the level of competition could intensify. The telecommunications, Internet and digital video businesses are highly competitive. We face actual or potential competition from many existing and emerging companies, including other incumbent and competitive local telephone companies, long-distance carriers and resellers, wireless companies, Internet service providers, satellite companies, cable television companies and in some cases by new forms of providers who are able to offer competitive services through software applications, requiring a comparatively small initial investment. Due to consolidation and strategic alliances within the industry, we cannot predict the number of competitors we will face at any given time.
22
The wireless business has expanded significantly and has caused many subscribers towith traditional telephone services and land-based Internet access services to give up those services and to rely exclusively on wireless service. Consumers are finding individual television shows of interest to them through the Internet and are watching content that is downloaded to their computers. Some providers, including television and cable television content owners, have initiated what are called “over-the-top”over-the-top (“OTT”) services that deliver video content to televisions and computers over the Internet. Over-the-topOTT services can include episodes of highly-rated television series in their current broadcast seasons. They also can include content that is related to broadcast or sports content that we carry, but that is distinct and may be available only through the alternative source. Finally, the transition to digital broadcast television has allowed many consumers to obtain high definition local broadcast television signals (including many network affiliates) over-the-air, using a simple antenna. Consumers can pursue each of these options without foregoing any of the other options. We may not be able to successfully anticipate and respond to many of these various competitive factors affecting the industry, including regulatory changes that may affect our competitors and us differently, new technologies, services and applications that may be introduced, changes in consumer preferences, demographic trends and discount or bundled pricing strategies by competitors. The incumbent telephone carrier in the markets we serve enjoys certain business advantages, including size, financial resources, favorable regulatory position, a more diverse product mix, brand recognition and connection to virtually all of our customers and potential customers. The largest cable operators also enjoy certain business advantages, including size, financial resources, ownership of or
22
Table of Contents
superior access to desirable programming and other content, a more diverse product mix, brand recognition and first-in-the-field advantages with a customer base that generates positive cash flow for its operations. Our competitors continue to add features and adopt aggressive pricing and packaging for services comparable to the services we offer. Their success in selling some services competitive with ours can lead to revenue erosion in other related areas. We face intense competition in our markets for long-distance, Internet access and other ancillary services that are important to our business and to our growth strategy. If we do not compete effectively we could lose customers, revenue and market share; customers may reduce their usage of our services or switch to a less profitable service; and we may need to lower our prices or increase our marketing efforts to remain competitive.
We must adapt to rapid technological change. If we are unable to take advantage of technological developments, or if we adopt and implement them more slowly than our competitors, we may experience a decline in the demand for our services. The telecommunications industry operates in a technologically complex environment. New technologies are continually developed and products and services undergo constant improvement. TheseEmerging technologies offer consumers a variety of choices for their communication needs. To remain competitive, we will need to adapt to future changes in technology to enhance our existing offerings and to introduce new or improved offerings that anticipate and respond to the varied and continually changing demands of our customers. If we are unable to match the benefits offered by competing technologies on a timely basis or at an acceptable cost, if we fail to employ technologies desired by our customers before our competitors do so, or if we do not successfully execute on our technology initiatives, our business and results of operations could be adversely affected.
New technologies, particularly alternative methods for the distribution, access and viewing of content, have been and will likely continue to be developed that will further increase the number of competitors that we face and drive changes in consumer behavior. Consumers seek more control over when, where and how they consume content and are increasingly interested in communication services outside of the home and in newer services in wireless Internet technology and devices such as tablets, smartphones and mobile wireless routers that connect to such devices. These new technologies, distribution platforms and consumer behavior may have a negative impact on our business.
In addition, evolving technologies can reduce the costs of entry for others, resulting in greater competition and give competitors significant new advantages. Technological developments could require us to make a significant new capital investment in order to remain competitive with other service providers. If we do not replace or upgrade our network and its technology once it becomes obsolete, we will be unable to compete effectively and will likely lose customers. We also may be placed at a cost disadvantage in offering our services. Technology changes are also allowing individuals to bypass telephone companies and cable operators entirely to make and receive calls, and to provide for the distribution and viewing of video programming without the need to subscribe to traditional voice and video products and services. Increasingly, this can be done over wireless facilities and other emerging mobile technologies as well as traditional wired networks. Wireless companies are aggressively developing networks using next-generation data technologies, which are capable of delivering high-speed Internet service via wireless technology to a large geographic footprint. As these technologies continue to expand in availability and reliability, they could become an effective alternative to our high-speed Internet services. Although we use fiber optics in parts of our networks, including in some residential areas, we continue to rely on coaxial cable and copper transport media to serve customers in many areas. The facilities we use to offer our video services, including the interfaces with customers, are undergoing a rapid evolution, and depend in part on the products, expertise and capabilities of third parties. If we cannot develop new services and products to keep pace with technological advances, or if such services and products are not widely embraced by our customer,customers, our results of operations could be adversely impacted.
Shifts in our product mix may result in declines in operating profitability. Margins vary among our products and services. Our profitability may be impacted by technological changes, customer demands, regulatory changes, the competitive nature of our business and changes in the product mix of our sales. These shifts may also result in our long-lived assets becoming impaired or our inventory becoming obsolete. We review long-lived assets for potential impairment if certain events or changes in circumstances indicate impairment may be present. We currently manage potential obsolescence through reserves, but future technology changes may exceed current reserves.
23
Table of Contents
Transport and content costs are substantial and continue to increase. We expect the cost of video transport and content costs to continue to be one of our largest operating costs associated with providing video service. Video programming content includes cable-oriented programming designed to be shown in linear channels, as well as the programming of local over-the-air television stations that we retransmit. In addition, on-demand programming is being made available in response to customer demand. In recent years, the cable industry has experienced rapid increases in the cost of programming, especially the costs for sports programming and for local broadcast station retransmission consent.content. Programming costs are generally assessed on a per-subscriber basis, and therefore, are related directly to the number of subscribers to which the programming is provided. Our relatively small base of subscribers limits our ability to negotiate lower per-subscriber programming costs. Larger providers often can qualify for discounts based on the number of their subscribers. This cost difference can cause us to experience reduced operating margins, while our competitors with a larger subscriber base may not experience similar margin compression. In addition, escalators in existing content agreements cause cost increases that are out of line with general inflation. While we expect these increases to continue we may not be able to pass our programming cost increases on to our customers, particularly as an increasing amount of programming content becomes available via the Internet at little or no cost. Also, some competitors (or their affiliates) own programming in their own right and we may be unable to secure license rights to that programming. As our programming contracts with content providers expire, there can be no assurance that they will be renewed on acceptable terms or that they will be renewed at all, in which case we may be unable to provide such programming as part of our video services packages and our business and results of operations may be adversely affected.
We receive cash distributions from our wireless partnership interests and the continued receipt of future distributions is not guaranteed. We own five wireless partnership interests consisting of 2.34% of GTE Mobilnet of South Texas Limited Partnership, which provides cellular service in the Houston, Galveston, and Beaumont, Texas metropolitan areas; 3.60% of Pittsburgh SMSA Limited Partnership, which provides cellular service in and around the Pittsburgh metropolitan area; 20.51% of GTE Mobilnet of Texas #17 Limited Partnership (“RSA #17”); 16.67% of Pennsylvania RSA No. 6(I) Limited Partnership (“RSA 6(I)”) and 23.67% of Pennsylvania RSA No. 6(II) Limited Partnership (“RSA 6(II)”). RSA #17 provides cellular service to a limited rural area in Texas. RSA 6(I) and RSA 6(II) provide cellular service in and around our Pennsylvania service territory.
In 2014, 2013 and 2012, we received cash distributions from these partnerships of $34.6 million, $34.8 million and $29.1 million, respectively. The cash distributions we receive from these partnerships are based on our percentage of ownership and the partnerships’ operating results, cash availability and financing needs, as determined by the General Partner at the date of the distribution. We cannot control the timing, dollar amount or certainty of any future cash distributions from these partnerships. In the absence of the receipt of cash distributions from these partnerships, we may be unable to fulfill our long-term obligations or our ability to pay cash dividends to our shareholders may be restricted. If we do not receive cash distributions from these partnerships in the future, or if the cash distributions decrease in amount, our results of operations could be adversely affected.
A disruption in our networks and infrastructure could cause delays or interruptions of service, which could cause us to lose customers and incur additional expenses. Our customers depend on reliable service over our network. The primary risks to our network infrastructure include physical damage to lines, security breaches, capacity limitations, power surges or outages, software defects and disruptions beyond our control, such as natural disasters and acts of terrorism. From time to time in the ordinary course of business, we will experience short disruptions in our service due to factors such as physical damage, inclement weather and service failures of our third party service providers. We could experience more significant disruptions in the future. Disruptions may cause interruptions in service or reduced capacity for customers, either of which could cause us to lose customers and incur unexpected expenses.
Our business may be harmed if we are unable to maintain data security. We are dependent upon automated information technology processes and systems. Any failure to maintain the security of our data and our employees’ and customers’ confidential information, including the breach of our network security or the misappropriation of confidential information, could result in fines, penalties, litigation, and loss of customers and revenues. Any such failure could adversely impact our business, financial condition and results of operations.
24
Table of Contents
We have employees who are covered by collective bargaining agreements. If we are unable to enter into new agreements or renew existing agreements before they expire, we could have a work stoppage or other labor actions that could materially disrupt our ability to provide services to our customers. At December 31, 2012,2014, approximately 28%27% of our employees were covered by collective bargaining agreements. These employees are hourly workers located in Texas, Pennsylvania, Minnesota and Illinois service territories and are represented by various unions and locals. Our relationship with these unions generally has been satisfactory, but occasional work stoppages can occur, including a four day work stoppage that did occur in December 2012. Our collective bargaining agreement with International BrotherhoodAll of Electrical Workers (“IBEW”) for our Illinois Incumbent Local Exchange Carrier (“ILEC”) expired on November 14, 2012. Employees continue to work without a contract and we remain in negotiations with the IBEW on a new collective bargaining agreement. All the other existing collective bargaining agreements expire between 20132015 through 2017, of which three contracts covering 14% of our employees will expire in 2015.
We cannot predict the outcome of negotiations of the collective bargaining agreements covering our employees. If we are unable to reach new agreements or renew existing agreements, employees subject to collective bargaining agreements may engage in strikes, work stoppages or slowdowns, or other labor actions, which could materially disrupt our ability to provide services. New labor agreements or the renewal of existing agreements may impose significant new costs on us, which could adversely affect our financial condition and result of operations. While we believe our relations with the unions representing these employees are good, any protracted labor disputes or labor disruptions by any of our employees could have a significant negative effect on our financial results and operations.
We may be unable to obtain necessary hardware, software and operational support from third party vendors. We depend on third party vendors to supply us with a significant amount of hardware, software and operational support necessary to provide certain of our services and to maintain, upgrade and enhance our network facilities and operations and to support our information and billing systems. Some of our third-party vendors are our primary source of supply for products and services for which there are few substitutes. If any of these vendors should experience financial difficulties, have demand that exceeds their capacity or they cannot otherwise meet our specifications, our ability to provide some services may be materially adversely affected in which case our business, results of operations and financial condition may be adversely affected.
24The loss of our certification or designation by key equipment manufacturers or business partners, or a partner losing its position as a leading provider of technology solutions would adversely impact our suite of business products and services. We provide various equipment solutions to our business customers. The equipment and product lines are provided by various manufacturers from which we also provide hardware and IT consulting solutions for our business customers. If our providers of equipment and certain technology solutions fall out of favor in the marketplace, our success as a distributor or implementer may decline or be delayed as we seek alternative providers. The loss of any special designations or authorizations may affect our success as a leading distributor. It is also possible that we may lose the certified technicians who build the basis for our qualifications.
If we cannot obtain and maintain necessary rights-of-way for our network, our operations may be interrupted and we would likely face increased costs. We are dependent on easements, franchises and licenses from various private parties such as established telephone companies and other utilities, railroads, long-distance companies and from state highway authorities, local governments and transit authorities for access to aerial pole space, underground conduits and other rights-of-way in order to construct and operate our networks. Some agreements relating to rights-of-way may be short-term or revocable at will, and we cannot be certain that we will continue to have access to existing rights-of-way after the governing agreements are terminated or expire. If any of our right-of-way agreements were terminated or could not be renewed, we may be forced to remove our network facilities from the affected areas, relocate or abandon our networks which would interrupt our operations and force us to find alternative rights-of-way and make unexpected capital expenditures.
Our ability to retain certain key management personnel and attract and retain highly qualified management and other personnel in the future could have an adverse effect on our business. We rely on the talents and efforts of key management personnel, many of whom have been with our company and in our industry for decades. While we maintain long-term and emergency transition plans for key management personnel and believe we could either identify internal candidates or attract outside candidates to fill any vacancy created by the loss of any key management personnel, the loss of one or more of our key management personnel and the ability to attract and retain highly qualified technical and management personnel in the future could have a negative impact on our business, financial condition and results of operations.
Future acquisitions could be expensive and may not be successful. From time to time we make acquisitions and investments and enter into other strategic transactions. In connectionsconnection with these types of transactions, we may incur unanticipated expenses,expenses; fail to realize anticipated benefits,benefits; have difficulty incorporating the acquired businesses,businesses; disrupt relationships with current and new employees, customers and vendors,vendors; incur significant indebtedness or have to delay or not proceed with announced transactions. The occurrence of any of the foregoing events could have a material adverse effect on our business, results of operations, cash flows and financial condition.
25
Table of Contents
Risks Relating to Our Acquisition of SureWestEnventis
The integration of the Company and SureWestEnventis following the merger may present significant challenges. We may face significant challenges in combining SureWest’sEnventis’ operations into our operations in a timely and efficient manner and in retaining key SureWestEnventis personnel. The failure to successfully integrate the Company and SureWestEnventis and to manage successfully the challenges presented by the integration process may result in our not achieving the anticipated benefits of the merger, including operational and financial synergies.
We will incur transaction, integration and restructuring costs in connection with the merger. We have incurred significant transaction costs in connection with the merger, including fees of our attorneys, accountants and financial advisors. We expect to continue to incur additional integration and restructuring costs as we continue to integrate the businesses of SureWestEnventis with those of the Company. Although we expect that the realization of efficiencies related to the integration of the businesses will offset incremental transaction, integration and restructuring costs over time, we cannot give any assurance that this net benefit will be achieved in the near term.
Risks Relating to Current Economic Conditions
Unfavorable changes in financial markets could adversely affect pension plan investments resulting in material funding requirements to meet our pension obligations. We expect that we will continue to make future cash contributions to our pension plans, the amount and timing of which will depend on various factors including funding regulations, future investment performance, changes in future discount rates and changes in participant demographics. Our pension plans have investments in marketable securities, including marketable debt and equity securities, whose values are exposed to changes in the financial markets. Returns generated on plan assets have historically funded a large portion of the benefits paid under these plans. If the financial markets experience a downturn and returns fall below the estimated long-term rate of return, our future funding requirements could increase significantly, which could adversely affect our cash flows from operations.
Weak economic conditions may have a negative impact on our business, results of operations and financial condition. Downturns in the economic conditions in the markets and industries we serve could adversely affect demand for our products and services and have a negative impact on our results of operations. Economic weakness or uncertainty may make it difficult for us to obtain new customers and may cause our existing customers to reduce or discontinue their services to which they subscribe. This risk may be worsened by the expanded availability of free or lower cost services, such as video over the Internet, or substitute services, such as wireless phones and data devices. Weak economic conditions may also impact the ability of third parties to satisfy their obligations to us.
Risks Relating to Our Common Stock and Payment of Dividends
Our Board of Directors could, at its discretion, depart from or change our dividend policy at any time. Our Board of Directors maintains a current dividend practice for the payment of quarterly dividends at an annual rate of approximately $1.55 per share of common stock. We are not required to pay dividends and our stockholders do not have contractual or other legal rights to receive them. Our Board of Directors may decide at any time, in its discretion, to decrease the amount of dividends, change or revoke the dividend policy or discontinue paying dividends entirely. Our ability to pay dividends is dependent on our earnings, capital requirements, financial condition, expected cash needs, debt covenant compliance and other factors considered relevant by our Board of Directors. If we do not pay dividends, for whatever reason, shares of our common stock could become less liquid and the market price of our common stock could decline.
We might not have sufficient cash to maintain current dividend levels. Our debt agreements, applicable state, legal and corporate law, regulatory requirements and other risk factors described in this section, could materially reduce the cash available from operations or significantly increase our capital expenditure requirements, and these outcomes could cause funds not to be available when needed in an amount sufficient to support our current dividend practice.
If we continue to pay dividends at the level currently anticipated under our dividend policy, our ability to pursue growth opportunities may be limited. Our dividend practice could limit, but not preclude, our ability to grow. If we continue paying dividends at the level currently anticipated, we may not retain a sufficient amount of cash to fund a material expansion of our business, including any acquisitions or growth opportunities requiring significant and unexpected capital expenditures. For that reason, our ability to pursue any material expansion of our business may depend on our ability to obtain third-party financing. We cannot guarantee that such financing will be available to us on reasonable terms or at all.
26
Table of Contents
Our organizational documents could limit or delay another party’s ability to acquire us and, therefore, could deprive our investors of a possible takeover premium for their shares. A number of provisions in our amended and restated certificate of incorporation and bylaws will make it difficult for another company to acquire us. Among other things, these provisions:
·Divide our Board of Directors into three classes, which results in roughly one-third of our directors being elected each year;
·Provide that directors may only be removed for cause and then only upon the affirmative vote of holders of two-thirds or more of the voting power of our outstanding common stock;
·Require the affirmative vote of holders of two-thirds or more of the voting power of our outstanding common stock to amend, alter, change or repeal specified provisions of our amended and restated certificate of incorporation and bylaws;
·Require stockholders to provide us with advance notice if they wish to nominate any candidates for election to our Board of Directors or if they intend to propose any matters for consideration at an annual stockholders meeting; and
·Authorize the issuance of so-called “blank check” preferred stock without stockholder approval upon such terms as the Board of Directors may determine.
We also are subject to laws that may have a similar effect. For example, federal, California, Illinois, Minnesota, and Pennsylvania telecommunications laws and regulations generally prohibit a direct or indirect transfer of control over our business without prior regulatory approval. Similarly, Section 203 of the Delaware General Corporation Law restricts our ability to engage in a business combination with an “interested stockholder”. These laws and regulations make it difficult for another company to acquire us, and therefore could limit the price that investors might be willing to pay in the future for shares of our common stock. In addition, the rights of our common stockholders will be subject to, and may be adversely affected by, the rights of holders of any class or series of preferred stock that we may issue in the future.
Risks Relating to Our Indebtedness and Our Capital Structure
We have a substantial amount of debt outstanding and may incur additional indebtedness in the future, which could restrict our ability to pay dividends and fund working capital and planned capital expenditures. As of December 31, 2014, we had $1,362.0 million of debt outstanding. Our substantial level of indebtedness could adversely impact our business, including:
·We may be required to use a substantial portion of our cash flow from operations to make principal and interest payments on our debt, which will reduce funds available for operations, future business opportunities and dividends;
·We may have limited flexibility to react to changes in our business and our industry;
·It may be more difficult for us to satisfy our other obligations;
·We may have a limited ability to borrow additional funds or to sell assets to raise funds if needed for working capital, capital expenditures, acquisitions or other purposes;
·We may become more vulnerable to general adverse economic and industry conditions, including changes in interest rates; and
·We may be at a disadvantage compared to our competitors that have less debt.
We cannot guarantee that we will generate sufficient revenues to service our debt and have adequate funds left over to achieve or sustain profitability in our operations, meet our working capital and capital expenditure needs, compete successfully in our markets, or pay dividends to our stockholders.
Our credit agreement and the indentures governing our 2020 Notes and 2022 Notes contain covenants that limit management’s discretion in operating our business and could prevent us from capitalizing on opportunities and taking other corporate actions. Among other things, our credit agreement limits or restricts our ability (and the ability of certain of our subsidiaries), and the separate indentures governing the 2020 Notes and 2022 Notes limit the ability of our subsidiary, Consolidated Communications, Inc., and its restricted subsidiaries to: incur additional debt and issue preferred stock; make restricted payments, including paying dividends on, redeeming, repurchasing or retiring our capital stock; make investments and prepay or redeem debt; enter into agreements restricting our subsidiaries’ ability to pay dividends, make loans or transfer assets to us; create liens; sell or otherwise dispose of assets, including capital stock of, or other ownership interests in subsidiaries; engage in transactions with affiliates; engage in sale and leaseback transactions; engage in a business other than telecommunications; and consolidate or merge.
27
Table of Contents
In addition, our credit agreement requires us to comply with specified financial ratios, including ratios regarding total leverage and interest coverage. Our ability to comply with these ratios may be affected by events beyond our control. These restrictions limit our ability to plan for or react to market conditions, meet capital needs or otherwise constrain our activities or business plans. They also may adversely affect our ability to finance our operations, enter into acquisitions or engage in other business activities that would be in our interest.
A breach of any of the covenants contained in our credit agreement, in any future credit agreement, or in the separate indentures governing the 2020 Notes and the 2022 Notes, or our inability to comply with the financial ratios could result in an event of default, which would allow the lenders to declare all borrowings outstanding to be due and payable. If the amounts outstanding under our credit facilities were to be accelerated, we cannot assure that our assets would be sufficient to repay in full the money owed. In such a situation, the lenders could foreclose on the assets and capital stock pledged to them.
We may not be able to refinance our existing debt if necessary, or we may only be able to do so at a higher interest expense. We may be unable to refinance or renew our credit facilities and our failure to repay all amounts due on the maturity dates would cause a default under the credit agreement. Alternatively, any renewal or refinancing may occur on less favorable terms. If we refinance our credit facilities on terms that are less favorable to us than the terms of our existing debt, our interest expense may increase significantly, which could impact our results of operations and impair our ability to use our funds for other purposes, such as to pay dividends.
Our variable-rate debt subjects us to interest rate risk, which could impact our cost of borrowing and operating results. Certain of our debt obligations are at variable rates of interest and expose us to interest rate risk. Increases in interest rates could negatively impact our results of operations and operating cash flows. We utilize interest rate swap agreements to convert a portion of our variable-rate debt to a fixed-rate basis. However, we do not maintain interest rate hedging agreements for all of our variable-rate debt and our existing hedging agreements may not fully mitigate our interest rate risk, may prove disadvantageous or may create additional risks. Changes in fair value of cash flow hedges that have been de-designated or determined to be ineffective are recognized in earnings. Significant increases or decreases in the fair value of these cash flow hedges could cause favorable or adverse fluctuations in our results of operations.
Risks Related to the Regulation of Our Business
We are subject to a complex and uncertain regulatory environment, and we face compliance costs and restrictions greater than those of many of our competitors. Our businesses are subject to regulation by the Federal Communications Commission (“FCC”) and other Federal, state and local entities. Rapid changes in technology and market conditions have required corresponding changes in how government addresses telecommunications, video programming and Internet services. Many businesses that compete with our ILECIncumbent Local Exchange Carrier (“ILEC”) and Non-ILECnon-ILEC subsidiaries are comparatively less regulated. Some of our competitors are either completely free from utilities regulation or are regulated on a significantly less burdensome basis. Further, in comparison to our subsidiaries regulated as cable operators, satellite video providers, on-demand and over-the-topOTT video providers, and motion picture and DVD firms have almost no regulation of their video activities. Recently, Federal and state authorities have become far more active in seeking to address critical issues in each of our product and service markets. The adoption of new laws or regulations or changes to the existing regulatory framework at the federal or state levels could require significant and costly adjustments, and adversely affect our business plans. New regulations could impose additional costs or capital requirements, require new reporting, impair revenue opportunities, potentially impede our ability to provide services in a manner that would be attractive to our customers and us and potentially create barriers to enter new markets or acquire new lines of business. We face continued uncertainty in the regulatory area for the immediate
25
future. Not only are these governmental entities continuing to move forward on these matters, their actions remain subject to reconsideration, appeal and legislative modification over an extended period of time, and it is unclear how their actions ultimately will impact our markets. We cannot predict future developments or changes to the regulatory environment or the impact such developments or changes may have on us.
28
Table of Contents
We receive support from various funds established under federal and state law and the continued receipt of that support is not assured.A significant portion of our ILECs’ revenues come from network access and subsidies. An order adopted by the FCC in 2011 (the “Order”) may significantly impact the amount of support revenue we receive from Universal Service Fund (“USF”)/Connect America Fund (“CAF”) and intercarrier compensation (“ICC”). The Order reformed core parts of the USF, broadly recast the existing ICC scheme and established the CAF to replace support revenues provided by the current USF and redirects support from voice services to broadband services. In 2012, the first phase of the CAF was implemented, freezing USF support to a price cap holding companycompanies until the FCC implementsimplemented a broadband cost model to shift support from voice service to broadband. In December 2014, the FCC issued an order finalizing the transition to CAF Phase II. If companies accept Phase II model-based support, then funding will continue at the new support level for a period of six years. Additionally, if Phase II funding is less than the frozen Phase I support, then there will be a three year step-down to Phase II. The FCC expects to release the final model-based support in the first quarter of 2015. If companies do not accept Phase II model-based support, then the frozen Phase I support will continue until the competitive bidding process is complete, and funding areas are awarded to the participating carriers. The bidding is expected to commence in late 2015 after the release of the final model support, and broadband which couldbuild out funding will be as early as July 2013.received for 10 years by the carriers chosen during the auction process. If companies chose not to accept Phase II model-based support, they may still engage in the competitive bidding process. We are currently reviewing our Phase II options. The amount of the impact cannot yet be determined, however, we anticipate that our revenues will be significantly impacted when the broadband cost model is implemented.
The orderOrder also modifies the methodology used for ICC traffic exchanged between carriers. The initial phase of ICC reform was effective on July 1, 2012, beginning the transition of our terminating switched access rates to bill-and-keep over a seven year period. As a result of implementing the provisions of the Order, our 2012 network access revenues decreased approximately $972 thousand.$1.4 million during 2014. We anticipate network access revenues will continue to decline as a result of the Order through 2018 and could be2017 by as much as $2.1 million, $1.9 million, $805 thousand, $936 thousand, $1.0and $4.7 million $2.5 million and $618 thousand in 2013, 2014, 2015, 2016, and 2017, and 2018, respectively.
The Order is currently subject to both reconsideration and appeal. Further regulatory actions on these issues may have a material impact on our consolidated financial position and our results of operations in future periods. The impact cannot be fully determined at this time.
We receive subsidy payments from various federal or state universal service support programs. These include high cost support, Lifeline, Schools and Libraries programs within the Federal universal service program. In addition, our Pennsylvania and Texas ILEC’sILECs receive state universal service funding. The Pennsylvania PUC (“PAPUC”) issued an order in 2012 addressing state ICC and USF, but rescinded the order in early 2012 due to the FCC order usurping the PAPUC rules. In the future, the PAPUC may reintroduce a universal service proceeding. In Texas, the Public Utilities Commission of Texas (“PUCT”) has initiated a proceeding to review the large company and small company high cost funds. The proceedings will undertakeundertook a comprehensive review of high cost funds and provided recommended changes to the legislature. Any legislative or PUCT action would not occur untilIn June 2013, the Texas state legislature passed Senate Bill No. 583 (“SB 583”). The provisions of SB 583 were effective September 1, 2013 and froze the small and rural incumbent local exchange company plan high cost fund (“HCF”) and high cost assistance fund (“HCAF”) support for the remainder of 2013 and eliminated our annual $1.4 million HCAF support, effective January 1, 2014. In July 2013, the Company entered into a settlement agreement with the PUCT on Docket 41097, which was approved by the PUCT on August 30, 2013. In accordance with the provisions of settlement agreement, our HCF draw will be reduced by approximately $1.2 million annually, or approximately $4.8 million in total, over a four year period beginning June 1, 2014 through 2018.
The total cost of all of the various Federal universal service programs has increased greatly in recent years, putting pressure on regulators to reform them, and to limit both eligibility and support flows. We cannot predict when or how these matters will be decided or the effect on our subsidy revenues. However, future reductions in the subsidies we receive may directly affect our profitability and cash flows.
The support we receive from the FCC is subject to a change in accounting treatment, and may impact how future support is recorded to the financial statements. Certain funds that we receive from the FCC to subsidize our broadband build out are recorded as revenue on our financial statements, while other funds are recorded as an asset reduction. The direction of how to record these items is driven by the FCC, and is subject to change. Future Federal support we receive and how we are instructed to record it may result in a reduction to our revenue by as much as $9.0 million of the CAF Phase II funding, however; once the broadband cost model is implemented, the estimated impact may be modified.
29
Table of Contents
Increased regulation of the Internet could increase our cost of doing business. Currently, there exists only a small body of law and regulation applicable to access to, or commerce on, the Internet. As the significance of the Internet expands, federal, state and local governments may adopt new rules and regulations or apply existing laws and regulations to the Internet. At the federal level, the FCC intends to reclassify broadband Internet services as a telecommunications service subject to regulation under Title II of the Telecommunications Act of 1996, and is expected to issue an order in the first quarter of 2015. The outcome of these proceedings may affect our regulatory obligations, costs and competition for our services which could have a material adverse effect on our profitability. In addition, certain members of Congress have proposed legislation that would ban the blocking of Internet traffic, and impose non-discrimination requirements on broadband Internet access providers. If such legislation is passed, it could adversely impact our ability to profitably operate our network.
We are subject to extensive laws and regulations relating to the protection of the environment, natural resources, and worker health and safety. Our operations and properties are subject to federal, state, and local laws and regulations relating to protection of the environment, natural resources, and worker health and safety, including laws and regulations governing and creating liability in connection with the management, storage, and disposal of hazardous materials, asbestos and petroleum products. We also are subject to laws and regulations governing air emissions from our fleets of vehicles. As a result, we face several risks, including:
·Hazardous materials may have been released at properties that we currently own or formerly owned (perhaps through our predecessors). Under certain environmental laws, we could be held liable, without regard to fault, for the costs of investigating and remediating any actual or threatened contamination at these properties and for contamination associated with disposal by us or our predecessors of hazardous materials at third-party disposal sites. | Hazardous materials may have been released at properties that we currently own or formerly owned (perhaps through our predecessors). Under certain environmental laws, we could be held liable, without regard to fault, for the costs of investigating and remediating any actual or threatened contamination at these properties and for contamination associated with disposal by us or our predecessors of hazardous materials at third-party disposal sites.
|
| |
·
| We could incur substantial costs in the future if we acquire businesses or properties subject to environmental requirements or affected by environmental contamination. In particular, environmental laws regulating wetlands, endangered species, and other land use and natural resource issues may increase costs associated with future business or expansion opportunities or delay, alter, or interfere with such plans.
|
26·We could incur substantial costs in the future if we acquire businesses or properties subject to environmental requirements or affected by environmental contamination. In particular, environmental laws regulating wetlands, endangered species, and other land use and natural resource issues may increase costs associated with future business or expansion opportunities or delay, alter, or interfere with such plans.
·The presence of contamination can adversely affect the value of our properties and make it difficult to sell any affected property or to use it as collateral. ·We could be held responsible for third-party property damage claims, personal injury claims, or natural resource damage claims relating to contamination found at any of our current or past properties. | The presence of contamination can adversely affect the value of our properties and make it difficult to sell any affected property or to use it as collateral.
|
| |
·
| We could be held responsible for third-party property damage claims, personal injury claims, or natural resource damage claims relating to contamination found at any of our current or past properties.
|
The cost of complying with environmental requirements could be significant. Similarly, the adoption of new environmental laws or regulations or changes in existing laws or regulations or their interpretations could result in significant compliance costs or unanticipated environmental liabilities.
Item 1B. Unresolved Staff Comments.
None.
Item 2. Properties.
Our corporate headquarters are located at 121 S. 17th St.,Street, Mattoon, Illinois, a leased facility. We also own and lease office facilities and related equipment for administrative personnel, central office buildings and operations in Illinois, Pennsylvania, Texas, California, Kansas, Missouri, Minnesota, Iowa and Missouri utilized primarily by our Telephone Operations segment.North Dakota. We own approximately 21 acres of undeveloped land in Roseville, California. Our Other Operations segment shares certain facilities with the Telephone Operations segment in Illinois.
In addition to land and structures, our property consists of equipment necessary for the provision of communication services including central office equipment, customer premises equipment and connections, pole lines, video head-end, remote terminals, aerial and underground cable and wire facilities, vehicles, furniture and fixtures, computers and other equipment. We also own certain other communications equipment held as inventory for sale or lease.
In addition to plant and equipment that we wholly-own, we utilize poles, towers and cable and conduit systems jointly-owned with other entities and lease space on facilities to other entities. These arrangements are in accordance with written agreements customary in the industry.
We have appropriate easements, rights of way and other arrangements for the accommodation of our pole lines, underground conduits, aerial and underground cables and wires. See Note 11 in the Notes to Consolidated Financial Statements and Part II - Item 7 – “Management’s Discussion and Analysis of Financial Condition and Results of Operations” for information regarding our lease obligations.
As a result30
Table of efficiencies realized through cost controls and efficiencies gained through our acquisition of SureWest Communications in February 2012, certain of our owned and leased facilities are not being utilized to their full capacity. We are actively reviewing all of our holdings to determine if we have excess properties. Contents
As of December 31, 2012, we are actively marketing2014, 21 acres of undeveloped land and an office campus in Roseville, California andare in escrow pending a sale to a third party with an office buildingexpected close date in Cranbury, Pennsylvania.the third quarter of 2015.
Item 3.Legal Proceedings.
Prior to the completion of the SureWest Merger on July 2, 2012, sixFive putative class action lawsuits werehave been filed by alleged SureWestEnventis shareholders challenging the Company’s proposed merger with SureWestEnventis in which the Company, WH Acquisition Corp. and WH Acquisition II Corp, SureWestSky Merger Sub Inc., Enventis and members of the SureWestEnventis board of directors have been named as defendants. FiveThe shareholder actions were filed in the Superior Court of California, PlacerFifth Judicial District, Blue Earth County, and one shareholder action was filed in the United States District Court for the Eastern District of California.Minnesota. The actions are called Needlescalled: Hoepner v. SureWest Communications,Enventis Corp. et al.al, filed February 17, 2012, ErrecartJuly 15, 2014, Case No. 07-CV-14-2489, Bockley v. Oldham,Finke et al.al, filed February 24, 2012, SpringerJuly 18, 2014, Case No. 07-CV-14-2551, Kaplan et al v. SureWest Communications,Enventis Corp. et al.al, filed March 9, 2012, AievoliJuly 21, 2014, Case No. 07-CV-14-2575, Marcial v. Oldham,Enventis Corp. et al.al., filed March 15, 2012,July 25, 2014, Case No. 07-CV-14-2628, and WaterburyBarta v. SureWest Communications,Finke et al.al, filed March 26, 2012, and the federal action is called Broering v. Oldham, et al., filed April 18, 2012.August 14, 2014, Case No. 07-CV-14-2854. The actions generally allege, among other things, that each member of the SureWestEnventis board of directors breached fiduciary duties to SureWestEnventis and its shareholders by authorizing the sale of SureWestEnventis to the Company for consideration that allegedly wasis unfair to the SureWestEnventis shareholders, and agreedagreeing to terms that allegedly unduly restrict other bidders from making a competing offer.offer, as well as allegations regarding disclosure deficiencies in the joint proxy statement/prospectus. The complaints also allege that the Company and SureWestSky Merger Sub Inc. aided and abetted the breaches of fiduciary duties allegedly committed by the members of the SureWestEnventis board of directors. The Broering complaint also alleges, amonglawsuits seek, amongst other things, that the joint proxy statement/prospectus filed with the SEC on March 28, 2012 did not make sufficient disclosures regarding the merger, that SureWest’s board should have appointed an independent committee to negotiate the transaction and that SureWest should have gone back to another bidder to create a competitive bid
27
process. The lawsuits seek equitable relief, including an order to prevent the defendants from consummating the merger on the agreed-upon terms and/or an awardterms. The Enventis board of unspecified monetary damages.directors appointed a Special Litigation Committee to address the claims. We believe that these claims are without merit. On March 14, 2012,September 19, 2014, the Placer County SuperiorDistrict Court entered an order consolidating the Needles, Errecart and Springer actions into a single action underfive lawsuits as In Re: Enventis Corporation Shareholder Litigation, Case No. 07-CV-14-2489. On September 23, 2014, the caption In re SureWest Communications Shareholder Litigation. Under the terms of this order, all cases subsequently filed in the Superior Court for the State of California, County of Placer, that relate to the same subject matter and involve similar questions of law or fact were to be consolidated with these cases as well. This included the Aievoli and Waterbury cases. On April 10, 2012, the plaintiff in Waterbury filed a request for voluntary dismissal of her complaint without prejudice. On May 18, 2012, pursuant to the parties’ stipulation, the federalDistrict Court entered an order stayingthat denied the Broering actionplaintiffs’ request for 90 days. The federal Court subsequently extendedexpedited proceedings and stayed all proceedings “pending the staycompletion of the Broering action until June 1, 2013.Special Litigation Committee and the issuance of its decision.” On June 1, 2012,February 2, 2015, the parties entered intoSpecial Litigation Committee issued a proposed settlementreport stating that the claims lack merit and should not proceed.
In 2014, Sprint Corporation, Level 3 Communications, Inc., and Verizon Communications Inc. filed lawsuits against us and many others in the industry regarding the proper charges to be applied between interexchange and local exchange carriers for certain calls between mobile and wireline devices that are routed through an interexchange carrier. The plaintiffs are refusing to pay these access charges in all states and are seeking refunds of past charges paid. The disputed amounts total $1.2 million, and cover the periods extending from 2006. CenturyLink, Inc. has filed to bring all of the shareholder actions without any admission of liability by the Company or the other defendants. Pursuantrelated suits to the proposed settlement, SureWest agreedU.S. District Court’s Judicial Panel on multi district litigation. This panel is granted authority to make, and subsequently made, certain additional disclosures intransfer to a Current Report on Form 8-K filed with the SEC in advance of the special meeting of SureWest shareholders held on June 12, 2012. The proposed settlement also provided that plaintiffs’ counsel collectively are to receive attorneys’ fees of $0.525 million, of which the Company is to pay $36.25 thousand, with the balance to be paid by SureWest and its insurer. The proposed settlement is subject to approval by the Placer County Superior Court. On December 20, 2012, the court issued a ruling preliminarily approving the proposed settlement. The court set a hearing for March 28, 2013 at which it will consider final approval of the proposed settlement. Upon final approval by thesingle court the consolidated state court actionspretrial proceedings for civil cases involving common questions of fact. The U.S. District Court in Dallas, TX is expected to hear the case no later than September 2015. We have interconnection agreements in place with all wireless carriers and the federal action will be dismissed with prejudice.applicable traffic is being billed at current access rates, therefore we do not expect any potential settlement to have an adverse material impact on our financial results or cash flows.
On April 15, 2008, Salsgiver Inc., a Pennsylvania-based telecommunications company, and certain of its affiliates (“Salsgiver”) filed a lawsuit against us and our subsidiaries North Pittsburgh Telephone Company and North Pittsburgh Systems Inc. in the Court of Common Pleas of Allegheny County, Pennsylvania alleging that we have prevented Salsgiver from connecting their fiber optic cables to our utility poles. Salsgiver seeks compensatory and punitive damages as the result of alleged lost projected profits, damage to its business reputation, and other costs. Salsgiver originally claimed to have sustained losses of approximately $125 million and did not request a specific dollar amount in damages.million. We believe that these claims are without merit and that the alleged damages are completely unfounded. We intend to defend against these claims vigorously. Discovery concluded and Consolidated filed a motion for summary judgment on June 18, 2012 and the court heard oral arguments on August 30, 2012. On February 12, 2013, the court, granted, in part, Consolidated’sgranted our motion. The court ruled that Salsgiver could not recover prejudgment interest and could not use as a basis of liability any actions prior to April 14, 2006. In September 2013, in order to avoid the distraction and uncertainty of further litigation, we reached an agreement in principle (the “Agreement”) with Salsgiver, Inc. In accordance with the terms of the Agreement, we would pay Salsgiver approximately $0.9 million in cash and grant approximately $0.3 million in credits that may be used for make-ready charges (the “Credits”). The Credits would be available for services performed in connection with the pole attachment applications within five years of the execution of the Agreement. We anticipate a status conference being heldhad previously recorded approximately $0.4 million in late March2011 in anticipation of the settlement of this case. During the quarter ended September 30, 2013, atper the terms of the Agreement we recorded an additional $0.9 million, which timeincluded estimated legal fees. In October 2014, Salsgiver rejected the court will set a briefing andAgreement, remanding the case back to the court. A trial schedule.is anticipated to occur in the third quarter of 2015; however, we believe that despite the rejection, the $1.3 million currently accrued represents management’s best estimate of the probable payment.
In addition, we have asked the Federal Communications Commission (“FCC”) Enforcement Bureau to address Salsgiver’s unauthorized pole attachments and safety violations on those attachments. We believe that these are violations31
Table of an FCC order regarding Salsgiver’s complaint against us. We do not believe that these claims will have a material adverse impact on our financial results.Contents
Two of our subsidiaries, Consolidated Communications of Pennsylvania Company LLC (“CCPA”) and Consolidated Communications Enterprise Services, Inc. (“CCES”), have, at various times, received assessment notices from the Commonwealth of Pennsylvania Department of Revenue (“DOR”) increasing the amounts owed for Pennsylvania Gross Receipt Taxes, and/or have had audits performed for the tax period ending December 31, 2009. These two assessments adjusted the subsidiaries’ combined total outstanding taxable gross receipts liability (with interest) to approximately $2.3 million.years of 2008 through 2013. In addition, based upon recently completed audits of CCESa re-audit was performed on CCPA for 2008, 2009the 2010 calendar year. For the calendar years for which we received both additional assessment notices and 2010, we believe the Commonwealth of Pennsylvania may issue additional assessments totaling approximately $1.7 million for Gross Receipt Taxes allegedly owed. Our CCPA subsidiary has alsoaudit actions, those issues have been notifiedcombined by the Commonwealth of Pennsylvania that they will conductDOR into a gross receipts auditsingle Docket for each year.
For the CCES subsidiary, the total additional tax liability calculated by the auditors for the tax years 2008-2013 is approximately $4.6 million. Audits for calendar year 2008. An appeal challenging the 2009 CCPA assessment was filed with the Department of Revenue’s Board of Appeals on September 15, 2011, and we filed a similar appeal for CCES with the Board of Appeals on November 11, 2011 challenging the 2009 CCES assessment. The Board of Appeals denied CCPA and CCES’s appeals. On November 13, 2012, CCPA and CCES filed appeals with the Commonwealth’s Board of Finance and Revenue. Theseyears 2008-2010 have been stayedfiled for appeal and have received continuance pending the outcome of present litigation in the Commonwealth Court between Verizon Pennsylvania, Inc. and the Commonwealth of Pennsylvania (Verizon Pennsylvania, Inc. v. Commonwealth, Docket No. 266 F.R. 2008). The preliminary audit findings for the calendar years 2011-2013 were received on September 16, 2014. We are waiting invoicing for each of these years, at which time we will prepare to file an appeal with the DOR.
For the CCPA subsidiary, the total additional tax liability calculated by the auditors for calendar years 2008-2013 (using the re-audited 2010 number) is approximately $6.7 million. Appeals of cases for calendar years 2008, 2009, and the original 2010 audit have been filed and have received continuance pending the outcome of present litigation in the Commonwealth of Pennsylvania (Verizon Pennsylvania, Inc. v. Commonwealth, Docket No. 266 F.R. 2008). The preliminary audit findings for the calendar years 2011-2013, as well as the re-audit of 2010 were received on September 16, 2014. We are awaiting invoicing for each of these years, at which time we will prepare to file an appeal with the DOR.
We anticipate that the outstanding audits and subsequent appeals will be continued pending the outcome of the Verizon litigation as well. The Gross Receipts Tax issues in the Verizon Pennsylvania case are substantially the same as those presently facing CCPA and CCES. In addition, there are numerous telecommunications carriers with Gross Receipts Tax matters dealing with the same issues that are in various stages of appeal before the Board of Finance and Revenue and the Commonwealth Court. Those appeals by
28
other similarly situated telecommunications carriers have been continued until resolution of the Verizon Pennsylvania case. We believe that these assessments and the positions taken by the Commonwealth of Pennsylvania are without substantial merit. We do not believe that the outcome of these claims will have a material adverse impact on our financial results or cash flows.
We currently provide telephone service to inmates incarcerated at facilities operated by the Illinois Department of Corrections. On June 27, 2012, the Illinois Department of Central Management Services announced its intent to replace the Company as the provider of those services with a competitor, Securus Technologies, Inc. We have challenged Securus’ bid, and the State’s decision to accept that bid, in a variety of different forums including: (i) protests with the Chief Procurement Officer of the Illinois Executive Ethics Commission, which were denied, (ii) a lawsuit filed in the Circuit Court of Sangamon County, Illinois that was dismissed, but is now under appeal in the Illinois Appellate Court Fourth District, (iii) a declaratory ruling request filed with the Illinois Commerce Commission and (iv) a complaint filed with the Illinois Procurement Policy Board. In each of those challenges, we claimed either that Securus was not a responsible vendor, as defined by the State’s bid solicitation document, and/or that rates for the services Securus proposes to provide are subject to regulatory limits below those Securus has proposed to charge. Although we will continue to pursue legal recourse to the State’s decision, our business plans and projections assume that our contract with the State of Illinois will end during 2013.
On January 18, 2012, we filed a petition with the U.S. Court of Appeals for the District of Columbia Circuit to review the FCC’s Order issued November 18, 2011 that reformed intercarrier compensation and core parts of the Universal Service Fund. We are appealing five core issues in the November 18, 2011 FCC order. The U.S. Court of Appeals for the tenth circuit will hear oral arguments on November 19, 2013.
We are from time to time involved in various other legal proceedings and regulatory actions arising out of our operations. We do not believe that any of these, individually or in the aggregate, will have a material adverse effect upon our business, operating results or financial condition.
Item 4.Mine Safety Disclosures.
Not Applicable.
2932
Table of Contents
PART II
Item 5. Market for Registrant’s Common Equity, Related Stockholder Matters and Issuer Purchases of Equity Securities.
Our common stock is traded on The NASDAQ Global Select Market (“NASDAQ”) under the symbol “CNSL”. As of February 15, 2013,13, 2015, there were approximately 3,7514,704 stockholders of record of the Company’s common stock. The following table indicates the range of stock closing prices of the Company’s common stock as reported on the NASDAQ, for each of the quarters ending on the dates indicated:
| | 2012 | | 2011 | | | 2014 | | 2013 |
Period | | High | | Low | | High | | Low | | | High | | Low | | High | | Low |
First quarter | | 19.80 | | 18.08 | | 19.50 | | 17.25 | | | 20.39 | | 18.41 | | 17.86 | | 16.37 |
Second quarter | | 19.63 | | 13.95 | | 19.50 | | 17.94 | | | 22.29 | | 18.94 | | 18.95 | | 16.58 |
Third quarter | | 17.79 | | 15.21 | | 20.02 | | 16.77 | | | 25.72 | | 21.27 | | 18.50 | | 16.67 |
Fourth quarter | | 17.40 | | 13.48 | | 19.39 | | 16.83 | | | 28.60 | | 24.29 | | 19.75 | | 17.32 |
Dividend Policy and Restrictions
Our Board of Directors declared dividends of approximately $0.38738 per share in each of the periods listed above. Our Board of Directors adopted a dividend policy that reflects its judgment that our stockholders are better served if we distribute a substantial portion of the cash generated by our business in excess of our expected cash needs rather than retaining the cash or using it for investments, acquisitions, or other purposes. We expect to continue to pay quarterly dividends at an annual rate of approximately $1.55 per share during 2013.2015. Future dividend payments are at the discretion of our Board of Directors. Changes in our dividend program will depend on our earnings, capital requirements, financial condition, debt covenant compliance, expected cash needs and other factors considered relevant by our Board of Directors. Dividends on our common stock are not cumulative.
See Part II - Item 7–“Management’s7 “Management’s Discussion and Analysis of Financial Condition and Results of Operations – Liquidity and Capital Resources” for a discussion regarding restrictions on the payment of dividends. See Part I – Item 1A – “Risk Factors” of this report, which sets forth several factors that could prevent stockholders from receiving dividends in the future. Additional information concerning dividends may be found in “Selected Financial Data” in Item 6, which is incorporated herein by reference.
Share Repurchases
During the quarter ended December 31, 2012,2014, we repurchased 36,91468,624 common shares surrendered by employees in the administration of employee share-based compensation plans. The following table summarizes the share repurchase activity:
| | | | | | Total number of | |
| | | | | | shares purchased | |
| | Total number of | | Average price | | as part of publicly | |
Purchase period | | shares purchased | | paid per share | | announced plans | |
October 1-October 31, 2012 | | - | | n/a | | n/a | |
November 1-Novermber 30, 2012 | | - | | n/a | | n/a | |
December 1-December 31, 2012 | | 36,914 | | $ 15.14 | | n/a | |
| | | | | | Total number of | | Maximum number | |
| | | | | | shares purchased | | of shares that may | |
| | | | | | as part of publicly | | yet be purchased | |
| | Total number of | | Average price | | announced plans | | under the plans | |
Purchase period | | shares purchased | | paid per share | | or programs | | or programs | |
October 1-October 31, 2014 | | - | | n/a | | n/a | | n/a | |
November 1-November 30, 2014 | | 12,483 | | 25.55 | | n/a | | n/a | |
December 1-December 31, 2014 | | 56,141 | | 27.38 | | n/a | | n/a | |
Performance Graph
The following graph shows a five-year comparison of cumulative total shareholder return of our common stock (assuming dividend reinvestment) with the S&P 500 index, the Dow Jones US Fixed-Line Telecommunications Subsector index and a customized peer group of four companies that includes: Alaska Communications Systems Group, Inc., Consolidated Communications Holdings, Inc., Otelco, Inc. and Shenandoah Telecommunications Company. The comparison of total return on investment (change in year-end stock price plus reinvested dividends) for each of the periods assumes that $100 was invested on December 31, 20072009 respectively in each index, and in the peer group. The stock performance shown on the graphs below is not necessarily indicative of future price performance.
3033
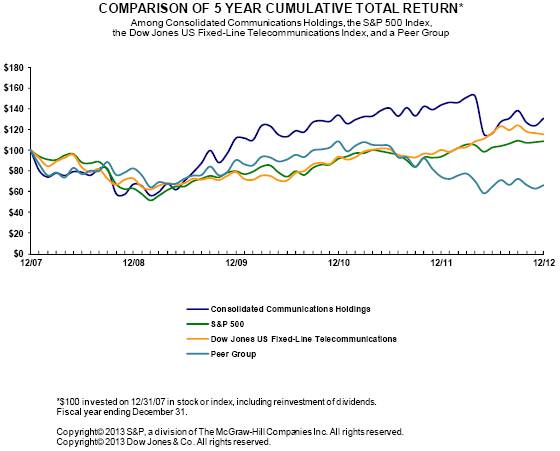
| | At December 31, | |
(In dollars) | | | 2007 | | | | 2008 | | | | 2009 | | | | 2010 | | | | 2011 | | | | 2012 | |
Consolidated Communications Holdings, Inc. | | | $ | 100 | | | | $ | 67 | | | | $ | 111 | | | | $ | 134 | | | | $ | 143 | | | | $ | 131 | |
S&P 500 | | | $ | 100 | | | | $ | 63 | | | | $ | 80 | | | | $ | 92 | | | | $ | 94 | | | | $ | 109 | |
Dow Jones US Fixed-Line Telecommunications | | | $ | 100 | | | | $ | 73 | | | | $ | 79 | | | | $ | 94 | | | | $ | 100 | | | | $ | 115 | |
Peer group | | | $ | 100 | | | | $ | 82 | | | | $ | 90 | | | | $ | 108 | | | | $ | 74 | | | | $ | 66 | |
COMPARISON OF 5 YEAR CUMULATIVE TOTAL RETURN*
Among Consolidated Communications Holdings, the S&P 500 Index, the Dow Jones US
Fixed Line Telecommunications Subsector Index,
and a Peer Group
*$100 invested on 12/31/09 in stock or index, including reinvestment of dividends.
Fiscal year ending December 31.
Copyright© 2015 S&P, a division of The McGraw-Hill Companies Inc. All rights reserved.
Copyright© 2015 Dow Jones & Co. All rights reserved.
| | At December 31, | |
(In dollars) | | 2009 | | 2010 | | 2011 | | 2012 | | 2013 | | 2014 | |
Consolidated Communications Holdings, Inc. | | $ | 100.00 | | $ | 120.13 | | $ | 128.77 | | $ | 117.35 | | $ | 158.07 | | $ | 241.18 | |
S&P 500 | | $ | 100.00 | | $ | 115.06 | | $ | 117.49 | | $ | 136.30 | | $ | 180.44 | | $ | 205.14 | |
Dow Jones US Fixed-Line Telecommunications Subsector | | $ | 100.00 | | $ | 118.65 | | $ | 126.93 | | $ | 146.13 | | $ | 163.27 | | $ | 168.60 | |
Peer group | | $ | 100.00 | | $ | 118.88 | | $ | 82.04 | | $ | 72.57 | | $ | 105.25 | | $ | 142.34 | |
Sale of Unregistered Securities
During the year ended December 31, 2012,2014, we did not sell any equity securities of the Company, which were not registered under the Securities Act of 1933, as amended.
3134
Table of Contents
Item 6. Selected Financial Data.
The selected financial data set forth below should be read in conjunction with Item 7—“Management’s Discussion and Analysis of Financial Condition and Results of Operations”, our consolidated financial statements and the related notes, and other financial data included elsewhere in this annual report. Historical results are not necessarily indicative of the results to be expected in future periods.
| | | Year Ended December 31, | | | Year Ended December 31, | |
(In millions, except per share amounts) | | | 2012 (1) | | | | 2011 | | | | 2010 | | | | 2009 | | | | 2008 | | | 2014 (1) | | 2013 | | 2012 (2) | | 2011 | | 2010 | |
| | | | | | | | | | | | | | | | | | | | | | | | | | | | | | | |
Telephone operations revenues | | | $ | 472.1 | | | | $ | 342.6 | | | | $ | 349.6 | | | | $ | 364.6 | | | | $ | 379.0 | | |
Other operations revenues | | | 31.4 | | | | 31.7 | | | | 33.8 | | | | 41.6 | | | | 39.4 | | |
Total operating revenues | | | 503.5 | | | | 374.3 | | | | 383.4 | | | | 406.2 | | | | 418.4 | | |
Operating revenues | | | $ | 635.7 | | $ | 601.6 | | $ | 477.9 | | $ | 349.0 | | $ | 360.3 | |
| | | | | | | | | | | | | | | | | | | | | | | | | | | | | | | |
Cost of products and services (exclusive of depreciation and amortization) | | | 193.7 | | | | 139.3 | | | | 142.3 | | | | 145.5 | | | | 143.5 | | | 242.7 | | 222.5 | | 175.9 | | 121.7 | | 127.0 | |
Selling, general and administrative expense | | | 111.7 | | | | 81.1 | | | | 88.0 | | | | 104.8 | | | | 108.8 | | | 140.6 | | 135.4 | | 108.2 | | 77.8 | | 84.2 | |
Financing and other transaction costs (2) | | | 20.8 | | | | 2.6 | | | | – | | | | – | | | | – | | |
Acquisition and other transaction costs (3) | | | 11.8 | | 0.8 | | 20.8 | | 2.6 | | - | |
Intangible asset impairment | | | 2.9 | | | | – | | | | – | | | | – | | | | 6.1 | | | - | | - | | 1.2 | | - | | - | |
Depreciation and amortization | | | 121.0 | | | | 88.7 | | | | 87.2 | | | | 85.2 | | | | 91.7 | | | 149.4 | | 139.3 | | 120.3 | | 88.0 | | 86.5 | |
Income from operations | | | 53.4 | | | | 62.6 | | | | 65.9 | | | | 70.7 | | | | 68.3 | | | 91.2 | | 103.6 | | 51.5 | | 58.9 | | 62.6 | |
| | | | | | | | | | | | | | | | | | | | | | | | | | | | | | | |
Interest expense, net and loss on extinguishment of debt (3) | | | (77.1 | ) | | | (49.4 | ) | | | (50.7 | ) | | | (57.9 | ) | | | (66.3 | ) | |
Interest expense, net and loss on extinguishment of debt (4)(5)(6) | | | (96.3) | | (93.5) | | (77.1) | | (49.4) | | (50.7) | |
Other income, net | | | 31.2 | | | | 28.6 | | | | 27.0 | | | | 25.5 | | | | 10.8 | | | 33.5 | | 37.3 | | 31.2 | | 27.9 | | 26.1 | |
Income before income taxes and extraordinary item | | | 7.5 | | | | 41.8 | | | | 42.2 | | | | 38.3 | | | | 12.8 | | |
Income from continuing operations before income taxes | | | 28.4 | | 47.4 | | 5.6 | | 37.4 | | 38.0 | |
Income tax expense | | | 1.4 | | | | 14.8 | | | | 9.0 | | | | 12.4 | | | | 6.6 | | | 13.0 | | 17.5 | | 0.7 | | 13.1 | | 7.4 | |
Income before extraordinary item | | | 6.1 | | | | 27.0 | | | | 33.2 | | | | 25.9 | | | | 6.2 | | |
Extraordinary item, net of tax | | | – | | | | – | | | | – | | | | – | | | | 7.2 | | |
Income from continuing operations | | | 15.4 | | 29.9 | | 4.9 | | 24.3 | | 30.6 | |
Discontinued operations, net of tax | | | - | | 1.2 | | 1.2 | | 2.7 | | 2.5 | |
Net income | | | 6.1 | | | | 27.0 | | | | 33.2 | | | | 25.9 | | | | 13.4 | | | 15.4 | | 31.1 | | 6.1 | | 27.0 | | 33.1 | |
Net income of noncontrolling interest (4) | | | 0.5 | | | | 0.6 | | | | 0.6 | | | | 1.0 | | | | 0.9 | | |
Net income attributable to common shareholders (4) | | | $ | 5.6 | | | | $ | 26.4 | | | | $ | 32.6 | | | | $ | 24.9 | | | | $ | 12.5 | | |
Income per common share - basic and diluted: (5) | | | | | | | | | | | | | | | | | | | | | |
Income per common share before extraordinary item | | | $ | 0.15 | | | | $ | 0.88 | | | | $ | 1.09 | | | | $ | 0.84 | | | | $ | 0.18 | | |
Extraordinary item per share | | | – | | | | – | | | | – | | | | – | | | | 0.24 | | |
Net income of noncontrolling interest | | | 0.3 | | 0.3 | | 0.5 | | 0.6 | | 0.6 | |
Net income attributable to common shareholders | | | $ | 15.1 | | $ | 30.8 | | $ | 5.6 | | $ | 26.4 | | $ | 32.5 | |
Income per common share - basic and diluted: | | | | | | | | | | | | |
Income from continuing operations | | | $ | 0.35 | | $ | 0.73 | | $ | 0.12 | | $ | 0.79 | | $ | 1.00 | |
Discontinued operations, net of tax(7) | | | - | | 0.03 | | 0.03 | | 0.09 | | 0.09 | |
Net income per common share - basic and diluted | | | $ | 0.15 | | | | $ | 0.88 | | | | $ | 1.09 | | | | $ | 0.84 | | | | $ | 0.42 | | | $ | 0.35 | | $ | 0.76 | | $ | 0.15 | | $ | 0.88 | | $ | 1.09 | |
Weighted-average number of shares - basic and diluted | | | 34,652 | | | | 29,600 | | | | 29,490 | | | | 29,396 | | | | 29,321 | | | 41,998 | | 39,764 | | 34,652 | | 29,600 | | 29,490 | |
| | | | | | | | | | | | | | | | | | | | | | | | | | | | | | | |
Cash dividends per common share | | | $ | 1.55 | | | | $ | 1.55 | | | | $ | 1.55 | | | | $ | 1.55 | | | | $ | 1.55 | | | $ | 1.55 | | $ | 1.55 | | $ | 1.55 | | $ | 1.55 | | $ | 1.55 | |
| | | | | | | | | | | | | | | | | | | | | | | | | | | | | | | |
Consolidated cash flow data: | | | | | | | | | | | | | | | | | | | | | |
Consolidated cash flow data from continuing operations: | | | | | | | | | | | | |
Cash flows from operating activities | | | $ | 123.2 | | | | $ | 129.5 | | | | $ | 116.1 | | | | $ | 115.7 | | | | $ | 93.4 | | | $ | 187.8 | | $ | 168.5 | | $ | 119.7 | | $ | 124.3 | | $ | 111.9 | |
Cash flows used for investing activities | | | (468.6 | ) | | | (40.8 | ) | | | (41.8 | ) | | | (41.0 | ) | | | (49.0 | ) | | (246.9) | | (107.4) | | (468.5) | | (40.7) | | (41.6) | |
Cash flows used for financing activities | | | 257.5 | | | | (50.7 | ) | | | (49.4 | ) | | | (47.4 | ) | | | (63.3 | ) | |
Cash flows (used for) provided by financing activities | | | 60.2 | | (71.6) | | 257.5 | | (50.7) | | (49.4) | |
Capital expenditures | | | 77.1 | | | | 41.9 | | | | 42.9 | | | | 41.8 | | | | 49.0 | | | 109.0 | | 107.4 | | 77.0 | | 41.8 | | 42.7 | |
| | | | | | | | | | | | | | | | | | | | | | | | | | | | | | | |
Consolidated Balance Sheet: | | | | | | | | | | | | | | | | | | | | | | | | | | | | | | | |
Cash and cash equivalents | | | $ | 17.9 | | | | $ | 105.7 | | | | $ | 67.7 | | | | $ | 42.8 | | | | $ | 15.5 | | | $ | 6.7 | | $ | 5.6 | | $ | 17.9 | | $ | 105.7 | | $ | 67.7 | |
Total current assets | | | 108.5 | | | | 161.9 | | | | 129.2 | | | | 102.0 | | | | 72.1 | | | 134.1 | | 87.7 | | 109.3 | | 164.7 | | 132.6 | |
Net property, plant and equipment | | | 908.2 | | | | 338.4 | | | | 363.2 | | | | 383.1 | | | | 406.8 | | | 1,135.3 | | 885.4 | | 907.7 | | 337.6 | | 362.0 | |
Total assets | | | 1,794.8 | | | | 1,194.1 | | | | 1,209.5 | | | | 1,226.6 | | | | 1,241.6 | | | 2,220.3 | | 1,747.4 | | 1,793.5 | | 1,194.1 | | 1,209.5 | |
Total debt (including current portion) | | | 1,217.8 | | | | 884.7 | | | | 884.1 | | | | 880.3 | | | | 881.3 | | | 1,366.6 | | 1,221.9 | | 1,217.8 | | 884.7 | | 884.1 | |
Stockholders’ equity | | | 136.1 | | | | 47.8 | | | | 71.9 | | | | 80.7 | | | | 75.3 | | | 326.9 | | 152.3 | | 136.1 | | 47.8 | | 71.9 | |
| | | | | | | | | | | | | | | | | | | | | | | | | | | | | | | |
Other financial data (unaudited): | | | | | | | | | | | | | | | | | | | | | | | | | | | | | | | |
Adjusted EBITDA (6) | | | $ | 236.2 | | | | $ | 189.5 | | | | $ | 185.6 | | | | $ | 188.8 | | | | $ | 189.8 | | |
Adjusted EBITDA (8) | | | $ | 288.5 | | $ | 286.5 | | $ | 231.9 | | $ | 185.0 | | $ | 181.7 | |
3235
Table of Contents
(1)
| In July 2012, we acquired 100% of the outstanding shares of SureWest Communications (“SureWest”) in a cash and stock transaction. SureWest results of operations have been included in our consolidated financial statements as of the acquisition date of July 2, 2012.
|
| |
(2)
| Financing and other transaction costs includes costs incurred related to the acquisition of SureWest including severance costs.
|
| |
(3)
| In 2012, we entered into a $350.0 million Senior Unsecured Bridge Loan Facility (“Bridge Facility”) to fund the SureWest acquisition. During 2012, we incurred $4.2 million of amortization related to the financing costs and $1.5 million of interest related to ticking fees associated with the Bridge Facility. In addition, in 2012 we entered into a Second Amendment and Incremental Facility Agreement to amend our term loan facility. As a result, we incurred a loss on the extinguishment of debt of $4.5 million related to the repayment of our outstanding term loan.
|
| |
(4)
| We adopted the Financial Accounting Standards Board’s (“FASB”) authoritative guidance on the presentation of noncontrolling interests in consolidated financial statements effective January 1, 2009. This presentation has been retrospectively applied to all periods presented.
|
| |
(5)
| We adopted the FASB’s authoritative guidance on the treatment of participating securities in the calculation of earnings per share on January 1, 2009. This presentation has been retrospectively applied to all periods presented.
|
| |
(6)
| In addition to the results reported in accordance with accounting principles generally accepted in the United States (“US GAAP” or “GAAP”), we also use certain non-GAAP measures such as EBITDA and adjusted EBITDA to evaluate operating performance and to facilitate the comparison of our historical results and trends. These financial measures are not a measure of financial performance under US GAAP and should not be considered in isolation or as a substitute for net income (loss) as a measure of performance and net cash provided by operating activities as a measure of liquidity. They are not, on their own, necessarily indicative of cash available to fund cash needs as determined in accordance with GAAP. The calculation of these non-GAAP measures may not be comparable to similarly titled measures used by other companies. Reconciliations of these non-GAAP measures to the most directly comparable financial measures presented in accordance with GAAP are provided below.
|
| |
| EBITDA is defined as net earnings before interest expense, income taxes, and depreciation and amortization. Adjusted EBITDA is comprised of EBITDA, adjusted for certain items as permitted or required under our credit facility as described in the reconciliations below. These measures are a common measure of operating performance in the telecommunications industry and are useful, with other data, as a means to evaluate our ability to fund our estimated uses of cash.
|
33(1) On October 16, 2014, we completed our acquisition of Enventis Corporation (“Enventis”) in which we acquired all the issued and outstanding shares of Enventis in exchange for shares of our common stock. The financial results for Enventis have been included in our consolidated financial statements as of the acquisition date.
(2) In July 2012, we acquired 100% of the outstanding shares of SureWest Communications (“SureWest”) in a cash and stock transaction. SureWest results of operations have been included in our consolidated financial statements as of the acquisition date of July 2, 2012.
(3) Acquisition and other transaction costs includes costs incurred related to acquisitions, including severance costs.
(4) In 2014, we redeemed $72.8 million of the original aggregate principal amount of our 10.875% Senior Notes due 2020 (the “2020 Notes”). In connection with the repurchases of the 2020 Notes, we recognized a loss of $13.8 million on the partial extinguishment of debt during the year ended December 31, 2014.
(5) In 2013, we entered into a Second Amended and Restated Credit Agreement to restate our term loan credit facility. In connection with entering into the restated credit agreement, we incurred a loss on the extinguishment of debt of $7.7 million during the year ended December 31, 2013.
(6) In 2012, we entered into a $350.0 million Senior Unsecured Bridge Loan Facility (“Bridge Facility”) to fund the SureWest acquisition. During 2012, we incurred $4.2 million of amortization related to the financing costs and $1.5 million of interest related to ticking fees associated with the Bridge Facility. In addition, in 2012 we entered into a Second Amendment and Incremental Facility Agreement to amend our term loan facility. As a result, we incurred a loss on the extinguishment of debt of $4.5 million related to the repayment of our outstanding term loan.
(7) In September 2013, we completed the sale of the assets and contractual rights of our prison services business for a total cash price of $2.5 million, resulting in a gain of $1.3 million, net of tax. The financial results and net gain from the sale of the prison services business are included in income from discontinued operations for the years ended on or before December 31, 2013.
(8) In addition to the results reported in accordance with accounting principles generally accepted in the United States (“US GAAP” or “GAAP”), we also use certain non-GAAP measures such as EBITDA and adjusted EBITDA to evaluate operating performance and to facilitate the comparison of our historical results and trends. These financial measures are not a measure of financial performance under US GAAP and should not be considered in isolation or as a substitute for net income (loss) as a measure of performance and net cash provided by operating activities as a measure of liquidity. They are not, on their own, necessarily indicative of cash available to fund cash needs as determined in accordance with GAAP. The calculation of these non-GAAP measures may not be comparable to similarly titled measures used by other companies. Reconciliations of these non-GAAP measures to the most directly comparable financial measures presented in accordance with GAAP are provided below.
EBITDA is defined as net earnings before interest expense, income taxes, and depreciation and amortization. Adjusted EBITDA is comprised of EBITDA, adjusted for certain items as permitted or required under our credit facility as described in the reconciliations below. These measures are a common measure of operating performance in the telecommunications industry and are useful, with other data, as a means to evaluate our ability to fund our estimated uses of cash.
36
Table of Contents
The following tables are a reconciliation of net cash provided by operating activities to Adjusted EBITDA:
| | | Year Ended December 31, | |
(In millions, unaudited) | | | 2012 | | | | 2011 | | | | 2010 | | | | 2009 | | | | 2008 | |
Net cash provided by operating activities | | $ | 123.2 | | | $ | 129.5 | | | $ | 116.1 | | | $ | 115.7 | | | $ | 93.4 | |
Adjustments: | | | | | | | | | | | | | | | | | | | | |
Non-cash, stock-based compensation | | | (2.3 | ) | | | (2.1 | ) | | | (2.4 | ) | | | (1.9 | ) | | | (1.9 | ) |
Other adjustments, net | | | (11.3 | ) | | | (11.0 | ) | | | 4.2 | | | | (1.0 | ) | | | 3.8 | |
Changes in operating assets and liabilities | | | 17.6 | | | | (0.6 | ) | | | 2.4 | | | | (1.6 | ) | | | 8.9 | |
Interest expense, net | | | 72.6 | | | | 49.4 | | | | 50.7 | | | | 57.9 | | | | 66.3 | |
Income taxes | | | 1.4 | | | | 14.8 | | | | 9.0 | | | | 12.4 | | | | 6.6 | |
EBITDA | | | 201.2 | | | | 180.0 | | | | 180.0 | | | | 181.5 | | | | 177.1 | |
| | | | | | | | | | | | | | | | | | | | |
Adjustments to EBITDA: | | | | | | | | | | | | | | | | | | | | |
Other, net (a) | | | (3.9 | ) | | | (21.0 | ) | | | (24.3 | ) | | | (17.0 | ) | | | (15.1 | ) |
Investment distributions (b) | | | 29.2 | | | | 28.4 | | | | 27.5 | | | | 22.4 | | | | 17.8 | |
Loss on extinguishment of debt (c) | | | 4.5 | | | | – | | | | – | | | | – | | | | 9.2 | |
Intangible asset impairment (d) | | | 2.9 | | | | – | | | | – | | | | – | | | | 6.1 | |
Extraordinary item (e) | | | – | | | | – | | | | – | | | | – | | | | (7.2 | ) |
Non-cash, stock-based compensation (f) | | | 2.3 | | | | 2.1 | | | | 2.4 | | | | 1.9 | | | | 1.9 | |
Adjusted EBITDA | | $ | 236.2 | | | $ | 189.5 | | | $ | 185.6 | | | $ | 188.8 | | | $ | 189.8 | |
(a)
| Other, net includes the equity earnings from our investments, dividend income, income attributable to noncontrolling interests in subsidiaries, transaction related costs including severance and certain other miscellaneous items related to the acquisition of SureWest. 2009 and 2008 also includes expenses associated with Sarbanes-Oxley maintenance costs, costs to integrate our technology, administrative and customer service functions and billing systems in connection with the acquisition of North Pittsburgh.
|
| |
(b)
| Includes all cash dividends and other cash distributions received from our investments.
|
| |
(c)
| Represents the redemption premium and write-off of unamortized debt issuance costs in connection with the redemption or retirement of our debt obligations.
|
| |
(d)
| Represents intangible asset impairment charges recognized during the period.
|
| |
(e)
| Upon making the election to discontinue the applicable accounting guidance for regulated enterprises in accounting for the effects of certain types of regulation, we recognized an extraordinary non-cash gain and began to apply the authoritative guidance required for the discontinuance of the application of regulatory accounting.
|
| |
(f)
| Represents compensation expenses in connection with the issuance of stock awards, which because of their non-cash nature, these expenses are excluded from Adjusted EBITDA.
|
| | Year Ended December 31, |
(In millions, unaudited) | | 2014 | | 2013 | | 2012 | | 2011 | | 2010 |
Net cash provided by operating activities from continuing operations | | $ | 187.8 | | | $ | 168.5 | | | $ | 119.7 | | | $ | 124.3 | | | $ | 111.9 | |
Adjustments: | | | | | | | | | | | | | | | | | | | | |
Non-cash, stock-based compensation | | | (3.6 | ) | | | (3.0 | ) | | | (2.3 | ) | | | (2.1 | ) | | | (2.4 | ) |
Other adjustments, net | | | (31.6 | ) | | | (24.8 | ) | | | (9.7 | ) | | | (10.9 | ) | | | 4.1 | |
Changes in operating assets and liabilities | | | 12.3 | | | | 28.5 | | | | 17.6 | | | | 1.1 | | | | 3.5 | |
Interest expense, net | | | 82.5 | | | | 85.8 | | | | 72.6 | | | | 49.4 | | | | 50.7 | |
Income taxes | | | 13.0 | | | | 17.5 | | | | 0.7 | | | | 13.1 | | | | 7.4 | |
EBITDA | | | 260.4 | | | | 272.5 | | | | 198.6 | | | | 174.9 | | | | 175.2 | |
| | | | | | | | | | | | | | | | | | | | |
Adjustments to EBITDA: | | | | | | | | | | | | | | | | | | | | |
Other, net (a) | | | (23.9 | ) | | | (31.5 | ) | | | (3.9 | ) | | | (20.4 | ) | | | (23.4 | ) |
Investment distributions (b) | | | 34.6 | | | | 34.8 | | | | 29.2 | | | | 28.4 | | | | 27.5 | |
Loss on extinguishment of debt (c) | | | 13.8 | | | | 7.7 | | | | 4.5 | | | | – | | | | – | |
Intangible asset impairment (d) | | | – | | | | – | | | | 1.2 | | | | – | | | | – | |
Non-cash, stock-based compensation (e) | | | 3.6 | | | | 3.0 | | | | 2.3 | | | | 2.1 | | | | 2.4 | |
Adjusted EBITDA | | $ | 288.5 | | | $ | 286.5 | | | $ | 231.9 | | | $ | 185.0 | | | $ | 181.7 | |
34(a)Other, net includes the equity earnings from our investments, dividend income, income attributable to noncontrolling interests in subsidiaries, acquisition and transaction related costs including severance and certain other miscellaneous items.
(b)Includes all cash dividends and other cash distributions received from our investments.
(c)Represents the redemption premium and write-off of unamortized debt issuance costs in connection with the redemption or retirement of our debt obligations.
(d)Represents intangible asset impairment charges recognized during the period.
(e)Represents compensation expenses in connection with the issuance of stock awards, which because of their non-cash nature, these expenses are excluded from adjusted EBITDA.
37
Table of Contents
Item 7.Management’s Discussion and Analysis of Financial Condition and Results of Operations.
Reference is made to Part I - Item 1 “Note About Forward LookingForward-Looking Statements” and Item 1A “Risk Factors” which describes important factors that could cause actual results to differ from expectations and non-historical information contained herein. In addition, the following Management’s Discussion and Analysis of Financial Condition and Results of Operations (“MD&A”) is intended to help the reader understand the results of operations and financial condition of Consolidated Communications Holdings, Inc. (“Consolidated”, “the Company”the “Company”, “we” or “our”). MD&A should be read in conjunction with our audited consolidated financial statements and accompanying notes to the consolidated financial statements (“Notes”) as of and for each of the three years in the period ended December 31, 20122014 included elsewhere in this Annual Report on Form 10-K.
Throughout MD&A, we refer to certain measures that are not a measure of financial performance in accordance with United States generally accepted accounting principles (“US GAAP” or “GAAP”). We believe the use of these non-GAAP measures on a consolidated and segment basis provides the reader with additional information that is useful in understanding our operating results and trends. These measures should be viewed in addition to, rather than as a substitute for, those measures prepared in accordance with GAAP. See the Non-GAAP Measures section below for a more detailed discussion on the use and calculation of these measures.
Overview
We are an integrated communications services company that operates as both an Incumbent Local Exchange Carrier (“ILEC”) and a Competitive Local Exchange Carrier (“CLEC”), dependent upon the territory served. We provide services in consumer, commercial, and carrier channels to customers in 11 states, including local and long-distance service, high-speed broadband Internet access, video, Voice over Internet Protocol (“VoIP”), private line, cloud services, carrier grade access services, network capacity services over our regional fiber optic networks, data center and managed services, directory publishing, and equipment sales.
2014 Highlights:
1)In October 2014, we completed a merger with Enventis Corporation, an advanced communications provider in the upper Midwest.
2)We increased our consumer maximum broadband Internet speeds to 1Gbps in our Kansas market. Additional markets on our fiber network are scheduled to follow in early 2015.
3)We launched consumer data speeds of up to 100 Mbps over our fiber networks in Pennsylvania and California. Additional markets are expected to be launched in early 2015.
4)Our data and Internet revenue remains a strategic growth area driven by both organic growth and acquisitive expansion of our footprint.
5) We continue to invest in and enrich our suite of commercial services through the introduction of cloud services and advanced VoIP solutions, creating a foundation for future product enhancements.
We generate the majority of our consolidated operating revenues primarily from subscriptions to our video, data, and Internet services (collectively “broadband services”) to residential and business customers. Revenues increased $34.1 million during 2014 compared to 2013, primarily from growth in our broadband services and the Enventis acquisition.
| | | | | | | | % Change | |
| | | | | | | | 2014 vs. | | 2013 vs. | |
| | 2014 | | 2013 | | 2012 | | 2013 | | 2012 | |
Video, Data and Internet services | | 45.2% | | 44.9% | | 37.0% | | 0.8 | % | | 21.4% | |
All Other services | | 54.8% | | 55.1% | | 63.0% | | (0.6) | % | | (12.5)% | |
As noted in the table above, broadband services now constitute more than 45% of our total operating revenue, an increase of 0.8% and 21.4% over 2013 and 2012, respectively. Data and Internet connections have grown as a result of consumer trends toward increased Internet usage and our enhanced product and service offerings, such as our progressively increasing consumer data speeds. In December 2014, we introduced data speeds of up to 1 Gbps to our fiber-to-the-home customers in our Kansas market, with other markets following in early 2015. Where 1 Gbps speeds are not yet offered, the maximum broadband speed is100 Mbps, depending on the geographic market availability. As of December 31, 2014, approximately 31% of the homes in the areas we serve subscribe to our data service.
38
Table of Contents
We expect our broadband service revenues to continue to grow as consumer and commercial demands for data based services increase. Our exceptional maximum consumer broadband speed allows us to continue to meet the needs of our customers and the demand for higher speed resulting from the growing trend of over-the-top (“OTT”) content viewing. The availability of 1Gbps data speed also complements our wireless home networking (“Wi-Fi”) that supports our TV Everywhere service which launched in 2013, and allows our subscribers to watch their favorite programs at home or away on a computer, smartphone or tablet. As of December 31, 2014, our video service was available to approximately 579,000 homes in the markets we serve, with an approximate 21% penetration rate. As of December 31, 2014, we had approximately 123,000 video subscribers, an 11% increase from 2013 primarily as a result of the Enventis acquisition.
We are continually expanding our commercial product offerings for both small and large businesses to capitalize on industry technological advances. In 2014, we gained strategic advantage through the acquisition of Enventis, which earlier in the year launched a suite of cloud services that increases efficiency and reduces IT costs for our customers. In addition, we launched an enhanced hosted voice product, which enables greater scalability and reliability for businesses. We anticipate future momentum in new business revenue as these new products gain traction.
The increase in our operating revenues during 2014 was offset in part by an anticipated industry wide trend of a decline in access lines and related network access. Many consumers are choosing to subscribe to alternative communications services and competition for these subscribers continues to increase. Competition from wireless providers, competitive local exchange carriers and in some cases cable television providers has increased in recent years in the markets we serve. We have been able to mitigate some of the access line losses through marketing initiatives and product offerings, such as our VoIP service. In addition, our video connection growth is decelerating. Excluding Enventis subscribers of approximately 12,000, our increase in connections was less than 1% over 2013. This trend is driven by changing consumer viewing habits, which we believe will continue to impact our business model and strategy of providing consumers the necessary broadband speed to facilitate OTT content viewing.
As discussed in the “Regulatory Matters” section below, our operating revenues are also impacted by legislative or regulatory changes at the federal and state levels, which could reduce or eliminate the current subsidies revenue we receive. A number of proceedings and recent orders relate to universal service reform, intercarrier compensation and network access charges. There are various ongoing legal challenges to the orders that have been issued. As a result, it is not yet possible to determine fully the impact of the regulatory changes on our operations.
Significant Recent DevelopmentDevelopments
Enventis Merger
On October 16, 2014, we completed our merger with Enventis Corporation, a Minnesota corporation (“Enventis”), and acquired all the issued and outstanding shares of Enventis in exchange for shares of our common stock. As a result, Enventis became a wholly-owned subsidiary of the Company. Each share of common stock, no par value, of Enventis converted into and became the right to receive 0.7402 shares of common stock, par value of $0.01 per share, of our common stock plus cash in lieu of fractional shares as set forth in the merger agreement. Based on the closing price of our common stock at $25.40 per share on the date preceding the merger, the total value of the purchase consideration exchanged was $257.7 million, excluding $149.9 million paid to extinguish Enventis’ outstanding debt. On the date of the merger, we issued an aggregate total of 10.1 million shares of our common stock to the former Enventis shareholders.
Enventis is an advanced communications provider, which services business and residential customers primarily in the upper Midwest. The acquisition reflects our strategy to diversify revenue and cash flows amongst multiple products and to expand our network to new markets. The financial results for Enventis have been included in our consolidated financial statements as of the acquisition date.
39
Table of Contents
In conjunction with the acquisition, we completed an offering of $200.0 million aggregate principal amount of 6.50% senior notes due in 2022 (the “2022 Notes”). The net proceeds from the issuance of the 2022 Notes were used to finance the acquisition of Enventis including related fees and expenses and for the repayment of the existing indebtedness of Enventis. A portion of the proceeds, together with cash on hand, was also used to repurchase $46.8 million of our 10.875% Senior Notes due 2020 (the “2020 Notes”), as described in the Liquidity and Capital Resources section below.
Discontinued Operations
On September 13, 2013, we completed the sale of the assets and contractual rights used to provide communications services to thirteen county jails located in Illinois. The sale was completed for an aggregate purchase price of $2.5 million, resulting in a gain of $1.3 million, net of tax. The financial results of the operations for Prison Services have been reported as discontinued operations in our consolidated financial statements for the years ended on or before December 31, 2013.
SureWest Merger
On July 2, 2012, we completed the merger with SureWest, Communications (“SureWest”), which resulted in the acquisition of 100% of all the outstanding shares of SureWest for $23.00 per share in a cash and stock transaction. The acquisition of SureWest provides additional diversification of the Company’s revenues and cash flows both geographically and by service type, which offers a platform for future growth and is expected to generate operational and capital cost synergies. SureWest provides a wide range of telecommunications, digital video, Internet, data and other facilities-based communications services in Northern California, primarily in the greater Sacramento region, and in the greater Kansas City, Kansas and Missouri areas. For the year ended December 31, 2011, SureWest reported $248.1 million in total operating revenues. For the six months ended June 30, 2012, SureWest generated $127.9 million in operating revenues. The total purchase price of $550.8 million, consisted of cash and assumed debt of $402.4 million and 9,965,983 shares of the Company’s common stock valued at the Company’s opening stock price on July 2, 2012 of $14.89, which totaled $148.4 million. The cash portion of the merger consideration and the funds required to repay SureWestSureWest’s outstanding debt was financed with the sale of $300.0 million inthe 2020 Notes with an original aggregate principal amount of 10.875% Senior Notes due 2020 (“Senior Notes”).$300.0 million. The Company also used cash on hand and approximately $35.0 million in borrowings from its revolving credit facility. Because the acquisition closed on July 2, 2012, the Company’s financial information does not include any of theThe results of operations from SureWest prior toare included in our consolidated financial statements as of the acquisition date. The financial results of SureWest are included in the Telephone Operations segment as of the date of the acquisition.
Overview
We are an established telecommunications services company providing a wide range of services to residential and business customers in Illinois, Texas, Pennsylvania, California, Kansas and Missouri. We offer a wide range of telecommunications services, including local and long-distance service, high-speed broadband Internet access, video services, digital telephone service (“VOIP”), custom calling features, private line services, carrier grade access services, network capacity services over our regional fiber optic networks, directory publishing and Competitive Local Exchange Carrier (“CLEC”) services. We also operate two non-core complementary businesses, prison services and equipment sales. We classify our operations into two reportable business segments: Telephone Operations and Other Operations.
Telephone Operations Segment
Our Telephone Operations segment generated approximately 94% of our consolidated operating revenues during 2012, primarily from subscriptions to our voice, video and data services (“broadband services”) to residential and business customers. Revenues in the Telephone Operations segment increased $129.5 million during 2012 compared to 2011, primarily from the SureWest acquisition and growth in data, video and Internet connections. We expect our broadband service revenues to continue to grow as consumer and business demands for data based services increase.
We market our services to residential and business customers, either individually or as a bundled package. Our “triple play” bundle includes our voice, video and data services. As of December 31, 2012, our video service was available to approximately 524,000 homes in Illinois, Texas, Pennsylvania, California, Kansas and Missouri
3540
markets. AsTable of December 31, 2012, approximately 20% of the homes in the areas we serve subscribe to our video service. Data and Internet connections continue to increase as a result of enhanced product and service offerings, such as our VOIP service and data speeds of up to 50 megabits per second, depending on the geographic market availability.Contents
The increase in Telephone Operations revenues during 2012 was offset in part by an anticipated industry wide trend of a decline in access lines and related use of services. Many consumers are choosing to subscribe to alternative communications services and competition for these subscribers continues to increase. Progressively, consumers are utilizing over-the-top services to download and watch television shows of interest to them on their computers. Competition from wireless providers, competitive local exchange carriers and in some cases cable television providers has increased in recent years in the markets we serve. We have been able to mitigate some of the access line losses through marketing initiatives and product offerings, such as our VOIP service.
Other Operations Segment
Our Other Operations segment is comprised of non-core business activities including prison services and business systems. Prison services, which operates primarily in Illinois, provides local and long-distance telephone service and automated calling service to inmates incarcerated at facilities operated by the Illinois Department of Corrections. On June 27, 2012, the Illinois Department of Central Management Services announced its intent to replace us as the provider of those services with a competitor. We have challenged our competitor’s bid and the State’s decision to accept that bid in a variety of different forums. Although we will continue to seek legal recourse to the State’s decision, our business plans and projections assume that our contract with the State of Illinois will end during 2013. During 2012, the prison services contract comprised 82% of the operating revenues in our Other Operations, 5% of consolidated operating revenues and approximately 2% of consolidated operating income, excluding financing and other transaction fees. Business systems sells and supports telecommunications equipment to business customers in Texas and Illinois.
Consolidated Results of Operations
The following tables reflect our financial results on a consolidated basis and key operating statistics as of and for the years ended December 31, 2012, 20112014, 2013 and 2010.2012.
Financial Data
| | | | | | | | | | | | | | | % Change | | | | | | | | | % Change |
| | | | | | | | | | | | | | | 2012 vs. | | | | 2011 vs. | | | | | | | | | 2014 vs. | | 2013 vs. | |
(In millions, except for percentages) | | | 2012 | | | | 2011 | | | | 2010 | | | | 2011 | | | | 2010 | | |
Revenue | | | | | | | | | | | | | | | | | | | | | |
Telephone operations | | | $ | 472.1 | | | | $ | 342.6 | | | | $ | 349.6 | | | | 38 % | | | | (2) % | | |
Other operations | | | 31.4 | | | | 31.7 | | | | 33.8 | | | | (1) | | | | (6) | | |
(In millions, except for percentages) | | | 2014 | | 2013 | | 2012 | | 2013 | | | 2012 | |
Operating Revenues | | | | | | | | | | | | | |
Local calling services | | | $ | 108.3 | | $ | 106.5 | | $ | 93.5 | | 2 | % | | 14 | % |
Network access services | | | 106.3 | | 112.4 | | 98.6 | | (5) | | | 14 | |
Video, Data and Internet services | | | 287.5 | | 270.0 | | 176.7 | | 6 | | | 53 | |
Subsidies | | | 53.2 | | 52.0 | | 49.3 | | 2 | | | 5 | |
Long-distance services | | | 19.6 | | 19.3 | | 17.3 | | 2 | | | 12 | |
Other services | | | 60.8 | | 41.4 | | 42.5 | | 47 | | | (3) | |
Total operating revenue | | | 503.5 | | | | 374.3 | | | | 383.4 | | | | 35 | | | | (2) | | | 635.7 | | 601.6 | | 477.9 | | 6 | | | 26 | |
Expenses | | | | | | | | | | | | | | | | | | | | | | | | | | | | | | | | |
Telephone operations | | | 277.4 | | | | 192.0 | | | | 199.1 | | | | 44 | | | | (4) | | |
Other operations | | | 28.0 | | | | 28.4 | | | | 31.2 | | | | (1) | | | | (9) | | |
Transaction/Debt refinancing costs | | | 20.8 | | | | 2.6 | | | | – | | | | 700 | | | | – | | |
Cost of services and products | | | 242.7 | | 222.5 | | 175.9 | | 9 | | | 26 | |
Selling, general and administrative expense | | | 140.6 | | 135.4 | | 108.2 | | 4 | | | 25 | |
Acquisition and other transaction costs | | | 11.8 | | 0.8 | | 20.8 | | 1,375 | | | (96) | |
Impairment of intangible assets | | | 2.9 | | | | – | | | | – | | | | 100 | | | | 100 | | | - | | - | | 1.2 | | - | | | (100) | |
Depreciation and amortization | | | 121.0 | | | | 88.7 | | | | 87.2 | | | | 36 | | | | 2 | | | 149.4 | | 139.3 | | 120.3 | | 7 | | | 16 | |
Total operating expense | | | 450.1 | | | | 311.7 | | | | 317.5 | | | | 44 | | | | (2) | | |
Total operating expenses | | | 544.5 | | 498.0 | | 426.4 | | 9 | | | 17 | |
Income from operations | | | 53.4 | | | | 62.6 | | | | 65.9 | | | | (15) | | | | (5) | | | 91.2 | | 103.6 | | 51.5 | | (12) | | | 101 | |
Interest expense, net | | | (72.6 | ) | | | (49.4 | ) | | | (50.7 | ) | | | 47 | | | | (3) | | | (82.5) | | (85.8) | | (72.6) | | (4) | | | 18 | |
Loss on extinguishment of debt | | | (4.5 | ) | | | – | | | | – | | | | 100 | | | | 100 | | | (13.8) | | (7.7) | | (4.5) | | 79 | | | 71 | |
Other income | | | 31.2 | | | | 28.6 | | | | 27.0 | | | | 9 | | | | 6 | | | 33.5 | | 37.3 | | 31.2 | | (10) | | | 20 | |
Income tax expense | | | 1.4 | | | | 14.8 | | | | 9.0 | | | | (91) | | | | 64 | | | 13.0 | | 17.5 | | 0.7 | | (26) | | | 2,400 | |
Net income | | | 6.1 | | | | 27.0 | | | | 33.2 | | | | (77) | | | | (19) | | |
Income from continuing operations | | | 15.4 | | 29.9 | | 4.9 | | (48) | | | 510 | |
Income from discontinued operations, net of tax | | | - | | 1.2 | | 1.2 | | (100) | | | 0 | |
Net income attributable to noncontrolling interest | | | 0.5 | | | | 0.6 | | | | 0.6 | | | | (17) | | | | 0 | | | 0.3 | | 0.3 | | 0.5 | | 0 | | | (40) | |
Net income attributable to common stockholders | | | $ | 5.6 | | | | $ | 26.4 | | | | $ | 32.6 | | | | (79) | | | | (19) | | |
Net income attributable to common shareholders | | | $ | 15.1 | | $ | 30.8 | | $ | 5.6 | | (51) | | | 450 | |
| | | | | | | | | | | | | | | | | | | | | | | | | | | | | | | | |
Adjusted EBITDA (1) | | | $ | 236.2 | | | | $ | 189.5 | | | | $ | 185.6 | | | | 25 % | | | | 2 % | | | $ | 288.5 | | $ | 286.5 | | $ | 231.9 | | 1 | % | | 24 | % |
(1)A non-GAAP measure. See the Non-GAAP Measures section below for additional information and reconciliation
36
to the most directly comparable GAAP measure.
41
Table of Contents
Key Operating Statistics
| | | | | | | | % Change | | | | | | | | | % Change |
| | | | | | | | 2012 vs. | | 2011 vs. | | | | | | | | | 2014 vs. | | 2013 vs. | |
| | 2012 | | 2011 | | 2010 | | 2011 | | 2010 | | | 2014 | | 2013 | | 2012 | | 2013 | | | 2012 | |
ILEC access lines | | | | | | | | | | | | | | | | | | | | | | | |
Residential | | 153,855 | | 137,179 | | 140,660 | | 12 % | | (2) % | | | 151,359 | | 147,247 | | 153,855 | | 3 | % | | (4) | % |
Business | | 114,742 | | 90,813 | | 96,481 | | 26 | | (6) | | | 118,149 | | 109,558 | | 114,742 | | 8 | | | (5) | |
Total | | 268,597 | | 227,992 | | 237,141 | | 18 | | (4) | | | 269,508 | | 256,805 | | 268,597 | | 5 | | | (4) | |
| | | | | | | | | | | | | | | | | | | | | | | |
Voice connections (1) | | | | | | | | | | | | | | | | | | | | | | | |
Residential | | 78,811 | | 2,388 | | 2,957 | | 3200 | | (19) | | | 72,145 | | 73,219 | | 78,811 | | (1) | | | (7) | |
Business | | 50,918 | | 52,424 | | 53,671 | | (3) | | (2) | | | 95,309 | | 50,214 | | 50,918 | | 90 | | | (1) | |
Total | | 129,729 | | 54,812 | | 56,628 | | 137 | | (3) | | | 167,454 | | 123,433 | | 129,729 | | 36 | | | (5) | |
| | | | | | | | | | | | | | | | | | | | | | | |
Data and internet connections (2) | | 247,633 | | 134,129 | | 125,678 | | 85 | | 7 | | |
Data and Internet connections (2) | | | 289,658 | | 255,231 | | 247,633 | | 13 | | | 3 | |
Video connections (2) | | 106,137 | | 34,356 | | 29,236 | | 209 | | 18 | | | 122,832 | | 110,621 | | 106,137 | | 11 | | | 4 | |
Total connections | | 752,096 | | 451,289 | | 448,683 | | 67 | | 1 | | | 849,452 | | 746,090 | | 752,096 | | 14 | | | (1) | |
(1)Voice connections include voice lines outside the Incumbent Local Exchange Carrier (“ILEC”)ILEC service areas and Voice-over-IP inside the ILEC service areas.
(2)These connections include both residential and business (excluding SureWest business metrics) for services both inside and outside the ILEC service areas.
Consolidated Overview
The comparability of our consolidated results of operations and key operating statistics was impacted by the SureWest acquisition, which closed on July 2, 2012, and the Enventis acquisition, which closed on October 16, 2014, as described above. SureWest’s and Enventis’ results are included in our consolidated financial statements as of the daterespective dates of the acquisition. We also incurred transaction costs directly related to the SureWest acquisition in 2012. During 2012, we incurred $20.8 million in expense related to the acquisition, which included change-in-control payments to former members of the SureWest management team of $9.4 million of which $8.6 million were accrued for at December 31, 2012 and are expected to be paid during the six months ended June 30, 2013. We also incurred additional interest costs of $24.9 million, which included $19.2 million of interest incurred on the Senior Notes obtained for the SureWest acquisition, $4.2 million of amortization of fees related to securing the bridge loan commitment to finance the SureWest acquisition, and $1.5 million of interest related to ticking fees associated with the bridge loan financing.
Consolidated operating revenue increased $129.2 million during 2012 due to the SureWest acquisition. The SureWest operations accounted for $133.1 million of the annual increase in operating revenues. The acquisition of SureWest providesacquisitions. These acquisitions provide additional diversification of the Company’s revenues and cash flows both geographically and by service type. Excluding the additionThe SureWest operations accounted for $133.1 million of the operations for SureWest,2012 consolidated operating revenues decreased $3.9 million during 2012. Revenues related to our traditional wireline telephone business decreased due to the continued decline in access lines, but were partially offset by an increase in video, data and Internet revenue as we continue to grow our broadband services. The SureWest operations accounted for 296,459 of the total connections at December 31, 2012.
Our operating revenues are also impacted by legislative or regulatory changes at the federal and state levels, which could reduce or eliminate the current subsidies revenue we receive. A number of proceedings and recent orders relate to universal service reform, intercarrier compensation and network access charges. There are various ongoing legal challenges to the orders that have been issued. As a result, it is not yet possible to determine fully the impact of the regulatory changes on our operations.
Operating expenses increased $138.4 million due to the acquisition of SureWest and the transaction costs directly related to the acquisition as described above. During 2012, the SureWest The Enventis operations accounted for $119.5$37.6 million of the year-to-date increases in2014 consolidated operating expenses and transaction costs increased $18.2 million.
37
Operating revenues and expenses by segment are discussed below.
Reclassifications
Certain amounts in our 2011 and 2010 consolidated financial statements have been reclassified to conform to the presentation of our 2012 consolidated financial statements. These reclassifications had no effect on total shareholders’ equity, total revenue, income from operations or net income.
During 2012, inventories and the related activity were reclassified from current assets to property, plant and equipment on the consolidated balance sheets and statements of cash flows. Inventories consist primarily of network construction materials and supplies that when issued are capitalized as part of new customer installations and the constructionfor 116,856 of the network. The change in classification of inventories impacts the calculation of certain financial ratios. Prior period calculations have been revised to conform to the current year presentation.
In addition, the calculation of certain key operating statistics was revised during 2012 to reflect a new methodology for the Company following the acquisition of SureWest. Accordingly, prior period operating statistics have been revised to conform to the current practice.total connections at December 31, 2014.
2012 versus 2011
Segment Results of Operations
Telephone Operations
| | | | | | | | | | | $ | | | | % | |
(In millions, except for percentages) | | | 2012 | | | | 2011 | | | | Change | | | | Change | |
Revenue | | | | | | | | | | | | | | | | |
Local calling services | | | $ | 93.5 | | | | $ | 84.2 | | | | $ | 9.3 | | | | 11 % | |
Network access services | | | 98.6 | | | | 80.5 | | | | 18.1 | | | | 22 | |
Subsidies | | | 49.3 | | | | 45.4 | | | | 3.9 | | | | 9 | |
Long-distance services | | | 17.3 | | | | 15.9 | | | | 1.4 | | | | 9 | |
Video, data and Internet services | | | 176.7 | | | | 83.0 | | | | 93.7 | | | | 113 | |
Other services | | | 36.7 | | | | 33.6 | | | | 3.1 | | | | 9 | |
Total operating revenue | | | 472.1 | | | | 342.6 | | | | 129.5 | | | | 38 | |
Expenses | | | | | | | | | | | | | | | | |
Cost of services and products | | | 171.4 | | | | 116.9 | | | | 54.5 | | | | 47 | |
Selling, general and administrative costs | | | 106.0 | | | | 75.1 | | | | 30.9 | | | | 41 | |
Financing and other transaction costs | | | 20.8 | | | | 2.6 | | | | 18.2 | | | | 700 | |
Depreciation and amortization | | | 120.2 | | | | 87.9 | | | | 32.3 | | | | 37 | |
Total operating expense | | | 418.4 | | | | 282.5 | | | | 135.9 | | | | 48 | |
Income from operations | | | $ | 53.7 | | | | $ | 60.1 | | | | $ | (6.4 | ) | | | (11) | |
Telephone Operations Operating RevenueRevenues
Local Calling Services
We offer several different basic local phone service packages for residential and business customers. The plans include options for voicemail and other custom calling features such as caller ID, call forwarding and call waiting. Local calling services revenue increased $9.3$1.8 million during 20122014 compared to 20112013. Excluding the addition of Enventis’ revenue of $3.4 million, revenues decreased by $1.6 million due to a 6% decline in local access lines.
In 2013, local calling services revenue increased $13.0 million compared to 2012 primarily due to the acquisition of SureWest. Excluding the addition of SureWest revenues, local calling services decreased $8.1$4.8 million during 20122013 compared to 20112012 primarily due to a 3%4% decline in local access lines.
The number of local access lines in service directly affects the recurring revenue we generate from end users and continues to be impacted by the industry-wide decline in access lines. We expect to continue to experience modest erosion in access lines due to market forces and throughcompetition from alternative technologies including our own competing VOIPVoIP product.
Network Access Services
Network access service revenues include interstate and intrastate switched access revenue, network special access services, end user access, and wireless backhaul services. Network access services revenue increased $18.1decreased $6.1 million during 20122014 compared to 2011 primarily as a result of the acquisition of SureWest, which accounted for $21.3 million of the annual increase. Excluding the addition of the SureWest revenues, network access services decreased $3.2 million during 2012 compared to 20112013 primarily due to a decline in switched access minutes of use and special access revenue. These decreases were partially offsetExcluding Enventis, the decrease would have been $8.7 million. Special access revenue declined due to a reduction in the number of our carrier circuits; however, a portion of the decrease can be attributed to carriers shifting to our fiber Metro Ethernet product, contributing to the growth in that area. Switched access revenue decreased as a result of the continuing decline in minutes of use. End user revenues decreased due to a reduction in residential federal subscriber line charges in Texas effective in July 2013, which was mitigated in part by ana rate increase in end user and access recovery revenues.within local calling services.
3842
SubsidiesTable of Contents
Subsidies consist of federal and state subsidies designed to promote widely available, quality telephone service at affordable prices in rural areas. SubsidyIn 2013, network access services revenuesrevenue increased $3.9$13.8 million during 2012 compared to 20112012 primarily as a result of the acquisition of SureWest, an increase in high cost fund support and the addition of revenues from the Connect America Fund in 2012.
Long-Distance Services
We offer a variety of long-distance calling plans, including unlimited flat-rate calling plans, to residential and business customers. Long-distance services revenue increased $1.4 million duringJuly 2012 compared to 2011 primarily due to the acquisition of SureWest. Excluding the additionadditional six months of revenue for SureWest, revenues, long distancenetwork access services decreased $2.4$7.4 million during 20122013 compared to 20112012 primarily due to thea decline in switched and special access linesrevenue.
As described in the “Regulatory Matters” section below, network access revenues were also impacted in part by a decline in interstate and intrastate rates resulting from the intercarrier compensation (“ICC”) reform implemented by the Federal Communications Commission (“FCC”). Certain of our network access revenues are based on rates set or approved by federal and state regulatory commissions which may be subject to change at any time. However, these declines were partially offset by the continued growth in wireless backhaul services as described above and the shift in customers movingdemand for wireless data continues to unlimited long-distance plans.escalate.
Video, Data and Internet Services
The following table reflects the components of Video, dataData and Internet servicesServices:
| | | | | | | | % Change | |
| | | | | | | | 2014 vs. | | | 2013 vs. | |
(In millions, except for percentages) | | 2014 | | 2013 | | 2012 | | 2013 | | | 2012 | |
Video, Data and Internet services | | | | | | | | | | | | |
DSL and Internet | | $ | 122.0 | | $ | 115.3 | | $ | 84.4 | | 5.8 | % | | 36.6 | % |
VoIP | | 27.4 | | 26.6 | | 15.1 | | 3.0 | | | 76.2 | |
Video | | 95.7 | | 91.9 | | 57.0 | | 4.1 | | | 61.2 | |
Private Line | | 42.4 | | 36.2 | | 20.2 | | 17.1 | | | 79.2 | |
Total | | $ | 287.5 | | $ | 270.0 | | $ | 176.7 | | 6.5 | % | | 52.8 | % |
Video, Data and Internet Services include revenue from both residential and business customers for subscriptions to our voice,VoIP, video and data products. We offer high speed Internet access at speeds for residential customers of up to 50 Mbps,1 Gbps, depending on the nature of the network facilities that are available, the level of service selected and the location. WeOur VoIP service is offered to both residential and business customers, and provides options from basic service to virtual hosted systems. In addition to Internet and VoIP services, we also offer a varietyprivate line data services to businesses that include dedicated Internet access through our Metro Ethernet network. Wide Area Network (“WAN”) products include point-to-point and multi-point deployments from 2.5 Mbps to 10 Gbps, to accommodate the growth patterns of data connectivity services in select markets, including Ethernet services over our copperbusiness customers. Data center solutions provide collocation and fiber-based networks, virtual hosting services and collocationcomplementary services. Our VOIP digital phone service is also available in certain markets as an alternative to the traditional telephone line.
Depending on geographic market availability, our video services range from limited basic service to advanced digital television, which includes several plans, each with hundreds of local, national and music channels including premium and pay-per-view channels as well as video on demand service. Certain subscriberscustomers may also subscribe to our advanced video services, which consist of high-definition television, digital video recorders (“DVR”) and/or a whole home DVR.
Video, data and Internet revenue increased $93.7$17.5 million during 20122014 compared to 20112013 primarily due to the acquisition of Enventis and the continued growth in data and Internet revenue. Excluding Enventis, the increase over 2013 was $6.9 million. As shown by the table above, digital subscriber line (“DSL”) and Internet revenue is a primary growth area, with a revenue increase of $6.7 million over 2013, with Enventis contributing $3.5 million of the growth in 2014. Our commercial private line product that includes Metro Ethernet is also a growth area, with an increase of $6.2 million over 2013. Excluding Enventis’ revenue of $4.7 million, private line growth in 2014 was $1.5 million.
In 2013, revenue increased $93.3 million compared to 2012 primarily as a result of the acquisition of SureWest, which accounted for $84.9$85.2 million of the annual increase. The remaining increase in revenue was alsoprimarily due to the continued growth in data and Internet connections and video connections, which increased 7%3% and 9%4%, respectively, as of December 31, 2012.2013. Video, data and Internet revenue comprised 35%45% of our consolidated revenues in 20122013 compared to 22%37% in 2011. 2012.
43
Table of Contents
We expect video,that our data and Internet service revenue to continue to grow aswill see continued growth from the consumerincreasing demand of both consumers and business demandbusinesses for data based services. In addition, our network advances, enhanced broadband product offerings, and expanded footprint have opened up new market opportunities.
Subsidies
Subsidies consist of both federal and state subsidies designed to promote widely available, quality telephone service at affordable prices in rural areas. Subsidy revenues increased $1.2 million during 2014 compared to 2013 primarily from the acquisition of Enventis. In 2013, subsidies increased $2.7 million compared to 2012 as a result of our acquisition of SureWest, as well as the addition of revenues from the Connect America Fund (“CAF”), which was implemented by the FCC in July 2012. See the “Regulatory Matters” section below for a further discussion of the subsidies we receive.
Long-Distance Services
We offer a variety of long-distance calling plans, including unlimited flat-rate calling plans, to residential and business customers. Long-distance services revenue increased $0.3 million during 2014 compared to 2013. Excluding Enventis, long-distance revenue decreased $0.6 million due to the continued decline in residential access lines.
In 2013, long-distance services continuesrevenue increased $2.0 million compared to increase.2012 primarily due to the acquisition of SureWest. Excluding the addition of SureWest revenues, long distance services decreased approximately $1.7 million during 2013 compared to 2012 primarily due to the decline in access lines as described above and the shift in customers moving to unlimited long-distance plans.
Other Services
Other services include revenues from telephone directory publishing, wholesale transport services, billing and collection services, and inside wiring service and maintenance.maintenance and equipment sales. Other services revenue increased $3.1$19.4 million during 20122014 compared to 2011.2013. The growth over prior year is primarily from Enventis’ business telecommunication equipment sales and related support services, which contributed $11.1 million of our 2014 revenue, and enhanced our growing suite of commercial product offerings. The remaining increase of $8.3 million over 2013 is primarily due to Enventis’ transport revenue of $7.1 million.
In 2013, other services revenue decreased $1.1 million compared to 2012. The decrease in other services revenue was primarily due to a decline in directory publishing revenues and equipment sales, which was offset in part by the acquisition of SureWest and an increase in transport services, which was offset in part by a decline in directory publishing revenues.services.
Telephone Operations Operating Expenses
Cost of Services and Products
Cost of services and products increased $54.5$20.2 million during 20122014 compared to 20112013 primarily as a result ofdue to the addition of the SureWest operations for Enventis during 2014, which accounted for $18.8 million of $53.0 million as well as higher costs associated with video programming.the increase. Video programming costs also increased as costs per program channel continue to rise. Video programming costs are impacted by license fees charged by cable networks, the amount and quality of the content we provide and the number of video subscribers we serve. We anticipate that programming costs will continue to increase due to the rising cost in license fees and as we add additional content and offer video content to various platforms. However, the increase in video programming costs was largely offset by a decline in employee costs due to a reduction in headcount as a result of integration and cost reduction efforts in 2013 as well as a reduction in pension expense in the current year.
In 2013, cost of services and products increased $46.6 million compared to 2012. The addition of the operations for SureWest during the first six months of 2013 accounted for $50.0 million of the increase. Video programming costs increased due to a growth in video connections and an increase in costs per program channel. During 2012, the increase in video programming costs was offset in part by a reduction in access costs due to the decline in access lines and usage.
Selling, General and Administrative Costs
Selling, general and administrative costs increased $30.9$5.2 million during 20122014 compared to 20112013. The acquisition of Enventis in 2014 contributed $7.2 million of the increase. Excluding Enventis, selling, general and administrative expense decreased $2.0 million due to a decline in professional fees for legal and billing services and a reduction in pension costs in the current year. These savings were offset in part by growth in our commercial sales force as a result of the expansion of our commercial services in the Dallas market in 2014. Bad debt expense also increased due to recoveries recognized in the prior year period.
44
Table of Contents
Selling, general and administrative costs increased $27.2 million during 2013 compared to 2012 primarily as a result of the addition of the operations for SureWest for the first six months of 2013, which accounted for $30.1$27.0 million of the annual increase. The remaining increase in selling, general and administrative costs was due to an increase in insurance costsprofessional fees for audit and stock compensation expense,legal services, which were largelywas offset in part by a reduction in bad debt expense, utility costs and legal expenses.expense.
39
Transaction/Debt refinancingTransaction costs
Transaction costs increased $11.0 million during 2014 compared to 2013 as a result of the acquisition of Enventis, which closed in the fourth quarter of 2014. In 2012, we incurred $20.8 million in transaction related fees in connection with the acquisition of SureWest, we incurred $20.8 millionSureWest. Transaction costs consist primarily of transaction related fees which were recognized as a financinglegal, finance and other transaction costs during 2012. In 2011, we amended our credit agreement and incurredprofessional fees as well as expenses related to change-in-control payments to former employees of $2.6 million, which were recognized as a financing cost during 2011.the acquired companies.
Depreciation and Amortization
Depreciation and amortization expense increased $32.3$10.1 million during 20122014 compared to 2011,2013, primarily as a result of the acquisition of Enventis during 2014 which accounted for $8.0 million of the increase. The remaining increase was primarily associated with ongoing capital expenditures related to network enhancements and success based capital projects for consumer and commercial services.
In 2013, depreciation and amortization expense increased $19.0 million compared to 2012, primarily as a result of the acquisition of SureWest. Excluding the addition of the operations for SureWest for the first six months of 2013, which accounted for $36.4$38.5 million of the current year increase, depreciation and amortization expense decreased $4.1$19.5 million in 20122013 as a result of circuitcertain intangible assets and network and outside plant equipment becoming fully amortized or depreciated during 2012.
Regulatory Matters
Our revenues are subject to broad Federal and/or state regulation, which include such telecommunications services as local telephone service, network access service and toll service and are derived from various sources, including:
·business and residential subscribers of basic exchange services;
·surcharges mandated by state commissions;
·long distance carriers, for network access service;
·competitive access providers and commercial enterprises for network access service; and
·support payments from federal or state programs.
The telecommunications industry is subject to extensive federal, state and local regulation. Under the Telecommunications Act of 1996, federal and state regulators share responsibility for implementing and enforcing statutes and regulations designed to encourage competition and to preserve and advance widely available, quality telephone service at affordable prices.
At the federal level, the FCC generally exercises jurisdiction over facilities and services of local exchange carriers, such as our rural telephone companies, to the extent they are used to provide, originate, or terminate interstate or international communications. The FCC has the authority to condition, modify, cancel, terminate, or revoke our operating authority for failure to comply with applicable federal laws or FCC rules, regulations and policies. Fines or penalties also may be imposed for any of these violations.
State regulatory commissions generally exercise jurisdiction over carriers’ facilities and services to the extent they are used to provide, originate, or terminate intrastate communications. In particular, state regulatory agencies have substantial oversight over interconnection and network access by competitors of our rural telephone companies. In addition, municipalities and other assets becoming fully depreciatedlocal government agencies regulate the public rights-of-way necessary to install and operate networks. State regulators can sanction our rural telephone companies or revoke our certifications if we violate relevant laws or regulations.
FCC Matters
In general, telecommunications service in rural areas is more costly to provide than service in urban areas. The lower customer density means that switching and other facilities serve fewer customers and loops are typically longer, requiring greater expenditures per customer to build and maintain. By supporting the high cost of operations in rural markets, Universal Service Fund (“USF”) subsidies promote widely available, quality telephone service at affordable prices in rural areas. Revenues from the federal and certain states’ universal service funds increased $1.2 million in 2014 compared to 2013, primarily due to the acquisition of Enventis in October 2014.
45
Table of Contents
In order for eligible telecommunications carriers (“ETCs”) to receive high-cost support, the USF/ICC Transformation Order requires states to certify on an annual basis that USF support is used “only for the provision, maintenance, and upgrading of facilities and services for which the support is intended”. States, in turn, require that ETCs file certifications with them as the basis for the state filings with the FCC. Failure to meet the annual data and certification deadlines can result in reduced support to the ETC based on the length of the delay in certification. For the calendar year 2013, the California state certification was due to be filed with the FCC on or before October 1, 2012. We were notified in January 2013 that SureWest Communications (“SureWest”) did not submit the required certification to the California Public Utilities Commission (“CPUC”) in time to be included in its October 1, 2012, submission to the FCC. On January 24, 2013, we filed a certification with the CPUC and filed a petition with the FCC for a waiver of the filing deadline for the annual state certification. On February 19, 2013, the CPUC filed a certification with the FCC with respect to SureWest. On October 29, 2013, the Wireline Competition Bureau of the FCC denied our petition for a waiver of the annual certification deadline. On November 26, 2013, we applied for a review of the decision made by the FCC staff by the full Commission. Management is optimistic, based on the change in SureWest Telephone’s USF filing status caused by the change in the ownership of SureWest Telephone, the lack of formal notice by the FCC regarding this change in filing status, the fact that SureWest Telephone had a previously-filed certification of compliance in effect with the FCC for the two quarters for which USF was withheld, and the FCC’s past practice of granting waivers to accept late filings in similar situations, that the Company may prevail in its application to the Commission and receive USF funding for the period January 1, 2013, through June 30, 2013. However, due to the denial of our petition by the Wireline Competition Bureau and the uncertainty of the collectability of the previously recognized revenues, in December 2013 we reversed the $3.0 million of previously recognized revenues until such time that the Commission has the opportunity to reach a decision on our application for review.
Our recently acquired Enventis ILEC properties are cost based rate of return companies. Historically, under FCC rules governing rate making, these ILECs were required to establish rates for their interstate telecommunications services based on projected demand usage for the various services. We projected our earnings through the use of annual cost separation studies, which utilized estimated total cost information and projected demand usage. Carriers were required to follow FCC rules in the preparation of these annual studies. We determined actual earnings from our interstate rates as actual volumes and costs became known.
Effective January 1, 2015, our Enventis ILECs are treated as price cap companies for universal service purposes. We anticipate filing a petition for waiver in the first quarter of 2015 to keep them as rate of return for switched access. If the petition is denied, then they would convert to price cap companies effective July 1, 2015. We expect certain adjustments to take place over 18 months as a result of exiting the National Exchange Carrier Association (“NECA”) pool; however, we do not anticipate that they will be material to our consolidated financial statements or results of operations.
An order adopted by the FCC in 2011 (the “Order”) may significantly impact the amount of support revenue we receive from USF/CAF and ICC. The Order reformed core parts of the USF, broadly recast the existing ICC scheme and established the CAF to replace support revenues provided by the current USF and redirects support from voice services to broadband services. In 2012, Phase I of the CAF was implemented freezing USF support to price cap holding companies until the FCC implemented a broadband cost model to shift support from voice service to broadband. The order also modified the methodology used for ICC traffic exchanged between carriers. The initial phase of ICC reform was effective on July 1, 2012, beginning the transition of our terminating switched access rates to bill-and-keep over a seven year period. As a result of implementing the provisions of the Order, during 2014 our network access revenues decreased approximately $1.4 million compared to 2013.
On December 19, 2014, the year.FCC released a report and order that addresses, among other things, the transition to CAF Phase II for price cap carriers, the acceptance criteria of CAF Phase II funding, and the rules for the competitive bidding process. For companies that accept the CAF Phase II model based support, there will be a three year transition period in instances where their current Phase I frozen funding exceeds the Phase II funding. If Phase II support exceeds Phase I, then transitional support is waived and Phase II funding begins immediately. Companies are required to commit to a statewide build out requirement to 10 Mbps downstream and 1 Mbps upstream in funded locations, with funding received over six years beginning in mid-2015. The FCC is expected to release the final model support in the first quarter of 2015, with funding retroactive to January 2015.
46
Table of Contents
Companies that do not accept the CAF Phase II funding will continue to receive Phase I frozen support amounts until funding for their service area is awarded to another carrier through the competitive bidding process, which is expected to be completed in 2016. In addition, companies that do not accept the model based support will be eligible to participate in the competitive bidding process. There is no statewide commitment associated with the auction process; ILECs will only be required to build to the locations won, and funding will be received over 10 years. The broadband requirement at the onset of the funding period is 10Mbps/1Mbps, and is subject to change over the remaining years. The Company is currently evaluating its options in these matters and acceptance of funding will depend on the FCC’s final model support in the first quarter of 2015.
Other OperationsState Matters
| | | | | | | | | | | $ | | | | % | |
(In millions, except for percentages) | | | 2012 | | | | 2011 | | | | Change | | | | Change | |
Revenue | | | $ | 31.4 | | | | $ | 31.7 | | | | $ | (0.3 | ) | | | (1) % | |
Expenses | | | | | | | | | | | | | | | | |
Cost of services and products | | | 22.3 | | | | 22.4 | | | | (0.1 | ) | | | (0) | |
Selling, general and administrative costs | | | 5.7 | | | | 6.0 | | | | (0.3 | ) | | | (5) | |
Impairment of intangible assets | | | 2.9 | | | | - | | | | 2.9 | | | | 100 | |
Depreciation and amortization | | | 0.8 | | | | 0.8 | | | | - | | | | 0 | |
Total operating expense | | | 31.7 | | | | 29.2 | | | | 2.5 | | | | 9 | |
Income (loss) from operations | | | $ | (0.3 | ) | | | $ | 2.5 | | | | $ | (2.8 | ) | | | (112) | |
California
In an ongoing proceeding relating to the New Regulatory Framework, the CPUC adopted Decision 06-08-030 in 2006, which grants carriers broader pricing freedom in the provision of telecommunications services, bundling of services, promotions and customer contracts. This decision adopted a new regulatory framework, the Uniform Regulatory Framework (“URF”), which among other things (i) eliminates price regulation and allows full pricing flexibility for all new and retail services, (ii) allows new forms of bundles and promotional packages of telecommunication services, (iii) allocates all gains and losses from the sale of assets to shareholders and (iv) eliminates almost all elements of rate of return regulation, including the calculation of shareable earnings. On December 31, 2010, the CPUC issued a ruling to initiate a new proceeding to assess whether, or to what extent, the level of competition in the telecommunications industry is sufficient to control prices for the four largest ILECs in the state. Subsequently, the CPUC issued a ruling temporarily deferring the proceeding. The status on when the CPUC may open this proceeding is unclear and on hold at this time. The CPUC’s actions in this and future proceedings could lead to new rules and an increase in government regulation. The Company will continue to monitor this matter.
Pennsylvania
In 2011, the Pennsylvania Public Utilities Commission (“PAPUC”) issued an intrastate access reform order reducing intrastate access rates to interstate levels in a three-step process, which began in March 2012. With the release of the FCC order in November 2011, the PAPUC temporarily issued a stay. A final stay was issued in 2012 to implement the FCC ordered intrastate access rate changes. The PAPUC had indicated that it would address state universal funding in 2013, but delayed conducting a proceeding pending any state legislative activity that may occur in the 2015 legislative session. The Company will continue to monitor this matter.
Texas
The Texas Public Utilities Regulatory Act (“PURA”) directs the Public Utilities Commission of Texas (“PUCT”) to adopt and enforce rules requiring local exchange carriers to contribute to a state universal service fund that helps telecommunications providers offer basic local telecommunications service at reasonable rates in high cost rural areas. The Texas Universal Service Fund is also used to reimburse telecommunications providers for revenues lost by providing lifeline service. Our Texas rural telephone companies receive disbursements from this fund.
Our Texas ILECs have historically received two state funds, the small and rural incumbent local exchange company plan high cost fund (“HCF”) and the high cost assistance fund (“HCAF”). The HCF is a line-based fund used to keep local rates low. The rate is applied on all residential lines and up to five single business lines. The amount we receive from the HCAF is a frozen monthly amount that was originally developed to offset high intrastate toll rates.
In September 2011, the Texas state legislature passed Senate Bill No. 980/House Bill No. 2603 which, among other things, mandated the PUCT to review the Universal Service Fund and issue recommendations by January 1, 2013 with the intent to effectively reduce the size of the Universal Service Fund. This would be accomplished by implementing an urban floor to offset state funding reductions with a phase-in period of four years. The PUCT recommended that (i) frozen line counts be lifted effective September 1, 2013 and (ii) rural and urban local rate benchmarks be developed. The large company fund was completed in September 2012 and the PUCT addressed the small fund participants in Docket 41097 Rate Rebalancing (“Docket 41097”), as discussed below.
47
Table of Contents
In June 2013, the Texas state legislature passed Senate Bill No. 583 (“SB 583”). The provisions of SB 583 were effective September 1, 2013 and froze HCF and HCAF support for the remainder of 2013. As of January 1, 2014, our annual $1.4 million HCAF support was eliminated, and the frozen HCF support returned to funding on a per line basis. In July 2013, the Company entered into a settlement agreement with the PUCT on Docket 41097, which was approved by the PUCT on August 30, 2013. In accordance with the provisions of the settlement agreement, the HCF draw will be reduced by approximately $1.2 million annually, or approximately $4.8 million in total, over a four year period beginning June 1, 2014 through 2018. However, we have the ability to fully offset this reduction with increases to residential rates where market conditions allow, which the Company filed for in April and implemented in June 2014.
In addition, the PUCT is required to develop a needs test for post-2017 funding and has held workshops on various proposals. The PUCT issued its recommendation to the Texas state Commissioners in May 2014 which was approved in December 2014. The needs test allows for a one-time disaggregation of line rates from a per line flat rate, then a competitive test must be met to receive funding. Deadline for submission of the needs test is December 31, 2016. We expect to complete the needs test as required and file for continued funding by the 2016 deadline.
Other Operations RevenueRegulatory Matters
Other Operations revenue decreased $0.3 million during 2012 comparedWe are also subject to 2011. Declines in revenue froma number of regulatory proceedings occurring at the federal and state levels that may have a material impact on our equipment system salesoperations. The FCC and installation business were offset slightly by an in increase instate commissions have authority to issue rules and regulations related to our prison systems business in the current year.
Other Operations Operating Expenses
Operating expenses for Other Operations increased $2.5 million in 2012 comparedbusiness. A number of proceedings are pending or anticipated that are related to 2011. As discussed in the Overview section above,such telecommunications issues as competition, interconnection, access charges, intercarrier compensation, broadband deployment, consumer protection and universal service reform. Some proceedings may authorize new services to compete with our contract as service providerexisting services. Proceedings that relate to our cable television operations include rulemakings on set top boxes, carriage of programming, industry consolidation and ways to promote additional competition. There are various on-going legal challenges to the Illinois Departmentscope or validity of Corrections was not renewed. Although we will continue to seek legal recourse to the State’s decision, our business plans and projections assumeFCC orders that our contract with the State of Illinois will end during 2013.have been issued. As a result, in 2012 as partit is not yet possible to determine fully the impact of our annual impairment test, we recognized an impairment charge of $2.9 millionthe related FCC rules and regulations on our goodwill and tradenames associated with the Other Operations reporting units.operations.
Non-Operating Items
Other Income andInterest Expense, Net
Interest expense, net of interest income, increased $23.2decreased $3.3 million during 20122014 compared to 2011. In February 2012, we entered into2013 primarily due to a temporary $350.0 million Senior Unsecured Bridge Loan Facility (“Bridge Facility”) to fund the SureWest acquisition. During 2012 we incurred $4.2 million of amortizationreduction in interest expense related to our interest rate swap agreements as a result of the financing costsmaturity of several agreements during 2013. Interest rates on outstanding borrowings under our Credit Agreement also declined due to the amendment of our Credit Agreement in December 2013, as described in the Liquidity and $1.5 million ofCapital Resources section below. These reductions in interest related to ticking fees associated with the Bridge Facility. In May 2012, we finalized the financing for the SureWest acquisition and entered into a Senior Note offering (“Senior Notes”), effectively replacing our Bridge Facility. Interest expense were partially offset by an increase in 2012 included $19.2 million of interest expense related to the issuance of a $200.0 million Senior Notes.Note offering in September 2014 used in part to fund the acquisition of Enventis. 2014 also included additional amortization of deferred financing fees of $1.4 million related to the bridge loan facility obtained for the Enventis acquisition.
During 2013, interest expense, net of interest income, increased $13.2 million compared to 2012. The increase in interest expense was due primarily to an increase in total debt outstanding as a result of the acquisition of SureWest in 2012, which included the issuance of a $300.0 million Senior Note offering in May 2012 and the issuance of incremental term loans under our credit facility in December 2012. An increase in interest rates on outstanding borrowings under our credit facility, which was amended in December 2012, also contributed to the increase in interest expense during 2013. The increase in 2013 was offset in part by amortized financing costs of $4.2 million for the temporary bridge loan facility obtained to fund the SureWest acquisition in 2012. In addition, interest expense related to our interest rate swap agreements declined due to the maturity of several agreements during 2013.
In 2013 and 2012, interest rate swaps previously designated as cash flow hedges were de-designated as a result of amendments to our credit agreement. These interest rate swap agreements mature on various dates through September 2016. Prior to de-designation, the effective portion of the change in fair value of the interest rate swaps were recognized in accumulated other comprehensive income (loss) (“AOCI”). The balance of the unrealized loss included in AOCI as of the date the swaps were de-designated is being amortized to earnings over the remaining term of the swap agreements. Changes in fair value of the de-designated swaps are immediately recognized in earnings as interest expense. During the years ended December 31, 2014, 2013 and 2012, gains of $1.6 million, $2.2 million and $2.8 million, respectively, were recognized as a reduction to interest expense for the change in fair value of the de-designated swaps.
48
Table of Contents
Loss on Extinguishment of Debt
In 2014, we redeemed $72.8 million of the original aggregate principal amount of our 2020 Notes, as described in the Liquidity and Capital Resources section below. In connection with the repurchases of the 2020 Notes, we paid $84.1 million and recognized a loss of $13.8 million on the partial extinguishment of debt during the year ended December 31, 2014.
In 2013 and 2012, we entered into a Second Amendmentamended our Credit Agreement to restate and Incremental Facility Agreement (the “Second Amendment”) to amend our term loan facility. Undercredit facilities. In connection with entering into the terms of the Second Amendment, we issued incremental term loans in the aggregate amount of $515.0 millionamended and used the proceeds in part to pay off the outstanding term loan debt that was due to mature December 31, 2014. As a result,restated credit agreements, we incurred a losslosses on the extinguishment of debt of $7.7 million and $4.5 million related toduring the repayment of our outstanding term loan.years ended December 31, 2013 and 2012, respectively.
Other Income
Investment income increased by $2.8decreased $3.2 million during 2012in 2014 compared to 20112013, primarily due to lower earnings from our wireless partnership interests. Other, net decreased $0.5 million compared to 2013 due to bond solicitation fees of $0.5 million, and the sale of an office facility and other related assets in Pennsylvania that resulted in a non-cash loss of $0.8 million. Decreases were partially offset by a tentative settlement agreement of $0.9 million reached in a legal dispute in the prior year.
In 2013, investment income increased $7.0 compared to 2012, primarily due to higher earnings from our wireless partnership interests. Other, net decreased $1.1 million in 2013 compared to 2012, primarily due to an agreement in principle reached in a legal dispute during 2013. See Note 11 to the Consolidated Financial Statements for a more detailed discussion regarding the agreement in principle.
40
Income Taxes
Income taxes decreased $13.4$4.5 million in 20122014 compared to 2011.2013. Our effective rate was 18.9%45.8% for 20122014 compared to 35.5%36.9% for 2011.2013. In 2014, we released the full $1.5 million valuation allowance and related deferred tax asset of $0.5 million maintained against the Federal net operating loss (“NOL”) carryforwards subject to separate return limitation year restrictions and placed a valuation allowance on the state tax credit carryforwards of $0.5 million and related deferred tax asset of $0.3 million. The acquisition of Enventis on October 16, 2014 resulted in changes to our unitary state filings and correspondingly our state deferred income taxes. These changes resulted in a net increase of $2.1 million to our net state deferred tax liabilities and a corresponding increase to our state tax. In addition, we incurred non-deductible transaction costs in relation to the acquisition that resulted in an increase to our tax provision of $0.7 million. During 2013, we recognized $1.2 million of our previously unrecognized tax benefits, which resulted in a decrease to our tax expense of $0.8 million, due to the expiration of a state statute of limitations. We also recognized approximately $0.7 million of tax expense during 2013 to adjust our 2012 provision to match our 2012 returns. Exclusive of these adjustments, our effective tax rate for 2014 would have been approximately 36.6% compared to 37.1% for 2013.
In 2013, income taxes increased $16.9 million compared to 2012. Our effective rate was 36.9% for 2013 compared to 11.7% for 2012. During 2013, we recognized $1.2 million of our previously unrecognized tax benefits, which resulted in a decrease to our tax expense of $0.8 million, due to the expiration of a state statute of limitations. We also recognized approximately $0.7 million of tax expense during 2013 to adjust our 2012 provision to match our 2012 returns. The acquisition of SureWest on July 2, 2012 resulted in changes to our unitary state filings and correspondingly our state deferred income taxes. These changes resulted in a net decrease of $1.1 million to our net state deferred tax liabilities and a corresponding decrease to our state tax. In addition, we incurred non-deductible transaction costs in relation to the acquisition that resulted in an increase to our tax provision of $0.8 million.
2011 versus 2010
Segment Results Exclusive of Operations
Telephone Operations
| | | | | | | | | | | $ | | | | % | |
(In millions, except for percentages) | | | 2011 | | | | 2010 | | | | Change | | | | Change | |
Revenue | | | | | | | | | | | | | | | | |
Local calling services | | | $ | 84.2 | | | | $ | 91.0 | | | | $ | (6.8 | ) | | | (7) % | |
Network access services | | | 80.5 | | | | 81.7 | | | | (1.2 | ) | | | (1) | |
Subsidies | | | 45.4 | | | | 48.7 | | | | (3.3 | ) | | | (7) | |
Long-distance services | | | 15.9 | | | | 18.0 | | | | (2.1 | ) | | | (12) | |
Video, data and Internet services | | | 83.0 | | | | 76.1 | | | | 6.9 | | | | 9 | |
Other services | | | 33.6 | | | | 34.1 | | | | (0.5 | ) | | | (1) | |
Total operating revenue | | | 342.6 | | | | 349.6 | | | | (7.0 | ) | | | (2) | |
Expenses | | | | | | | | | | | | | | | | |
Cost of services and products | | | 116.9 | | | | 119.0 | | | | (2.1 | ) | | | (2) | |
Selling, general and administrative costs | | | 75.1 | | | | 80.1 | | | | (5.0 | ) | | | (6) | |
Financing and other transaction costs | | | 2.6 | | | | - | | | | 2.6 | | | | 100 | |
Depreciation and amortization | | | 87.9 | | | | 86.3 | | | | 1.6 | | | | 2 | |
Total operating expense | | | 282.5 | | | | 285.4 | | | | (2.9 | ) | | | (1) | |
Income from operations | | | $ | 60.1 | | | | $ | 64.2 | | | | $ | (4.1 | ) | | | (6) | |
Telephone Operations Operating Revenue
Local Calling Services
Local calling services revenue decreased $6.8 million in 2011these adjustments, our effective tax rate for 2013 would have been approximately 37.1% compared to 201016.6% for 2012. The adjusted effective tax rate for 2012 is lower primarily due to a 4% decline in local access lines. The number of local access lines in service directly affects the recurring revenue we generate from end usersstate taxable income differences and continues to be impacted by the industry-wide decline in access lines. We expect to continue to experience modest erosion in access lines due to market forces and through our own competing VOIP product.state tax credits.
Network Access Services
Network access services revenue decreased $1.2 million in 2011 compared to 2010 primarily due to a decline in switched access minutes of use as a result of the decline in access lines. These decreases were partially offset by higher special access revenue.
Subsidies
Subsidy revenues decreased $3.3 million in 2011 compared to 2010 primarily as a result of a reduction in the amount of Federal Interstate High Cost Fund support we received, and to a lesser extent, a decrease in Federal interstate common line revenue.
Long-Distance Services
Long-distance services revenue decreased $2.1 million in 2011 compared to 2010 primarily due to the decline in access lines as described above and the shift in customers moving to unlimited long-distance plans.
Video, Data and Internet Services
Video, data and Internet revenue increased $6.9 million in 2011 compared to 2010. The increase in revenue was due to the continued growth in data and video connections, which increased 7% and 18%, respectively, as of December 31, 2011 compared to 2010.
41
Other Services
Other services revenue decreased $0.5 million during 2011 compared to 2010. The decrease in other services revenue was primarily due to a decline in directory publishing revenues, which was offset in part by an increase in transport services.
Telephone Operations Operating Expenses
Cost of Services and Products
Cost of services and products decreased $2.1 million during 2011 compared to 2010 as higher costs associated with video programming were offset by declines in network access costs, pension expense and labor costs due to a reduction in headcount.
Selling, General and Administrative Costs
Selling, general and administrative costs decreased $5.0 million during 2011 compared to 2010 primarily due to a decrease in employee labor and benefit expenses. In 2011, we completed a reorganization that resulted in a reduction in headcount and cost reductions gained through the implementation of operational efficiencies. The decrease in selling, general and administrative costs was also due to lower pension and bad debt expenses as well as a decrease in rent expense due the renegotiated terms on our leases.
Debt refinancing costs
In 2011, we amended our credit agreement and incurred fees of $2.6 million, which were recognized as a financing cost during 2011.
Depreciation and Amortization
Depreciation and amortization expense increased $1.6 million during 2011 compared to 2010 primarily due to an increase in lease expense related to our buildings.
Other Operations
| | | | | | | | | | | $ | | | | % | |
(In millions, except for percentages) | | | 2011 | | | | 2010 | | | | Change | | | | Change | |
Revenue | | | $ | 31.7 | | | | $ | 33.8 | | | | $ | (2.1 | ) | | | (6) % | |
Expenses | | | | | | | | | | | | | | | | |
Cost of services and products | | | 22.4 | | | | 23.3 | | | | (0.9 | ) | | | (4) | |
Selling, general and administrative costs | | | 6.0 | | | | 7.9 | | | | (1.9 | ) | | | (24) | |
Depreciation and amortization | | | 0.8 | | | | 0.9 | | | | (0.1 | ) | | | (11) | |
Total operating expense | | | 29.2 | | | | 32.1 | | | | (2.9 | ) | | | (9) | |
Income from operations | | | $ | 2.5 | | | | $ | 1.7 | | | | $ | 0.8 | | | | 47 | |
Other Operations Operating Revenue
Other Operations revenue decreased $2.1 million in 2011 compared to 2010. In 2010, we sold our CMR and Operator Services business units, which accounted for $4.9 of the annual decline in revenues. The decrease in revenues was offset in part from an increase in our prison systems business in the 2011.
Other Operations Operating Expenses
Other Operations operating expenses decreased $2.9 million in 2011 compared to 2010. The decrease was primarily the result of cost savings realized through the sale of our CMR and Operator Services business units in 2010.
Non-Operating Items
Other Income and Expense, Net
Interest expense, net of interest income, decreased $1.3 million in 2011 compared to 2010. The decrease in interest in 2011 was due in part to the expiration of $200 million of fixed interest rate swaps as the fixed rates paid on the swaps were at a significantly higher rate than the rates we received in return, as well as lower overall interest rates in
42
general. Interest expense in 2010 benefited from the reversal of $1.4 million of interest expense related to uncertain tax positions for which the statute of limitations expired on September 15, 2010. Had this reversal in 2010 not occurred, our 2011 interest expense would have shown a larger decrease when comparing 2011 to 2010.
Investment income increased by $1.6 million in 2011 compared to 2010. The increase in the current year periods was due primarily to higher earnings from our wireless partnership interests and $0.6 million of net proceeds from a key-man life insurance policy.
Income Taxes
Income taxes increased $5.8 million in 2011 compared to 2010. Our effective rate was 35.5% for 2011 and 21.3% for 2010. During 2011 and 2010, we recorded a decrease of $0.3 million and a net decrease of $4.6 million to our unrecognized tax benefits, respectively, which reduced our tax expense by a corresponding amount. The 2011 decrease related to the expiration of a federal statute of limitations and the 2010 net decrease included a $5.4 million decrease due to the expiration of a federal statute of limitations and an increase of $1.2 million related to 2009 state income tax filings with a corresponding $0.4 million of related federal deferred tax asset.
Non-GAAP Measures
In addition to the results reported in accordance with US GAAP, we also use certain non-GAAP measures such as EBITDA and adjusted EBITDA to evaluate operating performance and to facilitate the comparison of our historical results and trends. These financial measures are not a measure of financial performance under US GAAP and should not be considered in isolation or as a substitute for net income as a measure of performance and net cash provided by operating activities as a measure of liquidity. They are not, on their own, necessarily indicative of cash available to fund cash needs as determined in accordance with GAAP. The calculation of these non-GAAP measures may not be comparable to similarly titled measures used by other companies. Reconciliations of these non-GAAP measures to the most directly comparable financial measures presented in accordance with GAAP are provided below.
49
Table of Contents
EBITDA is defined as net earnings before interest expense, income taxes, and depreciation and amortization. Adjusted EBITDA is comprised of EBITDA, adjusted for certain items as permitted or required under our credit facility as described in the reconciliations below. These measures are a common measure of operating performance in the telecommunications industry and are useful, with other data, as a means to evaluate our ability to fund our estimated uses of cash.
43
The following tables are a reconciliation of net cash provided by operating activities to adjusted EBITDA for the years ended December 31, 2012, 20112014, 2013 and 2010:2012:
| | | Year Ended December 31, | | | Year Ended December 31, |
(In thousands, unaudited) | | | 2012 | | | | 2011 | | | | 2010 | | | 2014 | | 2013 | | 2012 |
Net cash provided by operating activities | | $ | 123,215 | | | $ | 129,504 | | | $ | 116,142 | | |
Net cash provided by operating activities from continuing operations | | | $ | 187,785 | | | $ | 168,530 | | | $ | 119,732 | |
Adjustments: | | | | | | | | | | | | | | | | | | | | | | |
Non-cash, stock-based compensation | | | (2,348 | ) | | (2,132 | ) | | (2,363 | ) | | | (3,636 | ) | | | (3,028 | ) | | | (2,348 | ) |
Other adjustments, net | | | (11,340 | ) | | (11,010 | ) | | 4,193 | | | | (31,578 | ) | | | (24,750 | ) | | | (9,653 | ) |
Changes in operating assets and liabilities | | | 17,620 | | | (635 | ) | | 2,322 | | | | 12,252 | | | | 28,486 | | | | 17,566 | |
Interest expense, net | | | 72,604 | | | 49,394 | | | 50,740 | | | | 82,537 | | | | 85,767 | | | | 72,604 | |
Income taxes | | | 1,436 | | | 14,845 | | | 8,991 | | | | 13,027 | | | | 17,512 | | | | 661 | |
EBITDA | | | 201,187 | | | 179,966 | | | 180,025 | | | | 260,387 | | | | 272,517 | | | | 198,562 | |
| | | | | | | | | | | | | | | | | | | | | | |
Adjustments to EBITDA: | | | | | | | | | | | | | | | | | | | | | | |
Other, net (1) | | | (3,884 | ) | | (21,052 | ) | | (24,247 | ) | | | (23,920 | ) | | | (31,529 | ) | | | (3,894 | ) |
Investment distributions (2) | | | 29,217 | | | 28,410 | | | 27,479 | | | | 34,600 | | | | 34,833 | | | | 29,217 | |
Loss on extinguishment of debt | | | 4,455 | | | - | | | - | | | | 13,785 | | | | 7,657 | | | | 4,455 | |
Impairment of intangible assets | | | 2,923 | | | - | | | - | | | | - | | | | - | | | | 1,236 | |
Non-cash, stock-based compensation (3) | | | 2,348 | | | 2,132 | | | 2,363 | | | | 3,636 | | | | 3,028 | | | | 2,348 | |
Adjusted EBITDA | | $ | 236,246 | | | $ | 189,456 | | | $ | 185,620 | | | $ | 288,488 | | | $ | 286,506 | | | $ | 231,924 | |
(1) Other, net includes the equity earnings from our investments, dividend income, income attributable to noncontrolling interests in subsidiaries, acquisition and transaction related costs including severance and certain other miscellaneous items. (2) Includes all cash dividends and other cash distributions received from our investments. (3) Represents compensation expenses in connection with issuance of stock awards, which because of the non-cash nature of these expenses are excluded from adjusted EBITDA. | Other, net includes the equity earnings from our investments, dividend income, income attributable to noncontrolling interests in subsidiaries, transaction related costs including severance and certain other miscellaneous items.
|
| |
(2)
| Includes all cash dividends and other cash distributions received from our investments.
|
| |
(3)
| Represents compensation expenses in connection with issuance of stock awards, which because of the non-cash nature of these expenses are excluded from adjusted EBITDA.
|
Liquidity and Capital Resources
Outlook and Overview
Our operating requirements have historically been funded from cash flows generated from our business and borrowings under our credit facilities. We expect that our future operating requirements will continue to be funded from cash flows from operating activities, existing cash and cash equivalents, and, if needed, from borrowings under our revolving credit facility and our ability to obtain future external financing. We anticipate that we will continue to use a substantial portion of our cash flow to fund capital expenditures, meet scheduled payments of long-term debt, make dividend payments and to invest in future business opportunities.
50
Table of Contents
The following table summarizes our cash flows:
| | | Years Ended December 31, | | | Years Ended December 31, |
| | | 2012 | | | | 2011 | | | | 2010 | | |
(In thousands) | | | 2014 | | 2013 | | 2012 |
Cash flows provided by (used in): | | | | | | | | | | | | | | | | |
| | | | | | | | | | | |
Operating activities: | | $ | 123,215 | | | $ | 129,504 | | | $ | 116,142 | | | | | | | |
| | | | | | | | | | | |
Continuing operations | | | $ | 187,785 | | $ | 168,530 | | $ | 119,732 |
Discontinued operations | | | | - | | | (4,174) | | | 3,483 |
Investing activities | | | (468,559 | ) | | (40,801 | ) | | (41,817 | ) | | | | | | | | | |
| | | | | | | | | | | |
Continuing operations | | | | (246,861) | | | (107,436) | | | (468,462) |
Discontinued operations | | | | - | | | 2,331 | | | (97) |
Financing activities | | | 257,494 | | | | (50,653 | ) | | | (49,429 | ) | | | | | | | | | |
| | | | | | | | | | | | | |
Continuing operations | | | | 60,204 | | | (71,554) | | | 257,494 |
Increase (decrease) in cash and cash equivalents | | $ | (87,850 | ) | | $ | 38,050 | | | $ | 24,896 | | | $ | 1,128 | | $ | (12,303) | | $ | (87,850) |
Cash Flows Provided by Operating Activities
Net cash provided by operating activities from continuing operations was $123.2$187.8 million in 2012, a decrease2014, an increase of $6.3$19.3 million as compared to 2011.2013. Cash provided by operating activities decreasedincreased primarily as a result of the additional cash flows provided by the addition of the SureWestEnventis operations were more than offsetof $12.4 million. Additionally, cash provided by operating activities increased primarily due to the timing in payments to suppliers and the payment of $12.6 million foraccrued transaction costs incurred related to acquisition of SureWestin 2013. These increases were offset in part by an increase in accounts receivable and an increase in interest payments of $16.5 million due to an increase in our outstanding debt.income taxes paid during 2014.
44
Cash Flows Used In Investing Activities
Net cash used in investing activities from continuing operations was $468.6$246.9 million during 20122014 and consisted primarily of cash used for acquisitions,the acquisition of Enventis and for capital expenditures and investments.expenditures.
Acquisition of SureWestEnventis
In 2012,2014, we acquired 100%all of the issued and outstanding shares of SureWestEnventis for $23.00 per shareshares of our common stock and cash in a cash and stock transaction.lieu of fractional shares. The purchase price consisted of cash and assumedthe repayment of debt of $385.3$139.6 million, net of cash acquired, and the issuance of shares of the Company’s common stock valued at $148.4$257.7 million. The cash portion of the purchase price and the funds required to repay SureWest’sEnventis’ outstanding debt was financed in part with the sale of $300.0$200.0 million in aggregate principal amount of 10.875%6.50% Senior Notes due 2020 (“Senior Notes”),2022, as described below. The Company also used cash on hand and approximately $35.0 million in borrowings from its revolving credit facility.
Capital Expenditures
Capital expenditures continue to be our primary recurring investing activity and were $77.1$109.0 million in 2012,2014, an increase of $35.2$1.6 million compared to 2011. The increase in capital expenditures was due to the addition of the SureWest operations, increased investment in business services and growth in residential customers. We plan to continue our capital investment in business services in order to optimize new long-term revenue opportunities and support the growth in wireless backhaul services.2013. Capital expenditures for 20132015 are expected to be $100.0$122.0 million to $110.0$129.0 million, of which 62%approximately 63% is planned for success-based capital projects for residentialconsumer and commercial initiatives. Capital expenditures in 2015 and subsequent years will depend on various factors, including competition, changes in technology, regulatory changes and the timing in the deployment of new services. We expect to continue to invest in existing and new services and the expansion of our fiber network in order to retain and acquire more customers through a broader set of products and an expanded network footprint.
Investments51
In addition to our core business, we also derive a significant portionTable of our cash flow and earnings from investments in five wireless partnerships. In 2012, we purchased an additional ownership interest in our equity investment of GTE Mobilnet of Texas RSA #17 Limited Partnership for $6.7 million which increased our ownership from 17.02% to 20.51%.Contents
Cash Flows Provided by (Used In) Financing Activities
Net cash provided by financing activities from continuing operations consists primarily of our proceeds and principal payments on long-term borrowings and the payment of dividends.
Long-term Debt
The following table summarizes our indebtedness as of December 31, 2012:2014:
(In thousands) | | | Balance | | | Maturity Date | | Rate(1) | |
Senior Notes, net of discount | | | $ | 298,127 | | | June 1, 2020 | | 10.875% | |
Term loan 2 | | | 404,961 | | | December 31, 2017 | | LIBOR plus 4.00% | |
Term loan 3, net of discount | | | 509,912 | | | December 31, 2018 | | LIBOR plus 4.00% | |
Capital leases | | | 4,844 | | | May 31, 2021 | | 13.32% (2) | |
| | | $ | 1,217,844 | | | | | | |
(In thousands) | | Balance | | Maturity Date | | Rate(1) | |
10.875% Senior Notes, net of discount | | $ | 226,097 | | June 1, 2020 | | 10.875% | |
6.50% Senior Notes | | 200,000 | | October 1, 2022 | | 6.50% | |
Term loan 4, net of discount | | 896,952 | | December 23, 2020 | | LIBOR plus 3.25% | |
Revolving loan | | 39,000 | | December 23, 2018 | | LIBOR plus 3.00% | |
Capital leases | | 4,553 | | May 31, 2021 | | 12.92% (2) | |
| | $ | 1,366,602 | | | | | |
(1)At December 31, 2012,2014, the 1-month London Interbank Offered Rate (“LIBOR”) in effect onapplicable to our borrowings was 0.22%0.17%. The Term 34 loan is also subject to a 1.25%1.00% LIBOR floor.
(2)Weighted-average rate.
Credit FacilitiesAgreement
TheIn December 2013, the Company, through certain of its wholly owned subsidiaries, has an outstanding credit agreemententered into a Second Amended and Restated Credit Agreement with severalvarious financial institutions which(the “Credit Agreement”) to replace the Company’s previously amended credit agreement. The Credit Agreement consists of a $50.0$75.0 million revolving credit facility and initial term loans in the aggregate amount of $910.0 million (“Term 4”). The proceeds from the Credit Agreement were used to repay the outstanding term loans of $914.9 million at December 31, 2012.from the previous agreement in its entirety. The credit facilityCredit Agreement also includes an incremental term loan facility which provides the ability to request to borrow up to $300.0 million of incremental term loans. As of December 31, 2012loans subject to certain terms and 2011, no amounts were outstanding under the revolving credit facility.conditions. Borrowings under the senior secured credit facility are secured by substantially all of the assets of the Company and its subsidiaries, with the exception of Illinois Consolidated Telephone Company and our majority-owned subsidiary, East Texas Fiber Line Incorporated.
45
Our term loans under the credit facility, as amended, wereThe Term 4 loan was issued in three separate tranches, resulting in different maturity dates and interest rate margins for each term loan. Prior to being refinanced in December 2012, the first term loan (“Term 1”) consisted of an original aggregate principal amount of $470.9 million maturing on December 31, 2014 and had an applicable margin (at our election) equal to either 2.50% for a LIBOR-based term loan or 1.50% for an alternative base rate loan. The Term 1 loan required quarterly principal payments of $1.2 million which began on March 31, 2012. The second term loan (“Term 2”) consists of an original aggregate principal amount $409.1 million, matures on December 31, 2017 and currently has an applicable margin (at our election) equal to either 4.00% for a LIBOR-based term loan or 3.00% for an alternative base rate term loan. The Term 2 loan also requires $1.0 million in quarterly principal payments which began on March 31, 2012.
In December 2012, we entered into the Second Amendment to amend our credit agreement. Under the terms of the Second Amendment, we issued incremental term loans (“Term 3”) in the aggregate amount of $515.0$910.0 million with a maturity date of December 23, 2020, but is subject to earlier maturity on December 31, 2018, and used2019 if the proceeds2020 Notes are not repaid or redeemed in part to repay the outstanding Term 1 loan debt of $467.4 and to repay the amounts outstanding under our revolving loan in the amount of $35.0 million.full by December 31, 2019. The Term 3 loan requires quarterly principal payments of $1.3 million commencing March 31, 2013 and has an applicable margin (at our election) equal to either 4.00% for a LIBOR-based term loan or 3.00% for an alternative base rate term loan subject to 1.25% LIBOR floor. The Term 34 loan contains an original issuance discount of $5.2$4.6 million, which will beis being amortized over the term of the loan. In connection with entering into the Second Amendment, feesThe Term 4 loan requires quarterly principal payments of $4.2$2.3 million, were capitalized as deferred debt issuance costs. We also incurredwhich commenced March 31, 2014, and has an interest rate of LIBOR plus 3.25% subject to a loss on the extinguishment of debt of $4.5 million related to the repayment of our outstanding Term 1 loan during the year ended December 31, 2012.1.00% LIBOR floor.
Our revolving credit facility has a maturity date of June 8, 2016December 23, 2018 and an applicable margin (at our election) of between 2.75%2.50% and 3.50%3.25% for LIBOR-based borrowings or between 1.50% and between 1.75% and 2.50%2.25% for alternativealternate base rate borrowings, depending on our leverage ratio. Based on our leverage ratio at December 31, 2012,2014, the borrowing margin for the next three month period ending March 31, 20132015 will be at a weighted-average margin of 3.25%3.00% for a LIBOR-based loan or 2.25%2.00% for an alternativealternate base rate loan. The applicable borrowing margin for the revolving credit facility is adjusted quarterly to reflect the leverage ratio from the prior quarter-end. During the year endedAs of December 31, 2012, we borrowed $35.02014 and 2013, borrowings of $39.0 million ofand $13.0 million, respectively, were outstanding under the revolving credit facilityfacility. A stand-by letter of credit of $0.9 million, issued in connection with the acquisition of SureWest, whichCompany’s insurance coverage, was repaid with the proceeds from the issuance of the incremental Term 3 loan in December 2012 as described above. There were no borrowings or letters of credit outstanding under theour revolving credit facility as of December 31, 20122014. The stand-by letter of credit is renewable annually and 2011.reduces the borrowing availability under the revolving credit facility.
The weighted-average interest rate on outstanding borrowings under our credit agreementfacility was 4.79%4.20% and 3.38%4.23% at December 31, 20122014 and 2011,2013, respectively. Interest is payable at least quarterly.
Net proceeds from asset sales exceeding certain thresholds, to the extent not reinvested, are required to be used to repay loans outstanding under the credit agreement.
52
Table of Contents
Credit Agreement Covenant Compliance
The credit agreement contains various provisions and covenants, including, among other items, restrictions on the ability to pay dividends, incur additional indebtedness, and issue capital stock. We have agreed to maintain certain financial ratios, including interest coverage and total net leverage ratios, all as defined in the credit agreement. As of December 31, 2012,2014, we were in compliance with the credit agreement covenants.
Effective February 17, 2012, we amended our credit facility to provide us with the ability to incur indebtedness necessary to finance the acquisition of SureWest, which enabled us to issue the Senior Notes described below. In connection with the amendment, fees of $3.5 million were recognized as financing and other transaction costs during the quarter ended March 31, 2012.
In general, our credit agreement restricts our ability to pay dividends to the amount of our Available Cash (asas defined in our credit agreement) accumulated after October 1, 2005, plus $23.7 million and minus the aggregate amountagreement. As of dividends paid after July 27, 2005. Based on the results of operations from October 1, 2005 through December 31, 2012, and after taking into consideration dividend payments (including the $15.4 million dividend declared in November 2012 and paid on February 1, 2013),2014, we continue to have $192.8had $211.8 million in dividend availability under the credit facility covenant.
46
Under our credit agreement, if our total net leverage ratio (as defined in the credit agreement), as of the end of any fiscal quarter, is greater than 5.10:1.00, we will be required to suspend dividends on our common stock unless otherwise permitted by an exception for dividends that may be paid from the portion of proceeds of any sale of equity not used to fund acquisitions, or make other investments. During any dividend suspension period, we will be required to repay debt in an amount equal to 50.0% of any increase in Available Cash, among other things. In addition, we will not be permitted to pay dividends if an event of default under the credit agreement has occurred and is continuing. Among other things, it will be an event of default if our total net leverage ratio and interest coverage ratio as of the end of any fiscal quarter is belowgreater than 5.25:1.00 and less than 2.25:1.00.1.00, respectively. As of December 31, 2012,2014, our total net leverage ratio under the credit agreement was 4.34:4.08:1.00, and our interest coverage ratio was 3.77:4.07:1.00.
Senior Notes
6.50% Senior Notes due 2022
On September 18, 2014, Consolidated Communications Finance II Co., a wholly–owned subsidiary of the Company, completed an offering of $200.0 million aggregate principal amount of 6.50% senior notes due in 2022 (the “2022 Notes”). Interest on the 2022 Notes is payable semi-annually on April 1 and October 1, commencing on April 1, 2015. The 2022 Notes were priced at par, which resulted in total gross proceeds of $200.0 million. Deferred debt issuance costs of $3.5 million incurred in connection with the issuance of the 2022 Notes are amortized using the effective interest method over the term of the 2022 Notes.
Upon closing of the Enventis acquisition, the obligations under the 2022 Notes were assumed by Consolidated Communications, Inc. (“CCI”) and were guaranteed by the Company and certain of its wholly-owned subsidiaries. The net proceeds from the issuance of the 2022 Notes were used to finance the acquisition of Enventis including related fees and expenses, to repay the existing indebtedness of Enventis and to repurchase a portion of our 10.875% Senior Notes due 2020, as described below.
10.875% Senior Notes due 2020
On May 30, 2012, we completed an offering of $300.0 million aggregate principal amount of 10.875% unsecured Senior Notes, due 2020 through our wholly-owned subsidiary, Consolidated Communications Finance Co. (“Finance Co.”(the “2020 Notes”). The Senior2020 Notes were sold in the United States to qualified institutional buyers pursuant to Rule 144A under the Securities Act of 1933 (the “Securities Act”) and outside the Unites States in compliance with Regulation S under the Securities Act. In addition, some of the Senior Notes were sold to certain “accredited investors” (as defined in Rule 501 under the Securities Act). The Senior Notes were sold to investors at a price equal to 99.345% of the principal amount thereof, for a yield to maturity of 11.00%. Upon closing of the SureWest acquisition on July 2, 2012, Finance Co. merged with and into our wholly-owned subsidiary Consolidated Communications, Inc., which assumed the Senior Notes, and we and certain of our subsidiaries also fully and unconditionally guaranteed the Senior Notes. On August 3, 2012, SureWest and its subsidiaries guaranteed the Senior Notes. The net proceeds of the Senior Notes were used to finance the acquisition of SureWest. The Senior Notes will mature on June 1, 2020. Interest is payable on the Senior Notes2020 and earn interest at a rate of 10.875% per year, payable semi-annually in arrears on June 1 and December 1 of each year, commencing on December 1, 2012. The 2020 Notes were sold to investors at a price equal to 99.345% of the principal amount thereof, for a yield to maturity of 11.00%. This discount is being amortized over the term of the 2020 Notes. CCI is the primary obligor under the 2020 Notes, and we and certain of our subsidiaries have fully and unconditionally guaranteed the 2020 Notes.
On October 16, 2014, we redeemed $46.8 million of the original aggregate principal amount of the 2020 Notes at a price of 116.75%, plus accrued and unpaid interest. On December 19, 2014, we redeemed an additional $26.0 million of the 2020 Notes at a price of 113.50%, plus accrued and unpaid interest. In connection with the repurchases of the 2020 Notes, we paid $84.1 million and recognized a loss of $13.8 million on the partial extinguishment of debt during the year ended December 31, 2014.
53
Table of Contents
Senior Notes Covenant Compliance
The indenture governing the Senior2020 Notes contains customary covenants for high yield notes, which limits Consolidated Communications, Inc.’sCCI’s and its restricted subsidiaries’ ability to:
·incur debt or issue certain preferred stock;
·pay dividends or make other distributions on capital stock or prepay subordinated indebtedness;
·purchase or redeem any equity interests;
·make investments;
·create liens;
·sell assets;
·enter into agreements that restrict dividends or other payments by restricted subsidiaries;
·consolidate, mergermerge or transfer all or substantially all of its assets;
·engage in transactions with its affiliates; or
·enter into any sale and leaseback transactions.
Among other matters, the 2020 Notes indenture provides that CCI may not pay dividends or make other “restricted payments” to the Company if its total net leverage ratio is 4.50:1.00 or greater. This ratio is calculated differently than the comparable ratio under the Credit Agreement; among other differences, it takes into account, on a pro forma basis, synergies expected to be achieved as a result of certain acquisitions but not yet reflected in historical results. At December 31, 2014, this ratio was 4.01:1.00. If this ratio is met, dividends and other restricted payments may be made from cumulative consolidated cash flow since the date the 2020 Notes were issued, less 1.75 times fixed charges, less dividends and other restricted payments made since the date the 2020 Notes were issued. Dividends may be paid and other restricted payments may also be made from a “basket” of $50.0 million, none of which has been used to date, and pursuant to other exceptions identified in the indenture. Since dividends of $174.8 million have been paid since May 30, 2012, including the quarterly dividend declared in October 2014 and paid on February 2, 2015, there was $241.4 million of the $416.2 million of cumulative consolidated cash flow since May 30, 2012 available to pay dividends at December 31, 2014.
On March 19, 2014, CCI commenced a solicitation of consents from the eligible holders of the 2020 Notes in order to amend the indenture governing the 2020 Notes to (i) modify CCI’s Consolidated Leverage Ratio (as defined in the indenture governing the 2020 Notes) level required before CCI (subject to certain other conditions specified in the indenture) can make Restricted Payments (as defined in the indenture) otherwise available under the consolidated cash flow builder basket from 4.25:1.00 to 4.50:1.00 and (ii) modify the size of a permitted lien basket for liens securing Indebtedness (as defined in the indenture) by amending the multiplier for CCI’s Consolidated Cash Flow (as defined in the indenture) in the calculation of such permitted lien basket from 2.50 to 2.75. On April 1, 2014, the required consent of the holders of the 2020 Notes was obtained and the consent solicitation expired, and we entered into a supplemental indenture effecting the proposed amendments as provided in the consent solicitation. The amendment to the indenture with respect to modifying the size of a permitted lien basket for liens securing Indebtedness modified such provision in the indenture so that it would be the same as the equivalent provision in our Credit Agreement. In connection with entering into the supplemental indenture, consent fees of $2.5 million paid to the holders of the 2020 Notes who validly consented to the proposed amendment were capitalized during 2014 as deferred debt issuance costs and amortized over the remaining term of the 2020 Notes.
The indenture governing the 2022 Notes contains substantially the same covenants as the indenture governing the 2020 notes, except that the indenture governing the 2022 Notes provides that CCI may not pay dividends or make other “restricted payments” to the Company if its total net leverage ratio is 4.75:1.00 or greater.
Capital Leases
As of December 31, 2012,2014, we had fivevarious capital leases of which four expire in 2021between 2015 and one will expire in 2015.2021. As of December 31, 2012,2014, the present value of the minimum remaining lease commitments was $4.8approximately $4.5 million, of which $0.4$0.7 million was due and payable within the next twelve months. The leases require total remaining rental paymentscarrying amount of approximately $8.1our capital lease obligations, net of imputed interest of $2.1 million, over the remaining termwas $4.5 million as of the leases.December 31, 2014.
Dividends
We paid $54.1$62.3 million and $46.3$62.1 million forin dividend payments to shareholders during 20122014 and 2011,2013, respectively. On March 1, 2013,In October 2014, our board of directors declared its next quarterly dividend of $0.38738 per common share, which is payablewas paid on May 1, 2013February 2, 2015 to stockholders of record at the close of business on AprilJanuary 15, 2013.2015. Our current annual dividend rate is approximately $1.55 per share.
The cash required to fund dividend payments is in addition to our other expected cash needs, which we expect to fund with cash flows from our operations. In addition, we expect we will have sufficient availability under our revolving credit facility to fund dividend payments in addition to any expected fluctuations in working capital and other cash needs, although we do not intend to borrow under this facility to pay dividends.
54
Table of Contents
We believe that our dividend policy will limit, but not preclude, our ability to grow. If we continue paying dividends at the level currently anticipated under our dividend policy, we may not retain a sufficient amount of cash, and may need to seek refinancing, to fund a material expansion of our business, including any significant acquisitions or to pursue growth opportunities requiring capital expenditures significantly beyond our current expectations. In addition, because we expect a significant portion of cash available will be distributed to holders of common stock under our dividend policy, our ability to pursue any material expansion of our business will depend more than it otherwise would on our ability to obtain third-party financing.
47
Sufficiency of Cash Resources
The following table sets forth selected information regarding our financial condition.
| | | December 31, | |
(In thousands, except for ratio) | | | 2012 | | | | 2011 | |
Cash and cash equivalents | | | $ | 17,854 | | | | $ | 105,704 | |
Working capital (deficit) | | | (35,653 | ) | | | 76,660 | |
Current ratio | | | 0.75 | | | | 1.90 | |
| | | | | | | | | | |
Our net working capital position decreased $112.3 million at December 31, 2012 compared to December 31, 2011. Our decreased working capital position in 2012 was principally the result of the decrease in cash and cash equivalents of $87.9 million primarily as a result of cash used to fund the acquisition of SureWest and the additional financing and transaction costs incurred related to the acquisition. The remainder of the decrease in our working capital position for 2012 was related to an increase in accounts payable and accrued expenses, which included accrued change-in-control payments to former members of the SureWest management team of $8.6 million and are expected to be paid during the six months ended June 30, 2013.
| | December 31, | |
(In thousands, except for ratio) | | 2014 | | 2013 | |
Cash and cash equivalents | | $ | 6,679 | | $ | 5,551 | |
Working capital (deficit) | | (21,930) | | (29,979) | |
Current ratio | | 0.86 | | 0.75 | |
| | | | | | | |
Our most significant use of funds in 20132015 is expected to be for: (i) dividend payments of between $62.0$78.0 million and $64.0$80.0 million; (ii) interest payments on our indebtedness of between $80.0$78.0 million and $85.0$81.0 million and principal payments on debt of $9.2$9.1 million; (iii) capital expenditures of between $100.0$122.0 million and $110.0$129.0 million and (iv) pension and other post-retirement obligations of $14.0$16.2 million. However,Upon closing of the Enventis acquisition, various triggering events occurred which will result in the payment of various change in control and other contingent payments to certain Enventis employees and directors. The estimated cash payments under these agreements will be approximately $4.7 million and are expected to be paid in the second quarter of 2015. In the future, our ability to use cash may be limited by our other expected uses of cash, including our dividend policy, and our ability to incur additional debt will be limited by our existing and future debt agreements.
While we expect the SureWest acquisition to be de-leveraging, it was necessary for us to take on additional debt to fund the transaction. We believe that cash flows from operating activities, together with our existing cash and borrowings available under our revolving credit facility will be sufficient for at least the next twelve months to fund our current anticipated uses of cash. After that, our ability to fund these expected uses of cash and to comply with the financial covenants under our debt agreements will depend on the results of future operations, performance and cash flow. Our ability to fund these expected uses from the results of future operations will be subject to prevailing economic conditions and to financial, business, regulatory, legislative and other factors, many of which are beyond our control.
We may be unable to access the cash flows of our subsidiaries since certain of our subsidiaries are parties to credit or other borrowing agreements, or subject to statutory or regulatory restrictions, that restrict the payment of dividends or making intercompany loans and investments, and those subsidiaries are likely to continue to be subject to such restrictions and prohibitions for the foreseeable future. In addition, future agreements that our subsidiaries may enter into governing the terms of indebtedness may restrict our subsidiaries’ ability to pay dividends or advance cash in any other manner to us.
To the extent that our business plans or projections change or prove to be inaccurate, we may require additional financing or require financing sooner than we currently anticipate. Sources of additional financing may include commercial bank borrowings, other strategic debt financing, sales of nonstrategic assets, vendor financing or the private or public sales of equity and debt securities. There can be no assurance that we will be able to generate sufficient cash flows from operations in the future, that anticipated revenue growth will be realized, or that future borrowings or equity issuances will be available in amounts sufficient to provide adequate sources of cash to fund our expected uses of cash. Failure to obtain adequate financing, if necessary, could require us to significantly reduce our operations or level of capital expenditures which could have a material adverse effect on our financial condition and the results of operations.
Surety Bonds
In the ordinary course of business, we enter into surety, performance, and similar bonds as required by certain jurisdictions in which we provide services. As of December 31, 2012,2014, we had approximately $2.9$3.8 million of these bonds outstanding.
4855
Table of Contents
Contractual Obligations
As of December 31, 2012,2014, our contractual obligations were as follows:
| | | Less than | | | | 1 - 3 | | | | 3 - 5 | | | | | | | | | | | Less than | | 1 - 3 | | 3 - 5 | | | | | |
(In thousands) | | | 1 Year | | | | Years | | | | Years | | | | Thereafter | | | | Total | | | 1 Year | | Years | | Years | | Thereafter | | Total | |
Long-term debt | | | $ | 9,240 | | | | $ | 18,481 | | | | $ | 402,990 | | | | $ | 789,250 | | | | $ | 1,219,961 | | | $ | 9,100 | | $ | 18,200 | | $ | 57,200 | | $ | 1,282,618 | | $ | 1,367,118 | |
Interest on long-term debt (1) | | | 76,656 | | | | 151,984 | | | | 150,212 | | | | 107,532 | | | | 486,384 | | | 79,435 | | 158,792 | | 156,009 | | 88,960 | | 483,196 | |
Interest rate swaps (2) | | | 4,840 | | | | 2,243 | | | | – | | | | – | | | | 7,083 | | | 1,871 | | 1,590 | | – | | – | | 3,461 | |
Capital leases | | | 983 | | | | 1,985 | | | | 1,850 | | | | 3,322 | | | | 8,140 | | | 1,302 | | 2,048 | | 1,945 | | 1,378 | | 6,673 | |
Operating leases | | | 2,375 | | | | 3,243 | | | | 830 | | | | 1,233 | | | | 7,681 | | | 4,796 | | 5,639 | | 3,409 | | 5,068 | | 18,912 | |
Unconditional purchase obligations: | | | | | | | | | | | | | | | | | | | | | | | | | | | | | | | |
Unrecorded (3) | | | 18,764 | | | | 19,628 | | | | 18,000 | | | | – | | | | 56,392 | | | 20,589 | | 27,831 | | 2,920 | | 858 | | 52,198 | |
Recorded (4) | | | 47,786 | | | | – | | | | – | | | | – | | | | 47,786 | | | 42,477 | | – | | – | | – | | 42,477 | |
Pension funding | | | 13,992 | | | | – | | | | – | | | | – | | | | 13,992 | | | 16,161 | | – | | – | | – | | 16,161 | |
|
(1)Interest on long-term debt includes amounts due on fixed and variable rate debt. As the rates on our variable debt are subject to change, the rates in effect at December 31, 20122014 were used in determining our future interest obligations.
(2)Scheduled based onExpected settlements estimated using yield curves in effect at December 31, 2012.2014.
(3)Unrecorded purchase obligations include binding commitments for future capital expenditures and service and maintenance agreements to support various computer hardware and software applications and certain equipment. If we terminate any of the contracts prior to their expiration date, we would be liable for minimum commitment payments as defined in by the contractual terms of the contracts.
(4)Recorded obligations include amounts in accounts payable and accrued expenses for external goods and services received as of December 31, 20122014 and expected to be settled in cash.
Defined Benefit Pension Plans
As required, we contribute to qualified defined pension plans and non-qualified supplemental retirement plans (collectively the “Pension Plans”) and other post-retirement benefit plans, which provide retirement benefits to certain eligible employees. Contributions are intended to provide for benefits attributed to service to date. Our funding policy is to contribute annually an actuarially determined amount consistent with applicable federal income tax regulations.
The cost to maintain our Pension Plans and future funding requirements are affected by several factors including the expected return on investment of the assets held by the Pension Plan, changes in the discount rate used to calculate pension expense and the amortization of unrecognized gains and losses. Returns generated on Plan assets have historically funded a significant portion of the benefits paid under the Pension Plans. For 2012, the estimated long-term rate of return of Plan assets was 7.7%. As of January 1, 2013, weWe estimate the long-term rate of return of Plan assets will be 8.0%. However, the significant decline in the equity markets precipitated by the credit crisis in recent years has negatively affected the value of our Pension Plan assets. The Pension Plans invest in marketable equity securities which are exposed to changes in the financial markets. If the financial markets experience a downturn and returns fall below our estimate, as seen in recent years, we could be required to make a material contribution to the Pension Plan, which could adversely affect our cash flows from operations.
Net pension and post-retirement (benefit)/costs were $4.6$(5.5) million, $4.0$0.7 million and $5.6$4.6 million for the years ended December 31, 2012, 20112014, 2013 and 2010,2012, respectively. We contributed $11.1 million, $11.5 million and $15.2 million in 2014, 2013 and $9.5 million in 2012, and 2011, respectively to our pension plans and did not make a contribution in 2010.plans. For our other post-retirement plans, we contributed $2.7 million, $2.8 million and $3.2 million in 2014, 2013 and $3.6 million in 2012, and 2011, respectively. In July of 2012, the Moving Ahead for Progress in the 21st Century Act (“MAP-21”), which includes pension funding stabilization provisions, was signed into law. These provisions establish an interest rate corridor which is designed to stabilize the segment rates used to determine minimum funding requirements from the effects of interest rate volatility, which is may reduce the Company’s minimum required pension contributions in the near-term. In 2013,2015, we expect to make contributions totaling approximately $11.5$12.4 million to our pension plans and $2.5$3.8 million to our other post-retirement plans. Our contribution amounts meet the minimum funding requirements as set forth in employee benefit and tax laws. See Note 9 to the Consolidated Financial Statements for a more detailed discussion regarding our pension and other post-retirement plans.
4956
Table of Contents
Income Taxes
The timing of cash payments for income taxes, which is governed by the Internal Revenue Service and other taxing jurisdictions, will differ from the timing of recording tax expense and deferred income taxes, which are reported in accordance with GAAP. For example, tax laws in effect regarding accelerated or “bonus” depreciation for tax reporting resulted in less cash payments than the GAAP tax expense. Acceleration of tax deductions could eventually result in situations where cash payments will exceed GAAP tax expense.
It is more likely than not that the benefit from approximately $1.5 million in federal NOL carryforwards that are subject to separate return limitation year restrictions will not be realized. This loss carryover can only be used against consolidated taxable income to the extent of a single member’s contribution to consolidated taxable income. The amount considered realizable, however, could be adjusted if estimates of future taxable income for the single member during the carryforward period are increased.
Historically, pre-tax earnings for financial reporting purposes have exceeded the amount of taxable income reported for income tax purposes. This has primarily occurred due to the acceleration of depreciation deductions for income tax reporting purposes.
Related Party Transactions
A portion of the Senior2020 Notes waswere sold to certain accredited investors consisting of the Company’s Chairman of the BOD and certain other members of the BOD, includingCompany’s Board of Directors or a trust of which a director is the Company’s Chief Executive Officer (collectively “relatedbeneficiary (“related parties”). TheIn May 2012, the related parties purchased $10.8 million of the Senior2020 Notes on the same terms available to other investors, except that the related parties were not entitled to registration rights. In September 2014, $5.0 million of the 2022 Notes were sold to a trust, the beneficiary of which is a member of the Company’s Board of Directors. During 2012, the Company paid $0.62014 and 2013, we recognized $1.3 million and $1.2 million, respectively, in interest in the aggregate tofor the 2020 Notes purchased by the related parties for the Senior Notes.parties.
In December 2010, we entered into new lease agreements with LATEL LLC (“LATEL”) for the occupancy of three buildingbuildings on a triple net lease basis withbasis. Each of the three lease agreements have a maturity date of May 31, 2021, which weand have been accounted for as capital leases. Each of the three lease agreements have two five-year options to extend the terms of the lease after the expiration date. The ChairmanOur Board of the Company,Directors member, Richard A. Lumpkin, and his immediate family have a beneficial ownership interest of 72.4% and 70.7% in 20122014 and 20112013, respectively, of LATEL, directly or through Agracel, Inc. (“Agracel”). Agracel is real estate investment company of which Mr. Lumpkin, together with his family, have a beneficial interest of 44.7% and 41.3% in 20122014 and 2011.2013, respectively. Agracel is the sole managing member and 50% owner of LATEL. In addition, Mr. Lumpkin is a director of Agracel. The three leases require total rental payments to LATEL of approximately $7.9 million over the term of the leases. The carrying value of the capital leases at December 31, 20122014 and 20112013 was approximately $3.8$3.4 million and $4.0$3.6 million, respectively. In 20122014 and 2011,2013, we recognized $0.5 million in interest expense and $0.4 million and $0.1 million in amortization expense, respectively, related to the capitalized leases.
Regulatory Matters
AnAs discussed in the Regulatory Matters section above, an order adopted by the Federal Communications Commission (“FCC”) in 2011 (the “Order”)FCC may significantly impact the amount of support revenue we receive from Universal Service Fund (“USF”)/Connect America Fund (“CAF”)USF/CAF and intercarrier compensation (“ICC”).ICC. The Order reformed core parts of the USF, broadly recast the existing ICC scheme and established the CAFseeks to replace support revenues provided byreform the current USF and redirectssystem by redirecting support from voice services to broadband services. In 2012, the first phase of the CAF was implemented freezing USF support to a price cap holding company until the FCC implements aThe broadband cost model for this reform is expected to shift support from voice service to broadband, which could be as early as July, 2013. Wefinalized in the first quarter of 2015, and we anticipate that our revenues will be significantly impacted when the broadband cost modelit is implemented. The order also modifies the methodology used for ICC traffic exchanged between carriers. The initial phase of ICC reform was effective on July 1, 2012, beginning the transition ofdecreased our terminating switched access rates to bill-and-keep over a seven year period. As a result of implementing the provisions of the Order, our 2012 network access revenues decreased approximately $972 thousand.$1.4 million during 2014. We anticipate network access revenues will continue to decline, in total, by as much as $8.7 million through 2017 as a result of the OrderOrder. The projected decline in network access revenues does not include amounts for Enventis, as that information cannot yet be determined; however, we do not anticipate any potential declines will have a material adverse effect on our cash flows or financial results.
In accordance with the provisions of SB 583, as discussed above in the Regulatory Matters Section, our annual $1.4 million Texas HCAF was eliminated effective January 1, 2014. In addition, the terms of the settlement agreement reached with the PUCT in August 2013 will reduce our HCF draw by approximately $1.2 million annually, or approximately $4.8 million in total, over a four year period beginning June 1, 2014 through 2018 and could be as much as $1.9 million, $805 thousand, $936 thousand, $1.0 million, $2.5 million and $618 thousand in 2013, 2014, 2015, 2016, 2017 and 2018, respectively.2018. However, we have the ability to offset this reduction with increases to residential rates, where market conditions will allow.
5057
Table of Contents
Critical Accounting Estimates
Our significant accounting policies and estimates are discussed in the Notes to our Consolidated Financial Statements. We prepare our consolidated financial statements in accordance with generally accepted accounting principles in the United States. The preparation of financial statements requires management to make estimates and assumptions that affect reported amounts of assets, liabilities, revenues and expenses. These estimates and assumptions are affected by management’s application of our accounting policies. Our judgments are based on historical experience and various other assumptions that are believed to be reasonable under the circumstances, the results of which form the basis for making estimates about the carrying values of assets and liabilities that are not readily apparent from other sources. However, because future events and the related effects cannot be determined with certainty, actual results may differ from our estimates and assumptions and such differences could be material. Management believes that the following accounting estimates are the most critical to understanding and evaluating our reported financial results.
Indefinite-Lived IntangiblesIntangible Assets
Goodwill and tradenames are intangible assets that are not subject to amortization and are tested for impairment annually or more frequently when events or changes in circumstances indicate that the asset might be impaired. We evaluate the carrying value of our indefinite-lived assets, tradenames and goodwill, as of November 30 of each year.
Goodwill
As discussed more fully in Note 1 to the Consolidated Financial Statements, goodwill is not amortized but instead evaluated for impairment annually, or more frequently if an event occurs or circumstances change that would indicate potential impairment, for impairment using a preliminary qualitative assessment and two-step process, if deemed necessary. In 2012, we adopted Accounting Standards Update No. 2011-08 —– Intangibles-Goodwill and Other (Topic 350) Testing Goodwill for Impairment, that allows an entity to consider qualitative indicators to determine if the current two-step test is necessary. Under the provisions of the amended guidance, the step-one test of estimating the fair value of a reporting unit is not required unless, as a result of the qualitative assessment, it is more likely than not (a likelihood of more than 50%) that the fair value of the reporting unit is less than its carrying amount. Events and circumstances integrated into the qualitative assessment process include a combination of macroeconomic conditions affecting equity and credit markets, significant changes to the cost structure, overall financial performance and other relevant events affecting the reporting unit. A company is permitted to skip the qualitative assessment at its election, and proceed to Step 1 of the quantitative test, which we choosechose to do in 2012.2014.
Functional management within the organization evaluates the operations of the Telephone Operations segmentour single reporting unit on a consolidated basis rather than at a geographic level or on any other component basis. In general, product managers and cost managers are responsible for managing costs and services across territories rather than treating the territories as separate business units. The operations of our Illinois, Texas, Pennsylvania, California, Kansas and Missouri properties share network operations monitoring call routing and research and development costs. The operations of our Illinois, Texas and Pennsylvania properties share remittance, customer service and billing systems. We are in the process of integrating the California, Kansas and Missouri cash remittance, customer service and billing system into the systems and process used by the Illinois, Texas and Pennsylvania properties, which is expected to be completed by June 30, 2014.during the first quarter of 2015. In connection with our recent acquisition of Enventis in October 2014, the functional realignment occurred shortly after close. The continued integration of the various systems and processes in place at Enventis will occur over the next several quarters. All of the properties are managed at a functional level. In addition, the Pennsylvania territories receive their video programming from a video head-end located in the Illinois territory, and all of the networks provide redundancy. As a result, we evaluate the Telephone Operations ofoperations for all our Illinois, Texas and Pennsylvania, Californiaservice territories and our Pennsylvania, California, Kansas and Missouri CLEC operations are included inas a single reporting unit, Telephone Operations (“TORU”).
The only reporting units in the Other Operations segment that had a goodwill intangible balance as of our valuation date were our Prison Services and Business Systems entities.unit.
At our November 30, 20122014 assessment date, the carrying value of goodwill allocated to TORU, Prison Services and Business Systems was $605.0 million, $0.2 million and $0.8 million, respectively.$765.8 million.
Telephone Operations Reporting Unit58
Table of Contents
The estimated fair value of the TORUour single reporting unit is determined using a combination of market-based approaches and a discounted cash flow (“DCF”) model. The assumptions used in the estimate of fair value are based upon a combination of historical results and trends, new industry developments, future cash flow projections, as well as relevant comparable company earnings multiples for the market-based approaches. Such assumptions are subject to
51
change as a result of changing economic and competitive conditions. The market-based approaches used in the valuation effort includes the publicly-traded market capitalization, guideline public companies, and guideline transaction methods. We use a weighting of the results derived from the valuation approaches to estimate the fair value of the TORU.single reporting unit. Key assumptions used in the DCF model include the following:
· cash flow assumptions regarding investment in network facilities, distribution channels and customer base (the assumptions underlying these inputs are based upon a combination of historical results and trends, new industry developments and the Company’s business plans); · 6.1% weighted average cost of capital based on comparable public companies and adjusting for risks unique to our business and the cash flow assumptions utilized in the analysis; and · 1.5% terminal growth rate. | cash flow assumptions regarding investment in network facilities, distribution channels and customer base (the assumptions underlying these inputs are based upon a combination of historical results and trends, new industry developments and the Company’s business plans);
|
| |
·
| 7.6% weighted average cost of capital based on comparable public companies and adjusting for risks unique to the TORU and the cash flow assumptions utilized in the analysis; and
|
| |
·
| 2.0% terminal growth rate.
|
At November 30, 20122014, the fair value of the TORU’ssingle reporting unit’s total equity was estimated at approximately $806.0 million$1.6 billion on a control basis, and the associated carrying value of its equity was $156.7$384.0 million. For all valuation methods used, TORU’sthe fair value of equity exceeds its carrying value. The use of different estimates or assumptions in the DCF model could result in a different fair value conclusion. As a sensitivity calculation, if the discount rate in our DCF model was increased 1.0 percentage point from 7.6%6.1% to 8.6%7.1%, the fair value would decrease from approximately $806.0 million$1.6 billion to approximately $702.7 million,$1.4 billion, which would not result in an impairment of goodwill, recorded at the TORU, assuming there are no changes to the market-based approaches used in the valuation. Assuming the discount rate in our DCF model was increased 2.0 percentage points, the terminal growth rate decreased by 1.00.05 percentage point, and each of the market-based valuation approaches decreased in value by 5%, the fair value of approximately $806.0 million$1.6 billion would decrease by approximately $238.4$344.0 million to approximately $567.5 million,$1.2 billion, which would not result in an impairment of goodwill recorded at the TORU.goodwill. As discussed above, the other market-based approaches are subject to change as a result of changing economic and competitive conditions. Negative changes relating to the Telephone OperationsCompany’s operations could result in potential impairment of goodwill recorded at the TORU.goodwill. Changes in the overall weighting of the DCF model and the market-based approach valuation models may also impact the resulting fair value and could result in potential impairment of goodwill recorded at the TORU.
Prison Services Reporting Unit
We used a DCF model to estimate the fair value of the Prison Services reporting unit’s total equity on a control basis as of November 30, 2012. The DCF model and the determination of the reporting units fair value was negatively impacted by the cancellation of the state of Illinois Prison Services contract which is expected to be fully terminated during the year ending December 31, 2013. Based on this analysis, the carrying value of the Prison Services reporting unit exceeded its fair value indicating that a potential impairment of goodwill may exist.
The second step of the goodwill impairment testing compares the implied fair value of the reporting unit goodwill with the carrying amount of that goodwill. The implied fair value is determined by allocating the fair value of the reporting unit to all of the assets and liabilities other than goodwill in a manner similar to a purchase price allocation. The excess of the fair value of a reporting unit over the amounts assigned to its assets and liabilities is the implied fair value of goodwill. If the carrying amount of goodwill is greater than the implied fair value of that goodwill, then an impairment charge would be recorded equal to the difference between the implied fair value and the carrying value. Based on this analysis, we determined that the implied fair value of the Prison Services reporting unit’s goodwill was reasonably estimated at approximately zero as of November 30, 2012, and that the carrying value of approximately $0.2 million was fully impaired. We therefore recorded an impairment charge of $0.2 million during the quarter ended December 31, 2012 related to the Prison Services reporting unit’s goodwill amount, resulting in a zero goodwill balance for the Prison Services reporting unit as of December 31, 2012.
Business Systems Reporting Unit
We used a DCF model to estimate the fair value of the Business Systems reporting unit’s total equity on a control basis as of November 30, 2012. The DCF model forecasted break-even operating results which negatively impacted the estimated fair value. Based on this analysis, the carrying value of the Business Systems reporting unit exceeded its fair value indicating that a potential impairment of goodwill may exist.
The second step of the goodwill impairment testing compares the implied fair value of the reporting unit goodwill with the carrying amount of that goodwill. The implied fair value is determined by allocating the fair value of the reporting unit to all of the assets and liabilities other than goodwill in a manner similar to a purchase price allocation. The excess of the fair value of a reporting unit over the amounts assigned to its assets and liabilities is the
52
implied fair value of goodwill. If the carrying amount of goodwill is greater than the implied fair value of that goodwill, then an impairment charge would be recorded equal to the difference between the implied fair value and the carrying value. Based on this analysis, we determined that the implied fair value of the Business Systems reporting unit’s goodwill was reasonably estimated at approximately zero as of November 30, 2012, and that the carrying value of approximately $0.8 million was fully impaired. We therefore recorded an impairment charge of $0.8 million during the quarter ended December 31, 2012 related to the Business Systems reporting unit’s goodwill amount.
The cumulative impact of the goodwill impairment charges for the Prison Services and Business Systems reporting units which totaled $1.0 million reduces the goodwill balance for the Other Operations segment as of December 31, 2012 to zero.
Tradenames
As discussed more fully in Note 1 to the Consolidated Financial Statements, tradenames are generally not amortized but instead evaluated annually, or more frequently if an event occurs or circumstances change that would indicate potential impairment, for impairment using a preliminary qualitative assessment and two-step process, if deemed necessary. We estimate the fair value of our tradenames using DCFs based on a relief from royalty method. If the fair value of our tradenames was less than the carrying amount, we would recognize an impairment charge for the difference between the estimated fair value and the carrying value of the tradename. In accordance with Accounting Codification Standard 350 Intangibles – Goodwill and Other (“ASC 350”) separately recorded indefinite-lived intangible assets, whether acquired or internally developed, shall be combined into a single unit of accounting for purposes of testing impairment if they are operated as a single asset and, as such, are essentially inseparable from one another. An indefinite-lived intangible asset may need to be removed from the accounting unit if it is disposed of, the accounting unit is reconsidered or one or more of the separate indefinite-lived intangible asset(s) within the accounting unit is now considered finite-lived rather than indefinite-lived. We perform our impairment testing of our tradenames as single units of accounting based on their use in the reporting units, TORU, Prison Services and Business Systems.our business.
The carrying value of the TORUour tradenames, excluding any finite lived tradenames, was $11.5 million and $10.6 million at December 31, 20122014 and 2011, respectively.2013. For the years ended December 31, 20122014 and 2011,2013, we completed our annual impairment test using a DCF methodology based on a relief from royalty method and determined that there was no impairment of our tradenames included in the TORU.
The carrying value of the tradenames associated with the Prison Services and Business Systems reporting units included in the Other Operations segment had an aggregate carrying value of $1.8 million as of December 31, 2011. We performed our annual impairment test of the tradenames associated with the Prison Services and Business Systems using a DCF methodology based on a relief from royalty method. The DCF models were negatively impacted by the cancellation of the state of Illinois Prison Services contract, which is expected to be fully terminated during the year ending December 31, 2013 and forecasted break-even operating results of the Business Systems. Based on the relief from royalty method we determined that the tradenames associated the Prison Services and Business Systems reporting unit’s carrying value exceeded the estimated fair value and were impaired. During the quarter ended December 31, 2012, we recorded an impairment charge of $1.8 million to write off the tradenames associated with the Prison Services and Business Systems reporting units included in the Other Operations segment.tradename.
Revenue recognition
We recognize certain revenues pursuant to various cost recovery programs from federal and state USF and from revenue sharing arrangements with other local exchange carriers administered by the National Exchange Carrier Association.USF. Revenues are calculated based on our estimates and assumptions regarding various financial data including operating expenses, taxes and investment in property, plant and equipment. Non-financial data estimates are also utilized including projected demand usage and detailed network information. We must also make estimates of the
59
Table of Contents
jurisdictional separation of this data to assign current financial and operating data to the interstate or intrastate jurisdiction. These estimates are finalized in future periods as actual data becomes available to complete the separation studies. We have historically collected revenues recognized through these programs; however, adjustments to estimated revenues in future periods are possible. These adjustments could be necessitated by adverse regulatory developments with respect to these subsidies and revenue sharing arrangements, changes in allowable rates of return and the determination of recoverable costs, or decreases in the availability of funds in the programs due to increased participation by other carriers.
53
Derivatives
We have designateduse derivative contracts as cash flow hedges which willfinancial instruments primarily to manage the risks associated with fluctuations in interest rates and to convert a portion of future cash flows associated with the interest to be paid on our credit facility from a floating rate to a fixed rate. The changeAll derivative financial statements are recognized in the market valueconsolidated balance sheet at fair value. For the derivative financial instruments designated as a cash flow hedge, the effective portion of these derivative contracts is highly effective at offsettingthe changes in interest rate movements of our hedged item. Gains and losses arising from the change in fair value of the hedging transactionsderivative contracts are deferred in other comprehensive income, net of applicable income taxes, and recognized as a component of interest expense in the period in which the hedged item affects earnings. Any ineffectiveness is recognized immediately in earnings. If theFor derivative financial instruments used wouldnot designated as a cash flow hedge or have been determined to no longer be effective at offsetting changes in the price of the hedged item and have been de-designated, then the changes in the market value of these instruments would beare recorded in the statement of operations as a component of interest expense.
Our interest rate swaps are measured using an internal valuation modelmodels which reliesrely on an expected LIBOR-based yield curvequoted market prices and estimates of counterparty and our non-performance risk as the most significant inputs. Because each of these inputs are directly observable or can be corroborated by observable market data we have considered theseof similar instruments. The valuation models require estimates of future interest rate swaps to be within Level 2 inrates and judgments about the fair value hierarchy.future credit worthiness of the Company and each counterparty over the terms of the contracts.
Income taxes
Our current and deferred income taxes and associated valuation allowances are impacted by events and transactions arising in the normal course of business as well as in connection with the adoption of new accounting standards, acquisitions of businesses and non-recurring items. Assessment of the appropriate amount and classification of income taxes is dependent on several factors, including estimates of the timing and realization of deferred income tax assets and the timing of income tax payments. Actual amounts may materially differ from these estimates as a result of changes in tax laws as well as unanticipated future transactions impacting related income tax balances. We account for tax benefits taken or expected to be taken in our tax returns in accordance with the accounting guidance applicable for uncertainty in income taxes, which requires the use of a two-step approach for recognizing and measuring tax benefits taken or expected to be taken in a tax return.
Pension and postretirement benefits
The amounts recognized in our financial statements for pension and postretirement benefits are determined on an actuarial basis utilizing several critical assumptions.
We make significant assumptions in regards to our pension and postretirement plans, including the expected long-term rate of return on plan assets, and the discount rate used to value the periodic pension expense and liabilities. liabilities and actuarial assumptions relating to mortality rates and healthcare trend rates. Changes in these estimates and other factors could significantly impact our benefit cost and obligations to maintain pension and postretirement plans.
In 2014, we adopted the new U.S. mortality tables released by the Society of Actuaries for purposes of determining our mortality assumption used in our pension and postretirement benefit plans. The adoption of the new tables resulted in an increase in the life expectancy of plan participants. As a result of the updated mortality assumption, our pension and postretirement benefit obligations increased approximately $17.0 million at December 31, 2014.
Our pension investment strategy is to maximize long-term returns on invested plan assets while minimizing the risk of volatility. Accordingly, we target our allocation percentage at 55% -65%approximately 60% in equity funds, with the remainder in fixed income and cash equivalents. Our assumed rate considers this investment mix as well as past trends. We used a weighted-averagean expected long-term rate of return of 7.7%8.0% in 2014 and 7.5% in 2012 and 2011, respectively. As of January 1, 2013, we estimate the long-term rate of return of pension plan assets will be 8.0%.2013.
In determining the appropriate discount rate, we consider the current yields on high-quality corporate fixed-income investments with maturities that correspond to the expected duration of our pension and postretirement benefit plan obligations. For our 20122014 and 20112013 projected benefit obligations, we used a weighted-average discount rate of 4.20%4.27% and 5.35%4.97%, respectively, for our pension plans and 3.90%4.11% and 5.22%4.40%, respectively, for our other postretirement plans. The decrease in the discount rates in 2014 resulted in an increase in our pension and postretirement benefit obligations of approximately $29.9 million at December 31, 2014.
60
Table of Contents
A one percentage-point increase or decrease in the discount rate would have the following effects on net periodic benefit cost:
1-Percentage- | 1-Percentage- | | 1-Percentage- | | 1-Percentage- | | 1-Percentage- | |
Point Increase | Point Increase | | Point Decrease | | Point Increase | | Point Decrease | |
| | | | | | | | |
$ | (811) | | $ | 892 | | 1,280 | | $ | 172 | |
|
Accounting for the SureWest AcquisitionAcquisitions
Acquisitions ofAcquired businesses are accounted for using the purchaseacquisition method of accounting. The purchaseacquisition method of accounting requires that the purchase price paid for an acquisition be allocated to thetangible and intangible assets acquired and liabilities assumed based onbe recognized at their estimated fair valuesvalue as of the effective date of the acquisition, with the excess of the purchase price over the net assets acquired being recorded as goodwill. These estimates are revised during the allocation period, notValuations to exceed one year from the date of acquisition, when the information necessary to finalizedetermine the fair value of the net assets acquired requires management to make significant estimates is received and analyzed, or if information regarding contingencies becomes available to further defineassumptions. We believe these estimates and assumptions are reasonable; however, such assumptions are inherently uncertain and actual results could differ from those estimates.
At December 31, 2014, the quantifyfair values of the assets and liabilities acquired. Our consolidated financial statements include the operating results of SureWest from the date of the acquisition, July 2, 2012, and are not retroactively restated to include the historical position or the results of operations of SureWest.
54
We have not yet completed the valuation of all the assetsacquired and liabilities assumed in the SureWest acquisition. Adjustments, if necessary duringEnventis acquisition are based on a preliminary valuation, which is subject to change within the allocationmeasurement period as additional information is obtained. Upon completion of the final fair value assessment, the fair values of the net assets acquired may differ from the preliminary assessment. We are in the process of finalizing the valuation of the net assets acquired, most notably, the valuation of property, plant and equipment, intangible assets, pension and other post-retirement obligations and deferred income taxes. Any changes to the initial estimates of the fair value of the assets acquired and liabilities assumed will be reflected as adjustmentsrecorded to the acquired opening balance sheetthose assets and could impact our reported results. If we are unableliabilities and residual amounts will be allocated to goodwill. We expect to complete the purchase accounting relating the SureWest acquisition prior to the endvaluation of the allocation period, any required adjustment tonet assets acquired during the estimated fair values would be reflected in our consolidated statementsecond quarter of income.2015.
Recent Accounting Pronouncements
For information regarding the impact of certain recent accounting pronouncements, see Note 1 “Business Description & Summary of Significant Accounting Policies” to the Consolidated Financial Statements, included in this report in Part II - Item 8 Part II “Financial Statements and Supplementary Data”.
Item 7A. Quantitative and Qualitative Disclosures about Market Risk
Our exposure to market risk is primarily related to the impact of interest rate fluctuations on our debt obligations. Market risk is the potential loss arising from adverse changes in market interest rates on our variable rate obligations. In order to manage the volatility relating to changes in interest rates, we utilize derivative financial instruments such as interest rate swaps to maintain a mix of fixed and variable rate debt. We do not use derivatives for trading or speculative purposes. Our interest rate swap agreements effectively convert a portion of our floating-rate debt to a fixed-rate basis, thereby reducing the impact of interest rate changes on future cash interest payments. We calculate the potential change in interest expense caused by changes in market interest rates by determining the effect of the hypothetical rate increase on the portion of our variable rate debt that is not subject to a variable rate floor or hedged through the interest rate swap agreements.
At December 31, 2014, the majority of our variable rate debt was subject to a 1.00% London Interbank Offered Rate (“LIBOR”) floor thereby reducing the impact of fluctuations in interest rates. As of December 31, 2012,2014, LIBOR was well below the interest rate1.00% floor. Based on approximately $284.9 million of our floating rate debt was not fixed through the use of interest rate swaps, thereby subjecting this portion of our debt to potential changes in interest rates. Based on variable rate debt outstanding at December 31, 2012, if2014 that is not subject to a variable rate floor, a 1.0% change in market interest rates changed by 1.0%,would increase or decrease annual interest expense would have increased or decreased by approximately $2.8$0.4 million.
As of December 31, 2012,2014, the fair value of our interest rate swap agreements amounted to a net liability of $7.1$1.1 million. Pretax deferred losses related to our interest rate swap agreements included in accumulated other comprehensive loss (“AOCI”) was $7.9$0.7 million at December 31, 2012.
On December 4, 2012, $660,000 million notional interest rate swaps designated as a cash flow hedge were de-designated in connection with the amendment to our credit agreement. Prior to the de-designation, the effective portion of the change in fair value of these interest rate swaps were recognized in AOCI. The balance of the unrealized loss included in AOCI as of the date the swaps were de-designated is being amortized to earnings over the remaining term of the swap agreements. On December 31, 2012, $200,000 million notional interest rate swap agreements expired and the remainder will expire on March 31, 2013. Subsequent to December 4, 2012, changes in fair value of the de-designated swaps are recognized in earnings.2014.
Item 8. Financial Statements and Supplementary Data
For information pertaining to our Financial Statements and Supplementary Data, refer to pages F-1 to F-62F-48 of this report, which are incorporated herein by reference.
Item 9. Changes in and Disagreements with Accountants on Accounting and Financial Disclosure
Not applicable.
61
Table of Contents
Item 9A. Controls and Procedures
Evaluation of disclosure controls and procedures
We maintain disclosure controls and procedures as defined in Rules 13a-15(e) and 15d-15(e) under the Securities Exchange Act of 1934 (“Exchange Act”) that are designed to ensure that information required to be disclosed by us in reports that we file or submit under the Exchange Act is (i) recorded, processed, summarized and reported within the time periods specified in SEC rules and forms; and (ii) accumulated and communicated to our management, including our Chief Executive Officer and Chief Financial Officer, as appropriate to allow timely decisions regarding required disclosure. There are inherent limitations to the effectiveness of any system of disclosure controls
55
and procedures, including the possibility of human error and the circumvention or overriding of the controls and procedures. Accordingly, even effective disclosure controls and procedures can only provide reasonable assurance of achieving their control objectives. In connection with the filing of this Form 10-K, management evaluated, under the supervision and with the participation of our Chief Executive Officer and Chief Financial Officer, the effectiveness of the design to provide reasonable assurance of achieving their objectives and operation of our disclosure controls and procedures as of December 31, 2012.2014. Based upon that evaluation and subject to the foregoing, our Chief Executive Officer and Chief Financial Officer concluded that our disclosure controls and procedures are effective as of December 31, 2012.2014.
Our assessment of the internal control structure excluded SureWest,Enventis, which was acquired on July 2, 2012.October 16, 2014. The SureWestEnventis results since July 2, 2012October 16, 2014 are included in our consolidated results. Management’s assessment of and conclusion on the effectiveness of internal control over financial reporting did not include the internal controls of SureWest Communications,Enventis, which is included in our 20122014 consolidated financial statements and constituted $725.1$506.0 million and $552.3$388.8 million of total and net assets, respectively, as of December 31, 20122014 and $133.1$37.6 million and $2.5$1.4 million of revenues and net income,loss, respectively, for the year then ended. Under guidance issued by the SEC, companies are allowed to exclude acquisitions from their assessment of internal control over financial reporting during the first year of an acquisition.
Inherent Limitation of the Effectiveness of Internal Control
A control system, no matter how well conceived and operated, can only provide reasonable, not absolute, assurance that the objectives of the internal control system are met. Because of the inherent limitations of any internal control system, no evaluation of controls can provide absolute assurance that all control issues, if any, within a company have been detected.
MANAGEMENT’S REPORT ON INTERNAL CONTROL OVER FINANCIAL REPORTING
Our management is responsible for establishing and maintaining adequate internal control over financial reporting as such term is defined in Exchange Act Rule 13a–15(f). Management, with the participation of our Chief Executive Officer and Chief Financial Officer, assessed the effectiveness of our internal control over financial reporting as of December 31, 2014. In making this assessment, management used the framework set forth in Internal Control-Integrated Framework (2013) issued by the Committee of Sponsoring Organizations of the Treadway Commission. Based upon this assessment, our management concluded that, as of December 31, 2014, our internal control over financial reporting was effective to provide reasonable assurance that the desired control objectives were achieved.
We acquired Enventis on October 16, 2014. The Enventis results since October 16, 2014 are included in our consolidated results. Management’s assessment of and conclusion on the effectiveness of internal control over financial reporting did not include the internal controls of Enventis, which is included in our 2014 consolidated financial statements and constituted $506.0 million and $388.8 million of total and net assets, respectively, as of December 31, 2014 and $37.6 million and $1.4 million of revenues and net loss, respectively, for the year then ended. As the acquisition occurred during the last twelve months, the scope of our assessment of the effectiveness of internal control over financial reporting does not include Enventis. This exclusion is in accordance with the Securities Exchange Commission’s general guidance that an assessment of a recently acquired business may be omitted from our scope in the year of acquisition.
The effectiveness of internal control on financial reporting has been audited by Ernst & Young LLP, independent registered public accounting firm, as stated in their report which is included elsewhere in this Annual Report on Form 10-K.
62
Table of Contents
Changes in Internal Control over Financial Reporting
Based upon the evaluation performed by our management, which was conducted with the participation of our Chief Executive Officer and Chief Financial Officer, there has been no change in our internal control over financial reporting during the quarter ended December 31, 20122014 that has materially affected, or is reasonably likely to materially affect, our internal control over financial reporting.
Inherent Limitation of the Effectiveness of Internal Control
A control system, no matter how well conceived and operated, can only provide reasonable, not absolute, assurance that the objectives of the internal control system are met. Because of the inherent limitations of any internal control system, no evaluation of controls can provide absolute assurance that all control issues, if any, within a company have been detected.
MANAGEMENT’S REPORT ON INTERNAL CONTROL OVER FINANCIAL REPORTING
Our management is responsible for establishing and maintaining adequate internal control over financial reporting as such term is defined in Exchange Act Rule 13a–15(f). Management, with the participation of our Chief Executive Officer and Chief Financial Officer, assessed the effectiveness of our internal control over financial reporting as of December 31, 2012. In making this assessment, management used the framework set forth in Internal Control-Integrated Framework issued by the Committee of Sponsoring Organizations of the Treadway Commission. Based upon this assessment, our management concluded that, as of December 31, 2012, our internal control over financial reporting was effective to provide reasonable assurance that the desired control objectives were achieved.
We acquired SureWest on July 2, 2012. The SureWest results since July 2, 2012 are included in our consolidated results. Management’s assessment of and conclusion on the effectiveness of internal control over financial reporting did not include the internal controls of SureWest Communications, which is included in our 2012 consolidated financial statements and constituted $725.1 million and $552.3 million of total and net assets, respectively, as of December 31, 2012 and $133.1 million and $2.5 million of revenues and net income, respectively, for the year then ended. As the acquisition occurred during the last twelve months, the scope of our assessment of the effectiveness of internal control over financial reporting does not include SureWest. This exclusion is in accordance with the Securities Exchange Commission’s general guidance that an assessment of a recently acquired business may be omitted from our scope in the year of acquisition.
The effectiveness of internal control on financial reporting has been audited by Ernst & Young LLP, independent registered public accounting firm, as stated in their report which is included elsewhere in this Annual Report on Form 10-K.
5663
Table of Contents
REPORT OF INDEPENDENT REGISTERED PUBLIC ACCOUNTING FIRM
The Board of Directors and Shareholders
Consolidated Communications Holdings, Inc.
We have audited Consolidated Communications Holdings, Inc. and subsidiaries’ (the Company’s) internal control over financial reporting as of December 31, 2012,2014, based on criteria established in Internal Control—Integrated Framework issued by the Committee of Sponsoring Organizations of the Treadway Commission (2013 framework) (the COSO criteria). The Company’s management is responsible for maintaining effective internal control over financial reporting, and for its assessment of the effectiveness of internal control over financial reporting included in the accompanying Management’s Report on Internal Control Over Financial Reporting. Our responsibility is to express an opinion on the company’s internal control over financial reporting based on our audit.
We conducted our audit in accordance with the standards of the Public Company Accounting Oversight Board (United States). Those standards require that we plan and perform the audit to obtain reasonable assurance about whether effective internal control over financial reporting was maintained in all material respects. Our audit included obtaining an understanding of internal control over financial reporting, assessing the risk that a material weakness exists, testing and evaluating the design and operating effectiveness of internal control based on the assessed risk, and performing such other procedures as we considered necessary in the circumstances. We believe that our audit provides a reasonable basis for our opinion.
A company’s internal control over financial reporting is a process designed to provide reasonable assurance regarding the reliability of financial reporting and the preparation of financial statements for external purposes in accordance with generally accepted accounting principles. A company’s internal control over financial reporting includes those policies and procedures that (1) pertain to the maintenance of records that, in reasonable detail, accurately and fairly reflect the transactions and dispositions of the assets of the company; (2) provide reasonable assurance that transactions are recorded as necessary to permit preparation of financial statements in accordance with generally accepted accounting principles, and that receipts and expenditures of the company are being made only in accordance with authorizations of management and directors of the company; and (3) provide reasonable assurance regarding prevention or timely detection of unauthorized acquisition, use, or disposition of the company’s assets that could have a material effect on the financial statements.
Because of its inherent limitations, internal control over financial reporting may not prevent or detect misstatements. Also, projections of any evaluation of effectiveness to future periods are subject to the risk that controls may become inadequate because of changes in conditions, or that the degree of compliance with the policies or procedures may deteriorate.
As indicated in the accompanying Management’s Report on Internal Control Over Financial Reporting, management’s assessment of and conclusion on the effectiveness of internal control over financial reporting did not include the internal controls of SureWest Communications Inc.,Enventis Corporation, which is included in the 20122014 consolidated financial statements of Consolidated Communications Holdings, Inc. and subsidiaries and constituted $725.1$506.0 million and $552.3$388.8 million of total and net assets, respectively, as of December 31, 20122014 and $133.1$37.6 million and $2.5$1.4 million of revenues and net income,loss, respectively, for the year then ended. Our audit of internal control over financial reporting of Consolidated Communications Holdings, Inc. and subsidiaries(and subsidiaries) also did not include an evaluation of the internal control over financial reporting of SureWest Communications Inc.Enventis Corporation.
In our opinion, Consolidated Communications Holdings, Inc. and subsidiaries maintained, in all material respects, effective internal control over financial reporting as of December 31, 2012,2014, based on the COSO criteria.
We also have also audited, in accordance with the standards of the Public Company Accounting Oversight Board (United States), the consolidated balance sheets of Consolidated Communications Holdings, Inc. and subsidiaries as ofif December 31, 20122014 and 2011,2013, and the related consolidated statements of income, comprehensive income, changes in Shareholders’shareholders’ equity, and cash flows for each of the three years in the period ended December 31, 2012,2014, and our report dated March 12, 2013,February 27, 2015 expressed an unqualified opinion thereon.
St. Louis, Missouri
March 12, 2013February 27, 2015
5764
Table of Contents
PART III
Item 10.Directors, Executive Officers and Corporate Governance
Our Board of Directors adopted a Code of Business Conduct and Ethics (“the code”) that applies to all of our employees, officers, and directors, including its principal executive officer, principal financial officer, and principal accounting officer. A copy of the code is posted on our investor relations website at www.Consolidated.com.www.Consolidated.com. Information contained on the website inis not incorporated by reference in, or considered to be a part of, this document.
Additional information required by this Item is incorporated herein by reference to our proxy statement for the annual meeting of our shareholders to be filed pursuant to Regulation 14A within 120 days after our fiscal year-end of December 31, 2012.2014.
Item 11.Executive Compensation
Incorporated herein by reference from the proxy statement for the annual meeting of our shareholders to be filed pursuant to Regulation 14A within 120 days after our fiscal year-end of December 31, 2012.2014.
Item 12.Security Ownership of Certain Beneficial Owners and Management and Related Stockholder Matters
Incorporated herein by reference from the proxy statement for the annual meeting of our shareholders to be filed pursuant to Regulation 14A within 120 days after our fiscal year-end of December 31, 2012.2014.
Item 13.Certain Relationships and Related Transactions, and Director Independence
Incorporated herein by reference from the proxy statement for the annual meeting of our shareholders to be filed pursuant to Regulation 14A within 120 days after our fiscal year-end of December 31, 2012.2014.
Item 14.Principal Accountant Fees and Services
Incorporated herein by reference from the proxy statement for the annual meeting of our shareholders to be filed pursuant to Regulation 14A within 120 days after our fiscal year-end of December 31, 2012.2014.
5966
Table of Contents
PART IV
Item 15. Exhibits and Financial Statement Schedules.
(a) (1) All Financial Statements
a) | (1) All Financial Statements | Location |
| | |
| The following consolidating financial statements and independent auditors’ reports are filed as part of this report on Form 10-K in Item 8–“Financial Statements and Supplementary Data”: Management’s Report on Internal Control Over Financial Reporting
Reports of Independent Registered Public Accounting Firm
Consolidated Statements of Income for each of the three years in the period ended December 31, 2012
Consolidated Statements of Comprehensive Income for each of the three years in the period ended December 31, 2012
Consolidated Balance Sheets as of December 31, 2012 and 2011
Consolidated Statements of Shareholders’ Equity for each of the three years in the period ended December 31, 2012
Consolidated Statements of Cash Flows for each of the three years in the period ended December 31, 2012
| |
| | |
| Reports of Independent Registered Public Accounting Firm | F-1 |
| Consolidated Statements of Income for each of the three years in the period ended December 31, 2014 | F-2 |
| Consolidated Statements of Comprehensive Income for each of the three years in the period ended December 31, 2014 | F-3 |
| Consolidated Balance Sheets as of December 31, 2014 and 2013 | F-4 |
| Consolidated Statements of Shareholders’ Equity for each of the three years in the period ended December 31, 2014 | F-5 |
| Consolidated Statements of Cash Flows for each of the three years in the period ended December 31, 2014 | F-6 |
| Notes to Consolidated Financial Statements | F-7 |
|
|
|
| (2) Financial Statement Schedules | Location |
| | |
| Independent Auditors’ Report –Ernst & Young LLP | S-1 |
| Independent Auditors’ Report-Deloitte & Touche LLP | S-3 |
| Pennsylvania RSA No. 6 (II) Limited Partnership Balance Sheets - As of December 31, 20122014 and 20112013 | S-5 |
| Pennsylvania RSA No. 6 (II) Limited Partnership Statements of OperationsIncome and Comprehensive Income – Years Ended December 31, 2012, 20112014, 2013 and 20102012 | S-6 |
| Pennsylvania RSA No. 6 (II) Limited Partnership Statements of Changes in Partners’ Capital – Years Ended December 31, 2012, 20112014, 2013 and 20102012 | S-7 |
| Pennsylvania RSA No. 6 (II) Limited Partnership Statements of Cash Flows – Years Ended December 31, 2012, 20112014, 2013 and 20102012 | S-8 |
| Pennsylvania RSA No. 6 (II) Limited Partnership - Notes to Financial Statements | (2) Financial Statement SchedulesS-9
|
| | |
| Independent Auditors’ Report –Ernst & Young LLP | S-21 |
| GTE Mobilnet of Texas #17 Limited Partnership Balance Sheets - As of December 31, 2014 and 2013 | S-22 |
| GTE Mobilnet of Texas #17 Limited Partnership Statements of Income and Comprehensive Income – Years Ended December 31, 2014, 2013 and 2012 | S-23 |
| GTE Mobilnet of Texas #17 Limited Partnership Statements of Changes in Partners’ Capital – Years Ended December 31, 2014, 2013 and 2012 | S-24 |
| GTE Mobilnet of Texas #17 Limited Partnership Statements of Cash Flows – Years Ended December 31, 2014, 2013 and 2012 | S-25 |
| GTE Mobilnet of Texas #17 Limited Partnership - Notes to Financial Statements | S-26 |
| | |
| All other financial statement schedules have been omitted because they are not required, not applicable, or the information is otherwise included in the notes to the consolidated financial statements. | |
| | |
| (3) Exhibits | |
| | |
| The exhibits listed below on the accompanying Index to Exhibits are filed or furnished as part of this report. | |
67
Table of Contents
Exhibit
No.
|
Exhibit
No. | | Description | |
2.1* | | Agreement and Plan of Merger, dated as of February 5, 2012, by and among the Company, SureWest Communications, WH Acquisition Corp. and WH Acquisition II Corp. (incorporated by reference to Exhibit 2.1 to Current Report on Form 8-K dated February 5, 2012)
|
| | |
3.1
| | Form of Amended and Restated Certificate of Incorporation (incorporated by reference to Exhibit 3.1 to Amendment No. 7 to Form S-1 dated July 19, 2005, file no. 333-121086)
|
| | |
3.2
| | Certificate of Amendment of the Amended and Restated Certificate of Incorporation of Consolidated Communications Holdings, Inc., as filed with the Secretary of State of the State of Delaware on May 3, 2011 (incorporated by reference to Exhibit 3.1 to our Current Report on Form 8-K dated May 4, 2011)
|
| | |
3.3
| | Form of Amended and Restated Bylaws, as amended (incorporated by reference to Exhibit 3.1 to our Quarterly Report on Form 10-Q for the quarter ended September 30, 2009)
|
| | |
4.1
| | Specimen Common Stock Certificate (incorporated by reference to Exhibit 4.1 to Amendment No. 7 to Form S-1 dated July 19, 2005, file no. 333-121086)
|
| | |
4.2
| | Indenture, dated as of May 30, 2012, between Consolidated Communications, Inc. (“CCI”) (as successor to Consolidated Communications Finance Co. (“CCFC”)) and Wells Fargo Bank, National Association, as trustee (incorporated by reference to Exhibit 4.1 to our Current Report on Form 8-K dated May 30, 2012)
|
| | |
4.3
| | First Supplemental Indenture, dated as of July 2, 2012, among the Company, CCI, Consolidated Communications Enterprise Services, Inc. (“CCES”), Consolidated Communications Services Company (“CCSC”), Consolidated Communications of Fort Bend Company (“CCFBC”), Consolidated Communications of Texas Company (“CCTC”), and Consolidated Communications of Pennsylvania Company, LLC (“CCPC”), and Wells Fargo Bank, National Association (incorporated by reference to Exhibit 4.1 to our Current Report on Form 8-K dated June 29, 2012)
|
60
4.4
| | Second Supplemental Indenture, dated as of August 3, 2012, among SureWest Communications, SureWest Long Distance, SureWest Communications, Inc., SureWest Broadband, SureWest TeleVideo, SureWest Kansas, Inc., SureWest Telephone, SureWest Kansas Holdings, Inc., SureWest Kansas Connections, LLC, SureWest Kansas Licenses, LLC, SureWest Kansas Operations, LLC, SureWest Kansas Purchasing, LLC and SureWest Fiber Ventures LLC (collectively, the “SureWest Subsidiaries”), CCI, and Wells Fargo Bank, National Association (incorporated by reference to our Current Report on Form 8-K dated August 3, 2012)
|
| | |
4.5
| | Form of 10.875% Senior Note due 2020 (incorporated by reference to Exhibit A to Exhibit 4.1 to our Current Report on Form 8-K dated June 29, 2012)
|
| | |
4.6
| | Registration Rights Agreement, dated as of May 30, 2012, between CCFC and Morgan Stanley & Co. LLC (incorporated by reference to Exhibit 4.4 to our Current Report on Form 8-K dated May 30, 2012)
|
| | |
4.7
| | Joinder to Registration Rights Agreement, dated as of July 2, 2012, by the Company, CCI, CCES, CCSC, CCFBC, CCTC, and CCPC (incorporated by reference to our Current Report on Form 8-K dated June 29, 2012)
|
| | |
4.8
| | Joinder to Registration Rights Agreement, dated as of August 3, 2012, by each of the SureWest Subsidiaries (incorporated by reference to our Current Report on Form 8-K dated August 3, 2012)
|
| | |
4.9
| | Joinder Agreement, dated as of August 3, 2012, among each of the SureWest Subsidiaries, the Company, CCI, and Wells Fargo Bank, National Association, a national banking association, as Administrative Agent for the Lenders under the Credit Agreement (incorporated by reference to our Current Report on Form 8-K dated August 3, 2012)
|
| | |
10.1
| | Amendment Agreement dated June 8, 2011 among the Company, the subsidiaries of the Company named therein, the lenders named therein, and Wells Fargo Bank, National Association, as administrative agent (incorporated by reference to Exhibit 10.1 to our Current Report on Form 8-K dated June 13, 2011)
|
| | |
10.2
| | Amended and Restated Credit Agreement, dated June 8, 2011, among the Company, as Parent Guarantor, CCI, as Borrower, the lenders referred to therein, Wells Fargo Bank, National Association, as administrative agent, issuing bank and swingline lender, CoBank, ACB, as syndication agent, General Electric Capital Corporation, as documentation agent, The Royal Bank of Scotland PLC, as documentation agent, and Wells Fargo Securities, LLC, as sole lead arranger and sole bookrunner (incorporated by reference to Exhibit 10.1 to our Current Report on Form 8-K dated June 13, 2011), as amended by the First Amendment to Amended and Restated Credit Agreement, dated as of February 17, 2012, by and among the Company, CCI, the Subsidiary Loan Parties identified therein, the lenders referred to therein and Wells Fargo Bank, National Association, as administrative agent (incorporated by reference to Exhibit 10.1 to our Current Report on Form 8-K dated February 17, 2012), as amended by the Second Amendment and Incremental Facility Agreement, dated as of December 4, 2012, by and among the Company, CCI, the Subsidiary Loan Parties identified therein, the lenders referred to therein and Wells Fargo Bank, National Association, as administrative agent and certain other lenders (incorporated by reference to Exhibit 10.1 to our Current Report on Form 8-K dated December 4, 2012)
|
| | |
10.3
| | Revolving Extension Agreement, dated July 7, 2011, among the Company, CCCI, the Revolving-1 Lenders referred therein and Wells Fargo Bank, National Association (successor by merger to Wachovia Bank, National Association), as administrative agent (incorporated by reference to Exhibit 10.3 to our Quarterly Report on Form 10-Q for the quarterly period ended June 30, 2011)
|
| | |
10.4
| | Form of Collateral Agreement, dated December 31, 2007, by and among the Company, CCI, Consolidated Communications Acquisition Texas, Inc., Fort Pitt Acquisition Sub Inc., certain subsidiaries of the Company identified on the signature pages thereto, in favor of Wells Fargo Bank, National Association (successor by merger to Wachovia Bank, National Association), as Administrative Agent (incorporated by reference to Exhibit 10.2 to our Annual Report on Form 10-K for the period ended December 31, 2007, file no. 000-51446)
|
| | |
10.5
| | Form of Guaranty Agreement, dated December 31, 2007, made by the Company and certain subsidiaries of the Company identified on the signature pages thereto, in favor of Wells Fargo Bank, National Association (successor by merger to Wachovia Bank, National Association), as Administrative Agent (incorporated by reference to Exhibit 10.3 to our Annual Report on Form 10-K for the period ended December 31, 2007, file no. 000-51446)
|
61
10.6
| | Letter Agreement, dated March 31, 2008, by Wells Fargo Bank, National Association (successor by merger to Wachovia Bank, National Association), and agreed to and acknowledged by the Company, CCI, Consolidated Communications Acquisition Texas, Inc. and North Pittsburgh Systems, Inc. (formerly known as Fort Pitt Acquisition Sub Inc.) (incorporated by reference to Exhibit 10.1 to our Current Report on Form 8-K dated March 31, 2008)
|
| | |
10.7
| | Letter Agreement dated August 6, 2008 by Wells Fargo Bank, National Association (successor by merger to Wachovia Bank, National Association), and agreed to and acknowledged by the Company, CCI, Consolidated Communications Acquisition Texas, Inc. and North Pittsburgh Systems, Inc. (formerly known as Fort Pitt Acquisition Sub Inc.) (incorporated by reference to Exhibit 10.1 to our Quarterly Report on Form 10-Q for the period ended June 30, 2008)
|
| | |
10.8
| | Lease Agreement, dated December 31, 2002, between LATEL, LLC and Illinois Consolidated Telephone Company (incorporated by reference to Exhibit 10.12 to Form S-4 dated October 26, 2004, file no. 333-119968)
|
| | |
10.9
| | Lease Agreement, dated December 22, 2010, between LATEL, LLC and Consolidated Communications Services Company (incorporated by reference to Exhibit 10.1 to our Current Report on Form 8-K dated December 22, 2010)
|
| | |
10.10
| | Lease Agreement, dated December 22, 2010, between LATEL, LLC and Illinois Consolidated Telephone Company (incorporated by reference to Exhibit 10.2 to our Current Report on Form 8-K dated December 22, 2010)
|
| | |
10.11
| | Lease Agreement, dated December 22, 2010, between LATEL, LLC and Illinois Consolidated Telephone Company (incorporated by reference to Exhibit 10.3 to our Current Report on Form 8-K dated December 22, 2010)
|
| | |
10.12
| | Master Lease Agreement, dated February 25, 2002, between General Electric Capital Corporation and TXU Communications Ventures Company (incorporated by reference to Exhibit 10.13 to Form S-4 dated October 26, 2004, file no. 333-119968)
|
| | |
10.13
| | Amendment No. 1 to Master Lease Agreement, dated February 25, 2002, between General Electric Capital Corporation and TXU Communications Ventures Company, dated March 18, 2002 (incorporated by reference to Exhibit 10.14 to Form S-4 dated October 26, 2004, file no. 333-119968)
|
| | |
10.14
| | Amended and Restated Consolidated Communications Holdings, Inc. Restricted Share Plan (incorporated by reference to Exhibit 10.11 to Amendment No. 7 to Form S-1 dated July 19, 2005, file no. 333-121086)
|
| | |
10.15**
| | Amended and Restated Consolidated Communications Holdings, Inc. 2005 Long-Term Incentive Plan (As Amended and Restated Effective May 4, 2010) (incorporated by reference to Exhibit 10.1 to our Current Report on Form 8-K dated May 10, 2010)
|
| | |
10.16**
| | Form of Employment Security Agreement with certain of the Company’s employees (incorporated by reference to Exhibit 10.1 to our Quarterly Report on Form 10-Q for the quarter ended September 30, 2012)
|
| | |
10.17**
| | Form of Employment Security Agreement with Robert J. Currey (incorporated by reference to Exhibit 10.1 to our Current Report on Form 8-K dated December 4, 2009)
|
| | |
10.18**
| | Form of Employment Security Agreement with certain of the Company’s other executive officers (incorporated by reference to Exhibit 10.2 to our Current Report on Form 8-K dated December 4, 2009)
|
| | |
10.19**
| | Form of Employment Security Agreement with the Company’s and its subsidiaries vice president and director level employees (incorporated by reference to Exhibit 10.12 to our Annual Report on Form 10-K for the period ended December 31, 2007, file no. 000-51446)
|
| | |
10.20**
| | Executive Long-Term Incentive Program, as revised March 12, 2007 (incorporated by reference to Exhibit 10.1 to our Current Report on Form 8-K dated March 12, 2007, file no. 000-51446)
|
| | |
10.21**
| | Form of 2005 Long-Term Incentive Plan Performance Stock Grant Certificate (incorporated by reference to Exhibit 10.2 to our Current Report on Form 8-K dated March 12, 2007, file no. 000-51446)
|
| | |
10.22**
| | Form of 2005 Long-Term Incentive Plan Restricted Stock Grant Certificate (incorporated by reference to Exhibit 10.3 to our Current Report on Form 8-K dated March 12, 2007, file no. 000-51446)
|
62
10.23**
| | Form of 2005 Long-Term Incentive Plan Restricted Stock Grant Certificate for Directors (incorporated by reference to Exhibit 10.4 to our Current Report on Form 8-K dated March 12, 2007, file no. 000-51446)
|
| | |
10.24**
| | Description of the Consolidated Communications Holdings, Inc. Bonus Plan (incorporated by reference to Exhibit 10.5 to our Current Report on Form 8-K dated March 12, 2007, file no. 000-51446)
|
| | |
10.25**
| | Separation Agreement dated May 3, 2011 between the Company and Joseph R. Dively (incorporated by reference to Exhibit 10.1 to our Current Report on Form 8-K dated May 4, 2011)
|
| | |
10.26
| | Commitment Letter, dated February 5, 2012, from Morgan Stanley Senior Funding, Inc. and agreed to and accepted by CCI (incorporated by reference to Exhibit 10.1 to our Current Report on Form 8-K dated February 5, 2012)
|
| | |
21.1
| | List of subsidiaries of the Registrant
|
| | |
23.1
| | Consent of Ernst & Young LLP
|
| | |
23.2
| | Consent of Deloitte & Touche LLP
|
| | |
31.1
| | Certificate of Chief Executive Officer of Consolidated Communications Holdings, Inc. pursuant to Rule 13(a)-14(a) under the Securities Exchange Act of 1934
|
| | |
31.2
| | Certificate of Chief Financial Officer of Consolidated Communications Holdings, Inc. pursuant to Rule 13(a)-14(a) under the Securities Exchange Act of 1934
|
| | |
32.1
| | Certification of the Chief Executive Officer and Chief Financial Officer pursuant to 18 U.S.C. Section 1350, as adopted pursuant to Section 906 of the Sarbanes-Oxley Act of 2002.
|
| | |
101***
| | The following financial information from Consolidated Communications Holdings, Inc. Annual Report on Form 10-K for the year ended December 31, 2012, formatted in XBRL (eXtensible Business Reporting Language): (i) Consolidated Statements of Income, (ii) Consolidated Statements of Comprehensive Income, (iii) Consolidated Balance Sheets, (iv) Consolidated Statements of Changes in Shareholders’ Equity, (v) Consolidated Statements of Cash Flows, and (vi) Notes to Consolidated Financial Statements.
|
*Schedules and other attachments to the Agreement and Plan of Merger, which aredated as of June 29, 2014, by and among the Company, Enventis Corporation and Sky Merger Sub Inc. (incorporated by reference to Exhibit 2.1 to our Current Report on Form 8-K dated June 29, 2014).
3.1 | Form of Amended and Restated Certificate of Incorporation (incorporated by reference to Exhibit 3.1 to Amendment No. 7 to Form S-1 dated July 19, 2005, file no. 333-121086) |
3.2 | Certificate of Amendment of the Amended and Restated Certificate of Incorporation of Consolidated Communications Holdings, Inc., as filed with the Secretary of State of the State of Delaware on May 3, 2011 (incorporated by reference to Exhibit 3.1 to our Current Report on Form 8-K dated May 4, 2011) |
3.3 | Amended and Restated Bylaws of Consolidated Communications Holdings Inc., as amended as of June 29, 2014 (incorporated by reference to Exhibit 3.2 to our Current Report on Form 8-K dated June 29, 2014). |
4.1 | Specimen Common Stock Certificate (incorporated by reference to Exhibit 4.1 to Amendment No. 7 to Form S-1 dated July 19, 2005, file no. 333-121086) |
4.2 | Indenture, dated as of September 18, 2014, between Consolidated Communications, Inc. (“CCI”) (as successor to Consolidated Communications Finance II Co. (“CCFII Co.”) and Wells Fargo Bank, National Association, as trustee (incorporated by reference to Exhibit 4.1 to our Current Report on Form 8-K dated September 18, 2014) |
4.3 | First Supplemental Indenture, dated as of October 16, 2014, among the Company, CCI, Consolidated Communications Enterprise Services, Inc., (“CCES”), Consolidated Communications of Fort Bend Company (“CCFBC”) Consolidated Communications of Pennsylvania Company, LLC (“CCPC”), Consolidated Communications Services Company (“CCSC”), Consolidated Communications of Texas Company (“CCTC”), SureWest Communications (“SW Communications”), SureWest Fiber Ventures, LLC(“SW Fiber Ventures”), SureWest Kansas, Inc. (“SW Kansas”), SureWest Long Distance (“SW Long Distance”). SureWest Telephone (“SW Telephone”), SureWest Tele Video (“SW Tele Video”), and Wells Fargo Bank, National Association (incorporated by reference to Exhibit 4.1 to our Current Report on Form 8-K dated October 16, 2014) |
4.4 | Second Supplemental Indenture, dated as of November 14, 2014, among CCI, Enventis Corporation, Cable Network, Inc., Crystal Communications, Inc., Enventis Telecom, Inc., Heartland Telecommunications Company of Iowa, Inc., Mankato Citizens Telephone Company, Mid-Communications, Inc., National Independent Billing, Inc., IdeaOne Telecom Inc. and Enterprise Integration Services, Inc. (collectively, the “Enventis Subsidiaries”) each of the Enventis Subsidiaries, and Wells Fargo Bank, National Association (incorporated by reference to Exhibit 4.2 to our Current Report on Form 8-K dated November 14, 2014) |
4.5 | Indenture, dated as of May 30, 2012, between CCI (as successor to Consolidated Communications Finance Co. (“CCFC”)) and Wells Fargo Bank, National Association, as trustee (incorporated by reference to Exhibit 4.1 to our Current Report on Form 8-K dated May 30, 2012) |
4.6 | First Supplemental Indenture, dated as of July 2, 2012, among the Company, CCI, CCES, CCSC, CCFBC, CCTC, and CCPC, and Wells Fargo Bank, National Association (incorporated by reference to Exhibit 4.1 to our Current Report on Form 8-K dated June 29, 2012)
|
4.7 | Second Supplemental Indenture, dated as of August 3, 2012, among SureWest Communications, SureWest Long Distance, SureWest Communications, Inc., SureWest Broadband, SureWest TeleVideo, SureWest Kansas, Inc., SureWest Telephone, SureWest Kansas Holdings, Inc., SureWest Kansas Connections, LLC, SureWest Kansas Licenses, LLC, SureWest Kansas Operations, LLC, SureWest Kansas Purchasing, LLC and SureWest Fiber Ventures LLC (collectively, the “SureWest Subsidiaries”), CCI, and Wells Fargo Bank, National Association (incorporated by reference to our Current Report on Form 8-K dated August 3, 2012) |
4.8 | Third Supplemental Indenture, dated as of April 1, 2014, among the Company, Consolidated Communications Inc., each of the subsidiaries listed inon the exhibit, are omitted. The Company agreessignature page thereto, and Wells Fargo Bank, National Association (incorporated by reference to furnish a supplemental copy of any schedule or other attachmentExhibit 4.1 to the Securities and Exchange Commission upon request.our Current Report on Form 8-K dated April 1, 2014). |
68
Table of Contents
4.9 | Fourth Supplemental Indenture, dated as of October 16, 2014, by the Company, CCI, CCES, CCFBC, CCPC, CCSC, CCTC, SW Communications, SW Fiber Ventures, SW Kansas, SW Long Distance, SW Telephone and SW Tele Video (incorporated by reference to Exhibit 4.4 to our Current Report on Form 8-K dated October 16, 2014) |
4.10 | Fifth Supplemental Indenture, dated as of November 14, 2014, among CCI, each of the Enventis Subsidiaries, and Wells Fargo Bank, National Association (incorporated by reference to Exhibit 4.4 to our Current Report on Form 8-K dated November 14, 2014 |
4.11 | Form of 6.50% Senior Note due 2022 (incorporated by reference to Exhibit A to Exhibit 4.1 to our Current Report on Form 8-K dated September 18, 2014) |
4.12 | Form of 10.875% Senior Note due 2020 (incorporated by reference to Exhibit A to Exhibit 4.1 to our Current Report on Form 8-K dated June 29, 2012) |
4.13 | Registration Rights Agreement, dated as of September 18, 2014, between CCI (as successor to CCFII Co.) and Morgan Stanley & Co. LLC (incorporated by reference to Exhibit 4.4 to our Current Report on Form 8-K dated September 18, 2014) |
4.14 | Joinder to Registration Rights Agreement, dated as of October 16, 2014, by the Company, CCI, CCES, CCFBC, CCSC, SW Communications, SW Fiber Ventures, SW Kansas, SW Long Distance, SW Telephone, and SW TeleVideo (incorporated by reference to Exhibit 4.3 to our Current Report on Form 8-K dated October 16, 2014) |
4.15 | Joinder to Registration Rights Agreement, dated as of November 14, 2014, by each of the Enventis Subsidiaries (incorporated by reference to Exhibit 4.3 to our Current Report on Form 8-K dated November 14, 2014) |
4.16***Compensatory plan or arrangement. | Joinder Agreement, dated as of November 14, 2014, among each of the Enventis Subsidiaries, the Company, CCI, and Wells Fargo Bank, National Association, a national banking association, as Administrative Agent for the Lenders under the Agreement (incorporated by reference to Exhibit 4.1 to our Current Report on Form 8-K dated November 14, 2014) |
4.17 | Registration Rights Agreement, dated as of May 30, 2012, between CCFC and Morgan Stanley & Co. LLC (incorporated by reference to Exhibit 4.4 to our Current Report on Form 8-K dated May 30, 2012). |
4.18 | Joinder to Registration Rights Agreement, dated as of July 2, 2012, by the Company, CCI, CCES, CCSC, CCFBC, CCTC, and CCPC (incorporated by reference to our Current Report on Form 8-K dated June 29, 2012) |
4.19 | Joinder to Registration Rights Agreement, dated as of August 3, 2012, by each of the SureWest Subsidiaries (incorporated by reference to our Current Report on Form 8-K dated August 3, 2012) |
4.20 | Joinder Agreement, dated as of August 3, 2012, among each of the SureWest Subsidiaries, the Company, CCI, and Wells Fargo Bank, National Association, a national banking association, as Administrative Agent for the Lenders under the Credit Agreement (incorporated by reference to our Current Report on Form 8-K dated August 3, 2012) |
10.1 | Second Amended and Restated Credit Agreement dated December 23, 2013 by and among the Company, the lenders named therein, and Wells Fargo Bank, National Association, as administrative agent (incorporated by reference to Exhibit 10.1 to our Current Report on Form 8-K dated December 23, 2013) as amended by that certain First Amendment to Second Amended and Restated Credit Agreement, dated as of October 16, 2014, by and among, Company, CCI, CCES, CCFBC, CCPC, CCSC, CCTC, SW Communications, SW Fiber Ventures, SW Kansas, SW Long Distance, SW Telephone and SW TeleVideo and Wells Fargo Bank, National Association, as administrative agent (filed herewith) |
10.2 | Form of Collateral Agreement, dated December 31, 2007, by and among the Company, CCI, Consolidated Communications Acquisition Texas, Inc., Fort Pitt Acquisition Sub Inc., certain subsidiaries of the Company identified on the signature pages thereto, in favor of Wells Fargo Bank, National Association (successor by merger to Wachovia Bank, National Association), as Administrative Agent (incorporated by reference to Exhibit 10.2 to our Annual Report on Form 10-K for the period ended December 31, 2007, file no. 000-51446) |
69
Table of Contents
10.3 | Form of Guaranty Agreement, dated December 31, 2007, made by the Company and certain subsidiaries of the Company identified on the signature pages thereto, in favor of Wells Fargo Bank, National Association (successor by merger to Wachovia Bank, National Association), as Administrative Agent (incorporated by reference to Exhibit 10.3 to our Annual Report on Form 10-K for the period ended December 31, 2007, file no. 000-51446) |
10.4 | Lease Agreement, dated December 22, 2010, between LATEL, LLC and Consolidated Communications Services Company (incorporated by reference to Exhibit 10.1 to our Current Report on Form 8-K dated December 22, 2010) |
10.5 | Lease Agreement, dated December 22, 2010, between LATEL, LLC and Illinois Consolidated Telephone Company (incorporated by reference to Exhibit 10.2 to our Current Report on Form 8-K dated December 22, 2010) |
10.6 | Lease Agreement, dated December 22, 2010, between LATEL, LLC and Illinois Consolidated Telephone Company (incorporated by reference to Exhibit 10.3 to our Current Report on Form 8-K dated December 22, 2010) |
10.7 | Amended and Restated Consolidated Communications Holdings, Inc. Restricted Share Plan (incorporated by reference to Exhibit 10.11 to Amendment No. 7 to Form S-1 dated July 19, 2005, file no. 333-121086) |
10.8*** | Amended and Restated Consolidated Communications Holdings, Inc. 2005 Long-Term Incentive Plan (As Amended and Restated Effective May 4, 2010) (incorporated by reference to Exhibit 10.1 to our Current Report on Form 8-K dated May 10, 2010) |
10.9**Pursuant* | Form of Employment Security Agreement with certain of the Company’s employees (incorporated by reference to Exhibit 10.1 to our Quarterly Report on Form 10-Q for the quarter ended September 30, 2012) |
10.10*** | Form of Employment Security Agreement with Robert J. Currey (incorporated by reference to Exhibit 10.1 to our Current Report on Form 8-K dated December 4, 2009) |
10.11*** | Form of Employment Security Agreement with certain of the Company’s other executive officers (incorporated by reference to Exhibit 10.2 to our Current Report on Form 8-K dated December 4, 2009) |
10.12*** | Form of Employment Security Agreement with the Company’s and its subsidiaries vice president and director level employees (incorporated by reference to Exhibit 10.12 to our Annual Report on Form 10-K for the period ended December 31, 2007, file no. 000-51446) |
10.13*** | Executive Long-Term Incentive Program, as revised March 12, 2007 (incorporated by reference to Exhibit 10.1 to our Current Report on Form 8-K dated March 12, 2007, file no. 000-51446) |
10.14*** | Form of 2005 Long-Term Incentive Plan Performance Stock Grant Certificate (incorporated by reference to Exhibit 10.2 to our Current Report on Form 8-K dated March 12, 2007, file no. 000-51446) |
10.15*** | Form of 2005 Long-Term Incentive Plan Restricted Stock Grant Certificate (incorporated by reference to Exhibit 10.3 to our Current Report on Form 8-K dated March 12, 2007, file no. 000-51446) |
10.16*** | Form of 2005 Long-Term Incentive Plan Restricted Stock Grant Certificate for Directors (incorporated by reference to Exhibit 10.4 to our Current Report on Form 8-K dated March 12, 2007, file no. 000-51446) |
10.17*** | Description of the Consolidated Communications Holdings, Inc. Bonus Plan (incorporated by reference to Exhibit 10.5 to our Current Report on Form 8-K dated March 12, 2007, file no. 000-51446) |
10.18 | Form of Indemnification Agreement with Directors and Executive Officers (incorporated by reference to Exhibit 10.1 to our Current Report on Form 8-K dated May 7, 2013) |
70
Table of Contents
10.19 | Commitment Letter, dated as of June 29, 2014, from Morgan Stanley Senior Funding, Inc., WF Investment Holdings, LLC, Wells Fargo Securities, LLC, RBS Securities, Inc. and the Royal Bank of Scotland plc and agreed to and accepted by Consolidated Communications Inc. (incorporated by reference to Exhibit 10.1 to our Current Report on Form 8-K dated June 29, 2014) |
21 | List of subsidiaries of the Registrant |
23.1 | Consent of Ernst & Young LLP |
23.2 | Consent of Deloitte & Touche LLP |
23.3 | Consent of Ernst & Young LLP |
31.1 | Certificate of Chief Executive Officer of Consolidated Communications Holdings, Inc. pursuant to Rule 406T of Regulation S-T,13(a)-14(a) under the Interactive Data Files in Exhibit 101 hereto are not deemed filed or part of a registration statement or prospectus for purposes of Sections 11 or 12 of the Securities Act of 1933, as amended, are not deemed filed for purposes of Section 18 of the Securities and Exchange Act of 1934 |
31.2 | Certificate of Chief Financial Officer of Consolidated Communications Holdings, Inc. pursuant to Rule 13(a)-14(a) under the Securities Exchange Act of 1934 |
32.1 | Certification of the Chief Executive Officer and Chief Financial Officer pursuant to 18 U.S.C. Section 1350, as amended,adopted pursuant to Section 906 of the Sarbanes-Oxley Act of 2002. |
101 | The following financial information from Consolidated Communications Holdings, Inc. Annual Report on Form 10-K for the year ended December 31, 2014, formatted in XBRL (eXtensible Business Reporting Language): (i) Consolidated Statements of Income, (ii) Consolidated Statements of Comprehensive Income, (iii) Consolidated Balance Sheets, (iv) Consolidated Statements of Changes in Shareholders’ Equity, (v) Consolidated Statements of Cash Flows, and otherwise are not subject(vi) Notes to liability under those sections.Consolidated Financial Statements. |
*Schedules and other attachments to the Agreement and Plan of Merger, which are listed in the exhibit, are omitted. The Company agrees to furnish a supplemental copy of any schedule or other attachment to the Securities and Exchange Commission upon request.
** Annexes to the Joinder Agreement, which are listed in the exhibit, are omitted. The Company agrees to furnish supplementally a copy of any annex to the Securities and Exchange Commission upon request.
***Compensatory plan or arrangement.
71
SIGNATURES
Pursuant to the requirements of Section 13 or 15(d) of the Securities Exchange Act of 1934, the registrant has duly caused this report to be signed on its behalf by the undersigned, thereunto duly authorized, in Mattoon, Illinois on March 12, 2013.February 27, 2015.
| CONSOLIDATED COMMUNICATIONS HOLDINGS, INC. |
| | |
| By: | /s/ C. ROBERT J. CURREYUDELL JR. | |
| | C. Robert J. CurreyUdell Jr. |
| | President and Chief Executive Officer
|
Pursuant to the requirements of the Securities Exchange Act of 1934, this report has been signed below by the following persons on behalf of the registrant and in the capacities and on the dates indicated.
Signature | | Title | | Date |
| | | | | |
By: | /s//s/ C. ROBERT J. CURREYUDELL JR.
| | | President and Chief Executive | | March 12, 2013February 27, 2015
|
| C. Robert J. CurreyUdell Jr. | | Chief Executive Officer, and Director | | |
| | | (Principal Executive Officer) | | |
| | | | | |
By: | /s//s/ STEVEN L. CHILDERS
| | Senior Vice President and
| | March 12, 2013
|
| Steven L. Childers
| | Chief Financial Officer (Principal | | February 27, 2015 |
| Steven L. Childers | | Financial and Accounting Officer) | | |
| | | | | |
By: | /s/ RICHARD A. LUMPKIN/s/ ROBERT J. CURREY
| | | Executive Chairman of the Board | | March 12, 2013February 27, 2015
|
| Richard A. LumpkinRobert J. Currey
| | and Director
| | |
| | | | | |
By: | /s/ ROGER H. MOORE/s/ RICHARD A. LUMPKIN
| | | Director | | March 12, 2013February 27, 2015
|
| Richard A. Lumpkin | | | | |
| | | | |
By: | /s/ ROGER H. MOORE | | | Director | | February 27, 2015 |
| Roger H. Moore | | | | |
| | | | | |
By: | /s//s/ MARIBETH S. RAHE
| | | Director | | March 12, 2013February 27, 2015
|
| Maribeth S. Rahe | | | | |
| | | | | |
By: | /s//s/ TIMOTHY D. TARON
| | | Director | | March 12, 2013February 27, 2015
|
| Timothy D. Taron | | | | |
| | | | | |
By: | /s//s/ THOMAS A. GERKE
| | | Director | | March 12, 2013February 27, 2015
|
| Thomas A. Gerke | | | | |
| | | | |
By: | /s/ DALE E. PARKER | | | Director | | February 27, 2015 |
| Dale E. Parker | | | | |
6472
Table of Contents
REPORT OF INDEPENDENT REGISTERED PUBLIC ACCOUNTING FIRM
The Board of Directors and Shareholders
Consolidated Communications Holdings, Inc.
We have audited the accompanying consolidated balance sheets of Consolidated Communications Holdings, Inc. and subsidiaries (the Company) as of December 31, 20122014 and 2011,2013, and the related consolidated statements of income, comprehensive income, changes in shareholders’ equity, and cash flows for each of the three years in the period ended December 31, 2012.2014. These consolidated financial statements are the responsibility of the Company’s management. Our responsibility is to express an opinion on these consolidated financial statements based on our audits.
We conducted our audits in accordance with the standards of the Public Company Accounting Oversight Board (United States). Those standards require that we plan and perform the audit to obtain reasonable assurance about whether the consolidated financial statements are free of material misstatement. An audit includes examining, on a test basis, evidence supporting the amounts and disclosures in the consolidated financial statements. An audit also includes assessing the accounting principles used and the significant estimates made by management, as well as evaluating the overall financial statement presentation. We believe that our audits provide a reasonable basis for our opinion.
In our opinion, the consolidated financial statements referred to above present fairly, in all material respects, the consolidated financial position of Consolidated Communications Holdings, Inc. and subsidiaries at December 31, 20122014 and 2011,2013, and the consolidated results of their operations and their cash flows for each of the three years in the period ended December 31, 2012,2014, in conformity with U.S. generally accepted accounting principles.
We also have audited, in accordance with the standards of the Public Company Accounting Oversight Board (United States), Consolidated Communications Holdings, Inc.’s internal control over financial reporting as of December 31, 2012,2014, based on criteria established in Internal Control – IntegratedControl-Integrated Framework issued by the Committee of Sponsoring Organizations of the Treadway Commission (2013 framework), and our report dated March 12, 2013,February 27, 2015, expressed an unqualified opinion thereon.
| /s/ Ernst & Young LLP |
| |
St. Louis, Missouri | |
February 27, 2015 | |
St. Louis, Missouri
March 12, 2013
F-1
Table of Contents
CONSOLIDATED COMMUNICATIONS HOLDINGS, INC. AND SUBSIDIARIES
CONSOLIDATED STATEMENTS OF INCOME
(amounts in thousands except per share amounts)
| | Year Ended December 31, | | Year Ended December 31, |
| | 2012 | | 2011 | | 2010 | | | 2014 | | 2013 | | 2012 |
| | | | | | | | | | | | | | | | |
Net revenues | | $ | 503,457 | | $ | 374,263 | | $ | 383,366 | | | $ | 635,738 | | $ | 601,577 | | $ | 477,877 | |
| | | | | | | | | | | | | | |
Operating expense: | | | | | | | | | | | | | | |
Cost of services and products (exclusive of depreciation and amortization) | | 193,743 | | 139,264 | | 142,302 | | | 242,661 | | 222,452 | | 175,929 | |
Selling, general and administrative expenses | | 111,617 | | 81,050 | | 88,025 | | | 140,636 | | 135,414 | | 108,163 | |
Financing and other transaction costs | | 20,800 | | 2,649 | | - | | |
Acquisition and other transaction costs | | | 11,817 | | 776 | | 20,800 | |
Impairment of intangible assets | | 2,923 | | - | | - | | | - | | - | | 1,236 | |
Depreciation and amortization | | 120,976 | | 88,745 | | 87,142 | | | 149,435 | | | 139,274 | | | 120,332 | |
Operating income | | 53,398 | | 62,555 | | 65,897 | | |
Income from operations | | | 91,189 | | | 103,661 | | | 51,417 | |
| | | | | | | | | | | | | | |
Other income (expense): | | | | | | | | | | | | | | |
Interest expense, net of interest income | | (72,604) | | (49,394) | | (50,740) | | | (82,537 | ) | | (85,767 | ) | | (72,604 | ) |
Loss on extinguishment of debt | | (4,455) | | - | | - | | | (13,785 | ) | | (7,657 | ) | | (4,455 | ) |
Investment income | | 30,667 | | 27,843 | | 27,744 | | | 34,516 | | 37,695 | | 30,667 | |
Other, net | | 601 | | 823 | | (758) | | | (968 | ) | | (456 | ) | | 601 | |
Income before income taxes | | 7,607 | | 41,827 | | 42,143 | | |
Income from continuing operations before income taxes | | | 28,415 | | | 47,476 | | | 5,626 | |
| | | | | | | | | | | | | | |
Income tax expense | | 1,436 | | 14,845 | | 8,991 | | | 13,027 | | | 17,512 | | | 661 | |
| | | | | | | | | | |
Income from continuing operations | | | 15,388 | | 29,964 | | 4,965 | |
| | | | | | | | |
Discontinued operations, net of tax: | | | | | | | | |
Income (loss) from discontinued operations, net of tax | | | - | | (156 | ) | | 1,206 | |
Gain on sale of discontinued operations, net of tax | | | - | | | 1,333 | | | - | |
Total discontinued operations | | | - | | | 1,177 | | | 1,206 | |
| | | | | | | | | | | | | | | | |
Net income | | 6,171 | | 26,982 | | 33,152 | | | 15,388 | | 31,141 | | 6,171 | |
Less: net income attributable to noncontrolling interest | | 531 | | 572 | | 557 | | | 321 | | | 330 | | | 531 | |
Net income attributable to common shareholders | | $ | 5,640 | | $ | 26,410 | | $ | 32,595 | | | $ | 15,067 | | | $ | 30,811 | | | $ | 5,640 | |
| | | | | | | | | | | | | | | |
Net income per common share - basic and diluted | | $ | 0.15 | | $ | 0.88 | | $ | 1.09 | | | | | | | | |
Income from continuing operations | | | $ | 0.35 | | $ | 0.73 | | $ | 0.12 | |
Discontinued operations, net of tax | | | - | | 0.03 | | | 0.03 | |
Net income per basic and diluted common shares attributable to common shareholders | | | $ | 0.35 | | | $ | 0.76 | | | $ | 0.15 | |
| | | | | | | | | | | | | | | |
Dividends declared per common share | | $ | 1.55 | | $ | 1.55 | | $ | 1.55 | | | $ | 1.55 | | | $ | 1.55 | | | $ | 1.55 | |
See accompanying notes.
F-2
Table of Contents
CONSOLIDATED COMMUNICATIONS HOLDINGS, INC. AND SUBSIDIARIES
CONSOLIDATED STATEMENTS OF COMPREHENSIVE INCOME (LOSS)
(amounts in thousands)
| | Year Ended December 31, | | Year Ended December 31, |
| | 2012 | | 2011 | | 2010 | | | 2014 | | 2013 | | 2012 |
| | | | | | | | | | | | | | |
Net income | | $ | 6,171 | | $ | 26,982 | | $ | 33,152 | | | $ | 15,388 | | $ | 31,141 | | $ | 6,171 | |
Change in prior service cost and net actuarial loss, net of tax benefit (expense) of $8,159, $8,434 and $(948) in 2012, 2011 and 2010, respectively | | (12,929) | | (13,959) | | 1,572 | | |
| | | | | | | | |
Change in fair value of cash flow hedges, net of tax expense of $3,055, $4,434 and $1,430 in 2012, 2011 and 2010, respectively | | 4,978 | | 7,597 | | 2,497 | | |
Pension and post-retirement obligations: | | | | | | | | |
Change in net actuarial loss and prior service credit, net of tax expense (benefit) of $(22,473), $24,604 and $(8,932) in 2014, 2013 and 2012, respectively | | | (35,107 | ) | | 39,381 | | (14,205 | ) |
Amortization of actuarial losses and prior service credit to earnings, net of tax expense (benefit) of $(400), $1,172 and $771 in 2014, 2013 and 2012, respectively | | | (637 | ) | | 1,843 | | 1,276 | |
Derivative instruments designated as cash flow hedges: | | | | | | | | |
Change in fair value of derivatives, net of tax benefit of $51, $233 and $2,074 in 2014, 2013 and 2012, respectively | | | (81 | ) | | (381 | ) | | (3,557 | ) |
Reclassification of realized loss to earnings, net of tax expense of $781, $1,934 and $5,129 in 2014, 2013 and 2012, respectively | | | 1,269 | | | 3,941 | | | 8,535 | |
Comprehensive income (loss) | | (1,780) | | 20,620 | | 37,221 | | | (19,168 | ) | | 75,925 | | | (1,780 | ) |
Less: comprehensive income attributable to noncontrolling interest | | 531 | | 572 | | 557 | | | 321 | | | 330 | | | 531 | |
| | | | | | | | | | | | | | | | |
Total comprehensive income (loss) attributable to common shareholders | | $ | (2,311) | | $ | 20,048 | | $ | 36,664 | | | $ | (19,489 | ) | | $ | 75,595 | | | $ | (2,311 | ) |
See accompanying notes.
F-3
Table of Contents
CONSOLIDATED COMMUNICATIONS HOLDINGS, INC. AND SUBSIDIARIES
CONSOLIDATED BALANCE SHEETS
(amounts in thousands, except share and per share amounts)
| | December 31, | | December 31, |
| | 2012 | | 2011 | | | 2014 | | 2013 |
ASSETS | | | | | | | | | | | |
Current assets: | | | | | | | | | | | |
Cash and cash equivalents | | $ | 17,854 | | $ | 105,704 | | | $ | 6,679 | | | $ | 5,551 | |
Accounts receivable, net of allowance for doubtful accounts | | 58,582 | | 35,492 | | | 77,536 | | | 52,033 | |
Income tax receivable | | 11,819 | | 8,988 | | | 18,940 | | | 9,796 | |
Deferred income taxes | | 9,000 | | 4,825 | | | 13,374 | | | 7,960 | |
Prepaid expenses and other current assets | | 11,269 | | 6,941 | | | 17,616 | | | 12,380 | |
Total current assets | | 108,524 | | 161,950 | | | 134,145 | | | 87,720 | |
| | | | | | | | | | | |
Property, plant and equipment, net | | 908,236 | | 338,426 | | | 1,135,333 | | | 885,362 | |
Investments | | 109,750 | | 98,069 | | | 115,376 | | | 113,099 | |
Goodwill | | 604,988 | | 520,562 | | | 765,806 | | | 603,446 | |
Other intangible assets | | 49,530 | | 70,158 | | | 50,292 | | | 40,084 | |
Deferred debt issuance costs, net and other assets | | 13,800 | | 4,904 | | | 19,313 | | | 17,667 | |
Total assets | | $ | 1,794,828 | | $ | 1,194,069 | | | $ | 2,220,265 | | | $ | 1,747,378 | |
| | | | | | | | | | | |
LIABILITIES AND SHAREHOLDERS’ EQUITY | | | | | | | | | | | |
Current liabilities: | | | | | | | | | | | |
Accounts payable | | $ | 19,162 | | $ | 6,651 | | | $ | 15,277 | | | $ | 4,885 | |
Advance billings and customer deposits | | 28,592 | | 20,324 | | | 31,933 | | | 25,934 | |
Dividends payable | | 15,463 | | 11,571 | | | 19,510 | | | 15,520 | |
Accrued compensation | | 21,968 | | 12,814 | | | 32,581 | | | 22,252 | |
Accrued interest | | | 6,784 | | | 3,524 | |
Accrued expense | | 46,232 | | 21,358 | | | 39,698 | | | 35,173 | |
Current portion of long-term debt and capital lease obligations | | 9,596 | | 8,992 | | | 9,849 | | | 9,751 | |
Current portion of derivative liability | | 3,164 | | 3,580 | | | 443 | | | 660 | |
Total current liabilities | | 144,177 | | 85,290 | | | 156,075 | | | 117,699 | |
| | | | | | | | | | | |
Long-term debt and capital lease obligations | | 1,208,248 | | 875,719 | | | 1,356,753 | | | 1,212,134 | |
Deferred income taxes | | 138,842 | | 77,327 | | | 243,576 | | | 179,859 | |
Pension and other postretirement obligations | | 156,710 | | 93,754 | | | 122,367 | | | 75,754 | |
Other long-term liabilities | | 10,746 | | 14,167 | | | 14,581 | | | 9,593 | |
Total liabilities | | 1,658,723 | | 1,146,257 | | | 1,893,352 | | | 1,595,039 | |
| | | | | | | | | | | |
Commitments and contingencies | | | | | | | | | | | |
| | | | | | | | | | | |
Shareholders’ equity: | | | | | | | | | | | |
Common stock, par value $0.01 per share; 100,000,000 shares authorized, 39,877,998 and 29,869,512, shares outstanding as of December 31, 2012 and 2011, respectively | | 399 | | 299 | | |
Common stock, par value $0.01 per share; 100,000,000 shares authorized, 50,364,579 and 40,065,246 shares outstanding as of December 31, 2014 and 2013, respectively | | | 504 | | | 401 | |
Additional paid-in capital | | 177,315 | | 79,852 | | | 357,139 | | | 148,433 | |
Retained earnings | | - | | - | | | – | | | – | |
Accumulated other comprehensive loss, net | | (45,784) | | (37,833) | | | (35,556 | ) | | (1,000 | ) |
Noncontrolling interest | | 4,175 | | 5,494 | | | 4,826 | | | 4,505 | |
Total shareholders’ equity | | 136,105 | | 47,812 | | | 326,913 | | | 152,339 | |
Total liabilities and shareholders’ equity | | $ | 1,794,828 | | $ | 1,194,069 | | | $ | 2,220,265 | | | $ | 1,747,378 | |
See accompanying notes.
F-4
Table of Contents
CONSOLIDATED COMMUNICATIONS HOLDINGS, INC. AND SUBSIDIARIES
CONSOLIDATED STATEMENTS OF CHANGES IN SHAREHOLDERS’ EQUITY
(amounts in thousands)
| | Common Stock | | | | | | Accumulated | | | | | | | Common Stock | | | | | | Accumulated | | | | |
| | Shares | | Amount | | Additional
Paid-in
Capital | | Retained
Earnings | | Other
Comprehensive
Loss, net | | Non-
controlling
Interest | | Total | | | | | | | Additional | | | | Other | | Non- | | |
| | | | | | | | | | | | | | | | | | | | | Paid-in | | Retained | | Comprehensive | | controlling | | |
Balance at January 1, 2010 | | 29,609 | | $ | 296 | | $ | 109,746 | | $ | – | | $ | (35,540) | | $ | 6,215 | | $ | 80,717 | | |
Cash dividends on common stock | | – | | – | | (13,584) | | (32,595) | | – | | – | | (46,179 | ) | |
Shares issued under employee plan, net of forfeitures | | 208 | | 2 | | – | | – | | – | | – | | 2 | | |
Non-cash, stock-based compensation | | – | | – | | 2,363 | | – | | – | | – | | 2,363 | | |
Purchase and retirement of common stock | | (54) | | – | | (1,001) | | – | | – | | – | | (1,001 | ) | |
Tax on restricted stock vesting | | – | | – | | 602 | | – | | – | | – | | 602 | | |
Distributions to non-controlling interests | | – | | – | | – | | – | | – | | (1,850) | | (1,850 | ) | |
Other comprehensive income (loss) | | – | | – | | – | | – | | 4,069 | | – | | 4,069 | | |
Net income | | – | | – | | – | | 32,595 | | – | | 557 | | 33,152 | | |
Balance at December 31, 2010 | | 29,763 | | $ | 298 | | $ | 98,126 | | $ | – | | $ | (31,471) | | $ | 4,922 | | $ | 71,875 | | |
Cash dividends on common stock | | – | | – | | (19,938) | | (26,410) | | – | | – | | (46,348 | ) | |
Shares issued under employee plan, net of forfeitures | | 145 | | 1 | | – | | – | | – | | – | | 1 | | |
Non-cash, stock-based compensation | | – | | – | | 2,132 | | – | | – | | – | | 2,132 | | |
Purchase and retirement of common stock | | (39) | | – | | (726) | | – | | – | | – | | (726 | ) | |
Tax on restricted stock vesting | | – | | – | | 258 | | – | | – | | – | | 258 | | |
Other comprehensive income (loss) | | – | | – | | – | | – | | (6,362) | | – | | (6,362 | ) | |
Net income | | – | | – | | – | | 26,410 | | – | | 572 | | 26,982 | | |
| | | Shares | | Amount | | Capital | | Earnings | | Loss, net | | Interest | | Total |
| | | | | | | | | | | | | | | |
| | | | | | | | | | | | | | | |
Balance at December 31, 2011 | | 29,870 | | $ | 299 | | $ | 79,852 | | $ | – | | $ | (37,833) | | $ | 5,494 | | $ | 47,812 | | | 29,870 | | $ | 299 | | $ | 79,852 | | $ | - | | $ | (37,833) | | $ | 5,494 | | $ | 47,812 |
Cash dividends on common stock | | – | | – | | (52,352) | | (5,640) | | – | | – | | (57,992 | ) | | – | | – | | (52,352) | | (5,640) | | – | | – | | (57,992) |
Shares issued upon acquisition of SureWest | | 9,966 | | 100 | | 148,293 | | – | | – | | – | | 148,393 | | | 9,966 | | 100 | | 148,293 | | – | | – | | – | | 148,393 |
Shares issued under employee plan, net of forfeitures | | 79 | | – | | – | | – | | – | | – | | – | | | 79 | | – | | – | | – | | – | | – | | - |
Non-cash, stock-based compensation | | – | | – | | 2,348 | | – | | – | | – | | 2,348 | | | – | | – | | 2,348 | | – | | – | | – | | 2,348 |
Purchase and retirement of common stock | | (37) | | – | | (559) | | – | | – | | – | | (559 | ) | | (37) | | – | | (559) | | – | | – | | – | | (559) |
Tax on restricted stock vesting | | – | | – | | 47 | | – | | – | | – | | 47 | | | – | | – | | 47 | | – | | – | | – | | 47 |
Distributions to non-controlling interests | | – | | – | | – | | – | | – | | (1,850) | | (1,850 | ) | | – | | – | | – | | – | | – | | (1,850) | | (1,850) |
Other comprehensive income (loss) | | – | | – | | – | | – | | (7,951) | | – | | (7,951 | ) | | – | | – | | – | | – | | (7,951) | | – | | (7,951) |
Other | | – | | – | | (314) | | – | | – | | – | | (314 | ) | | – | | – | | (314) | | – | | – | | – | | (314) |
Net income | | – | | – | | – | | 5,640 | | – | | 531 | | 6,171 | | | – | | – | | – | | 5,640 | | – | | 531 | | 6,171 |
Balance at December 31, 2012 | | 39,878 | | $ | 399 | | $ | 177,315 | | $ | – | | $ | (45,784) | | $ | 4,175 | | $ | 136,105 | | | 39,878 | | $ | 399 | | $ | 177,315 | | $ | - | | $ | (45,784) | | $ | 4,175 | | $ | 136,105 |
Cash dividends on common stock | | | – | | – | | (31,310) | | (30,811) | | – | | – | | (62,121) |
Shares issued under employee plan, net of forfeitures | | | 234 | | 2 | | – | | – | | – | | – | | 2 |
Non-cash, stock-based compensation | | | – | | – | | 3,028 | | – | | – | | – | | 3,028 |
Purchase and retirement of common stock | | | (46) | | – | | (889) | | – | | – | | – | | (889) |
Tax on restricted stock vesting | | | – | | – | | 289 | | – | | – | | – | | 289 |
Other comprehensive income (loss) | | | – | | – | | – | | – | | 44,784 | | – | | 44,784 |
Net income | | | – | | – | | – | | 30,811 | | – | | 330 | | 31,141 |
Balance at December 31, 2013 | | | 40,066 | | $ | 401 | | $ | 148,433 | | $ | - | | $ | (1,000) | | $ | 4,505 | | $ | 152,339 |
Cash dividends on common stock | | | – | | – | | (51,264) | | (15,067) | | – | | – | | (66,331) |
Shares issued upon acquisition of Enventis | | | 10,144 | | 101 | | 257,558 | | – | | – | | – | | 257,659 |
Shares issued under employee plan, net of forfeitures | | | 224 | | 2 | | (2) | | – | | – | | – | | - |
Non-cash, stock-based compensation | | | – | | – | | 3,622 | | – | | – | | – | | 3,622 |
Purchase and retirement of common stock | | | (69) | | – | | (1,856) | | – | | – | | – | | (1,856) |
Tax on restricted stock vesting | | | – | | – | | 879 | | – | | – | | – | | 879 |
Other comprehensive income (loss) | | | – | | – | | – | | – | | (34,556) | | – | | (34,556) |
Other | | | – | | – | | (231) | | – | | – | | – | | (231) |
Net income | | | – | | – | | – | | 15,067 | | – | | 321 | | 15,388 |
Balance at December 31, 2014 | | | 50,365 | | $ | 504 | | $ | 357,139 | | $ | - | | $ | (35,556) | | $ | 4,826 | | $ | 326,913 |
See accompanying notes.
F-5
Table of Contents
CONSOLIDATED COMMUNICATIONS HOLDINGS, INC. AND SUBSIDIARIES
CONSOLIDATED STATEMENTS OF CASH FLOWS
(amounts in thousands)
| | Year Ended December 31, | | |
| | 2012 | | | 2011 | | | 2010 | | | Year Ended December 31, |
| | | | | | | | | | | 2014 | | 2013 | | 2012 |
Cash flows from operating activities: | | | | | | | | | | | | | | | | |
Net income | $ | | 6,171 | | $ | | 26,982 | | $ | | 33,152 | | | $ | 15,388 | | $ | 31,141 | | $ | 6,171 | |
Income from discontinued operations, net of tax | | | - | | (1,177) | | (1,206 | ) |
Net income from continuing operations | | | 15,388 | | 29,964 | | 4,965 | |
Adjustments to reconcile net income to net cash provided by operating activities: | | | | | | | | | | | | | | | | |
Depreciation and amortization | | 120,976 | | | 88,745 | | | 87,142 | | | 149,435 | | 139,274 | | 120,332 | |
Impairment of intangible assets | | 2,923 | | | – | | | – | | | - | | - | | 1,236 | |
Deferred income taxes | | (757 | ) | | 8,546 | | | (2,390 | ) | | 10,244 | | 16,045 | | (757 | ) |
Cash distributions from wireless partnerships in excess of/(less than) current earnings | | (1,309 | ) | | 945 | | | 16 | | | 212 | | (2,949) | | (1,309 | ) |
Stock-based compensation expense | | 2,348 | | | 2,132 | | | 2,363 | | | 3,636 | | 3,028 | | 2,348 | |
Amortization of deferred financing costs | | 6,360 | | | 1,411 | | | 1,293 | | | 4,364 | | 2,209 | | 6,360 | |
Loss on extinguishment of debt | | 4,455 | | | – | | | – | | | 13,785 | | 7,657 | | 4,455 | |
Other, net | | (332 | ) | | 108 | | | (3,112 | ) | | 2,973 | | 1,788 | | (332 | ) |
Changes in operating assets and liabilities: | | | | | | | | | | | | | | | | |
Accounts receivable, net | | (1,512 | ) | | 6,520 | | | 113 | | | 11,896 | | 5,937 | | (1,797 | ) |
Income tax receivable | | (2,846 | ) | | (2,498 | ) | | (3,699 | ) | | (3,406) | | 2,224 | | (2,846 | ) |
Other assets | | (803 | ) | | 421 | | | 317 | | |
Prepaids and other assets | | | 1,953 | | (1,111) | | (803 | ) |
Accounts payable | | 4,504 | | | 2,179 | | | (2,501 | ) | | (1,904) | | (10,069) | | 4,496 | |
Accrued expenses and other liabilities | | (16,963 | ) | | (5,987 | ) | | 3,448 | | | (20,791) | | (25,467) | | (16,616 | ) |
Net cash provided by continuing operations | | | 187,785 | | 168,530 | | 119,732 | |
Net cash provided by (used in) discontinued operations | | | - | | (4,174) | | 3,483 | |
Net cash provided by operating activities | | 123,215 | | | 129,504 | | | 116,142 | | | 187,785 | | 164,356 | | 123,215 | |
| | | | | | | | | | | | | | | | |
Cash flows from investing activities: | | | | | | | | | | | | | | | | |
Business acquisition, net of cash acquired | | (385,346 | ) | | – | | | – | | | (139,558) | | - | | (385,346 | ) |
Purchases of property, plant and equipment, net | | (77,095 | ) | | (41,913 | ) | | (42,917 | ) | | (108,998) | | (107,363) | | (76,998 | ) |
Purchase of investments | | (6,728 | ) | | – | | | – | | | (100) | | (403) | | (6,728 | ) |
Proceeds from sale of assets | | 924 | | | 840 | | | 1,065 | | | 1,795 | | 330 | | 924 | |
Other | | (314 | ) | | 272 | | | 35 | | | - | | - | | (314 | ) |
Net cash used for investing activities | | (468,559 | ) | | (40,801 | ) | | (41,817 | ) | |
Net cash used in continuing operations | | | (246,861) | | (107,436) | | (468,462 | ) |
Net cash provided by (used in) discontinued operations | | | - | | 2,331 | | (97 | ) |
Net cash used in investing activities | | | (246,861) | | (105,105) | | (468,559 | ) |
| | | | | | | | | | | | | | | | |
Cash flows from financing activities: | | | | | | | | | | | | | | | | |
Proceeds on bond offering | | 298,035 | | | – | | | – | | | 200,000 | | - | | 298,035 | |
Proceeds from issuance of long-term debt | | 544,850 | | | – | | | – | | | 80,000 | | 989,450 | | 544,850 | |
Payment of capital lease obligation | | (228 | ) | | (149 | ) | | (399 | ) | | (703) | | (516) | | (228 | ) |
Payment on long-term debt | | (510,038 | ) | | – | | | – | | | (63,100) | | (990,961) | | (510,038 | ) |
Partial redemption of senior notes | | | (84,127) | | - | | - | |
Payment of financing costs | | (18,616 | ) | | (3,471 | ) | | – | | | (7,438) | | (6,576) | | (18,616 | ) |
Distributions to noncontrolling interest | | (1,850 | ) | | – | | | (1,850 | ) | | - | | - | | (1,850 | ) |
Repurchase and retirement of common stock | | (559 | ) | | (726 | ) | | (1,001 | ) | | (1,856) | | (887) | | (559 | ) |
Dividends on common stock | | (54,100 | ) | | (46,307 | ) | | (46,179 | ) | | (62,341) | | (62,064) | | (54,100 | ) |
Other | | | (231) | | - | | - | |
Net cash provided by (used in) financing activities | | 257,494 | | | (50,653 | ) | | (49,429 | ) | | 60,204 | | (71,554) | | 257,494 | |
| | | | | | | | | | | | | | | | |
(Decrease)/increase in cash and cash equivalents | | (87,850 | ) | | 38,050 | | | 24,896 | | | 1,128 | | (12,303) | | (87,850 | ) |
| | | | | | | | | | | | | | | | |
Cash and cash equivalents at beginning of period | | 105,704 | | | 67,654 | | | 42,758 | | | 5,551 | | 17,854 | | 105,704 | |
| | | | | | | | | | | | | | | | | | | |
Cash and cash equivalents at end of period | $ | | 17,854 | | $ | | 105,704 | | $ | | 67,654 | | | $ | 6,679 | | $ | 5,551 | | $ | 17,854 | |
See accompanying notes.
F-6
Table of Contents
CONSOLIDATED COMMUNICATIONS HOLDINGS, INC. AND SUBSIDIARIES
NOTES TO CONSOLIDATED FINANCIAL STATEMENTS
YEARS ENDED DECEMBER 31, 2012, 20112014, 2013 AND 20102012
1. BUSINESS DESCRIPTION & SUMMARY OF SIGNIFICANT ACCOUNTING POLICIES
Business and Basis of Accounting
Consolidated Communications Holdings, Inc. (the “Company”, “we” or “our”) is a holding company with operating subsidiaries (collectively “Consolidated”) that provide integrated communications services to residentialin consumer, commercial, and business customerscarrier channels in California, Illinois, Iowa, Kansas, Minnesota, Missouri, North Dakota, Pennsylvania, South Dakota, Texas, Pennsylvania, California, Kansas and Missouri.Wisconsin. We classify our operations into two reportable segments: Telephone Operationsoperate as both an Incumbent Local Exchange Carrier (“ILEC”) and Other Operations.
Our Telephone Operations segment primarily consists ofa Competitive Local Exchange Carrier (“CLEC”), dependent upon the delivery ofterritory served. We provide a wide range of telecommunications services to residential and business customers. Our telecommunications servicesproducts that include local and long-distance service, high-speed broadband Internet access, video services, digital telephone serviceVoice over Internet Protocol (“VOIP”VoIP”), custom calling features, private line services, carrier grade access services, network capacity services over our regional fiber optic networks, cloud services, data center and managed services, directory publishing, and Competitive Local Exchange Carrier (“CLEC”) services.equipment sales. As of December 31, 2012,2014, we had approximately 269270 thousand access lines, 130167 thousand voice connections, 248290 thousand data and Internet connections and 106123 thousand video connections.
Our Other Operations segment consists primarily of two non-core businesses, including telephone services to correctional facilities (“prison services”) and equipment sales. See the “Recent Business Developments” section below for information regarding our prison services business.
We completed the acquisition of SureWest Communications on July 2, 2012. SureWest Communications results of operations are included within our results following the acquisition date. For a more complete discussion of the transaction, refer to Note 3.
Use of Estimates
Preparation of the financial statements in conformity with accounting principles generally accepted in the United States and pursuant to the rules and regulations of the Securities and Exchange Commission (the “SEC”) requires management to make estimates and assumptions that affecteffect the reported amounts of assets and liabilities at the date of the financial statements and the reported amounts of revenues and expenses during the reporting period. Actual results may differ materially from those estimates. Our critical accounting estimates include (i) impairment evaluations associated with indefinite-lived intangible assets (Note 1), (ii) revenue recognition (Note 1), (iii) derivatives (Notes 1 and 7), (iv) business combinations (Note 3), (v) the determination of deferred tax asset and liability balances (Notes 1 and 10), (v) and (vi) pension plan and other post-retirement costs and obligations (Notes 1 and 9) and (vi) accounting for the SureWest acquisition (Note 3). Events subsequent to the balance sheet date have been evaluated for inclusion in the accompanying consolidated financial statements through the date of issuance.
Principles of Consolidation
Our consolidated financial statements include the accounts of the Company and our wholly-owned subsidiaries and subsidiaries in which we have a controlling financial interest. All significant intercompany transactions have been eliminated.
Recent Business Developments
We currentlyEnventis Merger
On October 16, 2014, we completed our acquisition of Enventis Corporation, a Minnesota corporation (“Enventis”) in which we acquired all the issued and outstanding shares of Enventis in exchange for shares of our common stock. The financial results for Enventis have been included in our consolidated financial statements as of the acquisition date. For a more complete discussion of the transaction, refer to Note 3.
Discontinued Operations
On September 13, 2013, we completed the sale of the assets and contractual rights used to provide telephone servicecommunications services to inmates incarcerated at facilities operated by thein thirteen county jails located in Illinois Departmentfor a total purchase price of Corrections. On June 27, 2012, the Illinois Department of Central Management Services announced its intent to replace us as the provider of those services with a competitor. We have challenged our competitors bid and the State’s decision to accept that bid in a variety of different forums. Although we will continue to seek legal recourse to the State’s decision, our business plans and projections assume that our contract$2.5 million. In accordance with the StateFinancial Accounting Standards Board (“FASB”) Accounting Standards Codification (“ASC”) 205-20, “Discontinued Operations”, the financial results of Illinois will end during 2013. All related assets have been assessed for recoverability in light of this change. During 2012, the prison services contract comprised 82%business have been reported as a discontinued operation in our consolidated financial statements for the years ended on or before December 31, 2013. For a more complete discussion of the operating revenues intransaction, refer to Note 3.
SureWest Merger
We completed the acquisition of SureWest Communications (“SureWest”) on July 2, 2012. SureWest’s results of operations are included within our Other Operations segment, 5%results following the acquisition date. For a more complete discussion of consolidated operating revenues and approximately 2%the transaction, refer to Note 3.
F-7
Table of consolidated operating income, excluding financing and other transaction fees.Contents
CONSOLIDATED COMMUNICATIONS HOLDINGS, INC. AND SUBSIDIARIES
NOTES TO CONSOLIDATED FINANCIAL STATEMENTS (continued)
YEARS ENDED DECEMBER 31, 2014, 2013 AND 2012
Cash and Cash Equivalents
We consider all highly liquid investments with an original maturity of three months or less to be cash equivalents. Our cash equivalents consist primarily of money market funds. The carrying amounts of our cash equivalents approximate their fair value.
F-7
CONSOLIDATED COMMUNICATIONS HOLDINGS, INC. AND SUBSIDIARIES
NOTES TO CONSOLIDATED FINANCIAL STATEMENTS (continued)
YEARS ENDED DECEMBER 31, 2012, 2011 AND 2010
Accounts Receivable and Allowance for Doubtful Accounts
Accounts receivable consist primarily of amounts due to the Company from normal activities. We maintain an allowance for doubtful accounts for estimated losses, which result from the inability of our customers to make required payments. Such allowance is based on the likelihood of recoverability of accounts receivable based on past experience and management’s best estimates of current bad debt exposures. We perform ongoing credit evaluations of our customers’ financial condition and management believes that adequate allowances for doubtful accounts have been provided. Accounts are determined to be past due if customer payments have not been received in accordance with the payment terms. Uncollectible accounts are charged against the allowance for doubtful accounts and removed from the accounts receivable balances when internal collection efforts have been unsuccessful in collecting the amount due. The following table summarizes the activity in our accounts receivable allowance account for the years ended December 31, 2012, 20112014, 2013 and 2010:2012:
| | Year Ended December 31, | |
| | | | | | | | | | | Year Ended December 31, | |
(In thousands) | | 2012 | | | 2011 | | | 2010 | | | 2014 | | 2013 | | 2012 | |
Balance at beginning of year | | $ | 2,547 | | | $ | 2,694 | | | $ | 1,796 | | | $ | 1,598 | | $ | 4,025 | | $ | 2,547 | |
Provision charged to expense | | 5,615 | | | 4,104 | | | 5,963 | | | 3,320 | | 515 | | 5,615 | |
Write-offs, less recoveries | | (4,137 | ) | | (4,251 | ) | | (5,065 | ) | | (2,166) | | (2,942) | | (4,137) | |
Balance at end of year | | $ | 4,025 | | | $ | 2,547 | | | $ | 2,694 | | | $ | 2,752 | | $ | 1,598 | | $ | 4,025 | |
Investments
Our investments are primarily accounted for under either the equity or cost method. If we have the ability to exercise significant influence over the operations and financial policies of an affiliated company, the investment in the affiliated company is accounted for using the equity method. If we do not have control and also cannot exercise significant influence, the investment in the affiliated company is accounted for using the cost method.
We review our investment portfolio each reporting periodperiodically to determine whether there are identified events or circumstances that would indicate there is a decline in the fair value that is considered to be other than temporary. If we believe the decline is other than temporary, we evaluate the financial performance of the business and compare the carrying value of the investment to quoted market prices (if available) or the fair value of similar investments. In certain circumstances, fair value is based on traditional valuation models utilizing a multiple of cash flows. If an investment is deemed to have experienced an impairment we reducethat is considered other-than temporary, the carrying amount of the investment is reduced to its quoted or estimated fair value, as applicable, and establish a new cost basis for the investment. For cost method investments, we record thean impairment to investment income (loss), net. For our equity method investments, we record the impairment toloss is recognized in other income (expense).
Fair Value of Financial Instruments
We account for certain assets and liabilities at fair value. Fair value is an exit price, representing the amount that would be received to sell an asset or paid to transfer a liability in an orderly transaction between market participants. As such, fair value is a market-based measurement that should be determined based on assumptions that market participants would use in pricing an asset or a liability. A financial asset or liability’s classification within a three-tiered value hierarchy is determined based on the lowest level input that is significant to the fair value measurement. The hierarchy prioritizes the inputs to valuation techniques into three broad levels in order to maximize the use of observable inputs and minimize the use of unobservable inputs. The levels of the fair value hierarchy are as follows:
Level 1 | – | Observable inputs that reflect quoted prices (unadjusted) for identical assets or liabilities in active markets. |
| | |
Level 2 | – | Inputs that reflect quoted prices in active markets for similar assets or liabilities, quoted prices for identical or similar assets or liabilities in inactive markets and inputs other than quoted prices that are directly or indirectly observable in the marketplace. |
| | |
Level 3 | – | Level 1 – Observable inputs that reflect quoted prices (unadjusted) for identical assets or liabilities in active markets.
Level 2 – Inputs that reflect quoted prices in active markets for similar assets or liabilities, quoted prices for identical or similar assets or liabilities in inactive markets and inputs other than quoted prices that are directly or indirectly observable in the marketplace.
Level 3 – Unobservable inputs which are supported by little or no market activity.
|
F-8
Table of Contents
CONSOLIDATED COMMUNICATIONS HOLDINGS, INC. AND SUBSIDIARIES
NOTES TO CONSOLIDATED FINANCIAL STATEMENTS (continued)
YEARS ENDED DECEMBER 31, 2014, 2013 AND 2012
Property, Plant and Equipment
Property, plant and equipment are recorded at cost. We capitalize additions and substantial improvements and expense repairs and maintenance costs as incurred.
F-8
CONSOLIDATED COMMUNICATIONS HOLDINGS, INC. AND SUBSIDIARIES
NOTES TO CONSOLIDATED FINANCIAL STATEMENTS (continued)
YEARS ENDED DECEMBER 31, 2012, 2011 AND 2010
We capitalize the cost of internal-use network and non-network software which has a useful life in excess of one year. Subsequent additions, modifications or upgrades to internal-use network and non-network software are capitalized only to the extent that they allow the software to perform a task it previously did not perform. Software maintenance and training costs are expensed in the period in which they are incurred. Also, we capitalize interest associated with the development of internal-use network and non-network software.
Property, plant and equipment consisted of the following as of December 31, 20122014 and 2011:2013:
(In thousands) | | December 31,
2012 | | | December 31,
2011 | | | Estimated
Useful Lives | | | December 31,
2014 | | December 31,
2013 | | Estimated
Useful Lives | |
Land and buildings | | $ | 94,929 | | | $ | 66,704 | | | 18-40 years | | | $ | 116,523 | | $ | 98,663 | | 18-40 years | |
Network and outside plant facilities | | 1,469,418 | | | 897,140 | | | 3-50 years | | | 1,854,975 | | 1,543,190 | | 3-50 years | |
Furniture, fixtures and equipment | | 95,710 | | | 73,185 | | | 3-15 years | | | 136,682 | | 99,578 | | 3-15 years | |
Assets under capital lease | | 10,375 | | | 10,014 | | | 11 years | | | 11,510 | | 11,169 | | 3-11 years | |
Total plant in service | | 1,670,432 | | | 1,047,043 | | | | | | 2,119,690 | | 1,752,600 | | | |
Less: accumulated depreciation and amortization | | (785,502 | ) | | (721,527 | ) | | | | | (1,025,665) | | (899,926) | | | |
Plant in service | | 884,930 | | | 325,516 | | | | | | 1,094,025 | | 852,674 | | | |
Construction in progress | | 12,922 | | | 6,530 | | | | | | 28,233 | | 23,586 | | | |
Construction inventory | | 10,384 | | | 6,380 | | | | | | 13,075 | | 9,102 | | | |
Totals | | $ | 908,236 | | | $ | 338,426 | | | | | | $ | 1,135,333 | | $ | 885,362 | | | |
Construction inventory, which is stated at weighted average cost, consists primarily of network construction materials and supplies that when issued are predominately capitalized as part of new customer installations and the construction of the network.
We record depreciation using the straight line method over estimated useful lives using either the group or unit method. The useful lives are estimated at the time the assets are acquired and are based on historical experience with similar assets, anticipated technological changes and the expected impact of our strategic operating plan on our network infrastructure. The group method is used for depreciable assets dedicated to providing regulated telecommunication services, including the majority of the network and outside plant facilities. A depreciation rate for each asset group is developed based on the average useful life of the group. The group method requires periodic revision of depreciation rates. When an individual asset is sold or retired, the difference between the proceeds, if any, and the cost of the asset is charged or credited to accumulated depreciation, without recognition of a gain or loss.
The unit method is primarily used for buildings, furniture, fixtures and other support assets. Each asset is depreciated on the straight-line basis over its estimated useful life. When an individual asset is sold or retired, the cost basis of the asset and related accumulated depreciation are removed from the accounts and any associated gain or loss is recognized.
Depreciation and amortization expense was $98.6$139.0 million, $66.6$129.9 million and $65.0$98.3 million in 2012, 20112014, 2013 and 2010,2012, respectively. Amortization of assets under capital leases is included in depreciation and amortization expense.
We evaluate the recoverability of our property, plant and equipment whenever events or substantive changes in circumstances indicate that the carrying amount of an asset group may not be recoverable. Recoverability is measured by a comparison of the carrying amount of an asset group to estimated undiscounted future cash flows expected to be generated by the asset group. If the total of the expected future undiscounted cash flows were less than the carrying amount of the asset group, we would recognize an impairment charge for the difference between the estimated fair value and the carrying value of the asset group.
F-9
Table of Contents
CONSOLIDATED COMMUNICATIONS HOLDINGS, INC. AND SUBSIDIARIES
NOTES TO CONSOLIDATED FINANCIAL STATEMENTS (continued)
YEARS ENDED DECEMBER 31, 2014, 2013 AND 2012
Intangible Assets
Indefinite-Lived Intangibles
Goodwill and tradenames are evaluated for impairment annually or more frequently when events or changes in circumstances indicate that the asset might be impaired. We evaluate the carrying value of our indefinite-lived assets, tradenames and goodwill, as of November 30 of each year.
F-9
CONSOLIDATED COMMUNICATIONS HOLDINGS, INC. AND SUBSIDIARIES
NOTES TO CONSOLIDATED FINANCIAL STATEMENTS (continued)
YEARS ENDED DECEMBER 31, 2012, 2011 AND 2010
Tradenames
Our most valuable tradename is the federally registered mark CONSOLIDATED, which is used in association with our telephone communication services and is a design of interlocking circles. The Company’s corporate branding strategy leverages a CONSOLIDATED naming structure. With the acquisition of SureWest on July 2, 2012, we also own the tradenames associated with SureWest. All of the Company’s business units and several of our products and services incorporate the CONSOLIDATED name, except for the SureWest business units. We do not amortize our tradenames, as we have determined that they have an indefinite life. If facts and circumstances change relating to a tradenames continued use in the branding of our products and services, it may be treated as a finite-lived asset and begin to be amortized over its estimated remaining life. We estimate the fair value of our tradenames using discounted cash flows (“DCF”) based on a relief from royalty method. If the fair value of our tradenames was less than the carrying amount, we would recognize an impairment charge for the difference between the estimated fair value and the carrying value of the assets. We perform our impairment testing of our tradenames as single units of accounting based on their use in the reporting units, Telephone Operations reporting unit (“TORU”), Prison Services and Business Systems.
The carrying value of the TORU tradenames was $11.5 million and $10.6 million at December 31, 2012 and 2011, respectively. For the years ended December 31, 2012 and 2011, we completed our annual impairment test using a DCF methodology based on a relief from royalty method and determined that there was no impairment of our tradenames included in the TORU.
The tradenames associated with the Prison Services and Business Systems reporting units included in the Other Operations segment had a carrying value of $1.8 million as of December 31, 2011. We performed our annual impairment test of the tradenames associated with the Prison Services and Business Systems as of November 30, 2012 using a DCF based on a relief from royalty method. The DCF models were negatively impacted by the cancellation of the state of Illinois Prison Services contract, which is expected to be fully terminated during the year ending December 31, 2013 and forecasted break-even operating results of Business Systems. Based on the relief from royalty method we determined that the carrying value the tradenames associated with the Prison Services and Business Systems exceeded the estimated fair value and were impaired. During the quarter ended December 31, 2012, we recorded an impairment charge of $1.8 million to write off the tradenames associated with the Prison Services and Business Systems reporting units included in the Other Operations segment.
Goodwill
Goodwill is the excess of the acquisition cost of a business over the fair value of the identifiable net assets acquired. As noted above, goodwill is not amortized but instead evaluated annually for impairment using a preliminary qualitative assessment and two-step process, if deemed necessary. In 2012, we adopted an Accounting Standards Update No. 2011-08 – Intangibles-Goodwill and Other (Topic 350) Testing Goodwill for Impairment, that allows an entity to consider qualitative indicators to determine if the current two-step test is necessary. Under the provisions of the amended guidance, the step-one test of a reporting unit’s fair value is not required unless, as a result of the qualitative assessment, it is more likely than not (a likelihood of more than 50%) that fair value of the reporting unit is less than its carrying amount. Events and circumstances integrated into the qualitative assessment process include a combination of macroeconomic conditions affecting equity and credit markets, significant changes to the cost structure, overall financial performance and other relevant events affecting the reporting unit. A company is permitted to skip the qualitative assessment at its election, and proceed to Step 1 of the quantitative test, which we chose to do in 2012.2014. In the first step of the impairment test, the fair value of each of our two reporting unitsunit is compared to its carrying amount, including goodwill.
The estimated fair value of the reporting unit is determined using a combination of market-based approaches and a DCFdiscounted cash flow (“DCF”) model. The assumptions used in the estimate of fair value are based upon a combination of historical results and trends, new industry developments and future cash flow projections, as well as relevant comparable company earnings multiples for the market-based approaches. Such assumptions are subject to change as a result of changing economic and competitive conditions. We use a weighting of the results derived from the valuation approaches to estimate the fair value of the TORU. We used a DCF model to estimate the fair value of the Prison Services and Business Systems reporting units.unit. The fair value of the TORUreporting unit exceeded the carrying value at December 31, 2012. For the Prison Services and Business Systems reporting units, the carrying values exceeded the fair value indicating a potential impairment existed.
F-10
CONSOLIDATED COMMUNICATIONS HOLDINGS, INC. AND SUBSIDIARIES
NOTES TO CONSOLIDATED FINANCIAL STATEMENTS (continued)
YEARS ENDED DECEMBER 31, 2012, 2011 AND 20102014.
If the carrying value of the reporting unit exceeds its fair value, the second step of the impairment test is performed to measure the amount of impairment loss. In measuring the fair value of our reporting unitsunit as previously described, we consider the combined carrying and fair values of our reporting unitsunit in relation to our overall enterprise value, measured as the publicly traded stock price multiplied by the fully diluted shares outstanding plus the value of outstanding debt. Our reporting unit fair value models are consistent with a range in value indicated by both the preceding three month average stock price and the stock price on the valuation date, plus an estimated acquisition premium which is based on observable transactions of comparable companies, if applicable.
The second step compares the implied fair value of the reporting unit goodwill with the carrying amount of that goodwill. The implied fair value is determined by allocating the fair value of the reporting unit to all of the assets and liabilities other than goodwill in a manner similar to a purchase price allocation. The excess of the fair value of a reporting unit over the amounts assigned to its assets and liabilities is the implied fair value of goodwill. If the carrying amount of goodwill is greater than the implied fair value of that goodwill, then an impairment charge would be recorded equal to the difference between the implied fair value and the carrying value. At December 31, 2014 and 2013, the carrying value of goodwill was $765.8 million and $603.4 million, respectively. Goodwill increased $162.4 during 2014 as a result of the acquisition of Enventis, as described in Note 3.
Tradenames
Our most valuable tradename is the federally registered mark CONSOLIDATED, a design of interlocking circles, which is used in association with our telephone communication services. The Company’s corporate branding strategy leverages a CONSOLIDATED naming structure. All of the Company’s business units and several of our products and services incorporate the CONSOLIDATED name. Tradenames with indefinite useful lives are not amortized but are tested for impairment at least annually. If facts and circumstances change relating to a tradename’s continued use in the branding of our products and services, it may be treated as a finite-lived asset and begin to be amortized over its estimated remaining life. We determined that the based on the allocation ofestimate the fair value of our tradenames using DCF based on a relief from royalty method. If the reporting unit to assets and liabilities in second stepfair value of our tradenames was less than the impairment testing that the goodwill recorded at the Prison Services and Business Systems reporting units included in the Other Operations segment were impaired and recordedcarrying amount, we would recognize an impairment charge for the difference between the estimated fair value and the carrying value of
F-10
Table of $1.0Contents
CONSOLIDATED COMMUNICATIONS HOLDINGS, INC. AND SUBSIDIARIES
NOTES TO CONSOLIDATED FINANCIAL STATEMENTS (continued)
YEARS ENDED DECEMBER 31, 2014, 2013 AND 2012
the assets. We perform our impairment testing of our tradenames as single units of accounting based on their use in our single reporting unit.
The carrying value of our tradenames, excluding any finite lived tradenames, was $10.6 million duringat December 31, 2014 and 2013. For the quarteryears ended December 31, 2012.
The following table summarizes the carrying amount2014 and 2013, we completed our annual impairment test using a DCF methodology based on a relief from royalty method and determined that there was no impairment of goodwill recorded for the Telephone Operations and Other Operations segments at December 31, 2012 and 2011:our tradenames.
(In thousands) | | 2012 | | 2011 | |
Telephone operations | | $ | 604,988 | | $ | 519,542 | |
Other operations | | – | | 1,020 | |
Total | | $ | 604,988 | | $ | 520,562 | |
Finite-Lived Intangible Assets
Customer Lists
Finite lived intangible assets subject to amortization consist primarily of our customer lists of an established base of customers that subscribe to our services. Customer listsservices, tradenames of acquired companies and other intangible assets. Finite-lived intangible assets are amortized on a straight-line basis over their estimated useful lives (ranging from 3 to 13 years) based upon our historical experience with customer attrition.lives. In accordance with the applicable guidance relating to the impairment or disposal of long-lived assets, we evaluate the potential impairment of finite-lived intangible assets when impairment indicators exist. If the carrying value is no longer recoverable based upon the undiscounted future cash flows of the asset, an impairment equal to the difference between the carrying amount and the fair value of the asset is recognized. In 2012, we removed the fully amortized customer list balances of $0.2 million and $4.4 million included in the Telephone Operations and Other Operations, respectively.
The following is the carrying amountcomponents of customer lists at December 31, 2012 and 2011:finite-lived intangible assets are as follows:
| | Telephone Operations | | Other Operations |
(In thousands) | | 2012 | | | 2011 | | | 2012 | | 2011 | |
Gross carrying amount | | $ | 195,651 | | | $ | 193,124 | | | – | | $ | 4,405 | |
Less: accumulated amortization | | (157,579 | ) | | (135,754 | ) | | – | | (3,964 | ) |
Net carrying amount | | $ | 38,072 | | | $ | 57,370 | | | $ | - | | $ | 441 | |
| | | | | | | | | | | | | | | |
F-11
CONSOLIDATED COMMUNICATIONS HOLDINGS, INC. AND SUBSIDIARIES
NOTES TO CONSOLIDATED FINANCIAL STATEMENTS (continued)
YEARS ENDED DECEMBER 31, 2012, 2011 AND 2010
| | | | December 31, 2014 | | December 31, 2013 | |
| | | | Gross Carrying | | Accumulated | | Gross Carrying | | Accumulated | |
(In thousands) | | Useful Lives | | Amount | | Amortization | | Amount | | Amortization | |
| | | | | | | | | | | |
Customer relationships | | 3 - 13 years | | $ | 209,341 | | $ | (175,769) | | $ | 195,651 | | $ | (166,500) | |
Tradenames | | 1 - 2 years | | 2,280 | | (1,044) | | 900 | | (525) | |
Other intangible assets | | 2 years | | 5,500 | | (573) | | - | | - | |
Total | | | | $ | 217,121 | | $ | (177,386) | | $ | 196,551 | | $ | (167,025) | |
| | | | | | | | | | | | | | | | |
Amortization expense related to the finite-lived intangible assets for the years ended December 31, 2014, 2013 and 2012 2011 and 2010 was $22.4$10.4 million, and $22.1$9.4 million and $22.1 million, respectively. The weighted-average remaining period over which customer lists are being amortized is 2.63 years. Expected future amortization expense for the years 2013 through 2017of finite-lived intangible assets is as follows:
(In thousands) | | | | | | |
2013 | | $ | 8,921 | | |
2014 | | 8,921 | | |
2015 | | 8,848 | | | $ | 13,960 | |
2016 | | 8,776 | | | 13,170 | |
2017 | | 2,606 | | | 4,276 | |
2018 | | | 1,671 | |
2019 | | | 1,600 | |
Thereafter | | | | 5,058 | |
Total | | $ | 38,072 | | | $ | 39,735 | |
Derivative Financial Instruments
We use derivative financial instruments to manage our exposure to the risks associated with fluctuations in interest rates. Our interest rate swap agreements effectively convert a portion of our floating-rate debt to a fixed-rate basis, thereby reducing the impact of interest rate changes on future cash interest payments. At the inception of a hedge transaction, we formally document the relationship between the hedging instruments including our objective and strategy for establishing the hedge. In addition, the effectiveness of the derivative instrument is assessed at inception and on an ongoing basis throughout the hedging period. Counterparties to derivative instruments expose us to credit-related losses in the event of nonperformance. We execute agreements only with financial institutions we believe to be creditworthy and regularly assess the credit worthiness of each of the counterparties. We do not use derivative instruments for trading or speculative purposes.
Derivative financial instruments are recorded at fair value in our consolidated balance sheet. Certain of our interest rate swaps are designated as cash flow hedges of our expected future interest payments. Fair value is determined based on publicly available interest rate yield curves and an estimate of our nonperformance risk or our counterparty’s nonperformance credit risk, as applicable. We do not anticipate any nonperformance by any counterparty.
F-11
Table of Contents
CONSOLIDATED COMMUNICATIONS HOLDINGS, INC. AND SUBSIDIARIES
NOTES TO CONSOLIDATED FINANCIAL STATEMENTS (continued)
YEARS ENDED DECEMBER 31, 2014, 2013 AND 2012
For derivative instruments designated as a cash flow hedges,hedge, the effective portion of the change in the fair value is recognized as a component of accumulated other comprehensive income (loss) (“AOCI”) and is recognized as an adjustment to earnings over the period in which the hedged item impacts earnings. When an interest rate swap agreement terminates, any resulting gain or loss is recognized over the shorter of the remaining original term of the hedging instrument or the remaining life of the underlying debt obligation. The ineffective portion of the change in fair value of any hedging derivative is recognized immediately in earnings. If a derivative instrument is de-designated, the remaining gain or loss in AOCI on the date of de-designation is amortized to earnings over the remaining term of the hedging instrument. For derivative financial instruments that are not designated as a hedge, changes in fair value are recognized on a current basis in earnings. Cash flows from hedging activities are classified under the same category as the cash flows from the hedged items in our consolidated statement of cash flows. See Note 7 for further discussion of our derivative financial instruments.
Share-based Compensation
Our share-based compensation consists of the issuance of restricted stock awards (“RSAs”) and performance share awards (“PSAs”) (collectively “stock awards”). Associated costs are based on a stock award’s estimated fair value at the date of the grant and are recognized over a period in which any related services are provided. We recognize the cost of RSAs and PSAs on a straight-line basis over the requisite service period, generally from immediate vest to a four-year vesting period. See Note 8 for further details regarding share-based compensation.
Pension Plan and Other Post-Retirement Benefits
We maintain noncontributory defined benefit pension plans and provide certain post-retirement health care and life insurance benefits other than pensions to certain eligible employees. We also maintain two unfunded supplemental retirement plans to provide incremental pension payments to certain former employees.
We recognize pension and post-retirement benefits expense during the current period in the consolidated income statement using certain assumptions, including the expected long-term rate of return on plan assets, interest cost implied by the discount rate,
F-12
CONSOLIDATED COMMUNICATIONS HOLDINGS, INC. AND SUBSIDIARIES
NOTES TO CONSOLIDATED FINANCIAL STATEMENTS (continued)
YEARS ENDED DECEMBER 31, 2012, 2011 AND 2010
expected health care cost trend rate and the amortization of unrecognized gains and losses. Refer to Note 9 for further details regarding the determination of these assumptions.
We recognize the overfunded or underfunded status of our defined benefit pension and post-retirement plans as either an asset or liability in the consolidated balance sheet. We recognize changes in the funded status in the year in which the changes occur through comprehensive income, net of applicable income taxes, including unrecognized actuarial gains and losses and prior service costs and credits.
Income Taxes
Our estimates of income taxes and the significant items resulting in the recognition of deferred tax assets and liabilities are disclosed in Note 10 and reflect our assessment of future tax consequences of transactions that have been reflected in our financial statements or tax returns for each taxing jurisdiction in which we operate. We base our provision for income taxes on our current period income, changes in our deferred income tax assets and liabilities, income tax rates, changes in estimates of our uncertain tax positions and tax planning opportunities available in the jurisdictions in which we operate. We recognize deferred tax assets and liabilities when there are temporary differences between the financial reporting basis and tax basis of our assets and liabilities and for the expected benefits of using net operating loss and tax credit loss carryforwards. We establish valuation allowances when necessary to reduce the carrying amount of deferred income tax assets to the amounts that we believe are more likely than not to be realized. We evaluate the need to retain all or a portion of the valuation allowance on our deferred tax assets. When a change in the tax rate or tax law has an impact on deferred taxes, we apply the change based on the years in which the temporary differences are expected to reverse. As we operate in more than one state, changes in our state apportionment factors, based on operational results, may affect our future effective tax rates and the value of our deferred tax assets and liabilities. We record a change in tax rates in our consolidated financial statements in the period of enactment.
Income tax consequences that arise in connection with a business combination include identifying the tax basis of assets and liabilities acquired and any contingencies associated with uncertain tax positions assumed or resulting from the business combination. Deferred tax assets and liabilities related to temporary differences of an acquired entity are recorded as of the date of the business combination and are based on our estimate of the ultimateappropriate tax basis that will be accepted by the various taxing authorities.
F-12
Table of Contents
CONSOLIDATED COMMUNICATIONS HOLDINGS, INC. AND SUBSIDIARIES
NOTES TO CONSOLIDATED FINANCIAL STATEMENTS (continued)
YEARS ENDED DECEMBER 31, 2014, 2013 AND 2012
We record unrecognized tax benefits as liabilities in accordance with Accounting Standards Codification 740 and adjust these liabilities in the appropriate period when our judgment changes as a result of the evaluation of new information. In certain instances, the ultimate resolution may result in a payment that is materially different from our current estimate of the unrecognized tax benefit liabilities. These differences will be reflected as increases or decreases to income tax expense in the period in which new information is available. We classify interest and penalties, if any, associated with our uncertain tax positions as a component of interest expense and general and administrative expense, respectively. See Note 10 for additional information on income taxes.
Revenue Recognition
We recognize revenue when (i) persuasive evidence of an arrangement exists between us and the customer, (ii) delivery of the product to the customer has occurred or service has been provided to the customer, (iii) the price to the customer is fixed or determinable, and (iv), collectability of the sales price is reasonably assured.
Services
Revenues based on a flat fee, derived principally from local telephone, dedicated network access, data communications, digital TV, Internet access service and residential/businessconsumer/commercial broadband service are billed in advance and recognized in subsequent periods when the services are provided. provided, with the exception of certain governmental accounts which are billed in arrears.
Certain of our service bundles may include multiple deliverables. When these circumstances occur, the base bundle consists of voice services, which include a phone line, calling features and long distance. Customers may choose to add additional services including high-speed Internet and digital/IP TV services to the base bundle packages. Separate units of accounting within the bundled packages include voice services, high-speed Internet, and digital/IP TV services. Revenue for all services included in our bundles is recognized over the same service period, which is the time period in which service is provided to the customer. Service bundle discounts are recognized concurrently with the associated revenue and are allocated to the various services in the bundled offering based on the relative selling price of the services included in each bundled combination.
Revenues for usage-based services, such as per-minute long-distance service and access charges billed to other telephone carriers for originating and terminating long-distance calls on our network, are billed in arrears. We recognize revenue from these services in the period the services are rendered rather than billed. Earned but unbilled usage-based services are recorded in accounts receivable.
When required as part of providing service, revenues related to nonrefundable, upfront service activation and setup fees are deferred and recognized over the estimated customer life.
Incremental direct costs of telecommunications service activation are charged to expense in the period in which they are incurred, except when we maintain ownership of wiring installed during the activation process. In such cases the cost is capitalized and charged to expensedepreciated over the estimated useful life of the asset.
TelephonePrint advertising and publishing revenues are recognized ratably over the life of the related directory, generally 12 months.
Equipment
Revenues generated from the sale of equipment includes: i) the sale of voice and data communications equipment, ii) design, configuration and installation services related to voice and data equipment, iii) the provision of Cisco maintenance support contracts, and iv) the sale of professional support services related to customer voice and data systems. Equipment revenues generated from retail channels are recorded at the point of sale. Telecommunications systems and structured cabling project revenues are recognized when the project is completed. Maintenance services are provided on both a contract and time and material basis and are recorded when the service is provided. Print advertising
Support services revenue also includes “24x7” support of a customer’s voice and publishing revenuesdata networks. Most of these contracts are billed on a time and materials basis and revenue is recognized ratablyeither as services are provided or over the lifeterm of the contract. Support services also include professional support services, which are typically sold on a time and materials basis, but may be sold as a prepaid block of time. This revenue is recognized as the services are provided (deferred and recognized as utilized if prepaid).
Multiple Deliverable Arrangements
F-13
Table of Contents
CONSOLIDATED COMMUNICATIONS HOLDINGS, INC. AND SUBSIDIARIES
NOTES TO CONSOLIDATED FINANCIAL STATEMENTS (continued)
YEARS ENDED DECEMBER 31, 2014, 2013 AND 2012
We often enter into arrangements which include multiple deliverables. These arrangements primarily include the sale of communications equipment and associated support contracts, along with professional services providing design, configuration and installation consulting. When an equipment sale involves multiple deliverables, revenue is allocated to each respective element. When multiple deliverables included in an arrangement are separable into different units of accounting, the arrangement consideration is allocated to the identified separate units of accounting based on their relative selling price.
Allocation of revenue to deliverables of an arrangement is based on the relative selling price of the element being sold on a stand-alone basis. Equipment, maintenance contracts and professional services each qualify as separate units of accounting. We utilize the best estimate of selling price (“BESP”) for stand-alone value for our equipment and maintenance contracts, taking into consideration market conditions and entity-specific factors. We evaluate BESP by reviewing historical data related directory, generally 12 months.to sales of our deliverables.
Subsidies and Surcharges
Subsidies, including universal service revenues, are government-sponsored support mechanisms to assist in funding services in mostly rural, high-cost areas. These revenues typically are based on information we provide and are calculated by the administering government agency. Subsidies are recognized in the period the service is provided. There is a reasonable possibility that out of period subsidy adjustments may be recorded in the future, but they are anticipated to be immaterial to our results of operation, financial position and cash flow.
F-13
CONSOLIDATED COMMUNICATIONS HOLDINGS, INC. AND SUBSIDIARIES
NOTES TO CONSOLIDATED FINANCIAL STATEMENTS (continued)
YEARS ENDED DECEMBER 31, 2012, 2011 AND 2010
We collect and remit Federal Universal Service contributions on a gross basis, which resulted in recorded revenue of $11.0approximately $11.4 million for the year ended December 31, 2012.2014. We account for all other taxes collected from customers and remitted to the respective government agencies on a net basis.
Advertising Costs
Advertising costs are expensed as incurred. Advertising expense was $8.2 million, $7.6 million and $5.1 million $2.4 millionin 2014, 2013 and $2.5 million in 2012, 2011 and 2010 respectively.
Statement of Cash Flows Information
During 2012, 20112014, 2013 and 2010,2012, we made payments for interest and income taxes as follows:
(In thousands) | | 2012 | | 2011 | | 2010 | | | 2014 | | 2013 | | 2012 | |
Interest, net of amounts capitalized ($515, $144 and $173 in 2012, 2011 and 2010, respectively) | | $ | 63,541 | | $ | 47,071 | | $ | 50,032 | | |
Interest, net of amounts capitalized ($1,437, $1,215 and $515 in 2014, 2013 and 2012, respectively) | | | $ | 73,400 | | $ | 80,693 | | $ | 63,541 | |
Income taxes paid, net | | $ | 4,991 | | $ | 8,788 | | $ | 18,706 | | | $ | 5,311 | | $ | 960 | | $ | 4,991 | |
Noncash investing and financing activities:
In 2014, we issued 10.1 million shares of the Company’s common stock with a market value of $257.7 million in connection with the acquisition of Enventis as described in Note 3.
As described in Note 3, we issued $148.4 million in shares of the Company’s common stock in connection with the acquisition of SureWest in 2012.
In 2013 and 2012, we acquired equipment of $0.8 million and $0.4 million, respectively, through a capital lease agreement.agreements.
Noncontrolling Interest
We have a majority-owned subsidiary, East Texas Fiber Line Incorporated (“ETFL”) which is a joint venture owned 63% by the Company and 37% by Eastex Telecom Investments, LLC. ETFL provides connectivity over a fiber optic transport network to certain customers residing in Texas.
Recent Accounting Pronouncements
In July 2012, Financial Accounting Standards Board (“FASB”)August 2014, FASB issued the Accounting Standards Update No. 2012-022014-15 (“ASU 2012-02”2014-15”), Testing Indefinite-Lived Intangible AssetsDisclosure of Uncertainties about an Entity’s Ability to Continue as a Going Concern. ASU 2014-15 requires management to evaluate for Impairment. ASU 2012-02 permits an entity to perform an initial assessment of qualitative factors to determine whether it is more likely than not that a non-goodwill indefinite-lived intangible asset is impaired and thus whether it is necessary to calculate the asset’s fair value for the purpose of comparing it with the asset’s carrying amount. The amended guidance is effective foreach annual and interim impairment tests performed for fiscal years beginning after September 15, 2012, with early adoption permitted. We are currently evaluating the impact this update will have on our condensed consolidated financial statements.
Effective January 1, 2012, we adopted Accounting Standards Update No. 2011-04 (“ASU 2011-04”), Amendmentsreporting period whether conditions or events give rise to Achieve Common Fair Value Measurement and Disclosure Requirements in U.S. GAAP and International Financial Reporting Standards (“IFRS”). This pronouncement was issued to provide a consistent definition of fair value and ensuresubstantial doubt that the fair value measurement and disclosure requirements are similar between U.S. GAAP and IFRS. ASU 2011-04 changes certain fair value measurement principles and enhances the disclosure requirements particularly for Level 3 fair value measurements. The adoption of this standard did not have a material impact on our consolidated financial statements.
Effective January 1, 2012, we adopted Accounting Standards Update No. 2011-05 (“ASU 2011-05”), Presentation of Comprehensive Income. ASU 2011-05 requires an entity to either present components of net income and other comprehensive income in one continuous statement or in two separate but consecutive statements. Accordingly, we have presented net income and other comprehensive income in two consecutive statements.
Effective January 1, 2012, we adopted Accounting Standards Update No. 2011-08 (“ASU 2011-08”), Intangibles-Goodwill and Other (Topic 350) Testing Goodwill for Impairment. ASU 2011-08 provides entities an option to perform a qualitative assessment to determine whether further impairment testing on goodwill is necessary. Specifically, an entity has the optionability to first assess qualitative factors to determine whether it is necessary to perform the current two-step test. If an entity believes,continue as a result of its qualitative assessment, that it is more likely than not that the fair value of a reporting unit is less than its carrying amount, the quantitative impairment test is required. Otherwise, no further testing is required. Our adoption of this guidance did not impact our consolidated financial position or results of operations. For a more detailed discussiongoing concern within one year following issuance of the effects of applying the provisions of this guidance, refer to the Intangible Assets-Goodwill section above in Note 1.
Reclassifications
Certain amounts in our 2011 and 2010 consolidated financial statements have been reclassifiedand requires specific disclosures regarding the conditions or events leading to conform to the presentation of our 2012 consolidated financial statements. Inventories and the related activity have beensubstantial doubt. The new guidance
F-14
Table of Contents
CONSOLIDATED COMMUNICATIONS HOLDINGS, INC. AND SUBSIDIARIES
NOTES TO CONSOLIDATED FINANCIAL STATEMENTS (continued)
YEARS ENDED DECEMBER 31, 2012, 20112014, 2013 AND 20102012
reclassifiedis effective for annual and interim periods ending after December 15, 2016, with early adoption permitted. The adoption of ASU 2014-15 is not expected to have a material impact on our financial position or results of operations.
In June 2014, FASB issued the Accounting Standards Update No. 2014-12 (“ASU 2014-12”), Accounting for Share-Based Payments When the Terms of an Award Provide That a Performance Target Could Be Achieved after the Requisite Service Period. ASU 2014-12 provides guidance requiring a performance target that could be achieved after the requisite service period has ended to be treated as a performance condition affecting vesting of the award and therefore not reflected in estimating the fair value of the award at the date of grant. The amended guidance is effective for annual and interim periods beginning on or after December 15, 2015, with early adoption permitted. We do not expect the adoption of this standard to have a material effect on our financial position or results of operations.
In May 2014, FASB issued the Accounting Standards Update No. 2014-09 (“ASU 2014-09”), Revenue from current assetsContracts with Customers (Topic 606). ASU 2014-09 provides new, globally applicable converged guidance concerning recognition and measurement of revenue. As a result, significant additional disclosures are required about nature, amount, timing and uncertainty of revenue and cash flows arising from contracts with customers. The new guidance is effective for annual and interim periods beginning on or after December 15, 2016. Companies are allowed to property, plant and equipment ontransition using either the consolidated balance sheets and statementsmodified retrospective or full retrospective adoption method. If full retrospective adoption is chosen, three years of cash flows. Inventories consist primarilyfinancial information must be presented in accordance with the new standard. We are currently evaluating the alternative methods of network construction materials and supplies that when issued are capitalized as part of new customer installationsadoption and the constructioneffect on our condensed consolidated financial statements and related disclosures.
In April 2014, FASB issued the Accounting Standards Update No. 2014-08 (“ASU 2014-08”), Reporting Discontinued Operations and Disclosures of Disposals of Components of an Entity. ASU 2014-08 revises the network. The proportiondefinition of a discontinued operation to limit the items included in inventories that are capitalized to property, plant and equipment continues to increasecircumstances under which a disposal or classification as held for sale qualifies for presentation as a resultdiscontinued operation. Amendments in this ASU require expanded disclosures concerning a discontinued operation and the disposal of an individually-material component of an entity not qualifying as a discontinued operation. ASU 2014-08 is effective for annual and interim periods beginning on or after December 15, 2014 and should be applied prospectively, with early adoption permitted.
Effective January 1, 2014, we adopted Accounting Standards Update No. 2013-11 (“ASU 2013-11”), Presentation of an Unrecognized Tax Benefit When a Net Operating Loss Carryforward, a Similar Tax Loss, or a Tax Credit Carryforward Exists. ASU 2013-11 provides guidance concerning the growth in the broadband services offered by the Company.balance sheet presentation of an unrecognized tax benefit when a net operating loss carryforward, a similar tax loss or a tax credit carryforward is present. The adoption of this standard did not have a material impact on our consolidated financial statements.
2. EARNINGS PER SHARE
We compute net income per share using the two-class method. The two-class method is an earnings allocation formula that determines income per share for each class of common stock and participating security according to dividends declared and participation rights in undistributed earnings. Basic net income per share is computed using the weighted-average number of common shares outstanding during the period. Diluted net income attributable to our shareholders is computed using the weighted-average number of common shares and the effect of potentially dilutive securities outstanding during the period. Potentially dilutive shares consist of restricted shares, and shares subject to repurchase and cancellation.
The computation of basic and diluted earnings per share attributable to common shareholders is as follows:
(In thousands, except per share amounts) | | 2012 | | 2011 | | 2010 | |
| | | | | | | |
Basic and Diluted Earnings Per Share using Two-class Method: | | | | | | | |
Net income | | $ | 6,171 | | $ | 26,982 | | $ | 33,152 | |
Less: net income attributable to noncontrolling interest | | 531 | | 572 | | 557 | |
Net income attributable to common shareholders before allocation of earnings to participating securities | | 5,640 | | 26,410 | | 32,595 | |
Less: earnings allocated to participating securities | | 351 | | 429 | | 439 | |
Net income attributable to common shareholders | | $ | 5,289 | | $ | 25,981 | | $ | 32,156 | |
| | | | | | | |
Weighted-average number of common shares outstanding | | 34,652 | | 29,600 | | 29,490 | |
| | | | | | | |
Net income per common share attributable to common | | | | | | | |
shareholders - basic and diluted | | $ | 0.15 | | $ | 0.88 | | $ | 1.09 | |
An additional 0.3 million shares were not included in the computation of potentially dilutive securities at December 31, 2012, 2011 and 2010, because they were anti-dilutive.
3.MERGER WITH SUREWEST COMMUNICATIONS
On July 2, 2012, we completed the merger with SureWest Communications (“SureWest”), which resulted in the acquisition of 100% of all the outstanding shares of SureWest for $23.00 per share in a cash and stock transaction. SureWest provides telecommunication services in Northern California, primarily in the greater Sacramento region, and in the greater Kansas City, Kansas and Missouri areas. The total purchase price of $550.8 million consisted of cash and assumed debt of $402.4 million and 9,965,983 shares of the Company’s common stock valued at the Company’s opening stock price on July 2, 2012 of $14.89, which totaled $148.4 million. We acquired SureWest to provide additional diversification of our revenues and cash flows.
Subsequent to the merger, the financial results of SureWest operations have been included in our consolidated statement of operations within the Telephone Operations segment. SureWest contributed $133.1 million in net revenues and recorded net income of $2.5 million for the period of July 2, 2012 through December 31, 2012, which includes $9.5 million in acquisition related costs. As of December 31, 2012, we recognized change-in-control payments to former members of the SureWest management team of $8.6 million, which is expected to be paid during the six months ended June 30, 2013. These payments were recognized in financing and other transaction costs in the consolidated statement of operations during the year ended December 31, 2012 due to the close of the acquisition and the change or elimination of job duties.shares.
F-15
Table of Contents
CONSOLIDATED COMMUNICATIONS HOLDINGS, INC. AND SUBSIDIARIES
NOTES TO CONSOLIDATED FINANCIAL STATEMENTS (continued)
YEARS ENDED DECEMBER 31, 2012, 20112014, 2013 AND 20102012
The computation of basic and diluted earnings per share attributable to common shareholders is as follows:
(In thousands, except per share amounts) | | 2014 | | 2013 | | 2012 | |
Income from continuing operations | | $ | 15,388 | | $ | 29,964 | | $ | 4,965 | |
Less: net income attributable to noncontrolling interest | | 321 | | 330 | | 531 | |
Income attributable to common shareholders before allocation of earnings to participating securities | | 15,067 | | 29,634 | | 4,434 | |
Less: earnings allocated to participating securities | | 546 | | 466 | | 351 | |
Income from continuing operations attributable to common shareholders | | 14,521 | | 29,168 | | 4,083 | |
Net income from discontinued operations | | - | | 1,177 | | 1,206 | |
Net income attributable to common shareholders | | $ | 14,521 | | $ | 30,345 | | $ | 5,289 | |
| | | | | | | |
Weighted-average number of common shares outstanding | | 41,998 | | 39,764 | | 34,652 | |
| | | | | | | |
Basic and diluted earnings per common share: | | | | | | | |
Income from continuing operations | | $ | 0.35 | | $ | 0.73 | | $ | 0.12 | |
Income from discontinued operations, net of tax | | - | | 0.03 | | 0.03 | |
Net income per common share attributable to common shareholders | | $ | 0.35 | | $ | 0.76 | | $ | 0.15 | |
Diluted earnings per common share attributable to common shareholders excludes 0.4 million shares at December 31, 2014, and 0.3 million shares at December 31, 2013 and 2012, of potential common shares related to our share-based compensation plan, because the inclusion of the potential common shares would have had an antidilutive effect.
3.ACQUISITION AND DISPOSITIONS
Merger With Enventis
On October 16, 2014, we completed our merger with Enventis and acquired all the issued and outstanding shares of Enventis in exchange for shares of our common stock. As a result, Enventis became a wholly-owned subsidiary of the Company. Enventis is an advanced communications provider, which services business and residential customers primarily in the upper Midwest. The Enventis fiber network spans more than 4,200 route miles across Minnesota and into Iowa, North Dakota, South Dakota and Wisconsin. The acquisition reflects our strategy to diversify revenue and cash flows amongst multiple products and to expand our network to new markets.
At the effective time of SureWest has beenthe merger, each share of common stock, no par value, of Enventis owned immediately prior to the effective time of the merger converted into and became the right to receive 0.7402 shares of common stock, par value of $0.01 per share, of our common stock plus cash in lieu of fractional shares, as set forth in the merger agreement. Based on the closing price of our common stock of $25.40 per share on the date preceding the merger, the total value of the purchase consideration exchanged was $257.7 million, excluding the repayment of Enventis’ outstanding debt of $149.9 million. On the date of the merger, we issued an aggregate total of 10.1 million shares of our common stock to the former Enventis shareholders.
The acquisition was accounted for using the acquisition method in accordance with the FASB’s Accounting Standards Codification Topic 805, Business Combinations. Accordingly, the netacquisition method of accounting for business combinations. The tangible and intangible assets acquired areand liabilities assumed were recorded at their estimated fair values at July 2, 2012. Theseas of the date of the acquisition. The results of operations of Enventis have been reported in our consolidated financial statements as of the effective date of the acquisition. For the period of October 16, 2014 through December 31, 2014, Enventis contributed operating revenues of $37.6 million and a net loss of $1.4 million, which included $5.7 million in acquisition related costs. Included in acquisition related costs as of December 31, 2014, are various change in control payments and other contingent payments to certain Enventis employees and directors that were triggered upon the closing of the Enventis acquisition or shortly thereafter. The estimated cash payments under these agreements will be approximately $4.7 million and are expected to be paid in the second quarter of 2015.
F-16
Table of Contents
CONSOLIDATED COMMUNICATIONS HOLDINGS, INC. AND SUBSIDIARIES
NOTES TO CONSOLIDATED FINANCIAL STATEMENTS (continued)
YEARS ENDED DECEMBER 31, 2014, 2013 AND 2012
The preliminary estimated fair value of the tangible and intangible assets acquired and liabilities assumed are as follows:
|
| (In thousands) |
|
Cash and cash equivalents | | $ | 10,382 | |
Accounts receivable | | 37,399 | |
Other current assets | | 15,961 | |
Property, plant and equipment | | 282,564 | |
Intangible assets | | 20,570 | |
Other long-term assets | | 3,162 | |
Total assets acquired | | 370,038 | |
Current liabilities | | 40,552 | |
Pension and other post-retirement obligations | | 7,506 | |
Deferred income taxes | | 73,973 | |
Other long-term liabilities | | 2,768 | |
Total liabilities assumed | | 124,799 | |
Net fair value of assets acquired | | 245,239 | |
Goodwill | | 162,360 | |
Total consideration transferred | | $ | 407,599 | |
The fair values of the assets acquired and liabilities assumed are derived frombased on a preliminary purchase price allocation,valuation, which is subject to change based onwithin the completed tax analysis. The Company expects to completemeasurement period as additional information is obtained. Upon completion of the tax analysis by June 30, 2013, which may impactfinal fair value assessment, the fair values of the net assets acquired at the acquisition date during the measurement period.
The following table summarizesmay differ from the preliminary purchase price allocation:
| | (In thousands) | |
Current assets | | $ | 46,872 | |
Property, plant and equipment | | 591,818 | |
Goodwill | | 85,559 | |
Other intangible assets | | 3,600 | |
Other long-term assets | | 4,860 | |
Total assets acquired | | 732,709 | |
| | | |
Current liabilities | | 53,566 | |
Pension and other post-retirement obligations | | 55,916 | |
Deferred income taxes | | 68,317 | |
Other long-term liabilities | | 4,114 | |
Total liabilities assumed | | 181,913 | |
Net assets acquired | | $ | 550,796 | |
Theassessment. We are in the process of finalizing the valuation of the net assets acquired, currentmost notably, the valuation of property, plant and equipment, intangible assets, include cashpension and other post-retirement obligations and deferred income taxes. Any changes to the initial estimates of $17.1 million and trade receivables with a fair value of approximately $21.6 million and a gross value of approximately $23.4 million. We believe that the estimated fair value of the trade receivables approximates the amountassets acquired and liabilities assumed will be recorded to those assets and liabilities and residual amounts will be eventually collected. The acquired other intangible assets of approximately $3.6 million consists of the estimated fair values assignedallocated to customer lists of $2.7 million and tradenames of $0.9 million. The customer list intangible asset is being amortized over the estimated useful life of 3 or 5 years, depending on customer type. During the period ending December 31, 2012, we recorded amortization expense of approximately $0.3 million relating to the customer lists. Goodwill of $85.6 million and the tradenames of $0.9 million are indefinite-lived assets which are not subject to amortization; however, they are tested annually for impairment or more frequently when events or changes in circumstances indicate that the asset might be impaired. We evaluate our goodwill for impairment annually as of November 30, as described in Note 1 above. goodwill.
Goodwill recognized from the acquisition primarily relates to the expected contributions of the entity to the overall corporate strategy in addition to synergies and acquired workforce, which are not separable from goodwill.workforce. Goodwill is not deductible for income tax purposes. See Note 1 for additional information regarding the evaluation of goodwill.
DuringThe preliminary identifiable intangible assets acquired include customer relationships of $13.7 million, tradenames of $1.4 million and non-compete agreements of $5.5 million. The identifiable intangible assets are amortized using the quarter ended December 31, 2012,straight-line method over their estimated useful lives, which is five to nine years for customer relationships, depending on the Company adjusted its preliminary purchase price allocation due to the finalization of amounts recorded based on estimates and the reclassification of $2.2 million previously included in other long term liabilities to current liabilities. We also updated our valuationnature of the realcustomer, and personal propertytwo years for tradenames and intangible assets, which resulted in an increase to property, plant and equipment of $40.5 million, a decrease to other intangible assets relating to customer lists of $6.9 million and an increase to deferred tax liabilities of $10.0 million due to the increase in value assigned to the property, plant and equipment. Goodwill was reduced by $23.8 million due to the changes in valuation of assets and liabilities. These adjustments to the preliminary purchase price allocation have been recorded retrospectively as of the acquisition date.non-compete agreements.
Unaudited Pro Forma Results
The following unaudited pro forma information presents our results of operations as if the acquisition of SureWestEnventis occurred on January 1, 2011.2013. The adjustments to arrive at the pro forma information below includedincluded: additional depreciation and amortization expense for the fair value increases to property, plant and equipment software and customer relationships. Interestintangible assets acquired; increase in interest expense was increased to reflect the additional debt entered into to finance a portion of the acquisition; and the exclusion of certain acquisition price.related costs. Shares used to calculate the basic and diluted earnings per share were adjusted to reflect the additional shares of common stock issued to fund a portion of the acquisition price. The pro forma information below does not purport to present the actual results that would have resulted if the acquisition had in fact occurred at
F-16F-17
Table of Contents
CONSOLIDATED COMMUNICATIONS HOLDINGS, INC. AND SUBSIDIARIES
NOTES TO CONSOLIDATED FINANCIAL STATEMENTS (continued)
YEARS ENDED DECEMBER 31, 2012, 20112014, 2013 AND 20102012
| | Year Ended December 31, | |
(Unaudited; in thousands, except per share amounts) | | 2014 | | 2013 | |
Operating revenues | | $ | 790,745 | | $ | 790,777 | |
Income from operations | | $ | 104,674 | | $ | 103,178 | |
Net income from continuing operations | | $ | 18,648 | | $ | 24,288 | |
Less: net income attributable to noncontrolling interest | | 321 | | 330 | |
Net income attributable to common stockholders | | $ | 18,327 | | $ | 23,958 | |
Net income per common share - basic and diluted | | $ | 0.37 | | $ | 0.48 | |
Transaction costs related to the acquisition of Enventis were $11.5 million during the year ended December 31, 2014, which are included in acquisition and other transaction costs in the consolidated statements of income. These costs are considered to be non-recurring in nature and therefore have been excluded from the pro forma results of operations.
The pro forma information does not purport to present the actual results that would have resulted if the acquisition had in fact occurred at the beginning of the fiscal periods presented, nor does the information project results for any future period. The pro forma information does not include the impact of any future cost savings or synergies that may be achieved as a result of the acquisition.
| | Year Ended December 31, |
(Unaudited; in thousands, except share amounts) | | 2012 | | 2011 | |
| | | | | |
Operating revenues | | $ | 631,359 | | $ | 623,590 | |
Income from operations | | $ | 71,862 | | $ | 70,411 | |
Net income | | $ | 10,465 | | $ | 9,969 | |
Less: income attributable to noncontrolling interest | | 531 | | 572 | |
Net income attributable to common stockholders | | $ | 9,934 | | $ | 9,397 | |
| | | | | |
Basic and diluted earnings per common share: | | | | | |
Net income | | $ | 0.29 | | $ | 0.24 | |
Merger With SureWest Communications
On July 2, 2012, we completed the merger with SureWest, which resulted in the acquisition of 100% of all the outstanding shares of SureWest for $23.00 per share in a cash and stock transaction. The total purchase price of $550.8 million consisted of cash and assumed debt of $402.4 million and 9,965,983 shares of the Company’s common stock valued at the Company’s opening stock price on July 2, 2012 of $14.89, which totaled $148.4 million. We acquired SureWest to provide additional diversification of our revenues and cash flows.
Subsequent to the merger, the financial results of SureWest operations have been included in our consolidated statements of income. SureWest contributed $133.1 million in net revenues and recorded net income of $2.5 million for the period of July 2, 2012 through December 31, 2012, which included $9.5 million in acquisition related costs.
Discontinued Operations
In September 2013, we completed the sale of the assets and contractual rights of our prison services business for a total cash purchase price of $2.5 million, which included the settlement of any pending legal matters. The financial results of the operations for prison services have been reported as a discontinued operation in our consolidated financial statements for the years ended on or before December 31, 2013.
The following table summarizes the financial information for the prison services operations for the years ended December 31, 2013 and 2012:
F-18
Table of Contents
CONSOLIDATED COMMUNICATIONS HOLDINGS, INC. AND SUBSIDIARIES
NOTES TO CONSOLIDATED FINANCIAL STATEMENTS (continued)
YEARS ENDED DECEMBER 31, 2014, 2013 AND 2012
(In thousands) | | 2013 | | 2012 | |
Operating revenues | | $ | 5,622 | | $ | 25,580 | |
Operating expenses including depreciation and amortization | | 5,883 | | 23,599 | |
Income (loss) from operations | | (261) | | 1,981 | |
Income tax expense (benefit) | | (105) | | 775 | |
Income (loss) from discontinued operations | | $ | (156) | | $ | 1,206 | |
| | | | | |
Gain on sale of discontinued operations, net of tax of $887 | | $ | 1,333 | | $ | - | |
4. INVESTMENTS
Our investments are as follows:
(In thousands) | | 2012 | | 2011 | | | 2014 | | 2013 | |
Cash surrender value of life insurance policies | | $ | 2,045 | | $ | 1,978 | | | $ | 2,039 | | $ | 2,183 | |
Cost method investments: | | | | | | | | | | |
GTE Mobilnet of South Texas Limited Partnership (2.34% interest) | | 21,450 | | 21,450 | | | 21,450 | | 21,450 | |
Pittsburgh SMSA Limited Partnership (3.60% interest) | | 22,950 | | 22,950 | | | 22,950 | | 22,950 | |
CoBank, ACB Stock | | 5,023 | | 3,394 | | | 7,645 | | 5,112 | |
Other | | 430 | | 15 | | | 200 | | 200 | |
Equity method investments: | | | | | | | | | | |
GTE Mobilnet of Texas RSA #17 Limited Partnership (20.51% interest) | | 25,695 | | 19,422 | | | 27,990 | | 27,467 | |
Pennsylvania RSA 6(I) Limited Partnership (16.6725% interest) | | 7,286 | | 7,063 | | |
Pennsylvania RSA 6(I) Limited Partnership (16.67% interest) | | | 7,451 | | 7,696 | |
Pennsylvania RSA 6(II) Limited Partnership (23.67% interest) | | 23,338 | | 21,797 | | | 23,894 | | 24,105 | |
CVIN, LLC (13.61% interest) | | 1,533 | | – | | |
CVIN, LLC (12.09% interest) | | | 1,757 | | 1,936 | |
Totals | | $ | 109,750 | | $ | 98,069 | | | $ | 115,376 | | $ | 113,099 | |
|
Cost Method
We own 2.34% of GTE Mobilnet of South Texas Limited Partnership (the “Mobilnet South Partnership”). The principal activity of the Mobilnet South Partnership is providing cellular service in the Houston, Galveston, and Beaumont, Texas metropolitan areas. We also own 3.60% of Pittsburgh SMSA Limited Partnership (“Pittsburgh SMSA”), which provides cellular service in and around the Pittsburgh metropolitan area. Because of our limited influence over these partnerships, we use the cost method to account for both of these investments. It is not practicable to estimate fair value of these investments. We did not evaluate any of the investments for impairment as no factors indicating impairment existed during the year. In 2012, 20112014, 2013 and 2010,2012, we received cash distributions from these partnerships totaling $14.1$14.8 million, $11.1$16.9 million and $11.7$14.1 million, respectively.
CoBank, ACB (“CoBank”) is a cooperative bank owned by its customers. Annually, CoBank distributes patronage in the form of cash and stock in the cooperative based on the Company’s outstanding loan balance with CoBank, which has traditionally been a significant lender in the Company’s credit facility. The investment in CoBank represents the accumulation of the equity patronage paid by CoBank to the Company.
Equity Method
We own 20.51% of GTE Mobilnet of Texas RSA #17 Limited Partnership (“RSA #17”), 16.6725%16.67% of Pennsylvania RSA 6(I) Limited Partnership (“RSA 6(I)”) and 23.67% of Pennsylvania RSA 6(II) Limited Partnership (“RSA 6(II)”). RSA #17 provides cellular service to a limited rural area in Texas. In December 2012, we purchased additional ownership interest in RSA #17 for $6.7 million which increased our ownership from 17.02% to 20.51%. RSA 6(I) and RSA 6(II) provide cellular service in and around our Pennsylvania service territory. Because we have significant influence over the operating and financial policies of these three entities, we account for the investments using the equity method. In 2012, 20112014, 2013 and 2010,2012, we received cash distributions from these partnerships totaling $15.0$19.8 million, $17.2$17.9 million and $15.6$15.0 million, respectively. The carrying value of the investments exceeds the underlying equity in net assets of the partnerships by $32.8 million.
F-17F-19
Table of Contents
CONSOLIDATED COMMUNICATIONS HOLDINGS, INC. AND SUBSIDIARIES
NOTES TO CONSOLIDATED FINANCIAL STATEMENTS (continued)
YEARS ENDED DECEMBER 31, 2012, 20112014, 2013 AND 20102012
underlying equity in net assets of the partnerships by $33.0 million. In 2011, we disposed of our 50% ownership interest in Boulevard Communications, LLP, a competitive access provider in western Pennsylvania and recognized a loss of $22 thousand.
We have a 13.61%12.09% interest in Central Valley Independent Network, LLC (“CVIN”), a joint enterprise comprised of affiliates of several independent telephone companies located in central and northern California. CVIN provides network services and oversees a broadband infrastructure project designed to expand and improve the availability of network services to counties in central California. In 2014 and 2013, we made additional capital investments of $0.1 million and $0.4 million in this partnership, respectively. We did not receive any distributions from this partnership in 2014, 2013 or 2012.
The combined unaudited results of operations and financial position of our three equity investments in the cellular limited partnerships are summarized below:
(In thousands) | | 2012 | | 2011 | | 2010 | | | 2014 | | 2013 | | 2012 | |
Total revenues | | $ | 299,389 | | $ | 305,965 | | $ | 258,249 | | | $ | 338,575 | | $ | 321,555 | | $ | 299,389 | |
Income from operations | | 83,577 | | 84,803 | | 77,830 | | | 96,606 | | 98,962 | | 83,577 | |
Net income before taxes | | 83,633 | | 84,844 | | 79,473 | | | 96,763 | | 99,024 | | 83,633 | |
Net income | | 83,283 | | 84,483 | | 78,973 | | | 96,763 | | 99,024 | | 83,283 | |
| | | | | | | | | | | | | | |
Current assets | | $ | 49,982 | | $ | 44,739 | | $ | 48,802 | | | $ | 52,866 | | $ | 54,837 | | $ | 49,982 | |
Non-current assets | | 79,529 | | 79,432 | | 78,262 | | | 93,771 | | 87,968 | | 79,529 | |
Current liabilities | | 15,417 | | 14,523 | | 12,916 | | | 16,253 | | 15,221 | | 15,417 | |
Non-current liabilities | | 1,351 | | 1,096 | | 874 | | | 3,225 | | 1,786 | | 1,351 | |
Partnership equity | | 112,734 | | 108,552 | | 113,293 | | | 127,159 | | 125,799 | | 112,734 | |
5. FAIR VALUE MEASUREMENTS
Financial Instruments
The Company’sOur derivative instruments related to interest rate swap agreements are required to be measured at fair value on a recurring basis. The fair values of the interest rate swaps are determined using an internal valuation model which relies onmodels and are categorized within Level 2 of the expected London Interbank Offered Rate (“LIBOR”) based yield curve and estimates of counterparty and Consolidated’s non-performance riskfair value hierarchy as the most significant inputs. Because each of thesevaluation inputs are directly observable or can be corroborated bybased on quoted prices and observable market data we have categorized these interest rate swaps as Level 2 within the fair value hierarchy.of similar instruments. See Note 7 for further discussion regarding our interest rate swap agreements.
Our interest rate swap liabilities measured at fair value on a recurring basis and subject to disclosure requirements at December 31, 20122014 and 20112013 were as follows:
| | | | | As of December 31, 2012 | |
| | | | | | | | | | | | | | | As of December 31, 2014 | |
| | | | Quoted Prices
In Active
Markets for
Identical Assets | | Significant
Other
Observable
Inputs | | Significant
Unobservable
Inputs | | | | Quoted Prices
In Active
Markets for
Identical Assets | | Significant
Other
Observable
Inputs | | Significant
Unobservable
Inputs | |
(In thousands) | | Total | | (Level 1) | | (Level 2) | | (Level 3) | | Total | | (Level 1) | | (Level 2) | | (Level 3) | |
Current interest rate swap liabilities | | $ | (3,164 | ) | | – | | $ | (3,164 | ) | | – | | | $ | (443) | | – | | $ | (443) | | – | |
Long-term interest rate swap liabilities | | (3,919 | ) | | – | | (3,919 | ) | | – | | | (690) | | – | | (690) | | – | |
Totals | | $ | (7,083 | ) | | $ | – | | $ | (7,083 | ) | | $ | – | | |
Total | | | $ | (1,133) | | $ | – | | $ | (1,133) | | $ | – | |
|
| | | | As of December 31, 2013 | |
| | | | Quoted Prices
In Active
Markets for
Identical Assets | | Significant
Other
Observable
Inputs | | Significant
Unobservable
Inputs | |
(In thousands) | | Total | | (Level 1) | | (Level 2) | | (Level 3) | |
Current interest rate swap liabilities | | $ | (660) | | – | | $ | (660) | | – | |
Long-term interest rate swap liabilities | | (1,959) | | – | | (1,959) | | – | |
Total | | $ | (2,619) | | $ | – | | $ | (2,619) | | $ | – | |
| | | | | | | | | | | | | |
F-18F-20
Table of Contents
CONSOLIDATED COMMUNICATIONS HOLDINGS, INC. AND SUBSIDIARIES
NOTES TO CONSOLIDATED FINANCIAL STATEMENTS (continued)
YEARS ENDED DECEMBER 31, 2012, 20112014, 2013 AND 20102012
| | | | | As of December 31, 2011 |
| | | | | | | | | |
| | | | | Quoted Prices
In Active
Markets for
Identical Assets | | Significant
Other
Observable
Inputs | | Significant
Unobservable
Inputs |
(In thousands) | | Total | | (Level 1) | | (Level 2) | | (Level 3) |
Current interest rate swap liabilities | | $ | (3,580 | ) | | – | | $ | (3,580 | ) | | – | |
Long-term interest rate swap liabilities | | (12,401 | ) | | – | | (12,401 | ) | | – | |
Totals | | $ | (15,981 | ) | | $ | – | | $ | (15,981 | ) | | $ | – | |
| | | | | | | | | | | | | | | |
The change in the fair value of the derivatives is primarily a result of a change in market expectations for future interest rates.
We have not elected the fair value option for any of our financial assets or liabilities. The carrying value of other financial instruments, including cash, accounts receivable, accounts payable and accrued liabilities approximate fair value due to their short maturities or variable-rate nature of the respective balances. The following table presents the other financial instruments that are not carried at fair value but which require fair value disclosure as of December 31, 20122014 and 2011.2013.
| | As of December 31, 2012 | | As of December 31, 2011 | | | As of December 31, 2014 | | As of December 31, 2013 | |
(In thousands) | | Carrying Value | | Fair Value | | Carrying Value | | Fair Value | | | Carrying Value | | Fair Value | | Carrying Value | | Fair Value | |
Investments, equity basis | | $ | 57,852 | | n/a | | $ | 48,282 | | n/a | | | $ | 61,092 | | n/a | | $ | 61,204 | | n/a | |
Investments, at cost | | $ | 49,853 | | n/a | | $ | 47,809 | | n/a | | | $ | 52,245 | | n/a | | $ | 49,712 | | n/a | |
Long-term debt | | $ | 1,213,000 | | $ | 1,231,355 | | $ | 880,000 | | $ | 880,000 | | |
Long-term debt, excluding capital leases | | | $ | 1,362,049 | | $ | 1,381,972 | | $ | 1,216,764 | | $ | 1,261,508 | |
|
Cost & Equity Method Investments
The Company’sOur investments at December 31, 20122014 and 20112013 accounted for under both the equity and cost methods consists primarily of minority positions in various cellular telephone limited partnerships and our investment in CoBank. These investments are recorded using either the equity or cost methods. It is impracticable to determine fair value of these investments.
Long-term Debt
The fair value of our long-term debt was estimated using a discounted cash flow analyses based on incremental borrowing rates for similar types of borrowing arrangements. We have categorized the long-term debt as Level 2 within the fair value hierarchy.
6. LONG-TERM DEBT
Long-term debt outstanding, presented net of unamortized discounts, consisted of the following:following as of December 31, 2014 and 2013:
(In thousands) | | 2012 | | | 2011 | | | 2014 | | 2013 | |
Senior secured credit facility: | | | | | | | | | | | |
Term loan 1 | | $ | - | | | $ | 470,948 | | |
Term loan 2 | | 404,961 | | | 409,052 | | |
Term loan 3, net of discount of $5,088 | | 509,912 | | | – | | |
Senior notes, net of discount of $1,873 | | 298,127 | | | – | | |
Term loan 4, net of discount of $3,948 and $4,537 at | | | $ | 896,952 | | $ | 905,463 | |
December 31, 2014 and 2013, respectively | | | | | | |
Revolving loan | | | 39,000 | | 13,000 | |
10.875% Senior notes due 2020, net of discount of $1,121 and $1,699 at December 31, 2014 and 2013, respectively | | | 226,097 | | 298,301 | |
6.50% Senior notes due 2022 | | | 200,000 | | - | |
Capital leases | | 4,844 | | | 4,711 | | | 4,553 | | 5,121 | |
| | 1,217,844 | | | 884,711 | | | 1,366,602 | | 1,221,885 | |
Less: current portion of long-term debt and capital leases | | (9,596) | | | (8,992) | | | (9,849) | | (9,751) | |
Total long-term debt | | $ | 1,208,248 | | | $ | 875,719 | | | $ | 1,356,753 | | $ | 1,212,134 | |
Credit Agreement
TheIn December 2013, the Company, through certain of its wholly owned subsidiaries, has an outstanding credit agreemententered into a Second Amended and Restated Credit Agreement with severalvarious financial institutions which(the “Credit Agreement”) to replace the Company’s previously amended credit agreement. The Credit Agreement consists of a $50.0$75.0 million revolving credit facility and initial term loans in the aggregate amount of $910.0 million (“Term 4”). The proceeds from the Credit Agreement were used to repay the outstanding term loans of $914.9 million at December 31, 2012.from the previous agreement in its entirety. The credit facilityCredit Agreement also includes an incremental term loan facility which provides the ability to request to borrow up to $300.0 million of incremental term loans subject to certain terms and conditions. Borrowings under the senior secured credit facility are secured by substantially all of the assets of the Company and its subsidiaries, with the exception of Illinois Consolidated Telephone Company and our majority-owned subsidiary, East Texas Fiber Line Incorporated.
The Term 4 loan was issued in an original aggregate principal amount of $910.0 million with a maturity date of December 23, 2020, but is subject to earlier maturity on December 31, 2019 if the Company’s unsecured Senior
F-19F-21
Table of Contents
CONSOLIDATED COMMUNICATIONS HOLDINGS, INC. AND SUBSIDIARIES
NOTES TO CONSOLIDATED FINANCIAL STATEMENTS (continued)
YEARS ENDED DECEMBER 31, 2012, 20112014, 2013 AND 20102012
ability to borrow up to $300.0 million of incremental term loans. As ofNotes due in 2020 are not repaid or redeemed in full by December 31, 2012 and 2011, no amounts were outstanding under the revolving credit facility. Borrowings under the senior secured credit facility are secured by substantially all of the assets of the Company, with the exception of Illinois Consolidated Telephone Company and our majority-owned subsidiary, East Texas Fiber Line Incorporated.
Our term loans under the credit facility, as amended, were issued in three separate tranches, resulting in different maturity dates and interest rate margins for each term loan. Prior to being refinanced in December 2012, the first term loan (“Term 1”) consisted of an original aggregate principal amount of $470.9 million maturing on December 31, 2014 and had an applicable margin (at our election) equal to either 2.50% for a LIBOR-based term loan or 1.50% for an alternative base rate loan.2019. The Term 1 loan required quarterly principal payments of $1.2 million which began on March 31, 2012. The second term loan (“Term 2”) consists of an original aggregate principal amount $409.1 million, matures on December 31, 2017 and currently has an applicable margin (at our election) equal to either 4.00% for a LIBOR-based term loan or 3.00% for an alternative base rate term loan. The Term 2 loan also requires $1.0 million in quarterly principal payments which began on March 31, 2012.
In December 2012, we entered into a Second Amendment and Incremental Facility Agreement (the “Second Amendment”) to amend our credit agreement. Under the terms of the Second Amendment, we issued incremental term loans (“Term 3”) in the aggregate amount of $515.0 million, with a maturity date of December 31, 2018, and used the proceeds in part to repay the outstanding Term 1 loan debt of $467.4 that was due to mature December 31, 2014 and to repay the outstanding revolving loan in the amount of $35.0 million. The Term 3 loan requires quarterly principal payments of $1.3 million commencing March 31, 2013 and has an applicable margin (at our election) equal to either 4.00% for a LIBOR-based term loan or 3.00% for an alternative base rate term loan subject to a 1.25% LIBOR floor. The Term 34 loan contains an original issuance discount of $5.2$4.6 million, which will beis being amortized over the term of the loan. In connection with entering intoThe Term 4 loan requires quarterly principal payments of $2.3 million, which commenced March 31, 2014, and has an interest rate of the Second Amendment, fees of $4.2 million were capitalized as deferred debt issuance costs. We also incurredLondon Interbank Offered Rate (“LIBOR”) plus 3.25% subject to a loss on the extinguishment of debt of $4.5 million related to the repayment of our outstanding Term 1 loan during the year ended December 31, 2012.1.00% LIBOR floor.
Our revolving credit facility has a maturity date of June 8, 2016December 23, 2018 and an applicable margin (at our election) of between 2.75%2.50% and 3.50%3.25% for LIBOR-based borrowings or between 1.50% and between 1.75% and 2.50%2.25% for alternativealternate base rate borrowings, depending on our leverage ratio. Based on our leverage ratio at December 31, 2012,2014, the borrowing margin for the next three month period ending March 31, 20132015 will be at a weighted-average margin of 3.25%3.00% for a LIBOR-based loan or 2.25%2.00% for an alternativealternate base rate loan. The applicable borrowing margin for the revolving credit facility is adjusted quarterly to reflect the leverage ratio from the prior quarter-end. During the year endedAs of December 31, 2012, we borrowed $35.02014 and 2013, borrowings of $39.0 million ofand $13.0 million, respectively, were outstanding under the revolving credit facilityfacility. A stand-by letter of credit of $0.9 million, issued in connection with the acquisition of SureWest as described in Note 3. As described above, the outstanding balance of the revolving credit facilityCompany’s insurance coverage, was repaid with the proceeds from the issuance of the incremental Term 3 loan in December 2012. There were no borrowings or letters of credit outstanding under theour revolving credit facility as of December 31, 20122014. The stand-by letter of credit is renewable annually and 2011.reduces the borrowing availability under the revolving credit facility.
The weighted-average interest rate on outstanding borrowings under our credit agreementfacility was 4.79%4.20% and 3.38%4.23% at December 31, 20122014 and 2011,2013, respectively. Interest is payable at least quarterly.
Net proceeds from asset sales exceeding certain thresholds, to the extent not reinvested, are required to be used to repay loans outstanding under the credit agreement.
Financing Costs
In connection with entering into the restated credit agreement in December 2013, fees of $6.6 million were capitalized as deferred debt issuance costs. These capitalized costs are amortized over the term of the debt and are included as a component of interest expense in the consolidated statements of income. We also incurred a loss on the extinguishment of debt of $7.7 million during the year ended December 31, 2013 related to the repayment of outstanding term loans under the previous credit agreement which were scheduled to mature in December 2017 and 2018.
The credit agreement was previously amended in December 2012, to issue incremental term loans (Term 3) which were used to repay outstanding term loans scheduled to mature in December 2014 and to extend the maturity dates of outstanding term loans and the revolving loan facility. In connection with entering into the December 2012 amendment, we recognized a loss on the extinguishment of debt of $4.5 million during the year ended December 31, 2012.
Credit Agreement Covenant Compliance
The credit agreement contains various provisions and covenants, including, among other items, restrictions on the ability to pay dividends, incur additional indebtedness, and issue capital stock. We have agreed to maintain certain financial ratios, including interest coverage and total net leverage ratios, all as defined in the credit agreement. As of December 31, 2012,2014, we were in compliance with the credit agreement covenants.
Effective February 17, 2012, we amended our credit facility to provide us with the ability to incur indebtedness necessary to finance the acquisition of SureWest, which enabled us to issue the Senior Notes described below. In connection with the amendment, fees of $3.5 million were recognized as financing and other transaction costs during the quarter ended March 31, 2012.
In general, our credit agreement restricts our ability to pay dividends to the amount of our available cash (asAvailable Cash as defined in our credit agreement) accumulated after October 1, 2005, plus $23.7 million and minus the aggregate amountagreement. As of
F-20
CONSOLIDATED COMMUNICATIONS HOLDINGS, INC. AND SUBSIDIARIES
NOTES TO CONSOLIDATED FINANCIAL STATEMENTS (continued)
YEARS ENDED DECEMBER 31, 2012, 2011 AND 2010
dividends paid after July 27, 2005. Based on the results of operations from October 1, 2005 through December 31, 2012, and after taking into consideration dividend payments (including the $15.4 million dividend declared in November 2012 and paid on February 1, 2013),2014, we continue to have $192.8had $211.8 million in dividend availability under the credit facility covenant.
Under our credit agreement, if our total net leverage ratio (as defined in the credit agreement), as of the end of any fiscal quarter, is greater than 5.10:1.00, we will be required to suspend dividends on our common stock unless otherwise permitted by an exception for dividends that may be paid from the portion of proceeds of any sale of equity not used to fund acquisitions, or make other investments. During any dividend suspension period, we will be required to repay debt in an amount equal to 50.0% of any increase in Available Cash, among other things. In addition, we will not be permitted to pay dividends if an event of default under the credit agreement has occurred and is continuing. Among other things, it will be an event of default if our total net leverage ratio and interest coverage ratio as of the end of any fiscal quarter is belowgreater than 5.25:1.00 and less than 2.25:1.00.1.00, respectively. As of December 31, 2012,2014, our total net leverage ratio under the credit agreement was 4.34:4.08:1.00, and our interest coverage ratio was 3.77:4.07:1.00.
F-22
Table of Contents
CONSOLIDATED COMMUNICATIONS HOLDINGS, INC. AND SUBSIDIARIES
NOTES TO CONSOLIDATED FINANCIAL STATEMENTS (continued)
YEARS ENDED DECEMBER 31, 2014, 2013 AND 2012
Senior Notes
6.50% Senior Notes due 2022
On September 18, 2014, Consolidated Communications Finance II Co., a wholly–owned subsidiary of the Company completed an offering of $200.0 million aggregate principal amount of 6.50% Senior Notes due in October 2022 (the “2022 Notes”). Interest on the 2022 Notes is payable semi-annually on April 1 and October 1, commencing on April 1, 2015. The 2022 Notes were priced at par, which resulted in total gross proceeds of $200.0 million. Deferred debt issuance costs of $3.5 million incurred in connection with the issuance of the 2022 Notes are amortized using the effective interest method over the term of the 2022 Notes.
Upon closing of the Enventis acquisition, the obligations under the 2022 Notes were assumed by Consolidated Communications, Inc. (“CCI”) and were guaranteed by the Company and certain of its wholly-owned subsidiaries. The net proceeds from the issuance of the 2022 Notes were used to finance the acquisition of Enventis including related fees and expenses, to repay the existing indebtedness of Enventis and to repurchase a portion of our 10.875% Senior Notes due 2020, as described below.
10.875% Senior Notes due 2020
On May 30, 2012, we completed an offering of $300.0 million aggregate principal amount of 10.875% unsecured Senior Notes, due 2020 through our wholly-owned subsidiary, Consolidated Communications Finance Co. (“Finance Co.”(the “2020 Notes”) for the acquisition of SureWest.. The Senior2020 Notes will mature on June 1, 2020 and earn interest at a rate of 10.875% per year, payable semi-annually in arrears on June 1 and December 1 of each year, commencing on December 1, 2012. The Senior Notes were sold in the United States to qualified institutional buyers pursuant to Rule 144A under the Securities Act of 1933 (the “Securities Act”) and outside the Unites States in compliance with Regulation S under the Securities Act. In addition, some of the Senior Notes were sold to certain “accredited investors” (as defined in Rule 501 under the Securities Act). The Senior2020 Notes were sold to investors at a price equal to 99.345% of the principal amount thereof, for a yield to maturity of 11.00%. This discount will beis being amortized over the term of the Senior2020 Notes. The proceeds ofCCI is the sale ofprimary obligor under the Senior Notes were held in an escrow account prior to the closing of the SureWest transaction. Upon closing of the SureWest acquisition on July 2, 2012, Finance Co. merged with and into our wholly-owned subsidiary Consolidated Communications, Inc., which assumed the Senior2020 Notes, and we and certain of our subsidiaries have fully and unconditionally guaranteed the Senior2020 Notes.
In 2013, we completed an exchange offer to issue registered notes (“Exchange Notes”) for $287.3 million of the original 2020 Notes. The terms of the Exchange Notes are substantially identical to the 2020 Notes, except that the Exchange Notes are registered under the Securities Act of 1933 and the transfer restrictions and registration rights applicable to the 2020 Notes do not apply to the Exchange Notes. The exchange offer did not impact the aggregate principal amount or the remaining terms of the 2020 Notes outstanding.
On August 3, 2012, SureWestOctober 16, 2014, we redeemed $46.8 million of the original aggregate principal amount of the 2020 Notes at a price of 116.75%, plus accrued and its subsidiaries guaranteedunpaid interest. On December 19, 2014, we redeemed an additional $26.0 million of the Senior Notes. Deferred debt issuance costs2020 Notes at a price of $7.8 million incurred in113.50%, plus accrued and unpaid interest. In connection with the issuancerepurchases of the 2020 Notes, we paid $84.1 million and recognized a loss of $13.8 million on the partial extinguishment of debt during the year ended December 31, 2014.
Senior Notes will be amortized using the effective interest method over the term of the Senior Notes through June 2020. Covenant Compliance
The indenture governing the Senior2020 Notes contains customary covenants for high yield notes, which limits Consolidated Communications, Inc.’sCCI’s and its restricted subsidiaries’ ability to:
·incur debt or issue certain preferred stock;
·pay dividends or make other distributions on capital stock or prepay subordinated indebtedness;
·purchase or redeem any equity interests;
·make investments;
·create liens;
·sell assets;
·enter into agreements that restrict dividends or other payments by restricted subsidiaries;
·consolidate, mergermerge or transfer all or substantially all of its assets;
·engage in transactions with its affiliates; or
·enter into any sale and leaseback transactions.
Among other matters, the 2020 Notes indenture provides that CCI may not pay dividends or make other “restricted payments” to the Company if its total net leverage ratio is 4.50:1.00 or greater. This ratio is calculated differently than the comparable ratio under the Credit Agreement; among other differences, it takes into account, on a pro forma basis, synergies expected to be achieved as a result of certain acquisitions but not yet reflected in historical results. At December 31, 2014, this ratio was 4.01:1.00. If this ratio is met, dividends and other restricted payments may be made from cumulative consolidated cash flow since the date the 2020 Notes were issued, less 1.75 times fixed charges, less dividends and other restricted payments made since the date the 2020 Notes were issued. Dividends may be paid and other restricted payments may also be made from a “basket” of $50.0 million, none of which has been used to date, and pursuant to other exceptions identified in the indenture. Since dividends of $174.8 million have been paid since May 30, 2012, including the quarterly dividend declared in October 2014 and paid on February 2, 2015, there was $241.4 million of the $416.2 million of cumulative consolidated cash flow since May 30, 2012 available to pay dividends at December 31, 2014.
F-23
Table of Contents
CONSOLIDATED COMMUNICATIONS HOLDINGS, INC. AND SUBSIDIARIES
NOTES TO CONSOLIDATED FINANCIAL STATEMENTS (continued)
YEARS ENDED DECEMBER 31, 2014, 2013 AND 2012
On March 19, 2014, CCI commenced a solicitation of consents from the eligible holders of the 2020 Notes in order to amend the indenture governing the 2020 Notes to (i) modify CCI’s Consolidated Leverage Ratio (as defined in the indenture governing the 2020 Notes) level required before CCI (subject to certain other conditions specified in the indenture) can make Restricted Payments (as defined in the indenture) otherwise available under the consolidated cash flow builder basket from 4.25:1.00 to 4.50:1.00 and (ii) modify the size of a permitted lien basket for liens securing Indebtedness (as defined in the indenture) by amending the multiplier for CCI’s Consolidated Cash Flow (as defined in the indenture) in the calculation of such permitted lien basket from 2.50 to 2.75. On April 1, 2014, the required consent of the holders of the 2020 Notes was obtained and the consent solicitation expired, and we entered into a supplemental indenture effecting the proposed amendments as provided in the consent solicitation. The amendment to the indenture with respect to modifying the size of a permitted lien basket for liens securing Indebtedness modified such provision in the indenture so that it would be the same as the equivalent provision in our Credit Agreement. In connection with entering into the supplemental indenture, consent fees of $2.5 million paid to the holders of the 2020 Notes who validly consented to the proposed amendment were capitalized during 2014 as deferred debt issuance costs and amortized over the remaining term of the 2020 Notes.
The indenture governing the 2022 Notes contains substantially the same covenants as the indenture governing the 2020 notes, except that the indenture governing the 2022 Notes provides that CCI may not pay dividends or make other “restricted payments” to the Company if its total net leverage ratio is 4.75:1.00 or greater.
Bridge Loan Facility
In connection with the acquisition of SureWest, on February 5, 2012Enventis, the Company received committed financing forentered into a total of $350.0$140.0 million senior unsecured bridge loan facility (“Bridge Facility”) on June 29, 2014 in order to fund the cash portion ofanticipated acquisition including the anticipated transaction, to refinance SureWest’s debtrelated fees and expenses and to pay for certain transaction costs. The financing package included a $350.0 million Senior Unsecured Bridge Loan Facility (“Bridge Facility”).repay the existing indebtedness of Enventis. As anticipated, permanent financing for the SureWestEnventis acquisition was funded by our Seniorcompleted through the 2022 Note offering, as described above. As a result, the $4.2 million commitment fee incurred forabove, replacing the Bridge Facility was on the closing date of the acquisition. No amounts were drawn or funded under the Bridge Facility prior to replacement. In connection with entering into the Bridge Facility, commitment fees of $1.4 million were capitalized during the quarter ended June 30, 2014 as deferred debt issuance costs and was amortized over the expected life of the Bridge Facility through October 2014.
In 2012, we entered into a temporary $350.0 million senior unsecured bridge loan facility in connection with the acquisition of SureWest. As a result, we incurred commitment fees of $4.2 million which waswere amortized during the year ended December 31, 2012 over the four months.month life of the bridge loan facility.
Future Maturities of Debt
At December 31, 2012,2014, the aggregate maturities of our long-term debt excluding capital leases were as follows:
(In thousands) | | | | | | |
2013 | | $ | 9,240 | | |
2014 | | 9,240 | | |
2015 | | 9,240 | | | $ | 9,100 | |
2016 | | 9,240 | | | 9,100 | |
2017 | | 393,751 | | | 9,100 | |
2018 | | | 48,100 | |
2019 | | | 9,100 | |
Thereafter | | 789,250 | | | 1,282,618 | |
Total maturities | | 1,219,961 | | | 1,367,118 | |
Less: Unamortized discount | | (6,961) | | | (5,069) | |
| | $ | 1,213,000 | | | $ | 1,362,049 | |
As of December 31, 2012, we had five capital leases with maturities ranging from 2015 to 2021. See Note 11 regarding the future maturities of our obligations for capital leases.
F-21F-24
Table of Contents
CONSOLIDATED COMMUNICATIONS HOLDINGS, INC. AND SUBSIDIARIES
NOTES TO CONSOLIDATED FINANCIAL STATEMENTS (continued)
YEARS ENDED DECEMBER 31, 2012, 20112014, 2013 AND 20102012
7. DERIVATIVE FINANCIAL INSTRUMENTS
We may utilize interest rate swap agreements to mitigate risk associated with fluctuations in interest rates related to our variable rate debt. Derivative financial instruments are recorded at fair value in our consolidated balance sheet.
The following interest rate swaps were outstanding at December 31, 2012:2014:
(In thousands) | | Notional
Amount | | 2012 Balance Sheet Location | | Fair Value | | Notional Amount | | 2014 Balance Sheet Location | | Fair Value | |
| | | | | | | | | | | | | | |
Cash Flow Hedges: | | | | | | | | | | | | | | |
Fixed to 1-month floating LIBOR (with floor) | | | $ | 100,000 | | Other long-term liabilities | | $ | (133) | |
| | | | | | | | |
De-designated Hedges: | | | | | | | | |
Fixed to 1-month floating LIBOR | | $ | 200,000 | | Other long-term liabilities | | $ | (2,758 | ) | | $ | 125,000 | | Other long-term liabilities | | (410) | |
Fixed to 1-month floating LIBOR | | 100,000 | | Current portion of derivative liability | | (1,069 | ) | | 50,000 | | Current portion of derivative liability | | (443) | |
Forward starting fixed to | | | | | | | | |
1-month floating LIBOR | | 75,000 | | Other long-term liabilities | | (1,161 | ) | |
| | | | | | | | |
De-designated Hedges: | | | | | | | | |
Fixed to 3-month floating LIBOR | | 130,000 | | Current portion of derivative liability | | (1,300 | ) | |
3-month floating LIBOR minus spread to 1-month floating LIBOR | | 130,000 | | Current portion of derivative liability | | (16 | ) | |
Fixed to 1-month floating LIBOR | | 200,000 | | Current portion of derivative liability | | (779 | ) | |
Fixed to 1-month floating LIBOR (with floor) | | | 50,000 | | Other long-term liabilities | | (147) | |
Total Fair Values | | | | | | $ | (7,083 | ) | | | | | | $ | (1,133) | |
|
The following interest rate swaps all designated as cash flow hedges, were outstanding at December 31, 2011:2013:
(In thousands) | | Notional
Amount | | 2011 Balance Sheet Location | | Fair Value |
| | | | | | | | |
Cash Flow Hedges: | | | | | | | | |
Fixed to 3-month floating LIBOR | | $ | 100,000 | | Current portion of derivative liability | | $ | (3,401 | ) |
Fixed to 3-month floating LIBOR | | 130,000 | | Other long-term liabilities | | | (6,053 | ) |
3-month floating LIBOR minus spread to 1-month floating LIBOR | | 100,000 | | Current portion of derivative liability | | | (179 | ) |
3-month floating LIBOR minus spread to 1-month floating LIBOR | | 130,000 | | Other long-term liabilities | | | (269 | ) |
Fixed to 1-month floating LIBOR | | 300,000 | | Other long-term liabilities | | | (5,343 | ) |
Forward starting fixed to 1- month floating LIBOR | | 200,000 | | Other long-term liabilities | | | (736 | ) |
Total Fair Values | | | | | | $ | (15,981 | ) |
| | | | | | | | | |
(In thousands) | | Notional Amount | | 2013 Balance Sheet Location | | Fair Value | |
| | | | | | | |
De-designated Hedges: | | | | | | | |
Fixed to 1-month floating LIBOR | | $ | 175,000 | | Other long-term liabilities | | $ | (1,897) | |
Fixed to 1-month floating LIBOR | | 100,000 | | Current portion of derivative liability | | (660) | |
Fixed to 1-month floating LIBOR (with floor) | | 50,000 | | Other long-term liabilities | | (62) | |
Total Fair Values | | | | | | $ | (2,619) | |
| | | | | | | | | |
AtAs of December 31, 2012 and 2011,2014, the interest rate on approximately 69% and 60%, respectively, of our outstanding debt under the term loan credit facility was fixed through the use of interest rate swaps.
The counterparties to our various swaps are sixfour major U.S. and European banks. None of the swap agreements provide for either us or the counterparties to post collateral nor do the agreements include any covenants related to the financial condition of Consolidated or the counterparties. The swaps of any counterparty that is a “Lender” as defined in our credit facility are secured along with the other creditors under the credit facility. Each of the swap agreements provides that in the event of a bankruptcy filing by either Consolidated or the counterparty, any amounts owed between the two parties would be offset in order to determine the net amount due between parties. This provision allows us to partially mitigate the risk of non-performance by a counterparty.
At December 31, 2012 and 2011, the pretax deferred losses related to our interest rate swap agreements included in AOCI totaled $7.9 million and $15.9 million, respectively. The change in fair value of any ineffective portion of the hedging derivative is recognized immediately in earnings.
On December 4, 2012, $660,000 million notionalFor interest rate swaps designated as a cash flow hedge, the effective portion of the unrealized gain or loss in fair value is recorded in AOCI and reclassified into earnings when the underlying hedged item impacts earnings. The ineffective portion of the change in fair value of the cash flow hedge is recognized immediately in earnings. For interest rate swaps not designated as a hedge, changes in fair value are recognized in earnings as interest expense.
In 2013 and 2012, interest rate swaps previously designated as cash flow hedges were de-designated in connection with the amendmentas a result of amendments to our credit agreement as described in Note 6.agreement. These interest rate swap agreements mature on various dates through September 2016. Prior to the de-designation, the effective portion of the change in fair value of thesethe interest rate swaps were recognized in AOCI. The balance of the unrealized loss included in AOCI as of the date the swaps were de-designated is being amortized to earnings over the remaining term of the swap agreements. On December 31, 2012, $200,000 million notional interest rate swap agreements expired and the remainder will expire on March 31, 2013. Subsequent to December 4, 2012, changesChanges in fair value of the de-designated swaps are immediately recognized in earnings.earnings as interest expense. During the yearyears ended December 31, 2014, 2013 and 2012, againgains of $1.6 million, $2.2 million and $2.8 million, wasrespectively, were recognized as a reduction to interest expense for the change in fair value of the de-designated swaps.
At December 31, 2014 and 2013, the pre-tax deferred losses related to our interest rate swap agreements included in AOCI were $0.8 million and $2.6 million, respectively. The estimated amount of losses included in AOCI as of December 31, 2014 that will be recognized in earnings in the next twelve months is approximately $1.2 million.
F-22F-25
Table of Contents
CONSOLIDATED COMMUNICATIONS HOLDINGS, INC. AND SUBSIDIARIES
NOTES TO CONSOLIDATED FINANCIAL STATEMENTS (continued)
YEARS ENDED DECEMBER 31, 2012, 20112014, 2013 AND 20102012
Information regarding ourThe following table presents the effect of interest rate derivatives designated as cash flow hedge transactions is as follows:hedges on AOCI and on the consolidated statements of income for the years ended December 31, 2014, 2013 and 2012:
(In thousands) | | 2012 | | | 2011 | | | 2010 | |
(Gain)/loss recognized in AOCI, pretax | | $ | (6,041 | ) | | $ | (10,781 | ) | | $ | 815 | |
Gain arising from ineffectiveness reducing interest expense | | $ | (47 | ) | | $ | (93 | ) | | $ | (146 | ) |
Deferred losses reclassed from AOCI to interest expense | | $ | 1,992 | | | $ | 1,250 | | | $ | 4,742 | |
| | December 31, | |
(In thousands, except months) | | 2012 | | 2011 | |
Aggregate notional value of current derivatives outstanding | | $ | 630,000 | | $ | 530,000 | |
Aggregate notional value of forward derivatives outstanding | | $ | 75,000 | | $ | 200,000 | |
Period through which derivative positions currently exist | | March 2016 | | June 2015 | |
Fair value of derivatives | | $ | 7,083 | | $ | 15,981 | |
Deferred losses included in AOCI (pretax) | | $ | 7,899 | | $ | 15,932 | |
Losses included in AOCI to be recognized in the next 12 months | | $ | 2,912 | | $ | 65 | |
Number of months over which loss in OCI is to be recognized | | 3 | | 15 | |
(In thousands) | | 2014 | | 2013 | | 2012 | |
Loss recognized in AOCI, pretax | | $ | (132) | | $ | (614) | | $ | (5,631) | |
Loss reclassified from AOCI to interest expense | | $ | (2,050) | | $ | (5,875) | | $ | (13,664) | |
Gain arising from ineffectiveness reducing interest expense | | $ | - | | $ | - | | $ | 47 | |
8. EQUITY
Share-Based Compensation
Our Board of Directors may grant share-based awards from our shareholder approved Amended and Restated Consolidated Communications Holdings, Inc. 2005 Long-term Incentive Plan (the “Plan”). The Plan permits the issuance of awards in the form of stock options, stock appreciation rights, stock grants, stock unit grants and other equity-based awards to eligible directors and employees at the discretion of the Compensation Committee of the Board of Directors. Under the Plan, approximately 1,650,000 shares of our common stock are authorized for issuance, provided that no more than 300,000 shares may be granted in the form of stock options or stock appreciation rights to any eligible employee or director in any calendar year. Unless terminated sooner, the Plan will continue in effect until May 5, 2019.
We measure the fair value of time-based RSAs based on the market price of the underlying common stock as of the date of the grant. RSAs are amortized over their respective vesting periods, generally from immediate vest up to a four year vesting period using the straight line method.
We implemented an ongoing performance-based incentive program under the Plan. The performance-based incentive program provides for annual grants of PSAs. PSAs are restricted stock that is issued, to the extent earned, at the end of each performance cycle. Under the performance-based incentive program, each participant is given a target award expressed as a number of shares, with a payout opportunity ranging from 0% to 120% of the target, depending on performance relative to predetermined goals. In accordance with the applicable accounting guidance, an accounting estimate of the number of these shares that are expected to vest is made, and these shares are then expensed utilizing the grant-date fair value of the shares from the grant date through the end of the vesting period.
The following table summarizes the grants of RSAs and PSAs under the Plan during the years ended December 31, 2012, 20112014, 2013 and 2010:2012:
| | | Years Ended December 31, | |
| | Years Ended December 31, | | | | Grant Date | | | | Grant Date | | | | Grant Date | |
| | 2012 | | Grant Date
Fair Value | | 2011 | | Grant Date
Fair Value | | 2010 | | Grant Date
Fair Value | | 2014 | | Fair Value | | 2013 | | Fair Value | | 2012 | | Fair Value | |
RSAs Granted | | 14,732 | | $ | 19.30 | | 127,377 | | $ | 17.92 | | 115,949 | | $ | 18.65 | | | 132,781 | | $ | 19.74 | | 168,516 | | $ | 17.13 | | 14,732 | | $ | 19.30 | |
PSAs Granted | | 68,540 | | $ | 19.30 | | 50,440 | | $ | 17.92 | | 98,002 | | $ | 18.65 | | | 91,127 | | $ | 19.74 | | 66,504 | | $ | 17.13 | | 68,540 | | $ | 19.30 | |
Total | | 83,272 | | | | 177,817 | | | | 213,951 | | | | | 223,908 | | | | 235,020 | | | | 83,272 | | | |
The total fair value of the RSAs and PSAs that vested during the years ended December 31, 2014, 2013 and 2012 2011 and 2010 was $2.4$3.5 million, $1.6$3.0 million and $1.8$2.4 million, respectively.
The following table summarizes the RSA and PSA activity during the year ended December 31, 2014:
| | RSAs | | PSAs | |
| | Shares | | Weighted
Average Grant
Date Fair Value | | Shares | | Weighted
Average Grant
Date Fair Value | |
Non-vested shares outstanding - January 1, 2014 | | 123,501 | | $ | 17.32 | | 64,266 | | $ | 17.96 | |
Shares granted | | 132,781 | | $ | 19.74 | | 91,127 | | $ | 19.74 | |
Shares vested | | (114,717) | | $ | 18.32 | | (72,984) | | $ | 19.08 | |
Non-vested shares outstanding - December 31, 2014 | | 141,565 | | $ | 18.78 | | 82,409 | | $ | 18.94 | |
F-23F-26
Table of Contents
CONSOLIDATED COMMUNICATIONS HOLDINGS, INC. AND SUBSIDIARIES
NOTES TO CONSOLIDATED FINANCIAL STATEMENTS (continued)
YEARS ENDED DECEMBER 31, 2012, 20112014, 2013 AND 20102012
The following table summarizes the RSA and PSA activity during the year ended December 31, 2012:
| | RSAs | | PSAs |
| | Shares | | | Weighted
Average Grant
Date Fair Value | | Shares | | | Weighted
Average Grant
Date Fair Value |
Non-vested shares outstanding - January 1, 2012 | | 129,203 | | | $ | 17.79 | | 50,879 | | | $ | 17.04 | |
Shares granted | | 14,732 | | | 19.30 | | 68,540 | | | 19.30 | |
Shares vested | | (75,762 | ) | | 17.63 | | (61,198 | ) | | 17.85 | |
Shares forfeited, cancelled or retired | | (3,855 | ) | | 15.74 | | – | | | – | |
Non-vested shares outstanding - December 31, 2012 | | 64,318 | | | $ | 18.33 | | 58,221 | | | $ | 18.85 | |
Share-Based Compensation Expense
The following table summarizes total compensation costs recognized for share-based payments during the years ended December 31, 2012, 20112014, 2013 and 2010:2012:
| | Year Ended December 31, | | | Year Ended December 31, | |
(In millions) | | 2012 | | 2011 | | 2010 | | | 2014 | | 2013 | | 2012 | |
Restricted stock | | $ | 1.3 | | $ | 1.3 | | $ | 1.4 | | | $ | 2.1 | | $ | 1.8 | �� | $ | 1.3 | |
Performance shares | | 1.0 | | 0.8 | | 1.0 | | | 1.5 | | 1.2 | | 1.0 | |
Total | | $ | 2.3 | | $ | 2.1 | | $ | 2.4 | | | $ | 3.6 | | $ | 3.0 | | $ | 2.3 | |
Income tax benefits related to stock-based compensation of approximately $0.4$1.3 million, $0.8$1.1 million and $0.5$0.4 million was recorded for the years ended December 31, 2012, 20112014, 2013 and 2010,2012, respectively. Stock-based compensation expense is included in “selling, general and administrative expenses” in the accompanying statements of operations.income.
As of December 31, 2012,2014, total unrecognized compensation costs related to nonvested RSAs and PSAs was $2.1$4.3 million and will be recognized over a weighted-average period of approximately 0.680.9 years.
Accumulated Other Comprehensive Loss
As of December 31, 2012 and 2011,The following table summarizes the changes in accumulated other comprehensive loss, net of tax, consisted of the following:by component during 2014 and 2013:
(In thousands) | | 2012 | | | 2011 | |
Fair value of cash flow hedges | | $ | (7,899 | ) | | $ | (15,932 | ) |
Pension and post-retirement obligations | | | (65,190 | ) | | | (44,102 | ) |
| | | (73,089 | ) | | | (60,034 | ) |
Deferred taxes | | | 27,305 | | | | 22,201 | |
Totals | | $ | (45,784 | ) | | $ | (37,833 | ) |
| | Pension and | | | | | |
| | Post-Retirement | | Derivative | | | |
(In thousands) | | Obligations | | Instruments | | Total | |
Balance at December 31, 2012 | | $ | (40,581) | | $ | (5,203) | | $ | (45,784) | |
Other comprehensive income before reclassifications | | 39,381 | | (381) | | 39,000 | |
Amounts reclassified from accumulated other comprehensive income | | 1,843 | | 3,941 | | 5,784 | |
Net current period other comprehensive income | | 41,224 | | 3,560 | | 44,784 | |
Balance at December 31, 2013 | | | 643 | | | (1,643) | | | (1,000) | |
Other comprehensive income before reclassifications | | (35,107) | | (81) | | (35,188) | |
Amounts reclassified from accumulated other comprehensive income | | (637) | | 1,269 | | 632 | |
Net current period other comprehensive income | | (35,744) | | 1,188 | | (34,556) | |
Balance at December 31, 2014 | | $ | (35,101) | | $ | (455) | | $ | (35,556) | |
The following table summarizes reclassifications from accumulated other comprehensive loss during 2014:
| | Amount Reclassified from AOCI | | | |
| | Year Ended December 31, | | Affected Line Item in the | |
(In thousands) | | 2014 | | 2013 | | Statement of Income | |
Amortization of pension and post-retirement items: | | | | | | | |
Prior service credit | | $ | 494 | | $ | 637 | | (a) | |
Actuarial gain (loss) | | 543 | | (3,652) | | (a) | |
| | 1,037 | | (3,015) | | Total before tax | |
| | (400) | | 1,172 | | Tax (expense) benefit | |
| | $ | 637 | | $ | (1,843) | | Net of tax | |
| | | | | | | |
Loss on cash flow hedges: | | | | | | | |
Interest rate derivatives | | $ | (2,050) | | $ | (5,875) | | Interest expense | |
| | 781 | | 1,934 | | Tax benefit | |
| | $ | (1,269) | | $ | (3,941) | | Net of tax | |
F-27
Table of Contents
CONSOLIDATED COMMUNICATIONS HOLDINGS, INC. AND SUBSIDIARIES
NOTES TO CONSOLIDATED FINANCIAL STATEMENTS (continued)
YEARS ENDED DECEMBER 31, 2014, 2013 AND 2012
(a)These items are included in the components of net periodic benefit cost for our pension and post-retirement benefit plans. See Note 9 for additional details.
9. PENSION PLANS AND OTHER POST-RETIREMENT BENEFITS
Defined Benefit Plans
We sponsor a qualified defined benefit pension plan (“Retirement Plan”) that is non-contributory covering certain of our hourly employees who fulfill minimum age and service requirements. Certain salaried employees are also covered by the Retirement Plan, although these benefits have previously been frozen. In connection withAs of May 2013, the acquisition of SureWest, we assumed sponsorship in 2012 ofRetirement Plan was closed to all new entrants and all employees under collective bargaining agreements that include a frozen non-contributory defined benefit pension plan (the “SureWest Plan”). The SureWest Plan covers certain eligible employees and benefits are based on years of service and the employee’s average compensation during the five highest consecutive years of the last ten years of credited service. This plan has previously been frozen so that no person is eligible to become a new participant and all future benefit accruals for existing participants have ceased.cash balance plan.
F-24
CONSOLIDATED COMMUNICATIONS HOLDINGS, INC. AND SUBSIDIARIES
NOTES TO CONSOLIDATED FINANCIAL STATEMENTS (continued)
YEARS ENDED DECEMBER 31, 2012, 2011 AND 2010
The CompanyWe also hashave two non-qualified supplemental retirement plans (“Supplemental Plans”): the Restoration Plan, which we acquired as part of our North Pittsburgh Systems, Inc. (“North Pittsburgh”) and TXU Communications Venture Company (“TXUCV”) acquisitions, and a Supplemental Executive Retirement Plan (“SERP”), which we acquired as part of our acquisition of SureWest.. The Supplemental Plans provide supplemental retirement benefits to certain former employees by providing for incremental pension payments to partially offset the reduction that would have been payable under the qualified defined benefit pension plans if it were not for limitations imposed by federal income tax regulations. Both plansThe Supplemental Plans have previously been frozen so that no person is eligible to become a new participant in the Supplemental Plans.participant. These plans are unfunded and have no assets. The benefits paid under the Supplemental Plans are paid from the general operating funds of the Company.
The following tables summarize the change in benefit obligation, plan assets and funded status of the Retirement Plan SureWest Plan and Supplemental Plans (collectively the “Pension Plans”) as of December 31, 20122014 and 2011.2013.
(In thousands) | | 2012 | | | 2011 | | | 2014 | | | 2013 | |
Change in benefit obligation | | | | | | | | | | | | |
Benefit obligation at the beginning of the year | | $ | 203,413 | | | $ | 194,101 | | | $ | 337,343 | | | $ | 379,528 | |
Service cost | | 1,184 | | | 1,277 | | | 560 | | | 743 | |
Interest cost | | 13,620 | | | 10,960 | | | 16,295 | | | 15,307 | |
Actuarial loss | | 32,274 | | | 9,583 | | |
Actuarial loss (gain) | | | 48,620 | | | (34,315 | ) |
Benefits paid | | (16,529 | ) | | (12,508 | ) | | (21,630 | ) | | (21,559 | ) |
Acquisition of SureWest Plans | | 146,688 | | | – | | |
Plan change | | (1,122 | ) | | – | | | - | | | (2,361 | ) |
Benefit obligation at the end of the year | | $ | 379,528 | | | $ | 203,413 | | | $ | 381,188 | | | $ | 337,343 | |
| | | | | | | | | | | | |
(In thousands) | | 2012 | | | 2011 | | | 2014 | | | 2013 | |
Change in plan assets | | | | | | | | | | | | |
Fair value of plan assets at the beginning of the year | | $ | 142,736 | | | $ | 146,965 | | | $ | 292,188 | | | $ | 262,778 | |
Employer contributions | | 15,222 | | | 9,503 | | | 11,112 | | | 11,480 | |
Actual return (loss) on plan assets | | 27,935 | | | (1,224 | ) | |
Actual return on plan assets | | | 15,448 | | | 39,489 | |
Benefits paid | | (16,529 | ) | | (12,508 | ) | | (21,630 | ) | | (21,559 | ) |
Acquisition of SureWest Plans | | 93,414 | | | – | | |
Fair value of plan assets at the end of the year | | $ | 262,778 | | | $ | 142,736 | | | $ | 297,118 | | | $ | 292,188 | |
Funded status at year end | | $ | (116,750 | ) | | $ | (60,677 | ) | | $ | (84,070 | ) | | $ | (45,155 | ) |
Amounts recognized in the consolidated balance sheets at December 31, 20122014 and 20112013 consisted of:
(In thousands) | | 2012 | | | 2011 | | | 2014 | | | 2013 | |
Current liabilities | | $ | (254 | ) | | $ | (52 | ) | | $ | (246 | ) | | $ | (254 | ) |
Long-term liabilities | | $ | (116,496 | ) | | $ | (60,624 | ) | | $ | (83,824 | ) | | $ | (44,901 | ) |
Amounts recognized in accumulated other comprehensive loss for the years ended December 31, 20122014 and 20112013 consisted of:
(In thousands) | | 2012 | | | 2011 | | | 2014 | | | 2013 | |
Unamortized prior service credit | | $ | (2,523 | ) | | $ | (1,683 | ) | | $ | (3,969 | ) | | $ | (4,426 | ) |
Unamortized net actuarial loss | | 67,104 | | | 50,556 | | | 66,561 | | | 10,302 | |
| | $ | 64,581 | | | $ | 48,873 | | | $ | 62,592 | | | $ | 5,876 | |
F-25F-28
Table of Contents
CONSOLIDATED COMMUNICATIONS HOLDINGS, INC. AND SUBSIDIARIES
NOTES TO CONSOLIDATED FINANCIAL STATEMENTS (continued)
YEARS ENDED DECEMBER 31, 2012, 20112014, 2013 AND 20102012
The following table summarizes the components of net periodic pension cost recognized in the consolidated statements of income for the plans for the years ended December 31, 2012, 20112014, 2013 and 2010:2012:
(In thousands) | | 2012 | | | 2011 | | | 2010 | | | 2014 | | | 2013 | | | 2012 | |
Service cost | | $ | 1,184 | | | $ | 1,277 | | | $ | 1,900 | | | $ | 560 | | | $ | 743 | | | $ | 1,184 | |
Interest cost | | 13,620 | | | 10,960 | | | 11,255 | | | 16,295 | | | 15,307 | | | 13,620 | |
Expected return on plan assets | | (14,728 | ) | | (10,893 | ) | | (10,178 | ) | | (23,106 | ) | | (20,654 | ) | | (14,728 | ) |
Amortization of: | | | | | | | | | | | | | | | | | | |
Net actuarial loss | | 2,518 | | | 786 | | | 875 | | | 20 | | | 3,652 | | | 2,518 | |
Prior service credit | | (282 | ) | | (166 | ) | | (43 | ) | | (457 | ) | | (457 | ) | | (282 | ) |
Net periodic pension cost | | $ | 2,312 | | | $ | 1,964 | | | $ | 3,809 | | |
Net periodic pension (benefit) cost | | | $ | (6,688 | ) | | $ | (1,409 | ) | | $ | 2,312 | |
The following table summarizes other changes in plan assets and benefit obligations recognized in other comprehensive loss, before tax effects, during 20122014 and 2011.2013.
(In thousands) | | 2012 | | | 2011 | | | 2014 | | | 2013 | |
Actuarial loss, net | | $ | 19,066 | | | $ | 21,701 | | |
Actuarial loss (gain), net | | | $ | 56,279 | | | $ | (53,149 | ) |
Recognized actuarial loss | | (2,518 | ) | | (786 | ) | | (20 | ) | | (3,652 | ) |
Prior service credit | | (1,122 | ) | | – | | | - | | | (2,361 | ) |
Recognized prior service credit | | 282 | | | 166 | | | 457 | | | 457 | |
Total amount recognized in other comprehensive loss, before tax effects | | $ | 15,708 | | | $ | 21,081 | | | $ | 56,716 | | | $ | (58,705 | ) |
The estimated net actuarial loss and net prior service credit for the defined benefit pension plans that will be amortized from accumulated other comprehensive loss in net periodic benefit cost in 20132015 are $3.6$3.9 million and $(0.3)$(0.5) million, respectively.
The weighted-average assumptions used to determine the projected benefit obligations and net periodic benefit cost for the years ended December 31, 2012, 20112014, 2013 and 20102012 were as follows:
| | 2012 | | 2011 | | 2010 | | | 2014 | | 2013 | | 2012 | |
Discount rate - net periodic benefit cost | | 5.00% | | 5.86% | | 6.23% | | | 4.97% | | 4.20% | | 5.00% | |
Discount rate - benefit obligation | | 4.20% | | 5.35% | | 5.86% | | | 4.27% | | 4.97% | | 4.20% | |
Expected long-term rate of return on plan assets | | 7.70% | | 7.50% | | 7.50% | | | 8.00% | | 8.00% | | 7.70% | |
Rate of compensation/salary increase | | 1.50% | | 3.06% | | 3.06% | | | 1.75% | | 1.75% | | 1.50% | |
The decrease in the discount rate in 2014 resulted in an increase to our pension benefit obligation of approximately $28.8 million at December 31, 2014. In addition, in 2014, we adopted the new U.S. mortality tables released by the Society of Actuaries for purposes of determining our mortality assumption used in the Pension Plans. The adoption of the new tables resulted in an increase in the life expectancy of plan participants. As a result of the updated mortality assumption, our pension benefit obligation increased approximately $16.7 million at December 31, 2014.
Other Non-qualified Deferred Compensation Agreements
We also are liable for deferred compensation agreements with former members of the board of directors and certain other former employees of a subsidiary of TXUCV, which was acquired in 2004. Thecompanies. Depending on the plan, benefits are payable in monthly or annual installments for a period of time based on the terms of the agreement which range from five years up to the life of the participant or to the beneficiary upon death of the participant and may begin as early as age 65 or upon the death of the participant.55. Participants accrue no new benefits as these plans had previously been frozen by TXUCV’s predecessor company prior to our acquisition of TXUCV.frozen. Payments related to the deferred compensation agreements totaled approximately $0.5 million and $0.6 million for the years ended December 31, 20122014 and 2011,2013, respectively. The net present value of the remaining obligations was approximately $2.2$2.4 million and $2.5$1.8 million at December 31, 20122014 and 2011,2013, respectively, and is included in pension and post-retirement benefit obligations in the accompanying balance sheets.
We also maintain 3728 life insurance policies on certain of the participating former directors and employees. We recognized $0.4$0.2 million and $0.6$0.3 million in life insurance proceeds as other non-operating income in 20122014 and 2011, respectively.2013. The excess of the cash surrender value of the remaining life insurance policies over the notes payable balances related to these policies is determined by an independent consultant, and totaled $2.0 million at December 31, 2012 and 2011, respectively. These amounts are included in investments in the accompanying balance sheets. Cash principal payments for the policies and any proceeds from the policies are classified as operating activities in the statements of cash flows. The aggregate death benefit payment payable under these policies totaled $7.5$2.2 million and $7.8 million as of December 31, 2012 and 2011, respectively.at
F-26F-29
Table of Contents
CONSOLIDATED COMMUNICATIONS HOLDINGS, INC. AND SUBSIDIARIES
NOTES TO CONSOLIDATED FINANCIAL STATEMENTS (continued)
YEARS ENDED DECEMBER 31, 2012, 20112014, 2013 AND 20102012
December 31, 2014 and 2013, respectively. These amounts are included in investments in the accompanying consolidated balance sheets. Cash principal payments for the policies and any proceeds from the policies are classified as operating activities in the consolidated statements of cash flows. The aggregate death benefit payment payable under these policies totaled $6.9 million and $7.3 million as of December 31, 2014 and 2013, respectively.
Post-retirement Benefit Obligations
We sponsor avarious healthcare and life insurance planplans (“Post-retirement Plan”Plans”) that providesprovide post-retirement medical benefits and life insurance benefits to certain groups of retired employees. Certain plans have previously been frozen so that no person is eligible to become a new participant. Retirees share in the cost of healthcare benefits, making contributions that are adjusted periodically—either based upon collective bargaining agreements or because total costs of the program have changed. Covered expenses for retiree health benefits are paid as they are incurred. Post-retirement life insurance benefits are fully insured. The Post-retirement Plan isA majority of the plans are unfunded and hashave no assets, and benefits are paid from the general operating funds of the Company.
In connection with the acquisition of SureWest, we acquired its post-retirement benefit plan which provides life insurance benefits and a stated reimbursement for Medicare supplemental insurance to certain eligible retired participants. This plan has previously been frozen so that no person is eligible to become a new participant. Employer However, employer contributions for retiree medical benefits of a plan from an acquired company are separately designated within the SureWest Plan pension trust for the sole purpose of providing payments of retiree medical benefits. The nature of the assets used to provide payment of retiree medical benefits for this plan is the same as that of the SureWestRetirement Plan. In connection with the acquisition of Enventis, we have included its post-retirement benefit plan as of the date of acquisition.
The following tables summarize the change in benefit obligation, plan assets and funded status of the post-retirement benefit obligations as of December 31, 20122014 and 2011.2013.
(In thousands) | | 2012 | | | 2011 | | | 2014 | | | 2013 | |
Change in benefit obligation | | | | | | | | | | | | |
Benefit obligation at the beginning of the year | | $ | 33,184 | | | $ | 33,476 | | | $ | 35,093 | | | $ | 43,906 | |
Service cost | | 811 | | | 749 | | | 479 | | | 925 | |
Interest cost | | 1,756 | | | 1,690 | | | 1,565 | | | 1,575 | |
Plan participant contributions | | 614 | | | 480 | | | 694 | | | 757 | |
Actuarial loss | | 5,282 | | | 911 | | |
Actuarial loss (gain) | | | 831 | | | (9,552 | ) |
Benefits paid | | (4,011 | ) | | (4,122 | ) | | (3,434 | ) | | (3,966 | ) |
Amendments | | | - | | | 1,448 | |
Acquisition | | 6,270 | | | - | | | 6,911 | | | - | |
Benefit obligation at the end of the year | | $ | 43,906 | | | $ | 33,184 | | | $ | 42,139 | | | $ | 35,093 | |
(In thousands) | | 2012 | | | 2011 | | | 2014 | | | 2013 | |
Change in plan assets | | | | | | | | | | | | |
Fair value of plan assets at the beginning of the year | | $ | – | | | $ | – | | | $ | 3,575 | | | $ | 3,410 | |
Employer contributions | | 3,189 | | | 3,643 | | | 2,740 | | | 2,772 | |
Plan participant’s contributions | | 614 | | | 479 | | | 694 | | | 757 | |
Actual return on plan assets | | 197 | | | – | | | (246 | ) | | 602 | |
Benefits paid | | (4,011 | ) | | (4,122 | ) | | (3,434 | ) | | (3,966 | ) |
Acquisition | | 3,421 | | | – | | |
Fair value of plan assets at the end of the year | | $ | 3,410 | | | $ | – | | | $ | 3,329 | | | $ | 3,575 | |
Funded status at year end | | $ | (40,496 | ) | | $ | (33,184 | ) | | $ | (38,810 | ) | | $ | (31,518 | ) |
Amounts recognized in the consolidated balance sheets at December 31, 20122014 and 20112013 consist of:
(In thousands) | | 2012 | | | 2011 | |
Current liabilities | | $ | (2,467 | ) | | $ | (2,527 | ) |
Long-term liabilities | | $ | (38,029 | ) | | $ | (30,657 | ) |
Amounts recognized in accumulated other comprehensive loss for the years ended December 31, 2012 and 2011 consist of:
(In thousands) | | 2012 | | | 2011 | |
Unamortized prior service credit | | $ | (1,446 | ) | | $ | (1,635 | ) |
Unamortized net actuarial loss (gain) | | 2,055 | | | (3,136 | ) |
| | $ | 609 | | | $ | (4,771 | ) |
(In thousands) | | 2014 | | | 2013 | |
Current liabilities | | $ | (2,734 | ) | | $ | (2,429 | ) |
Long-term liabilities | | $ | (36,076 | ) | | $ | (29,089 | ) |
F-27F-30
Table of Contents
CONSOLIDATED COMMUNICATIONS HOLDINGS, INC. AND SUBSIDIARIES
NOTES TO CONSOLIDATED FINANCIAL STATEMENTS (continued)
YEARS ENDED DECEMBER 31, 2012, 20112014, 2013 AND 20102012
Amounts recognized in accumulated other comprehensive loss for the years ended December 31, 2014 and 2013 consist of:
(In thousands) | | 2014 | | | 2013 | |
Unamortized prior service cost (credit) | | $ | 221 | | | $ | 183 | |
Unamortized net actuarial loss (gain) | | (6,005 | ) | | (7,868 | ) |
| | $ | (5,784 | ) | | $ | (7,685 | ) |
The following table summarizes the components of the net periodic costs for post-retirement benefits for the years ended December 31, 20122014, 2013 and 2011:2012:
(In thousands) | | 2012 | | | 2011 | | | 2010 | | | 2014 | | | 2013 | | | 2012 | |
Service cost | | $ | 811 | | | $ | 749 | | | $ | 668 | | | $ | 479 | | | $ | 925 | | | $ | 811 | |
Interest cost | | 1,756 | | | 1,690 | | | 1,835 | | | 1,565 | | | 1,575 | | | 1,756 | |
Expected return on plan assets | | (105 | ) | | – | | | – | | | (223 | ) | | (233 | ) | | (105 | ) |
Amortization of: | | | | | | | | | | | | | | | | | | |
Net actuarial loss | | – | | | (212 | ) | | (234 | ) | |
Net actuarial loss (gain) | | | (563 | ) | | – | | | – | |
Prior service credit | | (189 | ) | | (189 | ) | | (447 | ) | | (37 | ) | | (180 | ) | | (189 | ) |
Net periodic postretirement benefit cost | | $ | 2,273 | | | $ | 2,038 | | | $ | 1,822 | | | $ | 1,221 | | | $ | 2,087 | | | $ | 2,273 | |
The following table summarizes other changes in plan assets and benefit obligations recognized in other comprehensive loss, before tax effects, during 20122014 and 2011:2013:
(In thousands) | | 2012 | | | 2011 | | | 2014 | | | 2013 | |
Actuarial loss , net | | $ | 5,191 | | | $ | 911 | | |
Actuarial loss (gain), net | | | $ | 1,301 | | | $ | (9,922 | ) |
Recognized actuarial gain | | – | | | 213 | | | 563 | | | - | |
Prior service cost | | | - | | | 1,448 | |
Recognized prior service credit | | 189 | | | 189 | | | 37 | | | 180 | |
Total amount recognized in other comprehensive loss, before tax effects | | $ | 5,380 | | | $ | 1,313 | | | $ | 1,901 | | | $ | (8,294 | ) |
TheIn 2015, the estimated net prior service creditactuarial gain that will be amortized from accumulated other comprehensive loss in net periodic postretirement cost in 2013 is approximately $0.2$(0.3) million. In 2013, thereThe estimated net prior service credit is not an expected unamortized net actuarial gain to reduce the net periodic postretirement cost.significant.
The weighted-average discount rate assumptions utilized for the years ended December 31 were as follows:
| | 2012 | | 2011 | | 2010 | | | 2014 | | 2013 | | 2012 | |
Net periodic benefit cost | | 5.00% | | 5.58% | | 6.10% | | | 4.55% | | 4.00% | | 5.00% | |
Benefit obligation | | 3.90% | | 5.22% | | 5.58% | | | 4.11% | | 4.40% | | 3.90% | |
For purposes of determining the cost and obligation for pre-Medicare postretirement medical benefits, an 8%a 7.50% annual rate of increase in the per capita cost of covered benefits (i.e., healthcare trend rate) was assumed for the plan in 2013,2014, declining to a rate of 5.00% in 2019.2020. Assumed healthcare cost trend rates have a significant effect on the amounts reported for healthcare plans. A one percent change in the assumed healthcare cost trend rate would have had the following effects:
(In thousands) | | 1% Increase | | | 1% Decrease | | | 1% Increase | | | 1% Decrease | |
Effect on total of service and interest cost | | $ | 267 | | | $ | (226 | ) | | $ | 150 | | | $ | (132 | ) |
Effect on postretirement benefit obligation | | $ | 3,417 | | | $ | (2,953 | ) | | $ | 2,414 | | | $ | (2,136 | ) |
Plan Assets
Our investment strategy is designed to provide a stable environment to earn a rate of return over time to satisfy the benefit obligations and minimize the reliance on contributions as a source of benefit security. The objectives are based on a long-term (5 to 15 year) investment horizon, so that interim fluctuations should be viewed with appropriate perspective. The assets of the fund are to be invested to achieve the greatest return for the pension plans consistent with a prudent level of risk.
F-31
Table of Contents
CONSOLIDATED COMMUNICATIONS HOLDINGS, INC. AND SUBSIDIARIES
NOTES TO CONSOLIDATED FINANCIAL STATEMENTS (continued)
YEARS ENDED DECEMBER 31, 2014, 2013 AND 2012
The asset return objective is to achieve, as a minimum over time, the passively managed return earned by managed index funds, weighted in the proportions outlined by the asset class exposures identified in the pension plan’s strategic allocation. We update our long-term, strategic asset allocations every few years to ensure they are in line with our fund objectives. The target allocation of the Pension Plan assets is approximately 55% - 65%60% in equities with the remainder in fixed income funds and cash equivalents. Fixed income funds include corporate and municipal bonds, U.S. Treasury and Government Agency securities, mutual funds and mortgage-backed securities. Currently, we believe that there are no significant concentrations of risk associated with the pension plan assets.
F-28
CONSOLIDATED COMMUNICATIONS HOLDINGS, INC. AND SUBSIDIARIES
NOTES TO CONSOLIDATED FINANCIAL STATEMENTS (continued)
YEARS ENDED DECEMBER 31, 2012, 2011 AND 2010
The following is a description of the valuation methodologies for assets measured at fair value utilizing the fair value hierarchy discussed in Note 1, which prioritizes the inputs used in the valuation methodologies in measuring fair value. The fair value measurements used to value our plan assets as of December 31, 20122014 were generated by using market transactions involving identical or comparable assets. There were no changes in the valuation techniques used during 2012.2014.
Equity securities include investments in common and preferred stocks, mutual funds, common collective trusts and other commingled investment funds.
Common and InternationalPreferred Stocks: Includes domestic and international common and preferred stocks and are valued at the closing price as of the measurement date as reported on the active market on which the individual securities are traded multiplied by the number of shares owned.
Mutual Funds: Valued at the closing net asset value as of the measurement date as reported on the active market on which the funds are traded multiplied by the number of shares owned or the percentage of ownership in the fund.
Common Collective Trust:Trusts and Commingled Funds: Valued as determined by the fund manager based on the underlying net asset values multiplied by the ownership percentage and supported by the value of the underlying securities as of the financial statement date.
Fixed Income Funds: Includesincome securities include U.S. Treasury and Government Agency securities, corporate and municipal bonds, and mortgage-backed securities. U.S. Treasury and Government Agency securitiesSecurities using Level 1 inputs are valued at the closing net asset value as of the measurement date asprice reported on the active market on which the funds are traded multiplied by the number of shares owned or the percentage of ownership in the fund. Corporate and municipal bonds and mortgage-backedindividual securities are traded. Securities using Level 2 inputs are valued based on yields currentlyusing available on comparabletrade information for similar securities, of issuersrecently executed transactions, cash flow models with similar credit ratings.
The fair values of our assets for our defined benefit pension plans at December 31, 2012yield curves, dealer quotes, market indices and 2011, by asset category were as follows:
| | | | As of December 31, 2012 |
| | | | Quoted Prices
In Active
Markets for
Identical Assets | | Significant
Other
Observable
Inputs | | Significant
Unobservable
Inputs | |
(In thousands) | | Total | | (Level 1) | | (Level 2) | | (Level 3) | |
| | | | | | | | | |
Cash equivalents: | | | | | | | | | |
Short-term investments(1) | | $ | 4,262 | | $ | 1,036 | | $ | 3,226 | | $ | – | |
| | | | | | | | | |
Equities: | | | | | | | | | |
U.S. common stocks | | 36,620 | | 36,620 | | – | | – | |
International stocks | | 9,589 | | 9,589 | | – | | – | |
Mutual funds | | 62,818 | | 62,818 | | – | | – | |
Common Collective Trust | | 55,152 | | – | | 55,152 | | – | |
| | | | | | | | | |
Fixed Income: | | | | | | | | | |
U.S. treasury and government agency securities | | 22,937 | | 22,937 | | – | | – | |
Corporate and municipal bonds | | 9,238 | | – | | 9,238 | | – | |
Mortgage/asset-backed securities | | 10,669 | | – | | 10,669 | | – | |
Mutual funds | | 51,493 | | 51,493 | | – | | – | |
Total | | $ | 262,778 | | $ | 184,493 | | $ | 78,285 | | $ | – | |
(1) Short-term investments includes cash and cash equivalents and an investment in a common collective trust which is principally comprised of certificates of deposit, commercial paper and U.S. Treasury bills with maturities less than one year.other pricing models utilizing observable inputs.
F-29F-32
Table of Contents
CONSOLIDATED COMMUNICATIONS HOLDINGS, INC. AND SUBSIDIARIES
NOTES TO CONSOLIDATED FINANCIAL STATEMENTS (continued)
YEARS ENDED DECEMBER 31, 2012, 20112014, 2013 AND 20102012
| | | | As of December 31, 2011 |
| | | | Quoted Prices
In Active
Markets for
Identical Assets | | Significant
Other
Observable
Inputs | | Significant
Unobservable
Inputs | |
(In thousands) | | Total | | (Level 1) | | (Level 2) | | (Level 3) | |
| | | | | | | | | |
Cash equivalents: | | | | | | | | | |
Short-term investments(1) | | $ | 2,991 | | $ | 191 | | $ | 2,800 | | $ | – | |
| | | | | | | | | |
Equities: | | | | | | | | | |
U.S. common stocks | | 22,090 | | 22,090 | | – | | – | |
International stocks | | 9,245 | | 9,245 | | – | | – | |
Mutual funds | | 42,999 | | 42,999 | | – | | – | |
Common Collective Trust | | 15,695 | | – | | 15,695 | | – | |
| | | | | | | | | |
Fixed Income: | | | | | | | | | |
Mutual funds | | 49,716 | | 49,716 | | – | | – | |
Total | | $ | 142,736 | | $ | 124,241 | | $ | 18,495 | | $ | – | |
The fair values of our assets for our defined benefit pension plans at December 31, 2014 and 2013, by asset category were as follows:
| | | | As of December 31, 2014 |
| | | | Quoted Prices
In Active
Markets for
Identical Assets | | Significant
Other
Observable
Inputs | | Significant
Unobservable
Inputs | |
(In thousands) | | Total | | (Level 1) | | (Level 2) | | (Level 3) | |
| | | | | | | | | |
Cash equivalents: | | | | | | | | | |
Short-term investments(1) | | $ | 7,634 | | $ | 1,370 | | $ | 6,264 | | $ | – | |
| | | | | | | | | |
Equities: | | | | | | | | | |
Stocks: | | | | | | | | | |
U.S. common stocks | | 29,338 | | 29,338 | | – | | – | |
International stocks | | 9,459 | | 9,459 | | – | | – | |
Funds: | | | | | | | | | |
U.S. small cap | | 11,224 | | – | | 11,224 | | – | |
U.S. mid cap | | 8,890 | | 8,890 | | – | | – | |
U.S. large cap | | 26,081 | | 10,212 | | 15,869 | | – | |
Emerging markets | | 22,662 | | 14,838 | | 7,824 | | – | |
International | | 64,748 | | 49,334 | | 15,414 | | – | |
| | | | | | | | | |
Fixed Income: | | | | | | | | | |
U.S. treasury and government agency securities | | 16,707 | | 7,996 | | 8,711 | | – | |
Corporate and municipal bonds | | 6,950 | | – | | 6,950 | | – | |
Mortgage/asset-backed securities | | 7,247 | | – | | 7,247 | | – | |
Common Collective Trust | | 62,507 | | – | | 62,507 | | | |
Mutual funds | | 26,964 | | 26,964 | | – | | – | |
Total investments | | $ | 300,411 | | $ | 158,401 | | $ | 142,010 | | $ | – | |
Other liabilities (2) | | | (3,293) | | | | | | | | | | |
Net plan assets | | $ | 297,118 | | | | | | | | | | |
F-33
Table of Contents
CONSOLIDATED COMMUNICATIONS HOLDINGS, INC. AND SUBSIDIARIES
NOTES TO CONSOLIDATED FINANCIAL STATEMENTS (continued)
YEARS ENDED DECEMBER 31, 2014, 2013 AND 2012
| | | | As of December 31, 2013 |
| | | | Quoted Prices
In Active
Markets for
Identical Assets | | Significant
Other
Observable
Inputs | | Significant
Unobservable
Inputs | |
(In thousands) | | Total | | (Level 1) | | (Level 2) | | (Level 3) | |
| | | | | | | | | |
Cash equivalents: | | | | | | | | | |
Short-term investments(1) | | $ | 4,708 | | $ | 2,835 | | $ | 1,873 | | $ | – | |
| | | | | | | | | |
Equities: | | | | | | | | | |
Stocks: | | | | | | | | | |
U.S. common stocks | | 38,463 | | 38,463 | | – | | – | |
International stocks | | 10,198 | | 10,198 | | – | | – | |
Funds: | | | | | | | | | |
U.S. small cap | | 15,181 | | – | | 15,181 | | – | |
U.S. mid cap | | 9,215 | | 9,215 | | – | | – | |
U.S. large cap | | 34,535 | | 11,101 | | 23,434 | | – | |
Emerging markets | | 20,225 | | 12,855 | | 7,370 | | – | |
International | | 60,416 | | 44,132 | | 16,284 | | – | |
| | | | | | | | | |
Fixed Income: | | | | | | | | | |
U.S. treasury and government agency securities (3) | | 19,012 | | 11,063 | | 7,949 | | – | |
Corporate and municipal bonds | | 8,624 | | – | | 8,624 | | – | |
Mortgage/asset-backed securities | | 8,116 | | – | | 8,116 | | – | |
Common Collective Trust | | 17,398 | | – | | 17,398 | | | |
Mutual funds | | 46,097 | | 46,097 | | – | | – | |
Total | | $ | 292,188 | | $ | 185,959 | | $ | 106,229 | | $ | – | |
(1) Short-term investments includes cash and cash equivalents and an investment in a common collective trust which is principally comprised of certificates of deposit, commercial paper and U.S. Treasury bills with maturities less than one year.
(2)Net amount due for securities purchased and sold.
(3)During 2014, we determined that certain government agency securities more appropriately aligned with the Level 2 classification of the fair value hierarchy. Accordingly, we have reclassified these securities from Level 1 to Level 2 as of December 31, 2013.
F-34
Table of Contents
CONSOLIDATED COMMUNICATIONS HOLDINGS, INC. AND SUBSIDIARIES
NOTES TO CONSOLIDATED FINANCIAL STATEMENTS (continued)
YEARS ENDED DECEMBER 31, 2014, 2013 AND 2012
The fair values of our assets for our post-retirement benefit plans at December 31, 20122014 and 2013 were as follows:
| | | | As of December 31, 2012 | | | | As of December 31, 2014 | |
| | | | Quoted Prices | | Significant | | Significant | | | | | Quoted Prices
In Active
Markets for
Identical Assets | | Significant
Other
Observable
Inputs | | Significant
Unobservable
Inputs | |
(In thousands) | | Total | | (Level 1) | | (Level 2) | | (Level 3) | | | Total | | (Level 1) | | (Level 2) | | (Level 3) | |
| | | | | | | | | | | | | | | | | | |
Cash equivalents: | | | | | | | | | | | | | | | | | | |
| | | | | | | | | | | | | | |
Short-term investments(1) | | $ | 30 | | $ | 30 | | $ | – | | $ | – | | | $ | 97 | | $ | 17 | | $ | 80 | | $ | – | |
| | | | | | | | | | | | | | | | | | |
Equities: | | | | | | | | | | | | | | | | | | |
U.S. common stocks | | 545 | | 545 | | – | | – | | | 372 | | 372 | | – | | – | |
Mutual funds | | 289 | | 289 | | – | | – | | |
Common Collective Trust | | 1,097 | | – | | 1,097 | | – | | |
International stocks | | | 120 | | 120 | | – | | – | |
Funds: | | | | | | | | | | |
U.S. small cap | | | 142 | | – | | 142 | | – | |
U.S. mid cap | | | 113 | | 113 | | – | | – | |
U.S. large cap | | | 330 | | 129 | | 201 | | – | |
Emerging markets | | | 287 | | 188 | | 99 | | – | |
International | | | 821 | | 625 | | 196 | | – | |
| | | | | | | | | | | | | | | | | | |
Fixed Income: | | | | | | | | | | | | | | | | | | |
U.S. treasury and government agency securities | | 776 | | 776 | | – | | – | | | 212 | | 102 | | 110 | | – | |
Corporate and municipal bonds | | 312 | | – | | 312 | | – | | | 88 | | – | | 88 | | – | |
Mortgage/asset-backed securities | | | 361 | | | – | | | 361 | | | – | | | 92 | | – | | 92 | | – | |
Total | | $ | 3,410 | | $ | 1,640 | | $ | 1,770 | | $ | – | | |
Common Collective Trust | | | 792 | | – | | 792 | | | |
Mutual funds | | | 342 | | 342 | | – | | – | |
Total investments | | | $ | 3,808 | | $ | 2,008 | | $ | 1,800 | | $ | – | |
Benefit payments payable | | | (438) | | | | | | | |
Other liabilities (2) | | | (41) | | | | | | | |
Net plan assets | | | $ | 3,329 | | | | | | | |
F-35
Table of Contents
CONSOLIDATED COMMUNICATIONS HOLDINGS, INC. AND SUBSIDIARIES
NOTES TO CONSOLIDATED FINANCIAL STATEMENTS (continued)
YEARS ENDED DECEMBER 31, 2014, 2013 AND 2012
| | | | As of December 31, 2013 | |
| | | | Quoted Prices
In Active
Markets for
Identical Assets | | Significant
Other
Observable
Inputs | | Significant
Unobservable
Inputs | |
(In thousands) | | Total | | (Level 1) | | (Level 2) | | (Level 3) | |
| | | | | | | | | |
Cash equivalents: | | | | | | | | | |
Short-term investments(1) | | $ | 89 | | $ | 89 | | $ | – | | $ | – | |
| | | | | | | | | |
Equities: | | | | | | | | | |
U.S. common stocks | | 592 | | 592 | | – | | – | |
Funds: | | | | | | | | | |
U.S. small cap | | 215 | | – | | 215 | | – | |
U.S. large cap | | 638 | | – | | 638 | | – | |
Emerging markets | | 263 | | – | | 263 | | – | |
International | | 938 | | 357 | | 581 | | – | |
| | | | | | | | | |
Fixed Income: | | | | | | | | | |
U.S. treasury and government agency securities (3) | | 678 | | 394 | | 284 | | – | |
Corporate and municipal bonds | | 308 | | – | | 308 | | – | |
Mortgage/asset-backed securities | | 289 | | – | | 289 | | – | |
Total investments | | $ | 4,010 | | $ | 1,432 | | $ | 2,578 | | $ | – | |
Benefit payments payable | | (434) | | | | | | | |
Net plan assets | | $ | 3,576 | | | | | | | |
(1) Short-term investments includes cash and cash equivalents and an investment in a common collective trust which is principally comprised of certificates of deposit, commercial paper and U.S. Treasury bills with maturities less than one year.
(2)Net amount due for securities purchased and sold.
(3)During 2014, we determined that certain government agency securities more appropriately aligned with the Level 2 classification of the fair value hierarchy. Accordingly, we have reclassified these securities from Level 1 to Level 2 as of December 31, 2013.
Cash Flows
Contributions
Our funding policy is to contribute annually an actuarially determined amount necessary to meet the minimum funding requirements as set forth in employee benefit and tax laws. In July of 2012, the Moving Ahead for Progress in the 21st Century Act (“MAP-21”), which includes pension funding stabilization provisions, was signed into law. These provisions establish an interest rate corridor that is designed to stabilize the segment rates used to determine minimum funding requirements from the effects of interest rate volatility, which is expected to reduce the
F-30
CONSOLIDATED COMMUNICATIONS HOLDINGS, INC. AND SUBSIDIARIES
NOTES TO CONSOLIDATED FINANCIAL STATEMENTS (continued)
YEARS ENDED DECEMBER 31, 2012, 2011 AND 2010
Company’s minimum required pension contributions in the near-term. We expect to contribute approximately $11.5$12.4 million to our pension plans and $2.5$3.8 million to our other post-retirement plans in 2013.2015.
Estimated Future Benefit Payments
As of December 31, 2012,2014, benefit payments expected to be paid over the next ten years are outlined in the following table:
| | | | Other | | | | | Other | |
| | Pension | | Post-retirement | | | Pension | | Post-retirement | |
(In thousands) | | Plans | | Plans | | | Plans | | Plans | |
2013 | | $ | 21,628 | | $ | 3,579 | | |
2014 | | 21,952 | | 3,536 | | |
2015 | | 22,345 | | 3,607 | | | $ | 23,180 | | $ | 3,771 | |
2016 | | 22,634 | | 3,614 | | | 23,464 | | 3,906 | |
2017 | | 22,819 | | 2,842 | | | 23,484 | | 3,248 | |
2018 - 2022 | | 116,146 | | 14,211 | | |
2018 | | | 23,421 | | 3,119 | |
2019 | | | 23,482 | | 3,136 | |
2020 - 2024 | | | 116,982 | | 14,189 | |
|
Defined Contribution Plans
We offer defined contribution 401(k) plans to substantially all of our employees. Contributions made under the defined contribution plans include a match, at the Company’s discretion, of employee contributions to the plans. We
F-36
Table of Contents
CONSOLIDATED COMMUNICATIONS HOLDINGS, INC. AND SUBSIDIARIES
NOTES TO CONSOLIDATED FINANCIAL STATEMENTS (continued)
YEARS ENDED DECEMBER 31, 2014, 2013 AND 2012
recognized expense with respect to these plans of $5.3 million, $5.2 million and $3.9 million in 2014, 2013 and 2012, $2.5 million in 2011 and $2.4 million in 2010. The increase in 2012 is attributable to the acquisition of SureWest which accounted for $1.4 million of the total expense.respectively.
10. INCOME TAXES
Income tax expense consists of the following components:
| | For the Year Ended | | For the Year Ended | |
(In thousands) | | 2012 | | | 2011 | | | 2010 | | | 2014 | | 2013 | | 2012 | |
| | | | | | | | | | | | | | | | |
Current: | | | | | | | | | | | | | | | | |
Federal | | $ | 1,033 | | | $ | 5,657 | | | $ | 9,904 | | | $ | 1,769 | | $ | 1,381 | | $ | 340 | |
State | | 1,160 | | | 642 | | | 2,251 | | | 1,014 | | 86 | | 1,078 | |
Total current expense (benefit) | | 2,193 | | | 6,299 | | | 12,155 | | |
Total current expense | | | 2,783 | | 1,467 | | 1,418 | |
| | | | | | | | | | | | | | | | |
Deferred: | | | | | | | | | | | | | | | | |
Federal | | 1,998 | | | 8,209 | | | (1,796 | ) | | 8,136 | | 15,929 | | 1,998 | |
State | | (2,755 | ) | | 337 | | | (1,368 | ) | | 2,108 | | 116 | | (2,755) | |
Total deferred expense (benefit) | | (757 | ) | | 8,546 | | | (3,164 | ) | | 10,244 | | 16,045 | | (757) | |
Total income tax expense | | $ | 1,436 | | | $ | 14,845 | | | $ | 8,991 | | | $ | 13,027 | | $ | 17,512 | | $ | 661 | |
The following is a reconciliation of the federal statutory tax rate to the effective tax rate for the years ended December 31, 2012, 20112014, 2013 and 2010:2012:
| | Year Ended December 31, | | For the Year Ended | |
(In percentages) | | 2012 | | | 2011 | | | 2010 | | 2014 | | | 2013 | | | 2012 | |
| | | | | | | | | | | | | | | | | | |
Statutory federal income tax rate | | 35.0 | | | 35.0 | | | 35.0 | | | 35.0 | % | | 35.0 | % | | 35.0 | % |
State income taxes, net of federal benefit | | (8.4 | ) | | 0.8 | | | (0.1 | ) | | 1.2 | | | 1.7 | | | (12.8) | |
Transaction costs | | 11.0 | | | – | | | – | | | 2.6 | | | - | | | 14.9 | |
Other permanent differences | | (0.8 | ) | | (0.8 | ) | | (0.3 | ) | | 0.4 | | | - | | | (1.1) | |
Change in tax reserves | | – | | | (0.6 | ) | | (10.9 | ) | |
Change in uncertain tax positions | | | - | | | (1.7) | | | - | |
Change in deferred tax rate | | (14.6 | ) | | 0.9 | | | (1.4 | ) | | 7.4 | | | - | | | (19.7) | |
Valuation allowance | | | (0.7) | | | - | | | - | |
Provision to return | | | - | | | 1.3 | | | (4.2) | |
Other | | (3.3 | ) | | 0.2 | | | (1.0 | ) | | (0.1) | | | 0.6 | | | (0.4) | |
| | 18.9 | | | 35.5 | | | 21.3 | | | 45.8 | % | | 36.9 | % | | 11.7 | % |
F-31F-37
Table of Contents
CONSOLIDATED COMMUNICATIONS HOLDINGS, INC. AND SUBSIDIARIES
NOTES TO CONSOLIDATED FINANCIAL STATEMENTS (continued)
YEARS ENDED DECEMBER 31, 2012, 20112014, 2013 AND 20102012
Deferred Taxes
The components of the net deferred tax liability are as follows:
| | Year Ended December 31, | | Year Ended December 31, | |
(In thousands) | | 2012 | | | 2011 | | 2014 | | 2013 | |
| | | | | | | | | | | |
Current deferred tax assets: | | | | | | | | | | | |
Reserve for uncollectible accounts | | $ | 1,815 | | | $ | 964 | | | $ | 1,062 | | $ | 615 | |
Accrued vacation pay deducted when paid | | 1,727 | | | 1,153 | | | 2,381 | | 2,196 | |
Accrued expenses and deferred revenue | | 5,458 | | | 2,708 | | | 9,931 | | 5,149 | |
| | 9,000 | | | 4,825 | | | 13,374 | | 7,960 | |
Non-current deferred tax assets: | | | | | | | | | | | |
Net operating loss carryforwards | | 31,763 | | | 2,216 | | | 12,431 | | 18,809 | |
Pension and postretirement obligations | | 60,252 | | | 34,303 | | | 46,831 | | 28,072 | |
Stock-based compensation | | 450 | | | 427 | | | 998 | | 495 | |
Derivative instruments | | 3,004 | | | 5,872 | | | 276 | | 1,004 | |
Financing costs | | 567 | | | - | | | 2,151 | | 1,503 | |
State tax credit carryforwards | | 2,437 | | | 2,216 | | |
Tax credit carryforwards | | | 4,193 | | 3,143 | |
Other | | 305 | | | 427 | | | 28 | | - | |
| | 98,778 | | | 45,461 | | | 66,908 | | 53,026 | |
Valuation allowance | | (535 | ) | | – | | | (1,736) | | (535) | |
Net non-current deferred tax assets | | 98,243 | | | 45,461 | | | 65,172 | | 52,491 | |
| | | | | | | | | | | |
Non-current deferred tax liabilities: | | | | | | | | | | | |
Goodwill and other intangibles | | (27,376 | ) | | (31,106 | ) | | (42,246) | | (28,515) | |
Basis in investment | | (120 | ) | | - | | | (282) | | (38) | |
Partnership investments | | (26,413 | ) | | (26,985 | ) | | (25,813) | | (25,523) | |
Property, plant and equipment | | (183,176 | ) | | (64,697 | ) | | (240,407) | | (178,274) | |
| | (237,085 | ) | | (122,788 | ) | | (308,748) | | (232,350) | |
Net non-current deferred taxes | | (138,842 | ) | | (77,327 | ) | | (243,576) | | (179,859) | |
Net deferred income tax liabilities | | $ | (129,842 | ) | | $ | (72,502 | ) | | $ | (230,202) | | $ | (171,899) | |
Deferred income taxes are provided for the temporary differences between assets and liabilities recognized for financial reporting purposes and assets and liabilities recognized for tax purposes. The ultimate realization of deferred tax assets depends upon taxable income during the future periods in which those temporary differences become deductible. To determine whether deferred tax assets can be realized, management assesses whether it is more likely than not that some portion or all of the deferred tax assets will not be realized, taking into consideration the scheduled reversal of deferred tax liabilities, projected future taxable income and tax-planning strategies.
Based upon historical taxable income, taxable temporary differences, available and prudent tax planning strategies and projections for future taxablepre-tax book income over the periods that the deferred tax assets are deductible, management believes it is more likely than not that the Company will realize the benefits of these temporary differences. However, management may reduce the amount of deferred tax assets it considers realizable in the near term if estimates of future taxable income during the carryforward period are reduced. Estimates of future taxable income are based on the estimated recognition of taxable temporary differences, available and prudent tax planning strategies, and projections of future pre-tax book income. The amount of projectedestimated future taxable income is expected to allow for the full utilization of the net operating loss (“NOL”) carryforwards,carryforward, as described below.
Consolidated and its wholly owned subsidiaries, which file a consolidated federal income tax return, estimates it has available federal NOL carryforwards at December 31, 2012,2014, of $80.8$21.0 million and related deferred tax assets of $28.3$7.4 million. The federal NOL carryforwards expire from 20262031 to 2032. ManagementIn 2014, management no longer believes that the future utilization ofis uncertain and has released the full $1.5 million valuation allowance and related deferred tax asset of $0.5 million maintained against the Federal NOL carryforwards subject to Separate Return Limitation Yearseparate return limitation year restrictions. The tax benefits recognized related to the reversal of the valuation allowance were accounted for as a reduction of income tax expense.
F-38
Table of Contents
CONSOLIDATED COMMUNICATIONS HOLDINGS, INC. AND SUBSIDIARIES
NOTES TO CONSOLIDATED FINANCIAL STATEMENTS (continued)
YEARS ENDED DECEMBER 31, 2014, 2013 AND 2012
ETFL, a nonconsolidated subsidiary for federal income tax return purposes, estimates it has available NOL carryforwards at December 31, 2014, of $2.1 million and related deferred tax assets of $0.7 million. ETFL’s federal NOL carryforwards expire from 2020 to 2024.
We estimate that we have available state NOL carryforwards at December 31, 2014, of $105.2 million and related deferred tax assets of $4.4 million. The state NOL carryforwards expire from 2016 to 2034. Management believes that the future utilization of $26.9 million and related deferred tax asset of $1.4 million is uncertain and has placed a full valuation allowance on this amount of the available federalstate NOL carryforwards. The related NOL carryforward expires in 2026.carryforwards expire from 2018 to 2025. The valuation allowance was recorded as a result of the acquisition of SureWest during 2012.Enventis on October 16, 2014. If or when recognized, the tax benefits related to any reversal of the valuation allowance will be accounted for as a reduction of income tax expense.
ETFL, a nonconsolidated subsidiary forWe estimate that we have available federal incomealternative minimum tax return purposes, estimates it has available NOL(“AMT”) credit carryforwards at December 31, 2012,2014, of $2.5$1.3 million and related deferred tax assets of $0.8 million. ETFL’s federal NOL carryforwards expire from 2020 to 2024.
F-32
CONSOLIDATED COMMUNICATIONS HOLDINGS, INC. AND SUBSIDIARIES
NOTES TO CONSOLIDATED FINANCIAL STATEMENTS (continued)
YEARS ENDED DECEMBER 31, 2012, 2011 AND 2010
We estimate that we have available state NOL carryforwards at December 31, 2012, of $50.2 million and related deferred tax assets of $2.6$1.3 million. The state NOL carryforwards expire from 2016AMT credits are available to 2032.offset future tax liabilities only to the extent that the Company has regular tax liabilities in excess of AMT tax liabilities. The federal AMT credit carryforward does not expire.
We estimate that we have available state tax credit carryforwards at December 31, 2012,2014, of $3.9$4.5 million and related deferred tax assets of $2.4$2.9 million. The state tax credit carryforwardcarryforwards are limited annually and expire from 2016 to 2027. Management believes that the future utilization of $0.5 million and related deferred tax asset of $0.3 million is uncertain and has placed a valuation allowance on this amount of available state tax credit carryforwards. The related state tax credit carryforwards expires from 2016 to 2019. If or when recognized, the tax benefits related to any reversal of the valuation allowance will be accounted for as a reduction of income tax expense.
On September 13, 2013, Treasury and the Internal Revenue Service issued final regulations regarding the deduction and capitalization of expenditures related to tangible property. The final regulations under Internal Revenue Code Sections 162, 167 and 263(a) apply to amounts paid to acquire, produce, or improve tangible property as well as dispositions of such property and are generally effective for tax years beginning on or after January 1, 2014. We are currently working through the implementation of the regulations for the 2014 income tax returns to be filed in 2015 and do not expect they will have a material impact on our consolidated results of operations, cash flows, or financial position.
Unrecognized Tax Benefits
We adoptedUnder the accounting guidance applicable to uncertainty in income taxes effective January 1, 2007 with no impact on our results of operations or financial condition, andwe have analyzed filing positions in all of the federal and state jurisdictions where we are required to file income tax returns as well as all open tax years in these jurisdictions. This accounting guidance clarifies the accounting for uncertainty in income taxes recognized in a company’s financial statements; prescribes a recognition threshold and measurement attribute for the financial statement recognition and measurement of a tax position taken or expected to be taken in a tax return; and provides guidance on description, classification, interest and penalties, accounting in interim periods, disclosure, and transition.
AsOur unrecognized tax benefits as of December 31, 20122014 and 2011,2013 were $0.2 million and $0, respectively. Due to the amountacquisition of Enventis on October 16, 2014, the company recognized an increase in unrecognized tax benefits was $1.2of $0.2 million. The net amount of unrecognized benefits that, if recognized, would result in an impact to the effective tax rate is $0.8$0.2 million.
Our practice is to recognize interest and penalties related to income tax matters in interest expense and general and administrative expense, respectively. WeDuring 2014 and 2013 we did not have a material liability for interest or penalties and had no material interest or penalty expense in 2012 or 2011 and have no material remaining liability for interest or penalties.expense.
The only periods subject to examination for our federal return are years 20092010 through 2011.2013. The periods subject to examination for our state returns are years 20052010 through 2011.2013. We are currently under examination by federal and state taxing authorities. Weauthorities, but do not expect any settlement or payment that may result from the auditaudits to have a material effect on our results of operations or cash flows.
F-39
Table of Contents
CONSOLIDATED COMMUNICATIONS HOLDINGS, INC. AND SUBSIDIARIES
NOTES TO CONSOLIDATED FINANCIAL STATEMENTS (continued)
YEARS ENDED DECEMBER 31, 2014, 2013 AND 2012
We do not expect that the total unrecognized tax benefits and related accrued interest will significantly change due to the settlement of audits or the expiration of statute of limitations in the next twelve months. There were no material changes to these amounts during 20122014 and there were no effects on the Company’s effective tax rate.
The following is a reconciliation of the unrecognized tax benefits for the years ended December 31, 20122014 and 2011:2013:
| | Liability for | | Liability for | |
| | Unrecognized | | Unrecognized | |
| | Tax Benefits | | Tax Benefits | |
(In thousands) | | 2012 | | 2011 | | 2014 | | 2013 | |
| | | | | | | | | | |
Balance at January 1 | | $ | 1,224 | | $ | 1,496 | | | $ | - | | $ | 1,224 | |
Additions for tax positions of acquisition | | | 240 | | - | |
Additions for tax positions in the current year | | – | | – | | | - | | - | |
Additions for tax positions of prior years | | – | | – | | | - | | - | |
Settlements with taxing authorities | | – | | – | | | - | | - | |
Reduction for lapse of federal statute of limitations | | – | | (272 | ) | | - | | - | |
Reduction for lapse of state statute of limitations | | – | | – | | | - | | (1,224) | |
Balance at December 31 | | $ | 1,224 | | $ | 1,224 | | | $ | 240 | | $ | - | |
11. COMMITMENTS AND CONTINGENCIES
We have certain other obligations for various contractual agreements to secure future rights to goods and services to be used in the normal course of our operations. These include purchase commitments for planned capital expenditures, agreements securing dedicated access and transport services, and service and support agreements. Additionally, we have procured transport resale arrangements with several interexchange carriers for our long distance services.
F-33
CONSOLIDATED COMMUNICATIONS HOLDINGS, INC. AND SUBSIDIARIES
NOTES TO CONSOLIDATED FINANCIAL STATEMENTS (continued)
YEARS ENDED DECEMBER 31, 2012, 2011 AND 2010
As of December 31, 2012,2014, future minimum contractual obligations, including capital and operating leases, and the estimated timing and effect the obligations will have on our liquidity and cash flows in future periods are as follows:
| | | Minimum Annual Contractual Obligations | |
| | | | | | | | | | | | | | | | |
(in thousands) | | 2013 | | 2014 | | 2015 | | 2016 | | 2017 | | Thereafter | | Total | | | 2015 | | 2016 | | 2017 | | 2018 | | 2019 | | Thereafter | | Total | |
Operating lease agreements | | $ | 2,375 | | $ | 1,831 | | $ | 1,412 | | $ | 431 | | $ | 399 | | $ | 1,233 | | $ | 7,681 | | | $ | 4,796 | | $ | 3,019 | | $ | 2,620 | | $ | 1,855 | | $ | 1,554 | | $ | 5,068 | | $ | 18,912 | |
Capital lease agreements | | 983 | | 1,004 | | 981 | | 914 | | 936 | | 3,322 | | 8,140 | | | 1,302 | | 1,077 | | 971 | | 961 | | 984 | | 1,378 | | 6,673 | |
Capital expenditures (1) | | 7,223 | | – | | – | | – | | – | | – | | 7,223 | | | 3,023 | | – | | – | | – | | – | | – | | 3,023 | |
Service and support agreements (2) | | 2,211 | | 1,209 | | 419 | | – | | – | | – | | 3,839 | | | 8,526 | | 7,403 | | 2,428 | | 1,586 | | 1,334 | | 858 | | 22,135 | |
Transport and data connectivity | | 9,330 | | 9,000 | | 9,000 | | 9,000 | | 9,000 | | – | | 45,330 | | | 9,040 | | 9,000 | | 9,000 | | – | | – | | – | | 27,040 | |
Total | | $ | 22,122 | | $ | 13,044 | | $ | 11,812 | | $ | 10,345 | | $ | 10,335 | | $ | 4,555 | | $ | 72,213 | | | $ | 26,687 | | $ | 20,499 | | $ | 15,019 | | $ | 4,402 | | $ | 3,872 | | $ | 7,304 | | $ | 77,783 | |
(1)We have binding commitments with numerous suppliers for future capital expenditures.
(2)We have entered into service and maintenance agreements to support various computer hardware and software applications and certain equipment. If we terminate any of the contracts prior to their expiration date, we would be liable for minimum commitment payments as defined in by the contractual terms of the contracts.
Leases
Operating
We have entered into various non-cancelable operating leases with terms greater than one year for certain facilities and equipment used in our operations. The facility leases generally require us to pay operating costs: including property taxes, insurance and maintenance, and certain of them contain scheduled rent increases and renewal options. Leasehold improvements are amortized over their estimated useful lives or lease period, whichever is shorter. We recognize rent expense on a straight-line basis over the term of each lease.
We incurred rent expense of $2.9$2.6 million, $2.1$2.3 million and $3.4$2.9 million for the years ended December 31, 2014, 2013, and 2012, 2011, and 2010, respectively.
F-40
Table of Contents
CONSOLIDATED COMMUNICATIONS HOLDINGS, INC. AND SUBSIDIARIES
NOTES TO CONSOLIDATED FINANCIAL STATEMENTS (continued)
YEARS ENDED DECEMBER 31, 2014, 2013 AND 2012
Capital Leases
We lease certain facilities and equipment under various capital lease arrangements, all of which expire between 2015 and 2021. As of December 31, 2012, we had five capital leases, of which four expire in 2021 and one will expire in 2015. As of December 31, 2012,2014, the present value of the minimum remaining lease commitments was approximately $4.8$4.5 million, of which $0.4$0.7 million was due and payable within the next twelve months. The carrying amount of our capital lease obligations, net of imputed interest of $3.3$2.1 million, was $4.8$4.5 million as of December 31, 2012.2014. See Note 12 for information regarding the capital leases we have entered into with related parties.
Litigation, Regulatory Proceedings and Other Contingencies
Prior to the completion of the SureWest Merger on July 2, 2012, sixFive putative class action lawsuits werehave been filed by alleged SureWestEnventis shareholders challenging the Company’s proposed merger with SureWestEnventis in which the Company, WH Acquisition Corp. and WH Acquisition II Corp, SureWestSky Merger Sub Inc., Enventis and members of the SureWestEnventis board of directors have been named as defendants. FiveThe shareholder actions were filed in the Superior Court of California, PlacerFifth Judicial District, Blue Earth County, and one shareholder action was filed in the United States District Court for the Eastern District of California.Minnesota. The actions are called Needlescalled: Hoepner v. SureWest Communications,Enventis Corp. et al.al, filed February 17, 2012, ErrecartJuly 15, 2014, Case No. 07-CV-14-2489, Bockley v. Oldham,Finke et al.al, filed February 24, 2012, SpringerJuly 18, 2014, Case No. 07-CV-14-2551, Kaplan et al v. SureWest Communications,Enventis Corp. et al.al, filed March 9, 2012, AievoliJuly 21, 2014, Case No. 07-CV-14-2575, Marcial v. Oldham,Enventis Corp. et al.al., filed March 15, 2012,July 25, 2014, Case No. 07-CV-14-2628, and WaterburyBarta v. SureWest Communications,Finke et al.al, filed March 26, 2012, and the federal action is called Broering v. Oldham, et al., filed April 18, 2012.August 14, 2014, Case No. 07-CV-14-2854. The actions generally allege, among other things, that each member of the SureWestEnventis board of directors breached fiduciary duties to SureWestEnventis and its shareholders by authorizing the sale of SureWestEnventis to the Company for consideration that allegedly wasis unfair to the SureWestEnventis shareholders, and agreedagreeing to terms that allegedly unduly restrict other bidders from making a competing offer.offer, as well as allegations regarding disclosure deficiencies in the joint proxy statement/prospectus. The complaints also allege that the Company and SureWestSky Merger Sub Inc. aided and abetted the breaches of fiduciary duties allegedly committed by the members of the SureWestEnventis board of directors. The Broering complaint also alleges, amonglawsuits seek, amongst other things, that the joint proxy statement/prospectus filed with the SEC on March 28, 2012 did not make sufficient disclosures regarding the merger, that SureWest’s board should have appointed an independent committee to negotiate the transaction and that SureWest should have gone back to another bidder to create a competitive bid process. The lawsuits seek equitable relief, including an order to prevent the defendants from consummating the merger on the agreed-upon terms and/or an awardterms. The Enventis board of unspecified monetary damages.directors appointed a Special Litigation Committee to address the claims. We believe that these claims are without merit. On March 14, 2012,September 19, 2014, the Placer County SuperiorDistrict Court entered an order consolidating the Needles, Errecart and Springer actions into a single action
F-34
CONSOLIDATED COMMUNICATIONS HOLDINGS, INC. AND SUBSIDIARIES
NOTES TO CONSOLIDATED FINANCIAL STATEMENTS (continued)
YEARS ENDED DECEMBER 31, 2012, 2011 AND 2010
underfive lawsuits as In Re: Enventis Corporation Shareholder Litigation, Case No. 07-CV-14-2489. On September 23, 2014, the caption In re SureWest Communications Shareholder Litigation. Under the terms of this order, all cases subsequently filed in the Superior Court for the State of California, County of Placer, that relate to the same subject matter and involve similar questions of law or fact were to be consolidated with these cases as well. This included the Aievoli and Waterbury cases. On April 10, 2012, the plaintiff in Waterbury filed a request for voluntary dismissal of her complaint without prejudice. On May 18, 2012, pursuant to the parties’ stipulation, the federalDistrict Court entered an order stayingthat denied the Broering actionplaintiffs’ request for 90 days. The federal Court subsequently extendedexpedited proceedings and stayed all proceedings “pending the staycompletion of the Broering action until June 1, 2013.Special Litigation Committee and the issuance of its decision.” On June 1, 2012,February 2, 2015, the parties entered intoSpecial Litigation Committee issued a proposed settlementreport stating that the claims lack merit and should not proceed.
In 2014, Sprint Corporation, Level 3 Communications, Inc., and Verizon Communications Inc. filed lawsuits against us and many others in the industry regarding the proper charges to be applied between interexchange and local exchange carriers for certain calls between mobile and wireline devices that are routed through an interexchange carrier. The plaintiffs are refusing to pay these access charges in all states and are seeking refunds of past charges paid. The disputed amounts total $1.2 million, and cover the periods extending from 2006. CenturyLink, Inc. has filed to bring all of the shareholder actions without any admission of liability by the Company or the other defendants. Pursuantrelated suits to the proposed settlement, SureWest agreedU.S. District Court’s Judicial Panel on multi district litigation. This panel is granted authority to make, and subsequently made, certain additional disclosures intransfer to a Current Report on Form 8-K filed with the SEC in advance of the special meeting of SureWest shareholders held on June 12, 2012. The proposed settlement also provided that plaintiffs’ counsel collectively are to receive attorneys’ fees of $0.525 million, of which the Company is to pay $36.25 thousand, with the balance to be paid by SureWest and its insurer. The proposed settlement is subject to approval by the Placer County Superior Court. On December 20, 2012, the court issued a ruling preliminarily approving the proposed settlement. The court set a hearing for March 28, 2013 at which it will consider final approval of the proposed settlement. Upon final approval by thesingle court the consolidated state court actionspretrial proceedings for civil cases involving commom questions of fact. The U.S. District Court in Dallas, TX is expected to hear the case no later than September 2015. We have interconnection agreements in place with all wireless carriers and the federal action will be dismissed with prejudice.applicable traffic is being billed at current access rates, therefore we do not expect any potential settlement to have an adverse material impact on our financial results or cash flows.
On April 15, 2008, Salsgiver Inc., a Pennsylvania-based telecommunications company, and certain of its affiliates (“Salsgiver”) filed a lawsuit against us and our subsidiaries North Pittsburgh Telephone Company and North Pittsburgh Systems Inc. in the Court of Common Pleas of Allegheny County, Pennsylvania alleging that we have prevented Salsgiver from connecting their fiber optic cables to our utility poles. Salsgiver seeks compensatory and punitive damages as the result of alleged lost projected profits, damage to its business reputation, and other costs. Salsgiver originally claimed to have sustained losses of approximately $125 million and did not request a specific dollar amount in damages.million. We believe that these claims are without merit and that the alleged damages are completely unfounded. We intend to defend against these claims vigorously. Discovery concluded and Consolidated filed a motion for summary judgment on June 18, 2012 and the court heard oral arguments on August 30, 2012. On February 12, 2013, the court, granted, in part, Consolidated’sgranted our motion. The court ruled that Salsgiver could not recover prejudgment interest and could not use as a basis of liability any actions prior to April 14, 2006. We anticipate a status conference being heldIn September 2013, in late March 2013, at which timeorder to avoid the court will set a briefingdistraction and trial schedule.uncertainty of further litigation, we reached an agreement in principle (the “Agreement”) with Salsgiver, Inc. In accordance with the terms of the Agreement, we would pay Salsgiver approximately $0.9 million in cash and grant approximately $0.3 million in credits that may be used for make-ready charges (the “Credits”). The Credits would be available for services performed in connection with the pole
F-41
Table of Contents
CONSOLIDATED COMMUNICATIONS HOLDINGS, INC. AND SUBSIDIARIES
NOTES TO CONSOLIDATED FINANCIAL STATEMENTS (continued)
YEARS ENDED DECEMBER 31, 2014, 2013 AND 2012
attachment applications within five years of the execution of the Agreement. We had previously recorded approximately $0.4 million in 2011 in anticipation of the settlement of this case. During the quarter ended September 30, 2013, per the terms of the Agreement we recorded an additional $0.9 million, which included estimated legal fees. In addition,October 2014, Salsgiver rejected the Agreement, remanding the case back to the court. A trial is anticipated to occur in the third quarter of 2015; however, we have asked the Federal Communications Commission (“FCC”) Enforcement Bureau to address Salsgiver’s unauthorized pole attachments and safety violations on those attachments. We believe that these are violationsdespite the rejection, the $1.3 million currently accrued represents management’s best estimate of an FCC order regarding Salsgiver’s complaint against us. We do not believe that these claims will have a material adverse impact on our financial results.the probable payment.
Two of our subsidiaries, Consolidated Communications of Pennsylvania Company LLC (“CCPA”) and Consolidated Communications Enterprise Services Inc. (“CCES”), have, at various times, received assessment notices from the Commonwealth of Pennsylvania Department of Revenue (“DOR”) increasing the amounts owed for Pennsylvania Gross Receipt Taxes, and/or have had audits performed for the tax period ending December 31, 2009. These two assessments adjusted the subsidiaries’ combined total outstanding taxable gross receipts liability (with interest) to approximately $2.3 million.years of 2008 through 2013. In addition, based upon recently completed audits of CCESa re-audit was performed on CCPA for 2008, 2009the 2010 calendar year. For the calendar years for which we received both additional assessment notices and 2010, we believe the Commonwealth of Pennsylvania may issue additional assessments totaling approximately $1.7 million for Gross Receipt Taxes allegedly owed. Our CCPA subsidiary has alsoaudit actions, those issues have been notifiedcombined by the Commonwealth of Pennsylvania that they will conductDOR into a gross receipts auditsingle Docket for each year.
For the CCES subsidiary, the total additional tax liability calculated by the auditors for the tax years 2008-2013 is approximately $4.6 million. Audits for calendar year 2008. An appeal challenging the 2009 CCPA assessment was filed with the Department of Revenue’s Board of Appeals on September 15, 2011, and we filed a similar appeal for CCES with the Board of Appeals on November 11, 2011 challenging the 2009 CCES assessment. The Board of Appeals denied CCPA and CCES’s appeals. On November 13, 2012, CCPA and CCES filed appeals with the Commonwealth’s Board of Finance and Revenue. Theseyears 2008-2010 have been stayedfiled for appeal and have received continuance pending the outcome of present litigation in the Commonwealth Court between Verizon Pennsylvania, Inc. and the Commonwealth of Pennsylvania (Verizon Pennsylvania, Inc. v. Commonwealth, Docket No. 266 F.R. 2008). The preliminary audit findings for the calendar years 2011-2013 were received on September 16, 2014. We are waiting invoicing for each of these years, at which time we will prepare to file an appeal with the DOR.
For the CCPA subsidiary, the total additional tax liability calculated by the auditors for calendar years 2008-2013 (using the re-audited 2010 number) is approximately $6.7 million. Appeals of cases for calendar years 2008, 2009, and the original 2010 audit have been filed and have received continuance pending the outcome of present litigation in the Commonwealth of Pennsylvania (Verizon Pennsylvania, Inc. v. Commonwealth, Docket No. 266 F.R. 2008). The preliminary audit findings for the calendar years 2011-2013, as well as the re-audit of 2010 were received on September 16, 2014. We are awaiting invoicing for each of these years, at which time we will prepare to file an appeal with the DOR.
We anticipate that the outstanding audits and subsequent appeals will be continued pending the outcome of the Verizon litigation as well. The Gross Receipts Tax issues in the Verizon Pennsylvania case are substantially the same as those presently facing CCPA and CCES. In addition, there are numerous telecommunications carriers with Gross Receipts Tax matters dealing with the same issues that are in various stages of appeal before the Board of Finance and Revenue and the Commonwealth Court. Those appeals by other similarly situated telecommunications carriers have been continued until resolution of the Verizon Pennsylvania case. We believe that these assessments and the positions taken by the Commonwealth of Pennsylvania are without substantial merit. We do not believe that the outcome of these claims will have a material
F-35
CONSOLIDATED COMMUNICATIONS HOLDINGS, INC. AND SUBSIDIARIES
NOTES TO CONSOLIDATED FINANCIAL STATEMENTS (continued)
YEARS ENDED DECEMBER 31, 2012, 2011 AND 2010
adverse impact on our financial results or cash flows.
We currently provide telephone service to inmates incarcerated at facilities operated by the Illinois Department of Corrections. On June 27, 2012, the Illinois Department of Central Management Services announced its intent to replace the Company as the provider of those services with a competitor, Securus Technologies, Inc. We have challenged Securus’ bid, and the State’s decision to accept that bid, in a variety of different forums including: (i) protests with the Chief Procurement Officer of the Illinois Executive Ethics Commission, which were denied, (ii) a lawsuit filed in the Circuit Court of Sangamon County, Illinois that was dismissed, but is now under appeal in the Illinois Appellate Court Fourth District, (iii) a declaratory request ruling action filed with the Illinois Commerce Commission and (iv) a complaint filed with the Illinois Procurement Policy Board. In each of those challenges, we claimed either that Securus was not a responsible vendor, as defined by the State’s bid solicitation document, and/or that rates for the services Securus proposes to provide are subject to regulatory limits below those Securus has proposed to charge. Although we will continue to pursue legal recourse to the State’s decision, our business plans and projections assume that our contract with the State of Illinois will end during 2013.
On January 18, 2012, we filed a petition with the U.S. Court of Appeals for the District of Columbia Circuit to review the FCC’s Order issued November 18, 2011 that reformed intercarrier compensation and core parts of the Universal Service Fund. We are appealing five core issues in the November 18, 2011 FCC order. The U.S. Court of Appeals for the tenth circuit will hear oral arguments on November 19, 2013.
We are from time to time involved in various other legal proceedings and regulatory actions arising out of our operations. We do not believe that any of these, individually or in the aggregate, will have a material adverse effect upon our business, operating results or financial condition.
12. RELATED PARTY TRANSACTIONS
Capital Leases
Richard A. Lumpkin, Chairmana member of theour Board of Directors, together with his family, beneficially owned 44.7% and 41.3% of Agracel, Inc. (“Agracel”), a real estate investment company, at December 31, 20122014 and 2011.2013, respectively. Mr. Lumpkin also is a director of Agracel.
Agracel is the sole managing member and 50% owner of LATEL LLC (“LATEL”). Mr. Lumpkin and his immediate family had a 72.4% and 70.7% beneficial ownership of LATEL at December 31, 20122014 and 2011. In2013, respectively.
As of December 2010,31, 2014, we entered into newhad three capital lease agreements with LATEL for the occupancy of three previously leased buildings on a triple net lease basis. Prior to the new lease agreements, we leased five properties from LATEL which were used as office and warehouse space and were accounted for as operating leases. In 2010, we assigned one of the five leased buildings to the purchaser of our Marketing Response business upon closing. On June 30, 2011 we vacated one of the leased buildings at the end of the lease term. In accordance with the Company’s related person transactions policy, the newthese leases were approved by our Audit Committee and Board of Directors (“BOD”).
In.We have accounted for these leases as capital leases in accordance with Accounting Standards Codification (“ASC”)ASC Topic 840, Leases, we have accounted for the three leases as capital leases, and have capitalized the lower of the present value of the future minimum lease payments or their fair value. The capital lease agreements require us to pay substantially all expenses associated with general maintenance and repair, utilities, insurance, and taxes. Each of the three lease
F-42
Table of Contents
CONSOLIDATED COMMUNICATIONS HOLDINGS, INC. AND SUBSIDIARIES
NOTES TO CONSOLIDATED FINANCIAL STATEMENTS (continued)
YEARS ENDED DECEMBER 31, 2014, 2013 AND 2012
agreements have a maturity date of May 31, 2021 and each have two five-year options to extend the terms of the lease after the initial expiration date. We are required to pay LATEL approximately $7.9 million over the terms of the lease agreements. The carrying value of the capital leases at December 31, 20122014 and 20112013 was approximately $3.8$3.4 million and $4.0$3.6 million, respectively. We recognized $0.5 million in interest expense in 2014, 2013 and 2012 and 2011 andamortization expense of $0.4 million in 2014, 2013 and $0.1 million in amortization expense in 2012 and 2011, respectively, related to the capitalized leases.
Long-Term Debt
A portion of the 2020 Notes was sold to accredited investors consisting of certain members of the Company’s Board of Directors or a trust of which a director is the beneficiary (“related parties”). In May 2012, the related parties purchased $10.8 million of the 2020 Notes on the same terms available to other investors, except that the related parties were not entitled to registration rights. In September 2014, $5.0 million of the 2022 Notes were sold to a trust, the beneficiary of which is a member of the Company’s Board of Directors. We recognized rent expense of $0.2$1.3 million, $1.2 million, and $1.2$0.6 million in 20112014, 2013, and 2010,2012, respectively, in interest expense in the aggregate for the 2020 Notes.
13.QUARTERLY FINANCIAL INFORMATION (UNAUDITED)
| | Quarter Ended | |
2014 | | March 31 | | June 30 | | September 30 | | December 31 | |
| | (In thousands, except per share amounts) | |
Net revenues | | $ | 149,648 | | $ | 151,036 | | $ | 149,040 | | $ | 186,014 | |
Operating income | | $ | 25,942 | | $ | 25,425 | | $ | 24,249 | | $ | 15,573 | |
Net income (loss) attributable to common stockholders | | $ | 8,324 | | $ | 9,807 | | $ | 7,642 | | $ | (10,706) | |
Basic and diluted earnings (loss) per share | | $ | 0.20 | | $ | 0.24 | | $ | 0.19 | | $ | (0.22) | |
| | Quarter Ended | |
2013 | | March 31 | | June 30 | | September 30 | | December 31 | |
| | (In thousands, except per share amounts) | |
Net revenues | | $ | 151,528 | | $ | 151,320 | | $ | 150,773 | | $ | 147,956 | |
Operating income | | $ | 28,330 | | $ | 26,947 | | $ | 26,167 | | $ | 22,217 | |
Income from continuing operations | | $ | 6,858 | | $ | 9,560 | | $ | 10,330 | | $ | 3,216 | |
Discontinued operations, net of tax | | $ | 24 | | $ | (272) | | $ | 1,425 | | $ | - | |
Net income attributable to common stockholders | | $ | 6,783 | | $ | 9,194 | | $ | 11,694 | | $ | 3,140 | |
| | | | | | | | | |
Basic and diluted earnings (loss) per share: | | | | | | | | | |
Income from continuing operations | | $ | 0.17 | | $ | 0.23 | | $ | 0.26 | | $ | 0.08 | |
Discontinued operations, net of tax | | - | | (0.01) | | 0.03 | | - | |
Net income per basic and diluted common share attributable to common shareholders | | | | | | | | | |
| $ | 0.17 | | $ | 0.22 | | $ | 0.29 | | $ | 0.08 | |
During the fourth quarter of 2014, we acquired 100% of the issued and outstanding shares of Enventis in exchange for shares of our common stock. Enventis’ results of operations have been included in our consolidated financial statements as of the acquisition date of October 16, 2014. As result of the Enventis acquisition, we incurred transaction costs of $0.9 million, $0.7 million and $9.8 million during the quarters ended June 30, 2014, September 30, 2014 and December 31, 2014, respectively.
In connection with regard to the operating leases.repurchase of a portion of our 2020 Notes, as described in Note 6, we recognized a loss of $13.8 million on the partial extinguishment of debt during the quarter ended December 31, 2014.
As described in Note 3, in September 2013, we completed the sale of the assets and contractual rights of our prison services business for a total cash price of $2.5 million, resulting in a gain of $1.3 million, net of tax. The financial results of the operations for prison services have been reported as a discontinued operation in our consolidated financial statements for all periods presented.
14.CONDENSED CONSOLIDATING FINANCIAL INFORMATION
Consolidated Communications, Inc. is the primary obligor under the unsecured 2020 Notes it issued on May 30, 2012. We and substantially all of our subsidiaries have jointly and severally guaranteed the 2020 Notes. All of the
F-36F-43
Table of Contents
CONSOLIDATED COMMUNICATIONS HOLDINGS, INC. AND SUBSIDIARIES
NOTES TO CONSOLIDATED FINANCIAL STATEMENTS (continued)
YEARS ENDED DECEMBER 31, 2012, 20112014, 2013 AND 20102012
Banking Services
Mr. Lumpkin also has a minority ownership interest in First Mid-Illinois Bancshares, Inc. (“First Mid-Illinois”), which provides us with general banking services, including depository, disbursement, and payroll accounts and retirement plan administrative services. We provide telecommunication products and services to First Mid-Illinois at pricing which is similar to other strategic business customers. Following is a summary of the transactions between us and First Mid-Illinois for the years ended December 31:
(In thousands) | | 2012 | | 2011 | | 2010 |
Fees charged from First Mid-Illinois for: | | | | | | | |
Banking services | | $ | 16 | | $ | 4 | | $ | 8 | |
401(k) plan administration | | 1 | | 14 | | 14 | |
Interest income earned on deposits at First Mid-Illinois | | 3 | | 8 | | 8 | |
Fees charged to First Mid-Illinois for telecommunication services | | 642 | | 532 | | 455 | |
| | | | | | | | | | |
Long-Term Debt
A portion of the Senior Notes was sold to certain accredited investors consisting of the Company’s Chairman of the BOD and certain other members of the BOD, including the Company’s Chief Executive Officer (collectively “related parties”). The related parties purchased $10.8 million of the Senior Notes on same terms available to other investors, except that the related parties were not entitled to registration rights. During 2012, the Company paid $0.6 million in interest in the aggregate to the related parties for the Senior Notes.
F-37
CONSOLIDATED COMMUNICATIONS HOLDINGS, INC. AND SUBSIDIARIES
NOTES TO CONSOLIDATED FINANCIAL STATEMENTS (continued)
YEARS ENDED DECEMBER 31, 2012, 2011 AND 2010
13.BUSINESS SEGMENTS
The Company is viewed and managed as two separate, but highly integrated, reportable business segments: “Telephone Operations” and “Other Operations”. Telephone Operations consists of a wide range of telecommunications services, including local and long-distance service, high-speed broadband Internet access, video services, VOIP, custom calling features, private line services, carrier access services, network capacity services over a regional fiber optic network, mobile services and directory publishing. The financial results of SureWest are included in the Telephone Operations segment as of the date acquisition. The Company also operates two complementary non-core businesses that comprise “Other Operations”, including telephone services to correctional facilities and equipment sales. Management evaluates the performance of these business segments based upon net revenue and operating income.
(In thousands) | | 2012 | | 2011 | | 2010 |
Telephone operations | | $ | 472,060 | | | $ | 342,598 | | | $ | 349,612 | |
Other operations | | 31,397 | | | 31,665 | | | 33,754 | |
Total net revenue | | 503,457 | | | 374,263 | | | 383,366 | |
| | | | | | | | | |
Operating expense - telephone operations | | 298,205 | | | 194,580 | | | 199,077 | |
Operating expense - other operations | | 30,878 | | | 28,383 | | | 31,250 | |
Total operating expense | | 329,083 | | | 222,963 | | | 230,327 | |
| | | | | | | | | |
Depreciation and amortization - telephone operations | | 120,152 | | | 87,907 | | | 86,270 | |
Depreciation and amortization - other operations | | 824 | | | 838 | | | 872 | |
Total depreciation expense | | 120,976 | | | 88,745 | | | 87,142 | |
| | | | | | | | | |
Operating income - telephone operations | | 53,703 | | | 60,111 | | | 64,265 | |
Operating income - other operations | | (305 | ) | | 2,444 | | | 1,632 | |
Total operating income | | 53,398 | | | 62,555 | | | 65,897 | |
| | | | | | | | | |
Interest expense, net of interest income | | (72,604 | ) | | (49,394 | ) | | (50,740 | ) |
Loss on extinguishment of debt | | (4,455 | ) | | – | | | – | |
Investment income | | 30,667 | | | 27,843 | | | 27,744 | |
Other, net | | 601 | | | 823 | | | (758 | ) |
Income before taxes | | $ | 7,607 | | | $ | 41,827 | | | $ | 42,143 | |
| | | | | | | | | |
Capital expenditures: | | | | | | | | | |
Telephone operations | | $ | 76,983 | | | $ | 41,697 | | | $ | 42,748 | |
Other operations | | 112 | | | 216 | | | 169 | |
Total | | $ | 77,095 | | | $ | 41,913 | | | $ | 42,917 | |
| | | | | | | | | |
Goodwill: | | | | | | | | | |
Telephone operations | | $ | 604,988 | | | $ | 519,542 | | | $ | 519,542 | |
Other operations | | - | | | 1,020 | | | 1,020 | |
Total | | $ | 604,988 | | | $ | 520,562 | | | $ | 520,562 | |
| | | | | | | | | |
Total assets: | | | | | | | | | |
Telephone operations (1) | | $ | 1,792,585 | | | $ | 1,187,708 | | | $ | 1,201,545 | |
Other operations | | 2,243 | | | 6,361 | | | 8,001 | |
Total | | $ | 1,794,828 | | | $ | 1,194,069 | | | $ | 1,209,546 | |
(1) Included within the telephone operations segment assets are our equity method investments totaling $57.9 million, $48.3 million and $49.6 million at December 31, 2012, December 31, 2011 and December 31, 2010, respectively.
F-38
CONSOLIDATED COMMUNICATIONS HOLDINGS, INC. AND SUBSIDIARIES
NOTES TO CONSOLIDATED FINANCIAL STATEMENTS (continued)
YEARS ENDED DECEMBER 31, 2012, 2011 AND 2010
14.QUARTERLY FINANCIAL INFORMATION (UNAUDITED)
| | Quarter Ended |
2012 | | March 31 | | | June 30 | | | September 30 | | | December 31 | |
| | (In thousands, except per share amounts) |
Net revenues | | $ | 93,364 | | | $ | 93,005 | | | $ | 157,012 | | | $ | 160,076 | |
Operating income | | 11,013 | | | 14,052 | | | 9,030 | | | 19,303 | |
Net income (loss) attributable to common stockholders | | 1,759 | | | 2,786 | | | (965 | ) | | 2,060 | |
Basic and diluted earnings (loss) per share | | $ | 0.06 | | | $ | 0.09 | | | $ | (0.02 | ) | | $ | 0.05 | |
| | Quarter Ended |
2011 | | March 31 | | | June 30 | | | September 30 | | | December 31 | |
| | (In thousands, except per share amounts) |
Net revenues | | $ | 95,441 | | | $ | 92,623 | | | $ | 92,548 | | | $ | 93,651 | |
Operating income | | 16,900 | | | 14,682 | | | 15,217 | | | 15,756 | |
Net income attributable to common stockholders | | 7,365 | | | 5,351 | | | 5,818 | | | 7,876 | |
Basic and diluted earnings per share | | $ | 0.25 | | | $ | 0.18 | | | $ | 0.19 | | | $ | 0.26 | |
As described in Note 3, during the third quarter of 2012, we acquired 100% of the outstanding shares of SureWest in a cash and stock transaction. SureWest results of operations have been included in our consolidated financial statements as of the acquisition date of July 2, 2012. During the quarter ended December 31, 2012, we adjusted the preliminary purchase price allocation and updated our valuation of the real and personal property and intangible assets acquired. These adjustments to the preliminary purchase price accounting have been recorded retrospectively as of the acquisition date. As a result of the retrospective adjustments, amounts previously reported for the quarter ended September 30, 2012 have been restated as reconciled in the following table:
| | As Reported | | | Adjustments | | | As Restated | |
Net revenues | | $ | 157,012 | | | $ | - | | | $ | 157,012 | |
Operating income | | 10,078 | | | (1,048 | ) | | 9,030 | |
Net loss attributable to common stockholders | | (311 | ) | | (654 | ) | | (965 | ) |
Basic and diluted loss per share | | $ | (0.01 | ) | | $ | (0.01 | ) | | $ | (0.02 | ) |
15.CONDENSED CONSOLIDATING FINANCIAL INFORMATION
Consolidated Communications, Inc. is the primary obligor under the unsecured Senior Notes it issued on May 30, 2012. We and the following of our subsidiaries: Consolidated Communications Enterprise Services, Inc., Consolidated Communications Services Company, Consolidated Communications of Fort Bend Company, Consolidated Communications of Texas Company, Consolidated Communications of Pennsylvania Company, LLC, SureWest Communications, Inc., SureWest Broadband, SureWest Communications, SureWest Long Distance, SureWest Telephone, SureWest TeleVideo, SureWest Kansas, Inc., SureWest Kansas Holdings, Inc., SureWest Fiber Ventures, LLC, SureWest Kansas Connections, LLC, SureWest Kansas Licenses, LLC, SureWest Kansas Operations, LLC and SureWest Kansas Purchasing, LLC have jointly and severally guaranteed the Senior Notes. All of the subsidiary guarantors are 100% direct or indirect wholly owned subsidiaries of the parent, and all guarantees are full, unconditional and joint and several with respect to principal, interest and liquidated damages, if any. As such, we present condensed consolidating balance sheets as of December 31, 20122014 and 2011,2013, and condensed consolidating statements of operations and cash flows for the years ended December 31, 2012, 20112014, 2013 and 20102012 for each of Consolidated Communications Holdings, Inc. (Parent), Consolidated Communications, Inc. (Subsidiary Issuer), guarantor subsidiaries and other non-guarantor subsidiaries with any consolidating adjustments. See Note 6 for more information regarding our Senior2020 Notes.
F-39
CONSOLIDATED COMMUNICATIONS HOLDINGS, INC. AND SUBSIDIARIES
NOTES TO CONSOLIDATED FINANCIAL STATEMENTS (continued)
YEARS ENDED DECEMBER 31, 2012, 2011 AND 2010
Condensed Consolidating Balance Sheets
(amounts in thousands)
| | December 31, 2012 | | | December 31, 2014 | |
| | Parent | | | Subsidiary
Issuer | | | Guarantors | | | Non-Guarantors | | | Eliminations | | | Consolidated | | | Parent | | Subsidiary
Issuer | | Guarantors | | Non-Guarantors | | Eliminations | | Consolidated | |
ASSETS | | | | | | | | | | | | | | | | | | | | | | | | | | | | | | | |
Current assets: | | | | | | | | | | | | | | | | | | | | | | | | | | | | | | | |
Cash and cash equivalents | | $ | - | | | $ | 6,577 | | | $ | 8,530 | | | $ | 2,747 | | | $ | - | | | $ | 17,854 | | | $ | - | | $ | 4,940 | | $ | 820 | | $ | 919 | | $ | - | | $ | 6,679 | |
Accounts receivable, net | | 19 | | | 457 | | | 50,108 | | | 7,998 | | | - | | | 58,582 | | | - | | - | | 70,543 | | 6,993 | | - | | 77,536 | |
Income taxes receivable | | 4,258 | | | - | | | 7,685 | | | (124 | ) | | - | | | 11,819 | | | 12,665 | | - | | 6,232 | | 43 | | - | | 18,940 | |
Deferred income taxes | | (51 | ) | | (310 | ) | | 8,985 | | | 376 | | | - | | | 9,000 | | | (71) | | 158 | | 12,807 | | 480 | | - | | 13,374 | |
Prepaid expenses and other current assets | | - | | | - | | | 10,855 | | | 414 | | | - | | | 11,269 | | | - | | - | | 17,285 | | 331 | | - | | 17,616 | |
Total current assets | | 4,226 | | | 6,724 | | | 86,163 | | | 11,411 | | | - | | | 108,524 | | | 12,594 | | 5,098 | | 107,687 | | 8,766 | | - | | 134,145 | |
| | | | | | | | | | | | | | | | | | | | | | | | | | | | | | | |
Property, plant and equipment, net | | - | | | - | | | 855,722 | | | 52,514 | | | - | | | 908,236 | | | - | | - | | 1,086,051 | | 49,282 | | - | | 1,135,333 | |
| | | | | | | | | | | | | | | | | | | | | | | | | | | | | | | |
Intangibles and other assets: | | | | | | | | | | | | | | | | | | | | | | | | | | | | | | | |
Investments | | 1,459,656 | | | 372,735 | | | 109,735 | | | 15 | | | (1,832,391 | ) | | 109,750 | | | - | | 3,724 | | 111,652 | | - | | - | | 115,376 | |
Investments in subsidiaries | | | 2,119,335 | | 1,510,416 | | 13,000 | | - | | (3,642,751) | | - | |
Goodwill | | - | | | - | | | 538,807 | | | 66,181 | | | - | | | 604,988 | | | - | | - | | 699,625 | | 66,181 | | - | | 765,806 | |
Other intangible assets | | - | | | - | | | 40,443 | | | 9,087 | | | - | | | 49,530 | | | - | | - | | 41,205 | | 9,087 | | - | | 50,292 | |
Deferred debt issuance costs, net and other assets | | - | | | 12,788 | | | 1,012 | | | - | | | - | | | 13,800 | | | - | | 15,421 | | 3,892 | | - | | - | | 19,313 | |
Total assets | | $ | 1,463,882 | | | $ | 392,247 | | | $ | 1,631,882 | | | $ | 139,208 | | | $ | (1,832,391 | ) | | $ | 1,794,828 | | | $ | 2,131,929 | | $ | 1,534,659 | | $ | 2,063,112 | | $ | 133,316 | | $ | (3,642,751) | | $ | 2,220,265 | |
| | | | | | | | | | | | | | | | | | | | | | | | | | | | | | | |
LIABILITIES AND SHAREHOLDERS’ EQUITY | | | | | | | | | | | | | | | | | | | | | | | | | | | | | | | |
Current liabilities: | | | | | | | | | | | | | | | | | | | | | | | | | | | | | | | |
Accounts payable | | $ | 223 | | | $ | 430 | | | $ | 16,411 | | | $ | 2,098 | | | $ | - | | | $ | 19,162 | | | $ | - | | $ | - | | $ | 15,277 | | $ | - | | $ | - | | $ | 15,277 | |
Advance billings and customer deposits | | - | | | - | | | 26,069 | | | 2,523 | | | - | | | 28,592 | | | - | | - | | 30,250 | | 1,683 | | - | | 31,933 | |
Dividends payable | | 15,463 | | | - | | | - | | | - | | | - | | | 15,463 | | | 19,510 | | - | | - | | - | | - | | 19,510 | |
Accrued compensation | | 36 | | | - | | | 19,919 | | | 2,013 | | | - | | | 21,968 | | | - | | - | | 30,737 | | 1,844 | | - | | 32,581 | |
Accrued interest | | | - | | 6,775 | | 6 | | 3 | | - | | 6,784 | |
Accrued expense | | 12 | | | 2,943 | | | 41,431 | | | 1,846 | | | - | | | 46,232 | | | 36 | | - | | 38,211 | | 1,451 | | - | | 39,698 | |
Current portion of long term debt and capital lease obligations | | - | | | 9,242 | | | 300 | | | 54 | | | - | | | 9,596 | | |
Current portion of long term debt and capital | | | | | | | | | | | | | | |
lease obligations | | | - | | 9,100 | | 671 | | 78 | | - | | 9,849 | |
Current portion of derivative liability | | - | | | 3,164 | | | - | | | - | | | - | | | 3,164 | | | - | | 443 | | - | | - | | - | | 443 | |
Total current liabilities | | 15,734 | | | 15,779 | | | 104,130 | | | 8,534 | | | - | | | 144,177 | | | 19,546 | | 16,318 | | 115,152 | | 5,059 | | - | | 156,075 | |
| | | | | | | | | | | | | | | | | | | | | | | | | | | | | | | |
Long-term debt and capital lease obligations | | - | | | 1,203,760 | | | 3,611 | | | 877 | | | - | | | 1,208,248 | | | - | | 1,352,949 | | 3,070 | | 734 | | - | | 1,356,753 | |
Advances due to/from affiliates, net | | 1,367,914 | | | (1,760,026 | ) | | 411,411 | | | (19,299 | ) | | - | | | - | | | 1,805,129 | | (1,953,695) | | 206,616 | | (58,050) | | - | | - | |
Deferred income taxes | | (2,357 | ) | | (3,571 | ) | | 135,891 | | | 8,879 | | | - | | | 138,842 | | | (14,833) | | (938) | | 240,338 | | 19,009 | | - | | 243,576 | |
Pension and postretirement benefit obligations | | - | | | - | | | 125,706 | | | 31,004 | | | - | | | 156,710 | | | - | | - | | 100,225 | | 22,142 | | - | | 122,367 | |
Other long-term liabilities | | - | | | 3,919 | | | 6,587 | | | 240 | | | - | | | 10,746 | | | - | | 690 | | 13,339 | | 552 | | - | | 14,581 | |
Total liabilities | | 1,381,291 | | | (540,139 | ) | | 787,336 | | | 30,235 | | | - | | | 1,658,723 | | | 1,809,842 | | (584,676) | | 678,740 | | (10,554) | | - | | 1,893,352 | |
| | | | | | | | | | | | | | | | | | | | | | | | | | | | | | | |
Shareholders’ equity: | | | | | | | | | | | | | | | | | | | | | | | | | | | | | | | |
Common Stock | | 399 | | | - | | | 568,960 | | | 30,000 | | | (598,960 | ) | | 399 | | | 504 | | - | | 17,411 | | 30,000 | | (47,411) | | 504 | |
Other shareholders’ equity | | 82,192 | | | 932,386 | | | 271,411 | | | 78,973 | | | (1,233,431 | ) | | 131,531 | | | 321,583 | | 2,119,335 | | 1,362,135 | | 113,870 | | (3,595,340) | | 321,583 | |
Total Consolidated Communications Holdings, Inc. shareholders’ equity | | 82,591 | | | 932,386 | | | 840,371 | | | 108,973 | | | (1,832,391 | ) | | 131,930 | | |
Total Consolidated Communications Holdings, Inc. | | | | | | | | | | | | | | |
shareholders’ equity | | | 322,087 | | 2,119,335 | | 1,379,546 | | 143,870 | | (3,642,751) | | 322,087 | |
Noncontrolling interest | | - | | | - | | | 4,175 | | | - | | | - | | | 4,175 | | | - | | - | | 4,826 | | - | | - | | 4,826 | |
Total shareholders’ equity | | 82,591 | | | 932,386 | | | 844,546 | | | 108,973 | | | (1,832,391 | ) | | 136,105 | | | 322,087 | | 2,119,335 | | 1,384,372 | | 143,870 | | (3,642,751) | | 326,913 | |
Total liabilities and shareholders’ equity | | $ | 1,463,882 | | | $ | 392,247 | | | $ | 1,631,882 | | | $ | 139,208 | | | $ | (1,832,391 | ) | | $ | 1,794,828 | | | $ | 2,131,929 | | $ | 1,534,659 | | $ | 2,063,112 | | $ | 133,316 | | $ | (3,642,751) | | $ | 2,220,265 | |
F-40F-44
Table of Contents
CONSOLIDATED COMMUNICATIONS HOLDINGS, INC. AND SUBSIDIARIES
NOTES TO CONSOLIDATED FINANCIAL STATEMENTS (continued)
YEARS ENDED DECEMBER 31, 2012, 20112014, 2013 AND 20102012
| | December 31, 2011 | | | December 31, 2013 | |
| | Parent | | | Subsidiary
Issuer | | | Guarantors | | | Non-Guarantors | | | Eliminations | | | Consolidated | | | Parent | | Subsidiary
Issuer | | Guarantors | | Non-Guarantors | | Eliminations | | Consolidated | |
ASSETS | | | | | | | | | | | | | | | | | | | | | | | | | | | | | | | |
Current assets: | | | | | | | | | | | | | | | | | | | | | | | | | | | | | | | |
Cash and cash equivalents | | $ | - | | | $ | 103,369 | | | $ | 80 | | | $ | 2,255 | | | $ | - | | | $ | 105,704 | | | $ | - | | $ | 86 | | $ | 2,366 | | $ | 3,099 | | $ | - | | $ | 5,551 | |
Accounts receivable, net | | 19 | | | 457 | | | 27,014 | | | 8,002 | | | - | | | 35,492 | | | - | | 502 | | 44,521 | | 7,010 | | - | | 52,033 | |
Income taxes receivable | | 7,329 | | | - | | | 1,387 | | | 272 | | | - | | | 8,988 | | | 9,346 | | - | | 370 | | 80 | | - | | 9,796 | |
Deferred income taxes | | (39 | ) | | 18 | | | 4,315 | | | 531 | | | - | | | 4,825 | | | (61) | | (7) | | 7,533 | | 495 | | - | | 7,960 | |
Prepaid expenses and other current assets | | - | | | - | | | 6,481 | | | 460 | | | - | | | 6,941 | | | - | | - | | 11,862 | | 518 | | - | | 12,380 | |
Total current assets | | 7,309 | | | 103,844 | | | 39,277 | | | 11,520 | | | - | | | 161,950 | | | 9,285 | | 581 | | 66,652 | | 11,202 | | - | | 87,720 | |
| | | | | | | | | | | | | | | | | | | | | | | | | | | | | | | |
Property, plant and equipment, net | | - | | | - | | | 281,633 | | | 56,793 | | | - | | | 338,426 | | | - | | - | | 834,199 | | 51,163 | | - | | 885,362 | |
| | | | | | | | | | | | | | | | | | | | | | | | | | | | | | | |
Intangibles and other assets: | | | | | | | | | | | | | | | | | | | | | | | | | | | | | | | |
Investments | | 917,208 | | | 362,957 | | | 98,054 | | | 15 | | | (1,280,165 | ) | | 98,069 | | | - | | 3,729 | | 109,370 | | - | | - | | 113,099 | |
Investments in subsidiaries | | | 1,101,039 | | 335,659 | | 12,130 | | - | | (1,448,828) | | - | |
Goodwill | | - | | | - | | | 454,381 | | | 66,181 | | | - | | | 520,562 | | | - | | - | | 537,265 | | 66,181 | | - | | 603,446 | |
Other intangible assets | | - | | | - | | | 58,178 | | | 11,980 | | | - | | | 70,158 | | | - | | - | | 30,997 | | 9,087 | | - | | 40,084 | |
Deferred debt issuance costs, net and other assets | | - | | | 4,833 | | | 71 | | | - | | | - | | | 4,904 | | | - | | 13,620 | | 4,047 | | - | | - | | 17,667 | |
Total assets | | $ | 924,517 | | | $ | 471,634 | | | $ | 931,594 | | | $ | 146,489 | | | $ | (1,280,165 | ) | | $ | 1,194,069 | | | $ | 1,110,324 | | $ | 353,589 | | $ | 1,594,660 | | $ | 137,633 | | $ | (1,448,828) | | $ | 1,747,378 | |
| | | | | | | | | | | | | | | | | | | | | | | | | | | | | | | |
LIABILITIES AND SHAREHOLDERS’ EQUITY | | | | | | | | | | | | | | | | | | | | | | | | | | | | | | | |
Current liabilities: | | | | | | | | | | | | | | | | | | | | | | | | | | | | | | | |
Accounts payable | | $ | - | | | $ | - | | | $ | 5,790 | | | $ | 861 | | | $ | - | | | $ | 6,651 | | | $ | - | | $ | - | | $ | 4,885 | | $ | - | | $ | - | | $ | 4,885 | |
Advance billings and customer deposits | | - | | | - | | | 17,797 | | | 2,527 | | | - | | | 20,324 | | | - | | - | | 23,699 | | 2,235 | | - | | 25,934 | |
Dividends payable | | 11,571 | | | - | | | - | | | - | | | - | | | 11,571 | | | 15,520 | | - | | - | | - | | - | | 15,520 | |
Accrued compensation | | 38 | | | - | | | 10,734 | | | 2,042 | | | | | | 12,814 | | | - | | - | | 20,447 | | 1,805 | | - | | 22,252 | |
Accrued interest | | | - | | 3,514 | | 6 | | 4 | | - | | 3,524 | |
Accrued expense | | - | | | 215 | | | 19,155 | | | 1,988 | | | - | | | 21,358 | | | 224 | | 875 | | 32,703 | | 1,371 | | - | | 35,173 | |
Current portion of long term debt and capital lease obligations | | - | | | 8,800 | | | 147 | | | 45 | | | - | | | 8,992 | | | - | | 9,100 | | 586 | | 65 | | - | | 9,751 | |
Current portion of derivative liability | | - | | | 3,580 | | | - | | | - | | | - | | | 3,580 | | | - | | 660 | | - | | - | | - | | 660 | |
Total current liabilities | | 11,609 | | | 12,595 | | | 53,623 | | | 7,463 | | | - | | | 85,290 | | | 15,744 | | 14,149 | | 82,326 | | 5,480 | | - | | 117,699 | |
| | | | | | | | | | | | | | | | | | | | | | | | | | | | | | | |
Long-term debt and capital lease obligations | | - | | | 871,200 | | | 3,588 | | | 931 | | | - | | | 875,719 | | | - | | 1,207,663 | | 3,659 | | 812 | | - | | 1,212,134 | |
Advances due to/from affiliates, net | | 872,537 | | | (1,335,897 | ) | | 465,854 | | | (2,494 | ) | | - | | | - | | | 968,319 | | (1,970,192) | | 1,037,969 | | (36,096) | | - | | - | |
Deferred income taxes | | (1,948 | ) | | (5,872 | ) | | 74,697 | | | 10,450 | | | - | | | 77,327 | | | (21,598) | | (1,029) | | 184,209 | | 18,277 | | - | | 179,859 | |
Pension and postretirement benefit obligations | | - | | | - | | | 65,899 | | | 27,855 | | | - | | | 93,754 | | | - | | - | | 61,053 | | 14,701 | | - | | 75,754 | |
Other long-term liabilities | | - | | | 12,401 | | | 1,494 | | | 272 | | | | | | 14,167 | | | 25 | | 1,960 | | 7,328 | | 280 | | - | | 9,593 | |
Total liabilities | | 882,198 | | | (445,573 | ) | | 665,155 | | | 44,477 | | | - | | | 1,146,257 | | | 962,490 | | (747,449) | | 1,376,544 | | 3,454 | | - | | 1,595,039 | |
| | | | | | | | | | | | | | | | | | | | | | | | | | | | | | | |
Shareholders’ equity: | | | | | | | | | | | | | | | | | | | | | | | | | | | | | | | |
Common Stock | | 299 | | | - | | | 18,163 | | | 30,000 | | | (48,163 | ) | | 299 | | | 401 | | - | | 17,411 | | 30,000 | | (47,411) | | 401 | |
Other shareholders’ equity | | 42,020 | | | 917,207 | | | 242,782 | | | 72,012 | | | (1,232,002 | ) | | 42,019 | | | 147,433 | | 1,101,038 | | 196,200 | | 104,179 | | (1,401,417) | | 147,433 | |
Total Consolidated Communications Holdings, Inc. shareholders’ equity | | 42,319 | | | 917,207 | | | 260,945 | | | 102,012 | | | (1,280,165 | ) | | 42,318 | | | 147,834 | | 1,101,038 | | 213,611 | | 134,179 | | (1,448,828) | | 147,834 | |
Noncontrolling interest | | - | | | - | | | 5,494 | | | - | | | - | | | 5,494 | | | - | | - | | 4,505 | | - | | - | | 4,505 | |
Total shareholders’ equity | | 42,319 | | | 917,207 | | | 266,439 | | | 102,012 | | | (1,280,165 | ) | | 47,812 | | | 147,834 | | 1,101,038 | | 218,116 | | 134,179 | | (1,448,828) | | 152,339 | |
Total liabilities and shareholders’ equity | | $ | 924,517 | | | $ | 471,634 | | | $ | 931,594 | | | $ | 146,489 | | | $ | (1,280,165 | ) | | $ | 1,194,069 | | | $ | 1,110,324 | | $ | 353,589 | | $ | 1,594,660 | | $ | 137,633 | | $ | (1,448,828) | | $ | 1,747,378 | |
F-41F-45
Table of Contents
CONSOLIDATED COMMUNICATIONS HOLDINGS, INC. AND SUBSIDIARIES
NOTES TO CONSOLIDATED FINANCIAL STATEMENTS (continued)
YEARS ENDED DECEMBER 31, 2012, 20112014, 2013 AND 20102012
Condensed Consolidating Statements of Operations
(amounts in thousands)
| | Year Ended December 31, 2012 | | | Year Ended December 31, 2014 | |
| | Parent | | | Subsidiary
Issuer | | | Guarantors | | | Non-Guarantors | | | Eliminations | | | Consolidated | | | Parent | | Subsidiary
Issuer | | Guarantors | | Non-Guarantors | | Eliminations | | Consolidated | |
Net revenues | | $ | - | | | $ | (15 | ) | | $ | 448,883 | | | $ | 68,774 | | | $ | (14,185 | ) | | $ | 503,457 | | | $ | - | | $ | (7) | | $ | 585,148 | | $ | 64,380 | | $ | (13,783) | | $ | 635,738 | |
Operating expenses: | | | | | | | | | | | | | | | | | | | | | | | | | | | | | | | |
Cost of services and products (exclusive of depreciation and amortization) | | - | | | - | | | 193,573 | | | 14,355 | | | (14,185 | ) | | 193,743 | | | - | | - | | 242,354 | | 13,391 | | (13,084) | | 242,661 | |
Selling, general and administrative expenses | | 13,800 | | | 385 | | | 80,848 | | | 16,584 | | | - | | | 111,617 | | | 3,975 | | 126 | | 119,649 | | 17,585 | | (699) | | 140,636 | |
Financing and other transaction costs | | 11,269 | | | 9,531 | | | - | | | - | | | - | | | 20,800 | | | 10,808 | | 581 | | 428 | | - | | - | | 11,817 | |
Impairment of intangible assets | | - | | | - | | | 2,923 | | | - | | | - | | | 2,923 | | |
Depreciation and amortization | | - | | | - | | | 107,708 | | | 13,268 | | | - | | | 120,976 | | | - | | - | | 141,673 | | 7,762 | | - | | 149,435 | |
Operating income (loss) | | (25,069 | ) | | (9,931 | ) | | 63,831 | | | 24,567 | | | - | | | 53,398 | | | (14,783) | | (714) | | 81,044 | | 25,642 | | - | | 91,189 | |
Other income (expense): | | | | | | | | | | | | | | | | | | | | | | | | | | | | | | | |
Interest expense, net of interest income | | (20 | ) | | (71,704 | ) | | (816 | ) | | (64 | ) | | - | | | (72,604 | ) | | 36 | | (82,617) | | 55 | | (11) | | - | | (82,537) | |
Intercompany interest income (expense) | | (50,126 | ) | | 87,717 | | | (37,509 | ) | | (82 | ) | | | | | - | | | (108,366) | | 125,932 | | (19,677) | | 2,111 | | - | | - | |
Loss on extinguishment of debt | | - | | | (4,455 | ) | | - | | | - | | | - | | | (4,455 | ) | | - | | (13,785) | | - | | - | | - | | (13,785) | |
Investment income | | - | | | 246 | | | 30,421 | | | - | | | - | | | 30,667 | | | - | | (5) | | 34,521 | | - | | - | | 34,516 | |
Equity in earnings of subsidiaries, net | | | 94,458 | | 77,156 | | 870 | | - | | (172,484) | | - | |
Other, net | | - | | | 1 | | | 617 | | | (17 | ) | | - | | | 601 | | | 53 | | (553) | | (236) | | (232) | | - | | (968) | |
Income (loss) before income taxes | | (75,215 | ) | | 1,874 | | | 56,544 | | | 24,404 | | | - | | | 7,607 | | |
Income (loss) from continuing operations before income taxes | | | (28,602) | | 105,414 | | 96,577 | | 27,510 | | (172,484) | | 28,415 | |
Income tax expense (benefit) | | (20,643 | ) | | 1,204 | | | 12,014 | | | 8,861 | | | - | | | 1,436 | | | (43,669) | | 10,956 | | 35,022 | | 10,718 | | - | | 13,027 | |
Net income (loss) | | (54,572 | ) | | 670 | | | 44,530 | | | 15,543 | | | - | | | 6,171 | | | 15,067 | | 94,458 | | 61,555 | | 16,792 | | (172,484) | | 15,388 | |
Less: net income attributable to noncontrolling interest | | - | | | - | | | 531 | | | - | | | - | | | 531 | | | - | | - | | 321 | | - | | - | | 321 | |
Net income (loss) attributable to Consolidated Communications Holdings, Inc. | | $ | (54,572 | ) | | $ | 670 | | | $ | 43,999 | | | $ | 15,543 | | | $ | - | | | $ | 5,640 | | | $ | 15,067 | | $ | 94,458 | | $ | 61,234 | | $ | 16,792 | | $ | (172,484) | | $ | 15,067 | |
| | | | | | | | | | | | | | |
Total comprehensive income (loss) attributable to common shareholders | | $ | (54,572 | ) | | $ | 5,648 | | | $ | 34,651 | | | $ | 11,962 | | | $ | - | | | $ | (2,311 | ) | | $ | (19,489) | | $ | 59,902 | | $ | 39,502 | | $ | 2,780 | | $ | (102,184) | | $ | (19,489) | |
| | Year Ended December 31, 2011 | | | Year Ended December 31, 2013 | |
| | Parent | | | Subsidiary
Issuer | | | Guarantors | | | Non-Guarantors | | | Eliminations | | | Consolidated | | | Parent | | Subsidiary
Issuer | | Guarantors | | Non-Guarantors | | Eliminations | | Consolidated | |
Net revenues | | $ | - | | | $ | 25 | | | $ | 316,760 | | | $ | 71,249 | | | $ | (13,771 | ) | | $ | 374,263 | | | $ | - | | $ | (60) | | $ | 547,635 | | $ | 68,128 | | $ | (14,126) | | $ | 601,577 | |
Operating expenses: | | | | | | | | | | | | | | | | | | | | | | | | | | | | | | | |
Cost of services and products (exclusive of depreciation and amortization) | | - | | | - | | | 138,303 | | | 14,732 | | | (13,771 | ) | | 139,264 | | | - | | - | | 220,764 | | 14,635 | | (12,947) | | 222,452 | |
Selling, general and administrative expenses | | 2,249 | | | 2,724 | | | 60,003 | | | 16,074 | | | - | | | 81,050 | | | 3,608 | | 167 | | 113,942 | | 18,876 | | (1,179) | | 135,414 | |
Financing and other transaction costs | | - | | | - | | | 2,649 | | | - | | | - | | | 2,649 | | | 457 | | - | | 319 | | - | | - | | 776 | |
Depreciation and amortization | | - | | | - | | | 73,654 | | | 15,091 | | | - | | | 88,745 | | | - | | - | | 130,455 | | 8,819 | | - | | 139,274 | |
Operating income (loss) | | (2,249 | ) | | (2,699 | ) | | 42,151 | | | 25,352 | | | - | | | 62,555 | | | (4,065) | | (227) | | 82,155 | | 25,798 | | - | | 103,661 | |
Other income (expense): | | | | | | | | | | | | | | | | | | | | | | | | | | | | | | | |
Interest expense, net of interest income | | - | | | (48,095 | ) | | (1,133 | ) | | (166 | ) | | - | | | (49,394 | ) | | 100 | | (86,090) | | 181 | | 42 | | - | | (85,767) | |
Intercompany interest income (expense) | | (40,283 | ) | | 80,142 | | | (39,407 | ) | | (452 | ) | | | | | - | | | (103,588) | | 126,918 | | (24,662) | | 1,332 | | - | | - | |
Loss on extinguishment of debt | | | - | | (7,657) | | - | | - | | - | | (7,657) | |
Investment income | | - | | | 246 | | | 27,597 | | | - | | | - | | | 27,843 | | | - | | 89 | | 37,606 | | - | | - | | 37,695 | |
Equity in earnings of subsidiaries, net | | | 98,055 | | 74,479 | | 896 | | - | | (173,430) | | - | |
Other, net | | - | | | - | | | 2,097 | | | (1,274 | ) | | - | | | 823 | | | (18) | | - | | (448) | | 10 | | - | | (456) | |
Income (loss) before income taxes | | (42,532 | ) | | 29,594 | | | 31,305 | | | 23,460 | | | - | | | 41,827 | | |
Income (loss) from continuing operations before income taxes | | | (9,516) | | 107,512 | | 95,728 | | 27,182 | | (173,430) | | 47,476 | |
Income tax expense (benefit) | | (15,725 | ) | | 10,776 | | | 10,923 | | | 8,871 | | | - | | | 14,845 | | | (40,327) | | 9,457 | | 38,038 | | 10,344 | | - | | 17,512 | |
Income (loss) from continuing operations | | | 30,811 | | 98,055 | | 57,690 | | 16,838 | | (173,430) | | 29,964 | |
Discontinued operations, net of tax | | | - | | - | | 1,177 | | - | | - | | 1,177 | |
Net income (loss) | | (26,807 | ) | | 18,818 | | | 20,382 | | | 14,589 | | | - | | | 26,982 | | | 30,811 | | 98,055 | | 58,867 | | 16,838 | | (173,430) | | 31,141 | |
Less: net income attributable to noncontrolling interest | | - | | | - | | | 572 | | | - | | | - | | | 572 | | | - | | - | | 330 | | - | | - | | 330 | |
Net income (loss) attributable to Consolidated Communications Holdings, Inc. | | $ | (26,807 | ) | | $ | 18,818 | | | $ | 19,810 | | | $ | 14,589 | | | $ | - | | | $ | 26,410 | | | $ | 30,811 | | $ | 98,055 | | $ | 58,537 | | $ | 16,838 | | $ | (173,430) | | $ | 30,811 | |
| | | | | | | | | | | | | | |
Total comprehensive income (loss) attributable to common shareholders | | $ | (26,807 | ) | | $ | 26,415 | | | $ | 10,288 | | | $ | 10,152 | | | $ | - | | | $ | 20,048 | | | $ | 30,811 | | $ | 101,616 | | $ | 91,395 | | $ | 25,203 | | $ | (173,430) | | $ | 75,595 | |
F-42F-46
Table of Contents
CONSOLIDATED COMMUNICATIONS HOLDINGS, INC. AND SUBSIDIARIES
NOTES TO CONSOLIDATED FINANCIAL STATEMENTS (continued)
YEARS ENDED DECEMBER 31, 2012, 20112014, 2013 AND 20102012
| | Year Ended December 31, 2010 | | | Year Ended December 31, 2012 |
| | Parent | | | Subsidiary
Issuer | | | Guarantors | | | Non-Guarantors | | | Eliminations | | | Consolidated | | | Parent | | Subsidiary
Issuer | | Guarantors | | Non-Guarantors | | Eliminations | | Consolidated |
Net revenues | | $ | - | | | $ | 4 | | | $ | 322,764 | | | $ | 74,531 | | | $ | (13,933 | ) | | $ | 383,366 | | | $ | - | | $ | (15) | | $ | 423,303 | | $ | 68,774 | | $ | (14,185) | | $ | 477,877 |
Operating expenses: | | | | | | | | | | | | | | | | | | | | | | | | | | | | | | |
Cost of services and products (exclusive of depreciation and amortization) | | - | | | - | | | 139,610 | | | 16,625 | | | (13,933 | ) | | 142,302 | | | - | | - | | 175,759 | | 14,355 | | (14,185) | | 175,929 |
Selling, general and administrative expenses | | 2,699 | | | 119 | | | 65,289 | | | 19,918 | | | - | | | 88,025 | | | 2,530 | | 385 | | 88,664 | | 16,584 | | - | | 108,163 |
Financing and other transaction costs | | | 11,269 | | 9,531 | | - | | - | | - | | 20,800 |
Intangible assets impairment | | | - | | - | | 1,236 | | - | | - | | 1,236 |
Depreciation and amortization | | - | | | - | | | 71,522 | | | 15,620 | | | - | | | 87,142 | | | - | | - | | 107,064 | | 13,268 | | - | | 120,332 |
Operating income (loss) | | (2,699 | ) | | (115 | ) | | 46,343 | | | 22,368 | | | - | | | 65,897 | | | (13,799) | | (9,931) | | 50,580 | | 24,567 | | - | | 51,417 |
Other income (expense): | | | | | | | | | | | | | | | | | | | | | | | | | | | | | | |
Interest expense, net of interest income | | 973 | | | (50,804 | ) | | (949 | ) | | 40 | | | - | | | (50,740 | ) | | (20) | | (71,704) | | (816) | | (64) | | - | | (72,604) |
Intercompany interest income (expense) | | (39,878 | ) | | 82,364 | | | (41,074 | ) | | (1,412 | ) | | | | | - | | | (50,126) | | 87,717 | | (37,509) | | (82) | | - | | - |
Loss on extinguishment of debt | | | - | | (4,455) | | - | | - | | - | | (4,455) |
Investment income | | - | | | 246 | | | 27,498 | | | - | | | - | | | 27,744 | | | - | | 246 | | 30,421 | | - | | - | | 30,667 |
Equity in earnings of subsidiaries, net | | | 48,942 | | 48,272 | | 1,435 | | - | | (98,649) | | - |
Other, net | | - | | | 3 | | | (974 | ) | | 213 | | | - | | | (758 | ) | | - | | 1 | | 617 | | (17) | | - | | 601 |
Income (loss) before income taxes | | (41,604 | ) | | 31,694 | | | 30,844 | | | 21,209 | | | - | | | 42,143 | | |
Income (loss) from continuing operations before income taxes | | | (15,003) | | 50,146 | | 44,728 | | 24,404 | | (98,649) | | 5,626 |
Income tax expense (benefit) | | (20,814 | ) | | 11,641 | | | 10,853 | | | 7,311 | | | - | | | 8,991 | | | (20,643) | | 1,204 | | 11,239 | | 8,861 | | - | | 661 |
Income (loss) from continuing operations | | | 5,640 | | 48,942 | | 33,489 | | 15,543 | | (98,649) | | 4,965 |
Discontinued operations, net of tax | | | - | | - | | 1,206 | | - | | - | | 1,206 |
Net income (loss) | | (20,790 | ) | | 20,053 | | | 19,991 | | | 13,898 | | | - | | | 33,152 | | | 5,640 | | 48,942 | | 34,695 | | 15,543 | | (98,649) | | 6,171 |
Less: net income attributable to noncontrolling interest | | - | | | - | | | 557 | | | - | | | - | | | 557 | | | - | | - | | 531 | | - | | - | | 531 |
Net income (loss) attributable to Consolidated Communications Holdings, Inc. | | $ | (20,790 | ) | | $ | 20,053 | | | $ | 19,434 | | | $ | 13,898 | | | $ | - | | | $ | 32,595 | | | $ | 5,640 | | $ | 48,942 | | $ | 34,164 | | $ | 15,543 | | $ | (98,649) | | $ | 5,640 |
| | | | | | | | | | | | | |
Total comprehensive income (loss) attributable to common shareholders | | $ | (20,790 | ) | | $ | 22,550 | | | $ | 20,919 | | | $ | 13,985 | | | $ | - | | | $ | 36,664 | | | $ | 5,640 | | $ | 53,920 | | $ | 24,816 | | $ | 11,962 | | $ | (98,649) | | $ | (2,311) |
F-43
CONSOLIDATED COMMUNICATIONS HOLDINGS, INC. AND SUBSIDIARIES
NOTES TO CONSOLIDATED FINANCIAL STATEMENTS (continued)
YEARS ENDED DECEMBER 31, 2012, 2011 AND 2010
Condensed Consolidating Statements of Cash Flows
(amounts in thousands)
| | Year Ended December 31, 2012 | | | Year Ended December 31, 2014 | |
| | Parent | | | Subsidiary
Issuer | | | Guarantors | | | Non-Guarantors | | | Consolidated | | | Parent | | Subsidiary
Issuer | | Guarantors | | Non-Guarantors | | Consolidated | |
Net cash provided by (used in) operating activates | | $ | (52,318 | ) | | $ | 13,106 | | | $ | 140,869 | | | $ | 21,558 | | | $ | 123,215 | | |
Net cash (used in) provided by operating activities | | | $ | (71,646) | | $ | 37,972 | | $ | 196,186 | | $ | 25,273 | | $ | 187,785 | |
| | | | | | | | | | | | | | | | | | | | | | | | | | |
Cash flows from investing activities: | | | | | | | | | | | | | | | | | | | | | | | | | | |
Business acquisition, net of cash acquired | | (385,346 | ) | | - | | | - | | | - | | | (385,346 | ) | | (139,558) | | - | | - | | - | | (139,558) | |
Purchases of property, plant and equipment | | - | | | - | | | (71,045 | ) | | (6,050 | ) | | (77,095 | ) | | - | | - | | (103,509) | | (5,489) | | (108,998) | |
Purchase of investments | | - | | | - | | | (6,728 | ) | | | | | (6,728 | ) | | - | | - | | (100) | | - | | (100) | |
Proceeds from sale of assets | | - | | | - | | | 882 | | | 42 | | | 924 | | | - | | - | | 1,740 | | 55 | | 1,795 | |
Other | | (314 | ) | | - | | | - | | | | | | (314 | ) | |
Net cash used in investing activities | | (385,660 | ) | | - | | | (76,891 | ) | | (6,008 | ) | | (468,559 | ) | | (139,558) | | - | | (101,869) | | (5,434) | | (246,861) | |
| | | | | | | | | | | | | | | | | | | | | | | | | | |
Cash flows from financing activities: | | | | | | | | | | | | | | | | | | | | | | | | | | |
Proceeds from bond offering | | - | | | 298,035 | | | - | | | - | | | 298,035 | | |
Proceeds on bond offering | | | - | | 200,000 | | - | | - | | 200,000 | |
Proceeds from issuance of long-term debt | | - | | | 544,850 | | | - | | | - | | | 544,850 | | | - | | 80,000 | | - | | - | | 80,000 | |
Payment of capital lease obligation | | - | | | - | | | (183 | ) | | (45 | ) | | (228 | ) | | - | | - | | (638) | | (65) | | (703) | |
Payment on long-term debt | | - | | | (510,038 | ) | | - | | | - | | | (510,038 | ) | | - | | (63,100) | | - | | - | | (63,100) | |
Partial redemption of senior notes | | | | | (84,127) | | | | | | (84,127) | |
Payment of financing costs | | - | | | (18,616 | ) | | - | | | - | | | (18,616 | ) | | - | | (7,438) | | - | | - | | (7,438) | |
Distribution to noncontrolling interest | | - | | | - | | | 3,150 | | | (5,000 | ) | | (1,850 | ) | |
Repurchase and retirement of common stock | | (559 | ) | | - | | | - | | | - | | | (559 | ) | |
Distributions to noncontrolling interest | | | - | | - | | | | | | - | |
Dividends on common stock | | (54,100 | ) | | - | | | - | | | - | | | (54,100 | ) | | (62,341) | | - | | - | | - | | (62,341) | |
Purchase and retirement of common stock | | | (1,856) | | - | | - | | - | | (1,856) | |
Transactions with affiliates, net | | 492,637 | | | (424,129 | ) | | (58,495 | ) | | (10,013 | ) | | - | | | 275,632 | | (158,453) | | (95,225) | | (21,954) | | - | |
Other | | | (231) | | - | | - | | - | | (231) | |
Net cash provided by (used in) financing activities | | 437,978 | | | (109,898 | ) | | (55,528 | ) | | (15,058 | ) | | 257,494 | | | 211,204 | | (33,118) | | (95,863) | | (22,019) | | 60,204 | |
(Decrease)/increase in cash and cash equivalents | | - | | | (96,792 | ) | | 8,450 | | | 492 | | | (87,850 | ) | |
(Decrease) increase in cash and cash equivalents | | | - | | 4,854 | | (1,546) | | (2,180) | | 1,128 | |
Cash and cash equivalents at beginning of period | | - | | | 103,369 | | | 80 | | | 2,255 | | | 105,704 | | | - | | 86 | | 2,366 | | 3,099 | | 5,551 | |
Cash and cash equivalents at end of period | | $ | - | | | $ | 6,577 | | | $ | 8,530 | | | $ | 2,747 | | | $ | 17,854 | | | $ | - | | $ | 4,940 | | $ | 820 | | $ | 919 | | $ | 6,679 | |
|
F-44F-47
Table of Contents
CONSOLIDATED COMMUNICATIONS HOLDINGS, INC. AND SUBSIDIARIES
NOTES TO CONSOLIDATED FINANCIAL STATEMENTS (continued)
YEARS ENDED DECEMBER 31, 2012, 20112014, 2013 AND 20102012
| | Year Ended December 31, 2011 | |
| | Parent | | | Subsidiary
Issuer | | | Guarantors | | | Non-Guarantors | | | Consolidated | |
Net cash provided by (used in) operating activates | | $ | (27,033 | ) | | $ | 22,335 | | | $ | 103,966 | | | $ | 30,236 | | | $ | 129,504 | |
| | | | | | | | | | | | | | | |
Cash flows from investing activities: | | | | | | | | | | | | | | | |
Purchases of property, plant and equipment | | - | | | - | | | (35,331 | ) | | (6,582 | ) | | (41,913 | ) |
Proceeds from sale of assets | | - | | | - | | | 511 | | | 329 | | | 840 | |
Other | | - | | | - | | | 272 | | | - | | | 272 | |
Net cash used in investing activities | | - | | | - | | | (34,548 | ) | | (6,253 | ) | | (40,801 | ) |
| | | | | | | | | | | | | | | |
Cash flows from financing activities: | | | | | | | | | | | | | | | |
Payment of capital lease obligation | | - | | | - | | | (113 | ) | | (36 | ) | | (149 | ) |
Payment of financing costs | | - | | | (3,471 | ) | | - | | | - | | | (3,471 | ) |
Repurchase and retirement of common stock | | (726 | ) | | - | | | - | | | - | | | (726 | ) |
Dividends on common stock | | (46,307 | ) | | - | | | - | | | - | | | (46,307 | ) |
Transactions with affiliates, net | | 74,066 | | | 19,107 | | | (69,277 | ) | | (23,896 | ) | | - | |
Net cash provided by (used in) financing activities | | 27,033 | | | 15,636 | | | (69,390 | ) | | (23,932 | ) | | (50,653 | ) |
Increase in cash and cash equivalents | | - | | | 37,971 | | | 28 | | | 51 | | | 38,050 | |
Cash and cash equivalents at beginning of period | | - | | | 65,398 | | | 52 | | | 2,204 | | | 67,654 | |
Cash and cash equivalents at end of period | | $ | - | | | $ | 103,369 | | | $ | 80 | | | $ | 2,255 | | | $ | 105,704 | |
| | Year Ended December 31, 2013 | |
| | Parent | | Subsidiary
Issuer | | Guarantors | | Non-Guarantors | | Consolidated | |
Net cash (used in) provided by continuing operations | | $ | (88,251) | | $ | 36,811 | | $ | 195,591 | | $ | 24,379 | | $ | 168,530 | |
Net cash used in discontinued operations | | - | | - | | (4,174) | | - | | (4,174) | |
Net cash (used in) provided by operating activities | | (88,251) | | 36,811 | | 191,417 | | 24,379 | | 164,356 | |
| | | | | | | | | | | |
Cash flows from investing activities: | | | | | | | | | | | |
Purchases of property, plant and equipment | | - | | - | | (100,139) | | (7,224) | | (107,363) | |
Purchase of investments | | - | | - | | (403) | | - | | (403) | |
Proceeds from sale of assets | | - | | - | | 282 | | 48 | | 330 | |
Net cash used in continuing operations | | - | | - | | (100,260) | | (7,176) | | (107,436) | |
Net cash provided by discontinued operations | | - | | - | | 2,331 | | - | | 2,331 | |
Net cash used in investing activities | | - | | - | | (97,929) | | (7,176) | | (105,105) | |
| | | | | | | | | | | |
Cash flows from financing activities: | | | | | | | | | | | |
Proceeds from issuance of long-term debt | | - | | 989,450 | | - | | - | | 989,450 | |
Payment of capital lease obligation | | - | | - | | (462) | | (54) | | (516) | |
Payment on long-term debt | | - | | (990,961) | | - | | - | | (990,961) | |
Payment of financing costs | | - | | (6,576) | | - | | - | | (6,576) | |
Dividends on common stock | | (62,064) | | - | | - | | - | | (62,064) | |
Purchase and retirement of common stock | | (887) | | - | | - | | - | | (887) | |
Transactions with affiliates, net | | 151,202 | | (35,215) | | (99,190) | | (16,797) | | - | |
Net cash provided by (used in) financing activities | | 88,251 | | (43,302) | | (99,652) | | (16,851) | | (71,554) | |
(Decrease) increase in cash and cash equivalents | | - | | (6,491) | | (6,164) | | 352 | | (12,303) | |
Cash and cash equivalents at beginning of period | | - | | 6,577 | | 8,530 | | 2,747 | | 17,854 | |
Cash and cash equivalents at end of period | | $ | - | | $ | 86 | | $ | 2,366 | | $ | 3,099 | | $ | 5,551 | |
| | Year Ended December 31, 2012 | |
| | Parent | | Subsidiary
Issuer | | Guarantors | | Non-Guarantors | | Consolidated | |
Net cash (used in) provided by continuing operations | | $ | (52,318) | | $ | 13,106 | | $ | 137,386 | | $ | 21,558 | | $ | 119,732 | |
Net cash provided by discontinued operations | | - | | - | | 3,483 | | - | | 3,483 | |
Net cash (used in) provided by operating activities | | (52,318) | | 13,106 | | 140,869 | | 21,558 | | 123,215 | |
| | | | | | | | | | | |
Cash flows from investing activities: | | | | | | | | | | | |
Business acquisition, net of cash acquired | | (385,346) | | - | | - | | - | | (385,346) | |
Purchases of property, plant and equipment | | - | | - | | (70,948) | | (6,050) | | (76,998) | |
Purchase of investments | | - | | - | | (6,728) | | - | | (6,728) | |
Proceeds from sale of assets | | - | | - | | 882 | | 42 | | 924 | |
Other | | (314) | | - | | - | | - | | (314) | |
Net cash used in continuing operations | | (385,660) | | - | | (76,794) | | (6,008) | | (468,462) | |
Net cash used in discontinued operations | | - | | - | | (97) | | - | | (97) | |
Net cash used in investing activities | | (385,660) | | - | | (76,891) | | (6,008) | | (468,559) | |
| | | | | | | | | | | |
Cash flows from financing activities: | | | | | | | | | | | |
Proceeds on bond offering | | - | | 298,035 | | - | | - | | 298,035 | |
Proceeds from issuance of long-term debt | | - | | 544,850 | | - | | - | | 544,850 | |
Payment of capital lease obligation | | - | | - | | (183) | | (45) | | (228) | |
Payment on long-term debt | | - | | (510,038) | | - | | - | | (510,038) | |
Payment of financing costs | | - | | (18,616) | | - | | - | | (18,616) | |
Distributions to noncontrolling interest | | - | | - | | 3,150 | | (5,000) | | (1,850) | |
Dividends on common stock | | (54,100) | | - | | - | | - | | (54,100) | |
Purchase and retirement of common stock | | (559) | | - | | - | | - | | (559) | |
Transactions with affiliates, net | | 492,637 | | (424,129) | | (58,495) | | (10,013) | | - | |
Net cash provided by (used in) financing activities | | 437,978 | | (109,898) | | (55,528) | | (15,058) | | 257,494 | |
(Decrease) increase in cash and cash equivalents | | - | | (96,792) | | 8,450 | | 492 | | (87,850) | |
Cash and cash equivalents at beginning of period | | - | | 103,369 | | 80 | | 2,255 | | 105,704 | |
Cash and cash equivalents at end of period | | $ | - | | $ | 6,577 | | $ | 8,530 | | $ | 2,747 | | $ | 17,854 | |
F-45F-48
Table of Contents
Report of Independent Certified Public Accountants
The Partners of Pennsylvania RSA No. 6 (II)
Limited Partnership
We have audited the accompanying financial statements of Pennsylvania RSA No. 6 (II) Limited Partnership, which comprise the balance sheet as of December 31, 2014, and the related statements of income and comprehensive income, changes in partners’ capital and cash flows for the year then ended, and the related notes to the financial statements.
CONSOLIDATED COMMUNICATIONS HOLDINGS, INC. AND SUBSIDIARIES
NOTES TO CONSOLIDATED FINANCIAL STATEMENTS (continued)
YEARS ENDED DECEMBER 31, 2012, 2011 AND 2010Management’s Responsibility for the Financial Statements
| | Year Ended December 31, 2010 | |
| | Parent | | | Subsidiary
Issuer | | | Guarantors | | | Non-Guarantors | | | Consolidated | |
Net cash provided by (used in) operating activates | | $ | (26,981 | ) | | $ | 21,010 | | | $ | 90,955 | | | $ | 31,158 | | | $ | 116,142 | |
| | | | | | | | | | | | | | | |
Cash flows from investing activities: | | | | | | | | | | | | | | | |
Purchases of property, plant and equipment | | - | | | - | | | (36,078 | ) | | (6,839 | ) | | (42,917 | ) |
Proceeds from sale of assets | | - | | | - | | | 1,035 | | | 30 | | | 1,065 | |
Proceeds from sale of investments | | - | | | - | | | 35 | | | - | | | 35 | |
Net cash used in provided by investing activities | | - | | | - | | | (35,008 | ) | | (6,809 | ) | | (41,817 | ) |
| | | | | | | | | | | | | | | |
Cash flows from financing activities: | | | | | | | | | | | | | | | |
Payment of capital lease obligation | | - | | | - | | | (386 | ) | | (13 | ) | | (399 | ) |
Distribution to noncontrolling interest | | - | | | - | | | 3,150 | | | (5,000 | ) | | (1,850 | ) |
Repurchase and retirement of common stock | | (1,001 | ) | | - | | | - | | | - | | | (1,001 | ) |
Dividends on common stock | | (46,179 | ) | | - | | | - | | | - | | | (46,179 | ) |
Transactions with affiliates, net | | 74,161 | | | 2,875 | | | (58,893 | ) | | (18,143 | ) | | - | |
Net cash provided by (used in) financing activities | | 26,981 | | | 2,875 | | | (56,129 | ) | | (23,156 | ) | | (49,429 | ) |
Increase in cash and cash equivalents | | - | | | 23,885 | | | (182 | ) | | 1,193 | | | 24,896 | |
Cash and cash equivalents at beginning of period | | - | | | 41,513 | | | 234 | | | 1,011 | | | 42,758 | |
Cash and cash equivalents at end of period | | $ | - | | | $ | 65,398 | | | $ | 52 | | | $ | 2,204 | | | $ | 67,654 | |
Management is responsible for the preparation and fair presentation of these financial statements in conformity with U.S. generally accepted accounting principles; this includes the design, implementation and maintenance of internal control relevant to the preparation and fair presentation of financial statements that are free of material misstatement, whether due to fraud or error.
Auditor’s Responsibility
Our responsibility is to express an opinion on these financial statements based on our audit. We conducted our audit in accordance with auditing standards generally accepted in the United States. Those standards require that we plan and perform the audit to obtain reasonable assurance about whether the financial statements are free of material misstatement.
An audit involves performing procedures to obtain audit evidence about the amounts and disclosures in the financial statements. The procedures selected depend on the auditor’s judgment, including the assessment of the risks of material misstatement of the financial statements, whether due to fraud or error. In making those risk assessments, the auditor considers internal control relevant to the entity’s preparation and fair presentation of the financial statements in order to design audit procedures that are appropriate in the circumstances, but not for the purpose of expressing an opinion on the effectiveness of the entity’s internal control. Accordingly, we express no such opinion. An audit also includes evaluating the appropriateness of accounting policies used and the reasonableness of significant accounting estimates made by management, as well as evaluating the overall presentation of the financial statements.
We believe that the audit evidence we have obtained is sufficient and appropriate to provide a basis for our audit opinion.
Opinion
In our opinion, the financial statements referred to above present fairly, in all material respects, the financial position of Pennsylvania RSA No. 6 (II) Limited Partnership at December 31, 2014, and the results of its operations and its cash flows for the year then ended in conformity with U.S. generally accepted accounting principles.
F-46S-1
Table of Contents
December 31, 2013 Financial Statements
The accompanying balance sheet of Pennsylvania RSA No. 6 (II) Limited Partnership as of December 31, 2013, and the related statements of income and comprehensive income, changes in partners’ capital and cash flows for the year then ended were not audited, reviewed, or compiled by us and, accordingly, we do not express an opinion or any other form of assurance on them.
/s/ Ernst & Young LLP
Orlando, Florida
February 27, 2015
S-2
Table of Contents
REPORT OF INDEPENDENT AUDITORS REPORTCERTIFIED PUBLIC ACCOUNTANTS
To the Partners of Pennsylvania RSA No. 6 (II) Limited Partnership:
We have audited the accompanying financial statements of Pennsylvania RSA No. 6 (II) Limited Partnership (the "Partnership"“Partnership”) which comprise the balance sheetssheet as of December 31, 2012, and 2011, and the related statements of operations,income and comprehensive income, changes in partners’ capital, and cash flows for each of the three years in the periodyear ended December 31, 2012, and the related notes to the financial statements.
Management'sManagement’s Responsibility for the Financial Statements
Management is responsible for the preparation and fair presentation of these financial statements in accordance with accounting principles generally accepted in the United States of America; this includes the design, implementation, and maintenance of internal control relevant to the preparation and fair presentation of financial statements that are free from material misstatement, whether due to fraud or error.
Auditors'Auditors’ Responsibility
Our responsibility is to express an opinion on these financial statements based on our audits. We conducted our audits in accordance with auditing standards generally accepted in the United States of America. Those standards require that we plan and perform the audit to obtain reasonable assurance about whether the financial statements are free from material misstatement.
An audit involves performing procedures to obtain audit evidence about the amounts and disclosures in the financial statements. The procedures selected depend on the auditor'sauditor’s judgment, including the assessment of the risks of material misstatement of the financial statements, whether due to fraud or error. In making those risk assessments, the auditor considers internal control relevant to the Partnership'sPartnership’s preparation and fair presentation of the financial statements in order to design audit procedures that are appropriate in the circumstances, but not for the purpose of expressing an opinion on the effectiveness of the Partnership'sPartnership’s internal control. Accordingly, we express no such opinion. An audit also includes evaluating the appropriateness of accounting policies used and the reasonableness of significant accounting estimates made by management, as well as evaluating the overall presentation of the financial statements.
We believe that the audit evidence we have obtained is sufficient and appropriate to provide a basis for our audit opinion.
Opinion
In our opinion, the financial statements referred to above present fairly, in all material respects, the financial position of Pennsylvania RSA No. 6 (II) Limited Partnership as of December 31, 2012, and 2011, and the results of its operations and its cash flows for each of the three years in the periodyear ended December 31, 2012 in accordance with accounting principles generally accepted in the United States of America.
S-3
Table of Contents
Other Matters
The accompanying balance sheet of the Partnership as of December 31, 2013, and the related statements of operations, change in partner’s capital and cash flows for the year then ended were not audited, reviewed, or compiled by us and, accordingly, we do not express an opinion or any other form of assurance on them.
| /s/ Deloitte & Touche LLP |
Atlanta, GA
March 12, 2013
F-47S-4
Table of Contents
Pennsylvania RSA No. 6 (II) Limited Partnership
Balance Sheets - As of December 31, 20122014 and 20112013
ASSETS | | 2012 | | 2011 | | | 2014 | | 2013 | |
| | | | | | | (Audited) | | (Unaudited) | |
| | | | | | |
CURRENT ASSETS: | | | | | | | | | | |
Accounts receivable, net of allowance of $143 and $366 | | $ | 14,750 | | $ | 9,005 | | |
Due from affiliate | | | $ | 8,341 | | $ | 12,113 | |
Accounts receivable, net of allowance of $498 and $225 | | | 12,077 | | 12,176 | |
Unbilled revenue | | 890 | | 1,091 | | | 961 | | 919 | |
Due from affiliate | | 7,374 | | 6,117 | | |
Prepaid expenses and other current assets | | - | | 22 | | |
Prepaid expenses | | | 244 | | - | |
| | | | | | | | | | |
Total current assets | | 23,014 | | 16,235 | | | 21,623 | | 25,208 | |
| | | | | | | | | | |
PROPERTY, PLANT AND EQUIPMENT—Net | | 12,412 | | 11,448 | | |
PROPERTY, PLANT AND EQUIPMENT - NET | | | 15,752 | | 12,651 | |
| | | | | | | | | | |
OTHER ASSETS | | 27 | | 54 | | | 1,973 | | 190 | |
| | | | | | | | | | |
TOTAL ASSETS | | $ | 35,453 | | $ | 27,737 | | | $ | 39,348 | | $ | 38,049 | |
| | | | | | | | | | |
LIABILITIES AND PARTNERS’ CAPITAL | | | | | | | | | | |
| | | | | | | | | | |
CURRENT LIABILITIES: | | | | | | | | | | |
Accounts payable and accrued liabilities | | $ | 3,804 | | $ | 3,326 | | | $ | 4,195 | | $ | 3,329 | |
Advance billings and customer deposits | | 3,648 | | 3,382 | | | 5,121 | | 3,857 | |
| | | | | | | | | | |
Total current liabilities | | 7,452 | | 6,708 | | | 9,316 | | 7,186 | |
| | | | | | | | | | |
LONG TERM LIABILITIES | | 411 | | 355 | | | 639 | | 627 | |
| | | | | | | | | | |
Total liabilities | | 7,863 | | 7,063 | | | 9,955 | | 7,813 | |
| | | | | | | | | | |
PARTNERS’ CAPITAL | | 27,590 | | 20,674 | | | 29,393 | | 30,236 | |
| | | | | | | | | | |
TOTAL LIABILITIES AND PARTNERS’ CAPITAL | | $ | 35,453 | | $ | 27,737 | | | $ | 39,348 | | $ | 38,049 | |
| | | | | | |
See notes to financial statements. | | | | | | |
See notes to financial statements. | | | | | |
F-48S-5
Table of Contents
Pennsylvania RSA No. 6 (II) Limited Partnership
Statements of OperationsIncome and Comprehensive Income - Years Ended December 31, 2012, 20112014, 2013 and 20102012
| | 2012 | | 2011 | | 2010 | | | 2014 | | 2013 | | 2012 | |
| | | | | | | | | (Audited) | | (Unaudited) | | (Audited) | |
OPERATING REVENUE: | | | | | | | | | | | | | | |
Service revenue | | $ | 112,987 | | $ | 112,822 | | $ | 101,143 | | | $ | 125,490 | | $ | 120,364 | | $ | 112,987 | |
Equipment and other | | 22,699 | | 22,758 | | 18,986 | | | 26,312 | | 23,360 | | 22,699 | |
| | | | | | | | | | | | | | |
Total operating revenue | | 135,686 | | 135,580 | | 120,129 | | | 151,802 | | 143,724 | | 135,686 | |
| | | | | | | | | | | | | | |
OPERATING COSTS AND EXPENSES: | | | | | | | | |
OPERATING EXPENSES: | | | | | | | | |
Cost of service (exclusive of depreciation and amortization) | | 38,665 | | 45,726 | | 37,846 | | | 44,109 | | 41,062 | | 38,665 | |
Depreciation and amortization | | | 2,520 | | 2,500 | | 2,446 | |
Cost of equipment | | 25,416 | | 25,347 | | 16,385 | | | 30,428 | | 25,150 | | 25,416 | |
Selling, general and administrative | | 35,758 | | 33,139 | | 30,384 | | | 38,682 | | 37,387 | | 35,758 | |
Depreciation and amortization | | 2,446 | | 2,619 | | 2,445 | | |
| | | | | | | | | | | | | | |
Total operating costs and expenses | | 102,285 | | 106,831 | | 87,060 | | |
Total operating expenses | | | 115,739 | | 106,099 | | 102,285 | |
| | | | | | | | | | | | | | |
OPERATING INCOME | | 33,401 | | 28,749 | | 33,069 | | | 36,063 | | 37,625 | | 33,401 | |
| | | | | | | | | | | | | | |
INTEREST INCOME, NET | | 15 | | 26 | | 552 | | | 94 | | 21 | | 15 | |
| | | | | | | | | | | | | | |
NET INCOME | | $ | 33,416 | | $ | 28,775 | | $ | 33,621 | | |
NET INCOME AND COMPREHENSIVE INCOME | | | $ | 36,157 | | $ | 37,646 | | $ | 33,416 | |
| | | | | | | | | | | | | | |
Allocation of Net Income: | | | | | | | | | | | | | | |
Limited Partners | | $ | 16,330 | | $ | 14,062 | | $ | 16,431 | | | $ | 17,671 | | $ | 18,398 | | $ | 16,330 | |
General Partner | | $ | 17,086 | | $ | 14,713 | | $ | 17,190 | | | $ | 18,486 | | $ | 19,248 | | $ | 17,086 | |
| | | | | | | | |
See notes to financial statements. | | | | | | | | |
See notes to financial statements. | | | | | | | |
F-49S-6
Table of Contents
Pennsylvania RSA No. 6 (II) Limited Partnership
Statements of Changes in Partners’ Capital - Years Ended December 31, 2012, 20112014, 2013 and 20102012
| | General Partner | | Limited Partners | | | | |
| | Cellco Partnership | | Cellco Partnership | | Consolidated Communications Enterprise Services, Inc. | | Venus Cellular Telephone Company, Inc. | | | Total Partners’ Capital | |
| | | | | | | | | | | | |
BALANCE—January 1, 2010 | | $ | 13,436 | | $ | 2,242 | | $ | 6,220 | | $ | 4,380 | | | $ | 26,278 | |
| | | | | | | | | | | | |
Distributions | | (17,384 | ) | (2,900 | ) | (8,048 | ) | (5,668 | ) | | (34,000 | ) |
| | | | | | | | | | | | |
Net Income | | 17,190 | | 2,868 | | 7,958 | | 5,605 | | | 33,621 | |
| | | | | | | | | | | | |
BALANCE—December 31, 2010 | | 13,242 | | 2,210 | | 6,130 | | 4,317 | | | 25,899 | |
| | | | | | | | | | | | |
Distributions | | (17,384 | ) | (2,900 | ) | (8,048 | ) | (5,668 | ) | | (34,000 | ) |
| | | | | | | | | | | | |
Net Income | | 14,713 | | 2,453 | | 6,812 | | 4,797 | | | 28,775 | |
| | | | | | | | | | | | |
BALANCE—December 31, 2011 | | 10,571 | | 1,763 | | 4,894 | | 3,446 | | | 20,674 | |
| | | | | | | | | | | | |
Distributions | | (13,549 | ) | (2,260 | ) | (6,273 | ) | (4,418 | ) | | (26,500 | ) |
| | | | | | | | | | | | |
Net Income | | 17,086 | | 2,850 | | 7,909 | | 5,571 | | | 33,416 | |
| | | | | | | | | | | | |
BALANCE—December 31, 2012 | | $ | 14,108 | | $ | 2,353 | | $ | 6,530 | | $ | 4,599 | | | $ | 27,590 | |
See notes to financial statements.
| | General Partner | | Limited Partners | | | |
| | Cellco
Partnership | | Cellco
Partnership | | Consolidated
Communications
Enterprise, Inc. | | Venus Cellular
Telephone
Company, Inc. | | Total Partners’
Capital | |
| | | | | | | | | | | |
BALANCE—January 1st, 2012 | | $ | 10,571 | | $ | 1,763 | | $ | 4,894 | | $ | 3,446 | | $ | 20,674 | |
| | | | | | | | | | | |
Distributions | | (13,549 | ) | (2,260 | ) | (6,273 | ) | (4,418 | ) | (26,500 | ) |
| | | | | | | | | | | |
Net Income | | 17,086 | | 2,850 | | 7,909 | | 5,571 | | 33,416 | |
| | | | | | | | | | | |
BALANCE—December 31, 2012 (Audited) | | $ | 14,108 | | $ | 2,353 | | $ | 6,530 | | $ | 4,599 | | $ | 27,590 | |
| | | | | | | | | | | |
Distributions | | (17,895 | ) | (2,986 | ) | (8,284 | ) | (5,835 | ) | (35,000 | ) |
| | | | | | | | | | | |
Net Income | | 19,248 | | 3,212 | | 8,911 | | 6,275 | | 37,646 | |
| | | | | | | | | | | |
BALANCE—December 31, 2013 (Unaudited) | | 15,461 | | 2,579 | | 7,157 | | 5,039 | | 30,236 | |
| | | | | | | | | | | |
Distributions | | (18,918 | ) | (3,156 | ) | (8,758 | ) | (6,168 | ) | (37,000 | ) |
| | | | | | | | | | | |
Net Income | | 18,486 | | 3,084 | | 8,558 | | 6,029 | | 36,157 | |
| | | | | | | | | | | |
BALANCE—December 31, 2014 (Audited) | | $ | 15,029 | | $ | 2,507 | | $ | 6,957 | | $ | 4,900 | | $ | 29,393 | |
| | | | | | | | | | | |
See notes to financial statements. | | | | | | | | | | | |
F-50S-7
Table of Contents
Pennsylvania RSA No. 6 (II) Limited Partnership
Statements of Cash Flows - Years Ended December 31, 2012, 20112014, 2013 and 20102012
| | 2012 | | 2011 | | 2010 | |
CASH FLOWS FROM OPERATING ACTIVITIES: | | | | | | | |
Net income | | $ | 33,416 | | $ | 28,775 | | $ | 33,621 | |
Adjustments to reconcile net income to net cash provided by operating activities: | | | | | | | |
Depreciation and amortization | | 2,446 | | 2,619 | | 2,445 | |
Provision for losses on accounts receivable | | 270 | | 722 | | 584 | |
Changes in certain assets and liabilities: | | | | | | | |
Accounts receivable | | (6,015 | ) | (1,644 | ) | (40 | ) |
Unbilled revenue | | 201 | | (53 | ) | (165 | ) |
Prepaid expenses and other current assets | | 22 | | - | | (2 | ) |
Accounts payable and accrued liabilities | | 85 | | 564 | | 386 | |
Advance billings and customer deposits | | 266 | | 263 | | 610 | |
Long term liabilities | | 56 | | 81 | | 71 | |
| | | | | | | |
Net cash provided by operating activities | | 30,747 | | 31,327 | | 37,510 | |
| | | | | | | |
CASH FLOWS FROM INVESTING ACTIVITIES: | | | | | | | |
Capital expenditures, net | | (2,990 | ) | (2,151 | ) | (2,310 | ) |
Change in due from affiliate, net | | (1,257 | ) | 4,824 | | (1,200 | ) |
| | | | | | | |
Net cash provided by (used in) investing activities | | (4,247 | ) | 2,673 | | (3,510 | ) |
| | | | | | | |
CASH FLOWS FROM FINANCING ACTIVITIES: | | | | | | | |
Distributions to partners | | (26,500 | ) | (34,000 | ) | (34,000 | ) |
| | | | | | | |
Net cash used in financing activities | | (26,500 | ) | (34,000 | ) | (34,000 | ) |
| | | | | | | |
CHANGE IN CASH | | - | | - | | - | |
| | | | | | | |
CASH—Beginning of year | | - | | - | | - | |
| | | | | | | |
CASH—End of year | | $ | - | | $ | - | | $ | - | |
| | | | | | | |
NONCASH TRANSACTIONS FROM INVESTING ACTIVITIES: | | | | | | | |
| | | | | | | |
Accruals for Capital Expenditures | | $ | 400 | | $ | 7 | | $ | 25 | |
See notes to financial statements.
| | 2014 | | 2013 | | 2012 | |
| | (Audited) | | (Unaudited) | | (Audited) | |
CASH FLOWS FROM OPERATING ACTIVITIES: | | | | | | | |
Net Income | | $ | 36,157 | | $ | 37,646 | | $ | 33,416 | |
Adjustments to reconcile net income to net cash provided by operating activities: | | | | | | | |
Depreciation and amortization | | 2,520 | | 2,500 | | 2,446 | |
Provision for losses on accounts receivable | | 739 | | 531 | | 270 | |
Changes in certain assets and liabilities: | | | | | | | |
Accounts receivable | | (640 | ) | 2,043 | | (6,015 | ) |
Unbilled revenue | | (42 | ) | (29 | ) | 201 | |
Prepaid expenses | | (244 | ) | - | | 22 | |
Other assets | | (1,783 | ) | (163 | ) | - | |
Accounts payable and accrued liabilities | | 589 | | (177 | ) | 85 | |
Advance billings and customer deposits | | 1,264 | | 209 | | 266 | |
Long term liabilities | | 12 | | 216 | | 56 | |
| | | | | | | |
Net cash provided by operating activities | | 38,572 | | 42,776 | | 30,747 | |
| | | | | | | |
CASH FLOWS FROM INVESTING ACTIVITIES: | | | | | | | |
Capital expenditures | | (5,759 | ) | (3,645 | ) | (3,077 | ) |
Fixed asset transfers out | | 415 | | 608 | | 87 | |
Change in due from affiliate | | 3,772 | | (4,739 | ) | (1,257 | ) |
| | | | | | | |
Net cash used in investing activities | | (1,572 | ) | (7,776 | ) | (4,247 | ) |
| | | | | | | |
CASH FLOWS FROM FINANCING ACTIVITIES: | | | | | | | |
Distributions to partners | | (37,000 | ) | (35,000 | ) | (26,500 | ) |
| | | | | | . | |
Net cash used in financing activities | | (37,000 | ) | (35,000 | ) | (26,500 | ) |
| | | | | | | |
CHANGE IN CASH | | - | | - | | - | |
| | | | | | | |
CASH—Beginning of year | | - | | - | | $ | - | |
| | | | | | | |
CASH—End of year | | $ | - | | $ | - | | $ | - | |
| | | | | | | |
NONCASH TRANSACTIONS FROM INVESTING ACTIVITIES: | | | | | | | |
| | | | | | | |
Accruals for Capital Expenditures | | $ | 379 | | $ | 102 | | $ | 400 | |
| | | | | | | |
See notes to financial statements. | | | | | | | |
F-51S-8
Table of Contents
Pennsylvania RSA No. 6 (II) Limited Partnership
Notes to Financial Statements - Years Ended December 31, 2014, 2013 and 2012
1. ORGANIZATION AND MANAGEMENT
Pennsylvania RSA No. 6 (II) Limited Partnership– Pennsylvania RSA No. 6 (II) Limited Partnership (the “Partnership” or “we”) was formed in 1991. The principal activity of the Partnership is providing cellular service in the Pennsylvania 6 (II) rural service area. Under the terms of the partnership agreement, the partnership expires on January 1, 2091.
The partners and their respective ownership percentages as of December 31, 2012, 20112014, 2013 and 20102012 are as follows:
General Partner: | | | |
Cellco Partnership* (“General Partner”) | | 51.13 | % |
| | | |
Limited Partners: | | | |
Cellco Partnership* | | 8.53 | % |
Consolidated Communications Enterprise Services, Inc. ** | | 23.67 | % |
Venus Cellular Telephone Company, Inc. | | 16.67 | % |
*Cellco Partnership (“Cellco”) doing business as Verizon Wireless.
**Consolidated Communications Enterprise Services, Inc. (CCES) is a wholly-owned subsidiary of Consolidated Communications Holdings, Inc.
In accordance with the partnership agreement, Cellco is responsible for managing the operations of the partnership (See Note 5)6).
In 2012, management determined that Cellco Partnership’s ownership percentage should have separately reflected the General and Limited Partnership interests, in accordance with the partnership agreement. Net income, distributions and capital should have reflected the same separation. The financial statements should have disclosed that Cellco Partnership had a 51.13% General Partnership interest and an 8.53% Limited Partnership interest. Accordingly, the Statements of Changes in Partners’ Capital for 2011 and 2010 have been revised to allocate Cellco’s capital, net income and distributions between General Partner and Limited Partner interest. The net income for 2011 and 2010 presented below the Statements of Operations previously allocated $17,166 and $20,058, respectively, to the General Partner. The allocation should have been $14,713 and $17,190, respectively. Additionally, the net income for 2011 and 2010 previously allocated to the Limiter Partner was $11,609 and $13,563, respectively. The allocation should have been $14,062 and $16,431, respectively.
F-52
2. SIGNIFICANT ACCOUNTING POLICIES
Use of Estimates – The preparation ofWe prepare our financial statements in accordance withusing U.S. generally accepted accounting principles generally accepted in the United States of America(GAAP), which requires management to make estimates and assumptions that affect reported amounts and disclosures. Actual results could differ from those estimates. Estimates are used for, but are not limited to,
Examples of significant estimates include: the accounting for: allocations, allowance for uncollectibledoubtful accounts, receivable,the recoverability of property, plant and equipment, the recoverability of intangible assets and other long-lived assets, unbilled revenue, depreciation and amortization, useful lives and impairmentrevenues, fair values of assets,financial instruments, accrued expenses and contingencies.
S-9
Table of Contents
Revenue Recognition – The Partnership offers products and services to our customers through bundled arrangements. These arrangements involve multiple deliverables which may include products, services, or a combination of products and services.
On January 1, 2011, the Partnership prospectively adopted the accounting standard updates regarding revenue recognition for multiple deliverable arrangements, and arrangements that include software elements. These updates require a vendor to allocate revenue in an arrangement using its best estimate of selling price if neither vendor specific objective evidence nor third party evidence of selling price exists. The residual method of revenue allocation is no longer permissible. These accounting standard updates do not change our units of accounting for bundled arrangements, nor do they materially change how we allocate arrangement consideration to our various products and services. Accordingly, the adoption of these standard updates did not have a significant impact on the financial statements. Additionally, we do not currently foresee any changes to our products, services or pricing practices that will have a significant effect on the financial statements in periods after the initial adoption, although this could change.
The Partnership earns revenue primarily by providing access to its network (access revenue) and usage of its network (usage revenue), which includes voice and data revenue. Customers are associated with the Partnership based upon mobile identification number.network. In general, access revenue is billed one month in advance and is recognized when earned; the unearned portion is classified in Advance billings in the balance sheet.earned. Usage revenue is generally billed in arrears and recognized when service is rendered and included in unbilled revenue until billed.rendered. Equipment sales revenue associated with the sale of wireless deviceshandsets and related equipment costs areaccessories is generally recognized when the products are delivered to and accepted by the customer, as this is considered to be a separate earnings process from the sale ofproviding wireless services. Customer activation fees charged to customers are considered additional consideration and are recorded in Equipment and other revenue, generally, at the time of customer acceptance. For agreements involving the resale of third-party services in which the Partnership iswe are considered the primary obligor in the arrangements, we record the Partnership records revenue gross at the time of sale. The roaming rates charged by the Partnership to Cellco do not necessarily reflect current market rates. The Partnership will continue to re-evaluate the rates on a periodic basis (See Note 5).
Wireless bundled service plans primarily consist of wireless voice and data services. The bundling of a voice plan with a text messaging plan (“Talk & Text”), for example, creates a multiple deliverable arrangement consisting of a voice component and a data
F-53
component in the form of text messaging. For these arrangements, revenue is allocated to each deliverable using a relative selling price method. Under this method, arrangement consideration is allocated to each separate deliverable based on our standalone selling price for each product or service, up to the amount that is not contingent upon providing additional services.sale. For equipment sales, the Partnership currently subsidizeswe generally subsidize the cost of wireless devices.devices for plans under our traditional subsidy model. The amount of this subsidy is generally contingent on the arrangement and terms selected by the customer. TheIn multiple deliverable arrangements which involve the sale of equipment and a service contract, the equipment revenue is recognized up to the amount collected when the wireless device is sold.
In addition to the traditional subsidy model for equipment sales, we offer new and existing customers the option to participate in Verizon Edge, a program that provides eligible wireless customers with the ability to pay for handsets under an equipment installment plan. Under the Verizon Edge program, customers have the right to upgrade their handset after a minimum of 30 days, subject to certain conditions, including making a stated portion of the required device payments, trading in their handset in good working condition and signing a new contract with Verizon. Upon upgrade, the outstanding balance of the equipment installment plan is exchanged for the used handset. This trade-in right is accounted for as a guarantee obligation.
Verizon Edge is a multiple-element arrangement typically consisting of the trade-in right, handset and monthly wireless service. At the inception of the arrangement, the amount allocable to the delivered units of accounting is limited to the amount that is not contingent upon the delivery of the monthly wireless service (the noncontingent amount). The full amount of the trade-in right’s fair value (not an allocated value) will be recognized as the guarantee liability and the remaining allocable consideration will be allocated to the handset. The value of the guarantee liability effectively results in a reduction to revenue recognized for the sale of the handset. The guarantee liability is measured at fair value upon initial recognition based on assumptions lacking observable pricing inputs including the probability and timing of the customer upgrading to a new phone, the customer’s estimated remaining installment balance at the time of trade-in and the estimated fair value of the phone at the time of trade-in and therefore is classified within Level 3 of the fair value hierarchy. When the customer trades-in their used phone, the handset received is recorded to inventory and measured as the difference between the remaining equipment installment plan balance at the time of trade-in and the guarantee liability. As a result of changes in the Verizon Edge program during 2014, and
S-10
Table of Contents
corresponding changes in related assumptions, the guarantee liability associated with Verizon Edge agreements under the current program is not material. The guarantee liability may increase after initial recognition as a result of changes in facts or assumptions and we will account for any increase in the guarantee liability with a corresponding decrease to revenue. The subsequent derecognition of the guarantee liability occurs when the guarantor is released from risk, which will occur at the earlier of the time the trade-in right is exercised or expires.
Roaming revenue reflects service revenue earned by the Partnership reports taxes imposedwhen customers not associated with the Partnership operate in the service area of the Partnership and use the Partnership’s network. The roaming rates with third party carriers associated with those customers are based on agreements with such carriers. The roaming rates charged by governmental authorities on revenue-producing transactions between us and our customersthe Partnership to Cellco are established by Cellco on a net basis.periodic basis and may not reflect current market rates (see Note 6).
Cellular service revenues resulting from a cellsite agreement with Cellco are recognized based upon a rate per minute of use (See Note 5)6).
Maintenance and Repairs – We charge the cost of maintenance and repairs, including the cost of replacing minor items not constituting substantial betterments, principally to Cost of services as these costs are incurred.
Advertising Costs– Costs for advertising products and services as well as other promotional and sponsorship costs are charged to Selling, general and administrative expense in the periods in which they are incurred.
Operating Costs and Expenses – Operating expenses include expenses incurred directly by the Partnership, as well as an allocation of selling, general and administrative, and operating costs incurred by Cellco or its affiliates on behalf of the Partnership. Employees of Cellco provide services performed on behalf of the Partnership. These employees are not employees of the Partnership, therefore operating expenses include direct and allocated charges of salary and employee benefit costs for the services provided to the Partnership. Cellco believes such allocations, principally based on the Partnership’s percentage of certain revenue streams, total customers, customer gross additions or minutes-of-use, are in accordance with the Partnership Agreement.Agreement and are a reasonable method of allocating such costs.
Cost of roaming reflects costs incurred by the Partnership when customers associated with the Partnership operate in a service area not associated with the Partnership and use a network not associated with the Partnership. The roaming rates with third party carriers are based on agreements with such carriers. The roaming rates charged to the Partnership by Cellco do not necessarily reflect current market rates. The Partnership will continue to re-evaluate the ratesare established by Cellco on a periodic basis and may not reflect current market rates (see Note 5)6).
Cost of equipment is recorded upon sale of the related equipment at Cellco’s cost basis. No inventory of equipment is maintained at the Partnership.
S-11
Table of Contents
Retail Stores–The daily operations of all retail stores owned by the Partnership are managed by Cellco. All fixed assets, liabilities, income and expenses related to these retail stores are recorded in the financial statements of the Partnership.
Income TaxesComprehensive Income– – The PartnershipComprehensive income is not a taxable entity for federal and statethe same as net income tax purposes. Any taxable income or loss is apportioned to the partners based on their respective partnership interests and is reported by them individually.
Inventory – Inventory is owned by Cellco and is not recorded on the Partnership’s financial statements. Upon sale, the related cost of the inventory is transferred to the Partnership at Cellco’s cost basis and includedas presented in the accompanying statements of operations.income and comprehensive income.
Income Taxes – The Partnership is treated as a pass through for income tax purposes and, therefore, is not subject to federal, state or local income taxes. Accordingly, no provision has been recorded for income taxes in the Partnership’s financial statements. The results of operations, including taxable income, gains, losses, deductions and credits, are allocated to and reflected on the income tax schedules provided to the respective partners.
The Partnership files federal and state tax returns. The 2011 through 2014 federal tax years for the Partnership remain subject to examination by the Internal Revenue Service. The 2011 through 2014 tax years for the Partnership remain subject to examination by the state tax jurisdiction. Because the application of tax laws and regulations to many types of transactions is susceptible to varying interpretations, positions taken could be changed at a later date upon final determination by taxing authorities.
Due from affiliate – Due from affiliate principally represents the Partnership’s cash position with Cellco. Cellco manages, on behalf of the Partnership, all cash, inventory, investing and financing activities of the Partnership. As such, the changes in due from/to affiliate are reflected as an investing activity or a financing activity in the statements of cash flows depending on whether the Partnership is in a net asset or net liability position with Cellco.
Additionally, administrative and operating costs incurred by Cellco on behalf of the Partnership, as well as property, plant and equipment transactions with affiliates, are charged to the Partnership through this account. Interest income is based on the Applicable Federal Rate which was approximately 0.3%, 0.2% and 0.2% for the years ended December 31, 2014, 2013 and 2012, respectively. Interest expense is calculated by applying Cellco’s average cost of borrowing from Verizon Communications, Inc, which was approximately 5.0%, 7.4% and 7.3% for the years ended December 31, 2014, 2013 and 2012 respectively. Included in interest income, net is interest income of $27, $18 (unaudited) and $15 for the years ended December 31, 2014, 2013 and 2012, respectively, related to due from affiliate.
Accounts Receivable and Allowance for Doubtful Accounts – The Partnership maintains allowances for uncollectible accounts receivable for estimated losses resulting from the inability of customers to make required payments. Estimates are based on the aging of the accounts receivable balances and the historical write-off experience, net of recoveries.
F-54
Property, Plant and EquipmentImpairment – Property, plant and equipment primarily represents costs incurred to construct and expand capacity and network coverage on mobile telephone switching offices and cell sites. The costAll of property, plant and equipment is depreciated over its estimated useful life using the straight-line method of accounting. Leasehold improvements are amortized over the shorter of their estimated useful lives or the term of the related lease. Major improvements to existing plant and equipment are capitalized. Routine maintenance and repairs that do not extend the life of the plant and equipment are charged to expense as incurred.
Upon the sale or retirement of property, plant and equipment, the cost and related accumulated depreciation or amortization are eliminated and any related gain or loss is reflected in the statements of operations. All property, plant and equipment purchases are made through an affiliate of Cellco. Transfers of property, plant and equipment between Cellco and affiliates are recorded at net book value.
Interest expense and network engineering costs incurred during the construction phase of the Partnership’s network and real estate properties under development are capitalized as part of property, plant and equipment and recorded as construction in progress until the projects are completed and placed into service.
Other Assets – Otherour long-lived assets consist of a customer list acquired in 2008. The Partnership amortizes the customer list over its expected useful life of 6 years using a method consistent with historical customer turnover rates. As of December 31, 2012, the gross carrying value is $182 and the accumulated amortization is $155. As of December 31, 2012, the scheduled amortization of the customer list for 2013 is $27.
FCC Licenses – The Federal Communications Commission (“FCC”) issues licenses that authorize cellular carriers to provide service in specific cellular geographic service areas. The FCC grants licenses for terms of up to ten years. In 1993 the FCC adopted specific standards to apply to cellular renewals, concluding it will award a license renewal to a cellular licensee that meets certain standards of past performance. Historically, the FCC has granted license renewals routinely and at nominal costs, which are expensed as incurred. All wireless licenses issued by the FCC that authorize the Partnership to provide cellular services are recorded on the books of Cellco. The current term of the Partnership’s FCC license expires in October 2020. Cellco believes it will be able to meet all requirements necessary to secure renewal of the Partnership’s cellular license.
Valuation of Assets – Long-lived assets, including property, plant and equipment and intangible assets with finite lives, are reviewed for impairment whenever events or changes in circumstances indicate that the carrying amount of the asset may not be
S-12
Table of Contents
recoverable. The carrying amount of a long-lived asset is not recoverable if it exceeds the sum of the undiscounted cash flows expected to result from the use and eventual disposition of the asset. The impairment loss would be measured as the amountIf any indications are present, we test for recoverability by whichcomparing the carrying amount of the asset exceedsgroup to the net undiscounted cash flows expected to be generated from the asset group. If those net undiscounted cash flows do not exceed the carrying amount, we perform the next step, which is to determine the fair value of the asset.
F-55
Cellco re-evaluatesasset and record an impairment, if any. We reevaluate the useful life determinationdeterminations for wireless licenses at least annuallythese long-lived assets each year to determine whether events and circumstances continuewarrant a revision in their remaining useful lives.
Property, Plant and Equipment – We record property, plant and equipment at cost. Property, plant and equipment are generally depreciated on a straight-line basis.
Leasehold improvements are amortized over the shorter of the estimated life of the improvement or the remaining term of the related lease, calculated from the time the asset was placed in service.
When the depreciable assets are retired or otherwise disposed of, the related cost and accumulated depreciation are deducted from the property, plant and equipment accounts, and any gains or losses on disposition are recognized in income. Transfers of property, plant and equipment between Cellco and affiliates are recorded at net book value on the date of the transfer and included in due from affiliate.
We capitalize interest associated with the acquisition or construction of network-related assets. Capitalized interest is reported as a reduction in interest expense and depreciated as part of the cost of the network-related assets.
Wireless Licenses –Cellco maintains wireless licenses that provide our wireless operations with the exclusive right to support an indefinite useful life.utilize designated radio frequency spectrum to provide wireless communication services. While licenses are issued for only a fixed time, generally ten years, such licenses are subject to renewal by the Federal Communications Commission (FCC). License renewals have occurred routinely and at nominal cost. Moreover, Cellco management has determined that there are currently no legal, regulatory, contractual, competitive, economic or other factors that limit the useful life of the Partnership’sour wireless licenses.
As a result, Cellco tests its wireless licenses for potential impairment annually, and more frequently if indications of impairment exist. Cellco evaluates its licenses on an aggregate basis, using a direct value approach. This approach estimates fair value using a discounted cash flow analysis to estimate what a marketplace participant would be willing to pay to purchasetreat the aggregated wireless licenses as ofan indefinite-lived intangible asset. Cellco reevaluates the valuation date. If the fair value of the aggregateduseful life determination for wireless licenses is less than the aggregated carrying amount of the wireless licenses,each year to determine whether events and circumstances continue to support an impairment is recognized. In addition, Cellco believes that underindefinite useful life. Under the Partnership agreement, it has the right toCellco may allocate, based on a reasonable methodology, any impairment loss recognized by Cellco for all licenses included in Cellco’s national footprint. Cellco does not charge the Partnership for the use of any FCC license recorded on its books (except for the annual cost of $317 related to the spectrum leases). Cellco evaluated itstheir wireless licenses for potential impairment as of December 15, 20122014. Cellco performed a qualitative assessment to determine whether it is more likely than not that the fair value of their wireless licenses was less than the carrying amount. As part of the assessment, they considered several qualitative factors including the business enterprise value of Cellco, macroeconomic conditions (including changes in interest rates and December 15, 2011. Thesediscount rates), industry and market considerations (including industry revenue and EBITDA (Earnings before interest, taxes, depreciation and amortization) margin projections), the projected financial performance
S-13
Table of Contents
of Cellco, as well as other factors.These evaluations resulted in no impairment of wireless licenses.
Concentrations – The Partnership maintains allowances for uncollectible accounts receivable for estimated losses resulting from the inability of customers to make required payments. Estimates are based on historical net write-off experience. No single customer receivable is large enough to present a significant financial risk to the partnership.
Cellco and the Partnership rely on local and long-distance telephone companies, some of which are related parties (See Note 5), and other companies to provide certain communication services. Although management believes alternative telecommunications facilities could be found in a timely manner, any disruption of these services could potentially have a material adverse impact on the Partnership’s operating results.
Although Cellco attempts to maintain multiple vendors for its network assets and inventory, which are important components of its operations, they are currently acquired from only a few sources. Certain of these products are in turn utilized by the Partnership and are important components of the Partnership’s operations. If the suppliers are unable to meet Cellco’s needs as it builds out its network infrastructure and sells service and equipment, delays and increased costs in the expansion of the Partnership’s network infrastructure or losses of potential customers could result, which would adversely affect operating results.
Financial Instruments – The Partnership’s trade receivables and payables are short-term in nature, and accordingly, their carrying value approximates fair value.
Due from affiliateFair Value Measurements– Due from affiliate principally representsFair value of financial and non-financial assets and liabilities is defined as an exit price, representing the Partnership’s cash position with Cellco. Cellco manages, on behalfamount that would be received to sell an asset or paid to transfer a liability in an orderly transaction between market participants. The three-tier hierarchy for inputs used in measuring fair value, which prioritizes the inputs used in the methodologies of the Partnership, all cash, inventory, investingmeasuring fair value for assets and financing activities of the Partnership. As such, the change in due fromliabilities, is as follows:
F-56
affiliate is reflected as an investing activityLevel 1 - Quoted prices in active markets for identical assets or a financing activity in the statements of cash flows depending on whether it represents a net asset or net liability for the Partnership.liabilities
Level 2 - Observable inputs other than quoted prices in active markets for identical assets and liabilities
Additionally, administrative
Level 3 - No observable pricing inputs in the market
Financial assets and operating costs incurred by Cellco on behalf of the Partnership, as well as property, plant and equipment transactions with affiliates,financial liabilities are charged to the Partnership through this account. Startingclassified in 2011, interest income istheir entirety based on the Applicable Federal Rate which was approximately .2%lowest level of input that is significant to the fair value measurements. Our assessment of the significance of a particular input to the fair value measurements requires judgment, and .4% formay affect the years ended December 31, 2012valuation of the assets and 2011, respectively. Interest expense is calculated by applying Cellco’s average cost of borrowing from Verizon Communications, Inc, which was approximately 7.3%liabilities being measured and 6.8% fortheir placement within the years ended December 31, 2012 and 2011, respectively. For 2010, interest income or interest expense was based on the average monthly outstanding balance in this account and was calculated by applying Cellco’s average cost of borrowing from Verizon Communications, Inc., which was approximately 5.8% for the year ended December 31, 2010. Included in net interest income is interest income of $15, $31 and $556 for the years ended December 31, 2012, 2011 and 2010, respectively, related to due from affiliate.fair value hierarchy.
Distributions -– The Partnership is required to make distributions to its partners based upon the Partnership’s operating results, cash availabilitydue to/from affiliate status, and financing needs as determined by the General Partner at the date of the distribution.
Recently AdoptedRecent Accounting Standards -During the first quarter of 2012, we adopted In May 2014, the accounting standard update regarding fair value measurement.related to the recognition of revenue from contracts with customers was issued. This standard update was issued to provideclarifies the principles for recognizing revenue and develops a consistent definition of fair value and ensure that the fair value measurement and disclosure requirements are similar betweencommon revenue standard for U.S. generally accepted accounting principlesGAAP and International Financial Reporting Standards. ThisThe standard update also changes certain fair value measurement principlesintends to provide a more robust framework for addressing revenue issues; improve comparability of revenue recognition practices across entities, industries, jurisdictions, and enhances thecapital markets; and provide more useful information to users of financial statements through improved disclosure requirements particularly for Level 3 fair value measurements. Therequirements. Upon adoption of this standard update, did not have a significant impact on the financial statements.
During the first quarter of 2012, we adopted the accounting standard update regarding testing of goodwill for impairment. This standard update gives companies the option to perform a qualitative assessment to first assess whether the fair value of a reporting unit is less than its carrying amount. If an entity determines it is not more likely than notexpect that the fair valueallocation and timing of the reporting unit is less than its carrying amount, then performing the two-step impairment test is unnecessary. The adoption of this standard did not have a significant impact on the financial statements.
Recent Accounting Standards - In July 2012, the accounting standard update regarding testing of intangible assets for impairment was issued. This standard update allows companies the optionrevenue recognition will be impacted. We expect to perform a qualitative assessment to determine whether it is more likely than not that an indefinite-lived intangible asset is impaired. An entity is not required to calculate the fair value of an indefinite-lived intangible asset and perform the quantitative impairment test unless the entity determines that it is more likely than not the asset is impaired. We will adopt this standard update during the first quarter of 2013.2017.
There are two adoption methods available for implementation of the standard update related to the recognition of revenue from contracts with customers. Under one method, the guidance is applied retrospectively to contracts for each reporting period presented, subject to allowable practical expedients. Under the other method, the guidance is applied to contracts not completed as of the date of initial application, recognizing the cumulative effect of the change as an adjustment to the beginning balance of retained earnings, and
F-57S-14
Table of Contents
The
also requires additional disclosures comparing the results to the previous guidance. We are currently evaluating these adoption ofmethods and the impact that this standard is not expectedupdate will have on our financial statements.
In January 2015, the accounting standard update related to have a significant impact onthe reporting of extraordinary and unusual items was issued. This standard update eliminates the concept of extraordinary items from U.S. GAAP as part of an initiative to reduce complexity in accounting standards while maintaining or improving the usefulness of the information provided to the users of the financial statements. The presentation and disclosure guidance for items that are unusual in nature or occur infrequently will be retained and expanded to include items that are both unusual in nature and infrequent in occurrence. This standard update is effective as of the first quarter of 2016; however, earlier adoption is permitted.
Reclassifications – Certain amounts in the 2013 and 2012 financial statements have been reclassified to conform to the 2014 presentation.
Subsequent Events – Events subsequent to December 31, 20122014 have been evaluated through March 12, 2013,February 27, 2015, the date the financial statements were issued.
3. WIRELESS EQUIPMENT INSTALLMENT PLANS
We offer new and existing customers the option to participate in Verizon Edge, a program that provides eligible wireless customers with the ability to pay for their handset over a period of time (an equipment installment plan) and the right to upgrade their handset after a minimum of 30 days, subject to certain conditions, including making a stated portion of the required device payments, trading in their handset in good working condition and signing a new contract with Verizon. The current portion of gross guarantee liability related to this program, which was approximately $1,052 at December 31, 2014 and was not material at December 31, 2013, was primarily included in Advance billings and customer deposits on our balance sheets. The long term portion of gross guarantee liability related to this program, which was approximately $87 at December 31, 2014 and $157 (unaudited) at December 31, 2013, was primarily included in Other liabilities on our balance sheets.
At the time of sale, we impute risk adjusted interest on the receivables associated with Verizon Edge. We record the imputed interest as a reduction to the related accounts receivable. Interest income, which is included within Interest income, net on our statements of income and comprehensive income, is recognized over the financed installment term.
We assess the collectability of our Verizon Edge receivables based upon a variety of factors, including the credit quality of the customer base, payment trends and other qualitative factors. The current portion of our receivables related to Verizon Edge included in Accounts receivable was $3,934 at December 31, 2014 and was not material
S-15
Table of Contents
at December 31, 2013. The long-term portion of the equipment installment plan receivables included in Other assets was $1,976 at December 31, 2014 and was not material at December 31, 2013.
The credit profiles of our customers with a Verizon Edge plan are similar to those of our customers with a traditional subsidized plan. Customers with a credit profile which carries a higher risk are required to make a down payment for equipment financed through Verizon Edge.
4.PROPERTY, PLANT AND EQUIPMENT, NETEQUIPMENT-NET
Property, plant and equipment consist of the following as of December 31, 20122014 and 2011:2013:
| | 2012 | | 2011 | | | 2014 | | 2013 | |
| | | | | | | | | (unaudited) | |
Buildings and improvements (15-40 years) | | $ | 7,807 | | $ | 6,603 | | |
| | | | | | |
Buildings and improvements (20-45 years) | | | 9,450 | | 8,501 | |
Wireless plant and equipment (3-15 years) | | 21,421 | | 22,732 | | | 26,782 | | 22,682 | |
Furniture, fixtures and equipment (3-10 years) | | 509 | | 554 | | |
Furniture, fixtures and equipment (2-10 years) | | | 568 | | 563 | |
Leasehold improvements (5 years) | | 1,138 | | 1,501 | | | 1,608 | | 1,210 | |
| | | | | | |
| | 30,875 | | 31,390 | | | | | | |
| | | | | | | 38,408 | | 32,956 | |
Less: accumulated depreciation | | 18,463 | | 19,942 | | | (22,656 | ) | (20,305 | ) |
| | | | | | | | | | |
Property, plant and equipment, net | | $ | 12,412 | | $ | 11,448 | | | $ | 15,752 | | $ | 12,651 | |
| | | | | | | | | | |
Depreciation expense | | $ | 2,419 | | $ | 2,592 | | | $ | 2,520 | | $ | 2,473 | |
Capitalized network engineering costs of $224$234 and $89$201 (unaudited) were recorded during the years ended December 31, 20122014 and 2011,2013, respectively. Construction in progress included in certain classifications shown above, principally wireless plant and equipment, amounted to $556$1,559 and $828$1,478 (unaudited), as of December 31, 20122014 and 2011,2013, respectively.
S-16
Table of Contents
4.5. CURRENT LIABILITIES
Accounts payable and accrued liabilities consist of the following as of December 31, 20122014 and 2011:2013:
| | 2012 | | 2011 | |
| | | | | |
Accounts payable | | $ | 3,578 | | $ | 3,103 | |
Accrued liabilities | | 226 | | 223 | |
Accounts payable and accrued libilities | | $ | 3,804 | | $ | 3,326 | |
| | 2014 | | 2013 | |
| | | | (unaudited) | |
| | | | | |
Accounts payable | | $ | 3,964 | | $ | 3,117 | |
Accrued liabilities | | 231 | | 212 | |
Accounts payable and accrued libilities | | $ | 4,195 | | $ | 3,329 | |
Advance billings and customer deposits consist of the following as of December 31, 20122014 and 2011:2013:
F-58
| | | 2014 | | 2013 | |
| | 2012 | | 2011 | | | | | (unaudited) | |
| | | | | | | | | | |
Advance billings | | $ | 3,565 | | $ | 3,300 | | | $ | 3,932 | | $ | 3,764 | |
Customer deposits | | 83 | | 82 | | | 137 | | 93 | |
Edge guarantee liability | | | 1,052 | | - | |
Advance billings and customer deposits | | $ | 3,648 | | $ | 3,382 | | | $ | 5,121 | | $ | 3,857 | |
5.6. TRANSACTIONS WITH AFFILIATES AND RELATED PARTIES
In addition to fixed asset purchases (see Note 2), substantially all of service revenues, equipment and other revenues, cost of service, cost of equipment, and selling, general and administrative expenses represent transactions processed by affiliates (Cellco and its related parties) on behalf of the Partnership or represent transactions with affiliates. These transactions consist of revenues and expenses that pertain to the Partnership which are processed by Cellco and directly attributed to or directly charged to the Partnership. They also include certain revenues and expenses that are processed or incurred by Cellco which are allocated to the Partnership based on factors such as the Partnership’s percentage of customers, gross customer additions, or minutes of use. These transactions do not necessarily represent arm’s length transactions and may not represent allthe amount of revenues and costs that would result if the Partnership operated on a standalone basis. Cellco periodically reviews the methodology and allocation bases for allocating certain revenues, operating costs, selling, administrative and general expenses to the Partnership. Resulting changes, if any, in the methodology and allocation bases have not resulted in significant changes in the allocated amounts.
Service revenues - Service revenues include monthly customer billings processed by Cellco on behalf of the Partnership and roaming revenues relating to customers of other affiliated markets that are specifically identified to the Partnership. Service revenue also includes long distance, data, and certain revenue reductions including revenue concessions that are processed by Cellco and allocated to the Partnership based on certain factors deemed appropriate by Cellco.
Equipment and other revenues - Equipment revenue includes equipment sales processed by Cellco and specifically identified to the Partnership, as well as certain handset and accessory revenues, contra-revenues including equipment concessions, and coupon rebates that are processed by Cellco and allocated to the Partnership based on certain
S-17
Table of Contents
factors deemed appropriate by Cellco. Other revenues include cell sharing revenue and other fees and surcharges charged to the customer that are specifically identified to the Partnership.
Cost of Service - Cost of service includes roaming costs relating to the Partnership’s customers roaming in other affiliated markets cell sharing costs and switch costs that are specifically identified to the Partnership. Cost of service also includes cost of telecom, long distance and application content that are incurred by Cellco and allocated to the Partnership based on certain factors deemed appropriate by Cellco. The Partnership has also entered into a lease agreement for the right to use additional spectrum owned by Cellco. See Note 6 for further information regarding this arrangement.
Cost of equipment - Cost of equipment includes theis recorded at Cellco’s cost of inventory specifically identified and transferred to the Partnershipbasis (see Note 2). Cost of equipment also includes
F-59
certain costs related to handsets, accessories and other costs incurred by Cellco and allocated to the Partnership based on certain factors deemed appropriate by Cellco.
Selling, general and administrative - Selling, general and administrative expenses include commissions, customer billing, office telecom, customer care, salaries, sales and marketing and advertising expenses that are specifically identified to the Partnership as well as incurred by Cellco and allocated to the Partnership based on certain factors deemed appropriate by Cellco.
Property, plant and equipment- Property, plant and equipment includes assets purchased by Cellco and directly charged to the Partnership as well as assets transferred between Cellco and the Partnership (see Note 2).
6.7. COMMITMENTS
Cellco, on behalf of the Partnership, and the Partnership itself have entered into operating leases for facilities, equipment and spectrumequipment used in itsthe Partnership’s operations. Lease contracts include renewal options that include rent expense adjustments based on the Consumer Price Index as well as annual and end-of-lease term adjustments. Rent expense is recorded on a straight-line basis. The noncancellable lease term used to calculate the amount of the straight-line rent expense is generally determined to be the initial lease term, including any optional renewal terms that are reasonably assured. Leasehold improvements related to these operating leases are amortized over the shorter of their estimated useful lives or the noncancellable lease term. For the years ended December 31, 2012, 20112014, 2013 and 2010,2012, the Partnership incurred a total of $1,604, $1,562$1,478, $1,388 (unaudited) and $1,265,$1,286 respectively, as rent expense related to these operating leases, which was included in cost of service and general and administrative expenses in the accompanying statements of operations. income and comprehensive income.
S-18
Table of Contents
Aggregate future minimum rental commitments under noncancellable operating leases, excluding renewal options that are not reasonably assured for the years shown are as follows:
Years | | Amount | | | Amount | |
| | | | | | |
2013 | | $ | 1,160 | | |
2014 | | 1,013 | | |
2015 | | 992 | | | $ | 1,354 | |
2016 | | 947 | | | 1,312 | |
2017 | | 833 | | | 1,214 | |
2018 and thereafter | | 5,767 | | |
2018 | | | 1,110 | |
2019 | | | 920 | |
2020 and thereafter | | | 4,230 | |
| | | | | | |
Total minimum payments | | $ | 10,712 | | | $ | 10,140 | |
On January 1, 2011,
The Partnership has also entered into certain agreements with Cellco, whereas the Partnership entered into a 700 MHz upper bandleases certain spectrum lease with Cellco. The lease includes an initial term extending through June 13, 2019from Cellco that overlaps the Pennsylvania 6 (II) rural service area. Total rent expense under these leases amounted to $583 in 2014, $318 (unaudited) in 2013 and a renewal option through June 13, 2029. The license, held by Cellco, is considered an indefinite-lived intangible as Cellco believes it will be able to meet all requirements necessary to secure renewal of this license. The Partnership accounts for this spectrum lease as an executory contract which is similar to an operating lease.$317 in 2012, respectively.
F-60
Based on the terms of the spectrum license leasethese leases as of December 31, 2012,2014, future spectrum lease obligations, including theexcluding renewal period,options that are not reasonably assured, are expected to be as follows:
Years | | Amount | | | Amount | |
| | | | | | |
2013 | | $ | 285 | | |
2014 | | 285 | | |
2015 | | 285 | | | $ | 633 | |
2016 | | 285 | | | 635 | |
2017 | | 285 | | | 613 | |
2018 and thereafter | | 3,256 | | |
2018 | | | 602 | |
2019 | | | 461 | |
2020 and thereafter | | | 4,649 | |
| | | | | | |
Total minimum payments | | $ | 4,681 | | | $ | 7,593 | |
The General Partner currently expects that the renewal option in the lease will be exercised.
From time to time Cellco enters into purchase commitments, primarily for network equipment, on behalf of the Partnership. These represent legal obligations of Cellco.
7.8. CONTINGENCIES
Cellco and the Partnership are subject to lawsuits and other claims including class actions, product liability, patent infringement, intellectual property, antitrust, partnership disputes, and claims involving relations with resellers and agents. Cellco is also currently defending lawsuits filed against it and other participants in the wireless industry alleging various adverse effects as a result of wireless phone usage. Various consumer class action
S-19
Table of Contents
lawsuits allege that Cellco violated certain state consumer protection laws and other statutes and defrauded customers through misleading billing practices or statements. These matters may involve indemnification obligations by third parties and/or affiliated parties covering all or part of any potential damage awards against Cellco and the Partnership and/or insurance coverage. All of the above matters are subject to many uncertainties, and the outcomes are not currently predictable.
The Partnership may be allocated a portion of the damages that may result upon adjudication of these matters if the claimants prevail in their actions. In none of the currently pending matters is the amount of accrual material. An estimate of the reasonably possible loss or range of loss in excess of the amounts already accrued to either Cellco or the Partnership with respect to these matters as of December 31, 20122014 cannot be made at this time due to various factors typical in contested proceedings, including (1) uncertain damage theories and demands; (2) a less than complete factual record; (3) uncertainty concerning legal theories and their resolution by courts or regulators; and (4) the unpredictable nature of the opposing party and its demands. We continuously monitor these proceedings as they develop and adjust any accrual or disclosure as needed. We do not expect that the ultimate resolution of any pending
F-61
regulatory or legal matter in future periods will have a material effect on the financial condition of the Partnership, but it could have a material effect on our results of operations for a given reporting period.
8.9. RECONCILIATION OF ALLOWANCE FOR DOUBTFUL ACCOUNTS
| | Balance at | | Additions | | Write-offs | | Balance at | | | Balance at | | Additions | | Write-offs | | Balance at | |
| | Beginning | | Charged to | | Net of | | End | | | Beginning | | Charged to | | Net of | | End | |
| | of the Year | | Operations | | Recoveries | | of the Year | | | of the Year | | Operations | | Recoveries | | of the Year | |
| | | | | | | | | | | | | | | | | | | | | | |
Accounts Receivable Allowances: | | | | | | | | | | | | | | | | | | | | | | |
2014 | | | $ | 225 | | $ | 739 | | $ | (466 | ) | $ | 498 | |
2013 (unaudited) | | | $ | 143 | | $ | 531 | | $ | (449 | ) | $ | 225 | |
2012 | | | $ | 366 | | $ | 270 | | $ | (493 | ) | $ | 143 | |
| | | | | | | | | | | | | | | | | | | | | | |
2012 | | $ | 366 | | | $ | 270 | | | $ | (493 | ) | | $ | 143 | | | |
2011 | | 245 | | | 722 | | | (601 | ) | | 366 | | | |
2010 | | 184 | | | 584 | | | (523 | ) | | 245 | | | |
|
******
F-62S-20
Table of Contents
Report of Independent Certified Public Accountants
The Partners of GTE Mobilnet of Texas #17
Limited Partnership
We have audited the accompanying financial statements of GTE Mobilnet of Texas #17 Limited Partnership, which comprise the balance sheet as of December 31, 2014, and the related statements of income and comprehensive income, changes in partners’ capital and cash flows for the year then ended, and the related notes to the financial statements.
Management’s Responsibility for the Financial Statements
Management is responsible for the preparation and fair presentation of these financial statements in conformity with U.S. generally accepted accounting principles; this includes the design, implementation and maintenance of internal control relevant to the preparation and fair presentation of financial statements that are free of material misstatement, whether due to fraud or error.
Auditor’s Responsibility
Our responsibility is to express an opinion on these financial statements based on our audit. We conducted our audit in accordance with auditing standards generally accepted in the United States. Those standards require that we plan and perform the audit to obtain reasonable assurance about whether the financial statements are free of material misstatement.
An audit involves performing procedures to obtain audit evidence about the amounts and disclosures in the financial statements. The procedures selected depend on the auditor’s judgment, including the assessment of the risks of material misstatement of the financial statements, whether due to fraud or error. In making those risk assessments, the auditor considers internal control relevant to the entity’s preparation and fair presentation of the financial statements in order to design audit procedures that are appropriate in the circumstances, but not for the purpose of expressing an opinion on the effectiveness of the entity’s internal control. Accordingly, we express no such opinion. An audit also includes evaluating the appropriateness of accounting policies used and the reasonableness of significant accounting estimates made by management, as well as evaluating the overall presentation of the financial statements.
We believe that the audit evidence we have obtained is sufficient and appropriate to provide a basis for our audit opinion.
Opinion
In our opinion, the financial statements referred to above present fairly, in all material respects, the financial position of GTE Mobilnet of Texas #17 Limited Partnership at December 31, 2014, and the results of its operations and its cash flows for the year then ended in conformity with U.S. generally accepted accounting principles.
December 31, 2013 and 2012 Financial Statements
The accompanying balance sheet of GTE Mobilnet of Texas #17 Limited Partnership as of December 31, 2013, and the related statements of income and comprehensive income, changes in partners’ capital and cash flows for the two years then ended were not audited, reviewed, or compiled by us and, accordingly, we do not express an opinion or any other form of assurance on them.
/s/ Ernst & Young LLP
Orlando, Florida
February 27, 2015
S-21
Table of Contents
GTE Mobilnet of Texas #17 Limited Partnership
Balance Sheets - As of December 31, 2014 and 2013
ASSETS | | 2014 | | 2013 | |
| | (Audited) | | (Unaudited) | |
| | | | | |
CURRENT ASSETS: | | | | | |
Due from affiliate | | $ | 14,306 | | $ | 11,329 | |
Accounts receivable, net of allowance of $666 and $693 | | 6,166 | | 4,791 | |
Unbilled revenue | | 2,131 | | 1,927 | |
Prepaid expenses | | 131 | | 13 | |
| | | | | |
Total current assets | | 22,734 | | 18,060 | |
| | | | | |
PROPERTY, PLANT AND EQUIPMENT - NET | | 65,194 | | 65,328 | |
| | | | | |
OTHER ASSETS | | 631 | | 28 | |
| | | | | |
TOTAL ASSETS | | $ | 88,559 | | $ | 83,416 | |
| | | | | |
LIABILITIES AND PARTNERS’ CAPITAL | | | | | |
| | | | | |
CURRENT LIABILITIES: | | | | | |
Accounts payable and accrued liabilities | | $ | 3,642 | | $ | 3,799 | |
Advance billings and customer deposits | | 2,078 | | 1,580 | |
| | | | | |
Total current liabilities | | 5,720 | | 5,379 | |
| | | | | |
LONG TERM LIABILITIES | | 1,276 | | 1,026 | |
| | | | | |
Total liabilities | | 6,996 | | 6,405 | |
| | | | | |
PARTNERS’ CAPITAL | | 81,563 | | 77,011 | |
| | | | | |
TOTAL LIABILITIES AND PARTNERS’ CAPITAL | | $ | 88,559 | | $ | 83,416 | |
See notes to financial statements.
S-22
Table of Contents
GTE Mobilnet of Texas #17 Limited Partnership
Statements of Income and Comprehensive Income - Years Ended December 31, 2014, 2013 and 2012
| | 2014 | | 2013 | | 2012 | |
| | (Audited) | | (Unaudited) | | (Unaudited) | |
| | | | | | | |
OPERATING REVENUE: | | | | | | | |
Service revenue | | $ | 113,153 | | $ | 107,693 | | $ | 95,448 | |
Equipment and other | | 9,738 | | 8,359 | | 8,660 | |
| | | | | | | |
Total operating revenue | | 122,891 | | 116,052 | | 104,108 | |
| | | | | | | |
OPERATING EXPENSES: | | | | | | | |
Cost of service (exclusive of depreciation and amortization) | | 36,454 | | 33,732 | | 32,952 | |
Depreciation and amortization | | 11,874 | | 10,126 | | 9,608 | |
Cost of equipment | | 12,892 | | 9,524 | | 10,130 | |
Selling, general and administrative | | 23,655 | | 24,596 | | 22,276 | |
| | | | | | | |
Total operating expenses | | 84,875 | | 77,978 | | 74,966 | |
OPERATING INCOME | | 38,016 | | 38,074 | | 29,142 | |
INTEREST INCOME, NET | | 36 | | 28 | | 30 | |
NET INCOME AND COMPREHENSIVE INCOME | | $ | 38,052 | | $ | 38,102 | | $ | 29,172 | |
| | | | | | | |
Allocation of Net Income: | | | | | | | |
Limited Partners | | $ | 30,441 | | $ | 30,482 | | $ | 23,338 | |
General Partner | | $ | 7,611 | | $ | 7,620 | | $ | 5,834 | |
See notes to financial statements.
S-23
Table of Contents
GTE Mobilnet of Texas #17 Limited Partnership
Statements of Changes in Partners’ Capital - Years Ended December 31, 2014, 2013 and 2012
| | General
Partner | | Limited Partners | | | |
| | San Antonio
MTA, L.P. | | Eastex
Telcom
Investments,
LLC | | Telecom
Supply, Inc | | Consolidated
Communications
Enterprise
Services, Inc. | | Verizon
Wireless
(VAW), LLC | | ALLTEL
Communications
Investments,
Inc. | | San Antonio
MTA, L.P. | | Total
Partners’
Capital | |
BALANCE—January 1, 2012 (Unaudited) | | $ | 14,348 | | $ | 12,210 | | $ | 12,210 | | $ | 12,210 | | $ | - | | $ | 12,210 | | $ | 8,549 | | $ | 71,737 | |
| | | | | | | | | | | | | | | | | |
Distributions | | (6,400 | ) | (5,447 | ) | (5,447 | ) | (5,447 | ) | - | | (5,447 | ) | (3,812 | ) | (32,000 | ) |
| | | | | | | | | | | | | | | | | |
Net Income 1/1/2012-12/12/2012 | | 5,539 | | 4,715 | | 4,715 | | 4,715 | | - | | 4,715 | | 3,300 | | 27,699 | |
| | | | | | | | | | | | | | | | | |
Net Income 12/13/2012-12/31/2012 | | 295 | | 302 | | - | | 302 | | 149 | | 251 | | 174 | | 1,473 | |
| | | | | | | | | | | | | | | | | |
Purchase of Partner’s Interest | | - | | 2,355 | | (11,478 | ) | 2,355 | | 6,768 | | - | | - | | - | |
| | | | | | | | | | | | | | | | | |
BALANCE—December 31, 2012 (Unaudited) | | 13,782 | | 14,135 | | - | | 14,135 | | 6,917 | | 11,729 | | 8,211 | | 68,909 | |
| | | | | | | | | | | | | | | | | |
Distributions | | (6,000 | ) | (6,154 | ) | - | | (6,154 | ) | (3,012 | ) | (5,106 | ) | (3,574 | ) | (30,000 | ) |
| | | | | | | | | | | | | | | | | |
Net Income | | 7,620 | | 7,816 | | - | | 7,816 | | 3,826 | | 6,485 | | 4,539 | | 38,102 | |
| | | | | | | | | | | | | | | | | |
BALANCE—December 31, 2013 (Unaudited) | | 15,402 | | 15,797 | | - | | 15,797 | | 7,731 | | 13,108 | | 9,176 | | 77,011 | |
| | | | | | | | | | | | | | | | | |
Distributions | | (6,700 | ) | (6,872 | ) | - | | (6,872 | ) | (3,363 | ) | (5,702 | ) | (3,991 | ) | (33,500 | ) |
| | | | | | | | | | | | | | | | | |
Net Income | | 7,611 | | 7,806 | | - | | 7,806 | | 3,819 | | 6,477 | | 4,533 | | 38,052 | |
| | | | | | | | | | | | | | | | | |
BALANCE—December 31, 2014 (Audited) | | $ | 16,313 | | $ | 16,731 | | $ | - | | $ | 16,731 | | $ | 8,187 | | $ | 13,883 | | $ | 9,718 | | $ | 81,563 | |
See notes to financial statements.
S-24
Table of Contents
GTE Mobilnet of Texas #17 Limited Partnership
Statements of Cash Flows - Years Ended December 31, 2014, 2013 and 2012
| | 2014 | | 2013 | | 2012 | |
| | (Audited) | | (Unaudited) | | (Unaudited) | |
CASH FLOWS FROM OPERATING ACTIVITIES: | | | | | | | |
Net Income | | $ | 38,052 | | $ | 38,102 | | $ | 29,172 | |
Adjustments to reconcile net income to net cash provided by operating activities: | | | | | | | |
Depreciation and amortization | | 11,874 | | 10,126 | | 9,608 | |
Provision for losses on accounts receivable | | 1,421 | | 1,549 | | 952 | |
Changes in certain assets and liabilities: | | | | | | | |
Accounts receivable | | (2,796 | ) | (1,661 | ) | (1,552 | ) |
Unbilled revenue | | (204 | ) | (91 | ) | 419 | |
Prepaid expenses | | (118 | ) | (1 | ) | 9 | |
Other assets | | (605 | ) | (28 | ) | - | |
Accounts payable and accrued liabilities | | 515 | | (207 | ) | 573 | |
Advance billings and customer deposits | | 498 | | 13 | | 234 | |
Long term liabilites | | 250 | | 194 | | 177 | |
| | | | | | | |
Net cash provided by operating activities | | 48,887 | | 47,996 | | 39,592 | |
| | | | | | | |
CASH FLOWS FROM INVESTING ACTIVITIES: | | | | | | | |
Capital expenditures | | (16,813 | ) | (22,131 | ) | (9,152 | ) |
Fixed asset transfers out | | 4,403 | | 3,926 | | 988 | |
Change in due from affiliate | | (2,977 | ) | 209 | | 572 | |
| | | | | | | |
Net cash used in investing activities | | (15,387 | ) | (17,996 | ) | (7,592 | ) |
| | | | | | | |
CASH FLOWS FROM FINANCING ACTIVITIES: | | | | | | | |
Distributions to partners | | (33,500 | ) | (30,000 | ) | (32,000 | ) |
| | | | | | | |
Net cash used in financing activities | | (33,500 | ) | (30,000 | ) | (32,000 | ) |
| | | | | | | |
CHANGE IN CASH | | - | | - | | - | |
| | | | | | | |
CASH—Beginning of year | | - | | - | | - | |
| | | | | | | |
CASH—End of year | | $ | - | | $ | - | | $ | - | |
| | | | | | | |
NONCASH TRANSACTIONS FROM INVESTING ACTIVITIES: | | | | | | | |
| | | | | | | |
Accruals for Capital Expenditures | | $ | 133 | | $ | 805 | | $ | 511 | |
| | | | | | | |
See notes to financial statements.
S-25
Table of Contents
GTE Mobilnet of Texas #17 Limited Partnership
Notes to Financial Statements - Years Ended December 31, 2014, 2013 and 2012
1. ORGANIZATION AND MANAGEMENT
GTE Mobilnet of Texas #17 Limited Partnership – GTE Mobilnet of Texas #17 Limited Partnership (the “Partnership” or “we”) was formed in 1989. The principal activity of the Partnership is providing cellular service in the Texas #17 rural service area.
The partners and their respective ownership percentages as of December 31, 2014, 2013 and 2012 are as follows:
General Partner: | | | | |
| | | | |
San Antonio MTA, L.P * (“General Partner”) | | 20.000000 | | % |
| | | | |
Limited Partners: | | | | |
| | | | |
Eastex Telecom Investments, LLC | | 20.512855 | | % |
Consolidated Communications Enterprises Services, Inc. ** | | 20.512855 | | % |
ALLTEL Communications Investments, Inc. * | | 17.021300 | | % |
Verizon Wireless (VAW) LLC * | | 10.038190 | | % |
San Antonio MTA, L.P * | | 11.914800 | | % |
*San Antonio MTA, L.P, (“General Partner”), Verizon Wireless (VAW) LLC and ALLTELL Communications Investments, Inc. are wholly-owned subsidiaries of Cellco Partnership (“Cellco”) doing business as Verizon Wireless.
** Consolidated Communications Enterprise Services, Inc. (“CCES”) is a wholly-owned subsidiary of Consolidated Communications Holdings, Inc.
On December 13, 2012, Telecom Supply, Inc. closed on the sale of their 17.0213% partnership interest to Verizon Wireless (VAW) LLC, Eastex and CCES resulting in an increase to those partner’s proportionate share of ownership. Accordingly, Verizon Wireless (VAW) LLC received a 10.03819% ownership interest while Eastex received an additional 3.491555% interest in the Partnership and CCES received an additional 3.491555% interest in the Partnership.
In accordance with the partnership agreement, Cellco is responsible for managing the operations of the partnership (See Note 6).
2. SIGNIFICANT ACCOUNTING POLICIES
Use of Estimates – We prepare our financial statements using U.S. generally accepted accounting principles (GAAP), which require management to make estimates and assumptions that affect reported amounts and disclosures. Actual results could differ from those estimates.
S-26
Table of Contents
Examples of significant estimates include: the allowance for doubtful accounts, the recoverability of property, plant and equipment, the recoverability of intangible assets and other long-lived assets, unbilled revenues, fair values of financial instruments, accrued expenses and contingencies.
Revenue Recognition – The Partnership offers products and services to our customers through bundled arrangements. These arrangements involve multiple deliverables which may include products, services, or a combination of products and services.
The Partnership earns revenue primarily by providing access to and usage of its network. In general, access revenue is billed one month in advance and recognized when earned. Usage revenue is generally billed in arrears and recognized when service is rendered. Equipment sales revenue associated with the sale of wireless handsets and accessories is generally recognized when the products are delivered to and accepted by the customer, as this is considered to be a separate earnings process from providing wireless services. For agreements involving the resale of third-party services in which we are considered the primary obligor in the arrangements, we record the revenue gross at the time of the sale. For equipment sales, we generally subsidize the cost of wireless devices for plans under our traditional subsidy model. The amount of this subsidy is generally contingent on the arrangement and terms selected by the customer. In multiple deliverable arrangements which involve the sale of equipment and a service contract, the equipment revenue is recognized up to the amount collected when the wireless device is sold.
In addition to the traditional subsidy model for equipment sales, we offer new and existing customers the option to participate in Verizon Edge, a program that provides eligible wireless customers with the ability to pay for handsets under an equipment installment plan. Under the Verizon Edge program, customers have the right to upgrade their handset after a minimum of 30 days, subject to certain conditions, including making a stated portion of the required device payments, trading in their handset in good working condition and signing a new contract with Verizon. Upon upgrade, the outstanding balance of the equipment installment plan is exchanged for the used handset. This trade-in right is accounted for as a guarantee obligation.
Verizon Edge is a multiple-element arrangement typically consisting of the trade-in right, handset and monthly wireless service. At the inception of the arrangement, the amount allocable to the delivered units of accounting is limited to the amount that is not contingent upon the delivery of the monthly wireless service (the noncontingent amount). The full amount of the trade-in right’s fair value (not an allocated value) will be recognized as the guarantee liability and the remaining allocable consideration will be allocated to the handset. The value of the guarantee liability effectively results in a reduction to revenue recognized for the sale of the handset. The guarantee liability is measured at fair value upon initial recognition based on assumptions lacking observable pricing inputs including the probability and timing of the customer upgrading to a new phone, the customer’s estimated remaining installment balance at the time of trade-in and the estimated fair value of the phone at the time of trade-in and therefore is classified within Level 3 of the fair value hierarchy. When the customer trades-in their used phone,
S-27
Table of Contents
the handset received is recorded to inventory and measured as the difference between the remaining equipment installment plan balance at the time of trade-in and the guarantee liability. As a result of changes in the Verizon Edge program during 2014, and corresponding changes in related assumptions, the guarantee liability associated with Verizon Edge agreements under the current program is not material. The guarantee liability may increase after initial recognition as a result of changes in facts or assumptions and we will account for any increase in the guarantee liability with a corresponding decrease to revenue. The subsequent derecognition of the guarantee liability occurs when the guarantor is released from risk, which will occur at the earlier of the time the trade-in right is exercised or expires.
Roaming revenue reflects service revenue earned by the Partnership when customers not associated with the Partnership operate in the service area of the Partnership and use the Partnership’s network. The roaming rates with third party carriers associated with those customers are based on agreements with such carriers. The roaming rates charged by the Partnership to Cellco are established by Cellco on a periodic basis and may not reflect current market rates (see Note 6).
Maintenance and Repairs – We charge the cost of maintenance and repairs, including the cost of replacing minor items not constituting substantial betterments, principally to Cost of services as these costs are incurred.
Advertising Costs– Costs for advertising products and services as well as other promotional and sponsorship costs are charged to Selling, general and administrative expense in the periods in which they are incurred.
Operating Expenses – Operating expenses include expenses incurred directly by the Partnership, as well as an allocation of selling, general and administrative, and operating costs incurred by Cellco or its affiliates on behalf of the Partnership. Employees of Cellco provide services performed on behalf of the Partnership. These employees are not employees of the Partnership, therefore operating expenses include direct and allocated charges of salary and employee benefit costs for the services provided to the Partnership. Cellco believes such allocations, principally based on the Partnership’s percentage of certain revenue streams, total customers, customer gross additions or minutes-of-use, are in accordance with the Partnership Agreement and are a reasonable method of allocating such costs.
Cost of roaming reflects costs incurred by the Partnership when customers associated with the Partnership operate in a service area not associated with the Partnership and use a network not associated with the Partnership. The roaming rates with third party carriers are based on agreements with such carriers. The roaming rates charged to the Partnership by Cellco are established by Cellco on a periodic basis and may not reflect current market rates (see Note 6).
Cost of equipment is recorded upon sale of the related equipment at Cellco’s cost basis. No inventory of equipment is maintained at the Partnership.
S-28
Table of Contents
Comprehensive Income – Comprehensive income is the same as net income as presented in the accompanying statements of income and comprehensive income.
Income Taxes – The Partnership is treated as a pass through for income tax purposes and, therefore, is not subject to federal, state or local income taxes. Accordingly, no provision has been recorded for income taxes in the Partnership’s financial statements. The results of operations, including taxable income, gains, losses, deductions and credits, are allocated to and reflected on the income tax schedules provided to the respective partners.
The Partnership files federal and state tax returns. The 2011 through 2014 federal tax years for the Partnership remain subject to examination by the Internal Revenue Service. The 2011 through 2014 tax years for the Partnership remain subject to examination by the state tax jurisdiction. Because the application of tax laws and regulations to many types of transactions is susceptible to varying interpretations, amounts reported in the financial statements could be changed at a later date upon final determination by taxing authorities.
Due from affiliate – Due from affiliate principally represents the Partnership’s cash position with Cellco. Cellco manages, on behalf of the Partnership, all cash, inventory, investing and financing activities of the Partnership. As such, the change in due from/to affiliate are reflected as an investing activity or a financing activity in the statements of cash flows depending on whether the Partnership is in a net asset or net liability position with Cellco.
Additionally, administrative and operating costs incurred by Cellco on behalf of the Partnership, as well as property, plant and equipment transactions with affiliates, are charged to the Partnership through this account. Interest income is based on the Applicable Federal Rate which was approximately 0.3%, 0.2% and 0.2% for the years ended December 31, 2014, 2013 and 2012, respectively. Interest expense is calculated by applying Cellco’s average cost of borrowing from Verizon Communications, Inc, which was approximately 5.0%, 7.4% and 7.3% for the years ended December 31, 2014, 2013 and 2012 respectively. Included in interest income, net is interest income of $25, $33 (unaudited) and $30 (unaudited) for the years ended December 31, 2014, 2013 and 2012, respectively, related to due from affiliate.
Accounts Receivable and Allowance for Doubtful Accounts – The Partnership maintains allowances for uncollectible accounts receivable for estimated losses resulting from the inability of customers to make required payments. Estimates are based on the aging of the accounts receivable balances and historical write-off experience, net of recoveries.
Impairment – All of our long-lived assets are reviewed for impairment whenever events or changes in circumstances indicate that the carrying amount of the asset may not be recoverable. If any indications are present, we test for recoverability by comparing the carrying amount of the asset group to the net undiscounted cash flows expected to be generated from the asset group. If those net undiscounted cash flows do not exceed the carrying amount, we would perform the next step, which is to determine the fair value of the asset and record an impairment, if any. We reevaluate the useful life determinations for these long-lived assets each year to determine whether events and circumstances warrant a revision in their remaining useful lives.
S-29
Table of Contents
Property, Plant and Equipment – We record plant, property and equipment at cost. Plant, property and equipment are generally depreciated on a straight-line basis.
Leasehold improvements are amortized over the shorter of the estimated life of the improvement or the remaining term of the related lease, calculated from the time the asset was placed in service.
When the depreciable assets are retired or otherwise disposed of, the related cost and accumulated depreciation are deducted from the property, plant and equipment accounts, and any gains or losses on disposition are recognized in income. Transfers of property, plant and equipment between Cellco and affiliates are recorded at net book value on the date of the transfer and included in due from affiliate.
We capitalize interest associated with the acquisition or construction of network-related assets. Capitalized interest is reported as a reduction in interest expense and depreciated as part of the cost of the network-related assets.
Wireless Licenses –Cellco maintains wireless licenses that provide our wireless operations with the exclusive right to utilize designated radio frequency spectrum to provide wireless communication services. While licenses are issued for only a fixed time, generally ten years, such licenses are subject to renewal by the Federal Communications Commission (FCC). License renewals have occurred routinely and at nominal cost. Moreover, Cellco management has determined that there are currently no legal, regulatory, contractual, competitive, economic or other factors that limit the useful life of our wireless licenses. As a result, Cellco treats the wireless licenses as an indefinite-lived intangible asset. Cellco reevaluates the useful life determination for wireless licenses each year to determine whether events and circumstances continue to support an indefinite useful life. Under the Partnership agreement, Cellco may allocate, based on a reasonable methodology, any impairment loss recognized by Cellco for licenses included in Cellco’s national footprint. Cellco evaluated their wireless licenses for potential impairment as of December 15, 2014. Cellco performed a qualitative assessment to determine whether it is more likely than not that the fair value of their wireless licenses was less than the carrying amount. As part of the assessment, they considered several qualitative factors including the business enterprise value of Cellco, macroeconomic conditions (including changes in interest rates and discount rates), industry and market considerations (including industry revenue and EBITDA (Earnings before interest, taxes, depreciation and amortization) margin projections), the projected financial performance of Cellco, as well as other factors. These evaluations resulted in no impairment of wireless licenses.
Financial Instruments – The Partnership’s trade receivables and payables are short-term in nature, and accordingly, their carrying value approximates fair value.
S-30
Table of Contents
Fair Value Measurements– Fair value of financial and non-financial assets and liabilities is defined as an exit price, representing the amount that would be received to sell an asset or paid to transfer a liability in an orderly transaction between market participants. The three-tier hierarchy for inputs used in measuring fair value, which prioritizes the inputs used in the methodologies of measuring fair value for assets and liabilities, is as follows:
Level 1 - Quoted prices in active markets for identical assets or liabilities
Level 2 - Observable inputs other than quoted prices in active markets for identical assets and liabilities
Level 3 - No observable pricing inputs in the market
Financial assets and financial liabilities are classified in their entirety based on the lowest level of input that is significant to the fair value measurements. Our assessment of the significance of a particular input to the fair value measurements requires judgment, and may affect the valuation of the assets and liabilities being measured and their placement within the fair value hierarchy.
Distributions – The Partnership is required to make distributions to its partners based upon the Partnership’s operating results, due to/from affiliate status, and financing needs as determined by the General Partner at the date of the distribution.
Recent Accounting Standards - In May 2014, the accounting standard update related to the recognition of revenue from contracts with customers was issued. This standard update clarifies the principles for recognizing revenue and develops a common revenue standard for U.S. GAAP and International Financial Reporting Standards. The standard update intends to provide a more robust framework for addressing revenue issues; improve comparability of revenue recognition practices across entities, industries, jurisdictions, and capital markets; and provide more useful information to users of financial statements through improved disclosure requirements. Upon adoption of this standard update, we expect that the allocation and timing of revenue recognition will be impacted. We expect to adopt this standard update during the first quarter of 2017.
There are two adoption methods available for implementation of the standard update related to the recognition of revenue from contracts with customers. Under one method, the guidance is applied retrospectively to contracts for each reporting period presented, subject to allowable practical expedients. Under the other method, the guidance is applied to contracts not completed as of the date of initial application, recognizing the cumulative effect of the change as an adjustment to the beginning balance of retained earnings, and also requires additional disclosures comparing the results to the previous guidance. We are currently evaluating these adoption methods and the impact that this standard update will have on our financial statements.
In January 2015, the accounting standard update related to the reporting of extraordinary and unusual items was issued. This standard update eliminates the concept of
S-31
Table of Contents
extraordinary items from U.S. GAAP as part of an initiative to reduce complexity in accounting standards while maintaining or improving the usefulness of the information provided to the users of the financial statements. The presentation and disclosure guidance for items that are unusual in nature or occur infrequently will be retained and expanded to include items that are both unusual in nature and infrequent in occurrence. This standard update is effective as of the first quarter of 2016; however, earlier adoption is permitted.
Reclassifications – Certain amounts in the 2013 and 2012 financial statements have been reclassified to conform to the 2014 presentation.
Subsequent Events – Events subsequent to December 31, 2014 have been evaluated through February 27, 2015 the date the financial statements were issued.
3. WIRELESS EQUIPMENT INSTALLMENT PLANS
We offer new and existing customers the option to participate in Verizon Edge, a program that provides eligible wireless customers with the ability to pay for their handset over a period of time (an equipment installment plan) and the right to upgrade their handset after a minimum of 30 days, subject to certain conditions, including making a stated portion of the required device payments, trading in their handset in good working condition and signing a new contract with Verizon. The current portion of gross guarantee liability related to this program, which was approximately $279 at December 31, 2014 and was not material at December 31, 2013, was primarily included in Advance billings and customer deposits on our balance sheets. The long term portion of gross guarantee liability related to this program, which was approximately $41 at December 31, 2014 and was not material at December 31, 2013, was primarily included in Other liabilities on our balance sheets.
At the time of sale, we impute risk adjusted interest on the receivables associated with Verizon Edge. We record the imputed interest as a reduction to the related accounts receivable. Interest income, which is included within Interest Income, net on our statements of income and comprehensive income, is recognized over the financed installment term.
We assess the collectability of our Verizon Edge receivables based upon a variety of factors, including the credit quality of the customer base, payment trends and other qualitative factors. The current portion of our receivables related to Verizon Edge included in Accounts receivable was $1,214 at December 31, 2014 and was not material at December 31, 2013. The long-term portion of the equipment installment plan receivables included in Other assets was $597 at December 31, 2014 and was not material at December 31, 2013.
The credit profiles of our customers with a Verizon Edge plan are similar to those of our customers with a traditional subsidized plan. Customers with a credit profile which carries a higher risk are required to make a down payment for equipment financed through Verizon Edge.
S-32
Table of Contents
4. PROPERTY, PLANT AND EQUIPMENT, NET
Property, plant and equipment - net consist of the following as of December 31, 2014 and 2013:
| | 2014 | | 2013 | | 2012 | |
| | (Audited) | | (Unaudited) | | (Unaudited) | |
Buildings and improvements (20-45 years) | | 27,618 | | 26,214 | | 24,972 | |
Wireless plant and equipment (3-15 years) | | 94,390 | | 91,392 | | 77,371 | |
Furniture, fixtures and equipment (2-10 years) | | 294 | | 294 | | 364 | |
Leasehold improvements (5 years) | | 6,898 | | 6,529 | | 5,495 | |
| | | | | | | |
| | 129,200 | | 124,429 | | 108,202 | |
Less: accumulated depreciation | | (64,006 | ) | (59,101 | ) | (51,247 | ) |
Property, plant and equipment, net | | $ | 65,194 | | $ | 65,328 | | $ | 56,955 | |
| | | | | | | |
Depreciation expense | | $ | 11,871 | | $ | 10,126 | | $ | 9,608 | |
Capitalized network engineering costs of $991 and $941 (unaudited) were recorded during the years ended December 31, 2014 and 2013, respectively. Construction in progress included in certain classifications shown above, principally wireless plant and equipment, amounted to $1,143 and $3,395 (unaudited) as of December 31, 2014 and 2013, respectively.
5. CURRENT LIABILITIES
Accounts payable and accrued liabilities consist of the following as of December 31, 2014 and 2013:
| | 2014 | | 2013 | |
| | (Audited) | | (Unaudited) | |
| | | | | |
Accounts payable | | $ | 1,510 | | $ | 2,091 | |
Non-income based taxes and regulatory fees | | 771 | | 620 | |
Texas margin tax payable | | 470 | | 397 | |
Accrued commissions | | 891 | | 691 | |
Accounts payable and accrued libilities | | $ | 3,642 | | $ | 3,799 | |
S-33
Table of Contents
Advance billings and customer deposits consist of the following as of December 31, 2014 and 2013:
| | 2014 | | 2013 | |
| | (Audited) | | (Unaudited) | |
| | | | | |
Advance billings | | $ | 1,707 | | $ | 1,456 | |
Customer deposits | | 92 | | 124 | |
Edge guarantee liability | | 279 | | - | |
Advance billings and customer deposits | | $ | 2,078 | | $ | 1,580 | |
6. TRANSACTIONS WITH AFFILIATES AND RELATED PARTIES
In addition to fixed asset purchases (see Note 2), substantially all of service revenues, equipment and other revenues, cost of service, cost of equipment, and selling, general and administrative expenses represent transactions processed by affiliates (Cellco and its related parties) on behalf of the Partnership or represent transactions with affiliates. These transactions consist of revenues and expenses that pertain to the Partnership which are processed by Cellco and directly attributed to or directly charged to the Partnership. They also include certain revenues and expenses that are processed or incurred by Cellco which are allocated to the Partnership based on factors such as the Partnership’s percentage of customers, gross customer additions, or minutes of use. These transactions do not necessarily represent arm’s length transactions and may not represent the amount of revenues and costs that would result if the Partnership operated on a standalone basis. Cellco periodically reviews the methodology and allocation bases for allocating certain revenues, operating costs, selling, administrative and general expenses to the Partnership. Resulting changes, if any, in the methodology and allocation bases have not resulted in significant changes in the allocated amounts.
Service revenues - Service revenues include monthly customer billings processed by Cellco on behalf of the Partnership and roaming revenues relating to customers of other affiliated markets that are specifically identified to the Partnership. Service revenue also includes long distance, data, and certain revenue reductions including revenue concessions that are processed by Cellco and allocated to the Partnership based on certain factors deemed appropriate by Cellco.
Equipment and other revenues - Equipment revenue includes equipment sales processed by Cellco and specifically identified to the Partnership, as well as certain handset and accessory revenues, contra-revenues including equipment concessions, and coupon rebates that are processed by Cellco and allocated to the Partnership based on certain factors deemed appropriate by Cellco. Other revenues include other fees and surcharges charged to the customer that are specifically identified to the Partnership.
Cost of Service - Cost of service includes roaming costs relating to the Partnership’s customers roaming in other affiliated markets and switch costs that are specifically
S-34
Table of Contents
identified to the Partnership. Cost of service also includes cost of telecom, long distance and application content that are incurred by Cellco and allocated to the Partnership based on certain factors deemed appropriate by Cellco. The Partnership has also entered into a lease agreement for the right to use additional spectrum owned by Cellco. See Note 7 for further information regarding this arrangement.
Cost of equipment - Cost of equipment is recorded at Cellco’s cost basis (see Note 2). Cost of equipment also includes certain costs related to handsets, accessories and other costs incurred by Cellco and allocated to the Partnership based on certain factors deemed appropriate by Cellco.
Selling, general and administrative - Selling, general and administrative expenses include commissions, customer billing, office telecom, customer care, salaries, sales and marketing and advertising expenses that are specifically identified to the Partnership as well as incurred by Cellco and allocated to the Partnership based on certain factors deemed appropriate by Cellco.
Property, plant and equipment- Property, plant and equipment includes assets purchased by Cellco and directly charged to the Partnership as well as assets transferred between Cellco and the Partnership (see Note 2).
7. COMMITMENTS
Cellco, on behalf of the Partnership, and the Partnership itself have entered into operating leases for facilities and equipment used in the Partnership’s operations. Lease contracts include renewal options that include rent expense adjustments based on the Consumer Price Index as well as annual and end-of-lease term adjustments. Rent expense is recorded on a straight-line basis. The noncancellable lease term used to calculate the amount of the straight-line rent expense is generally determined to be the initial lease term, including any optional renewal terms that are reasonably assured. Leasehold improvements related to these operating leases are amortized over the shorter of their estimated useful lives or the noncancellable lease term. For the years ended December 31, 2014, 2013 and 2012, the Partnership incurred a total of $3,803, $3,545 (unaudited) and $3,286 (unaudited), respectively, as rent expense related to these operating leases, which was included in cost of service and in the accompanying statements of income and comprehensive income.
S-35
Table of Contents
Aggregate future minimum rental commitments under noncancellable operating leases, excluding renewal options that are not reasonably assured for the years shown are as follows:
Years | | Amount | |
| | | |
2015 | | $ | 3,383 | |
2016 | | 3,047 | |
2017 | | 2,915 | |
2018 | | 2,786 | |
2019 | | 2,613 | |
2020 and thereafter | | 10,226 | |
| | | |
Total minimum payments | | $ | 24,970 | |
The Partnership has also entered into certain agreements with Cellco, whereas the Partnership leases certain spectrum from Cellco that overlaps Texas #17 rural service area. Total rent expense under these leases amounted to $817, $422 (unaudited) and $76 (unaudited) in 2014, 2013 and 2012, respectively.
Based on the terms of these leases as of December 31, 2014, future spectrum lease obligations, excluding renewal options that are not reasonably assured, are expected to be as follows:
Years | | Amount | |
| | | |
2015 | | $ | 779 | |
2016 | | 741 | |
2017 | | 741 | |
2018 | | 741 | |
2019 | | 568 | |
2020 and thereafter | | 5,522 | |
| | | |
Total minimum payments | | $ | 9,092 | |
The General Partner currently expects that the renewal option in the lease will be exercised.
8. CONTINGENCIES
Cellco and the Partnership are subject to lawsuits and other claims including class actions, product liability, patent infringement, intellectual property, antitrust, partnership disputes, and claims involving relations with resellers and agents. Cellco is also currently defending lawsuits filed against it and other participants in the wireless industry alleging various adverse effects as a result of wireless phone usage. Various consumer class action lawsuits allege that Cellco violated certain state consumer protection laws and other statutes and defrauded customers through misleading billing practices or statements. These matters may involve indemnification obligations by third parties and/or affiliated
S-36
Table of Contents
parties covering all or part of any potential damage awards against Cellco and the Partnership and/or insurance coverage. All of the above matters are subject to many uncertainties, and the outcomes are not currently predictable.
The Partnership may be allocated a portion of the damages that may result upon adjudication of these matters if the claimants prevail in their actions. In none of the currently pending matters is the amount of accrual material. An estimate of the reasonably possible loss or range of loss in excess of the amounts already accrued to either Cellco or the Partnership with respect to these matters as of December 31, 2014 cannot be made at this time due to various factors typical in contested proceedings, including (1) uncertain damage theories and demands; (2) a less than complete factual record; (3) uncertainty concerning legal theories and their resolution by courts or regulators; and (4) the unpredictable nature of the opposing party and its demands. We continuously monitor these proceedings as they develop and adjust any accrual or disclosure as needed. We do not expect that the ultimate resolution of any pending regulatory or legal matter in future periods will have a material effect on the financial condition of the Partnership, but it could have a material effect on our results of operations for a given reporting period.
9. RECONCILIATION OF ALLOWANCE FOR DOUBTFUL ACCOUNTS
| | Balance at | | Additions | | Write-offs | | Balance at | |
| | Beginning | | Charged to | | Net of | | End | |
| | of the Year | | Operations | | Recoveries | | of the Year | |
| | | | | | | | | |
| | | | | | | | | |
Accounts Receivable Allowances: | | | | | | | | | |
2014 | | $ | 693 | | $ | 1,421 | | $ | (1,448) | | $ | 666 | |
2013 (Unaudited) | | 419 | | 1,549 | | (1,275) | | 693 | |
2012 (Unaudited) | | 472 | | 952 | | (1,005) | | 419 | |
| | | | | | | | | | | | | |
******
S-37