Use these links to rapidly review the document
TABLE OF CONTENTS
TABLE OF CONTENTS 2
Table of Contents
UNITED STATES
SECURITIES AND EXCHANGE COMMISSION
Washington, D.C. 20549
FORMForm 10-K
x ANNUAL REPORT PURSUANT TO SECTION 13 OR 15(d) OF THE SECURITIES EXCHANGE ACT OF 1934
| | |
| ý | | ANNUAL REPORT PURSUANT TO SECTION 13 OR 15(d) OF THE SECURITIES
EXCHANGE ACT OF 1934 |
For the Fiscal Year Ended December 31, 2015 |
o |
|
TRANSITION REPORT PURSUANT TO SECTION 13 OR 15(d) OF THE SECURITIES
EXCHANGE ACT OF 1934 |
For the Transition Period From to
|
For the fiscal year ended December 31, 2012
o TRANSITION REPORT PURSUANT TO SECTION 13 OR 15(d) OF THE SECURITIES EXCHANGE ACT OF 1934
For the transition period from to .
Commission File NumberNo. 001-32472
DAWSON GEOPHYSICAL COMPANY
TGC INDUSTRIES, INC.
(Exact name of registrant as specified in its charter)
Texas
|
| 74-2095844
|
Texas
(State or other jurisdiction of
incorporation or organization) | | 74-2095844
(I.R.S. Employer
Identification No.) |
| | |
101 East Park Blvd., Suite 955, Plano, Texas
|
| 75074
|
(Address of principal executive offices)
| | (Zip Code)
|
508 West Wall, Suite 800, Midland, Texas 79701
(Address of Principal Executive Office) (Zip Code)
Registrant’s telephone number,Registrant's Telephone Number, including area code: (972) 881-1099432-684-3000
Securities registered pursuant to Section 12(b) of the Act:
| | |
| Title of Each Class | | Name of Exchange on Which Registered |
|---|
Common Stock, $0.01 par value $.01 per share |
| The NASDAQ Stock Market LLC |
(Title of Class)
| | (Name of exchange on which registered)
|
Securities registered pursuant to Section 12(g) of the Act:None
Indicate by check mark if the registrant is a well-known seasoned issuer, as defined in Rule 405 of the Securities Act. Yes o No ý
No x
Indicate by check mark if the registrant is not required to file reports pursuant to Section 13 or Section 15(d) of the Act. Yes o No ýx
Indicate by check mark whether the registrant: (1) has filed all reports required to be filed by Section 13 or 15 (d)15(d) of the Securities Exchange Act of 1934 during the preceding 12 months (or for such shorter period that the registrant was required to file such reports), and (2) has been subject to such filing requirements for the past 90 days. Yes ýx No o
Indicate by check mark whether the registrant has submitted electronically and posted on its corporate Website,Web site, if any, every Interactive Data File required to be submitted and posted pursuant to Rule 405 of Regulation S-T (§232.405 232 405 of thisthe chapter) during the preceding 12 months (or for such shorter period that the registrant was required to submit and post such files). Yes ýx No o
Indicate by check mark if disclosure of delinquent filers pursuant to Item 405 of Regulation S-K (§229.405) is not contained herein, and will not be contained, to the best of Registrant’sregistrant's knowledge, in definitive proxy or information statements incorporated by reference in Part III of this Form 10-K or any amendment to this Form 10-K. ox
Indicate by check mark whether the registrant is a large accelerated filer, an accelerated filer, a non-accelerated filer, or a smaller reporting company. See the definitions of “large"large accelerated filer,” “accelerated filer”" "accelerated filer" and “smaller"smaller reporting company”company" in Rule 12b-2 of the Exchange Act. (Check one):
| | | | | | |
| Large accelerated filer o | | Accelerated filer ýx |
| | |
Non-accelerated filer o
(Do not check if a
smaller reporting company) | | Smaller reporting company o |
Indicate by check mark whether the registrant is a shell company (as defined in Rule 12b-2 of the Exchange Act). Yes o No ýx
TheAs of June 30, 2015, the aggregate market value of the voting and non-votingDawson Geophysical Company common equitystock, par value $0.01 per share, held by non-affiliates computed(based upon the closing transaction price on Nasdaq) was approximately $94,238,000.
On March 11, 2016, there were 21,629,310 shares of Dawson Geophysical Company common stock, $0.01 par value outstanding.
As used in this report, the terms "we," "our," "us," "Dawson" and the "Company" refer to Dawson Geophysical Company unless the context indicates otherwise.
DOCUMENTS INCORPORATED BY REFERENCE
Portions of the Registrant's Proxy Statement for its 2016 Annual Meeting of Shareholders are incorporated by reference to the price at which the common equity was last sold asinto Part III of the last business day of the Registrant’s most recently completed second fiscal quarter was $140,940,825this Annual Report on Form 10-K.
Number
Table of sharesContents
TABLE OF CONTENTS
| | | | | | |
| |
| | Page | |
|---|
| | PART I | | | | |
Item 1. | | Business | | | 2 | |
Item 1A. | | Risk Factors | | | 7 | |
Item 1B. | | Unresolved Staff Comments | | | 17 | |
Item 2. | | Properties | | | 17 | |
Item 3. | | Legal Proceedings | | | 17 | |
| | PART II | | | | |
Item 5. | | Market for Our Common Equity and Related Stockholder Matters | | | 18 | |
Item 6. | | Selected Financial Data | | | 21 | |
Item 7. | | Management's Discussion and Analysis of Financial Condition and Results of Operations | | | 22 | |
Item 7A. | | Quantitative and Qualitative Disclosures about Market Risk | | | 33 | |
Item 8. | | Financial Statements and Supplementary Data | | | 34 | |
Item 9. | | Changes in and Disagreements with Accountants on Accounting and Financial Disclosure | | | 34 | |
Item 9A. | | Controls and Procedures | | | 34 | |
Item 9B. | | Other Information | | | 35 | |
| | PART III | | | | |
Item 10. | | Directors, Executive Officers and Corporate Governance | | | 36 | |
Item 11. | | Executive Compensation | | | 36 | |
Item 12. | | Security Ownership of Certain Beneficial Owners and Management and Related Stockholder Matters | | | 36 | |
Item 13. | | Certain Relationships and Related Transactions and Director Independence | | | 36 | |
Item 14. | | Principal Accounting Fees and Services | | | 36 | |
| | PART IV | | | | |
Item 15. | | Exhibits and Financial Statement Schedules | | | 37 | |
Signatures | | | 38 | |
Index to Financial Statements | | | F-1 | |
Index to Exhibits | | | | |
Table of Common Stock outstandingContents
DAWSON GEOPHYSICAL COMPANY
FORM 10-K
For the Fiscal Year Ended December 31, 2015
DISCLOSURE REGARDING FORWARD-LOOKING STATEMENTS
Statements other than statements of historical fact included in this Form 10-K that relate to forecasts, estimates or other expectations regarding future events, including without limitation, statements under "Management's Discussion and Analysis of Financial Condition and Results of Operations" and "Business" regarding technological advancements and our financial position, business strategy and plans and objectives of our management for future operations, may be deemed to be forward-looking statements within the meaning of Section 27A of the Securities Act and Section 21E of the Securities Exchange Act of 1934, as amended (the "Exchange Act"). When used in this Form 10-K, words such as "anticipate," "believe," "estimate," "expect," "intend" and similar expressions, as they relate to us or our management, identify forward-looking statements. Such forward-looking statements are based on the beliefs of March 1, 2013: 20,676,047
Documents incorporatedour management, as well as assumptions made by reference
Listed below are documents, partsand information currently available to management. Actual results could differ materially from those contemplated by the forward-looking statements as a result of which are incorporated herein by reference,certain factors, including but not limited to the volatility of oil and natural gas prices, dependence upon energy industry spending, industry competition, delays, reductions or cancellations of service contracts, reduced utilization, crew productivity, the type of contracts we enter into, external factors affecting our crews such as weather interruptions and inability to obtain land access rights of way, high fixed costs of our operations and our high capital requirements, limited number of clients, credit risk related to our clients, the availability of capital resources, operational disruptions, the risk that the benefits from the business combination pursuant to the Merger (as defined below) may not be fully realized or may take longer to realize than expected, the ability to promptly and effectively integrate our combined business and the partdiversion of management time on transaction-related issues. See "Risk Factors" for more information on these and other factors. These forward-looking statements reflect our current views with respect to future events and are subject to these and other risks, uncertainties and assumptions relating to our operations, results of operations, growth strategies and liquidity. The cautionary statements made in this report into which the document is incorporated:Form 10-K should be read as applying to all related forward-looking statements wherever they appear in this Form 10-K. All subsequent written and oral forward-looking statements attributable to us or persons acting on our behalf are expressly qualified in their entirety by this paragraph. We assume no obligation to update any such forward-looking statements.
Part I
Item 1. BUSINESS
General
Proxy statement for the 2013 annual meeting of shareholders — Part III
Part I
ITEM 1. BUSINESS.
General
TGC Industries, Inc. isDawson Geophysical Company, a Texas corporation and its wholly-owned subsidiary, Eagle Canada, Inc., a Delaware corporation (collectively “TGC” or the “Company”(the "Company"), are primarily engaged inis a leading provider of North America onshore seismic data acquisition services with operations throughout the geophysical service business of conducting three-dimensional (“3-D”) surveyscontinental United States and Canada. We acquire and process 2-D, 3-D and multi-component seismic data for our clients, in theranging from major oil and gas business. TGC’scompanies to independent oil and gas operators as well as providers of multi-client data libraries. Our principal business office is located at 101 E. Park Blvd.508 West Wall, Suite 800, Midland, Texas 79701 (Telephone: 432-684-3000), Suite 955, Plano, Texas 75074 (Telephone: 972-881-1099). TGC’sand our internet address is www.tgcseismic.com. TGC makeswww.dawson3d.com. We make available free of charge on itsour website itsour annual reports on Form 10-K, quarterly reports on Form 10-Q, and current reports on Form 8-K as soon as reasonably practicable after filing or furnishing such information with the Securities and Exchange Commission.
History
In April of 1980, SupremeOn February 11, 2015, the Company, which was formerly known as TGC Industries, Inc. (“Supreme”("Legacy TGC"), consummated a strategic business combination with Dawson Operating Company, which was formerly ESI Industries, Inc.known as Dawson Geophysical Company ("Legacy Dawson"), formedpursuant to which a wholly-owned
Table of Contents
subsidiary of Legacy TGC merged with and into Legacy Dawson, with Legacy Dawson continuing after the merger as the surviving entity and a wholly-owned subsidiary Tidelandsof Legacy TGC (the "Merger"). In connection with the Merger, Legacy Dawson changed its name to "Dawson Operating Company" and Legacy TGC changed its name to "Dawson Geophysical Co., Inc. (“Tidelands”) that acquired certain equipment, instruments,Company." Legacy TGC was formed in 1980. Legacy Dawson was formed in 1952.
Except as otherwise specifically noted herein, references herein to the "Company," "we," "us" or "our" refer to post-combination Dawson Geophysical Company and related supplies from a Houston-based corporation that was engaged in the business of conductingits consolidated subsidiaries, including Legacy Dawson.
We provide our seismic gravity, and magnetic surveys under contracts fordata acquisition services primarily to onshore oil and natural gas companies. On June 30, 1986, the Boards of Directors of Supremeexploration and Tidelands approved a spin-off of substantially all of the shares of Tidelands owned by Supreme which were distributed as a stock dividend to Supreme’s security holders. In July of 1986, our name was changed from “Tidelands Geophysical Co., Inc.” to “TGC Industries, Inc.” (“TGC”). On October 19, 2009, we disclosed our entry into an agreement regarding the acquisition of the stock of Eagle Canada, Inc. (“Eagle Canada”), a Delaware corporation. Eagle Canada was a wholly-owned subsidiary of Eagle Geophysical, Inc. and Eagle Geophysical Onshore, Inc. (the “Debtors”) which were debtors in a Chapter 11 bankruptcy proceeding in Houston, Texas. Eagle Canada isdevelopment companies for use in the businessonshore drilling and production of providing seismic dataoil and surveying services to the Canadian energy industry and has its principal place of business locatednatural gas in Calgary, Alberta, Canada. By Order dated October 14, 2009, the Bankruptcy Court approved the sale of the Eagle Canada stock by the Debtors to TGC and authorized the Debtors to enter into a stock purchase agreement with TGC. In accordance with the terms of the stock purchase agreement, the sale transaction closed on October 16, 2009, with TGC acquiring the Eagle Canada stock for a total purchase price of approximately $10.3 million paid from existing cash.
We are a leading provider of seismic data acquisition services throughout the continental United States and Canada.Canada as well as providers of multi-client data libraries. The main factors influencing demand for seismic data acquisition services in our industry are the level of drilling activity by oil and natural gas companies and the sizes of such companies' exploration and development budgets, which, in turn, depend largely on current and anticipated future crude oil and natural gas prices and depletion rates of the companies' oil and natural gas reserves.
As of December 31, 2012,2015, we operated 14ten seismic crews, consisting of nineeight crews in the U.S.United States and two crews in Canada, and one seismic data processing center. During the three months ended December 31, 2015, we operated a maximum of ten crews in the United States and two in Canada. We are currently operating five crews in Canada. Thesethe United States with limited activity in Canada as the Canadian winter operating season comes to an end. We anticipate operating between four and six crews in the United States with limited activity in Canada into the second quarter of 2016. Visibility for active crew count beyond the second quarter is limited due to uncertainty in oil prices and demand levels. Demand for our services is likely to be at reduced levels in North America in response to the reduced expenditures by our clients related to the recent drop in crude oil prices. Our seismic crews supply seismic data primarily to companies engaged in the exploration and development of oil and natural gas on land and in land-to-water transition areas. Eagle Canada’s seismicSeismic acquisition services of our wholly-owned subsidiary, Eagle Canada, Inc. ("Eagle Canada"), are also used by the potash mining industry in Canada, and Eagle Canada has particular expertise through its heliportable capabilities. Our customersclients rely on seismic data to identify areas where subsurface conditions are favorable for the accumulation of existing hydrocarbons, to optimize the development and production of hydrocarbon reservoirs, to better delineate existing oil and natural gas fields, and to augment reservoir management techniques.
We acquire geophysical data using the latest in 3-D seismic survey techniques. We introduce acoustic energy into the ground by using vibration equipment or dynamite detonation, depending on the surface terrain, area of operation, and subsurface requirements. The reflected energy, or echoes, is received through geophones, converted into a digital signal at a multi-channel recording unit, and then transmitted to a central recording vehicle. Subsurface requirements dictate the number of channels necessary to perform our services. We generally use thousands of recording channels in our seismic surveys. Additional recording channels enhance the resolution of the seismic survey through increased imaging analysis and provide improved operational efficiencies for our clients. With our state-of-the-art seismic equipment, including computer technology and multiple channels, we acquire, on a cost effective basis, immense volumes of seismic data that, when processed and interpreted, produce more precise images of the earth’searth's subsurface. Our customersclients then use our seismic data to generate 3-D geologic models that help reduce drilling risks, finding and development costs and improve recovery rates from existing wells.fields.
In addition to conventional 2-D and 3-D seismic surveys, we provide what the industry refers to as multi-component seismic data surveys. Multi-component surveys involve the recording of alternative seismic waves known as shear waves. Shear waves can be recorded as wave conversion of conventional energy sources (3-C converted waves) or from horizontal vibrator energy source units (shear wave vibrators). Multi-component data are utilized in further analysis of subsurface rock type, fabric and
Table of Contents
reservoir characterization. We own equipment required for onshore multi-component surveys. The majority of the projects in Canada require multi-component recording equipment. We have operated one to two multi-component equipped crews in the United States routinely over the past few years. The use of multi-component seismic data could increase in North America over the next few years if industry conditions improve and potentially require capital expenditures for additional equipment.
In recent years, we have begun providing surface-recorded microseismic services utilizing equipment we currently own. Microseismic monitoring is used by clients who use hydraulic fracturing to extract hydrocarbon deposits to monitor their hydraulic fracturing operations.
We market and supplement our services in the continental United States from our headquarters in Midland, Texas and from additional offices in three other cities in Texas (Denison, Houston and Plano) as well as two additional states, Oklahoma (Oklahoma City) and Colorado (Denver). In addition, we market and supplement our services in Canada from our facilities in Calgary, Alberta.
The Industry
Technological advances in seismic equipment and computing allow the seismic industry to acquire and process, on a cost-effective basis, immense volumes of seismic data which produce precise images of the earth’searth's subsurface. The latest accepted method of seismic data acquisition, processing, and the subsequent interpretation of the processed data is the 3-D seismic method. Geophysicists use computer workstations to interpret 3-D data volumes, identify subsurface anomalies, and generate a geologic model of subsurface features. In contrast with the 3-D method, the 2-D method involves the collection of seismic data in a linear fashion, thus generating a single plane of subsurface seismic data.
2
3-D seismic data are used in the exploration and development of new reserves and enable oil and natural gas companies to better delineate existing fields and to augment their reservoir management techniques. Benefits of incorporating high resolution 3-D seismic surveys into exploration and development programs include reducing drilling risk, decreasing oil and natural gas finding costs, and increasing the efficiencies of reservoir location, delineation, and management. In order to meet the requirements necessary to fully realize the benefits of 3-D seismic data, there is an increasing demand for improved data quality with greater subsurface resolution.
Currently, the North American seismic data acquisition industry is made up of a number of companies divided into two groups. The first group is made up of four publicly-traded companies with long operating histories that field numerous crews and work in a number of different regions and terrain.companies. This group includes us, Dawson Geophysical Company, Geokinetics,SAExploration Holdings, Inc., ("SAE") and CGG-Veritas. These companies field approximately 50% of the seismic crews currently operating in the continental U.S. and Canada.Tesla Exploration, Ltd. ("Tesla"). The second group is made up of Geokinetics, Inc. ("Geokinetics"), Global Geophysical Services, Inc. ("Global Geophysical"), Breckenridge Geophysical Inc. ("Breckenridge"), Paragon Geophysical Services, Inc. ("Paragon"), LoneStar Geophysical Surveys ("LoneStar"), and smaller companies which generally run one or two seismic crews and often specialize in specific regions or types of operations.
We provide our seismic data acquisition services primarily to onshore oil and natural gas exploration and development companies for use in the onshore drilling and production of oil and natural gas in the continental U.S. and Canada. The main factors influencing demand for seismic data acquisition services in our industry are the levels of drilling activity by oil and natural gas companies and the sizes of such companies’ exploration and development budgets, which, in turn, depend largely on current and anticipated future crude oil and natural gas prices and depletion rates.
Equipment and Crews
During 2010, 2011 and 2012, anIn recent years, we have experienced continued increases in recording channel capacity on a per crew or project basis. This increase in channel count demand is driven by client needs and is necessary in order to produce higher resolution images, increase crew efficiencies and undertake larger scale projects. Due to the increase in demand for seismic services allowedhigher channel counts, we have continued our investments in additional channels. In response to project-based channel requirements, we routinely deploy a variable number of channels on a variable number of crews in an effort to maximize asset utilization and meet client needs. While the number of recording systems we own may exceed the number utilized in the field at any given time, we maintain the excess equipment to provide additional operational flexibility and to allow us to quickly deploy additional recording channels and energy source units as needed to respond to client demand and desire for an expansionimproved data quality with greater subsurface images. We believe we will realize the
Table of Contents
benefit of increased channel counts and flexibility of deployment through increased crew efficiencies, higher revenues and margins in improved conditions.
In addition, since 2011, we have purchased or leased a significant number of cable-less recording channels. We have utilized this equipment primarily as stand-alone recording systems, but on occasion we have utilized it in conjunction with our cable-based systems. As a result of the Company’sintroduction of cable-less recording systems, we have realized increased crew count from sixefficiencies and increased revenue on projects using this equipment. We believe we will experience continued demand for cable-less recording systems in the future. While we have replaced cable-based recording equipment with cable-less equipment on certain crews, atthe cable-based recording equipment continues to be deployed on existing crews.
As of December 31, 2009 to 11 crews at December 31, 2010, to 12 crews at December 31, 2011, and to 14 crews at December 31, 2012.
In June of 2010, the Company acquired a new 3,000 channel OYO Geospace Seismic Recording System (“GSR System”). This new GSR System uses cable-free/radio-free autonomous nodal data recorders which have a built-in GPS and disciplined clock. The GSR System provides for up to 30 days of continuous data recording. This system is fully compatible with our current ARAM recording equipment. In addition, our crews continue to utilize the state-of-the-art ARAM ARIES recording systems. These systems employ cable telemetry technology enhanced by multiple baseline and redundant cable connections that provide seismic data acquisition services with increased reliability. In January of 2011, the Company acquired its second new 3,000 channel GSR system financed by a note payable with a commercial lender, and in April of 2011 the Company purchased an additional 2,500 channels with existing cash that were added to this system. In May of 2011, the Company purchased five new INOVA vibration vehicles with existing cash. In July of 2011, the Company acquired its third new GSR system financed by a note payable with a commercial bank. The third GSR system contains 5,000 channels. In September of 20112015, we purchased with existing cash an additional 5,000 channels of ARAM equipment to supplement existing ARAM systems. In October of 2011 the Company purchased two new INOVA vibration vehicles with existing cash. In November of 2011 the Company purchased an additional 3,000 channels of GSR equipment with existing cash. In January of 2012 we purchased an additional 14,200 channels of GSR equipment financed by existing cash and a note payable with a commercial bank. In April of 2012 the Company purchased seven new INOVA vibration vehicles with existing cash. Also in April of 2012 the Company purchased 13,000 channels of GSR equipment financed partially with existing cash and partially by a note payable with a commercial bank. In October of 2012 we purchased 8,000 stations of 3-channel GSX wireless recording system, along with all peripheral equipment. GSX wireless recording systems are the most current GSR wireless recording systems available. The purchase of the OYO Geospace GSX recording system equipment was financed partially with existing cash and partially by a note payable with a commercial bank.
We currently ownowned equipment for 1622 land-based seismic data acquisition crews, 217 vibrator energy source units, approximately 248,000 recording channels and 73 vibration vehicles.22 central recording systems. Of the 22 recording systems we owned at December 31, 2015, 12 were Geospace Technologies GSR cable-less recording systems, eight were ARAM ARIES cable-based recording systems, one was a Wireless Seismic RT System 2 system, and one was a cable-less INOVA Hawk system. Each crew consists of approximately 40 to 80100 technicians with associated vehicles, geophones, a seismic recording system, energy sources, cables, and a variety of other equipment. Each ARAM crew has one central recording vehicle which captures seismic data. The GSR, GSX and GSXINOVA Hawk crews utilize a recorder to manage the data acquisition while the individual system captures and holds the data until they are placed in the Data Transfer Module. The data is then transferred to a CD ROM orvarious data tapestorage media, which isare delivered to a data processing center selected by the customer.
client.
3
Equipment Acquisition and Capital Expenditures
We believe that it is essential to take advantage ofmonitor and evaluate advances in seismicgeophysical technology and to commit capital funds to purchase and updatethe equipment we deem most effective to maintain our equipmentcompetitive position cost-effectively. Purchasing and updating seismic equipment and technology involves a commitment to capital spending. We also tie our capital expenditures closely to demand for our services. As a result duringof the year ended December 31, 2012continuing softening in demand for seismic services beginning in early 2014 and the Company's belief that its current equipment base is sufficient to meet current demand, the Company has adopted a maintenance capital expenditures of approximately $57,108,000 were used to acquire, maintain,program and replace seismichas generally curtailed large equipment and vehicles. Major purchases in 2012 included our fourth GSR System with 7,200 channels, our fifth GSR System with 7,000 channels, our sixth GSR System with 13,000 channels, some of which were added to existing systems, an 8,000 station 3-channel GSX wireless recording system, and seven new INOVA vibration vehicles. During the year ended December 31, 2011 capital expenditures of approximately $30,730,000 were used to acquire, maintain, and replace seismic equipment and vehicles. Major purchases in 2011 included our second GSR System with 3,000 channels to which we added an additional 2,500 channels, our third GSR System with 5,000 channels, an additional 3,000 GSR System channels which were added to existing systems, 5,000 additional ARAM channels, and seven new INOVA vibration vehicles. During the year ended December 31, 2010 capital expenditures of approximately $15,226,000 were used to acquire, maintain, and replace seismic equipment and vehicles. Major purchases in 2010 included a new 3,000 channel GSR System, approximately 5,000 additional GSR System channels and 8,500 additional ARAM channels. These major investments should continue to bring us the benefits of these new technologies and allow us to be in a cash building mode in 2013.purchases.
Clients
Customers
Our customers are major and independent oil and natural gas exploration and development companies. The services we provide to our customers vary according to the size and needs of each customer. Our services are marketed by supervisory and executive personnel who contact customersclients to determine theirgeophysical needs and respond to customerclient inquiries regarding the availability of crews. Contactscrews or processing schedules. These contacts are based principally upon professional relationships developed over a number of years.
Our clients range from major oil and gas companies to small independent oil and gas operators and also providers of multi-client data libraries. The services we provide to our clients vary according to the size and needs of each client. During 2012, our largest customer accounted for approximately 16% of revenues. During 2011, our largest customer accounted for approximately 17% of revenues. During 2010, our largest customer accounted for approximately 15% of revenues. Atthe twelve months ended December 31, 20122015, sales to two clients represented more than 36% of our revenue. The remaining balance of our revenue was derived from varied clients and December 31, 2011,none represented 10% or more of our backlog was approximately $81 millionrevenues. We anticipate that sales to these two clients will represent a smaller percentage of our overall revenues during 2016.
We do not acquire seismic data for our own account or for future sale, maintain multi-client seismic data libraries or participate in oil and $118 million, respectively, allgas ventures. The results of which we anticipate filling during fiscal years 2013 and 2012, respectively. Dueseismic surveys conducted for a client belong to that client. It is also our backlog, we would not expect the losspolicy that none of any single customer to have a material adverse effect on our operations.
In order to avoid potential conflicts of interest with our customers, we do notofficers, directors or employees actively participate in oil and natural gas ventures. The results of a seismic survey conducted for a customer belong to that customer. All of our customers’clients' information is maintained in the strictest confidence.
Table of Contents
Domestic and Foreign Operations
We derive our revenue from domestic and foreign sources. Total revenues for the twelve months ended December 31, 2015 were approximately $234,685,000, of which $222,154,000 were earned in the United States and $12,531,000 were earned in Canada. Total revenue for the twelve months ended December 31, 2014 were approximately $244,304,000, of which $240,751,000 were earned in the United Stated and $3,553,000 were earned in Canada.
Long lived assets as of December 31, 2015 were approximately $345,619,000, with $329,467,000 owned in the United States and $16,152,000 owned in Canada. Long lived assets as of December 31, 2014 were approximately $339,245,000, with $337,945,000 owned in the United States and $1,300,000 owned in Canada.
Contracts
Our contracts are obtained either through competitive bidding or as a result of customerclient negotiations. Our services are conducted under general service agreements for seismic data acquisition services which define certain obligations for us and for our customers.clients. A supplemental agreement setting forth the terms of a specific project, which may be cancelledcanceled by either party upon 30 days’ advance writtenon short notice, is entered into for every project. We currently operate under supplemental agreements that are either “turnkey”"turnkey" agreements providing for a fixed fee to be paid to us for each unit of data acquired or “term”"term" agreements providing for a fixed hourly, daily, or monthly fee during the term of the project or projects.
Currently, as in recent years, most of our projects are operated under turnkey agreements. Turnkey agreements generally provide us more profit potential, but involve more risks because of the potential of crew downtime or operational delays. We attempt to negotiate on a project-by-project basis some level of weather downtime protection within the turnkey agreements. Under the term agreements, we forego an increased profit potential in exchange for a more consistent revenue stream with improved protection from crew downtime or operational delays.
Competition
The acquisition of seismic data for the oil and natural gas industry is a highly competitive business. Contracts for such services generally are awarded on the basis of price quotations, crew experience, and the availability of crews to perform in a timely manner, although factors other than price, such as crew safety, performance history, and technological and operational expertise, are often determinative. Our competition includes publicly traded competitors, such as Tesla and SAE. Our other major competitors include companies with financial resources that are significantly greater than our own as well as companies of comparableGeokinetics, Global Geophysical, Breckenridge, Paragon and smaller size. Our primary competitors are Dawson Geophysical Company, Geokinetics, Inc. and CGG-Veritas.LoneStar. In addition to thethese previously named companies, we also compete for projects from time to time with smaller seismic companies which operate in local markets with only one or two crews. Further, the barriers to entry in the seismic industry are not prohibitive, and it would not be difficult for seismic companies outside of the United States to enter the United States market and compete with us.
Employees
4
Employees
As of December 31, 2012,2015, we employed a total of 1,052over 1,125 full-time (non-union) employees, of which 31approximately 150 consisted of management, sales, and administrative personnel with the remainder being crew and crew support personnel. Our employees are not represented by a labor union. We believe our relationshipwe have good relations with our employees to be satisfactory.employees.
Operating Risks and Insurance
Our business is subject to the hazards inherent in conducting seismic data acquisition activities in hostile environments with dangerous machinery, and in some instances explosives. These activities can cause personal injury or loss of life, damage to or destruction of property, equipment, the environment, and marine life, and suspension of operations.
In addition, we could be subject to personal injury or real property damage claims in the normal operationSee "Item 2. Properties" for a description of our business. Such claims may not be covered by the indemnification provisionsmaterial properties utilized in our general service agreements to the extent that the damage is due to our negligence or intentional misconduct.business.
Table of Contents
Item 1A. RISK FACTORS
We do not carry insurance against certain risks that we could experience such as business interruption resulting from equipment maintenance or weather delays. We obtain insurance against certain property and personal casualty risks and other risks when such insurance is available and when our management considers it advisable to do so. Currently, our insurance coverage consists of employers’ liability with limits of $1,000,000 per accident and $2,000,000 in the aggregate, commercial general liability of $1,000,000 per accident and $2,000,000 in the aggregate, pollution liability of $1,000,000 per accident and $2,000,000 in the aggregate, and automobile liability with a $1,000,000 combined single limit, and a $20,000,000 umbrella policy. Our general service agreements require us to have specific amounts of insurance. Management feels that the Company’s insurance coverage is adequate. There can be no assurance, however, that any insurance obtained by us will be adequate to cover any losses or liabilities, or that this insurance will continue to be available or available on terms which are acceptable to us. Liabilities for which we are not insured, or which exceed the policy limits of our applicable insurance, could have a material adverse effect on us.
ITEM 1A. RISK FACTORS
AnyAn investment in our common stock involvesis subject to a high degreenumber of risk.risks, including those discussed below. You should carefully consider the risks and uncertainties described belowthese discussions of risk and the other information included in this Form 10-K before purchasing10-K. These risk factors could affect our common stock.actual results and should be considered carefully when evaluating us. Although the risks described below are the risks that we believe are material, they are not the only risks relating to our business, our industry and our common stock. Additional risks and uncertainties, including those that are not yet identified or that we currently believe are immaterial, may also adversely affect our business, financial condition or results of operations. If any of the events described below occur, our business, and financial condition or results of operations could be materially and adversely affected. The market price
We derive substantially all of our common stock could decline due to any of these risks, perhaps significantly, and you could lose part or all of your investment.
Company Risks
We may incur losses.
We reported net income of approximately $15,672,000 for the year ended December 31, 2012, compared to $10,833,000 for the year ended December 31, 2011, and a net loss of approximately $1,223,000 for the year ended December 31, 2010. We also reported net income for the years ended December 31, 2009, 2008, and 2007. Our ability to be profitablerevenues from companies in the future will depend on many factors beyond our control, but primarily on the level of demand for land-based seismic data acquisition services by oil and natural gas exploration and development companies. Evenindustry, as well as providers of multi-client data libraries which serve common clients in the industry. The oil and natural gas industry is a historically cyclical industry which is currently experiencing a severe downturn, with levels of activity that are significantly affected by the levels and volatility of oil and natural gas prices.
Demand for our services depends upon the level of expenditures by oil and natural gas companies for exploration, production, development and field management activities, which depend primarily on oil and natural gas prices. The oil and natural gas industry is currently experiencing a severe downturn. Significant declines in oil and natural gas exploration activities and oil and natural gas prices have adversely affected the demand for our services and our results of operations in the past as well as currently and will continue to do so if we do achieve profitability, we may not be ablethe level of such exploration activities and the prices for oil and natural gas were to sustaindecline in the future or if the current downturn is extended or becomes more severe. In addition to the market prices of oil and natural gas, the willingness of our clients to explore, develop and produce depends largely upon prevailing industry conditions that are influenced by numerous factors over which our management has no control, including general economic conditions and the availability of credit. Any prolonged reduction in the overall level of exploration and development activities, whether resulting from changes in oil and natural gas prices or otherwise, could adversely impact us in many ways by negatively affecting:
- •
- our revenues, cash flows, and profitability;
- •
- our ability to maintain or increase
profitabilityour borrowing capacity;
- •
- our ability to obtain additional capital to finance our business and the cost of that capital; and
- •
- our ability to attract and retain skilled personnel whom we would need in the event of an upturn in the demand for our services.
Worldwide political, economic, and military events have contributed to oil and natural gas price volatility and are likely to continue to do so in the future. Depending on a quarterlythe market prices of oil and natural gas, oil and natural gas exploration and development companies may cancel or annual basis.
An economic downturn could adversely affectcurtail their capital expenditure and drilling programs, thereby reducing demand for our revenues and cash flows.
An economic downturn could adversely affect our revenues and cash flows if our customers, and/services, or potential customers,may become unable to pay, or musthave to delay payment of, amounts owingowed to us for our services. Oil and natural gas prices have been highly volatile historically and, we believe, will continue to be so in the Company because such customersfuture. Many factors beyond our control affect oil and natural gas prices, including:
- •
- the cost of exploring for, producing, and delivering oil and natural gas;
- •
- the discovery rate of new oil and natural gas reserves;
- •
- the rate of decline of existing and new oil and natural gas reserves;
- •
- available pipeline and other oil and natural gas transportation capacity;
- •
- the ability of oil and natural gas companies to raise capital and debt financing;
Table of Contents
- •
- actions by OPEC (the Organization of Petroleum Exporting Countries);
- •
- political instability in the Middle East and other major oil and natural gas producing regions;
- •
- economic conditions in the United States and elsewhere;
- •
- domestic and foreign tax policy;
- •
- domestic and foreign energy policy including increased emphasis on alternative sources of energy;
- •
- weather conditions in the United States, Canada and elsewhere;
- •
- the pace adopted by foreign governments for the exploration, development, and production of their national reserves;
- •
- the price of foreign imports of oil and natural gas; and
- •
- the overall supply and demand for oil and natural gas.
We and our clients may be adversely affected by an economic downturn.
An economic downturn could have a material adverse effect on our financial results and proposed plan of operations and could lead to further significant fluctuations in the demand for and pricing of oil and gas. Reduced demand and pricing pressures could adversely affect the financial condition and results of operations of our clients and their ability to purchase our services. We are not successfulable to predict the timing, extent, and duration of the economic cycles in generatingthe markets in which we operate. The oil and natural gas industry is currently experiencing a severe downturn and prices for oil and natural gas have been in decline since the fourth quarter of 2014. If the current downturn continues for an extended period of time, or if it becomes more extreme, it may have material adverse effects on our planned operations, level of capital expenditures and financial condition.
A limited number of clients operating in a single industry account for a significant portion of our revenues, or are precluded from securing necessary financing.and the loss of one of these clients could adversely affect our results of operations.
We derive a significant amount of our revenues from a relatively small number of oil and gas exploration and development companies and providers of multi-client data libraries. During the twelve months ended December 31, 2015, our two largest clients accounted for approximately 36% of our revenues. If either of these clients, or any of our other significant clients, were to terminate their contracts or fail to contract for our services in the future because they are acquired, alter their exploration or development strategy, experience financial difficulties or for any other reason, our results of operations could be adversely affected.
5 Our clients could delay, reduce or cancel their service contracts with us on short notice, which may lead to lower than expected demand and revenues.
Our order book reflects client commitments at levels we believe are sufficient to maintain operations on our existing crews for the indicated periods. However, our clients can delay, reduce or cancel their service contracts with us on short notice. If the current downturn in the oil and natural gas industry continues for an extended period of time, or if it becomes more extreme, it may result in an increase in delays, reductions or cancellations by our clients. In addition, the timing of the origination and completion of projects and when projects are awarded and contracted for is also uncertain. As a result, our order book as of any particular date may not be indicative of actual demand and revenues for any succeeding fiscal period.
Table of Contents
Our revenues, and operating results and cash flows can be expected to fluctuate from period to period.
Our revenues, operating results, and profitability may fluctuate from period to period. These fluctuations are attributable to the level of new business in a particular period, the timing of the initiation, progress or cancellation of significant projects, higher revenues and expenses on our dynamite contracts, and costs we incur to train new crews we may add in the future to meet increased customerclient demand. Fluctuations in our operating results may also be affected by other factors that are outside of our control such as permit delays, weather delays and crew productivity. Oil and natural gas prices have continued to be volatile, during the year ended December 31, 2012, and have resulted in significant demand fluctuations for our services. The current downturn in the oil and natural gas industry and the related sustained declines in oil and natural gas commodity prices have resulted in declines in the demand for our services. There can be no assurance of future oil and gas price levels or stability. Our operations in Canada are also seasonal as a result of the thawing season and we have historically experienced limited Canadian activity for the second and third quarters of each year. The demand for our services will be adversely affected by a significant reduction in oil and natural gas prices and by climate change legislation or material changes to U.S. energy policy. SinceBecause our business has high fixed costs, the negative effect of one or more of these factors could trigger wide variations in our operating revenues, cash flows, EBITDA margin, and profitability from quarter to quarter, which factors renderquarter-to-quarter, rendering quarter-to-quarter comparisons unreliable as an indicator of performance. Due to the factors discussed above, you should not expect sequential growth in our quarterly revenues and profitability.
We extend credit to our clients without requiring collateral and a default by a client could have a material adverse effect on our operating revenues.
We perform ongoing credit evaluations of our clients' financial conditions and, generally, require no collateral from our clients. It is possible that one or more of our clients will become financially distressed, especially in light of the current downturn in the oil and natural gas industry and low commodity prices, which could cause them to default on their obligations to us and could reduce the client's future need for seismic services provided by us. Our concentration of clients may also increase our overall exposure to these credit risks. A default in payment from one of our large clients could have a material adverse effect on our operating revenues for the period involved.
We incur losses.
We incurred net losses of $26,279,000 and $14,714,000 for the twelve months ended December 31, 2015 and 2014, respectively.
Our ability to be profitable in the future will depend on many factors beyond our control, but primarily on the level of demand for land-based seismic data acquisition services by oil and natural gas exploration and development companies. Even if we do achieve profitability, we may not be able to sustain or increase profitability on a quarterly or annual basis.
We have indebtedness under credit facilities with commercial banks, and certain of our core assets and our accounts receivable are pledged as collateral for these obligations. Our ability to borrow may be limited if our accounts receivable decrease.
We have indebtedness under credit facilities with commercial banks, and certain of our core assets as well as our accounts receivable are pledged as collateral for these borrowings. If we are unable to repay all secured borrowings when due, whether at maturity or if declared due and payable following a default, our lenders have the right to proceed against the assets pledged to secure the indebtedness and may sell these assets in order to repay those borrowings, which could materially harm our business, financial condition and results of operations. Our ability to borrow funds under our revolving line of credit is tied to the amount of our eligible accounts receivable. If our accounts receivable decrease materially for any reason,
Table of Contents
including due to delays, reductions or cancellations by clients or decreased demand for our services, our ability to borrow to fund operations or other obligations may be limited.
Our financial results could be adversely affected by asset impairments.
We periodically review our portfolio of equipment and our intangible assets for impairment. In connection with the Merger, we recorded intangibles associated with the combination of Legacy TGC and Legacy Dawson that are an asset on our consolidated balance sheet. Future events, including our financial performance, sustained decreases in oil and natural gas prices, reduced demand for our services, our market valuation or the market valuation of comparable companies, loss of a significant client's business, failure to realize the benefits of the Merger, or strategic decisions, could cause us to conclude that impairment indicators exist and ultimately that the asset values associated with our equipment or our intangibles, if any, were to be impaired. If we were to impair our equipment or intangibles, these noncash asset impairments could negatively affect our financial results in a material manner in the period in which they are recorded, and the larger the amount of any impairment that may be taken, the greater the impact such impairment may have on our financial results.
Our profitability is determined, in part, by the utilization level and productivity of our crews and is affected by numerous external factors that are beyond our control.
Our revenue is determined, in part, by the contract price we receive for our services, the level of utilization of our data acquisition crews and the productivity of these crews. Crew utilization and productivity is partly a function of external factors, such as client cancellation or delay of projects, operating delays from inclement weather, obtaining land access rights and other factors, over which we have no control. If our crews encounter operational difficulties or delays on any data acquisition survey, our results of operations may vary, and in some cases, may be adversely affected.
In recent years, most of our projects have been performed on a turnkey basis for which we were paid a fixed price for a defined scope of work or unit of data acquired. The revenue, cost and gross profit realized under our turnkey contracts can vary from our estimates because of changes in job conditions, variations in labor and equipment productivity or because of the performance of our subcontractors. Turnkey contracts may also cause us to bear substantially all of the risks of business interruption caused by external factors over which we may have no control, such as weather, obtaining land access rights, crew downtime or operational delays. These variations, delays and risks inherent in turnkey contracts may result in reducing our profitability.
We face intense competition in our business from companies with greater financial resources.that could result in downward pricing pressure and the loss of market share.
The seismic data acquisition services industry is a highly competitive business in the continental U.S. and Canada. Our competitors include companies with financial resources that are significantly greater than our own as well as companies of comparable and smaller size. Additionally, the seismic data acquisition business is extremely price competitive and has a history of periods in which seismic contractors bid jobs below cost and therefore adversely affect industry pricing. Many contracts are awarded on a bid basis, which may further increase competition based primarily on price. Further, the barriers to entry in the seismic industry are not prohibitive, and it would not be difficult for seismic companies outside of the U.S. to enter the U.S. market and compete with us.
Inclement weather may adversely affect our ability to complete projects and could therefore adversely affect our results of operations.
Our seismic data acquisition operations could be adversely affected by inclement weather conditions. Delays associated with weather conditions could adversely affect our results of operations. For example,
Table of Contents
weather delays could affect our operations on a particular project or an entire region and could lengthen the time to complete data acquisition projects. In addition, even if we negotiate weather protection provisions in our contracts, we may not be fully compensated by our clients for the delay caused by the inclement weather.
We Our operations are subject to Canadian foreign currency exchangedelays related to obtaining land access rights of way from third parties which could affect our results of operations.
Our seismic data acquisition operations could be adversely affected by our inability to obtain timely right of way usage from both public and private land and/or mineral owners. We cannot begin surveys on property without obtaining permits from governmental entities as well as the permission of the private landowners who own the land being surveyed. In recent years, it has become more difficult, costly and time-consuming to obtain access rights of way as drilling activities have expanded into more populated areas. Additionally, while landowners generally are cooperative in granting access rights, some have become more resistant to seismic and drilling activities occurring on their property. In addition, governmental entities do not always grant permits within the time periods expected. Delays associated with obtaining such rights of way could negatively affect our results of operations.
Capital requirements for our operations are large. If we are unable to finance these requirements, we may not be able to maintain our competitive advantage.
Seismic data acquisition and data processing technologies historically have progressed steadily, and we expect this trend to continue. In order to remain competitive, we must continue to invest additional capital to maintain, upgrade and expand our seismic data acquisition capabilities. Our working capital requirements remain high, primarily due to the expansion of our infrastructure in response to client demand for cable-less recording systems and more recording channels, which has increased as the industry strives for improved data quality with greater subsurface resolution images. Our sources of working capital are limited. We have historically funded our working capital requirements primarily with cash generated from operations, cash reserves and from time to time borrowings from commercial banks. In recent years we have funded some of our capital expenditures through equipment term loans and capital leases. In the past, we have also funded our capital expenditures and other financing needs through public equity offerings. If we were to expand our operations at a rate risk.
We conduct business in Canada which subjectsexceeding operating cash flow, if current demand or pricing of geophysical services were to decrease substantially or if technical advances or competitive pressures required us to foreign currency exchange rate risk. Our results of operations andacquire new equipment faster than our cash flowsflow could sustain, additional financing could be impacted by changes in foreign currency exchange rates.required. If we were not able to obtain such financing or renew our existing revolving line of credit when needed, our failure could have a negative impact on our ability to pursue expansion and maintain our competitive advantage.
Technological change in our business creates risks of technological obsolescence and requirements for future capital expenditures. If we are unable to keep up with these technological advances, we may not be able to compete effectively.
Seismic data acquisition technologies historically have steadily improved and progressed, and we expect this progression to continue. Our strategy is to upgrade our seismic data acquisition equipment on a regular basis to maintain our competitive position. However, since weWe are in a capital intensive industry, and in order to remain competitive, we must continue to invest additional capital to maintain, upgrade and expand our seismic data acquisition capabilities. However, we may have limitations on our ability to obtain the financing necessary to enable us to purchase state-of-the-art equipment, someand certain of our competitors may be able to purchase newer equipment when we may not be able to do so.so, thus affecting our ability to compete.
We rely on a limited number of key suppliers for specific seismic services and equipment.
We depend on a limited number of third parties to supply us with specific seismic services and equipment. From time to time, increased demand for seismic data acquisition services has decreased the
Table of Contents
available supply of new seismic equipment, resulting in extended delivery dates on orders of new equipment. Any delay in obtaining equipment could delay our deployment of additional crews and restrict the productivity of existing crews, adversely affecting our business and results of operations. In addition, any adverse change in the terms of our suppliers' arrangements could affect our results of operations.
Some of our suppliers may also be our competitors. If competitive pressures were to become such that our suppliers would no longer sell to us, we would not be able to easily replace the technology with equipment that communicates effectively with our existing technology, thereby impairing our ability to conduct our business.
We are dependent on our management team and key employees, and the loss of any of themour inability to retain our current team or attract new employees could harm our business.
We have limited management depth with the result that theOur continued success depends upon attracting and retaining highly skilled professionals and other technical personnel. A number of our employees are highly skilled scientists and highly trained technicians. The loss, whether by death, departure or illness, of Wayne A. Whitener, our President and Chief Executive Officer,senior executives or other senior executives,key employees or our failure to continue to attract and retain skilled and technically knowledgeable personnel could adversely affect our ability to compete in the seismic services industry. We may experience significant competition for such personnel, particularly during periods of increased demand for seismic services. A limited number of our employees are under employment contracts, and we have a material adverse effectno key man insurance.
We may fail to realize the anticipated benefits of the Merger, which could adversely affect the value of our common stock.
The success of the Merger will depend, in part, on our ability to manage effectively the businesses of Legacy TGC and Legacy Dawson and realize the anticipated benefits from the combination of Legacy TGC and Legacy Dawson. We believe that these anticipated benefits, which include the expansion of our geographic diversity, an increase in seismic crew utilization rates due to an expanded order book and the ability to enhance efficiencies because of managementlogistical improvements and expanded support services capabilities, are achievable. However, it is possible that we will not be able to continue operationsachieve these benefits fully, or at all, or will not be able to achieve them within the same level of efficiency.anticipated timeframe.
We have key man insurance on the life of our President and Chief Executive Officer so that, in the event of his untimely death, we would receive insurance proceeds of $1,000,000 under this policy.
Certain members of our management team are not subject to employment or non-competition agreements and may leave our employment at any time.
Our President and Chief Executive Officer, the President, Vice President of Operations, and the Operations Manager of Eagle Canada, and a salesman, are subject to employment agreementsCanadian foreign currency exchange rate risk.
We conduct business in Canada which subjects us to foreign currency exchange rate risk. Currently, we do not hold or issue foreign currency forward contracts, option contracts or other derivative financial instruments to mitigate the currency exchange rate risk. Our results of operations and non-competition agreements. Membersour cash flows could be impacted by changes in foreign currency exchange rates.
Our common stock has experienced, and may continue to experience, price volatility and low trading volume.
Our stock price is subject to significant volatility. Overall market conditions, including a decline in oil and natural gas prices and other risks and uncertainties described in this "Risk Factors" section and in our other filings with the Securities and Exchange Commission, could cause the market price of our management team whocommon stock to fall. Our high and low sales price following the Merger through December 31, 2015 was $7.31 and $2.93, respectively.
Our common stock is listed on the Nasdaq Global Select Market under the symbol "DWSN." However, daily trading volumes for our common stock are, not subjectand may continue to employment or non-competition agreements could leave upon little or no notice, which could have a material adverse effect on our management’s abilitybe, relatively small compared to continue operationsmany other publicly traded securities. It may be difficult for shares to be sold in the public market at any given time at prevailing prices, and the same level of effectiveness. Additionally, the lack of non-competition agreements would allow these membersprice of our management team to immediately begin working for one of our competitors upon the termination of their relationship with us. This could have a negative impact on our strategic plan and our relationships with customers.common stock may, therefore, be volatile.
6
Table of Contents
We extend credit to our customers without requiring collateral, Our common stock currently trades below $5.00 per share, and as a default byresult it may be considered a customer could have a material adverse effect on our operating revenues.
We perform ongoing credit evaluations of our customers’ financial conditionslow-priced stock and generally, require no collateral from our customers. A default in payment from one of our large customers could have a material adverse effect on our operating revenues for the period involved.
Certain of our core assets are pledged as collateral for short term notes that require large monthly payments.
Certain assets that are critical to our operations, including eight vibration vehicles, a 5,000 channel OYO Geospace GSR recording system, acquired in 2010, a 5,000 channel GSR system, acquired in 2011, an additional 7,200 channels of GSR equipment acquired in 2012, two GSR Systems with a total of 13,000 channels acquired in 2012, and an 8,000 station GSX system acquired in 2012 are pledged as collateral to our equipment lenders and commercial banks and couldmay be subject to foreclosureregulations that limit or restrict the potential market for the stock.
Our common stock may be considered a low-priced stock pursuant to rules promulgated under Section 15(g) of the Securities Exchange Act of 1934, as amended. The rules apply to non-NASDAQ listed companies whose stock trades below a price of $5.00 per share or that have tangible net worth of less than $5,000,000. These rules require, among other things, that broker-dealers participating in transactions in low-priced securities with persons other than "established customers" complete certain documentation, make suitability inquiries of investors and provide investors with certain information concerning trading in the eventsecurity, including a risk disclosure document and quote information under certain circumstances. Broker-dealers must also disclose these restrictions in writing and provide monthly account statements to the client, and obtain specific written consent of the client. Many brokers have decided not to trade low-priced stock because of the requirements of the rules and, as a result, the number of broker-dealers willing to act as market makers in such securities is limited. With these restrictions, the likely effect of a designation as a low-price stock would be to decrease the willingness of broker-dealers to make a market for our common stock, to decrease the liquidity of the stock and to increase the transaction costs of sales and purchase of such stocks compared to other securities. As of December 31, 2015, our common stock was quoted at a closing sales price of $3.46 per share, and as of March 11, 2016, our common stock was quoted at a closing sales price of $4.34 per share. We cannot guarantee that our common stock will trade at a price greater than $5.00 per share in the future.
We do not expect to pay cash dividends on our common stock for the foreseeable future, and therefore only appreciation of the price of our common stock may provide a return to shareholders.
While there are currently no restrictions prohibiting us from paying dividends to our shareholders, our board of directors, after consideration of general economic and market conditions affecting the energy industry in general, and the oilfield services business in particular, determined that we defaultwould not pay a dividend in respect of our common stock for the foreseeable future. Payment of any dividends in the future will be at the discretion of our board and will depend on our indebtedness having 36financial condition, results of operations, capital and legal requirements, and other factors deemed relevant by the board.
Certain provisions of our amended and restated certificate of formation may make it difficult for a third party to 57 month terms. We currently have debt obligations coveringacquire us in the purchasefuture or may adversely impact your ability to obtain a premium in connection with a future change of this equipmentcontrol transaction.
Our amended restated certificate of formation, as amended, contains provisions that require monthly payments between approximately $50,000the approval of holders of 80% of our issued and $223,000.outstanding shares before we may merge or consolidate with or into another corporation or entity or sell all or substantially all of our assets to another corporation or entity. Additionally, if we increase the size of our board from the current eight directors to nine directors, we could by resolution of the board of directors stagger the directors' terms, and our directors could not be removed without approval of holders of 80% of our issued and outstanding shares. These debt obligations mature at various dates ranging from Februaryprovisions could discourage or impede a tender offer, proxy contest or other similar transaction involving control of 2013us.
In addition, our board of directors has the right to January of 2017. Any declineissue preferred stock upon such terms and conditions as it deems to be in our operations could inhibit our ability to make these substantial monthly payments. In view of the shortbest interest. The terms of these notes, a failure to makesuch preferred stock may adversely impact the monthly payments on these notes could cause our lenders to foreclose quickly on the assets securing these notes. The foreclosure on certaindividend and liquidation rights of our core assets securing these notes could severely limitcommon shareholders without the approval of our ability to continue operations.common shareholders.
We may be subject to liability claims that are not covered by our insurance.
Our business is subject to the general risks inherent in land-based seismic data acquisition activities. Our activities are often conducted in remote areas under dangerous conditions, including the detonation of dynamite. These operations are subject to risks of injury to personnel and damage to equipment. Our
Table of Contents
crews are mobile, and equipment and personnel are subject to vehicular accidents. These risks could cause us to experience equipment losses, injuries to our personnel, and interruptions in our business.
In addition, we could be subject to personal injury or real property damage claims in the normal operation of our business. Such claims may not be covered under the indemnification provisions contained in our general service agreements to the extent that the damage is due to our negligence or intentional misconduct.
WeOur general service agreements require us to have specific amounts of insurance. However, we do not carry insurance against certain risks that could cause losses, including business interruption resulting from equipment maintenance or weather delays (see “Operating Risks and Insurance”).
Our general service agreements require us to have specific amounts of insurance. Theredelays. Further, there can be no assurance, however, that any insurance obtained by us will be adequate to cover all losses or liabilities or that this insurance will continue to be available or available on terms which are acceptable to us. Liabilities for which we are not insured, or which exceed the policy limits of our applicable insurance, could have a materially adverse effect on us.
We may be held liable for the actions of our subcontractors.
We are subjectoften work as the general contractor on seismic data acquisition surveys and, consequently, engage a number of subcontractors to perform services and provide products. While we obtain contractual indemnification and insurance covering the requirementsacts of Section 404 ofthese subcontractors and require the Sarbanes-Oxley Act. Ifsubcontractors to obtain insurance for our benefit, we are unable to maintain compliance with Section 404, or if the costs related to maintaining compliance are significant, our profitability, stock price, and results of operations and financial condition could be materially adversely affected.
If we are unable to maintain adequate internal controls in accordance with Section 404, as such standards are amended, supplemented, or modified from time to time, we may not be able to ensure that we have effective internal controls over financial reporting on an ongoing basis in accordance with Section 404. Failure to achieve and maintain effective internal controls could have a material adverse effect on our stock price.held liable for the actions of these subcontractors. In addition, a material weakness in the effectiveness ofsubcontractors may cause injury to our internal control over financial reporting could result in an increased chance of fraud and the loss of customers, reducepersonnel or damage to our ability to obtain financing, and/or require additional expenditures to comply with these requirements, each of which could negatively impact our business, profitability, and financial condition.
property that is not fully covered by insurance.
7
Industry Risks
We and our customers may be adversely affected by an economic downturn.
An economic downturn could have a material adverse effect on our financial results and proposed plan of operations and could lead to further significant fluctuations in the demand for and pricing of oil and gas. Reduced demand and pricing pressures could adversely affect the financial condition and results of operations of our customers and their ability to purchase our services. We are not able to predict the timing, extent, and duration of the economic cycles in the markets in which we operate.
We derive nearly all of our revenues from companies in the oil and natural gas exploration and development industry, a historically cyclical industry, with levels of activity that are significantly affected by the levels and volatility of oil and natural gas prices.
Any prolonged reduction in the overall level of exploration and development activities, whether resulting from changes in oil and natural gas prices or otherwise, could adversely impact us in many ways by negatively affecting:
·our revenues, cash flows, and profitability;
·our ability to maintain or increase our borrowing capacity;
·our ability to obtain additional capital to finance our business and the cost of that capital; and
·our ability to attract and retain skilled personnel whom we would need in the event of an upturn in the demand for our services.
Worldwide political, economic, and military events have contributed to oil and natural gas price volatility and are likely to continue to do so in the future. Depending on the market prices of oil and natural gas, oil and natural gas exploration and development companies may cancel or curtail their drilling programs, thereby reducing demand for our services. Oil and natural gas prices have been highly volatile historically and, we believe, will continue to be so in the future. Many factors beyond our control affect oil and natural gas prices including:
·the cost of exploring for, producing, and delivering oil and natural gas;
·the discovery rate of new oil and natural gas reserves;
·the rate of decline of existing and new oil and natural gas reserves;
·available pipeline and other oil and natural gas transportation capacity;
·the ability of oil and natural gas companies to raise capital;
·actions by OPEC (the Organization of Petroleum Exporting Countries);
·political instability in the Middle East and other major oil and natural gas producing regions;
·economic conditions in the U.S. and elsewhere;
·domestic and foreign tax policy;
·domestic and foreign energy policy including the ever increasing emphasis on alternative sources of energy;
·weather conditions in the U.S. and elsewhere;
·the pace adopted by foreign governments for the exploration, development, and production of their national reserves;
·the price of foreign imports of oil and natural gas; and
·the overall supply and demand for oil and natural gas.
8
The high fixed costs of our operations could result in operating losses.
Companies within our industry are typically subject to high fixed costs which consist primarily of depreciation (a non-cash item) and maintenance expenses associated with seismic data acquisition and equipment and crew costs. In addition, ongoing maintenance capital expenditures, as well as new equipment investment, can be significant. As a result, any extended periods of significant downtime or low productivity caused by reduced demand, weather interruptions, equipment failures, permit delays, or other causes could adversely affectresult in operating losses.
We operate under hazardous conditions that subject us to risk of damage to property or personnel injuries and may interrupt our business.
Our business is subject to the resultsgeneral risks inherent in land-based seismic data acquisition activities. Our activities are often conducted in remote areas under extreme weather and other dangerous conditions, including the use of our operations.
Ourdynamite as an energy source. These operations are subject to delays relatedrisks of injury to obtaining land access rights of way fromour personnel and third parties and damage to our equipment and improvements in the areas in which we operate. In addition, our crews often operate in areas where the risk of wildfires is present and may be increased by our activities. Our crews are mobile, and equipment and personnel are subject to vehicular accidents. We use diesel fuel which is classified by the U.S. Department of Transportation as a hazardous material. These risks could cause us to experience equipment losses, injuries to our personnel and interruptions in our business. Delays due to operational disruptions such as equipment losses, personnel injuries and business interruptions could adversely affect our results of operations.
Our seismic data acquisition operations could be adversely affected by our inability to obtain timely right of way usage from both publicprofitability and private land and/or mineral owners. Delays associated with obtaining such rights of way could negatively affect our results of operations.
Loss of our information and computer systems could adversely affect our business.
We are heavily dependent on our information systems and computer-based programs, including our seismic information, electronic data processing and accounting data. If any of such programs or systems were to fail or create erroneous information in our hardware or software network infrastructure, or if we were subject to cyberspace breaches or attacks, possible consequences include our loss of communication
Table of Contents
links, loss of seismic data and inability to automatically process commercial transactions or engage in similar automated or computerized business activities. Any such consequence could have a material adverse effect on our business.
Our business could be negatively impacted by security threats, including cyber-security threats and other disruptions.
We face various security threats, including cyber-security threats to gain unauthorized access to sensitive information or to render data or systems unusable, threats to the safety of our employees, threats to the security of our facilities and infrastructure and threats from terrorist acts. Cyber-security attacks in particular are evolving and include, but are not limited to, malicious software, attempts to gain unauthorized access to data and other electronic security breaches that could lead to disruptions in critical systems, unauthorized release of confidential or otherwise protected information and corruption of data. Although we utilize various procedures and controls to monitor and protect against these threats and to mitigate our exposure to such threats, there can be no assurance that these procedures and controls will be sufficient in preventing security threats from materializing. If any of these events were to materialize, they could lead to losses of sensitive information, critical infrastructure, personnel or capabilities essential to our operations and could have a material adverse effect on our reputation, financial position, results of operations or cash flows.
Our business is subject to government regulation whichthat may adversely affect our future operations.
Our operations are subject to a variety of federal, state, and provincial and local laws and regulations, including laws and regulations relating to the protection of the environment and archeological sites and those that may result from climate change legislation. Canadian operations have been historically cyclical due to governmental restrictions on seismic acquisition during certain periods. As a result, there is a risk that there will be a significant amount of unused equipment during those periods. We are required to expend financial and managerial resources to comply with such laws and related permit requirements in our operations, and we anticipate that we will continue to be required to do so in the future. Although such expenditures historically have not been material to us, the fact that such laws or regulations change frequently makes it impossible for us to predict the cost or impact of such laws and regulations on our future operations. The adoption of laws and regulations that have the effect of reducing or curtailing exploration and development activities by energy companies could also adversely affect our operations by reducing the demand for our services.
Risks Related To Our Common Stock
Our common stock has experienced, Current and may continuefuture legislation or regulation relating to experience, price volatilityclimate change or hydraulic fracturing could negatively affect the exploration and low trading volume.
Our stock price is subject to significant volatility. Overall market conditions, including a decline inproduction of oil and natural gas pricesand adversely affect demand for our services.
In response to concerns suggesting that emissions of certain gases, commonly referred to as "greenhouse gases" (GHG) (including carbon dioxide and methane) may be contributing to global climate change, legislative and regulatory measures to address the concerns are in various phases of discussion or implementation at the national and state levels. At least one-half of the states, either individually or through multi-state regional initiatives, have already taken legal measures intended to reduce GHG emissions, primarily through the planned development of GHG emission inventories and/or GHG cap and trade programs. Although various climate change legislative measures have been under consideration by the U.S. Congress, it is not possible at this time to predict whether or when Congress may act on climate change legislation. The U.S. Environmental Protection Agency (the "EPA") has promulgated a series of rulemakings and taken other actions that the EPA states will result in the regulation of GHG as "air pollutants" under the existing federal Clean Air Act. Furthermore, in 2010, EPA regulations became effective that require monitoring and reporting of GHG emissions on an annual basis, including extensive GHG monitoring and reporting requirements. While this new rule does not control GHG emission levels from any facilities, it will cause covered facilities to incur monitoring and reporting costs. Moreover,
Table of Contents
lawsuits have been filed seeking to require individual companies to reduce GHG emissions from their operations. These and other riskslawsuits relating to GHG emissions may result in decisions by state and uncertainties describedfederal courts and agencies that could impact our operations.
This increasing governmental focus on global warming may result in this “Risk Factors” sectionnew environmental laws or regulations that may negatively affect us, our suppliers and elsewhere in this Form 10-K,our clients. This could cause the market priceus to incur additional direct costs in complying with any new environmental regulations, as well as increased indirect costs resulting from our clients, suppliers or both incurring additional compliance costs that get passed on to us. Moreover, passage of climate change legislation or other federal or state legislative or regulatory initiatives that regulate or restrict emissions of GHG may curtail production and demand for fossil fuels such as oil and gas in areas where our common stock to fall. The highclients operate and low sales pricesthus adversely affect future demand for our services. Reductions in our revenues or increases in our expenses as a result of climate control initiatives could have adverse effects on our common stock for the year ended December 31, 2012, were $11.55business, financial position, results of operations and $5.96, respectively.prospects.
Our common stockHydraulic fracturing is listedan important and commonly used process in the completion of oil and gas wells. Hydraulic fracturing involves the injection of water, sand and chemical additives under pressure into rock formations to stimulate gas production. Due to public concerns raised regarding potential impacts of hydraulic fracturing on groundwater quality, legislative and regulatory efforts at the NASDAQ Stock Market LLCfederal level and in some states have been initiated to require or make more stringent the permitting and compliance requirements for hydraulic fracturing operations. At the federal level, a bill was introduced in Congress in March 2011 entitled, the "Fracturing Responsibility and Awareness of Chemicals Act," or the "FRAC Act," that would amend the federal Safe Drinking Water Act, or the "SDWA," to repeal an exemption from regulation for hydraulic fracturing. If the FRAC Act or similar legislation in the next Congress were enacted, the definition of "underground injection" in the SDWA would be amended to encompass hydraulic fracturing activities. Such a provision could require hydraulic fracturing operations to meet permitting and financial assurance requirements, adhere to certain construction specifications, fulfill monitoring, reporting, and recordkeeping obligations and meet plugging and abandonment requirements. The FRAC Act also proposes to require the reporting and public disclosure of chemicals used in the fracturing process, which could make it easier for third parties opposing the hydraulic fracturing process to initiate legal proceedings based on allegations that specific chemicals used in the fracturing process could adversely affect groundwater. In early 2010, the EPA indicated in a website posting that it intended to regulate hydraulic fracturing under the symbol “TGE.” However, daily trading volumesSDWA and require permitting for our common stock are, and may continue to be, relatively small compared to many other publicly traded securities. For example, during 2012 our daily trading volumeany well where hydraulic fracturing was conducted with the use of diesel as lowan additive. While industry groups have challenged the EPA's website posting as 13,176 shares. It may be difficult for you to sell your shares inimproper rulemaking, the public market at any given time at prevailing prices, and the price of our common stock may, therefore, be volatile.
Our officers and directors own a large percentage of our common stock, and they may exercise control over our business and affairs.
Our officers and directors as a group beneficially own approximately 29% of our common stock. As a result, they will continue to be able to exercise significant influence, and in most cases control, over matters requiring shareholder approval, including the election of directors, changes to our charter documents, and significant corporate transactions. This concentration of ownership makes it unlikely that any other holder or group of holders of our common stock will be able to affect the way we are managed or the direction of our business. The continued concentrated ownership of our common stock will make it difficult for another company to acquire us and for you to receive any related takeover premium for your shares (unless the controlling group approves the acquisition).
9
Certain provisions of our Restated Articles of Incorporation may make it difficult for a third party to acquire us or may adversely impact your rights as a common shareholder.
Our Restated Articles of Incorporation contain provisions thatAgency's position, if upheld, could require the approval of holders of 80% of our issued and outstanding shares before we can enter into a merger or other business combination or sell all or substantially all of our assets. Additionally, if we increase the size of our board from the current six to nine directors, we could be required to stagger our directors’ terms, and our directors could not be removed without approval of holders of 80% of our issued and outstanding shares. These provisions could discourage or impede a tender offer, proxy contest, or other similar transaction involving control of us.
additional permitting. In addition, our board of directors hasin March 2010 the right to issue preferred stock upon such terms and conditions as it deems to be in the best interestEPA commenced a study of the Company. The terms of such preferred stockpotential adverse effects that hydraulic fracturing may adversely impact the dividendhave on water quality and liquidation rightspublic health, and a committee of the common shareholders without the approvalU.S. House of the common shareholders.
We paid our first cash dividend in 2012 but may not pay cash dividends on our common stock in the foreseeable future, and therefore only appreciation of the price of our common stock may provideRepresentatives has commenced its own investigation into hydraulic fracturing practices. The EPA released a return to our shareholders.
We paid our first cash dividendprogress report in December 2012, but mayit did not pay cash dividends on our common stock in the foreseeable future. While there are currently no restrictions prohibiting us from paying dividends to our shareholders, it is at the discretioninclude results of the boardresearch. In May 2014, the EPA indicated it would convene a stakeholder process to develop an approach to obtain information on chemical substances and mixtures used in hydraulic fracturing. The EPA issued a draft report in June 2015, concluding that, although hydraulic fracturing activities have the potential to impact drinking water resources through water withdrawals, spills, fracturing directly into such resources, underground migration of directors whetherliquids and gases, and inadequate treatment and discharge of wastewater, EPA did not find evidence that these mechanisms have led to widespread, systemic impacts on drinking water resources. However, the Company pays any cash dividendsdraft report did identify important vulnerabilities to drinking water. The draft report has not yet been finalized. These legislative and regulatory initiatives imposing additional reporting obligations on, or otherwise limiting, the hydraulic fracturing process could make it more difficult or costly to complete natural gas wells. Shale gas cannot be economically produced without extensive fracturing. In the event such legislation is enacted, demand for our commonseismic acquisition services may be adversely affected.
Table of Contents
We are subject to the requirements of Section 404 of the Sarbanes-Oxley Act. If we are unable to maintain compliance with Section 404, or if the costs related to maintaining compliance are significant, our profitability, stock in the foreseeable futureprice, and will depend on our financial condition, results of operations capital and legal requirements, and other factors deemed relevant by our board of directors. Earnings, if any, are expected tofinancial condition could be retained to fund our future operations. On May 14, 2012 and May 14, 2010, the Company paid 5% stock dividends to its shareholders. No stock dividends were declared or paid in 2011.materially adversely affected.
If we are unable to maintain adequate internal controls in accordance with Section 404, as such standards are amended, supplemented, or modified from time to time, we may not be able to ensure that we have effective internal controls over financial reporting on an ongoing basis in accordance with Section 404. Failure to achieve and maintain effective internal controls could have a material adverse effect on our stock price. In addition, a material weakness in the effectiveness of our internal control over financial reporting could result in an increased chance of fraud and the loss of clients, reduce our ability to obtain financing, and/or require additional expenditures to comply with these requirements, each of which could negatively impact our business, profitability, and financial condition.
ITEM Item 1B. UNRESOLVED STAFF COMMENTS.COMMENTS
None.
None Item 2. PROPERTIES
ITEM 2. DESCRIPTION OF PROPERTY.
Our Houston sales office isheadquarters are located in a 1,711-square34,570 square foot facility. The monthly rent is currently $3,279. Our corporate officeleased property in Plano, Texas was increased from 8,523Midland, Texas. We have two other properties in Midland, including a 61,402 square feet to 10,137 square feet of office space in March of 2012. The monthly rent is currently $14,784. We lease an 800-square foot facility in Oklahoma City, Oklahoma,property that we own and use as a salesfield office, onequipment and fabrication facility and maintenance and repair shop. We also own a month-to-month basis6,600 square foot property that we use as an inventory field office and the current monthly rent is $665.storage facility.
We lease a 400-square foot facilityalso have additional offices in Pratt, Kansas, as a permit office on a month-to-month basisthree other cities in Texas: Denison, Houston and the current monthly rent is $500. In October 2012, we expanded ourPlano. Our Denison Texas repair warehouse facility with the addition of a third 10,000-square foot building. The Denison, Texas, facility consists of one 5,000-square foot building, three 10,000-square foot adjacent buildings, and an outdoor storage area of approximately 60,500 square feet. The monthly rentOur Houston sales office is currently $16,547.in a 10,041-square foot facility. Our office in Plano, Texas consists of 10,137 square feet of office space.
We also lease a 3,443-square foot facility in Denver, Colorado, as a sales office. We lease a 915-square7,480 and 1,094-square foot office facility in Midland, Texas,Oklahoma City, Oklahoma, as a sales office with a monthly rent of $915. Upon the acquisition of Eagle Canada, we assumed aoffices.
We lease for 3,030 square feet of office space located in Calgary, Alberta. The monthly rent is currently $12,817. In addition, Eagle Canada leases a 10,088-square7,423-square foot facility, also located in Calgary, Alberta, that is used as a shop and warehouse. The monthly rent is currently $8,041. In April of 2012, we leasedWe also lease a storage and parking area adjacent tonear the Eagle Canada shop and warehouse. The monthly rent is currently $5,126. The Company is not responsible for insuring these facilities. The conditions of these
We believe that our existing facilities are good,being appropriately utilized in line with past experience and we believe that these properties are well maintained, suitable for their intended use and adequate forto meet our foreseeable needs.current and future operating requirements.
Item 3. LEGAL PROCEEDINGS
ITEM 3. LEGAL PROCEEDINGS.
The Company isFrom time to time, we are a defendant inparty to various legal actions that arose or may arise out ofproceedings arising in the normalordinary course of business. InAlthough we cannot predict the outcomes of any such legal proceedings, our opinion, nonemanagement believes that the resolution of thesepending legal actions will not have a material adverse effect on our financial condition, results of operations or will result in any significant loss to us.liquidity.
For a discussion of certain contingencies affecting the Company, please refer to Note 16, "Commitments and Contingencies" to the Consolidated Financial Statements included herein, which is incorporated by reference herein.
ITEM Item 4. MINE SAFETY DISCLOSURES.DISCLOSURES
Not applicable.
None.
Table of Contents
10Part II
PART II
ITEM Item 5. MARKET FOR REGISTRANT’SOUR COMMON EQUITY AND RELATED STOCKHOLDER MATTERS AND ISSUER PURCHASES OF EQUITY SECURITIES.
Market Prices
On April 18, 2005, we began tradingOur common stock trades on the NYSE Amex (formerly the AmericanNasdaq Stock Exchange) (“AMEX”) under our current trading symbol “TGE.” On October 26, 2007, we announced that our board of directors approved the decision to switch the listing of our common stock from AMEX to the NASDAQ Global Select Market (“NASDAQ.”) As a result, on November 6, 2007, our stock began trading on NASDAQMarket® under the symbol “TGE.”
"DWSN." The following table showsbelow represents the high and low sales prices per share for the period shown for Legacy TGC prior to the Merger and for the combined Company after the Merger.
| | | | | | | |
Three Months Ended | | High(1) | | Low(1) | |
|---|
March 31, 2014 | | $ | 7.45 | | $ | 5.66 | |
June 30, 2014 | | $ | 6.12 | | $ | 4.24 | |
September 30, 2014 | | $ | 5.76 | | $ | 3.69 | |
December 31, 2014 | | $ | 3.92 | | $ | 1.93 | |
March 31, 2015 | | $ | 7.31 | | $ | 1.90 | |
June 30, 2015 | | $ | 6.11 | | $ | 4.22 | |
September 30, 2015 | | $ | 5.38 | | $ | 3.34 | |
December 31, 2015 | | $ | 4.63 | | $ | 2.93 | |
- (1)
- The high and low stock price provided for periods prior to February 11, 2015 was calculated by dividing the historical Legacy TGC high or low price by three to account for the 1-for-3 reverse stock split undertaken by Legacy TGC in connection with the Merger. The high and low stock price provided for periods after February 11, 2015 reflect the stock price of the combined Company following the Merger as reported on the Nasdaq Stock Market under the symbol "DWSN".
The table below represents the high and low sales prices per share for the period shown for Legacy Dawson prior to the Merger.
| | | | | | | |
Three Months Ended | | High(2) | | Low(2) | |
|---|
March 31, 2014 | | $ | 19.83 | | $ | 15.66 | |
June 30, 2014 | | $ | 17.55 | | $ | 14.47 | |
September 30, 2014 | | $ | 16.59 | | $ | 10.32 | |
December 31, 2014 | | $ | 10.66 | | $ | 5.91 | |
February 11, 2015 | | $ | 7.13 | | $ | 5.86 | |
- (2)
- The high and low stock price provided for periods prior to February 11, 2015 was calculated by dividing the historical Legacy Dawson high or low price by the merger conversion factor of 1.76.
As of March 11, 2016, the market price for our common stock on NASDAQ during 2012was $4.34 per share, and 2011. On December 27, 2012 the Company paid its first cash dividend of $0.15 perwe had 103 common share to shareholdersstockholders of record, at the close of businessas reported by our transfer agent.
Legacy Dawson paid quarterly dividends in 2014, with its last quarterly dividend paid on December 17, 2012. On May 14, 2012 the Company paid 5% stock8, 2014. Legacy Dawson did not pay any dividends to shareholders of record at the close of business on April 30, 2012. Noin 2015. Legacy TGC last paid cash ordividends in 2012 and last paid stock dividends were declaredin 2013. Legacy TGC did not pay any dividends to shareholders in 2014 or paid in 2011. All prior share and per share amounts have been restated to reflect the stock dividends.
| | 2012 | | 2011 | |
| | High | | Low | | High | | Low | |
| | | | | | | | | |
1st quarter | | $ | 10.83 | | $ | 7.09 | | $ | 7.92 | | $ | 3.66 | |
2nd quarter | | 11.55 | | 8.69 | | 8.23 | | 5.64 | |
3rd quarter | | 10.46 | | 5.96 | | 7.65 | | 4.35 | |
4th quarter | | 8.39 | | 6.46 | | 8.58 | | 4.11 | |
| | | | | | | | | | | | | |
The number of shareholders of record of TGE’s common stock as of March 1, 2013, was 160. Due to the number of shares held in nominee or street name, we believe that2015. While there are currently no restrictions prohibiting us from paying dividends to our shareholders, our board of directors, after consideration of general economic and market conditions affecting the energy industry in general, and the oilfield services business in particular, determined that we would not pay a significantly greater number of beneficial ownersdividend in respect of our common stock. Asstock for the foreseeable future. Payment of such date, CEDE & CO. held 16,904,784 sharesany dividends in street name. On March 1, 2013,the future will be at the discretion of our common stock was quoted at a closing sales priceboard and will depend on our financial condition, results of $9.81operations, capital and legal requirements, and other factors deemed relevant by the board.
Performance Graph
The following graph is not “solicitingtable summarizes certain information regarding securities authorized for issuance under our equity compensation plans as of December 31, 2015. See information regarding material” is not deemed filed with
Table of Contents
features of the Securities and Exchange Commission, and is notplan in Note 8, "Stock-Based Compensation," to bethe Consolidated Financial Statements incorporated by reference into anyherein.
Equity Compensation Plan Information
| | | | | | | | | | |
Plan Category | | Number of
Securities to be
Issued Upon
Exercise or
Vesting of
Outstanding
Options,
Warrants and
Rights | | Weighted-Average
Exercise Price
of Outstanding
Options,
Warrants and
Rights | | Number of Securities
Remaining Available
for Future Issuance
Under the Equity
Compensation Plan
(Excluding Securities
Reflected in
Column (a)) | |
|---|
| | (a)
| |
| |
| |
|---|
Legacy Dawson | | | | | | | | | | |
Equity compensation plan approved by security holders | | | 287,921 | (1) | $ | 10.74 | (2) | | 456,708 | |
Equity compensation plans not approved by security holders | | | — | | | — | | | — | |
Legacy TGC | | | | | | | | | | |
Equity compensation plan approved by security holders | | | 269,756 | (3) | $ | 14.34 | (2) | | 406,360 | |
Equity compensation plans not approved by security holders | | | — | | | — | | | — | |
| | | | | | | | | | | |
Total | | | 557,677 | | $ | 12.48 | | | 863,068 | |
| | | | | | | | | | | |
| | | | | | | | | | | |
| | | | | | | | | | | |
- (1)
- Number of securities to be issued upon the
Company’s filings underexercise of outstanding options, warrants and rights include 158,674 options that have vested but have not yet been exercised and 129,247 restricted stock units that have not yet vested.
- (2)
- Excludes outstanding and unvested restricted stock unit awards, for which there is no exercise price.
- (3)
- Number of securities to be issued upon the
Securities Actexercise of 1933, as amended, or the Securities Exchange Act of 1934, as amended, respectively.outstanding options, warrants and rights include 269,756 options that have vested but have not yet been exercised.
PERFORMANCE GRAPH
The following graph sets forth the five-yearbelow matches Dawson Geophysical Company's cumulative 5-Year total shareholder return which assumes reinvestmenton common stock with the cumulative total returns of dividends,the S&P 500 index and the PHLX Oil Service Sector index. The graph tracks the performance of a $100 investment beginningin our common stock and in each index (with the reinvestment of all dividends) from 12/31/2010 to 12/31/2015.
The stock prices used in the Company’s commoncomputation of the graph below reflect those of Legacy TGC from December 31, 2010 to December 31, 2014 multiplied by three to account for the 1-for-3 reverse stock a peer group made upsplit undertaken by Legacy TGC in connection with the Merger. The stock price at December 31, 2015 reflects that of companies in the Philadelphiacombined Company following the Merger, as reported on the Nasdaq Stock Market under the symbol "DWSN".
Table of Contents
COMPARISON OF 5 YEAR CUMULATIVE TOTAL RETURN*
Among Dawson Geophysical Company, the S&P 500 Index
and the PHLX Oil Service Sector Index and the
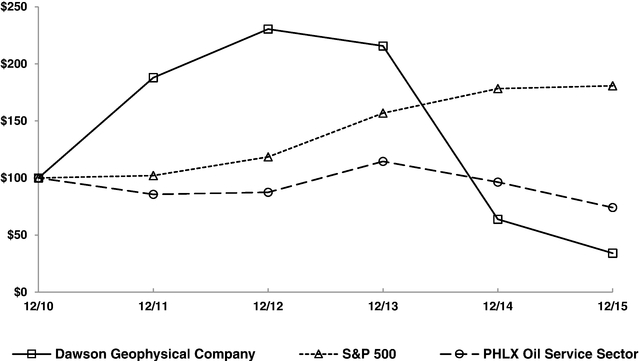
- *
- $100 invested on 12/31/10 in stock or index, including reinvestment of dividends.
Fiscal year ended December 31.
Copyright© 2016 S&P, 500 Stock Index. a division of McGraw Hill Financial. All rights reserved.
| | | | | | | | | | | | | | | | | | | |
| | 12/10 | | 12/11 | | 12/12 | | 12/13 | | 12/14 | | 12/15 | |
|---|
Dawson Geophysical Company | | | 100.00 | | | 187.89 | | | 230.45 | | | 215.67 | | | 63.82 | | | 34.07 | |
S&P 500 | | | 100.00 | | | 102.11 | | | 118.45 | | | 156.82 | | | 178.29 | | | 180.75 | |
PHLX Oil Service Sector | | | 100.00 | | | 85.62 | | | 87.44 | | | 114.50 | | | 96.36 | | | 74.08 | |
The Philadelphia Oil Service Sector Index consistsstock price performance included in this graph is not necessarily indicative of far larger companies that provide a variety of services as compared to the land-based geophysical services provided by the Company.future stock price performance.
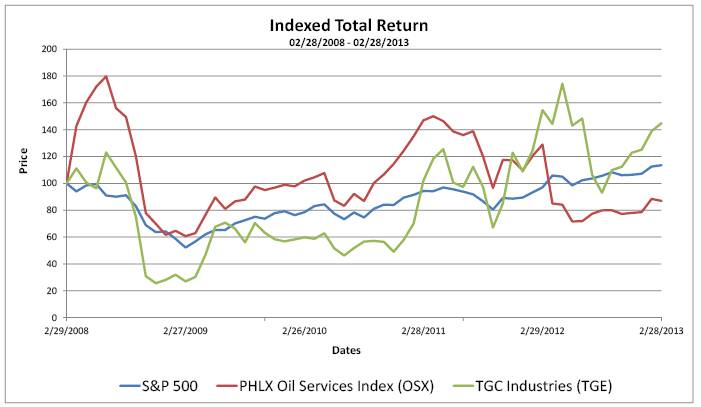
Item 6. SELECTED FINANCIAL DATA
11
ITEM 6. SELECTED FINANCIAL DATA.
The following selected financial data should be read in conjunction with Item 7, “Management’s"Management's Discussion and Analysis of Financial Condition and Results of Operations,”" and the Company’sCompany's consolidated financial statements and related notes thereto included in Item 8, “Financial"Financial Statements and Supplementary Data.” A cash dividend"
| | | | | | | | | | | | | | | | | | | |
| | Year Ended
December 31, | | Three Months
Ended
December 31, | | Year Ended September 30, | |
|---|
| | 2015 | | 2014 | | 2014 | | 2013 | | 2012 | | 2011 | |
|---|
| | (In thousands, except per share amounts)
| |
|---|
Operating revenues | | $ | 234,685 | | $ | 50,802 | | $ | 261,683 | | $ | 305,299 | | $ | 319,274 | | $ | 333,279 | |
Net (loss) income(1) | | $ | (26,279 | ) | $ | (4,991 | ) | $ | (12,620 | ) | $ | 10,480 | | $ | 11,113 | | $ | (3,246 | ) |
Basic (loss) income per share attributable to common stock(2)(3) | | $ | (1.27 | ) | $ | (0.36 | ) | $ | (0.90 | ) | $ | 0.75 | | $ | 0.81 | | $ | (0.24 | ) |
Cash dividends declared per share of common stock(4)(5) | | $ | — | | $ | 0.05 | | $ | 0.14 | | $ | — | | $ | — | | $ | — | |
Weighted average equivalent common shares outstanding | | | 20,688 | | | 14,020 | | | 14,009 | | | 13,868 | | | 13,801 | | | 13,745 | |
Total assets | | $ | 247,787 | | $ | 244,022 | | $ | 256,662 | | $ | 289,027 | | $ | 279,175 | | $ | 264,824 | |
Revolving line of credit | | $ | — | | $ | — | | $ | — | | $ | — | | $ | — | | $ | — | |
Current maturities of notes payable and obligations under capital leases | | $ | 8,585 | | $ | 6,018 | | $ | 6,752 | | $ | 9,258 | | $ | 9,131 | | $ | 5,290 | |
Notes payable and obligations under capital leases less current maturities | | $ | 2,106 | | $ | 4,209 | | $ | 4,933 | | $ | 3,697 | | $ | 11,179 | | $ | 10,281 | |
Stockholders' equity | | $ | 209,718 | | $ | 194,218 | | $ | 199,530 | | $ | 213,060 | | $ | 200,949 | | $ | 188,163 | |
- (1)
- Net loss for the year ended September 30, 2011 includes $3,866,000 of
$0.15transaction costs associated with a previously proposed transaction with TGC. Net loss for the year ended December 31, 2015, the three months ended December 31, 2014, and the year ended September 30, 2014 include transaction costs associated with the Merger of $3,314,000, $1,492,000 and $950,000, respectively.
- (2)
- The September 30, 2012 earnings per
common share calculation has been adjusted for the two-class method to reflect restricted shares that were not reflected as participating in the prior period. Basic earnings per share as previously reported for the year ended September 30, 2012 was declared$0.81. The impact on all prior period financial statements is deemed immaterial.
- (3)
- Earnings per share for the three months ended December 31, 2014 and
paid in December, 2012. No cashfor the years ended September 30, 2014, 2013, 2012, and 2011 have been adjusted for the effect of the merger by dividing the previously reported earnings per share by the merger conversion factor of 1.76.
- (4)
- Calculated based on dividends
were declared in anyperiod regardless of period paid.
- (5)
- Weighted average shares for the three months ended December 31, 2014 and for the years ended September 30, 2014, 2013, 2012, and 2011 have been adjusted for the effect of the
remaining four years shown below:merger by multiplying the previously reported weighted average shares by the merger conversion factor of 1.76.
Table of Contents
| | Year Ended December, 31, | |
| | 2012 | | 2011 | | 2010 | | 2009 | | 2008 | |
| | (In thousands, except per share amounts) | |
Statement of Income Data: | | | | | | | | | | | |
| | | | | | | | | | | |
Revenues | | $ | 196,317 | | $ | 151,029 | | $ | 108,319 | | $ | 90,432 | | $ | 86,770 | |
| | | | | | | | | | | |
Net income (loss) | | $ | 15,672 | | $ | 10,833 | | $ | (1,223 | ) | $ | 1,880 | | $ | 6,898 | |
| | | | | | | | | | | |
Net Income (loss) per common share - basic | | $ | 0.76 | | $ | 0.54 | | $ | (0.06 | ) | $ | 0.09 | | $ | 0.34 | |
| | | | | | | | | | | |
Net Income (loss) per common share - diluted | | $ | 0.75 | | $ | 0.53 | | $ | (0.06 | ) | $ | 0.09 | | $ | 0.34 | |
| | | | | | | | | | | |
Weighted average number of common Shares outstanding - basic | | 20,489 | | 20,206 | | 20,162 | | 20,154 | | 20,132 | |
| | | | | | | | | | | |
Weighted average number of common Shares outstanding - diluted | | 20,856 | | 20,522 | | 20,162 | | 20,224 | | 20,217 | |
| | | | | | | | | | | |
Total assets | | $ | 142,028 | | $ | 99,881 | | $ | 87,615 | | $ | 86,050 | | $ | 85,091 | |
| | | | | | | | | | | |
Long-term debt, less current maturities | | $ | 16,298 | | $ | 6,956 | | $ | 6,021 | | $ | 6,507 | | $ | 11,452 | |
| | | | | | | | | | | |
Shareholders’ equity | | $ | 77,986 | | $ | 63,720 | | $ | 52,863 | | $ | 52,695 | | $ | 50,427 | |
ITEM Item 7. MANAGEMENT’SMANAGEMENT'S DISCUSSION AND ANALYSIS OF FINANCIAL CONDITION AND RESULTS OF OPERATION.OPERATIONS
The following discussion and analysis should be read in conjunction with our financial statements and related notes thereto included elsewhere in this Form 10-K. Portions of this document that are not statements of historical or current fact are forward-looking statements that involve risk and uncertainties, such as statements of our plans, business strategy, objectives, expectations and intentions. The cautionaryThis discussion contains forward-looking statements madethat involve risks and uncertainties. Please see "Business," "Disclosure Regarding Forward-Looking Statements" and "Risk Factors" elsewhere in this Form 10-K10-K.
On February 11, 2015, Legacy TGC completed the merger with Legacy Dawson pursuant to which a wholly-owned subsidiary of Legacy TGC merged with and into Legacy Dawson, with Legacy Dawson continuing after the merger as the surviving entity and a wholly-owned subsidiary of Legacy TGC. The common stock of the merged company is listed on the NASDAQ Stock Market LLC ("NASDAQ") under the symbol "DWSN." Under the merger agreement, at the effective time of the Merger, each issued and outstanding share of Legacy Dawson's common stock, par value $0.33 1/3 per share, including shares underlying Legacy Dawson's outstanding equity awards, were converted into the right to receive 1.760 shares of common stock of Legacy TGC, par value $0.01 per share (the "Legacy TGC Common Stock"), after giving effect to a 1-for-3 reverse stock split of Legacy TGC Common Stock which occurred immediately prior to the Merger.
The Merger is accounted for as a reverse acquisition under which Legacy Dawson is considered the accounting acquirer of Legacy TGC. As such, the financial statements of Legacy Dawson are treated as the historical financial statements of the merged company. Except as otherwise specifically provided, this discussion and analysis relates to the business and operations of Legacy Dawson and its consolidated subsidiaries for the periods prior to the closing of the Merger and on a consolidated basis with Legacy TGC and its subsidiaries after the closing of the Merger.
You should be read as applying to all related forward-lookingthis discussion in conjunction with the financial statements wherever they appearand notes thereto included elsewhere in this Form 10-K. Our actual results could differ materially from those anticipatedUnless the context requires otherwise, all references in this Item 7 to the forward-looking statements. Factors that could cause our actual results"Company," "we," "us" or "our" refer to differ materially from those anticipated include those discussed in “Business,” “Information Regarding Forward-Looking Statements,”(i) Legacy Dawson and “Risk Factors.”its consolidated subsidiaries, for periods through February 11, 2015 and (ii) the merged company for periods on or after February 12, 2015.
Overview
12
Executive Overview
The Company isWe are a leading provider of North America onshore seismic data acquisition services with operations throughout the continental United States and Canada. We added a crew after December 31, 2012, increasingSubstantially all of our revenues are derived from the number of seismic crews to 15. These seismic crews supply seismic data acquisition services we provide to companies engaged in the exploration and development ofour clients, mainly oil and natural gas on landcompanies of all sizes. Our clients consist of major oil and in land-to-water transition areas. Our customers rely on seismicgas companies, independent oil and gas companies, and providers of multi-client data to identify areas where subsurface conditions are favorablelibraries. Demand for our services depends upon the accumulationlevel of existing hydrocarbons, to optimize thespending by these companies for exploration, production, development and production of hydrocarbon reservoirs, to better delineate existingfield management activities, which depends, in a large part, on oil and natural gas fields, and to augment reservoir management techniques.
We acquire geophysical data using the latestprices. Significant fluctuations in 3-D survey techniques. We introduce acoustic energy into the ground by using vibration equipment or dynamite detonation, depending on the surface terrain and subsurface requirements. The reflected energy, or echoes, is received through geophones, converted into a digital signal at a multi-channel recording unit, and then transmitted to a central recording vehicle. Subsurface requirements dictate the number of channels necessary to perform our services. With our state-of-the-art seismic equipment, including computer technology and multiple channels, we acquire, on a cost-effective basis, immense volumes of seismic data that when processed and interpreted produce more precise images of the earth’s subsurface. Our customers then use our seismic data to generate 3-D geologic models that help reduce finding costs and improve recovery rates from existing wells.
Currently, the seismic data acquisition industry is made up of a number of companies divided into two groups. The first group is made up of four publicly-traded companies with long operating histories which field numerous crews and work in a number of different regions and terrain. This group includes us, Dawson Geophysical Company, Geokinetics, Inc. and CGG-Veritas. These companies field approximately 50% of the seismic crews currently operating in the continental U.S. and Canada. The second group is made up of smaller companies who generally run one or two seismic crews and often specialize in specific regions or types of operation.
We provide our seismic data acquisition services primarily to onshoredomestic oil and natural gas exploration activities and development companiescommodity prices, as we have recently experienced, have and will continue to affect demand for useour services and our results of operations and such fluctuations continue to be the single most important factor affecting our business and results of operations.
The Company operated approximately ten crews in the onshore drillingUnited States with limited activity in Canada during the fourth quarter of 2015. Demand for our services in 2015 was at reduced levels from recent years and productionis anticipated to remain at reduced levels into 2016. During 2015, we operated a maximum of fourteen crews in the United States. Quarterly and annual results were negatively impacted during the year as result of weakening demand, inclement weather (particularly in the second quarter), delays in securing land access agreements, lower crew utilization rates, reduced pricing for our services and project delays on behalf of our clients. Due to further declining and uncertain oil prices during and at the end of 2015, our crew count in the first quarter of 2016 reduced to four to six crews in the United States and limited activity
Table of Contents
in Canada. Until there is a recovery in oil or natural gas prices, our visibility into 2016 relative to the number of active crews is uncertain. The majority of our crews are currently working in oil producing basins. While our revenues are mainly affected by the level of client demand for our services, our revenues are also affected by the pricing for our services that we negotiate with our clients and the productivity and utilization level of our data acquisition crews. Factors impacting productivity and utilization levels include client demand, commodity prices, whether we enter into turnkey or term contracts with our clients, the number and size of crews and the number of recording channels per crew, as well as crew downtime related to inclement weather, delays in acquiring land access permits, agricultural or hunting activity, holiday schedules, short winter days and crew repositioning or equipment failure. To the extent we experience these factors, our operating results may be affected from quarter to quarter. Consequently, our efforts to negotiate more favorable contract terms in our supplemental service agreements, to mitigate permit access delays and to improve overall crew productivity may contribute to growth in our revenues.
We have experienced several client-directed delays over the last several months on certain projects primarily related to final funding approval, partnership agreements and land access agreements. We were impacted by severe weather conditions and flooding in many areas of operation, a weaker than anticipated Canadian season and reduced utilization rates of deployed data acquisition crews in the lower 48 United States. Severe weather conditions that began in April 2015 and that were subsequently followed by Tropical Storm Bill later in the second quarter negatively affected our operations in Texas and the mid-continent region where many of our crews were deployed. These multiple weather delays during the second quarter greatly impacted utilization on seven of the active crews and delayed deployment of three additional crews on new projects. Reduced demand and client delays continued in these areas during the fourth quarter of 2015 which negatively impacted crew utilization. This negative utilization was offset by increased crew utilization as a result of improved weather conditions and operational discipline in the other areas we worked.
Most of our client contracts are turnkey contracts. The percentage of revenues derived from turnkey contracts represented approximately three-quarters of our revenues in 2015 and for the past few years. While turnkey contracts allow us to capitalize on improved crew productivity, we also bear more risks related to weather and crew downtime. We expect the percentage of turnkey contracts to remain high as we continue to expand our operations in the mid-continent, western and southwestern regions of the United States in which turnkey contracts are more common.
Over time, we have experienced continued increases in recording channel capacity on a per crew or project basis. This increase in channel count demand is driven by client needs and is necessary in order to produce higher resolution images, increase crew efficiencies and undertake larger scale projects. In response to project-based channel requirements, we routinely deploy a variable number of channels on a variable number of crews in an effort to maximize asset utilization and meet client needs.
Reimbursable third-party charges related to our use of helicopter support services, permit support services, specialized survey technologies and dynamite energy sources in areas with limited access are another important factor affecting our results. Revenues associated with third-party charges continued to decline as a percentage of revenue during 2014 and 2015. We expect that as we continue to perform our operations in the more open terrain of the mid-continent, western and southwestern regions of the United States, the level of these third-party charges will continue to be below our historical ranges of 25% to 35% of our total revenue.
While the markets for oil and natural gas have been very volatile and are likely to continue to be so in the continental U.S.future, and Canada. The main factors influencing demandwe can make no assurances as to future levels of domestic exploration or commodity prices, we believe opportunities exist for seismic data acquisition servicesus to enhance our market position by responding to our clients' continuing desire for higher resolution subsurface images. If economic conditions continue to weaken such that our clients continue to reduce their capital expenditures or if the sustained drop in our industry are the level of drilling activity by oil and natural gas
Table of Contents
prices worsens, it could continue to result in diminished demand for our seismic services, could cause downward pressure on the prices we charge and would affect our results of operations and cash flows.
Items Affecting Comparability of Our Financial Results
As discussed above, the Merger has been accounted for as a reverse acquisition under which Legacy Dawson was considered the accounting acquirer of Legacy TGC. As such, the historical financial statements of Legacy Dawson are treated as the historical financial statements of the merged company. Further, the merged company adopted a calendar fiscal year ending December 31. Accordingly, the financial results of the merged company for the year ended December 31, 2015 presented in this Form 10-K are compared to the results for Legacy Dawson for the quarter ended December 31, 2014 and the years ended September 30, 2014 and 2013. In order to aid in the review and comparison of our financial results, we have prepared and presented unaudited financial results as of the year ended December 31, 2014 even though Legacy Dawson's 2014 fiscal year ended on September 30, 2014. We would not have otherwise prepared or presented our financial results from this period in this fashion. The financial results for the year ended December 31, 2015 presented in this Form 10-K reflect the operations of Legacy Dawson for the period January 1 through February 11, 2015 and the operations of the merged company for the period February 12 through December 31, 2015. Due to the foregoing, our financial results for the three months ended December 31, 2014 and the years ended September 30, 2014 and 2013 are not comparable to our financial results for the year ended December 31, 2015 as a result of the combination of the assets and liabilities and results of operations of two previously separate companies and the sizeschange in fiscal year end.
Results of Operations
The table below shows our revenues and expenses for the years ended December 31, 2015 and 2014 and the years ended September 30, 2014 and 2013:
CONSOLIDATED STATEMENTS OF OPERATIONS FOR THE YEARS ENDED DECEMBER 31, 2015 AND 2014 AND THE YEARS ENDED SEPTEMBER 30, 2014 AND 2013
| | | | | | | | | | | | | |
| | Year Ended December 31, | | Year Ended September 30, | |
|---|
| | 2015 | | 2014 | | 2014 | | 2013 | |
|---|
| |
| | (unaudited)
| |
| |
| |
|---|
Operating revenues | | $ | 234,685,000 | | $ | 244,304,000 | | $ | 261,683,000 | | $ | 305,299,000 | |
Operating costs: | | | | | | | | | | | | | |
Operating expenses | | | 205,566,000 | | | 207,185,000 | | | 223,336,000 | | | 234,660,000 | |
General and administrative | | | 22,729,000 | | | 17,012,000 | | | 16,083,000 | | | 13,364,000 | |
Depreciation and amortization | | | 47,072,000 | | | 40,028,000 | | | 40,168,000 | | | 37,095,000 | |
| | | | | | | | | | | | | | |
| | | 275,367,000 | | | 264,225,000 | | | 279,587,000 | | | 285,119,000 | |
(Loss) income from operations | | | (40,682,000 | ) | | (19,921,000 | ) | | (17,904,000 | ) | | 20,180,000 | |
Other income (expense) | | | 648,000 | | | 252,000 | | | 4,000 | | | (610,000 | ) |
| | | | | | | | | | | | | | |
(Loss) income before income tax | | | (40,034,000 | ) | | (19,669,000 | ) | | (17,900,000 | ) | | 19,570,000 | |
Income tax benefit (expense) | | | 13,755,000 | | | 4,955,000 | | | 5,280,000 | | | (9,090,000 | ) |
| | | | | | | | | | | | | | |
Net (loss) income | | $ | (26,279,000 | ) | $ | (14,714,000 | ) | $ | (12,620,000 | ) | $ | 10,480,000 | |
| | | | | | | | | | | | | | |
| | | | | | | | | | | | | | |
| | | | | | | | | | | | | | |
Year Ended December 31, 2015 versus Year Ended December 31, 2014
Operating Revenues. Our operating revenues for the year ended December 31, 2015 were $234,685,000 as compared to $244,304,000 for the same period of 2014. The decrease was primarily due to the reduction in utilization rates in 2015 as demand for our services has decreased as a result of decreasing
Table of Contents
and uncertain commodity prices and reduced client expenditures. Severe weather conditions in several areas of operation throughout 2015 also led to short-term project delays. Reimbursed third-party charges as a percentage of revenues were below our historical ranges of 25% to 35% during the year ended December 31, 2015.
Operating Costs. Operating expenses for the year ended December 31, 2015 decreased to $205,566,000 as compared to $207,185,000 for the same period of 2014. The decrease in operating expenses did not correlate to the decrease in operating revenues due to the process of internal reorganization and consolidation after the Merger. Although the dollar amount of operating costs decreased between the two periods, operating costs as a percentage of revenue increased between periods due to reduced revenue.
Selling, general and administrative expenses. Selling, general and administrative expenses were 9.7% of revenues in the year ended December 31, 2015 compared to 7.0% of revenues in the same period of 2014. General and administrative expenses increased to $22,729,000 during the year ended December 31, 2015 from $17,012,000 during the same period of 2014. The primary factors for the increase in general and administrative expenses are related to salary costs that have increased from the same period in 2014 as a result of increased employee costs to support our combined company and additional accounting costs associated with the expanded Canadian operations acquired in the Merger. Accounting and consulting costs are increased from the same period in fiscal 2014 relating to the Merger and new accounting software conversion implementation.
Depreciation expense. Depreciation for the year ended December 31, 2015 totaled $47,072,000 compared to $40,028,000 for the same period of 2014. The increase in depreciation expense is related to the additional assets acquired in the Merger. Our depreciation expense is expected to remain flat during 2016, primarily due to limited capital expenditures to maintain our existing asset base.
Our total operating costs for the year ended December 31, 2015 were $275,367,000, representing a 4.2% increase from the corresponding period of 2014. This change was primarily due to the following: salary costs of the combined Company resulting from the Merger; an increase in depreciation related to the additional assets acquired in the Merger; and comparability of the periods reported which were the combined Company for most of 2015 and Legacy Dawson for 2014.
Income Taxes. Income tax benefit was $13,755,000 for the year ended December 31, 2015 as compared to income tax benefit of $4,955,000 for the same period of 2014. The effective tax benefit rates for the years ended December 31, 2015 and 2014 were approximately 34.4% and 25.2%, respectively. Our effective tax benefit rates increased as compared to the corresponding prior year primarily due to the increase in pre-tax losses that were partially offset by the effect of permanent tax differences. Our effective tax rates differ from the statutory federal rate of 35% for certain items such companies’as state and local taxes, valuation allowances, non-deductible expenses, discrete items and expenses related to share-based compensation that were not expected to result in a tax deduction.
As discussed in "Overview," recent declines in oil and natural gas prices have impacted spending by our clients for exploration, production, development and development budgets,field management activities, which in turn, depend largely on currenthas negatively affected demand for our services and anticipatedcaused the market price of our common stock to fall. In light of the existing market volatility, we continue to closely monitor our assets, including our equipment base, to assess possible impairment. There are numerous uncertainties factored into the estimates of the life cycle of a seismic recording system, including the future crudecash flows estimated to be generated by a particular system. Estimated cash flows can be affected by, among other things, the decline in oil and natural gas prices and depletion rates.
Our customers are major and independentreduced client demand. Although we do not currently anticipate an impairment of our assets, if oil and natural gas explorationprices remain at current levels for an extended period of time or decline further, or if projected cash flows decline, we may be exposed to impairment charges in future periods, which could negatively affect our results of operations in a material manner in the period in which they are recorded. If
Table of Contents
we record significant impairment charges in the future, we may also need to recognize valuation allowances on our net operating loss carry forwards and, development companies.accordingly, a tax benefit may not be recognized on such charges.
Fiscal Year Ended September 30, 2014 versus Fiscal Year Ended September 30, 2013
Operating Revenues. Our operating revenues decreased 14% to $261,683,000 in fiscal 2014 from $305,299,000 in year ended September 30, 2013. The servicesrevenue decrease in fiscal 2014 was primarily the result of a reduction in crew utilization. Third-party charges, for which we provideare reimbursed by clients, decreased slightly in fiscal 2014 compared to our customers vary accordingyear ended September 30, 2013.
Operating Costs. Our operating expenses decreased 4.8% to $223,336,000 in fiscal 2014 from $234,660,000 in year ended September 30, 2013 primarily due to the sizeslight decrease in reimbursed third-party charges. The decrease can be attributed to a reduction in survey related charges.
Selling, general and needs of each customer. Our services are marketed by sales, supervisory,administrative expenses. Selling, general and executive personnel who contact customersadministrative expenses increased to determine their needs and respond to customer inquiries regarding the availability of crews. Contacts are based principally upon professional relationships developed over a number of years.
The acquisition of seismic data for the oil and natural gas industry is a highly competitive business. Contracts for such services generally are awarded on the basis of price quotations, crew experience, and the availability of crews to perform in a timely manner, although factors other than price, such as crew safety performance history and technological and operational expertise, are often determinative. Our competitors include companies with financial resources that are significantly greater than our own as well as companies of comparable and smaller size. Our primary competitors are Dawson Geophysical Company, Geokinetics, Inc., and CGG-Veritas. In addition to the previously named companies, we also compete for projects from time to time with smaller seismic companies which operate in local markets with only one or two crews. We believe that our long-term industry expertise, the customer relationships developed over our history, and our financial stability gives us an advantage over most of our competitors in the industry.
13
Results of Operations
Year Ended December 31, 2012, Compared to Year Ended December 31, 2011
Revenues. Our revenues were $196,317,215 for$16,083,000 during the year ended December 31, 2012, compared to $151,028,582 forSeptember 30, 2014 from $13,364,000 during the same period of 2011, an increase2013 and represented 6.1% of 30.0%. Approximately 74%revenues in fiscal 2014 as compared to 4.4% of revenues in year ended September 30, 2013. The primary factor for the increase in revenuesgeneral and administrative expenses was attributable to continued improvement intransaction costs of $950,000 associated with the North American land seismic acquisition market and increased efficiencies of new wireless recording technology, and approximately 26% of theMerger. The remaining increase in revenues was attributablegeneral and administrative expenses primarily resulted from increased administrative costs to support our operationoperations.
Depreciation expense. We recognized $40,168,000 of additional seismic crews. We operated eight seismic crewsdepreciation expense in the U.S. during the first and second quarters, added a ninth crew in the third quarter, and continued operating nine crews during the fourth quarter of 2012,fiscal 2014 as compared to seven seismic crews$37,095,000 in the U.S.year ended September 30, 2013. Depreciation expense increased 8.3% from year ended September 30, 2013 to 2014 reflecting increased capital expenditures during the first quarter, the addition of an eighth crew in the second quarter,year ended September 30, 2013 and the continued operating eight crews during the third and fourth quarters of 2011. We operated seven seismic crews in Canada during the first quarter, two crews during the second quarter, the equivalent of 1.5 crews during the third quarter, and five crews during the fourth quarter of 2012, as compared to six seismic crews during the first quarter, two crews during the second and third quarters, and four crews during the fourth quarter of 2011.2014.
CostOur total operating costs for fiscal 2014 were $279,587,000, a decrease of services. Our cost of services was $135,279,937 for the1.9% from year ended December 31, 2012, comparedSeptember 30, 2013 primarily due to $104,022,944 for the same period of 2011, an increase of 30.0%. Virtually all of this increase was attributable to strong revenue growth during 2012. As a percentage of revenues, cost of services was 68.9% for both the year ended December 31, 2012 and the year ended December 31, 2011.
Selling,following factors: reduced operating costs, reduced selling general and administrative expenses. SG&A expenses were $8,755,270and reduced depreciation.
Income Taxes. Income tax benefit was $5,280,000 for fiscal 2014 and expense was $9,090,000 for year ended September 30, 2013. The effective tax rates for the year ended December 31, 2012, compared to $9,626,679income tax provision for fiscal 2014 and 2013 were 29.5% and 46.4%, respectively. Our effective tax rates differ from the same periodstatutory federal rate of 2011, a decrease of 9.0%. This decrease was primarily attributable to $2,117,950 of transaction costs incurred in 201135% for certain items such as state and local taxes, non-deductible expenses, discrete items, expenses related to terminated merger discussions, partially offset by increasedshare-based compensation coststhat were not expected to result in a tax deduction and recent staff additions to handle increased business activity. SG&A expense as a percentagechanges in reserves for uncertain tax positions.
Use of revenues was 4.5% for the year ended December 31, 2012, and 6.4% for the year ended December 31, 2011.EBITDA (Non-GAAP measure)
Depreciation and amortization expense. Depreciation and amortization expense was $25,502,597 for the year ended December 31, 2012, compared to $19,214,069 for the same period of 2011, an increase of 32.7%. This increase was primarily attributable to capital expenditures of approximately $57,108,000 for the 12 months ended December 31, 2012. Depreciation and amortization expense as a percentage of revenues was 13.0% for the year ended December 31, 2012, compared to 12.7% for the same period of 2011.
Income from operations. Income from operations was $26,779,411 for the year ended December 31, 2012, compared to $18,164,890 for the same period of 2011. The increase was attributable to an increase in revenues, partially offset by increases in cost of services and depreciation expenses discussed above. EBITDA increased $14,903,049 to $52,282,008 for the 12 months ended December 31, 2012, from $37,378,959 for the same period of 2011, an increase of 39.9%. This increase was primarily a result of a $4,838,664 increase in net income, a $6,288,528 increase in depreciation, and a $3,337,828 increase in income tax expense. For a definition of EBITDA, a reconciliation of EBITDA to net income, and discussion of EBITDA, refer to the section entitled “EBITDA” found below.
Interest expense. Interest expense was $1,222,454 for the year ended December 31, 2012, compared to $784,425 for the same period of 2011, an increase of 55.8%. This increase was primarily attributable to additional debt of $22,202,000 incurred for the purchase of additional GSR and GSX systems, channels, and other seismic equipment and vehicles. The increase was partially offset by our continuing principal payments of $11,338,000 on notes payable and capital lease obligations.
Income tax expense. Income tax expense was $9,885,078 for the year ended December 31, 2012, compared to $6,547,250 for the same period of 2011. This increase was attributable to the increase in pre-tax income in 2012 as compared to 2011. Income tax expense for the year ended December 31, 2012 reflects the impact of state taxes, net of federal benefit, and permanent tax differences, including share based compensation. See Note H of Notes to Financial Statements.
14
Year Ended December 31, 2011, Compared to Year Ended December 31, 2010
Revenues. Our revenues were $151,028,582 for the year ended December 31, 2011, compared to $108,318,801 for the same period of 2010, an increase of 39.4%. Approximately 37% of the increase in revenues was attributable to continued improvement in the North American land seismic acquisition market and increased efficiencies of new wireless recording technology, and approximately 63% of the increase in revenues was attributable to our operation of additional seismic crews. We operated seven seismic crews in the U.S. during the first quarter, added an eighth crew in the second quarter, and continued operating eight crews during the third and fourth quarters of 2011, as compared to six seismic crews during each of the first three quarters and seven crews in the fourth quarter of 2010. We operated six seismic crews in Canada during the first quarter, two crews during the second and third quarters, and four crews during the fourth quarter of 2011, as compared to five seismic crews during the first quarter, no crews during the second quarter, two crews during the third quarter and four crews in the fourth quarter of 2010.
Cost of services. Our cost of services was $104,022,944 for the year ended December 31, 2011, compared to $85,932,862 for the same period of 2010, an increase of 21.1%. Virtually all of this increase was attributable to strong revenue growth during 2011. Approximately 19% of the increase was offset by increased efficiencies of new wireless recording technology and a decrease in higher cost shot-hole contracts. As a percentage of revenues, cost of services was 68.9% for the year ended December 31, 2011, compared to 79.3% for the same period of 2010.
Selling, general, and administrative expenses. SG&A expenses were $9,626,679 for the year ended December 31, 2011, compared to $6,894,500 for the same period of 2010, an increase of 39.6%. This increase was primarily attributable to $2,117,950 of transaction costs related to the terminated merger discussions with Dawson Geophysical Company. SG&A expense as a percentage of revenues was 6.4% for each of the years ended December 31, 2011, and December 31, 2010.
Depreciation and amortization expense. Depreciation and amortization expense was $19,214,069 for the year ended December 31, 2011, compared to $15,343,804 for the same period of 2010, an increase of 25.2%. This increase was primarily attributable to capital expenditures of approximately $30,730,000 for the 12 months ended December 31, 2011. Depreciation and amortization expense as a percentage of revenues was 12.7% for the year ended December 31, 2011, compared to 14.2% for the same period of 2010.
Income from operations. Income from operations was $18,164,890 for the year ended December 31, 2011, compared to $147,635 for the same period of 2010. The increase was attributable to several factors including strengthening demand, better contract terms with the continued improvement in the North American land seismic acquisition market, and the items previously discussed. EBITDA increased $21,887,520 to $37,378,959 for the 12 months ended December 31, 2011, from $15,491,439 for the same period of 2010, an increase of 141.3%. This increase was a result of factors discussed above. For a definition of EBITDA, a reconciliation of EBITDA to net income, and discussion of EBITDA, refer to the section entitled “EBITDA” found below.
Interest expense. Interest expense was $784,425 for the year ended December 31, 2011, compared to $790,417 for the same period of 2010, a decrease of less than 1.0%. This decrease was primarily attributable to our continuing principal payments on notes payable and capital lease obligations partially offset by additional debt incurred during the first and third quarters of 2011 for the purchase of additional GSR channels and equipment.
Income tax expense. Income tax expense was $6,547,250 for the year ended December 31, 2011, compared to $579,900 for the same period of 2010. This increase was primarily attributable to the substantial increase in pre-tax income in 2011 as compared to a pre-tax loss in 2010. Income tax expense for the year ended December 31, 2010 reflects the impact of state taxes, net of federal benefit, and permanent tax differences, including share based compensation. See Note H of Notes to Financial Statements.
15
Non-GAAP Financial Measure
We define EBITDA as net income (loss) plus expenses of interest expense, interest income, income taxes, depreciation and amortization. We useamortization expense. Our management uses EBITDA as a supplemental financial measure to assess:
·
- •
- the financial performance of our assets without regard to financing methods, capital structures, taxes or historical cost basis;
·
- •
- our liquidity and operating performance over time
and in relation to other companies that own similar assets and that we believe calculate EBITDA in a manner similar to us;manner; and·
- •
- the ability of our assets to generate cash sufficient for us to pay potential interest
expenses.costs.
We also understand that such data isare used by investors to assess our performance. However, the term EBITDA is not defined under generally accepted accounting principles ("GAAP"), and EBITDA is not a measure of operating income, operating performance or liquidity presented in accordance with U.S. Generally Accepted Accounting Principles (“GAAP”).GAAP. When assessing our operating performance or our liquidity, youinvestors and others should not consider this data
Table of Contents
in isolation or as a substitute for our net income,loss, cash flow from operating activities or other cash flow data calculated in accordance with GAAP. In addition, our EBITDA excludes some, but not all, items that affect net income and operating income, and these measures may vary among other companies. Therefore, EBITDA as presented below may not be comparable to EBITDA or similarly titled measures ofutilized by other companies.companies since such other companies may not calculate EBITDA in the same manner as us. Further, the results presented by EBITDA cannot be achieved without incurring the costs that the measure excludes: interest, taxes, depreciation and amortization.
The following table reconcilesreconciliation of our EBITDA to our net income:(loss) income and net cash provided by operating activities, which are the most directly comparable GAAP financial measures, are provided in the tables below:
| | | | | | | | | | | | | |
| | Year Ended
December 31, | | Year Ended
September 30, | |
|---|
| | 2015 | | 2014 | | 2014 | | 2013 | |
|---|
| | (in thousands)
| |
|---|
Net (loss) income | | $ | (26,279 | ) | $ | (14,714 | ) | $ | (12,620 | ) | $ | 10,480 | |
Depreciation and amortization | | | 47,072 | | | 40,028 | | | 40,168 | | | 37,095 | |
Interest expense (income), net | | | 450 | | | 417 | | | 462 | | | 597 | |
Income tax (benefit) expense | | | (13,755 | ) | | (4,955 | ) | | (5,280 | ) | | 9,090 | |
| | | | | | | | | | | | | | |
EBITDA | | $ | 7,488 | | $ | 20,776 | | $ | 22,730 | | $ | 57,262 | |
| | | | | | | | | | | | | | |
| | | | | | | | | | | | | | |
| | | | | | | | | | | | | | |
| | Year Ended | |
| | December 31, | |
| | 2012 | | 2011 | | 2010 | |
| | | | | | | |
Net income (loss) | | $ | 15,671,879 | | $ | 10,833,215 | | $ | (1,222,682 | ) |
Depreciation and amortization expense | | 25,502,597 | | 19,214,069 | | 15,343,804 | |
Interest expense | | 1,222,454 | | 784,425 | | 790,417 | |
Income tax expense | | 9,885,078 | | 6,547,250 | | 579,900 | |
EBITDA | | $ | 52,282,008 | | $ | 37,378,959 | | $ | 15,491,439 | |
| | | | | | | | | | | | | |
| | Year Ended
December 31, | | Year Ended
September 30, | |
|---|
| | 2015 | | 2014 | | 2014 | | 2013 | |
|---|
| | (in thousands)
| |
|---|
Net cash provided by operating activities | | $ | 20,612 | | $ | 30,472 | | $ | 10,446 | | $ | 70,579 | |
Changes in working capital and other items | | | (11,968 | ) | | (8,424 | ) | | 13,509 | | | (11,457 | ) |
Noncash adjustments to net (loss) income | | | (1,156 | ) | | (1,272 | ) | | (1,225 | ) | | (1,860 | ) |
| | | | | | | | | | | | | | |
EBITDA | | $ | 7,488 | | $ | 20,776 | | $ | 22,730 | | $ | 57,262 | |
| | | | | | | | | | | | | | |
| | | | | | | | | | | | | | |
| | | | | | | | | | | | | | |
Liquidity and Capital Resources
Introduction. Our principal sources of cash are amounts earned from the seismic data acquisition services we provide to our clients. Our principal uses of cash are the amounts used to provide these services, including expenses related to our operations and acquiring new equipment. Accordingly, our cash position depends (as do our revenues) on the level of demand for our services. Historically, cash generated from our operations along with cash reserves and borrowings from commercial banks have been sufficient to fund our working capital requirements and, to some extent, our capital expenditures.
Table of Contents
Cash Flows. The table below shows our sources and uses of cash for the years ended December 31, 2015 and 2014 and the years ended September 30, 2014 and 2013:
CONSOLIDATED STATEMENTS OF CASH FLOWS FOR THE YEARS ENDED DECEMBER 31, 2015 AND 2014 AND THE YEARS ENDED SEPTEMBER 30, 2014 AND 2013
| | | | | | | | | | | | | |
| | Year Ended December 31, | | Year Ended September 30, | |
|---|
| | 2015 | | 2014 | | 2014 | | 2013 | |
|---|
| |
| | (unaudited)
| |
| |
| |
|---|
Net cash provided by (used in): | | | | | | | | | | | | | |
Operating activities | | $ | 20,612,000 | | $ | 30,472,000 | | $ | 10,446,000 | | $ | 70,579,000 | |
Investing activities | | | 15,787,000 | | | (13,438,000 | ) | | (36,095,000 | ) | | (67,504,000 | ) |
Financing activities | | | (13,606,000 | ) | | (13,870,000 | ) | | (3,658,000 | ) | | (8,043,000 | ) |
Effect of exchange rate changes on cash | | | (428,000 | ) | | (380,000 | ) | | (345,000 | ) | | — | |
| | | | | | | | | | | | | | |
Net increase (decrease) in cash and cash equivalents | | $ | 22,365,000 | | $ | 2,784,000 | | $ | (29,652,000 | ) | $ | (4,968,000 | ) |
| | | | | | | | | | | | | | |
| | | | | | | | | | | | | | |
| | | | | | | | | | | | | | |
Years Ended December 31, 2015 and 2014
Liquidity
Cash flows from operating activities.
Net cash provided by operating activities was $39,283,062$20,612,000 and $30,472,000 for the years ended December 31, 2015 and 2014, respectively. This decrease primarily reflects our decline in revenues during the year ended December 31, 2015.
Net cash provided by investing activities was $15,787,000 for the year ended December 31, 2012, compared to $34,174,167 for the same period of 2011. The $5,108,895 increase was principally attributable to an increase in net income of $4,838,664 in 2012. The timing of billings and revenue recognition, the collections of accounts receivable, the timing of receipt and payment of invoices, federal and state income taxes payable, depreciation and amortization, and the mix of contracts account for the remainder of the increase.
Working capital decreased $7,640,436 to $12,216,093 as of December 31, 2012, from the December 31, 2011, working capital of $19,856,529. This decrease was due primarily to a decrease in cash and cash equivalents of $7,131,315, increases of $4,424,146 in trade accounts payable, $2,945,945 in accrued liabilities, $2,819,594 in billings in excess of costs and estimated earnings on uncompleted contracts, $2,552,247 in federal and state income taxes payable, and $4,812,766 in current maturities of notes payable, partially offset by increases in trade accounts receivable of $16,289,735 and in costs and estimated earnings in excess of billings on uncompleted contracts of $1,162,465.
Cash flows used in investing activities.
2015. Net cash used in investing activities was $30,265,696$13,438,000 for the year ended December 31, 2012, and $21,270,845 for2014. The net cash provided by investing activities during the year ended December 31, 2011. This $8,994,851 increase was due to an increase2015 represents cash of $12,382,000 acquired in the Merger, $7,750,000 of short-term investment maturities that were not reinvested and $1,501,000 in proceeds from disposal of assets. These increases in cash provided by investing activities were offset by cash capital expenditures of $9,958,915$6,846,000. During the year ended December 31, 2014, cash of $14,001,000 was used to purchase property and equipment and an additional $2,750,000 of excess cash was invested in short-term investments. These decreases in cash used in investing activities were offset by an increase$3,313,000 in proceeds from the saledisposals of property and equipment of $964,064.assets.
Cash flows used in financing activities.
Net cash used in financing activities was $16,140,906$13,606,000 for the year ended December 31, 2012,2015 and $10,172,831included principal payments of $16,348,000 on our notes, proceeds of $5,144,000 on our New Term Loan (as defined below), payments of $1,535,000 under our capital leases, and outflows of $867,000 associated with taxes related to stock vesting. Net cash used in financing activities for the year ended December 31, 2011. The $5,968,075 increase2014 was due$13,870,000 and was primarily to an increasecomprised of principal payments of $10,293,000 on term notes, payments of $1,014,000 under our capital leases, and cash dividends paid of $2,581,000.
Fiscal Year Ended September 30, 2014 versus Fiscal Year Ended September 30, 2013
Net cash provided by operating activities was $10,446,000 for fiscal 2014 and $70,579,000 for year ended September 30, 2013. Net cash provided by operating activities in fiscal 2014 was primarily impacted by declines in revenues between periods.
Net cash used in investing activities was $36,095,000 in fiscal 2014 and $67,504,000 in year ended September 30, 2013. Net capital expenditures in fiscal 2014 and 2013 were $35,281,000 and $48,485,000, respectively. During fiscal 2014 and 2013, $3,500,000 and $19,500,000, respectively, were invested in short-term investments.
Net cash used in financing activities in fiscal 2014 of $3,658,000 primarily includes net $1,755,000 in principal payments on notes payableand debt proceeds along with $1,935,000 of $2,331,996 and the paymentdividends paid. Net cash used in financing
Table of cash dividends of $3,099,014.
16Contents
Capital expenditures.
During theactivities in year ended December 31, 2012,September 30, 2013 of $8,043,000 primarily includes net $8,651,000 in principal payments and debt proceeds.
Capital Expenditures. During 2015, we made capital expenditures of $57,107,732 were used$6,920,000. We limited our capital expenditures to acquire seismicnecessary maintenance capital requirements. The Board of Directors has approved an initial 2016 budget of $10,000,000 for capital expenditures, which is again limited primarily to necessary maintenance capital requirements and incremental recording channel replacement or increase. In recent years we have funded some of our capital expenditures through cash reserves, equipment and vehicles, replace similar equipment and vehicles, and to purchase our fourth and fifth GSR systems consisting of a total of 14,200 channels and related equipment, our sixth GSR system with 13,000 channels, our first next-generation 3-channel GSX system with 8,000 stations, and seven new INOVA vibration vehicles. Cash of $31,970,418, notes of $22,201,800 from a commercial bank,term loans and capital lease obligations from a vehicle leasing companyleases. In the past, we have also funded our capital expenditures and other financing needs through public equity offerings.
We continually strive to supply our clients with technologically advanced 3-D data acquisition recording services and data processing capabilities. We maintain equipment in and out of $2,935,514 were used to finance these acquisitions. This major investment should continue to bring us the benefitsservice in anticipation of these new technologies and allow us to be in a cash building mode in 2013. We may, however, purchase additional equipment during 2013 as theincreased future demand for our services warrants.services.
Capital ResourcesResources.
Historically, we have primarily relied on cash generated from operations, short-termcash reserves and borrowings from commercial banks and equipment lenders, and loans from directors to fund our working capital requirements and, to some extent, our capital expenditures. Recently, we have funded some of our capital expenditures through equipment term loans and capital leases. From time to time in the past, we have also funded our capital expenditures and other financing needs through public equity offerings.
Indebtedness. Legacy Dawson and Legacy TGC each had a credit agreement in effect prior to the Merger (the "Legacy Dawson Credit Agreement" and the "Legacy TGC Credit Agreement," respectively), which continued as our obligations following the Merger. On June 30, 2015, we entered into an amendment to the Legacy TGC Credit Agreement with our lender, Sovereign Bank, (as amended, and as further amended pursuant to the LOC Amendment (as defined below), the "Existing Credit Agreement") for the purpose of renewing, extending and increasing our line of credit under such agreement. In connection with this amendment to the Legacy TGC Credit Agreement, we entered into a new term loan evidenced by a promissory note dated June 30, 2015 in the aggregate principal amount of $5,144,000 (the "New Term Loan") and used the proceeds of the New Term Loan to repay in full and terminate the Legacy Dawson Credit Agreement and its master advance term note agreement in connection therewith (collectively, the "Legacy Dawson Credit Facilities").
Our Existing Credit Agreement with Sovereign Bank includes a term loan feature and a revolving loan feature, and also allows for the issuance of letters of credit or and other promissory notes. We can borrow up to a maximum of $20.0 million pursuant to the Existing Credit Agreement, subject to the terms and limitations discussed below.
The Company hasAs of December 31, 2015, we had one outstanding note payable under the term loan feature of the Existing Credit Agreement with a principal amount of $3,429,000. We had two outstanding notes payable under the Existing Credit Agreement that are not under the term loan feature (and therefore do not count towards the maximum amounts that we may borrow) which were incurred to purchase (and are secured by) equipment, representing a remaining aggregate principal amount of $5,225,000 as of December 31, 2015. In addition, the Existing Credit Agreement permits us to borrow, repay and re-borrow, from time to time until June 30, 2017, up to the lesser of $20.0 million or 80% of our eligible accounts receivable less the then-outstanding principal balance of the New Term Loan (the "Existing Line of Credit"). We did not utilize the Existing Line of Credit during 2015, and we have the full Existing Line of Credit available for borrowing. Because our ability to borrow funds under our revolving line of credit agreement withis tied to the amount of our eligible accounts receivable, if our accounts receivable decrease materially for any reason, including delays, reductions or cancellations by clients or decreased demand for our services, our ability to borrow to fund operations or other obligations may be limited.
Table of Contents
On November 25, 2015, we entered into an amendment (the "LOC Amendment") to the Existing Credit Agreement to provide for the issuance of a commercial bank. The borrowing limit under the revolving lineletter of credit agreement is $5,000,000 and was renewed on September 16, 2011, and again on September 16, 2012.in the principal amount of $1,767,000 in favor of AIG Assurance Company in order to support payment of certain insurance premiums of the Company. The revolving lineprincipal amount of this letter of credit agreementcounts as funds borrowed under our Existing Line of Credit. The foregoing description does not expire until September 16, 2013.purport to set forth the complete terms of the LOC Amendment and is qualified in its entirety by reference to the full text of the LOC Amendment attached hereto as Exhibit 10.11, which is incorporated by reference herein.
Our obligations under this agreementthe Existing Line of Credit are secured by a security interest in our accounts receivable.receivable, and the term notes are secured by certain of our core equipment. Interest on amounts outstanding under the outstanding amountExisting Credit Agreement accrues at the lesser of 4.5% or the prime rate (as quoted in theWall Street Journal), subject to an interest rate floor of 2.5%. The Existing Credit Agreement contains customary covenants for credit facilities of this type, including limitations on disposition of assets, mergers and other fundamental changes. We are also obligated to meet certain financial covenants, including (i) a ratio of (x) total liabilitiesminus subordinated debt to (y) tangible net worthplus subordinated debt not to exceed 1.00:1.00, (ii) a ratio of current assets to current liabilities of at least 1.50:1.00 and (iii) required tangible net worth of not less than $150,000,000. We were in compliance with all covenants under the Existing Credit Agreement, including specified ratios, as of December 31, 2015.
Prior to its repayment and termination, the Legacy Dawson Credit Facilities provided for a revolving line of credit and term loans to be made pursuant to notes. We did not utilize the line of credit loan agreement is payable monthly atavailable under the greaterLegacy Dawson Credit Facilities prior to the termination of the prime rateLegacy Dawson Credit Facilities. Prior to termination of interest or five percent. As of December 31, 2012, and since its inception,the Legacy Dawson Credit Facilities, we have had no borrowingsoutstanding under the line of credit loan agreement.
At December 31, 2012, the Company had seven outstanding notes payable to commercial banks for equipment purchases. The notes have interest rates between 3.50% and 6.35%, are due in monthly installments between $50,170 and $223,437 plus interest, have a total outstanding balance of $24,553,291 and are collateralized by equipment. Three notes payable with interest rates between 5.33% and 6.00% and monthly payments between $23,740 and $61,997 plus interest were paid off in 2012. These notes were collateralized by equipment.
The Company had, at December 31, 2011, three outstanding notes payable to equipment finance companies for equipment purchases. The notes have interest rates between 5.33%under the term loan feature of the Legacy Dawson Credit Agreement. All amounts owed under the Legacy Dawson Credit Facilities were repaid on June 30, 2015 using proceeds of the New Term Loan and 6.00%, were duetotaled $5,144,000.
We had one outstanding note, in monthly installments between $23,740 and $61,997 plus interest, and were collateralized by equipment. Allthe remaining principal amount of these notes were paid off in 2012.
The Company had,$838,000 at December 31, 2012, two outstanding notes2015 payable to a finance companiescompany for corporate insurance. The notes have interest rates between 4.16% and 4.95%, are due in monthly installments between $16,861 and $302,892 including interest, and have a total outstanding balance of $474,587.
Our Houston sales office is in a 1,711-square foot facility. The monthly rent is currently $3,279. Our corporate offices in Plano, Texas were increased from 8,523 square feet to 10,137 square feet of office space in March of 2012. The monthly rent is currently $14,784. We lease an 800-square foot facility in Oklahoma City, Oklahoma, as a sales office on a month-to-month basis, and the current monthly rent is $665. We lease a 400-square foot facility in Pratt, Kansas, as a permit office on a month-to-month basis, and the current monthly rent is $500. In October 2012, we expanded our Denison, Texas, repair warehouse facility with the addition of a third 10,000-square foot building. The Denison, Texas, facility consists of one 5,000-square foot building, three 10,000-square foot adjacent buildings, and an outdoor storage area of approximately 60,500 square feet. The monthly rent is currently $16,547. We lease a 915-square foot office facility in Midland, Texas, as a sales office with a monthly rent of $915. Upon the acquisition of Eagle Canada, we assumed a lease entered into in August of 2008 for 3,030 square feet of office space located in Calgary, Alberta. The monthly rent is currently $12,817. In addition, Eagle Canadawe lease vehicles and certain specialized seismic equipment under leases a 10,088-square foot facility, also located in Calgary, Alberta, that is usedclassified as a shop and warehouse. The monthly rent is currently $8,041. In April of 2012, we leased a storage and parking area adjacent to the Eagle Canada shop and warehouse. The monthly rent is currently $5,126. The Company is not responsible for insuring these facilities. The conditions of these facilities are good, and we believe that these properties are suitable and adequate for our foreseeable needs.
17
Contractual Obligations
The following table summarizes payments due in specific periods related to our contractual obligationscapital leases. Our balance sheet as of December 31, 2012:2015 includes capital lease obligations of $1,199,000.
| | Payments Due by Period | |
| | | | Within | | | | | | After | |
Contractual Obligations | | Total | | 1 Year | | 1-2 Years | | 3-5 Years | | 5 Years | |
| | (In thousands) | | | | | | | | | |
Operating lease obligations | | $ | 1,951 | | $ | 718 | | $ | 519 | | $ | 714 | | $ | — | |
Debt obligations | | $ | 25,028 | | $ | 10,615 | | $ | 7,934 | | $ | 6,479 | | $ | — | |
Capital lease obligations | | $ | 3,845 | | $ | 1,960 | | $ | 1,280 | | $ | 605 | | $ | — | |
Total | | $ | 30,824 | | $ | 13,293 | | $ | 9,733 | | $ | 7,798 | | $ | — | |
Contractual Obligations.We believe that our capital resources, including our short-term investments, funds available under our line ofrevolving credit loan agreement, and cash flow from operations, arewill be adequate to meet our current operational needs. We believe that we will be able to finance our 20132016 capital expenditures through cash flow from operations, borrowings from commercial lenders, and the funds available under our line ofrevolving credit loan agreement. However, our ability to satisfy working capital requirements, meet debt repayment obligations, and fund future capital requirements will depend principally upon our future operating performance, which is subject to the risks inherent in our business.business, and will also depend on the extent to which the current economic climate adversely affects the ability of our customers, and/or potential customers, to promptly pay amounts owing to us under their service contracts with us.
Table of Contents
The following table summarizes payments due in specific periods related to our contractual obligations with initial terms exceeding one year as of December 31, 2015.
| | | | | | | | | | | | | | | | |
| | Payments Due by Period (in 000's) | |
|---|
Contractual Obligations | | Total | | Within
1 Year | | 2 - 3 Years | | 4 - 5 Years | | After
5 Years | |
|---|
Operating lease obligations (office space) | | $ | 11,271 | | $ | 1,704 | | $ | 2,660 | | $ | 1,899 | | $ | 5,008 | |
Capital lease obligations | | | 1,199 | | | 781 | | | 418 | | | — | | | — | |
Debt obligations | | | 9,492 | | | 7,804 | | | 1,688 | | | — | | | — | |
| | | | | | | | | | | | | | | | | |
Total | | $ | 21,962 | | $ | 10,289 | | $ | 4,766 | | $ | 1,899 | | $ | 5,008 | |
| | | | | | | | | | | | | | | | | |
| | | | | | | | | | | | | | | | | |
| | | | | | | | | | | | | | | | | |
Off-Balance Sheet Arrangements
As of December 31, 2012,2015, we had no off-balance sheet arrangements.
Critical Accounting Policies
The preparation of our financial statements in conformity with GAAPgenerally accepted accounting principles requires us to makethat certain assumptions and estimates be made that affect the reported amounts of assets and liabilities at the date of our financial statements and the reported amounts of revenues and expenses during the reporting period.periods. Because of the use of assumptions and estimates inherent in the reporting process, actual results could differ from those estimates.
Revenue Recognition
Seismic Surveys
The Company provides seismic data acquisition survey services to its customers under general service agreements which define certain obligations for the Company and for its customers. A supplemental agreement setting forth the terms of a specific project, which may be cancelled by either party upon 30 days’ advance written notice, is entered into for every project. These supplemental agreements are either “turnkey” agreements providing for a fixed fee to be paid for each unit of seismic data acquired or “term” agreements providing for a fixed hourly, daily, or monthly fee during the term of the project. The duration of these projects will vary from a few days to several months. The Company recognizes revenue when services are performed under both types of agreements. Services are defined as the commencement of data acquisition, which is the physical act of laying out seismic equipment or recording contractually determined data points. Under turnkey agreements, the total number of units of seismic data to be gathered is set forth in the agreement. TGC recognizes revenue on turnkey agreements as services are performed on a per unit of seismic data acquired rate based on the number of data points per square mile obtained as compared to the number of square miles set forth in the agreement. Eagle Canada recognizes revenue on turnkey agreements as services are performed on a per unit of seismic data laid-out rate, which is standard industry practice in Canada, based on the number of receiver lines laid out as compared to the estimated total lines to be laid out for the project pursuant to the agreement. Under term agreements, revenue is recognized, by both TGC and Eagle Canada, as services are performed based on the time worked rate provided in the term agreement. Under both turnkey and term agreements, cost of earned revenue is recognized by multiplying total estimated agreement cost by the percentage-of-completion of the agreement. The excess of that amount over the cost of earned revenue reported in prior periods is recognized as cost of earned revenue for the period. Agreements are not segmented nor combined for purposes of calculating percentage of completion. The asset “Cost and estimated earnings in excess of billings on uncompleted contracts” represents cost incurred on turnkey agreements in excess of billings on those agreements. The liability “Billings in excess of costs and estimated earnings on uncompleted contracts” represents billings on turnkey agreements in excess of cost on those agreements. Claims have been negligible in the years ended December 31, 2012, 2011, and 2010.
18
Business Combinations
We allocate the purchase price of acquired companies to the tangible assets acquired, liabilities assumed, and intangible assets acquired, based on their estimated fair values. The excess of the purchase price over these fair values is recorded as goodwill. We engage independent third-party appraisal firms to assist us in determining the fair values of assets acquired and liabilities assumed. Such valuations require management to make significant estimates and assumptions.
Allowance for Doubtful AccountsAccounts.
We prepare our allowance for doubtful accounts receivable based on our review of past-due accounts, our past experience of historical write-offs and our current customer base, and our reviewclient base. While the collectability of past due accounts. Theoutstanding client invoices is continually assessed, the inherent volatility of the energy industry’sindustry's business cycle can cause swift and unpredictable changes in the financial stability of our customers. In the fourth quarter of 2009, we recorded an allowance against the account of a slow paying customer. In the third quarter of 2010, this allowance was reversed because we determined an allowance was no longer required. In 2012 and 2011, no allowances were necessary.clients.
Impairment of Long-lived AssetsLong-Lived Assets.
We review long-lived assets for impairment when triggering events occur suggesting deterioration in the assets’assets' recoverability or fair value. Recognition of an impairment charge is required if future expected undiscounted net cash flows are insufficient to recover the carrying value of the asset.assets and the fair value of the assets is below the carrying value of the assets. Our forecast of future cash flows used to perform impairment analysis includes estimates of future revenues and profitabilityexpenses based on our historicalanticipated future results and analysis ofwhile considering anticipated future oil and natural gas prices, which areis fundamental toin assessing demand for our services. If we are unable to achieve thesethe carrying amounts of the assets exceed the estimated expected undiscounted future cash flows, our estimates willwe measure the amount of possible impairment by comparing the carrying amount of the asset to its fair value. If there were to be revised which could resulta fifteen percent or more decline in anprojected cash flows the Company would be required to do further impairment chargeanalysis to determine if fair value is less than the carrying amount of the assets at that time. No impairment charges were recognized for the period of revision.year ended December 31, 2015, the three months ended December 31, 2014, and the years ended September 30, 2014 and 2013.
Leases.Depreciable Lives of Property, Plant, We lease certain equipment and Equipment
Our property, plant,vehicles under lease agreements. We evaluate each lease to determine its appropriate classification as an operating or capital lease for financial reporting purposes. Any lease that does not meet the criteria for a capital lease is accounted for as an operating lease. The assets and equipmentliabilities under capital leases are capitalizedrecorded at historical cost and depreciated over the useful lifelower of the asset. Our estimate of this useful life is based on circumstances that exist in the seismic industry and information available at the timepresent value of the purchaseminimum lease payments or the fair market value of the asset. The technology of the equipment used to gather data in the seismic industry has historically evolved such that obsolescence does not occur quickly. As circumstances change and new information becomes available, these estimates could change. We amortize these capitalized itemsrelated assets. Assets under capital leases are amortized using the straight-line method. Capitalmethod over the initial lease term. Amortization of assets under capital leases is included in depreciation expense.
Revenue Recognition. Our services are depreciated over their useful lives ranging from oneprovided under cancelable service contracts. These contracts are either "turnkey" or "term" agreements. Under both types of agreements, we recognize revenues when
Table of Contents
revenue is realizable and services are performed. Services are defined as the commencement of data acquisition or processing operations. Revenues are considered realizable when earned according to seven years, depending on the classificationterms of the asset.service contracts. Under turnkey agreements, revenue is recognized on a per unit of data acquired rate, as services are performed. Under term agreements, revenue is recognized on a per unit of time worked rate, as services are performed. In the case of a cancelled service contract, we recognize revenue and bill our client for services performed up to the date of cancellation.
Tax AccountingWe also receive reimbursements for certain out-of-pocket expenses under the terms of our service contracts. We record amounts billed to clients in revenue at the gross amount including out-of-pocket expenses that are reimbursed by the client.
In some instances, we bill clients in advance of the services performed. In those cases, we recognize the liability as deferred revenue. As services are performed, those deferred revenue amounts are recognized as revenue.
In some instances, the contract contains certain permitting, surveying and drilling costs that are incorporated into the per unit of data acquired rate. In these circumstances, these set-up costs that occur prior to initiating revenue recognition are capitalized and amortized as data is acquired.
Income Taxes.We account for our income taxes in accordance with the recognition of amounts of taxes payable or refundable for the current year and by using an asset and liability approach in recognizing the amount of deferred tax liabilities and assets for the future tax consequences of events that have been recognized in our financial statements or tax returns. We determine deferred taxes by identifying the types and amounts of existing temporary differences, measuring the total deferred tax asset or liability using the applicable tax rate and reducingin effect for the year in which those temporary differences are expected to be recovered or settled. The effect of a change in tax rates of deferred tax assets and liabilities is recognized in income in the year of an enacted rate change. The deferred tax asset is reduced by a valuation allowance if, based on available evidence, it is more likely than not that some portion or all of the deferred tax assets will not be realized. Our methodology for recording income taxes requires judgment regarding assumptions and the use of estimates, including determining our annual effective tax rate and the valuation of deferred tax assets, which can create a variance between actual results and estimates and could have a material impact on our provision or benefit for income taxes.
Stock-Based Compensation
We recognize Our effective tax rates differ from the fair valuestatutory federal rate of the stock-based compensation awards, including stock options35% for certain items such as state and restricted stock, as wages in the consolidated statements of earnings on a straight-line basis over the vesting period of the related stock options or restricted stock awards. This has resulted in the recognition of compensation expense, relative to stock-based awards, in wages in the consolidated statements of earnings of approximately $601,000 or approximately $0.03 per share for the year ended December 31, 2012,local taxes, non-deductible expenses, discrete items and $424,000, or approximately $0.02 per share, for the year ended December 31, 2011.
19
Shares of restricted stock were issued to employees of the Company under the 2006 Stock Awards Plan as follows: 18,900 in August of 2007; 10,000 in June of 2008; 5,000 in July 2009; 5,000 in May of 2010; 25,331 in November of 2011; 21,520 in December of 2011; 6,000 in January of 2012; and 213,125 in August of 2012. In addition, stock options were issued to employees of the Company under the 2006 Stock Awards Plan as follows: 335,000 in October of 2008; 135,000 in November of 2009; and 15,000 in November of 2011. No stock options were granted to employees in 2010 or 2012. As of December 31, 2012, there was approximately $1,141,400 of unrecognized compensation expenseexpenses related to our share-based compensation plan.that were not expected to result in a tax deduction.
Recently Issued Accounting Pronouncements
In May 2011,February 2016, the Financial Accounting Standards Board (FASB)("FASB") issued Accounting Standards Update (ASU)("ASU") No. 2011-04, Fair Value Measurement2016-02, Leases (Topic 820): Amendments842) which will require organizations that lease assets to Achieve Common Fair Value Measurementrecognize on the balance sheet the assets and Disclosure Requirements in U.S. GAAPliabilities for the rights and International Financial Reporting Standards,obligations created by those leases. This ASU is effective for the annual period ending after December 15, 2016, and for annual interim periods thereafter. Early adoption is permitted. We are currently evaluating the new guidance to provide a consistent definition of fair value and ensure thatdetermine the fair value measurement and disclosure requirements are similar between U.S. GAAP and International Financial Reporting Standards. ASU 2011-04 changes certain fair value measurement principles and enhances disclosure requirements, particularly for Level 3 fair value measurements. ASU 2011-04 became effective in our first quarter of 2012 and has not had a material effectimpact it will have on our consolidated financial statements.
In June 2011,November 2015, the FASB issued ASU No. 2011-05, Comprehensive Income (Topic 220): Presentation2015-17 to simplify income tax accounting. The update requires that all deferred tax assets and liabilities be classified as noncurrent on the balance sheet instead of Comprehensive Income, to require an entity to present the total of comprehensive income, the components of net income,separating deferred taxes into current and the components of other comprehensive income either in a single continuous statement of comprehensive income or in two separate but consecutive statements. ASU 2011-05 eliminates the option to present the components of other comprehensive income as part of the statement of equity.noncurrent amounts. This update does not change what items are reported in other comprehensive income or the requirement to report reclassification of items from other comprehensive income to net income. ASU 2011-05 becameis effective in our first quarter of 2012 and has not had a material effect on our financial statements.
In September 2011, the FASB issued ASU 2011-08, Intangibles-Goodwill and Other (Topic 350): Testing for Impairment. ASU 2011-08 amends the guidance in FASB Accounting Standards Codification Topic (“ASC”) 350-20, Intangibles-Goodwill and Other-Goodwill. The intent of this ASU is to simplify how entities test goodwill for impairment by allowing an entity to use a qualitative approach to test goodwill for impairment. The amendments in the ASU permit an entity to first assess qualitative factors to determine whether it is more likely than not that the fair value of a reporting unit is less than its carrying amount as a basis for determining whether it is necessary to perform the two-step goodwill impairment test described in ASC 350-20. The amendments do not change the current guidance for testing other indefinite-lived assets for impairment. ASU 2011-08 was effective for goodwill impairment tests performed for fiscal years beginning after December 15, 2011. Early application was permitted. The Company2016, and interim periods within those fiscal years, and may be adopted earlier on a voluntary basis. We elected to early adopt this standard earlyguidance during the fourth quarter of 2015 and effectivehave applied a full retrospective approach to all periods presented. Current deferred income tax assets of $5,977,000 as of December 31, 2011September 30, 2014 have been reclassified and presented as a reduction to deferred income tax liabilities, net, in its year-end goodwill impairment analysis.the consolidated balance sheet.
Table of Contents
EffectIn September 2015, the FASB issued ASU 2015-16 that eliminates the requirement that an acquirer in a business combination account for measurement-period adjustments retrospectively. Instead, an acquirer will recognize a measurement-period adjustment during the period in which it determines the amount of Inflationthe adjustment, including the effect on earnings of any amounts it would have recorded in previous periods if the accounting had been completed at the acquisition date. The guidance is effective for public entities for fiscal years beginning after December 15, 2015 and interim periods within those fiscal years. Early adoption is permitted. We adopted ASU 2015-16 during the quarter ended September 30, 2015. The adoption of ASU 2015-16 did not materially affect our consolidated results of operations, cash flows, financial position or financial statement disclosures.
In August 2014, the FASB issued ASU No. 2014-15, "Presentation of Financial Statements — Going Concern" (Subtopic 205-40). This ASU provides guidance on management's responsibility to evaluate whether there is substantial doubt about an entity's ability to continue as a going concern and in certain circumstances to provide related footnote disclosures. This ASU is effective for the annual period ending after December 15, 2016, and for annual and interim periods thereafter. Early adoption is permitted. We do not believe that inflation has hadexpect the adoption of this guidance to have a material effectimpact on our business, resultsconsolidated financial statements.
In May 2014, the FASB issued ASU No. 2014-09 that introduces a new five-step revenue recognition model in which an entity should recognize revenue to depict the transfer of operations,promised goods or financial condition duringservices to customers in an amount that reflects the past three years.
20
Information Regarding Forward-Looking Statements
consideration to which the entity expects to be entitled in exchange for those goods or services. This Form 10-K includes “forward-looking statements” as definedASU also requires disclosures sufficient to enable users to understand the nature, amount, timing, and uncertainty of revenue and cash flows arising from contracts with customers, including qualitative and quantitative disclosures about contracts with customers, significant judgments and changes in Section 27Ajudgments, and assets recognized from the costs to obtain or fulfill a contract. This standard is effective for fiscal years beginning after December 15, 2017, including interim periods within that reporting period. Early adoption is permitted, but only for fiscal years beginning after December 15, 2016. The standard permits the use of either the Securities Actretrospective or cumulative effect transition method of 1933, as amended, and Section 21E ofadoption. We are currently evaluating the Securities Exchange Act of 1934, as amended, which reflect our view with respectnew guidance to future events. We base these forward-looking statementsdetermine the impact it will have on our current expectationsconsolidated financial statements and projections about future events. These forward-looking statements are subject to risks, uncertainties, and assumptions about the Company, including:
method of adoption.
·dependence upon energy industry spending for seismic data acquisition services;
·the unpredictable nature of forecasting weather;
·the potential for contract delay or cancellation;
·the potential for fluctuations in oil and natural gas prices; and
·the availability of capital resources.
We use the words “may,” “will,” “can,” “could,” “should,” “expect,” “anticipate,” “estimate,” “believe,” “target,” “continue,” “intend,” “plan,” “budget,” and other similar words to identify forward-looking statements. You should read statements that contain these words carefully because they discuss future expectations, contain projections of results of operations or of our financial condition, and/or state other “forward-looking” information. We do not undertake any obligation to update or revise publicly any forward-looking statements, except as required by law. These statements also involve risks and uncertainties that could cause our actual results or financial condition to differ materially from our expectations in this Form 10-K.
We believe that it is important to communicate our expectations of future performance to our investors. However, events may occur in the future that we are unable to accurately predict or over which we have no control. When considering our forward-looking statements, you should keep in mind the risk factors and other cautionary statements contained in this Form 10-K and other factors noted throughout this Form 10-K. There are many risks, uncertainties, and events that may cause our actual results to differ materially from those contained in any forward-looking statement. Please read the section entitled “Risk Factors” for a discussion of certain risks of our business and an investment in our common stock.
ITEM Item 7A. QUANTITATIVE AND QUALITATIVE DISCLOSURES ABOUT MARKET RISK
We are exposed to certain market risks arising from the use of financial instruments in the ordinary course of business. These risks arise primarily as a result of potential changes to operating concentration of credit risk and changes in interest rates. We have not entered into any hedginghedge arrangements, commodity swap agreements, commodity futures, options or swap agreements.other derivative financial instruments. We conduct business in Canada which subjects our results of operations and cash flow to foreign currency exchange rate risk.
Concentration of Credit Risk. Our principal market risk isrisks include fluctuations in commodity prices, which affect demand for and pricing of our services, and the risk related to the concentration of our customersclients in the oil and natural gas industry. Since all of our customersclients are involved in the oil and natural gas industry, there may be a positive or a negative effect on our exposure to credit risk in thatbecause our customersclients may be similarly affected by changes in economic and industry conditions. ForAs an example, changes to existing regulations or the adoption of new regulations may unfavorably impact us, our suppliers or our clients. In the normal course of business, we provide credit terms to our clients. Accordingly, we perform ongoing credit evaluations of our clients and maintain allowances for possible losses. Our historical experience supports our allowance for doubtful accounts of $250,000 at December 31, 2015. This does not necessarily indicate that it would be adequate to cover a payment default by one large or several small clients.
We generally provide services to certain key clients that account for a significant percentage of our accounts receivable at any given time. Our key clients vary over time. We extend credit to various
Table of Contents
companies in the oil and natural gas industry, including our key clients, for the acquisition of seismic data, which results in a concentration of credit risk. This concentration of credit risk may be affected by changes in the economic or other conditions of our key clients and may accordingly impact our overall credit risk. If any of these significant clients were to terminate their contracts or fail to contract for our services in the future because they are acquired, alter their exploration or development strategy, or for any other reason, our results of operations could be affected. Because of the nature of our contracts and clients' projects, our largest clients can change from year to year, and the largest clients in any year may not be indicative of the largest clients in any subsequent year. During the twelve months ended December 31, 2012,2015, our two largest customerclients accounted for approximately 16%36% of revenues. Forrevenue. The remaining balance of our revenue derived from varied clients and none represented more than 10% of revenue.
Interest Rate Risk. We are exposed to the year endedimpact of interest rate changes on the outstanding indebtedness under our Existing Credit Agreement. We generally have cash in the bank which exceeds federally insured limits. Historically, we have not experienced any losses in such accounts; however, volatility in financial markets may impact our credit risk on cash and short-term investments. At December 31, 2011, our largest customer accounted for approximately 17% of revenues. For the year ended December 31, 2010, our top customer accounted for approximately 15% of our revenues. We conduct business in Canada which subjected us to a foreign currency exchange rate risk. Our results of operations2015, cash and our cash flows could be impacted by changes in foreign currency exchange rates.equivalents totaled $37,009,000.
For further information, see “Item"Item 7. Management’sManagement's Discussion and Analysis of Financial Condition and Results of Operations,”" and “Item"Item 1A. Risk Factors.”
"
21
ITEM Item 8. FINANCIAL STATEMENTS AND SUPPLEMENTARY DATA.DATA
The information required by this item appears on pages F-1 through F-27 hereof and are incorporated herein by reference.
Consolidated Financial Statements
Item 9. December 31, 2012, 2011, and 2010CHANGES IN AND DISAGREEMENTS WITH ACCOUNTANTS ON ACCOUNTING AND FINANCIAL DISCLOSURE
None.
Item 9A. CONTROLS AND PROCEDURES
CONTENTSManagement's Evaluation of Disclosure Controls and Procedures
22
ReportWe carried out an evaluation, under the supervision and with the participation of Independent Registered Publicour management, including our principal executive, financial and accounting officers, of the effectiveness of our disclosure controls and procedures pursuant to Rule 13a-15(e) and 15d-15(e) under the Securities Exchange Act of 1934 as of the end of the period covered by this report. Based upon that evaluation, our President and Chief Executive Officer, our Executive Vice President, Treasurer and Chief Financial Officer and our Executive Vice President, Secretary and Chief Accounting Firm
Board of Directors and Shareholders
TGC Industries, Inc. and Subsidiary
We have audited the accompanying consolidated balance sheets of TGC Industries, Inc. and Subsidiary (“the Company”)Officer concluded that, as of December 31, 20122015, our disclosure controls and 2011, and the related consolidated statements of earnings, comprehensive income, shareholders’ equity, and cash flows for each of the three years in the period ended December 31, 2012. These financial statements are the responsibility of the Company’s management. Our responsibility is to express an opinion on these consolidated financial statements based on our audit.
We conducted our audit in accordance with the standards of the Public Company Accounting Oversight Board (United States). Those standards require that we plan and perform the audit to obtain reasonable assurance about whether the consolidated financial statements are free of material misstatement. Our audit of the consolidated financial statements included examining, on a test basis, evidence supporting the amounts and disclosures in the consolidated financial statements, assessing the accounting principles used and significant estimates made by management, as well as evaluating the overall financial statement presentation. We believe that our audit provides a reasonable basis for our opinion.
In our opinion, the consolidated financial statements referred to above present fairly,procedures were effective, in all material respects, with regard to the consolidatedrecording, processing, summarizing and reporting, within the time periods specified in the SEC's rules and forms, for information required to be disclosed by us in the reports that we file or submit under the Exchange Act. Our disclosure controls and procedures include controls and procedures designed to ensure that information required to be disclosed in reports filed or submitted under the Exchange Act is accumulated and communicated to our management, including our President and Chief Executive Officer, our Executive Vice President, Treasurer and Chief Financial Officer and our Executive Vice President, Secretary and Chief Accounting Officer, as appropriate, to allow timely decisions regarding required disclosure.
Changes in Internal Control Over Financial Reporting. We completed the Merger on February 11, 2015. We have extended our oversight and monitoring processes that support our internal control over financial position of TGC Industries, Inc.reporting to include Legacy TGC's operations. Except for this extension, there have not been any changes in our internal control over financial reporting (as defined in Rule 13a-15(f) and Subsidiary as of December 31, 2012 and 2011, and the consolidated results of their operations and comprehensive income and their cash flows for each15d-15(f) of the years in
Table of Contents
Securities Exchange Act of 1934) during the three year periodquarter ended December 31, 2012, in conformity with accounting principles generally accepted in2015 that have materially affected or are reasonably likely to materially affect our internal control over financial reporting.
Management's Report on Internal Control over Financial Reporting
Our management is responsible for establishing and maintaining adequate internal control over financial reporting. Our internal control over financial reporting is designed to provide reasonable assurance regarding the United Statesreliability of America.
We also have audited,financial reporting and the preparation of financial statements for external purposes in accordance with the standardsgenerally accepted accounting principles. Because of the Public Company Accounting Oversight Board (United States), TGC Industries, Inc. and Subsidiary’sits inherent limitations, internal control over financial reporting may not prevent or detect misstatements. Also, projections of any evaluation of effectiveness to future periods are subject to the risk that controls may become inadequate because of changes in conditions, or that the degree of compliance with the policies or procedures may deteriorate. Under the supervision and with the participation of management, including our President and Chief Executive Officer, Executive Vice President, Treasurer and Chief Financial Officer, and our Executive Vice President, Secretary and Chief Accounting Officer, we evaluated the effectiveness of our internal controls over financial reporting as of December 31, 2012, based on2015 using the criteria establishedset forth inInternal Control-IntegratedControl — Integrated Framework issued by the Committee of Sponsoring Organizations of the Treadway Commission and(2013 framework). Based on this evaluation, we have concluded that, as of December 31, 2015, our report dated March 15, 2013 expressed an unqualified opinion thereon.
/s/ LANE GORMAN TRUBITT, PLLC
| |
| |
| |
Dallas, Texas
| |
March 15, 2013
| |
23
Report of Independent Registered Public Accounting Firm
Board of Directors and Shareholders
TGC Industries, Inc. and Subsidiary
We have audited the TGC Industries, Inc. and Subsidiary’s (“the Company”)internal control over financial reporting was effective. Our internal control over financial reporting as of December 31, 2012,2015 has been audited by Ernst & Young LLP, the independent registered public accounting firm who also audited our financial statements. Their attestation report appears on page F-2.
Changes in Internal Control over Financial Reporting
There have not been any changes in our internal control over financial reporting (as defined in Exchange Act Rule 13a-15(f) and 15d-15(f) of the Securities Exchange Act of 1934) during the quarter ended December 31, 2015 that have materially affected or are reasonably likely to materially affect our internal control over financial reporting.
Item 9B. OTHER INFORMATION
None.
Table of Contents
Part III
Item 10. DIRECTORS, EXECUTIVE OFFICERS AND CORPORATE GOVERNANCE
The information required by Item 10 of Form 10-K is hereby incorporated by reference from the earlier filed of: (i) an amendment to this annual report on Form 10-K or (ii) the Company's definitive proxy statement which will be filed pursuant to Regulation 14A within 120 days after the Company's year-end for the year covered by this report.
Item 11. EXECUTIVE COMPENSATION
The information required by Item 11 of Form 10-K is hereby incorporated by reference from the earlier filed of: (i) an amendment to this annual report on Form 10-K or (ii) the Company's definitive proxy statement which will be filed pursuant to Regulation 14A within 120 days after the Company's year-end for the year covered by this report.
Item 12. SECURITY OWNERSHIP OF CERTAIN BENEFICIAL OWNERS AND MANAGEMENT AND RELATED STOCKHOLDER MATTERS
The information required with respect to our equity compensation plans is set forth in Item 5 of this Form 10-K. Other information required by Item 12 of Form 10-K is hereby incorporated by reference from the earlier filed of: (i) an amendment to this annual report on Form 10-K or (ii) the Company's definitive proxy statement which will be filed pursuant to Regulation 14A within 120 days after the Company's year-end for the year covered by this report.
Item 13. CERTAIN RELATIONSHIPS AND RELATED TRANSACTIONS AND DIRECTOR INDEPENDENCE
The information required by Item 13 of Form 10-K is hereby incorporated by reference from the earlier filed of: (i) an amendment to this annual report on Form 10-K or (ii) the Company's definitive proxy statement which will be filed pursuant to Regulation 14A within 120 days after the Company's year-end for the year covered by this report.
Item 14. PRINCIPAL ACCOUNTING FEES AND SERVICES
The information required by Item 14 of Form 10-K is hereby incorporated by reference from the earlier filed of: (i) an amendment to this annual report on Form 10-K or (ii) the Company's definitive proxy statement, which will be filed pursuant to Regulation 14A within 120 days after the Company's year-end for the year covered by this report.
Table of Contents
Part IV
Item 15. EXHIBITS AND FINANCIAL STATEMENT SCHEDULES
- (a)
- The following documents are filed as part of this report:
- (1)
- Financial Statements.
The following consolidated financial statements of the Company appear on pages F-1 through F-27 and are incorporated by reference into Part II, Item 8:
|
| Reports of Independent Registered Public Accounting Firms |
| Consolidated Balance Sheets |
| Consolidated Statements of Operations and Comprehensive (Loss) Income |
| Consolidated Statements of Stockholders' Equity |
| Consolidated Statements of Cash Flows |
| Notes to the Consolidated Financial Statements |
- (2)
- Financial Statement Schedules.
All schedules are omitted because they are either not applicable or the required information is shown in the financial statements or notes thereto.
The information required by this item 15(a)(3) is set forth in the Index to Exhibits accompanying this Annual Report on Form 10-K and is hereby incorporated by reference.
Table of Contents
SIGNATURES
Pursuant to the requirements of Section 13 or 15(d) of the Securities Exchange Act of 1934, the registrant has duly caused this report to be signed on its behalf by the undersigned, thereunto duly authorized, in the City of Midland, and the State of Texas, on the 15th day of March, 2016.
| | | | |
| | DAWSON GEOPHYSICAL COMPANY |
|
|
By: |
|
/s/ STEPHEN C. JUMPER
Stephen C. Jumper
Chairman of the Board of Directors
President and Chief Executive Officer |
Pursuant to the requirements of the Securities Exchange Act of 1934, this report has been signed below by the following persons on behalf of the registrant and in the capacities and on the dates indicated.
| | | | |
Signature | | Title | | Date |
|---|
|
|
|
|
|
/s/ STEPHEN C. JUMPER
Stephen C. Jumper | | President, Chief Executive Officer and Chairman of the Board of Directors (principal executive officer) | | 03-15-16 |
/s/ WAYNE A. WHITENER
Wayne A. Whitener |
|
Vice Chairman of the Board of Directors (principal executive officer) |
|
03-15-16 |
/s/ WILLIAM J. BARRETT
William J. Barrett |
|
Director |
|
03-15-16 |
/s/ CRAIG W. COOPER
Craig W. Cooper |
|
Director |
|
03-15-16 |
/s/ GARY M. HOOVER
Gary M. Hoover |
|
Director |
|
03-15-16 |
/s/ ALLEN T. MCINNES
Allen T. McInnes |
|
Director |
|
03-15-16 |
/s/ TED R. NORTH
Ted R. North |
|
Director |
|
03-15-16 |
Table of Contents
| | | | |
Signature | | Title | | Date |
|---|
|
|
|
|
|
/s/ MARK A. VANDER PLOEG
Mark A. Vander Ploeg | | Director | | 03-15-16 |
/s/ JAMES K. BRATA
James K. Brata |
|
Executive Vice President, Treasurer and Chief Financial Officer (principal financial officer) |
|
03-15-16 |
/s/ CHRISTINA W. HAGAN
Christina W. Hagan |
|
Executive Vice President, Secretary and Chief Accounting Officer (principal accounting officer) |
|
03-15-16 |
Table of Contents
INDEX TO CONSOLIDATED FINANCIAL STATEMENTS
| | |
Consolidated Financial Statements of Dawson Geophysical Company | | Page |
|---|
Reports of Independent Registered Public Accounting Firm, dated March 15, 2016 | | F-2 |
Consolidated Balance Sheets as of December 31, 2015 and September 30, 2014 | | F-4 |
Consolidated Statements of Operations and Comprehensive (Loss) Income for the year ended December 31, 2015, the three months ended December 31, 2014, and the years ended September 30, 2014 and 2013 | | F-5 |
Consolidated Statements of Stockholders' Equity for the year ended December 31, 2015, the three months ended December 31, 2014, and the years ended September 30, 2014 and 2013 | | F-6 |
Consolidated Statements of Cash Flows for the year ended December 31, 2015, the three months ended December 31, 2014, and for the years ended September 30, 2014 and 2013 | | F-7 |
Notes to Consolidated Financial Statements | | F-8 |
Table of Contents
Report of Independent Registered Public Accounting Firm
The Board of Directors and Stockholders of
Dawson Geophysical Company
We have audited Dawson Geophysical Company's internal control over financial reporting as of December 31, 2015, based on criteria established in Internal Control—Control — Integrated Framework issued by the Committee of Sponsoring Organizations of the Treadway Commission (COSO)(2013 framework) (the COSO criteria). The Company’sDawson Geophysical Company's management is responsible for maintaining effective internal control over financial reporting, and for its assessment of the effectiveness of internal control over financial reporting included in the accompanying Management’sManagement's Report on Internal Control over Financial Reporting. Our responsibility is to express an opinion on the Company’scompany's internal control over financial reporting based on our audit.
We conducted our audit in accordance with the standards of the Public Company Accounting Oversight Board (United States). Those standards require that we plan and perform the audit to obtain reasonable assurance about whether effective internal control over financial reporting was maintained in all material respects. Our audit of internal control over financial reporting included obtaining an understanding of internal control over financial reporting, assessing the risk that a material weakness exists, and testing and evaluating the design and operating effectiveness of internal control based on the assessed risk, and performing such other procedures as we considered necessary in the circumstances. We believe that our audit provides a reasonable basis for our opinion.
A company’scompany's internal control over financial reporting is a process designed to provide reasonable assurance regarding the reliability of financial reporting and the preparation of consolidated financial statements for external purposes in accordance with generally accepted accounting principles. A company’scompany's internal control over financial reporting includes those policies and procedures that (1) pertain to the maintenance of records that, in reasonable detail, accurately and fairly reflect the transactions and dispositions of the assets of the company; (2) provide reasonable assurance that transactions are recorded as necessary to permit preparation of consolidated financial statements in accordance with generally accepted accounting principles, and that receipts and expenditures of the company are being made only in accordance with authorizations of management and directors of the company; and (3) provide reasonable assurance regarding prevention or timely detection of unauthorized acquisition, use, or disposition of the company’scompany's assets that could have a material effect on the consolidated financial statements.
Because of its inherent limitations, internal control over financial reporting may not prevent or detect misstatements. Also, projections of any evaluation of effectiveness to future periods are subject to the risk that controls may become inadequate because of changes in conditions, or that the degree of compliance with the policies or procedures may deteriorate.
In our opinion, TGC Industries, Inc. and SubsidiaryDawson Geophysical Company maintained, in all material respects, effective internal control over financial reporting as of December 31, 2012,2015, based on the COSO criteria.
We also have audited, in accordance with the standards of the Public Company Accounting Oversight Board (United States), the consolidated balance sheets of TGC Industries, Inc. and SubsidiaryDawson Geophysical Company as of December 31, 20122015 and 2011,September 30, 2014, and the related consolidated statements of earnings,operations and comprehensive (loss) income, shareholders’stockholders' equity and cash flows for the year ended December 31, 2015, the three months ended December 31, 2014, and each of the threetwo years in the period ended December 31, 2012 of TGC Industries, Inc. and SubsidiarySeptember 30, 2014 and our report dated March 15, 20132016 expressed an unqualified opinion thereon.
/s/ LANE GORMAN TRUBITT, PLLC
| | |
| | /s/ Ernst & Young LLP |
Dallas, Texas
March 15, 2016
Table of Contents
Report of Independent Registered Public Accounting Firm
The Board of Directors and Stockholders of
Dawson Geophysical Company
We have audited the accompanying consolidated balance sheets of Dawson Geophysical Company as of December 31, 2015 and September 30, 2014, and the related consolidated statements of operations and comprehensive (loss) income, stockholders' equity and cash flows for the year ended December 31, 2015, the three months ended December 31, 2014, and each of the two years in the period ended September 30, 2014. These financial statements are the responsibility of the Company's management. Our responsibility is to express an opinion on these financial statements based on our audits.
We conducted our audits in accordance with the standards of the Public Company Accounting Oversight Board (United States). Those standards require that we plan and perform the audit to obtain reasonable assurance about whether the financial statements are free of material misstatement. An audit includes examining, on a test basis, evidence supporting the amounts and disclosures in the financial statements. An audit also includes assessing the accounting principles used and significant estimates made by management, as well as evaluating the overall financial statement presentation. We believe that our audits provide a reasonable basis for our opinion.
In our opinion, the financial statements referred to above present fairly, in all material respects, the consolidated financial position of Dawson Geophysical Company at December 31, 2015 and September 30, 2014, and the consolidated results of its operations and its cash flows for the year ended December 31, 2015, the three months ended December 31, 2014, and each of the two years in the period ended September 30, 2014, in conformity with U.S. generally accepted accounting principles.
We also have audited, in accordance with the standards of the Public Company Accounting Oversight Board (United States), Dawson Geophysical Company's internal control over financial reporting as of December 31, 2015, based on criteria established in Internal Control — Integrated Framework issued by the Committee of Sponsoring Organizations of the Treadway Commission (2013 framework), and our report dated March 15, 2016 expressed an unqualified opinion thereon.
| | |
| |
Dallas, Texas
| |
March 15, 2013
| /s/ Ernst & Young LLP |
Dallas, Texas
March 15, 2016
24
Table of Contents
TGC Industries, Inc. and Subsidiaries
DAWSON GEOPHYSICAL COMPANY
CONSOLIDATED BALANCE SHEETS
December 31,
| | 2012 | | 2011 | |
ASSETS | | | | | |
| | | | | |
CURRENT ASSETS | | | | | |
| | | | | |
Cash and cash equivalents | | $ | 8,614,244 | | $ | 15,745,559 | |
Trade accounts receivable | | 35,640,758 | | 19,351,023 | |
Cost and estimated earnings in excess of billings on uncompleted contracts | | 6,263,943 | | 5,101,478 | |
Prepaid expenses and other | | 1,824,779 | | 1,606,936 | |
| | | | | |
Total current assets | | 52,343,724 | | 41,804,996 | |
| | | | | |
PROPERTY AND EQUIPMENT - at cost | | | | | |
| | | | | |
Machinery and equipment | | 190,943,331 | | 139,017,290 | |
Automobiles and trucks | | 15,265,627 | | 12,616,608 | |
Furniture and fixtures | | 488,779 | | 434,146 | |
Leasehold improvements | | 14,994 | | 14,994 | |
| | 206,712,731 | | 152,083,038 | |
Less accumulated depreciation and amortization | | (117,326,964 | ) | (94,286,207 | ) |
| | 89,385,767 | | 57,796,831 | |
| | | | | |
Goodwill | | 201,530 | | 201,530 | |
Other assets | | 96,817 | | 77,870 | |
| | 298,347 | | 279,400 | |
| | | | | |
Total assets | | $ | 142,027,838 | | $ | 99,881,227 | |
| | | | | | | |
| | December 31,
2015 | | September 30,
2014 | |
|---|
ASSETS | | | | | | | |
Current assets: | | | | | | | |
Cash and cash equivalents | | $ | 37,009,000 | | $ | 22,753,000 | |
Short-term investments | | | 21,000,000 | | | 27,000,000 | |
Accounts receivable, net of allowance for doubtful accounts of $250,000 at December 31, 2015 and September 30, 2014 | | | 35,700,000 | | | 39,995,000 | |
Prepaid expenses and other assets | | | 6,150,000 | | | 2,420,000 | |
| | | | | | | | |
Total current assets | | | 99,859,000 | | | 92,168,000 | |
Property, plant and equipment | | |
345,619,000 | | |
337,922,000 | |
Less accumulated depreciation | | | (198,052,000 | ) | | (173,428,000 | ) |
| | | | | | | | |
Net property, plant and equipment | | | 147,567,000 | | | 164,494,000 | |
Intangibles | | |
361,000 | | |
— | |
| | | | | | | | |
Total assets | | $ | 247,787,000 | | $ | 256,662,000 | |
| | | | | | | | |
| | | | | | | | |
| | | | | | | | |
LIABILITIES AND STOCKHOLDERS' EQUITY | | | | | | | |
Current liabilities: | | | | | | | |
Accounts payable | | $ | 8,401,000 | | $ | 10,720,000 | |
Accrued liabilities: | | | | | | | |
Payroll costs and other taxes | | | 1,074,000 | | | 1,998,000 | |
Other | | | 4,604,000 | | | 4,097,000 | |
Deferred revenue | | | 6,146,000 | | | 801,000 | |
Current maturities of notes payable and obligations under capital leases | | | 8,585,000 | | | 6,752,000 | |
| | | | | | | | |
Total current liabilities | | | 28,810,000 | | | 24,368,000 | |
Long-term liabilities: | | |
| | |
| |
Notes payable and obligations under capital leases less current maturities | | | 2,106,000 | | | 4,933,000 | |
Deferred tax liability, net | | | 5,319,000 | | | 27,831,000 | |
Other accrued liabilities | | | 1,834,000 | | | — | |
| | | | | | | | |
Total long-term liabilities | | | 9,259,000 | | | 32,764,000 | |
Commitments and contingencies | | |
| | |
| |
Stockholders' equity: | | |
| | |
| |
Preferred stock-par value $1.00 per share; 4,000,000 shares authorized, none outstanding | | | — | | | — | |
Common stock-par value $0.01 per share; 35,000,000 shares authorized, 21,629,310 and 14,194,810 shares issued, and 21,580,865 and 14,194,810 shares outstanding at December 31, 2015 and September 30, 2014, respectively | | | 216,000 | | | 142,000 | |
Additional paid-in capital | | | 142,269,000 | | | 98,632,000 | |
Retained earnings | | | 69,057,000 | | | 100,973,000 | |
Treasury stock, at cost; 48,445 shares at December 31, 2015 and none at September 30, 2014 | | | — | | | — | |
Accumulated other comprehensive loss, net of tax | | | (1,824,000 | ) | | (217,000 | ) |
| | | | | | | | |
Total stockholders' equity | | | 209,718,000 | | | 199,530,000 | |
| | | | | | | | |
Total liabilities and stockholders' equity | | $ | 247,787,000 | | $ | 256,662,000 | |
| | | | | | | | |
| | | | | | | | |
| | | | | | | | |
The See accompanying notes are an integral part of these statementsto the consolidated financial statements.
25
TGC Industries, Inc. and Subsidiaries
CONSOLIDATED BALANCE SHEETS — Continued
December 31,
| | 2012 | | 2011 | |
| | | | | |
LIABILITIES AND SHAREHOLDERS’ EQUITY | | | | | |
| | | | | |
CURRENT LIABILITIES | | | | | |
| | | | | |
Trade accounts payable | | $ | 13,680,538 | | $ | 9,256,392 | |
Accrued liabilities | | 5,544,071 | | 2,598,126 | |
Billings in excess of costs and estimated earnings on uncompleted contracts | | 3,757,349 | | 937,755 | |
Federal and state income tax payable | | 4,569,891 | | 2,017,644 | |
Current maturities of notes payable | | 10,615,279 | | 5,802,513 | |
Current portion of capital lease obligations | | 1,960,503 | | 1,336,037 | |
| | | | | |
Total current liabilities | | 40,127,631 | | 21,948,467 | |
| | | | | |
NOTES PAYABLE, less current maturities | | 14,412,598 | | 5,328,892 | |
| | | | | |
CAPITAL LEASE OBLIGATIONS, less current portion | | 1,884,937 | | 1,626,612 | |
| | | | | |
LONG-TERM DEFERRED TAX LIABILITY | | 7,617,111 | | 7,257,576 | |
| | | | | |
COMMITMENTS AND CONTINGENCIES | | — | | — | |
| | | | | |
SHAREHOLDERS’ EQUITY | | | | | |
| | | | | |
Preferred stock, $1.00 par value; 4,000,000 shares authorized; issued - none | | — | | — | |
| | | | | |
Common stock, $.01 par value; 25,000,000 shares authorized; 20,732,500 and 19,348,436 shares issued and outstanding in each period | | 207,325 | | 193,484 | |
| | | | | |
Additional paid-in capital | | 29,573,986 | | 28,176,922 | |
| | | | | |
Retained earnings | | 48,073,556 | | 35,499,541 | |
| | | | | |
Treasury stock, at cost; 80,076 and 37,820 shares in each period | | (691,009 | ) | (257,394 | ) |
| | | | | |
Accumulated other comprehensive income | | 821,703 | | 107,127 | |
| | | | | |
| | 77,985,561 | | 63,719,680 | |
Total liabilities and shareholders’ equity | | $ | 142,027,838 | | $ | 99,881,227 | |
The accompanying notes are an integral partTable of these statements
Contents
26
DAWSON GEOPHYSICAL COMPANY
TGC Industries, Inc. and Subsidiaries
CONSOLIDATED STATEMENTS OF EARNINGSOPERATIONS AND COMPREHENSIVE (LOSS) INCOME
Years Ended December 31,
| | 2012 | | 2011 | | 2010 | |
| | | | | | | |
Revenue | | $ | 196,317,215 | | $ | 151,028,582 | | $ | 108,318,801 | |
| | | | | | | |
Cost and expenses | | | | | | | |
Cost of services | | 135,279,937 | | 104,022,944 | | 85,932,862 | |
Selling, general and administrative | | 8,755,270 | | 9,626,679 | | 6,894,500 | |
Depreciation and amortization expense | | 25,502,597 | | 19,214,069 | | 15,343,804 | |
| | 169,537,804 | | 132,863,692 | | 108,171,166 | |
| | | | | | | |
Income from operations | | 26,779,411 | | 18,164,890 | | 147,635 | |
| | | | | | | |
Interest expense | | 1,222,454 | | 784,425 | | 790,417 | |
| | | | | | | |
Income (loss) before income taxes | | 25,556,957 | | 17,380,465 | | (642,782 | ) |
| | | | | | | |
Income tax expense: | | | | | | | |
Current | | 9,525,543 | | 4,077,297 | | 433,350 | |
Deferred | | 359,535 | | 2,469,953 | | 146,550 | |
Income tax expense | | 9,885,078 | | 6,547,250 | | 579,900 | |
| | | | | | | |
Net income (loss) | | $ | 15,671,879 | | $ | 10,833,215 | | $ | (1,222,682 | ) |
| | | | | | | |
Net income (loss) per common share: | | | | | | | |
Basic | | $ | 0.76 | | $ | 0.54 | | $ | (0.06 | ) |
Diluted | | $ | 0.75 | | $ | 0.53 | | $ | (0.06 | ) |
| | | | | | | |
Weighted average number of shares outstanding: | | | | | | | |
Basic | | 20,489,179 | | 20,205,524 | | 20,162,944 | |
Diluted | | 20,855,596 | | 20,522,287 | | 20,162,944 | |
| | | | | | | | | | | | | |
| |
| | Three Months
Ended
December 31,
2014 | | Year Ended September 30, | |
|---|
| | Year Ended
December 31,
2015 | |
|---|
| | 2014 | | 2013 | |
|---|
Operating revenues | | $ | 234,685,000 | | $ | 50,802,000 | | $ | 261,683,000 | | $ | 305,299,000 | |
Operating costs: | | | | | | | | | | | | | |
Operating expenses | | | 205,566,000 | | | 42,957,000 | | | 223,336,000 | | | 234,660,000 | |
General and administrative | | | 22,729,000 | | | 5,093,000 | | | 16,083,000 | | | 13,364,000 | |
Depreciation and amortization | | | 47,072,000 | | | 9,736,000 | | | 40,168,000 | | | 37,095,000 | |
| | | | | | | | | | | | | | |
| | | 275,367,000 | | | 57,786,000 | | | 279,587,000 | | | 285,119,000 | |
(Loss) income from operations | | |
(40,682,000 |
) | |
(6,984,000 |
) | |
(17,904,000 |
) | |
20,180,000 | |
Other income (expense): | | | | | | | | | | | | | |
Interest income | | | 159,000 | | | 20,000 | | | 73,000 | | | 63,000 | |
Interest expense | | | (609,000 | ) | | (93,000 | ) | | (535,000 | ) | | (660,000 | ) |
Other income (expense) | | | 1,098,000 | | | 154,000 | | | 466,000 | | | (13,000 | ) |
| | | | | | | | | | | | | | |
(Loss) income before income tax | | | (40,034,000 | ) | | (6,903,000 | ) | | (17,900,000 | ) | | 19,570,000 | |
Income tax benefit (expense): | | |
| | |
| | |
| | |
| |
Current | | | (291,000 | ) | | (39,000 | ) | | (787,000 | ) | | (817,000 | ) |
Deferred | | | 14,046,000 | | | 1,951,000 | | | 6,067,000 | | | (8,273,000 | ) |
| | | | | | | | | | | | | | |
| | | 13,755,000 | | | 1,912,000 | | | 5,280,000 | | | (9,090,000 | ) |
| | | | | | | | | | | | | | |
Net (loss) income | | $ | (26,279,000 | ) | $ | (4,991,000 | ) | $ | (12,620,000 | ) | $ | 10,480,000 | |
| | | | | | | | | | | | | | |
| | | | | | | | | | | | | | |
| | | | | | | | | | | | | | |
Other comprehensive loss: | | | | | | | | | | | | | |
Net unrealized loss on foreign exchange rate translation, net of tax | | $ | (1,480,000 | ) | $ | (127,000 | ) | $ | (217,000 | ) | $ | — | |
| | | | | | | | | | | | | | |
Comprehensive (loss) income | | $ | (27,759,000 | ) | $ | (5,118,000 | ) | $ | (12,837,000 | ) | $ | 10,480,000 | |
| | | | | | | | | | | | | | |
| | | | | | | | | | | | | | |
| | | | | | | | | | | | | | |
Basic (loss) income per share attributable to common stock | | $ | (1.27 | ) | $ | (0.36 | ) | $ | (0.90 | ) | $ | 0.75 | |
| | | | | | | | | | | | | | |
| | | | | | | | | | | | | | |
| | | | | | | | | | | | | | |
Diluted (loss) income per share attributable to common stock | | $ | (1.27 | ) | $ | (0.36 | ) | $ | (0.90 | ) | $ | 0.74 | |
| | | | | | | | | | | | | | |
| | | | | | | | | | | | | | |
| | | | | | | | | | | | | | |
Cash dividend declared per share of common stock | | $ | — | | $ | 0.05 | | $ | 0.14 | | $ | — | |
| | | | | | | | | | | | | | |
| | | | | | | | | | | | | | |
| | | | | | | | | | | | | | |
Weighted average equivalent common shares outstanding | | | 20,688,185 | | | 14,019,813 | | | 14,008,635 | | | 13,868,120 | |
| | | | | | | | | | | | | | |
| | | | | | | | | | | | | | |
| | | | | | | | | | | | | | |
Weighted average equivalent common shares outstanding — assuming dilution | | | 20,688,185 | | | 14,019,813 | | | 14,008,635 | | | 13,939,841 | |
| | | | | | | | | | | | | | |
| | | | | | | | | | | | | | |
| | | | | | | | | | | | | | |
The See accompanying notes are an integral part of these statementsto the consolidated financial statements.
27
TGC Industries, Inc. and Subsidiaries
Consolidated StatementsTable of Comprehensive IncomeContents
Years Ended December 31,
| | 2012 | | 2011 | | 2010 | |
| | | | | | | |
Net Income (loss) | | $ | 15,671,879 | | $ | 10,833,215 | | $ | (1,222,682 | ) |
| | | | | | | | | | |
Other comprehensive income (loss): | | | | | | | |
Foreign currency translation adjustments | | 714,576 | | (641,538 | ) | 882,381 | |
| | | | | | | |
Total other comprehensive income (loss), net of tax | | $ | 16,386,455 | | $ | 10,191,677 | | $ | (340,301 | ) |
The accompanying notes are an integral part of these statements
28
DAWSON GEOPHYSICAL COMPANY
TGC Industries, Inc. and Subsidiaries
CONSOLIDATED STATEMENTS OF SHAREHOLDERS’STOCKHOLDERS' EQUITY
| | | | | | Additional | | | | | | Other | | | |
| | Common stock | | Paid-in | | Retained | | Treasury | | Comprehensive | | | |
| | Shares | | Amount | | Capital | | Earnings | | Stock | | Income (Loss) | | Total | |
Balances at December 31, 2009 | | 18,323,091 | | $ | 183,231 | | $ | 27,014,078 | | $ | 25,889,008 | | $ | (257,323 | ) | $ | (133,716 | ) | $ | 52,695,278 | |
5% common stock dividend | | 914,160 | | 9,142 | | (9,573 | ) | — | | — | | — | | (431 | ) |
Issuance of restricted common stock | | 5,000 | | 50 | | (50 | ) | — | | — | | — | | — | |
Amortization of unearned compensation restricted stock awards | | — | | — | | 86,230 | | — | | — | | — | | 86,230 | |
Amortization of compensation cost of unvested stock options | | — | | — | | 422,024 | | — | | — | | — | | 422,024 | |
Foreign currency translation adjustments | | — | | — | | — | | — | | — | | 882,381 | | 882,381 | |
Net loss | | — | | — | | — | | (1,222,682 | ) | — | | — | | (1,222,682 | ) |
Balances at December 31, 2010 | | 19,242,251 | | 192,423 | | 27,512,709 | | 24,666,326 | | (257,323 | ) | 748,665 | | 52,862,800 | |
Issuance of common stock awards | | 31,851 | | 318 | | 224,681 | | — | | — | | — | | 224,999 | |
Issuance of restricted common stock | | 15,000 | | 150 | | (150 | ) | — | | — | | — | | — | |
Exercise of stock options | | 59,334 | | 593 | | 180,912 | | — | | — | | — | | 181,505 | |
Amortization of unearned compensation restricted stock awards | | — | | — | | 28,603 | | — | | — | | — | | 28,603 | |
Amortization of compensation cost of unvested stock options | | — | | — | | 230,167 | | — | | — | | — | | 230,167 | |
Purchase of treasury shares | | — | | — | | — | | — | | (71 | ) | — | | (71 | ) |
Foreign currency translation adjustments | | — | | — | | — | | — | | — | | (641,538 | ) | (641,538 | ) |
Net income | | — | | — | | — | | 10,833,215 | | — | | — | | 10,833,215 | |
Balances at December 31, 2011 | | 19,348,436 | | 193,484 | | 28,176,922 | | 35,499,541 | | (257,394 | ) | 107,127 | | 63,719,680 | |
5% common stock dividend | | 971,990 | | 9,720 | | (10,870 | ) | — | | — | | — | | (1,150 | ) |
Cash dividend | | — | | — | | — | | (3,097,864 | ) | — | | — | | (3,097,864 | ) |
Issuance of restricted common stock | | 219,125 | | 2,191 | | (2,191 | ) | — | | — | | — | | — | |
Exercise of stock options | | 192,949 | | 1,929 | | 809,066 | | — | | (433,615 | ) | — | | 377,380 | |
Amortization of unearned compensation restricted stock awards | | — | | — | | 317,109 | | — | | — | | — | | 317,109 | |
Amortization of compensation cost of unvested stock options | | — | | — | | 283,950 | | — | | — | | — | | 283,950 | |
Foreign currency translation adjustments | | — | | — | | — | | — | | — | | 714,576 | | 714,576 | |
Net income | | — | | — | | — | | 15,671,879 | | — | | — | | 15,671,879 | |
Balances at December 31, 2012 | | 20,732,500 | | $ | 207,325 | | $ | 29,573,986 | | $ | 48,073,556 | | $ | (691,009 | ) | $ | 821,703 | | $ | 77,985,561 | |
| | | | | | | | | | | | | | | | | | | |
| | Common Stock | |
| |
| |
| |
| |
|---|
| |
| |
| | Accumulated
Other
Comprehensive
Loss | |
| |
|---|
| | Number
Of Shares | | Amount | | Additional
Paid-in
Capital | | Retained
Earnings | | Total | |
|---|
Balance September 30, 2012 | | | 14,135,209 | | $ | 141,000 | | $ | 95,760,000 | | $ | 105,048,000 | | $ | — | | $ | 200,949,000 | |
Net income | | | | | | | | | | | | 10,480,000 | | | | | | 10,480,000 | |
Stock-based compensation expense | | | | | | | | | 1,394,000 | | | | | | | | | 1,394,000 | |
Issuance of common stock as compensation | | | 25,492 | | | — | | | 403,000 | | | | | | | | | 403,000 | |
Forfeiture of restricted stock awards | | | (1,584 | ) | | — | | | — | | | | | | | | | — | |
Shares exchanged for taxes on stock-based compensation | | | (35,481 | ) | | — | | | (774,000 | ) | | | | | | | | (774,000 | ) |
Exercise of stock options | | | 56,584 | | | 1,000 | | | 607,000 | | | | | | | | | 608,000 | |
| | | | | | | | | | | | | | | | | | | | |
Balance September 30, 2013 | | | 14,180,220 | | | 142,000 | | | 97,390,000 | | | 115,528,000 | | | — | | | 213,060,000 | |
Net loss | | | | | | | | | | | | (12,620,000 | ) | | | | | (12,620,000 | ) |
Unrealized loss on foreign exchange rate translation | | | | | | | | | | | | | | | (345,000 | ) | | | |
Income tax benefit | | | | | | | | | | | | | | | 128,000 | | | | |
| | | | | | | | | | | | | | | | | | | | |
Other comprehensive loss | | | | | | | | | | | | | | | (217,000 | ) | | (217,000 | ) |
Stock-based compensation expense | | | | | | | | | 1,054,000 | | | | | | | | | 1,054,000 | |
Issuance of common stock as compensation | | | 9,706 | | | — | | | 171,000 | | | | | | | | | 171,000 | |
Issurance of common stock under stock compensation plans including tax effect | | | 2,640 | | | — | | | (1,000 | ) | | | | | | | | (1,000 | ) |
Shares exchanged for taxes on stock-based compensation | | | (836 | ) | | — | | | (14,000 | ) | | | | | | | | (14,000 | ) |
Exercise of stock options | | | 3,080 | | | — | | | 32,000 | | | | | | | | | 32,000 | |
Dividends paid | | | | | | | | | | | | (1,935,000 | ) | | | | | (1,935,000 | ) |
| | | | | | | | | | | | | | | | | | | | |
Balance September 30, 2014 | | | 14,194,810 | | | 142,000 | | | 98,632,000 | | | 100,973,000 | | | (217,000 | ) | | 199,530,000 | |
Net loss | | | | | | | | | | | | (4,991,000 | ) | | | | | (4,991,000 | ) |
Unrealized loss on foreign exchange rate translation | | | | | | | | | | | | | | | (203,000 | ) | | | |
Income tax benefit | | | | | | | | | | | | | | | 76,000 | | | | |
| | | | | | | | | | | | | | | | | | | | |
Other comprehensive loss | | | | | | | | | | | | | | | (127,000 | ) | | (127,000 | ) |
Stock-based compensation expense | | | | | | | | | 287,000 | | | | | | | | | 287,000 | |
Issuance of common stock as compensation | | | 21,730 | | | — | | | 165,000 | | | | | | | | | 165,000 | |
Dividends paid | | | | | | | | | | | | (646,000 | ) | | | | | (646,000 | ) |
| | | | | | | | | | | | | | | | | | | | |
Balance December 31, 2014 | | | 14,216,540 | | | 142,000 | | | 99,084,000 | | | 95,336,000 | | | (344,000 | ) | | 194,218,000 | |
Net loss | | | | | | | | | | | | (26,279,000 | ) | | | | | (26,279,000 | ) |
Unrealized loss on foreign exchange rate translation | | | | | | | | | | | | | | | (2,106,000 | ) | | | |
Income tax benefit | | | | | | | | | | | | | | | 626,000 | | | | |
| | | | | | | | | | | | | | | | | | | | |
Other comprehensive loss | | | | | | | | | | | | | | | (1,480,000 | ) | | (1,480,000 | ) |
Shares exchanged for taxes on stock-based compensation | | | (41,855 | ) | | — | | | (333,000 | ) | | | | | | | | (333,000 | ) |
Stock consideration issued in merger | | | 7,381,476 | | | 74,000 | | | 42,828,000 | | | | | | | | | 42,902,000 | |
Issurance of common stock under stock compensation plans including tax effect | | | 14,212 | | | — | | | 85,000 | | | | | | | | | 85,000 | |
Tax deficit recorded to hypothetical apic pool | | | | | | | | | (551,000 | ) | | | | | | | | (551,000 | ) |
Stock-based compensation expense | | | | | | | | | 890,000 | | | | | | | | | 890,000 | |
Issuance of common stock as compensation | | | 58,937 | | | | | | 266,000 | | | | | | | | | 266,000 | |
| | | | | | | | | | | | | | | | | | | | |
Balance December 31, 2015 | | | 21,629,310 | | $ | 216,000 | | $ | 142,269,000 | | $ | 69,057,000 | | $ | (1,824,000 | ) | $ | 209,718,000 | |
| | | | | | | | | | | | | | | | | | | | |
| | | | | | | | | | | | | | | | | | | | |
| | | | | | | | | | | | | | | | | | | | |
The See accompanying notes are an integral part of these statementsto the consolidated financial statements.
29
Table of Contents
TGC Industries, Inc. and Subsidiaries
DAWSON GEOPHYSICAL COMPANY
CONSOLIDATED STATEMENTS OF CASH FLOWS
Years Ended December 31,
| | 2012 | | 2011 | | 2010 | |
Cash flows from operating activities | | | | | | | |
Net income (loss) | | $ | 15,671,879 | | $ | 10,833,215 | | $ | (1,222,682 | ) |
Adjustments to reconcile net income to net cash provided by operating activities: | | | | | | | |
Depreciation and amortization | | 25,502,597 | | 19,214,069 | | 15,343,804 | |
Gain on disposal of property and equipment | | (1,069,766 | ) | (441,524 | ) | (39,725 | ) |
Stock-based compensation | | 601,059 | | 483,769 | | 508,254 | |
Deferred income taxes | | 359,535 | | 2,469,953 | | 146,550 | |
Changes in operating assets and liabilities | | | | | | | |
Trade accounts receivable | | (16,021,574 | ) | (2,442,223 | ) | (7,377,921 | ) |
Cost and estimated earnings in excess of billings on uncompleted contracts | | (1,121,420 | ) | (589,429 | ) | (4,098,234 | ) |
Prepaid expenses and other | | 2,820,516 | | 2,326,499 | | 1,384,007 | |
Prepaid federal and state income tax | | 78,268 | | 1,145,437 | | (239,844 | ) |
Other assets | | (17,991 | ) | (18,035 | ) | (27,495 | ) |
Trade accounts payable | | 4,328,707 | | 2,763,004 | | 1,944,647 | |
Accrued liabilities | | 2,911,755 | | 823,278 | | 443,628 | |
Billings in excess of cost and estimated earnings on uncompleted contracts | | 2,814,863 | | (4,550,293 | ) | (1,604,706 | ) |
Federal and state income tax payable | | 2,424,634 | | 2,156,447 | | — | |
Net cash provided by operating activities | | 39,283,062 | | 34,174,167 | | 5,160,283 | |
| | | | | | | |
Cash flows from investing activities | | | | | | | |
Capital expenditures | | (31,970,418 | ) | (22,011,503 | ) | (8,220,293 | ) |
Proceeds from sale of property and equipment | | 1,704,722 | | 740,658 | | 164,323 | |
Net cash used in investing activities | | (30,265,696 | ) | (21,270,845 | ) | (8,055,970 | ) |
| | | | | | | |
Cash flows from financing activities | | | | | | | |
Principal payments on notes payable | | (11,338,097 | ) | (9,006,101 | ) | (8,448,138 | ) |
Principal payments on capital lease obligations | | (2,081,176 | ) | (1,348,164 | ) | (1,101,242 | ) |
Proceeds from exercise of stock options | | 377,381 | | 181,505 | | — | |
Purchase of treasury shares | | — | | (71 | ) | — | |
Payment of dividends | | (3,099,014 | ) | — | | (431 | ) |
Net cash used in financing activities | | (16,140,906 | ) | (10,172,831 | ) | (9,549,811 | ) |
Net increase (decrease) in cash and cash equivalents | | (7,123,540 | ) | 2,730,491 | | (12,445,498 | ) |
| | | | | | | |
Effect of exchange rates on cash | | (7,775 | ) | (57,435 | ) | 13,852 | |
| | | | | | | |
Cash and cash equivalents at beginning of year | | 15,745,559 | | 13,072,503 | | 25,504,149 | |
| | | | | | | |
Cash and cash equivalents at end of year | | $ | 8,614,244 | | $ | 15,745,559 | | $ | 13,072,503 | |
| | | | | | | |
Supplemental cash flow information | | | | | | | |
Interest paid | | $ | 1,222,454 | | $ | 784,425 | | $ | 790,417 | |
Income taxes paid | | $ | 7,022,640 | | $ | 774,136 | | $ | 1,479,446 | |
| | | | | | | |
Noncash investing and financing activities | | | | | | | |
Capital lease obligations incurred | | $ | 2,935,514 | | $ | 1,953,263 | | $ | 2,030,175 | |
Financed equipment purchase | | $ | 22,201,800 | | $ | 6,765,619 | | $ | 4,975,110 | |
Financed insurance premiums | | $ | 3,050,024 | | $ | 2,336,121 | | $ | 2,206,655 | |
Restricted stock awards to employees, net of cancellations | | $ | 1,334,014 | | $ | 101,475 | | $ | 20,750 | |
Stock awards to employees | | $ | — | | $ | 225,000 | | $ | — | |
Treasury shares issued for stock options exercised | | $ | 433,615 | | $ | — | | $ | — | |
| | | | | | | | | | | | | |
| |
| |
| | Year Ended
September 30, | |
|---|
| |
| | Three Months
Ended
December 31,
2014 | |
|---|
| | Year Ended
December 31,
2015 | |
|---|
| | 2014 | | 2013 | |
|---|
CASH FLOWS FROM OPERATING ACTIVITIES: | | | | | | | | | | | | | |
Net (loss) income | | $ | (26,279,000 | ) | $ | (4,991,000 | ) | $ | (12,620,000 | ) | $ | 10,480,000 | |
Adjustments to reconcile net (loss) income to net cash provided by (used in) operating activities: | | |
| | |
| | |
| | |
| |
Depreciation and amortization | | | 47,072,000 | | | 9,736,000 | | | 40,168,000 | | | 37,095,000 | |
Noncash compensation | | | 1,156,000 | | | 452,000 | | | 1,225,000 | | | 1,797,000 | |
Deferred income tax (benefit) expense | | | (14,046,000 | ) | | (1,951,000 | ) | | (6,067,000 | ) | | 8,273,000 | |
Change in other long-term liabilities | | | 1,834,000 | | | — | | | — | | | — | |
Loss (gain) on disposal of assets | | | 408,000 | | | — | | | (108,000 | ) | | 657,000 | |
Other | | | (81,000 | ) | | (614,000 | ) | | 51,000 | | | (712,000 | ) |
Change in current assets and liabilities: | | |
| | |
| | |
| | |
| |
Decrease (increase) in accounts receivable | | | 15,883,000 | | | 2,862,000 | | | (2,507,000 | ) | | 16,168,000 | |
Decrease (increase) in prepaid expenses and other assets | | | 1,752,000 | | | (3,283,000 | ) | | (1,683,000 | ) | | 25,000 | |
Decrease in accounts payable | | | (3,128,000 | ) | | (4,923,000 | ) | | (3,467,000 | ) | | (2,952,000 | ) |
(Decrease) increase in accrued liabilities | | | (4,579,000 | ) | | 78,000 | | | (1,909,000 | ) | | (223,000 | ) |
Increase (decrease) in deferred revenue | | | 620,000 | | | 951,000 | | | (2,637,000 | ) | | (29,000 | ) |
| | | | | | | | | | | | | | |
Net cash provided by (used in) operating activities | | | 20,612,000 | | | (1,683,000 | ) | | 10,446,000 | | | 70,579,000 | |
| | | | | | | | | | | | | | |
CASH FLOWS FROM INVESTING ACTIVITIES: | | | | | | | | | | | | | |
Cash acquired from merger | | | 12,382,000 | | | — | | | — | | | — | |
Capital expenditures, net of noncash capital expenditures summarized below | | | (6,846,000 | ) | | (2,555,000 | ) | | (35,281,000 | ) | | (48,485,000 | ) |
Proceeds from maturity of short-term investments | | | 34,500,000 | | | 7,750,000 | | | 29,250,000 | | | 10,750,000 | |
Acquisition of short-term investments | | | (26,750,000 | ) | | (9,500,000 | ) | | (32,750,000 | ) | | (30,250,000 | ) |
Proceeds from disposal of assets | | | 1,501,000 | | | 631,000 | | | 2,686,000 | | | 481,000 | |
Partial proceeds on flood insurance claim | | | 1,000,000 | | | — | | | — | | | — | |
| | | | | | | | | | | | | | |
Net cash provided by (used in) investing activities | | | 15,787,000 | | | (3,674,000 | ) | | (36,095,000 | ) | | (67,504,000 | ) |
| | | | | | | | | | | | | | |
CASH FLOWS FROM FINANCING ACTIVITIES: | | | | | | | | | | | | | |
Proceeds from promissory note | | | 5,144,000 | | | — | | | — | | | — | |
Proceeds from notes payable | | | — | | | — | | | 10,000,000 | | | 983,000 | |
Principal payments on notes payable | | | (16,348,000 | ) | | (1,783,000 | ) | | (10,823,000 | ) | | (8,898,000 | ) |
Principal payments on capital lease obligations | | | (1,535,000 | ) | | (288,000 | ) | | (932,000 | ) | | (736,000 | ) |
Excess tax benefit from share-based payment arrangement | | | (551,000 | ) | | — | | | — | | | — | |
Tax withholdings related to stock based compensation awards | | | (316,000 | ) | | — | | | — | | | — | |
Proceeds from exercise of stock options | | | — | | | — | | | 32,000 | | | 608,000 | |
Dividends paid | | | — | | | (646,000 | ) | | (1,935,000 | ) | | — | |
| | | | | | | | | | | | | | |
Net cash used in financing activities | | | (13,606,000 | ) | | (2,717,000 | ) | | (3,658,000 | ) | | (8,043,000 | ) |
| | | | | | | | | | | | | | |
Effect of exchange rate changes in cash and cash equivalents | | | (428,000 | ) | | (35,000 | ) | | (345,000 | ) | | — | |
Net increase (decrease) in cash and cash equivalents | | |
22,365,000 | | |
(8,109,000 |
) | |
(29,652,000 |
) | |
(4,968,000 |
) |
CASH AND CASH EQUIVALENTS AT BEGINNING OF PERIOD | | |
14,644,000 | | |
22,753,000 | | |
52,405,000 | | |
57,373,000 | |
| | | | | | | | | | | | | | |
CASH AND CASH EQUIVALENTS AT END OF PERIOD | | $ | 37,009,000 | | $ | 14,644,000 | | $ | 22,753,000 | | $ | 52,405,000 | |
| | | | | | | | | | | | | | |
| | | | | | | | | | | | | | |
| | | | | | | | | | | | | | |
SUPPLEMENTAL CASH FLOW INFORMATION: | | | | | | | | | | | | | |
Cash paid for interest | | $ | 620,000 | | $ | 93,000 | | $ | 537,000 | | $ | 688,000 | |
Cash paid for income taxes | | $ | 752,000 | | $ | — | | $ | 735,000 | | $ | 1,665,000 | |
Cash received for income taxes | | $ | 692,000 | | $ | 18,000 | | $ | 3,000 | | $ | 42,000 | |
NONCASH INVESTING AND FINANCING ACTIVITIES: | | |
| | |
| | |
| | |
| |
(Decrease) increase in accrued purchases of property and equipment | | $ | (52,000 | ) | $ | 52,000 | | $ | (1,693,000 | ) | $ | 288,000 | |
Capital lease obligations incurred | | $ | 126,000 | | $ | 651,000 | | $ | 485,000 | | $ | 1,296,000 | |
Stock consideration to consummate the merger | | $ | 42,902,000 | | $ | — | | $ | — | | $ | — | |
Financed insurance premiums | | $ | 1,046,000 | | | — | | | — | | | — | |
The See accompanying notes are an integral part of these statementsto the consolidated financial statements.
30
Table of Contents
TGC Industries, Inc. and Subsidiaries
DAWSON GEOPHYSICAL COMPANY
NOTES TO CONSOLIDATED FINANCIAL STATEMENTS
December 31, 2012, 2011, and 2010
NOTE A - NATURE OF OPERATIONS
On February 11, 2015, the Company, which was formerly known as TGC Industries, Inc. (TGC or("Legacy TGC"), consummated a strategic business combination (the "Merger") with Dawson Operating Company LLC, which was formerly known as Dawson Geophysical Company ("Legacy Dawson"). Unless the Company) is engagedcontext requires otherwise, all references in the geophysical services businessNotes to Consolidated Financial Statements of this Form 10-K to the "Company," "we," "us" or "our" refer to (i) Legacy Dawson and primarily conductsits consolidated subsidiaries, for periods through February 11, 2015 and (ii) the merged company for periods on or after February 12, 2015.
1. Summary of Significant Accounting Policies
The Company is a leading provider of onshore seismic surveysdata acquisition and sells gravityprocessing services. Founded in 1952, the Company acquires and processes 2-D, 3-D and multi-component seismic data to companies engaged in exploration in thefor its clients, ranging from major oil and gas industrycompanies to independent oil and gas operators as well as providers of multi-client data libraries. The Company operates in the U.S.lower 48 states of the United States and in Canada.
NOTE B - SUMMARY OF SIGNIFICANT ACCOUNTING POLICIES
Principles of Consolidation
The Consolidated Financial Statementsconsolidated financial statements include the accounts of TGC Industries, Inc.the Company and its wholly-owned subsidiary,subsidiaries, Dawson Operating LLC, Eagle Canada, Inc. We have eliminated all, Dawson Seismic Services Holdings, Inc., Eagle Canada Seismic Services ULC, Tidelands Geophysical Co., Inc. and Exploration Surveys, Inc. All significant intercompany accountsbalances and transactions.transactions have been eliminated in consolidation.
Business Combinations
We record acquisitions using the purchase method of accounting and, accordingly, have included the results of operations of acquired businesses in our consolidated results from the date of each acquisition. We allocate the purchase price of our acquisitions to the tangible assets, liabilities, and intangible assets acquired based on their estimated fair values. The excess purchase price over those fair values is recorded as goodwill. The fair value assigned to assets acquired is based on valuations provided by independent consultants and using management’s estimates and assumptions.
Foreign Currency
The functional currencyFor purposes of the Company’s international subsidiary isfinancial statements, the local currency. Local currency assets and liabilities are translated at the rates of exchange on the balance sheet date, and local currency revenues and expenses are translated at average rates of exchange during the period. The resulting translation adjustments are recorded directly into a separate component of stockholders’ equity and represents the only component of accumulated other comprehensive income.
Cash Equivalents
The Company considers demand deposits, certificates of deposit, overnight investments, money market funds and all highly liquid investmentsdebt instruments purchased with originalan initial maturity dates of three months or less to be cash equivalents. The Company maintains
Management prepares its accounts at financial institutions located in Texas and Alberta, Canada. The Texas bank accounts are insured by the Federal Deposit Insurance Corporation up to $250,000. The Alberta bank accounts are insured by the Canadian Depository Insurance Corporation up to $100,000 Canadian dollars.
Trade Accounts Receivable
Trade accounts receivable are recorded in accordance with terms and amounts as specified in the related contracts on an ongoing basis. The Company evaluates the collectability of accounts receivable on a specific account basis using a combination of factors including the age of the outstanding balances, evaluation of the customer’s financial condition, and discussions with relevant Company personnel and with the customers directly. An allowance for doubtful accounts receivable based on its review of past-due accounts, its past experience of historical write-offs and its current client base. While the collectability of outstanding client invoices is continually assessed, the inherent volatility of the energy industry's business cycle can cause swift and unpredictable changes in the financial stability of the Company's clients.
Property, Plant and Equipment
Property, plant and equipment is capitalized at historical cost and depreciated over the useful life of the asset. Management's estimation of this useful life is based on circumstances that exist in the seismic industry and information available at the time of the purchase of the asset. As circumstances change and new information becomes available, these estimates could change.
Depreciation is computed using the straight-line method. When assets are retired or direct write-offotherwise disposed of, the cost and related accumulated depreciation are removed from the balance sheet, and any resulting gain or loss is recordedreflected in the results of operations for the period.
Long-lived assets are reviewed for impairment when ittriggering events occur suggesting deterioration in the assets' recoverability or fair value. Recognition of an impairment charge is determined thatrequired if future expected undiscounted net cash flows are insufficient to recover the receivable may not be collected, depending oncarrying value of the facts knownassets and the probability
Table of collection of the outstanding amount.
Contents
31
DAWSON GEOPHYSICAL COMPANY
TGC Industries, Inc. and Subsidiaries
NOTES TO CONSOLIDATED FINANCIAL STATEMENTS (Continued)
fair value of the assets is below the carrying value of the assets. Management's forecast of future cash flows used to perform impairment analysis includes estimates of future revenues and expenses based on the Company's anticipated future results while considering anticipated future oil and natural gas prices which is fundamental in assessing demand for the Company's services. If the carrying amounts of the assets exceed the estimated expected undiscounted future cash flows, the Company measures the amount of possible impairment by comparing the carrying amount of the assets to the fair value. If there were to be a fifteen percent or more decline in projected cash flows the Company would be required to do further impairment analysis to determine if fair value is less than the carrying amount of the assets at that time. No impairment charges were recognized for the year ended December 31, 2012, 2011,2015, the three months ended December 31, 2014, and 2010the years ended September 30, 2014 and 2013.
NOTE B - SUMMARY OF SIGNIFICANT ACCOUNTING POLICIES - CONTINUED
PropertyThe Company leases certain equipment and Equipment
Propertyvehicles under lease agreements. The Company evaluates each lease to determine its appropriate classification as an operating or capital lease for financial reporting purposes. Any lease that does not meet the criteria for a capital lease is accounted for as an operating lease. The assets and equipmentliabilities under capital leases are statedrecorded at cost. Depreciation and amortizationthe lower of the present value of the minimum lease payments or the fair market value of the related assets. Assets under capital leases are providedamortized using the straight-line method over the estimated useful livesinitial lease term. Amortization of the individual assets ranging from 1 to 7 years. The depreciation expense on assets acquired under capital leases is included within depreciation expenseexpense.
Trademarks/tradenames resulting from a business combination are not subject to amortization. The Company tests for impairment on owned assets. Expendituresan annual basis during the fourth quarter and between annual tests if an event occurs or circumstances change that would more likely than not reduce the fair value of the reporting unit below its carrying amount. No impairment charges were recognized for major renewalsthe year ended December 31, 2015.
Services are provided under cancelable service contracts. These contracts are either "turnkey" or "term" agreements. Under both types of agreements, the Company recognizes revenues when revenue is realizable and bettermentsservices have been performed. Services are defined as the commencement of data acquisition or processing operations. Revenues are considered realizable when earned according to the terms of the service contracts. Under turnkey agreements, revenue is recognized on a per unit of data acquired rate as services are performed. Under term agreements, revenue is recognized on a per unit of time worked rate as services are performed. In the case of a cancelled service contract, revenue is recognized and the client is billed for services performed up to the date of cancellation.
The Company receives reimbursements for certain out-of-pocket expenses under the terms of the service contracts. Amounts billed to clients are recorded in revenue at the gross amount including out-of-pocket expenses that extendare reimbursed by the useful livesclient.
In some instances, clients are billed in advance of propertyservices performed. In those cases, the Company recognizes the liability as deferred revenue. As services are performed, those deferred revenue amounts are recognized as revenue.
In some instances, the contract contains certain permitting, surveying and equipmentdrilling costs that are capitalized. Expenditures for maintenanceincorporated into the per unit of data acquired rate. In these circumstances, these set-up costs that occur prior to initiating revenue recognition are capitalized and repairs are charged toamortized as data is acquired.
Table of Contents
DAWSON GEOPHYSICAL COMPANY
NOTES TO CONSOLIDATED FINANCIAL STATEMENTS (Continued)
The Company measures all stock-based compensation awards, which include stock options, restricted stock, restricted stock units and common stock awards, using the fair value method and recognizes compensation cost, net of estimated forfeitures, in its financial statements. The Company records compensation expense as incurred.operating or general and administrative expense as appropriate in the consolidated statements of operations on a straight-line basis over the vesting period of the related stock options, restricted stock awards or restricted stock unit awards.
The U.S. Dollar is the reporting currency for all periods presented. The functional currency of the Company's foreign subsidiaries is generally the local currency. All assets and liabilities denominated in a foreign currency are translated into U.S. Dollars at the exchange rate on the balance sheet date. Income and expenses are translated at the average exchange rate during the period. Equity transactions are translated using historical exchange rates. Adjustments resulting from translation are recorded as a separate component of accumulated other comprehensive (loss) income in the consolidated balance sheets. Foreign currency transaction gains (losses) are included in the consolidated statements of operations as other income (expense).
Long-lived assets heldThe Company accounts for income taxes by recognizing amounts of taxes payable or refundable for the current year and used by the Company are reviewed for impairment whenever events or changesusing an asset and liability approach in circumstances indicate thatrecognizing the carrying amount of an asset may not be recoverable. For the purposes of evaluating the recoverability of long-lived assets, the recoverability test is performed using undiscounted cash flows estimated to be generated by those assets. No impairment charge was necessary at December 31, 2012, 2011, and 2010.
Income Taxes
Deferreddeferred tax assets and liabilities are recognized for the future tax consequences attributable to differences betweenof events that have been recognized in the Company's financial statement carryingstatements or tax returns. Management determines deferred taxes by identifying the types and amounts of existing assets and liabilities and their respectivetemporary differences, measuring the total deferred tax bases,asset or liability using the applicable tax rate in accordance with ASC Topic 740 (“Topic 740”). Deferred tax assets and liabilities are measured using enacted tax rates expected to be applied to taxable income ineffect for the yearsyear in which those temporary differences are expected to be recovered or settled. The effect on deferred tax assets and liabilities of a change in tax rates of deferred tax assets and liabilities is recognized in income in the period that includes the enactment date. Deferred tax expense or benefit is the resultyear of changes inan enacted rate change. The deferred tax assets and liabilities. The components of the deferred tax assets and liabilities are individually classified as current or non-current based on their characteristics. Deferred tax assets areasset is reduced by a valuation allowance when, in the opinion of management,if, based on available evidence, it is more likely than not that some portion or all of the deferred tax assetsasset will not be realized.
Topic 740 prescribes Management's methodology for recording income taxes requires judgment regarding assumptions and the use of estimates, including determining the annual effective tax rate and the valuation of deferred tax assets, which can create variances between actual results and estimates and could have a recognition thresholdmaterial impact on the Company's provision or benefit for income taxes. The Company's effective tax rates differ from the statutory federal rate of 35% for certain items such as state and measurement attribute for the financial statement recognitionlocal taxes, valuations allowances, non-deductible expenses, discrete items and measurement of a tax position taken orexpenses related to share-based compensation that are not expected to be takenresult in a tax return. In accordance with Topic 740,deduction.
Use of Estimates in the Company recognizes in its financial statements the impactPreparation of a tax position if that position is “more likely than not” to be sustained on audit, based on the technical meritsFinancial Statements
Preparation of the position. The Company’s estimate of the potential outcome of any uncertain tax issue is subject to management’s assessment of relevant risks, facts, and circumstances existing at that time. Topic 740 also provides guidance on derecognition, classification, interest and penalties, accounting in interim periods, and disclosure. Interest and penalties related to unrecognized tax benefits, if any, are recorded as income tax expense. See Note H for further information.
Revenue Recognition
Seismic Surveys
The Company provides seismic data acquisition survey services to its customers under general service agreements which define certain obligations for the Company and for its customers. A supplemental agreement setting forth the terms of a specific project, which may be cancelled by either party upon 30 days’ advance written notice, is entered into for every project. These supplemental agreements are either “turnkey” agreements providing for a fixed fee to be paid for each unit of seismic data acquired or “term” agreements providing for a fixed hourly, daily, or monthly fee during the term of the project. The duration of these projects will vary from a few days to several months. The Company recognizes revenue when services are performed under both types of agreements. Services are defined as the commencement of data acquisition which is the physical act of laying out seismic equipment or recording contractually determined data points. Under turnkey agreements, the total number of units of seismic data to be gathered is set forth in the agreement. TGC recognizes revenue on turnkey agreements, as services are performed on a per unit of seismic data acquired rate based on the number of data points per square mile obtained as compared to the number of square miles set forth in the agreement. Eagle Canada recognizes revenue on turnkey agreements as services are performed on a per unit of seismic data laid-out rate, which is standard industry practice in Canada,
32
TGC Industries, Inc. and Subsidiaries
NOTES TO CONSOLIDATED FINANCIAL STATEMENTS
December 31, 2012, 2011, and 2010
NOTE B - SUMMARY OF SIGNIFICANT ACCOUNTING POLICIES
Revenue Recognition - Seismic Surveys - Continued
based on the number of receiver lines laid out as compared to the estimated total lines to be laid out for the project pursuant to the agreement. Under term agreements, revenue is recognized, by both TGC and Eagle Canada, as services are performed based on the time worked rate provided in the term agreement. Under both turnkey and term agreements, cost of earned revenue is recognized by multiplying total estimated agreement cost by the percentage-of-completion of the agreement. The excess of that amount over the cost of earned revenue reported in prior periods is recognized as cost of earned revenue for the period. Agreements are not segmented nor combined for purposes of calculating percentage of completion. The asset “Cost and estimated earnings in excess of billings on uncompleted contracts” represents cost incurred on turnkey agreements in excess of billings on those agreements. The liability “Billings in excess of costs and estimated earnings on uncompleted contracts” represents billings on turnkey agreements in excess of cost on those agreements. Claims have been negligible in the years ended December 31, 2012, 2011, and 2010.
Reclassifications
Certain reclassifications have been made to the 2011 financial statements to conform to the 2012 presentation.
Share-Based Compensation
The Company has two stock-based compensation plans, which are described more fully in Note G. The Company recognizes the fair value of the share-based compensation awards as wages in the Statements of Earnings on a straight-line basis over the vesting period. As a result, during the years ended December 31, 2012, 2011, and 2010, the Company recognized compensation expense for unvested stock options of $283,950, $230,167, and $422,024, respectively, and restricted stock of $317,109, $28,603, and $86,230, respectively.
No options were granted during the year ended December 31, 2012. For the year ended December 31, 2011, the fair value of the single option grant was estimated on the date of the grant using the Binomial Lattice option pricing model with the following assumptions used for the outstanding grants: risk-free interest rate of 0.40%; expected dividend yield of 0.0%; expected life of 5.0 years; and expected volatility of 61.0%. No options were granted during the year ended December 31, 2010.
Financial Instruments
The Company’s financial instruments recorded on the consolidated balance sheet include cash and cash equivalents, accounts receivable, accounts payable, and debt. The carrying amounts of cash and cash equivalents, accounts receivable, and accounts payable approximate fair value because of the short-term nature of these items. The carrying amounts of debt obligations approximate fair value due to their relative short-term maturities and their contract rates which approximate market.
Earnings Per Share
Basic earnings per common share are based upon the weighted average number of shares of common stock outstanding. Diluted earnings per share are based upon the weighted average number of common shares outstanding and, when dilutive, common shares issuable for stock options, warrants, and convertible securities.
All share and per share amounts for the years ended December 31, 2012, 2011 and 2010, have been adjusted to reflect 5% stock dividends paid May 14, 2012 and May 14, 2010 to shareholders of record as of April 30, 2012, and April 30, 2010, respectively. No stock dividends were declared or paid during the year ended December 31, 2011.
33
TGC Industries, Inc. and Subsidiaries
NOTES TO CONSOLIDATED FINANCIAL STATEMENTS
December 31, 2012, 2011, and 2010
NOTE B - SUMMARY OF SIGNIFICANT ACCOUNTING POLICIES — CONCLUDED
Use of Estimates
The preparation of consolidatedaccompanying financial statements in accordanceconformity with accounting principles generally accepted in the United States of Americaaccounting principles requires management to make estimates and assumptions that affect the reported amounts of assets and liabilities and disclosure of contingent assets and liabilities at the date of the financial statements and the reported amounts of revenues and expenses during the reporting period. ActualBecause of the use of assumptions and estimates inherent in the reporting process, actual results could differ from those estimates.
Table of Contents
DAWSON GEOPHYSICAL COMPANY
NOTES TO CONSOLIDATED FINANCIAL STATEMENTS (Continued)
Certain reclassifications have been made to the three months ended December 31, 2014 and the years ended September 30, 2014 and 2013 consolidated financial statements to conform to the 2015 presentation. Current deferred income tax assets have been reclassified and presented as a reduction to deferred income tax liabilities, net in the Consolidated Balance Sheet for the year ended September 30, 2014.
Recent Accounting Standards2. Short-Term Investments
The Company had short-term investments at December 31, 2015 and September 2014 consisting of certificates of deposit with original maturities greater than three months, but less than a year. Certificates of deposits with any given banking institution do not exceed the FDIC insurance limit at December 31, 2015 or September 30, 2014.
In May 2011, the Financial Accounting Standards Board (FASB) issued Accounting Standards Update (ASU) No. 2011-04, 3. Fair Value Measurement (Topic 820): Amendmentsof Financial Instruments
At December 31, 2015 and September 30, 2014, the Company's financial instruments included cash and cash equivalents, short-term investments in certificates of deposit, trade and other receivables, other current assets, accounts payable, other current liabilities and term notes (defined below). Due to Achieve Common Fair Value Measurementthe short-term maturities of cash and Disclosure Requirements in U.S. GAAPcash equivalents, trade and International Financial Reporting Standards, to provide a consistent definition ofother receivables, other current assets, accounts payables and other current liabilities, the carrying amounts approximate fair value at the respective balance sheet dates. The carrying value of the term notes approximate their fair value based on a comparison with the prevailing market interest rate. Due to the short-term maturities of the Company's investments in certificates of deposit, the carrying amounts approximate fair value at the respective balance sheet dates. The fair values of the Company's term notes and ensure thatinvestments in certificates of deposit are level 2 measurements in the fair value measurement and disclosure requirements are similar between U.S. GAAP and International Financial Reporting Standards. ASU 2011-04 changes certain fair value measurement principles and enhances disclosure requirements, particularly for Level 3 fair value measurements. ASU 2011-04 became effective in our first quarter and has not had a material effect on our financial statements.hierarchy.
4. Merger
In June 2011,On February 11, 2015, the FASB issued ASU No. 2011-05, Comprehensive Income (Topic 220): PresentationCompany completed the Merger. Immediately prior to the effective time of Comprehensive Income,the Merger, Legacy TGC effected a reverse stock split with respect to require an entityits common stock, par value $0.01 per share, on a one-for-three ratio (the "Reverse Stock Split") to presentreduce the total number of comprehensive income,shares of Legacy TGC Common Stock outstanding. After giving effect to the componentsReverse Stock Split, at the effective time of net income, and the components of other comprehensive income either in a single continuous statement of comprehensive income or in two separate but consecutive statements. ASU 2011-05 eliminatesMerger, without any action on the option to present the components of other comprehensive income as part of any shareholder, each issued and outstanding share of Legacy Dawson's common stock, par value $0.33-1/3 per share (the "Legacy Dawson Common Stock"), including shares underlying Legacy Dawson's outstanding equity awards (but excluding any shares of Legacy Dawson Common Stock owned by Legacy TGC, Merger Sub or Legacy Dawson or any wholly-owned subsidiary of Legacy Dawson), were converted into the statementright to receive 1.760 shares of equity. This update does not change what items are reportedLegacy TGC Common Stock (the "Exchange Ratio").
The Merger was accounted for as a reverse acquisition under the acquisition method of accounting in other comprehensive income oraccordance with ASC No. 805, "Business Combinations." The Company accounted for the requirement to report reclassificationtransaction by using Legacy Dawson's historical information and accounting policies and adding the assets and liabilities of items from other comprehensive income to net income. ASU 2011-05 becameLegacy TGC at their respective fair values. Consequently, Legacy Dawson's assets and liabilities retained their carrying values and Legacy TGC's assets acquired and liabilities assumed by Legacy Dawson as the accounting acquirer in the Merger were recorded at their fair values measured as of February 11, 2015, the effective in our firstdate of the Merger.
In the fourth quarter of 20122015, management finalized its valuation of assets acquired and has not hadliabilities assumed in connection with the Merger. As a material effect on our financial statements.
In September 2011, the FASB issued ASU 2011-08, Intangibles-Goodwill and Other (Topic 350): Testing for Impairment. ASU 2011-08 amends the guidance in FASB Accounting Standards Codification Topic (“ASC”) 350-20, Intangibles-Goodwill and Other-Goodwill. The intent of this ASU is to simplify how entities test goodwill for impairment by allowing an entity to use a qualitative approach to test goodwill for impairment. The amendments in the ASU permit an entity to first assess qualitative factors to determine whether it is more likely than not thatresult, the fair value of a reporting unit is less than its carrying amount as a basis for determining whether it is necessary to perform the two-step goodwill impairment test described in ASC 350-20. The amendments do not change the current guidance for testing other indefinite-lived assets for impairment. ASU 2011-08 was effective for goodwill impairment tests performed for fiscal years beginning after December 15, 2011. Early application was permitted. The Company adopted this standard earlyacquired property, plant and effective as
Table of December 31, 2011 in its year-end goodwill impairment analysis.Contents
NOTE C — COSTS, BILLINGS, AND ESTIMATED EARNINGS ON UNCOMPLETED CONTRACTS
The components of uncompleted contracts are as follows at December 31:
| | 2012 | | 2011 | |
Costs incurred on uncompleted contracts and estimated earnings | | $ | 11,299,753 | | $ | 5,785,132 | |
Less billings to date | | (8,793,159 | ) | (1,621,409 | ) |
| | $ | 2,506,594 | | $ | 4,163,723 | |
DAWSON GEOPHYSICAL COMPANY
34
TGC Industries, Inc. and Subsidiaries
NOTES TO CONSOLIDATED FINANCIAL STATEMENTS (Continued)
equipment was ultimately concluded to be $5,055,000 higher than preliminarily estimated, the fair value of current liabilities assumed was higher by $943,000, the fair value of current assets was lower by $625,000, and the fair value of intangible assets was lower by $2,953,000. Further, the net deferred tax asset as a result of these adjustments was $534,000 lower. In the fourth quarter of 2015, we recorded a $628,000 increase to depreciation expense and a $697,000 reduction to amortization expense as compared to what we would have recorded had the final valuations of assets acquired and liabilities assumed been recorded as of the acquisition date in February 2015. The following table summarizes the fair values of the assets acquired and liabilities assumed at the Merger date:
| | | | |
| | Estimated Fair
Value (in 000's) | |
|---|
Stock consideration | | $ | 42,902 | |
Interest bearing debt assumed | | | 12,048 | |
Debt-free current liabilities | | | 13,590 | |
| | | | | |
Total purchase price consideration including liabilities assumed | | $ | 68,540 | |
| | | | | |
| | | | | |
| | | | | |
Value of current assets | | | | |
Current assets excluding cash and cash equivalents | | $ | 15,531 | |
Cash and cash equivalents | | | 12,382 | |
| | | | | |
Total current assets | | $ | 27,913 | |
Identified tangible assets | | |
| |
Fair value of property, plant and equipment | | $ | 33,867 | |
Identified intangible assets | | |
| |
Trademarks/trade names | | $ | 400 | |
Net deferred tax asset | | |
| |
| | $ | 6,360 | |
| | | | | |
Total indicated value of assets | | | | |
| | $ | 68,540 | |
| | | | | |
| | | | | |
| | | | | |
The value of the stock consideration was determined based on the closing price of Legacy TGC on the February 11, 2015 closing date and the 7,381,476 shares outstanding. As a result of the consideration transferred being less than the book value of net assets acquired, the Company was required to analyze the purchase price allocation and the potential reasonableness of reflecting a bargain purchase. Upon completing this analysis, the Company determined that the Merger was not an acquisition of a distressed business or a bargain purchase and accordingly reflected a substantial reduction in the property, plant and equipment to its fair value which was reflected by the value of the consideration transferred. Furthermore, in allocating the remainder of the purchase price to the indicated fair value of the property, plant and equipment, there was not any excess purchase price to be allocated to goodwill. Measurements used to determine fair value were deemed to be level 3 fair value measurements.
Trade receivables and payables, as well as other current and non-current assets and liabilities, are recorded at their expected settlement amounts as they approximate the fair value of those items at the time of the Merger, based on management's judgments and estimates.
Property, plant and equipment were valued using a combination of the income approach, the market approach and the cost approach which was based on current replacement and/or reproduction cost of the
Table of Contents
DAWSON GEOPHYSICAL COMPANY
NOTES TO CONSOLIDATED FINANCIAL STATEMENTS (Continued)
asset as new, less depreciation attributable to physical, functional, and economic factors. Useful lives of the property, plant and equipment were estimated to be between eighteen months and twelve years.
Trademarks were valued using the relief from royalty method. Relief from royalty method under the income approach estimates the cost savings that accrue to the Company which would otherwise have to pay royalties or license fees on revenues earned through the use of the asset. Trademarks are considered to have an indefinite life and as a result are not amortizable.
Existing long term debt assumed in the Merger was recorded at fair valued based on a current market rate.
Deferred income tax assets and liabilities as of the acquisition date represent the expected future tax consequences of temporary differences between the fair values of the assets acquired and liabilities assumed and their tax bases. At the acquisition date, the Company accrued approximately $865,000 for unrecognized tax benefits and contingencies related to certain tax matters.
The Company incurred approximately $3,314,000 in merger-related costs on a pretax basis during the year ended December 31, 2012, 2011, and 2010
NOTE C — COSTS, BILLINGS, AND ESTIMATED EARNINGS ON UNCOMPLETED CONTRACTS - CONCLUDED
The components of uncompleted contracts are2015. This amount is reflected in the accompanying consolidated balance sheets as follows at December 31:statements of operations.
The Company has integrated the operations of Legacy TGC. Additionally, the Company operates in one segment and has a single company-wide management team that administers all service contracts as a whole rather than by discrete operating segments. The Company tracks only basic operational data by area and does not track results by legacy origin. Therefore, it is impracticable to disclose the amount of revenues and earnings or losses attributable to Legacy TGC during the year ended December 31, 2015.
| | 2012 | | 2011 | |
Costs and estimated earnings in excess of billings on uncompleted contracts | | $ | 6,263,943 | | $ | 5,101,478 | |
Billings in excess of costs and estimated earnings on uncompleted contracts | | (3,757,349 | ) | (937,755 | ) |
| | $ | 2,506,594 | | $ | 4,163,723 | |
The following unaudited pro forma condensed financial information for the three and twelve months ended December 31, 2015 and 2014 gives effect to the Merger as if it had occurred on January l, 2014. The unaudited pro forma condensed financial information has been included for comparative purposes only and is not necessarily indicative of the results that might have occurred had the transactions taken place on the dates indicated and is not intended to be a projection of future results. The unaudited pro forma financial information reflects certain adjustments related to the acquisition, such as (1) to record certain incremental expenses resulting from purchase accounting adjustments, such as reduced depreciation expense in connection with the fair value adjustments to property, plant and equipment; and (2) to record the related tax effects. Shares used in the calculations of earnings per share in the table below were 21,537,480 for the year ended December 31, 2015, 21,400,593 for the three months ended December 31, 2014, and 21,367,677 for the year ended September 30, 2014.
| | | | | | | | | | |
| | Year Ended
December 31, | | Three Months
Ended
December 31, | | Year Ended
September 30, | |
|---|
| | 2015 | | 2014 | | 2014 | |
|---|
Pro forma total revenues | | $ | 248,295,000 | | $ | 76,897,000 | | $ | 373,544,000 | |
Pro forma net loss | | $ | (30,256,000 | ) | $ | (7,722,000 | ) | $ | (13,383,000 | ) |
Pro forma net loss per share | | |
| | |
| | |
| |
Basic | | $ | (1.40 | ) | $ | (0.36 | ) | $ | (0.63 | ) |
Diluted | | $ | (1.40 | ) | $ | (0.36 | ) | $ | (0.63 | ) |
NOTE D - ACCRUED LIABILITIESTable of Contents
DAWSON GEOPHYSICAL COMPANY
NOTES TO CONSOLIDATED FINANCIAL STATEMENTS (Continued)
5. Property, Plant and Equipment
Property, plant and equipment, together with the related estimated useful lives, were as follows:
| | | | | | | | |
| | December 31, | | September 30, | |
|
|---|
| | 2015 | | 2014 | | Useful Lives |
|---|
Land, building and other | | $ | 16,357,000 | | $ | 15,472,000 | | 3 to 40 years |
Recording equipment | | | 212,541,000 | | | 206,517,000 | | 5 to 10 years |
Line clearing equipment | | | 1,071,000 | | | 1,084,000 | | 5 years |
Vibrator energy sources | | | 80,454,000 | | | 78,119,000 | | 5 to 15 years |
Vehicles | | | 35,196,000 | | | 36,730,000 | | 1.5 to 10 years |
| | | | | | | | | |
| | | 345,619,000 | | | 337,922,000 | | |
Less accumulated depreciation | | | (198,052,000 | ) | | (173,428,000 | ) | |
| | | | | | | | | |
Net property, plant and equipment | | $ | 147,567,000 | | $ | 164,494,000 | | |
| | | | | | | | | |
| | | | | | | | | |
| | | | | | | | | |
6. Supplemental Consolidated Balance Sheet Information
Accrued Other current liabilities consist of the following at December 31:31, 2015 and September 30, 2014:
| | | | | | | |
| | December 31, | | September 30, | |
|---|
| | 2015 | | 2014 | |
|---|
Accrued self-insurance reserves | | $ | 1,830,000 | | $ | 1,524,000 | |
Income and franchise taxes payable | | | 21,000 | | | 96,000 | |
Other accrued expenses and current liabilities | | | 2,753,000 | | | 2,477,000 | |
| | | | | | | | |
Total other current liabilities | | $ | 4,604,000 | | $ | 4,097,000 | |
| | | | | | | | |
| | | | | | | | |
| | | | | | | | |
7. Debt
| | 2012 | | 2011 | |
Compensation and payroll taxes | | $ | 2,004,444 | | $ | 1,364,810 | |
Accrued sales and use tax | | 336,870 | | 114,601 | |
Insurance | | 335,412 | | 176,676 | |
Accrued interest | | 73,105 | | 73,105 | |
Other | | 2,794,239 | | 868,934 | |
| | $ | 5,544,071 | | $ | 2,598,126 | |
NOTE E - DEBT
LineLegacy Dawson and Legacy TGC each had a credit agreement in effect prior to the Merger (the "Legacy Dawson Credit Agreement" and the "Legacy TGC Credit Agreement," respectively), which continued our obligations following the Merger. On June 30, 2015, we entered into an amendment to the Legacy TGC Credit Agreement with our lender, Sovereign Bank, (as so amended, and as further amended pursuant to the LOC Amendment (as defined below), the "Existing Credit Agreement") for the purpose of Credit
In September of 2011,renewing, extending and again in September of 2012, the Company renewed its revolvingincreasing our line of credit allowingunder such agreement. In connection with this amendment to the CompanyLegacy TGC Credit Agreement, we entered into a new term loan evidenced by a promissory note dated June 30, 2015 in the aggregate principal amount of $5,144,000 (the "New Term Loan") and used the proceeds of the New Term Loan to repay in full and terminate the Legacy Dawson Credit Agreement and its master advance term note agreement in connection therewith (collectively, the "Legacy Dawson Credit Facilities").
Our Existing Credit Agreement with Sovereign Bank includes a term loan feature and a revolving loan feature, and also allows for the issuance of letters of credit or and other promissory notes. We can borrow up to a maximum of $20.0 million pursuant to the Existing Credit Agreement, subject to the terms and limitations discussed below.
Table of Contents
DAWSON GEOPHYSICAL COMPANY
NOTES TO CONSOLIDATED FINANCIAL STATEMENTS (Continued)
As of December 31, 2015, we had one outstanding note payable under the term loan feature of the Existing Credit Agreement with a principal amount of $3,429,000. We had two outstanding notes payable under the Existing Credit Agreement that are not under the term loan feature (and therefore do not count towards the maximum amounts that we may borrow) which were incurred to purchase (and are secured by) equipment, representing a remaining aggregate principal amount of $5,225,000 as of December 31, 2015. In addition, the Existing Credit Agreement permits us to borrow, repay and re-borrow, from time to time until June 30, 2017, up to $5,000,000. Interest on the outstanding amountlesser of $20.0 million or 80% of our eligible accounts receivable less the then-outstanding principal balance of the New Term Loan (the "Existing Line of Credit"). We did not utilize the Existing Line of Credit during 2015, and we have the full Existing Line of Credit available for borrowing. Because our ability to borrow funds under theour revolving line of credit loan agreement is payable monthly attied to the greateramount of our eligible accounts receivable, if our accounts receivable decrease materially for any reason, including delays, reductions or cancellations by clients or decreased demand for our services, our ability to borrow to fund operations or other obligations may be limited.
On November 25, 2015, we entered into an amendment (the "LOC Amendment") to the Existing Credit Agreement to provide for the issuance of a letter of credit in the principal amount of $1,767,000 in favor of AIG Assurance Company in order to support payment of certain insurance premiums of the prime rateCompany. The principal amount of interest or five percent. Thethis letter of credit loan agreement iscounts as funds borrowed under our Existing Line of Credit.
Our obligations under the Existing Line of Credit are secured by a security interest in our accounts receivable. Asreceivable, and the term notes are secured by certain of our core equipment. Interest on amounts outstanding under the Existing Credit Agreement accrues at the lesser of 4.5% or the prime rate (as quoted in theWall Street Journal), subject to an interest rate floor of 2.5%. The Existing Credit Agreement contains customary covenants for credit facilities of this type, including limitations on disposition of assets, mergers and other fundamental changes. We are also obligated to meet certain financial covenants, including (i) a ratio of (x) total liabilitiesminus subordinated debt to (y) tangible net worthplus subordinated debt not to exceed 1.00:1.00, (ii) a ratio of current assets to current liabilities of at least 1.50:1.00 and (iii) required tangible net worth of not less than $150,000,000. We were in compliance with all covenants under the Existing Credit Agreement, including specified ratios, as of December 31, 2012,2015.
Prior to its repayment and since its inception, we have had no borrowings outstanding undertermination, the Legacy Dawson Credit Facilities provided for a revolving line of credit and term loans to be made pursuant to notes. We did not utilize the line of credit loan agreement.
Notes Payable
Notes payable consistsavailable under the Legacy Dawson Credit Facilities prior to the termination of the following at December 31:
| | 2012 | | 2011 | |
| | | | | |
Notes Payable to commercial banks, | | | | | |
| | | | | |
Seven outstanding notes payable as of 12/31/2012 with Interest between 3.50% and 6.35%, due in monthly installments between $50,170 and $223,437 plus interest; collateralized by equipment | | $ | 24,553,291 | | $ | 9,827,949 | |
| | | | | |
Notes Payable to finance companies, | | | | | |
| | | | | |
Three outstanding notes payable as of 12/31/2011 with Interest between 5.33% and 6.00%, due in monthly installments between $23,740 and $61,997 plus interest; collateralized by equipment. The notes were paid off during 2012. | | $ | — | | $ | 904,103 | |
| | | | | |
Notes Payable to finance companies for insurance | | | | | |
| | | | | |
Two outstanding notes payable as of 12/31/2012 with interest between 4.16% and 4.95%, due in monthly installments between $16,861 and $302,892 plus interest | | $ | 474,586 | | $ | 399,353 | |
| | | | | | | |
| | $ | 25,027,877 | | $ | 11,131,405 | |
Less Current Maturities | | $ | (10,615,279 | ) | $ | (5,802,513 | ) |
| | $ | 14,412,598 | | $ | 5,328,892 | |
35
TGC Industries, Inc. and Subsidiaries
NOTES TO CONSOLIDATED FINANCIAL STATEMENTS
December 31, 2012, 2011, and 2010
Aggregate annual maturitiesLegacy Dawson Credit Facilities. Prior to termination of the Legacy Dawson Credit Facilities, we had three outstanding notes payable under the term loan feature of the Legacy Dawson Credit Agreement. All amounts owed under the Legacy Dawson Credit Facilities were repaid on June 30, 2015 using proceeds of the New Term Loan and totaled $5,144,000.
We had one outstanding note, in the remaining principal amount of $838,000 at December 31, 2012 are as follows:2015 payable to a finance company for insurance.
Year Ending | | | |
December 31, | | | |
| | | |
2013 | | $ | 10,615,279 | |
2014 | | $ | 7,933,416 | |
2015 | | $ | 4,810,458 | |
2016 | | $ | 1,540,360 | |
2017 | | $ | 128,364 | |
| | $ | 25,027,877 | |
NOTE F — LEASES
Capital Lease Obligations
TheIn addition, the Company leases vehicles and certain specialized seismic equipment under leases classified as capital leases. The Company's balance sheets as of December 31, 2015 and September 30, 2014 includes capital lease obligations of $1,199,000 and $1,321,000, respectively.
Table of Contents
DAWSON GEOPHYSICAL COMPANY
NOTES TO CONSOLIDATED FINANCIAL STATEMENTS (Continued)
The following is a schedule showingtables set forth the future minimum lease paymentsaggregate principal amount outstanding under capital leases by yearsour outstanding notes payable and the present value of the minimum leaseinterest rates and monthly payments as of December 31, 2012.
Year Ending | | | |
December 31, | | | |
2013 | | $ | 2,146,272 | |
2014 | | 1,356,995 | |
2015 | | 586,123 | |
2016 | | 35,340 | |
Total minimum lease payments required | | 4,124,730 | |
Less: Amount representing interest | | (279,290 | ) |
Present value of minimum lease payments | | 3,845,440 | |
Less current maturities | | (1,960,503 | ) |
| | $ | 1,884,937 | |
The net book value2015 and September 30, 2014. Information as of September 30, 2014 does not include indebtedness of Legacy TGC as of such date, due to the accounting treatment of the capital assets leased was approximately $4,957,000 and $3,604,000Merger as a reverse acquisition as described in Note 4.
| | | | |
| | Year Ended
December 31,
2015 | | Year Ended
September 30,
2014 |
|---|
Notes payable to commercial banks | | | | |
Aggregate principal amount outstanding | | $8,654,000 | | $10,364,000 |
Interest rates | | 3.5% - 4.5% | | 3.2% - 3.8% |
| | | | | | | |
| | Year Ended
December 31,
2015 | | Year Ended
September 30,
2014 | |
|---|
Notes payable to finance company for insurance | | | | | | | |
Aggregate principal amount outstanding | | $ | 838,000 | | | — | |
Interest rates | | | 2.35 | % | | — | |
The aggregate maturities of the notes payable at December 31, 20122015 are as follows:
| | | | |
January 2016 - December 2016 | | $ | 7,804,000 | |
January 2017 - December 2017 | | | 1,688,000 | |
| | | | | |
| | $ | 9,492,000 | |
| | | | | |
| | | | | |
| | | | | |
The Company leases vehicles and 2011, respectively. Total accumulated depreciation for fixed assetscertain specialized seismic equipment under leases classified as capital leases.
The aggregate maturities of obligations under capital lease with remaining obligations was approximately $5,114,466 and $3,743,000 as ofleases at December 31, 2012, and 2011, respectively.2015 are as follows:
| | | | |
January 2016 - December 2016 | | $ | 781,000 | |
January 2017 - December 2017 | | | 418,000 | |
| | | | | |
| | $ | 1,199,000 | |
| | | | | |
| | | | | |
| | | | | |
Interest rates on these leases rangeranged from 5.11%3.16% to 10.51%6.88%.
8. Stock-Based Compensation
36
At December 31, 2015, the Company had two stock-based compensation plans: (i) the Amended and Restated Dawson Geophysical Company 2006 Stock and Performance Incentive Plan (the "Legacy Dawson Plan"), which originated from Legacy Dawson and (ii) the Amended and Restated Dawson Geophysical Company 2006 Stock Awards Plan (formerly known as the TGC Industries, Inc. 2006 Stock Awards Plan) (the "Legacy TGC Plan"), which originated from Legacy TGC. As a result of the Merger, the Company administers both the Legacy Dawson Plan and Subsidiariesthe Legacy TGC Plan. The awards outstanding and available under these plans and their associated accounting treatment are discussed below.
In 2006, Legacy Dawson adopted the Legacy Dawson Plan. The Legacy Dawson Plan, which was amended and restated in connection with the Merger, provides for the issuance of up to 827,647 shares of authorized Company common stock (which represents the adjusted number of shares subject to
Table of Contents
DAWSON GEOPHYSICAL COMPANY
NOTES TO CONSOLIDATED FINANCIAL STATEMENTS (Continued)
December 31, 2012, 2011,outstanding awards and 2010
NOTE F — LEASES - CONCLUDED
Operating Lease Obligations
The Company leases six officesavailable for issuance under new awards immediately following the Merger, and two warehouse facilities under operating leases that expire at various dates between April 2013 and September 2017 with two leases on a month-to-month basis. Onethe unadjusted number of the office facilities, used by the Company as its corporate headquarters, is located in Plano, Texas. One of the office facilities, used by Eagle Canada, is located in Calgary, Alberta. The warehouse facilities, used as warehouse and equipment repair facilities, are located in Denison, Texas, and Calgary, Alberta. Three office facilities are used as sales offices and are located in Houston, Texas, Midland, Texas, and Oklahoma City, Oklahoma. The remaining office facility, located in Pratt, Kansas, is used as a permitting office. Rent expense for these facilities for the years ended December 31, 2012, 2011, and 2010 was approximately $700,000, $605,000, and $580,000, respectively.
The following is a schedule by years of future minimum rental payments requiredshares originally reserved under the operating leases as of December 31, 2012:
2013 | | $ | 717,834 | |
2014 | | 519,082 | |
2015 | | 349,532 | |
2016 | | 245,434 | |
2017 and thereafter | | 118,924 | |
Total minimum payments required | | $ | 1,950,806 | |
NOTE G — SHAREHOLDERS’ EQUITY
Income (loss) Per Share
The following is a reconciliation of net income (loss) and weighted average common shares outstanding for purposes of calculating basic and diluted net income (loss) per share:
| | December 31, | |
| | 2012 | | 2011 | | 2010 | |
| | | | | | | |
Numerator: | | | | | | | |
Net income (loss) | | $ | 15,671,879 | | $ | 10,833,215 | | $ | (1,222,682 | ) |
| | | | | | | |
Denominator: | | | | | | | |
Basic - weighted average common shares outstanding | | 20,489,179 | | 20,205,524 | | 20,162,944 | |
Effect of Dilutive Securities: | | | | | | | |
| | | | | | | |
Stock options | | 366,417 | | 317,063 | | — | |
| | 20,855,596 | | 20,522,587 | | 20,162,944 | |
| | | | | | | |
Basic net income (loss) per share | | $ | 0.76 | | $ | 0.54 | | $ | (0.06 | ) |
Diluted net income (loss) per share | | $ | 0.75 | | $ | 0.53 | | $ | (0.06 | ) |
Outstanding options that were not included in the diluted calculation because their effect would be anti-dilutive. Totals were 44,370 and 161,835 for the years ended December 31, 2012 and 2011, respectively.
All share and per share amounts have been adjusted to reflect 5% stock dividends paid May 14, 2012 and May 14, 2010, to shareholders of record as of April 30, 2012 and April 30, 2010.
37
TGC Industries, Inc. and Subsidiaries
NOTES TO CONSOLIDATED FINANCIAL STATEMENTS
December 31, 2012, 2011, and 2010
NOTE G — SHAREHOLDERS’ EQUITY — CONTINUED
Share-Based Compensation Plans
The Company currently has in effect a 2006 stock award plan (the “2006 Plan”)Legacy Dawson Plan was 750,000). At the June 11, 2010 Annual Meetingdate of Shareholders, the shareholders approved an increase of 2,000,000Merger, 466,136 shares of common stockwere available for issuance (immediately following such Merger) pursuant to new grants under the 2006 Plan. This increased the total aggregate number of shares of common stock under the 2006Legacy Dawson Plan to 3,000,000 shares.officers, directors, employees and consultants of the Company (who were not otherwise officers, directors, employees or consultants of Legacy TGC immediately prior to the Merger). The 2006Legacy Dawson Plan provides for the grantingissuance of stock options, common stock grants, restricted stock grants, restricted stock units and restricted stock. The 2006other forms of awards. Stock option grant prices awarded under the Legacy Dawson Plan is administered by a committeemay not be less than the fair market value of the Boardcommon stock subject to such option on the grant date, and the term of Directors (“the Committee”). Currently the Committee is comprised of three directors. Any stock options granted under the 2006 Plan will be exercisable as set forth in the option agreements pursuant to which they are issued, but inshall extend no event will stock options be exercisablemore than ten years after the expirationgrant date. The Legacy Dawson Plan terminates November 28, 2016.
In 2006, the Company adopted the Legacy TGC Plan. The Legacy TGC Plan, which was amended and restated in connection with the Merger, provides for the issuance of five (5) years fromup to 1,000,000 shares of authorized Company common stock. At the date of grant. Outstanding options,the Merger, 412,254 shares were available for issuance pursuant to new grants under the 2006Legacy TGC Plan at December 31, 2012, have vesting periods ranging from the date of grant to the third annual anniversaryofficers, directors and employees of the grant.
During 2012, 93,750Company. The Legacy TGC Plan provides for the issuance of stock options, were grantedcommon stock grants and 192,949 options were exercised or cancelledrestricted stock grants. Stock option grant prices awarded under the 2006 Plan. During 2011, 99,185 options were granted and 80,334 options were exercised or cancelled underLegacy TGC Plan may not be less than the 2006 Plan. During 2010, no options were granted and 3,308 options were canceled underfair market value of the 2006 Plan. Restrictedcommon stock consists of shares that are transferred by the Company to a participant, but are subject to substantial risksuch option on the grant date, and the term of forfeiture and to restrictions on their sale or other transfer bystock options shall extend no more than ten years after the participant. Anygrant date. The Legacy TGC Plan terminates March 29, 2016. At the time of the Merger, Legacy TGC had no restricted stock granted or issued under the 2006 Plan will vest as set forth in the restricted stock agreement pursuant to which it was issued or granted. The provisionsgrants outstanding.
Impact of the restricted stock agreements need not be the same with respect to each participant. In May of 2010, November of 2011, December of 2011, January of 2012, and August of 2012, the Committee granted 5,000, 25,331, 21,520, 6,000 and 213,125 shares of restricted stock, respectively. The shares of restricted stock were issued in the names of the grantees and had restrictive legends prohibiting their sales prior to vesting. Vesting periods, for restricted stock issued to date, range from at grant date to the third annual anniversary of the grant. Upon vesting, a new certificate is issued for the vested portion without the restrictive legend.Stock-based Compensation:
During the years ended December 31, 2012, 2011, and 2010, the Company recognized compensation expense associated with the restricted stock of $317,109, $28,603, and $86,230, respectively. During the years ended December 31, 2012, 2011, and 2010, no unamortized deferred stock-based compensation was related to any employee that left the Company.
During the years ended December 31, 2012, 2011, and 2010, the Company recognized compensation expense associated with unvested options of $283,950, $230,167, and $422,024, respectively.
The following table summarizes activity understock-based compensation expense, which is included in operating or general and administrative expense as appropriate in the Plans:
| | | | Weighted | |
| | Shares under | | Average | |
| | Option | | exercise price | |
| | | | | |
Balance at December 31, 2009 | | 875,039 | | $ | 3.69 | |
Granted | | — | | $ | — | |
Exercised | | — | | $ | — | |
Canceled | | (87,366 | ) | $ | 4.27 | |
Balance at December 31, 2010 | | 787,673 | | $ | 3.63 | |
Granted | | 104,145 | | $ | 6.07 | |
Exercised | | (59,334 | ) | $ | 3.06 | |
Canceled | | (21,000 | ) | $ | 4.10 | |
Balance at December 31, 2011 | | 811,484 | | $ | 3.97 | |
Granted | | 138,120 | | $ | 7.13 | |
Exercised | | (192,949 | ) | $ | 4.20 | |
Canceled | | (51,496 | ) | $ | 8.94 | |
Balance at December 31, 2012 | | 705,159 | | $ | 4.16 | |
38
TGC Industries, Inc. and Subsidiaries
NOTES TO CONSOLIDATED FINANCIAL STATEMENTS
December 31, 2012, 2011, and 2010
NOTE G — SHAREHOLDERS’ EQUITY
Share-Based Compensation Plans - Concluded
The following information applies to options outstanding and exercisable at December 31, 2012:
| | | | | | Weighted | | | |
| | | | | | average | | | |
| | | | | | remaining | | Weighted | |
| | Range of | | Number | | contractual | | average | |
| | Exercise prices | | outstanding | | life (in years) | | exercise price | |
Outstanding options | | $2.80 – $9.87 | | 705,159 | | 2.06 | | $ | 4.16 | |
Exercisable options | | $2.80 – $9.87 | | 653,034 | | 1.86 | | $ | 4.02 | |
NOTE H - INCOME TAXES
The income tax provision charged to continuingconsolidated statements of operations, for the years ended December 31, 2012, 2011, and 2010, was as follows:
| | 2012 | | 2011 | | 2010 | |
| | | | | | | |
Current: | | | | | | | |
U.S. federal | | $ | 3,947,400 | | $ | 35,561 | | $ | (190,869 | ) |
Foreign | | 5,313,874 | | 3,343,374 | | 250,190 | |
State and local | | 264,269 | | 698,362 | | 374,029 | |
| | 9,525,543 | | 4,077,297 | | 433,350 | |
| | | | | | | |
Deferred expense | | 359,535 | | 2,469,953 | | 146,550 | |
| | $ | 9,885,078 | | $ | 6,547,250 | | $ | 579,900 | |
The components of the Company’s income before income tax expense attributable to domestic and foreign operations amounted to $6,018,971 and $19,537,986, respectively, for the year ended December 31, 2012. The components2015, the three months ended December 31, 2014 and years ended September 30, 2014 and 2013:
| | | | | | | | | | | | | |
| | Year Ended
December 31, | | Three Months
Ended
December 31, | | Year Ended
September 30, | |
|---|
| | 2015 | | 2014 | | 2014 | | 2013 | |
|---|
Stock Options | | $ | — | | $ | — | | $ | — | | $ | 62,000 | |
Restricted Stock Awards | | | 363,000 | | | 213,000 | | | 821,000 | | | 1,307,000 | |
Restricted Stock Units | | | 526,000 | | | 74,000 | | | 233,000 | | | 25,000 | |
Common Stock Awards | | | 267,000 | | | 165,000 | | | 171,000 | | | 403,000 | |
| | | | | | | | | | | | | | |
Total Compensation Expense | | $ | 1,156,000 | | $ | 452,000 | | $ | 1,225,000 | | $ | 1,797,000 | |
| | | | | | | | | | | | | | |
| | | | | | | | | | | | | | |
| | | | | | | | | | | | | | |
Stock Options:
Legacy Dawson estimated the fair value of each stock option on the date of grant using the Black-Scholes option pricing model. Legacy TGC estimated the fair value of each stock option on the date of grant using the Binomial Lattice Model. No stock options have been awarded during the three months ended December 31, 2014 and the year ended December 31, 2015. Actual value realized with stock options, if any, is dependent on the future performance of the Company’s income before incomeCompany's common stock and overall stock market conditions.
Table of Contents
DAWSON GEOPHYSICAL COMPANY
NOTES TO CONSOLIDATED FINANCIAL STATEMENTS (Continued)
A summary of the Company's employee stock options as of December 31, 2015 as well as activity during the three months ended December 31, 2014, the year ended September 30, 2014 and the year ended December 31, 2015 is presented below.
| | | | | | | | | | |
| | Number of
Optioned
Shares(1) | | Weighted
Average
Exercise
Price(1) | | Weighted
Average
Remaining
Contractual
Term in Years | |
|---|
Balance as of September 30, 2014 and December 31, 2014 | | | 160,434 | | $ | 10.74 | | | | |
Forfeited | | | (1,760 | ) | $ | 10.74 | | | | |
Oustanding and vested Legacy TGC options | | | 279,756 | | $ | 14.25 | | | | |
Options cancelled | | | (10,000 | ) | $ | 11.79 | | | | |
| | | | | | | | | | | |
Balance as of December 31, 2015 | | | 428,430 | | $ | 13.01 | | | 2.93 | |
| | | | | | | | | | | |
| | | | | | | | | | | |
| | | | | | | | | | | |
Exercisable as of December 31, 2015 | | | 428,430 | | $ | 13.01 | | | 2.93 | |
| | | | | | | | | | | |
| | | | | | | | | | | |
| | | | | | | | | | | |
- (1)
- Balance of optioned shares and weighted average exercise price converted for the Merger that occurred February 11, 2015.
Stock options issued under the Legacy TGC and Legacy Dawson plans are incentive stock options. No tax expense attributablededuction is recorded when options are awarded. If an exercise and sale of vested options results in a disqualifying disposition, a tax deduction for the Company occurs.
Outstanding options at December 31, 2015 expire from November 2016 to domesticJuly 2019. There was no unrecognized compensation costs related to stock option awards as of December 31, 2015.
There were no options granted or vested and foreignthere were no excess tax benefits from disqualifying dispositions during the year ended December 31, 2015, the three months ended December 31, 2014 and the years ended September 30, 2014 and 2013. No options were exercised during the year ended December 31, 2015 or the three months ended December 31, 2014 or the year ended September 30, 2013. The total intrinsic value of options exercised during the year ended September 30, 2014 was $13,000, respectively.
No cash was received from option exercises under all share-based payment arrangements during the year ended December 31, 2015 and the three months ended December 31, 2014. Cash received from option exercises under all share-based payment arrangements during the years ended September 30, 2014 and 2013 was $32,000 and $608,000, respectively.
There were no restricted stock grants in year ended December 31, 2015, three months ended December 31, 2014, or years ended September 30, 2014 and 2013.
At September 30, 2014 and December 31, 2014, 182,160 restricted share awards with a weighted average grant date fair value (based on the market price of the Company's stock on the date of grant) of $13.38 per share were outstanding. As of December 31, 2015, all restricted stock has vested and no awards were outstanding.
The Company granted 10,000, 94,898, 38,555 and 3,520 restricted stock units in the year ended December 31, 2015, the three months ended December 31, 2014 and the years ended September 30, 2014
Table of Contents
DAWSON GEOPHYSICAL COMPANY
NOTES TO CONSOLIDATED FINANCIAL STATEMENTS (Continued)
and 2013, respectively, with a weighted average grant date fair value of $5.76, $6.79, $18.02 and $15.42, respectively. The fair value of restricted stock units equals the market price of the Company's stock on the grant date.
A summary of the Company's nonvested restricted stock unit awards as of December 31, 2015 as well as activity during the three months ended December 31, 2014 and the year ended December 31, 2015 is presented below.
| | | | | | | |
| | Number of
Restricted
Share
Units(1) | | Weighted
Average
Grant Date
Fair Value(1) | |
|---|
Balance as of September 30, 2014 | | | 38,555 | | $ | 18.02 | |
Grants | | | 94,898 | | | 6.79 | |
Balance as of December 31, 2014 | | | 133,453 | | $ | 10.03 | |
Grants | | | 10,000 | | | 5.76 | |
Vested | | | (14,206 | ) | | 17.78 | |
| | | | | | | | |
Balance as of December 31, 2015 | | | 129,247 | | $ | 8.85 | |
| | | | | | | | |
| | | | | | | | |
| | | | | | | | |
- (1)
- Balance of restricted share units and weighted average grant date fair value price converted for merger that occurred February 11, 2015.
As of December 31, 2015, there was approximately $587,000 of unrecognized compensation cost related to nonvested restricted stock units. This cost is expected to be recognized over a weighted average period of 1.78 years.
The Company granted common shares with immediate vesting to outside directors and employees in year ended December 31, 2015, the three months ended December 31, 2014 and the years ended September 30, 2014 and 2013 as follows:
| | | | | | | |
| | Number of
Shares
Granted | | Weighted
Average
Grant Date
Fair Value | |
|---|
Year Ended December 31, 2015 | | | 58,937 | | $ | 4.53 | |
Three Months Ended December 31, 2014 | | | 21,730 | | $ | 7.59 | |
Year Ended September 30, 2014 | | | 9,706 | | $ | 17.61 | |
Year Ended September 30, 2013 | | | 25,491 | | $ | 15.81 | |
9. Dividends
The Company has not paid dividends during calendar year 2015. During calendar year 2014, four quarterly dividends of $0.05 per share were paid to shareholders of record representing an aggregate dividend of approximately $645,000 on each payment date on the number of issued and outstanding Common Stock as of the applicable declaration date, or approximately $2,580,000.
While there are currently no restrictions prohibiting the Company from paying dividends, the Board of Directors, after consideration of general economic and market conditions affecting the energy industry in general, and the oilfield services business in particular, determined that the Company would not pay a dividend in respect of the foreseeable future. Payment of any dividends in the future will be at the discretion of our board and will depend on our financial condition, results of operations, amountedcapital and legal requirements, and other factors deemed relevant by the board.
Table of Contents
DAWSON GEOPHYSICAL COMPANY
NOTES TO CONSOLIDATED FINANCIAL STATEMENTS (Continued)
10. Employee Benefit Plans
The Company provides a 401(k) plan as part of its employee benefits package in order to $6,085,192 and $11,295,273, respectively,retain quality personnel. Legacy Dawson elected to match 100% of the employee contributions up to a maximum of 6% of the participant's gross salary under the Legacy Dawson 401(k) plan for the year ended December 31, 2011.2015, the three months ended December 31, 2014, and the years ended September 30, 2014 and 2013. Legacy Dawson's 401(k) plan was retained in connection with the merger. Legacy TGC's 401(k) plan, which was terminated in connection with the Merger, is consistent with Legacy Dawson's 401(k) plan except Legacy TGC matched 50% of the employee's contribution up to a maximum of 6% of the participant's gross salary. The Company's matching contributions under Legacy Dawson's 401(k) plan for calendar year 2015, three months ended December 31, 2014, and fiscal 2014 and 2013 were approximately $1,849,000, $462,000, $1,895,000 and $1,747,000, respectively. Legacy TGC's employees rolled on to the Legacy Dawson 401(k) plan during 2015. In addition, the Company's matching contributions to the Legacy TGC 401(k) plan (prior to such plan's termination) during 2015 were $98,000.
11. Advertising Costs
Advertising costs are charged to expense as incurred. Advertising costs totaled $466,000 during the year ended December 31, 2015, $62,000 during the three months ended December 31, 2014, $223,000 and $319,000 during the years ended September 30, 2014 and 2013, respectively.
12. Income Taxes
The Company's components of the Company’s loss(loss) income before income taxes are as follows:
| | | | | | | | | | | | | |
| | Year Ended
December 31, | | Three Months Ended
December 31, | | Year Ended September 30, | |
|---|
| | 2015 | | 2014 | | 2014 | | 2013 | |
|---|
(Loss) income before income taxes | | | | | | | | | | | | | |
Domestic | | $ | (36,230,000 | ) | $ | (6,249,000 | ) | $ | (11,671,000 | ) | $ | 23,019,000 | |
Foreign | | | (3,804,000 | ) | | (654,000 | ) | | (6,229,000 | ) | | (3,449,000 | ) |
| | | | | | | | | | | | | | |
Total | | $ | (40,034,000 | ) | $ | (6,903,000 | ) | $ | (17,900,000 | ) | $ | 19,570,000 | |
| | | | | | | | | | | | | | |
| | | | | | | | | | | | | | |
| | | | | | | | | | | | | | |
The Company recorded income tax expense attributable to domesticbenefit of $13,755,000 and foreign operations amounted to $(3,002,790) and $2,360,008, respectively,$1,912,000 for the year ended December 31, 2010.2015 and the three months ended December 31, 2014, respectively. In year ended September 30, 2014, the Company recorded income tax benefit of $5,280,000 as compared to expense of $9,090,000 in year ended September 30, 2013.
Income tax benefit (expense) is comprised of the following:
| | | | | | | | | | | | | |
| | Year Ended
December 31, | | Three Months Ended
December 31, | | Year Ended September 30, | |
|---|
| | 2015 | | 2014 | | 2014 | | 2013 | |
|---|
Current federal benefit (expense) | | $ | 280,000 | | | — | | $ | 74,000 | | $ | (124,000 | ) |
Current state expense | | | (571,000 | ) | $ | (39,000 | ) | | (633,000 | ) | | (693,000 | ) |
Current foreign expense | | | — | | | — | | | (228,000 | ) | | — | |
Deferred foreign benefit (expense) | | | 687,000 | | | — | | | — | | | — | |
Deferred federal benefit (expense) | | | 12,499,000 | | | 1,783,000 | | | 5,489,000 | | | (6,251,000 | ) |
Deferred state benefit (expense) | | | 860,000 | | | 168,000 | | | 578,000 | | | (2,022,000 | ) |
| | | | | | | | | | | | | | |
Total | | $ | 13,755,000 | | $ | 1,912,000 | | $ | 5,280,000 | | $ | (9,090,000 | ) |
| | | | | | | | | | | | | | |
| | | | | | | | | | | | | | |
| | | | | | | | | | | | | | |
Table of Contents
DAWSON GEOPHYSICAL COMPANY
NOTES TO CONSOLIDATED FINANCIAL STATEMENTS (Continued)
The income tax provision differs from the amount of income tax determinedcomputed by applying the U.S.statutory federal income tax rate (35% for 2012, 34% for 2011 and 2010) to pretax(losses) income (loss) from continuing operations for the years ended December 31, 2012, 2011, and 2010, due to the following:before income taxes as follows:
| | | | | | | | | | | | | |
| | Year Ended
December 31, | | Three Months Ended
December 31, | | Year Ended September 30, | |
|---|
| | 2015 | | 2014 | | 2014 | | 2013 | |
|---|
Tax benefit (expense) computed at statutory rate of 35% | | $ | 14,012,000 | | $ | 2,416,000 | | $ | 6,265,000 | | $ | (6,850,000 | ) |
Change in valuation allowance | | | (502,000 | ) | | (170,000 | ) | | (1,506,000 | ) | | (1,265,000 | ) |
State income tax benefit (expense), net of federal tax | | | 423,000 | | | 83,000 | | | (32,000 | ) | | (1,486,000 | ) |
Foreign losses | | | 954,000 | | | 170,000 | | | 1,506,000 | | | 987,000 | |
Transaction costs | | | (445,000 | ) | | (522,000 | ) | | (332,000 | ) | | — | |
Other | | | (687,000 | ) | | (65,000 | ) | | (621,000 | ) | | (476,000 | ) |
| | | | | | | | | | | | | | |
Income tax benefit (expense) | | $ | 13,755,000 | | $ | 1,912,000 | | $ | 5,280,000 | | $ | (9,090,000 | ) |
| | | | | | | | | | | | | | |
| | | | | | | | | | | | | | |
| | | | | | | | | | | | | | |
| | 2012 | | 2011 | | 2010 | |
Computed “expected” tax expense | | $ | 8,944,935 | | $ | 5,909,358 | | $ | (218,546 | ) |
Increase (decrease) in income taxes resulting from: | | | | | | | |
Change in effective rates used for deferred taxes | | — | | (503,693 | ) | — | |
Nondeductible expenses and other | | 768,652 | | 534,742 | | 548,943 | |
State and local taxes, net of federal benefit | | 171,491 | | 606,843 | | 249,503 | |
| | $ | 9,885,078 | | $ | 6,547,250 | | $ | 579,900 | |
39
TGC Industries, Inc. and Subsidiaries
NOTES TO CONSOLIDATED FINANCIAL STATEMENTS
December 31, 2012, 2011, and 2010
NOTE H - INCOME TAXES — CONCLUDED
Net deferred tax liabilities consistThe principal components of the following components as of December 31, 2012 and 2011:
| | 2012 | | 2011 | |
Deferred tax assets | | | | | |
Foreign tax credits | | $ | 473,405 | | $ | 2,034,130 | |
Net operating loss carry forwards | | 462,548 | | 776,647 | |
Other | | 92,983 | | — | |
Total deferred tax assets | | 1,028,936 | | 2,810,777 | |
Deferred tax liability | | | | | |
Property, equipment, and intangible asset | | (8,646,047 | ) | (10,068,353 | ) |
Total deferred tax liabilities | | $ | (7,617,111 | ) | $ | (7,257,576 | ) |
The components giving rise to theCompany's net deferred tax items described above have been included in the accompanying balance sheetsliability are as offollows:
| | | | | | | |
| | December 31,
2015 | | September 30,
2014 | |
|---|
Deferred tax assets: | | | | | | | |
Federal tax net operating loss (NOL) carryforward | | $ | 23,002,000 | | $ | 11,205,000 | |
Foreign tax NOL carryforward | | | 3,694,000 | | | 2,441,000 | |
Deferred revenue | | | 1,193,000 | | | 297,000 | |
Restricted stock | | | 214,000 | | | 756,000 | |
Workers' compensation | | | 144,000 | | | 148,000 | |
State tax NOL carryforward | | | 850,000 | | | 792,000 | |
Self-insurance | | | 260,000 | | | 286,000 | |
Canadian start-up costs | | | 296,000 | | | 337,000 | |
AMT credit carry forward | | | 315,000 | | | 312,000 | |
Foreign tax credit | | | 1,874,000 | | | 228,000 | |
Other comprehensive income | | | 1,055,000 | | | 128,000 | |
Unrecognized tax benefits | | | 562,000 | | | — | |
Other | | | (91,000 | ) | | 209,000 | |
| | | | | | | | |
Total gross deferred tax assets | | | 33,368,000 | | | 17,139,000 | |
Less valuation allowance | | | (3,707,000 | ) | | (2,771,000 | ) |
Total net deferred tax assets | | | 29,661,000 | | | 14,368,000 | |
Deferred tax liabilities: | | | | | | | |
Property and equipment | | | (34,980,000 | ) | | (42,199,000 | ) |
| | | | | | | | |
Total net deferred tax liability | | $ | (5,319,000 | ) | $ | (27,831,000 | ) |
| | | | | | | | |
| | | | | | | | |
| | | | | | | | |
At December 31, 2012 and 2011, as follows:
| | 2012 | | 2011 | |
| | | | | |
Current assets | | $ | — | | $ | — | |
Noncurrent (liabilities) | | (7,617,111 | ) | (7,257,576 | ) |
| | $ | (7,617,111 | ) | $ | (7,257,576 | ) |
As of December 31, 2012,2015, the Company has U.S. net operating loss carry forwardshad a gross NOL for U.S. federal income tax purposes of approximately $1.4 million. These$65,719,000. This NOL will begin to expire in 2029. The Company will carry forward the net operating lossesfederal NOL of approximately $23,002,000. The Company also had net state NOLs that will affect state taxes of approximately $850,000 at December 31, 2015. State NOLs began to expire in 2015. Carryback provisions are not allowed by all states, accordingly the state NOLs give rise to a deferred tax asset. Several of these carry forwards are primarily available in states where the Company believes the assets cannot be
Table of Contents
DAWSON GEOPHYSICAL COMPANY
NOTES TO CONSOLIDATED FINANCIAL STATEMENTS (Continued)
deemed to offset future federal taxable income, if any, and expire from 2027 through 2030. The amount ofbe more likely than not realizable. Based on management's belief that the net operating loss carry forwards that may reduceare not realizable, a $526,000 valuation allowance, net of federal income taxes in any given year are subjectbenefit was maintained to annual limitations and taxable income requirements. The foreignoffset these deferred tax creditassets as of $473,405 expires in 2020.
The Company files a U.S. consolidated federal income tax return for operating activities in the U.S. and Canada.December 31, 2015. The Company also files federal and localhas Canadian deferred tax returnsassets that will begin to expire in Canada, as well as state2032. The Company has recorded a partial valuation allowance of $3,181,000 against the Canadian deferred tax returns in a numberassets because management believes it is currently not more likely than not to be realizable.
In conjunction with the Merger at February 11, 2015, the Company established an accrual for unrecognized tax benefits of state and local jurisdictions in the U.S. The Company’s U.S. federal income tax returns filed for 2009 through 2011 are subject to audit by the IRS. The Company’s income tax returns filed in Canada for 2009 through 2011 remain subject to examination by Canadian authorities. As of$715,000. At December 31, 2012 and 2011,2015, the Company hadincreased this accrual for unrecognized tax benefits to $1,684,000. There were no unrecognized tax benefits within its provision for income taxes.
NOTE I - 401(k) PLAN
The Company has a 401(k) salary deferral plan which covers all employees who have reachedat the age of 20.5 years and have been employed by the Company for at least one year. The covered employees may elect to have an amount deducted from their wages for investment in the retirement plan. The Company makes contributions to the plan equal to 50% of each participant’s salary reduction contributions to the plan up to 6% of the participant’s compensation. The Company’s matching contribution to the plan was approximately $113,000, $98,000, and $79,000, forthree months ended December 31, 2014 or the years ended December 31, 2012, 2011,September 30, 2014 and 2010, respectively.
NOTE J - CONCENTRATION OF CREDIT RISK
2013. The Company sells its geophysical services primarilytax years generally subject to large independent oil and gas companies operating in the U.S. and Canada. The Company performs ongoing credit evaluations of its customers’ financial condition and, generally, requires no collateral from its customers.
40
TGC Industries, Inc. and Subsidiaries
NOTES TO CONSOLIDATED FINANCIAL STATEMENTS
December 31, 2012, 2011, and 2010
NOTE J - CONCENTRATION OF CREDIT RISK - CONCLUDED
During the years ended December 31, 2012, 2011, and 2010, our largest customers accountedfuture examination by tax authorities are for approximately 16%, 17%, and 15% of revenues, respectively. As of December 31, 2012, 2011, and 2010, two customers accounted for 29% and 23%, 13% and 12%, and 18% and 11% of outstanding accounts receivable, respectively. During 2012, one vendor represented 12% of our purchases. During 2011 and 2010, no vendor represented over 10% of our purchases.
NOTE K - CONTINGENCIES
In conducting its activities, the Company from time to time is the subject of various claims arising from the ordinary course of business. In the opinion of management, it is remote that these claims will be material, including to the Company’s results of operations and liquidity.
NOTE L — QUARTERLY FINANCIAL DATA — (UNAUDITED)
The following is a summary of the unaudited quarterly financial information for the two years ended December 31, 2012 and 2011 (in thousands, except per share amounts):
| | Three Months Ended | |
2012 | | March 31 | | June 30 | | September 30 | | December 31 | |
| | | | | | | | | |
Revenues | | $ | 67,045 | | $ | 30,384 | | $ | 41,835 | | $ | 57,053 | |
Income (loss) from operations | | 20,475 | | (2,860 | ) | 2,096 | | 7,069 | |
Net Income (loss) | | 12,384 | | (1,974 | ) | 1,112 | | 4,150 | |
Net income (loss) per share basic | | .61 | | (.10 | ) | .05 | | .20 | |
Net income (loss) per share diluted | | .60 | | (.10 | ) | .05 | | .20 | |
| | | | | | | | | | | | | |
| | Three Months Ended | |
2011 | | March 31 | | June 30 | | September 30 | | December 31 | |
| | | | | | | | | |
Revenues | | $ | 50,247 | | $ | 30,216 | | $ | 31,013 | | $ | 39,552 | |
Income from operations | | 9,014 | | 1,214 | | 1,889 | | 6,048 | |
Net Income | | 5,764 | | 587 | | 1,047 | | 3,436 | |
Net income per share basic | | .29 | | .03 | | .05 | | .17 | |
Net income per share diluted | | .28 | | .03 | | .05 | | .17 | |
| | | | | | | | | | | | | |
41
ITEM 9.CHANGES IN AND DISAGREEMENTS WITH ACCOUNTANTS ON ACCOUNTING AND FINANCIAL DISCLOSURE.
Not Applicable.
ITEM 9A. CONTROLS AND PROCEDURES.
Disclosure Controls and Procedures
The Company maintains controls and procedures to ensure thatafter. While it is able to collectexpected that the information it is required to discloseamount of unrecognized tax benefits will change in the reports it files with the Securities and Exchange Commission, and to process, summarize, and disclose this information within the time periods specified in the rules of the SEC. Based on an evaluation of the Company’s disclosure controls and procedures (as such term is defined in Rules 13a-15(e) and 15d-15(e) under the Securities Exchange Act of 1934, as amended) as of the end of the period covered by this report conducted by the Company’s management, with the participation of the Chief Executive and Chief Financial Officers, the Chief Executive and Chief Financial Officers believe that these controls and procedures are effective to ensure thatnext twelve months, the Company does not expect any change to have a significant impact on its results of operations. The Company's policy is able to record, process, summarize,recognize interest and report information requiredpenalties related to be includedunrecognized tax benefits in reports filed or submitted under the Securities Exchange Act of 1934, as amended, within the required time period.income tax expense. There werewas no changesinterest and penalties recognized in the Company’s internal controls over financial reporting during the year ended December 31, 2012,2015, three months ended December 31, 2014 or in the years ended September 30, 2014 or 2013.
13. Net (Loss) Income per Share Attributable to Common Stock
Net (loss) income per share attributable to common stock is calculated using the two-class method. The two-class method is an allocation method of calculating (loss) earnings per share when a company's capital structure includes participating securities that have materially affected, orrights to undistributed earnings. The Company's employees and officers that hold unvested restricted stock are reasonably likelyentitled to materially affect,dividends when the Company’s internal control over financial reporting.
Management’s ReportCompany pays dividends. The Company's basic net (loss) income per share attributable to common stock is computed by reducing the Company's net (loss) income by the net income allocable to unvested restricted stockholders that have a right to participate in earnings. The Company's employees and officers that hold unvested restricted stock do not participate in losses because they are not contractually obligated to do so. The undistributed earnings are allocated based on Internal Control over Financial Reporting
Managementthe relative percentage of the weighted average unvested restricted stock awards. The basic net (loss) income per share attributable to common stock is computed by dividing the net (loss) income attributable to common stock by the weighted average shares outstanding. The weighted average shares outstanding for the year ended December 31, 2015 was calculated by totaling (i) the product of (x) the weighted shares of Legacy Dawson Common Stock outstanding at the beginning of the year multiplied by (y) the Exchange Ratio, plus (ii) the number of shares associated with awards of Legacy Dawson restricted stock and restricted stock units that vested in conjunction with the Merger, weighted as of February 11, 2015, plus (iii) the number of shares of Legacy TGC Common Stock outstanding immediately prior to the Merger, weighted to reflect that such shares were outstanding from February 11, 2015 until December 31, 2015. The weighted average number of shares outstanding for the three months ended December 31, 2014 and for the years ended September 30, 2014 and 2013 were calculated as if the Merger had occurred at the beginning of the respective period, and the components of the weighted average shares calculation were multiplied by the Exchange Ratio. The Company's dilutive net (loss) income per share attributable to common stock is computed by adjusting basic net (loss) income per share attributable to common stock by diluted income allocable to unvested
Table of Contents
DAWSON GEOPHYSICAL COMPANY
NOTES TO CONSOLIDATED FINANCIAL STATEMENTS (Continued)
restricted stock, if any, divided by weighted average diluted shares outstanding. A reconciliation of the basic and diluted (loss) income per share attributable to common stock is as follows:
| | | | | | | | | | | | | |
| | Year Ended
December 31, | | Three Months Ended
December 31, | | Year Ended September 30, | |
|---|
| | 2015 | | 2014 | | 2014 | | 2013 | |
|---|
| | (in thousands, except share and per share data)
| |
|---|
Net (loss) income | | $ | (26,279 | ) | $ | (4,991 | ) | $ | (12,620 | ) | $ | 10,480 | |
Income allocable to unvested restricted stock | | | — | | | (9 | ) | | (26 | ) | | (136 | ) |
| | | | | | | | | | | | | | |
Basic (loss) income attributable to common stock | | $ | (26,279 | ) | $ | (5,000 | ) | $ | (12,646 | ) | $ | 10,344 | |
| | | | | | | | | | | | | | |
| | | | | | | | | | | | | | |
| | | | | | | | | | | | | | |
Reallocation of participating earnings | | | — | | | — | | | — | | | 1 | |
| | | | | | | | | | | | | | |
Diluted (loss) income attributable to common stock | | $ | (26,279 | ) | $ | (5,000 | ) | $ | (12,646 | ) | $ | 10,345 | |
| | | | | | | | | | | | | | |
| | | | | | | | | | | | | | |
| | | | | | | | | | | | | | |
Weighted average common shares outstanding: | | | | | | | | | | | | | |
Basic | | | 20,688,185 | | | 14,019,813 | | | 14,008,635 | | | 13,868,120 | |
Dilutive common stock options and restricted stock units | | | — | | | — | | | — | | | 71,721 | |
| | | | | | | | | | | | | | |
Diluted | | | 20,688,185 | | | 14,019,813 | | | 14,008,635 | | | 13,939,841 | |
| | | | | | | | | | | | | | |
| | | | | | | | | | | | | | |
| | | | | | | | | | | | | | |
Basic (loss) income attributable to a share of common stock | | $ | (1.27 | ) | $ | (0.36 | ) | $ | (0.90 | ) | $ | 0.75 | |
| | | | | | | | | | | | | | |
| | | | | | | | | | | | | | |
| | | | | | | | | | | | | | |
Diluted (loss) income attributable to a share of common stock | | $ | (1.27 | ) | $ | (0.36 | ) | $ | (0.90 | ) | $ | 0.74 | |
| | | | | | | | | | | | | | |
| | | | | | | | | | | | | | |
| | | | | | | | | | | | | | |
The Company is responsiblehad a net loss in the year ended December 31, 2015, the three months ended December 31, 2014, and the year ended September 30, 2014. As a result, all stock options and restricted stock units were anti-dilutive and excluded from weighted average shares used in determining the diluted loss attributable to a share of common stock for establishingthe respective periods. The following weighted average numbers of stock options and maintaining adequate internal control over financial reportingrestricted stock units have been excluded from the calculation of diluted loss per share attributable to common stock, as defined in Rule 13a-15(f) undertheir effect would be anti-dilutive for the Securities Exchange Actyear ended December 31, 2015, the three months ended December 31, 2014, and the year ended September 30, 2014:
| | | | | | | | | | |
| | Year Ended
December 31, | | Three Months ended
December 31, | | Year Ended
September 30, | |
|---|
| | 2015 | | 2014 | | 2014 | |
|---|
Stock options | | | 159,561 | | | 160,434 | | | 162,107 | |
Restricted stock units | | | 126,596 | | | 66,405 | | | 33,373 | |
| | | | | | | | | | | |
Total | | | 286,157 | | | 226,839 | | | 195,480 | |
| | | | | | | | | | | |
| | | | | | | | | | | |
| | | | | | | | | | | |
There were no weighted average number of 1934, as amended.stock options or restricted stock units that were anti-dilutive for the year ended September 30, 2013.
Table of Contents
DAWSON GEOPHYSICAL COMPANY
NOTES TO CONSOLIDATED FINANCIAL STATEMENTS (Continued)
The following weighted average shares of unvested restricted stock were included in common stock outstanding as such shares have a nonforfeitable right to participate in any dividends that might be declared and have the right to vote:
| | | | | | | | | | | | | |
| | Year Ended
December 31, | | Three Months Ended
December 31, | | Year Ended
September 30, | |
|---|
| | 2015 | | 2014 | | 2014 | | 2013 | |
|---|
Restricted Stock | | | 46,695 | | | 182,160 | | | 182,160 | | | 182,160 | |
14. Major Clients
Because The Company operates in only one business segment, contract seismic data acquisition and processing services. Sales to these clients, as a percentage of its inherent limitations, internal control over financial reporting mayoperating revenues that exceeded 10%, were as follows:
| | | | | | | | | | | | | |
| | Year Ended
December 31, 2015 | | Three Months Ended
December 31, 2014 | | Year Ended
September 30, 2014 | | Year Ended
September 30, 2013 | |
|---|
A | | | 21 | % | | 14 | % | | 16 | % | | 19 | % |
B | | | 15 | % | | 10 | % | | 13 | % | | 17 | % |
C | | | — | | | — | | | 12 | % | | — | |
The Company does not prevent or detect misstatements. Projectionsbelieve that the loss of any evaluationclient listed above would have a material adverse effect on the Company.
15. Areas of effectiveness to future periodsOperation
The U.S. and Canada are subject to the risk that controls may become inadequate becauseonly countries of changes in conditions or thatoperation for the degree of compliance with the policies or procedures may deteriorate. All internal control systems, no matter how well designed, have inherent limitations. Therefore, even those systems determined to be effective can provide only reasonable assurance with respect to financial statement preparation and presentation.Company.
Revenues for the year ended December 31, 2015 were $234,685,000 with $222,154,000 earned in the United States and $12,531,000 earned in Canada. Revenues for the three months ended December 31, 2014 were $50,802,000, all earned in the United States. Revenues for the fiscal year ended September 30, 2014 were $261,683,000 with $256,110,000 earned in the United States and $5,573,000 earned in Canada. Revenues for the fiscal year ended September 30, 2013 were $305,299,000 with $303,869,000 earned in the United States and $1,430,000 earned in Canada.
Management assessed the effectiveness of the Company’s internal control over financial reporting Net long-lived assets as of December 31, 2012. In making this assessment,2015 were approximately $147,567,000, with $136,758,000 located in the United States and $10,809,000 located in Canada. Net long-lived assets as of September 30, 2014 were approximately $164,494,000, with $163,880,000 located in the United States and $614,000 located in Canada.
16. Commitments and Contingencies
From time to time, the Company is a party to various legal proceedings arising in the ordinary course of business. Although the Company cannot predict the outcomes of any such legal proceedings, management usedbelieves that the criteria set forth byresolution of pending legal actions will not have a material adverse effect on the CommitteeCompany's financial condition, results of Sponsoring Organizationsoperations or liquidity as the Company believes it is adequately indemnified and insured.
The Company experiences contractual disputes with its clients from time to time regarding the payment of invoices or other matters. While the Treadway Commission (COSO)Company seeks to minimize these disputes and maintain good relations with its clients, the Company has in Internal Control — Integrated Framework. Based on our assessment, we believethe past, and may in the future, experience disputes that could affect its revenues and results of operations in any period.
Table of Contents
DAWSON GEOPHYSICAL COMPANY
NOTES TO CONSOLIDATED FINANCIAL STATEMENTS (Continued)
The Company has non-cancelable operating leases for office and shop space in Midland, Plano, Denison, Houston, Denver, Oklahoma City and Calgary, Alberta.
The following table summarizes payments due in specific periods related to the Company's contractual obligations with initial terms exceeding one year as of December 31, 2012,2015.
| | | | | | | | | | | | | | | | |
| | Payments Due by Period (in 000's) | |
|---|
| | Total | | Within
1 Year | | 2 - 3
Years | | 4 - 5
Years | | After
5 Years | |
|---|
Operating lease obligations (office space) | | $ | 11,271 | | $ | 1,704 | | $ | 2,660 | | $ | 1,899 | | $ | 5,008 | |
| | | | | | | | | | | | | | | | | |
| | | | | | | | | | | | | | | | | |
| | | | | | | | | | | | | | | | | |
Some of the Company’s internal control over financial reporting is effective basedCompany's operating leases contain predetermined fixed increases of the minimum rental rate during the initial lease term. For these leases, the Company recognizes the related expense on those criteria.a straight-line basis and records deferred rent as the difference between the amount charged to expense and the rent paid. Rental expense under the Company's operating leases with initial terms exceeding one year was $1,691,000 for the year ended December 31, 2015, $242,000 for the three months ended December 31, 2014, and $965,000 and $900,000 for the years ended September 30, 2014 and 2013, respectively.
As of December 31, 2015, the Company had unused letters of credit of approximately $1,767,000. The Company's letters of credit of $1,767,000 are associated with the Company's existing insurance coverage.
The effectiveness of internal control over financial reporting Also as of December 31, 2015, the Company had unused letters of credit of approximately $233,000. The Company's letters of credit are associated with the Company's self-insured retention on workers' compensation claims. Effective in fiscal 2012, has been auditedthe Company was no longer self-insured for workers' compensation claims after October 1, 2011. The unused letters of credit of $233,000 are associated with workers' compensation claims outstanding prior to October 1, 2011.
17. Rights Agreement
Legacy Dawson executed a Rights Agreement, dated as of July 23, 2009, between Legacy Dawson and Mellon Investors Services, LLC, as rights agent (the "Rights Agreement"). The Rights Agreement set forth and governed the rights that were dividended to the holders of record of the common stock of Legacy Dawson at the close of business on July 23, 2009 (the "Rights"). The Rights, if triggered, would have entitled the registered holder to purchase from Legacy Dawson certain fractional shares of Series A Junior Participating Preferred Stock, par value $1.00 per share, of Legacy Dawson.
On October 8, 2014, Legacy Dawson entered into an amendment to the rights agreement (the "Rights Amendment") with the rights agent in order to include provisions such that (a) the Merger would not trigger any action under the Rights Agreement and no distribution of rights would occur by Lane Gorman Trubitt, PLLC,virtue of the independent registered public accounting firmMerger or the consummation of the other transactions contemplated thereby and (b) the rights would expire at the effective time of the Merger. Pursuant to the Rights Amendment, the Rights Agreement expired pursuant to its terms upon the closing of the Merger on February 11, 2015.
18. Recently Issued Accounting Pronouncements
In February 2016, the FASB issued ASU No. 2016-02, Leases (Topic 842) which auditedwill require organizations that lease assets to recognize on the Company’sbalance sheet the assets and liabilities for the rights and obligations created by those leases. This ASU is effective for the annual period ending after December 15, 2016, and for annual and interim periods thereafter. Early adoption is permitted. The Company is currently evaluating the new guidance to determine the impact it will have on its consolidated financial statements. Lane Gorman Trubitt, PLLC’s attestation report
Table of Contents
DAWSON GEOPHYSICAL COMPANY
NOTES TO CONSOLIDATED FINANCIAL STATEMENTS (Continued)
In November 2015, the FASB issued ASU No. 2015-17 to simplify income tax accounting. The update requires that all deferred tax assets and liabilities be classified as noncurrent on effectivenessthe balance sheet instead of separating deferred taxes into current and noncurrent amounts. This update is effective for fiscal years beginning after December 15, 2016, and interim periods within those fiscal years, and may be adopted earlier on a voluntary basis. The Company elected to early adopt this guidance during the fourth quarter of 2015 and have applied a full retrospective approach to all periods presented. Current deferred income tax assets of $5,977,000 as of September 30, 2014 have been reclassified and presented as a reduction to deferred income tax liabilities, net, in the Consolidated Balance Sheet.
In September 2015, the FASB issued ASU No. 2015-16, "Business Combinations — Simplifying the Accounting for Measurement-Period Adjustments". ASU 2015-16 eliminates the requirement that an acquirer in a business combination account for measurement-period adjustments retrospectively. Instead, an acquirer will recognize a measurement-period adjustment during the period in which it determines the amount of the Company’s internal control overadjustment, including the effect on earnings of any amounts it would have recorded in previous periods if the accounting had been completed at the acquisition date. The guidance is effective for public entities for fiscal years beginning after December 15, 2015 and interim periods within those fiscal years. Early adoption is permitted. The Company adopted ASU 2015-16 during the quarter ended September 30, 2015. The adoption of ASU 2015-16 did not materially affect the Company's consolidated results of operations, cash flows, financial reporting appearsposition or financial statement disclosures.
In August 2014, the FASB issued ASU No. 2014-15, "Presentation of Financial Statements — Going Concern" (Subtopic 205-40). This ASU provides guidance on management's responsibility to evaluate whether there is substantial doubt about an entity's ability to continue as a going concern and in their Reportcertain circumstances to provide related footnote disclosures. This ASU is effective for the annual period ending after December 15, 2016, and for annual and interim periods thereafter. Early adoption is permitted. The Company does not expect the adoption of Independent Registered Public Accounting Firm.this guidance will have any material impact on its consolidated financial statements.
ITEM 9B. OTHER INFORMATION.
Not Applicable.
42
PART III
ITEM 10. DIRECTORS, EXECUTIVE OFFICERS AND CORPORATE GOVERNANCE.
The information required by Item 10In May 2014, the FASB issued ASU No. 2014-09 that introduces a new five-step revenue recognition model in which an entity should recognize revenue to depict the transfer of Form 10-K is hereby incorporated by referencepromised goods or services to customers in an amount that reflects the consideration to which the entity expects to be entitled in exchange for those goods or services. This ASU also requires disclosures sufficient to enable users to understand the nature, amount, timing, and uncertainty of revenue and cash flows arising from contracts with customers, including qualitative and quantitative disclosures about contracts with customers, significant judgments and changes in judgments, and assets recognized from the earlier filed of: (i) an amendmentcosts to this annual reportobtain or fulfill a contract. This standard is effective for fiscal years beginning after December 15, 2017, including interim periods within that reporting period. Early adoption is permitted, but only for fiscal years beginning after December 15, 2016. Entities have the option of using either a full retrospective or modified approach to adopt ASU 2014-09. The Company is currently evaluating the new guidance to determine the impact it will have on Form 10-K or (ii)its consolidated financial statements and the Company’s definitive proxy statement which will be filed pursuant to Regulation 14A within 120 days after the Company’s year end for the year covered by this report.
ITEM 11. EXECUTIVE COMPENSATION.
The information required by Item 11method of Form 10-K is hereby incorporated by reference from the earlier filed of: (i) an amendment to this annual report on Form 10-K or (ii) the Company’s definitive proxy statement which will be filed pursuant to Regulation 14A within 120 days after the Company’s year end for the year covered by this report.
ITEM 12.SECURITY OWNERSHIP OF CERTAIN BENEFICIAL OWNERS AND MANAGEMENT AND RELATED STOCKHOLDER MATTERS.
The information required by Item 12 of Form 10-K is hereby incorporated by reference from the earlier filed of: (i) an amendment to this annual report on Form 10-K or (ii) the Company’s definitive proxy statement which will be filed pursuant to Regulation 14A within 120 days after the Company’s year end for the year covered by this report.
ITEM 13.CERTAIN RELATIONSHIPS AND RELATED TRANSACTIONS, AND DIRECTOR INDEPENDENCE.
The information required by Item 13 of Form 10-K is hereby incorporated by reference from the earlier filed of: (i) an amendment to this annual report on Form 10-K or (ii) the Company’s definitive proxy statement which will be filed pursuant to Regulation 14A within 120 days after the Company’s year end for the year covered by this report.
ITEM 14. PRINCIPAL ACCOUNTING FEES AND SERVICES.
The information required by Item 14 of Form 10-K is hereby incorporated by reference from the earlier filed of: (i) an amendment to this annual report on Form 10-K or (ii) the Company’s definitive proxy statement, which will be filed pursuant to Regulation 14A within 120 days after the Company’s year end for the year covered by this report.
PART IV
ITEM 15. EXHIBITS AND FINANCIAL STATEMENT SCHEDULES.
(a) The following documents are filed as a part of this report:
adoption.
(1)Financial Statements included in Item 8 above are filed as part19. Concentrations of this annual report.Credit Risk
Financial instruments that potentially expose the Company to concentrations of credit risk at any given time may consist of cash and cash equivalents, money market funds and overnight investment accounts, short-term investments in certificates of deposit, trade and other receivables and other current assets. At December 31, 2015 and September 30, 2014, the Company had deposits with domestic and international banks in excess of federally insured limits. Management believes the credit risk associated with these deposits is minimal. Money market funds seek to preserve the value of the investment, but it is possible to lose money investing in these funds.
Table of Contents
(2)
DAWSON GEOPHYSICAL COMPANY
Financial Statement Schedules included in Item 8 herein:NOTES TO CONSOLIDATED FINANCIAL STATEMENTS (Continued)
The Company's sales are to clients whose activities relate to oil and natural gas exploration and production. The Company generally extends unsecured credit to these clients; therefore, collection of receivables may be affected by the economy surrounding the oil and natural gas industry or other economic conditions. The Company closely monitors extensions of credit and may negotiate payment terms that mitigate risk.
All schedules20. Quarterly Consolidated Financial Data (Unaudited)
| | | | | | | | | | | | | | | | |
| | Quarter Ended | |
|---|
| | December 31 | | March 31 | | June 30 | | September 30 | | December 31 | |
|---|
Year Ended December 31, 2015: | | | | | | | | | | | | | | | | |
Operating revenues | | | | | $ | 73,722,000 | | $ | 43,335,000 | | $ | 62,498,000 | | $ | 55,130,000 | |
Loss from operations | | | | | $ | (9,814,000 | ) | $ | (18,065,000 | ) | $ | (4,662,000 | ) | $ | (8,141,000 | ) |
Net loss | | | | | $ | (6,592,000 | ) | $ | (11,877,000 | ) | $ | (2,870,000 | ) | $ | (4,940,000 | ) |
Basic and diluted loss per share attributable to common stock | | | | | $ | (0.37 | ) | $ | (0.55 | ) | $ | (0.13 | ) | $ | (0.23 | ) |
Diluted loss per share attributable to common stock | | | | | $ | (0.37 | ) | $ | (0.55 | ) | $ | (0.13 | ) | $ | (0.23 | ) |
Three Months Ended December 31, 2014: | | | | | | | | | | | | | | | | |
Operating revenues | | | | | | | | | | | | | | $ | 50,802,000 | |
Loss from operations | | | | | | | | | | | | | | $ | (6,984,000 | ) |
Net loss | | | | | | | | | | | | | | $ | (4,991,000 | ) |
Basic and diluted loss per share attributable to common stock | | | | | | | | | | | | | | $ | (0.36 | ) |
Diluted loss per share attributable to common stock | | | | | | | | | | | | | | $ | (0.36 | ) |
Year Ended September 30, 2014: | | | | | | | | | | | | | | | | |
Operating revenues | | $ | 68,181,000 | | $ | 76,766,000 | | $ | 54,166,000 | | $ | 62,570,000 | | | | |
(Loss) income from operations | | $ | (4,967,000 | ) | $ | 2,822,000 | | $ | (9,228,000 | ) | $ | (6,531,000 | ) | | | |
Net (loss) income | | $ | (2,897,000 | ) | $ | 1,652,000 | | $ | (7,493,000 | ) | $ | (3,882,000 | ) | | | |
Basic (loss) income per share attributable to common stock | | $ | (0.20 | ) | $ | 0.12 | | $ | (0.54 | ) | $ | (0.28 | ) | | | |
Diluted (loss) income per share attributable to common stock | | $ | (0.20 | ) | $ | 0.12 | | $ | (0.54 | ) | $ | (0.28 | ) | | | |
Basic and diluted (loss) income per share attributable to common stock are computed independently for which provision is made in the applicable accounting regulationseach of the Securitiesquarters presented. Therefore, the sum of quarterly basic and Exchange Commission arediluted information may not required underequal the related instructions or are inapplicableannual basic and therefore,diluted (loss) income per share attributable to common stock. In addition, all income (loss) per share calculations have been omitted.adjusted to reflect the 1.76 merger conversion factor.
(3)Exhibits: The information required by this Item 15(a)(3) is set forth in the Index to Exhibits accompanying this Annual Report on Form 10-K.Table of Contents
43
SIGNATURES
Pursuant to the requirements of Section 13 or 15(d) of the Securities Exchange Act of 1934, the registrant has duly caused this report to be signed on its behalf by the undersigned, thereunto duly authorized.
| TGC INDUSTRIES, INC.
|
| | |
Date: March 15, 2013
| | By:
| /s/ Wayne A. Whitener
|
| | | Wayne A. Whitener
|
| | | President and Chief Executive Officer
|
| | | (Principal Executive Officer)
|
Pursuant to the requirements of the Securities Exchange Act of 1934, this report has been signed below by the following persons on behalf of the registrant and in the capacities and on the dates indicated.
Date: March 15, 2013
| | By:
| /s/ Wayne A. Whitener
|
| | | Wayne A. Whitener
|
| | | President, Chief Executive Officer, and Director
|
| | | (Principal Executive Officer)
|
| | | |
Date: March 15, 2013
| | By:
| /s/ James K. Brata
|
| | | James K. Brata
|
| | | Vice President, Secretary, Treasurer, and Chief Financial Officer
|
| | | (Principal Financial and Accounting Officer)
|
| | | |
Date: March 15, 2013
| | By:
| /s/ William J. Barrett
|
| | | William J. Barrett
|
| | | Director
|
| | | |
Date: March 15, 2013
| | By:
| /s/ Herbert M. Gardner
|
| | | Herbert M. Gardner
|
| | | Director
|
| | | |
Date: March 15, 2013
| | By:
| /s/ Allen T. McInnes
|
| | | Allen T. McInnes
|
| | | Director
|
| | | |
Date: March 15, 2013
| | By:
| /s/ Edward L. Flynn
|
| | | Edward L. Flynn
|
| | | Director
|
| | | |
Date: March 15, 2013
| | By:
| /s/ Stephanie P. Hurtt
|
| | | Stephanie P. Hurtt
|
| | | Director
|
44
INDEX TO EXHIBITS
| | | |
EXHIBIT
NO. |
|
| | DESCRIPTION |
|---|
2.1
| 2.1 | Stock Purchase
| Agreement and Plan of Merger, dated as of October 16, 2009,8, 2014, by and among TGC Industries, Inc.Dawson Operating Company (f/k/a Dawson Geophysical Company), Eagle Geophysical, Inc.the Registrant and Eagle Geophysical Onshore, Inc.Riptide Acquisition Corp., filed as Exhibit 2.1 to the Company’s Current Report on Form 8-K dated October 17, 2009, and incorporated herein by reference. |
| | |
3.1
| | Restated Articles of Incorporation (with amendment) as filed with the Secretary of State of Texas on June 20, 2003, filed as Exhibit 3.4 to the Company’s Annual Report on Form 10-KSB for the fiscal year ended December 31, 2003, and incorporated herein by reference.
|
| | |
3.2
| | Amended and Restated Bylaws (as amended March 25, 2009), filed as Exhibit 3.1 to the Company’sRegistrant's Current Report on Form 8-K, filed on March 31, 2009,October 9, 2014, and incorporated herein by reference.
|
| | | |
4.1
| 3.1 | | Amended and Restated Certificate of Formation, as amended February 11, 2015, filed as Exhibit 3.1 to the Registrant's Annual Report on Form 10-K, filed on March 16, 2015, and incorporated herein by reference. |
| | | |
| 3.2 | | Bylaws, as amended February 11, 2015 filed as Exhibit 3.2 to the Registrant's Annual Report on Form 10-K, filed on March 16, 2015, and incorporated herein by reference. |
| | | |
| 4.1 | | Form of Specimen Stock Certificate, filed as Exhibit 4.1 to the Company’s Registration Statement on Form SB-2/A on September 20, 2005 (Registration No. 333-128018), and incorporated herein by reference. |
| | |
+10.1
| | Employment Contract between TGC Industries, Inc. and Wayne A. Whitener, filed as Exhibit 10.1 to the Company’sRegistrant's Current Report on Form 8-K, filed on April 18, 2012,February 11, 2015, and incorporated herein by reference.
|
| | | |
10.2
| 10.1 | Form of TGC Industries, Inc. Director and Officer Indemnification Agreement, filed as Exhibit 10.1 to the Company’s Current Report on Form 8-K filed on October 22, 2008, and incorporated herein by reference.
|
| | |
10.3
| | Amended and Restated Loan and Security Agreement by and between TGC Industries, Inc.the Registrant and Sovereign Bank, dated September 16, 2009,, filed as Exhibit 10.1 to the Company’sRegistrant's Current Report on Form 8-K, filed on September 22, 2009 (File No. 001-32472), and incorporated herein by reference. |
| | | |
10.4
| 10.2 | | Amended and Restated Promissory Note, by and between TGC Industries, Inc.the Registrant and Sovereign Bank, dated September 16, 2009, filed as Exhibit 10.2 to the Company’sRegistrant's Current Report on Form 8-K, filed on September 22, 2009 (File No. 001-32472), and incorporated herein by reference. |
| | | |
10.5
| 10.3 | | Amendment to Amended and Restated Loan and Security Agreement and Amended and Restated Promissory Note by and between TGC Industries, Inc.the Registrant and Sovereign Bank, dated September 16, 2010, filed as Exhibit 10.1 to the Company’sRegistrant's Form 10-Q for the quarterly period ended September 30, 2010, and incorporated herein by reference. |
|
|
| |
10.6
| 10.4 | | Third Amendment to Amended and Restated Loan and Security Agreement and Amendment to Amended and Restated Promissory Note, by and between TGC Industries, Inc.the Registrant and Sovereign Bank, dated September 16, 2011, filed as Exhibit 10.1 to the Company’sRegistrant's Current Report on Form 8-K, filed on September 22, 2011, and incorporated herein by reference. |
| | | |
10.7
| 10.5 | | Fourth Amendment to Amended and Restated Loan and Security Agreement by and between TGC Industries, Inc.the Registrant and Sovereign Bank, dated January 26, 2012, filed as Exhibit 10.1 to the Company’sRegistrant's Quarterly Report on Form 10-Q for the quarterly period ended September 30, 2012, and incorporated herein by reference. |
| | | |
10.8
| 10.6 | | Fifth Amendment to Amended and Restated Loan and Security Agreement by and between TGC Industries, Inc.the Registrant and Sovereign Bank, dated September 16, 2012, filed as Exhibit 10.2 to the Company’sRegistrant's Quarterly Report on Form 10-Q for the quarterly period ended September 30, 2012, and incorporated herein by reference. |
| | | |
+10.9
| 10.7 | 2006 Stock Awards Plan,
| Sixth Amendment to Amended and Restated Loan and Security Agreement, by and between the Registrant and Sovereign Bank, dated March 30, 2006,as of October 11, 2012, filed as Exhibit A10.1 to the Company’s definitive proxy statement onRegistrant's Form DEFR 14A10-Q for the quarterly period ended September 30, 2013, and incorporated herein by reference |
| | | |
| 10.8 | | Seventh Amendment to Amended and Restated Loan and Security Agreement and Amendment to Amended and Restated Promissory Note, by and between the Registrant and Sovereign Bank, dated April 25, 2006,as of September 16, 2013, filed as Exhibit 10.2 to the Registrant's Form 10-Q for the quarterly period ended September 30, 2013, and incorporated herein by reference. |
|
| | |
45Table of Contents
+10.10
| | | |
| EXHIBIT NO. | | DESCRIPTION |
|---|
| 10.9 | | Eighth Amendment to Amended and Restated Loan and Security Agreement and Amendment to Amended and Restated Promissory Note, by and between the Registrant and Sovereign Bank, dated September 16, 2014, filed as Exhibit 10.1 to the Registrant's Current Report on Form 8-K, filed on September 19, 2014, and incorporated herein by reference. |
| | | |
| 10.10 | | Ninth Amendment to Amended and Restated Loan and Security Agreement (filed on July 2, 2015 as Exhibit 10.1 to the Company's Current Report on Form 8-K (File No. 001-32472) and incorporated herein by reference). |
| | | |
| *10.11 | | Tenth Amendment to Amended and Restated Loan and Security Agreement. |
| | | |
| +10.12 | | The Executive Nonqualified "Excess" Plan Adoption Agreement, filed as Exhibit 10.1 to the Registrant's Current Report on Form 8-K, filed on January 8, 2013, and incorporated herein by reference. |
| | | |
| +10.13 | | The Executive Nonqualified Excess Plan Document, filed as Exhibit 10.2 to the Registrant's Current Report on Form 8-K filed on January 8, 2013, and incorporated herein by reference. |
| | | |
| +10.14 | | Form of Indemnification Agreement entered with directors and executive officers, filed as Exhibit 10.1 to the Registrant's Current Report on Form 8-K, filed on October 9, 2014, and incorporated herein by reference. |
| | | |
| +10.15 | | Employment Agreement, dated October 8, 2014, by and between the Registrant and Stephen C. Jumper, filed as Exhibit 10.5 to the Registrant's Current Report on Form 8-K, filed on October 9, 2014, and incorporated herein by reference. |
| | | |
| +10.16 | | Employment Agreement, dated October 8, 2014, by and between the Registrant and Wayne A. Whitener, filed as Exhibit 10.2 to the Registrant's Current Report on Form 8-K, filed on October 9, 2014, and incorporated herein by reference. |
| | | |
| +10.17 | | Employment Agreement, dated October 8, 2014, by and between the Registrant and C. Ray Tobias, filed as Exhibit 10.6 to the Registrant's Current Report on Form 8-K, filed on October 9, 2014, and incorporated herein by reference. |
| | | |
| +10.18 | | Employment Agreement, dated October 8, 2014, by and between the Registrant and Daniel G. Winn, filed as Exhibit 10.4 to the Registrant's Current Report on Form 8-K, filed on October 9, 2014, and incorporated herein by reference. |
| | | |
| +10.19 | | Employment Agreement, dated October 8, 2014, by and between the Registrant and James K. Brata, filed as Exhibit 10.3 to the Registrant's Current Report on Form 8-K, filed on October 9, 2014, and incorporated herein by reference. |
| | | |
| +10.20 | | Employment Agreement, dated October 8, 2014, by and between the Registrant and Christina W. Hagan, filed as Exhibit 10.7 to the Registrant's Current Report on Form 8-K, filed on October 9, 2014, and incorporated herein by reference. |
| | | |
| +10.21 | | Employment Agreement, dated October 8, 2014, by and between the Registrant and James W. Thomas, filed as Exhibit 10.8 to the Registrant's Current Report on Form 8-K, filed on October 9, 2014, and incorporated herein by reference. |
| | | |
| +10.22 | | Letter Agreement, dated February 15, 2016, by and between James K. Brata and the Company, filed as Exhibit 10.1 to the Company's Current Report on Form 8-K, filed on February 19, 2016, and incorporated herein by reference. |
| | | |
| +10.23 | | Letter Agreement, dated February 15, 2016, by and between Christina W. Hagan and the Company, filed as Exhibit 10.2 to the Company's Current Report on Form 8-K, filed on February 19, 2016, and incorporated herein by reference. |
|
| | |
Table of Contents
| | | |
| EXHIBIT NO. | | DESCRIPTION |
|---|
| +10.24 | | Letter Agreement, dated February 15, 2016, by and between Stephen C. Jumper and the Company, filed on February 19, 2016 as Exhibit 10.3 to the Company's Current Report on Form 8-K (File No. 001-32472) and incorporated herein by reference. |
| | | |
| +10.25 | | Letter Agreement, dated February 15, 2016, by and between James W. Thomas and the Company, filed as Exhibit 10.4 to the Company's Current Report on Form 8-K, filed on February 19, 2016, and incorporated herein by reference. |
| | | |
| +10.26 | | Letter Agreement, dated February 15, 2016, by and between C. Ray Tobias and the Company, filed as Exhibit 10.5 to the Company's Current Report on Form 8-K, filed on February 19, 2016, and incorporated herein by reference. |
| | | |
| +10.27 | | Letter Agreement, dated February 15, 2016, by and between Wayne A. Whitener and the Company, filed as Exhibit 10.6 to the Company's Current Report on Form 8-K, filed on February 19, 2016, and incorporated herein by reference. |
| | | |
| +10.28 | | Letter Agreement, dated February 15, 2016, by and between Daniel G. Winn and the Company, filed as Exhibit 10.7 to the Company's Current Report on Form 8-K, filed on February 19, 2016, and incorporated herein by reference. |
| | | |
| +10.29 | | Amended and Restated Dawson Geophysical Company 2006 Stock and Performance Incentive Plan, filed as Exhibit 10.1 to the Registrant's Current Report on Form 8-K, filed on February 11, 2015, and incorporated herein by reference. |
| | | |
| +10.30 | | Form of Restricted Stock Agreement for the Legacy Dawson Plan, filed as Exhibit 10.3 to Dawson Operating Company's (f/k/a Dawson Geophysical Company) Quarterly Report on Form 10-Q, filed on February 11, 2008 (File No. 001-34404), and incorporated herein by reference. |
| | | |
| +10.31 | | Form of Restricted Stock Agreement for the Legacy Dawson Plan, filed as Exhibit 10.5 to Dawson Operating Company's (f/k/a Dawson Geophysical Company) Annual Report on Form 10-K, filed on December 11, 2013 (File No. 001-34404), and incorporated herein by reference. |
| | | |
| +10.32 | | Form of Restricted Stock Unit Agreement for the Legacy Dawson Plan, filed as Exhibit 10.5 to Dawson Operating Company's (f/k/a Dawson Geophysical Company) Annual Report on Form 10-K, filed on December 11, 2013 (File No. 001-34404) , and incorporated herein by reference. |
| | | |
| +10.33 | | Form of Stock Option Agreement for the Legacy Dawson Plan, filed as Exhibit 10.4 to Dawson Operating Company's (f/k/a Dawson Geophysical Company) Quarterly Report on Form 10-Q, filed on February 11, 2008 (File No. 001-34404), and incorporated herein by reference. |
| | | |
| +10.34 | | Form of Stock Option Agreement for the Legacy Dawson Plan, filed as Exhibit 10.9 to Dawson Operating Company's (f/k/a Dawson Geophysical Company) Annual Report on Form 10-K, filed on December 11, 2013 (File No. 001-34404), and incorporated herein by reference. |
| | | |
| +10.35 | | Dawson Geophysical 2014 Annual Incentive Plan, filed as Exhibit 10.1 to Dawson Operating Company's (f/k/a Dawson Geophysical Company) Current Report on Form 8-K, filed on November 25, 2013 (File No. 001-34404), and incorporated herein by reference. |
| | | |
| 10.36 | | Form of Master Geophysical Data Acquisition Agreement, filed as Exhibit 10.10 to Dawson Operating Company's (f/k/a Dawson Geophysical Company) Annual Report on Form 10-K, filed on December 5, 2012 (File No. 001-34404), and incorporated herein by reference. |
|
| | |
Table of Contents
| | | |
| EXHIBIT NO. | | DESCRIPTION |
|---|
| 10.37 | | Form of Supplemental Agreement to Master Geophysical Data Acquisition Agreement, filed as Exhibit 10.11 to Dawson Operating Company's (f/k/a Dawson Geophysical Company) Annual Report on Form 10-K, filed on December 5, 2012 (File No. 001-34404), and incorporated herein by reference. |
| | | |
| 10.38 | | Amended and Restated 2006 Stock Awards Plan dated April 12, 2010, included inof the Company’s Definitive Proxy Statement filedCompany (formerly known as the TGC Industries, Inc. 2006 Stock Awards Plan, i.e., the Legacy TGC Plan) (filed on April 23, 2010,June 5, 2015 as Exhibit 10.1 to the Company's Current Report on Form 8-K (File No. 001-32472) and incorporated herein by reference.reference). |
|
|
| |
| *21.1 | | Subsidiaries of the Registrant. |
| | | |
| *23.1 | | Consent of Lane Gorman Trubitt, PLLC,Ernst & Young LLP, independent registered public accountants to incorporation of report by reference. |
| | | |
| *31.1 | | Certification of Chief Executive Officer pursuant to 18 U.S.C. Section 1350, as adopted pursuant to Section 302 of the Sarbanes-Oxley Act of 2002. |
| | | |
| *31.2 | | Certification of Chief Financial Officer pursuant to 18 U.S.C. Section 1350, as adopted pursuant to Section 302 of the Sarbanes-Oxley Act of 2002. |
| | | |
| *31.3 | | Certification of Chief Accounting Officer pursuant to 18 U.S.C. Section 1350, as adopted pursuant to Section 302 of the Sarbanes-Oxley Act of 2002. |
| | | |
| *32.1 | | Certification of Chief Executive Officer pursuant to 18 U.S.C. Section 1350, as adopted pursuant to Section 906 of the Sarbanes-Oxley Act of 2002. |
| | | |
| *32.2 | | Certification of Chief Financial Officer pursuant to 18 U.S.C. Section 1350, as adopted pursuant to Section 906 of the Sarbanes-Oxley Act of 2002. |
| | | |
101.INS*
| *32.3 | | Certification of Chief Accounting Officer pursuant to 18 U.S.C. Section 1350, as adopted pursuant to Section 906 of the Sarbanes-Oxley Act of 2002. |
| | | |
| 101.INS | * | XBRL Instance DocumentDocument. |
| | | |
101.SCH*
| 101.SCH | * | XBRL Taxonomy Extension Schema DocumentDocument. |
| 101.CAL | |
101.CAL*
* | | XBRL Taxonomy Extension Calculation Linkbase Document Document. |
| | | |
101.DEF*
| 101.DEF | * | XBRL Taxonomy Extension Definition Linkbase DocumentDocument. |
| | | |
101.LAB*
| 101.LAB | * | XBRL Taxonomy Extension Labels Linkbase DocumentDocument. |
| | | |
101.PRE*
| 101.PRE | * | XBRL Taxonomy Extension Presentation Linkbase DocumentDocument. |
- *
- Filed herewith.
- +
- Management contract
onor compensatory plan contract, or arrangement.
46