UNITED STATES
SECURITIES AND EXCHANGE COMMISSION
Washington, D.C. 20549
FORM 10-K
FORM 10-K
x☒ANNUAL REPORT PURSUANT TO SECTION 13 OR 15(d) OF THE SECURITIES EXCHANGE ACT OF 1934
��
For the fiscal year ended December 31, 20132016
o☐TRANSITION REPORT PURSUANT TO SECTION 13 or 15(d) OF THE SECURITIES EXCHANGE ACT OF 1934
For the transition period from ________________ to ________________
Commission file number 000-51446


CONSOLIDATED COMMUNICATIONS HOLDINGS, INC.
(Exact name of registrant as specified in its charter)
| Delaware | | 02-0636095 | |
| (State or other jurisdiction | | (I.R.S. Employer | |
| of incorporation or organization) | | Identification No.) | |
| | | | |
| 121 South 17th17th Street, Mattoon, Illinois | | 61938-3987 | |
| (Address of principal executive offices) | | (Zip Code) | |
Registrant’s telephone number, including area code (217) 235-3311
Securities registered pursuant to Section 12(b) of the Act:
| Title of each class | | Name of each exchange on which registered | |
| Common Stock—$0.01 par value | | The NASDAQ Global Select Market | |
Securities registered pursuant to Section 12(g) of the Act: None
Indicate by check mark if the registrant is a well-known seasoned issuer, as defined in Rule 405 of the Securities Act.
Yes o☐ No x☒
Indicate by check mark if the registrant is not required to file reports pursuant to Section 13 or Section 15(d) of the Act.
Yes o☐ No x☒
Indicate by check mark whether the registrant (1) has filed all reports required to be filed by Section 13 or 15(d) of the Securities Exchange Act of 1934 during the preceding 12 months (or for such shorter period that the registrant was required to file such reports), and (2) has been subject to such filing requirements for the past 90 days.
Yes x☒ No o☐
Indicate by check mark whether the registrant has submitted electronically and posted on its corporate Web site, if any, every Interactive Data File required to be submitted and posted pursuant to Rule 405 of Regulation S-T (§232.405 of this chapter) during the preceding 12 months (or for such shorter period that the registrant was required to submit and post such files).
Yes x☒ No o☐
Indicate by check mark if disclosure of delinquent filers pursuant to Item 405 of Regulation S-K (§229.405 of this chapter) is not contained herein, and will not be contained, to the best of registrant’s knowledge, in definitive proxy or information statements incorporated by reference in Part III of this Form 10-K or any amendment to this Form 10-K. o☐
Indicate by check mark whether the registrant is a large accelerated filer, an accelerated filer, a non-accelerated filer, or a small reporting company. See definitions of “large accelerated filer” “accelerated filer” and “smaller reporting company” in Rule 12b-2 of the Exchange Act.
Large accelerated filer o☒ | Accelerated filer x☐ | Non-accelerated filer o
☐
(Do not check if a smaller
reporting company) | Smaller reporting companyocompany☐ |
Indicate by check mark whether the registrant is a shell company (as defined in Rule 12b-2 of the Exchange Act).
Yes o☐ No x☒
As of June 30, 2013,2016, the aggregate market value of the shares held by non-affiliates of the registrant’s common stock was $653,300,709$1,313,079,194 based on the closing price as reported on the NASDAQ Global Select Market. The market value calculations exclude shares held on the stated date by registrant’s directors and officers on the assumption such shares may be shares owned by affiliates. Exclusion from these public market value calculations does not necessarily conclude affiliate status for any other purpose.
On February 14, 2014,23, 2017, the registrant had 40,065,24650,605,844 shares of Common Stock outstanding.
DOCUMENTS INCORPORATED BY REFERENCE
Portions of the registrant’s Proxy Statement for the 20142017 Annual Meeting of Shareholders are incorporated herein by reference in Part III of this Annual Report on Form 10-K to the extent stated herein. Such proxy statement will be filed with the Securities and Exchange Commission within 120 days of the registrant’s fiscal year ended December 31, 2013.2016.
PART I
PART I
Note About Forward-Looking Statements
The SECSecurities and Exchange Commission (“SEC”) encourages companies to disclose forward-looking information so that investors can better understand a company’s future prospects and make informed investment decisions. Certain statements in this Annual Report on Form 10-K, including that which relatesthose relating to the impact on future revenue sources, pending and future regulatory orders, continued expansion of the telecommunications network and expected changes in the sources of our revenue and cost structure resulting from our entrance into new communications markets, are forward-looking statements. Forward-lookingstatements and are made pursuant to the safe harbor provisions of the Securities Litigation Reform Act of 1995. These forward-looking statements reflect, among other things, our current expectations, plans, strategies and anticipated financial results. There are a number of risks, uncertainties and conditions that may cause our actual results to differ materially from those expressed or implied by these forward-looking statements. Many of these circumstances are beyond our ability to control or predict. Moreover, forward-looking statements necessarily involve assumptions on our part. These forward-looking statements generally are identified by the words “believe”, “expect”, “anticipate”, “estimate”, “project”, “intend”, “plan”, “should”, “may”, “will”, “would”,“estimate,” “project,” “intend,” “plan,” “should,” “may,” “will, be”,” “would,” “will be,” “will continue” or similar expressions. Such forward-looking statements involve known and unknown risks, uncertainties and other factors that may cause actual results, performance or achievements of Consolidated Communications Holdings, Inc. and its subsidiaries (“Consolidated,” the “Company,” “we” or “our”) to be different from those expressed or implied in the forward-looking statements. All forward-looking statements attributable to us or persons acting on our behalf are expressly qualified in their entirety by the cautionary statements that appear throughout this report. A detailed discussion of these and other risks and uncertainties that could cause actual results and events to differ materially from such forward–looking statements is included in the section entitledPart I – Item 1A – “Risk Factors” (refer to Part I, Item 1A). Furthermore, forward-looking statements speak only as of the date they are made. Except as required under the federal securities laws or the rules and regulations of the Securities and Exchange Commission,SEC, we disclaim any intention or obligation to update or revise publicly any forward-looking statements. YouUndue reliance should not place undue reliancebe placed on forward-looking statements.
Item 1.Business.
Consolidated Communications Holdings, Inc. (the “Company”, “we” or “our”) is a Delaware holding company with operating subsidiaries (collectively “Consolidated”) providing a wide range ofthat provide integrated communications services to residentialin consumer, commercial and business customerscarrier channels in California, Illinois, Iowa, Kansas, Minnesota, Missouri, North Dakota, Pennsylvania, South Dakota, Texas Pennsylvania, California, Kansas and Missouri.Wisconsin. We were founded in 1894 as the Mattoon Telephone Company by the great-grandfather of one of the members of our Board of Directors, Richard A. Lumpkin. After several acquisitions, the Mattoon Telephone Company was incorporated as the Illinois Consolidated Telephone Company (“ICTC”) on April 10, 1924. We were incorporated under the laws of Delaware in 2002, and through our predecessors, we have provided telecommunicationsbeen providing communications services in many of the communities we serve for more than a century. Through strategic acquisitions over the last decade,
In addition to our focus on organic growth in our commercial and carrier channels, we have grown ourachieved business diversified ourgrowth and a diversification of revenue and cash flow streams andthat have created a strong platform for future growth.growth through our acquisitions over the last decade. Our strategic approach into evaluating potential transactions includeincludes analysis of the market opportunity, the quality of the network, our ability to integrate the acquired company efficiently and the potential for creating significant operating synergies and agenerating positive cash flow at the inception of each acquisition. The operatingOperating synergies are created through the use of consistent platforms, convergence of processes and functional management of the combined entities. We measure our synergies during the first two years following an acquisition. For example, the acquisition of our Texas properties in 2004 tripled the size of our business and gave us the requisite scale to make system and platform decisions that would facilitate future acquisitions. For theThe acquisition of our Pennsylvania properties wein 2007 achieved synergies in excess of $12.0 million in annualized savings, which at the time, represented aboutapproximately 20% of their operating expense. During the first full year following theThe acquisition of SureWest Communications wein 2012 achieved synergies of $29.5 million during the two years subsequent to the acquisition date. Our acquisition of Enventis Corporation (“Enventis”) in excess of $23.4 million and we believe we will continue to achieve furtherOctober 2014 generated annual operating synergies inof approximately $17.0 million during the second year post acquisition. Wefirst two years subsequent to the acquisition date. Through these acquisitions, we have positioned our business to provide services in both rural, suburban and suburbanmetropolitan markets, with service territories spanning the country.
We offerThrough our advanced fiber optic network and multiple data centers, we provide a wide range of telecommunicationscommunication services including local and long-distance service,products that include, high-speed broadband Internet access, video services, digital telephone service (“VOIP”), custom calling features,voice services, private line services, carrier grade access services, network capacity services, over our regional fiber optic networks, a comprehensive suite of cloud services, data center and managed services,
directory publishing Competitive Local Exchange Carrier (“CLEC”) services and equipment sales. Consolidated is dedicated to turning technology into solutions, connecting people and enriching how its customers work and live.
Recent Business Developments
Acquisitions
FairPoint Communications, Inc.
On December 3, 2016, we entered into a definitive agreement and plan of merger (the “Merger Agreement”) with FairPoint Communications, Inc. (“FairPoint”) to acquire all the issued and outstanding shares of FairPoint in exchange for shares of our common stock. FairPoint is an advanced communications provider to business, wholesale and residential customers within its service territory, which spans across 17 states. FairPoint owns and operates a robust fiber-based network with more than 21,000 route miles of fiber, including 17,000 route miles of fiber in northern New England. This pending acquisition reflects our strategy to diversify revenue and cash flows amongst multiple products and to expand our network to new markets. The merger is subject to standard closing conditions including the approval of our stockholders and FairPoint’s stockholders, the approval of the listing of additional shares of Consolidated common stock to be issued to FairPoint’s stockholders, required federal and state regulatory approvals and other customary closing conditions. We historically operatedexpect the merger to close by mid-2017.
Enventis Corporation
On October 16, 2014, we completed our business as two separate reportable segments: Telephone Operationsmerger with Enventis, an advanced communications provider, which services consumer, commercial and Other Operations. Based on changeswholesale carrier customer channels primarily in the upper Midwest. The financial results for Enventis have been included in our business structure, duringconsolidated financial statements as of the quarter ended June 30, 2013 we concluded that we operate our business as one reportable segment. acquisition date.
See Note 3 to the Recent Business Developments section belowconsolidated financial statements included in this report in Part II – Item 8 – “Financial Statements and Supplementary Data” for a more detailed discussion regarding the circumstances that resulted in the change to our segment reporting.of these transactions.
1
Table of Contents
Recent Business Developments
Segment Reporting
Historically, we classified our operations into two separate reportable business segments: Telephone Operations and Other Operations. Our Telephone Operations consisted of a wide range of telecommunications services to residential and business customers, including local and long-distance service, high-speed broadband Internet access, video services, VOIP services, custom calling features, private line services, carrier access services, network capacity services over a regional fiber optic network, mobile services and directory publishing. Our Other Operations segment operated two complementary non-core businesses including telephone services to state and county correctional facilities (“Prison Services”) and equipment sales. As discussed below, our contract to provide telephone services to correctional facilities operated by the Illinois Department of Corrections was not renewed and the process of transitioning those services to another service provider was completed during the quarter ended March 31, 2013. The remaining prison services assets and operations were classified as discontinued operations during the quarter ended June 30, 2013 and subsequently sold during the quarter ended September 30, 2013. Prison Services comprised nearly all of the Other Operations segment revenue and results of operations. Consequently, with the cessation of our Prison Services business and based on the segment accounting guidance, we concluded that we operate as one segment as of the quarter ended June 30, 2013. As required by the authoritative guidance for segment presentation, segment results of operations have been retrospectively adjusted to reflect this change for all periods presented.
Prison Services Contract
We previously provided telephone service to inmates incarcerated at facilities operated by the Illinois Department of Corrections and to certain county jails. On June 27, 2012, the Illinois Department of Central Management Services announced its intent to replace us as the provider of those services with a competitor. Although we challenged our competitor’s bid and the State’s decision to accept that bid in a variety of different forums, during the quarter ended March 31, 2013, the process of transitioning these services to another service provider was completed. All related assets have been assessed for recoverability in light of this change and we determined that no impairment was necessary. During 2012, the prison services contract comprised 5% of consolidated operating revenues and approximately 2% of consolidated operating income, excluding financing and other transaction fees.
Discontinued Operations
In September 2013, we completed the sale of the assets and contractual rights used to provide communications services to inmates in thirteen county jails located in Illinois for a total purchase price of $2.5 million. In accordance with the Financial Accounting Standards Board (“FASB”) Accounting Standards Codification (“ASC”) 205-20, “Discontinued Operations”, the financial results of the prison services business have been reported as a discontinued operation in our consolidated financial statements for all periods presented. For a more complete discussion of the transaction, refer to Note 3 to the Consolidated Financial Statements.
SureWest Merger
We completed the merger with SureWest Communications on July 2, 2012. SureWest Communications’ results of operations are included within our results following the acquisition date. During the quarter ended June 30, 2013 we finalized the purchase price allocation. For a more complete discussion of the transaction, refer to Note 3 to the Consolidated Financial Statements.
Available Information
Our Annual Reports on Form 10-K, Quarterly Reports on Form 10-Q, Current Reports on Form 8-K and amendments to reports filed or furnished pursuant to Sections 13(a) or 15(d) of the Securities Exchange Act of 1934, as amended, are available free of charge on our web sitewebsite at www.consolidated.com, as soon as reasonably practicable after we electronically file such material with, or furnish it to, the Securities and Exchange Commission (“SEC”).SEC. Copies are also available free of charge upon request to Consolidated Communications, 121 S. 17th St, Mattoon, IL 61938, Attn: Vice President Investor Relations and Treasurer.Treasurer, 121 S. 17th Street, Mattoon, Illinois 61938. Our website also contains copies of our Corporate Governance Guidelines,Principles, Code of Business Conduct and Ethics and charter of each committee of our Board of Directors. The information found on our web sitewebsite is not part of this report or any other report we file with or furnish to the SEC. The public may read and copy any materials we file with the SEC at the SEC’s Public Reference Room at 100 F Street, NE, Washington, DC 20549 on official business days during the hours of 10:00 am to 3:00 pm. The public may obtain information on the operation of the Public Reference Room by calling the SEC at 1-800-SEC-0330.
2
Table of Contents
The SEC maintains an Internet site that contains reports, proxy and information statements and other information regarding our filings at http://www.sec.gov.
Description of Our Business
We are an established telecommunicationsintegrated communications services company providingthat operates as both an Incumbent Local Exchange Carrier (“ILEC”) and a wide rangeCompetitive Local Exchange Carrier (“CLEC”) dependent upon the territory served. We provide an array of telecommunications services to residentialin consumer, commercial and business customerscarrier channels in six states. We offer a wide range of telecommunications services,11 states, including local and long-distance service, high-speed broadband Internet access, video services, VOIP,Voice over Internet Protocol (“VoIP”), custom calling features, private line services, carrier grade access services, network capacity services over our regional fiber optic networks, data center and managed services, directory publishing, CLEC servicesequipment sales and equipment sales.cloud data services. The geographic areas we serve are characterized by a balanced mix of growing suburban areas and stable, rural territories.
We generate the majority of our consolidated operating revenuesrevenue primarily from subscriptions to our video, data and transport services (collectively “broadband services”) to business and residential customers. Commercial and carrier services represent the largest source of our operating revenues and are expected to be the primary driver of our growth in
the future. We continue to focus on commercial and broadband growth opportunities and are continually expanding our commercial product offerings for both small and large businesses to capitalize on industry technological advances. We can leverage our fiber optic networks and tailor our services for business customers by developing solutions to fit their specific needs. We provide services to a wide range of commercial customers from sole proprietors and other small businesses to multi-location corporations and telecommunications carriers. Our business suite of services includes local and long-distance calling plans, hosted voice videoservices using cloud network servers, the added capacity for multiple phone lines, scalable broadband Internet, online back-up and business directory listings. In addition, we recently launched a suite of cloud services and an enhanced hosted voice product that increases efficiency and enables greater scalability and reliability for businesses.
For larger businesses, we offer data services including dedicated Internet access through our Metro Ethernet network. Wide Area Network (“broadband services”WAN”) products include point-to-point and multi-point deployments from 2.5 Mbps to residential and10 Gbps, accommodating the growth patterns of our business customers. Revenues increased $123.7 million during 2013 comparedOur data centers provide redundant, scalable bandwidth over a self-healing fiber-optic backbone that is protected by uninterrupted power supplies and generator back-ups with direct connection to 2012, primarily from the SureWest acquisitionbroadband. We also offer wholesale services to regional and growth in data, videonational interexchange and Internet connections. We expect our broadband service revenueswireless carriers, including cellular backhaul, dark fiber and other fiber-based transport solutions with speeds up to continue to grow as consumer and business demands for data based services increase.100 Gbps.
We market our services to our residential and business customers either individually or as a bundled package. Our “triple play” bundle includes our voice, video and data services. As the market demands for bandwidth continue to increase as a result of December 31, 2013,consumer trends toward increased Internet usage, our videocontinued focus is on enhancing product and service was availableofferings, such as our progressively increasing consumer data speeds. We offer data speeds of up to approximately 531,000 homes1 Gbps in select markets. Where 1 Gbps speeds are not yet offered, the markets we serve, with an approximate 21% penetration rate.maximum broadband speed is 100 Mbps, depending on the geographic market availability. As of December 31, 2013,2016, approximately 28% of the homes in the areas we had approximately 110,613 video subscribers, a 4% increaseserve subscribe to our data service. Our exceptional consumer broadband speed allows us to continue to meet the needs of our customers and the demand for higher speed resulting from 2012. During 2013, we launchedthe growing trend of over-the-top (“OTT”) content viewing. The availability of 1 Gbps data speed also complements our wireless home networking (“Wi-Fi”) that supports our TV Everywhere whichservice and allows our subscribers to watch their favorite programs at home or away on a computer, smartphone or tablet. Data and Internet connections continue to increase as a result of enhanced product and service offerings, such as our consumer VOIP service and data speeds of up to 50 megabits per second, depending on the geographic market availability. As of December 31, 2013, approximately 30% of the homes in the areas we serve subscribe to our data service. Our voice services provide local and long-distance calling and other features such as hosted voice services using cloud network servers, a business directory listing and the added capacity for multiple phone lines are made available to our business voice customers. For our small to medium sized business customers, we also offer metro Ethernet network services and wireless backhaul services.
A discussion of factors potentially affecting our operations is set forth in Part I – Item 1A – “Risk Factors” in Item 1A,, which is incorporated herein by reference.
Key Operating Statistics
| | As of December 31, | |
| | 2013 | | 2012 | | 2011 | |
ILEC access lines | | | | | | | |
Residential | | 147,247 | | 153,855 | | 137,179 | |
Business | | 109,558 | | 114,742 | | 90,813 | |
Total | | 256,805 | | 268,597 | | 227,992 | |
| | | | | | | |
Voice connections (1) | | | | | | | |
Residential | | 73,219 | | 78,811 | | 2,388 | |
Business | | 50,214 | | 50,918 | | 52,424 | |
Total | | 123,433 | | 129,729 | | 54,812 | |
| | | | | | | |
Data and internet connections (2) | | 255,239 | | 247,633 | | 134,129 | |
Video connections (2) | | 110,613 | | 106,137 | | 34,356 | |
Total connections | | 746,090 | | 752,096 | | 451,289 | |
| | | | | | | |
| | As of December 31, | |
| | 2016 | | 2015 | | 2014 | |
Consumer customers | | 253,203 | | 268,934 | | 277,753 | |
| | | | | | | |
Voice connections | | 457,315 | | 482,735 | | 503,120 | |
Data connections | | 473,403 | | 456,100 | | 443,489 | |
Video connections | | 106,343 | | 117,882 | | 124,229 | |
Total connections | | 1,037,061 | | 1,056,717 | | 1,070,838 | |
(1)Voice connections include voice lines outside the Incumbent Local Exchange Carrier (“ILEC”) service areas and Voice-over-IP inside the ILEC service areas.
(2)These connections include both residential and business (excluding SureWest business metrics) for services both inside and outside the ILEC service areas.
3
Sources of Revenue
The following table summarizes our sources of revenue for the last three fiscal years:
| | | | | | | | | | | | | | | | |
| | 2016 | | 2015 | | 2014 | |
| | | | | % of | | | | | % of | | | | | % of | |
(In millions, except for percentages) | | $ | | Revenues | | $ | | Revenues | | $ | | Revenues | |
Commercial and carrier: | | | | | | | | | | | | | | | | |
Data and transport services (includes VoIP) | | $ | 196.7 | | 26.5 | % | $ | 187.5 | | 24.1 | % | $ | 123.0 | | 19.4 | % |
Voice services | | | 99.8 | | 13.4 | | | 103.0 | | 13.3 | | | 92.6 | | 14.6 | |
Other | | | 12.5 | | 1.7 | | | 12.3 | | 1.6 | | | 11.5 | | 1.8 | |
| | | 309.0 | | 41.6 | | | 302.8 | | 39.0 | | | 227.1 | | 35.8 | |
Consumer: | | | | | | | | | | | | | | | | |
Broadband (VoIP, data and video) | | | 209.9 | | 28.2 | | | 213.6 | | 27.5 | | | 200.8 | | 31.6 | |
Voice services | | | 55.3 | | 7.4 | | | 60.6 | | 7.8 | | | 60.2 | | 9.5 | |
| | | 265.2 | | 35.6 | | | 274.2 | | 35.3 | | | 261.0 | | 41.1 | |
| | | | | | | | | | | | | | | | |
Equipment sales and service | | | 43.1 | | 5.8 | | | 55.0 | | 7.1 | | | 10.0 | | 1.5 | |
Subsidies | | | 48.3 | | 6.5 | | | 56.3 | | 7.3 | | | 53.2 | | 8.4 | |
Network access | | | 63.8 | | 8.6 | | | 69.7 | | 9.0 | | | 70.2 | | 11.0 | |
Other products and services | | | 13.8 | | 1.9 | | | 17.7 | | 2.3 | | | 14.2 | | 2.2 | |
Total operating revenues | | $ | 743.2 | | 100.0 | % | $ | 775.7 | | 100.0 | % | $ | 635.7 | | 100.0 | % |
The comparability of our consolidated results of operations and key operating statistics was impacted by the SureWestEnventis acquisition whichthat closed on July 2, 2012,October 16, 2014, as described above. SureWest’sEnventis’ results are included in our consolidated financial statements as of the date of the acquisition. The acquisition of SureWest provides additional diversification of the Company’s revenues and cash flows both geographically and by service type.
Sources of Revenue
The following table summarizes our sources of revenue for the last three fiscal years:
| | 2013 | | 2012 | | 2011 | |
(In millions, except for percentages) | | $ | | % of
Revenues | | $ | | % of
Revenues | | $ | | % of
Revenues | |
Local calling services | | 106.5 | | 17.7 | | 93.5 | | 19.6 | | 84.2 | | 24.1 | |
Network access services | | 112.4 | | 18.7 | | 98.6 | | 20.6 | | 80.5 | | 23.1 | |
Video, data and Internet services | | 270.0 | | 44.9 | | 176.7 | | 37.0 | | 83.0 | | 23.8 | |
Subsidies | | 52.0 | | 8.6 | | 49.3 | | 10.3 | | 45.4 | | 13.0 | |
Long-distance services | | 19.3 | | 3.2 | | 17.3 | | 3.6 | | 15.9 | | 4.6 | |
Other services | | 41.4 | | 6.9 | | 42.5 | | 8.9 | | 40.0 | | 11.4 | |
Total operating revenue | | 601.6 | | 100.0 | | 477.9 | | 100.0 | | 349.0 | | 100.0 | |
All telecommunications providers continue to face increased competition as a result of technology changes and industry legislative and regulatory developments. In recent years, changesdevelopments in consumer demand and our acquisition of SureWest have provided us with significantthe industry. We continue to focus on commercial growth opportunities and are continually expanding our commercial product offerings for both small and large businesses to capitalize on industry technological advances. In addition, we expect our video, data and Internet services. As indicated by the table above, the percentage of operating revenues we receive from our video, data and Internetbroadband services has nearly doubled since 2011. We anticipate that video, data and Internet revenues willrevenue to continue to grow as consumer and commercial demands for data based services increase, as a total percentage of operating revenues andwhich will offset, in part, the anticipated decline in traditional telephonevoice services which continue to be impacted by the ongoing industry-wide declinereduction in residential access lines.
Local calling servicesCommercial and Carrier
Local calling services include traditional wireline telephone serviceData and other basic services. Our service plans include options for voicemail and other enhanced custom calling features including caller ID, call forwarding and call waiting.Transport Services are charged at a fixed monthly rate or can be bundled with selected services at a discounted rate.
We offer private lines that provide direct connections between two or more local locations at flat monthly rates. We provide a variety of business communication services to small, medium and large business customers, including many services over our advanced fiber network. The services we offer include scalable high speed broadband Internet access and VoIP phone services, which range from basic service plans to virtual hosted VOIPsystems. Our hosted VoIP package which utilizes aour soft switchswitching technology and allows the customerenables our customers to have the flexibility of utilizingemploying new telephone technologyadvances and features without investing in a new telephone system. The package bundles local service, calling features, Internet protocol (“IP”) business telephones and unified messaging, which integrates multiple messaging technologies into a single system whichand allows the customer to receive and listen to voice messages through email.
Network accessIn addition to Internet and VoIP services, we also offer a variety of commercial data connectivity services in select markets including private line, WAN and Ethernet services to provide high bandwidth connectivity across point-to-point and multiple site networks. Networking services are available at a variety of speeds up to 10 Gbps. Data center and disaster recovery solutions also provide a reliable and local colocation option for commercial customers. We have also recently launched a suite of cloud-based services, which includes a hosted unified communications solution that replaces the customer’s on-site phone systems and data networks, managed network security services and data protection services.
Network access service revenues include interstateWe also offer wholesale services to regional and intrastate switched access revenuenational interexchange and network special access services. Revenue from network access charges are received from long-distancewireless carriers, including cellular backhaul, dark fiber and other carriers for customers originating or terminating calls from/fiber transport solutions with speeds up to our local exchanges. These services allow customers to make or receive calls in our service area. Our long-distance customers typically pay a monthly flat-rate fee for this service. In addition, other carriers pay network access charges for their originating or terminating calls within our service areas. These charges also apply to private lines that connect a customer in one of our service areas to a location outside of our service areas. Through these dedicated lines customers can transmit data and access external data networks. We also provide cell site backhaul services to wireless carriers.100 Gbps. The demand for backhaul services continues to grow as wireless carriers are faced with escalating consumer and businesscommercial demands for wireless data. Certain
Video, Data and Internet servicesVoice Services
Video, dataVoice services include basic local phone and Internetlong-distance service packages for business customers. The plans include options for voicemail, conference calling, linking multiple office locations and other custom calling features such as caller ID, call forwarding, speed dialing and call waiting. Services can be charged at a fixed monthly rate, a measured rate or can be bundled with selected services at a discounted rate.
Consumer
Broadband Services
Broadband services include revenue from residential and business customers for subscriptions to our VoIP, data and video and data products. Our data service can provide high-speedWe offer high speed Internet access at various symmetrical speeds of up to 50 megabits per second (“Mbps”),1 Gbps, depending on the nature of the network facilities that are available, the level of service selected and the geographic market availability.location. Our data service plans also include wireless internet access, email and internet security and protection. Our VoIP digital phone service is also available in certain markets as an alternative to the traditional telephone line. We also offer a variety of data connectivity services in
4
Table of Contents
select markets, including Ethernet services capable of connecting multiple connections over our coppervoice service plans with customizable calling features and fiber-based networks, virtual hosting services, Wi-Fi and colocation services.
voicemail. Depending on geographic market availability, our video services range from limited basic service to advanced digital television, which includes several plans each with hundreds of local, national and music channels including premium and pay-per-view channels as well as video on demandon-demand service. Certain subscriberscustomers may also subscribe to our advanced video services, which consist of high-definition television, digital video recorders (“DVR”) and/or a whole home DVR. Our Whole Home DVR allows customers the ability to watch recorded shows on any television in the house, record multiple shows at one time and utilize an intuitive on-screen guide and user interface. Video subscribers also have access to our TV Everywhere service, which allows subscriber access to full episodes of available shows, movies and live streams using a computer or mobile device.
Our digitalVoice Services
We offer several different basic local phone service including VOIP, is also available in certain markets as an alternative to the traditional telephone line. We offer multiple voice service plans that provide for either usage based or unlimitedpackages and long-distance calling plans, including unlimited flat-rate calling plans. The plans include options for long distance, voice mailvoicemail and other custom calling features such as caller ID, call forwarding and call blocking, abbreviated dialingwaiting. The number of local access lines in service directly affects the recurring revenue we generate from end users and conferencing.continues to be impacted by the industry-wide decline in access lines. We expect to continue to experience modest erosion in voice connections due to competition from alternative technologies, including our own competing VoIP product.
AlthoughEquipment Sales and Service
As an equipment integrator, we expectoffered network design, implementation and support services, including maintenance contracts, in order to provide integrated communication solutions for our revenues from video, datacustomers. We sold telecommunications equipment, such as key, Private Branch Exchange (“PBX”), IP-based telephone systems and Internetother sophisticated hardware solutions, and offered support services to grow substantially, these products typically generate lower margins thanmedium and large business customers. Through our traditional wireline business. Asacquisition of Enventis in 2014, we obtained a leading market relationship with Cisco Systems, Inc. and, as a result, were an accredited Master Level Unified Communications and Gold Certified Cisco Partner providing equipment solutions and support for business customers. Our strategic relationship with Cisco as we replace traditional wireline revenuethe supplier allowed us to deploy a wide range of collaboration, data center and network technology solutions. We earned Cisco’s Master Cloud Builder Specialization and received the Data Center Interconnect designation. We maintained numerous Cisco specializations and authorizations, as well as partner relationships with revenue from video, dataEMC, NetApp, VMware and Internet services,other industry-leading vendors in order to provide integrated communication solutions that best fit our margins may decline.customers’ needs.
SubsidiesIn December 2016, we completed the sale of our Enterprise Services equipment and IT Services business (“EIS”) to ePlus Technology inc. (“ePlus”). As part of the transaction, we entered into a Co-Marketing Agreement with ePlus, a nationwide systems integrator of technology solutions, to cross-sell both broadband network services and IT services. The strategic partnership will provide our business customers access to a broader suite of IT solutions, and will also provide ePlus customers access to Consolidated’s business network services.
We receive
Subsidies
Subsidies consist of both federal and state subsidies, which are designed to promote widely available, quality telephone service at affordable prices in rural areas. Subsidies come from poolsare funded by end user surcharges to which we and other telecommunications providers, including local, long-distance and wireless carriers, contribute on a monthly basis. Subsidies are allocated and distributed to participating carriers monthly based upon their respective costs for providing local service. Similar to access charges, subsidies are regulated by federal and state regulatory commissions. See Part I – Item 1 -– “Regulatory Environment” below and Item 1A – “Risk Factors – Regulatory Risks”Risks Related to the Regulation of Our Business” for additional informationfurther discussion regarding the subsidies we receive.receive”.
Long-distance servicesNetwork Access Services
Long-distanceNetwork access services include traditional domesticinterstate and international long distance which enablesintrastate switched access revenue, network special access services and end user access. Switched access revenue includes access services to other communications carriers to terminate or originate long-distance calls on our network. Special access circuits provide dedicated lines and trunks to business customers and interexchange carriers. Certain of our network access revenues are based on rates set or approved by federal and state regulatory commissions or as directed by law that are subject to make calls that terminate outside their local calling area. These services also include calling cards, toll free calls and conference calling. We offer a variety of long-distance plans, including unlimited flat-rate calling plans and offer a combination of subscription and usage fees.
Other serviceschange at any time.
Other Products and Services
Other products and services include revenues from telephone directory publishing, wholesale transport services on our fiber-optic network in Texas,video advertising and billing and collection services, inside wiring service and maintenance and equipment sales (“Business Systems”). Business Systems sells and supports telecommunications equipment, such as key, private branch exchange (“PBX”) and IP-based telephone systems, to business customers. We are an Avaya and ShoreTel distributor.support services.
No customer accounted for more than 10% of our consolidated operating revenues during the years ended December 31, 2016, 2015 and 2014.
Wireless partnershipsPartnerships
In addition to our core business, we also derive a significant portion of our cash flow and earnings from investments in five wireless partnerships. Wireless partnership investment income is included as a component of other income in the consolidated statements of income.operations. Our wireless partnership investment consistedconsists of five cellular partnerships: GTE Mobilnet of South Texas Limited Partnership (“Mobilnet South Partnership”), GTE Mobilnet of Texas RSA #17 Limited Partnership (“RSA #17”), Pittsburgh SMSA Limited Partnership (“Pittsburgh SMSA”), Pennsylvania RSA No. 6(I) Limited Partnership (“RSA 6(I)”) and Pennsylvania RSA No. 6(II) Limited Partnership (“RSA 6(II)”).
We own 2.34% of the Mobilnet South Partnership. The principal activity of the Mobilnet South Partnership is providing cellular service in the Houston, Galveston and Beaumont, Texas metropolitan areas. Because we have a minor ownership interest and cannot influence operations, we account for this investment using the cost basis.method. Income is recognized only upon cash distributions of our proportionate earnings in the partnership.
We own 20.51% of GTE Mobilnet of Texas RSA #17, which serves areas in and around Conroe, Texas. In December 2012, we purchased additional ownership interest for $6.7 million which increased our ownership from 17.02% to 20.51%. Because we have some influence over the operating and financial policies of this partnership, we account for the investment under the equity method, recognizing income on our proportionate share of earnings. Cash distributions are recorded as a reduction in our investment.
5
Table of Contents
San Antonio MTA, L.P., a wholly owned partnership of Cellco Partnership (doing business as Verizon Wireless), is the general partner for both the Mobilnet South Partnership and GTE Mobilnet of Texas RSA #17.
We own 3.6%3.60% of Pittsburgh SMSA, 16.6725%16.67% of Pennsylvania RSA 6(I) and 23.67% of Pennsylvania RSA 6(II) wireless partnerships,, all of which are majority owned and operated by Verizon Wireless. These partnerships cover territories that almost entirely overlap the markets served by our Pennsylvania ILEC and CLEC operations. Because of our limited influence over Pittsburgh SMSA, we account for the investment using the cost basis. The Pennsylvaniamethod. RSA 6(I) and RSA 6(II) partnerships are accounted for under the equity method.
For the years ended December 31, 2013, 20122016, 2015 and 2011,2014, we recognized income of $37.5$32.6 million, $30.2$37.0 million and $27.1$34.4 million, respectively, and received cash distributions of $34.8$32.1 million, $29.1$45.3 million and $28.3$34.6 million, respectively, from these wireless partnerships.
Employees
AtAs of December 31, 2013,2016, we employed approximately 1,5211,676 employees, including part-time employees. We also use temporary employees in the normal course of our business.
Approximately 28%20% of our employees were covered by collective bargaining agreements as of December 31, 2013.2016. For a more detailed discussion regarding how the collective bargaining agreements could affect our business, see Part I - Item 1A – “RiskRisk Factors – Risks“Risks Relating to Our Business”.
Customers and Markets
Our services are available to customers in six states: Illinois, Texas, Pennsylvania, California, Kansas and Missouri. The geographic areas we serve are characterized by a balanced mix of growing suburban areas and stable, rural territories. The acquisition of SureWest in 2012 further diversifies our operating revenues and cash flows across multiple business lines and markets.
Our Illinois local telephone markets consist of 35 geographically contiguous exchanges serving predominantly small towns and rural areas. We cover an area of 2,681 square miles, primarily in five central Illinois counties: Coles, Christian, Montgomery, Effingham and Shelby. As of December 31, 2013, we had total connections of 103,717, which included 56,757 local access lines (averaging 21.2 lines per square mile). Approximately 61.3% of our Illinois local access lines serve residential customers, with the remainder serving business customers. Our Illinois business customers are predominantly small retail, commercial, light manufacturing and service industry businesses, as well as universities and hospitals.
Our 21 exchanges in Texas serve three principal geographic markets—Lufkin, Conroe and Katy—in a 2,054 square mile area. This territory had 114,090 local access lines (averaging 55.5 lines per square mile) and 70,731 data connections as of December 31, 2013. Approximately 67.0% of our Texas local access lines serve residential customers, with the remainder serving business customers. Our Texas business customers predominately operate in the manufacturing and retail industries; our largest business customers are hospitals, local governments and school districts. In 2014, we will expand our commercial services into the greater Dallas/Fort Worth market utilizing our existing 30,000 miles of carrier-class fiber network in this area. This network previously was used to serve our wholesale and carrier customers. Beginning in 2014, we will begin offering fiber based services including dedicated internet access, wide area networks and hosted iPBX to commercial customers in this market.
The Lufkin market is centered primarily in Angelina County in east Texas, approximately 120 miles northeast of Houston, and extends into three neighboring counties. The Conroe market is located primarily in Montgomery County and is centered approximately 40 miles north of Houston. Parts of the Conroe operating territory extend south to within 28 miles of downtown Houston, including parts of the affluent suburb of The Woodlands. The Katy market is located in parts of Fort Bend, Harris, Waller and Brazoria Counties and is centered approximately 30 miles west of downtown Houston along the busy and expanding I-10 corridor. Most of the Katy market is considered part of metropolitan Houston.
Our Lufkin, Texas and central Illinois markets have experienced only nominal population growth over the past decade. These low growth, low customer density markets, along with the predominantly rural residential character of these areas, have limited the number of product offerings from potential competitors in these areas. The Conroe and Katy markets have experienced above-average population and business employment growth over the past decade as compared to the remainder of Texas and the United States as a whole.
6
Table of Contents
The Pennsylvania ILEC territory consists of nine exchanges and covers 285 square miles, serving portions of Allegheny, Armstrong, Butler and Westmoreland Counties in western Pennsylvania. The southernmost point of the ILEC territory is 12 miles north of the city of Pittsburgh. As of December 31, 2013, we had 43,555 local access lines in this territory (averaging 152.8 lines per square mile). The local access lines in this territory consist of approximately 54.7% business customers and 45.3% residential customers. The western Pennsylvania area has experienced below average population growth in the past decade as compared to the remainder of the United States as a whole. The CLEC operations expand south to serve the city of Pittsburgh and north to serve the city of Butler and surrounding areas. Business customers consist primarily of small to mid-sized businesses, educational institutions, and healthcare facilities.
Our California ILEC territory consists of approximately 83 square miles, covering Roseville and Citrus Heights, California and adjacent areas in Placer and Sacramento Counties. As of December 31, 2013, we had 42,403 local access lines (averaging 510.9 lines per square mile), of which 61.6% consisted of business customers and 38.4% residential customers. This territory also included 62,692 data connections and 30,271 video connections at December 31, 2013. Our CLEC operations expand both north and south to serve primarily the greater Sacramento region. The California territory has experienced rapid growth during the past two decades, but the pace of growth has slowed in recent years as the area has become more developed. The rapid growth also attracted new competitors to the area. In this market, our business customers primarily include financial institutions, healthcare, manufacturing, local governments and school districts.
We also serve as a competitive provider to residential and business customers in the greater Kansas City, Kansas and Missouri areas. A significant portion of the market area is in Johnson County, Kansas, which includes the cities of Lenexa, Overland Park and Shawnee. The Kansas City market has favorable market demographics and has experienced growth in its metropolitan and suburban communities in recent years which has resulted in tremendous business opportunities in this market. Johnson County has the highest median household income and highest per-capita income in Kansas and is among the most affluent in the United States. Business customers consist primarily of small to medium sized businesses and government entities. As of December 31, 2013, the Kansas City territory had 109,162 voice, video and data connections, or 15% of the Company’s total connections.
Sales and Marketing
The key components of our overall marketing strategy include:
·Organizing our sales and marketing activities around our consumer, enterprise, and carrier customers;
| · | | Organizing our sales and marketing activities around our consumer, commercial and carrier customers; |
·Positioning ourselves as a single point of contact for our customers’ communications needs;
| · | | Positioning ourselves as a single point of contact for our customers’ communications needs; |
·Providing customers with a broad array of voice, data and video services and bundling these services whenever possible;
| · | | Providing customers with a broad array of voice, data and video services and bundling these services whenever possible; |
·Providing excellent customer service, including 24/7 centralized customer support to coordinate installation of new services, repair and maintenance functions;
| · | | Identifying and broadening our commercial customer needs by developing solutions and providing integrated service offerings; |
·Developing and delivering new services to meet evolving customer needs and market demands; and
| · | | Providing excellent customer service, including 24/7 centralized customer support to coordinate installation of new services, repair and maintenance functions; |
| · | | Developing and delivering new services to meet evolving customer needs and market demands; and |
·Leveraging history and brand recognition across all market areas.
| · | | Leveraging history and brand recognition across all market areas. |
We currently offer our services through call centers, our website, communication centers and commissioned sales representatives. Our customer service call centers and dedicated sales teams serve as the primary sales channels for consumer, business enterprise customers and carrier services. Our sales efforts are supported by direct mail, bill inserts, newspaper, radio and television advertising, public relations activities, community events and website promotions.
We market our services both individually and as bundled services, including our triple-play offering of voice, data and video services. By bundling our service offerings, we are able to offer and sell a more complete and competitive package of services, which we believe simultaneously increases our average revenue per user (“ARPU”) and adds value for the consumer. We also believe that bundling leads to increased customer loyalty and retention.
Network Architecture and Technology
We have made significant investments in our technologically advanced telecommunications networks.networks and continue to enhance and expand our network by deploying technologies to provide additional capacity to our customers. As a result, we are able to deliver high-quality, reliable data, video data and voice services in allthe markets we serve. Our wide-ranging network and extensive use of fiber provide an easy reach into existing and new areas. By bringing the fiber
7
Table of Contents
network closer to the customer premises, we can increase our service offerings, quality and bandwidth services. Our existing network enables us to efficiently respond and adapt to changes in technology and is capable of supporting the rising customer demand for bandwidth in order to support the growing amount of wireless data devices in the home.our customers’ homes and businesses.
Our networks are supported by advanced 100% digital switches, with a fiber network connecting in all but one of our exchanges. These switches provide all of our local telephone customers with access to custom calling features, value-added services and dial-up Internet access. We continue to enhance our copper network to increase bandwidth in order to provide additional products and services to our marketable homes. In addition to our copper plant enhancements, we have deployed fiber-optic cable extensively throughout our network, resulting in a 100% fiber backbone network that supports all of the inter-office and host-remote links, as well as the majority of business parks within our ILEC and CLEC service areas. In addition, this fiber infrastructure provides the connectivity required to provide video service, Internet and long-distance services to all Consolidated
residential and enterprisecommercial customers. Our fiber network utilizes fiber-to-the-home (“FTTH”) and fiber-to-the-node (“FTTN”) networks to offer bundled residential and commercial services.
As a result of our advanced networks, we provide data and video service in the markets we serve. We leverage our high definition head-end equipment to distribute content across our network allowing the Company to better manage costs of future channel additions and upgrades. As of December 31, 2013, video service was available to approximately 531,000 homes in our markets up from 524,019 at December 31, 2012. Our video subscriber base continues to grow and now totals 110,613 connections at December 31, 2013 as compared to 106,137 at December 31, 2012. We do not anticipate having to make any material capital upgrades to our network infrastructure in connection with the continued growth of our video product except for providing set-top boxes to future subscribers and additional high definition channel equipment.
In our CLEC markets, we operate fiber networks which we own or have entered into long-term leases for fiber network access. Our CLEC’s operateAt December 31, 2016, our fiber-optic network consisted of approximately 3,00014,160 route-miles, of fiber, which includes approximately 2,0004,565 miles of fiber network in Minnesota and surrounding areas, approximately 4,130 miles of fiber network in Texas, approximately 6001,800 route-miles of fiber-optic facilities in the Pittsburgh metropolitan area, approximately 3501,815 miles of fiber network in Illinois, approximately 1,085 route-miles of fiber optic facilities in California that cover large parts of the greater Sacramento metropolitan area and over 60765 route-miles of fiber optic facilities in Kansas City that service the greater Kansas City area, including both Kansas and Missouri. Our CLEC operations provide both residential and commercial services. Residential service includes VOIP, data and video service. ForIn 2014, we expanded our commercial services we sell competitive wholesale capacity oninto the greater Dallas/Fort Worth market, utilizing our existing carrier-class fiber network in this area. This network previously was used to otherserve our wholesale and carrier customers. With the expansion of the network, we began offering fiber based services including dedicated Internet access, wide area network services and hosted private branch exchange (iPBX) to commercial customers in this market.
Through our extensive fiber network, we are also able to support the increased demand on wireless carriers wireless providers, CLECs and large commercial customers. We also provide carrier hotel space andfor data center space in the various markets we serve.bandwidth. In all the markets we serve, we have launched initiatives to support fiber backhaul services to cell sites. As of December 31, 2013,2016, we had 7881,271 cell sites under contract with 6981,119 connected and 90152 scheduled for completion in 2014.2017.
Business Strategies
Diversify revenues and increase revenues per customer
We continue to transform our business and diversify our revenue streams as we adapt to changes in the regulatory environment and advances in technology. As a result of acquisitions, our wireless partnerships and increases in the consumer and commercial demand for data services, we continue to reduce our reliance on subsidies and access revenue. Utilizing our existing network and strategic network expansion initiatives, we are able to acquire and serve a more diversified business customer base and create new long-term revenue streams such as wireless carrier backhaul services. We will continue to focus on growing our broadband and commercial services through the expansion and extension of our fiber network to communities and corridors near our primary fiber routes where we believe we can offer competitive services and increase market share.
We also continue to focus on increasing our revenue per customer, primarily by improving our data and video market penetration, by increasing the sale of other value-added services and by encouraging customers to subscribe to our service bundles.
Improve operating efficiency
We continue to seek to improve operating efficiency through technology, better practices and procedures and through cost containment measures. Our current focus is on the further integration of SureWest into our existing operations and creating operating synergies for the combined company. In recent years, we have made significant operational improvements in our business through the centralization of work groups, processes and systems, which has resulted in significant cost savings and reductions in headcount. Because of these efficiencies, we are better able to deliver a consistent customer experience, service our customers in a more cost-effective manner and lower our
8
Table of Contents
cost structure. We continue to evaluate our operations in order to align our cost structure with operating revenues while continuing to launch new products and improve the overall customer experience.
Maintain capital expenditure discipline
Across all of our service territories, we have successfully managed capital expenditures to optimize returns through disciplined planning and targeted investment of capital. For example, investments in our networks allows significant flexibility to expand our commercial footprint, offer new service offerings and provide services in a cost-efficient manner while maintaining our reputation as a high-quality service provider. We will continue to invest in strategic growth initiatives to expand our fiber network to new markets and customers in order to optimize new business, backhaul and wholesale opportunities.
Pursue selective acquisitions
We have in the past taken, and expect to continue to take in the future, a disciplined approach in pursuing company acquisitions. When we evaluate potential transactions, important factors include:
·The quality of the network;
| · | | The quality of the network; |
·The ability to integrate the acquired company efficiently;
| · | | The ability to integrate the acquired company efficiently; |
·Significant potential operating synergies exist; and
| · | | Existence of significant potential operating synergies; and |
·The transaction will be cash flow accretive from day one.
| · | | The transaction will be cash flow accretive from day one. |
We believe all of the above criteria werewill be met in connection with our expected acquisition of SureWest CommunicationsFairPoint in 2012.2017. In the long term, we believe that this transaction giveswill give us additional scale and will better positionsposition us financially, strategically and competitively to pursue additional acquisitions.
Competition
The telecommunications industry is subject to extensive competition, andwhich has increased significantly in recent years. Technological advances have expanded the types and uses of services and products available. In addition, differences in the regulatory environment applicable to comparable alternative services have lowered costs for these competitors. As a result, we face heightened competition but also have new opportunities to grow our broadband business. Our competitors vary by market and may include other incumbent and competitive local telephone companies; cable operators offering video, data and VOIPVoIP products; wireless carriers; long distance providers; satellite companies; Internet service providers and in some cases new forms of providers who are able to offer a broad range of competitive services through software applications, requiring a small initial investment.services. We expect competition to remain a significant factor affecting our operating results and that the nature and extent of that competition will continue to increase. See Part I - Item 1A – “Risk Factors – Risks Relating to Our Business”.
Voice, data and video service
In recent years, competition in our incumbent service areas has increased significantly. Except for the traditional multichannel video delivery business, which requires significant capital investment to serve customers, the barriers to entry are not high and technology changes force rapid competitive adjustments. Depending on the market area, we compete against AT&T and a number of other carriers, as well as Comcast, Time Warner, Mediacom, Armstrong, Suddenlink and NewWave communications,Communications, in both the businesscommercial and residentialconsumer markets. Google also recently launched data and video services in a limited, but growing, number of service areas including the Kansas City market. Our competitors offer traditional telecommunications services as well as IP-based services and other emerging data-based services. Our competitors continue to add features and adopt aggressive pricing and packaging for services comparable to the services we offer.
We continue to face significant competition from wireless and other fiber data providers as the demand for substitute communication services, such as wireless phones and data devices, continues to increase. Customers are increasingly foregoing traditional telephone services and land-based Internet service and relying exclusively on wireless service. In addition, the expanded availability for free or lower cost services, such as video over the Internet, and complimentary Wi-Fi service in an increasing number of commercial venuesand other streaming devices has increased competition among other providers including online digital distributors for our video and data services.
In most cases, we have entered the cable television service markets as the operator of a second (or subsequent) cable system. Therefore, we face the challenge of drawing customers away from the incumbent cable service provider. Similarly, the possession of comparatively greater size and scale can give an incumbent cable competitor an advantage in both access to and pricing of the program content needed to operate a cable television business.
9
Table of Contents
Our competitors, in some cases, possess significantly greater size and scale than we do.
In order to meet the competition, we have responded in part by introducing new services and service bundles, offering services in convenient groupings with package discounts and billing advantages, providing excellent customer service and by continuing to invest in our network and business operations.
In our rural markets, services are more costly to provide than service in urban areas as a lower customer density necessitates higher capital expenditures on a per-customer basis. As a result, it generally is not economically viable for new entrants to overlap existing networks in rural territories. Despite the barriers to entry, rural telephone companies still face significant competition from wireless providers, cableand video providers and, to a lesser extent, competitive telephone companies.
Other competition
Our other lines of business are subject to substantial competition from local, regional and national competitors. In particular, our directory publishingwholesale and transport businesses operate inbusiness serves other interexchange carriers and we compete with a variety of service providers including incumbent and competitive markets. local telephone companies and other fiber data companies. For our business systems products, we compete with other equipment providers or value added resellers, network providers, incumbent and competitive local telephone companies and with cloud and data hosting service providers.
We expect that competition in all of our businesses will continue to intensify as new technologies and new services are offered.changes in consumer behavior continue to emerge.
Regulatory Environment
The following summary does not describe all existing and proposed legislation and regulations affecting the telecommunications industry. Regulation can change rapidly, and ongoing proceedings and hearings could alter the manner in which the telecommunications industry operates. We cannot predict the outcome of any of these developments, nor their potential impact on us. See Part I —Item 1A—“Risk– Item 1A – “Risk Factors—Regulatory Risks”Risks Related to the Regulation of Our Business”.
Overview
Our revenues, which include revenues from such telecommunications services as local telephone service, network access service and toll service, are subject to broad federal and/or state regulation and are derived from various sources, including:
| | | |
| | | Business and residential subscribers of basic exchange services; |
| | | Surcharges mandated by state commissions; |
| | | |
| | | Long-distance carriers for network access service; |
| | | Competitive access providers and commercial customers for network access service; and |
| | | |
| | | Support payments from federal or state programs. |
The telecommunications industry is subject to extensive federal, state and local regulation. Under the Telecommunications Act of 1996 (the “Telecommunications Act”), federal and state regulators share responsibility for implementing and enforcing statutes and regulations designed to encourage competition and to preserve and advance widely available, quality telephone service at affordable prices.
At the federal level, the Federal Communications Commission (“FCC”) generally exercises jurisdiction over facilities and services of local exchange carriers, such as our rural telephone companies, to the extent they are used to provide, originate or terminate interstate or international communications. The FCC has the authority to condition, modify, cancel, terminate or revoke our operating authority for failure to comply with applicable federal laws or FCC rules, regulations and policies. Fines or penalties also may be imposed for any of these violations.
State regulatory commissions generally exercise jurisdiction over carriers’ facilities and services to the extent they are used to provide, originate or terminate intrastate communications. In particular, state regulatory agencies have substantial oversight over interconnection and network access by competitors of our rural telephone companies. In addition, municipalities and other local government agencies regulate the public rights-of-way necessary to install and operate our networks. State regulators can sanction our rural telephone companies or revoke our certifications if we violate relevant laws or regulations.
Federal regulationRegulation
Our rural telephone companies and competitive local exchange companies must comply with the Communications Act of 1934, which requires, among other things, that telecommunications carriers offer services at just and reasonable rates and on non-discriminatory terms and conditions. The 1996 amendments to the Communications Act (contained in the Telecommunications Act discussed below) dramatically changed, and likely will continue to change, the landscape of the industry.
Removal of Entry Barriers
The central aim of the Telecommunications Act is to open local telecommunications markets to competition while enhancing universal service. Before the Telecommunications Act was enacted, many states limited the services that could be offered by a company competing with an incumbent telephone company. The Telecommunications Act preempts these state and local laws.
The Telecommunications Act imposes a number of interconnection and other requirements on all local communications providers. All telecommunications carriers have a duty to interconnect directly or indirectly with
10
Table of Contents
the facilities and equipment of other telecommunications carriers. Local exchange carriers, including our rural telephone companies, are required to:
| · | | Allow other carriers to resell their services; |
| · |
·
| Provide number portability where feasible; |
| · |
·
| Ensure dialing parity, meaning that consumers can choose their default local or long-distance telephone company without having to dial additional digits; |
| · |
·
| Ensure that competitors’ customers receive non-discriminatory access to telephone numbers, operator service, directory assistance and directory listings; |
| · |
·
| Afford competitors access to telephone poles, ducts, conduits and rights-of-way; and |
| · |
·
| Establish reciprocal compensation arrangements with other carriers for the transport and termination of telecommunications traffic. |
Furthermore, the Telecommunications Act imposes on incumbent telephone companies (other than rural telephone companies that maintain their so-called “rural exemption” as our subsidiaries do) additional obligations to:
| · | | Negotiate interconnection agreements with other carriers in good faith; |
| · |
·
| Interconnect their facilities and equipment with any requesting telecommunications carrier, at any technically feasible point, at non-discriminatory rates and on non-discriminatory terms and conditions; |
| · |
·
| Offer their retail services to other carriers for resale at discounted wholesale rates; |
| · |
·
| Provide reasonable notice of changes in the information necessary for transmission and routing of services over the incumbent telephone company’s facilities or in the information necessary for interoperability; and |
| · |
·
| Provide, at rates, terms and conditions that are just, reasonable and non-discriminatory, for the physical collocation of other carriers’ equipment necessary for interconnection or access to UNEsunbundled network elements (“UNEs”) at the premises of the incumbent telephone company. |
Access Charges
On November 18, 2011, the FCC released its comprehensive order on intercarrier compensation and universal service reform. For detailed discussion on the FCC order, see Part 1 – Item 1 - Regulatory Environment – FCCSee “FCC Access Charge and Universal Service Reform Order below.Order” below for detailed discussion on the FCC order.
A significant portion of our rural telephone companies’ revenues come from network access charges paid by long-distance and other carriers for using our companies’ local telephone facilities for originating or terminating calls within our service areas. The amount of network access revenues our rural telephone companies receive is based on rates set or approved by federal and state regulatory commissions, and these rates are subject to change at any time.
Intrastate network access charges are regulated by state commissions. NetworkThe FCC order on intercarrier compensation and universal service reform required state access charges in our Illinois market currentlyto mirror interstate access charges, for everything except local switching. Illinois law requires that ourand as of July 1, 2013, all switched intrastate access charges may not exceed ourmirror interstate access charges. Interstate and intrastate network access charges in our Pennsylvania market are also very similar. In contrast, as required by Texas regulators, our Texas rural telephone companies impose significantly higher network access charges for intrastate calls than for interstate calls.
The FCC regulates the prices we may charge for the use of our local telephone facilities to originate or terminate interstate and international calls. The FCC has structured these prices as a combination of flat monthly charges paid by customers and both usage-sensitive (per-minute) charges and flat monthly charges paid by long-distance or other carriers.
The FCC regulates interstate network access charges by imposing price caps on Regional Bell Operating Companies referred to as RBOC’s, and other large incumbent telephone companies. These price caps can be adjusted based on various formulas, such as inflation and productivity, and otherwise through regulatory proceedings. Incumbent telephone companies, such as our local telephone companies, may elect to base network access charges on price caps, but are not required to do so. All of our incumbent telephone companies have elected for price cap regulation.
11
Table of Contents
Historically, all of our rural telephone companies had elected not to apply federal price caps. Instead, they employed rate-of-return regulation for their network interstate access charges, whereby they earned a fixed return on their investment over and above operating costs. In December 2007, we filed a petition with the FCC seeking to permit our Illinois and Texas companies to convert to price cap regulation. Our petition was approved on May 6, 2008, and became effective on July 1, 2008. The conversion toWe believe that price cap regulation gives us greater pricing flexibility for interstate services, especially in the increasingly competitive special access segment. It also provides us with the potential to increase our net earnings by becoming more productive and introducing new services. On the other hand,As we were requiredhave acquired new properties, we have converted them to reduce our interstate access charges in Illinois significantly, and because our Illinois intrastate access charges mirror interstate rates, this conversion also resulted in lower intrastate revenues in Illinois. In addition, we now receive somewhat reduced subsidies from the interstate Universal Service Fund program.
Our Pennsylvania rural telephone company was an average schedule rate-of-return company. On March 1, 2012 we filed a petition for waiver to exit the National Exchange Carrier Association (“NECA”) settlement pools and tariff and become afederal price cap company. The FCC approved our waiver request on December 13, 2012. The exit from the NECA settlement pools and tariff was retroactive to July 1, 2012 and the price cap waiver was effective January 1, 2013.
Our California rural telephone company was historically a cost based rate of return company. In March 2013, we filed a waiver with the FCC to convert our California ILEC from a rate of return to a price cap company. The FCC granted the waiver with an effective date of our annual interstate access tariff filing of July 2, 2013. We expect certain adjustments to take place over eighteen months as a result of exiting the NECA pool, however we do not anticipate that they will be material to our consolidated financial statements or results of operations.regulation.
Traditionally, regulators have allowed network access rates for rural areas to be set higher than the actual cost of terminating or originating long-distance calls as an implicit means of subsidizing the high cost of providing local service in rural areas. Following a series of federal court decisions ruling that subsidies must be explicit rather than implicit, the FCC adopted reforms in 2001 that reduced per-minute network access charges and shifted a portion of cost recovery, which historically was imposed on long-distance carriers, to flat-rate, monthly subscriber line charges imposed on end-user customers. While the FCC also increased explicit subsidies to rural telephone companies through the Universal Service Fund, the aggregate amount of interstate network access charges paid by long-distance carriers to access providers, such as our rural telephone companies, has decreased and may continue to decrease.
Unlike the federal system, California, Illinois and IllinoisMinnesota do not provide an explicit subsidy in the form of a universal service fund for companies of our size. Therefore, while subsidies from the Federal Universal Service Fund offset the decrease in revenues resulting from the reduction in interstate network access rates, there was no corresponding offset for the decrease in revenues from the reduction in California orand Illinois intrastate network access rates. In Minnesota, Pennsylvania and Texas, the intrastate network access rate regime applicable to our rural telephone companies does not mirror the FCC regime, so the impact of the reforms was revenue neutral.
In recent years, carriers have become more aggressive in disputing the FCC’s interstate access charge rates and the application of access charges to their telecommunications traffic. We believe these disputes have increased, in part, because advances in technology have made it more difficult to determine the identity and jurisdiction of traffic, giving carriers an increased opportunity to challenge access costs for their traffic. For example, in September 2003, Vonage Holdings Corporation filed a petition with the FCC to preempt an order of the Minnesota Public Utilities Commission asserting jurisdiction over Vonage. The FCC determined that it was impossible to divide Vonage’s VOIPVoIP service into interstate and intrastate components without negating federal rules and policies. Accordingly, the FCC found it was an interstate service not subject to traditional state telephone regulation. While the FCC order did not specifically address whether intrastate access charges were applicable to Vonage’s VOIPVoIP service, the fact that the service was found to be solely interstate raises that concern. We cannot predict what other actions other long-distance carriers may take before the FCC or with their local exchange carriers, including our rural telephone companies, to challenge the applicability of access charges. Due to the increasing deployment of VOIPVoIP services and other technological changes, we believe these types of disputes and claims are likely to increase.
Unbundled Network Element Rules
The unbundling requirements have been some of the most controversial provisions of the Telecommunications Act. In its initial implementation of the law, the FCC generally required incumbent telephone companies to lease a wide range of UNE’s to CLECs. Those rules were designed to enable competitors to deliver services to their customers in
12
Table of Contents
combination with their existing networks or as recombined service offerings on an unbundled network elementa UNE platform commonly known as UNE-P,(“UNE-P”), which allowed competitors with no facilities of their own to purchase all the elements of local telephone service from the incumbent and resell them to customers. These unbundling requirements, and the duty to offer UNEs to competitors, imposed substantial costs on
the incumbent telephone companies and made it easier for customers to shift their business to other carriers. After a court challenge and a decision vacating portions of the UNE rules, the FCC issued revised rules in February 2005 that reinstated some unbundling requirements for incumbent telephone companies that are not protected by the rural exemption, but eliminated the UNE-P option and certain other unbundling requirements.
Each of the subsidiaries through which we operate our local telephone businesses is an incumbent telephone company and provides service in rural areas. As discussed above, the Telecommunications Act exempts rural telephone companies from certain of the more burdensome interconnection requirements. However, the Telecommunications Act provides that the rural exemption will cease to apply as to competing cable companies if and when the rural carrier introduces video services in a service area. In that event,area, in which case, a competing cable operator providing video programming and seeking to provide telecommunications services in the area may interconnect. Since each of our subsidiaries now providesprovide video services in their major service areas, the rural exemption no longer applies to cable company competitors in those service areas. Additionally, in Texas, the Public Utilities Commission of Texas (“PUCT”) has removed the rural exemption for our Texas subsidiaries with respect to telecommunications services furnished by Sprint Communications, L.P. on behalf of cable companies. Our ILEC subsidiaries in California, Illinois, Iowa, Minnesota and Pennsylvania still have the rural exemption in place. We believe the benefits of providing video services outweigh the loss of the rural exemptions to cable operators.
Under its current rules, the FCC has eliminated unbundling requirements for ILECs providing broadband services over fiber facilities, but continues to require unbundled access to mass-market narrowband loops. ILECs are no longer required to unbundle packet switching services. In addition, the FCC found that CLECs generally are not at a disadvantage at certain wire center locations in regard to high bandwidth (DS-1 and DS-3) loops, dark fiber loops and dedicated interoffice transport facilities. However, where a disadvantage persists, ILECs continue to be required to unbundle loops and transport facilities.
The FCC rules regarding the unbundling of network elements did not have an impact on our Illinois and Pennsylvania ILEC operations because these ILECs have rural exemptions. Our CLEC operations were not significantly affected by the 2005 changes to the UNE rules because they use their own switching for business customers that are served by high capacity loops. In July 2011, ourOur Pennsylvania CLEC renewed, for a three-year term,has a commercial agreement with Verizon that sets the terms of the pricing and provisioning of lines previously served utilizing UNE-P, including Verizon switching service. Less than 5% of our Pennsylvania CLEC access lines are provisioned utilizing this commercial arrangement. Although the costs for this arrangement will increase over time pursuant to the terms of the agreement, our relatively low use of Verizon’s switching and our ability to migrate some of the lines to alternative provisioning sources will limit the overall impact on our current cost structure. The CLEC has experienced moderate increases in the overall cost to provision high-capacity loops, interoffice transport facilities and dark fiber as a result of the FCC’s changes to unbundling requirements for those facilities. In December 2012, our subsidiary Consolidated Communications Enterprise Services, Inc. (“CCES”), entered into a 5-year wholesale special access agreement with AT&T, which moved us off of the UNE platform, reduced costcosts and gave us greater flexibility. This agreement applies to our CLEC operations in California, Illinois, Kansas, Missouri and Texas.
In 2006, Verizon filed a petition requesting that the FCC refrain from applying a number of regulations to the Verizon operations in six major metropolitan markets, including the Pittsburgh market area. Among other things, Verizon urged the FCC to forbear from applying loop and transport unbundling regulations, claiming there was sufficient competition in the Pittsburgh market to mitigate the need for these rules. The FCC denied Verizon’s petition in December 2007, but a federal court of appeals remanded this decision to the FCC for further analysis in 2009. If the FCC grants this remanded petition or any similar forbearance petitions in markets in which our CLEC operates, our cost to obtain access to loop and transport facilities would increase substantially for the 5%, or less, of the lines provisioned under the commercial agreement discussed above. In 2013, AT&T filed to amend its interstate access tariff with the FCC to eliminate the 5-year term discounts on its special access services. We filed a petition to reject AT&T’s filing, and on December 9, 2013, the FCC suspended AT&T’s filing for five months forpending investigation. The FCC has not yet issued a ruling in this matter.
13
Table of Contents
Promotion of Universal Service
In general, telecommunications service in rural areas is more costly to provide than service in urban areas. The lower customer density means that switching and other facilities serve fewer customers and loops are typically longer, requiring greater expenditures per customer to build and maintain. By supporting the high cost of operations in rural markets, Federal Universal Service Fund (“USF”) subsidies promote widely available, quality telephone service at affordable prices in rural
areas. We received $52.0Revenues from federal and certain states’ USFs totaled $48.4 million, $56.3 million and $49.3$53.2 million from the Federal Universal Service Fund, the Pennsylvania Universal Service Fundin 2016, 2015 and the Texas Universal Service Fund in 2013 and 2012,2014, respectively.
Federal Universal Service Fund subsidies are paid only to carriers that are designated eligible telecommunications carriers (“ETCs”), by a state commission. Each of our rural telephone companies have been designated an ETC. However, under FCC rules prior to 2008, competitors could obtain the same level of Federal Universal Service Fund subsidies as we do, per line served, if the applicable state regulator determined that granting such Federal Universal Service Fund subsidies to competitors would be in the public interest and the competitors offered and advertised certain services as required by the Telecommunications Act and the FCC. The Illinois Commerce Commission (“ILCC”) has granted several petitions for ETC designations, but to date no other ETCs are operating in our Illinois service area. We are not aware that any carriers have filed petitions to be designated an ETC in our Pennsylvania or Texas service areas. In May 2008, the FCC adopted an interim cap on payments to ETCs that are not incumbent telephone companies, based on the payments received by such companies in March 2008, which reduces (but does not eliminate) the incentive for ETCs to seek to compete against our rural telephone companies.
In order for ETCsan eligible telecommunications carrier (“ETC”) to receive high-cost support, the USF/Inter CarrierIntercarrier Compensation (“ICC”) Transformation Order requires states to certify on an annual basisannually that federal universal service high-costUSF support (“USF”) is used “onlyonly for the provision, maintenance and upgrading of facilities and services for which the support is intended”.intended. States, in turn, require that ETCs file certifications with them as the basis for the state filings with the FCC. Failure to meet the annual data and certification deadlines can result in reduced support to the ETC based on the length of the delay in certification. Each of our rural telephone companies has been designated as an ETC. For the calendar year 2013, the California state certification was due to be filed with the FCC on or before October 1, 2012. We were notified in January 2013 that SureWest Communications (“SureWest”) did not submit the required certification to the California Public Utilities Commission (“CPUC”) in time to be included in its October 1, 2012 submission to the FCC. OnIn January 24, 2013, we filed a certification with the CPUC and filed a petition with the FCC for a waiver of the filing deadline for the annual state certification. OnIn February 19, 2013, the CPUC filed a certification with the FCC with respect to SureWest. OnIn October 29, 2013, the Wireline Competition Bureau of the FCC denied our petition for a waiver of the annual certification deadline. OnIn November 26, 2013, we applied for a review of the decision made by the FCC staff by the full Commission. Management believes,is optimistic that the Company may prevail in its application to the Commission and receive USF funding for the period January 1, 2013 through June 30, 2013 based on the change in SureWest Telephone’sSureWest’s USF filing status caused by the change in the ownership of SureWest, Telephone, the lack of formal notice by the FCC regarding this change in filing status, the fact that SureWest Telephone had a previously-filedpreviously filed certification of compliance in effect with the FCC for the two quarters for which USF was withheld and the FCC’s past practice of granting waivers to accept late filings in similar situations, that the Company should prevail in its application to the Commission and receive USF funding for the period January 1, 2013, through June 30, 2013.situations. However, due to the denial of our petition by the Wireline Competition Bureau and the uncertainty of the collectability of the previously recognized revenues, in December 2013 we reversed the $3.0 million of previously recognized revenues until such time that the Commission has the opportunity to reach a decision on our application for review. In October 2016, the FCC denied our request for review and, in December 2016, we filed a petition for review of this denial with the United States Court of Appeals for the District of Columbia Circuit. The proceeding is currently pending.
FCC Access Charge and Universal Service Reform Order
In November 2011, the FCC released itsa comprehensive order on Access Chargeaccess charge and Universal Service Reformuniversal service reform (the “Order”). The access charge portion of the Order systematically reduces minute of use basedminute-of-use-based interstate access, intrastate access and reciprocal compensation rates over a six to nine year period to an end state of Bill and Keep,bill-and-keep, in which each carrier recovers the costs of its network through charges to its own subscribers, notrather than through intercarrier compensation. The reductions apply to terminating access rates and usage, whilewith originating access willto be addressed by the FCC in a later proceeding. To help with the transition to Bill and Keep,bill-and-keep, the FCC created two mechanisms. The first is an Access Recovery Mechanism (“ARM”) which is funded from the Connect America Fund (“CAF”), and the second is an Access Recovery Charge (“ARC”) which is recovered from the end users. The universal service portion of the Order shifts the national policy goalredirects support from voice serviceservices to broadband services, and is now called the CAF. InThe initial release of the Order mandated that, in order to receive CAF funding, carriers must agree to provide broadband capability to 100% of their customer base at a minimum speed of 4 Mbps downstream and 1Mbps upstream. The current high cost
14
Table of Contents
funding program is frozen at 2011 levels and will be eliminated upon development and implementation of a CAF census block model.
The Order has already been appealed by state commissions and carriers, including Consolidated. We filed our petition for review on January 18, 2012 and raised issues with the Order pertaining to access rates, universal service and transition provisions. In addition, several other carriers and associations have filed petitions for reconsideration at the FCC. This matter was heard by the U.S. Court of Appeals for the Tenth Circuit on November 19, 2013, however a decision is not expected before the third quarter of 2014.
In the Order, holding companies with price cap study areas and rate of return study areas are mandated to move alleach of their interstate rate of return study areas to price cap for universal service purposes only. The intercarrier compensation rules will keep rate of return study areas under the rate of return intercarrier compensation transitions plan and the price cap study areas under the price cap intercarrier compensation transition.
In 2012, the first phase of the CAF Phase I was implemented, freezingwhich froze USF support to a price cap holding companycarriers until the FCC implementsimplemented a broadband cost model to shift support from voice serviceservices to broadband. Initially, the second phase was anticipated to be implemented July 1, 2013. It is now anticipated that implementation will likely occur no sooner than July 2014. We anticipate that our revenues will be significantly impacted when the broadband cost model is implemented.services. The Order also modifiesmodified the methodology used for intercarrier compensation (“ICC”)ICC traffic exchanged between carriers. The initial phase of ICC reform was effective on July 1, 2012, beginning the transition of our terminating switched access rates to bill-and-keep over a seven year period. Asperiod, and as a result, of implementing the provisions of the Order, during 2013 our network access revenuesrevenue decreased approximately $1.8$1.7 million, compared to 2012.$1.3 million and $1.4 million during 2016, 2015 and 2014, respectively.
State RegulationIn December 2014, the FCC released a report and order that addressed, among other things, the transition to CAF Phase II funding for price cap carriers, the acceptance criteria for CAF Phase II funding and the annual reporting requirements, and the introduction of CAF Phase III. For companies that accept the CAF Phase II funding, there is a three year transition period in instances in which their current CAF Phase I funding exceeds the CAF Phase II funding. If CAF Phase II funding
exceeds CAF Phase I funding, the transitional support is waived and CAF Phase II funding begins immediately. Companies are required to commit to a statewide build out requirement to 10 Mbps downstream and 1 Mbps upstream in funded locations. We accepted the CAF Phase II funding in August 2015. The annual funding under CAF Phase I of $36.6 million was replaced by annual funding under CAF Phase II of $13.9 million through 2020. With the sale of our Iowa ILEC in 2016, this amount was further reduced to $11.5 million through 2020. The acceptance of funding at the lower level for CAF Phase II will transition over a three year period, beginning in August 2015, at the rates of 75% of the CAF Phase I funding level in the first year, 50% in the second year and 25% in the third year.
The annual reporting requirements include (i) filings of annual certifications that the carrier is both meeting its public interest obligations and is offering comparable broadband rates and (ii) the filing of a Service Quality Improvement plan. The initial plan must be filed by July 1, 2016, with progress reports filed every year thereafter. The plan must include, among other things, the total amount of CAF Phase II funding used to fund capital expenditures in the previous year and certification that the carrier is meeting the required interim deployment milestones.
State Regulation
California
The CPUC has the power, among other things, to establish rates, terms and conditions for intrastate service, to prescribe uniform systems of accounts and to regulate the mortgaging or disposition of public utility properties.
In an ongoing proceeding relating to the New Regulatory Framework, the CPUC adopted Decision 06-08-030 in 2006, which grants carriers broader pricing freedom in the provision of telecommunications services, bundling of services, promotions and customer contracts. This decision adopted a new regulatory framework, the Uniform Regulatory Framework (“URF”), which among other things (i) eliminates price regulation and allows full pricing flexibility for all new and retail services, (ii) allows new forms of bundles and promotional packages of telecommunication services, (iii) allocates all gains and losses from the sale of assets to shareholders and (iv) eliminates almost all elements of rate of return regulation, including the calculation of shareable earnings. OnIn December 31, 2010, the CPUC issued a ruling to initiate a new proceeding to assess whether, or to what extent, the level of competition in the telecommunications industry is sufficient to control prices for the four largest ILECs in the state. Subsequently, the CPUC issued a ruling temporarily deferring the proceeding. The status on whenWhen the CPUC may open this proceeding is unclear and on hold at this time. The CPUC’s actions in this and future proceedings could lead to new rules and an increase in government regulation. The Company will continue to monitor this matter.
Illinois
Our Illinois rural telephone company holds the necessary certifications in Illinois to provide long-distance and payphone services. We are required to file tariffs with the ILCCIllinois Commerce Commission (“ILCC”) or post written service offerings on its website, but generally can change the prices, terms and conditions stated in its tariffs on one day’s notice, with prior notice of price increases to affected customers. Our CLEC services are not subject to any significant state regulations in Illinois.
Our Illinois rural telephone company is certified by the ILCC to provide local telephone services. This entity operates as a distinct company from a regulatory standpointstandpoint. As described below, Consolidated Communications of Illinois Company (formerly known as Illinois Consolidated Telephone Company) (“CCIL”) has elected the option under Illinois law to have its rates, terms and conditions of service subject to market regulation, meaning it is regulated under a rate of return system for intrastate revenues.by competition in the market. Although, as explained above, the FCC has preempted certain state regulations pursuant to the Telecommunications Act, Illinois retains the authority to impose requirements on our Illinois rural telephone company to preserve universal service, protect public safety and welfare, ensure quality of service and protect consumers. For instance, our Illinois rural telephone company must file tariffs setting forth the terms, conditions,
15
Table of Contents
and prices for its intrastate services; these tariffs may be challenged by third parties. Our Illinois rural telephone company has not had a general rate proceeding before the ILCC since 1983.
The ILCC has broad authority to impose service quality and service offering requirements on our Illinois rural telephone company, including credit and collection policies and practices, and can require our Illinois rural telephone company to take actions to ensure that it meets its statutory obligation to provide reliable local exchange service. For example, as part of its approval of the reorganization we implemented in connection with our 2005 initial public offering, the ILCC imposed various conditions, including (1) prohibitions on payment of dividends or other cash transfers from ICTC to us if ICTC fails to meet or exceed agreed benchmarks for a majority of seven service quality metrics, and (2) the requirement that ICTC have access to $5.0 million or its currently approved capital expenditure budget (whichever is higher) for each calendar year through a combination of available cash and credit facilities. During 2013, we satisfied each of the applicable Illinois regulatory requirements necessary to permit ICTC to pay dividends to us.
The Illinois General Assembly has made major revisions and added significant new provisions to the portions of the Illinois Public Utilities Act governing the regulation and obligations of telecommunications carriers on a number of occasions since 1985. In 2007, the Illinois legislature addressed competition for cable and video services and authorized statewide licensing by the ILCC to replace the existing system of individual town franchises. This legislation also imposed substantial state-mandated consumer service and consumer protection requirements on providers of cable and video services. The requirements generally became applicable to us on January 1, 2008, and we are operating in compliance
with the new law. Although we have franchise agreements for cable and video services in all the towns we serve, this statewide franchising authority will simplify the process in the future. In July 2016, we notified the ILCC and the municipalities with which we have cable and video franchise agreements that we will be filing with the ILCC for statewide franchising authority in 2017. In 2010, the Illinois General Assembly passed Public Act 96-0927, which updates the telecommunications statute, allowing ILECs, beginning January 1, 2011, to elect deregulation of local services. To date, ICTC has not made an election to deregulate its local services.The Governor of Illinois signed the bill into law on June 15, 2010. CCIL elected this option effective April 1, 2014. Under this option, an ILEC’sCCIL’s rates for local services would becomebecame “competitive” and no longer subject to rate of return regulation, and certain other service quality obligations would beare reduced. The electing ILECs would have obligationsCCIL is obligated to make certain basic local exchange service packages available to customers. Public Act 96-0927 also specified that local exchange carriers may not charge intrastate access rates at levels higher than their interstate access rates. The Governor of Illinois signed the bill into law on June 15, 2010. In June 2013, the Illinois legislature approved additional amendments to the telecommunications statute. The new telecommunications legislation mademaking minor changes to the telecommunications statute. The current telecommunications statute is currently scheduled to sunset July 1, 2015.2017.
Texas
Our Texas rural telephone companies are each certified by the PUCT to provide local telephone services in their respective territories. In addition, our Texas long-distance and transport subsidiaries are registered with the PUCT as interexchange carriers. The transport subsidiary has also has obtained a service provider certificate of operating authority (“SPCOA”) to better assist the transport subsidiary with its operations in municipal areas. Recently, to assist with expanding services offerings, Consolidated Communications Enterprise Services, Inc.CCES also obtained a SPCOA from the PUCT. While our Texas rural telephone company services are extensively regulated, our other services, such as long-distance and transport services, are not subject to any significant state regulation.
Our Texas rural telephone companies operate as distinct companies from a regulatory standpoint. Each is separately regulated by the PUCT in order to preserve universal service, protect public safety and welfare, ensure quality of service and protect consumers. Each Texas rural telephone company must file and maintain tariffs setting forth the terms, conditions and prices for its intrastate services.
Currently, both of our Texas rural telephone companies have immunity from adjustments to their rates, including their intrastate network access rates, because they elected “incentive regulation” under the Texas Public Utilities Regulatory Act (“PURA”). In order to qualify for incentive regulation, our rural telephone companies agreed to fulfill certain infrastructure requirements. In exchange, they are not subject to challenge by the PUCT regarding their rates, overall revenues, return on invested capital or net income.
PURA prescribes two different forms of incentive regulation in Chapter 58 and Chapter 59. Under either election, the rates, including network access rates, an incumbent telephone company may charge for basic local services generally cannot be increased from the amount(s) on the date of election without PUCT approval. Even with PUCT approval, increases can only occur in very specific situations. Pricing flexibility under Chapter 59 is extremely
16
Table of Contents
limited. In contrast, Chapter 58 allows greater pricing flexibility on non-basic network services, customer-specific contracts and new services.
Initially, both of our Texas rural telephone companies elected incentive regulation under Chapter 59 and fulfilled the applicable infrastructure requirements, but they changed their election status to Chapter 58 in 2003, which gives them some pricing flexibility for basic services, subject to PUCT approval. The PUCT could impose additional infrastructure requirements or other restrictions in the future. Any requirements or restrictionsfuture, which could limit the amount of cash that is available to be transferred from our rural telephone companies to the parent entities, and could adversely affect our ability to meet our debt service requirements and repayment obligations.entities.
In September 2005, the Texas legislature adopted significant additional telecommunications legislation. Among other things, this legislation created a statewide video franchise for telecommunications carriers, established a framework to deregulate the retail telecommunications services offered by incumbent local telecommunications carriers, imposed concurrent requirements to reduce intrastate access charges and directed the PUCT to initiate a study of the Texas Universal Service Fund. The PUCT study submitted to the legislature in 2007 recommended that the Small Company Area High-Cost Program, which covers our Texas telephone companies, should be reviewed by the PUCT from a policy perspective regarding basic local telephone service rates and lines eligible for support. The PUCT has only addressed the large company fund and has no immediate plans to conduct a small company review.
Texas Universal Service
The Texas Universal Service Fund is administered by NECA.the National Exchange Carrier Association. PURA, the governing law, directs the PUCT to adopt and enforce rules requiring local exchange carriers to contribute to a state universal service fund that helps telecommunications providers offer basic local telecommunications service at reasonable rates in high cost high-cost
rural areas. The Texas Universal Service Fund is also used to reimburse telecommunications providers for revenues lost for providing lifeline service. Our Texas rural telephone companies receive disbursements from this fund. Our Texas ILECs receive two state funds, the small and rural incumbent local exchange company plan High Cost Fund (“HCF”) and the high cost assistance fund (“HCAF”). The HCF is a line-based fund used to keep local rates low. The rate is applied on all residential lines and up to five single business lines. The amount we receive from the HCAF is a frozen monthly amount that was originally developed to offset high intrastate toll rates.
In 2011, the Texas legislature passed Senate Bill 985 which requires the PUCT to review the large and small company Texas Universal Service Funds in 2012 and report back to the legislature by January 2013. The PUCT began a series of dockets in 2012 reviewing the Texas universal service high cost fund programs, for both large and small companies. The large company dockets were settled in late 2012. The small company dockets will not be reviewed until after the 2013 legislative session has been completed. We expect that any impact from these proceedings will most likely occur in 2014.
In September 2011, the Texas state legislature passed Senate Bill No. 980/House Bill No. 2603 which, among other things, mandated the PUCT to review the Universal Service Fund and issue recommendations by January 1, 2013 with the intent to effectively eliminatereduce the HCF.size of the Universal Service Fund. This would be accomplished by implementing an urban floor to offset state funding reductions with a phase-in period of four years. The PUCT recommended that (i) frozen line counts be lifted effective September 1, 2013 and (ii) rural and urban local rate benchmarks be developed. The large company fund review was completed in September 2012 and the PUCT addressed the small company fund participants in Docket No. 41097 Rate Rebalancing (“Docket 41097”), as discussed below.
In June 2013, the Texas state legislature passed Senate Bill No. 583 (“SB 583”). The provisions of SB 583 were effective September 1, 2013 and froze HCF and HCAF support for the remainder of 2013 and will eliminate2013. As of January 1, 2014, our annual $1.4 million HCAF support effective January 1, 2014.was eliminated and the frozen HCF support returned to funding on a per line basis. In July 2013, the Company entered into a settlement agreement with the PUCT on Docket 41097, which was approved by the PUCT onin August 30, 2013. In accordance with the provisions of the settlement agreement, ourthe HCF draw will be reduced by approximately $1.2 million annually or approximately $4.8 million in total, over a 4four year period beginning June 1, 2014 through 2017.2018. However, we have the ability to fully offset this reduction with increases to residential rates where market conditions will allow.
In addition, the PUCT is required to develop a needs test for post-2017 funding and has held workshops on various proposals. The PUCT issued its recommendation to the Texas state commissioners in May 2014, which was approved in December 2014. The needs test allows for a one-time disaggregation of line rates from a per line flat rate, and then a competitive test must be met to receive funding. The Company filed its submission for the needs test on December 28, 2016. The PUCT issued docket 46699 on January 4, 2017 to review the filing and a decision is expected in the second quarter of 2017.
Pennsylvania
The Pennsylvania Public Utilities Commission (“PAPUC”) regulates the rates, the system of financial accounts for reporting purposes and certain aspects of service quality, billing procedures and universal service funding, among other things, related to our rural telephone company and CLEC’s provision of intrastate services. In addition, the PAPUC sets the rates and terms for interconnection between carriers within the guidelines ordered by the FCC.
17
Table of Contents
Pennsylvania intrastate rates are regulated under a statutory framework referred to as Act 183. Under this statute, rates for non-competitive intrastate services are allowed to increase based on an index that measures economy-wide price increases. In return, we committed to continue to upgrade our network to ensure that all our customers would have access to broadband services, and to deploy a ubiquitous broadband (defined as 1.544 mbps) network throughout our entire service area by December 31, 2008, which we did.
Pennsylvania Universal Service and Access Charges
In 2011, the PAPUC issued an intrastate access reform order reducing intrastate access rates to interstate levels in a three stepthree-step process, which began in March 2012. With the release of the FCC order in November 2011, the PAPUC temporarily issued a stay. A final stay was issued in 2012 to implement the FCC ordered intrastate access rate changes. The PAPUC had indicated that it willwould address state universal funding in 2013, but delayed conducting a proceeding pending any state legislative activity that may occur in the 20142017 legislative session. The Company will continue to monitor this matter.
Minnesota, Iowa and North Dakota
For our CLEC operations in Minnesota, Iowa and North Dakota, we must file for CLEC or interexchange authority to operate with the appropriate public utility commission in each state it serves. Our CLECs provide a variety of services to both residential and business customers in multiple jurisdictions for local and interexchange services. Our CLECs provide services with less regulatory oversight than our ILEC companies.
Our subsidiaries Consolidated Communications of Minnesota Company (formerly Mankato Citizens Telephone Company) (“CCMN”) and Consolidated Communications of Mid-Communications Company (formerly Mid-Communications, Inc.) (“CCMC”) are ILECs. CCMN and CCMC are public utilities operating pursuant to indeterminate permits issued by the
Minnesota Public Utilities Commission (“MPUC”). Due to the size of our ILEC companies, the MPUC does not regulate our rates of return or profits. In Minnesota, regulators monitor CCMN and CCMC price and service levels.
Local Government Authorizations
In Illinois,the various states we historically have been required to obtain franchises from each incorporated municipalityoperate in, we operate under a structure in which our rural telephone company operates. An Illinois state statute prescribes theeach municipality or other regulatory agencies may impose various fees, that a municipality may imposesuch as for the privilege of originating and terminating messages and placing facilities within the municipality. Our Illinois telephone operations may also be required to obtainmunicipality, for obtaining permits for street opening and construction, and/or for operating franchises to install and expand fiber optic facilities. These permits or other licenses or agreements typically require the payment of fees.
Similarly, Texas incumbent telephone companies had historically been required to obtain franchises from each incorporated municipality in which they operated. Texas law now provides that incumbent telephone companies do not need to obtain franchises or other licenses to use municipal rights-of-way for delivering services. Instead, payments to municipalities for rights-of-way are administered through the PUCT and through a reporting process by each telecommunications provider. Incumbent telephone companies are still required to obtain permits from municipal authorities for street opening and construction, but most burdens of obtaining municipal authorizations for access to rights-of-way have been streamlined or removed.
Our Texas rural telephone companies still operate pursuant to the terms of municipal franchise agreements in some territories served by Consolidated Communications of Fort Bend Company. As the franchises expire, they are not being renewed.
Like Illinois, California and Pennsylvania operates under a structure in which each municipality may impose various fees.
Regulation of Broadband and Internet Services
Video Services
Our cable television subsidiaries each require a state or local franchise or other authorization in order to provide cable service to customers. Each of these subsidiaries is subject to regulation under a framework that exists in Title VI of the Communications Act.
Under this framework, the responsibilities and obligations of franchising bodies and cable operators have been carefully defined. The law addresses such issues as the use of local streets and rights of way; the carriage of public, educational and governmental channels; the provision of channel space for leased commercial access; the amount and payment of franchise fees; consumer protection;protection and similar issues. In addition, Federal laws place limits on the common ownership of cable systems and competing multichannel video distribution systems, and on the common ownership of cable systems and local telephone systems in the same geographic area. Many provisions of the Federalfederal law have been implemented through FCC regulations. The FCC has expanded its oversight and regulation of the cable television-related matters recently. In some cases, it has acted to assure that new competitors in the cable television business are able to gain access to potential customers and can also obtain licenses to carry certain types of video programming.
The Communications Act also authorizes the licensing and operation of open video systems (“OVS”). An OVS is a form of multichannel video delivery that was initially intended to accommodate unaffiliated providers of video programming on the same network. The OVS regulatory structure also offered a means for a single provider to serve less than an entire community. Our Kansas City operations in Missouri utilize an OVS that allows us to operate in only a part of Kansas City.
18
Table of Contents
A number of state and local provisions also affect the operation of our cable systems. The California legislature adopted the Digital Infrastructure and Video Competition Act of 2006 (“DIVCA”) to encourage further entrance of telephone companies and other new cable operators to compete against the large incumbent cable operators. DIVCA changed preexisting California law to require new franchise applicants to obtain franchise authorizations on the state level. In addition, DIVCA established a general set of state-defined terms and conditions to replace numerous terms and conditions that had applied uniquely in local municipalities, and it repealed a state law that had prohibited local governments from adopting terms for new competitive franchises that differed in any material way from the incumbent’s franchise even if competitive circumstances were very different. Some portions of this law are also available to incumbent cable operators with existing local franchises who compete against us.
A state franchising law has also has been enacted in Kansas. While these laws have reduced franchise burdens on our subsidiaries and have made it easier for them to seek out and enter new markets, they also have reduced the entry barriers for others who may want to enter our cable television markets.
Federal law and regulation also affects numerous issues related to video programming and other content.
Under Federalfederal law, certain local television broadcast stations (both commercial and non-commercial) can elect, every three years, to take advantage of rules that require a cable operator to distribute the station’s content to the cable system’s customers without charge, or to forego this “must-carry” obligation and to negotiate for carriage on an arm’s length contractual basis, which typically involves the payment of a fee by the cable operator, and sometimes involves other consideration as well. The current three year cycle began on January 1, 2012.2015. The companyCompany has successfully negotiated agreements with all of the local television broadcast stations that would have been eligible for “must carry” treatment in
each of its markets. As anticipated, fees under retransmission consent agreements generally underwent marked increases for the 2012-20142015 through 2017 period.
Federal law and regulationregulations regulate access to certain programming content that is delivered by satellite. The FCC has provisions in place tothat ban certain discriminatory practices and unfair acts, and include a presumption that the withholding of regional sports programming by content affiliates of incumbent cable operators is presumptively unlawful. The existing FCC complaint process for program access for both satellite and terrestrially-delivered content is governed on a case-by-case basis. The FCC currently is considering adopting rules that could make it less burdensome for competing multichannel video programming providers who are denied access to cable-affiliated satellite programming on reasonable terms and conditions to pursue and meet evidentiary standards with respect to program access complaints. ThatThis proceeding remains pending before the FCC.
The FCC recently adopted an order banning exclusive contracts between affiliates where the programming is sent via terrestrial media, and banning certain other unfair acts, making it clear that the withholding of regional sports programming and high definition television programming by content affiliates of incumbent cable operators would receive special attention. Unlike the satellite provisions, the new rules will not expire. The FCC’s order was upheld in an appeals court decision issued on March 12, 2010.
In connection with the FCC’s approval of a cable transaction involving Comcast and Time Warner in July 2006, the parties’ regional sports networks were subject to certain program access rules until July 2012. The FCC did not extend these obligations beyond July 2012. This does not change the existing Comcast/NBC Universal merger conditions which expire in 2018, as described below. It is unknown what, if any, impact this decision will have on us.
In early 2010, Comcast proposed to enter into a joint venture with NBC Universal, through which it would acquire control of numerous NBC properties, including both broadcast and cable television programming operations of NBC. In early 2011, the FCC and the Department of Justice (“DOJ”) approved the transaction, with a significant number of conditions designed to promote programming diversity, to limit the ability of the combined entity to affect competition adversely, and to protect newly emerging markets such as independent on-line (“over-the-top”)OTT video. These conditions include requirements for program access and carriage, non-discrimination in making programming available, limits on bundling that would affect competition and the relationship of the joint venture to emerging on-line competition. In addition, conditions were imposed to maintain independence within the NBC unit in dealing with competing cable operators. The parties agreed to the conditions and the transaction was completed during 2011. Most of the conditions will have a duration of seven years.
The contractual relationships between cable operators and most providers of content who are not television broadcast stations generally are not subject to FCC oversight or other regulation. The majority of providers of
19
Table of Contents
content to our subsidiaries, including content providers affiliated with incumbent cable operators such as Comcast, but who are not subject to any FCC or DOJ conditions, do so through arm’s length contracts where the parties have mutually agreed upon the terms of carriage and the applicable fees.
The transition to digital television (“DTV”) has led the FCC to adopt and implement new rules designed to ease the shift. These rules also can be expected to make broadcast content more accessible over the air to smartphones, personal computers and other non-television devices. Local television broadcast stations will also be able to offer more content over their assigned digital spectrum after the DTV transition, including additional channels.
The Company continues to monitor the emergence of video content options for customers that have become available over the Internet, and that may be made available for free, by individual subscription or in conjunction with a separate cable service agreement. In some cases, this involves the ability to watch episodes of desirable network television programming and to procure additional content related to programs carried on linear cable channels. These options have increased significantly and can lead cable television customers to terminate or reduce their level of services. At this time, “over-the-top”OTT programming options cannot duplicate the nature or extent of desirable programming carried by cable systems, and the market is still comparatively nascent, but in light of changing technology and events such as the Comcast-NBC transaction, the “over-the-top”OTT market will continue to grow and evolve rapidly.
Cable operators depend, to some degree, upon their ability to utilize the poles (and conduit) of electric and telephone utilities. The terms and conditions under which such attachments can be made were established in the Federalfederal Pole Attachment Act of 1978, as amended. The Pole Attachment Act outlined the formula for calculating the fee to be charged for the use of utility poles, a formula that assesses fees based on the proportionate amount of space assigned for use and an allocation of certain qualified costs of the pole owner. The FCC has put a structure in place a structure for pole attachment regulation that has covered cable operators and other types of providers. The FCC has adopted new rules that apply a single rate to all providers who use poles, whether they are cable operators, telecommunications providers, or Internet providers, even if they use the attachment to offer more than one service. These rules only affect attachments in states where the Federalfederal rules apply. States have the option to opt out of the Federalfederal formula and to regulate pole attachments independently. Illinois, Iowa, Kansas, Minnesota, Missouri, Texas, Pennsylvania and IllinoisTexas follow the FCC pole attachment
framework. California has elected to separately regulate pole attachments and pole attachment rates. The FCC decision has been appealed, and the ultimate outcome of the appeal cannot be predicted.
Cable operators are subject to longstanding cable copyright obligations where they pay copyright fees for some types of programming that are considered secondary retransmissions. The copyright fees are updated from time to time, and are paid into a pool administered by the United States Copyright Office for distribution to qualifying recipients.
The FCC has so far declined to require that cable operators allow unaffiliated Internet service providers to gain access to customers by using the network of the operator’s cable system. The FCC also has considered the benefits of a requirement that cable operators offer programming on their systems on an a la carte or themed basis, but to date has not adopted regulations requiring such action. These matters may resurface in the future, particularly as the “over-the-top”OTT market grows. In light of the fact that programming is increasingly being made available through Internet connections, some cable operators have considered their own a la carte alternatives. Content owners with linear channels also are moving towardcontinue to provide greater “on demand” programming and offerings that maintain the value of their linear channels for customers.
The outcome of pending matters cannot be determined at this time but can lead to increased costs for the Company in connection with our provision of cable services and can affect our ability to compete in the markets we serve.
Internet Services
The provision of Internet access services is not significantly regulated by either the FCC or the state commissions. However, the FCC has been moving toward the imposition of some controls on the provision of Internet access. In 2002, in part to place cable modem service and Digital Subscriber Line (“DSL”) service on an equal competitive footing, the FCC asserted jurisdiction over these services as “information services” under Title I of the Communications Act, and removed them from treatment under Title II of the Act, but to date it has not determined what regulatory framework, if any, is appropriate for Internet services under Title I.
The FCC has also adopted policy principles to signal its objectives with respect to high speedhigh-speed Internet and related services. These principles are intended to encourage broad customer access to the content and applications of their
20
Table of Contents
choice, to promote the unrestricted use of lawful equipment by users of Internet services and to promote competition among providers.
In 2009, the FCC proposed to enact rules related to Internet access services, relying in part on the policy principles that it had earlier adopted, but expanding their reach and adding additional provisions. The adoption of theThese rules as they have been proposed would prohibit discrimination with respect to applications providers, among other things, subject to reasonable network management by an Internet access service provider.
While this initiative was getting underway, a Federal appeals court decision in April 2010 assessed the FCC’s authority over Internet services under the Communications Act, and invalidated action taken by the FCC that was based on authority that the FCC thought it possessed. The FCC continues to asserthas asserted that it has jurisdictional authority in some areas related tounder the Communications Act for the promotion of an open Internet. Notwithstanding the court setback, the“open Internet” or “net neutrality”. The FCC elected to adopt these rules in this regard in December 2010. That action also has been appealedIn January 2014, the U.S. Court of Appeals for the D.C. Circuit found that the FCC does have the authority to a Federal appeals court. The extentimplement regulation of the FCC’s jurisdictionInternet if those rules reasonably advance the promotion of broadband deployment and do not violate other statutory requirements.
As a result of the ruling, the FCC intends to reclassify broadband Internet services as a telecommunications service subject to regulation under Title II of the Telecommunications Act of 1996, and in connection withMarch 2015, the FCC released its net neutrality order, which applies to all wireline and wireless providers of broadband Internet services. The net neutrality order addresses several areas that will be regulated and others that are subject to forbearance. The regulations disallow blocking, throttling and paid prioritization by Internet service providers. The net neutrality order also requires providers to disclose certain information to consumers regarding rates, fees, data allowances and packet loss. Finally, it gives the FCC codified enforcement authority and it forbears on certain Title II regulations. We do not be resolved for some time. We are unablebelieve the net neutrality order will result in significant changes to predict the outcomeservices we provide our customers, nor do we believe it will have a material impact on our financial position or results of current proceedings.operations.
The Federal Trade Commission (“FTC”) is currently assessing certain advertising and marketing practices of Internet-related companies, as well as the use of the Internet in connection with other businesses. FTC action can affect the manner of operation of some of our businesses. The outcome of pending matters cannot be determined at this time but can lead to increased costs for the Company in connection with our provision of Internet services, and can affect our ability to compete in the markets we serve.
Item 1A. Risk Factors.
Our operations and financial results are subject to various risks and uncertainties, including but not limited to those described below, that could adversely affect our business, financial condition, results of operations, cash flows and the trading price of our common stock.
Risks Relating to Current Economic Conditions
Unfavorable changes in financial markets could adversely affect pension plan investments resulting in material funding requirements to meet our pension obligations. We expect that we will continue to make future cash contributions to our pension plans, the amount and timing of which will depend on various factors including funding regulations, future investment performance, changes in future discount rates and changes in participant demographics. Our pension plans have investments in marketable securities, including marketable debt and equity securities, whose values are exposed to changes in the financial markets. Returns generated on plan assets have historically funded a large portion of the benefits paid under these plans. If the financial markets experience a downturn and returns fall below the estimated long-term rate of return, our future funding requirements could increase significantly, which could adversely affect cash flows from operations.
Weak economic conditions may have a negative impact on our business, results of operations and financial condition. Downturns in the economic conditions in the markets and industries we serve could adversely affect demand for our products and services and have a negative impact on our results of operations. Economic weakness or uncertainty may make it difficult for us to obtain new customers and may cause our existing customers to reduce or discontinue their services to which they subscribe. This risk may be worsened by the expanded availability of free or lower cost services, such as video over the Internet, or substitute services, such as wireless phones and data devices. Weak economic conditions may also impact the ability of third parties to satisfy their obligations to us. If weak economic conditions were to continue or further deteriorate, the growth of our business, results of operations and financial condition may be adversely affected.
Risks Relating to Our Common Stock and Payment of Dividends
Our Board of Directors could, in its discretion, depart from or change our dividend policy at any time. Our Board of Directors maintains a current dividend practice for the payment of quarterly dividends at an annual rate of approximately $1.55 per share of common stock. We are not required to pay dividends and our stockholders do not have contractual or other legal rights to receive them. Our Board of Directors may decide at any time, in its discretion, to decrease the amount of dividends, change or revoke the dividend policy, or discontinue paying dividends entirely. Our ability to pay dividends is dependent on our earnings, capital requirements, financial condition, expected cash needs, debt covenant compliance and other factors considered relevant by our Board of Directors. If we do not pay dividends, for whatever reason, shares of our common stock could become less liquid and the market price of our common stock could decline.
21
Table of Contents
We might not have sufficient cash to maintain current dividend levels. Our debt agreements, applicable state, legal and corporate law, regulatory requirements and other risk factors described in this section, could materially reduce the cash available from operations or significantly increase our capital expenditure requirements, and these outcomes could cause funds not to be available when needed in amount sufficient to support our current dividend practice.
If we continue to pay dividends at the level currently anticipated under our dividend policy, our ability to pursue growth opportunities may be limited. Our dividend practice could limit, but not preclude, our ability to grow. If we continue paying dividends at the level currently anticipated, we may not retain a sufficient amount of cash to fund a material expansion of our business, including any acquisitions or growth opportunities requiring significant and unexpected capital expenditures. For that reason, our ability to pursue any material expansion of our business may depend on our ability to obtain third-party financing. We cannot guarantee that such financing will be available to us on reasonable terms or at all.
Our organizational documents could limit or delay another party’s ability to acquire us and, therefore, could deprive our investors of a possible takeover premium for their shares. A number of provisions in our amended and restated certificate of incorporation and bylaws will make it difficult for another company to acquire us. Among other things, these provisions:
·Divide our Board of Directors into three classes, which results in roughly one-third of our directors being elected each year;
·Provide that directors may only be removed for cause and then only upon the affirmative vote of holders of two-thirds or more of the voting power of our outstanding common stock;
·Require the affirmative vote of holders of two-thirds or more of the voting power of our outstanding common stock to amend, alter, change, or repeal specified provisions of our amended and restated certificate of incorporation and bylaws;
·Require stockholders to provide us with advance notice if they wish to nominate any candidates for election to our Board of Directors or if they intend to propose any matters for consideration at an annual stockholders meeting; and
·Authorize the issuance of so-called “blank check” preferred stock without stockholder approval upon such terms as the Board of Directors may determine.
We also are subject to laws that may have a similar effect. For example, federal, Illinois, and Pennsylvania telecommunications laws and regulations generally prohibit a direct or indirect transfer of control over our business without prior regulatory approval. Similarly, Section 203 of the Delaware General Corporation Law restricts our ability to engage in a business combination with an “interested stockholder”. These laws and regulations make it difficult for another company to acquire us, and therefore could limit the price that investors might be willing to pay in the future for shares of our common stock. In addition, the rights of our common stockholders will be subject to, and may be adversely affected by, the rights of holders of any class or series of preferred stock that we may issue in the future.
Risks Relating to Our Indebtedness and Our Capital Structure
We have a substantial amount of debt outstanding and may incur additional indebtedness in the future, which could restrict our ability to pay dividends and fund working capital and planned capital expenditures. As of December 31, 2013, we had $1,216.8 million of debt outstanding. Our substantial level of indebtedness could adversely impact our business, including:
·We may be required to use a substantial portion of our cash flow from operations to make principal and interest payments on our debt, which will reduce funds available for operations, future business opportunities and dividends;
·We may have limited flexibility to react to changes in our business and our industry;
·It may be more difficult for us to satisfy our other obligations;
·We may have a limited ability to borrow additional funds or to sell assets to raise funds if needed for working capital, capital expenditures, acquisitions, or other purposes;
22
Table of Contents
·We may become more vulnerable to general adverse economic and industry conditions, including changes in interest rates; and
·We may be at a disadvantage compared to our competitors that have less debt.
We cannot guarantee that we will generate sufficient revenues to service our debt and have adequate funds left over to achieve or sustain profitability in our operations, meet our working capital and capital expenditure needs, compete successfully in our markets, or pay dividends to our stockholders.
Our credit agreement and the indenture governing the Senior Notes contain covenants that limit management’s discretion in operating our business and could prevent us from capitalizing on opportunities and taking other corporate actions. Among other things, our credit agreement limits or restricts our ability (and the ability of certain of our subsidiaries), and the indenture governing the Senior Notes limits the ability of our subsidiary, Consolidated Communications, Inc., and its restricted subsidiaries, to:
·Incur additional debt and issue preferred stock;
·Make restricted payments, including paying dividends on, redeeming, repurchasing, or retiring our capital stock;
·Make investments and prepay or redeem debt;
·Enter into agreements restricting our subsidiaries’ ability to pay dividends, make loans, or transfer assets to us;
·Create liens;
·Sell or otherwise dispose of assets, including capital stock of, or other ownership interests in, subsidiaries;
·Engage in transactions with affiliates;
·Engage in sale and leaseback transactions;
·Engage in a business other than telecommunications; and
·Consolidate or merge.
In addition, our credit agreement requires us to comply with specified financial ratios, including ratios regarding total leverage and interest coverage. Our ability to comply with these ratios may be affected by events beyond our control. These restrictions limit our ability to plan for or react to market conditions, meet capital needs, or otherwise constrain our activities or business plans. They also may adversely affect our ability to finance our operations, enter into acquisitions, or engage in other business activities that would be in our interest.
A breach of any of the covenants contained in our credit agreement, in any future credit agreement, or in the indenture governing the Senior Notes, or our inability to comply with the financial ratios could result in an event of default, which would allow the lenders to declare all borrowings outstanding to be due and payable. If the amounts outstanding under our credit facilities were to be accelerated, we cannot assure that our assets would be sufficient to repay in full the money owed. In such a situation, the lenders could foreclose on the assets and capital stock pledged to them.
Our variable-rate debt subjects us to interest rate risk, which could impact our cost of borrowing and operating results. Certain of our debt obligations are at variable rates of interest and expose us to interest rate risk. Increases in interest rates could negatively impact our results of operations and operating cash flows. To mitigate the risk of rising interest rates, we have entered into interest rate swap agreements that convert a portion of our variable-rate debt to a fixed-rate basis. However, we do not maintain interest rate hedging agreements for all of our variable-rate debt and our existing hedging agreements may not fully mitigate our interest rate risk, may prove disadvantageous or may create additional risks. Changes in fair value of cash flow hedges that have been de-designated or determined to be ineffective are recognized in earnings. Significant increases or decreases in the fair value of these cash flow hedges could cause favorable or adverse fluctuations in our results of operations.
Risks Relating to Our Business
We expect to continue to face significant competition in all parts of our business and the level of competition could intensify.intensify among our customer channels. The telecommunications Internet and digital video businesses areindustry is highly competitive. We face actual orand potential competition from many existing and emerging companies, including other incumbent and
23
Table of Contents
competitive local telephone companies, long-distance carriers and resellers, wireless companies, Internet service providers, satellite companies and cable television companies, and, in some cases, byfrom new forms of providers who are able to offer competitive services through software applications requiring a comparatively small initial investment. Due to consolidationconsolidations and strategic alliances within the industry, we cannot predict the number of competitors we will face at any given time.
The wireless business has expanded significantly and has caused many subscribers towith traditional telephone services and land-based Internet access services to give up those services and to rely exclusively on wireless service. Consumers are finding individual television shows of interest to them through the Internet and are watching content that is downloaded to their computers. Some providers, including television and cable television content owners, have initiated what are called “over-the-top”over-the-top (“OTT”) services that deliver video content to televisions and computers over the Internet. Over-the-topOTT services can include episodes of highly-rated television series in their current broadcast seasons. They also can include content that is related to broadcast or sports content that we carry, but that is distinct and may be available only through the alternative source.
Finally, the transition to digital broadcast television has allowed many consumers to obtain high definitionhigh-definition local broadcast television signals (including many network affiliates) over-the-air using a simple antenna. Consumers can pursue each of these options without foregoing any of the other options. We may not be able to successfully anticipate and respond to many of these various competitive factors affecting the industry, including regulatory changes that may affect our competitors and us differently, new technologies, services and applications that may be introduced, changes in consumer preferences, demographic trends, and discount or bundled pricing strategies by competitors.
The incumbent telephone carrier in the markets we serve enjoys certain business advantages, including size, financial resources, favorable regulatory position, a more diverse product mix, brand recognition and connection to virtually all of our customers and potential customers. The largest cable operators also enjoy certain business advantages, including size, financial resources, ownership of or superior access to desirable programming and other content, a more diverse product mix, brand recognition and first-in-the-fieldfirst-in-field advantages with a customer base that generates positive cash flow for its operations. Our competitors continue to add features, increase data speeds and adopt aggressive pricing and packaging for services comparable to the services we offer. Their success in selling some services that are competitive with ours among our various customer channels can lead to revenue erosion in other related areas. We face intense competition in our markets for long-distance, Internet access, video service and other ancillary services that are important to our business and to our growth strategy. If we do not compete effectively we could lose customers, revenue and market share; customers may reduce their usage of our services or switch to a less profitable service; and we may need to lower our prices or increase our marketing efforts to remain competitive.
We must adapt to rapid technological change. If we are unable to take advantage of technological developments, or if we adopt and implement them more slowlyat a slower rate than our competitors, we may experience a decline in the demand for our services.service. The telecommunicationsOur industry operates in a technologically complex environment. New technologies are continually developed and products and services undergo constant improvement. Emerging technologies offer consumers a variety of choices for their communication and broadband needs. To remain competitive, we will need to adapt to future changes in technology to enhance our existing offerings and to introduce new or improved offerings that anticipate and respond to the varied and continually changing demands of our customers. Ifvarious customer channels. Our business and results of operations could be adversely affected if we are unable to match the benefits offered by competing technologies on a timely basis or at an acceptable cost, and if we fail to employ technologies desired by our customers before our competitors do so or if we do not successfully execute on our technology initiatives, our business and results of operations could be adversely affected.initiatives.
New technologies, particularly alternative methods for the distribution, access and viewing of content, have been, and will likely continue to be, developed that will further increase the number of competitors that we face and drive changes in consumer behavior. Consumers seek more control over when, where and how they consume content and are increasingly interested in communication services outside of the home and in newer services in wireless Internet technology and devices such as tablets, smartphones and mobile wireless routers that connect to such devices. These new technologies, distribution platforms and consumer behaviorbehaviors may have a negative impact on our business.
In addition, evolving technologies can reduce the costs of entry for others, resulting in greater competition and give competitors significant new advantages.advantages to competitors. Technological developments could require us to make a significant new capital investment in order to remain competitive with other service providers. If we do not replace or upgrade our network and its technology once it becomes obsolete, we will not be unableable to compete effectively and will likely lose customers. We also may be placed at a cost disadvantage in offering our services. Technology changes are also allowing individuals to bypass telephone companies and cable operators entirely to make and receive calls, and to provide for the distribution and viewing of video programming without the need to subscribe to traditional voice and
24
Table of Contents
video products and services. Increasingly, this can be done over wireless facilities and other emerging mobile technologies as well as traditional wired networks. Wireless companies are aggressively developing networks using next-generation data technologies, which are capable of delivering high-speed Internet service via wireless technology to a large geographic footprint. As these technologies continue to expand in availability and reliability, they could become an effective alternative to our high-speed Internet services. Although we use fiber optics in parts of our networks, including in some residential areas, we continue to rely on coaxial cable and copper transport media to serve customers in many areas. The facilities we use to offer our video services, including the interfaces with customers, are undergoing a rapid evolution, and depend in part on the products, expertise and capabilities of third parties. If we cannot develop new services and products to keep pace with technological advances, or if such services and products are not widely embraced by our customer,customers, our results of operations could be adversely impacted.
TransportShifts in our product mix may result in declines in operating profitability. Margins vary among our products and services. Our profitability may be impacted by technological changes, customer demands, regulatory changes, the competitive nature of our business and changes in the product mix of our sales. These shifts may also result in our long-lived assets becoming impaired or our inventory becoming obsolete. We review long-lived assets for potential impairment if certain events or changes in circumstances indicate that impairment may be present. We currently manage potential inventory obsolescence through reserves, but future technology changes may cause inventory obsolescence to exceed current reserves.
Video content costs are substantial and continue to increase. We expect the cost of video transport and content costs to continue to be one of our largest operating costs associated with providing video service. Video programming content includes cable-oriented programming designed to be shown in linear channels, as well as the programming of local over-the-air television stations that we retransmit. In addition, on-demand programming is being made available in response to customer demand. In recent years, the cable industry has experienced rapid increases in the cost of programming, especially the costs forcost of sports programming and for local broadcast station retransmission consent.content. Programming costs are generally assessed on a per-subscriber basis, and therefore, are directly related directly to the number of subscribers to which the programming is provided. Our relatively small base of subscribers limits our ability to negotiate lower per-subscriber programming costs. Larger providers can often can qualify for discounts based on the number of their subscribers. This cost difference can cause us to experience reduced operating margins, while our competitors with a larger subscriber base may not experience similar margin compression. In addition, escalators in existing content agreements cause cost increases that are out of line withexceed general inflation. While we expect these increases to continue, we may not be able to pass our programming cost increases on to our customers, particularly as an increasing amount of programming content becomes available via the Internet at little or no cost. Also, some competitors (oror their affiliates)affiliates own programming in their own right and we may not be unableable to secure license rights to that programming. As our programming contracts with content providers expire, there can beis no assurance that they will be renewed on acceptable terms or that they will be renewed at all, in which case we may not be unableable to provide such programming as part of our video services packages and our business and results of operations may be adversely affected.
We receive cash distributions from our wireless partnership interests and the continued receipt of future distributions is not guaranteed. We own five wireless partnership interests consisting of 2.34% of GTE Mobilnet of South Texas Limited Partnership, which provides cellular service in the Houston, Galveston and Beaumont, Texas metropolitan areas; 3.60% of Pittsburgh SMSA Limited Partnership, which provides cellular service in and around the Pittsburgh metropolitan area; 20.51% of GTE Mobilnet of Texas RSA #17 Limited Partnership (“RSA #17”); 16.6725%16.67% of Pennsylvania RSA 6(I)
Limited Partnership (“RSA 6(I)”) and 23.67% of Pennsylvania RSA 6(II) Limited Partnership (“RSA 6(II)”). RSA #17 provides cellular service to a limited rural area in Texas. RSA 6(I) and RSA 6(II) provide cellular service in and around our Pennsylvania service territory.
In 2013, 20122016, 2015 and 2011,2014, we received cash distributions from these partnerships of $34.8$32.1 million, $29.1$45.3 million and $28.3$34.6 million, respectively. The cash distributions we receive from these partnerships are based on our percentage of ownership and the partnerships’ operating results, cash availability and financing needs, as determined by the General Partner at the date of the distribution. We cannot control the timing, dollar amount or certainty of any future cash distributions from these partnerships. In the absence of the receipt ofIf cash distributions from these partnerships decrease or end in the future, our results of operations could be adversely affected, and as a result, we may be unable to fulfill our long-term obligations or our ability to pay cash dividends to our shareholders may be restricted. If we do not receive cash distributions from these partnerships in the future, or if the cash distributions decrease in amount, our results of operations could be adversely affected.
A disruption in our networks and infrastructure could cause delays or interruptions of service, which could cause us to lose customers and incur additional expenses. Our customers depend on reliable service over our network. The primary risks to our network infrastructure include physical damage to lines, security breaches, capacity limitations, power surges or outages, software defects and disruptions beyond our control, such as natural disasters and acts of terrorism. From time to time in the ordinary course of business, we will experience short disruptions in our service due to factors such as physical damage, inclement weather and service failures of our third party service providers. We could experience more significant disruptions in the future. Disruptions may cause interruptions in service or reduced capacity for customers, either of which could cause us to lose customers and incur unexpected expenses.
25
TableA cyber-attack, information or security breach, or a technology failure of Contentsours or of a third party could adversely affect our ability to conduct our business, manage our exposure to risk, result in the disclosure or misuse of confidential or proprietary information, increase our costs to maintain and update our operational and security systems and infrastructure, and adversely impact our results of operations and financial condition. Our operations rely on the secure processing, transmission, storage and retrieval of confidential, proprietary and other information in our computer and data management systems and networks, and in the computer and data management systems and networks of third parties. We rely on digital technologies, computer, database and email systems, software, and networks to conduct our operations. Failure to prevent, detect and/or mitigate cyber-attacks, information or security breaches of our systems and networks may result in the disclosure or misuse of confidential or proprietary information, which could adversely affect our business, results of operations and financial condition.
expenses.
We have employees who are covered by collective bargaining agreements. If we are unable to enter into new agreements or renew existing agreements before they expire, we could have a work stoppage or other labor actions that could materially disrupt our ability to provide services to our customers. AtAs of December 31, 2013,2016, approximately 28%20% of our employees were covered by collective bargaining agreements. These employees are hourly workers located in Texas, Pennsylvania, Minnesota and Illinois service territories and are represented by various unions and locals. Our relationship with these unions generally has been satisfactory, but occasional work stoppages can occur, including a four day work stoppage that did occur in December 2012. All of the existing collective bargaining agreements expire between 20142017 through 2016,2021, of which two contracts covering 6%5% of our employees will expire in 2014.2017.
We cannot predict the outcome of negotiations of the collective bargaining agreements covering our employees. If we are unable to reach new agreements or renew existing agreements, employees subject to collective bargaining agreements may engage in strikes, work stoppages or slowdowns, or other labor actions, which could materially disrupt our ability to provide services. New labor agreements, or the renewal of existing agreements, may impose significant new costs on us, which could adversely affect our financial condition and result of operations. While we believe our relations with the unions representing these employees are good, any protracted labor disputes or labor disruptions by any of our employees could have a significant negative effect on our financial results and operations.
We may be unable to obtain necessary hardware, software and operational support from third party vendors. We depend on third party vendors to supply us with a significant amount of hardware, software and operational support necessary to provide certain of our services and to maintain, upgrade and enhance our network facilities and operations and to support our information and billing systems. Some of our third-party vendors are our primary source of supply for products and services for which there are few substitutes. If any of these vendors should experience financial difficulties, have demand that exceeds their capacity or they cannot otherwise meet our specifications, our ability to provide some services may be materially adversely affected in which case our business, financial condition and results of operations and financial condition may be adversely affected.
If we cannot obtain and maintain necessary rights-of-way for our network, our operations may be interrupted and we would likely face increased costs. We are dependent on easements, franchises and licenses from various private parties, such as established telephone companies and other utilities, railroads and long-distance companies, and from state highway authorities, local governments and transit authorities for access to aerial pole space, underground conduits and other rights-of-way in order to construct and operate our networks. Some agreements relating to rights-of-way may be short-term or revocable at will, and we cannot be certain that we will continue to have access to existing rights-of-way after the governing agreements are terminated or expire. If any of our right-of-way agreements were terminated or could not be renewed, we may be forced to remove our network facilities from the affected areas, relocate or abandon our networks, which would interrupt our operations, and force us to find alternative rights-of-way and makeincur unexpected capital expenditures.
Our ability to retain certain key management personnel and attract and retain highly qualified management and other personnel in the future could have an adverse effect on our business. We rely on the talents and efforts of key management personnel, many of whom have been with our company and in our industry for decades. While we maintain long-term and emergency transition plans for key management personnel and believe we could either identify internal candidates or attract outside candidates to fill any vacancy created by the loss of any key management personnel, the loss of one or more of our key management personnel and the ability to attract and retain highly qualified technical and management personnel in the future could have a negative impact on our business, financial condition and results of operations.
Future acquisitions could be expensive and may not be successful. From time to time, we make acquisitions and investments and enter into other strategic transactions. In connection with these types of transactions, we may incur unanticipated expenses,expenses; fail to realize anticipated benefits,benefits; have difficulty incorporating the acquired businesses,businesses; disrupt relationships with current and new employees, customers and vendors,vendors; incur significant indebtedness or have to delay or not proceed with announced transactions. The occurrence of any of the foregoing events could have a material adverse effect on our business, financial condition, results of operations and cash flowsflows.
Risks Relating to Our Merger with FairPoint
Obtaining required approvals and satisfying closing conditions may delay or prevent completion of the merger and/or result in the incurrence of additional costs. The merger with FairPoint is currently expected to close by the middle of 2017, assuming that all of the conditions in the Merger Agreement are satisfied or waived. Certain events may delay the completion of the merger or result in a termination of the Merger Agreement. Some of these events are outside of our control. Completion of the merger is conditioned upon our stockholder’s and FairPoint’s stockholders approval. If the stockholders do not approve, the merger will not be consummated. Completion of the merger is also conditioned upon, among other things, the receipt of certain governmental consents and regulatory approvals including approval by the FCC. While Consolidated and FairPoint intend to pursue vigorously all required consents and approvals and do not know of any reason why they would not be able to obtain them in a timely manner, the requirement to obtain these consents and approvals prior to completion of the merger could jeopardize or delay the completion of the merger. Further, these consents and approvals may impose conditions on or require divestitures relating to the divisions, operations or assets of Consolidated or FairPoint. Such conditions or divestitures may further jeopardize or delay completion of the merger or may reduce the anticipated benefits of the merger.
No assurance can be given that the required consents and approvals will be obtained or that the required conditions to closing will be satisfied. Even if all such consents and approvals are obtained, no assurance can be given as to the terms, conditions and timing of the consents and approvals or that they will satisfy the terms of the Merger Agreement. If the merger is not completed by September 30, 2017, or such later date determined in accordance with the Merger Agreement, either FairPoint or Consolidated may terminate the Merger Agreement (provided that the party terminating the Merger Agreement has not materially contributed to the failure to fulfill any condition under the Merger Agreement).
We may incur significant additional costs and expenses in connection with any delay in completing the merger or the termination of the Merger Agreement, including costs under our committed debt financing arrangement to be used to partially fund the merger as well as significant additional transaction costs, including legal, financial advisory, accounting and other costs we have already incurred. In addition, if the merger is not completed, we may be required to pay a termination fee of $18.9 million under certain circumstances as set forth in the Merger Agreement.
Completion of the merger, the failure to complete the merger and delays completing the merger could adversely affect the market price of our common stock. Failure to complete the merger would prevent us from realizing the anticipated benefits of the merger. We would also remain liable for significant transaction costs, including legal, accounting and financial condition.advisory fees. Any delay in completing the merger may significantly reduce the synergies and other benefits that we expect to achieve if we successfully complete the merger within the expected timeframe and integrate the businesses. In addition, the market price of our common stock may reflect various market assumptions as to whether and when the merger will be completed. Consequently, the completion of, the failure to complete, or any delay in the completion of the merger could result in a significant adverse change in the market price of our common stock, particularly to the extent that the current market price reflects a market assumption that the merger will be completed.
Whether or not the merger is completed, the pendency of the transaction could cause disruptions in our business, which could have an adverse effect on our business and financial results. The pendency of the merger could cause disruptions in our business, including, but not limited to, the following:
| · | | Current and prospective employees may experience uncertainty about their future roles with the combined company or consider other employment alternatives, which might adversely affect FairPoint’s and our ability to retain or attract key managers and other employees; |
| · | | Current and prospective customers of FairPoint or the Company may experience variations in levels of services as the companies prepare for integration or may anticipate change in how they are served and may, as a result, choose to discontinue their service with either company or choose another provider; and |
| · | | The attention of management of each of FairPoint and the Company may be diverted from the operation of the business toward the completion of the merger. |
We will incur transaction, integration and restructuring costs in connection with the merger. We expect to incur significant transaction costs in connection with the merger, including fees of our attorneys, accountants and financial advisors. In addition, we will incur integration and restructuring costs following the completion of the merger as we integrate the businesses of FairPoint with those of the Company. Although we expect that the realization of efficiencies related to the integration of the businesses will offset incremental transaction, integration and restructuring costs over time, we cannot give any assurance that this net benefit will be achieved in the near term.
26The integration of the Company and FairPoint following the merger may present significant challenges. We may face significant challenges in combining FairPoint’s operations into our operations in a timely and efficient manner and in retaining key FairPoint personnel. The failure to successfully integrate the Company and FairPoint and to manage successfully the challenges presented by the integration process may result in our not achieving the anticipated benefits of the merger, including operational and financial synergies.
Risks Relating to Current Economic Conditions
Unfavorable changes in financial markets could adversely affect pension plan investments resulting in material funding requirements to meet our pension obligations. We expect that we will continue to make future cash contributions to our pension plans, the amount and timing of which will depend on various factors including funding regulations, future investment performance, changes in future discount rates and mortality tables and changes in participant demographics. Unfavorable fluctuations or adverse changes in any of these factors, most of which are outside our control, could impact the funded status of the plans and increase future funding requirements. Returns generated on plan assets have historically funded a large portion of the benefits paid under these plans. If the financial markets experience a downturn and returns fall below the estimated long-term rate of return, our future funding requirements could increase significantly, which could adversely affect our cash flows from operations.
Weak economic conditions may have a negative impact on our business, results of operations and financial condition. Downturns in the economic conditions in the markets and industries we serve could adversely affect demand for our products and services and have a negative impact on our results of operations. Economic weakness or uncertainty may make it difficult for us to obtain new customers and may cause our existing customers to reduce or discontinue their services to which they subscribe. This risk may be worsened by the expanded availability of free or lower cost services, such as video over the Internet, or substitute services, such as wireless phones and data devices. Weak economic conditions may also impact the ability of third parties to satisfy their obligations to us.
Risks Relating to Our Common Stock and Payment of Dividends
Our Board of Directors could, at its discretion, depart from or change our dividend policy at any time. Our Board of Directors maintains a current dividend practice for the payment of quarterly dividends at an annual rate of approximately $1.55 per share of common stock. We are not required to pay dividends and our stockholders do not have contractual or other legal rights to receive them. Our Board of Directors may decide at any time, in its discretion, to decrease the amount of dividends, change or revoke the dividend policy or discontinue paying dividends entirely. Our ability to pay dividends is dependent on our earnings, capital requirements, financial condition, expected cash needs, debt covenant compliance and other factors considered relevant by our Board of Directors. If we do not pay dividends, for whatever reason, shares of our common stock could become less liquid and the market price of our common stock could decline.
We might not have sufficient cash to maintain current dividend levels. Our debt agreements, applicable state, legal and corporate law, regulatory requirements and other risk factors described in this section, could materially reduce the cash available from operations or significantly increase our capital expenditure requirements, and these outcomes could cause funds not to be available when needed in an amount sufficient to support our current dividend practice.
If we continue to pay dividends at the level currently anticipated under our dividend policy, our ability to pursue growth opportunities may be limited. Our dividend practice could limit, but not preclude, our ability to grow. If we continue paying dividends at the level currently anticipated, we may not retain a sufficient amount of cash to fund a material expansion of our business, including any acquisitions or growth opportunities requiring significant and unexpected capital expenditures. For that reason, our ability to pursue any material expansion of our business may depend on our ability to obtain third-party financing. We cannot guarantee that such financing will be available to us on reasonable terms or at all.
Our organizational documents could limit or delay another party’s ability to acquire us and, therefore, could deprive our investors of a possible takeover premium for their shares. A number of provisions in our amended and restated certificate of incorporation and bylaws will make it difficult for another company to acquire us. Among other things, these provisions:
| · | | Divide our Board of Directors into three classes, which results in roughly one-third of our directors being elected each year; |
| · | | Provide that directors may only be removed for cause and then only upon the affirmative vote of holders of two-thirds or more of the voting power of our outstanding common stock; |
| · | | Require the affirmative vote of holders of two-thirds or more of the voting power of our outstanding common stock to amend, alter, change or repeal specified provisions of our amended and restated certificate of incorporation and bylaws; |
| · | | Require stockholders to provide us with advance notice if they wish to nominate any candidates for election to our Board of Directors or if they intend to propose any matters for consideration at an annual stockholders meeting; and |
| · | | Authorize the issuance of so-called “blank check” preferred stock without stockholder approval upon such terms as the Board of Directors may determine. |
We also are subject to laws that may have a similar effect. For example, federal, California, Illinois, Minnesota and Pennsylvania telecommunications laws and regulations generally prohibit a direct or indirect transfer of control over our business without prior regulatory approval. Similarly, Section 203 of the Delaware General Corporation Law restricts our ability to engage in a business combination with an “interested stockholder”. These laws and regulations make it difficult
for another company to acquire us, and therefore, could limit the price that investors might be willing to pay in the future for shares of our common stock. In addition, the rights of our common stockholders will be subject to, and may be adversely affected by, the rights of holders of any class or series of preferred stock that we may issue in the future.
Risks Relating to Our Indebtedness and Our Capital Structure
We have a substantial amount of debt outstanding and may incur additional indebtedness in the future, which could restrict our ability to pay dividends and fund working capital and planned capital expenditures. As of December 31, 2016, we had $1,388.8 million of debt outstanding. Our substantial level of indebtedness could adversely impact our business, including:
| · | | We may be required to use a substantial portion of our cash flow from operations to make principal and interest payments on our debt, which will reduce funds available for operations, future business opportunities, strategic initiatives and dividends; |
| · | | We may have limited flexibility to react to changes in our business and our industry; |
| · | | It may be more difficult for us to satisfy our other obligations; |
| · | | We may have a limited ability to borrow additional funds or to sell assets to raise funds if needed for working capital, capital expenditures, acquisitions or other purposes; |
| · | | We may become more vulnerable to general adverse economic and industry conditions, including changes in interest rates; and |
| · | | We may be at a disadvantage compared to our competitors that have less debt. |
We cannot guarantee that we will generate sufficient revenues to service our debt and have adequate funds left over to achieve or sustain profitability in our operations, meet our working capital and capital expenditure needs, compete successfully in our markets, or pay dividends to our stockholders.
Our credit agreement and the indentures governing our Senior Notes contain covenants that limit management’s discretion in operating our business and could prevent us from capitalizing on opportunities and taking other corporate actions. Among other things, our credit agreement limits or restricts our ability (and the ability of certain of our subsidiaries), and the separate indentures governing the Senior Notes limit the ability of our subsidiary, Consolidated Communications, Inc., and its restricted subsidiaries to: incur additional debt and issue preferred stock; make restricted payments, including paying dividends on, redeeming, repurchasing or retiring our capital stock; make investments and prepay or redeem debt; enter into agreements restricting our subsidiaries’ ability to pay dividends, make loans or transfer assets to us; create liens; sell or otherwise dispose of assets, including capital stock of, or other ownership interests in subsidiaries; engage in transactions with affiliates; engage in sale and leaseback transactions; engage in a business other than telecommunications; and consolidate or merge.
In addition, our credit agreement requires us to comply with specified financial ratios, including ratios regarding total leverage and interest coverage. Our ability to comply with these ratios may be affected by events beyond our control. These restrictions limit our ability to plan for or react to market conditions, meet capital needs or otherwise constrain our activities or business plans. They also may adversely affect our ability to finance our operations, enter into acquisitions or engage in other business activities that would be in our interest.
A breach of any of the covenants contained in our credit agreement, in any future credit agreement, or in the separate indentures governing the Senior Notes, or our inability to comply with the financial ratios could result in an event of default, which would allow the lenders to declare all borrowings outstanding to be due and payable. If the amounts outstanding under our credit facilities were to be accelerated, we cannot assure that our assets would be sufficient to repay in full the money owed. In such a situation, the lenders could foreclose on the assets and capital stock pledged to them.
We may not be able to refinance our existing debt if necessary, or we may only be able to do so at a higher interest expense. We may be unable to refinance or renew our credit facilities and our failure to repay all amounts due on the maturity dates would cause a default under the credit agreement. Alternatively, any renewal or refinancing may occur on less favorable terms. If we refinance our credit facilities on terms that are less favorable to us than the terms of our existing debt, our interest expense may increase significantly, which could impact our results of operations and impair our ability to use our funds for other purposes, such as to pay dividends.
Our variable-rate debt subjects us to interest rate risk, which could impact our cost of borrowing and operating results. Certain of our debt obligations are at variable rates of interest and expose us to interest rate risk. Increases in interest rates could negatively impact our results of operations and operating cash flows. We utilize interest rate swap agreements to convert a portion of our variable-rate debt to a fixed-rate basis. However, we do not maintain interest rate hedging agreements for all of our variable-rate debt and our existing hedging agreements may not fully mitigate our interest rate risk, may prove disadvantageous or may create additional risks. Changes in fair value of cash flow hedges that have been de-designated or determined to be ineffective are recognized in earnings. Significant increases or decreases in the fair value of these cash flow hedges could cause favorable or adverse fluctuations in our results of operations.
Risks Related to the Regulation of Our Business
We are subject to a complex and uncertain regulatory environment, and we face compliance costs and restrictions greater than those of many of our competitors. Our businesses are subject to regulation by the Federal Communications Commission (“FCC”) and other Federal,federal, state and local entities. Rapid changes in technology and market conditions have required correspondingresulted in changes in how the government addresses telecommunications, video programming and Internet services. Many businesses that compete with our ILECIncumbent Local Exchange Carrier (“ILEC”) and Non-ILECnon-ILEC subsidiaries are comparatively less regulated. Some of our competitors are either completely free fromnot subject to utilities regulation or are regulated on asubject to significantly less burdensome basis. Further, in comparisonfewer regulations. In contrast to our subsidiaries regulated as cable operators and satellite video providers, competing on-demand and over-the-top videoOTT providers and motion picture and DVD firms have almost no regulation of their video activities. Recently, Federalfederal and state authorities have become far more active in seeking to address critical issues in each of our product and service markets. The adoption of new laws or regulations, or changes to the existing regulatory framework at the federal or state levelslevel, could require significant and costly adjustments andthat would adversely affect our business plans. New regulations could impose additional costs or capital requirements, require new reporting, impair revenue opportunities, potentially impede our ability to provide services in a manner that would be attractive to our customers and us and potentially create barriers to enter new markets or to acquire new lines of business. We face continued regulatory uncertainty in the regulatory area for the immediate future. Not only are these governmental entities continuing to move forward on these matters, their actions remain subject to reconsideration, appeal and legislative modification over an extended period of time, and it is unclear how their actions will ultimately will impact our markets. We cannot predict future developments or changes to the regulatory environment or the impact such developments or changes may have on us.
We receive support from various funds established under federal and state lawlaws, and the continued receipt of that support is not assured. A significant portion of our revenues come from network access and subsidies. An order adopted by the FCC in 2011 (the “Order”) may significantly impactimpacts the amount of support revenue we receive from the Universal Service Fund (“USF”)/, Connect America Fund (“CAF”) and intercarrier compensation (“ICC”). The Order reformed core parts of the USF, broadly recast the existing ICC scheme, and established the CAF to replace support revenues provided by the current USF and redirectsredirected support from voice services to broadband services. In 2012, the first phase of the CAF funding was implemented, freezingwhich froze USF support to a price cap holding companycarriers until the FCC implementsimplemented a broadband cost model to shift support from voice serviceservices to broadband. Initially, the second phase was anticipated to be implemented Julybroadband services. See Part I – Item 1 2013. It is now anticipated that the implementation will occur no sooner than July 1, 2014. We anticipate that our revenues will be significantly impacted when the broadband cost model is implemented. The order also modifies the methodology used– “Regulatory Environment” above for ICC traffic exchanged between carriers. The initial phasestatistics of ICC reform was effective on July 1, 2012, beginning the transition of our terminating switched access rates to bill-and-keep over a seven year period. As a result of implementing the provisions of the Order, our network access revenues decreased approximately $1.8 million during 2013. We anticipate network access revenues will continue to decline as a result of the Order through 2018 by as much as $1.2 million, $1.0 million, $1.1 million, $2.4 million and $1.8 million in 2014, 2015, 2016, 2017 and 2018, respectively.current CAF funding levels.
The Order is currently subject to both reconsideration and appeal. Further regulatory actions on these issues may have a material impact on our consolidated financial position and our results of operations in future periods. The impact cannot be fully determined at this time.
We receive subsidy payments from various federal orand state universal service support programs. These include high costprograms, including high-cost support, Lifeline Schools and LibrariesE-Rate programs within the Federal universal service program. In addition, our Pennsylvaniafor schools and Texas ILEC’s receive state universal service funding. The Pennsylvania PUC (“PAPUC”) issued an order in 2012 addressing state IC and USF, but rescinded the order in early 2012 due to the FCC order usurping the PAPUC rules. In the future the PAPUC may reintroduce a universal service proceeding. In Texas, the Public Utilities Commission of Texas (“PUCT”) initiated a proceeding to review the large company and small company high cost funds. The proceedings undertook a comprehensive review of high cost funds and provided recommended changes to the legislature. In June 2013, the Texas state legislature passed Senate Bill No. 583 (“SB 583”). The provisions of SB 583 were effective September 1, 2013 and froze the small and rural incumbent local exchange company plan (“HCF”) and high cost assistance fund (“HCAF”) support for the remainder of 2013 and will eliminate our annual $1.4 million HCAF support, effective January 1, 2014. In July 2013, the Company entered into a settlement agreement with the PUCT on Docket 41097, which was approved by the PUCT on August 30, 2013. In accordance with the provisions of settlement agreement, our HCF draw will be reduced by approximately $1.2 million annually, or approximately $4.8 million in total, over a 4 year period beginning June 1, 2014 through 2017.
27
Table of Contents
libraries. The total cost of all of the various Federalfederal universal service programs has increased greatlysignificantly in recent years, putting pressure on regulators to reform them,the programs and to limit both eligibility and support flows.support. We cannot predict when or how thesesuch matters will be decided or the effect on ourthe subsidy revenues.payments we receive. However, future reductions in the subsidiessubsidy payments we receive may directly affect our profitability and cash flows.
Increased regulation of the Internet could increase our cost of doing business. Current laws and regulations governing access to, or commerce on, the Internet are limited. As the Internet continues to become more significant, federal, state and local governments may adopt new rules and regulations applicable to, or apply existing laws and regulations to, the
Internet. At the federal level, the FCC intends to reclassify broadband Internet services as a telecommunications service subject to regulation under Title II of the Telecommunications Act of 1996, and in March 2015, the FCC released its net neutrality order, which applies to all wireline and wireless providers of broadband Internet services. The net neutrality order addresses several areas that will be regulated and others that are subject to forbearance. The regulations disallow blocking, throttling and paid prioritization by Internet service providers. The net neutrality order also requires providers to disclose certain information to consumers regarding rates, fees, data allowances and packet loss. Finally, it gives the FCC codified enforcement authority and it forbears on certain Title II regulations.
We are subject to extensive laws and regulations relating to the protection of the environment, natural resources and worker health and safety. Our operations and properties are subject to federal, state and local laws and regulations relating to the protection of the environment, natural resources and worker health and safety, including laws and regulations governing and creating liability in connection with the management, storage and disposal of hazardous materials, asbestos and petroleum products. We are also are subject to laws and regulations governing air emissions from our fleets offleet vehicles. As a result, we face several risks, including:
·Hazardous materials may have been released at properties that we currently own or formerly owned (perhaps through our predecessors). Under certain environmental laws, we could be held liable, without regard to fault, for the costs of investigating and remediating any actual or threatened contamination at these properties and for contamination associated with disposal by us or our predecessors of hazardous materials at third-party disposal sites.
| · | | Hazardous materials may have been released at properties that we currently own or formerly owned (perhaps through our predecessors). Under certain environmental laws, we could be held liable, without regard to fault, for the costs of investigating and remediating any actual or threatened contamination at these properties and for contamination associated with disposal by us, or by our predecessors, of hazardous materials at third-party disposal sites; |
·We could incur substantial costs in the future if we acquire businesses or properties subject to environmental requirements or affected by environmental contamination. In particular, environmental laws regulating wetlands, endangered species, and other land use and natural resource issues may increase costs associated with future business or expansion opportunities or delay, alter, or interfere with such plans.
| · | | We could incur substantial costs in the future if we acquire businesses or properties subject to environmental requirements or affected by environmental contamination. In particular, environmental laws regulating wetlands, endangered species and other land use and natural resources may increase the costs associated with future business or expansion or delay, alter or interfere with such plans; |
·The presence of contamination can adversely affect the value of our properties and make it difficult to sell any affected property or to use it as collateral.
| · | | The presence of contamination can adversely affect the value of our properties and make it difficult to sell any affected property or to use it as collateral; and |
·We could be held responsible for third-party property damage claims, personal injury claims, or natural resource damage claims relating to contamination found at any of our current or past properties.
| · | | We could be held responsible for third-party property damage claims, personal injury claims or natural resource damage claims relating to contamination found at any of our current or past properties. |
The cost of complying with environmental requirements could be significant. Similarly, the adoption of new environmental laws or regulations, or changes in existing laws or regulations or their interpretations, could result in significant compliance costs or unanticipated environmental liabilities.
Our business may be impacted by new or changing tax laws or regulations and actions by federal, state, and/or local agencies, or by how judicial authorities apply tax laws. Our operations are subject to various federal, state and local tax laws and regulations. In connection with the products and services we sell, we calculate, collect, and remit various federal, state, and local taxes, surcharges and regulatory fees (“tax” or “taxes”) to numerous federal, state and local governmental authorities. Tax laws are dynamic and subject to change as new laws are passed and new interpretations of the law are issued or applied. In many cases, the application of tax laws are uncertain and subject to differing interpretations, especially when evaluated against new technologies and telecommunications services, such as broadband Internet access and cloud related services. We cannot predict future changes to tax laws and regulations or the impact such changes may have on our business.
Item 1B. Unresolved Staff Comments.
None.
Item 2. Properties.
Our corporate headquarters are located at 121 S. 17th St.,Street, Mattoon, Illinois, a leased facility. We also own and lease office facilities and related equipment for administrative personnel, central office buildings and operations in California, Illinois, Iowa, Kansas, Minnesota, Missouri, North Dakota, Pennsylvania Texas, California, Kansas and Missouri. We own approximately 21 acres of undeveloped land in Roseville, California.Texas.
In addition to land and structures, our property consists of equipment necessary for the provision of communication services, including central office equipment, customer premises equipment and connections, pole lines, video head-end, remote terminals, aerial and underground cable and wire facilities, vehicles, furniture and fixtures, computers and other equipment. We also own certain other communications equipment held as inventory for sale or lease.
In addition to plant and equipment that we wholly-own, we utilize poles, towers and cable and conduit systems jointly-owned with other entities and lease space on facilities to other entities. These arrangements are in accordance with written agreements customary in the industry.
We have appropriate easements, rights of wayrights-of-way and other arrangements for the accommodation of our pole lines, underground conduits, aerial and underground cables and wires. See Note 11 into the Notes to Consolidated Financial Statementsconsolidated financial statements and Part II – Item 7 – “Management’s Discussion and Analysis of Financial Condition and Results of Operations” for information regarding our lease obligations.
As a result of efficiencies realized through cost controls and efficiencies gained through our acquisition of SureWest Communications in July 2012, certain of our owned and leased facilities are not being utilized to their full capacity. We are actively reviewing all of our holdings to determine if we have excess properties. As of December
28
Table of ContentsItem 3. Legal Proceedings.
31, 2013,From time to time we are actively marketing 21 acres of undeveloped land, an office campusmay be involved in Roseville, California and an office building in Cranbury, Pennsylvania.
Item 3.Legal Proceedings.
On April 15, 2008, Salsgiver Inc., a Pennsylvania-based telecommunications company, and certain of its affiliates filed a lawsuit against us and our subsidiaries North Pittsburgh Telephone Company and North Pittsburgh Systems Inc. in the Court of Common Pleas of Allegheny County, Pennsylvania alleginglitigation that we have prevented Salsgiver from connecting their fiber optic cables to our utility poles. Salsgiver seeks compensatory and punitive damages as the result of alleged lost projected profits, damage to its business reputation, and other costs. Salsgiver originally claimed to have sustained losses of approximately $125 million. We believe that these claims are without merit and that the alleged damages are completely unfounded. Discovery concluded and Consolidated filed a motion for summary judgment on June 18, 2012 and the court heard oral arguments on August 30, 2012. On February 12, 2013, the court, in part, granted our motion. The court ruled that Salsgiver could not recover prejudgment interest and could not use as a basis of liability any actions prior to April 14, 2006. In September 2013, in order to avoid the distraction and uncertainty of further litigation, we reached an agreement in principle (the “Agreement”) with Salsgiver, Inc. In accordance with the termsis of the Agreement, we will pay Salsgiver approximately $0.9 milliontype common to companies in cash and grant approximately $0.3 million in credits that may be used for make-ready charges (the “Credits”). The Credits will be available for services performed in connection with the pole attachment applications within five years of the execution of the agreement. We had previously recorded approximately $0.4 million in 2011 in anticipation of the settlement of this case. During the quarter ended September 30, 2013, per the terms of the agreement we recorded an additional $0.9 million, which included estimated legal fees. The Agreement is contingent on appropriate documentation and there is no assurance that the Agreement will be finalized.
Two of our subsidiaries, Consolidated Communications of Pennsylvania Company LLC (“CCPA”) and Consolidated Communications Enterprise Services Inc. (“CCES”), have, at various times, received assessment notices from the Commonwealth of Pennsylvania Department of Revenue (“DOR”) increasing the amounts owed for Pennsylvania Gross Receipt Taxes, and/or have had audits performed for the tax years of 2008, 2009, and 2010. For the calendar years for which we received both additional assessment notices and audit actions, those issues have been combined by the DOR into a single Docket for each year. For the CCES subsidiary, the total additional tax liability calculated by the auditors for calendar years 2008, 2009, and 2010 is approximately $1.9 million. As of March 2013, all three of these cases have been appealed, and have received continuance pendingindustry, including regulatory issues. While the outcome of present litigation in the Commonwealth of Pennsylvania (Verizon Pennsylvania, Inc. v. Commonwealth, Docket No. 266 F.R. 2008). For the CCPA subsidiary, the total additional tax liability calculated by the auditors for calendar years 2008, 2009, and 2010 is approximately $2.0 million. As of December 2013, the cases for calendar years 2009 and 2010 have been appealed, and have received continuance pending the outcome of present litigation in the Commonwealth of Pennsylvania (Verizon Pennsylvania, Inc. v. Commonwealth, Docket No. 266 F.R. 2008). The calendar year 2008 audit is ongoing andthese claims cannot be predicted with certainty, we anticipate based on previous results that we will appeal the result to the Pennsylvania Board of Finance and Revenue on or before March 19, 2014. We anticipate that the 2008 case will be continued pending the outcome of the Verizon litigation as well. The Gross Receipts Tax issues in the Verizon Pennsylvania case are substantially the same as those presently facing CCPA and CCES. In addition, there are numerous telecommunications carriers with Gross Receipts Tax matters dealing with the same issues that are in various stages of appeal before the Board of Finance and Revenue and the Commonwealth Court. Those appeals by other similarly situated telecommunications carriers have been continued until resolution of the Verizon Pennsylvania case. We believe that these assessments and the positions taken by the Commonwealth of Pennsylvania are without substantial merit. We do not believe that the outcome of any of these claimslegal matters will have a material adverse impact on our business, results of operations, financial results.
On January 18, 2012, we filedcondition or cash flows. See Note 11 to the consolidated financial statements included in this report in Part II – Item 8 – “Financial Statements and Supplementary Data” for a petition with the U.S. Courtdiscussion of Appeals for the District of Columbia Circuitrecent developments related to review the FCC’s Order issued November 18, 2011 that reformed intercarrier compensation and core parts of the Universal Service Fund. We are appealing five core issues in the November 18, 2011 FCC order. This matter was heard by the U.S. Court of Appeals for the Tenth Circuit on November 19, 2013, however a decision is not expected before the third quarter of 2014.
We are from time to time involved in various otherthese legal proceedings and regulatory actions arising out of our operations. We do not believe that any of these, individually or in the aggregate, will have a material adverse effect upon our business, operating results or financial condition.proceedings.
29
Table of Contents
PART II
Item 5.Market for Registrant’s Common Equity, Related Stockholder Matters and Issuer Purchases of Equity Securities.
Our common stock is traded on Thethe NASDAQ Global Select Market (“NASDAQ”) under the symbol “CNSL”. As of February 21, 2014,23, 2017, there were approximately 4,0084,679 stockholders of record of the Company’s common stock. The following table indicates the range ofhigh and low stock closing prices of the Company’s common stock as reported on the NASDAQ for each of the quarters ending on the dates indicated:
| | | | | | | | | | |
| | 2013 | | 2012 | | 2016 | | 2015 | |
Period | | High | | Low | | High | | Low | | High | | Low | | High | | Low | |
First quarter | | 17.86 | | 16.37 | | 19.80 | | 18.08 | | $ 25.76 | | $ 18.48 | | $ 27.86 | | $ 20.40 | |
Second quarter | | 18.95 | | 16.58 | | 19.63 | | 13.95 | | $ 27.24 | | $ 23.53 | | $ 21.89 | | $ 19.72 | |
Third quarter | | 18.50 | | 16.67 | | 17.79 | | 15.21 | | $ 28.38 | | $ 23.41 | | $ 21.07 | | $ 18.89 | |
Fourth quarter | | 19.75 | | 17.32 | | 17.40 | | 13.48 | | $ 29.68 | | $ 22.28 | | $ 22.62 | | $ 18.79 | |
Dividend Policy and Restrictions
Our Board of Directors declared dividends of approximately $0.38738 per share in each of the periods listed above. We expect to continue to pay quarterly dividends at an annual rate of approximately $1.55 per share during 2014.2017. Future dividend payments are at the discretion of our Board of Directors. Changes in our dividend program will depend on our earnings, capital requirements, financial condition, debt covenant compliance, expected cash needs and other factors considered relevant by our Board of Directors. Dividends on our common stock are not cumulative.
See Part II - Item 7–“Management’s7 “Management’s Discussion and Analysis of Financial Condition and Results of Operations – Liquidity and Capital Resources” for a discussion regarding restrictions on the payment of dividends. See Part I – Item 1A – “Risk Factors” of this report, which sets forth several factors that could prevent stockholders from receiving dividends in the future. Additional information concerning dividends may be found in “Selected Financial Data” in Part II – Item 6, which is incorporated herein by reference.
Share Repurchases
During the quarter ended December 31, 2013,2016, we repurchased 46,27242,627 common shares surrendered by employees in the administration of employee share-based compensation plans. The following table summarizes the share repurchase activity:
| | | | | | Total number of | | Maximum number | |
| | | | | | shares purchased | | of shares that may | |
| | | | | | as part of publicly | | yet be purchased | |
| | Total number of | | Average price | | announced plans | | under the plans | |
Purchase period | | shares purchased | | paid per share | | or programs | | or programs | |
October 1-October 31, 2013 | | - | | n/a | | n/a | | n/a | |
November 1-Novermber 30, 2013 | | - | | n/a | | n/a | | n/a | |
December 1-December 31, 2013 | | 46,272 | | $ | 19.18 | | n/a | | n/a | |
| | | | | | | | | | |
| | | | | | | | | |
| | | | | | Total number of | | Maximum number | |
| | | | | | shares purchased | | of shares that may | |
| | | | | | as part of publicly | | yet be purchased | |
| | Total number of | | Average price | | announced plans | | under the plans | |
Purchase period | | shares purchased | | paid per share | | or programs | | or programs | |
October 1-October 31, 2016 | | — | | n/a | | n/a | | n/a | |
November 1-November 30, 2016 | | — | | n/a | | n/a | | n/a | |
December 1-December 31, 2016 | | 42,627 | | $ 27.21 | | n/a | | n/a | |
Performance Graph
The following graph shows a five-year comparison of cumulative total shareholder return of our common stock (assuming dividend reinvestment)reinvestment of dividends) with the S&P 500 index, the Dow Jones US Fixed-Line Telecommunications Subsector index and a customized peer group of four companies that includes:includes, in addition to us: Alaska Communications Systems Group, Inc., Consolidated Communications Holdings, Inc., Otelco, Inc. and Shenandoah Telecommunications Company. The comparison of total return on investment (change in year-end stock price plus reinvested dividends) for each of the periods assumes that $100 was invested on December 31, 2008 respectively2011 in each index and in the peer group. The stock performance shown on the graphs below is not necessarily indicative of future price performance.
31
COMPARISON OF 5 YEAR CUMULATIVE TOTAL RETURN*
Among Consolidated Communications Holdings, the S&P 500 Index, the Dow Jones US
Fixed Line Telecommunications Subsector Index,
and a Peer Group
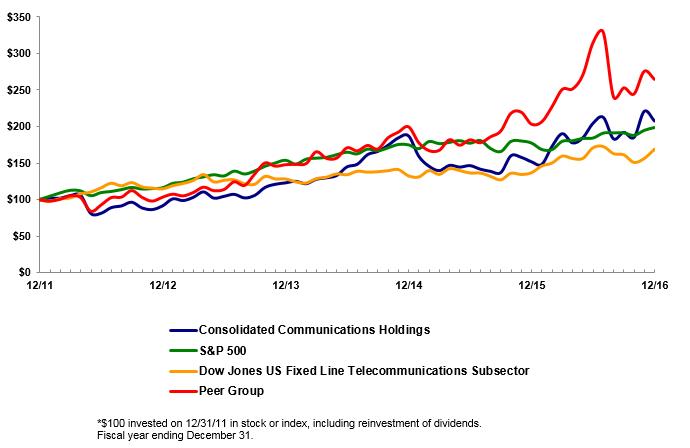
| | | | | | | | | | | | | | | | | | | | |
| | At December 31, | | | As of December 31, | |
(In dollars) | | 2008 | | 2009 | | 2010 | | 2011 | | 2012 | | 2013 | | | 2011 | | 2012 | | 2013 | | 2014 | | 2015 | | 2016 | |
Consolidated Communications Holdings, Inc. | | $ | 100 | | $ | 166 | | $ | 200 | | $ | 214 | | $ | 195 | | $ | 263 | | | $ | 100.00 | | $ | 91.13 | | $ | 122.76 | | $ | 187.29 | | $ | 151.72 | | $ | 207.68 | |
S&P 500 | | $ | 100 | | $ | 126 | | $ | 146 | | $ | 149 | | $ | 172 | | $ | 228 | | | $ | 100.00 | | $ | 116.00 | | $ | 153.58 | | $ | 174.60 | | $ | 177.01 | | $ | 198.18 | |
Dow Jones US Fixed-Line Telecommunications Subsector | | $ | 100 | | $ | 109 | | $ | 129 | | $ | 138 | | $ | 159 | | $ | 177 | | | $ | 100.00 | | $ | 115.13 | | $ | 128.63 | | $ | 132.83 | | $ | 137.10 | | $ | 169.30 | |
Peer group | | $ | 100 | | $ | 110 | | $ | 132 | | $ | 91 | | $ | 81 | | $ | 126 | | |
Peer Group | | | $ | 100.00 | | $ | 103.61 | | $ | 148.09 | | $ | 199.99 | | $ | 203.50 | | $ | 264.82 | |
Sale of Unregistered Securities
During the year ended December 31, 2013,2016, we did not sell any equity securities of the Company which were not registered under the Securities Act of 1933, as amended.
32
Item 6.Selected Financial Data.
The selected financial data set forth below should be read in conjunction with Part II - Item 7—“Management’s7 – “Management’s Discussion and Analysis of Financial Condition and Results of Operations”, our consolidated financial statements and the related notes, and other financial data included elsewhere in this annual report. Historical results are not necessarily indicative of the results to be expected in future periods.
| | | | | | | | | | | | | | | | | |
| | Year Ended December 31, | | | Year Ended December 31, | |
(In millions, except per share amounts) | | 2013 | | 2012(1) | | 2011 | | 2010 | | 2009 | | | 2016 | | 2015 | | 2014 (1) | | 2013 | | 2012 (2) | |
| | | | | | | | | | | | | | | | | | | | | | | | | | | |
Operating revenues | | $ | 601.6 | | $ | 477.9 | | $ | 349.0 | | $ | 360.3 | | $ | 385.5 | | | $ | 743.2 | | $ | 775.7 | | $ | 635.7 | | $ | 601.6 | | $ | 477.9 | |
| | | | | | | | | | | | | | | | | | | | | | | | | | | |
Cost of products and services (exclusive of depreciation and amortization) | | 222.5 | | 175.9 | | 121.7 | | 127.0 | | 132.7 | | | | 322.8 | | | 328.4 | | | 242.7 | | | 222.5 | | | 175.9 | |
Selling, general and administrative expense | | 135.4 | | 108.3 | | 77.8 | | 84.2 | | 100.5 | | | | 157.1 | | | 178.2 | | | 140.6 | | | 135.4 | | | 108.2 | |
Financing and other transaction costs (2) | | 0.8 | | 20.8 | | 2.6 | | - | | - | | |
Acquisition and other transaction costs (3) | | | | 1.2 | | | 1.4 | | | 11.8 | | | 0.8 | | | 20.8 | |
Intangible asset impairment | | - | | 1.2 | | - | | - | | - | | | | 0.6 | | | — | | | — | | | — | | | 1.2 | |
Depreciation and amortization | | 139.3 | | 120.3 | | 88.0 | | 86.5 | | 84.5 | | | | 174.0 | | | 179.9 | | | 149.4 | | | 139.3 | | | 120.3 | |
Income from operations | | 103.6 | | 51.4 | | 58.9 | | 62.6 | | 67.8 | | | | 87.5 | | | 87.8 | | | 91.2 | | | 103.6 | | | 51.5 | |
| | | | | | | | | | | | | | | | | | | | | | | | | | | |
Interest expense, net and loss on extinguishment of debt (3)(4) | | (93.5) | | (77.1) | | (49.4) | | (50.7) | | (57.9) | | |
Interest expense, net | | | | (76.8) | | | (79.6) | | | (82.5) | | | (85.8) | | | (72.6) | |
Loss on extinguishment of debt | | | | (6.6) | | | (41.2) | | | (13.8) | | | (7.7) | | | (4.5) | |
Other income, net | | 37.3 | | 31.2 | | 27.9 | | 26.1 | | 25.1 | | | | 34.1 | | | 35.1 | | | 33.5 | | | 37.3 | | | 31.2 | |
Income from continuing operations before income taxes | | 47.4 | | 5.5 | | 37.4 | | 38.0 | | 35.0 | | | | 38.2 | | | 2.1 | | | 28.4 | | | 47.4 | | | 5.6 | |
Income tax expense | | 17.5 | | 0.6 | | 13.1 | | 7.4 | | 11.1 | | | | 23.0 | | | 2.8 | | | 13.0 | | | 17.5 | | | 0.7 | |
Income from continuing operations | | 29.9 | | 4.9 | | 24.3 | | 30.6 | | 23.9 | | |
Income (loss) from continuing operations | | | | 15.2 | | | (0.7) | | | 15.4 | | | 29.9 | | | 4.9 | |
Discontinued operations, net of tax (4) | | | | — | | | — | | | — | | | 1.2 | | | 1.2 | |
Net income (loss) | | | | 15.2 | | | (0.7) | | | 15.4 | | | 31.1 | | | 6.1 | |
Net income of noncontrolling interest | | | | 0.3 | | | 0.2 | | | 0.3 | | | 0.3 | | | 0.5 | |
Net income (loss) attributable to common shareholders | | | $ | 14.9 | | $ | (0.9) | | $ | 15.1 | | $ | 30.8 | | $ | 5.6 | |
Income (loss) per common share - basic and diluted: | | | | | | | | | | | | | | | | | |
Income (loss) from continuing operations | | | $ | 0.29 | | $ | (0.02) | | $ | 0.35 | | $ | 0.73 | | $ | 0.12 | |
Discontinued operations, net of tax | | 1.2 | | 1.2 | | 2.7 | | 2.5 | | 2.0 | | | | — | | | — | | | — | | | 0.03 | | | 0.03 | |
Net income | | 31.1 | | 6.1 | | 27.0 | | 33.1 | | 25.9 | | |
Net income of noncontrolling interest | | 0.3 | | 0.5 | | 0.6 | | 0.6 | | 1.0 | | |
Net income attributable to common shareholders | | $ | 30.8 | | $ | 5.6 | | $ | 26.4 | | $ | 32.5 | | $ | 24.9 | | |
Income per common share - basic and diluted: | | | | | | | | | | | | |
Income from continuing operations | | $ | 0.73 | | $ | 0.12 | | $ | 0.79 | | $ | 1.00 | | $ | 0.77 | | |
Discontinued operations, net of tax(5) | | 0.03 | | 0.03 | | 0.09 | | 0.09 | | 0.07 | | |
Net income per common share - basic and diluted | | $ | 0.76 | | $ | 0.15 | | $ | 0.88 | | $ | 1.09 | | $ | 0.84 | | |
Net income (loss) per common share - basic and diluted | | | $ | 0.29 | | $ | (0.02) | | $ | 0.35 | | $ | 0.76 | | $ | 0.15 | |
| | | | | | | | | | | | | | | | | |
Weighted-average number of shares - basic and diluted | | 39,764 | | 34,652 | | 29,600 | | 29,490 | | 29,396 | | | | 50,301 | | | 50,176 | | | 41,998 | | | 39,764 | | | 34,652 | |
| | | | | | | | | | | | | | | | | | | | | | | | | | | |
Cash dividends per common share | | $ | 1.55 | | $ | 1.55 | | $ | 1.55 | | $ | 1.55 | | $ | 1.55 | | | $ | 1.55 | | $ | 1.55 | | $ | 1.55 | | $ | 1.55 | | $ | 1.55 | |
| | | | | | | | | | | | | | | | | | | | | | | | | | | |
Consolidated cash flow data from continuing operations: | | | | | | | | | | | | | | | | | | | | | | | | | | | |
Cash flows from operating activities | | $ | 168.5 | | $ | 119.7 | | $ | 124.3 | | $ | 111.9 | | $ | 112.6 | | | $ | 218.2 | | $ | 219.2 | | $ | 187.8 | | $ | 168.5 | | $ | 119.7 | |
Cash flows used for investing activities | | (107.4) | | (468.5) | | (40.7) | | (41.6) | | (40.6) | | | | (108.3) | | | (119.5) | | | (246.9) | | | (107.4) | | | (468.5) | |
Cash flows (used for) provided by financing activities | | (71.6) | | 257.5 | | (50.7) | | (49.4) | | (47.4) | | | | (98.7) | | | (90.4) | | | 60.2 | | | (71.6) | | | 257.5 | |
Capital expenditures | | 107.4 | | 77.0 | | 41.8 | | (42.7) | | 41.3 | | | | 125.2 | | | 133.9 | | | 109.0 | | | 107.4 | | | 77.0 | |
| | | | | | | | | | | | | | | | | | | | | | | | | | | |
Consolidated Balance Sheet: | | | | | | | | | | | | | | | | | | | | | | | | | | | |
Cash and cash equivalents | | $ | 5.6 | | $ | 17.9 | | $ | 105.7 | | $ | 67.7 | | $ | 42.8 | | | $ | 27.1 | | $ | 15.9 | | $ | 6.7 | | $ | 5.6 | | $ | 17.9 | |
Total current assets | | 87.7 | | 109.3 | | 164.7 | | 132.6 | | 105.8 | | | | 133.2 | | | 126.4 | | | 134.1 | | | 87.7 | | | 109.3 | |
Net property, plant and equipment | | 885.4 | | 907.7 | | 337.6 | | 362.0 | | 381.9 | | | | 1,055.2 | | | 1,093.3 | | | 1,137.5 | | | 885.4 | | | 907.7 | |
Total assets | | 1,747.4 | | 1,793.5 | | 1,194.1 | | 1,209.5 | | 1,226.6 | | | | 2,092.8 | | | 2,138.5 | | | 2,211.8 | | | 1,733.8 | | | 1,780.7 | |
Total debt (including current portion) | | 1,221.9 | | 1,217.8 | | 884.7 | | 884.1 | | 880.3 | | | | 1,391.7 | | | 1,388.8 | | | 1,351.2 | | | 1,208.3 | | | 1,205.0 | |
Stockholders’ equity | | 152.3 | | 136.1 | | 47.8 | | 71.9 | | 80.7 | | | | 176.3 | | | 250.7 | | | 330.8 | | | 152.3 | | | 136.1 | |
| | | | | | | | | | | | | | | | | | | | | | | | | | | |
Other financial data (unaudited): | | | | | | | | | | | | | | | | | | | | | | | | | | | |
Adjusted EBITDA (6) | | $ | 286.5 | | $ | 231.9 | | $ | 185.0 | | $ | 181.7 | | $ | 185.2 | | |
Adjusted EBITDA (5) | | | $ | 305.8 | | $ | 328.9 | | $ | 288.4 | | $ | 286.5 | | $ | 231.8 | |
| (1) | | On October 16, 2014, we completed our acquisition of Enventis Corporation (“Enventis”) in which we acquired all the issued and outstanding shares of Enventis in exchange for shares of our common stock. The financial results for Enventis have been included in our consolidated financial statements as of the acquisition date. |
| (2) | | In July 2012, we acquired 100% of the outstanding shares of SureWest Communications (“SureWest”) in a cash and stock transaction. SureWest results of operations have been included in our consolidated financial statements as of the acquisition date of July 2, 2012. |
33
| (3) | | Acquisition and other transaction costs includes costs incurred related to acquisitions, including severance costs. |
(1)In July 2012, we acquired 100% of the outstanding shares of SureWest Communications (“SureWest”) in a cash and stock transaction. SureWest results of operations have been included in our consolidated financial statements as of the acquisition date of July 2, 2012.
| (4) | | In September 2013, we completed the sale of the assets and contractual rights of our prison services business for a total cash price of $2.5 million, resulting in a gain of $1.3 million, net of tax. The financial results and net gain from the sale of the prison services business are included in income from discontinued operations for the years ended on or before December 31, 2013. |
(2)Financing and other transaction costs includes costs incurred related to the acquisition of SureWest including severance costs.
(3)In 2013, we entered into a Second Amended and Restated Credit Agreement to restate our term loan credit facility. In connection with entering into the restated credit agreement, we incurred a loss on the extinguishment of debt of $7.7 million during the year ended December 31, 2013.
(4)In 2012, we entered into a $350.0 million Senior Unsecured Bridge Loan Facility (“Bridge Facility”) to fund the SureWest acquisition. During 2012, we incurred $4.2 million of amortization related to the financing costs and $1.5 million of interest related to ticking fees associated with the Bridge Facility. In addition, in 2012 we entered into a Second Amendment and Incremental Facility Agreement to amend our term loan facility. As a result, we incurred a loss on the extinguishment of debt of $4.5 million related to the repayment of our outstanding term loan.
(5)In September 2013, we completed the sale of the assets and contractual rights of our prison services business for a total cash price of $2.5 million, resulting in a gain of $1.3 million, net of tax. The financial results and net gain from the sale of the prison services business are included in income from discontinued operations for the years ended on or before December 31, 2013.
(6)In addition to the results reported in accordance with accounting principles generally accepted in the United States (“US GAAP” or “GAAP”), we also use certain non-GAAP measures such as EBITDA and adjusted EBITDA to evaluate operating performance and to facilitate the comparison of our historical results and trends. These financial measures are not a measure of financial performance under US GAAP and should not be considered in isolation or as a substitute for net income (loss) as a measure of performance and net cash provided by operating activities as a measure of liquidity. They are not, on their own, necessarily indicative of cash available to fund cash needs as determined in accordance with GAAP. The calculation of these non-GAAP measures may not be comparable to similarly titled measures used by other companies. Reconciliations of these non-GAAP measures to the most directly comparable financial measures presented in accordance with GAAP are provided below.
| (5) | | In addition to the results reported in accordance with accounting principles generally accepted in the United States (“US GAAP” or “GAAP”), we also use certain non-GAAP measures such as EBITDA and adjusted EBITDA to evaluate operating performance and to facilitate the comparison of our historical results and trends. These financial measures are not a measure of financial performance under US GAAP and should not be considered in isolation or as a substitute for net income (loss) as a measure of performance and net cash provided by operating activities as a measure of liquidity. They are not, on their own, necessarily indicative of cash available to fund cash needs as determined in accordance with GAAP. The calculation of these non-GAAP measures may not be comparable to similarly titled measures used by other companies. Reconciliations of these non-GAAP measures to the most directly comparable financial measures presented in accordance with GAAP are provided below. |
EBITDA is defined as net earnings before interest expense, income taxes, and depreciation and amortization. Adjusted EBITDA is comprised of EBITDA, adjusted for certain items as permitted or required under our credit facility as described in the reconciliations below. These measures are a common measure of operating performance in the telecommunications industry and are useful, with other data, as a means to evaluate our ability to fund our estimated uses of cash.
34
Table of Contents
The following tables are a reconciliation of net cash provided by operating activitiesincome (loss) from continuing operations to Adjusted EBITDA:
| | | | | | | | | | | | | | | | | |
| | Year Ended December 31, | | Year Ended December 31, | |
(In millions, unaudited) | | 2013 | | 2012 | | 2011 | | 2010 | | 2009 | | 2016 | | 2015 | | 2014 | | 2013 | | 2012 | |
Net cash provided by operating activities from continuing operations | | $ | 168.5 | | | $ | 119.7 | | $ | 124.3 | | $ | 111.9 | | $ | 112.6 | | |
Adjustments: | | | | | | | | | | | | | | | | | |
Non-cash, stock-based compensation | | | (3.0 | ) | | | (2.3 | ) | | | (2.1 | ) | | | (2.4 | ) | | | (1.9 | ) | |
Other adjustments, net | | | (24.8 | ) | | | (9.7 | ) | | | (10.9 | ) | | | 4.1 | | | (0.7 | ) | |
Changes in operating assets and liabilities | | | 28.5 | | | 17.6 | | | 1.1 | | | 3.5 | | | (1.5 | ) | |
Interest expense, net | | | 85.8 | | | 72.6 | | | 49.4 | | | 50.7 | | | 57.9 | | |
Income taxes | | | 17.5 | | | | 0.7 | | | | 13.1 | | | | 7.4 | | | | 11.1 | | |
Net income (loss) from continuing operations | | | $ | 15.2 | | $ | (0.7) | | $ | 15.4 | | $ | 29.9 | | $ | 4.9 | |
Add (subtract): | | | | | | | | | | | | | | | | | |
Interest expense, net of interest income | | | | 76.8 | | | 79.6 | | | 82.5 | | | 85.8 | | | 72.6 | |
Income tax expense | | | | 23.0 | | | 2.8 | | | 13.0 | | | 17.5 | | | 0.7 | |
Depreciation and amortization | | | | 174.0 | | | 179.9 | | | 149.4 | | | 139.3 | | | 120.3 | |
EBITDA | | | 272.5 | | | | 198.6 | | | | 174.9 | | | | 175.2 | | | | 177.5 | | | | 289.0 | | | 261.6 | | | 260.3 | | | 272.5 | | | 198.5 | |
| | | | | | | | | | | | | | | | | | | | | | | | | | | | | | | | |
Adjustments to EBITDA: | | | | | | | | | | | | | | | | | | | | | | | | | | | | | | | | |
Other, net (a) | | | (31.5 | ) | | | (3.9 | ) | | | (20.4 | ) | | | (23.4 | ) | | | (16.6 | ) | | | (25.5) | | | (22.3) | | | (23.9) | | | (31.5) | | | (3.9) | |
Investment distributions (b) | | | 34.8 | | | 29.2 | | | 28.4 | | | 27.5 | | | 22.4 | | | | 32.1 | | | 45.3 | | | 34.6 | | | 34.8 | | | 29.2 | |
Loss on extinguishment of debt (c) | | | 7.7 | | | 4.5 | | | – | | | – | | | – | | | | 6.6 | | | 41.2 | | | 13.8 | | | 7.7 | | | 4.5 | |
Intangible asset impairment (d) | | | - | | | 1.2 | | | – | | | – | | | – | | | | 0.6 | | | — | | | — | | | — | | | 1.2 | |
Non-cash, stock-based compensation (e) | | | 3.0 | | | | 2.3 | | | | 2.1 | | | | 2.4 | | | | 1.9 | | | | 3.0 | | | 3.1 | | | 3.6 | | | 3.0 | | | 2.3 | |
Adjusted EBITDA | | $ | 286.5 | | | $ | 231.9 | | | $ | 185.0 | | | $ | 181.7 | | | $ | 185.2 | | | $ | 305.8 | | $ | 328.9 | | $ | 288.4 | | $ | 286.5 | | $ | 231.8 | |
(a)Other, net includes the equity earnings from our investments, dividend income, income attributable to noncontrolling interests in subsidiaries, transaction related costs including severance and certain other miscellaneous items related to the acquisition of SureWest. 2009 also includes expenses associated with Sarbanes-Oxley maintenance costs, costs to integrate our technology, administrative and customer service functions and billing systems in connection with the acquisition of North Pittsburgh.
(b)Includes all cash dividends and other cash distributions received from our investments.
(c)Represents the redemption premium and write-off of unamortized debt issuance costs in connection with the redemption or retirement of our debt obligations.
(d)Represents intangible asset impairment charges recognized during the period.
(e)Represents compensation expenses in connection with the issuance of stock awards, which because of their non-cash nature, these expenses are excluded from Adjusted EBITDA.
35
| (a) | | Other, net includes the equity earnings from our investments, dividend income, income attributable to noncontrolling interests in subsidiaries, acquisition and transaction related costs including severance and certain other miscellaneous items. |
| (b) | | Includes all cash dividends and other cash distributions received from our investments. |
| (c) | | Represents the redemption premium and write-off of unamortized debt issuance costs in connection with the redemption or retirement of our debt obligations. |
| (d) | | Represents intangible asset impairment charges recognized during the period. |
| (e) | | Represents compensation expenses in connection with the issuance of stock awards, which because of their non-cash nature, these expenses are excluded from adjusted EBITDA. |
Item 7.Management’s Discussion and Analysis of Financial Condition and Results of Operations.
Reference is made to Part I – Item 1 – “Note About Forward-Looking Statements” and Part I – Item 1A – “Risk Factors” which describes important factors that could cause actual results to differ from expectations and non-historical information contained herein. In addition, the following Management’s Discussion and Analysis of Financial Condition and Results of Operations (“MD&A”) is intended to help the reader understand the results of operations and financial condition of Consolidated Communications Holdings, Inc. (“Consolidated”, “the Company”the “Company”, “we” or “our”). MD&A should be read in conjunction with our audited consolidated financial statements and accompanying notes to the consolidated financial statements (“Notes”) as of and for each of the three years in the period ended December 31, 20132016 included elsewhere in this Annual Report on Form 10-K.
Throughout MD&A, we refer to certain measures that are not a measure of financial performance in accordance with United Statesaccounting principles generally accepted accounting principlesin the United States (“US GAAP” or “GAAP”). We believe the use of these non-GAAP measures on a consolidated basis provides the reader with additional information that is useful in understanding our operating results and trends. These measures should be viewed in addition to, rather than as a substitute for, those measures prepared in accordance with GAAP. See the Non-GAAP Measures section below for a more detailed discussion on the use and calculation of these measures.
Overview
We are an established telecommunicationsintegrated communications services company providingthat operates as both an Incumbent Local Exchange Carrier (“ILEC”) and a wide rangeCompetitive Local Exchange Carrier (“CLEC”) dependent upon the territory served. We provide an array of telecommunications services to residentialin consumer, commercial and business customerscarrier channels in Illinois, Texas, Pennsylvania, California, Kansas and Missouri. We offer a wide range of telecommunications services,11 states, including local and long-distance service, high-speed broadband Internet access, video services, digital telephone serviceVoice over Internet Protocol (“VOIP”VoIP”), custom calling features, private line services, carrier grade access services, network capacity services over our regional fiber optic networks, data center and managed services, directory publishing, Competitive Local Exchange Carrier (“CLEC”) servicesequipment sales and equipment sales.cloud services.
We generate the majority of our consolidated operating revenues primarily from subscriptions to our voice, video, data and datatransport services (“broadband(collectively “broadband services”) to business and residential customers. Commercial and business customers. Revenues increased $123.7 million during 2013 comparedcarrier services represent the largest source of our operating revenues and are expected to 2012, primarily frombe the primary driver of our acquisition of SureWest Communications (“SureWest”) and growth in data, video and Internet connections.the future. We expect our broadband service revenues to continue to growfocus on commercial and broadband growth opportunities and are continually expanding our commercial product offerings for both small and large businesses in order to capitalize on technological advances in the industry. We can leverage our fiber optic networks and tailor our services for business customers by developing solutions to fit their specific needs. In addition, we recently launched a suite of cloud services and an enhanced hosted voice product, which increases efficiency and enables greater scalability and reliability for businesses. We anticipate future momentum in commercial and carrier services as consumerthese new products gain traction as well as from the growing demand from customers for additional bandwidth and business demands for data based services increase.data-based services.
We market our services to our residential and business customers either individually or as a bundled package. Our “triple play” bundle includes our voice,data, video and voice services. As the market demands for bandwidth continue to increase as a result of consumer trends toward increased Internet usage, our continued focus is on enhancing product and service offerings, such as our progressively increasing consumer data services.speeds. We offer data speeds of up to 1 Gbps in select markets. Where 1 Gbps speeds are not yet offered, the maximum broadband speed is 100 Mbps, depending on the geographic market availability. As of December 31, 2013, our video service was available to2016, approximately 531 thousand28% of the homes in the marketsareas we serve with an approximate 21% penetration rate. Assubscribe to our data service. Our exceptional consumer broadband speed allows us to continue to meet the needs of December 31, 2013, we had approximately 111 thousand video subscribers, a 4% increaseour customers and the demand for higher speeds resulting from 2012. During 2013, we launchedthe growing trend of over-the-top (“OTT”) content viewing. The availability of 1 Gbps data speed also complements our wireless home networking (“Wi-Fi”) that supports our TV Everywhere whichservice and allows our subscribers to watch their favorite programs at home or away on a computer, smartphone or tablet. Data and Internet connections continue
The consumer’s growing acceptance of OTT video services either to increaseaugment their current viewing options or to entirely replace their video subscription may impact our future video subscriber base, which could result in a decline in video revenue as well as a result of enhanced product and service offerings, suchreduction in video programing costs. Total video connections decreased 10% as our consumer VOIP service and data speeds of up to 50 megabits per second, depending on the geographic market availability. As of December 31, 2013, approximately 30% of2016 compared to the homessame period in 2015. We believe the areas we serve subscribetrend in changing consumer viewing habits will continue to our data service. Our voice services provide local and long-distance calling and other features such as hosted voice services using cloud network servers, a business directory listing and the added capacity for multiple phone lines are made available toimpact our business voice customers. For our smallmodel and strategy of providing consumers the necessary broadband speed to medium sized business customers, we also offer metro Ethernet network services and wireless backhaul services.facilitate OTT content viewing.
The increase in our operating
Operating revenues during 2013 was offset in partalso continue to be impacted by anthe anticipated industry wide trend of a decline in voice services, access lines and related use of services.network access revenue. Many consumerscustomers are choosing to subscribe to alternative communications services and competition for these subscribers continues to increase. Progressively, consumers are utilizing over-the-top servicesTotal voice connections decreased 5% as of December 31, 2016 compared to download and watch television shows of interest to them on their computers.the same period in 2015. Competition from wireless providers, competitive local exchange carriers and, in some cases, cable television providers has increased in recent years in the markets we serve. We have been able to mitigate some of the access line losses through marketing initiatives and product offerings, such as our VOIPVoIP service.
As discussed in the “Regulatory Matters” section below, our operating revenues are also impacted by legislative or regulatory changes at the federal and state levels, which could reduce or eliminate the current subsidies revenue we receive. A number of proceedings and recent orders relate to universal service reform, intercarrier compensation and network access charges. There are various ongoing legal challenges to the orders that have been issued. As a result, it is not yet possible to determine fully the impact of the regulatory changes on our operations.
36Significant Recent Developments
Acquisitions
FairPoint Communications, Inc.
On December 3, 2016, we entered into a definitive agreement and plan of merger (the “Merger Agreement”) with FairPoint Communications, Inc. (“FairPoint”) to acquire all the issued and outstanding shares of FairPoint in exchange for shares of our common stock. FairPoint is an advanced communications provider to business, wholesale and residential customers within its service territory, which spans across 17 states. FairPoint owns and operates a robust fiber-based network with more than 21,000 route miles of fiber, including 17,000 route miles of fiber in northern New England. The acquisition reflects our strategy to diversify revenue and cash flows amongst multiple products and to expand our network to new markets. The merger is subject to standard closing conditions including the approval of our stockholders and FairPoint’s stockholders, the approval of the listing of additional shares of Consolidated common stock to be issued to FairPoint’s stockholders, required federal and state regulatory approvals and other customary closing conditions. We expect the merger to close by mid-2017.
In connection with the merger, we secured committed debt financing through a $935.0 million incremental term loan facility, as described in the “Liquidity and Capital Resources” section below, that in addition to cash on hand and other sources of liquidity, will be used to repay and redeem certain existing indebtedness of FairPoint and pay the fees and expenses in connection with the merger.
Champaign Telephone Company, Inc.
On April 18, 2016, we entered into a definitive agreement to acquire substantially all of the assets of Champaign Telephone Company, Inc. and its sister company, Big Broadband Services, LLC (collectively “CTC”), a private business communications provider in the Champaign-Urbana, IL area. The acquisition was completed on July 1, 2016. The aggregate purchase price, including customary working capital adjustments, consisted of cash consideration of $13.4 million, which was paid from our existing cash resources.
Enventis Corporation
On October 16, 2014, we completed our merger with Enventis and acquired all the issued and outstanding shares of Enventis in exchange for shares of our common stock. As a result, Enventis became a wholly-owned subsidiary of the Company. The total value of the purchase consideration exchanged was $257.7 million, excluding $149.9 million paid to extinguish Enventis’ outstanding debt. On the date of the merger, we issued an aggregate total of 10.1 million shares of our common stock to the former Enventis shareholders.
Divestitures
On December 6, 2016, we completed the sale of substantially all of the assets of the Company’s Enterprise Services equipment and IT Services business (“EIS”) to ePlus Technology inc. (“ePlus”) for cash proceeds of $9.2 million net of a customary working capital adjustment. As part of the transaction, we entered into a Co-Marketing Agreement with ePlus,
Significant Recent Developments
Merger With SureWest Communications
On July 2, 2012, we completed the merger with SureWest, which resulted in the acquisitiona nationwide systems integrator of 100%technology solutions, to cross-sell both broadband network services and IT services. The strategic partnership will provide our business customers access to a broader suite of all the outstanding shares of SureWest for $23.00 per share in a cashIT solutions, and stock transaction. The acquisition of SureWest provides additional diversification of the Company’s revenues and cash flows both geographically and by service type, which offers a platform for future growth and is expectedwill also provide ePlus customers access to generate operational and capital cost synergies. SureWest provides a wide range of telecommunications, digital video, Internet, data and other facilities-based communications services in Northern California, primarily in the greater Sacramento region, and in the greater Kansas City, Kansas and Missouri areas. ForConsolidated’s business network services. During the year ended December 31, 2011, SureWest reported $248.12016, we recognized a gain of $0.6 million on the sale, which is included in total operating revenues. Forother, net in the six months ended June 30, 2012, SureWest generated $127.9 million in operating revenues. The total purchase priceconsolidated statement of $550.8 million, consisted of cash and assumed debt of $402.4 million and 9,965,983 sharesoperations.
On May 3, 2016, we entered into a definitive agreement to sell all of the Company’s commonissued and outstanding stock valued at the Company’s opening stock price on July 2, 2012 of $14.89, which totaled $148.4 million. The cash portionConsolidated Communications of the merger considerationIowa Company (“CCIC”), formerly Heartland Telecommunications Company of Iowa. CCIC operates as an incumbent local exchange carrier providing telecommunications and the funds required to repay SureWest outstanding debt was financed with the sale of $300.0 million in aggregate principal amount of 10.875% Senior Notes due 2020 (“Senior Notes”). The Company also used cash on hand and approximately $35.0 million in borrowings from its revolving credit facility. Because the acquisition closed on July 2, 2012, the Company’s financial information does not include any of the results of operations from SureWest prior to the acquisition date.
Segment Reporting
Historically, we have classified our operations into two separate reportable business segments: Telephone Operations and Other Operations. Our Telephone Operations consisted of a wide range of telecommunicationsdata services to residential and business customers including localin 11 rural communities in northwest Iowa and long-distance service, high-speed broadband Internet access, video services, VOIP services, custom calling features, private line services, carrier access services, network capacity services over a regional fiber optic network, mobile services and directory publishing. Our Other Operations segment operated two complementary non-core businesses including telephone services to state and county correctional facilities (“Prison Services”) and equipment sales. As discussed below, our contract to provide telephone services to correctional facilities operated by the Illinois Department of Corrections was not renewed and the process of transitioning these services to another service provider was completed during the quarter ended March 31, 2013. The remaining prison services assets and operations were classified as discontinued operations during the quarter ended June 30, 2013 and subsequently sold during the quarter ended September 30, 2013, as discussed below. Prison Services comprised nearly all of the Other Operations segment revenue and results of operations. Consequently, with the cessation of our Prison Services business and based on the segment accounting guidance, we concluded that we operate as one segment as of the quarter ended June 30, 2013. As required by the authoritative guidance for segment presentation, segment results of operations have been retrospectively adjusted to reflect this change for all periods presented.
Prison Services Contract
We previously provided telephone service to inmates incarcerated at facilities operated by the Illinois Department of Corrections. On June 27, 2012, the Illinois Department of Central Management Services announced its intent to replace us as the provider of those services with a competitor. Although we challenged our competitor’s bid and the State’s decision to accept that bid in a variety of different forums, during the quarter ended March 31, 2013, the process of transitioning these services to another service provider was completed. All related assets have been assessed for recoverability in light of this change and we determined that no impairment was necessary. During 2012, the prison services contract comprised 5% of consolidated operating revenues and approximately 2% of consolidated operating income, excluding financing and other transaction fees.
Discontinued Operations
On September 13, 2013, we completed the sale of the assets and contractual rights used to provide communications services to thirteen county jails located in Illinois.surrounding areas. The sale was completed on September 1, 2016 for an aggregate purchase pricetotal cash proceeds of $2.5 million, resulting in a gain of $1.3approximately $21.0 million, net of tax. The financial resultscertain contractual and customary working capital adjustments. In May 2016, in connection with the expected sale, the carrying value of CCIC was reduced to its estimated fair value and we recognized an impairment loss of $0.6 million during the year ended December 31, 2016. We recognized an additional loss on the sale of $0.3 million during the year ended December 31, 2016, which is included in other, net in the consolidated statement of operations, as a result of changes in estimated working capital. We recognized a taxable gain on the transaction resulting in current income tax expense of $7.2 million during the year ended December 31, 2016 to reflect the tax impact of the operations for Prison Services, which were previously reporteddivestiture.
Restatement of Credit Agreement
On October 5, 2016, we amended and restated our existing credit agreement through a Third Amended and Restated Credit Agreement (the “Restated Credit Agreement”). Under the terms of the Restated Credit Agreement, we obtained initial term loans in the Other Operations segment, have been reported as discontinued operationsaggregate amount of $900.0 million, with a maturity date of October 5, 2023 (subject to an earlier maturity date of March 31, 2022 under certain conditions), and used the proceeds in our consolidated financial statements for all periods presented.part to pay off the outstanding term loan in the amount of $885.0 million. The initial term loan facility has an interest rate of 3.00% plus the London Interbank Offered Rate (“LIBOR”) subject to a 1.00% LIBOR floor. The refinancing is expected to save approximately $2.0 million per year in annual interest expense. We also obtained a revolving loan facility of $110.0 million maturing in October 2021, to replace the existing $75.0 million revolving credit facility scheduled to mature in December 2018. In connection with entering into the Restated Credit Agreement, we incurred a loss on the extinguishment of debt of $6.6 million during the year ended December 31, 2016.
37
Results of Operations
The following tables reflect our financial results on a consolidated basis and key operating statistics as of and for the years ended December 31, 2013, 20122016, 2015 and 2011.2014.
Financial Data
| | | | | | | | | | | | | | | | |
| | | | | | | | | | | % Change | | | | | | | | | | | | % Change | |
| | | | | | | | | | | 2013 vs. | | 2012 vs. | | | | | | | | | | | | 2016 vs. | | 2015 vs. | |
(In millions, except for percentages) | | 2013 | | | 2012 | | | 2011 | | | 2012 | | 2011 | | | 2016 | | 2015 | | 2014 | | 2015 | | 2014 | |
Operating Revenues | | | | | | | | | | | | | | | | | | | | | | | | | | | | | | |
Local calling services | | $ | 106.5 | | | $ | 93.5 | | | $ | 84.2 | | | 14 | % | | 11 | % | |
Network access services | | 112.4 | | | 98.6 | | | 80.5 | | | 14 | | | 22 | | |
Video, Data and Internet services | | 270.0 | | | 176.7 | | | 83.0 | | | 53 | | | 113 | | |
Commercial and carrier: | | | | | | | | | | | | | | | | |
Data and transport services (includes VoIP) | | | | $ | 196.7 | | $ | 187.5 | | $ | 123.0 | | 5 | % | 52 | % |
Voice services | | | | | 99.8 | | | 103.0 | | | 92.6 | | (3) | | 11 | |
Other | | | | | 12.5 | | | 12.3 | | | 11.5 | | 2 | | 7 | |
| | | | | 309.0 | | | 302.8 | | | 227.1 | | 2 | | 33 | |
Consumer: | | | | | | | | | | | | | | | | |
Broadband (VoIP, data and video) | | | | | 209.9 | | | 213.6 | | | 200.8 | | (2) | | 6 | |
Voice services | | | | | 55.3 | | | 60.6 | | | 60.2 | | (9) | | 1 | |
| | | | | 265.2 | | | 274.2 | | | 261.0 | | (3) | | 5 | |
Equipment sales and service | | | | | 43.1 | | | 55.0 | | | 10.0 | | (22) | | 450 | |
Subsidies | | 52.0 | | | 49.3 | | | 45.4 | | | 5 | | | 9 | | | | | 48.3 | | | 56.3 | | | 53.2 | | (14) | | 6 | |
Long-distance services | | 19.3 | | | 17.3 | | | 15.9 | | | 12 | | | 9 | | |
Other services | | 41.4 | | | 42.5 | | | 40.0 | | | (3) | | | 6 | | |
Total operating revenue | | 601.6 | | | 477.9 | | | 349.0 | | | 26 | | | 37 | | |
Expenses | | | | | | | | | | | | | | | | |
Cost of services and products | | 222.5 | | | 175.9 | | | 121.7 | | | 26 | | | 45 | | |
Network access | | | | | 63.8 | | | 69.7 | | | 70.2 | | (8) | | (1) | |
Other products and services | | | | | 13.8 | | | 17.7 | | | 14.2 | | (22) | | 25 | |
Total operating revenues | | | | | 743.2 | | | 775.7 | | | 635.7 | | (4) | | 22 | |
| | | | | | | | | | | | | | | | |
Operating Expenses | | | | | | | | | | | | | | | | |
Cost of services and products (exclusive of depreciation and amortization) | | | | | 322.8 | | | 328.4 | | | 242.7 | | (2) | | 35 | |
Selling, general and administrative costs | | 135.4 | | | 108.2 | | | 77.8 | | | 25 | | | 39 | | | | | 157.1 | | | 178.2 | | | 140.6 | | (12) | | 27 | |
Financing and other transaction costs | | 0.8 | | | 20.8 | | | 2.6 | | | (96) | | | 700 | | |
Impairment of intangible assets | | - | | | 1.2 | | | - | | | (100) | | | 100 | | |
Acquisition and other transaction costs | | | | | 1.2 | | | 1.4 | | | 11.8 | | (14) | | (88) | |
Loss on impairment | | | | | 0.6 | | | — | | | — | | 100 | | — | |
Depreciation and amortization | | 139.3 | | | 120.3 | | | 88.0 | | | 16 | | | 37 | | | | | 174.0 | | | 179.9 | | | 149.4 | | (3) | | 20 | |
Total operating expenses | | 498.0 | | | 426.4 | | | 290.1 | | | 17 | | | 47 | | | | | 655.7 | | | 687.9 | | | 544.5 | | (5) | | 26 | |
Income from operations | | 103.6 | | | 51.5 | | | 58.9 | | | 101 | | | (13) | | | | | 87.5 | | | 87.8 | | | 91.2 | | (0) | | (4) | |
Interest expense, net | | (85.8) | | | (72.6) | | | (49.4) | | | 18 | | | 47 | | | | | (76.8) | | | (79.6) | | | (82.5) | | (4) | | (4) | |
Loss on extinguishment of debt | | (7.7) | | | (4.5) | | | - | | | 71 | | | 100 | | | | | (6.6) | | | (41.2) | | | (13.8) | | (84) | | 199 | |
Other income | | 37.3 | | | 31.2 | | | 27.9 | | | 20 | | | 12 | | | | | 34.1 | | | 35.1 | | | 33.5 | | (3) | | 5 | |
Income tax expense | | 17.5 | | | 0.7 | | | 13.1 | | | 2,400 | | | (95) | | | | | 23.0 | | | 2.8 | | | 13.0 | | 721 | | (78) | |
Income from continuing operations | | 29.9 | | | 4.9 | | | 24.3 | | | 510 | | | (80) | | |
Income from discontinued operations, net of tax | | 1.2 | | | 1.2 | | | 2.7 | | | 0 | | | (56) | | |
Net income (loss) | | | | | 15.2 | | | (0.7) | | | 15.4 | | 2,271 | | (105) | |
Net income attributable to noncontrolling interest | | 0.3 | | | 0.5 | | | 0.6 | | | (40) | | | (17) | | | | | 0.3 | | | 0.2 | | | 0.3 | | 50 | | (33) | |
Net income attributable to common shareholders | | $ | 30.8 | | | $ | 5.6 | | | $ | 26.4 | | | 450 | | | (79) | | |
Net income (loss) attributable to common shareholders | | | | $ | 14.9 | | $ | (0.9) | | $ | 15.1 | | 1,756 | | (106) | |
| | | | | | | | | | | | | | | | | | | | | | | | | | | | | | |
Adjusted EBITDA (1) | | $ | 286.5 | | | $ | 231.9 | | | $ | 185.0 | | | 24 | % | | 25 | % | | | $ | 305.8 | | $ | 328.9 | | $ | 288.4 | | (7) | % | 14 | % |
(1)A non-GAAP measure. See the Non-GAAP Measures section below for additional information and reconciliation to the most directly comparable GAAP measure.
38
| (1) | | A non-GAAP measure. See the Non-GAAP Measures section below for additional information and reconciliation to the most directly comparable GAAP measure. |
Table of Contents
Key Operating Statistics
| | | | | | | | % Change |
| | | | | | | | 2013 vs. | | | 2012 vs. | |
| | 2013 | | 2012 | | 2011 | | 2012 | | | 2011 | |
ILEC access lines | | | | | | | | | | | | |
Residential | | 147,247 | | 153,855 | | 137,179 | | (4) | % | | 12 | % |
Business | | 109,558 | | 114,742 | | 90,813 | | (5) | | | 26 | |
Total | | 256,805 | | 268,597 | | 227,992 | | (4) | | | 18 | |
| | | | | | | | | | | | |
Voice connections (1) | | | | | | | | | | | | |
Residential | | 73,219 | | 78,811 | | 2,388 | | (7) | | | 3200 | |
Business | | 50,214 | | 50,918 | | 52,424 | | (1) | | | (3) | |
Total | | 123,433 | | 129,729 | | 54,812 | | (5) | | | 137 | |
| | | | | | | | | | | | |
Data and Internet connections (2) | | 255,239 | | 247,633 | | 134,129 | | 3 | | | 85 | |
Video connections (2) | | 110,613 | | 106,137 | | 34,356 | | 4 | | | 209 | |
Total connections | | 746,090 | | 752,096 | | 451,289 | | (1) | | | 67 | |
(1)Voice connections include voice lines outside the Incumbent Local Exchange Carrier (“ILEC”) service areas and Voice-over-IP inside the ILEC service areas.
(2)These connections include both residential and business (excluding SureWest business metrics) for services both inside and outside the ILEC service areas.
The comparability of our consolidated results of operations and key operating statistics was impacted by the SureWestEnventis acquisition whichthat closed on July 2, 2012,October 16, 2014, as described above. SureWest’sEnventis’ results are included in our consolidated financial statements as of the date of the acquisition. The acquisition of SureWest provides additional diversification of the Company’s revenues and cash flows both geographically and by service type.
Key Operating Statistics
| | | | | | | | | | | |
| | | | | | | | % Change | |
| | | | | | | | 2016 vs. | | 2015 vs. | |
| | 2016 | | 2015 | | 2014 | | 2015 | | 2014 | |
Consumer customers | | 253,203 | | 268,934 | | 277,753 | | (6) | % | (3) | % |
| | | | | | | | | | | |
Voice connections | | 457,315 | | 482,735 | | 503,120 | | (5) | | (4) | |
Data connections | | 473,403 | | 456,100 | | 443,489 | | 4 | | 3 | |
Video connections | | 106,343 | | 117,882 | | 124,229 | | (10) | | (5) | |
Total connections | | 1,037,061 | | 1,056,717 | | 1,070,838 | | (2) | % | (1) | % |
Operating Revenues
Commercial and Carrier
Data and Transport Services
We provide a variety of business communication services to small, medium and large business customers, including many services over our advanced fiber network. The SureWest operationsservices we offer include scalable high speed broadband Internet access and VoIP phone services, which range from basic service plans to virtual hosted systems. In addition to Internet and VoIP services, we also offer private line data services to businesses that include dedicated Internet access through our Metro Ethernet network. Wide Area Network (“WAN”) products include point-to-point and multi-point deployments from 2.5 Mbps to 10 Gbps to accommodate the growth patterns of our business customers. Data center and disaster recovery solutions provide a reliable and local colocation option for commercial customers. We also offer wholesale services to regional and national interexchange and wireless carriers, including cellular backhaul and other fiber transport solutions.
Data and transport services revenue increased $9.2 million during 2016 compared to 2015 and $64.5 million during 2015 compared to 2014 primarily from growth in data connections and a continued increase in VoIP, Internet access and Metro Ethernet revenue. Fiber transport and cellular backhaul revenue also increased as network bandwidth demand for wireless data continues to escalate. The acquisition of Enventis in 2014 accounted for $133.1$57.5 million of the 2012 consolidated operating revenuesannual increase in data and for 296,459 of the total connections at December 31, 2012.
2013 versus 2012
Operating Revenues
Local Calling Servicestransport services revenue during 2015 compared to 2014.
We offer several differentVoice Services
Voice services include basic local phone and long-distance service packages for residential and business customers. The plans include options for voicemail, conference calling, linking multiple office locations and other custom calling features such as caller ID, call forwarding, speed dialing and call waiting. Local callingServices can be charged at a fixed monthly rate, a measured rate or can be bundled with selected services at a discounted rate.
Voice services revenue increased $13.0decreased $3.2 million during 20132016 compared to 2012 primarily due2015 and increased $10.4 million during 2015 compared to the acquisition of SureWest.2014. Excluding the addition of SureWest revenues, local callingEnventis revenue, voice services revenue decreased $4.8$4.0 million during 20132015 compared to 20122014. The decline in voice services was primarily due to a 4% decline in local access lines. The number of local access lines in service directly affects the recurring revenue we generate from end users and continues to be impacted by the industry-wide7% decline in access lines. We expectlines during 2016 compared to continue to experience modest erosion2015, and a 5% decline in access lines dueduring 2015 compared to competition from2014 as commercial customers are increasingly choosing alternative technologies, including our own competing VOIP product.VoIP product, and the broad range of features that Internet based voice services can offer.
Network Access ServicesConsumer
Network access service revenues include interstate and intrastate switched access revenue, network special access services and wireless backhaul services. Network access servicesBroadband Services revenue increased $13.8 million during 2013 compared to 2012 primarily as a result of the acquisition of SureWest, which accounted for a $21.2 million annual increase in network access services revenue. Excluding the additional six months of revenue for SureWest, network access services decreased $7.4 million during 2013 compared to 2012 primarily due to a decline in switched and special access revenue. As described in the “Regulatory Matters” section below, network access revenues were also impacted by a decline in intrastate rates as a result of the intercarrier compensation (“ICC”) reform, which became effective in July 2012.
39
Table of Contents
Video, Data and Internet Services
Video, data and InternetBroadband services include revenue from residential and business customers for subscriptions to our voice,VoIP, data and video and data products. We offer high speed Internet access at speeds for residential consumers of up to 50 Mbps,1 Gbps, depending on the nature of the network facilities that are available, the level of service selected and the location. We also offer a variety of data connectivity services in select markets, including Ethernet services over our copper and fiber-based networks, virtual hosting services and collocation services. Our VOIPVoIP digital phone service is also available in certain markets as an alternative to the traditional telephone line. Depending on geographic market availability, our video services range from limited basic service to advanced digital television, which includes several plans each with hundreds of local, national
and music channels including premium and pay-per-view channels as well as video on demandon-demand service. Certain subscriberscustomers may also subscribe to our advanced video services, which consist of high-definition television, digital video recorders (“DVR”) and/or a whole home DVR.
Video,Broadband services revenue decreased $3.7 million during 2016 compared to 2015 despite price increases for data and Internet revenue increased $93.3 millionvideo services implemented during 2013 compared to 2012 primarily as a result of the acquisition of SureWest, which accounted for $85.2 million of the annual increase. The remaining increase in revenue was primarily due to the continued growth in2016. Total data and Internet connections and video connections which increased 3%decreased 5% and 4%11%, respectively, as of December 31, 2013. Video, data and Internet revenue comprised 45% of our consolidated revenues in 20132016 compared to 37%the same period in 2012.2015 as a result of increased competition as consumers are choosing to subscribe to alternative communications services particularly for video services. VoIP revenue also declined during that same period due to an 11% decline in voice connections as consumers increasingly rely exclusively on wireless service.
Broadband services revenue increased $12.8 million during 2015 compared to 2014. Excluding the addition of Enventis revenue, broadband services revenue decreased $0.7 million during 2015 primarily due to an 8% decline in video connections and increased discounts on our data service offerings.
Voice Services
We offer several different basic local phone service packages and long-distance calling plans, including unlimited flat-rate calling plans. The plans include options for voicemail and other custom calling features such as caller ID, call forwarding and call waiting. Voice services revenue decreased $5.3 million during 2016 compared to 2015 and increased $0.4 million during 2015 compared to 2014. Excluding the addition of Enventis revenue, voice services revenue decreased $5.1 million during 2015 compared to 2014. The decline in voice services was primarily due to a 10% and 9% decline in access lines in 2016 and 2015, respectively. The number of local access lines in service directly affects the recurring revenue we generate from end users and continues to be impacted by the industry-wide decline in access lines. We expect video, data and Internet service revenue to continue to grow as the consumer and business demand for data based services continuesexperience modest erosion in voice connections due to increase.competition from alternative technologies, including our own competing VoIP product.
SubsidiesEquipment Sales and Service
We were an accredited Master Level Unified Communications and Gold Certified Cisco Partner providing equipment solutions and support for business customers. As an equipment integrator, we offered network design, implementation and support services, including maintenance contracts, in order to provide integrated communication solutions for our customers. When an equipment sale involved multiple deliverables, revenue was allocated to each respective element based on the relative selling price. Equipment sales and services were non-recurring and changes in revenue were due to the timing and volume of customer sales, which varied each quarter and resulted in fluctuations in our quarterly operating revenues and expenses. Equipment sales and service revenue decreased $11.9 million during 2016 compared to 2015 partially due to the sale of EIS in December 2016, and increased $45.0 million during 2015 compared to 2014 due to the acquisition of Enventis in 2014.
Subsidies
Subsidies consist of both federal and state subsidies, which are designed to promote widely available, quality telephone service at affordable prices in rural areas. Subsidy revenues increased $2.7Subsidies decreased $8.0 million during 20132016 compared to 20122015 and increased $3.1 million during 2015 compared to 2014. Excluding the addition of Enventis revenue, subsidies revenue decreased $3.7 million during 2015 compared to 2014. Subsidies decreased each period primarily as a result of the addition of revenuetransition from CAF Phase I to CAF Phase II funding in 2015, the acquisition of SureWestscheduled reduction in the annual CAF Phase II rate in 2016, a reduction in state funding support for our Texas ILEC, and the additionsale of revenues from the Connect America Fund (“CAF”), which was implemented by the Federal Communications Commission (“FCC”)CCIC in July 2012.2016. See the “Regulatory Matters” section below for a further discussion of the subsidies we receive.
Long-DistanceNetwork Access Services
We offer a variety ofNetwork access services include interstate and intrastate switched access revenue, network special access services and end user access. Switched access revenue includes access services to other communications carriers to terminate or originate long-distance calling plans, including unlimited flat-rate calling plans,calls on our network. Special access circuits provide dedicated lines and trunks to residentialbusiness customers and business customers. Long-distanceinterexchange carriers. Network access services revenue increased $2.0decreased $5.9 million during 20132016 compared to 2012 primarily due2015 and $0.5 million during 2015 compared to the acquisition of SureWest.2014. Excluding the addition of SureWest revenues, long distanceEnventis revenue, network access services revenue decreased approximately $1.7$7.8 million during 20132015 compared to 20122014 primarily dueas a result of the continuing decline in interstate rates,
minutes of use, voice connections and carrier circuits; however, a portion of the decrease can be attributed to carriers shifting to our fiber Metro Ethernet product, contributing to the declinegrowth in access lines as described above and the shift in customers moving to unlimited long-distance plans.that area.
Other Products and Services
Other products and services include revenues from telephone directory publishing, wholesale transport services,video advertising and billing and collectionsupport services. Other products and services inside wiring service and maintenance and equipment sales. Other services revenue decreased $1.1$3.9 million during 20132016 compared to 2012. The decrease in other services revenue was2015 primarily due to a decline in outside billing and support services revenue of $3.0 million as a result of the sale of our billing services company in late 2015. The remainder of the decrease in other products and services revenue was due to a decline in telephone directory publishing revenuesadvertising revenues.
Other products and equipment sales, which was offset in part byservices revenue increased $3.5 million during 2015 compared to 2014 primarily from the acquisitionaddition of SureWestEnventis revenue of $3.9 million for its billing and support services and an increase in transport services.video advertising revenues, which was offset by a decline in directory publishing revenue.
Operating Expenses
Cost of Services and Products
Cost of services and products increased $46.6decreased $5.6 million during 20132016 compared to 2012. The addition2015. Cost of goods sold related to equipment sales decreased $8.5 million in 2016 related to changes in non-recurring equipment sales and the operations for SureWest during the first six monthssale of 2013 accounted for $50.0 million of the increase.EIS in December as discussed above. Video programming costs continue to increase due to the growthdecreased as a result of a 10% decline in video connections, andwhich was largely offset by an increase in programming costs per program channel.channel as costs continue to rise as a result of annual rate increases. Video programming costs are impacted by license fees charged by cable networks, the amount and quality of the content we provide and the number of video subscribers we serve. However, network access costs increased due to growth in carrier and wireless backhaul services during the year. The change in cost of services and products was also impacted by an increase in video programming costspension expense in the current year, but was offset in part by a reduction in incentive compensation in 2016.
In 2015, cost of services and products increased $85.7 million compared to 2014 primarily due to the addition of the operations for Enventis during 2014, which accounted for $80.3 million of the increase. Video programming costs also increased $5.0 million due to increases in programming license fees as costs per program channel continue to rise. Network access costs also increased as a result of growth in carrier and wireless backhaul services. However, these increases were partially offset by a decline in employee costs due to the declinea reduction in access lines and usage.headcount.
Selling, General and Administrative Costs
Selling, general and administrative costs decreased $21.1 million during 2016 compared to 2015 primarily due to a decline in employee-related costs from a reduction in headcount as part of the Company’s cost saving initiatives implemented in 2015 as well as a decrease in incentive compensation. In addition, one-time severance costs of $7.2 million were incurred in 2015 as a result of an early retirement program offered to a group of select employees as described below. Bad debt expense also decreased as a result of recoveries recognized in 2016 and increased reserves in the prior year periods. However, advertising expense increased due to additional radio advertising and marketing promotions in 2016.
Selling, general and administrative costs increased $27.2$37.6 million during 20132015 compared to 20122014. The acquisition of Enventis in 2014 contributed $29.7 million of the increase. As part of the Company’s continued integration efforts, an early retirement program was initiated during 2015 to a group of select employees who were 55 years of age or older and who have provided 15 or more years of service. The employees were primarily in non-customer facing positions or positions in which the Company believed the retiree’s workload could be absorbed internally as part of the Company’s continuing cost saving initiatives. The early retirement package was accepted by approximately 60 employees and, as a result, one-time severance costs of $7.2 million were incurred in 2015. The Company expects approximately $4.8 million in future annual savings as a result of the addition of the operations for SureWest for the first six months of 2013, which accounted for $27.0 million of the annual increase.early retirement program. The remaining increase in selling, general and administrative costs was primarily due to an increase in professionalproperty taxes and regulatory fees for audit and legal services, which wasincreased pension costs in 2015. These increases were offset in part by a decline in employee-related costs and a reduction in bad debt expense.advertising expense in 2015.
Transaction/Debt refinancing costsAcquisition and Other Transaction Costs
In connection with the acquisition of SureWest, we incurred $20.8 million of transaction related fees, which were recognized as financingAcquisition and other transaction costs during 2012. The transaction costs consisted primarily of legaldecreased $0.2 million and professional fees$10.4 million in 2016 and change-in-control payments to former members of the SureWest management team.
Depreciation and Amortization
Depreciation and amortization expense increased $19.0 million during 2013 compared to 2012,2015, respectively, primarily as a result of the acquisition of SureWest.Enventis, which closed in the fourth quarter of 2014. In 2014, we incurred $11.8 million in transaction related fees in connection with the acquisition of Enventis. Transaction costs consist primarily of legal, finance and other professional fees as well as expenses related to change-in-control payments to former employees of the acquired companies.
Depreciation and Amortization
Depreciation and amortization expense decreased $5.9 million during 2016 compared to 2015, primarily due certain circuit equipment, outside plant and software becoming fully depreciated in 2016, which was offset in part by ongoing capital expenditures related to network enhancements and success-based capital projects for consumer and commercial services.
In 2015, depreciation and amortization expense increased $30.5 million compared to 2014, primarily as a result of the acquisition of Enventis during 2014, which accounted for $31.4 million of the increase. Excluding the addition of the operations for SureWest for the first six months of 2013, which accounted for $38.5 million of the current year increase,Enventis, depreciation and amortization expense decreased $19.5$0.9 million in 2013 as a result of2015 due to certain intangible assetscircuit, network and networkterminal equipment becoming fully depreciated during 2015, which was offset in part by capital expenditures for internally developed software and outside plant equipment becoming fully amortized or depreciated during 2012.related to integration and success based projects.
Reclassifications
Certain amounts in our 2012 and 2011 consolidated financial statements have been reclassified to conform to the presentation of our 2013 consolidated financial statements. The reclassifications consist of the effects of reporting prison services as a discontinued operation, the retrospective adjustments to report operating results as a single segment and the finalization of purchase accounting for the SureWest acquisition. These reclassifications had no effect on total shareholders’ equity, total revenue or net income.
Regulatory Matters
Our revenues are subject to broad Federalfederal and/or state regulation, which include such telecommunications services as local telephone service, network access service and toll service and are derived from various sources, including:
| · | | Business and residential subscribers of basic exchange services; |
·business and residential subscribers of basic exchange services;
| · | | Surcharges mandated by state commissions; |
·surcharges mandated by state commissions;
| · | | Long distance carriers for network access service; |
·long distance carriers, for network access service;
| · | | Competitive access providers and commercial customers for network access service; and |
·competitive access providers and commercial enterprises for network access service;
·interstate pool settlements from the National Exchange Carrier Association (“NECA”); and
·support payments from federal or state programs.
| · | | Support payments from federal or state programs. |
The telecommunications industry is subject to extensive federal, state and local regulation. Under the Telecommunications Act of 1996, federal and state regulators share responsibility for implementing and enforcing statutes and regulations designed to encourage competition and to preserve and advance widely available, quality telephone service at affordable prices.
At the federal level, the FCCFederal Communications Commission (“FCC”) generally exercises jurisdiction over facilities and services of local exchange carriers, such as our rural telephone companies, to the extent they are used to provide, originate or terminate interstate or international communications. The FCC has the authority to condition, modify, cancel, terminate or revoke our operating authority for failure to comply with applicable federal laws or FCC rules, regulations and policies. Fines or penalties also may be imposed for any of these violations.
State regulatory commissions generally exercise jurisdiction over carriers’ facilities and services to the extent they are used to provide, originate or terminate intrastate communications. In particular, state regulatory agencies have substantial oversight over interconnection and network access by competitors of our rural telephone companies. In addition, municipalities and other local government agencies regulate the public rights-of-way necessary to install and operate networks. State regulators can sanction our rural telephone companies or revoke our certifications if we violate relevant laws or regulations.
FCC Matters
In general, telecommunications service in rural areas is more costly to provide than service in urban areas. The lower customer density means that switching and other facilities serve fewer customers and loops are typically longer, requiring greater expenditures per customer to build and maintain. By supporting the high costhigh-cost of operations in rural markets, Federal Universal Service Fund (“USF”) subsidies promote widely available, quality telephone service at affordable prices in rural areas. Revenues from the Federal Universal Service Fund, the Pennsylvania Universal Service Fund,federal and the Texas Universal Service Fund increased $2.7certain states’ USFs decreased $8.0 million in 20132016 compared to 2012. The increase in the Universal Service subsidies received during the current year was2015 primarily due to the acquisition of SureWest andtransition to CAF Phase II funding in 2015, the new subsidies received from the CAF, as described below.
41
Table of Contents
Historically, under FCC rules governing rate making, our California ILEC was required to establish rates for its interstate telecommunications services based on projected demand usage for the various services. We projected our earnings through the use of annual cost separation studies, which utilized estimated total cost information and projected demand usage. Carriers were required to follow FCC rulesscheduled reduction in the preparation of these annual studies. We determined actual earnings fromCAF Phase II rate in August 2016, and a decrease in state funding support for our interstate rates as actual volumes and costs became known. In March 2013, we filed a waiver with the FCC to convert our California ILEC from a rate of return to a price cap company. The FCC granted the waiver with an effective date of our annual interstate access tariff filing of July 2, 2013. We expect certain adjustments to take place over the next twenty-four months as a result of exiting the NECA pool, however we do not anticipate that they will be material to our consolidated financial statements or results of operations.Texas ILEC.
An order adopted by the FCC in 2011 (the “Order”) mayhas significantly impactimpacted the amount of support revenue we receive from Universal Servicethe USF, Connect America Fund (“USF”CAF”)/CAF and ICC.intercarrier compensation (“ICC”). The Order reformed core parts of the USF, broadly recast the existing ICC scheme, and established the CAF to replace support revenues provided by the current USF and redirectsredirected support from voice services to broadband services. In 2012, the first phase of the CAF Phase I was implemented, freezingwhich froze USF support to a price cap holding companycarriers until the FCC implementsimplemented a broadband cost model to shift support from voice serviceservices to broadband. Initially, the second phase was anticipated to be implemented July 1, 2013. It is now anticipated that implementation will likely occur no sooner than July 2014. We anticipate that our revenues will be significantly impacted when the broadband cost model is implemented.services. The orderOrder also modifiesmodified the methodology used for ICC traffic exchanged between carriers. The initial phase of ICC reform was effective on July 1, 2012, beginning the transition of our terminating switched access rates to bill-and-keep over a seven year period. Asperiod, and as a result, of implementing the provisions of the Order, during 2013 our network access revenuesrevenue decreased approximately $1.8$1.7 million, compared to 2012.$1.3 million and $1.4 million during 2016, 2015 and 2014, respectively.
In December 2014, the FCC released a report and order that addressed, among other things, the transition to CAF Phase II funding for eligible telecommunicationsprice cap carriers (“ETCs”) to receive high-cost support,and the USF/ICC Transformation Order requires states to certify on an annual basisacceptance criteria for CAF Phase II funding. For companies that federal universal service high-cost support (“USF”)accept the CAF Phase II funding, there is used “only fora three year transition period in instances in which their current CAF Phase I funding exceeds the provision, maintenance, and upgrading of facilities and services for whichCAF Phase II funding. If CAF Phase II funding exceeds CAF Phase I funding, the transitional support is intended”. States,waived and CAF Phase II funding begins immediately. Companies are required to commit to a statewide build out requirement to 10 Mbps downstream and 1 Mbps upstream in turn, require that ETCs file certifications with them asfunded locations. We accepted the basis forCAF Phase II funding in August 2015. The annual funding under CAF Phase I of $36.6 million was replaced by annual funding under CAF Phase II of $13.9 million through 2020. With the state filings withsale of our Iowa ILEC in 2016, this amount was further reduced to $11.5 million through 2020. The acceptance of funding at the FCC. Failure to meet the annual data and certification deadlines can result in reduced support to the ETClower level CAF Phase II will transition over a three year period based on the lengthCAF Phase I funding levels at the rates of 75% in the delayfirst year, 50% in certification. For the calendarsecond year 2013,and 25% in the California state certification was due to be filed withthird year.
In March 2015, the FCC released its net neutrality order which applies to all wireline and wireless providers of broadband internet access services. The net neutrality order addresses several areas that will be regulated and others that are subject to forbearance. The regulations disallow blocking, throttling and paid prioritization by internet service providers. The net neutrality order also requires providers to disclose certain information to consumers on or before October 1, 2012. We were notifiedrates, fees, data allowances and packet loss. Finally, it gives the FCC codified enforcement authority and it forbears on certain Title II regulations. On June 12, 2015, the net neutrality order became effective and has not resulted in January 2013 that SureWest did not submit the required certificationany significant changes to the California Public Utilities Commission (“CPUC”) in time to be included in its October 1, 2012, submission to the FCC. On January 24, 2013,services we filed a certification with the CPUC and filed a petition with the FCC for a waiver of the filing deadline for the annual state certification. On February 19, 2013, the CPUC filed a certification with the FCC with respect to SureWest. On October 29, 2013, the Wireline Competition Bureau of the FCC deniedprovide our petition for a waiver of the annual certification deadline. On November 26, 2013, we applied for a review of the decision made by the FCC staff by the full Commission. Management believes, based on the change in SureWest Telephone’s USF filing status caused by the change in the ownership of SureWest Telephone, the lack of formal notice by the FCC regarding this change in filing status, the fact that SureWest Telephonecustomers, nor has it had a previously-filed certification of compliance in effect with the FCC for the two quarters for which USF was withheld, and the FCC’s past practice of granting waivers to accept late filings in similar situations, that the Company should prevail in its application to the Commission and receive USF funding for the period January 1, 2013, through June 30, 2013. However, due to the denial of our petition by the Wireline Competition Bureau and the uncertainty of the collectability of the previously recognized revenues, in December 2013 we reversed the $3.0 million of previously recognized revenues until such time that the Commission has the opportunity to reach a decisionmaterial impact on our application for review.consolidated financial position or results of operations.
State Matters
California
In an ongoing proceeding relating to the New Regulatory Framework, the CPUCCalifornia Public Utilities Commission (“CPUC”) adopted Decision 06-08-030 in 2006, which grants carriers broader pricing freedom in the provision of telecommunications services, bundling of services, promotions and customer contracts. This decision adopted a new regulatory framework, the Uniform Regulatory Framework (“URF”), which among other things (i) eliminates price regulation and allows full pricing flexibility for all new and retail services, (ii) allows new forms of bundles and promotional packages of telecommunication services, (iii) allocates all gains and losses from the sale of assets to shareholders and (iv) eliminates almost all elements of rate of return regulation, including the calculation of shareable earnings. OnIn December 31, 2010, the CPUC issued a ruling to initiate a new proceeding to assess whether, or to what extent, the
42
Table of Contents
level of competition in the telecommunications industry is sufficient to control prices for the four largest ILECs in the state. Subsequently, the CPUC issued a ruling temporarily deferring the proceeding. The status on whenWhen the CPUC may open this proceeding is unclear and on hold at this time. The CPUC’s actions in this and future proceedings could lead to new rules and an increase in government regulation. The Company will continue to monitor this matter.
Pennsylvania
In 2011, the Pennsylvania Public Utilities Commission (“PAPUC”) issued an intrastate access reform order reducing intrastate access rates to interstate levels in a three-step process, which began in March 2012. With the release of the FCC order in November 2011, the PAPUC temporarily issued a stay. A final stay was issued in 2012 to implement the FCC ordered intrastate access rate changes. The PAPUC had indicated that it would address state universal funding in 2013, but delayed conducting a proceeding pending any state legislative activity that may occur in the 20142017 legislative session. The Company will continue to monitor this matter.
Texas
The Texas Public Utilities Regulatory Act (“PURA”) directs the Public Utilities Commission of Texas (“PUCT”) to adopt and enforce rules requiring local exchange carriers to contribute to a state universal service fund that helps telecommunications providers offer basic local telecommunications service at reasonable rates in high costhigh-cost rural areas. The Texas Universal Service Fund is also used to reimburse telecommunications providers for revenues lost by providing lifeline service. Our Texas rural telephone companies receive disbursements from this fund.
Our Texas ILECs receivehave historically received support from two state funds, the small and rural incumbent local exchange company plan High Cost Fund (“HCF”) and the high cost assistance fundHigh Cost Assistance Fund (“HCAF”). The HCF is a line-based fund used to keep local rates low. The rate is applied on all residential lines and up to five single business lines. The amount we receive from the HCAF is a frozen monthly amount that was originally developed to offset high intrastate toll rates.
In September 2011, the Texas state legislature passed Senate Bill No. 980/House Bill No. 2603 which, among other things, mandated the PUCT to review the Universal Service Fund and issue recommendations by January 1, 2013 with the intent to effectively eliminatereduce the HCF.size of the Universal Service Fund. This would be accomplished by implementing an urban floor to offset state funding reductions with a phase-in period of four years. The PUCT recommended that (i) frozen line counts be lifted effective September 1, 2013 and (ii) rural and urban local rate benchmarks be developed. The large company fund review was completed in September 2012 and the PUCT addressed the small fund participants in Docket 41097 Rate Rebalancing (“Docket 41097”), as discussed below. The elimination of the frozen line counts is not expected to impact funding until the first quarter of 2014. The potential impact on funding related to the urban benchmark is pending the docketed proceeding as well as potential legislative action. The Company will continue to monitor this matter.
In June 2013, the Texas state legislature passed Senate Bill No. 583 (“SB 583”). The provisions of SB 583 were effective September 1, 2013 and froze HCF and HCAF support for the remainder of 2013 and will eliminate2013. As of January 1, 2014, our annual $1.4 million HCAF support effective January 1, 2014.was eliminated and the frozen HCF support returned to funding on a per line basis. In July 2013, the Company entered into a settlement agreement with the PUCT on Docket 41097, which was approved by the PUCT onin August 30, 2013. In accordance with the provisions of the settlement agreement, ourthe HCF draw will be reduced by approximately $1.2 million annually or approximately $4.8 million in total, over a 4four year period beginning June 1, 2014 through 2017.2018. However, we have the ability to fully offset this reduction with increases to residential rates where market conditions will allow.allow, which the Company filed for in April 2014 and implemented in June 2014.
In addition, the PUCT is required to develop a needs test for post-2017 funding and has held workshops on various proposals. The PUCT issued its recommendation to the Texas state commissioners in May 2014, which was approved in December 2014. The needs test allows for a one-time disaggregation of line rates from a per line flat rate, then a competitive test must be met to receive funding. The Company filed its submission for the needs test on December 28, 2016. The PUCT issued docket 46699 on January 4, 2017 to review the filing and a decision is expected in the second quarter of 2017.
Other Regulatory Matters
We are also subject to a number of regulatory proceedings occurring at the federal and state levels that may have a material impact on our operations. The FCC and state commissions have authority to issue rules and regulations related to our business. A number of proceedings are pending or anticipated that are related to such telecommunications issues as competition, interconnection, access charges, intercarrier compensation, broadband deployment, consumer protection and universal service reform. Some proceedings may authorize new services to compete with our existing services. Proceedings that relate to our cable television operations include rulemakings on set top boxes, carriage of programming, industry consolidation and ways to promote additional competition. There are various on-going legal challenges to the scope or validity of FCC orders that have been issued. As a result, it is not yet possible to fully determine fully the impact of the related FCC rules and regulations on our operations.
Non-Operating Items
Other Income andInterest Expense, Net
Interest expense, net of interest income, increased $13.2decreased $2.8 million during 20132016 compared to 2012. The increase2015 primarily due to a reduction in the interest rate for our outstanding senior notes. In June 2015, we issued an additional $300.0 million in 6.50% Senior Notes due 2022, which were used, in part, to redeem the then-remaining amount of our outstanding 10.875% Senior Notes due 2020. Interest expense was due primarily to an increasealso reduced in total2016 from a decline in outstanding debt outstandingunder our revolving credit facility as well as a result of the acquisition of SureWestdecrease in 2012, which included the issuance of a $300.0 million Senior Note offering in May 2012 and the issuance of incremental term loans under our credit facility in December 2012, as described in the Liquidity and Capital Resources section below. An increase in interest rates on outstanding borrowings under our credit facility, which was amended in December 2012, also contributed to the increase in interest expense during 2013. The increase in the current year was offset in part by amortized financing costs of $4.2 million for the temporary bridge loan facility obtained to fund the SureWest acquisition in 2012. In addition, interest expense related to our interest rate swap agreements has declinedagreements.
During 2015, interest expense, net of interest income, decreased $2.9 million compared to 2014 primarily due to a reduction in the maturityinterest rate for our outstanding senior notes as a result of severalthe redemption of our outstanding 10.875% Senior Notes due 2020, as described above. Interest expense was also reduced in 2015 by declines in non-cash interest expense related to our de-designated interest rate swap agreements during 2013.and additional financing costs in 2014 related to the bridge loan facility obtained for the Enventis acquisition.
In 2013, interest rate swaps previously designated as cash flow hedges were de-designated as a result of amendments to our credit agreement. These interest rate swap agreements matured on various dates through September 2016. Prior to de-designation, the effective portion of the change in fair value of the interest rate swaps were recognized in accumulated other comprehensive income (loss) (“AOCI”). The balance of the unrealized loss included in AOCI as of the date the swaps were de-designated is being amortized to earnings over the remaining term of the swap agreements. Changes in fair value of the de-designated swaps are immediately recognized in earnings as interest expense. During the years ended December 2012,31, 2016, 2015 and 2014, gains of $0.2 million, $0.8 million and $1.6 million, respectively, were recognized as a reduction to interest expense for the change in fair value of the de-designated swaps.
Loss on Extinguishment of Debt
In 2016, we entered into a Second Amendmentamended our Credit Agreement to restate and Incremental Facility Agreement (the “Second Amendment”) to amend our term loan credit facility. Underfacilities. In connection with entering into the terms of the Second Amendment, we issued incremental term loans in the aggregate amount of $515.0 millionamended and used the proceeds in part to pay off the outstanding term loan debt that was due to mature December 31, 2014. In December 2013, we entered into a Second Amended and Restated Credit Agreement (the “Restated Agreement”) to restate the existingrestated credit agreement. Under the terms of the Restated Agreement, we issued term loans in the aggregate amount of $910.0 million and used the proceeds to pay off the outstanding term loans that were scheduled to mature in 2017 and 2018. As a result,agreement, we incurred a loss on the extinguishment of debt of $7.7 million and $4.5$6.6 million during the yearsyear ended December 31, 20132016.
In 2014, we redeemed $72.8 million of the original aggregate principal amount of our 10.875% Senior Notes due 2020, as described in the “Liquidity and 2012, respectively, relatedCapital Resources” section below. In connection with the redemption of the 2020 Notes, we paid $84.1 million and recognized a loss of $13.8 million on the partial extinguishment of debt during the year ended December 31, 2014. In 2015, we redeemed the remaining $227.2 million of the 2020 Notes for $261.9 million and recognized a loss on the extinguishment of debt of $41.2 million during 2015.
Other Income
Other income decreased $1.0 million during 2016 compared to the repayment of our outstanding term loans.
Investment income increased $7.0same period in 2013 compared to 2012,2015, primarily due to highera decline in investment income of $3.7 million due to lower earnings from our wireless partnership interests. Other,In addition, we recognized an impairment loss of $0.8 million as a result of the sale of our equity interest in Central Valley Independent Network, LLC in 2015. However, other, net decreased $1.1increased $2.7 million compared to 2015 due to the reversal of a legal contingency of $0.8 million in 20132016 while 2015 included additional reserves related to disputed tax assessments.
In 2015, other income increased $1.6 million compared to 2012,2014 primarily due to an agreementincrease in principle reachedinvestment income of $2.2 million as a result of increased earnings from our wireless partnership interests, which was reduced in legal disputepart by an impairment loss of $0.8 million recognized during 2015 from the sale of our equity interest in Central Valley Independent Network, LLC. Other, net decreased $0.6 million compared to 2014 primarily due to additional reserves related to disputed tax assessments recognized in 2015.
Income Taxes
Income taxes increased $20.2 million in 2016 compared to 2015. Our effective rate was 60.2% for 2016 compared to 131.9% for 2015. In 2016, we placed additional valuation allowances on state NOL and state tax credit carryforwards of $8.4 million and related deferred tax assets of $0.6 million. We also recorded a net decrease of $1.5 million to our net state deferred tax liabilities and a corresponding decrease to our state tax expense due to changes in state deferred income tax
rates. On September 1, 2016, we completed the sale of all the issued and outstanding stock of CCIC in a taxable transaction. As a result, we recorded an increase to our current year. See Note 11tax expense of $7.2 million to reflect the tax impact of the transaction. On December 5, 2016, we completed the sale of substantially all of the assets of our EIS business. As a result, we recorded an increase to our current tax expense of $1.5 million related to the Consolidated Financial Statementsderecognition of $4.2 million of noncash goodwill allocated to the disposed business that is not deductible for tax purposes. In 2015, we placed additional valuation allowances on state NOL and state tax credit carryforwards of $5.0 million and related deferred tax assets of $0.9 million. We also recorded a more detailed discussion regardingnet increase of $1.9 million to our net state deferred tax liabilities and a corresponding increase to our state tax expense due to changes in state deferred income tax rates. Exclusive of these adjustments, our effective tax rate for 2016 would have been approximately 38.8% compared to 7.9% for 2015. The 2016 effective tax rate differed from the agreementfederal and state statutory rates primarily due to differences in principle.
Income Taxesallocable income for the Company’s state tax filings.
Income taxes increased $16.9decreased $10.2 million in 20132015 compared to 2012.2014. Our effective rate was 36.9%131.9% for 20132015 compared to 11.7%45.8% for 2012. During 2013,2014. In 2015, we recognized $1.2placed additional valuation allowances on state NOL and state tax credit carryforwards of $5.0 million and related deferred tax assets of our previously unrecognized tax benefits, which resulted in$0.9 million. We also recorded a decreasenet increase of $1.9 million to our net state deferred tax liabilities and a corresponding increase to our state tax expense of $0.8 million, due to changes in state deferred income tax rates. In 2014, we released the expirationfull $1.5 million valuation allowance and related deferred tax asset of $0.5 million maintained against the Federal NOL carryforwards subject to separate return limitation year restrictions and placed a valuation allowance on the state statutetax credit carryforwards of limitations. We also recognized approximately $0.7$0.5 million and related deferred tax asset of tax expense during 2013 to adjust our 2012 provision to match our 2012 returns.$0.3 million. The acquisition of SureWestEnventis on July 2, 2012October 16, 2014 resulted in changes to our unitary state filings and correspondingly our state deferred income taxes. These changes resulted in a net decreaseincrease of $1.1$2.1 million to our net state deferred tax liabilities and a corresponding decreaseincrease to our state tax. In addition, we incurred non-deductible transaction costs in relation to the acquisition that resulted in an increase to our tax provision of $0.8$0.7 million. Exclusive of these adjustments, our effective tax rate for 20132015 would have been approximately 37.1%7.9% compared to 16.6%36.6% for 2012.2014. The adjusted2015 effective tax rate for 2012 is lowerdiffered from the federal and state statutory rates primarily due to state taxabletax credits and differences in allocable income differences andfor the Company’s state tax credits.filings.
2012 versus 2011
Operating Revenues
Local Calling Services
Local calling services revenue increased $9.3 million during 2012 compared to 2011 primarily due to the acquisition of SureWest. Excluding the addition of SureWest revenues, local calling services decreased $8.1 million during 2012 compared to 2011 primarily due to a 3% decline in local access lines. The number of local access lines in service directly affects the recurring revenue we generate from end users and continues to be impacted by the industry-wide decline in access lines.
Network Access Services
Network access services revenue increased $18.1 million during 2012 compared to 2011 primarily as a result of the acquisition of SureWest, which accounted for $21.3 million of the annual increase. Excluding the addition of the SureWest revenues, network access services decreased $3.2 million during 2012 compared to 2011 primarily due to a decline in switched access minutes of use and special access revenue. These decreases were partially offset by an increase in end user and access recovery revenues.
44
Table of Contents
Video, Data and Internet Services
Video, data and Internet revenue increased $93.7 million during 2012 compared to 2011 primarily as a result of the acquisition of SureWest, which accounted for $84.9 million of the annual increase. The increase in revenue was also due to the continued growth in data and video connections, which increased 7% and 9%, respectively, as of December 31, 2012. Video, data and Internet revenue comprised 37% of our consolidated revenues in 2012 compared to 24% in 2011. We expect video, data and Internet service revenue to continue to grow as the consumer and business demand for data based services continues to increase.
Subsidies
Subsidy revenues increased $3.9 million during 2012 compared to 2011 primarily as a result of the acquisition of SureWest, an increase in high cost fund support and the addition of revenues from the Connect America Fund in 2012.
Long-Distance Services
Long-distance services revenue increased $1.4 million during 2012 compared to 2011 primarily due to the acquisition of SureWest. Excluding the addition of SureWest revenues, long distance services decreased $2.4 million during 2012 compared to 2011 primarily due to the decline in access lines as described above and the shift in customers moving to unlimited long-distance plans.
Other Services
Other services revenue increased $2.5 million during 2012 compared to 2011. The increase in other services revenue was primarily due to the acquisition of SureWest and an increase in transport services, which was offset in part by a decline in directory publishing revenues and equipment system sales.
Operating Expenses
Cost of Services and Products
Cost of services and products increased $54.2 million during 2012 compared to 2011 primarily as a result of the addition of the SureWest operations of $53.0 million as well as higher costs associated with video programming. Video programming costs continue to increase due to the growth in video connections and an increase in costs per program channel. During 2012, the increase in video programming costs was offset in part by a reduction in access costs due to the decline in access lines and usage.
Selling, General and Administrative Costs
Selling, general and administrative costs increased $30.4 million during 2012 compared to 2011 primarily as a result of the addition of the operations for SureWest, which accounted for $30.1 million of the annual increase. The remaining increase in selling, general and administrative costs was due to an increase in insurance costs and stock compensation expense, which were largely offset by a reduction in bad debt expense, utility costs and legal expenses.
Transaction/Debt refinancing costs
In connection with the acquisition of SureWest, we incurred $20.8 million of transaction related fees which were recognized as a financing and other transaction costs during 2012. In 2011, we amended our credit agreement and incurred fees of $2.6 million, which were recognized as a financing cost during 2011.
Depreciation and Amortization
Depreciation and amortization expense increased $32.3 million during 2012 compared to 2011, primarily as a result of the acquisition of SureWest. Excluding the addition of the operations for SureWest, which accounted for $36.4 million of the current year increase, depreciation and amortization expense decreased $4.1 million in 2012 as a result of circuit equipment and other assets becoming fully depreciated during the year.
Non-Operating Items
Other Income and Expense, Net
Interest expense, net of interest income, increased $23.2 million during 2012 compared to 2011. In February 2012, we entered into a temporary $350.0 million Senior Unsecured Bridge Loan Facility (“Bridge Facility”) to fund the
45
Table of Contents
SureWest acquisition. During 2012, we incurred $4.2 million of amortization related to the financing costs and $1.5 million of interest related to ticking fees associated with the Bridge Facility. In May 2012, we finalized the financing for the SureWest acquisition and entered into a Senior Note offering (“Senior Notes”), effectively replacing our Bridge Facility. Interest expense in 2012 included $19.2 million of interest expense related to the Senior Notes.
In December 2012, we entered into a Second Amendment and Incremental Facility Agreement (the “Second Amendment”) to amend our term loan facility. Under the terms of the Second Amendment, we issued incremental term loans in the aggregate amount of $515.0 million and used the proceeds in part to pay off the outstanding term loan debt that was due to mature December 31, 2014. As a result, we incurred a loss on the extinguishment of debt of $4.5 million related to the repayment of our outstanding term loan.
Investment income increased by $2.8 million during 2012 compared to 2011 primarily due to higher earnings from our wireless partnership interests.
Income Taxes
Income taxes decreased $12.5 million in 2012 compared to 2011. Our effective rate was 11.7% for 2012 compared to 35.1% for 2011. The acquisition of SureWest on July 2, 2012 resulted in changes to our unitary state filings and correspondingly our state deferred income taxes. These changes resulted in a net decrease of $1.1 million to our net state deferred tax liabilities and a corresponding decrease to our state tax. In addition, we incurred non-deductible transaction costs in relation to the acquisition that resulted in an increase to our tax provision of $0.8 million. Exclusive of these adjustments our effective tax rate for 2012 would have been approximately 16.6%. The adjusted effective tax rate for 2012 was lower primarily due to state taxable income differences and state tax credits.
Non-GAAP Measures
In addition to the results reported in accordance with US GAAP, we also use certain non-GAAP measures such as EBITDA and adjusted EBITDA to evaluate operating performance and to facilitate the comparison of our historical results and trends. These financial measures are not a measure of financial performance under US GAAP and should not be considered in isolation or as a substitute for net income as a measure of performance and net cash provided by operating activities as a measure of liquidity. They are not, on their own, necessarily indicative of cash available to fund cash needs as determined in accordance with GAAP. The calculation of these non-GAAP measures may not be comparable to similarly titled measures used by other companies. Reconciliations of these non-GAAP measures to the most directly comparable financial measures presented in accordance with GAAP are provided below.
EBITDA is defined as net earnings before interest expense, income taxes, and depreciation and amortization. Adjusted EBITDA is comprised of EBITDA, adjusted for certain items as permitted or required under our credit facility as described in the reconciliations below. These measures are a common measure of operating performance in the telecommunications industry and are useful, with other data, as a means to evaluate our ability to fund our estimated uses of cash.
46
The following tables are a reconciliation of net cash provided by operating activitiesincome (loss) to adjusted EBITDA for the years ended December 31, 2013, 20122016, 2015 and 2011:2014:
| | | | | | | | | | | | |
| | | | | |
| | Year Ended December 31, | | | Year Ended December 31, | |
(In thousands, unaudited) | | 2013 | | 2012 | | 2011 | | | 2016 | | 2015 | | 2014 | |
Net cash provided by operating activities from continuing operations | | $ | 168,530 | | | $ | 119,732 | | | $ | 124,302 | | |
Adjustments: | | | | | | | | | | | | | |
Non-cash, stock-based compensation | | | (3,028 | ) | | | (2,348 | ) | | | (2,132 | ) | |
Other adjustments, net | | | (24,750 | ) | | | (9,653 | ) | | | (10,914 | ) | |
Changes in operating assets and liabilities | | | 28,486 | | | | 17,566 | | | | 1,122 | | |
Interest expense, net | | | 85,767 | | | | 72,604 | | | | 49,391 | | |
Income taxes | | | 17,512 | | | | 661 | | | | 13,141 | | |
Net income (loss) | | | | $ | 15,196 | | $ | (671) | | $ | 15,388 | |
Add (subtract): | | | | | | | | | | | | |
Interest expense, net of interest income | | | | | 76,826 | | | 79,618 | | | 82,537 | |
Income tax expense | | | | | 22,962 | | | 2,775 | | | 13,027 | |
Depreciation and amortization | | | | | 174,010 | | | 179,922 | | | 149,435 | |
EBITDA | | | 272,517 | | | | 198,562 | | | | 174,910 | | | | | 288,994 | | | 261,644 | | | 260,387 | |
| | | | | | | | | | | | | | | | | | | | | | | |
Adjustments to EBITDA: | | | | | | | | | | | | | | | | | | | | | | | |
Other, net (1) | | | (31,529 | ) | | | (3,894 | ) | | | (20,400 | ) | | | | (24,955) | | | (22,360) | | | (23,920) | |
Investment distributions (2) | | | 34,833 | | | | 29,217 | | | | 28,410 | | | | | 32,144 | | | 45,316 | | | 34,600 | |
Loss on extinguishment of debt | | | 7,657 | | | | 4,455 | | | | - | | | | | 6,559 | | | 41,242 | | | 13,785 | |
Impairment of intangible assets | | | - | | | | 1,236 | | | | - | | |
Non-cash, stock-based compensation (3) | | | 3,028 | | | | 2,348 | | | | 2,132 | | | | | 3,017 | | | 3,060 | | | 3,636 | |
Adjusted EBITDA | | $ | 286,506 | | | $ | 231,924 | | | $ | 185,052 | | | | $ | 305,759 | | $ | 328,902 | | $ | 288,488 | |
| (1) | | Other, net includes the equity earnings from our investments, dividend income, income attributable to noncontrolling interests in subsidiaries, acquisition and transaction related costs including severance and certain other miscellaneous items. |
| (2) | | Includes all cash dividends and other cash distributions received from our investments. |
| (3) | | Represents compensation expenses in connection with issuance of stock awards, which because of the non-cash nature of these expenses are excluded from adjusted EBITDA. |
(1)Other, net includes the equity earnings from our investments, dividend income, income attributable to noncontrolling interests in subsidiaries, transaction related costs including severance and certain other miscellaneous items.
(2)Includes all cash dividends and other cash distributions received from our investments.
(3)Represents compensation expenses in connection with issuance of stock awards, which because of the non-cash nature of these expenses are excluded from adjusted EBITDA.
Liquidity and Capital Resources
Outlook and Overview
Our operating requirements have historically been funded from cash flows generated from our business and borrowings under our credit facilities. We expect that our future operating requirements will continue to be funded from cash flows from operating activities, existing cash and cash equivalents, and, if needed, from borrowings under our revolving credit facility and our ability to obtain future external financing. We anticipate that we will continue to use a substantial portion of our cash flow to fund capital expenditures, meet scheduled payments of long-term debt, make dividend payments and to invest in future business opportunities.
The following table summarizes our cash flows:
| | | Years Ended December 31, |
| | | 2013 | | | 2012 | | | 2011 |
Cash flows provided by (used in): | | | | | | | | | |
Operating activities: | | | | | | | | | |
Continuing operations | | $ | 168,530 | | $ | 119,732 | | $ | 124,302 |
Discontinued operations | | | (4,174) | | | 3,483 | | | 5,202 |
Investing activities | | | | | | | | | |
Continuing operations | | | (107,436) | | | (468,462) | | | (40,682) |
Discontinued operations | | | 2,331 | | | (97) | | | (119) |
Financing activities | | | | | | | | | |
Continuing operations | | | (71,554) | | | 257,494 | | | (50,653) |
Increase (decrease) in cash and cash equivalents | | $ | (12,303) | | $ | (87,850) | | $ | 38,050 |
| | | | | | | | | | |
| | Years Ended December 31, | |
(In thousands) | | 2016 | | 2015 | | 2014 | |
Cash flows provided by (used in): | | | | | | | | | | |
Operating activities | | $ | 218,233 | | $ | 219,179 | | $ | 187,785 | |
Investing activities | | | (108,287) | | | (119,540) | | | (246,861) | |
Financing activities | | | (98,747) | | | (90,440) | | | 60,204 | |
Increase (decrease) in cash and cash equivalents | | $ | 11,199 | | $ | 9,199 | | $ | 1,128 | |
47
Table of Contents
Cash Flows Provided by Operating Activities
Net cash provided by operating activities from continuing operations was $168.5$218.2 million in 2013, an increase2016, a decrease of $48.8$0.9 million as compared to 2012.2015. Cash flows provided by operating activities increaseddecreased primarily as a result of changes in working capital related to the timing in the payment of expenditures. In 2016, cash distributions received from our wireless partnerships also decreased $13.2 million due in part to a non-recurring cash distribution received for the sale of the partnership owned towers in 2015. However, cash contributions to our defined benefit pension plan decreased $11.3 million in 2016 as compared to 2015. In
addition, in 2015, net cash provided by operating activities included the payment of various change-in-control and severance agreements as a result of the additional cash flows provided by the additionacquisition of the SureWest operations and a decreaseEnventis in accounts receivable. These increases were offset in part by a decrease in accounts payable and accrued expenses related to the timing in payments to suppliers and the payment of accrued transaction costs during 2013.2014.
Cash Flows Used In Investing Activities
Net cash used in investing activities from continuing operations was $107.4$108.3 million during 20132016 and consisted primarily of cash used for capital expenditures.expenditures and the acquisition of CTC and cash proceeds provided from the sale of CCIC and EIS.
Capital Expenditures
Capital expenditures continue to be our primary recurring investing activity and were $107.4$125.2 million in 2013, an increase2016, a decrease of $30.4$8.7 million compared to 2012. The increase in capital expenditures was due to the addition and integration of the SureWest operations and increased investment in commercial and residential services.2015. Capital expenditures for 20142017 are expected to be $95.0$115.0 million to $105.0$120.0 million, of which 61%approximately 56% is planned for success-based capital projects for residentialconsumer, commercial and commercialcarrier initiatives. Capital expenditures in 20142017 and subsequent years will depend on various factors, including competition, changes in technology, regulatory changes and the timing in the deployment of new services. We expect to continue to invest in existing and new services and the expansion of our fiber network in order to retain and acquire more customers through a broader set of products.products and an expanded network footprint.
Acquisitions and Dispositions
On July 1, 2016, we acquired substantially all of the assets of CTC, a private business communications provider in the Champaign-Urbana, IL area. The aggregate purchase price, including customary working capital adjustments, consisted of cash consideration of $13.4 million, which was paid from our existing cash resources.
In 2016, we received cash proceeds of $30.1 million for the sale of CCIC, our rural ILEC business located in northwest Iowa and the sale of EIS, our non-core equipment and IT services business.
Cash Flows Provided by (Used In) Financing Activities
Net cash provided byused in financing activities from continuing operations consists primarily of our proceeds and principal payments on long-term borrowings and the payment of dividends.
Long-term Debt
The following table summarizes our indebtedness as of December 31, 2013:2016:
| | | | | | | | | |
(In thousands) | | Balance | | Maturity Date | | Rate(1) | | | Balance | | Maturity Date | | Rate(1) | |
Senior Notes, net of discount | | $ | 298,301 | | June 1, 2020 | | 10.875% | | |
Term loan 4, net of discount | | 905,463 | | December 23, 2020 | | LIBOR plus 3.25% | | |
6.50% Senior Notes, net of discount | | | $ | 495,698 | | October 1, 2022 | | 6.50 | % |
Term loan 5, net of discount | | | | 893,088 | | October 5, 2023 | | LIBOR plus 3.00 | % |
Revolving loan | | 13,000 | | December 23, 2018 | | LIBOR plus 3.00% | | | | — | | October 5, 2021 | | LIBOR plus 3.00 | % |
Capital leases | | 5,121 | | May 31, 2021 | | 12.73% (2) | | | | 16,857 | | May 31, 2021 | | 6.83 | % (2) |
| | $ | 1,221,885 | | | | | | | $ | 1,405,643 | | | | | |
| (1) | | At December 31, 2016, the 1-month LIBOR applicable to our borrowings was 0.64%. The Term 5 loan is subject to a 1.00% LIBOR floor. |
| (2) | | Weighted-average rate. |
(1)At December 31, 2013, the 1-month London Interbank Offered Rate (“LIBOR”) applicable to our borrowings was 0.17%. The Term 4 loan is subject to a 1.00% LIBOR floor.Credit Agreement
(2)Weighted-average rate.
Credit Agreement
TheIn October 2016, the Company, through certain of its wholly owned subsidiaries, has an outstanding credit agreement with several financial institutions. In December 2013, we entered into a SecondThird Amended and Restated Credit Agreement with various financial institutions (the “Credit Agreement”) to restatereplace the Company’s previously amended credit agreement. The restated credit agreement consistsrefinancing of a $75.0 millionthe Credit Agreement increased the borrowing capacity of the revolving creditloan facility, extended the maturities of the debt outstanding, reduced the interest rate of the term loan, and increased the secured leverage ratio of the incremental term loan facility. Under the terms of the new Credit Agreement, we issued initial term loans in the aggregate amount of $910.0$900.0 million (“Term 4”5”). The and used the proceeds from the restated credit agreement were usedin part to repay the outstanding term loans from the previous agreement in its entirety. We also obtained a revolving loan facility of $110.0
million to replace the existing $75.0 million revolving credit facility scheduled to mature in December 2018. The credit agreementCredit Agreement also includes an incremental term loan facility, which provides the ability to request to borrow up to $300.0 million of incremental term loans subject to certain terms and conditions.conditions and can borrow more than $300.0 million provided that its senior secured leverage ratio would not exceed 3.00:1.00. Borrowings under the senior secured credit facility are secured by substantially all of the assets of the Company and its subsidiaries, with the exception of Consolidated Communications of Illinois Company (formerly Illinois Consolidated Telephone CompanyCompany) and our majority-owned subsidiary, East Texas Fiber Line Incorporated.
The Term 4 loan facility consists of an original aggregate principal amount of $910.0 million with a maturity date of December 23, 2020, but is subject to earlier maturity on December 31, 2019 if the Company’s unsecured Senior Notes due in 2020 (“Senior Notes”) are repaid or redeemed in full by December 31, 2019. The Term 4 loan contains an original issuance discount of $4.6 million, which is being amortized over the term of the loan. The Term 4 loan
48
Table of Contents
requires quarterly principal payments of $2.3 million commencing March 31, 2014 and has an interest rate of LIBOR plus 3.25% subject to a 1.00% LIBOR floor.
Our revolving credit facility has a maturity date of December 23, 2018 and an applicable margin (at our election) of between 2.50% and 3.25% for LIBOR-based borrowings and between 1.50% and 2.25% for alternate base rate borrowings, depending on our leverage ratio. Based on our leverage ratio at December 31, 2013, the borrowing margin for the next three month period ending March 31, 2014 will be at a weighted-average margin of 3.00% for a LIBOR-based loan or 2.00% for an alternative base rate loan. The applicable borrowing margin for the revolving credit facility is adjusted quarterly to reflect the leverage ratio from the prior quarter-end. As of December 31, 2013, $13.0 million was outstanding under the revolving credit facility. There were no borrowings or letters of credit outstanding under the revolving credit facility at December 31, 2012.
The weighted-average interest rate on outstanding borrowings under our credit facility was 4.23% and 4.79% at December 31, 2013 and 2012, respectively. Interest is payable at least quarterly.
Net proceeds from asset sales exceeding certain thresholds, to the extent not reinvested, are required to be used to repay loans outstanding under the credit agreement.
Financing Costs
In connection with entering into the restated credit agreement in December 2013,October 2016, fees of $6.6$3.9 million were capitalized as deferred debt issuance costs. These capitalized costs are amortized over the term of the debt and are included as a component of interest expense in the consolidated statements of income.operations. We also incurred a loss on the extinguishment of debt of $7.7$6.6 million during the year ended December 31, 20132016 related to the repayment of the outstanding term loansloan under the previous credit agreement, which werewas scheduled to mature in December 2017 and 2018.2020.
The credit agreementTerm 5 loan was previously amendedissued in December 2012, to issue incremental term loans (Term 3) which were used to repay outstanding term loans scheduled to mature in December 2014, to extend thean original aggregate principal amount of $900.0 million with a maturity dates of outstanding term loans (Term 2) from December 2014 to December 2017 and to extend the termination date of October 5, 2023, but is subject to earlier maturity on March 31, 2022 if the revolvingCompany’s unsecured Senior Notes due in October 2022 are repaid in full or redeemed in full on or prior to March 31, 2022. The Term 5 loan facility. In connection with entering intocontains an original issuance discount of 0.25%, which is being amortized over the December 2012 amendment, feesterm of $4.2the loan. The Term 5 loan requires quarterly principal payments of $2.25 million, were capitalized as deferred debt issuance costs and we recognized a loss on the extinguishment of debt of $4.5 million during the year endedwhich commenced December 31, 2012.2016, and has an interest rate of 3.00% plus LIBOR subject to a 1.00% LIBOR floor.
In February 2012,The revolving credit facility has a maturity date of October 5, 2021 and an applicable margin (at our election) of between 2.50% and 3.25% for LIBOR-based borrowings or between 1.50% and 2.25% for alternate base rate borrowings, depending on our leverage ratio. Based on our leverage ratio at December 31, 2016, the termsborrowing margin for the next three month period ending March 31, 2017 will be at a weighted-average margin of 3.00% for a LIBOR-based loan or 2.00% for an alternate base rate loan. The applicable borrowing margin for the revolving credit facility is adjusted quarterly to reflect the leverage ratio from the prior quarter-end. As of December 31, 2016, there were no outstanding borrowings under the revolving credit facility. At December 31 2015, borrowings of $10.0 million were outstanding under the revolving credit facility. A stand-by letter of credit of $1.6 million, issued in connection with the Company’s insurance coverage, was outstanding under our revolving credit facility as of December 31, 2016. The stand-by letter of credit is renewable annually and reduces the borrowing availability under the revolving credit facility. As of December 31, 2016, $108.4 million was available for borrowing under the revolving credit facility.
The weighted-average interest rate on outstanding borrowings under our credit facility were amended to provide us with the ability to incur indebtedness necessary to finance the acquisition of SureWest, which enabled us to issue the Senior Notes as described below. In connection with the amendment, fees of $3.5 million were recognized as financingwas 4.00% and other transaction costs during the year ended4.24% at December 31, 2012.2016 and 2015, respectively. Interest is payable at least quarterly.
Credit Agreement Covenant Compliance
The credit agreement contains various provisions and covenants, including, among other items, restrictions on the ability to pay dividends, incur additional indebtedness and issue capital stock. We have agreed to maintain certain financial ratios, including interest coverage and total net leverage ratios, all as defined in the credit agreement. As of December 31, 2013,2016, we were in compliance with the credit agreement covenants.
In general, our credit agreement restricts our ability to pay dividends to the amount of our Available Cash as defined in our credit agreement. As of December 31, 2013,2016, and including the $15.5$19.6 million dividend declared in November 2013October 2016 and paid on February 1, 2014,2017, we had $202.4$269.3 million in dividend availability under the credit facility covenant.
Under our credit agreement, if our total net leverage ratio, (asas defined in the credit agreement),agreement, as of the end of any fiscal quarter, is greater than 5.10:1.00, we will be required to suspend dividends on our common stock unless otherwise permitted by an exception for dividends that may be paid from the portion of proceeds of any sale of equity not used to fund acquisitions, or make other investments. During any dividend suspension period, we will be required to repay debt in an amount equal to 50.0% of any increase in Available Cash, among other things. In addition, we will not be permitted to pay dividends if an event of default under the credit agreement has occurred and is continuing. Among other things, it will be an event of default if our total net leverage ratio and interest coverage ratio as of the end of any fiscal quarter is greater than 5.25:1.00 and less than 2.25:1.00, respectively. As of December 31, 2013,2016, our total net leverage ratio under the credit agreement was 4.26:4.49:1.00, and our interest coverage ratio was 3.41:3.97:1.00.
49
Senior NotesCommitted Financing
On May 30, 2012, we completed an offeringIn connection with the execution of $300.0 million aggregate principal amount of 10.875% unsecured Senior Notes, due 2020 through our wholly-owned subsidiary, Consolidated Communications Finance Co. (“Finance Co.”) forthe Merger Agreement, in December 2016, the Company entered into two amendments to its Credit Agreement to secure committed financing related to the acquisition of SureWest. The Senior Notes will mature on JuneFairPoint. On December 14, 2016, we entered into Amendment No. 1 2020 and earn interest at a rate of 10.875% per year, payable semi-annually in arrears on June 1 and December 1 of each year, commencing on December 1, 2012. The Senior Notes were sold into the United StatesCredit Agreement, to qualified institutional buyers pursuant to Rule 144Aincrease the senior secured incremental term loan credit facility under the Securities ActCredit Agreement from $865.0 million to an aggregate amount of 1933 (the “Securities Act”)$935.0 million. Fees of $2.5 million paid to the lenders in connection with Amendment No. 1 are reflected as an additional discount on the Term 5 loan and outside the United States in compliance with Regulation S under the Securities Act. In addition, some of the Senior Notes were sold to certain “accredited investors” (as defined in Rule 501 under the Securities Act). The Senior Notes were sold to investors at a price equal to 99.345% of the principal amount thereof, for a yield to maturity of 11.00%. This discount is beingwill be amortized over the term of the Senior Notes.debt as interest expense. On December 21, 2016, the Company entered into Amendment No. 2 to the Credit Agreement in which a syndicate of lenders has agreed to provide an incremental term loan in an aggregate principal amount of up to $935.0 million under the Credit Agreement (the “Incremental Term Loan”), subject to the satisfaction of certain conditions. The proceeds of the saleIncremental Term Loan may be used, in part, to repay and redeem certain existing indebtedness of FairPoint and to pay certain fees and expenses in connection with the merger and the related financing. The terms, conditions and covenants of the Incremental Term Loan are materially consistent with those in the existing Credit Agreement, as described above. The Incremental Term Loan included an original issue discount of 0.50% and has an interest rate of 3.00% plus LIBOR based on the one-month adjusted rate subject to a 1.00% LIBOR floor. Ticking fees will begin accruing on the Incremental Term Loan commitments on January 15, 2017 at the rate equal to the interest rate of the Incremental Term Loan.
Senior Notes
6.50% Senior Notes due 2022
In September 2014, we completed an offering of $200.0 million aggregate principal amount of 6.50% Senior Notes due in October 2022 (the “Existing Notes”). The Existing Notes were priced at par, which resulted in total gross proceeds of $200.0 million. On June 8, 2015, we completed an additional offering of $300.0 million in aggregate principal amount of 6.50% Senior Notes due 2022 (the “New Notes” and together with the Existing Notes, the “Senior Notes”). The New Notes were issued as additional notes under the same indenture pursuant to which the Existing Notes were previously issued on in September 2014. The New Notes were priced at 98.26% of par with a yield to maturity of 6.80% and resulted in total gross proceeds of approximately $294.8 million, excluding accrued interest. The discount and deferred debt issuance costs of $8.3 million incurred in connection with the issuance of the Senior Notes were held in an escrow account prior toare being amortized using the closingeffective interest method over the term of the SureWest transaction. Upon closingnotes.
The Senior Notes mature on October 1, 2022 and interest is payable semi-annually on April 1 and October 1 of the SureWest acquisition on July 2, 2012, Finance Co. merged with and into our wholly-owned subsidiaryeach year. Consolidated Communications, Inc., which assumed (“CCI”) is the primary obligor under the Senior Notes, and we and certain of our wholly‑owned subsidiaries have fully and unconditionally guaranteed the Senior Notes. On August 3, 2012, SureWest and its subsidiaries guaranteedThe Senior Notes are senior unsecured obligations of the Company.
The net proceeds from the issuance of the Senior Notes, together with cash on hand, were used, in part, to finance the acquisition of Enventis in 2014 including related fees and expenses, to repay the existing indebtedness of Enventis and to redeem our then outstanding $300.0 million aggregate principal amount of 10.875% Senior Notes due 2020 (the “2020 Notes”). In December 2014, we paid $84.1 million to redeem $72.8 million of the original aggregate principal amount of the 2020 Notes and recognized a loss of $13.8 million on the partial extinguishment of debt during the year ended December 31, 2014. In June 2015, we redeemed the remaining $227.2 million of the original aggregate principal amount of the 2020 Notes. In connection with the redemption of the 2020 Notes, we paid $261.9 million and recognized a loss on extinguishment of debt of $41.2 million during the year ended December 31, 2015.
In 2013,On October 16, 2015, we completed an exchange offer to issue registered notes (“Exchange Notes”) for $287.3 millionregister all of the original Senior Notes.Notes under the Securities Act of 1933 (“Securities Act”). The terms of the Exchangeregistered Senior Notes are substantially identical to those of the Senior Notes prior to the exchange, except that the ExchangeSenior Notes are now registered under the Securities Act and the transfer restrictions and registration rights previously applicable to the Senior Notes do notno longer apply to the Exchangeregistered Senior Notes. The exchange offer did not impact the aggregate principal amount or the remaining terms of the Senior Notes outstanding.
Senior Notes Covenant Compliance
TheSubject to certain exceptions and qualifications, the indenture governing the Senior Notes contains customary covenants for high yield notes, whichthat, among other things, limits Consolidated Communications, Inc.’sCCI’s and its restricted subsidiaries’ ability to: incur additional debt or issue certain preferred stock; pay dividends or make other distributions on capital stock or prepay subordinated indebtedness; purchase
or redeem any equity interests; make investments; create liens; sell assets; enter into agreements that restrict dividends or other payments by restricted subsidiaries; consolidate, merge or transfer all or substantially all of its assets; engage in transactions with its affiliates; or enter into any sale and leaseback transactions. The indenture also contains customary events of default.
Among other matters, the Senior Notes indenture provides that Consolidated Communications, Inc.CCI may not pay dividends or make other “restricted payments” torestricted payments, as defined in the Companyindenture, if its total net leverage ratio is 4.25:4.75:1.00 or greater. This ratio is calculated differently than the comparable ratio under the credit agreement;Credit Agreement; among other differences, it takes into account, on a pro forma basis, synergies expected to be achieved as a result of the SureWest acquisitioncertain acquisitions but not yet reflected in historical results. At December 31, 2013,2016, this ratio was 4.20:4.53:1.00. If this ratio is met, dividends and other restricted payments may be made from cumulative consolidated cash flow since the date the Senior Notes were issued,April 1, 2012, less 1.75 times fixed charges, less dividends and other restricted payments made since the date the Senior Notes were issued.May 30, 2012. Dividends may be paid and other restricted payments may also be made from a “basket” of $50.0 million, none of which has been used to date, and pursuant to other exceptions identified in the Senior Notes indenture. Since dividends of $108.5$331.6 million have been paid since May 30, 2012, at December 31, 2013including the quarterly dividend declared in October 2016 and paid on February 1, 2017, there was $156.6$451.1 million of the $265.1$782.6 million of cumulative consolidated cash flow since May 30, 2012 available to pay dividends.dividends at December 31, 2016. At December 31, 2016, the Company was in compliance with all terms, conditions and covenants under the indenture governing the 2022 Notes.
Bridge Loan FacilityCapital Leases
In connection with the acquisition of SureWest, in February 2012 the Company received committed financing for a total of $350.0 million to fund the cash portion of the anticipated transaction, to refinance SureWest’s debtWe lease certain facilities and to pay for certain transaction costs. The financing package included a $350.0 million Senior Unsecured Bridge Loan Facility (“Bridge Facility”). As anticipated, permanent financing for the SureWest acquisition was funded by our Senior Note offering, as described above. As a result, the $4.2 million commitment fee incurred for the Bridge Facility was capitalized as deferred debt issuance costs in February 2012 and was amortized over the expected life of the Bridge Facility, which was four months.
Capital Leases
As of December 31, 2013, we had sevenequipment under various capital leases all of which expire between 20152017 and 2021. As of December 31, 2013,2016, the present value of the minimum remaining lease commitments was approximately $5.1$16.9 million, of which $0.7$5.9 million was due and payable within the next twelve months. The leases require total remaining rental payments of approximately $7.8$18.9 million over the remaining termas of the leases.December 31, 2016, of which $3.6 million will be paid to LATEL LLC, a related party entity.
In 2013, we acquired equipment of $0.8 million through capital lease agreements, which represents a noncash
50
Table of Contents
investing activity.
Dividends
We paid $62.1$78.4 million and $54.1$78.2 million in dividend payments to shareholders during 20132016 and 2012,2015, respectively. OnIn October 2016, our board of directors declared a quarterly dividend of $0.38738 per common share, which was paid on February 21, 2014,1, 2017 to stockholders of record at the close of business on January 13, 2017. In addition, on February 17, 2017, our board of directors declared its next quarterly dividend of $0.38738 per common share, which is payable on May 1, 20142017 to stockholders of record at the close of business on April 15, 2014.2017. Our current annual dividend rate is approximately $1.55 per share.
The cash required to fund dividend payments is in addition to our other expected cash needs, which we expect to fund with cash flows from our operations. In addition, we expect we will have sufficient availability under our revolving credit facility to fund dividend payments in addition to any expected fluctuations in working capital and other cash needs, although we do not intend to borrow under this facility to pay dividends.
We believe that our dividend policy will limit, but not preclude, our ability to grow. If we continue paying dividends at the level currently anticipated under our dividend policy, we may not retain a sufficient amount of cash, and may need to seek refinancing, to fund a material expansion of our business, including any significant acquisitions or to pursue growth opportunities requiring capital expenditures significantly beyond our current expectations. In addition, because we expect a significant portion of cash available will be distributed to holders of common stock under our dividend policy, our ability to pursue any material expansion of our business will depend more than it otherwise would on our ability to obtain third-party financing.
Sufficiency of Cash Resources
The following table sets forth selected information regarding our financial condition.
| | | | | | | | |
| | December 31, | | | December 31, | |
(In thousands, except for ratio) | | 2013 | | 2012 | | | 2016 | | 2015 | |
Cash and cash equivalents | | $ | 5,551 | | $ | 17,854 | | | $ | 27,077 | | $ | 15,878 | |
Working capital (deficit) | | (29,979) | | (34,888) | | | | (16,884) | | | (17,892) | |
Current ratio | | 0.75 | | 0.76 | | | | 0.89 | | | 0.88 | |
|
Our most significant use of funds in 20142017 is expected to be for: (i) dividend payments of between $62.0$78.0 million and $64.0$80.0 million; (ii) interest payments on our indebtedness of between $75.0$106.0 million and $78.0$108.0 million and principal payments on debt of $9.1$9.0 million; and (iii) capital expenditures of between $95.0$115.0 million and $105.0 million and (iv) pension and other post-retirement obligations of $14.6$120.0 million. However, inIn the future, our ability to use cash may be limited by our other expected uses of cash, including our dividend policy, and our ability to incur additional debt will be limited by our existing and future debt agreements.
With In addition, we expect to use significant funds in connection with the acquisition of SureWest,FairPoint, which is expected to close in mid-2017. As discussed above, we tookhave secured committed financing for the acquisition through a $935.0 million Incremental Term Loan, which will be used with cash on additional debthand, and other sources of liquidity to fundrepay and redeem certain existing indebtedness of FairPoint and to pay certain fees and expenses in connection with the transaction. merger.
We believe that cash flows from operating activities, together with our existing cash and borrowings available under our revolving credit facility, will be sufficient for at least the next twelve months to fund our current anticipated uses of cash. After that, our ability to fund these expected uses of cash and to comply with the financial covenants under our debt agreements will depend on the results of future operations, performance and cash flow. Our ability to fund these expected uses from the results of future operations will be subject to prevailing economic conditions and to financial, business, regulatory, legislative and other factors, many of which are beyond our control.
We may be unable to access the cash flows of our subsidiaries since certain of our subsidiaries are parties to credit or other borrowing agreements, or subject to statutory or regulatory restrictions, that restrict the payment of dividends or making intercompany loans and investments, and those subsidiaries are likely to continue to be subject to such restrictions and prohibitions for the foreseeable future. In addition, future agreements that our subsidiaries may enter into governing the terms of indebtedness may restrict our subsidiaries’ ability to pay dividends or advance cash in any other manner to us.
To the extent that our business plans or projections change or prove to be inaccurate, we may require additional financing or require financing sooner than we currently anticipate. Sources of additional financing may include commercial bank borrowings, other strategic debt financing, sales of nonstrategic assets, vendor financing or the private or public sales of equity and debt securities. There can be no assurance that we will be able to generate sufficient cash flows from operations in the future, that anticipated revenue growth will be realized, or that future borrowings or equity issuances will be available in amounts sufficient to provide adequate sources of cash to fund our expected uses of cash. Failure to obtain adequate financing, if necessary, could require us to significantly reduce
51
Table of Contents
our operations or level of capital expenditures, which could have a material adverse effect on our financial condition, and the results of operations.
Surety Bonds
In the ordinary course of business, we enter into surety, performance and similar bonds as required by certain jurisdictions in which we provide services. As of December 31, 2013,2016, we had approximately $2.8$3.7 million of these bonds outstanding.
Contractual Obligations
As of December 31, 2013,2016, our contractual obligations were as follows:
| | | | | | | | | | | | | | | |
| | Less than | | 1 - 3 | | 3 - 5 | | | | | | | Less than | | 1 - 3 | | 3 - 5 | | | | | |
(In thousands) | | 1 Year | | Years | | Years | | Thereafter | | Total | | | 1 Year | | Years | | Years | | Thereafter | | Total | |
Long-term debt | | $ | 9,100 | | $ | 18,200 | | $ | 31,200 | | $ | 1,164,500 | | $ | 1,223,000 | | | $ | 9,000 | | $ | 18,000 | | $ | 18,000 | | $ | 1,352,750 | | $ | 1,397,750 | |
Interest on long-term debt (1) | | 71,240 | | 141,319 | | 139,772 | | 121,822 | | 474,153 | | | | 105,585 | | | 135,290 | | | 133,850 | | 91,563 | | | 466,288 | |
Interest rate swaps (2) | | 2,342 | | 1,220 | | – | | – | | 3,562 | | | | 996 | | | 51 | | | — | | | — | | | 1,047 | |
Capital leases | | 1,272 | | 2,303 | | 1,921 | | 2,362 | | 7,858 | | | | 5,922 | | | 9,673 | | | 1,262 | | | — | | | 16,857 | |
Operating leases | | 2,133 | | 2,275 | | 679 | | 793 | | 5,880 | | | | 11,304 | | | 18,838 | | | 11,356 | | | 12,605 | | | 54,103 | |
Unconditional purchase obligations: | | | | | | | | | | | | | | | | | | | | | | | | | |
Unrecorded (3) | | 24,705 | | 28,669 | | 10,123 | | – | | 63,497 | | | | 30,745 | | | 21,291 | | | 14,600 | | | 7,106 | | | 73,742 | |
Recorded (4) | | 27,897 | | – | | – | | – | | 27,897 | | | | 46,395 | | | — | | | — | | | — | | | 46,395 | |
Pension funding | | 14,621 | | – | | – | | – | | 14,621 | | | | 6,758 | | | — | | | — | | | — | | | 6,758 | |
|
| (1) | | Interest on long-term debt includes amounts due on fixed and variable rate debt. As the rates on our variable debt are subject to change, the rates in effect at December 31, 2016 were used in determining our future interest obligations. Future interest obligations include anticipated ticking fees related to the committed financing for the expected acquisition of FairPoint in 2017. |
(1)Interest on long-term debt includes amounts due on fixed and variable rate debt. As the rates on our variable debt are subject to change, the rates in effect at December 31, 2013 were used in determining our future interest obligations.
| (2) | | Expected settlements to be paid estimated using yield curves in effect at December 31, 2016. |
| (3) | | Unrecorded purchase obligations include binding commitments for future capital expenditures and service and maintenance agreements to support various computer hardware and software applications and certain equipment. If we terminate any of the contracts prior to their expiration date, we would be liable for minimum commitment payments as defined by the contractual terms of the contracts. |
| (4) | | Recorded obligations include amounts in accounts payable and accrued expenses for external goods and services received as of December 31, 2016 and expected to be settled in cash. |
(2)Expected settlements estimated using yield curves in effect at December 31, 2013.
(3)Unrecorded purchase obligations include binding commitments for future capital expenditures and service and maintenance agreements to support various computer hardware and software applications and certain equipment. If we terminate any of the contracts prior to their expiration date, we would be liable for minimum commitment payments as defined in by the contractual terms of the contracts.
(4)Recorded obligations include amounts in accounts payable and accrued expenses for external goods and services received as of December 31, 2013 and expected to be settled in cash.
Defined Benefit Pension Plans
As required, we contribute to qualified defined pension plans and non-qualified supplemental retirement plans (collectively the “Pension Plans”) and other post-retirement benefit plans, which provide retirement benefits to certain eligible employees. Contributions are intended to provide for benefits attributed to service to date. Our funding policy is to contribute annually an actuarially determined amount consistent with applicable federal income tax regulations.
The cost to maintain our Pension Plans and future funding requirements are affected by several factors including the expected return on investment of the assets held by the Pension Plan, changes in the discount rate used to calculate pension expense and the amortization of unrecognized gains and losses. Returns generated on Plan assets have historically funded a significant portion of the benefits paid under the Pension Plans. We used an expected long-term rate of return of 7.75% and 8.00% in 2016 and 2015, respectively. As of January 1, 2017, we estimate the long-term rate of return of Plan assets will be 8.0%7.75%. The Pension Plans invest in marketable equity securities which are exposed to changes in the financial markets. If the financial markets experience a downturn and returns fall below our estimate, we could be required to make a material contribution to the Pension Plan, which could adversely affect our cash flows from operations.
Net pension and post-retirement costscosts/(benefit) were $0.7$2.9 million, $4.6$(2.2) million and $4.0$(5.5) million for the years ended December 31, 2013, 20122016, 2015 and 2011,2014, respectively. We contributed $11.5$0.3 million, $15.2$12.2 million and $9.5$11.1 million in 2013, 20122016, 2015 and 2011,2014, respectively to our pension plans. For our other post-retirement plans, we contributed $2.8$3.6 million, $3.2$3.0 million and $3.6$2.7 million in 2013, 20122016, 2015 and 2011,2014, respectively. In 2014,2017, we expect to make contributions totaling approximately $12.1$2.9 million to our pension plans and $2.5$3.9 million to our other post-retirement benefit plans.
52
Table of Contents
Our contribution amounts meet the minimum funding requirements as set forth in employee benefit and tax laws. See Note 9 to the Consolidated Financial Statementsconsolidated financial statements for a more detailed discussion regarding our pension and other post-retirement plans.
Income Taxes
The timing of cash payments for income taxes, which is governed by the Internal Revenue Service and other taxing jurisdictions, will differ from the timing of recording tax expense and deferred income taxes, which are reported in accordance with GAAP. For example, tax laws in effect regarding accelerated or “bonus” depreciation for tax reporting resulted in less cash payments than the GAAP tax expense. Acceleration of tax deductions could eventually result in situations where cash payments will exceed GAAP tax expense.
It is more likely than not that the benefit from approximately $1.5 million in federal NOL carryforwards that are subject to separate return limitation year restrictions will not be realized. This loss carryover can only be used against consolidated taxable income to the extent of a single member’s contribution to consolidated taxable income. The amount considered realizable, however, could be adjusted if estimates of future taxable income for the single member during the carryforward period are increased. The amount of estimated future taxable income is expected to allow for the full utilization of the remaining net operating loss carryforwards.Related Party Transactions
Historically, pre-tax earnings for financial reporting purposes have exceeded the amount of taxable income reported for income tax purposes. This has primarily occurred due to the acceleration of depreciation deductions for income tax reporting purposes.
Related Party Transactions
In May 2012, aA portion of the Senior2020 Notes waswere sold to certain accredited investors consisting of certain members of the Company’s Board of Directors includingor a trust of which a director is the Company’s Chief Executive Officer (collectively “relatedbeneficiary (“related parties”). TheIn May 2012, the related parties purchased $10.8 million of the Senior2020 Notes on the same terms available to other investors, except that the related parties were not entitled to registration rights. During 2013In 2015, the 2020 Notes were fully redeemed and 2012, the Companywe paid $1.2an early redemption premium of $1.5 million and $0.6recognized interest expense of approximately $0.7 million respectively,and $1.3 million in interest2015 and 2014, respectively, in the aggregate for the 2020 Notes purchased by related parties. In September 2014, $5.0 million of the 2022 Notes were sold to a trust, the beneficiary of which is a member of the Company’s Board of Directors and we recognized approximately $0.3 million in each 2016 and 2015 in interest expense for the 2022 Notes purchased by the related parties for the Senior Notes.party.
In December 2010, we entered into new lease agreements with LATEL LLC (“LATEL”) for the occupancy of three buildings on a triple net lease basis. Each of the three lease agreements have a maturity date of May 31, 2021, and have
been accounted for as capital leases. Each of the three lease agreements have two five-year options to extend the terms of the lease after the expiration date. Our Board of Directors member, Richard A. Lumpkin, and his immediate family havehad a beneficial ownership interest of 70.7%68.5% and 66.7% in 20132016 and 20122015, respectively, of LATEL, directly or through Agracel, Inc. (“Agracel”). Agracel is real estate investment company of which Mr. Lumpkin, together with his family, havehad a beneficial interest of 41.3%37.0% and 33.5% in 20132016 and 2012.2015, respectively. Agracel is the sole managing member and 50% owner of LATEL. In addition, Mr. Lumpkin is a director of Agracel. The three leases require total rental payments to LATEL of approximately $7.9 million over the term of the leases. The carrying value of the capital leases at December 31, 20132016 and 20122015 was approximately $3.6$2.7 million and $3.8$3.0 million, respectively. In 2013We recognized $0.4 million in interest expense in each 2016 and 2012, we recognized2015 and $0.5 million in interest expense in 2014 and amortization expense of $0.4 million in amortization expense, respectively,2016, 2015 and 2014 related to the capitalized leases.
Regulatory MattersMr. Lumpkin also has a minority ownership interest in First Mid-Illinois Bancshares, Inc. (“First Mid-Illinois”). We provide telecommunications products and services to First Mid-Illinois and we received approximately $0.7 million in 2016, $0.8 million in 2015 and $0.5 million in 2014 for these services.
Regulatory Matters
As discussed in the Regulatory Matters“Regulatory Matters” section above, an order adopted byin December 2014, the FCC mayreleased a report and order that significantly impactimpacts the amount of support revenue we receive from USF/the USF, CAF and ICC. The Order seeks to reform the current USF systemICC by redirecting support from voice services to broadband services. AlthoughThe annual funding under CAF Phase I of $36.6 million was replaced by annual funding under CAF Phase II of $13.9 million through 2020. With the broadband cost modelsale of our Iowa ILEC in 2016, this amount was further reduced to $11.5 million through 2020. The acceptance of funding at the lower level CAF Phase II will transition over a three year period, beginning in August 2015, at the rates of 75% of the CAF Phase I funding level in the first year, 50% in the second year and 25% in the third year.
The Order also modifies the methodology used for this reform is still being developed, we anticipate that our revenues will be significantly impacted when it is implemented. The initial phaseICC traffic exchanged between carriers. As a result of ICC reform decreasedimplementing the provisions of the Order, our network access revenues $1.8revenue decreased approximately $1.7 million, $1.3 million and $1.4 million during the 2013.2016, 2015 and 2014, respectively. We anticipate that network access revenuesrevenue will continue to decline as a result of the Order through 2018 by as much as $1.2 million, $1.0 million, $1.1 million, $2.4$2.0 million and $1.8$1.9 million in 2014, 2015, 2016, 2017 and 2018, respectively.
In accordance with the provisions of SB 583, as discussed above in the Regulatory Matters Section,“Regulatory Matters” section above, our annual $1.4 million Texas HCAF will besupport was eliminated effective January 1, 2014. In addition, in accordance with the termsprovisions of the settlement agreement reached with the PUCT, in August 2013the HCF draw will reduce our HCF drawbe reduced by approximately $1.2 million
53
Table of Contents
annually or approximately $4.8 million in total, over a 4four year period beginning June 1, 2014 through 2017.2018. However, we have the ability to fully offset this reduction with increases to residential rates where market conditions will allow.
Critical Accounting Estimates
Our significant accounting policies and estimates are discussed in the Notes to our Consolidated Financial Statements.consolidated financial statements. We prepare our consolidated financial statements in accordance with generally accepted accounting principles in the United States. The preparation of financial statements requires management to make estimates and assumptions that affect reported amounts of assets, liabilities, revenues and expenses. These estimates and assumptions are affected by management’s application of our accounting policies. Our judgments are based on historical experience and various other assumptions that are believed to be reasonable under the circumstances, the results of which form the basis for making estimates about the carrying values of assets and liabilities that are not readily apparent from other sources. However, because future events and the related effects cannot be determined with certainty, actual results may differ from our estimates and assumptions and such differences could be material. Management believes that the following accounting estimates are the most critical to understanding and evaluating our reported financial results.
Indefinite-Lived Intangible Assets
Goodwill and tradenames areOur indefinite-lived intangible assets that are not subject to amortization and are tested for impairment annually or more frequently when events or changes in circumstances indicate that the asset might be impaired. We evaluate the carrying value of our indefinite-lived assets tradenames and goodwill, as of November 30 of each year.
Goodwill
As discussed more fully in Note 1 to the Consolidated Financial Statements,consolidated financial statements, goodwill is not amortized but instead evaluated for impairment annually, or more frequently if an event occurs or circumstances change that would indicate potential impairment, for impairment usingimpairment. At December 31, 2016 and 2015, the carrying value of our goodwill was $756.9 and $764.6 million, respectively. The evaluation of goodwill may first include a preliminary qualitative assessment and two-step process, if deemed necessary. In 2012, we adopted Accounting Standards Update No. 2011-08 – Intangibles-Goodwill and Other (Topic 350) Testing Goodwill for Impairment, that allows an entity to consider qualitative indicators to determine if the current two-step test is necessary. Under the provisions of the amended guidance, the step-one test of estimating the fair value of a reporting unit is not required unless, as a result of the qualitative assessment,whether it is more likely than not (a likelihood of more than 50%) that the fair value of the reporting unit is less than its carrying amount. Events and circumstances integrated into the qualitative assessment process include a combination of macroeconomic conditions affecting equity and credit markets, significant changes to the cost structure, overall financial performance and other relevant events affecting the reporting unit. A company is permitted to skip the qualitative assessment at its election, and proceed to Step 1 of the quantitative test, which we chose to do in 2013.
Functional management within the organization evaluates the operations of our single reporting unit on a consolidated basis rather than at a geographic level or on any other component basis. In general, product managers and cost managers are responsible for managing costs and services across territories rather than treating the territories as separate business units. The operations of our Illinois, Texas, Pennsylvania, California, Kansas and Missouri properties share network operations monitoring call routing and research and development costs. The operations of our Illinois, Texas and Pennsylvania properties share remittance, customer service and billing systems. We are in the process of integrating the California, Kansas and Missouri cash remittance, customer service and billing system into the systems and process used by the Illinois, Texas and Pennsylvania properties, which is expected to be completed during the third quarter of 2014. All of the properties are managed at a functional level. In addition, the Pennsylvania territories receive their video programming from a video head-end located in the Illinois territory, and all of the networks provide redundancy. As a result, we evaluate the operations for all our service territories as a single reporting unit.
At our November 30, 2013For the 2016 assessment, date,we evaluated the fair value of the goodwill compared to the carrying value using the qualitative approach. The results of the qualitative approach concluded that it was more likely than not that the fair value was greater than the carrying value, and therefore, we did not perform the calculation of fair value for reporting units as described below. When we use the quantitative approach to assess the goodwill was $603.4 million.
The estimatedcarrying value and the fair value of our single reporting unit, is determined usingwe use a combination of market-based approaches and a discounted cash flow (“DCF”) model. The assumptions used in the estimate of fair value are based upon a combination of historical results and trends, new industry developments, future cash flow projections, as well as relevant comparable company earnings multiples for the market-based approaches. Such assumptions are subject to change as a result of changing economic and competitive conditions. The market-based approaches used in the valuation effort includesinclude the publicly-traded market capitalization, guideline public companies, and guideline
54
Table of Contents
transaction methods. We use a weighting of the results derived from the valuation approaches to estimate the fair value of the single reporting unit. Key assumptions used inFor the DCF model include the following:
·cash flow assumptions regarding investment in network facilities, distribution channels and customer base (the assumptions underlying these inputs are based upon a combination of historical results and trends, new industry developments and the Company’s business plans);
·7.1% weighted average cost of capital based on comparable public companies and adjusting for risks unique to our business and the cash flow assumptions utilized in the analysis; and
·1.0% terminal growth rate.
At November 30, 2013,2015 assessment, using the quantitative approach, we concluded that the fair value of the single reporting unit’s total equity was estimated atto be approximately $976.0 million$1.3 billion on a control basis, and the associated carrying value of its equity was $130.5$269.8 million. For all valuation methods used, the fair value of equity exceeds its carrying value. The use of different estimates or assumptions in the DCF model could result in a different fair value conclusion. As a sensitivity calculation, if the discount rate in our DCF model was increased 1.0 percentage point from 7.1% to 8.1%, the fair value would decrease from approximately $976.0 million to approximately $883.0 million, which would not result in an impairment of goodwill, assuming there are no changes to the market-based approaches used in the valuation. Assuming the discount rate in our DCF model was increased 2.0 percentage points, the terminal growth rate decreased by 0.05 percentage point, and each of the market-based valuation approaches decreased in value by 5%, the fair value of approximately $976.0 million would decrease by approximately $213.4 million to approximately $762.6 million, which would not result in an impairment of goodwill. As discussed above, the other market-based approaches are subject to change as a result of changing economic and competitive conditions. Negative changes relating to the Company’s operations could result in potential impairment of goodwill. Changes in the overall weighting of the DCF model and the market-based approach valuation models may also impact the resulting fair value and could result in potential impairment of goodwill.
TradenamesTrade Names
As discussed more fully in Note 1 to the Consolidated Financial Statements, tradenamesconsolidated financial statements, trade names are generally not amortized but instead evaluated annually, or more frequently if an event occurs or circumstances change that would indicate potential impairment for impairment using a preliminary qualitative assessment and two-step process quantitative process, if deemed necessary. WeThe carrying value of our trade names, excluding any finite lived trade names, was $10.6 million at December 31, 2016 and 2015.
For the 2016 assessment, we used the qualitative approach to evaluate the fair value compared to the carrying value of the trade names. Based on the various qualitative indicators reviewed, we concluded it was more likely than not, that the trade name was not impaired. When we use the quantitative approach to estimate the fair value of our tradenames usingtrade names, we use DCFs based on a relief from royalty method. If the fair value of our tradenamestrade names was less than the carrying amount, we would recognize an impairment charge for the difference between the estimated fair value and the carrying value of the tradename.trade name. In accordance with Accounting Codification Standard 350 Intangibles – Goodwill and Other (“ASC 350”) separately recorded indefinite-lived intangible assets, whether acquired or internally developed, shall be combined into a single unit of accounting for purposes of testing impairment if they are operated as a single asset and, as such, are essentially inseparable from one another. An indefinite-lived intangible asset may need to be removed from the accounting unit if it is disposed of, the accounting unit is reconsidered or one or more of the separate indefinite-lived intangible asset(s) within the accounting unit is now considered finite-lived rather than indefinite-lived. We perform our impairment testing of our tradenamestrade names as single units of accounting based on their use in our business.
The carrying value of our tradenames, excluding any amounts assigned to the SureWest tradename, was $10.6 million at December 31, 2013 and 2012. For the years ended December 31, 2013 and 2012, we completed our annual impairment test using a DCF methodology based on a relief from royalty method and determined that there was no impairment of our tradename. During the year ending December 31, 2013, a formal one-year plan to transition from the SureWest tradename to the CONSOLIDATED tradename was adopted. We began to amortize the $0.9 million assigned to the SureWest tradename over its estimated one-year useful life. During 2013, we recognized $0.5 million in amortization expense associated with the SureWest tradename. At December 31, 2013, the unamortized amount related to the SureWest tradename was $0.4 million.
Revenue recognitionRecognition
We recognize certain revenues pursuant to various cost recovery programs from federal and state USF and from revenue sharing arrangements with other local exchange carriers administered by the National Exchange Carrier Association.USF. Revenues are calculated based on our estimates and assumptions regarding various financial data, including operating expenses, taxes and investment in property, plant and equipment. Non-financial data estimates are also utilized, including projected
demand usage and detailed network information. We must also make estimates of the jurisdictional separation of this data to assign current financial and operating data to the interstate or intrastate
55
Table of Contents
jurisdiction. These estimates are finalized in future periods as actual data becomes available to complete the separation studies. We have historically collected revenues recognized through these programs; however, adjustments to estimated revenues in future periods are possible. These adjustments could be necessitated by adverse regulatory developments with respect to these subsidies and revenue sharing arrangements, changes in allowable rates of return and the determination of recoverable costs or decreases in the availability of funds in the programs due to increased participation by other carriers.
Derivatives
We use derivative financial instruments primarily to manage the risks associated with fluctuations in interest rates and to convert a portion of future cash flows associated with the interest to be paid on our credit facility from a floating rate to a fixed rate. All derivative financial statements are recognized in the consolidated balance sheet at fair value. For the derivative financial instruments designated as a cash flow hedge, the effective portion of the changes in the fair value of the derivative contracts are deferred in other comprehensive income, net of applicable income taxes, and recognized as a component of interest expense in the period in which the hedged item affects earnings. Any ineffectiveness is recognized immediately in earnings. For derivative financial instruments not designated as a cash flow hedge or have been determined to no longer be effective at offsetting changes in the price of the hedged item and have been de-designated, then the changes in the market value of these instruments are recorded in the statement of operations as a component of interest expense.
Our interest rate swaps are measured using valuation models which rely on quoted market prices and observable market data of similar instruments. The valuation models require estimates of future interest rates and judgments about the future credit worthiness of the Company and each counterparty over the terms of the contracts.
Income taxesTaxes
Our current and deferred income taxes and associated valuation allowances are impacted by events and transactions arising in the normal course of business as well as in connection with the adoption of new accounting standards, acquisitions of businesses and non-recurring items. Assessment of the appropriate amount and classification of income taxes is dependent on several factors, including estimates of the timing and realization of deferred income tax assets and the timing of income tax payments. Actual amounts may materially differ from these estimates as a result of changes in tax laws as well as unanticipated future transactions impacting related income tax balances. We account for tax benefits taken or expected to be taken in our tax returns in accordance with the accounting guidance applicable for uncertainty in income taxes, which requires the use of a two-step approach for recognizing and measuring tax benefits taken or expected to be taken in a tax return.
Pension and postretirement benefitsPostretirement Benefits
The amounts recognized in our financial statements for pension and postretirement benefits are determined on an actuarial basis utilizing several critical assumptions.
We make significant assumptions in regards to our pension and postretirement plans, including the expected long-term rate of return on plan assets, and the discount rate used to value the periodic pension expense and liabilities. liabilities, future salary increases and actuarial assumptions relating to mortality rates and healthcare trend rates. Changes in these estimates and other factors could significantly impact our benefit cost and obligations to maintain pension and postretirement plans.
Our pension investment strategy is to maximize long-term returns on invested plan assets while minimizing the risk of volatility. Accordingly, we target our allocation percentage at 50% -approximately 60% in equity funds, with the remainder in fixed income and cash equivalents. Our assumed rate considers this investment mix as well as past trends. We used a weighted-averagean expected long-term rate of return of 8.0%7.75% and 7.7%8.00% in 20132016 and 2012,2015, respectively. As of January 1, 2014,2017, we estimate that the long-term rate of return of pension plan assets will be 8.0%7.75%.
In determining the appropriate discount rate, we consider the current yields on high-quality corporate fixed-income investments with maturities that correspond to the expected duration of our pension and postretirement benefit plan obligations. For our 20132016 and 20122015 projected benefit obligations, we used a weighted-average discount rate of 4.97%4.27% and 4.20%4.76%, respectively, for our pension plans and 4.40%4.12% and 3.90%4.61%, respectively, for our other postretirement plans.
A one percentage-point increase or decrease in the discount rate and expected long-term rate of return would have the following effects on net periodic benefit cost:
1-Percentage- | | 1-Percentage- | |
Point Increase | | Point Decrease | |
| | | |
$ | (691) | | $ | 735 | |
| | | | | |
| | | | | | | |
| | | 1-Percentage- | | 1-Percentage- | |
(In thousands) | | | Point Increase | | Point Decrease | |
| | | | | | | |
Discount rate | | $ | (3,004) | | $ | 3,503 | |
Expected long-term rate of return on plan assets | | $ | (2,663) | | $ | 2,663 | |
56
Table of Contents
Recent Accounting Pronouncements
For information regarding the impact of certain recent accounting pronouncements, see Note 1 “Business Description & Summary of Significant Accounting Policies” to the Consolidated Financial Statements,consolidated financial statements included in this report in Item 8, Part II -Item 8 “Financial Statements and Supplementary Data”.
Item 7A. Quantitative and Qualitative Disclosures about Market Risk
Our exposure to market risk is primarily related to the impact of interest rate fluctuations on our debt obligations. Market risk is the potential loss arising from adverse changes in market interest rates on our variable rate obligations. In order to manage the volatility relating to changes in interest rates, we utilize derivative financial instruments such as interest rate swaps to maintain a mix of fixed and variable rate debt. We do not use derivatives for trading or speculative purposes. Our interest rate swap agreements effectively convert a portion of our floating-rate debt to a fixed-rate basis, thereby reducing the impact of interest rate changes on future cash interest payments. We calculate the potential change in interest expense caused by changes in market interest rates by determining the effect of the hypothetical rate increase on the portion of our variable rate debt that is not subject to a variable rate floor or hedged through the interest rate swap agreements.
At December 31, 2013,2016, the majority of our variable rate debt was subject to a 1.00% LIBORLondon Interbank Offered Rate (“LIBOR”) floor thereby reducing the impact of fluctuations in interest rates. As of December 31, 2013,2016, LIBOR was well below the 1.00% floor. Based on our variable rate debt outstanding at December 31, 2013 that is not subject to2016, a variable rate floor, a 1.0% change1.00% increase in market interest rates would not have a significant impact toincrease annual interest expense.expense by approximately $4.1 million. A 1.00% decrease in current interest rates would not impact annual interest expense on our variable rate debt due to the 1.00% LIBOR floor.
As of December 31, 2013,2016, the fair value of our interest rate swap agreements amounted to a net liability of $2.6$0.3 million. PretaxPre-tax deferred losses related to our interest rate swap agreements included in accumulated other comprehensive loss (“AOCI”) was $2.6$0.2 million at December 31, 2013.2016.
In December 2013, $325.0 million notional interest rate swaps previously designated as cash flow hedges were de-designated as a result of the amendment to our credit agreement on December 23, 2013. The interest rate swap agreements mature on various dates through September 2016. In December 2012, interest rate swaps with an aggregate notional value of $660.0 million were de-designated as cash flow hedges in connection with the amendment to our credit agreement on December 4, 2012. Of these agreements, $200.0 million notional interest rate swap agreements expired on December 31, 2012 and the remainder expired on March 31, 2013. Prior to de-designation, the effective portion of the change in fair value of the interest rate swaps were recognized in AOCI. The balance of the unrealized loss included in AOCI as of the date the swaps were de-designated is amortized to earnings over the remaining term of the swap agreements. Changes in fair value of the de-designated swaps are immediately recognized in earnings as interest expense. During the years ended December 31, 2013 and 2012, a gain of $2.2 million and $2.8 million, respectively, was recognized as a reduction to interest expense for the change in fair value of the de-designated swaps.
Item 8. Financial Statements and Supplementary Data
For information pertaining to our Financial Statements and Supplementary Data, refer to pages F-1 to F-60F-50 of this report, which are incorporated herein by reference.
Item 9. Changes in and Disagreements with Accountants on Accounting and Financial Disclosure
Not applicable.
Item 9A. Controls and Procedures
Evaluation of disclosure controlsDisclosure Controls and proceduresProcedures
We maintain disclosure controls and procedures as defined in Rules 13a-15(e) and 15d-15(e) under the Securities Exchange Act of 1934 (“Exchange Act”) that are designed to ensure that information required to be disclosed by us in reports that we file or submit under the Exchange Act is (i) recorded, processed, summarized and reported within the time periods specified in SEC rules and forms; and (ii) accumulated and communicated to our management, including our Chief Executive Officer and Chief Financial Officer, as appropriate to allow timely decisions regarding required disclosure. There are inherent limitations to the effectiveness of any system of disclosure controls and procedures, including the possibility of human error and the circumvention or overriding of the controls and procedures. Accordingly, even effective disclosure controls and procedures can only provide reasonable assurance of achieving their control objectives. In connection with the filing of this Form 10-K, management evaluated, under the supervision and with the participation of our Chief Executive Officer and Chief Financial Officer, the effectiveness of the design to provide reasonable assurance of achieving their objectives and operation of our disclosure controls and procedures as of December 31, 2013.2016. Based upon that evaluation and subject to the foregoing, our Chief Executive Officer and Chief Financial Officer concluded that our disclosure controls and procedures are effective as of December 31, 2013.2016.
Inherent Limitation of the Effectiveness of Internal Control
A control system, no matter how well conceived and operated, can only provide reasonable, not absolute, assurance that the objectives of the internal control system are met. Because of the inherent limitations of any internal control system, no evaluation of controls can provide absolute assurance that all control issues, if any, within a company have been detected.
57
MANAGEMENT’S REPORT ON INTERNAL CONTROL OVER FINANCIAL REPORTING
Our management is responsible for establishing and maintaining adequate internal control over financial reporting as such term is defined in Exchange Act Rule 13a–15(f). Management, with the participation of our Chief Executive Officer and Chief Financial Officer, assessed the effectiveness of our internal control over financial reporting as of December 31, 2013.2016. In making this assessment, management used the framework set forth in Internal Control-Integrated Framework (1992) (2013) issued by the Committee of Sponsoring Organizations of the Treadway Commission. Based upon this assessment, our management concluded that, as of December 31, 2013,2016, our internal control over financial reporting was effective to provide reasonable assurance that the desired control objectives were achieved.
The effectiveness of internal control onover financial reporting has been audited by Ernst & Young LLP, independent registered public accounting firm, as stated in their report which is included elsewhere in this Annual Report on Form 10-K.
Changes in Internal Control over Financial Reporting
Based upon the evaluation performed by our management, which was conducted with the participation of our Chief Executive Officer and Chief Financial Officer, there has been no change in our internal control over financial reporting during the quarter ended December 31, 20132016 that has materially affected, or is reasonably likely to materially affect, our internal control over financial reporting.
58
REPORT OF INDEPENDENT REGISTERED PUBLIC ACCOUNTING FIRM
The Board of Directors and Shareholders
Consolidated Communications Holdings, Inc.
We have audited Consolidated Communications Holdings, Inc. and subsidiaries’ (the Company’s) internal control over financial reporting as of December 31, 2013, based on criteria established in Internal Control—Integrated Framework issued by the Committee of Sponsoring Organizations of the Treadway Commission (1992 framework) (the COSO criteria). The Company’s management is responsible for maintaining effective internal control over financial reporting, and for its assessment of the effectiveness of internal control over financial reporting included in the accompanying Management’s Report on Internal Control Over Financial Reporting. Our responsibility is to express an opinion on the Company’s internal control over financial reporting based on our audit.
We conducted our audit in accordance with the standards of the Public Company Accounting Oversight Board (United States). Those standards require that we plan and perform the audit to obtain reasonable assurance about whether effective internal control over financial reporting was maintained in all material respects. Our audit included obtaining an understanding of internal control over financial reporting, assessing the risk that a material weakness exists, testing and evaluating the design and operating effectiveness of internal control based on the assessed risk, and performing such other procedures as we considered necessary in the circumstances. We believe that our audit provides a reasonable basis for our opinion.
A company’s internal control over financial reporting is a process designed to provide reasonable assurance regarding the reliability of financial reporting and the preparation of financial statements for external purposes in accordance with generally accepted accounting principles. A company’s internal control over financial reporting includes those policies and procedures that (1) pertain to the maintenance of records that, in reasonable detail, accurately and fairly reflect the transactions and dispositions of the assets of the company; (2) provide reasonable assurance that transactions are recorded as necessary to permit preparation of financial statements in accordance with generally accepted accounting principles, and that receipts and expenditures of the company are being made only in accordance with authorizations of management and directors of the company; and (3) provide reasonable assurance regarding prevention or timely detection of unauthorized acquisition, use or disposition of the company’s assets that could have a material effect on the financial statements.
Because of its inherent limitations, internal control over financial reporting may not prevent or detect misstatements. Also, projections of any evaluation of effectiveness to future periods are subject to the risk that controls may become inadequate because of changes in conditions or that the degree of compliance with the policies or procedures may deteriorate.
In our opinion, Consolidated Communications Holdings Inc. and subsidiaries maintained, in all material respects, effective internal control over financial reporting as of December 31, 2013, based on the COSO criteria.
We have also audited, in accordance with the standards of the Public Company Accounting Oversight Board (United States), the consolidated balance sheets of Consolidated Communications Holdings, Inc. and subsidiaries as of December 31, 2013 and 2012, and the related consolidated statements of income, comprehensive income, changes in Shareholders’ equity, and cash flows for each of the three years in the period ended December 31, 2013, and our report dated March 5, 2014, expressed an unqualified opinion thereon.
St. Louis, Missouri
March 5, 2014
59
Table of Contents
PART III
Item 10. Directors, Executive Officers and Corporate Governance
Our Board of Directors adopted a Code of Business Conduct and Ethics (“the code”) that applies to all of our employees, officers, and directors, including its principal executive officer, principal financial officer, and principal accounting officer. A copy of the code is posted on our investor relations website at www.Consolidated.com. Information contained on the website in not incorporated by reference in, or considered to be a part of, this document.
Additional information required by this Item is incorporated herein by reference to our proxy statement for the annual meeting of our shareholders to be filed pursuant to Regulation 14A within 120 days after our fiscal year-end of December 31, 2013.
Item 11. Executive Compensation
Incorporated herein by reference from the proxy statement for the annual meeting of our shareholders to be filed pursuant to Regulation 14A within 120 days after our fiscal year-end of December 31, 2013.
Item 12. Security Ownership of Certain Beneficial Owners and Management and Related Stockholder Matters
Incorporated herein by reference from the proxy statement for the annual meeting of our shareholders to be filed pursuant to Regulation 14A within 120 days after our fiscal year-end of December 31, 2013.
Item 13. Certain Relationships and Related Transactions, and Director Independence
Incorporated herein by reference from the proxy statement for the annual meeting of our shareholders to be filed pursuant to Regulation 14A within 120 days after our fiscal year-end of December 31, 2013.
Item 14. Principal Accountant Fees and Services
Incorporated herein by reference from the proxy statement for the annual meeting of our shareholders to be filed pursuant to Regulation 14A within 120 days after our fiscal year-end of December 31, 2013.
61
Table of Contents
PART IV
Item 15.Exhibits and Financial Statement Schedules.
(a) (1) All Financial Statements
The following consolidating financial statements and independent auditors’ reports are filed as part of this report on Form 10-K in Item 8–“Financial Statements and Supplementary Data”:
Management’s Report on Internal Control Over Financial Reporting
Reports of Independent Registered Public Accounting Firm
Consolidated Statements of Income for each of the three years in the period ended December 31, 2013
Consolidated Statements of Comprehensive Income for each of the three years in the period ended December 31, 2013
Consolidated Balance Sheets as of December 31, 2013 and 2012
Consolidated Statements of Shareholders’ Equity for each of the three years in the period ended December 31, 2013
Consolidated Statements of Cash Flows for each of the three years in the period ended December 31, 2013
Notes to Consolidated Financial Statements
Independent Auditors’ Report
Pennsylvania RSA No. 6 (II) Limited Partnership Balance Sheets - As of December 31, 2013 and 2012
Pennsylvania RSA No. 6 (II) Limited Partnership Statements of Operations – Years Ended December 31, 2013, 2012 and 2011
Pennsylvania RSA No. 6 (II) Limited Partnership Statements of Changes in Partners’ Capital – Years Ended December 31, 2013, 2012 and 2011
Pennsylvania RSA No. 6 (II) Limited Partnership Statements of Cash Flows – Years Ended December 31, 2013, 2012 and 2011
Pennsylvania RSA No. 6 (II) Limited Partnership - Notes to Financial Statements
(2) Financial Statement Schedules
Financial statement schedules have been omitted because they are not required, not applicable or the information is otherwise included in the notes to the consolidated financial statements.
(3) Exhibits
The exhibits listed below on the accompanying Index to Exhibits are filed or furnished as part of this report.
Exhibit
No.
|
|
| Description
|
|
3.1
| | Form of Amended and Restated Certificate of Incorporation (incorporated by reference to Exhibit 3.1 to Amendment No. 7 to Form S-1 dated July 19, 2005, file no. 333-121086)
|
3.2
| | Certificate of Amendment of the Amended and Restated Certificate of Incorporation of Consolidated Communications Holdings, Inc., as filed with the Secretary of State of the State of Delaware on May 3, 2011 (incorporated by reference to Exhibit 3.1 to our Current Report on Form 8-K dated May 4, 2011)
|
3.3
| | Form of Amended and Restated Bylaws, as amended (incorporated by reference to Exhibit 3.1 to Current Report on Form 8-K dated November 4, 2013)
|
4.1
| | Specimen Common Stock Certificate (incorporated by reference to Exhibit 4.1 to Amendment No. 7 to Form S-1 dated July 19, 2005, file no. 333-121086)
|
4.2
| | Indenture, dated as of May 30, 2012, between Consolidated Communications, Inc. (“CCI”) (as successor
|
62
Table of Contents
| | to Consolidated Communications Finance Co. (“CCFC”)) and Wells Fargo Bank, National Association, as trustee (incorporated by reference to Exhibit 4.1 to our Current Report on Form 8-K dated May 30, 2012)
|
4.3
| | First Supplemental Indenture, dated as of July 2, 2012, among the Company, CCI, Consolidated Communications Enterprise Services, Inc. (“CCES”), Consolidated Communications Services Company (“CCSC”), Consolidated Communications of Fort Bend Company (“CCFBC”), Consolidated Communications of Texas Company (“CCTC”), and Consolidated Communications of Pennsylvania Company, LLC (“CCPC”), and Wells Fargo Bank, National Association (incorporated by reference to Exhibit 4.1 to our Current Report on Form 8-K dated June 29, 2012)
|
4.4
| | Second Supplemental Indenture, dated as of August 3, 2012, among SureWest Communications, SureWest Long Distance, SureWest Communications, Inc., SureWest Broadband, SureWest TeleVideo, SureWest Kansas, Inc., SureWest Telephone, SureWest Kansas Holdings, Inc., SureWest Kansas Connections, LLC, SureWest Kansas Licenses, LLC, SureWest Kansas Operations, LLC, SureWest Kansas Purchasing, LLC and SureWest Fiber Ventures LLC (collectively, the “SureWest Subsidiaries”), CCI, and Wells Fargo Bank, National Association (incorporated by reference to our Current Report on Form 8-K dated August 3, 2012)
|
4.5
| | Form of 10.875% Senior Note due 2020 (incorporated by reference to Exhibit A to Exhibit 4.1 to our Current Report on Form 8-K dated June 29, 2012)
|
4.6
| | Registration Rights Agreement, dated as of May 30, 2012, between CCFC and Morgan Stanley & Co. LLC (incorporated by reference to Exhibit 4.4 to our Current Report on Form 8-K dated May 30, 2012)
|
4.7
| | Joinder to Registration Rights Agreement, dated as of July 2, 2012, by the Company, CCI, CCES, CCSC, CCFBC, CCTC, and CCPC (incorporated by reference to our Current Report on Form 8-K dated June 29, 2012)
|
4.8
| | Joinder to Registration Rights Agreement, dated as of August 3, 2012, by each of the SureWest Subsidiaries (incorporated by reference to our Current Report on Form 8-K dated August 3, 2012)
|
4.9
| | Joinder Agreement, dated as of August 3, 2012, among each of the SureWest Subsidiaries, the Company, CCI, and Wells Fargo Bank, National Association, a national banking association, as Administrative Agent for the Lenders under the Credit Agreement (incorporated by reference to our Current Report on Form 8-K dated August 3, 2012)
|
10.1
| | Second Amended and Restated Credit Agreement dated December 23, 2013 by and among the Company, the lenders named therein, and Wells Fargo Bank, National Association, as administrative agent (incorporated by reference to Exhibit 10.1 to our Current Report on Form 8-K dated December 23, 2013)
|
10.2
| | Form of Collateral Agreement, dated December 31, 2007, by and among the Company, CCI, Consolidated Communications Acquisition Texas, Inc., Fort Pitt Acquisition Sub Inc., certain subsidiaries of the Company identified on the signature pages thereto, in favor of Wells Fargo Bank, National Association (successor by merger to Wachovia Bank, National Association), as Administrative Agent (incorporated by reference to Exhibit 10.2 to our Annual Report on Form 10-K for the period ended December 31, 2007, file no. 000-51446)
|
10.3
| | Form of Guaranty Agreement, dated December 31, 2007, made by the Company and certain subsidiaries of the Company identified on the signature pages thereto, in favor of Wells Fargo Bank, National Association (successor by merger to Wachovia Bank, National Association), as Administrative Agent (incorporated by reference to Exhibit 10.3 to our Annual Report on Form 10-K for the period ended December 31, 2007, file no. 000-51446)
|
10.4
| | Lease Agreement, dated December 22, 2010, between LATEL, LLC and Consolidated Communications Services Company (incorporated by reference to Exhibit 10.1 to our Current Report on Form 8-K dated December 22, 2010)
|
10.5
| | Lease Agreement, dated December 22, 2010, between LATEL, LLC and Illinois Consolidated Telephone Company (incorporated by reference to Exhibit 10.2 to our Current Report on Form 8-K dated December 22, 2010)
|
63
Table of Contents
10.6
| | Lease Agreement, dated December 22, 2010, between LATEL, LLC and Illinois Consolidated Telephone Company (incorporated by reference to Exhibit 10.3 to our Current Report on Form 8-K dated December 22, 2010)
|
10.7
| | Amended and Restated Consolidated Communications Holdings, Inc. Restricted Share Plan (incorporated by reference to Exhibit 10.11 to Amendment No. 7 to Form S-1 dated July 19, 2005, file no. 333-121086)
|
10.8**
| | Amended and Restated Consolidated Communications Holdings, Inc. 2005 Long-Term Incentive Plan (As Amended and Restated Effective May 4, 2010) (incorporated by reference to Exhibit 10.1 to our Current Report on Form 8-K dated May 10, 2010)
|
10.9**
| | Form of Employment Security Agreement with certain of the Company’s employees (incorporated by reference to Exhibit 10.1 to our Quarterly Report on Form 10-Q for the quarter ended September 30, 2012)
|
10.10**
| | Form of Employment Security Agreement with Robert J. Currey (incorporated by reference to Exhibit 10.1 to our Current Report on Form 8-K dated December 4, 2009)
|
10.11**
| | Form of Employment Security Agreement with certain of the Company’s other executive officers (incorporated by reference to Exhibit 10.2 to our Current Report on Form 8-K dated December 4, 2009)
|
10.12**
| | Form of Employment Security Agreement with the Company’s and its subsidiaries vice president and director level employees (incorporated by reference to Exhibit 10.12 to our Annual Report on Form 10-K for the period ended December 31, 2007, file no. 000-51446)
|
10.13**
| | Executive Long-Term Incentive Program, as revised March 12, 2007 (incorporated by reference to Exhibit 10.1 to our Current Report on Form 8-K dated March 12, 2007, file no. 000-51446)
|
10.14**
| | Form of 2005 Long-Term Incentive Plan Performance Stock Grant Certificate (incorporated by reference to Exhibit 10.2 to our Current Report on Form 8-K dated March 12, 2007, file no. 000-51446)
|
10.15**
| | Form of 2005 Long-Term Incentive Plan Restricted Stock Grant Certificate (incorporated by reference to Exhibit 10.3 to our Current Report on Form 8-K dated March 12, 2007, file no. 000-51446)
|
10.16**
| | Form of 2005 Long-Term Incentive Plan Restricted Stock Grant Certificate for Directors (incorporated by reference to Exhibit 10.4 to our Current Report on Form 8-K dated March 12, 2007, file no. 000-51446)
|
10.17**
| | Description of the Consolidated Communications Holdings, Inc. Bonus Plan (incorporated by reference to Exhibit 10.5 to our Current Report on Form 8-K dated March 12, 2007, file no. 000-51446)
|
10.18
| | Form of Indemnification Agreement with Directors and Executive Officers (incorporated by reference to Exhibit 10.1 to our Current Report on Form 8-K dated May 7, 2013)
|
21.1
| | List of subsidiaries of the Registrant
|
23.1
| | Consent of Ernst & Young LLP
|
23.2
| | Consent of Deloitte & Touche LLP
|
31.1
| | Certificate of Chief Executive Officer of Consolidated Communications Holdings, Inc. pursuant to Rule 13(a)-14(a) under the Securities Exchange Act of 1934
|
31.2
| | Certificate of Chief Financial Officer of Consolidated Communications Holdings, Inc. pursuant to Rule 13(a)-14(a) under the Securities Exchange Act of 1934
|
32.1
| | Certification of the Chief Executive Officer and Chief Financial Officer pursuant to 18 U.S.C. Section 1350, as adopted pursuant to Section 906 of the Sarbanes-Oxley Act of 2002.
|
101
| | The following financial information from Consolidated Communications Holdings, Inc. Annual Report on Form 10-K for the year ended December 31, 2013, formatted in XBRL (eXtensible Business Reporting Language): (i) Consolidated Statements of Income, (ii) Consolidated Statements of Comprehensive Income, (iii) Consolidated Balance Sheets, (iv) Consolidated Statements of Changes in Shareholders’ Equity, (v) Consolidated Statements of Cash Flows, and (vi) Notes to Consolidated Financial Statements.
|
**
| Compensatory plan or arrangement.
|
64
Table of Contents
SIGNATURES
Pursuant to the requirements of Section 13 or 15(d) of the Securities Exchange Act of 1934, the registrant has duly caused this report to be signed on its behalf by the undersigned, thereunto duly authorized, in Mattoon, Illinois on March 5, 2014.
| CONSOLIDATED COMMUNICATIONS HOLDINGS, INC.
|
| |
| By:
| /s/ ROBERT J. CURREY
| |
| | Robert J. Currey
|
| | Chief Executive Officer
|
Pursuant to the requirements of the Securities Exchange Act of 1934, this report has been signed below by the following persons on behalf of the registrant and in the capacities and on the dates indicated.
Signature
| | Title
| | Date
|
| | | | |
By:
| /s/ ROBERT J. CURREY
| | Chief Executive Officer,
| | March 5, 2014
|
| Robert J. Currey
| | Chairman of the Board
| | |
| | | (Principal Executive Officer)
| | |
| | | | | |
By:
| /s/ C. ROBERT UDELL
| | President and
| | March 5, 2014
|
| C. Robert Udell
| | Chief Operating Officer, Director
| | |
| | | | | |
By:
| /s/ STEVEN L. CHILDERS
| | Senior Vice President and
| | March 5, 2014
|
| Steven L. Childers
| | Chief Financial Officer (Principal
| | |
| | | Financial and Accounting Officer)
| | |
| | | | | |
By:
| /s/ RICHARD A. LUMPKIN
| | Director
| | March 5, 2014
|
| Richard A. Lumpkin
| | | | |
| | | | | |
By:
| /s/ ROGER H. MOORE
| | Director
| | March 5, 2014
|
| Roger H. Moore
| | | | |
| | | | | |
By:
| /s/ MARIBETH S. RAHE
| | Director
| | March 5, 2014
|
| Maribeth S. Rahe
| | | | |
| | | | | |
By:
| /s/ TIMOTHY D. TARON
| | Director
| | March 5, 2014
|
| Timothy D. Taron
| | | | |
| | | | | |
By:
| /s/ THOMAS A. GERKE
| | Director
| | March 5, 2014
|
| Thomas A. Gerke
| | | | |
65
Table of Contents
REPORT OF INDEPENDENT REGISTERED PUBLIC ACCOUNTING FIRM
The Board of Directors and Shareholders
Consolidated Communications Holdings, Inc.
We have audited Consolidated Communications Holdings, Inc. and subsidiaries’ (the Company’s) internal control over financial reporting as of December 31, 2016, based on criteria established in Internal Control—Integrated Framework issued by the Committee of Sponsoring Organizations of the Treadway Commission (2013 framework), (the COSO criteria). The Company’s management is responsible for maintaining effective internal control over financial reporting, and for its assessment of the effectiveness of internal control over financial reporting included in the accompanying Management’s Report on Internal Control Over Financial Reporting. Our responsibility is to express an opinion on the Company’s internal control over financial reporting based on our audit.
We conducted our audit in accordance with the standards of the Public Company Accounting Oversight Board (United States). Those standards require that we plan and perform the audit to obtain reasonable assurance about whether effective internal control over financial reporting was maintained in all material respects. Our audit included obtaining an understanding of internal control over financial reporting, assessing the risk that a material weakness exists, testing and evaluating the design and operating effectiveness of internal control based on the assessed risk, and performing such other procedures as we considered necessary in the circumstances. We believe that our audit provides a reasonable basis for our opinion.
A company’s internal control over financial reporting is a process designed to provide reasonable assurance regarding the reliability of financial reporting and the preparation of financial statements for external purposes in accordance with generally accepted accounting principles. A company’s internal control over financial reporting includes those policies and procedures that (1) pertain to the maintenance of records that, in reasonable detail, accurately and fairly reflect the transactions and dispositions of the assets of the company; (2) provide reasonable assurance that transactions are recorded as necessary to permit preparation of financial statements in accordance with generally accepted accounting principles, and that receipts and expenditures of the company are being made only in accordance with authorizations of management and directors of the company; and (3) provide reasonable assurance regarding prevention or timely detection of unauthorized acquisition, use, or disposition of the company’s assets that could have a material effect on the financial statements.
Because of its inherent limitations, internal control over financial reporting may not prevent or detect misstatements. Also, projections of any evaluation of effectiveness to future periods are subject to the risk that controls may become inadequate because of changes in conditions, or that the degree of compliance with the policies or procedures may deteriorate.
In our opinion, Consolidated Communications Holdings, Inc. and subsidiaries maintained, in all material respects, effective internal control over financial reporting as of December 31, 2016, based on the COSO criteria.
We also have audited, in accordance with the standards of the Public Company Accounting Oversight Board (United States), the consolidated balance sheets of Consolidated Communications Holdings, Inc. and subsidiaries as of December 31, 2016 and 2015, and the related consolidated statements of operations, comprehensive income (loss), changes in shareholders’ equity, and cash flows for each of the three years in the period ended December 31, 2016, and our report dated February 28, 2017 expressed an unqualified opinion thereon.
St. Louis, Missouri
February 28, 2017
Item 9B. Other Information
None.
PART III
Item 10. Directors, Executive Officers and Corporate Governance
Our Board of Directors adopted a Code of Business Conduct and Ethics (“the code”) that applies to all of our employees, officers and directors, including our principal executive officer, principal financial officer and principal accounting officer. A copy of the code is posted on our investor relations website at www.consolidated.com. Information contained on the website is not incorporated by reference in, or considered to be a part of, this document.
Additional information required by this Item is incorporated herein by reference to our proxy statement for the annual meeting of our shareholders to be filed pursuant to Regulation 14A within 120 days after our fiscal year-end of December 31, 2016.
Item 11. Executive Compensation
Incorporated herein by reference to our proxy statement for the annual meeting of our shareholders to be filed pursuant to Regulation 14A within 120 days after our fiscal year-end of December 31, 2016.
Item 12. Security Ownership of Certain Beneficial Owners and Management and Related Stockholder Matters
Incorporated herein by reference to our proxy statement for the annual meeting of our shareholders to be filed pursuant to Regulation 14A within 120 days after our fiscal year-end of December 31, 2016.
Item 13. Certain Relationships and Related Transactions, and Director Independence
Incorporated herein by reference to our proxy statement for the annual meeting of our shareholders to be filed pursuant to Regulation 14A within 120 days after our fiscal year-end of December 31, 2016.
Item 14. Principal Accountant Fees and Services
Incorporated herein by reference to our proxy statement for the annual meeting of our shareholders to be filed pursuant to Regulation 14A within 120 days after our fiscal year-end of December 31, 2016.
PART IV
Item 15. Exhibits and Financial Statement Schedules
| | | | | |
a) | | (1) All Financial Statements | | Location | |
| | | | | |
| | The following consolidating financial statements and independent auditors’ reports are filed as part of this report on Form 10-K in Item 8–“Financial Statements and Supplementary Data”: | | | |
| | | | | |
| | Reports of Independent Registered Public Accounting Firm | | F-1 | |
| | Consolidated Statements of Operations for each of the three years in the period ended December 31, 2016 | | F-2 | |
| | Consolidated Statements of Comprehensive Income (Loss) for each of the three years in the period ended December 31, 2016 | | F-3 | |
| | Consolidated Balance Sheets as of December 31, 2016 and 2015 | | F-4 | |
| | Consolidated Statements of Shareholders’ Equity for each of the three years in the period ended December 31, 2016 | | F-5 | |
| | Consolidated Statements of Cash Flows for each of the three years in the period ended December 31, 2016 | | F-6 | |
| | Notes to Consolidated Financial Statements | | F-7 | |
| | | | | |
| | (2) Financial Statement Schedules | | Location | |
| | | | | |
| | Independent Auditors’ Report –Ernst & Young LLP | | S-1 | |
| | Pennsylvania RSA No. 6 (II) Limited Partnership Balance Sheets - As of December 31, 2016 (unaudited) and 2015 | | S-2 | |
| | Pennsylvania RSA No. 6 (II) Limited Partnership Statements of Income and Comprehensive Income – For the Years Ended December 31, 2016 (unaudited), 2015 and 2014 | | S-3 | |
| | Pennsylvania RSA No. 6 (II) Limited Partnership Statements of Changes in Partners’ Capital – For the Years Ended December 31, 2016 (unaudited), 2015 and 2014 | | S-4 | |
| | Pennsylvania RSA No. 6 (II) Limited Partnership Statements of Cash Flows – For the Years Ended December 31, 2016 (unaudited), 2015 and 2014 | | S-5 | |
| | Pennsylvania RSA No. 6 (II) Limited Partnership - Notes to Financial Statements | | S-6 | |
| | | | | |
| | Independent Auditors’ Report –Ernst & Young LLP | | S-23 | |
| | GTE Mobilnet of Texas RSA #17 Limited Partnership Balance Sheets - As of December 31, 2016 and 2015 | | S-24 | |
| | GTE Mobilnet of Texas RSA #17 Limited Partnership Statements of Income and Comprehensive Income – For the Years Ended December 31, 2016, 2015 and 2014 | | S-25 | |
| | GTE Mobilnet of Texas RSA #17 Limited Partnership Statements of Changes in Partners’ Capital – For the Years Ended December 31, 2016, 2015 and 2014 | | S-26 | |
| | GTE Mobilnet of Texas RSA #17 Limited Partnership Statements of Cash Flows – For the Years Ended December 31, 2016, 2015 and 2014 | | S-27 | |
| | GTE Mobilnet of Texas RSA #17 Limited Partnership - Notes to Financial Statements | | S-28 | |
| | | | | |
| | All other financial statement schedules have been omitted because they are not required, not applicable, or the information is otherwise included in the notes to the financial statements. | | | |
| | | | | |
| | (3) Exhibits | | | |
| | | | | |
| | The exhibits listed below on the accompanying Index to Exhibits are filed or furnished as part of this report. | | | |
No.
| | | |
Exhibit
No. | Description |
2.1* | Agreement and Plan of Merger, dated as of June 29, 2014, by and among the Company, Enventis Corporation and Sky Merger Sub Inc. (incorporated by reference to Exhibit 2.1 to our Current Report on Form 8-K dated June 29, 2014). |
2.2* | Agreement and Plan of Merger, dated as of December 3, 2016, by and among the Company, FairPoint Communications, Inc. and Falcon Merger Sub, Inc. (incorporated by reference to Exhibit 2.1 to our Current Report on Form 8-K dated December 3, 2016), as amended by the First Amendment thereto, dated as of January 20, 2017 (incorporated by reference to Annex I to our Registration Statement on Form S-4/A, as filed on February 24, 2017). |
3.1 | Form of Amended and Restated Certificate of Incorporation (incorporated by reference to Exhibit 3.1 to Amendment No. 7 to Form S-1 dated July 19, 2005, file no. 333-121086) |
3.2 | Certificate of Amendment of the Amended and Restated Certificate of Incorporation of Consolidated Communications Holdings, Inc., as filed with the Secretary of State of the State of Delaware on May 3, 2011 (incorporated by reference to Exhibit 3.1 to our Current Report on Form 8-K dated May 4, 2011) |
3.3 | Amended and Restated Bylaws of Consolidated Communications Holdings Inc., as amended as of June 29, 2014 (incorporated by reference to Exhibit 3.2 to our Current Report on Form 8-K dated June 29, 2014). |
4.1 | Specimen Common Stock Certificate (incorporated by reference to Exhibit 4.1 to Amendment No. 7 to Form S-1 dated July 19, 2005, file no. 333-121086) |
4.2 | Indenture, dated as of September 18, 2014, between Consolidated Communications, Inc. (“CCI”) (as successor to Consolidated Communications Finance II Co. (“CCFII Co.”) and Wells Fargo Bank, National Association, as trustee (incorporated by reference to Exhibit 4.1 to our Current Report on Form 8-K dated September 18, 2014) |
4.3 | First Supplemental Indenture, dated as of October 16, 2014, among the Company, CCI, Consolidated Communications Enterprise Services, Inc. (“CCES”), Consolidated Communications of Fort Bend Company (“CCFBC”) Consolidated Communications of Pennsylvania Company, LLC (“CCPC”), Consolidated Communications Services Company (“CCSC”), Consolidated Communications of Texas Company (“CCTC”), SureWest Communications (“SW Communications”), SureWest Fiber Ventures, LLC (“SW Fiber Ventures”), SureWest Kansas, Inc. (“SW Kansas”), SureWest Long Distance (“SW Long Distance”), SureWest Telephone (“SW Telephone”), SureWest TeleVideo (“SW TeleVideo”), and Wells Fargo Bank, National Association (incorporated by reference to Exhibit 4.1 to our Current Report on Form 8-K dated October 16, 2014) |
4.4 | Second Supplemental Indenture, dated as of November 14, 2014, among Enventis Corporation, Cable Network, Inc., Crystal Communications, Inc., Enventis Telecom, Inc., Heartland Telecommunications Company of Iowa, Inc., Mankato Citizens Telephone Company, Mid-Communications, Inc., National Independent Billing, Inc., IdeaOne Telecom Inc. and Enterprise Integration Services, Inc. (collectively, the “Enventis Subsidiaries”), CCI and Wells Fargo Bank, National Association (incorporated by reference to Exhibit 4.2 to our Current Report on Form 8-K dated November 14, 2014) |
4.5 | Third Supplemental Indenture, dated as of June 8, 2015, among CCES, CCFBC, CCPC, CCSC, CCTC, SW Fiber Ventures, SW Kansas, SW Telephone, SW TeleVideo, each of the Enventis Subsidiaries; the Company; CCI; and Wells Fargo Bank, National Association, as trustee (incorporated by reference to Exhibit 4.1 to our Current Report on Form 8-K dated June 8, 2015) |
4.6 | Fourth Supplemental Indenture, dated as of January 1, 2016, among CCTC; Consolidated Communications of Fort Bend Company; CCSC; Consolidated Communications Enterprise Services, Inc.; Consolidated Communications of Pennsylvania Company, LLC; Consolidated Communications of California Company; Crystal Communications, Inc.; Enventis Telecom, Inc.; Consolidated Communications of Iowa Company; Consolidated Communications of Minnesota Company; Consolidated Communications of Mid-Comm. Company, IdeaOne Telecom, Inc.; SureWest TeleVideo.; the Company; Consolidated Communications, Inc. and Wells Fargo Bank, National Association, as trustee (incorporated by reference to Exhibit 4.1 to our Current Report on Form 8-K dated January 1, 2016) |
4.7 | Form of 6.50% Senior Note due 2022 (incorporated by reference to Exhibit A to Exhibit 4.1 to our Current Report on Form 8-K dated September 18, 2014) |
10.1 | Restatement Agreement, dated as of October 5, 2016, by and among the Company, CCI, the lenders referred to therein, and Wells Fargo Bank, National Association, as administrative agent, including the Third Amended and Restated Credit Agreement attached as Annex A to the Restatement Agreement, by and among the Company, CCI, the lenders referred to therein, and Wells Fargo Bank, National Association, as Administrative Agent, attached as Annex A to such Restatement Agreement (incorporated by reference to Exhibit 10.1 to our Current Report on Form 8-K for the year ended October 5, 2016), as amended by Amendment No. 1 to Third Amended and Restated Credit Agreement, dated as of December 14, 2016, by and among the Company, CCI, the lenders party thereto, Wells Fargo Bank, National Association, as Administrative Agent and other agents party thereto (incorporated by reference to Exhibit 10.1 to our Current Report on Form 8-K for the year ended December 14, 2016) and Amendment No. 2 to Third Amended and Restated Credit Agreement, dated as of December 21, 2016, by and among the Company, CCI, certain other subsidiaries of the Company, the lenders party thereto, Wells Fargo Bank, National Association, as Administrative Agent and other agents party thereto |
10.2 | Form of Collateral Agreement, dated December 31, 2007, by and among the Company, CCI, Consolidated Communications Acquisition Texas, Inc., Fort Pitt Acquisition Sub Inc., certain subsidiaries of the Company identified on the signature pages thereto, in favor of Wells Fargo Bank, National Association (successor by merger to Wachovia Bank, National Association), as Administrative Agent (incorporated by reference to Exhibit 10.2 to our Annual Report on Form 10-K for the period ended December 31, 2007, file no. 000-51446) |
10.3 | Form of Guaranty Agreement, dated December 31, 2007, made by the Company and certain subsidiaries of the Company identified on the signature pages thereto, in favor of Wells Fargo Bank, National Association (successor by merger to Wachovia Bank, National Association), as Administrative Agent (incorporated by reference to Exhibit 10.3 to our Annual Report on Form 10-K for the period ended December 31, 2007, file no. 000-51446) |
10.4** | Joinder Agreement (to Guaranty Agreement and Collateral Agreement), dated as of November 14, 2014, among each of the Enventis Subsidiaries, the Company, CCI, and Wells Fargo Bank, National Association, a national banking association, as Administrative Agent for the Lenders under the Second Amended and Restated Credit Agreement dated December 23, 2013 (incorporated by reference to Exhibit 4.1 to our Current Report on Form 8-K dated November 14, 2014) |
10.5 | Lease Agreement, dated December 22, 2010, between LATEL, LLC and Consolidated Communications Services Company (incorporated by reference to Exhibit 10.1 to our Current Report on Form 8-K dated December 22, 2010) |
10.6 | Lease Agreement, dated December 22, 2010, between LATEL, LLC and Illinois Consolidated Telephone Company (incorporated by reference to Exhibit 10.2 to our Current Report on Form 8-K dated December 22, 2010) |
10.7 | Lease Agreement, dated December 22, 2010, between LATEL, LLC and Illinois Consolidated Telephone Company (incorporated by reference to Exhibit 10.3 to our Current Report on Form 8-K dated December 22, 2010) |
10.8*** | Amended and Restated Consolidated Communications Holdings, Inc. Restricted Share Plan (incorporated by reference to Exhibit 10.11 to Amendment No. 7 to Form S-1 dated July 19, 2005, file no. 333-121086) |
10.9*** | Consolidated Communications Holdings, Inc. 2005 Long-Term Incentive Plan (as amended and restated effective May 4, 2015) (incorporated by reference to Exhibit A to our definitive proxy statement on Schedule 14A filed with the SEC on March 27, 2015) |
10.10*** | Form of Employment Security Agreement with certain of the Company’s employees (incorporated by reference to Exhibit 10.1 to our Quarterly Report on Form 10-Q for the quarter ended September 30, 2012) |
10.11*** | Form of Employment Security Agreement with Robert J. Currey (incorporated by reference to Exhibit 10.1 to our Current Report on Form 8-K dated December 4, 2009) |
10.12*** | Form of Employment Security Agreement with certain of the Company’s other executive officers (incorporated by reference to Exhibit 10.2 to our Current Report on Form 8-K dated December 4, 2009) |
10.13*** | Form of Employment Security Agreement with the Company’s and its subsidiaries vice president and director level employees (incorporated by reference to Exhibit 10.12 to our Annual Report on Form 10-K for the period ended December 31, 2007, file no. 000-51446) |
10.14*** | Executive Long-Term Incentive Program, as revised March 12, 2007 (incorporated by reference to Exhibit 10.1 to our Current Report on Form 8-K dated March 12, 2007, file no. 000-51446) |
10.15*** | Form of 2005 Long-Term Incentive Plan Performance Stock Grant Certificate (incorporated by reference to Exhibit 10.2 to our Current Report on Form 8-K dated March 12, 2007, file no. 000-51446) |
10.16*** | Form of 2005 Long-Term Incentive Plan Restricted Stock Grant Certificate (incorporated by reference to Exhibit 10.3 to our Current Report on Form 8-K dated March 12, 2007, file no. 000-51446) |
10.17*** | Form of 2005 Long-Term Incentive Plan Restricted Stock Grant Certificate for Directors (incorporated by reference to Exhibit 10.4 to our Current Report on Form 8-K dated March 12, 2007, file no. 000-51446) |
10.18*** | Description of the Consolidated Communications Holdings, Inc. Bonus Plan (incorporated by reference to Exhibit 10.5 to our Current Report on Form 8-K dated March 12, 2007, file no. 000-51446) |
10.19 | Form of Indemnification Agreement with Directors and Executive Officers (incorporated by reference to Exhibit 10.1 to our Current Report on Form 8-K dated May 7, 2013) |
10.20 | Commitment Letter, dated as of December 3, 2016, from (i) Morgan Stanley Senior Funding, Inc., (ii) The Bank of Tokyo-Mitsubishi UFJ, Ltd., MUFG Union Bank, N.A., MUFG Securities Americas Inc. (collectively, “MUFG”) and/or any other affiliates or subsidiaries as MUFG collectively deems appropriate to provide the services referred to therein, (iii) TD Securities (USA) LLC, (iv) The Toronto-Dominion Bank, New York Branch, and (v) Mizuho Bank, Ltd. and agreed to and accepted by Consolidated Communications, Inc. (incorporated by reference to Exhibit 10.1 to our Current Report on Form 8-K dated December 3, 2016) |
21 | List of subsidiaries of the Registrant |
23.1 | Consent of Ernst & Young LLP |
23.2 | Consent of Ernst & Young LLP |
31.1 | Certificate of Chief Executive Officer of Consolidated Communications Holdings, Inc. pursuant to Rule 13(a)-14(a) under the Securities Exchange Act of 1934 |
31.2 | Certificate of Chief Financial Officer of Consolidated Communications Holdings, Inc. pursuant to Rule 13(a)-14(a) under the Securities Exchange Act of 1934 |
32.1 | Certification of the Chief Executive Officer and Chief Financial Officer pursuant to 18 U.S.C. Section 1350, as adopted pursuant to Section 906 of the Sarbanes-Oxley Act of 2002. |
101 | The following financial information from Consolidated Communications Holdings, Inc. Annual Report on Form 10-K for the year ended December 31, 2016, formatted in XBRL (eXtensible Business Reporting Language): (i) Consolidated Statements of Operations, (ii) Consolidated Statements of Comprehensive Income, (iii) Consolidated Balance Sheets, (iv) Consolidated Statements of Changes in Shareholders’ Equity, (v) Consolidated Statements of Cash Flows, and (vi) Notes to Consolidated Financial Statements. |
*Schedules and other attachments to the Agreement and Plan of Merger, which are listed in the exhibit, are omitted. The Company agrees to furnish a supplemental copy of any schedule or other attachment to the Securities and Exchange Commission upon request.
**Annexes to the Joinder Agreement, which are listed in the exhibit, are omitted. The Company agrees to furnish a supplemental copy of any annex to the Securities and Exchange Commission upon request.
***Compensatory plan or arrangement.
Item 16.Form 10-K Summary
Not Applicable.
SIGNATURES
Pursuant to the requirements of Section 13 or 15(d) of the Securities Exchange Act of 1934, the registrant has duly caused this report to be signed on its behalf by the undersigned, thereunto duly authorized, in Mattoon, Illinois on February 28, 2017.
| | |
| CONSOLIDATED COMMUNICATIONS HOLDINGS, INC. |
| By: | /s/ C. ROBERT UDELL JR. |
| | C. Robert Udell Jr. |
| | Chief Executive Officer |
Pursuant to the requirements of the Securities Exchange Act of 1934, this report has been signed below by the following persons on behalf of the registrant and in the capacities and on the dates indicated.
| | | | | | |
Signature | | Title | | Date |
| | | | |
By: | /s/ C. ROBERT UDELL JR. | | | President and | | February 28, 2017 |
| C. Robert Udell Jr. | | Chief Executive Officer, Director | | |
| | (Principal Executive Officer) | | |
| | | | |
By: | /s/ STEVEN L. CHILDERS | | | Chief Financial Officer (Principal | | February 28, 2017 |
| Steven L. Childers | | Financial and Accounting Officer) | | |
| | | | |
By: | /s/ ROBERT J. CURREY | | | Executive Chairman | | February 28, 2017 |
| Robert J. Currey | | | | |
| | | | |
By: | /s/ RICHARD A. LUMPKIN | | | Director | | February 28, 2017 |
| Richard A. Lumpkin | | | | |
| | | | |
By: | /s/ ROGER H. MOORE | | | Director | | February 28, 2017 |
| Roger H. Moore | | | | |
| | | | |
By: | /s/ MARIBETH S. RAHE | | | Director | | February 28, 2017 |
| Maribeth S. Rahe | | | | |
| | | | |
By: | /s/ TIMOTHY D. TARON | | | Director | | February 28, 2017 |
| Timothy D. Taron | | | | |
| | | | |
By: | /s/ THOMAS A. GERKE | | | Director | | February 28, 2017 |
| Thomas A. Gerke | | | | |
| | | | |
By: | /s/ DALE E. PARKER | | | Director | | February 28, 2017 |
| Dale E. Parker | | | | |
REPORT OF INDEPENDENT REGISTERED PUBLIC ACCOUNTING FIRM
The Board of Directors and Shareholders
Consolidated Communications Holdings, Inc.
We have audited the accompanying consolidated balance sheets of Consolidated Communications Holdings, Inc. and subsidiaries (the Company) as of December 31, 20132016 and 2012,2015, and the related consolidated statements of income,operations, comprehensive income (loss), changes in shareholders’ equity, and cash flows for each of the three years in the period ended December 31, 2013.2016. These consolidated financial statements are the responsibility of the Company’s management. Our responsibility is to express an opinion on these consolidated financial statements based on our audits.
We conducted our audits in accordance with the standards of the Public Company Accounting Oversight Board (United States). Those standards require that we plan and perform the audit to obtain reasonable assurance about whether the consolidated financial statements are free of material misstatement. An audit includes examining, on a test basis, evidence supporting the amounts and disclosures in the consolidated financial statements. An audit also includes assessing the accounting principles used and the significant estimates made by management, as well as evaluating the overall financial statement presentation. We believe that our audits provide a reasonable basis for our opinion.
In our opinion, the consolidated financial statements referred to above present fairly, in all material respects, the consolidated financial position of Consolidated Communications Holdings, Inc. and subsidiaries at December 31, 20132016 and 2012,2015, and the consolidated results of their operations and their cash flows for each of the three years in the period ended December 31, 2013,2016, in conformity with U.S. generally accepted accounting principles.
We also have audited, in accordance with the standards of the Public Company Accounting Oversight Board (United States), Consolidated Communications Holdings, Inc.’s internal control over financial reporting as of December 31, 2013,2016, based on criteria established in Internal Control — IntegratedControl-Integrated Frameworkissued by the Committee of Sponsoring Organizations of the Treadway Commission (1992(2013 framework), and our report dated March 5, 2014,February 28, 2017, expressed an unqualified opinion thereon.
| /s/ Ernst & Young LLP |
| |
St. Louis, Missouri | |
February 28, 2017 | |
St. Louis, Missouri
March 5, 2014
F-1
CONSOLIDATED COMMUNICATIONS HOLDINGS, INC. AND SUBSIDIARIES
CONSOLIDATED STATEMENTS OF INCOMEOPERATIONS
(amounts in thousands except per share amounts)
| | | | | | | | | | | | |
| | Year Ended December 31, | | | | Year Ended December 31, | |
| | 2013 | | 2012 | | 2011 | | | | 2016 | | 2015 | | 2014 | |
| | | | | | | | | | | | | | | | | | |
Net revenues | | $ | 601,577 | | $ | 477,877 | | $ | 349,003 | | | | $ | 743,177 | | $ | 775,737 | | $ | 635,738 | |
| | | | | | | | | | | | | | | | | | |
Operating expense: | | | | | | | | | | | | | | | | | | |
Cost of services and products (exclusive of depreciation and amortization) | | 222,452 | | 175,929 | | 121,711 | | | | | 322,792 | | | 328,400 | | | 242,661 | |
Selling, general and administrative expenses | | 135,414 | | 108,163 | | 77,724 | | | | | 157,111 | | | 178,227 | | | 140,636 | |
Financing and other transaction costs | | 776 | | 20,800 | | 2,649 | | |
Impairment of intangible assets | | - | | 1,236 | | - | | |
Acquisition and other transaction costs | | | | | 1,214 | | | 1,413 | | | 11,817 | |
Loss on impairment | | | | | 610 | | | — | | | — | |
Depreciation and amortization | | 139,274 | | 120,332 | | 88,090 | | | | | 174,010 | | | 179,922 | | | 149,435 | |
Income from operations | | 103,661 | | 51,417 | | 58,829 | | | | | 87,440 | | | 87,775 | | | 91,189 | |
| | | | | | | | | | | | | | | | | | |
Other income (expense): | | | | | | | | | | | | | | | | | | |
Interest expense, net of interest income | | (85,767) | | (72,604) | | (49,391) | | | | | (76,826) | | | (79,618) | | | (82,537) | |
Loss on extinguishment of debt | | (7,657) | | (4,455) | | - | | | | | (6,559) | | | (41,242) | | | (13,785) | |
Investment income | | 37,695 | | 30,667 | | 27,843 | | | | | 32,972 | | | 36,690 | | | 34,516 | |
Other, net | | (456) | | 601 | | 148 | | | | | 1,131 | | | (1,501) | | | (968) | |
Income from continuing operations before income taxes | | 47,476 | | 5,626 | | 37,429 | | |
Income before income taxes | | | | | 38,158 | | | 2,104 | | | 28,415 | |
| | | | | | | | | | | | | | | | | | |
Income tax expense | | 17,512 | | 661 | | 13,141 | | | | | 22,962 | | | 2,775 | | | 13,027 | |
| | | | | | | | | | | | | | | | | | |
Income from continuing operations | | 29,964 | | 4,965 | | 24,288 | | |
Net income (loss) | | | | | 15,196 | | | (671) | | | 15,388 | |
Less: net income attributable to noncontrolling interest | | | | | 265 | | | 210 | | | 321 | |
Net income (loss) attributable to common shareholders | | | | $ | 14,931 | | $ | (881) | | $ | 15,067 | |
| | | | | | | | | | | | | | | | | | |
Discontinued operations, net of tax: | | | | | | | | |
Income (loss) from discontinued operations, net of tax | | (156) | | 1,206 | | 2,694 | | |
Gain on sale of discontinued operations, net of tax | | 1,333 | | - | | - | | |
Total discontinued operations | | 1,177 | | 1,206 | | 2,694 | | |
| | | | | | | | |
Net income | | 31,141 | | 6,171 | | 26,982 | | |
Less: net income attributable to noncontrolling interest | | 330 | | 531 | | 572 | | |
Net income attributable to common shareholders | | $ | 30,811 | | $ | 5,640 | | $ | 26,410 | | |
| | | | | | | | |
Net income per common share - basic and diluted | | | | | | | | |
Income from continuing operations | | $ | 0.73 | | $ | 0.12 | | $ | 0.79 | | |
Discontinued operations, net of tax | | 0.03 | | 0.03 | | 0.09 | | |
Net income per basic and diluted common shares attributable to common shareholders | | $ | 0.76 | | $ | 0.15 | | $ | 0.88 | | |
Net income (loss) per basic and diluted common shares attributable to common shareholders | | | | $ | 0.29 | | $ | (0.02) | | $ | 0.35 | |
| | | | | | | | | | | | | | | | | | |
Dividends declared per common share | | $ | 1.55 | | $ | 1.55 | | $ | 1.55 | | | | $ | 1.55 | | $ | 1.55 | | $ | 1.55 | |
See accompanying notes.
F-2
CONSOLIDATED COMMUNICATIONS HOLDINGS, INC. AND SUBSIDIARIES
CONSOLIDATED STATEMENTS OF COMPREHENSIVE INCOME (LOSS)
(amounts in thousands)
| | Year Ended December 31, | | | | | | | | | | | |
| | 2013 | | 2012 | | 2011 | | | Year Ended December 31, | |
| | | | | | | | | 2016 | | 2015 | | 2014 | |
Net income | | $ | 31,141 | | $ | 6,171 | | $ | 26,982 | | |
| | | | | | | | | | | |
Net income (loss) | | | $ | 15,196 | | $ | (671) | | $ | 15,388 | |
Pension and post-retirement obligations: | | | | | | | | | | | | | | | | | |
Change in net actuarial loss and prior service credit, net of tax expense (benefit) of $24,604, $(8,932) and $(8,516) in 2013, 2012 and 2011, respectively | | 39,381 | | (14,205) | | (14,095) | | |
Amortization of actuarial losses and prior service credit to earnings, net of tax expense of $1,172, $771 and $83 in 2013, 2012 and 2011, respectively | | 1,843 | | 1,276 | | 136 | | |
Change in net actuarial loss and prior service credit, net of tax (benefit) of $(9,534), $(3,533) and $(20,039) in 2016, 2015 and 2014, respectively | | | | (14,831) | | | (5,547) | | | (31,191) | |
Amortization of actuarial losses (gains) and prior service credit to earnings, net of tax expense (benefit) of $1,738, $1,098 and $(400) in 2016, 2015 and 2014, respectively | | | | 2,706 | | | 1,707 | | | (637) | |
Derivative instruments designated as cash flow hedges: | | | | | | | | | | | | | | | | | |
Change in fair value of derivatives, net of tax benefit of $233, $2,074 and $2,807 in 2013, 2012 and 2011, respectively | | (381) | | (3,557) | | (4,810) | | |
Reclassification of realized loss to earnings, net of tax expense of $1,934, $5,129 and $7,242 in 2013, 2012 and 2011, respectively | | 3,941 | | 8,535 | | 12,407 | | |
Change in fair value of derivatives, net of tax (benefit) of $(180), $(672) and $(51) in 2016, 2015 and 2014, respectively | | | | (289) | | | (1,072) | | | (81) | |
Reclassification of realized loss to earnings, net of tax expense of $516, $518 and $781 in 2016, 2015 and 2014, respectively | | | | 836 | | | 853 | | | 1,269 | |
Comprehensive income (loss) | | 75,925 | | (1,780) | | 20,620 | | | | 3,618 | | | (4,730) | | | (15,252) | |
Less: comprehensive income attributable to noncontrolling interest | | 330 | | 531 | | 572 | | | | 265 | | | 210 | | | 321 | |
| | | | | | | | |
Total comprehensive income (loss) attributable to common shareholders | | $ | 75,595 | | $ | (2,311) | | $ | 20,048 | | | $ | 3,353 | | $ | (4,940) | | $ | (15,573) | |
See accompanying notes.
F-3
CONSOLIDATED COMMUNICATIONS HOLDINGS, INC. AND SUBSIDIARIES
CONSOLIDATED BALANCE SHEETS
(amounts in thousands, except share and per share amounts)
| | | | | | | |
| | December 31, | | | December 31, | |
| | 2013 | | 2012 | | | 2016 | | 2015 | |
ASSETS | | | | | | | | | | | | |
Current assets: | | | | | | | | | | | | |
Cash and cash equivalents | | $ | 5,551 | | $ | 17,854 | | | $ | 27,077 | | $ | 15,878 | |
Accounts receivable, net of allowance for doubtful accounts | | 52,033 | | 57,957 | | | | 56,216 | | | 68,848 | |
Income tax receivable | | 9,796 | | 12,020 | | | | 21,616 | | | 23,867 | |
Deferred income taxes | | 7,960 | | 9,000 | | |
Prepaid expenses and other current assets | | 12,380 | | 11,269 | | | | 28,292 | | | 17,815 | |
Assets of discontinued operations | | - | | 1,189 | | |
Total current assets | | 87,720 | | 109,289 | | | | 133,201 | | | 126,408 | |
| | | | | | | | | | | | |
Property, plant and equipment, net | | 885,362 | | 907,672 | | | | 1,055,186 | | | 1,093,261 | |
Investments | | 113,099 | | 109,750 | | | | 106,221 | | | 105,543 | |
Goodwill | | 603,446 | | 603,446 | | | | 756,877 | | | 764,630 | |
Other intangible assets | | 40,084 | | 49,530 | | | | 31,612 | | | 43,497 | |
Deferred debt issuance costs, net and other assets | | 17,667 | | 13,800 | | |
Other assets | | | | 9,661 | | | 5,187 | |
Total assets | | $ | 1,747,378 | | $ | 1,793,487 | | | $ | 2,092,758 | | $ | 2,138,526 | |
| | | | | | | | | | | | |
LIABILITIES AND SHAREHOLDERS’ EQUITY | | | | | | | | | | | | |
Current liabilities: | | | | | | | | | | | | |
Accounts payable | | $ | 4,885 | | $ | 14,954 | | | $ | 6,766 | | $ | 12,576 | |
Advance billings and customer deposits | | 25,934 | | 27,654 | | | | 26,438 | | | 27,616 | |
Dividends payable | | 15,520 | | 15,463 | | | | 19,605 | | | 19,551 | |
Accrued compensation | | 22,252 | | 21,912 | | | | 16,971 | | | 21,883 | |
Accrued interest | | | | 11,260 | | | 9,353 | |
Accrued expense | | 38,697 | | 47,225 | | | | 54,123 | | | 42,384 | |
Current portion of long-term debt and capital lease obligations | | 9,751 | | 9,596 | | | | 14,922 | | | 10,937 | |
Current portion of derivative liability | | 660 | | 3,164 | | |
Liabilities of discontinued operations | | - | | 4,209 | | |
Total current liabilities | | 117,699 | | 144,177 | | | | 150,085 | | | 144,300 | |
| | | | | | | | | | | | |
Long-term debt and capital lease obligations | | 1,212,134 | | 1,208,248 | | | | 1,376,754 | | | 1,377,892 | |
Deferred income taxes | | 179,859 | | 137,501 | | | | 244,298 | | | 236,529 | |
Pension and other postretirement obligations | | 75,754 | | 156,710 | | |
Pension and other post-retirement obligations | | | | 130,793 | | | 112,966 | |
Other long-term liabilities | | 9,593 | | 10,746 | | | | 14,573 | | | 16,140 | |
Total liabilities | | 1,595,039 | | 1,657,382 | | | | 1,916,503 | | | 1,887,827 | |
| | | | | | | | | | | | |
Commitments and contingencies | | | | | | |
Commitments and contingencies (Note 11) | | | | | | | | |
| | | | | | | | | | | | |
Shareholders’ equity: | | | | | | | | | | | | |
Common stock, par value $0.01 per share; 100,000,000 shares authorized, 40,065,246 and 39,877,998 shares outstanding as of December 31, 2013 and 2012, respectively | | 401 | | 399 | | |
Common stock, par value $0.01 per share; 100,000,000 shares authorized, 50,612,362 and 50,470,096 shares outstanding as of December 31, 2016 and December 31, 2015, respectively | | | | 506 | | | 505 | |
Additional paid-in capital | | 148,433 | | 177,315 | | | | 217,725 | | | 281,738 | |
Retained earnings | | – | | – | | |
Retained earnings (deficit) | | | | — | | | (881) | |
Accumulated other comprehensive loss, net | | (1,000) | | (45,784) | | | | (47,277) | | | (35,699) | |
Noncontrolling interest | | 4,505 | | 4,175 | | | | 5,301 | | | 5,036 | |
Total shareholders’ equity | | 152,339 | | 136,105 | | | | 176,255 | | | 250,699 | |
Total liabilities and shareholders’ equity | | $ | 1,747,378 | | $ | 1,793,487 | | | $ | 2,092,758 | | $ | 2,138,526 | |
|
See accompanying notes.
CONSOLIDATED COMMUNICATIONS HOLDINGS, INC. AND SUBSIDIARIES
CONSOLIDATED STATEMENTS OF CHANGES IN SHAREHOLDERS’ EQUITY
(amounts in thousands)
| | | | | | | | | | | | | | | | | | | | | |
| | | | | | | | | | | | | Accumulated | | | | | | | |
| | | | | | | Additional | | Retained | | Other | | Non- | | | | |
| | Common Stock | | Paid-in | | Earnings | | Comprehensive | | controlling | | | | |
| | Shares | | Amount | | Capital | | (Deficit) | | Loss, net | | Interest | | Total | |
| | | | | | | | | | | | | | | | | | | | | |
Balance at December 31, 2013 | | 40,066 | | $ | 401 | | $ | 148,433 | | $ | — | | $ | (1,000) | | $ | 4,505 | | $ | 152,339 | |
Cash dividends on common stock | | — | | | — | | | (51,264) | | | (15,067) | | | — | | | — | | | (66,331) | |
Shares issued upon acquisition of Enventis | | 10,144 | | | 101 | | | 257,558 | | | — | | | — | | | — | | | 257,659 | |
Shares issued under employee plan, net of forfeitures | | 224 | | | 2 | | | (2) | | | — | | | — | | | — | | | — | |
Non-cash, share-based compensation | | — | | | — | | | 3,622 | | | — | | | — | | | — | | | 3,622 | |
Purchase and retirement of common stock | | (69) | | | — | | | (1,856) | | | — | | | — | | | — | | | (1,856) | |
Tax on restricted stock vesting | | — | | | — | | | 879 | | | — | | | — | | | — | | | 879 | |
Other comprehensive income (loss) | | — | | | — | | | — | | | — | | | (30,640) | | | — | | | (30,640) | |
Other | | — | | | — | | | (231) | | | — | | | — | | | — | | | (231) | |
Net income | | — | | | — | | | — | | | 15,067 | | | — | | | 321 | | | 15,388 | |
Balance at December 31, 2014 | | 50,365 | | $ | 504 | | $ | 357,139 | | $ | — | | $ | (31,640) | | $ | 4,826 | | $ | 330,829 | |
Cash dividends on common stock | | — | | | — | | | (78,250) | | | — | | | — | | | — | | | (78,250) | |
Shares issued under employee plan, net of forfeitures | | 161 | | | 1 | | | 770 | | | — | | | — | | | — | | | 771 | |
Non-cash, share-based compensation | | — | | | — | | | 2,994 | | | — | | | — | | | — | | | 2,994 | |
Purchase and retirement of common stock | | (56) | | | — | | | (1,125) | | | — | | | — | | | — | | | (1,125) | |
Tax on restricted stock vesting | | — | | | — | | | 210 | | | — | | | — | | | — | | | 210 | |
Other comprehensive income (loss) | | — | | | — | | | — | | | — | | | (4,059) | | | — | | | (4,059) | |
Net income (loss) | | — | | | — | | | — | | | (881) | | | — | | | 210 | | | (671) | |
Balance at December 31, 2015 | | 50,470 | | $ | 505 | | $ | 281,738 | | $ | (881) | | $ | (35,699) | | $ | 5,036 | | $ | 250,699 | |
Cash dividends on common stock | | — | | | — | | | (64,423) | | | (14,050) | | | — | | | — | | | (78,473) | |
Shares issued under employee plan, net of forfeitures | | 188 | | | 1 | | | 94 | | | — | | | — | | | — | | | 95 | |
Non-cash, share-based compensation | | — | | | — | | | 2,980 | | | — | | | — | | | — | | | 2,980 | |
Purchase and retirement of common stock | | (46) | | | — | | | (1,231) | | | — | | | — | | | — | | | (1,231) | |
Tax on restricted stock vesting | | — | | | — | | | (1,433) | | | — | | | — | | | — | | | (1,433) | |
Other comprehensive income (loss) | | — | | | — | | | — | | | — | | | (11,578) | | | — | | | (11,578) | |
Net income | | — | | | — | | | — | | | 14,931 | | | — | | | 265 | | | 15,196 | |
Balance at December 31, 2016 | | 50,612 | | $ | 506 | | $ | 217,725 | | $ | — | | $ | (47,277) | | $ | 5,301 | | $ | 176,255 | |
See accompanying notes.
F-4
CONSOLIDATED COMMUNICATIONS HOLDINGS, INC. AND SUBSIDIARIES
CONSOLIDATED STATEMENTS OF CHANGES IN SHAREHOLDERS’ EQUITYCASH FLOWS
(amounts in thousands)
| | Common Stock | | | | | | Accumulated | | | | | |
| | Shares | | Amount | | Additional
Paid-in
Capital | | Retained
Earnings | | Other
Comprehensive
Loss, net | | Non-
controlling
Interest | | Total | |
| | | | | | | | | | | | | | | |
Balance at December 31, 2010 | | 29,763 | | $ | 298 | | $ | 98,126 | | $ | – | | $ | (31,471) | | $ | 4,922 | | $ | 71,875 | |
Cash dividends on common stock | | – | | – | | (19,938) | | (26,410) | | – | | – | | (46,348) | |
Shares issued under employee plan, net of forfeitures | | 145 | | 1 | | – | | – | | – | | – | | 1 | |
Non-cash, stock-based compensation | | – | | – | | 2,132 | | – | | – | | – | | 2,132 | |
Purchase and retirement of common stock | | (38) | | – | | (726) | | – | | – | | – | | (726) | |
Tax on restricted stock vesting | | – | | – | | 258 | | – | | – | | – | | 258 | |
Other comprehensive income (loss) | | – | | – | | – | | – | | (6,362) | | – | | (6,362) | |
Net income | | – | | – | | – | | 26,410 | | – | | 572 | | 26,982 | |
Balance at December 31, 2011 | | 29,870 | | $ | 299 | | $ | 79,852 | | $ | – | | $ | (37,833) | | $ | 5,494 | | $ | 47,812 | |
Cash dividends on common stock | | – | | – | | (52,352) | | (5,640) | | – | | – | | (57,992) | |
Shares issued upon acquisition of SureWest | | 9,966 | | 100 | | 148,293 | | – | | – | | – | | 148,393 | |
Shares issued under employee plan, net of forfeitures | | 79 | | – | | – | | – | | – | | – | | – | |
Non-cash, stock-based compensation | | – | | – | | 2,348 | | – | | – | | – | | 2,348 | |
Purchase and retirement of common stock | | (37) | | – | | (559) | | – | | – | | – | | (559) | |
Tax on restricted stock vesting | | – | | – | | 47 | | – | | – | | – | | 47 | |
Distributions to non-controlling interests | | – | | – | | – | | – | | – | | (1,850) | | (1,850) | |
Other comprehensive income (loss) | | – | | – | | – | | – | | (7,951) | | – | | (7,951) | |
Other | | – | | – | | (314) | | – | | – | | – | | (314) | |
Net income | | – | | – | | – | | 5,640 | | – | | 531 | | 6,171 | |
Balance at December 31, 2012 | | 39,878 | | $ | 399 | | $ | 177,315 | | $ | – | | $ | (45,784) | | $ | 4,175 | | $ | 136,105 | |
Cash dividends on common stock | | – | | – | | (31,310) | | (30,811) | | – | | – | | (62,121) | |
Shares issued under employee plan, net of forfeitures | | 234 | | 2 | | – | | – | | – | | – | | 2 | |
Non-cash, stock-based compensation | | – | | – | | 3,028 | | – | | – | | – | | 3,028 | |
Purchase and retirement of common stock | | (46) | | – | | (889) | | – | | – | | – | | (889) | |
Tax on restricted stock vesting | | – | | – | | 289 | | – | | – | | – | | 289 | |
Other comprehensive income (loss) | | – | | – | | – | | – | | 44,784 | | – | | 44,784 | |
Net income | | – | | – | | – | | 30,811 | | – | | 330 | | 31,141 | |
Balance at December 31, 2013 | | 40,066 | | $ | 401 | | $ | 148,433 | | $ | – | | $ | (1,000) | | $ | 4,505 | | $ | 152,339 | |
| | | | | | | | | | |
| | Year Ended December 31, | |
| | 2016 | | 2015 | | 2014 | |
| | | | | | | | | | |
Cash flows from operating activities: | | | | | | | | | | |
Net income (loss) | | $ | 15,196 | | $ | (671) | | $ | 15,388 | |
Adjustments to reconcile net income to net cash provided by operating activities: | | | | | | | | | | |
Depreciation and amortization | | | 174,010 | | | 179,922 | | | 149,435 | |
Deferred income taxes | | | 20,863 | | | 5,828 | | | 10,244 | |
Cash distributions from wireless partnerships in excess of/(less than) current earnings | | | (504) | | | 8,585 | | | 212 | |
Stock-based compensation expense | | | 3,017 | | | 3,060 | | | 3,636 | |
Amortization of deferred financing costs | | | 3,223 | | | 3,378 | | | 4,364 | |
Loss on extinguishment of debt | | | 6,559 | | | 41,242 | | | 13,785 | |
Other, net | | | (920) | | | 506 | | | 2,973 | |
Changes in operating assets and liabilities, net of acquired businesses: | | | | | | | | | | |
Accounts receivable, net | | | 5,353 | | | 8,688 | | | 11,896 | |
Income tax receivable | | | 2,251 | | | (4,927) | | | (3,406) | |
Prepaids and other assets | | | (14,282) | | | 163 | | | 1,953 | |
Accounts payable | | | (1,067) | | | (2,701) | | | (1,904) | |
Accrued expenses and other liabilities | | | 4,534 | | | (23,894) | | | (20,791) | |
Net cash provided by operating activities | | | 218,233 | | | 219,179 | | | 187,785 | |
| | | | | | | | | | |
Cash flows from investing activities: | | | | | | | | | | |
Business acquisition, net of cash acquired | | | (13,422) | | | — | | | (139,558) | |
Purchases of property, plant and equipment, net | | | (125,192) | | | (133,934) | | | (108,998) | |
Purchase of investments | | | — | | | — | | | (100) | |
Proceeds from sale of assets | | | 208 | | | 13,548 | | | 1,795 | |
Proceeds from business dispositions | | | 30,119 | | | — | | | — | |
Proceeds from sale of investments | | | — | | | 846 | | | — | |
Net cash used in investing activities | | | (108,287) | | | (119,540) | | | (246,861) | |
| | | | | | | | | | |
Cash flows from financing activities: | | | | | | | | | | |
Proceeds from bond offering | | | — | | | 294,780 | | | 200,000 | |
Proceeds from issuance of long-term debt | | | 936,750 | | | 69,000 | | | 80,000 | |
Payment of capital lease obligations | | | (2,885) | | | (1,107) | | | (703) | |
Payment on long-term debt | | | (943,050) | | | (107,100) | | | (63,100) | |
Redemption of senior notes | | | — | | | (261,874) | | | (84,127) | |
Payment of financing costs | | | (9,912) | | | (4,805) | | | (7,438) | |
Share repurchases for minimum tax withholding | | | (1,231) | | | (1,125) | | | (1,856) | |
Dividends on common stock | | | (78,419) | | | (78,209) | | | (62,341) | |
Other | | | — | | | — | | | (231) | |
Net cash used in financing activities | | | (98,747) | | | (90,440) | | | 60,204 | |
Increase in cash and cash equivalents | | | 11,199 | | | 9,199 | | | 1,128 | |
Cash and cash equivalents at beginning of period | | | 15,878 | | | 6,679 | | | 5,551 | |
Cash and cash equivalents at end of period | | $ | 27,077 | | $ | 15,878 | | $ | 6,679 | |
See accompanying notes.
F-5
CONSOLIDATED COMMUNICATIONS HOLDINGS, INC. AND SUBSIDIARIES
CONSOLIDATED STATEMENTS OF CASH FLOWS
(amounts in thousands)
| | Year Ended December 31, | |
| | 2013 | | 2012 | | 2011 | |
| | | | | | | |
Cash flows from operating activities: | | | | | | | |
Net income | | $ | 31,141 | | $ | 6,171 | | $ | 26,982 | |
Income from discontinued operations, net of tax | | (1,177) | | (1,206) | | (2,694) | |
Net income from continuing operations | | 29,964 | | 4,965 | | 24,288 | |
Adjustments to reconcile net income to net cash provided by operating activities: | | | | | | | |
Depreciation and amortization | | 139,274 | | 120,332 | | 88,090 | |
Impairment of intangible assets | | - | | 1,236 | | - | |
Deferred income taxes | | 16,045 | | (757) | | 8,546 | |
Cash distributions from wireless partnerships in excess of/(less than) current earnings | | (2,949) | | (1,309) | | 945 | |
Stock-based compensation expense | | 3,028 | | 2,348 | | 2,132 | |
Amortization of deferred financing costs | | 2,209 | | 6,360 | | 1,411 | |
Loss on extinguishment of debt | | 7,657 | | 4,455 | | - | |
Other, net | | 1,788 | | (332) | | 12 | |
Changes in operating assets and liabilities: | | | | | | | |
Accounts receivable, net | | 5,937 | | (1,797) | | 6,037 | |
Income tax receivable | | 2,224 | | (2,846) | | (2,498) | |
Other assets | | (1,111) | | (803) | | 421 | |
Accounts payable | | (10,069) | | 4,496 | | 2,175 | |
Accrued expenses and other liabilities | | (25,467) | | (16,616) | | (7,257) | |
Net cash provided by continuing operations | | 168,530 | | 119,732 | | 124,302 | |
Net cash provided by (used in) discontinued operations | | (4,174) | | 3,483 | | 5,202 | |
Net cash provided by operating activities | | 164,356 | | 123,215 | | 129,504 | |
| | | | | | | |
Cash flows from investing activities: | | | | | | | |
Business acquisition, net of cash acquired | | - | | (385,346) | | - | |
Purchases of property, plant and equipment, net | | (107,363) | | (76,998) | | (41,794) | |
Purchase of investments | | (403) | | (6,728) | | - | |
Proceeds from sale of assets | | 330 | | 924 | | 840 | |
Other | | - | | (314) | | 272 | |
Net cash used in continuing operations | | (107,436) | | (468,462) | | (40,682) | |
Net cash provided by (used in) discontinued operations | | 2,331 | | (97) | | (119) | |
Net cash used in investing activities | | (105,105) | | (468,559) | | (40,801) | |
| | | | | | | |
Cash flows from financing activities: | | | | | | | |
Proceeds on bond offering | | - | | 298,035 | | - | |
Proceeds from issuance of long-term debt | | 989,450 | | 544,850 | | - | |
Payment of capital lease obligation | | (516) | | (228) | | (149) | |
Payment on long-term debt | | (990,961) | | (510,038) | | - | |
Payment of financing costs | | (6,576) | | (18,616) | | (3,471) | |
Distributions to noncontrolling interest | | - | | (1,850) | | - | |
Repurchase and retirement of common stock | | (887) | | (559) | | (726) | |
Dividends on common stock | | (62,064) | | (54,100) | | (46,307) | |
Net cash provided by (used in) financing activities | | (71,554) | | 257,494 | | (50,653) | |
(Decrease)/increase in cash and cash equivalents | | (12,303) | | (87,850) | | 38,050 | |
Cash and cash equivalents at beginning of period | | 17,854 | | 105,704 | | 67,654 | |
Cash and cash equivalents at end of period | | $ | 5,551 | | $ | 17,854 | | $ | 105,704 | |
See accompanying notes.
F-6
Table of Contents
CONSOLIDATED COMMUNICATIONS HOLDINGS, INC. AND SUBSIDIARIES
NOTES TO CONSOLIDATED FINANCIAL STATEMENTS
YEARS ENDED DECEMBER 31, 2013, 20122016, 2015 AND 20112014
1.BUSINESS DESCRIPTION & SUMMARY OF SIGNIFICANT ACCOUNTING POLICIES
Business and Basis of Accounting
Consolidated Communications Holdings, Inc. (the “Company”,“Company,” “we” or “our”) is a holding company with operating subsidiaries (collectively “Consolidated”) that provide integrated communications services to residentialin consumer, commercial, and business customerscarrier channels in California, Illinois, Iowa, Kansas, Minnesota, Missouri, North Dakota, Pennsylvania, South Dakota, Texas Pennsylvania, California, Kansas and Missouri.Wisconsin.
We offeroperate as both an Incumbent Local Exchange Carrier (“ILEC”) and a Competitive Local Exchange Carrier (“CLEC”), dependent upon the territory served. We provide a wide range of telecommunications services to residential and business customers in the areas we serve. Our telecommunications servicesproducts that include local and long-distance service, high-speed broadband Internet access, video services, digital telephone serviceVoice over Internet Protocol (“VOIP”VoIP”), custom calling features, private line services, carrier grade access services, network capacity services over our regional fiber optic networks, cloud data services, data center and managed services, directory publishing Competitive Local Exchange Carrier (“CLEC”) services and equipment sales. As of December 31, 2013,2016, we had approximately 257 thousand access lines, 123457 thousand voice connections, 255473 thousand data and Internet connections and 111106 thousand video connections.
We historically operated our business as two separate reportable segments: Telephone Operations and Other Operations. Based on changes in our business structure, during the quarter ended June 30, 2013 we concluded that we operate our business as one reportable segment. See the Recent Business Developments section below for a more detailed discussion regarding the circumstances that resulted in the change to our segment reporting.
Use of Estimates
Preparation of the financial statements in conformity with accounting principles generally accepted in the United States and pursuant to the rules and regulations of the Securities and Exchange Commission (the “SEC”) requires management to make estimates and assumptions that affecteffect the reported amounts of assets and liabilities atas of the date of the financial statements and the reported amounts of revenues and expenses during the reporting period. Actual results may differ materially from those estimates. Our critical accounting estimates include (i) impairment evaluations associated with indefinite-lived intangible assets (Note 1), (ii) revenue recognition (Note 1), (iii) derivatives (Notes 1 and 7), (iv) the determination of deferred tax asset and liability balances (Notes 1 and 10) and (v)(iv) pension plan and other post-retirement costs and obligations (Notes 1 and 9). Events subsequent to the balance sheet date have been evaluated for inclusion in the accompanying consolidated financial statements through the date of issuance.
Principles of Consolidation
Our consolidated financial statements include the accounts of the Company and our wholly-owned subsidiaries and subsidiaries in which we have a controlling financial interest. All significant intercompany transactions have been eliminated.
Recent Business Developments
Segment ReportingAgreement and Plan of Merger with FairPoint
Historically,On December 3, 2016, we classifiedentered into a definitive agreement and plan of merger with FairPoint to acquire all the issued and outstanding shares of FairPoint in exchange for shares of our operations into two separate reportablecommon stock, as set forth in the Merger Agreement. FairPoint is an advanced communications provider to business, segments: Telephone Operationswholesale and Other Operations. Our Telephone Operations consistedresidential customers within its service territory which spans across 17 states. FairPoint owns and operates a robust fiber-based network with more than 21,000 route miles of a wide rangefiber, including 17,000 route miles of telecommunications servicesfiber in northern New England. In conjunction with the merger, we have secured committed debt financing, as described in Note 6, that will be used to residentialrepay the outstanding debt of FairPoint and business customers,pay fees and expenses associated with the merger. The merger is subject to standard closing conditions including localthe approval of our stockholders and long-distance service, high-speed broadband Internet access, video services, VOIP services, custom calling features, private line services, carrier access services, network capacity services over a regional fiber optic network, mobile services and directory publishing. Our Other Operations segment operated two complementary non-core businesses including telephone services to state and county correctional facilities (“Prison Services”) and equipment sales. As discussed below, our contract to provide telephone services to correctional facilities operated byFairPoint’s stockholders, the Illinois Department of Corrections was not renewed and the process of transitioning those services to another service provider was completed during the quarter ended March 31, 2013. The remaining prison services assets and operations were classified as discontinued operations during the quarter ended June 30, 2013 and subsequently sold during the quarter ended September 30, 2013. Prison Services comprised nearly allapproval of the Other Operations segment revenuelisting of additional shares of Consolidated common stock to be issued to FairPoint’s stockholders, required federal and results of operations. Consequently, withstate regulatory approvals and other customary closing conditions. We expect the cessation of our Prison Services business and based on the segment accounting guidance, we concluded that we operate as one segment asmerger to close by mid-2017. See Note 3 for a more detailed discussion of the quarter ended June 30, 2013. As required by the authoritative guidance for segment presentation, segment results of operations have been retrospectively adjusted to reflect this change for all periods presented.merger.
F-7Restatement of Credit Agreement
On October 5, 2016, the Company and certain of its subsidiaries entered into a Restatement Agreement to amend and restate our existing credit agreement through a Third Amended and Restated Credit Agreement (the “Restated Credit Agreement”). Under the terms of the Restated Credit Agreement, the Company issued initial term loans in the aggregate
amount of $900.0 million, with a maturity date of October 5, 2023 (subject to an earlier maturity date on March 31, 2022, under certain conditions), and used the proceeds in part to pay off the outstanding term loan in the amount of $885.0 million. The Company also obtained a revolving loan facility of $110.0 million, with a maturity date of October 5, 2021, to replace the existing $75.0 million revolving credit facility scheduled to mature in December 2018. In connection with entering into the Restated Credit Agreement, we incurred a loss on the extinguishment of debt of $6.6 million during the year ended December 31, 2016. See Note 6 for additional information regarding this transaction.
CONSOLIDATED COMMUNICATIONS HOLDINGS, INC. AND SUBSIDIARIES
NOTES TO CONSOLIDATED FINANCIAL STATEMENTS (continued)
YEARS ENDED DECEMBER 31, 2013, 2012 AND 2011
Prison Services Contract
We previously provided telephone service to inmates incarcerated at facilities operated by the Illinois Department of Corrections and to certain county jails. On June 27, 2012, the Illinois Department of Central Management Services announced its intent to replace us as the provider of those services with a competitor. Although we challenged our competitor’s bid and the State’s decision to accept that bid in a variety of different forums, during the quarter ended March 31, 2013, the process of transitioning these services to another service provider was completed. All related assets have been assessed for recoverability in light of this change and we determined that no impairment was necessary. During 2012, the prison services contract comprised 5% of consolidated operating revenues and approximately 2% of consolidated operating income, excluding financing and other transaction fees.
Discontinued Operations
On September 13, 2013, we completed the sale of the assets and contractual rights used to provide communications services to inmates in thirteen county jails located in Illinois for a total purchase price of $2.5 million. In accordance with the Financial Accounting Standards Board (“FASB”) Accounting Standards Codification (“ASC”) 205-20, “Discontinued Operations”, the financial results of the prison services business have been reported as a discontinued operation in our consolidated financial statements for all periods presented. For a more complete discussion of the transaction, refer to Note 3.
SureWest Merger
We completed the acquisition of SureWest Communications on July 2, 2012. SureWest Communications’ results of operations are included within our results following the acquisition date. For a more complete discussion of the transaction, refer to Note 2.
Cash and Cash Equivalents
We consider all highly liquid investments with an original maturity of three months or less to be cash equivalents. Our cash equivalents consist primarily of money market funds. The carrying amounts of our cash equivalents approximate their fair value.
Accounts Receivable and Allowance for Doubtful Accounts
Accounts receivable consistconsists primarily of amounts due to the Company from normal business activities. We maintain an allowance for doubtful accounts for estimated losses whichthat result from the inability of our customers to make required payments. SuchThe allowance for doubtful accounts is maintained based on the likelihood of recoverability of accounts receivable based on pastcustomer payment levels, historical experience and management’s best estimatesviews on trends in the overall receivable agings. In addition, for larger accounts, we perform analyses of current bad debt exposures.risks on a customer-specific basis. We perform ongoing credit evaluations of our customers’ financial condition and management believes that an adequate allowancesallowance for doubtful accounts havehas been provided. AccountsUncollectible accounts are determined to be past due if customer payments have not been received in accordance with the payment terms. Uncollectibleremoved from accounts receivable and are charged against the allowance for doubtful accounts and removed from the accounts receivable balances when internal collection efforts have been unsuccessful in collecting the amount due.unsuccessful. The following table summarizes the activity in ourallowance for doubtful accounts receivable allowance account for the years ended December 31, 2013, 20122016, 2015 and 2011:2014:
| | | | | | | | | | | |
| | Year Ended December 31, | | | Year Ended December 31, | |
(In thousands) | | 2013 | | 2012 | | 2011 | | | 2016 | | 2015 | | 2014 | |
Balance at beginning of year | | $ | 4,025 | | $ | 2,547 | | $ | 2,694 | | | $ | 3,235 | | $ | 2,752 | | $ | 1,598 | |
Provision charged to expense | | 515 | | 5,615 | | 4,104 | | | | 2,798 | | | 3,525 | | | 3,320 | |
Write-offs, less recoveries | | (2,942) | | (4,137) | | (4,251) | | | | (3,220) | | | (3,042) | | | (2,166) | |
Balance at end of year | | $ | 1,598 | | $ | 4,025 | | $ | 2,547 | | | $ | 2,813 | | $ | 3,235 | | $ | 2,752 | |
Investments
Our investments are primarily accounted for under either the equity or cost method. If we have the ability to exercise significant influence over the operations and financial policies of an affiliated company, the investment in the affiliated company is accounted for using the equity method. If we do not have control and also cannot exercise significant influence, the investment in the affiliated company is accounted for using the cost method.
We review our investment portfolio periodically to determine whether there are identified events or circumstances that would indicate there is a decline in the fair value that is considered to be other than temporary. If we believe the decline is other than temporary, we evaluate the financial performance of the business and compare the carrying
F-8
Table of Contents
CONSOLIDATED COMMUNICATIONS HOLDINGS, INC. AND SUBSIDIARIES
NOTES TO CONSOLIDATED FINANCIAL STATEMENTS (continued)
YEARS ENDED DECEMBER 31, 2013, 2012 AND 2011
value of the investment to quoted market prices (if available) or the fair value of similar investments. If an investment is deemed to have experienced an impairment that is considered other-than temporary, the carrying amount of the investment is reduced to its quoted or estimated fair value, as applicable, and an impairment loss is recognized in other income (expense).
Fair Value of Financial Instruments
We account for certain assets and liabilities at fair value. Fair value is an exit price, representing the amount that would be received to sell an asset or paid to transfer a liability in an orderly transaction between market participants. As such, fair value is a market-based measurement that should be determined based on assumptions that market participants would use in pricing an asset or a liability. A financial asset or liability’s classification within a three-tiered value hierarchy is determined based on the lowest level input that is significant to the fair value measurement. The hierarchy prioritizes the inputs to valuation techniques into three broad levels in order to maximize the use of observable inputs and minimize the use of unobservable inputs. The levels of the fair value hierarchy are as follows:
Level 1 – Observable inputs that reflect quoted prices (unadjusted) for identical assets or liabilities in active markets.
Level 2 – Inputs that reflect quoted prices in active markets for similar assets or liabilities, quoted prices for identical or similar assets or liabilities in inactive markets and inputs other than quoted prices that are directly or indirectly observable in the marketplace.
Level 3 – Unobservable inputs which are supported by little or no market activity.
Property, Plant and Equipment
Property, plant and equipment are recorded at cost. We capitalize additions and substantial improvements and expense repairs and maintenance costs as incurred.
We capitalize the cost of internal-use network and non-network software which has a useful life in excess of one year. Subsequent additions, modifications or upgrades to internal-use network and non-network software are capitalized only to the extent that they allow the software to perform a task it previously did not perform. Software maintenance and training costs are expensed in the period in which they are incurred. Also, we capitalize interest associated with the development of internal-use network and non-network software.
Property, plant and equipment consisted of the following as of December 31, 20132016 and 2012:2015:
| | | | | | | | | | | | |
| | | December 31, | | December 31, | | Estimated | |
(In thousands) | | December 31,
2013 | | December 31,
2012 | | Estimated
Useful Lives | | | 2016 | | 2015 | | Useful Lives | |
Land and buildings | | $ | 98,663 | | $ | 94,929 | | 18-40 years | | | $ | 105,923 | | $ | 105,728 | | 18 | - | 40 | years | |
Network and outside plant facilities | | 1,543,190 | | 1,462,875 | | 3-50 years | | |
Central office switching and transmission | | | | 861,608 | | | 791,719 | | 3 | - | 25 | years | |
Outside plant cable, wire and fiber facilities | | | | 1,201,042 | | | 1,174,777 | | 3 | - | 50 | years | |
Furniture, fixtures and equipment | | 99,578 | | 95,671 | | 3-15 years | | | | 167,125 | | | 154,049 | | 3 | - | 15 | years | |
Assets under capital lease | | 11,169 | | 10,375 | | 3-11 years | | | | 28,355 | | | 15,699 | | 3 | - | 11 | years | |
Total plant in service | | 1,752,600 | | 1,663,850 | | | | | | 2,364,053 | | | 2,241,972 | | | | | | |
Less: accumulated depreciation and amortization | | (899,926) | | (779,461) | | | | | | (1,345,551) | | | (1,185,054) | | | | | | |
Plant in service | | 852,674 | | 884,389 | | | | | | 1,018,502 | | | 1,056,918 | | | | | | |
Construction in progress | | 23,586 | | 12,899 | | | | | | 21,956 | | | 21,283 | | | | | | |
Construction inventory | | 9,102 | | 10,384 | | | | | | 14,728 | | | 15,060 | | | | | | |
Totals | | $ | 885,362 | | $ | 907,672 | | | | | $ | 1,055,186 | | $ | 1,093,261 | | | | | | |
Construction inventory, which is stated at weighted average cost, consists primarily of network construction materials and supplies that when issued are predominately capitalized as part of new customer installations and the construction of the network.
We record depreciation using the straight line method over estimated useful lives using either the group or unit method. The useful lives are estimated at the time the assets are acquired and are based on historical experience with similar assets, anticipated technological changes and the expected impact of our strategic operating plan on our network infrastructure. In addition, the ranges of estimated useful lives presented above are impacted by the accounting for business combinations as the lives assigned to these acquired assets are generally much shorter than that of a newly acquired asset. The group method is used for depreciable assets dedicated to providing regulated telecommunication services, including the majority of the network, and outside plant facilities.facilities and certain support assets. A depreciation rate for each asset group is developed based on the average useful life of the group. The group method requires periodic revision of depreciation rates.
F-9
Table of Contents
CONSOLIDATED COMMUNICATIONS HOLDINGS, INC. AND SUBSIDIARIES
NOTES TO CONSOLIDATED FINANCIAL STATEMENTS (continued)
YEARS ENDED DECEMBER 31, 2013, 2012 AND 2011
When an individual asset is sold or retired, the difference between the proceeds, if any, and the cost of the asset is charged or credited to accumulated depreciation, without recognition of a gain or loss.
The unit method is primarily used for buildings, furniture, fixtures and other support assets. Each asset is depreciated on the straight-line basis over its estimated useful life. When an individual asset is sold or retired, the cost basis of the asset and related accumulated depreciation are removed from the accounts and any associated gain or loss is recognized.
Depreciation and amortization expense related to property, plant and equipment was $129.9$161.1 million, $98.3$167.1 million and $66.3$139.0 million in 2013, 20122016, 2015 and 2011,2014, respectively. Amortization of assets under capital leases is included in the depreciation and amortization expense.expense in the consolidated statements of operations.
We evaluate the recoverability of our property, plant and equipment whenever events or substantive changes in circumstances indicate that the carrying amount of an asset group may not be recoverable. Recoverability is measured by a comparison of the carrying amount of an asset group to estimated undiscounted future cash flows expected to be generated by the asset group. If the total of the expected future undiscounted cash flows were less than the carrying amount of the asset group, we would recognize an impairment charge for the difference between the estimated fair value and the carrying value of the asset group.
Intangible Assets
Indefinite-Lived Intangibles
Goodwill and tradenames are evaluated for impairment annually or more frequently when events or changes in circumstances indicate that the asset might be impaired. We evaluate the carrying value of our indefinite-lived assets,goodwill and tradenames and goodwill, as of November 30 of each year. As noted above, during the quarter ended June 30, 2013, we became a single reporting segment. As such we now evaluate our intangibles based on the single reporting segment.
TradenamesGoodwill
Our most valuable tradename is the federally registered mark CONSOLIDATED, a design of interlocking circles, which is used in association with our telephone communication services. The Company’s corporate branding strategy leverages a CONSOLIDATED naming structure. With the acquisition of SureWest on July 2, 2012, we also own the tradenames associated with SureWest. All of the Company’s business units and several of our products and services incorporate the CONSOLIDATED name, except for the SureWest business units. We do not amortize our tradenames, as we have determined that they have an indefinite life. If facts and circumstances change relating to a tradenames continued use in the branding of our products and services, it may be treated as a finite-lived asset and begin to be amortized over its estimated remaining life. We estimate the fair value of our tradenames using discounted cash flows (“DCF”) based on a relief from royalty method. If the fair value of our tradenames was less than the carrying amount, we would recognize an impairment charge for the difference between the estimated fair value and the carrying value of the assets. We perform our impairment testing of our tradenames as single units of accounting based on their use in our single reporting unit. During the year ending December 31, 2013, a formal one-year plan to transition from the SureWest tradename to the CONSOLIDATED tradename was adopted. We began to amortize the $0.9 million assigned to the SureWest tradename over its estimated one-year useful life. During 2013, we recognized $0.5 million in amortization expense associated with the SureWest tradename. At December 31, 2013, the unamortized amount related to the SureWest tradename was $0.4 million.
The carrying value of the reporting unit tradename, excluding any amounts assigned to the SureWest tradename, was $10.6 million at December 31, 2013 and 2012. For the years ended December 31, 2013 and 2012, we completed our annual impairment test using a DCF methodology based on a relief from royalty method and determined that there was no impairment of our tradename. During our annual assessment of carrying value of our tradenames in 2012, we determined that the carrying value of the tradename associated with the Business Systems reporting unit, which was previously included in our Other Operations segment, exceeded the estimated fair value and was impaired. During the quarter ended December 31, 2012, we recorded an impairment charge of $0.3 million to write off the carrying value of the tradename associated with the Business Systems reporting unit.
Goodwill
Goodwill is the excess of the acquisition cost of a business over the fair value of the identifiable net assets acquired. As noted above, goodwillGoodwill is not amortized but instead evaluated annually for impairment usingimpairment. The evaluation of goodwill may first include a preliminary qualitative assessment and two-step process, if deemed necessary. In 2012, we adopted an Accounting Standards Update No. 2011-08 – Intangibles-Goodwill and Other (Topic 350) Testing Goodwill for Impairment, that allows an
F-10
Table of Contents
CONSOLIDATED COMMUNICATIONS HOLDINGS, INC. AND SUBSIDIARIES
NOTES TO CONSOLIDATED FINANCIAL STATEMENTS (continued)
YEARS ENDED DECEMBER 31, 2013, 2012 AND 2011
entity to consider qualitative indicators to determine if the current two-step test is necessary. Under the provisions of the amended guidance, the step-one test of a reporting unit’s fair value is not required unless, as a result of the qualitative assessment,whether it is more likely than not (a likelihood of more than 50%) that the fair value of the reporting unit is less than its carrying amount. Events and circumstances integrated into the qualitative assessment process include a combination of macroeconomic conditions affecting equity and credit markets, significant changes to the cost structure, overall financial performance and other relevant events affecting the reporting unit. A company is permitted
For the 2016 assessment, we evaluated the fair value of goodwill compared to skipthe carrying value using the qualitative assessment at its election, and proceed to Step 1approach. The results of the quantitative test, which we chose to do in 2013. Inqualitative approach concluded that it is more likely than not that the first stepfair value of goodwill was greater than the carrying value as of the impairment test,assessment date. When we use the quantitative approach to assess the goodwill carrying value and the fair value of our single reporting unit, the fair value of our reporting unit is compared to its carrying amount, including goodwill.
The estimated fair value of the reporting unit is determined using a combination of market-based approaches and a DCFdiscounted cash flow (“DCF”) model. The assumptions used in the estimate of fair value are based upon a combination of historical results and trends, new industry developments and future cash flow projections, as well as relevant comparable company earnings multiples for the market-based approaches. Such assumptions are subject to change as a result of changing economic and competitive conditions. We use a weighting of the results derived from the valuation approaches to estimate the fair value of the reporting unit. TheFor the November 30, 2015 assessment, using the quantitative approach, we concluded that the fair value of the reporting unit exceeded the carrying value at December 31, 2013.2015 and that there was no impairment of goodwill.
If the carrying value of the reporting unit exceeds its fair value, the second step of the impairment test is performed to measure the amount of impairment loss. In measuring the fair value of our reporting unit as previously described, we consider the combined carrying and fair valuesvalue of our reporting unit in relation to our overall enterprise value, measured as the publicly traded stock price multiplied by the fully diluted shares outstanding plus the value of outstanding debt. Our reporting unit fair value models are consistent with a range in value indicated by both the preceding three month average stock price and the stock price on the valuation date, plus an estimated acquisition premium which is based on observable transactions of comparable companies, if applicable.
If the carrying value of the reporting unit exceeds its fair value, the second step of the impairment test is performed to measure the amount of impairment loss. The second step compares the implied fair value of the reporting unit goodwill with the carrying amount of that goodwill. The implied fair value is determined by allocating the fair value of the reporting unit to all of the assets and liabilities other than goodwill in a manner similar to a purchase price allocation. The excess of the fair value of a reporting unit over the amounts assigned to its assets and liabilities is the implied fair value of goodwill. If the carrying amount of goodwill is greater than the implied fair value of that goodwill, then an impairment charge would be recorded equal to the difference between the implied fair value and the carrying value. We did not recognize any goodwill impairment in 2016, 2015 or 2014 as a result of the impairment test.
At December 31, 20132016 and 2012,2015, the carrying value of goodwill was $603.4 million.$756.9 million and $764.6 million, respectively. The following table summarizes the change in goodwill during the year ended December 31, 2016:
| | | |
(In thousands) | | |
Balance at December 31, 2015 | | $ | 764,630 |
Acquisition | | | 4,700 |
Divestiture of businesses | | | (12,453) |
Balance at December 31, 2016 | | $ | 756,877 |
Trade Names
Our most valuable trade name is the federally registered mark CONSOLIDATED, a design of interlocking circles, which is used in association with our telephone communication services. The Company’s corporate branding strategy leverages a CONSOLIDATED naming structure. All of the Company’s business units and several of our products and services incorporate the CONSOLIDATED name. Trade names with indefinite useful lives are not amortized but are tested for impairment at least annually. If facts and circumstances change relating to a trade name’s continued use in the branding of our products and services, it may be treated as a finite-lived asset and begin to be amortized over its estimated remaining life. The carrying value of our trade names, excluding any finite lived trade names, was $10.6 million at December 31, 2016 and 2015.
For the 2012 evaluation,2016 assessment, we used a DCF modelthe qualitative approach to evaluate the fair value compared to the carrying value of the trade names. Based on the various qualitative indicators reviewed, we concluded that the fair value of the trade names continued to exceed the carrying value. When we use the quantitative approach to estimate the fair value of the Business Systems reporting unit, which was previously included in the Other Operations reporting segment. For the Business Systems reporting unit, the carrying value exceeded the fair value indicating a potential impairment existed. In the 2012 evaluation,our trade names, we determined thatuse DCFs based on the allocation ofa relief from royalty method. If the fair value of our trade names was less than the reporting unit to assets and liabilities in the second step of the impairment testing that the goodwill recorded for the Business Systems reporting unit was impaired and recordedcarrying amount, we would recognize an impairment charge for the difference between the estimated fair value and the carrying value of $0.8 million during the year ended December 31, 2012.assets. We perform our impairment testing of our trade names as single units of accounting based on their use in our single reporting unit.
Finite-Lived Intangible Assets
Customer Lists
Finite livedFinite-lived intangible assets subject to amortization consist primarily of our customer lists of an established base of customers that subscribe to our services. Customer listsservices, trade names of acquired companies and other intangible assets. Finite-lived intangible assets are amortized on a straight-line basis over their estimated useful lives (ranging from 3 to 13 years) based upon our historical experience with customer attrition. In accordance with the applicable guidance relating to the impairment or disposal of long-lived assets, welives. We evaluate the potential impairment of finite-lived intangible assets when impairment indicators exist. If the carrying value is no longer recoverable based upon the undiscounted future cash flows of the asset, an impairment equal to the difference between the carrying amount and the fair value of the asset is recognized. We did not recognize any intangible impairment charges in the years ended December 31, 2016, 2015 or 2014.
The net carrying amountcomponents of our customer lists as of December 31, 2013 and 2012 werefinite-lived intangible assets are as follows:
(In thousands) | | 2013 | | 2012 | |
Gross carrying amount | | $ | 195,651 | | $ | 195,651 | |
Less: accumulated amortization | | (166,500) | | (157,579) | |
Net carrying amount | | $ | 29,151 | | $ | 38,072 | |
| | | | | | | | | | | | | | | | | | |
| | | | | | | December 31, 2016 | | December 31, 2015 | |
| | | | | | | Gross Carrying | | Accumulated | | Gross Carrying | | Accumulated | |
(In thousands) | | Useful Lives | | Amount | | Amortization | | Amount | | Amortization | |
| | | | | | | | | | | | | | | | | | |
Customer relationships | | 3 | - | 13 | years | | $ | 216,261 | | $ | (198,353) | | $ | 215,261 | | $ | (187,146) | |
Trade names | | 1 | - | 2 | years | | | 2,290 | | | (2,290) | | | 2,290 | | | (1,723) | |
Other intangible assets | | | | 5 | years | | | 5,600 | | | (2,453) | | | 5,600 | | | (1,342) | |
Total | | | | | | | $ | 224,151 | | $ | (203,096) | | $ | 223,151 | | $ | (190,211) | |
F-11
CONSOLIDATED COMMUNICATIONS HOLDINGS, INC. AND SUBSIDIARIES
NOTES TO CONSOLIDATED FINANCIAL STATEMENTS (continued)
YEARS ENDED DECEMBER 31, 2013, 2012 AND 2011
Amortization expense related to the finite-lived intangible assets for the years ended December 31, 2013, 20122016, 2015 and 20112014 was $8.9$12.9 million, $22.1$12.8 million and $21.8$10.4 million, respectively. The weighted-average remaining period over which customer lists are being amortized is 2.13 years. Expected future amortization expense for the years 2014 through 2017of finite-lived intangible assets is as follows:
| | | | | |
(In thousands) | | | | | | | |
2014 | | $ | 8,921 | | |
2015 | | 8,849 | | |
2016 | | 8,776 | | |
2017 | | 2,605 | | | $ | 6,197 | |
2018 | | | | 3,591 | |
2019 | | | | 3,326 | |
2020 | | | | 2,002 | |
2021 | | | | 2,002 | |
Thereafter | | | | 3,937 | |
Total | | $ | 29,151 | | | $ | 21,055 | |
Derivative Financial Instruments
We use derivative financial instruments to manage our exposure to the risks associated with fluctuations in interest rates. Our interest rate swap agreements effectively convert a portion of our floating-rate debt to a fixed-rate basis, thereby reducing the impact of interest rate changes on future cash interest payments. At the inception of a hedge transaction, we formally document the relationship between the hedging instruments including our objective and strategy for establishing the hedge. In addition, the effectiveness of the derivative instrument is assessed at inception and on an ongoing basis throughout the hedging period. Counterparties to derivative instruments expose us to credit-related losses in the event of nonperformance. We execute agreements only with financial institutions we believe to be creditworthy and regularly assess the credit worthiness of each of the counterparties. We do not use derivative instruments for trading or speculative purposes.
Derivative financial instruments are recorded at fair value in our consolidated balance sheet. Fair value is determined based on publicly available interest rate yield curves and an estimate of our nonperformance risk or our counterparty’s nonperformance credit risk, as applicable. We do not anticipate any nonperformance by any counterparty.
For derivative instruments designated as a cash flow hedge, the effective portion of the change in the fair value is recognized as a component of accumulated other comprehensive income (loss) (“AOCI”) and is recognized as an adjustment to earnings over the period in which the hedged item impacts earnings. When an interest rate swap agreement terminates, any resulting gain or loss is recognized over the shorter of the remaining original term of the hedging instrument or the remaining life of the underlying debt obligation. The ineffective portion of the change in fair value of any hedging derivative is recognized immediately in earnings. If a derivative instrument is de-designated, the remaining gain or loss in AOCI on the date of de-designation is amortized to earnings over the remaining term of the hedging instrument. For derivative financial instruments that are not designated as a hedge, changes in fair value are recognized on a current basis in earnings. Cash flows from hedging activities are classified under the same category as the cash flows from the hedged items in our consolidated statement of cash flows. See Note 7 for further discussion of our derivative financial instruments.
Share-based Compensation
OurWe recognize share-based compensation consists of the issuance ofexpense for all restricted stock awards (“RSAs”) and performance share awards (“PSAs”) (collectively, “stock awards”). Associated costs are based on a stock award’sthe estimated fair value atof the stock awards on the date of the grant and are recognized over a period in which any related services are provided.grant. We recognize the cost ofexpense associated with RSAs and PSAs on a straight-line basis over the requisite service period, which generally ranges from immediate vestvesting to a four-year vesting period. See Note 8 for further detailsadditional information regarding share-based compensation.
Pension Plan and Other Post-Retirement Benefits
We maintain noncontributory defined benefit pension plans and provide certain post-retirement health care and life insurance benefits other than pensions to certain eligible employees. We also maintain two unfunded supplemental retirement plans to provide incremental pension payments to certain former employees.
We recognize pension and post-retirement benefits expense during the current period in the consolidated income statement of operations using certain assumptions, including the expected long-term rate of return on plan assets, interest cost implied by the discount rate, expected health care cost trend rate and the amortization of unrecognized gains and losses. Refer to Note 9 for further details regarding the determination of these assumptions.
We recognize the overfunded or underfunded status of our defined benefit pension and post-retirement plans as either an asset or liability in the consolidated balance sheet. We recognize changes in the funded status in the year
F-12
Table of Contents
CONSOLIDATED COMMUNICATIONS HOLDINGS, INC. AND SUBSIDIARIES
NOTES TO CONSOLIDATED FINANCIAL STATEMENTS (continued)
YEARS ENDED DECEMBER 31, 2013, 2012 AND 2011
in which the changes occur throughin accumulated comprehensive income (loss), net of applicable income taxes, including unrecognized actuarial gains and losses and prior service costs and credits.
Income Taxes
Our estimates of income taxes and the significant items resulting in the recognition of deferred tax assets and liabilities are disclosed in Note 10 and reflect our assessment of future tax consequences of transactions that have been reflected in our financial statements or tax returns for each taxing jurisdiction in which we operate. We base our provision for income taxes on our current period income, changes in our deferred income tax assets and liabilities, income tax rates, changes in estimates of our uncertain tax positions and tax planning opportunities available in the jurisdictions in which we operate. We recognize deferred tax assets and liabilities when there are temporary differences between the financial reporting basis and tax basis of our assets and liabilities and for the expected benefits of using net operating loss and tax credit loss carryforwards. We establish valuation allowances when necessary to reduce the carrying amount of deferred income tax assets to the amounts that we believe are more likely than not to be realized. We evaluate the need to retain all or a portion of the valuation allowance on our deferred tax assets. When a change in the tax rate or tax law has an impact on deferred taxes, we apply the change based on the years in which the temporary differences are expected to reverse. As we operate in more than one state, changes in our state apportionment factors, based on operational results, may affect our future effective tax rates and the value of our deferred tax assets and liabilities. We record a change in tax rates in our consolidated financial statements in the period of enactment.
Income tax consequences that arise in connection with a business combination include identifying the tax basis of assets and liabilities acquired and any contingencies associated with uncertain tax positions assumed or resulting from the business combination. Deferred tax assets and liabilities related to temporary differences of an acquired entity are recorded as of the date of the business combination and are based on our estimate of the appropriate tax basis that will be accepted by the various taxing authorities.
We record unrecognized tax benefits as liabilities in accordance with ASCAccounting Standard Codification (“ASC”) 740,Income Taxes, and adjust these liabilities in the appropriate period when our judgment changes as a result of the evaluation of new information. In certain instances, the ultimate resolution may result in a payment that is materially different from our current estimate of the unrecognized tax benefit liabilities. These differences will be reflected as increases or decreases to income tax expense in the period in which new information is available. We classify interest and penalties, if any, associated with our uncertain tax positions as a component of interest expense and general and administrative expense, respectively. See Note 10 for additional informationfurther discussion on income taxes.
Revenue Recognition
We recognize revenue when (i) persuasive evidence of an arrangement exists, between us and the customer, (ii) delivery of the product to the customer has occurred or service hasservices have been provided to the customer, (iii)rendered, the price to the customer is fixed or determinable and (iv) collectability of the sales price is reasonably assured. Revenues
Services
Revenue based on a flat fee, dedicated network access, data communications, digital TV, Internet access service and broadband service, or revenue derived principally from local telephone, dedicated network access, data communications, Internet access service and residential/business broadband service areis billed in advance and is recognized in subsequent periods when the services arehave been provided, with the exception of certain governmental accounts which are billed in arrears. Revenues
Certain of our bundled service packages may include multiple deliverables. We offer a base service bundle which consists of voice services, including a phone line, calling features and long-distance. Customers may choose to add additional services, including high-speed Internet and digital/IP television services, to the base service bundle. Separate units of accounting within the bundled service package include voice services, high-speed Internet and digital/IP television services. Revenue for usage-basedall services included in our bundled service package is recognized over the same period in which service is provided to the customer. Bundled service package discounts are recognized concurrently with the associated
revenue and are allocated to the various services in the bundled service package based on the relative selling price of the services included in each bundle.
Usage-based services, such as per-minute long-distance service and access charges billed to other telephone carriers for originating and terminating long-distance calls onin our network, are billed in arrears. We recognize revenue from these services in the period in which service is provided to the services are rendered rather than billed. Earned but unbilled usage-based services are recorded in accounts receivable.customer.
When required as part of providing service, revenuesRevenue related to nonrefundable, upfront service activation and setup fees areis deferred and recognized over the estimated customer life.
Incremental direct costs of telecommunications service activation are charged to expenseexpensed in the period in which they are incurred, except when we maintain ownership of wiring installed during the activation process. In such cases, the cost is capitalized and depreciated over the estimated useful life of the asset.
Telephone equipment revenuesPrint advertising and publishing revenue is recognized ratably over the life of the related directory, which is generally 12 months.
Equipment
Revenue is generated from the sale of voice and data communications equipment; design, configuration and installation services related to voice and data equipment; the provision of Cisco maintenance support contracts; and the sale of professional support services for customer voice and data systems. Equipment revenue generated from retail channels are recorded atis recognized when the point of sale. Telecommunicationsequipment is sold. Equipment revenue generated from telecommunications systems and structured cabling project revenues areprojects is recognized when the project is completed. Maintenance services are provided on both a contract and time and material basis and are recorded whenrecognized in the period in which the service is provided. Print advertising
Equipment revenue generated from support services includes “24x7” support of a customer’s voice and publishing revenuesdata networks. The majority of these contracts are billed on a time and materials basis and revenue is recognized ratablyeither in the period in which the services are provided or over the lifeterm of the related directory, generally 12 months.contract. Support services also include professional support services, which are typically sold on a time and materials basis, but may be sold as a prepaid block of time, and the revenue is recognized in the period in which the services are provided.
F-13
Table of ContentsMultiple Deliverable Arrangements
CONSOLIDATED COMMUNICATIONS HOLDINGS, INC. AND SUBSIDIARIES
NOTES TO CONSOLIDATED FINANCIAL STATEMENTS (continued)
YEARS ENDED DECEMBER 31, 2013, 2012 AND 2011We often enter into arrangements which include multiple deliverables primarily relating to the sale of communications equipment, associated support contracts and professional services, which include design, configuration and installation consulting. When an equipment sale involves multiple deliverables, revenue is allocated to each respective deliverable if they are separately identifiable. Each separately identified deliverable is considered a separate unit of account. The arrangement consideration is allocated to the identified units of account based on their relative selling price on a stand-alone basis. Cisco equipment, maintenance contracts and professional services each qualify as separate units of accounting. We utilize best estimate of selling price for stand-alone value for our equipment and maintenance contracts, taking into consideration market conditions and entity-specific factors. We evaluate best estimate of selling price by reviewing historical data related to sales of our deliverables.
Subsidies including universaland Surcharges
Subsidies consist of both federal and state subsidies, which are designed to promote widely available, quality telephone service revenues, are government-sponsored support mechanisms to assistat affordable prices in funding services in mostly rural high-cost areas. These revenues typically are based on information we provide and are calculated by the administering government agency.agency based on information we provide. Subsidies are recognized in the period in which the service is provided. There is a reasonable possibility that out of periodout-of-period subsidy adjustments may be recorded in the future, but they are anticipatedexpected to be immaterial to our results of operation,operations, financial position and cash flow.
We collect and remit Federal Universal Service contributions on a gross basis, which resulted in recorded revenue of approximately $12.0$12.7 million forand $13.2 million during the yearyears ended December 31, 2013.2016 and 2015, respectively. We account for all other taxes collected from customers and remitted to the respective government agencies on a net basis.
Advertising Costs
Advertising costs are expensed as incurred. Advertising expense was $7.6$8.7 million, $5.1$8.3 million and $2.4$8.2 million in 2013, 20122016, 2015 and 2011,2014, respectively.
Statement of Cash Flows Information
During 2013, 20122016, 2015 and 2011,2014, we made payments for interest and income taxes as follows:
(In thousands) | | 2013 | | 2012 | | 2011 | |
Interest, net of amounts capitalized ($1,215, $515 and $144 in 2013, 2012 and 2011, respectively) | | $ | 80,693 | | $ | 63,541 | | $ | 47,071 | |
Income taxes paid, net | | $ | 960 | | $ | 4,991 | | $ | 8,788 | |
| | | | | | | | | | |
(In thousands) | | 2016 | | 2015 | | 2014 | |
Interest, net of amounts capitalized ($1,152, $1,373 and $1,437 in 2016, 2015 and 2014, respectively) | | $ | 69,536 | | $ | 76,823 | | $ | 73,400 | |
Income taxes (received) paid, net | | $ | (183) | | $ | 1,835 | | $ | 5,311 | |
Noncash investing and financing activities:
As described in Note 3, we issued $148.4 million in shares of the Company’s common stock in connection with the acquisition of SureWest in 2012.
In 20132016 and 2012,2015, we acquired equipment of $0.8$12.2 million and $0.4$4.1 million, respectively, through capital lease agreements.
In 2014, we issued 10.1 million shares of the Company’s common stock with a market value of $257.7 million in connection with the acquisition of Enventis as described in Note 3.
Noncontrolling Interest
We have a majority-owned subsidiary, East Texas Fiber Line Incorporated (“ETFL”) which is a joint venture owned 63% by the Company and 37% by Eastex Telecom Investments, LLC. ETFL provides connectivity over a fiber optic transport network to certain customers residing in Texas.
Recent Accounting Pronouncements
In July 2013,January 2017, the Financial Accounting Standards Board (“FASB”) issued the Accounting Standards Update No. 2017-01 (“ASU 2017-01”), Clarifying the Definition of a Business. ASU 2017-01 clarifies the definition of a business and establishes a screening process to determine whether an integrated set of assets and activities acquired is deemed the acquisition of a business or the acquisition of assets. ASU 2017-01 is effective for annual and interim periods beginning after December 15, 2017 and should be applied prospectively, with early adoption permitted. We do not expect that adoption of ASU 2017-01 will have a material impact on our consolidated financial statements and related disclosures.
In October 2016, the FASB issued the Accounting Standards Update No. 2013-112016-16 (“ASU 2013-11”2016-16”), PresentationIntra-Entity Transfers of an Unrecognized Tax Benefit When a Net Operating Loss Carryforward, a Similar Tax Loss, or a Tax Credit Carryforward ExistsAssets Other Than Inventory. ASU 2013-11 provides guidance concerning2016-16 eliminates the balance sheet presentationexisting exception prohibiting the recognition of the income tax consequences for intra-entity asset transfers until the asset has been sold to an unrecognizedoutside party. Under ASU 2016-16, entities will be required to recognize the income tax benefitconsequences of intra-entity asset transfers other than inventory when a net operating loss carryforward, a similar tax loss or a tax credit carryforward is present. The amended guidancethe transfer occurs. ASU 2016-16 is effective on a modified retrospective basis for fiscal yearsannual and interim periods beginning after December 15, 2013,2017, with early adoption permitted. We currently anticipate adoption of this update effective January 1, 2018 and do not expect a material impact on our consolidated financial statements and related disclosures.
In August 2016, the FASB issued the Accounting Standards Update No. 2016-15 (“ASU 2016-15”), Classification of Certain Cash Receipts and Cash Payments. ASU 2016-15 provides guidance concerning the classification of certain cash receipts and cash payments in the statement of cash flows. The new guidance is effective for annual and interim periods beginning after December 15, 2017 and should be applied retrospectively, with early adoption permitted. We are currently evaluating the impact this update will have on our consolidated financial statements.statements and related disclosures.
Effective January 1, 2013, we adoptedIn June 2016, the FASB issued the Accounting Standards Update No. 2012-022016-13 (“ASU 2012-02”2016-13”), Testing Indefinite-Lived Intangible Assets for ImpairmentMeasurement of Credit Losses on Financial Instruments. ASU 2012-02 permits an entity2016-13 establishes the new “current expected credit loss” model for measuring and recognizing credit losses on financial assets based on relevant information about past events, including historical experience, current conditions and reasonable and supportable forecasts. The new guidance is effective for annual and interim periods beginning after December 15, 2019, with early adoption permitted for annual and interim periods beginning after December 15, 2018. We are currently evaluating the impact this update will have on our consolidated financial statements and related disclosures.
In March 2016, the FASB issued the Accounting Standards Update No. 2016-09 (“ASU 2016-09”), Improvements to perform an initial assessmentEmployee Share-Based Payment Accounting. ASU 2016-09 simplifies various aspects of qualitative factors to determine whetheraccounting for share-based payment arrangements, including the income tax consequences, classification of awards as either equity or liabilities and classification on the statement of cash flows. ASU 2016-09 is effective on a modified retrospective basis for annual and interim periods beginning after December 15, 2016, with early adoption permitted. We adopted ASU 2016-09 as of January 1, 2017 and it is more likely than not that a non-goodwill indefinite-lived intangible asset is impaired and thus whether it is necessary to calculate the asset’s fair value for the purpose of comparing it with the asset’s carrying amount. The adoption of this standard did not have a material impact on our consolidated financial statements.statements and related disclosures immediately upon adoption. However, we are unable to estimate the prospective impact on our consolidated financial statements and related disclosures as it is dependent upon future stock exercises, which cannot be predicted.
In February 2016, the FASB issued the Accounting Standards Update No. 2016-02 (“ASU 2016-02”), Leases. ASU 2016-02 establishes a new lease accounting model for leases. Lessees will be required to recognize most leases on their balance sheets but lease expense will be recognized on the income statement in a manner similar to existing requirements. ASU 2016-02 is effective for annual and interim periods beginning after December 15, 2018, with early adoption permitted. We are currently evaluating the population of our leases and anticipate that most of our operating lease commitments will be recognized on our consolidated balance sheets. We have not yet made a decision on the timing and method of adoption and are continuing to assess all potential impacts of this update on our consolidated financial statements and related disclosures.
Effective January 1, 2013,2016, we adopted Accounting Standards Update No. 2013-022015-07 (“ASU 2013-02”2015-07”), Comprehensive Income (Topic 220): Reporting of Amounts Reclassified Out of Accumulated Other Comprehensive Income, which establishes newDisclosures for Investment in Certain Entities That Calculate Net Asset Value Per Share (or Its Equivalent). ASU 2015-07 removes the requirement to categorize within the fair value hierarchy those investments measured using the net asset value (“NAV”) per share practical expedient and amends certain disclosure requirements for disclosing reclassificationssuch investments. We adopted ASU 2015-07 retrospectively and restated our prior period investments in Note 9. As a result, we removed $111.0 million and $1.3 million of items out of accumulatedpension and other comprehensive incomepost-retirement benefits investments, respectively, from the fair value hierarchy on December 31, 2015.
Effective January 1, 2016, we adopted Accounting Standards Update No. 2015-16 (“OCI”ASU 2015-16”), Simplifying the Accounting for Measurement-Period Adjustments. ASU 2013-22015-16 requires that the acquiring company in a business combination recognize adjustments to provisional amounts identified during the measurement period in the reporting period in which the adjustments are determined and record in the reporting period in which the adjustments are determined the effect on earnings of changes in depreciation, amortization and other items resulting from the change to the provisional amounts. The adoption of this update did not have any impact on our consolidated financial statements and related disclosures.
Effective December 31, 2016, we adopted the Accounting Standards Update No. 2014-15 (“ASU 2014-15”), Disclosure of Uncertainties about an Entity’s Ability to Continue as a Going Concern. ASU 2014-15 requires management to evaluate for each annual and interim reporting period whether conditions or events give rise to substantial doubt that an entity has the ability to continue as a going concern within one year following issuance of the financial statements and requires specific disclosures regarding the conditions or events leading to substantial doubt. The adoption of this update did not have any impact on our financial position, results of operations or in disclosures in the current period.
In May 2014, FASB issued the Accounting Standards Update No. 2014-09 (“ASU 2014-09”), Revenue from Contracts with Customers (Topic 606), which will replace the current revenue recognition requirements in U.S. GAAP. The core principle of ASU 2014-09 is that a company should recognize revenue to depict the transfer of promised goods or services to customers in an amount that reflects the consideration to which the company expects to be entitled in exchange for those goods or services. In addition, ASU 2014-09 requires disclosures about the nature, amount, timing and uncertainty of revenue and cash flows arising from contracts with customers. Two transition methods are permitted under ASU 2014-09, the full retrospective method, in which case the standard would be applied to each prior reporting period presented and the cumulative effect of applying the standard would be recognized at the earliest period shown, or the modified retrospective method, in which case the cumulative effect of applying the standard would be recognized at the date of initial application. In August 2015, the FASB issued the Accounting Standards Update No. 2015-14 (“ASU 2015-14”), Deferral of the Effective Date, which deferred the effective date of ASU 2014-09 for the (i) changes in components of accumulated OCI, (ii) effects on individual line items in net incomeall entities by one year. Accordingly, ASU 2014-09 is effective for each item of accumulated OCI that is reclassified in its entirety to net income,annual and (iii) cross references to other disclosures that provide additional details for OCI items that are not reclassified in their entirety to net income. For public companies, amendments were effective prospectively for reportinginterim periods beginning after December 15, 2012, with early adoption permitted. In accordance2017, at which point we plan to adopt the standard.
F-14In 2016, we established a cross-functional implementation team consisting of representatives from across all of our functional areas. We are using a bottoms-up approach to assess the impact of ASU 2014-09 on our revenue contracts by
reviewing our current accounting policies and practices to identify potential differences that would result from applying the requirements of this update. While we are continuing to assess all potential impacts of this update, we currently believe that the most significant impact relates to the deferral of contract acquisition costs, which we currently expense as incurred but under ASU 2014-09 will generally be capitalized and amortized over the contract performance period. Currently, we anticipate adopting this update using the full retrospective method to restate each prior reporting period presented.
CONSOLIDATED COMMUNICATIONS HOLDINGS, INC. AND SUBSIDIARIES
NOTES TO CONSOLIDATED FINANCIAL STATEMENTS (continued)
YEARS ENDED DECEMBER 31, 2013, 2012 AND 2011
with the provisions of this guidance, disclosures related to accumulated OCI can be found in Note 8.
Reclassifications
Certain amounts in our 2012 and 2011 consolidated financial statements have been reclassified to conform to the presentation of our 2013 consolidated financial statements which consists of the effects of reclassifications from the presentation of prison services as a discontinued operation and the finalization of purchase accounting for the SureWest acquisition. These reclassifications had no effect on total shareholders’ equity, total revenue or net income.
2.EARNINGS PER SHARE
We compute net incomeBasic and diluted earnings (loss) per share (“EPS”) are computed using the two-class method. The two-class method, which is an earnings allocation formula that determines income per shareEPS for each class of common stock and participating securitysecurities according to dividends declared and participation rights in undistributed earnings. Basic net incomeThe Company’s restricted stock awards are considered participating securities because holders are entitled to receive non-forfeitable dividends during the vesting term. Diluted EPS includes securities that could potentially dilute basic EPS during a reporting period. Dilutive securities are not included in the computation of loss per share when a company reports a net loss from continuing operations as the impact would be anti-dilutive.
The potentially dilutive impact of the Company’s restricted stock awards is computeddetermined using the weighted-averagetreasury stock method. Under the treasury stock method, awards are treated as if they had been exercised with the proceeds of exercise used to repurchase common stock at the average market price for the period. Any incremental difference between the assumed number of common shares outstanding duringissued and repurchased is included in the period. Diluted net income attributable to our shareholders is computed using the weighted-average number of common shares and the effect of potentially dilutive securities outstanding during the period. Potentially dilutive shares consist of restricted shares.diluted share computation.
The computation of basic and diluted earnings per share attributable to common shareholders computed using the two-class method is as follows:
(In thousands, except per share amounts) | | 2013 | | 2012 | | 2011 | |
Income from continuing operations | | $ | 29,964 | | $ | 4,965 | | $ | 24,288 | |
Less: net income attributable to noncontrolling interest | | 330 | | 531 | | 572 | |
Income attributable to common shareholders before allocation of earnings to participating securities | | 29,634 | | 4,434 | | 23,716 | |
Less: earnings allocated to participating securities | | 466 | | 351 | | 429 | |
Income from continuing operations attributable to common shareholders | | 29,168 | | 4,083 | | 23,287 | |
Net income from discontinued operations | | 1,177 | | 1,206 | | 2,694 | |
Net income attributable to common shareholders | | $ | 30,345 | | $ | 5,289 | | $ | 25,981 | |
| | | | | | | |
Weighted-average number of common shares outstanding | | 39,764 | | 34,652 | | 29,600 | |
| | | | | | | |
Basic and diluted earnings per common share: | | | | | | | |
Income from continuing operations | | $ | 0.73 | | $ | 0.12 | | $ | 0.79 | |
Income from discontinued operations, net of tax | | 0.03 | | 0.03 | | 0.09 | |
Net income per common share attributable to common shareholders | | | | | | | | | | |
$ | 0.76 | | $ | 0.15 | | $ | 0.88 | |
| | | | | | | | | | | |
(In thousands, except per share amounts) | | | 2016 | | 2015 | | 2014 | |
Net income (loss) | | | $ | 15,196 | | $ | (671) | | $ | 15,388 | |
Less: net income attributable to noncontrolling interest | | | | 265 | | | 210 | | | 321 | |
Income (loss) attributable to common shareholders before allocation of earnings to participating securities | | | | 14,931 | | | (881) | | | 15,067 | |
Less: earnings allocated to participating securities | | | | 524 | | | — | | | 546 | |
Net income (loss) attributable to common shareholders, after earnings allocated to participating securities | | | $ | 14,407 | | $ | (881) | | $ | 14,521 | |
| | | | | | | | | | | |
Weighted-average number of common shares outstanding | | | | 50,301 | | | 50,176 | | | 41,998 | |
| | | | | | | | | | | |
Net income (loss) per common share attributable to common shareholders - basic and diluted | | | $ | 0.29 | | $ | (0.02) | | $ | 0.35 | |
Diluted earnings (loss) per common share attributable to common shareholders for each of the years ended December 31, 2016 and 2015 excludes 0.3 million shares at December 31, 2013, 2012 and 2011, respectively, of potential common shares related tothat could be issued under our share-based compensation plan because the inclusion of the potential common shares would have had an antidilutive effect. For the year ended December 31, 2014, diluted earnings (loss) per common share excludes 0.4 million potential common shares.
3.ACQUISITIONACQUISITIONS AND DISPOSITIONSDIVESTITURES
Acquisitions
FairPoint Communications, Inc.
On December 3, 2016, we entered into a definitive agreement and plan of merger with FairPoint to acquire all the issued and outstanding shares of FairPoint in exchange for shares of our common stock. FairPoint is an advanced communications provider to business, wholesale and residential customers within its service territory which spans across 17 states. FairPoint owns and operates a robust fiber-based network with more than 21,000 route miles of fiber, including 17,000 route miles of fiber in northern New England.
At the effective time of the merger, each share of common stock, par value of $0.01 per share, of FairPoint issued and outstanding immediately prior to the effective time of the merger will be converted into and become the right to receive
0.7300 shares of common stock, par value $0.01 per share, of Consolidated and cash in lieu of fractional shares, as set forth in the Merger With SureWest CommunicationsAgreement. Based on the closing price of our common stock as of the date of the Merger Agreement, the total value of the consideration to be exchanged is approximately $585.3 million, exclusive of debt of approximately $917.6 million. In connection with the merger, we secured committed debt financing through a $935.0 million incremental term loan facility, as described in Note 6, that in addition to cash on hand and other sources of liquidity will be used to repay the existing indebtedness of FairPoint and pay the fees and expenses in connection with the merger.
The merger is subject to standard closing conditions including the approval of our stockholders and FairPoint’s stockholders, the approval of the listing of additional shares of Consolidated common stock to be issued to FairPoint’s stockholders, required federal and state regulatory approvals and other customary closing conditions. We expect the merger to close by mid-2017.
Champaign Telephone Company, Inc.
On July 2, 2012,1, 2016, we acquired substantially all of the assets of Champaign Telephone Company, Inc. and its sister company, Big Broadband Services, LLC, a private business communications provider in the Champaign-Urbana, IL area. The aggregate purchase price, including customary working capital adjustments, consisted of cash consideration of $13.4 million, which was paid from our existing cash resources. The preliminary fair value of the acquired assets and liabilities assumed consisted primarily of property, plant and equipment of $6.9 million, intangible assets of $1.0 million, working capital of $0.8 million and goodwill of $4.7 million. Goodwill and other intangible assets are expected to be amortizable and deductible for income tax purposes. We are in the process of finalizing the preliminary purchase price and the valuation of the net assets acquired, most notably, the completion of various tax related matters for the acquisition. Upon completion of the final fair value assessment, the fair values of the net assets acquired may differ from the preliminary assessment. We expect to finalize the remaining tax items during the quarter ended March 31, 2017.
Enventis Corporation
On October 16, 2014, we completed theour merger with SureWest CommunicationsEnventis Corporation (“SureWest”Enventis”), which resulted in the acquisition of 100% of and acquired all the issued and outstanding shares of SureWestEnventis in exchange for $23.00 per share in a cash and stock transaction. SureWest provides telecommunications services in Northern California, primarily in the greater Sacramento region, and in the greater Kansas City, Kansas and Missouri areas. The total purchase price of $550.8 million consisted of cash and assumed debt of $402.4 million and 9,965,983 shares of the Company’sour common stock valued at the Company’s opening stock price on July 2, 2012 of $14.89, which totaled $148.4 million. We acquired SureWest to provide additional diversification of our revenues and cash flows.
Subsequent to the merger, the financialstock. The results of SureWest operations of Enventis have been includedreported in our consolidated financial statements as of income. SureWest contributed $133.1 million in net revenues and recorded net incomethe effective date of $2.5 million forthe acquisition. For the period of July 2, 2012October 16, 2014 through December 31, 2012,2014, Enventis contributed operating revenues of $37.6 million and a net loss of $1.4 million, which includes $9.5included $5.7 million in acquisition related costs.
F-15
Table of Contents
CONSOLIDATED COMMUNICATIONS HOLDINGS, INC. AND SUBSIDIARIES
NOTES TO CONSOLIDATED FINANCIAL STATEMENTS (continued)
YEARS ENDED DECEMBER 31, 2013, 2012 AND 2011
The acquisition of SureWest has been accounted for using the acquisition method in accordance with the FASB’s ASC Topic 805, Business Combinations. Accordingly, the net assets acquired were recorded at their estimated fair values at July 2, 2012. These values were derived from a purchase price allocation, which was finalized during the quarter ended June 30, 2013. During the quarter ended June 30, 2013, the Company recorded tax related adjustments to the preliminary purchase price allocation which decreased deferred income taxes by $1.3 million, increased current assets by $0.2 million and decreased goodwill by $1.5 million. These final adjustments were retrospectively applied on the balance sheet to reflect the appropriate balances as of July 2, 2012. There was no impact to the income statement for the twelve months ended December 31, 2012.
The following table summarizes the final purchase price allocation:
| | (In thousands) | |
Current assets | | $ | 47,073 | |
Property, plant and equipment | | 591,818 | |
Goodwill | | 84,016 | |
Other intangible assets | | 3,600 | |
Other long-term assets | | 4,861 | |
Total assets acquired | | 731,368 | |
Current liabilities | | 53,566 | |
Pension and other post-retirement obligations | | 55,916 | |
Deferred income taxes | | 66,976 | |
Other long-term liabilities | | 4,114 | |
Total liabilities assumed | | 180,572 | |
Net assets acquired | | $ | 550,796 | |
The acquired current assets included cash of $17.1 million and trade receivables with a fair value of approximately $21.6 million and a gross value of approximately $23.4 million. We believe that the estimated fair value of the trade receivables approximates the amount to be eventually collected. The acquired other intangible assets of approximately $3.6 million consisted of the estimated fair values assigned to customer lists of $2.7 million and tradenames of $0.9 million. The customer list intangible asset is being amortized over the estimated useful life of 3 or 5 years, depending on customer type. During the years ending December 31, 2013 and 2012, we recorded amortization expense of approximately $0.6 million and $0.3 million, respectively, relating to the customer lists. Goodwill of $84.0 million and the tradenames of $0.9 million are indefinite-lived assets which are not subject to amortization. During the year ending December 31, 2013, a formal one-year plan to transition from the SureWest tradename to the CONSOLIDATED tradename was adopted. We began to amortize the assigned value of the SureWest tradename over its estimated one-year useful life. We evaluate our goodwill for impairment annually as of November 30, as described in Note 1 above. Goodwill recognized from the acquisition primarily relates to the expected contributions of the entity to the overall corporate strategy in addition to synergies and acquired workforce, which are not separable from goodwill. Goodwill is not deductible for income tax purposes.
Unaudited Pro Forma Results
The following unaudited pro forma information presents our results of operations for the year ended December 31, 2014 as if the acquisition of SureWestEnventis occurred on January 1, 2011.2013. The adjustments to arrive at the pro forma information below includedincluded: additional depreciation and amortization expense for the fair value increases to property, plant and equipment software and customer relationships. Interestintangible assets acquired; increase in interest expense was increased to reflect the additional debt entered into to finance a portion of the acquisition; and the exclusion of certain acquisition price.related costs. Shares used to calculate the basic and diluted earnings per share were adjusted to reflect the additional shares of common stock issued to fund a portion of the acquisition price.
| | | | |
| | | | |
(Unaudited; in thousands, except per share amounts) | | 2014 | |
Operating revenues | | $ | 790,745 | |
Income from operations | | $ | 104,674 | |
Net income | | $ | 18,648 | |
Less: net income attributable to noncontrolling interest | | | 321 | |
Net income attributable to common stockholders | | $ | 18,327 | |
| | | | |
Net income per common share-basic and diluted | | $ | 0.37 | |
Transaction costs related to the acquisition of Enventis were $11.5 million during the year ended December 31, 2014, which are included in acquisition and other transaction costs in the consolidated statements of operations. These costs are considered to be non-recurring in nature and therefore have been excluded from the pro forma results of operations.
The pro forma information below does not purport to present the actual results that would have resulted if the acquisition had in fact occurred at the beginning of the fiscal periodsperiod presented, nor does the information project results for any future period. The pro forma information does not include the impact of any future cost savings or synergies that may be achieved as a result of the acquisition.
CONSOLIDATED COMMUNICATIONS HOLDINGS, INC. AND SUBSIDIARIESDivestitures
NOTES TO CONSOLIDATED FINANCIAL STATEMENTS (continued)
YEARS ENDED DECEMBER 31, 2013, 2012 AND 2011
| | Year Ended
December 31, | |
(Unaudited; in thousands, except share amounts) | | 2012 | |
Operating revenues | | $ | 605,779 | |
Income from operations | | $ | 69,881 | |
Income from continuing operations | | $ | 9,259 | |
Discontinued operations, net of tax | | $ | 1,206 | |
| | | |
Net income | | $ | 10,465 | |
Less: income attributable to noncontrolling interest | | 531 | |
Net income attributable to common stockholders | | $ | 9,934 | |
| | | |
Net income per common share - basic and diluted | | | |
Income from continuing operations | | $ | 0.27 | |
Discontinued operations, net of tax | | 0.03 | |
Net income per basic and diluted common share attributable to common shareholders | | $ | 0.30 | |
Discontinued Operations
In September 2013,On December 6, 2016, we completed the sale of substantially all of the assets and contractual rights of our prison services business for a total cash purchase price of $2.5 million, which included the settlement of any pending legal matters. The financial results of the operationsCompany’s Enterprise Services equipment and IT Services business (“EIS”) to ePlus Technology inc. (“ePlus”) for prisoncash proceeds of $9.2 million net of a customary working capital adjustment. As part of the transaction, we entered into a Co-Marketing Agreement with ePlus, a nationwide systems integrator of technology solutions, to cross-sell both broadband network services and IT services. The strategic partnership will provide our business customers access to a broader suite of IT solutions, and will also provide ePlus customers access to Consolidated’s business network services. During the year ended December 31, 2016, we recognized a gain of $0.6 million on the sale, net of selling costs, which were previously reportedis included in other, net in the Other Operations segment, have been reported as a discontinued operation in our consolidated financial statements for all periods presented.statement of operations.
As of December 31, 2012, theThe major classes of the prison services assets and liabilities sold consisted of the following:
| | | |
(In thousands) | | |
Current assets | | $ | 7,420 |
Property, plant and equipment | | | 1,639 |
Goodwill | | | 4,196 |
Other assets | | | 90 |
Total assets | | $ | 13,345 |
| | | |
Current liabilities | | $ | 6,351 |
Other long-term liabilities | | | 62 |
Total liabilities | | $ | 6,413 |
| | | |
On May 3, 2016, we entered into a definitive agreement to sell all of the issued and outstanding stock of our non-core, rural ILEC business located in northwest Iowa, Consolidated Communications of Iowa Company (“CCIC”), formerly Heartland Telecommunications Company of Iowa. CCIC provides telecommunications and data services to residential and business customers in 11 rural communities in northwest Iowa and surrounding areas. The sale was completed on September 1, 2016 for total cash proceeds of approximately $21.0 million, net of certain contractual and customary working capital adjustments.
The major classes of assets and liabilities sold consisted of the following:
| | | | |
(In thousands) | | | |
Current assets | | $ | 567 | |
Property, plant and equipment | | | 20,348 | |
Goodwill | | | 7,647 | |
Total assets | | $ | 28,562 | |
| | | | |
Current liabilities | | $ | 255 | |
Deferred taxes | | | 7,041 | |
Other long-term liabilities | | | 21 | |
Total liabilities | | $ | 7,317 | |
In May 2016, in connection with the expected sale, the carrying value of CCIC was reduced to its estimated fair value and we recognized an impairment loss of $0.6 million during the year ended December 31, 2016. We recognized an additional loss on the sale of $0.3 million during the year ended December 31, 2016, which is included in discontinuedother, net in the consolidated statement of operations, were as follows:a result of changes in estimated working capital. We recognized a taxable gain on the transaction resulting in current income tax expense of $7.2 million during the year ended December 31, 2016 to reflect the tax impact of the divestiture.
(In thousands) | | December 31, 2012 | |
Accounts receivable, net | | $ | 625 | |
Property, plant and equipment, net | | 564 | |
Total assets | | $ | 1,189 | |
| | | |
Accounts payable | | $ | 13 | |
Advance billings and customer deposits | | 938 | |
Accrued expense | | 3,258 | |
Total liabilities | | $ | 4,209 | |
F-17
CONSOLIDATED COMMUNICATIONS HOLDINGS, INC. AND SUBSIDIARIES
NOTES TO CONSOLIDATED FINANCIAL STATEMENTS (continued)
YEARS ENDED DECEMBER 31, 2013, 2012 AND 2011
The following table summarizes the financial information for the prison services operations:
(In thousands) | | 2013 | | 2012 | | 2011 | |
Operating revenues | | $ | 5,622 | | $ | 25,580 | | $ | 25,260 | |
Operating expenses including depreciation and amortization | | 5,883 | | 23,599 | | 21,534 | |
Income (loss) from operations | | (261) | | 1,981 | | 3,726 | |
Other income (expense) | | - | | - | | 672 | |
Income tax expense (benefit) | | (105) | | 775 | | 1,704 | |
Income (loss) from discontinued operations | | $ | (156) | | $ | 1,206 | | $ | 2,694 | |
| | | | | | | |
Gain on sale of discontinued operations, net of tax of $887 | | $ | 1,333 | | $ | - | | $ | - | |
4.INVESTMENTS
Our investments are as follows:
| | | | | | | | |
| | | | | | | | |
(In thousands) | | 2013 | | 2012 | | | 2016 | | 2015 | |
Cash surrender value of life insurance policies | | $ | 2,183 | | $ | 2,045 | | | $ | 2,156 | | $ | 2,149 | |
Cost method investments: | | | | | | | | | | | | |
GTE Mobilnet of South Texas Limited Partnership (2.34% interest) | | 21,450 | | 21,450 | | | | 21,450 | | | 21,450 | |
Pittsburgh SMSA Limited Partnership (3.60% interest) | | 22,950 | | 22,950 | | | | 22,950 | | | 22,950 | |
CoBank, ACB Stock | | 5,112 | | 5,023 | | | | 8,138 | | | 7,971 | |
Other | | 200 | | 430 | | | | 200 | | | 200 | |
Equity method investments: | | | | | | | | | | | | |
GTE Mobilnet of Texas RSA #17 Limited Partnership (20.51% interest) | | 27,467 | | 25,695 | | | | 17,160 | | | 18,099 | |
Pennsylvania RSA 6(I) Limited Partnership (16.6725% interest) | | 7,696 | | 7,286 | | |
Pennsylvania RSA 6(I) Limited Partnership (16.67% interest) | | | | 6,540 | | | 6,167 | |
Pennsylvania RSA 6(II) Limited Partnership (23.67% interest) | | 24,105 | | 23,338 | | | | 27,627 | | | 26,557 | |
CVIN, LLC (13.455% interest) | | 1,936 | | 1,533 | | |
Totals | | $ | 113,099 | | $ | 109,750 | | | $ | 106,221 | | $ | 105,543 | |
Cost Method
We own 2.34% of GTE Mobilnet of South Texas Limited Partnership (the “Mobilnet South Partnership”). The principal activity of the Mobilnet South Partnership is providing cellular service in the Houston, Galveston, and Beaumont, Texas metropolitan areas. We also own 3.60% of Pittsburgh SMSA Limited Partnership (“Pittsburgh SMSA”), which provides cellular service in and around the Pittsburgh metropolitan area. Because of our limited influence over these partnerships, we use the cost method to account for both of these investments. It is not practicable to estimate fair value of these investments. We did not evaluate any of the investments for impairment as no factors indicating impairment existed during the year. In 2013, 20122016, 2015 and 2011,2014, we received cash distributions from these partnerships totaling $16.9$12.9 million, $14.1$14.6 million and $11.1$14.8 million, respectively.
CoBank, ACB (“CoBank”) is a cooperative bank owned by its customers. Annually, CoBank distributes patronage in the form of cash and stock in the cooperative based on the Company’s outstanding loan balance with CoBank, which has traditionally been a significant lender in the Company’s credit facility. The investment in CoBank represents the accumulation of the equity patronage paid by CoBank to the Company.
Equity Method
We own 20.51% of GTE Mobilnet of Texas RSA #17 Limited Partnership (“RSA #17”), 16.6725%16.67% of Pennsylvania RSA 6(I) Limited Partnership (“RSA 6(I)”) and 23.67% of Pennsylvania RSA 6(II) Limited Partnership (“RSA 6(II)”). RSA #17 provides cellular service to a limited rural area in Texas. In December 2012, we purchased additional ownership interest in RSA #17 for $6.7 million which increased our ownership from 17.02% to 20.51%. RSA 6(I) and RSA 6(II) provide cellular service in and around our Pennsylvania service territory. Because we have significant influence over the operating and financial policies of these three entities, we account for the investments using the equity method. In 2013, 20122016, 2015 and 2011,2014, we received cash distributions from these partnerships totaling $17.9$19.2 million, $15.0$30.7 million and $17.2$19.8 million, respectively. The carrying value of the investments exceeds the underlying equity in net assets of the partnerships by $33.2$32.8 million.
F-18
Table of Contents
CONSOLIDATED COMMUNICATIONS HOLDINGS, INC. AND SUBSIDIARIES
NOTES TO CONSOLIDATED FINANCIAL STATEMENTS (continued)
YEARS ENDED DECEMBER 31, 2013, 2012 AND 2011
We have a 13.455%In 2015, we sold our 6.96% interest in Central Valley Independent Network, LLC (“CVIN”), a joint enterprise comprised of affiliates of several independent telephone companies located in central and northern California. CVIN provides network services and oversees a broadband infrastructure project designed to expand and improve the availability of network services to counties in central California. In 2013,As a result of the sale, we made additional capital investmentsrecognized an other-than-temporary impairment loss of $0.4$0.8 million during the year ended December 31, 2015 to reduce the investment to its estimated fair value. The impairment charge is included in this partnership.investment income within other income (expense) in the consolidated statements of operations. We did not receive any distributions from this partnership in 20132015 or 2012.2014.
The combined unaudited results of operations and financial position of our three equity investments in the cellular limited partnerships are summarized below:
| | | | | | | | | | | | |
| | | | | | | | | | | | |
| | | | | | | | | | | | |
(In thousands) | | 2013 | | 2012 | | 2011 | | | | 2016 | | 2015 | | 2014 | |
Total revenues | | $ | 321,555 | | $ | 299,389 | | $ | 305,965 | | | | $ | 334,421 | | $ | 348,595 | | $ | 338,575 | |
Income from operations | | 98,962 | | 83,577 | | 84,803 | | | | | 97,075 | | | 105,495 | | | 96,606 | |
Net income before taxes | | 99,024 | | 83,633 | | 84,844 | | | | | 95,473 | | | 104,568 | | | 96,763 | |
Net income | | 99,024 | | 83,283 | | 84,483 | | | | | 95,473 | | | 104,568 | | | 96,763 | |
| | | | | | | | | | | | | | | | | | |
Current assets | | $ | 54,837 | | $ | 49,982 | | $ | 44,739 | | | | $ | 64,083 | | $ | 57,716 | | $ | 52,866 | |
Non-current assets | | 87,968 | | 79,529 | | 79,432 | | | | | 89,651 | | | 96,197 | | | 93,771 | |
Current liabilities | | 15,221 | | 15,417 | | 14,523 | | | | | 21,985 | | | 20,576 | | | 16,253 | |
Non-current liabilities | | 1,786 | | 1,351 | | 1,096 | | | | | 51,836 | | | 52,414 | | | 3,225 | |
Partnership equity | | 125,799 | | 112,734 | | 108,552 | | | | | 79,913 | | | 80,923 | | | 127,159 | |
5.FAIR VALUE MEASUREMENTS
Financial Instruments
Our derivative instruments related to interest rate swap agreements are required to be measured at fair value on a recurring basis. The fair values of the interest rate swaps are determined using valuation models and are categorized within Level 2 of the fair value hierarchy as the valuation inputs are based on quoted prices and observable market data of similar instruments. See Note 7 for further discussion regarding our interest rate swap agreements.
Our interest rate swap liabilities measured at fair value on a recurring basis at December 31, 20132016 and 20122015 were as follows:
| | | | | | | | | | | | | | |
| | | | | | As of December 31, 2016 | |
| | | | | | Quoted Prices | | Significant | | | |
| | | | | | In Active | | Other | | Significant | |
| | | | As of December 31, 2013 | | | | | | Markets for | | Observable | | Unobservable | |
| | | | Quoted Prices
In Active
Markets for
Identical Assets | | Significant
Other
Observable
Inputs | | Significant
Unobservable
Inputs | | | | | | Identical Assets | | Inputs | | Inputs | |
(In thousands) | | Total | | (Level 1) | | (Level 2) | | (Level 3) | | | Total | | (Level 1) | | (Level 2) | | (Level 3) | |
Long-term interest rate swap assets | | | $ | 398 | | $ | - | | $ | 398 | | $ | - | |
Current interest rate swap liabilities | | $ | (660) | | – | | $ | (660) | | – | | | | (453) | | | - | | | (453) | | | - | |
Long-term interest rate swap liabilities | | (1,959) | | – | | (1,959) | | – | | | | (216) | | | - | | | (216) | | | - | |
Total | | $ | (2,619) | | $ | – | | $ | (2,619) | | $ | – | | | $ | (271) | | $ | - | | $ | (271) | | $ | - | |
|
| | | | As of December 31, 2012 | |
| | | | Quoted Prices
In Active
Markets for
Identical Assets | | Significant
Other
Observable
Inputs | | Significant
Unobservable
Inputs | |
(In thousands) | | Total | | (Level 1) | | (Level 2) | | (Level 3) | |
Current interest rate swap liabilities | | $ | (3,164) | | – | | $ | (3,164) | | – | |
Long-term interest rate swap liabilities | | (3,919) | | – | | (3,919) | | – | |
Total | | $ | (7,083) | | $ | – | | $ | (7,083) | | $ | – | |
| | | | | | | | | | | | | |
The change in the fair value of the derivatives is primarily a result of a change in market expectations for future interest rates and the expiration of certain instruments during 2013.
F-19
| | | | | | | | | | | | | |
| | | | | As of December 31, 2015 | |
| | | | | Quoted Prices | | Significant | | | |
| | | | | In Active | | Other | | Significant | |
| | | | | Markets for | | Observable | | Unobservable | |
| | | | | Identical Assets | | Inputs | | Inputs | |
(In thousands) | | Total | | (Level 1) | | (Level 2) | | (Level 3) | |
Current interest rate swap liabilities | | $ | (190) | | $ | - | | $ | (190) | | $ | - | |
Long-term interest rate swap liabilities | | | (1,084) | | | - | | | (1,084) | | | - | |
Total | | $ | (1,274) | | $ | - | | $ | (1,274) | | $ | - | |
Table of Contents
CONSOLIDATED COMMUNICATIONS HOLDINGS, INC. AND SUBSIDIARIES
NOTES TO CONSOLIDATED FINANCIAL STATEMENTS (continued)
YEARS ENDED DECEMBER 31, 2013, 2012 AND 2011
We have not elected the fair value option for any of our financial assets or liabilities. The carrying value of other financial instruments, including cash, accounts receivable, accounts payable and accrued liabilities approximate fair value due to their short maturities or variable-rate nature of the respective balances. The following table presents the other financial instruments that are not carried at fair value but which require fair value disclosure as of December 31, 20132016 and 2012.2015.
| | As of December 31, 2013 | | As of December 31, 2012 | |
(In thousands) | | Carrying Value | | Fair Value | | Carrying Value | | Fair Value | |
Investments, equity basis | | $ | 61,204 | | n/a | | $ | 57,852 | | n/a | |
Investments, at cost | | $ | 49,712 | | n/a | | $ | 49,853 | | n/a | |
Long-term debt, excluding capital leases | | $ | 1,216,764 | | $ | 1,261,508 | | $ | 1,213,000 | | $ | 1,231,355 | |
| | | | | | | | | | | | | |
| | | | | | | | | | | | | |
| | As of December 31, 2016 | | As of December 31, 2015 | |
(In thousands) | | Carrying Value | | Fair Value | | Carrying Value | | Fair Value | |
Investments, equity basis | | $ | 51,327 | | | n/a | | $ | 50,823 | | | n/a | |
Investments, at cost | | $ | 52,738 | | | n/a | | $ | 52,571 | | | n/a | |
Long-term debt, excluding capital leases | | $ | 1,388,786 | | $ | 1,390,773 | | $ | 1,393,567 | | $ | 1,312,383 | |
Cost & Equity Method Investments
Our investments at December 31, 20132016 and 20122015 accounted for under both the equity and cost methods consists primarily of minority positions in various cellular telephone limited partnerships and our investment in CoBank. These investments are recorded using either the equity or cost methods. It is impracticable to determine fair value of these investments.
Long-term Debt
The fair value of our long-term debtsenior notes was estimated using a discounted cash flow analyses based on incremental borrowingquoted market prices, and the fair value of borrowings under our credit agreement was determined using current market rates for similar types of borrowing arrangements. We have categorized the long-term debt as Level 2 within the fair value hierarchy.
6.LONG-TERM DEBT
Long-term debt outstanding, presented net of unamortized discounts, consisted of the following as of December 31, 20132016 and 2012:2015:
| | | | | | | | |
| | | | | | | | |
(In thousands) | | 2013 | | 2012 | | | 2016 | | 2015 | |
Senior secured credit facility: | | | | | | | | | | | | |
Term loan 2 | | $ | - | | $ | 404,961 | | |
Term loan 3, net of discount of $5,088 at December 31, 2012 | | - | | 509,912 | | |
Term loan 4, net of discount of $4,537 at December 31, 2013 | | 905,463 | | - | | |
Term loan 5, net of discount of $4,662 at December 31, 2016 | | | $ | 893,088 | | $ | - | |
Term loan 4, net of discount of $3,340 at December 31, 2015 | | | | - | | | 888,460 | |
Revolving loan | | 13,000 | | - | | | | - | | | 10,000 | |
Senior notes, net of discount of $1,699 and $1,873 at | | | | | | |
December 31, 2013 and 2012, respectively | | 298,301 | | 298,127 | | |
6.50% Senior notes due 2022, net of discount of $4,302 and $4,893 at December 31, 2016 and 2015, respectively | | | | 495,698 | | | 495,107 | |
Capital leases | | 5,121 | | 4,844 | | | | 16,857 | | | 7,580 | |
| | 1,221,885 | | 1,217,844 | | | | 1,405,643 | | | 1,401,147 | |
Less: current portion of long-term debt and capital leases | | (9,751) | | (9,596) | | | | (14,922) | | | (10,937) | |
Less: deferred debt issuance costs | | | | (13,967) | | | (12,318) | |
Total long-term debt | | $ | 1,212,134 | | $ | 1,208,248 | | | $ | 1,376,754 | | $ | 1,377,892 | |
Credit Agreement
TheIn October 2016, the Company, through certain of its wholly owned subsidiaries, has an outstanding credit agreement with several financial institutions. In December 2013, we entered into a SecondThird Amended and Restated Credit Agreement with various financial institutions (the “Credit Agreement”) to restatereplace the Company’s previously amended credit agreement. The restated credit agreement consistsUnder the terms of a $75.0 million revolving credit facility andthe new Credit Agreement, the Company issued initial term loans in the aggregate amount of $910.0$900.0 million (“Term 4”5”). The and used the proceeds from the restated credit agreement were usedin part to repay the outstanding term loans from the previous agreement in its entirety. The Company also obtained a revolving loan facility of $110.0 million to replace the existing $75.0 million revolving credit agreementfacility scheduled to mature in December 2018. The Credit Agreement also includes an incremental term loan facility which provides the ability to request to borrow up to $300.0 million of incremental term loans subject to certain terms and conditions.conditions and borrow more than $300.0 million, provided that its senior secured leverage ratio would not exceed 3.00:1.00. Borrowings under the senior secured credit facility are secured by substantially all of the assets of the Company and its subsidiaries, with the exception of Consolidated Communications of Illinois Company (formerly Illinois Consolidated Telephone CompanyCompany) and our majority-owned subsidiary, East Texas Fiber Line Incorporated.
The Term 45 loan facility consists ofwas issued in an original aggregate principal amount of $910.0$900.0 million with a maturity date of December 23, 2020,October 5, 2023, but is subject to earlier maturity on DecemberMarch 31, 20192022 if the Company’s unsecured Senior Notes due in 2020 (“Senior Notes”)October 2022 are repaid in full or redeemed in full by Decemberon or prior to March 31, 2019.2022. The Term 45 loan contains
F-20
Table of Contents
CONSOLIDATED COMMUNICATIONS HOLDINGS, INC. AND SUBSIDIARIES
NOTES TO CONSOLIDATED FINANCIAL STATEMENTS (continued)
YEARS ENDED DECEMBER 31, 2013, 2012 AND 2011
an original issuance discount of $4.6 million,0.25%, which is being amortized over the term of the loan. The Term 45 loan requires quarterly principal payments of $2.3$2.25 million, commencing Marchwhich commenced December 31, 20142016, and has an interest rate of LIBOR3.00% plus 3.25%the London Interbank Offered Rate (“LIBOR”) subject to a 1.00% LIBOR floor.
Our
The revolving credit facility has a maturity date of December 23, 2018October 5, 2021 and an applicable margin (at our election) of between 2.50% and 3.25% for LIBOR-based borrowings or between 1.50% and 2.25% for alternate base rate borrowings, depending on our leverage ratio. Based on our leverage ratio at December 31, 2013,2016, the borrowing margin for the next three month period ending March 31, 20142017 will be at a weighted-average margin of 3.00% for a LIBOR-based loan or 2.00% for an alternativealternate base rate loan. The applicable borrowing margin for the revolving credit facility is adjusted quarterly to reflect the leverage ratio from the prior quarter-end. As of December 31, 2013, $13.02016, there were no outstanding borrowings under the revolving credit facility. At December 31 2015, borrowings of $10.0 million waswere outstanding under the revolving credit facility. There were no borrowings or lettersA stand-by letter of credit of $1.6 million, issued in connection with the Company’s insurance coverage, was outstanding under our revolving credit facility as of December 31, 2016. The stand-by letter of credit is renewable annually and reduces the borrowing availability under the revolving credit facility atfacility. As of December 31, 2012.2016, $108.4 million was available for borrowing under the revolving credit facility.
The weighted-average interest rate on outstanding borrowings under our credit facility was 4.23%4.00% and 4.79%4.24% at December 31, 20132016 and 2012,2015, respectively. Interest is payable at least quarterly.
Net proceeds from asset sales exceeding certain thresholds, to the extent not reinvested, are required to be used to repay loans outstanding under the credit agreement.
Financing Costs
In connection with entering into the restated credit agreement in December 2013,October 2016, fees of $6.6$3.9 million were capitalized as deferred debt issuance costs. These capitalized costs are amortized over the term of the debt and are included as a component of interest expense in the consolidated statements of income.operations. We also incurred a loss on the extinguishment of debt of $7.7$6.6 million during the year ended December 31, 20132016 related to the repayment of the outstanding term loansloan under the previous credit agreement which werewas scheduled to mature in December 2017 and 2018.2020.
The credit agreement was previously amended in December 2012, to issue incremental term loans (Term 3) which were used to repay outstanding term loans scheduled to mature in December 2014, to extend the maturity dates of outstanding term loans (Term 2) from December 2014 to December 2017 and to extend the termination date of the revolving loan facility. In connection with entering into the December 2012 amendment, fees of $4.2 million were capitalized as deferred debt issuance costs and we recognized a loss on the extinguishment of debt of $4.5 million during the year ended December 31, 2012.
In February 2012, the terms of our credit facility were amended to provide us with the ability to incur indebtedness necessary to finance the acquisition of SureWest, which enabled us to issue the Senior Notes, as described below. In connection with the amendment, fees of $3.5 million were recognized as financing and other transaction costs during the year ended December 31, 2012.
Credit Agreement Covenant Compliance
The credit agreement contains various provisions and covenants, including, among other items, restrictions on the ability to pay dividends, incur additional indebtedness, and issue capital stock. We have agreed to maintain certain financial ratios, including interest coverage and total net leverage ratios, all as defined in the credit agreement. As of December 31, 2013,2016, we were in compliance with the credit agreement covenants.
In general, our credit agreement restricts our ability to pay dividends to the amount of our Available Cash as defined in our credit agreement. As of December 31, 2013,2016, and including the $15.5$19.6 million dividend declared in November 2013October 2016 and paid on February 1, 2014,2017, we had $202.4$269.3 million in dividend availability under the credit facility covenant.
Under our credit agreement, if our total net leverage ratio, (asas defined in the credit agreement),agreement, as of the end of any fiscal quarter, is greater than 5.10:1.00, we will be required to suspend dividends on our common stock unless otherwise permitted by an exception for dividends that may be paid from the portion of proceeds of any sale of equity not used to fund acquisitions, or make other investments. During any dividend suspension period, we will be required to repay debt in an amount equal to 50.0% of any increase in Available Cash, among other things. In addition, we will not be permitted to pay dividends if an event of default under the credit agreement has occurred and is continuing. Among other things, it will be an event of default if our total net leverage ratio and interest coverage ratio as of the end of any fiscal quarter is greater than 5.25:1.00 and less than 2.25:1.00, respectively. As of December 31, 2013,2016, our total net leverage ratio under the credit agreement was 4.26:4.49:1.00, and our interest coverage ratio was 3.41:3.97:1.00.
F-21
Table of ContentsCommitted Financing
CONSOLIDATED COMMUNICATIONS HOLDINGS, INC. AND SUBSIDIARIES
NOTES TO CONSOLIDATED FINANCIAL STATEMENTS (continued)
YEARS ENDED DECEMBER 31, 2013, 2012 AND 2011
Senior Notes
On May 30, 2012, we completed an offeringIn connection with the execution of $300.0 million aggregate principal amount of 10.875% unsecured Senior Notes, due 2020 through our wholly-owned subsidiary, Consolidated Communications Finance Co. (“Finance Co.”) forthe Merger Agreement, in December 2016, the Company entered into two amendments to its Credit Agreement to secure committed financing related to the acquisition of SureWest. The Senior Notes will mature on JuneFairPoint. On December 14, 2016, we entered into Amendment No. 1 2020 and earn interest at a rate of 10.875% per year, payable semi-annually in arrears on June 1 and December 1 of each year, commencing on December 1, 2012. The Senior Notes were sold into the United StatesCredit Agreement, to qualified institutional buyers pursuant to Rule 144Aincrease the senior secured incremental term loan credit facility under the Securities ActCredit Agreement from $865.0 million to an aggregate amount of 1933 (the “Securities Act”)$935.0 million. Fees of $2.5 million paid to the lenders in connection with Amendment No. 1 are reflected as an additional discount on the Term 5 loan and outside the United States in compliance with Regulation S under the Securities Act. In addition, some of the Senior Notes were sold to certain “accredited investors” (as defined in Rule 501 under the Securities Act). The Senior Notes were sold to investors at a price equal to 99.345% of the principal amount thereof, for a yield to maturity of 11.00%. This discount is beingwill be amortized over the term of the Senior Notes.debt as interest expense. On December 21, 2016, the Company entered into Amendment No. 2 to the Credit Agreement in which a syndicate of lenders has agreed to provide an incremental term loan in an aggregate principal amount of up to $935.0 million under the Credit Agreement (the “Incremental Term Loan”), subject to the satisfaction of certain conditions. The proceeds of the saleIncremental Term Loan may be used, in part, to repay and redeem certain existing indebtedness of FairPoint and to pay certain fees and expenses in connection with the Merger and
the related financing. The terms, conditions and covenants of the Incremental Term Loan are materially consistent with those in the existing Credit Agreement, as described above. The Incremental Term Loan included an original issue discount of 0.50% and has an interest rate of 3.00% plus LIBOR based on the one-month adjusted rate subject to a 1.00% LIBOR floor. Ticking fees will begin accruing on the Incremental Term Loan commitments on January 15, 2017 at the rate equal to the interest rate of the Incremental Term Loan.
Senior Notes
6.50% Senior Notes due 2022
In September 2014, we completed an offering of $200.0 million aggregate principal amount of 6.50% Senior Notes due in October 2022 (the “Existing Notes”). The Existing Notes were priced at par, which resulted in total gross proceeds of $200.0 million. On June 8, 2015, we completed an additional offering of $300.0 million in aggregate principal amount of 6.50% Senior Notes due 2022 (the “New Notes” and together with the Existing Notes, the “Senior Notes”). The New Notes were issued as additional notes under the same indenture pursuant to which the Existing Notes were previously issued on in September 2014. The New Notes were priced at 98.26% of par with a yield to maturity of 6.80% and resulted in total gross proceeds of approximately $294.8 million, excluding accrued interest. The original issuance discount of $5.2 million and deferred debt issuance costs of $8.3 million incurred in connection with the issuance of the Senior Notes were held in an escrow account prior toare being amortized using the closingeffective interest method over the term of the SureWest transaction. Upon closingnotes.
The Senior Notes mature on October 1, 2022 and interest is payable semi-annually on April 1 and October 1 of the SureWest acquisition on July 2, 2012, Finance Co. merged with and into our wholly-owned subsidiaryeach year. Consolidated Communications, Inc., which assumed (“CCI”) is the primary obligor under the Senior Notes, and we and certain of our wholly‑owned subsidiaries have fully and unconditionally guaranteed the Senior Notes. On August 3, 2012, SureWest and its subsidiaries guaranteedThe Senior Notes are senior unsecured obligations of the Company.
The net proceeds from the issuance of the Senior Notes, together with cash on hand, were used, in part, to finance the acquisition of Enventis in 2014 including related fees and expenses, to repay the existing indebtedness of Enventis and to redeem our then outstanding $300.0 million aggregate principal amount of 10.875% Senior Notes due 2020 (the “2020 Notes”). In December 2014, we paid $84.1 million to redeem $72.8 million of the original aggregate principal amount of the 2020 Notes and recognized a loss of $13.8 million on the partial extinguishment of debt during the year ended December 31, 2014. In June 2015, we redeemed the remaining $227.2 million of the original aggregate principal amount of the 2020 Notes. In connection with the redemption of the 2020 Notes, we paid $261.9 million and recognized a loss on extinguishment of debt of $41.2 million during the year ended December 31, 2015.
In 2013,On October 16, 2015, we completed an exchange offer to issue registered notes (“Exchange Notes”) for $287.3 millionregister all of the original Senior Notes.Notes under the Securities Act of 1933 (“Securities Act”). The terms of the Exchangeregistered Senior Notes are substantially identical to those of the Senior Notes prior to the exchange, except that the ExchangeSenior Notes are now registered under the Securities Act and the transfer restrictions and registration rights previously applicable to the Senior Notes do notno longer apply to the Exchangeregistered Senior Notes. The exchange offer did not impact the aggregate principal amount or the remaining terms of the Senior Notes outstanding.
Senior Notes Covenant Compliance
TheSubject to certain exceptions and qualifications, the indenture governing the Senior Notes contains customary covenants for high yield notes, whichthat, among other things, limits Consolidated Communications, Inc.’sCCI’s and its restricted subsidiaries’ ability to: incur additional debt or issue certain preferred stock; pay dividends or make other distributions on capital stock or prepay subordinated indebtedness; purchase or redeem any equity interests; make investments; create liens; sell assets; enter into agreements that restrict dividends or other payments by restricted subsidiaries; consolidate, merge or transfer all or substantially all of its assets; engage in transactions with its affiliates; or enter into any sale and leaseback transactions. The indenture also contains customary events of default.
Among other matters, the Senior Notes indenture provides that Consolidated Communications, Inc.CCI may not pay dividends or make other “restricted payments” torestricted payments, as defined in the Companyindenture, if its total net leverage ratio is 4.25:4.75:1.00 or greater. This ratio is calculated differently than the comparable ratio under the credit agreement;Credit Agreement; among other differences, it takes into account, on a pro forma basis, synergies expected to be achieved as a result of the SureWest acquisitioncertain acquisitions but not yet reflected in historical results. At December 31, 2013,2016, this ratio was 4.20:4.53:1.00. If this ratio is met, dividends and other restricted payments may be made from cumulative consolidated cash flow since the date the Senior Notes were issued,April 1, 2012, less 1.75 times fixed charges, less dividends and other restricted payments made since the date the Senior Notes were issued.May 30, 2012. Dividends may be paid and other restricted payments may also be made from a “basket”
“basket” of $50.0 million, none of which has been used to date, and pursuant to other exceptions identified in the Senior Notes indenture. Since dividends of $108.5$331.6 million have been paid since May 30, 2012, at December 31, 2013including the quarterly dividend declared in October 2016 and paid on February 1, 2017, there was $156.6$451.1 million of the $265.1$782.6 million of cumulative consolidated cash flow since May 30, 2012 available to pay dividends.dividends at December 31, 2016. At December 31, 2016, the Company was in compliance with all terms, conditions and covenants under the indenture governing the 2022 Notes.
Bridge Loan Facility
In connection with the acquisition of SureWest, in February 2012 the Company received committed financing for a total of $350.0 million to fund the cash portion of the anticipated transaction, to refinance SureWest’s debt and to pay for certain transaction costs. The financing package included a $350.0 million Senior Unsecured Bridge Loan Facility (“Bridge Facility”). As anticipated, permanent financing for the SureWest acquisition was funded by our Senior Note offering, as described above. As a result, the $4.2 million commitment fee incurred for the Bridge Facility was capitalized as deferred debt issuance costs in February 2012 and was amortized over the expected life of the Bridge Facility, which was four months.
F-22
Table of Contents
CONSOLIDATED COMMUNICATIONS HOLDINGS, INC. AND SUBSIDIARIES
NOTES TO CONSOLIDATED FINANCIAL STATEMENTS (continued)
YEARS ENDED DECEMBER 31, 2013, 2012 AND 2011
Future Maturities of Debt
At December 31, 2013,2016, the aggregate maturities of our long-term debt excluding capital leases were as follows:
| | | | | |
(In thousands) | | | | | | | |
2014 | | $ | 9,100 | | |
2015 | | 9,100 | | |
2016 | | 9,100 | | |
2017 | | 9,100 | | | $ | 9,000 | |
2018 | | 22,100 | | | | 9,000 | |
2019 | | | | 9,000 | |
2020 | | | | 9,000 | |
2021 | | | | 9,000 | |
Thereafter | | 1,164,500 | | | | 1,352,750 | |
Total maturities | | 1,223,000 | | | | 1,397,750 | |
Less: Unamortized discount | | (6,236) | | | | (8,964) | |
| | $ | 1,216,764 | | | $ | 1,388,786 | |
As of December 31, 2013, we had seven capital leases with maturities ranging from 2015 to 2021. See Note 11 regarding the future maturities of our obligations for capital leases.
7.DERIVATIVE FINANCIAL INSTRUMENTS
We may utilize interest rate swap agreements to mitigate risk associated with fluctuations in interest rates related to our variable rate debt. Derivative financial instruments are recorded at fair value in our consolidated balance sheet.
The following interest rate swaps were outstanding at December 31, 2013:2016:
| | | | | | | | | | |
| | | Notional | | | | | | |
(In thousands) | | Notional Amount | | 2013 Balance Sheet Location | | Fair Value | | | Amount | | 2016 Balance Sheet Location | | Fair Value | |
| | | | | | | | |
De-designated Hedges: | | | | | | | | |
Fixed to 1-month floating LIBOR | | $ | 175,000 | | Other long-term liabilities | | $ | (1,897) | | |
Fixed to 1-month floating LIBOR | | 100,000 | | Current portion of derivative liability | | (660) | | |
Cash Flow Hedges: | | | | | | | | | | |
Fixed to 1-month floating LIBOR (with floor) | | | $ | 100,000 | | Other assets | | $ | 398 | |
Fixed to 1-month floating LIBOR (with floor) | | | $ | 100,000 | | Accrued expense | | | (453) | |
Fixed to 1-month floating LIBOR (with floor) | | 50,000 | | Other long-term liabilities | | (62) | | | $ | 50,000 | | Other long-term liabilities | | | (216) | |
Total Fair Values | | | | | | $ | (2,619) | | | | | | | | $ | (271) | |
|
The following interest rate swaps were outstanding at December 31, 2012:2015:
| | | | | | | | | | |
| | | Notional | | | | | | |
(In thousands) | | Notional Amount | | 2012 Balance Sheet Location | | Fair Value | | | Amount | | 2015 Balance Sheet Location | | Fair Value | |
| | | | | | | | |
Cash Flow Hedges: | | | | | | | | | | | | | | | | |
Fixed to 1-month floating LIBOR | | $ | 200,000 | | Other long-term liabilities | | $ | (2,758) | | |
Fixed to 1-month floating LIBOR | | 100,000 | | Current portion of derivative liability | | (1,069) | | |
Forward starting fixed to 1-month floating LIBOR | | 75,000 | | Other long-term liabilities | | (1,161) | | |
Fixed to 1-month floating LIBOR (with floor) | | | $ | 150,000 | | Other long-term liabilities | | $ | (1,084) | |
| | | | | | | | | | | | | | | | |
De-designated Hedges: | | | | | | | | | | | | | | | | |
Fixed to 3-month floating LIBOR | | 130,000 | | Current portion of derivative liability | | (1,300) | | |
3-month floating LIBOR minus spread to 1-month floating LIBOR | | 130,000 | | Current portion of derivative liability | | (16) | | |
Fixed to 1-month floating LIBOR | | 200,000 | | Current portion of derivative liability | | (779) | | | $ | 50,000 | | Accrued expense | | | (80) | |
Fixed to 1-month floating LIBOR (with floor) | | | $ | 50,000 | | Accrued expense | | | (110) | |
Total Fair Values | | | | | | $ | (7,083) | | | | | | | | $ | (1,274) | |
|
As of December 31, 2013, theThe counterparties to our various swaps are four major U.S. and European banks.highly rated financial institutions. None of the swap agreements provide for either us or the counterparties to post collateral nor do the agreements include any covenants related to the financial condition of Consolidated or the counterparties. The swaps of any counterparty that is a “Lender”lender, as defined in our credit facility, are secured along with the other creditors under the credit facility. Each of the swap agreements provides that in the event of a bankruptcy filing by either Consolidated or the counterparty, any amounts owed between the two parties would be offset in order to determine the net amount due between parties. This provision allows us to partially mitigate the risk of non-performance by a counterparty.
For interest rate swaps designated as a cash flow hedge, the effective portion of the unrealized gain or loss in fair value is recorded in AOCI and reclassified into earnings when the underlying hedged item impacts earnings. The ineffective portion of the change in fair value of the cash flow hedge is recognized immediately in earnings. For derivative financial instruments that are not designated as a hedge, including those that have been de-designated changes in fair value are recognized in earnings as interest expense.
In Decemberconjunction with the refinancing of our credit agreement in October 2016 as discussed in Note 6, the interest rate swaps were simultaneously de-designated and re-designated as cash flow hedges of future anticipated interest payments associated with our variable rate debt. The balance of the unrealized loss included in AOCI as of the date the swaps were de-designated will be amortized to earnings over the remaining term of the agreements. The interest rate swap agreements mature on various dates through September 2019.
In 2013, $325.0 million notional interest rate swaps previously designated as cash flow hedges were de-designated as a result of the amendmentamendments to our credit agreement on December 23, 2013 as discussed in Note 6. Theagreement. These interest rate swap agreements maturematured on various dates through September 2016. In December 2012, interest rate
F-23
Table of Contents
CONSOLIDATED COMMUNICATIONS HOLDINGS, INC. AND SUBSIDIARIES
NOTES TO CONSOLIDATED FINANCIAL STATEMENTS (continued)
YEARS ENDED DECEMBER 31, 2013, 2012 AND 2011
swaps with an aggregate notional value of $660.0 million were de-designated as cash flow hedges in connection with the amendment to our credit agreement on December 4, 2012. Of these agreements, $200.0 million notional interest rate swap agreements expired on December 31, 2012 and the remainder expired on March 31, 2013. Prior to de-designation, the effective portion of the change in fair value of the interest rate swaps were recognized in AOCI. The balance of the unrealized loss included in AOCI as of the date the swaps were de-designated iswas amortized to earnings over the remaining term of the swap agreements. Changes in fair value of the de-designated swaps arewere immediately recognized in earnings as interest expense. During the years ended December 31, 20132016, 2015 and 2012, a gain2014, gains of $2.2$0.2 million, $0.8 million and $2.8$1.6 million, respectively, waswere recognized as a reduction to interest expense for the change in fair value of the de-designated swaps.
At December 31, 20132016 and 2012,2015, the pre-tax deferred losses related to our interest rate swap agreements included in AOCI was $2.6were $0.2 million and $7.9$1.1 million, respectively. The estimated amount of losses included in AOCI as of December 31, 20132016 that will be recognized in earnings in the next twelve months is approximately $2.0$2.1 million.
The following table presents the effect of interest rate derivatives designated as cash flow hedges on AOCI and on the consolidated statements of incomeoperations for the years ended December 31, 2013, 20122016, 2015 and 2011:2014:
| | | | | | | | | | | |
| | | | | | | | | | | |
(In thousands) | | | 2016 | | 2015 | | 2014 | |
Unrealized loss recognized in AOCI, pretax | | | $ | (469) | | $ | (1,744) | | $ | (132) | |
Deferred losses reclassified from AOCI to interest expense | | | $ | (1,352) | | $ | (1,371) | | $ | (2,050) | |
Gain recognized in interest expense from ineffectiveness | | | $ | 242 | | $ | — | | $ | — | |
(In thousands) | | 2013 | | 2012 | | 2011 | |
Loss recognized in AOCI, pretax | | $ | (614) | | $ | (5,631) | | $ | (7,617) | |
Loss reclassified from AOCI to interest expense | | $ | (5,875) | | $ | (13,664) | | $ | (19,649) | |
Gain arising from ineffectiveness reducing interest expense | | $ | - | | $ | 47 | | $ | 93 | |
8.EQUITY
Share-Based8.EQUITY
Share-based Compensation
Our Board of Directors may grant share-based awards from our shareholder approved Amended and Restated Consolidated Communications Holdings, Inc. 2005 Long-term Incentive Plan (the “Plan”). The Plan permits the issuance of awards in the form of stock options, stock appreciation rights, stock grants, stock unit grants and other equity-based awards to eligible directors and employees at the discretion of the Compensation Committee of the Board of Directors. UnderOn May 4, 2015, the shareholders approved an amendment to the Plan approximately 1,650,000to increase by 1,000,000 the number of shares of our common stock authorized for issuance under the Plan. Approximately 2,650,000 shares of our common stock are authorized for issuance under the Plan, provided that no more than 300,000 shares may be granted in the form of stock options or stock appreciation rights to any eligible employee or director in any calendar year. Unless terminated sooner, the Plan will continue to be in effect untilthrough May 5, 2019.
We measure the fair value of time-based RSAs based on the market price of the underlying common stock as ofon the date of grant. We recognize the grant.expense associated with RSAs are amortizedon a straight-line basis over their respective vesting periods,the requisite service period, which generally ranges from immediate vest upvesting to a four year vesting period using the straight line method.period.
We implemented an ongoing performance-based incentive program under the Plan. The performance-based incentive program provides for annual grants of PSAs. PSAs are restricted stock that isare issued, to the extent earned, at the end of each performance cycle. Under the performance-based incentive program, each participant is given a target award expressed as a number of shares, with a payout opportunity ranging from 0% to 120% of the target, depending on
performance relative to predetermined goals. In accordance with the applicable accounting guidance, an accountingAn estimate of the number of these sharesPSAs that are expected to vest is made, and these shares are then expensed utilizing the grant-date fair value of the shares fromPSAs is expensed utilizing the fair value on the date of grant date throughover the end of the vestingrequisite service period.
The following table summarizes the grants of RSAs and PSAs under the Plan during the years ended December 31, 2013, 20122016, 2015 and 2011:2014:
| | | | | | | | | | | | | | | | |
| | Years Ended December 31, | | | Year Ended December 31, | |
| | | | Grant Date | | | | Grant Date | | | | Grant Date | | | | | Grant Date | | | | Grant Date | | | | Grant Date | |
| | 2013 | | Fair Value | | 2012 | | Fair Value | | 2011 | | Fair Value | | | 2016 | | Fair Value | | 2015 | | Fair Value | | 2014 | | Fair Value | |
RSAs Granted | | 168,516 | | $ | 17.13 | | 14,732 | | $ | 19.30 | | 127,377 | | $ | 17.92 | | | 100,040 | | $ | 23.95 | | 83,571 | | $ | 21.08 | | 132,781 | | $ | 19.74 | |
PSAs Granted | | 66,504 | | $ | 17.13 | | 68,540 | | $ | 19.30 | | 50,440 | | $ | 17.92 | | | 94,066 | | $ | 20.86 | | 77,786 | | $ | 19.74 | | 91,127 | | $ | 17.13 | |
Total | | 235,020 | | | | 83,272 | | | | 177,817 | | | | | 194,106 | | | | 161,357 | | | | | 223,908 | | | | |
The following table summarizes the RSA and PSA activity during the year ended December 31, 2016:
| | | | | | | | | | | |
| | RSAs | | PSAs |
| | | | Weighted | | | | Weighted |
| | | | Average Grant | | | | Average Grant |
| | Shares | | Date Fair Value | | Shares | | Date Fair Value |
Non-vested shares outstanding - January 1, 2016 | | 99,360 | | $ | 19.40 | | 83,224 | | $ | 18.75 | |
Shares granted | | 100,040 | | $ | 23.95 | | 94,066 | | $ | 20.86 | |
Shares vested | | (103,671) | | $ | 21.13 | | (64,018) | | $ | 19.44 | |
Shares forfeited, cancelled or retired | | (2,067) | | $ | 19.74 | | (4,112) | | $ | 19.81 | |
Non-vested shares outstanding - December 31, 2016 | | 93,662 | | $ | 22.34 | | 109,160 | | $ | 20.12 | |
The total fair value of the RSAs and PSAs that vested during the years ended December 31, 2013, 20122016, 2015 and 20112014 was $3.0$3.4 million, $2.4$3.9 million and $1.6$3.5 million, respectively.
F-24
Table of Contents
CONSOLIDATED COMMUNICATIONS HOLDINGS, INC. AND SUBSIDIARIES
NOTES TO CONSOLIDATED FINANCIAL STATEMENTS (continued)
YEARS ENDED DECEMBER 31, 2013, 2012 AND 2011
The following table summarizes the RSA and PSA activity during the year ended December 31, 2013:
| | RSAs | | PSAs | |
| | Shares | | Weighted
Average Grant
Date Fair Value | | Shares | | Weighted
Average Grant
Date Fair Value | |
Non-vested shares outstanding - January 1, 2013 | | 64,318 | | $ | 18.33 | | 58,221 | | $ | 18.85 | |
Shares granted | | 168,516 | | $ | 17.13 | | 66,504 | | $ | 17.13 | |
Shares vested | | (107,833) | | $ | 17.61 | | (60,459) | | $ | 17.90 | |
Shares forfeited, cancelled or retired | | (1,500) | | $ | 17.13 | | – | | $ | - | |
Non-vested shares outstanding - December 31, 2013 | | 123,501 | | $ | 17.32 | | 64,266 | | $ | 17.96 | |
Share-BasedShare-based Compensation Expense
The following table summarizes total compensation costs recognized for share-based payments during the years ended December 31, 2013, 20122016, 2015 and 2011:2014:
| | Year Ended December 31, | | | | | | | | | | | | |
(In millions) | | 2013 | | 2012 | | 2011 | | |
| | | | | | | | | | | | |
| | | | Year Ended December 31, | |
(In thousands) | | | | 2016 | | 2015 | | 2014 | |
Restricted stock | | $ | 1.8 | | $ | 1.3 | | $ | 1.3 | | | | $ | 2.1 | | $ | 1.7 | | $ | 2.1 | |
Performance shares | | 1.2 | | 1.0 | | 0.8 | | | | | 0.9 | | | 1.3 | | | 1.5 | |
Total | | $ | 3.0 | | $ | 2.3 | | $ | 2.1 | | | | $ | 3.0 | | $ | 3.0 | | $ | 3.6 | |
Income tax benefits related to stock-basedshare-based compensation of approximately $1.1$1.2 million, $0.4$1.2 million and $0.8$1.3 million waswere recorded for the years ended December 31, 2013, 20122016, 2015 and 2011,2014, respectively. Stock-basedShare-based compensation expense is included in “selling, general and administrative expenses” in the accompanying consolidated statements of operations.
As of December 31, 2013,2016, total unrecognized compensation costs related to nonvestednon-vested RSAs and PSAs was $3.5$2.7 million and will be recognized over a weighted-average period of approximately 0.81.6 years.
Accumulated Other Comprehensive Loss
The following table summarizes the changes in accumulated other comprehensive loss, net of tax, by component during 2013:2016 and 2015:
| | Pension and | | | | | |
| | Post-Retirement | | Derivative | | | |
(In thousands) | | Obligations | | Instruments | | Total | |
Balance at December 31, 2012 | | $ | (40,581) | | $ | (5,203) | | $ | (45,784) | |
Other comprehensive income before reclassifications | | 39,381 | | (381) | | 39,000 | |
Amounts reclassified from accumulated other comprehensive income | | 1,843 | | 3,941 | | 5,784 | |
Net current period other comprehensive income | | 41,224 | | 3,560 | | 44,784 | |
Balance at December 31, 2013 | | $ | 643 | | $ | (1,643) | | $ | (1,000) | |
F-25
| | | | | | | | | | |
| | Pension and | | | | | | | |
| | Post-Retirement | | Derivative | | | | |
(In thousands) | | Obligations | | Instruments | | Total | |
Balance at December 31, 2014 | | $ | (31,185) | | $ | (455) | | $ | (31,640) | |
Other comprehensive income before reclassifications | | | (5,547) | | | (1,072) | | | (6,619) | |
Amounts reclassified from accumulated other comprehensive income | | | 1,707 | | | 853 | | | 2,560 | |
Net current period other comprehensive income | | | (3,840) | | | (219) | | | (4,059) | |
Balance at December 31, 2015 | | $ | (35,025) | | $ | (674) | | $ | (35,699) | |
Other comprehensive income before reclassifications | | | (14,831) | | | (289) | | | (15,120) | |
Amounts reclassified from accumulated other comprehensive loss | | | 2,706 | | | 836 | | | 3,542 | |
Net current period other comprehensive income | | | (12,125) | | | 547 | | | (11,578) | |
Balance at December 31, 2016 | | $ | (47,150) | | $ | (127) | | $ | (47,277) | |
Table of Contents
CONSOLIDATED COMMUNICATIONS HOLDINGS, INC. AND SUBSIDIARIES
NOTES TO CONSOLIDATED FINANCIAL STATEMENTS (continued)
YEARS ENDED DECEMBER 31, 2013, 2012 AND 2011
The following table summarizes reclassifications from accumulated other comprehensive loss during 2013:2016 and 2015:
| | | | | | | | | |
| | Amount Reclassified from AOCI | | | |
| | Year Ended December 31, | | Affected Line Item in the | |
(In thousands) | | 2016 | | 2015 | | Statement of Income | |
Amortization of pension and post-retirement items: | | | | | | | | | |
Prior service credit | | $ | 979 | | $ | 1,079 | | (a) | |
Actuarial loss | | | (5,423) | | | (3,884) | | (a) | |
| | | (4,444) | | | (2,805) | | Total before tax | |
| | | 1,738 | | | 1,098 | | Tax benefit | |
| | $ | (2,706) | | $ | (1,707) | | Net of tax | |
| | | | | | | | | |
Loss on cash flow hedges: | | | | | | | | | |
Interest rate derivatives | | $ | (1,352) | | $ | (1,371) | | Interest expense | |
| | | 516 | | | 518 | | Tax benefit | |
| | $ | (836) | | $ | (853) | | Net of tax | |
|
| Amount
Reclassified from
AOCI
| | | |
|
| Year Ended
|
| Affected Line Item in the
|
|
(In thousands)
|
| December 31, 2013
|
| Statement of Income
|
|
Amortization of pension and post-retirement items:
| | | | | |
Prior service credit
| | $
| (637)
| | (a) | |
Actuarial loss
| | 3,652
| | (a)
| |
| | 3,015
| | Total before tax
| |
| | (1,172)
| | TaxThese items are included in the components of net periodic benefit
| |
| | $
| 1,843
| | Net of tax
| |
| | | | | |
Loss on cash flow hedges:
| | | | | |
Interest rate derivatives
| | $
| 5,875
| | Interest expense
| |
| | (1,934)
| | Tax cost for our pension and post-retirement benefit
| |
| | $
| 3,941
| | Net of tax
| plans. See Note 9 for additional details. |
(a)These items are included in the components of net periodic benefit cost for our pension and post-retirement benefit plans. See Note 9 for additional details.
9.PENSION PLANS AND OTHER POST-RETIREMENT BENEFITS
Defined Benefit Plans
We sponsor a qualified defined benefit pension plan (“Retirement Plan”) that is non-contributory covering certain of our hourly employees under collective bargaining agreements who fulfill minimum age and service requirements. Certain salaried employees are also covered by the Retirement Plan, although these benefits have previously been frozen. In April 2013, theThe Retirement Plan was amendedis closed to all new entrants. Benefits for certain employeeseligible participants under collective bargaining agreements to among other things: (i) change the benefit formula to a cash balance account as of May 1, 2013 and (ii) freeze entrance into the Retirement Plan so that no person is eligible to become a participant on or following May 1, 2013. As of May 2013, all employees under collective bargaining agreements that include a defined benefit plan are accrued based on a cash balance plan.
In connection with the acquisition of SureWest, we assumed sponsorship in 2012 of a frozen non-contributory defined benefit pension plan (the “SureWest Plan”). The SureWest Plan covers certain eligible employees and benefits are based on years of service and the employee’s average compensation during the five highest consecutive years of the last ten years of credited service. This plan has previously been frozen so that no person is eligible to become a new participant and all future benefit accruals for existing participants have ceased.plan.
We also have two non-qualified supplemental retirement plans (“Supplemental Plans”): the Restoration Plan, which we acquired as part of our North Pittsburgh Systems, Inc. (“North Pittsburgh”) and TXU Communications Venture Company (“TXUCV”) acquisitions, and a Supplemental Executive Retirement Plan (“SERP”), which we acquired as part of our acquisition of SureWest.. The Supplemental Plans provide supplemental retirement benefits to certain former employees by providing for incremental pension payments to partially offset the reduction of the amount that would have been payable under the qualified defined benefit pension plans if it were not for limitations imposed by federal income tax regulations. Both plansThe Supplemental Plans have previously been frozen so that no person is eligible to become a new participant in the Supplemental Plans.participant. These plans are unfunded and have no assets. The benefits paid under the Supplemental Plans are paid from the general operating funds of the Company.
The following tables summarize the change in benefit obligation, plan assets and funded status of the Retirement Plan SureWest Plan and Supplemental Plans (collectively the “Pension Plans”) as of December 31, 20132016 and 2012.2015.
F-26
| | | | | | |
(In thousands) | | 2016 | | 2015 |
Change in benefit obligation | | | | | | |
Benefit obligation at the beginning of the year | | $ | 352,206 | | $ | 381,188 |
Service cost | | | 343 | | | 410 |
Interest cost | | | 16,291 | | | 15,788 |
Actuarial loss (gain) | | | 12,935 | | | (22,951) |
Benefits paid | | | (31,383) | | | (22,229) |
Benefit obligation at the end of the year | | $ | 350,392 | | $ | 352,206 |
| | | | | | |
(In thousands) | | 2016 | | 2015 |
Change in plan assets | | | | | | |
Fair value of plan assets at the beginning of the year | | $ | 278,038 | | $ | 297,118 |
Employer contributions | | | 258 | | | 12,224 |
Actual return on plan assets | | | 16,820 | | | (9,075) |
Benefits paid | | | (31,383) | | | (22,229) |
Fair value of plan assets at the end of the year | | $ | 263,733 | | $ | 278,038 |
Funded status at year end | | $ | (86,659) | | $ | (74,168) |
Table of Contents
CONSOLIDATED COMMUNICATIONS HOLDINGS, INC. AND SUBSIDIARIES
NOTES TO CONSOLIDATED FINANCIAL STATEMENTS (continued)
YEARS ENDED DECEMBER 31, 2013, 2012 AND 2011
(In thousands) | | 2013 | | | 2012 | |
Change in benefit obligation | | | | | | |
Benefit obligation at the beginning of the year | | $ | 379,528 | | | $ | 203,413 | |
Service cost | | 743 | | | 1,184 | |
Interest cost | | 15,307 | | | 13,620 | |
Actuarial loss (gain) | | (34,315 | ) | | 32,274 | |
Benefits paid | | (21,559 | ) | | (16,529 | ) |
Acquisition of SureWest Plans | | - | | | 146,688 | |
Plan change | | (2,361 | ) | | (1,122 | ) |
Benefit obligation at the end of the year | | $ | 337,343 | | | $ | 379,528 | |
| | | | | | |
(In thousands) | | 2013 | | | 2012 | |
Change in plan assets | | | | | | |
Fair value of plan assets at the beginning of the year | | $ | 262,778 | | | $ | 142,736 | |
Employer contributions | | 11,480 | | | 15,222 | |
Actual return on plan assets | | 39,489 | | | 27,935 | |
Benefits paid | | (21,559 | ) | | (16,529 | ) |
Acquisition of SureWest Plans | | - | | | 93,414 | |
Fair value of plan assets at the end of the year | | $ | 292,188 | | | $ | 262,778 | |
Funded status at year end | | $ | (45,155 | ) | | $ | (116,750 | ) |
Amounts recognized in the consolidated balance sheets at December 31, 20132016 and 20122015 consisted of:
(In thousands) | | 2013 | | | 2012 | | |
| | | | | | | | |
(In thousands) | | | 2016 | | 2015 | |
Current liabilities | | $ | (254 | ) | | $ | (254 | ) | | $ | (245) | | $ | (245) | |
Long-term liabilities | | $ | (44,901 | ) | | $ | (116,496 | ) | | $ | (86,414) | | $ | (73,923) | |
Amounts recognized in accumulated other comprehensive loss for the years ended December 31, 20132016 and 20122015 consisted of:
| | | | | | | | |
(In thousands) | | 2013 | | | 2012 | | | 2016 | | 2015 | |
Unamortized prior service credit | | $ | (4,426 | ) | | $ | (2,523 | ) | | $ | (3,054) | | $ | (3,512) | |
Unamortized net actuarial loss | | 10,302 | | | 67,104 | | | | 83,367 | | | 72,040 | |
| | $ | 5,876 | | | $ | 64,581 | | | $ | 80,313 | | $ | 68,528 | |
The following table summarizes the components of net periodic pension cost recognized in the consolidated statements of incomeoperations for the plans for the years ended December 31, 2013, 20122016, 2015 and 2011:2014:
(In thousands) | | 2013 | | | 2012 | | | 2011 | |
Service cost | | $ | 743 | | | $ | 1,184 | | | $ | 1,277 | |
Interest cost | | 15,307 | | | 13,620 | | | 10,960 | |
Expected return on plan assets | | (20,654 | ) | | (14,728 | ) | | (10,893 | ) |
Amortization of: | | | | | | | | | |
Net actuarial loss | | 3,652 | | | 2,518 | | | 786 | |
Prior service credit | | (457 | ) | | (282 | ) | | (166 | ) |
Net periodic pension cost | | $ | (1,409 | ) | | $ | 2,312 | | | $ | 1,964 | |
F-27
| | | | | | | | | | |
(In thousands) | | 2016 | | 2015 | | 2014 | |
Service cost | | $ | 343 | | $ | 410 | | $ | 560 | |
Interest cost | | | 16,291 | | | 15,788 | | | 16,295 | |
Expected return on plan assets | | | (20,635) | | | (23,372) | | | (23,106) | |
Amortization of: | | | | | | | | | | |
Net actuarial loss | | | 5,423 | | | 4,018 | | | 20 | |
Prior service credit | | | (458) | | | (457) | | | (457) | |
Net periodic pension cost (benefit) | | $ | 964 | | $ | (3,613) | | $ | (6,688) | |
Table of Contents
CONSOLIDATED COMMUNICATIONS HOLDINGS, INC. AND SUBSIDIARIES
NOTES TO CONSOLIDATED FINANCIAL STATEMENTS (continued)
YEARS ENDED DECEMBER 31, 2013, 2012 AND 2011
The following table summarizes other changes in plan assets and benefit obligations recognized in other comprehensive loss, before tax effects, during 20132016 and 2012.2015.
| | | | | | | |
(In thousands) | | 2013 | | | 2012 | | | 2016 | | 2015 | |
Actuarial loss (gain), net | | $ | (53,149 | ) | | $ | 19,066 | | |
Actuarial loss, net | | | $ | 16,750 | | $ | 9,497 | |
Recognized actuarial loss | | (3,652 | ) | | (2,518 | ) | | | (5,423) | | | (4,018) | |
Prior service credit | | (2,361 | ) | | (1,122 | ) | |
Recognized prior service credit | | 457 | | | 282 | | | | 458 | | | 457 | |
Total amount recognized in other comprehensive loss, before tax effects | | $ | (58,705 | ) | | $ | 15,708 | | | $ | 11,785 | | $ | 5,936 | |
The estimated net actuarial loss and net prior service credit for the defined benefit pension plans that will be amortized from accumulated other comprehensive loss in net periodic benefit cost in 20142017 are $0.2$6.8 million and $(0.5) million, respectively.
The weighted-average assumptions used to determine the projected benefit obligations and net periodic benefit cost for the years ended December 31, 2013, 20122016, 2015 and 20112014 were as follows:
| | | | | | | | |
| | 2013 | | 2012 | | 2011 | | | 2016 | | 2015 | | 2014 | |
Discount rate - net periodic benefit cost | | 4.20% | | 5.00% | | 5.86% | | | 4.76 | % | 4.27 | % | 4.97 | % |
Discount rate - benefit obligation | | 4.97% | | 4.20% | | 5.35% | | | 4.27 | % | 4.76 | % | 4.27 | % |
Expected long-term rate of return on plan assets | | 8.00% | | 7.70% | | 7.50% | | | 7.75 | % | 8.00 | % | 8.00 | % |
Rate of compensation/salary increase | | 1.75% | | 1.50% | | 3.06% | | | 1.75 | % | 1.75 | % | 1.75 | % |
Other Non-qualified Deferred Compensation Agreements
We also are liable for deferred compensation agreements with former members of the board of directors and certain other former employees of a subsidiary of TXUCV, which was acquired in 2004. Thecompanies. Depending on the plan, benefits are payable in monthly or annual installments for a period of time based on the terms of the agreement which range from five years up to the life of the participant or to the beneficiary upon the death of the participant and may begin as early as age 55. Participants accrue no new benefits as these plans had previously been frozen by TXUCV’s predecessor company prior to our acquisition of TXUCV.frozen. Payments related to the deferred compensation agreements totaled approximately $0.6$0.2 million and $0.3 million for the years ended December 31, 20132016 and 2012,2015, respectively. The net present value of the remaining obligations was approximately $1.8$2.0 million and $2.2$2.1 million at December 31, 20132016 and 2012,2015, respectively, and is included in pension and post-retirement benefit obligations in the accompanying balance sheets.
We also maintain 3425 life insurance policies on certain of the participating former directors and employees. We recognized $0.3 million and $0.4$0.2 million in life insurance proceeds as other non-operating income in 2013 and 2012.2016. We did not recognize any insurance proceeds in 2015. The excess of the cash surrender value of the remaining life insurance policies over the notes payable balances related to these policies is determined by an independent consultant, and totaled $2.2 million and $2.0$2.1 million at December 31, 20132016 and 2012,2015, respectively. These amounts are included in investments in the accompanying consolidated balance sheets. Cash principal payments for the policies and any proceeds from the policies are classified as operating activities in the consolidated statements of cash flows. The aggregate death benefit payment payable under these policies totaled $7.3$6.8 million and $7.5$7.0 million as of December 31, 20132016 and 2012,2015, respectively.
Post-retirement Benefit Obligations
We sponsor avarious healthcare and life insurance planplans (“Post-retirement Plan”Plans”) that providesprovide post-retirement medical benefits and life insurance benefits to certain groups of retired employees. Certain plans have previously been frozen so that no person is eligible to become a new participant. Retirees share in the cost of healthcare benefits, making contributions that are adjusted periodically—either based upon collective bargaining agreements or because total costs of the program have changed. Covered expenses for retiree health benefits are paid as they are incurred. Post-retirement life insurance benefits are fully insured. The Post-retirement Plan isA majority of the healthcare plans are unfunded and hashave no assets, and benefits are paid from the general operating funds of the Company.
F-28
Table However, a plan acquired in the purchase of Contents
CONSOLIDATED COMMUNICATIONS HOLDINGS, INC. AND SUBSIDIARIES
NOTES TO CONSOLIDATED FINANCIAL STATEMENTS (continued)
YEARS ENDED DECEMBER 31, 2013, 2012 AND 2011
In connection with the acquisition of SureWest, we acquired its post-retirement benefit plan which provides life insurance benefits and a stated reimbursement for Medicare supplemental insurance to certain eligible retired participants. This plan has previously been frozen soanother company is funded by assets that no person is eligible to become a new participant. Employer contributions for retiree medical benefits are separately designated within the SureWestRetirement Plan pension trust for the sole purpose of providing payments of retiree medical benefits. The nature of the assets used to provide payment of retiree medical benefits is the same as that of the SureWest Plan.for this specific plan.
The following tables summarize the change in benefit obligation, plan assets and funded status of the post-retirement benefit obligations as of December 31, 20132016 and 2012.2015.
| | | | | | | | |
(In thousands) | | 2013 | | | 2012 | | | 2016 | | 2015 | |
Change in benefit obligation | | | | | | | | | | | | | |
Benefit obligation at the beginning of the year | | $ | 43,906 | | | $ | 33,184 | | | $ | 40,538 | | $ | 42,135 | |
Service cost | | 925 | | | 811 | | | | 602 | | | 601 | |
Interest cost | | 1,575 | | | 1,756 | | | | 2,019 | | | 1,713 | |
Plan participant contributions | | 757 | | | 614 | | | | 544 | | | 657 | |
Actuarial loss (gain) | | (9,552 | ) | | 5,282 | | | | 6,767 | | | (910) | |
Benefits paid | | (3,966 | ) | | (4,011 | ) | | | (4,152) | | | (3,658) | |
Amendments | | 1,448 | | | - | | |
Acquisition | | - | | | 6,270 | | |
Benefit obligation at the end of the year | | $ | 35,093 | | | $ | 43,906 | | | $ | 46,318 | | $ | 40,538 | |
(In thousands) | | 2013 | | | 2012 | |
Change in plan assets | | | | | | |
Fair value of plan assets at the beginning of the year | | $ | 3,410 | | | $ | – | |
Employer contributions | | 2,772 | | | 3,189 | |
Plan participant’s contributions | | 757 | | | 614 | |
Actual return on plan assets | | 602 | | | 197 | |
Benefits paid | | (3,966 | ) | | (4,011 | ) |
Acquisition | | – | | | 3,421 | |
Fair value of plan assets at the end of the year | | $ | 3,575 | | | $ | 3,410 | |
Funded status at year end | | $ | (31,518 | ) | | $ | (40,496 | ) |
| | | | | | | |
(In thousands) | | 2016 | | 2015 | |
Change in plan assets | | | | | | | |
Fair value of plan assets at the beginning of the year | | $ | 2,985 | | $ | 3,329 | |
Employer contributions | | | 3,608 | | | 3,001 | |
Plan participant’s contributions | | | 544 | | | 657 | |
Actual return on plan assets | | | (699) | | | (344) | |
Benefits paid | | | (4,152) | | | (3,658) | |
Fair value of plan assets at the end of the year | | $ | 2,286 | | $ | 2,985 | |
Funded status at year end | | $ | (44,032) | | $ | (37,553) | |
Amounts recognized in the consolidated balance sheets at December 31, 20132016 and 20122015 consist of:
| | | | | | | | |
(In thousands) | | 2013 | | | 2012 | | | 2016 | | 2015 | |
Current liabilities | | $ | (2,429 | ) | | $ | (2,467 | ) | | $ | (1,555) | | $ | (566) | |
Long-term liabilities | | $ | (29,089 | ) | | $ | (38,029 | ) | | $ | (42,477) | | $ | (36,987) | |
Amounts recognized in accumulated other comprehensive loss for the years ended December 31, 20132016 and 20122015 consist of:
(In thousands) | | 2013 | | | 2012 | |
Unamortized prior service cost (credit) | | $ | 183 | | | $ | (1,446 | ) |
Unamortized net actuarial loss (gain) | | (7,868 | ) | | 2,055 | |
| | $ | (7,685 | ) | | $ | 609 | |
F-29
| | | | | | | |
(In thousands) | | 2016 | | 2015 | |
Unamortized prior service credit | | $ | (4,616) | | $ | (5,137) | |
Unamortized net actuarial loss (gain) | | | 956 | | | (6,658) | |
| | $ | (3,660) | | $ | (11,795) | |
Table of Contents
CONSOLIDATED COMMUNICATIONS HOLDINGS, INC. AND SUBSIDIARIES
NOTES TO CONSOLIDATED FINANCIAL STATEMENTS (continued)
YEARS ENDED DECEMBER 31, 2013, 2012 AND 2011
The following table summarizes the components of the net periodic costs for post-retirement benefits for the years ended December 31, 2013, 20122016, 2015 and 2011:2014:
| | | | | | | | | | | |
(In thousands) | | 2013 | | | 2012 | | | 2011 | | | 2016 | | 2015 | | 2014 | |
Service cost | | $ | 925 | | | $ | 811 | | | $ | 749 | | | $ | 602 | | $ | 601 | | $ | 479 | |
Interest cost | | 1,575 | | | 1,756 | | | 1,690 | | | | 2,019 | | | 1,713 | | | 1,565 | |
Expected return on plan assets | | (233 | ) | | (105 | ) | | – | | | | (148) | | | (150) | | | (223) | |
Amortization of: | | | | | | | | | | | | | | | | | | | |
Net actuarial loss (gain) | | – | | | – | | | (212 | ) | |
Net actuarial gain | | | | — | | | (134) | | | (563) | |
Prior service credit | | (180 | ) | | (189 | ) | | (189 | ) | | | (521) | | | (622) | | | (37) | |
Net periodic postretirement benefit cost | | $ | 2,087 | | | $ | 2,273 | | | $ | 2,038 | | | $ | 1,952 | | $ | 1,408 | | $ | 1,221 | |
The following table summarizes other changes in plan assets and benefit obligations recognized in other comprehensive loss, before tax effects, during 20132016 and 2012:2015:
| | | | | | | | |
(In thousands) | | 2013 | | | 2012 | | | 2016 | | 2015 | |
Actuarial loss (gain), net | | $ | (9,922 | ) | | $ | 5,191 | | | $ | 7,614 | | $ | (417) | |
Prior service cost | | 1,448 | | | – | | |
Recognized actuarial gain | | | | — | | | 134 | |
Recognized prior service credit | | 180 | | | 189 | | | | 521 | | | 622 | |
Total amount recognized in other comprehensive loss, before tax effects | | $ | (8,294 | ) | | $ | 5,380 | | | $ | 8,135 | | $ | 339 | |
The estimated net actuarial gain and net prior service credit that will be amortized from accumulated other comprehensive loss into net periodic postretirement cost in 20142017 is approximately $(0.5) million and $(0.2) million, respectively.$0.5 million. In 2017, there is not expected to be any amortization of the unamortized net actuarial loss in net periodic postretirement cost.
The weighted-average discount rate assumptions utilized for the years ended December 31 were as follows:
| | | | | | | | |
| | 2013 | | 2012 | | 2011 | | | 2016 | | 2015 | | 2014 | |
Net periodic benefit cost | | 4.00% | | 5.00% | | 5.58% | | | 4.61 | % | 4.11 | % | 4.55 | % |
Benefit obligation | | 4.40% | | 3.90% | | 5.22% | | | 4.12 | % | 4.61 | % | 4.11 | % |
For purposes of determining the cost and obligation for pre-Medicare postretirementpost-retirement medical benefits, a 7.50% annual rate of increase in the per capita cost of covered benefits (i.e., healthcare trend rate) was assumed for the plan in 2014, 2016,
declining to a rate of 5.00% in 2020.2022. Assumed healthcare cost trend rates have a significant effect on the amounts reported for healthcare plans. A one percent change in the assumed healthcare cost trend rate would have had the following effects:
| | | | | | | | |
(In thousands) | | 1% Increase | | | 1% Decrease | | | 1% Increase | | 1% Decrease | |
Effect on total of service and interest cost | | $ | 277 | | | $ | (230 | ) | | $ | 185 | | $ | (160) | |
Effect on postretirement benefit obligation | | $ | 2,063 | | | $ | (1,852 | ) | | $ | 2,429 | | $ | (2,157) | |
Plan Assets
Our investment strategy is designed to provide a stable environment to earn a rate of return over time to satisfy the benefit obligations and minimize the reliance on contributions as a source of benefit security. The objectives are based on a long-term (5 to 15 year) investment horizon, so that interim fluctuations should be viewed with appropriate perspective. The assets of the fund are to be invested to achieve the greatest return for the pension plans consistent with a prudent level of risk.
The asset return objective is to achieve, as a minimum over time, the passively managed return earned by managed index funds, weighted in the proportions outlined by the asset class exposures identified in the pension plan’s strategic allocation. We update our long-term, strategic asset allocations every few years to ensure they are in line with our fund objectives. The target allocation of the Pension Plan assets is approximately 50% - 60% in equities with the remainder in fixed income funds and cash equivalents. Currently, we believe that there are no significant concentrations of risk associated with the pension plan assets.
The following is a description of the valuation methodologies for assets measured at fair value utilizing the fair value hierarchy discussed in Note 1, which prioritizes the inputs used in the valuation methodologies in measuring fair value. The fair value measurements used to value our plan assets as of December 31, 20132016 were generated by
F-30
Table of Contents
CONSOLIDATED COMMUNICATIONS HOLDINGS, INC. AND SUBSIDIARIES
NOTES TO CONSOLIDATED FINANCIAL STATEMENTS (continued)
YEARS ENDED DECEMBER 31, 2013, 2012 AND 2011
using market transactions involving identical or comparable assets. There were no changes in the valuation techniques used during 2013.2016.
Equity securities includeIn 2016, we retrospectively adopted ASU 2015-07, as discussed in Note 1, and as a result, we have removed investments in commonthat are measured using NAV per share as a practical expedient from the fair value hierarchy and preferred stocks, mutual funds, common collective trusts and other commingled investment funds.restated prior period amounts accordingly.
Common and Preferred Stocks: Includes domestic and international common and preferred stocks and are valued at the closing price as of the measurement date as reported on the active market on which the individual securities are traded multiplied by the number of shares owned.traded.
Mutual Funds: Valued at the daily closing net asset value as ofNAV based on the measurement date asclosing price reported on the active market on which the funds are traded multiplied by the number of shares owned or the percentage of ownership in the fund.traded.
Common Collective Trusts and Commingled Funds: Valued as determined by the fund manager based on the underlying net asset values and supported by the value of the underlying securities as of the financial statement date.
Fixed income funds include U.S. Treasury and Government Agency securities, corporate and municipal bonds, and mortgage-backed securities.
U.S. Treasury and Government Agency Securities:Valued at the closing net asset value as of the measurement date asprice reported on the active market on which the fundsindividual securities are traded multiplied by the number of shares owned or the percentage of ownership in the fund.(Level 1). Government issued mortgage-backed securities are valued based on external pricing indices ( Level 2).
Corporate and municipal bonds and mortgage-backed securities:Municipal Bonds: Valued based on yields currently available on comparable securities of issuers with similar credit ratings.
Mortgage/Asset-backed Securities: Valued based on market prices from external pricing indices based on recent market activity.
Common Collective Trusts and Commingled Funds: Units in the fund are valued based on the NAV of the funds, which is based on the fair value of the underlying investments held by the fund less its liabilities as reported by the issuer of the fund. The NAV per share is used as a practical expedient to estimate fair value. This practical expedient is not used when it is determined to be probable that the fund will sell the investment for an amount different than the reported net asset value. These investments have no unfunded commitments, are redeemable daily or monthly and have redemption notice periods of up to 10 days.
The fair values of our assets for our defined benefit pension plans at December 31, 20132016 and 2012,2015, by asset category were as follows:
| | | | | | | | | | | | | |
| | | | | | As of December 31, 2016 | |
| | | | | | Quoted Prices | | Significant | | | |
| | | | | | In Active | | Other | | Significant | |
| | | | As of December 31, 2013 | | | | | Markets for | | Observable | | Unobservable | |
| | | | Quoted Prices
In Active
Markets for
Identical Assets | | Significant
Other
Observable
Inputs | | Significant
Unobservable
Inputs | | | | | | Identical Assets | | Inputs | | Inputs | |
(In thousands) | | Total | | (Level 1) | | (Level 2) | | (Level 3) | | | Total | | (Level 1) | | (Level 2) | | (Level 3) | |
| | | | | | | | | | |
Cash equivalents: | | | | | | | | | | |
Short-term investments(1) | | $ | 4,708 | | $ | 2,835 | | $ | 1,873 | | $ | – | | |
| | | | | | | | | | |
Cash and cash equivalents | | | $ | 671 | | $ | 671 | | $ | — | | $ | — | |
Equities: | | | | | | | | | | | | | | | | | | | | | |
Stocks: | | | | | | | | | | | | | | | | | | | | | |
U.S. common stocks | | 38,463 | | 38,463 | | – | | – | | | | 23,285 | | | 23,285 | | | — | | | — | |
International stocks | | 10,198 | | 10,198 | | – | | – | | | | 8,756 | | | 8,756 | | | — | | | — | |
Funds: | | | | | | | | | | | | | | | | | | | | | |
U.S. small cap | | 15,181 | | – | | 15,181 | | – | | |
U.S. mid cap | | 9,215 | | 9,215 | | – | | – | | | | 9,294 | | | 9,294 | | | — | | | — | |
U.S. large cap | | 34,535 | | 11,101 | | 23,434 | | – | | | | 7,564 | | | 7,564 | | | — | | | — | |
Emerging markets | | 20,225 | | 12,855 | | 7,370 | | – | | | | 14,382 | | | 14,382 | | | — | | | — | |
International | | 60,416 | | 44,132 | | 16,284 | | – | | | | 47,784 | | | 47,784 | | | — | | | — | |
| | | | | | | | | | |
Fixed Income: | | | | | | | | | | | | | | | | | | | | | |
U.S. treasury and government agency securities | | 19,012 | | 19,012 | | – | | – | | | | 16,821 | | | 8,794 | | | 8,027 | | | — | |
Corporate and municipal bonds | | 8,624 | | – | | 8,624 | | – | | | | 6,712 | | | — | | | 6,712 | | | — | |
Mortgage/asset-backed securities | | 8,116 | | – | | 8,116 | | – | | | | 4,171 | | | — | | | 4,171 | | | — | |
Common Collective Trust | | 17,398 | | – | | 17,398 | | | | |
Mutual funds | | 46,097 | | 46,097 | | – | | – | | | | 20,055 | | | 20,055 | | | — | | | — | |
Total | | $ | 292,188 | | $ | 193,908 | | $ | 98,280 | | $ | – | | |
Total plan assets in the fair value hierarchy | | | | 159,495 | | $ | 140,585 | | $ | 18,910 | | $ | — | |
Common Collective Trusts measured at NAV: (1) | | | | | | | | | | | | | | |
Short-term investments (2) | | | | 7,330 | | | | | | | | | |
Equities: | | | | | | | | | | | | | |
U.S. small cap | | | | 10,093 | | | | | | | | | |
U.S. large cap | | | | 14,064 | | | | | | | | | |
Emerging markets | | | | 7,865 | | | | | | | | | |
International | | | | 15,434 | | | | | | | | | |
Fixed Income | | | | 52,340 | | | | | | | | | |
Total plan assets | | | | 266,621 | | | | | | | | | | |
Other liabilities (3) | | | | (2,888) | | | | | | | | | |
Net plan assets | | | $ | 263,733 | | | | | | | | | | |
| | | | | | | | | | | | | |
| | | | | As of December 31, 2015 | |
| | | | | Quoted Prices | | Significant | | | | |
| | | | | In Active | | Other | | Significant | |
| | | | | Markets for | | Observable | | Unobservable | |
| | | | | Identical Assets | | Inputs | | Inputs | |
(In thousands) | | Total | | (Level 1) | | (Level 2) | | (Level 3) | |
Cash and cash equivalents | | $ | 1,692 | | $ | 1,692 | | $ | — | | $ | — | |
Equities: | | | | | | | | | | | | | |
Stocks: | | | | | | | | | | | | | |
U.S. common stocks | | | 27,192 | | | 27,192 | | | — | | | — | |
International stocks | | | 9,173 | | | 9,173 | | | — | | | — | |
Funds: | | | | | | | | | | | | | |
U.S. mid cap | | | 7,956 | | | 7,956 | | | — | | | — | |
U.S. large cap | | | 8,297 | | | 8,297 | | | — | | | — | |
Emerging markets | | | 12,822 | | | 12,822 | | | — | | | — | |
International | | | 47,966 | | | 47,966 | | | — | | | — | |
Fixed Income: | | | | | | | | | | | | | |
U.S. treasury and government agency securities | | | 16,859 | | | 8,895 | | | 7,964 | | | — | |
Corporate and municipal bonds | | | 6,540 | | | — | | | 6,540 | | | — | |
Mortgage/asset-backed securities | | | 5,910 | | | — | | | 5,910 | | | — | |
Mutual funds | | | 24,871 | | | 24,871 | | | — | | | — | |
Total plan assets in the fair value hierarchy | | | 169,278 | | $ | 148,864 | | $ | 20,414 | | $ | — | |
Common Collective Trusts measured at NAV: (1) | | | | | | | | | | | | | |
Short-term investments (2) | | | 5,028 | | | | | | | | | | |
Equities: | | | | | | | | | | | | | |
U.S. small cap | | | 11,018 | | | | | | | | | | |
U.S. large cap | | | 13,822 | | | | | | | | | | |
Emerging markets | | | 6,588 | | | | | | | | | | |
International | | | 15,696 | | | | | | | | | | |
Fixed Income | | | 58,882 | | | | | | | | | | |
Total plan assets | | | 280,312 | | | | | | | | | | |
Other liabilities (3) | | | (2,274) | | | | | | | | | | |
Net plan assets | | $ | 278,038 | | | | | | | | | | |
| (1) | | Certain investments that are measured at fair value using the NAV per share as a practical expedient have not been categorized in the fair value hierarchy. The fair value amounts presented in these tables are intended to permit reconciliation of the fair value hierarchy to the total plan assets. |
| (2) | | Short-term investments include an investment in a common collective trust which is principally comprised of certificates of deposit, commercial paper and U.S. Treasury bills with maturities less than one year. |
| (3) | | Net amount due for securities purchased and sold. |
CONSOLIDATED COMMUNICATIONS HOLDINGS, INC. AND SUBSIDIARIES
NOTES TO CONSOLIDATED FINANCIAL STATEMENTS (continued)
YEARS ENDED DECEMBER 31, 2013, 2012 AND 2011F-34
| | | | As of December 31, 2012 |
| | | | Quoted Prices
In Active
Markets for
Identical Assets | | Significant
Other
Observable
Inputs | | Significant
Unobservable
Inputs | |
(In thousands) | | Total | | (Level 1) | | (Level 2) | | (Level 3) | |
| | | | | | | | | |
Cash equivalents: | | | | | | | | | |
Short-term investments(1) | | $ | 4,262 | | $ | 1,036 | | $ | 3,226 | | $ | – | |
| | | | | | | | | |
Equities: | | | | | | | | | |
Stocks: | | | | | | | | | |
U.S. common stocks | | 36,620 | | 36,620 | | – | | – | |
International stocks | | 9,589 | | 9,589 | | – | | – | |
Funds: | | | | | | | | | |
U.S. small cap | | 17,110 | | – | | 17,110 | | – | |
U.S. mid cap | | 7,477 | | 7,477 | | – | | – | |
U.S. large cap | | 35,130 | | 12,932 | | 22,198 | | – | |
Emerging markets | | 7,807 | | 7,807 | | – | | – | |
International | | 43,100 | | 34,602 | | 8,498 | | – | |
| | | | | | | | | |
Fixed Income: | | | | | | | | | |
U.S. treasury and government agency securities | | 22,937 | | 22,937 | | – | | – | |
Corporate and municipal bonds | | 9,238 | | – | | 9,238 | | – | |
Mortgage/asset-backed securities | | 10,669 | | – | | 10,669 | | – | |
Common Collective Trust | | 7,346 | | | | 7,346 | | | |
Mutual funds | | 51,493 | | 51,493 | | – | | – | |
Total | | $ | 262,778 | | $ | 184,493 | | $ | 78,285 | | $ | – | |
(1)Short-term investments includes cash and cash equivalents and an investment in a common collective trust which is principally comprised of certificates of deposit, commercial paper and U.S. Treasury bills with maturities less than one year.
F-32
CONSOLIDATED COMMUNICATIONS HOLDINGS, INC. AND SUBSIDIARIES
NOTES TO CONSOLIDATED FINANCIAL STATEMENTS (continued)
YEARS ENDED DECEMBER 31, 2013, 2012 AND 2011
The fair values of our assets for our post-retirement benefit plans at December 31, 20132016 and 20122015 were as follows:
| | | | | | | | | | | | | |
| | | | | As of December 31, 2016 | |
| | | | | Quoted Prices | | Significant | | | | |
| | | | | In Active | | Other | | Significant | |
| | | | As of December 31, 2013 | | | | | Markets for | | Observable | | Unobservable | |
| | | | Quoted Prices
In Active
Markets for
Identical Assets | | Significant
Other
Observable
Inputs | | Significant
Unobservable
Inputs | | | | | Identical Assets | | Inputs | | Inputs | |
(In thousands) | | Total | | (Level 1) | | (Level 2) | | (Level 3) | | | Total | | (Level 1) | | (Level 2) | | (Level 3) | |
| | | | | | | | | | |
Cash equivalents: | | | | | | | | | | |
Short-term investments(1) | | $ | 89 | | $ | 89 | | $ | – | | $ | – | | |
| | | | | | | | | | |
Cash and cash equivalents | | | $ | 6 | | $ | 6 | | $ | — | | $ | — | |
Equities: | | | | | | | | | | | | | | | | | | | | | | |
U.S. common stocks | | 592 | | 592 | | – | | – | | | | 225 | | | 225 | | | — | | | — | |
International stocks | | | | 84 | | | 84 | | | — | | | — | |
Funds: | | | | | | | | | | | | | | | | | | | | | | |
U.S. mid cap | | | | 90 | | | 90 | | | — | | | | |
U.S. large cap | | | | 73 | | | 73 | | | — | | | — | |
Emerging markets | | | | 139 | | | 139 | | | — | | | — | |
International | | | | 462 | | | 462 | | | — | | | — | |
Fixed Income: | | | | | | | | | | | | | | |
U.S. treasury and government agency securities | | | | 163 | | | 85 | | | 78 | | | — | |
Corporate and municipal bonds | | | | 65 | | | — | | | 65 | | | — | |
Mortgage/asset-backed securities | | | | 40 | | | — | | | 40 | | | — | |
Mutual funds | | | | 194 | | | 194 | | | — | | | — | |
Total plan assets in the fair value hierarchy | | | | 1,541 | | $ | 1,358 | | $ | 183 | | $ | — | |
Common Collective Trusts measured at NAV: (1) | | | | | | | | | | | | | | |
Short-term investments (2) | | | | 71 | | | | | | | | | | |
Equities: | | | | | | | | | | | | | | |
U.S. small cap | | 215 | | – | | 215 | | – | | | | 98 | | | | | | | | | | |
U.S. large cap | | 638 | | – | | 638 | | – | | | | 136 | | | | | | | | | | |
Emerging markets | | 263 | | – | | 263 | | – | | | | 76 | | | | | | | | | | |
International | | 938 | | 357 | | 581 | | – | | | | 149 | | | | | | | | | | |
| | | | | | | | | | |
Fixed Income: | | | | | | | | | | |
U.S. treasury and government agency securities | | 678 | | 678 | | – | | – | | |
Corporate and municipal bonds | | 308 | | – | | 308 | | – | | |
Mortgage/asset-backed securities | | 289 | | – | | 289 | | – | | |
Total investments | | $ | 4,010 | | $ | 1,716 | | $ | 2,294 | | $ | – | | |
Fixed Income | | | | 506 | | | | | | | | | | |
Total plan assets | | | | 2,577 | | | | | | | | | | |
Benefit payments payable | | (434) | | | | | | | | | | (263) | | | | | | | | | | |
Other liabilities (3) | | | | (28) | | | | | | | | | | |
Net plan assets | | $ | 3,576 | | | | | | | | | $ | 2,286 | | | | | | | | | | |
| | | | As of December 31, 2012 |
| | | | Quoted Prices
In Active
Markets for
Identical Assets | | Significant
Other
Observable
Inputs | | Significant
Unobservable
Inputs | |
(In thousands) | | Total | | (Level 1) | | (Level 2) | | (Level 3) | |
| | | | | | | | | |
Cash equivalents: | | | | | | | | | |
Short-term investments(1) | | $ | 30 | | $ | 30 | | $ | – | | $ | – | |
| | | | | | | | | |
Equities: | | | | | | | | | |
U.S. common stocks | | 545 | | 545 | | – | | – | |
Funds: | | | | | | | | | |
U.S. small cap | | 238 | | – | | 238 | | – | |
U.S. large cap | | 572 | | – | | 572 | | – | |
International | | 576 | | 289 | | 287 | | – | |
| | | | | | | | | |
Fixed Income: | | | | | | | | | |
U.S. treasury and government agency securities | | 776 | | 776 | | – | | – | |
Corporate and municipal bonds | | 312 | | – | | 312 | | – | |
Mortgage/asset-backed securities | | | 361 | | | – | | | 361 | | | – | |
Total | | $ | 3,410 | | $ | 1,640 | | $ | 1,770 | | $ | – | |
| | | | | | | | | | | | | |
| | | | | As of December 31, 2015 | |
| | | | | Quoted Prices | | Significant | | | | |
| | | | | In Active | | Other | | Significant | |
| | | | | Markets for | | Observable | | Unobservable | |
| | | | | Identical Assets | | Inputs | | Inputs | |
(In thousands) | | Total | | (Level 1) | | (Level 2) | | (Level 3) | |
Cash and cash equivalents | | $ | 20 | | $ | 20 | | $ | — | | $ | — | |
Equities: | | | | | | | | | | | | | |
U.S. common stocks | | | 315 | | | 315 | | | — | | | — | |
International stocks | | | 106 | | | 106 | | | — | | | — | |
Funds: | | | | | | | | | | | | | |
U.S. mid cap | | | 92 | | | 92 | | | — | | | — | |
U.S. large cap | | | 96 | | | 96 | | | — | | | — | |
Emerging markets | | | 148 | | | 148 | | | — | | | — | |
International | | | 555 | | | 555 | | | — | | | — | |
Fixed Income: | | | | | | | | | | | | | |
U.S. treasury and government agency securities | | | 195 | | | 103 | | | 92 | | | — | |
Corporate and municipal bonds | | | 75 | | | — | | | 75 | | | — | |
Mortgage/asset-backed securities | | | 69 | | | — | | | 69 | | | — | |
Mutual funds | | | 288 | | | 288 | | | — | | | — | |
Total plan assets in the fair value hierarchy | | | 1,959 | | $ | 1,723 | | $ | 236 | | $ | — | |
Common Collective Trusts measured at NAV: (1) | | | | | | | | | | | | | |
Short-term investments (2) | | | 58 | | | | | | | | | | |
Equities: | | | | | | | | | | | | | |
U.S. small cap | | | 127 | | | | | | | | | | |
U.S. large cap | | | 160 | | | | | | | | | | |
Emerging markets | | | 76 | | | | | | | | | | |
International | | | 181 | | | | | | | | | | |
Fixed Income | | | 681 | | | | | | | | | | |
Total plan assets | | | 3,242 | | | | | | | | | | |
Benefit payments payable | | | (230) | | | | | | | | | | |
Other liabilities (3) | | | (27) | | | | | | | | | | |
Net plan assets | | $ | 2,985 | | | | | | | | | | |
| (1) | | Certain investments that are measured at fair value using NAV per share as a practical expedient have not been categorized in the fair value hierarchy. The fair value amounts presented in these tables are intended to permit reconciliation of the fair value hierarchy to the total plan assets. |
| (2) | | Short-term investments include investment in a common collective trust which is principally comprised of certificates of deposit, commercial paper and U.S. Treasury bills with maturities less than one year. |
| (3) | | Net amount due for securities purchased and sold. |
(1)Short-term investments includes cash and cash equivalents and an investment in a common collective trust which is principally comprised of certificates of deposit, commercial paper and U.S. Treasury bills with maturities less than one year.Cash Flows
Cash Flows
Contributions
Our funding policy is to contribute annually an actuarially determined amount necessary to meet the minimum funding requirements as set forth in employee benefit and tax laws. We expect to contribute approximately $12.1$2.9 million to our pension plans and $2.5$3.9 million to our other post-retirement plans in 2014.2017.
F-33
CONSOLIDATED COMMUNICATIONS HOLDINGS, INC. AND SUBSIDIARIES
NOTES TO CONSOLIDATED FINANCIAL STATEMENTS (continued)
YEARS ENDED DECEMBER 31, 2013, 2012 AND 2011
Estimated Future Benefit Payments
As of December 31, 2013,2016, benefit payments expected to be paid over the next ten years are outlined in the following table:
| | | | Other | |
| | Pension | | Post-retirement | |
(In thousands) | | Plans | | Plans | |
2014 | | $ | 22,413 | | $ | 3,495 | |
2015 | | 22,827 | | 3,574 | |
2016 | | 23,164 | | 3,615 | |
2017 | | 23,274 | | 2,806 | |
2018 | | 23,245 | | 2,820 | |
2019 - 2023 | | 116,421 | | 12,867 | |
| | | | | | | |
| | | | | | | |
| | | | | Other | |
| | Pension | | Post-retirement | |
(In thousands) | | Plans | | Plans | |
2017 | | $ | 23,667 | | $ | 3,872 | |
2018 | | | 23,594 | | | 4,016 | |
2019 | | | 23,590 | | | 4,077 | |
2020 | | | 23,565 | | | 4,058 | |
2021 | | | 23,409 | | | 3,886 | |
2022 - 2026 | | | 113,431 | | | 16,111 | |
Defined Contribution Plans
We offer defined contribution 401(k) plans to substantially all of our employees. Contributions made under the defined contribution plans include a match, at the Company’s discretion, of employee contributions to the plans. We recognized expense with respect to these plans of $5.2$6.5 million, $3.9$6.9 million and $2.5$5.3 million in 2013, 20122016, 2015 and 2011,2014, respectively. The increase in expense in 2013 and 2012 was2015 is attributable to the acquisition of SureWest in 2012.Enventis which accounted for $1.8 million of the total expense.
10.INCOME TAXES
Income tax expense (benefit) consists of the following components:
| | | | | | | | | | | |
| | For the Year Ended | | | For the Year Ended | |
(In thousands) | | 2013 | | 2012 | | 2011 | | | 2016 | | 2015 | | 2014 | |
| | | | | | | | | | | | | | | | | |
Current: | | | | | | | | | | | | | | | | | |
Federal | | $ | 1,381 | | $ | 340 | | $ | 4,118 | | | $ | 1,390 | | $ | (3,708) | | $ | 1,769 | |
State | | 86 | | 1,078 | | 477 | | | | 709 | | | 655 | | | 1,014 | |
Total current expense (benefit) | | 1,467 | | 1,418 | | 4,595 | | | | 2,099 | | | (3,053) | | | 2,783 | |
| | | | | | | | | | | | | | | | | |
Deferred: | | | | | | | | | | | | | | | | | |
Federal | | 15,929 | | 1,998 | | 8,209 | | | | 20,087 | | | 4,321 | | | 8,136 | |
State | | 116 | | (2,755) | | 337 | | | | 776 | | | 1,507 | | | 2,108 | |
Total deferred expense (benefit) | | 16,045 | | (757) | | 8,546 | | |
Total deferred expense | | | | 20,863 | | | 5,828 | | | 10,244 | |
Total income tax expense | | $ | 17,512 | | $ | 661 | | $ | 13,141 | | | $ | 22,962 | | $ | 2,775 | | $ | 13,027 | |
The following is a reconciliation of the federal statutory tax rate to the effective tax rate for the years ended December 31, 2013, 20122016, 2015 and 2011:2014:
| | | | | | | | |
| | Year Ended December 31, | | | For the Year Ended | |
(In percentages) | | 2013 | | 2012 | | 2011 | | | 2016 | | 2015 | | 2014 | |
| | | | | | | | | | | | | | |
Statutory federal income tax rate | | 35.0 | | 35.0 | | 35.0 | | | 35.0 | % | 35.0 | % | 35.0 | % |
State income taxes, net of federal benefit | | 1.7 | | (12.8) | | 0.5 | | | 2.9 | | (37.9) | | 1.2 | |
Transaction costs | | – | | 14.9 | | – | | | - | | - | | 2.6 | |
Other permanent differences | | – | | (1.1) | | (0.9) | | | 0.9 | | 10.8 | | 0.4 | |
Change in uncertain tax positions | | (1.7) | | – | | (0.7) | | | - | | (8.2) | | - | |
Change in deferred tax rate | | – | | (19.7) | | 1.1 | | | (4.0) | | 91.9 | | 7.4 | |
Valuation allowance | | | 1.6 | | 43.4 | | (0.7) | |
Provision to return | | 1.3 | | (4.2) | | – | | | 0.3 | | (1.5) | | - | |
Sale of stock in subsidiary | | | 19.1 | | - | | - | |
Non deductible goodwill | | | 3.8 | | - | | - | |
Other | | 0.6 | | (0.4) | | 0.1 | | | 0.6 | | (1.6) | | (0.1) | |
| | 36.9 | | 11.7 | | 35.1 | | | 60.2 | % | 131.9 | % | 45.8 | % |
F-34
Deferred Taxes
CONSOLIDATED COMMUNICATIONS HOLDINGS, INC. AND SUBSIDIARIESIn November 2015, the FASB issued the Accounting Standards Update No. 2015-17,
NOTES TO CONSOLIDATED FINANCIAL STATEMENTS (continued)Balance Sheet Classification of Deferred Taxes
YEARS ENDED DECEMBER(“ASU 2015-17”). ASU 2015-17 requires that all deferred tax liabilities and tax assets, and any related valuation allowance, be classified as non-current in a classified balance sheet. The classification change simplifies the Company’s process as it eliminates the need to separately identify the net current and net non-current deferred tax asset or liability in each jurisdiction and allocate valuation allowances. ASU 2015-17 is effective for annual and interim periods beginning after December 15, 2016, with early adoption permitted, and may be applied either prospectively or retrospectively. We early adopted this guidance prospectively as of December 31, 2013, 2012 AND 20112015, and as a result, we have classified all net deferred tax liabilities as non-current in the consolidated balance sheet at December 31, 2016 and 2015.
Deferred Taxes
The components of the net deferred tax liability are as follows:
| | | | | | | | |
| | Year Ended December 31, | | | Year Ended December 31, | |
(In thousands) | | 2013 | | 2012 | | | 2016 | | 2015 | |
| | | | | | | | | | | | |
Current deferred tax assets: | | | | | | |
Non-current deferred tax assets: | | | | | | | | |
Reserve for uncollectible accounts | | $ | 615 | | $ | 1,815 | | | $ | 1,090 | | $ | 1,268 | |
Accrued vacation pay deducted when paid | | 2,196 | | 1,727 | | | | 2,286 | | | 2,112 | |
Accrued expenses and deferred revenue | | 5,149 | | 5,458 | | | | 7,687 | | | 9,051 | |
| | 7,960 | | 9,000 | | |
Non-current deferred tax assets: | | | | | | |
Net operating loss carryforwards | | 18,809 | | 32,506 | | | | 13,068 | | | 31,695 | |
Pension and postretirement obligations | | 28,072 | | 60,252 | | | | 50,353 | | | 44,266 | |
Stock-based compensation | | 495 | | 450 | | |
Share-based compensation | | | | 189 | | | 268 | |
Derivative instruments | | 1,004 | | 3,004 | | | | 80 | | | 421 | |
Financing costs | | 1,503 | | 567 | | | | 492 | | | 310 | |
Tax credit carryforwards | | 3,143 | | 2,437 | | | | 5,383 | | | 3,973 | |
Other | | - | | 305 | | | | 22 | | | 23 | |
| | 53,026 | | 99,521 | | | | 80,650 | | | 93,387 | |
Valuation allowance | | (535) | | (535) | | | | (1,775) | | | (2,652) | |
Net non-current deferred tax assets | | 52,491 | | 98,986 | | | | 78,875 | | | 90,735 | |
| | | | | | | | | | | | |
Non-current deferred tax liabilities: | | | | | | | | | | | | |
Goodwill and other intangibles | | (28,515) | | (27,376) | | | | (36,558) | | | (38,658) | |
Basis in investment | | (38) | | (120) | | | | (38) | | | (39) | |
Partnership investments | | (25,523) | | (26,413) | | | | (22,360) | | | (22,058) | |
Property, plant and equipment | | (178,274) | | (182,578) | | | | (264,217) | | | (266,509) | |
| | (232,350) | | (236,487) | | | | (323,173) | | | (327,264) | |
Net non-current deferred taxes | | (179,859) | | (137,501) | | | $ | (244,298) | | $ | (236,529) | |
Net deferred income tax liabilities | | $ | (171,899) | | $ | (128,501) | | |
Deferred income taxes are provided for the temporary differences between assets and liabilities recognized for financial reporting purposes and assets and liabilities recognized for tax purposes. The ultimate realization of deferred tax assets depends upon taxable income during the future periods in which those temporary differences become deductible. To determine whether deferred tax assets can be realized, management assesses whether it is more likely than not that some portion or all of the deferred tax assets will not be realized, taking into consideration the scheduled reversal of deferred tax liabilities, projected future taxable income and tax-planning strategies.
Based upon historical taxable income, taxable temporary differences, available and prudent tax planning strategies and projections for future pre-tax book income over the periods that the deferred tax assets are deductible, management believes it is more likely than not that the Company will realize the benefits of these temporary differences. However, management may reduce the amount of deferred tax assets it considers realizable in the near term if estimates of future taxable income during the carryforward period are reduced. Estimates of future taxable income are based on the estimated recognition of taxable temporary differences, available and prudent tax planning strategies and projections of future pre-tax book income. The amount of estimated future taxable income is expected to allow for the full utilization of the net operating loss (“NOL”) carryforward, partial utilization of the state NOL carryforwards and partial utilization of the state credit carryforwards, as described below.
Consolidated and its wholly owned subsidiaries, which file a consolidated federal income tax return, estimates it has available federal NOL carryforwards atas of December 31, 2013,2016 of $43.0$20.7 million and related deferred tax assets of $15.0
$7.2 million. The amount of federal NOL carryforwards and related deferred tax assets for which a benefit would be recorded in additional paid-in capital (“APIC”) when realized is $5.8 million and $2.0 million, respectively. The federal NOL carryforwards expire in 2035.
ETFL, a nonconsolidated subsidiary for federal income tax return purposes, estimates it has available NOL carryforwards as of December 31, 2016 of $1.6 million and related deferred tax assets of $0.6 million. ETFL’s federal NOL carryforwards expire from 20262021 to 2032.2024.
We estimate that we have available state NOL carryforwards as of December 31, 2016 of $154.9 million and related deferred tax assets of $7.5 million. The amount of state NOL carryforwards and related deferred tax assets for which a benefit would be recorded in APIC when realized is $9.4 million and less than $0.2 million, respectively. The state NOL carryforwards expire from 2017 to 2035. Management believes that the future utilizationit is more likely than not that we will not be able to realize state NOL carryforwards of $1.5$11.1 million and related deferred tax asset of $0.5 million subject to Separate Return Limitation Year is uncertain and hashave placed a full valuation allowance on this amount of the available federal NOL carryforwards.amount. The related NOL carryforward expires in 2026. The valuation allowance was recorded as a result of the acquisition of
F-35
Table of Contents
CONSOLIDATED COMMUNICATIONS HOLDINGS, INC. AND SUBSIDIARIES
NOTES TO CONSOLIDATED FINANCIAL STATEMENTS (continued)
YEARS ENDED DECEMBER 31, 2013, 2012 AND 2011
SureWest during 2012.carryforwards expire from 2017 to 2035. If or when recognized, the tax benefits related to any reversal of the valuation allowance will be accounted for as a reduction of income tax expense.
ETFL, a nonconsolidated subsidiary for federal income tax return purposes, estimates it has available NOL carryforwards at December 31, 2013, of $2.3 million and related deferred tax assets of $0.8 million. ETFL’s federal NOL carryforwards expire from 2020 to 2024.
We estimate that we have available state NOL carryforwards at December 31, 2013, of $85.8 million and related deferred tax assets of $2.9 million. The state NOL carryforwards expire from 2016 to 2033.
We estimate that we have available federal alternative minimum tax (“AMT”) credit carryforwards atas of December 31, 2013,2016 of $0.5$2.2 million and related deferred tax assets of $0.5$2.2 million. The AMT credits are available to offset future tax liabilities only to the extent that the Company has regular tax liabilities in excess of AMT tax liabilities. The federal AMT credit carryforward does not expire.
We estimate that we have available state tax credit carryforwards atas of December 31, 2013,2016 of $4.1$5.0 million and related deferred tax assets of $2.7$3.3 million. The state tax credit carryforwardcarryforwards are limited annually and expire from 20162017 to 2027. Management believes that it is more likely than not that we will not be able to realize state tax carryforwards of $2.0 million and related deferred tax asset of $1.3 million and has placed a valuation allowance on this amount. The related state tax credit carryforwards expires from 2017 to 2021. If or when recognized, the tax benefits related to any reversal of the valuation allowance will be accounted for as a reduction of income tax expense.
On September 13, 2013, Treasury and the Internal Revenue Service issued final regulations regarding the deduction and capitalization of expenditures related to tangible property. The final regulations under Internal Revenue Code Sections 162, 167 and 263(a) apply to amounts paid to acquire, produce, or improve tangible property as well as dispositions of such property and are generally effective for tax years beginning on or after January 1, 2014. We have evaluated these regulations and we do not expect they will have a material impact on our consolidated results of operations, cash flows or financial position.
Unrecognized Tax Benefits
Under the accounting guidance applicable to uncertainty in income taxes, we have analyzed filing positions in all of the federal and state jurisdictions where we are required to file income tax returns as well as all open tax years in these jurisdictions. This accounting guidance clarifies the accounting for uncertainty in income taxes recognized in a company’s financial statements; prescribes a recognition threshold and measurement attribute for the financial statement recognition and measurement of a tax position taken or expected to be taken in a tax return; and provides guidance on description, classification, interest and penalties, accounting in interim periods, disclosure and transition.
Our unrecognized tax benefits as of December 31, 20132016 and 20122015 were $0 and $1.2 million, respectively. Due$0.1 million. The net amount of unrecognized benefits that, if recognized, would result in an impact to the expiration of a state statute of limitations, during 2013 we recognized $1.2 million of our previously unrecognized tax benefits, which resulted in a decrease to our tax expense of approximately $0.8effective rate is less than $0.1 million. The tax benefit attributable to the decrease in unrecognized tax benefits did not have a significant effect on our effective tax rate.
Our practice is to recognize interest and penalties related to income tax matters in interest expense and general and administrative expense, respectively. During 20132016 and 20122015, we did not record anyhave a material liability for interest or penalties and had no material interest or penalty expense and have no material remaining liability for interest or penalties.expense.
The periods subject to examination for our federal return are years 20102013 through 2012.2015. The periods subject to examination for our state returns are years 20052012 through 2012.2015. We are not currently under examination by federal andor state taxing authorities. We have received proposed assessments in connection with our federal examination for tax years ended December 31, 2010 and 2011. We are in the process of responding to the IRS and providing support for our tax position. We believe that our tax position will be upheld based on the technical merits of our position. Accordingly, the Company has not made any adjustments to its unrecognized tax benefits for the proposed assessments.
We do not expect anythat the total unrecognized tax benefits and related accrued interest will significantly change due to the settlement of audits or payment that may result from the auditsexpiration of statute of limitations in the next twelve months. There were no material changes to have athese amounts during 2016 and there were no material effecteffects on our results of operations or cash flows.the Company’s effective tax rate.
F-36
CONSOLIDATED COMMUNICATIONS HOLDINGS, INC. AND SUBSIDIARIES
NOTES TO CONSOLIDATED FINANCIAL STATEMENTS (continued)
YEARS ENDED DECEMBER 31, 2013, 2012 AND 2011
The following is a reconciliation of the unrecognized tax benefits for the years ended December 31, 20132016 and 2012:2015:
| | | | | | | | |
| | Liability for | | | Liability for | |
| | Unrecognized | | | Unrecognized | |
| | Tax Benefits | | | Tax Benefits | |
(In thousands) | | 2013 | | 2012 | | | 2016 | | 2015 | |
| | | | | | | | | | | | |
Balance at January 1 | | $ | 1,224 | | $ | 1,224 | | | $ | 66 | | $ | 238 | |
Additions for tax positions in the current year | | – | | – | | | | - | | | 1 | |
Additions for tax positions of prior years | | – | | – | | |
Settlements with taxing authorities | | – | | – | | |
Reduction for lapse of federal statute of limitations | | – | | – | | |
Reduction for tax positions of prior years | | | | - | | | (158) | |
Reduction for lapse of state statute of limitations | | (1,224) | | – | | | | (2) | | | (15) | |
Balance at December 31 | | $ | - | | $ | 1,224 | | | $ | 64 | | $ | 66 | |
11.COMMITMENTS AND CONTINGENCIES
We have certain other obligations for various contractual agreements to secure future rights to goods and services to be used in the normal course of our operations. These include purchase commitments for planned capital expenditures, agreements securing dedicated access and transport services, and service and support agreements. Additionally, we have procured transport resale arrangements with several interexchange carriers for our long distance services.
As of December 31, 2013,2016, future minimum contractual obligations, including capital and operating leases, and the estimated timing and effect the obligations will have on our liquidity and cash flows in future periods are as follows:
| | | | | | | | | | | | | | | | | | | | | | | |
| | Minimum Annual Contractual Obligations | | | | | | | | | | | | | | | | | | | | | | | |
| | | | | | | | | | | | | | | | | Minimum Annual Contractual Obligations | |
(in thousands) | | 2014 | | 2015 | | 2016 | | 2017 | | 2018 | | Thereafter | | Total | | | 2017 | | 2018 | | 2019 | | 2020 | | 2021 | | Thereafter | | Total | |
Operating lease agreements | | $ | 1,272 | | $ | 1,249 | | $ | 1,054 | | $ | 961 | | $ | 960 | | $ | 2,362 | | $ | 7,858 | | | $ | 11,304 | | $ | 10,000 | | $ | 8,838 | | $ | 7,069 | | $ | 4,287 | | $ | 12,605 | | $ | 54,103 | |
Capital lease agreements | | 2,133 | | 1,712 | | 563 | | 392 | | 287 | | 793 | | 5,880 | | | | 5,922 | | | 6,187 | | | 3,486 | | | 889 | | | 373 | | | — | | | 16,857 | |
Capital expenditures (1) | | 8,384 | | – | | – | | – | | – | | – | | 8,384 | | | | 3,151 | | | — | | | — | | | — | | | — | | | — | | | 3,151 | |
Service and support agreements (2) | | 7,221 | | 5,796 | | 4,873 | | 890 | | 233 | | – | | 19,013 | | | | 6,724 | | | 3,378 | | | 1,266 | | | 725 | | | 236 | | | 354 | | | 12,683 | |
Transport and data connectivity | | 9,100 | | 9,000 | | 9,000 | | 9,000 | | – | | – | | 36,100 | | | | 20,870 | | | 9,132 | | | 7,515 | | | 6,817 | | | 6,822 | | | 6,752 | | | 57,908 | |
Total | | $ | 28,110 | | $ | 17,757 | | $ | 15,490 | | $ | 11,243 | | $ | 1,480 | | $ | 3,155 | | $ | 77,235 | | | $ | 47,971 | | $ | 28,697 | | $ | 21,105 | | $ | 15,500 | | $ | 11,718 | | $ | 19,711 | | $ | 144,702 | |
| (1) | | We have binding commitments with numerous suppliers for future capital expenditures. |
| (2) | | We have entered into service and maintenance agreements to support various computer hardware and software applications and certain equipment. |
(1)We have binding commitments with numerous suppliers for future capital expenditures.Leases
(2)We have entered into service and maintenance agreements to support various computer hardware and software applications and certain equipment. If we terminate any of the contracts prior to their expiration date, we would be liable for minimum commitment payments as defined in by the contractual terms of the contracts.
Leases
Operating
We have entered into various non-cancelable operating leases with terms greater than one year for certain facilities and equipment used in our operations. The facility leases generally require us to pay operating costs:costs, including property taxes, insurance and maintenance, and certain of them contain scheduled rent increases and renewal options. Leasehold improvements are amortized over their estimated useful lives or lease period, whichever is shorter. We recognize rent expense on a straight-line basis over the term of each lease.
We incurred rent expense of $2.3$12.7 million, $2.9$12.1 million and $2.1$7.5 million for the years ended December 31, 2013, 2012,2016, 2015, and 2011,2014, respectively.
Capital Leases
As of December 31, 2013, we had sevenWe lease certain facilities and equipment under various capital leases,lease arrangements, all of which expire between 20152017 and 2021. As of December 31, 2013,2016, the present value of the minimum remaining lease commitments, net of imputed interest of $2.0 million, was approximately $5.1$16.9 million, of which $0.7$5.9 million was due and payable within the next twelve months.The carrying amount of our
F-37
Table of Contents
CONSOLIDATED COMMUNICATIONS HOLDINGS, INC. AND SUBSIDIARIES
NOTES TO CONSOLIDATED FINANCIAL STATEMENTS (continued)
YEARS ENDED DECEMBER 31, 2013, 2012 AND 2011
capital lease obligations, net of imputed interest of $2.7 million, was $5.1 million as of December 31, 2013. See Note 12 for information regarding the capital leases we have entered into with related parties.
Litigation, Regulatory Proceedings and Other Contingencies
FairPoint
On April 15, 2008, SalsgiverFebruary 7, 2017, an alleged class action complaint was filed by a purported stockholder of FairPoint in the United States District Court for the Western District of North Carolina (Case No. 3:17-cv-51) against us, FairPoint and its directors. Among other things, the complaint alleges that the disclosures in our Form S-4 Registration Statement filed with the SEC on January 26, 2017, in connection with the Merger Agreement, are materially incomplete and misleading in violation of Sections 14(a) and 20(a) of the Securities Exchange Act of 1934, as amended. The plaintiff seeks to enjoin us from consummating the merger with FairPoint on the agreed-upon terms or, alternatively, to rescind the merger in the event that we consummate the merger, in addition to damages and attorney fees and costs. We believe the allegations made in this complaint are without merit. We have not yet filed an answer or other responsive pleading to the complaint.
Access Charges
In 2014, Sprint Communications Company L.P. (“Sprint”) along with MCI Communications Services, Inc. and Verizon Select Services Inc. (collectively, “Verizon”) filed lawsuits against us and many other Local Exchange Carriers (“LECs”) throughout the country challenging the switched access charges LECs assessed Sprint and Verizon, as interexchange carriers (“IXCs”), for certain calls originating from or terminating to mobile and wireline devices that are routed to us through these IXCs. The plaintiffs’ position is based on their interpretation of federal law, among other things, and they are seeking refunds of past access charges paid for such calls. The disputed amounts total $2.4 million and cover periods dating back to 2006. CenturyLink, Inc., which is a Pennsylvania-based telecommunications company,defendant in both groups of cases, requested that the U.S. Judicial Panel on Multidistrict Litigation (the “Panel”), which has the authority to transfer the pretrial proceedings to a single court for multiple civil cases involving common questions of fact, transfer and consolidate these cases in one court. The Panel granted CenturyLink’s request and ordered that these cases be transferred to and centralized in the U.S. District Court for the Northern District of Texas (the “Court”). On November 17, 2015, the Court dismissed these complaints based on its interpretation of federal law and held that LECs could assess switched access charges for the calls at issue (the “November 2015 Order”). The November 2015 Order also allowed the plaintiffs to amend their complaints to assert claims that arise under state laws independent of the dismissed claims asserted under federal law. While Verizon did not make such a filing, on May 16, 2016, Sprint filed amended complaints and on June 30, 2016, the LEC defendants named in such complaints filed a Joint Motion to Strike or Dismiss them. Briefing on this Joint Motion concluded in August 2016 and the Court has yet to issue a decision on it.
Relatedly, in 2015, numerous LECs across the country, including a number of our LEC entities, filed complaints in various U.S. district courts against Level 3 Communications, LLC and certain of its affiliates filed a lawsuit against us and our subsidiaries North Pittsburgh Telephone Company and North Pittsburgh Systems Inc. in the Court of Common Pleas of Allegheny County, Pennsylvania alleging that we have prevented Salsgiver from connecting their fiber optic cables(collectively, “Level 3”) for its failure to our utility poles. Salsgiver seeks compensatory and punitive damages as the result of alleged lost projected profits, damage to its business reputation, and other costs. Salsgiver originally claimed to have sustained losses of approximately $125 million. We believe that these claims are without merit andpay access charges for certain calls that the alleged damages are completely unfounded. Discovery concluded and Consolidated filed a motion for summary judgment on June 18, 2012 and the court heard oral arguments on August 30, 2012. On February 12, 2013, the court,November 2015 Order held could be assessed by LECs. The total amount our LEC entities seek from Level 3 in part, granted our motion. The court ruled that Salsgiver could not recover prejudgment interest and could not use as a basis of liability any actions prior to April 14, 2006. In September 2013, in order to avoid the distraction and uncertainty of further litigation, we reached an agreement in principle (the “Agreement”) with Salsgiver, Inc. In accordance with the terms of the Agreement, we will pay Salsgiver approximately $0.9 million in cash and grantthis proceeding is at least approximately $0.3 million, excluding late payment charges/penalties and attorneys’ fees. These complaint cases were transferred to and included in creditsthe above-referenced consolidated proceeding before the Court. On May 31, 2016, Level 3 filed a Motion to Dismiss these complaints that largely repeated arguments the November 2015 Order rejected. Briefing on Level 3’s Motion has concluded and an oral argument on it is scheduled for February 15, 2017. After that, it will likely be a few months before the Court issues a decision on this Motion.
While the Court adopted a Scheduling Order on July 19, 2016 for the remaining proceedings in the consolidated cases (including, among other things, dates for the parties to informally resolve damage claims, i.e., the amounts in dispute and late payment charges), that Order was recently stayed. However, twenty days after the Court issues decisions on Level 3's Motion to Dismiss and the LECs’ Joint Motion to Dismiss, the parties are required to submit a joint status report proposing the appropriate procedures and deadlines for the case. Once the proceedings before the Court become final, Sprint, Verizon, and Level 3 are expected to appeal the November 2015 Order along with any order that may, be used for make-ready charges (the “Credits”). The Creditssimilar reasons, deny Level 3’s May 31, 2016 Motion to Dismiss. We have interconnection agreements in place with all wireless carriers and the applicable traffic is being billed at current access rates. Absent a decision by an appellate court that overturns the November 2015 Order or a decision granting Level 3’s Motion to Dismiss, it will be availabledifficult for services performedSprint and Verizon to succeed on any claims against us or for Level 3 to avoid paying the access charges it disputes in connection with the pole attachment applications within five yearsthis litigation. Therefore, we do not expect any potential settlement or judgment to have an adverse material impact on our financial results or cash flows.
Gross Receipts Tax
Two of our subsidiaries, Consolidated Communications of Pennsylvania Company LLC (“CCPA”) and Consolidated Communications Enterprise Services Inc. (“CCES”), have, at various times, received assessment notices from the Commonwealth of Pennsylvania Department of Revenue (“DOR”) increasing the amounts owed for Pennsylvania Gross Receipt Taxes,Receipts Tax, and/or have had audits performed for the tax years of 2008 2009,through 2013. In addition, a re-audit was performed on CCPA for the 2010 calendar year.
Pennsylvania generally imposes tax on the gross receipts received from telephone messages transmitted wholly within the state and 2010. Fortelephone messages transmitted in interstate commerce where such messages originate or terminate in Pennsylvania, and the calendar yearscharges for such messages are billed to a service address in the state. In a 2013 decision involving Verizon Pennsylvania, Inc. (“Verizon Pennsylvania”), the Commonwealth Court of Pennsylvania held that the gross receipts tax applies to Verizon Pennsylvania’s installation of private phone lines because the sole purpose of private lines is to transmit messages. Similarly, the court held that directory assistance is subject to the gross receipts tax because it makes the transmission of messages more effective and satisfactory. However, the court did not find Verizon Pennsylvania’s nonrecurring charges for the installation of telephone lines, moves of and changes to telephone lines and services and repairs of telephone lines to be subject to the gross receipts tax as no telephone messages are transmitted when Verizon Pennsylvania performs these nonrecurring services.
In November 2015, on appeal, the Supreme Court of Pennsylvania held in Verizon Pennsylvania, Inc. v. Commonwealth of Pennsylvania, 127 A.3d 745 (Pa. 2015), that charges for the installation of private phone lines, charges for directory assistance and certain nonrecurring charges were all subject to the state’s gross receipt tax. The Supreme Court of Pennsylvania found that all of the services, including those related to nonrecurring charges, in some way made transmission more effective or communication more satisfactory even though such services did not involve actual transmission. This is a partial reversal of the 2013 Commonwealth Court of Pennsylvania decision described above, which we received both additional assessment noticeshad ruled that while the charges for the installation of private phone lines and audit actions, those issues have been combined bydirectory assistance were subject to the DOR into a single Docketstate’s gross receipts tax, the nonrecurring charges in question were not. As neither reargument nor for each year. reconsideration was sought, the case is now final.
For the CCES subsidiary, the total additional tax liability calculated by the auditors for the calendar years 2008 2009, and 2010through 2013 is approximately $1.9$4.1 million. As of March 2013, all three of these cases have been appealed, and have received continuance pending the outcome of present litigation inIn May 2016, the Commonwealth of Pennsylvania (VerizonBoard of Finance and Revenue reviewed our appeals of cases for the audits in calendar years 2008 through 2013 and held that the charges in question were subject to the state’s gross receipts tax. In June 2016, we filed appeals with the Pennsylvania Inc. v. Commonwealth Docket No. 266 F.R. 2008). Court for the audits in calendar years 2008 through 2013. These appeals are presently awaiting fact development, and no action is expected to occur until second quarter 2017.
For the CCPA subsidiary, the total additional tax liability calculated by the DOR auditors for the calendar years 2008 2009, andthrough 2013 (using the re-audited 2010 number) is approximately $2.0$5.0 million. As of December 2013, the cases for calendar years 2009 and 2010 have been appealed, and have received continuance pending the outcome of present litigation inIn May 2016, the Commonwealth of Pennsylvania (Verizon Pennsylvania, Inc. v. Commonwealth, Docket No. 266 F.R. 2008). The calendar year 2008 audit is ongoing and we anticipate based on previous results that we will appeal the result to the Pennsylvania Board of Finance and Revenue on or before March 19, 2014. We anticipatereviewed our appeals of cases for the audits in calendar years 2008 through 2013 and held that the charges in question were subject to the state’s gross receipts tax. In June 2016, we filed appeals with the Pennsylvania Commonwealth Court for the audits in calendar years 2008 case will be continued pendingthrough 2013. These appeals are presently awaiting fact development, and no action is expected to occur until second quarter 2017.
In October 2016, CCPA and CCES received Audit Assessment Notices from the outcome ofDOR increasing the Verizon litigation as well. Theamounts owed for Pennsylvania Gross Receipts Tax issues infor the Verizon Pennsylvania case are substantially2014 tax year. The total additional tax liability calculated by the same as those presently facingDOR auditors for CCPA and CCES.CCES for 2014 is approximately $0.7 million and $0.9 million, respectively. In addition, there are numerous telecommunications carriersJanuary 2017, we filed Petitions for Reassessment with Gross Receipts Taxthe DOR’s Board of Appeals, contesting the audit assessments. The Petitions request that the matters dealing withbe stayed pending final action of the Commonwealth Court in litigation involving the same issues that are in various stages of appeal before the Board of Finance and Revenue and the Commonwealth Court. Those appeals by other similarly situated telecommunications carriers have been continued until resolution of the Verizon Pennsylvania case. related to CCPA’s 2008 through 2013 tax periods.
We believe that these assessmentscertain of the DOR’s findings regarding the Company’s additional tax liability for the calendar years 2008 through 2014, for which we have filed appeals, continue to lack merit. However, in light of the Supreme Court of Pennsylvania’s decision, we have accrued $1.4 million and $1.2 million for our CCES and CCPA subsidiaries, respectively. These accruals also include the positions taken byCompany’s best estimate of the Commonwealth of Pennsylvania are without substantial merit.potential 2014 and 2015 additional tax liabilities. We do not believe that the outcome of these claims will have a material adverse impact on our financial results.results or cash flows.
Other
On January 18, 2012, weApril 14, 2008, Salsgiver Inc., a Pennsylvania-based telecommunications company, and certain of its affiliates (“Salsgiver”) filed a petitionlawsuit against us and our former subsidiaries North Pittsburgh Telephone Company and North Pittsburgh Systems Inc. in the Court of Common Pleas of Allegheny County, Pennsylvania alleging that we had prevented Salsgiver from connecting their fiber optic cables to our utility poles. Salsgiver sought compensatory and punitive damages as the result of alleged lost projected profits, damage to its business reputation and other costs. Salsgiver originally claimed to have sustained losses of approximately $125.0 million. We believed that these claims were without merit and that the alleged damages were completely unfounded. We had previously recorded $0.4 million in 2011 and $0.9 million in 2013 in anticipation of the settlement of this case, which included estimated legal fees. A jury trial concluded on May 14, 2015 with the U.S. Court of Appeals forjury ruling in our favor. Salsgiver subsequently filed a post-trial motion asking the District of Columbia Circuitjudge to reviewoverturn the FCC’s Order issued November 18, 2011 that reformed intercarrier compensation and core parts of the Universal Service Fund. We are appealing five core issuesjury verdict. That motion was denied. On June 17, 2015, Salsgiver filed an appeal in the November 18, 2011 FCC order. This matterPennsylvania Superior Court. Salsgiver’s brief was heard by the U.S. Court of Appeals for the Tenth Circuit on November 19, 2013, however a decision is not expected before the third quarter of 2014.
In order for eligible telecommunications carriers (“ETCs”) to receive high-cost support, the USF/ICC Transformation Order requires states to certify on an annual basis that federal universal service high-cost support (“USF”) is used “only for the provision, maintenance, and upgrading of facilities and services for which the support is intended”. States, in turn, require that ETCs file certifications with them as the basis for the state filings with the FCC. Failure to meet the annual data and certification deadlines can result in reduced support to the ETC based on
F-38
Table of Contents
the length of the delay in certification. For the calendar year 2013, the California state certification was due to be filed with the FCCSuperior Court on or before October 1, 2012. We were notifiedDecember 4, 2015, and the Company filed its response on January 18, 2016. The Pennsylvania Superior Court held oral arguments on May 17, 2016. On November 10, 2016, the Pennsylvania Superior Court entered an order affirming the judgment in January 2013 that SureWestour favor. Salsgiver did not submit the required certificationattempt to take an appeal to the California Public Utilities Commission (“CPUC”) in time to be included in its October 1, 2012, submission toPennsylvania Superior Court. This case is now concluded. During the FCC. On January 24, 2013, we filed a certification with the CPUC and filed a petition with the FCC for a waiver of the filing deadline for the annual state certification. On February 19, 2013, the CPUC filed a certification with the FCC with respect to SureWest. On October 29, 2013, the Wireline Competition Bureau of the FCC denied our petition for a waiver of the annual certification deadline. On November 26, 2013, we applied for a review of the decision made by the FCC staff by the full Commission. Management believes, based on the change in SureWest Telephone’s USF filing status caused by the change in the ownership of SureWest Telephone, the lack of formal notice by the FCC regarding this change in filing status, the fact that SureWest Telephone had a previously-filed certification of compliance in effect with the FCC for the two quarters for which USF was withheld, and the FCC’s past practice of granting waivers to accept late filings in similar situations, that the Company should prevail in its application to the Commission and receive USF funding for the period January 1, 2013, through June 30, 2013. However, due to the denial of our petition by the Wireline Competition Bureau and the uncertainty of the collectability of the previously recognized revenues, inyear ended December 201331, 2016, we reversed the $3.0reserve of approximately $1.3 million ofrelated to the potential settlement previously recognized revenues until such time that the Commission has the opportunity to reach a decision on our application for review.in 2011 and 2013.
We are fromFrom time to time, we may be involved in various other legal proceedings andlitigation that we believe is of the type common to companies in our industry, including regulatory actions arising outissues. While the outcome of our operations. Wethese claims cannot be predicted with certainty, we do not believe that the outcome of any of these individually or in the aggregate,legal matters will have a material adverse effect uponimpact on our business, operating results of operations, financial condition or financial condition.cash flows.
12.RELATED PARTY TRANSACTIONS
Capital Leases
Richard A. Lumpkin, a member of our Board of Directors, together with his family, beneficially owned 41.3%37.0% and 33.5% of Agracel, Inc. (“Agracel”), a real estate investment company, at December 31, 20132016 and 2012.2015, respectively. Mr. Lumpkin also is a director of Agracel. Agracel is the sole managing member and 50% owner of LATEL LLC (“LATEL”). Mr. Lumpkin and his immediate family had a 70.7%68.5% and 66.7% beneficial ownership of LATEL at December 31, 20132016 and 2012.2015, respectively.
As of December 31, 2013,2016, we had three capital lease agreements with LATEL for the occupancy of three buildings on a triple net lease basis. In accordance with the Company’s related person transactions policy, these leases were approved by our Audit Committee and Board of Directors (“BOD”).We. We have accounted for these leases as capital leases in accordance with ASC Topic 840, Leases, and have capitalized the lower of the present value of the future minimum lease payments or their fair value. The capital lease agreements require us to pay substantially all expenses associated with general maintenance and repair, utilities, insurance and taxes. Each of the three lease agreements have a maturity date of May 31, 2021 and each have two five-year options to extend the terms of the lease after the initial expiration date. We are required to pay LATEL approximately $7.9 million over the terms of the lease agreements. The carrying value of the capital leases at December 31, 20132016 and 20122015 was approximately $3.6$2.7 million and $3.8$3.0 million, respectively. We recognized $0.4 million in interest expense in each 2016 and 2015 and $0.5 million in interest expense in 2013, 2012 and 20112014 and amortization expense of $0.4 million in 20132016, 2015 and 2012 and $0.1 in 2011, respectively,2014 related to the capitalized leases.
Long-Term Debt
A portion of the Senior2020 Notes was sold to certain accredited investors consisting of certain members of the Company’s Board of Directors includingor a trust of which a director is the Company’s Chief Executive Officer (collectively “relatedbeneficiary (“related parties”). In May 2012, the related parties purchased $10.8 million of the Senior2020 Notes on the same terms available to other investors, except that the related parties were not entitled to registration rights. During 2013In 2015, the 2020 Notes were fully redeemed and 2012, the Companywe paid $1.2an early redemption premium of $1.5 million and $0.6recognized approximately $0.7 million and $1.3 million in 2015 and 2014, respectively, in interest expense in the aggregate for the 2020 Notes purchased by related parties. In September 2014, $5.0 million of the 2022 Notes were sold to a trust, the beneficiary of which is a member of the Company’s Board of Directors and we recognized approximately $0.3 million in each 2016 and 2015 in interest expense for the 2022 Notes purchased by the related parties for the Senior Notes.party.
F-39
Other Services
CONSOLIDATED COMMUNICATIONS HOLDINGS, INC. AND SUBSIDIARIES
NOTES TO CONSOLIDATED FINANCIAL STATEMENTS (continued)
YEARS ENDED DECEMBER 31, 2013, 2012 AND 2011Mr. Lumpkin also has a minority ownership interest in First Mid-Illinois Bancshares, Inc. (“First Mid-Illinois”). We provide telecommunication products and services to First Mid-Illinois and we received approximately $0.7 million, $0.8 million and $0.5 million in 2016, 2015 and 2014, respectively, for these services.
13.QUARTERLY FINANCIAL INFORMATION (UNAUDITED)
| | Quarter Ended |
2013 | | March 31 | | June 30 | | September 30 | | December 31 |
| | (In thousands, except per share amounts) |
Net revenues | | $ | 151,528 | | $ | 151,320 | | $ | 150,773 | | $ | 147,956 |
Operating income | | $ | 28,330 | | $ | 26,947 | | $ | 26,167 | | $ | 22,217 |
Income from continuing operations | | $ | 6,858 | | $ | 9,560 | | $ | 10,330 | | $ | 3,216 |
Discontinued operations, net of tax | | $ | 24 | | $ | (272) | | $ | 1,425 | | $ | - |
Net income attributable to common stockholders | | $ | 6,783 | | $ | 9,194 | | $ | 11,694 | | $ | 3,140 |
| | | | | | | | |
Basic and diluted earnings (loss) per share | | | | | | | | |
Income from continuing operations | | $ | 0.17 | | $ | 0.23 | | $ | 0.26 | | $ | 0.08 |
Discontinued operations, net of tax | | - | | (0.01) | | 0.03 | | - |
Net income per basic and diluted common share attributable to common shareholders | | $ | 0.17 | | $ | 0.22 | | $ | 0.29 | | $ | 0.08 |
| | | | | | | | | | | | | |
| | Quarter Ended | |
2016 | | March 31, | | June 30, | | September 30, | | December 31, | |
| | (In thousands, except per share amounts) | |
Net revenues | | $ | 188,846 | | $ | 186,871 | | $ | 191,541 | | $ | 175,919 | |
Operating income | | $ | 24,310 | | $ | 22,954 | | $ | 22,736 | | $ | 17,440 | |
Net income (loss) attributable to common stockholders | | $ | 7,849 | | $ | 76 | | $ | 7,012 | | $ | (6) | |
Basic and diluted earnings (loss) per share | | $ | 0.15 | | $ | — | | $ | 0.14 | | $ | — | |
| | Quarter Ended |
2012 | | March 31 | | June 30 | | September 30 | | December 31 |
| | (In thousands, except per share amounts) |
Net revenues | | $ | 86,451 | | $ | 86,557 | | $ | 151,025 | | $ | 153,844 |
Operating income | | $ | 9,918 | | $ | 13,147 | | $ | 8,185 | | $ | 20,167 |
Income (loss) from continuing operations | | $ | 1,177 | | $ | 2,321 | | $ | (1,311) | | $ | 2,778 |
Discontinued operations, net of tax | | $ | 707 | | $ | 585 | | $ | 467 | | $ | (553) |
Net income (loss) attributable to common stockholders | | $ | 1,759 | | $ | 2,786 | | $ | (965) | | $ | 2,060 |
| | | | | | | | |
Basic and diluted earnings (loss) per share: | | | | | | | | |
Income from continuing operations | | $ | 0.03 | | $ | 0.07 | | $ | (0.03) | | $ | 0.07 |
Discontinued operations, net of tax | | 0.03 | | 0.02 | | 0.01 | | (0.02) |
Net income per basic and diluted common share attributable to common shareholders | | $ | 0.06 | | $ | 0.09 | | $ | (0.02) | | $ | 0.05 |
| | | | | | | | | | | | | |
| | Quarter Ended | |
2015 | | March 31, | | June 30, | | September 30, | | December 31, | |
| | (In thousands, except per share amounts) | |
Net revenues | | $ | 192,578 | | $ | 201,010 | | $ | 193,958 | | $ | 188,191 | |
Operating income | | $ | 26,745 | | $ | 27,675 | | $ | 13,648 | | $ | 19,707 | |
Net income (loss) attributable to common stockholders | | $ | 7,810 | | $ | (15,968) | | $ | 2,595 | | $ | 4,682 | |
Basic and diluted earnings (loss) per share | | $ | 0.15 | | $ | (0.32) | | $ | 0.05 | | $ | 0.09 | |
In October 2016, we amended our Credit Agreement to restate and amend our term loan credit facilities as described in Note 6. In connection with entering into the amended and restated credit agreement, we incurred a loss on the extinguishment of debt of $6.6 million during the quarter ended December 31, 2016.
In connection with the redemption of the 2020 Notes, as described in Note 6, we recognized a loss on extinguishment of debt of $41.2 million during the quarter ended June 30, 2015.
As described in Note 3, in September 2013, we completed the salepart of the assetsCompany’s continued integration efforts, an early retirement program was initiated during the quarter ended September 30, 2015 to a group of select employees who were 55 years of age or older and contractual rightswho have provided 15 or more years of our prison services business for a total cash price of $2.5 million, resultingservice. The employees were primarily in a gain of $1.3 million, net of tax. The financial resultsnon-customer facing positions or positions in which the Company believed the retiree’s workload could be absorbed internally as part of the operations for prison services have been reportedCompany’s continuing cost saving initiatives. The early retirement package was accepted by approximately 60 employees and, as a discontinued operationresult, one-time severance costs of $7.2 million were incurred during the quarter ended September 30, 2015. The Company expects approximately $4.8 million in our consolidated financial statements for all periods presented.future annual savings as a result of the early retirement program.
During the third quarter of 2012, we acquired 100% of the outstanding shares of SureWest in a cash and stock transaction. SureWest results of operations have been included in our consolidated financial statements as of the acquisition date of July 2, 2012.
14.CONDENSED CONSOLIDATING FINANCIAL INFORMATION
Consolidated Communications, Inc. is the primary obligor under the unsecured Senior Notes it issued on May 30, 2012.Notes. We and the followingsubstantially all of our subsidiaries: Consolidated Communications Enterprise Services, Inc., Consolidated Communications Services Company,subsidiaries, excluding Consolidated Communications of Fort BendIllinois Company (formerly Illinois Consolidated Communications of Texas Company, Consolidated Communications of Pennsylvania Company, LLC, SureWest Communications, SureWest Long Distance, SureWest Telephone SureWest TeleVideo, SureWest Kansas, Inc.Company), SureWest Kansas Holdings, Inc., SureWest Fiber Ventures, LLC, SureWest Kansas Connections, LLC, SureWest Kansas Licenses, LLC, SureWest Kansas Operations, LLC and SureWest Kansas Purchasing, LLC, have jointly and severally guaranteed the Senior Notes. All of the subsidiary guarantors are 100% direct or indirect wholly owned subsidiaries of the parent, and all guarantees are full, unconditional and joint and several with respect to principal, interest and liquidated damages, if any. As such, we present condensed consolidating balance sheets as of December 31, 20132016 and 2012,2015, and condensed consolidating statements of operations and cash flows for the years ended December 31, 2013, 20122016, 2015 and 20112014 for each of Consolidated Communications Holdings, Inc. (Parent), Consolidated Communications, Inc. (Subsidiary Issuer), guarantor subsidiaries and other non-guarantor subsidiaries with any consolidating adjustments. See Note 6 for more information regarding our Senior Notes.
F-40
CONSOLIDATED COMMUNICATIONS HOLDINGS, INC. AND SUBSIDIARIES
NOTES TO CONSOLIDATED FINANCIAL STATEMENTS (continued)
YEARS ENDED DECEMBER 31, 2013, 2012 AND 2011
Condensed Consolidating Balance Sheets
(amounts in thousands)
| | | | | | | | | | | | | | | | | | | | |
| | December 31, 2013 | | December 31, 2016 | |
| | Parent | | Subsidiary
Issuer | | Guarantors | | Non-Guarantors | | Eliminations | | Consolidated | | Parent | | Subsidiary Issuer | | Guarantors | | Non-Guarantors | | Eliminations | | Consolidated | |
ASSETS | | | | | | | | | | | | | | | | | | | | | | | | | | | | | | | | |
Current assets: | | | | | | | | | | | | | | | | | | | | | | | | | | | | | | | | |
Cash and cash equivalents | | $ | - | | $ | 86 | | $ | 2,366 | | $ | 3,099 | | $ | - | | $ | 5,551 | | | $ | — | | $ | 27,064 | | $ | 13 | | $ | — | | $ | — | | $ | 27,077 | |
Accounts receivable, net | | - | | 502 | | 44,521 | | 7,010 | | - | | 52,033 | | | | — | | | — | | | 48,911 | | | 7,347 | | | (42) | | | 56,216 | |
Income taxes receivable | | 9,346 | | - | | 370 | | 80 | | - | | 9,796 | | | | 20,756 | | | — | | | 885 | | | (25) | | | — | | | 21,616 | |
Deferred income taxes | | (61 | ) | | (7 | ) | | 7,533 | | 495 | | - | | 7,960 | | |
Prepaid expenses and other current assets | | - | | | - | | | 11,862 | | | 518 | | | - | | | 12,380 | | | | — | | | 12,856 | | | 15,310 | | | 126 | | | — | | | 28,292 | |
Total current assets | | 9,285 | | | 581 | | | 66,652 | | | 11,202 | | | - | | | 87,720 | | | | 20,756 | | | 39,920 | | | 65,119 | | | 7,448 | | | (42) | | | 133,201 | |
| | | | | | | | | | | | | | | | | | | | | | | | | | | | | | | | |
Property, plant and equipment, net | | - | | - | | 834,199 | | 51,163 | | - | | 885,362 | | | | — | | | — | | | 999,416 | | | 55,770 | | | — | | | 1,055,186 | |
| | | | | | | | | | | | | | | | | | | | | | | | | | | | | | | | |
Intangibles and other assets: | | | | | | | | | | | | | | | | | | | | | | | | | | | | | | | | |
Investments | | - | | 3,729 | | 109,370 | | - | | - | | 113,099 | | | | — | | | 8,338 | | | 97,883 | | | — | | | — | | | 106,221 | |
Investments in subsidiaries | | 1,101,039 | | 335,659 | | 12,130 | | - | | (1,448,828 | ) | | - | | | | 2,192,556 | | | 2,019,692 | | | 14,279 | | | — | | | (4,226,527) | | | — | |
Goodwill | | - | | - | | 537,265 | | 66,181 | | - | | 603,446 | | | | — | | | — | | | 690,696 | | | 66,181 | | | — | | | 756,877 | |
Other intangible assets | | - | | - | | 30,997 | | 9,087 | | - | | 40,084 | | | | — | | | — | | | 22,525 | | | 9,087 | | | — | | | 31,612 | |
Deferred debt issuance costs, net and other assets | | - | | | 13,620 | | | 4,047 | | | - | | | - | | | 17,667 | | |
Advances due to/from affiliates, net | | | | — | | | 1,524,906 | | | 427,720 | | | 87,171 | | | (2,039,797) | | | — | |
Deferred income taxes | | | | 17,150 | | | — | | | — | | | — | | | (17,150) | | | — | |
Other assets | | | | — | | | 1,562 | | | 8,058 | | | 41 | | | — | | | 9,661 | |
Total assets | | $ | 1,110,324 | | | $ | 353,589 | | | $ | 1,594,660 | | | $ | 137,633 | | | $ | (1,448,828 | ) | | $ | 1,747,378 | | | $ | 2,230,462 | | $ | 3,594,418 | | $ | 2,325,696 | | $ | 225,698 | | $ | (6,283,516) | | $ | 2,092,758 | |
| | | | | | | | | | | | | | | | | | | | | | | | | | | | | | | | | | | | | |
LIABILITIES AND SHAREHOLDERS’ EQUITY | | | | | | | | | | | | | | | | | | | | | | | | | | | | | | | | |
Current liabilities: | | | | | | | | | | | | | | | | | | | | | | | | | | | | | | | | |
Accounts payable | | $ | - | | $ | - | | $ | 4,885 | | $ | - | | $ | - | | $ | 4,885 | | | $ | — | | $ | — | | $ | 6,766 | | $ | — | | $ | — | | $ | 6,766 | |
Advance billings and customer deposits | | - | | - | | 23,699 | | 2,235 | | - | | 25,934 | | | | — | | | — | | | 24,981 | | | 1,457 | | | — | | | 26,438 | |
Dividends payable | | 15,520 | | - | | - | | - | | - | | 15,520 | | | | 19,605 | | | — | | | — | | | — | | | — | | | 19,605 | |
Accrued compensation | | - | | - | | 20,447 | | 1,805 | | - | | 22,252 | | | | — | | | — | | | 16,002 | | | 969 | | | — | | | 16,971 | |
Accrued interest | | | | — | | | 10,824 | | | 436 | | | — | | | — | | | 11,260 | |
Accrued expense | | 224 | | 4,389 | | 32,709 | | 1,375 | | - | | 38,697 | | | | 36 | | | 15,057 | | | 38,192 | | | 880 | | | (42) | | | 54,123 | |
Current portion of long term debt and capital | | | | | | | | | | | | | | |
lease obligations | | - | | 9,100 | | 586 | | 65 | | - | | 9,751 | | |
Current portion of derivative liability | | - | | | 660 | | | - | | | - | | | - | | | 660 | | |
Current portion of long term debt and capital lease obligations | | | | — | | | 9,000 | | | 5,735 | | | 187 | | | — | | | 14,922 | |
Total current liabilities | | 15,744 | | | 14,149 | | | 82,326 | | | 5,480 | | | - | | | 117,699 | | | | 19,641 | | | 34,881 | | | 92,112 | | | 3,493 | | | (42) | | | 150,085 | |
| | | | | | | | | | | | | | | | | | | | | | | | | | | | | | | | |
Long-term debt and capital lease obligations | | - | | 1,207,663 | | 3,659 | | 812 | | - | | 1,212,134 | | | | — | | | 1,365,820 | | | 10,332 | | | 602 | | | — | | | 1,376,754 | |
Advances due to/from affiliates, net | | 968,319 | | (1,970,192 | ) | | 1,037,969 | | (36,096 | ) | | - | | - | | | | 2,039,797 | | | — | | | — | | | — | | | (2,039,797) | | | — | |
Deferred income taxes | | (21,598 | ) | | (1,029 | ) | | 184,209 | | 18,277 | | | | 179,859 | | | | — | | | 984 | | | 232,668 | | | 27,796 | | | (17,150) | | | 244,298 | |
Pension and postretirement benefit obligations | | - | | - | | 61,053 | | 14,701 | | - | | 75,754 | | | | — | | | — | | | 109,185 | | | 21,608 | | | — | | | 130,793 | |
Other long-term liabilities | | 25 | | | 1,960 | | | 7,328 | | | 280 | | | - | | | 9,593 | | | | 70 | | | 216 | | | 13,807 | | | 480 | | | — | | | 14,573 | |
Total liabilities | | 962,490 | | | (747,449 | ) | | 1,376,544 | | | 3,454 | | | - | | | 1,595,039 | | | | 2,059,508 | | | 1,401,901 | | | 458,104 | | | 53,979 | | | (2,056,989) | | | 1,916,503 | |
Shareholders’ equity: | | | | | | | | | | | | | | | | | | | | | | | | | | | | | | | | |
Common Stock | | 401 | | - | | 17,411 | | 30,000 | | (47,411 | ) | | 401 | | | | 506 | | | — | | | 17,411 | | | 30,000 | | | (47,411) | | | 506 | |
Other shareholders’ equity | | 147,433 | | | 1,101,038 | | | 196,200 | | | 104,179 | | | (1,401,417 | ) | | 147,433 | | | | 170,448 | | | 2,192,517 | | | 1,844,880 | | | 141,719 | | | (4,179,116) | | | 170,448 | |
Total Consolidated Communications Holdings, Inc. | | | | | | | | | | | | | | | | | | | |
shareholders’ equity | | 147,834 | | 1,101,038 | | 213,611 | | 134,179 | | (1,448,828 | ) | | 147,834 | | |
Total Consolidated Communications Holdings, Inc. shareholders’ equity | | | | 170,954 | | | 2,192,517 | | | 1,862,291 | | | 171,719 | | | (4,226,527) | | | 170,954 | |
Noncontrolling interest | | - | | | - | | | 4,505 | | | - | | | - | | | 4,505 | | | | — | | | — | | | 5,301 | | | — | | | — | | | 5,301 | |
Total shareholders’ equity | | 147,834 | | | 1,101,038 | | | 218,116 | | | 134,179 | | | (1,448,828 | ) | | 152,339 | | | | 170,954 | | | 2,192,517 | | | 1,867,592 | | | 171,719 | | | (4,226,527) | | | 176,255 | |
Total liabilities and shareholders’ equity | | $ | 1,110,324 | | | $ | 353,589 | | | $ | 1,594,660 | | | $ | 137,633 | | | $ | (1,448,828 | ) | | $ | 1,747,378 | | | $ | 2,230,462 | | $ | 3,594,418 | | $ | 2,325,696 | | $ | 225,698 | | $ | (6,283,516) | | $ | 2,092,758 | |
CONSOLIDATED COMMUNICATIONS HOLDINGS, INC. AND SUBSIDIARIES
NOTES TO CONSOLIDATED FINANCIAL STATEMENTS (continued)
YEARS ENDED DECEMBER 31, 2013, 2012 AND 2011
| | | | | | | | | | | | | | | | | | | | |
| | December 31, 2012 | | December 31, 2015 | |
| | Parent | | Subsidiary
Issuer | | Guarantors | | Non-Guarantors | | Eliminations | | Consolidated | | Parent | | Subsidiary Issuer | | Guarantors | | Non-Guarantors | | Eliminations | | Consolidated | |
ASSETS | | | | | | | | | | | | | | | | | | | | | | | | | | | | | | | | | | | | | |
Current assets: | | | | | | | | | | | | | | | | | | | | | | | | | | | | | | | | |
Cash and cash equivalents | | $ | - | | $ | 6,577 | | $ | 8,530 | | $ | 2,747 | | $ | - | | $ | 17,854 | | | $ | — | | $ | 5,877 | | $ | 7,629 | | $ | 2,372 | | $ | — | | $ | 15,878 | |
Accounts receivable, net | | 19 | | 457 | | 49,483 | | 7,998 | | - | | 57,957 | | | | — | | | — | | | 62,460 | | | 6,388 | | | — | | | 68,848 | |
Income taxes receivable | | 4,258 | | - | | 7,886 | | (124 | ) | | - | | 12,020 | | | | 23,390 | | | — | | | 352 | | | 125 | | | — | | | 23,867 | |
Deferred income taxes | | (51 | ) | | (310 | ) | | 8,985 | | 376 | | - | | 9,000 | | |
Prepaid expenses and other current assets | | - | | - | | 10,855 | | 414 | | - | | 11,269 | | | | — | | | — | | | 17,456 | | | 359 | | | — | | | 17,815 | |
Assets of discontinued operations | | - | | | - | | | 1,189 | | | - | | | - | | | 1,189 | | |
Total current assets | | 4,226 | | | 6,724 | | | 86,928 | | | 11,411 | | | - | | | 109,289 | | | | 23,390 | | | 5,877 | | | 87,897 | | | 9,244 | | | — | | | 126,408 | |
| | | | | | | | | | | | | | | | | | | | | | | | | | | | | | | | |
Property, plant and equipment, net | | - | | - | | 855,158 | | 52,514 | | - | | 907,672 | | | | — | | | — | | | 1,043,594 | | | 49,667 | | | — | | | 1,093,261 | |
| | | | | | | | | | | | | | | | | | | | | | | | | | | | | | | | |
Intangibles and other assets: | | | | | | | | | | | | | | | | | | | | | | | | | | | | | | | | |
Investments | | - | | 3,641 | | 106,094 | | 15 | | - | | 109,750 | | | | — | | | 8,171 | | | 97,372 | | | — | | | — | | | 105,543 | |
Investments in subsidiaries | | 958,199 | | 219,955 | | 11,234 | | - | | (1,189,388 | ) | | - | | | | 2,189,142 | | | 2,018,472 | | | 13,567 | | | — | | | (4,221,181) | | | — | |
Goodwill | | - | | - | | 537,265 | | 66,181 | | - | | 603,446 | | | | — | | | — | | | 698,449 | | | 66,181 | | | — | | | 764,630 | |
Other intangible assets | | - | | - | | 40,443 | | 9,087 | | - | | 49,530 | | | | — | | | — | | | 34,410 | | | 9,087 | | | — | | | 43,497 | |
Deferred debt issuance costs, net and other assets | | - | | | 12,788 | | | 1,012 | | | - | | | - | | | 13,800 | | |
Advances due to/from affiliates, net | | | | — | | | 1,548,990 | | | 360,715 | | | 70,083 | | | (1,979,788) | | | — | |
Deferred income taxes | | | | 32,641 | | | — | | | — | | | — | | | (32,641) | | | — | |
Other assets | | | | — | | | — | | | 5,187 | | | — | | | — | | | 5,187 | |
Total assets | | $ | 962,425 | | | $ | 243,108 | | | $ | 1,638,134 | | | $ | 139,208 | | | $ | (1,189,388 | ) | | $ | 1,793,487 | | | $ | 2,245,173 | | $ | 3,581,510 | | $ | 2,341,191 | | $ | 204,262 | | $ | (6,233,610) | | $ | 2,138,526 | |
| | | | | | | | | | | | | | | | | | | | | | | | | | | | | | | | | | | | | |
LIABILITIES AND SHAREHOLDERS’ EQUITY | | | | | | | | | | | | | | | | | | | | | | | | | | | | | | | | |
Current liabilities: | | | | | | | | | | | | | | | | | | | | | | | | | | | | | | | | |
Accounts payable | | $ | - | | $ | - | | $ | 14,954 | | $ | - | | $ | - | | $ | 14,954 | | | $ | — | | $ | — | | $ | 12,576 | | $ | — | | $ | — | | $ | 12,576 | |
Advance billings and customer deposits | | - | | - | | 25,131 | | 2,523 | | - | | 27,654 | | | | — | | | — | | | 26,023 | | | 1,593 | | | — | | | 27,616 | |
Dividends payable | | 15,463 | | - | | - | | - | | - | | 15,463 | | | | 19,551 | | | — | | | — | | | — | | | — | | | 19,551 | |
Accrued compensation | | 36 | | - | | 19,863 | | 2,013 | | - | | 21,912 | | | | — | | | — | | | 21,094 | | | 789 | | | — | | | 21,883 | |
Accrued interest | | | | 136 | | | 9,084 | | | 133 | | | — | | | — | | | 9,353 | |
Accrued expense | | 235 | | 3,373 | | 39,673 | | 3,944 | | - | | 47,225 | | | | 35 | | | 190 | | | 41,201 | | | 958 | | | — | | | 42,384 | |
Current portion of long term debt and capital | | | | | | | | | | | | | | |
lease obligations | | - | | 9,242 | | 300 | | 54 | | - | | 9,596 | | |
Current portion of derivative liability | | - | | 3,164 | | - | | - | | - | | 3,164 | | |
Liabilities of discontinued operations | | - | | | - | | | 4,209 | | | - | | | - | | | 4,209 | | |
Current portion of long term debt and capital lease obligations | | | | — | | | 9,100 | | | 1,745 | | | 92 | | | — | | | 10,937 | |
Total current liabilities | | 15,734 | | | 15,779 | | | 104,130 | | | 8,534 | | | - | | | 144,177 | | | | 19,722 | | | 18,374 | | | 102,772 | | | 3,432 | | | — | | | 144,300 | |
| | | | | | | | | | | | | | | | | | | | | | | | | | | | | | | | |
Long-term debt and capital lease obligations | | - | | 1,203,760 | | 3,611 | | 877 | | - | | 1,208,248 | | | | — | | | 1,372,149 | | | 5,101 | | | 642 | | | — | | | 1,377,892 | |
Advances due to/from affiliates, net | | 817,118 | | (1,934,978 | ) | | 1,137,159 | | (19,299 | ) | | - | | - | | | | 1,979,788 | | | — | | | — | | | — | | | (1,979,788) | | | — | |
Deferred income taxes | | (2,357 | ) | | (3,571 | ) | | 134,550 | | 8,879 | | - | | 137,501 | | | | — | | | 762 | | | 245,579 | | | 22,829 | | | (32,641) | | | 236,529 | |
Pension and postretirement benefit obligations | | - | | - | | 125,706 | | 31,004 | | - | | 156,710 | | | | — | | | — | | | 93,097 | | | 19,869 | | | — | | | 112,966 | |
Other long-term liabilities | | - | | | 3,919 | | | 6,587 | | | 240 | | | - | | | 10,746 | | | | — | | | 1,084 | | | 14,540 | | | 516 | | | — | | | 16,140 | |
Total liabilities | | 830,495 | | | (715,091 | ) | | 1,511,743 | | | 30,235 | | | - | | | 1,657,382 | | | | 1,999,510 | | | 1,392,369 | | | 461,089 | | | 47,288 | | | (2,012,429) | | | 1,887,827 | |
Shareholders’ equity: | | | | | | | | | | | | | | | | | | | | | | | | | | | | | | | | |
Common Stock | | 399 | | - | | 17,411 | | 30,000 | | (47,411 | ) | | 399 | | | | 505 | | | — | | | 17,411 | | | 30,000 | | | (47,411) | | | 505 | |
Other shareholders’ equity | | 131,531 | | | 958,199 | | | 104,805 | | | 78,973 | | | (1,141,977 | ) | | 131,531 | | | | 245,158 | | | 2,189,141 | | | 1,857,655 | | | 126,974 | | | (4,173,770) | | | 245,158 | |
Total Consolidated Communications Holdings, Inc. | | | | | | | | | | | | | | | | | | | |
shareholders’ equity | | 131,930 | | 958,199 | | 122,216 | | 108,973 | | (1,189,388 | ) | | 131,930 | | |
Total Consolidated Communications Holdings, Inc. shareholders’ equity | | | | 245,663 | | | 2,189,141 | | | 1,875,066 | | | 156,974 | | | (4,221,181) | | | 245,663 | |
Noncontrolling interest | | - | | | - | | | 4,175 | | | - | | | - | | | 4,175 | | | | — | | | — | | | 5,036 | | | — | | | — | | | 5,036 | |
Total shareholders’ equity | | 131,930 | | | 958,199 | | | 126,391 | | | 108,973 | | | (1,189,388 | ) | | 136,105 | | | | 245,663 | | | 2,189,141 | | | 1,880,102 | | | 156,974 | | | (4,221,181) | | | 250,699 | |
Total liabilities and shareholders’ equity | | $ | 962,425 | | | $ | 243,108 | | | $ | 1,638,134 | | | $ | 139,208 | | | $ | (1,189,388 | ) | | $ | 1,793,487 | | | $ | 2,245,173 | | $ | 3,581,510 | | $ | 2,341,191 | | $ | 204,262 | | $ | (6,233,610) | | $ | 2,138,526 | |
F-42
CONSOLIDATED COMMUNICATIONS HOLDINGS, INC. AND SUBSIDIARIES
NOTES TO CONSOLIDATED FINANCIAL STATEMENTS (continued)
YEARS ENDED DECEMBER 31, 2013, 2012 AND 2011
Condensed Consolidating Statements of Operations
(amounts in thousands)
| | Year Ended December 31, 2013 | |
| | Parent | | Subsidiary
Issuer | | Guarantors | | Non-Guarantors | | Eliminations | | Consolidated | |
Net revenues | | $ | - | | $ | (60) | | $ | 547,635 | | $ | 68,128 | | $ | (14,126) | | $ | 601,577 | |
Operating expenses: | | | | | | | | | | | | | |
Cost of services and products (exclusive of depreciation and amortization) | | - | | - | | 220,764 | | 14,635 | | (12,947) | | 222,452 | |
Selling, general and administrative expenses | | 3,608 | | 167 | | 113,942 | | 18,876 | | (1,179) | | 135,414 | |
Financing and other transaction costs | | 457 | | - | | 319 | | - | | - | | 776 | |
Depreciation and amortization | | - | | - | | 130,455 | | 8,819 | | - | | 139,274 | |
Operating income (loss) | | (4,065) | | (227) | | 82,155 | | 25,798 | | - | | 103,661 | |
Other income (expense): | | | | | | | | | | | | | |
Interest expense, net of interest income | | 100 | | (86,090) | | 181 | | 42 | | - | | (85,767) | |
Intercompany interest income (expense) | | (103,588) | | 126,918 | | (24,662) | | 1,332 | | - | | - | |
Loss on extinguishment of debt | | - | | (7,657) | | - | | - | | - | | (7,657) | |
Investment income | | - | | 89 | | 37,606 | | - | | - | | 37,695 | |
Equity in earnings of subsidiaries, net | | 98,055 | | 74,479 | | 896 | | - | | (173,430) | | - | |
Other, net | | (18) | | - | | (448) | | 10 | | - | | (456) | |
Income (loss) from continuing operations before income taxes | | (9,516) | | 107,512 | | 95,728 | | 27,182 | | (173,430) | | 47,476 | |
Income tax expense (benefit) | | (40,327) | | 9,457 | | 38,038 | | 10,344 | | - | | 17,512 | |
Income (loss) from continuing operations | | 30,811 | | 98,055 | | 57,690 | | 16,838 | | (173,430) | | 29,964 | |
Discontinued operations, net of tax | | - | | - | | 1,177 | | - | | - | | 1,177 | |
Net income (loss) | | 30,811 | | 98,055 | | 58,867 | | 16,838 | | (173,430) | | 31,141 | |
Less: net income attributable to noncontrolling interest | | - | | - | | 330 | | - | | - | | 330 | |
Net income (loss) attributable to Consolidated Communications Holdings, Inc. | | $ | 30,811 | | $ | 98,055 | | $ | 58,537 | | $ | 16,838 | | $ | (173,430) | | $ | 30,811 | |
| | | | | | | | | | | | | |
Total comprehensive income (loss) attributable to common shareholders | | $ | 30,811 | | $ | 101,616 | | $ | 91,395 | | $ | 25,203 | | $ | (173,430) | | $ | 75,595 | |
| | | | | | | | | | | | | | | | | | | | |
| | Year Ended December 31, 2012 | | | Year Ended December 31, 2016 | |
| | Parent | | Subsidiary
Issuer | | Guarantors | | Non-Guarantors | | Eliminations | | Consolidated | | | Parent | | Subsidiary Issuer | | Guarantors | | Non-Guarantors | | Eliminations | | Consolidated | |
Net revenues | | $ | - | | $ | (15) | | $ | 423,303 | | $ | 68,774 | | $ | (14,185) | | $ | 477,877 | | | $ | — | | $ | (15) | | $ | 697,557 | | $ | 58,785 | | $ | (13,150) | | $ | 743,177 | |
Operating expenses: | | | | | | | | | | | | | | | | | | | | | | | | | | | | | | | | |
Cost of services and products (exclusive of depreciation and amortization) | | - | | - | | 175,759 | | 14,355 | | (14,185) | | 175,929 | | | | — | | | — | | | 323,112 | | | 12,401 | | | (12,721) | | | 322,792 | |
Selling, general and administrative expenses | | 2,530 | | 385 | | 88,664 | | 16,584 | | - | | 108,163 | | | | 3,331 | | | 7 | | | 141,533 | | | 12,669 | | | (429) | | | 157,111 | |
Financing and other transaction costs | | 11,269 | | 9,531 | | - | | - | | - | | 20,800 | | |
Intangible assets impairment | | - | | - | | 1,236 | | - | | - | | 1,236 | | |
Acquisition and other transaction costs | | | | 1,214 | | | — | | | — | | | — | | | — | | | 1,214 | |
Loss on impairment | | | | — | | | — | | | 610 | | | — | | | — | | | 610 | |
Depreciation and amortization | | - | | - | | 107,064 | | 13,268 | | - | | 120,332 | | | | — | | | — | | | 164,577 | | | 9,433 | | | — | | | 174,010 | |
Operating income (loss) | | (13,799) | | (9,931) | | 50,580 | | 24,567 | | - | | 51,417 | | | | (4,545) | | | (22) | | | 67,725 | | | 24,282 | | | — | | | 87,440 | |
Other income (expense): | | | | | | | | | | | | | | | | | | | | | | | | | | | | | | | | |
Interest expense, net of interest income | | (20) | | (71,704) | | (816) | | (64) | | - | | (72,604) | | | | 46 | | | (76,213) | | | (694) | | | 35 | | | — | | | (76,826) | |
Intercompany interest income (expense) | | (50,126) | | 87,717 | | (37,509) | | (82) | | - | | - | | | | (63,773) | | | 97,102 | | | (34,846) | | | 1,517 | | | — | | | — | |
Loss on extinguishment of debt | | - | | (4,455) | | - | | - | | - | | (4,455) | | | | — | | | (6,559) | | | — | | | — | | | — | | | (6,559) | |
Investment income | | - | | 246 | | 30,421 | | - | | - | | 30,667 | | | | — | | | 166 | | | 32,806 | | | — | | | — | | | 32,972 | |
Equity in earnings of subsidiaries, net | | 48,942 | | 48,272 | | 1,435 | | - | | (98,649) | | - | | | | 58,208 | | | 56,600 | | | 711 | | | — | | | (115,519) | | | — | |
Other, net | | - | | 1 | | 617 | | (17) | | - | | 601 | | | | — | | | (328) | | | 1,478 | | | (19) | | | — | | | 1,131 | |
Income (loss) from continuing operations before income taxes | | (15,003) | | 50,146 | | 44,728 | | 24,404 | | (98,649) | | 5,626 | | |
Income (loss) before income taxes | | | | (10,064) | | | 70,746 | | | 67,180 | | | 25,815 | | | (115,519) | | | 38,158 | |
Income tax expense (benefit) | | (20,643) | | 1,204 | | 11,239 | | 8,861 | | - | | 661 | | | | (24,995) | | | 12,538 | | | 25,807 | | | 9,612 | | | — | | | 22,962 | |
Income (loss) from continuing operations | | 5,640 | | 48,942 | | 33,489 | | 15,543 | | (98,649) | | 4,965 | | |
Discontinued operations, net of tax | | - | | - | | 1,206 | | - | | - | | 1,206 | | |
Net income (loss) | | 5,640 | | 48,942 | | 34,695 | | 15,543 | | (98,649) | | 6,171 | | | | 14,931 | | | 58,208 | | | 41,373 | | | 16,203 | | | (115,519) | | | 15,196 | |
Less: net income attributable to noncontrolling interest | | - | | - | | 531 | | - | | - | | 531 | | | | — | | | — | | | 265 | | | — | | | — | | | 265 | |
Net income (loss) attributable to Consolidated Communications Holdings, Inc. | | $ | 5,640 | | $ | 48,942 | | $ | 34,164 | | $ | 15,543 | | $ | (98,649) | | $ | 5,640 | | | $ | 14,931 | | $ | 58,208 | | $ | 41,108 | | $ | 16,203 | | $ | (115,519) | | $ | 14,931 | |
| | | | | | | | | | | | | | | | | | | | | | | | | | | | | | | | |
Total comprehensive income (loss) attributable to common shareholders | | $ | 5,640 | | $ | 53,920 | | $ | 24,816 | | $ | 11,962 | | $ | (98,649) | | $ | (2,311) | | | $ | 3,353 | | $ | 46,630 | | $ | 30,442 | | $ | 14,744 | | $ | (91,816) | | $ | 3,353 | |
F-43
| | | | | | | | | | | | | | | | | | | |
| | Year Ended December 31, 2015 | |
| | Parent | | Subsidiary Issuer | | Guarantors | | Non-Guarantors | | Eliminations | | Consolidated | |
Net revenues | | $ | — | | $ | 121 | | $ | 728,910 | | $ | 60,094 | | $ | (13,388) | | $ | 775,737 | |
Operating expenses: | | | | | | | | | | | | | | | | | | | |
Cost of services and products (exclusive of depreciation and amortization) | | | — | | | — | | | 328,714 | | | 12,567 | | | (12,881) | | | 328,400 | |
Selling, general and administrative expenses | | | 3,160 | | | 150 | | | 156,380 | | | 19,044 | | | (507) | | | 178,227 | |
Acquisition and other transaction costs | | | 1,413 | | | — | | | — | | | — | | | — | | | 1,413 | |
Depreciation and amortization | | | — | | | — | | | 171,232 | | | 8,690 | | | — | | | 179,922 | |
Operating income (loss) | | | (4,573) | | | (29) | | | 72,584 | | | 19,793 | | | — | | | 87,775 | |
Other income (expense): | | | | | | | | | | | | | | | | | | | |
Interest expense, net of interest income | | | (104) | | | (79,680) | | | 154 | | | 12 | | | — | | | (79,618) | |
Intercompany interest income (expense) | | | (153,713) | | | 166,838 | | | (15,917) | | | 2,792 | | | — | | | — | |
Loss on extinguishment of debt | | | — | | | (41,242) | | | — | | | — | | | — | | | (41,242) | |
Investment income | | | — | | | 326 | | | 36,364 | | | — | | | — | | | 36,690 | |
Equity in earnings of subsidiaries, net | | | 93,391 | | | 64,812 | | | 567 | | | — | | | (158,770) | | | — | |
Other, net | | | — | | | (26) | | | (1,346) | | | (129) | | | — | | | (1,501) | |
Income (loss) before income taxes | | | (64,999) | | | 110,999 | | | 92,406 | | | 22,468 | | | (158,770) | | | 2,104 | |
Income tax expense (benefit) | | | (64,118) | | | 17,608 | | | 40,346 | | | 8,939 | | | — | | | 2,775 | |
Net income (loss) | | | (881) | | | 93,391 | | | 52,060 | | | 13,529 | | | (158,770) | | | (671) | |
Less: net income attributable to noncontrolling interest | | | — | | | — | | | 210 | | | — | | | — | | | 210 | |
Net income (loss) attributable to Consolidated Communications Holdings, Inc. | | $ | (881) | | $ | 93,391 | | $ | 51,850 | | $ | 13,529 | | $ | (158,770) | | $ | (881) | |
| | | | | | | | | | | | | | | | | | | |
Total comprehensive income (loss) attributable to common shareholders | | $ | (4,940) | | $ | 89,332 | | $ | 48,434 | | $ | 13,105 | | $ | (150,871) | | $ | (4,940) | |
CONSOLIDATED COMMUNICATIONS HOLDINGS, INC. AND SUBSIDIARIES
NOTES TO CONSOLIDATED FINANCIAL STATEMENTS (continued)
YEARS ENDED DECEMBER 31, 2013, 2012 AND 2011
| | | | | | | | | | | | | | | | | | | | |
| | Year Ended December 31, 2011 | | | Year Ended December 31, 2014 | |
| | Parent | | Subsidiary
Issuer | | Guarantors | | Non-Guarantors | | Eliminations | | Consolidated | | | Parent | | Subsidiary Issuer | | Guarantors | | Non-Guarantors | | Eliminations | | Consolidated | |
Net revenues | | $ | - | | $ | 25 | | $ | 291,500 | | $ | 71,249 | | $ | (13,771) | | $ | 349,003 | | | $ | — | | $ | (7) | | $ | 585,148 | | $ | 64,380 | | $ | (13,783) | | $ | 635,738 | |
Operating expenses: | | | | | | | | | | | | | | | | | | | | | | | | | | | | | | | | |
Cost of services and products (exclusive of depreciation and amortization) | | - | | - | | 120,750 | | 14,732 | | (13,771) | | 121,711 | | | | — | | | — | | | 242,354 | | | 13,391 | | | (13,084) | | | 242,661 | |
Selling, general and administrative expenses | | 2,249 | | 2,724 | | 56,677 | | 16,074 | | - | | 77,724 | | | | 3,975 | | | 126 | | | 119,649 | | | 17,585 | | | (699) | | | 140,636 | |
Financing and other transaction costs | | - | | - | | 2,649 | | - | | - | | 2,649 | | |
Acquisition and other transaction costs | | | | 10,808 | | | 581 | | | 428 | | | — | | | — | | | 11,817 | |
Depreciation and amortization | | - | | - | | 72,999 | | 15,091 | | - | | 88,090 | | | | — | | | — | | | 141,673 | | | 7,762 | | | — | | | 149,435 | |
Operating income (loss) | | (2,249) | | (2,699) | | 38,425 | | 25,352 | | - | | 58,829 | | | | (14,783) | | | (714) | | | 81,044 | | | 25,642 | | | — | | | 91,189 | |
Other income (expense): | | | | | | | | | | | | | | | | | | | | | | | | | | | | | | | | |
Interest expense, net of interest income | | - | | (48,095) | | (1,130) | | (166) | | - | | (49,391) | | | | 36 | | | (82,617) | | | 55 | | | (11) | | | — | | | (82,537) | |
Intercompany interest income (expense) | | (40,283) | | 80,142 | | (39,407) | | (452) | | - | | - | | | | (108,366) | | | 125,932 | | | (19,677) | | | 2,111 | | | — | | | — | |
Loss on extinguishment of debt | | | | — | | | (13,785) | | | — | | | — | | | — | | | (13,785) | |
Investment income | | - | | 246 | | 27,597 | | - | | - | | 27,843 | | | | — | | | (5) | | | 34,521 | | | — | | | — | | | 34,516 | |
Equity in earnings of subsidiaries, net | | 53,217 | | 34,399 | | 1,542 | | - | | (89,158) | | - | | | | 94,458 | | | 77,156 | | | 870 | | | — | | | (172,484) | | | — | |
Other, net | | - | | - | | 1,422 | | (1,274) | | - | | 148 | | | | 53 | | | (553) | | | (236) | | | (232) | | | — | | | (968) | |
Income (loss) from continuing operations before income taxes | | 10,685 | | 63,993 | | 28,449 | | 23,460 | | (89,158) | | 37,429 | | |
Income (loss) before income taxes | | | | (28,602) | | | 105,414 | | | 96,577 | | | 27,510 | | | (172,484) | | | 28,415 | |
Income tax expense (benefit) | | (15,725) | | 10,776 | | 9,219 | | 8,871 | | - | | 13,141 | | | | (43,669) | | | 10,956 | | | 35,022 | | | 10,718 | | | — | | | 13,027 | |
Income (loss) from continuing operations | | 26,410 | | 53,217 | | 19,230 | | 14,589 | | (89,158) | | 24,288 | | |
Discontinued operations, net of tax | | - | | - | | 2,694 | | - | | - | | 2,694 | | |
Net income (loss) | | 26,410 | | 53,217 | | 21,924 | | 14,589 | | (89,158) | | 26,982 | | | | 15,067 | | | 94,458 | | | 61,555 | | | 16,792 | | | (172,484) | | | 15,388 | |
Less: net income attributable to noncontrolling interest | | - | | - | | 572 | | - | | - | | 572 | | | | — | | | — | | | 321 | | | — | | | — | | | 321 | |
Net income (loss) attributable to Consolidated Communications Holdings, Inc. | | $ | 26,410 | | $ | 53,217 | | $ | 21,352 | | $ | 14,589 | | $ | (89,158) | | $ | 26,410 | | | $ | 15,067 | | $ | 94,458 | | $ | 61,234 | | $ | 16,792 | | $ | (172,484) | | $ | 15,067 | |
| | | | | | | | | | | | | | | | | | | | | | | | | | | | | | | | |
Total comprehensive income (loss) attributable to common shareholders | | $ | 26,410 | | $ | 60,814 | | $ | 11,830 | | $ | 10,152 | | $ | (89,158) | | $ | 20,048 | | | $ | (15,573) | | $ | 63,818 | | $ | 43,418 | | $ | 2,780 | | $ | (110,016) | | $ | (15,573) | |
Condensed Consolidating Statements of Cash Flows
(amounts in thousands)
| | Year Ended December 31, 2013 | | | | | | | | | | | | | | | | | |
| | Parent | | Subsidiary
Issuer | | Guarantors | | Non-Guarantors | | Consolidated | | | Year Ended December 31, 2016 | |
Net cash (used in) provided by continuing operations | | $ | (88,251) | | $ | 36,811 | | $ | 195,591 | | $ | 24,379 | | $ | 168,530 | | |
Net cash used in discontinued operations | | - | | - | | (4,174) | | - | | (4,174) | | |
| | | Parent | | Subsidiary Issuer | | Guarantors | | Non-Guarantors | | Consolidated | |
Net cash (used in) provided by operating activities | | (88,251) | | 36,811 | | 191,417 | | 24,379 | | 164,356 | | | $ | (23,634) | | $ | 13,315 | | $ | 200,098 | | $ | 28,454 | | $ | 218,233 | |
| | | | | | | | | | | | | | | | | | | | | | | | | | | |
Cash flows from investing activities: | | | | | | | | | | | | | | | | | | | | | | | | | | | |
Business acquisition, net of cash acquired | | | | (13,422) | | | — | | | — | | | — | | | (13,422) | |
Purchases of property, plant and equipment | | - | | - | | (100,139) | | (7,224) | | (107,363) | | | | — | | | — | | | (111,389) | | | (13,803) | | | (125,192) | |
Purchase of investments | | - | | - | | (403) | | - | | (403) | | |
Proceeds from sale of assets | | - | | - | | 282 | | 48 | | 330 | | | | — | | | — | | | 198 | | | 10 | | | 208 | |
Net cash used in continuing operations | | - | | - | | (100,260) | | (7,176) | | (107,436) | | |
Net cash provided by discontinued operations | | - | | - | | 2,331 | | - | | 2,331 | | |
Net cash used in investing activities | | - | | - | | (97,929) | | (7,176) | | (105,105) | | |
Proceeds from business dispositions | | | | 30,119 | | | — | | | — | | | — | | | 30,119 | |
Net cash provided by (used in) investing activities | | | | 16,697 | | | — | | | (111,191) | | | (13,793) | | | (108,287) | |
| | | | | | | | | | | | | | | | | | | | | | | | | | | |
Cash flows from financing activities: | | | | | | | | | | | | | | | | | | | | | | | | | | | |
Proceeds from issuance of long-term debt | | - | | 989,450 | | - | | - | | 989,450 | | | | — | | | 936,750 | | | — | | | — | | | 936,750 | |
Payment of capital lease obligation | | - | | - | | (462) | | (54) | | (516) | | | | — | | | — | | | (2,743) | | | (142) | | | (2,885) | |
Payment on long-term debt | | - | | (990,961) | | - | | - | | (990,961) | | | | — | | | (943,050) | | | — | | | — | | | (943,050) | |
Payment of financing costs | | - | | (6,576) | | - | | - | | (6,576) | | | | — | | | (9,912) | | | — | | | — | | | (9,912) | |
Share repurchases for minimum tax withholding | | | | (1,231) | | | — | | | — | | | — | | | (1,231) | |
Dividends on common stock | | (62,064) | | - | | - | | - | | (62,064) | | | | (78,419) | | | — | | | — | | | — | | | (78,419) | |
Purchase and retirement of common stock | | (887) | | - | | - | | - | | (887) | | |
Transactions with affiliates, net | | 151,202 | | (35,215) | | (99,190) | | (16,797) | | - | | | | 86,587 | | | 24,084 | | | (93,780) | | | (16,891) | | | — | |
Net cash provided by (used in) financing activities | | 88,251 | | (43,302) | | (99,652) | | (16,851) | | (71,554) | | | | 6,937 | | | 7,872 | | | (96,523) | | | (17,033) | | | (98,747) | |
(Decrease) increase in cash and cash equivalents | | - | | (6,491) | | (6,164) | | 352 | | (12,303) | | |
Increase (decrease) in cash and cash equivalents | | | | — | | | 21,187 | | | (7,616) | | | (2,372) | | | 11,199 | |
Cash and cash equivalents at beginning of period | | - | | 6,577 | | 8,530 | | 2,747 | | 17,854 | | | | — | | | 5,877 | | | 7,629 | | | 2,372 | | | 15,878 | |
Cash and cash equivalents at end of period | | $ | - | | $ | 86 | | $ | 2,366 | | $ | 3,099 | | $ | 5,551 | | | $ | — | | $ | 27,064 | | $ | 13 | | $ | — | | $ | 27,077 | |
F-44
| | | | | | | | | | | | | | | | |
| | Year Ended December 31, 2015 | |
| | Parent | | Subsidiary Issuer | | Guarantors | | Non-Guarantors | | Consolidated | |
Net cash (used in) provided by operating activities | | $ | (119,472) | | $ | 76,962 | | $ | 240,372 | | $ | 21,317 | | $ | 219,179 | |
| | | | | | | | | | | | | | | | |
Cash flows from investing activities: | | | | | | | | | | | | | | | | |
Purchases of property, plant and equipment | | | — | | | — | | | (126,168) | | | (7,766) | | | (133,934) | |
Proceeds from sale of assets | | | — | | | — | | | 13,535 | | | 13 | | | 13,548 | |
Proceeds from sale of investments | | | — | | | — | | | 846 | | | — | | | 846 | |
Net cash used in investing activities | | | — | | | — | | | (111,787) | | | (7,753) | | | (119,540) | |
| | | | | | | | | | | | | | | | |
Cash flows from financing activities: | | | | | | | | | | | | | | | | |
Proceeds from bond offering | | | — | | | 294,780 | | | — | | | — | | | 294,780 | |
Proceeds from issuance of long-term debt | | | — | | | 69,000 | | | — | | | — | | | 69,000 | |
Payment of capital lease obligation | | | — | | | — | | | (1,029) | | | (78) | | | (1,107) | |
Payment on long-term debt | | | — | | | (107,100) | | | — | | | — | | | (107,100) | |
Redemption of senior notes | | | — | | | (261,874) | | | — | | | — | | | (261,874) | |
Payment of financing costs | | | — | | | (4,805) | | | — | | | — | | | (4,805) | |
Share repurchases for minimum tax withholding | | | (1,125) | | | — | | | — | | | — | | | (1,125) | |
Dividends on common stock | | | (78,209) | | | — | | | — | | | — | | | (78,209) | |
Transactions with affiliates, net | | | 198,806 | | | (66,026) | | | (120,747) | | | (12,033) | | | — | |
Net cash provided by (used in) financing activities | | | 119,472 | | | (76,025) | | | (121,776) | | | (12,111) | | | (90,440) | |
Increase (decrease) in cash and cash equivalents | | | — | | | 937 | | | 6,809 | | | 1,453 | | | 9,199 | |
Cash and cash equivalents at beginning of period | | | — | | | 4,940 | | | 820 | | | 919 | | | 6,679 | |
Cash and cash equivalents at end of period | | $ | — | | $ | 5,877 | | $ | 7,629 | | $ | 2,372 | | $ | 15,878 | |
| | | | | | | | | | | | | | | | |
| | Year Ended December 31, 2014 | |
| | | | | Subsidiary | | | | | | | | | | |
| | Parent | | Issuer | | Guarantors | | Non-Guarantors | | Consolidated | |
Net cash (used in) provided by operating activities | | $ | (71,646) | | $ | 37,972 | | $ | 196,186 | | $ | 25,273 | | $ | 187,785 | |
| | | | | | | | | | | | | | | | |
Cash flows from investing activities: | | | | | | | | | | | | | | | | |
Business acquisition, net of cash acquired | | | (139,558) | | | — | | | — | | | — | | | (139,558) | |
Purchases of property, plant and equipment | | | — | | | — | | | (103,509) | | | (5,489) | | | (108,998) | |
Purchase of investments | | | — | | | — | | | (100) | | | — | | | (100) | |
Proceeds from sale of assets | | | — | | | — | | | 1,740 | | | 55 | | | 1,795 | |
Net cash used in investing activities | | | (139,558) | | | — | | | (101,869) | | | (5,434) | | | (246,861) | |
| | | | | | | | | | | | | | | | |
Cash flows from financing activities: | | | | | | | | | | | | | | | | |
Proceeds from bond offering | | | — | | | 200,000 | | | — | | | — | | | 200,000 | |
Proceeds from issuance of long-term debt | | | — | | | 80,000 | | | — | | | — | | | 80,000 | |
Payment of capital lease obligation | | | — | | | — | | | (638) | | | (65) | | | (703) | |
Payment on long-term debt | | | — | | | (63,100) | | | — | | | — | | | (63,100) | |
Partial redemption of senior notes | | | — | | | (84,127) | | | — | | | — | | | (84,127) | |
Payment of financing costs | | | — | | | (7,438) | | | — | | | — | | | (7,438) | |
Share repurchases for minimum tax withholding | | | (1,856) | | | — | | | — | | | — | | | (1,856) | |
Dividends on common stock | | | (62,341) | | | — | | | — | | | — | | | (62,341) | |
Transactions with affiliates, net | | | 275,632 | | | (158,453) | | | (95,225) | | | (21,954) | | | — | |
Other | | | (231) | | | — | | | — | | | — | | | (231) | |
Net cash provided by (used in) financing activities | | | 211,204 | | | (33,118) | | | (95,863) | | | (22,019) | | | 60,204 | |
(Decrease) increase in cash and cash equivalents | | | — | | | 4,854 | | | (1,546) | | | (2,180) | | | 1,128 | |
Cash and cash equivalents at beginning of period | | | — | | | 86 | | | 2,366 | | | 3,099 | | | 5,551 | |
Cash and cash equivalents at end of period | | $ | — | | $ | 4,940 | | $ | 820 | | $ | 919 | | $ | 6,679 | |
CONSOLIDATED COMMUNICATIONS HOLDINGS, INC. AND SUBSIDIARIES
NOTES TO CONSOLIDATED FINANCIAL STATEMENTS (continued)
YEARS ENDED DECEMBER 31, 2013, 2012 AND 2011
| | Year Ended December 31, 2012 | |
| | Parent | | Subsidiary
Issuer | | Guarantors | | Non-Guarantors | | Consolidated | |
Net cash (used in) provided by continuing operations | | $ | (52,318) | | $ | 13,106 | | $ | 137,386 | | $ | 21,558 | | $ | 119,732 | |
Net cash provided by discontinued operations | | - | | - | | 3,483 | | - | | 3,483 | |
Net cash (used in) provided by operating activities | | (52,318) | | 13,106 | | 140,869 | | 21,558 | | 123,215 | |
| | | | | | | | | | | |
Cash flows from investing activities: | | | | | | | | | | | |
Business acquisition, net of cash acquired | | (385,346) | | - | | - | | - | | (385,346) | |
Purchases of property, plant and equipment | | - | | - | | (70,948) | | (6,050) | | (76,998) | |
Purchase of investments | | - | | - | | (6,728) | | - | | (6,728) | |
Proceeds from sale of assets | | - | | - | | 882 | | 42 | | 924 | |
Other | | (314) | | - | | - | | - | | (314) | |
Net cash used in continuing operations | | (385,660) | | - | | (76,794) | | (6,008) | | (468,462) | |
Net cash used in discontinued operations | | - | | - | | (97) | | - | | (97) | |
Net cash used in investing activities | | (385,660) | | - | | (76,891) | | (6,008) | | (468,559) | |
| | | | | | | | | | | |
Cash flows from financing activities: | | | | | | | | | | | |
Proceeds on bond offering | | - | | 298,035 | | - | | - | | 298,035 | |
Proceeds from issuance of long-term debt | | - | | 544,850 | | - | | - | | 544,850 | |
Payment of capital lease obligation | | - | | - | | (183) | | (45) | | (228) | |
Payment on long-term debt | | - | | (510,038) | | - | | - | | (510,038) | |
Payment of financing costs | | - | | (18,616) | | - | | - | | (18,616) | |
Distributions to noncontrolling interest | | - | | - | | 3,150 | | (5,000) | | (1,850) | |
Dividends on common stock | | (54,100) | | - | | - | | - | | (54,100) | |
Purchase and retirement of common stock | | (559) | | - | | - | | - | | (559) | |
Transactions with affiliates, net | | 492,637 | | (424,129) | | (58,495) | | (10,013) | | - | |
Net cash provided by (used in) financing activities | | 437,978 | | (109,898) | | (55,528) | | (15,058) | | 257,494 | |
(Decrease) increase in cash and cash equivalents | | - | | (96,792) | | 8,450 | | 492 | | (87,850) | |
Cash and cash equivalents at beginning of period | | - | | 103,369 | | 80 | | 2,255 | | 105,704 | |
Cash and cash equivalents at end of period | | $ | - | | $ | 6,577 | | $ | 8,530 | | $ | 2,747 | | $ | 17,854 | |
F-45
Report of Independent Certified Public Accountants
CONSOLIDATED COMMUNICATIONS HOLDINGS, INC. AND SUBSIDIARIES
NOTES TO CONSOLIDATED FINANCIAL STATEMENTS (continued)
YEARS ENDED DECEMBER 31, 2013, 2012 AND 2011
| | Year Ended December 31, 2011 | |
| | Parent | | Subsidiary
Issuer | | Guarantors | | Non-Guarantors | | Consolidated | |
Net cash (used in) provided by continuing operations | | $ | (27,033) | | $ | 22,335 | | $ | 98,764 | | $ | 30,236 | | $ | 124,302 | |
Net cash provided by discontinued operations | | - | | - | | 5,202 | | - | | 5,202 | |
Net cash (used in) provided by operating activities | | (27,033) | | 22,335 | | 103,966 | | 30,236 | | 129,504 | |
| | | | | | | | | | | |
Cash flows from investing activities: | | | | | | | | | | | |
Purchases of property, plant and equipment | | - | | - | | (35,212) | | (6,582) | | (41,794) | |
Proceeds from sale of assets | | - | | - | | 511 | | 329 | | 840 | |
Other | | - | | - | | 272 | | - | | 272 | |
Net cash used in continuing operations | | - | | - | | (34,429) | | (6,253) | | (40,682) | |
Net cash used in discontinued operations | | - | | - | | (119) | | - | | (119) | |
Net cash used in investing activities | | - | | - | | (34,548) | | (6,253) | | (40,801) | |
| | | | | | | | | | | |
Cash flows from financing activities: | | | | | | | | | | | |
Payment of capital lease obligation | | - | | - | | (113) | | (36) | | (149) | |
Payment of financing costs | | - | | (3,471) | | - | | - | | (3,471) | |
Dividends on common stock | | (46,307) | | - | | - | | - | | (46,307) | |
Purchase and retirement of common stock | | (726) | | - | | - | | - | | (726) | |
Transactions with affiliates, net | | 74,066 | | 19,107 | | (69,277) | | (23,896) | | - | |
Net cash provided by (used in) financing activities | | 27,033 | | 15,636 | | (69,390) | | (23,932) | | (50,653) | |
Increase in cash and cash equivalents | | - | | 37,971 | | 28 | | 51 | | 38,050 | |
Cash and cash equivalents at beginning of period | | - | | 65,398 | | 52 | | 2,204 | | 67,654 | |
Cash and cash equivalents at end of period | | $ | - | | $ | 103,369 | | $ | 80 | | $ | 2,255 | | $ | 105,704 | |
F-46
Table of Contents
INDEPENDENT AUDITORS REPORT
To theThe Partners of Pennsylvania RSA No. 6 (II)
Limited Partnership:Partnership
We have audited the accompanying financial statements of Pennsylvania RSA No. 6 (II)6(II) Limited Partnership, (the “Partnership”) which comprise the balance sheetsheets as of December 31, 2012,2015 and 2014, and the related statements of operations,income and comprehensive income, changes in partners’ capital and cash flows for each of the two years in the periodthen ended, December 31, 2012, and the related notes to the financial statements.
Management’sManagement's Responsibility for the Financial Statements
Management is responsible for the preparation and fair presentation of these financial statements in accordance with accounting principlesU.S. generally accepted in the United States of America;accounting principles; this includes the design, implementation, and maintenance of internal control relevant to the preparation and fair presentation of financial statements that are free from material misstatement, whether due to fraud or error.
Auditors’Auditor's Responsibility
Our responsibility is to express an opinion on these financial statements based on our audits. We conducted our audits in accordance with auditing standards generally accepted in the United States of America.States. Those standards require that we plan and perform the audit to obtain reasonable assurance about whether the financial statements are free from material misstatement.
An audit involves performing procedures to obtain audit evidence about the amounts and disclosures in the financial statements. The procedures selected depend on the auditor’sauditor's judgment, including the assessment of the risks of material misstatement of the financial statements, whether due to fraud or error. In making those risk assessments, the auditor considers internal control relevant to the Partnership’sentity's preparation and fair presentation of the financial statements in order to design audit procedures that are appropriate in the circumstances, but not for the purpose of expressing an opinion on the effectiveness of the Partnership’sentity's internal control. Accordingly, we express no such opinion. An audit also includes evaluating the appropriateness of accounting policies used and the reasonableness of significant accounting estimates made by management, as well as evaluating the overall presentation of the financial statements.
We believe that the audit evidence we have obtained is sufficient and appropriate to provide a basis for our audit opinion.
Opinion
In our opinion, the financial statements referred to above present fairly, in all material respects, the financial position of Pennsylvania RSA No. 6 (II)6(II) Limited Partnership as ofat December 31, 2012,2015 and 2014, and the results of its operations and its cash flows for each of the two years then ended in the period ended December 31, 2012 in accordanceconformity with accounting principlesU.S. generally accepted in the United States of America.accounting principles.
Other Matters/s/ Ernst & Young LLP
The accompanying balance sheet of the Partnership as of December 31, 2013, and the related statement of operations, change in partner’s capital and cash flows for the year then ended were not audited, reviewed, or compiled by us and, accordingly, we do not express an opinion or any other form of assurance on them.Orlando, FL
February 26, 2016
| /s/ Deloitte & Touche LLP
|
Atlanta, GA
March 12, 2013
F-47
Pennsylvania RSA No. 6 (II)6(II) Limited Partnership
Balance Sheets - As of December 31, 2013 (unaudited)2016 and 20122015
(Dollars in Thousands)
| | | | | | | |
| | 2016 | | 2015 | |
| | (Unaudited) | | (Audited) | |
ASSETS | | | | | | | |
| | | | | | | |
CURRENT ASSETS: | | | | | | | |
Due from affiliate | | $ | 5,199 | | $ | 2,621 | |
Accounts receivable, net of allowances of $713 and $938 | | | 22,311 | | | 18,136 | |
Unbilled revenue | | | 958 | | | 1,031 | |
Prepaid expenses | | | 768 | | | 259 | |
Total current assets | | | 29,236 | | | 22,047 | |
| | | | | | | |
PROPERTY, PLANT AND EQUIPMENT - NET | | | 17,568 | | | 18,525 | |
OTHER ASSETS | | | 6,927 | | | 6,718 | |
TOTAL ASSETS | | $ | 53,731 | | $ | 47,290 | |
| | | | | | | |
LIABILITIES AND PARTNERS’ CAPITAL | | | | | | | |
| | | | | | | |
CURRENT LIABILITIES: | | | | | | | |
Accounts payable and accrued liabilities | | $ | 4,772 | | $ | 4,141 | |
Advance billings and other | | | 4,076 | | | 4,397 | |
Financing obligation | | | 47 | | | 46 | |
Deferred rent | | | 13 | | | 13 | |
Total current liabilities | | | 8,908 | | | 8,597 | |
| | | | | | | |
LONG TERM LIABILITIES: | | | | | | | |
Financing obligation | | | 421 | | | 423 | |
Deferred rent | | | 1,076 | | | 1,030 | |
Total long term liabilities | | | 1,497 | | | 1,453 | |
Total liabilities | | | 10,405 | | | 10,050 | |
| | | | | | | |
PARTNERS’ CAPITAL | | | | | | | |
General Partner's interest | | | 22,153 | | | 19,040 | |
Limited Partners' interest | | | 21,173 | | | 18,200 | |
Total partners' capital | | | 43,326 | | | 37,240 | |
| | | | | | | |
TOTAL LIABILITIES AND PARTNERS’ CAPITAL | | $ | 53,731 | | $ | 47,290 | |
See notes to financial statements.
ASSETS | | 2013 | | 2012 | |
| | (unaudited) | | | |
CURRENT ASSETS: | | | | | |
Accounts receivable, net of allowance of $225 and $143 | | $ | 12,176 | | $ | 14,750 | |
Unbilled revenue | | 919 | | 890 | |
Due from affiliate | | 12,113 | | 7,374 | |
| | | | | |
Total current assets | | 25,208 | | 23,014 | |
| | | | | |
PROPERTY, PLANT AND EQUIPMENT—Net | | 12,651 | | 12,412 | |
| | | | | |
OTHER ASSETS | | 190 | | 27 | |
| | | | | |
TOTAL ASSETS | | $ | 38,049 | | $ | 35,453 | |
| | | | | |
LIABILITIES AND PARTNERS’ CAPITAL | | | | | |
| | | | | |
CURRENT LIABILITIES: | | | | | |
Accounts payable and accrued liabilities | | $ | 3,329 | | $ | 3,804 | |
Advance billings and customer deposits | | 3,857 | | 3,648 | |
| | | | | |
Total current liabilities | | 7,186 | | 7,452 | |
| | | | | |
LONG TERM LIABILITIES | | 627 | | 411 | |
| | | | | |
Total liabilities | | 7,813 | | 7,863 | |
| | | | | |
PARTNERS’ CAPITAL | | 30,236 | | 27,590 | |
| | | | | |
TOTAL LIABILITIES AND PARTNERS’ CAPITAL | | $ | 38,049 | | $ | 35,453 | |
| | | | | |
See Notes to the financial statements. | | | | | |
F-48
Pennsylvania RSA No. 6 (II)6(II) Limited Partnership
Statements of Operations -Income and Comprehensive Income – For the Years Ended December 31, 2013 (unaudited), 20122016, 2015, and 20112014
| | 2013 | | 2012 | | 2011 | |
| | (unaudited) | | | | | |
OPERATING REVENUE: | | | | | | | |
Service revenue | | $ | 120,364 | | $ | 112,987 | | $ | 112,822 | |
Equipment and other | | 23,360 | | 22,699 | | 22,758 | |
| | | | | | | |
Total operating revenue | | 143,724 | | 135,686 | | 135,580 | |
| | | | | | | |
OPERATING COSTS AND EXPENSES: | | | | | | | |
Cost of service (exclusive of depreciation and amortization) | | 41,062 | | 38,665 | | 45,726 | |
Cost of equipment | | 25,150 | | 25,416 | | 25,347 | |
Selling, general and administrative | | 37,387 | | 35,758 | | 33,139 | |
Depreciation and amortization | | 2,500 | | 2,446 | | 2,619 | |
| | | | | | | |
Total operating costs and expenses | | 106,099 | | 102,285 | | 106,831 | |
| | | | | | | |
OPERATING INCOME | | 37,625 | | 33,401 | | 28,749 | |
| | | | | | | |
INTEREST INCOME, NET | | 21 | | 15 | | 26 | |
| | | | | | | |
NET INCOME | | $ | 37,646 | | $ | 33,416 | | $ | 28,775 | |
| | | | | | | |
Allocation of Net Income | | | | | | | |
Limited Partners | | $ | 18,398 | | $ | 16,330 | | $ | 14,062 | |
General Partner | | $ | 19,248 | | $ | 17,086 | | $ | 14,713 | |
| | | | | | | |
| | | | | | | |
See notes to financial statements. | | | | | | | |
F-49
| | | | | | | | | | |
| | | | | | | | | | |
| | 2016 | | 2015 | | 2014 | |
| | (Unaudited) | | Audited | | Audited | |
OPERATING REVENUE: | | | | | | | | | | |
Service revenue | | $ | 114,071 | | $ | 121,247 | | $ | 125,490 | |
Equipment revenue | | | 26,780 | | | 28,121 | | | 17,135 | |
Other | | | 8,077 | | | 8,007 | | | 9,177 | |
Total operating revenue | | | 148,928 | | | 157,375 | | | 151,802 | |
| | | | | | | | | | |
OPERATING EXPENSES: | | | | | | | | | | |
Cost of service (exclusive of depreciation and amortization) | | | 51,138 | | | 47,596 | | | 44,109 | |
Cost of equipment | | | 31,532 | | | 35,448 | | | 30,428 | |
Depreciation and amortization | | | 3,334 | | | 3,223 | | | 2,520 | |
Selling, general and administrative | | | 32,599 | | | 36,075 | | | 38,682 | |
Total operating expenses | | | 118,603 | | | 122,342 | | | 115,739 | |
| | | | | | | | | | |
OPERATING INCOME | | | 30,325 | | | 35,033 | | | 36,063 | |
| | | | | | | | | | |
INTEREST INCOME, NET | | | 11 | | | 114 | | | 94 | |
| | | | | | | | | | |
NET INCOME AND COMPREHENSIVE INCOME | | $ | 30,336 | | $ | 35,147 | | $ | 36,157 | |
| | | | | | | | | | |
Allocation of Net Income: | | | | | | | | | | |
General Partners | | $ | 15,512 | | $ | 17,969 | | $ | 18,486 | |
Limited Partners | | $ | 14,824 | | $ | 17,178 | | $ | 17,671 | |
Table of Contents
Pennsylvania RSA No. 6 (II) Limited Partnership
Statements of Changes in Partners’ Capital - Years Ended December 31, 2013 (unaudited), 2012 and 2011
| | General Partner | | Limited Partners | | | |
| | Cellco
Partnership
| | Cellco
Partnership
| | Consolidated
Communications
Enterprise
Services, Inc. | | Venus
Cellular
Telephone
Company, Inc. | | Total
Partners’
Capital
| |
BALANCE—January 1, 2011 | | $ | 13,242 | | $ | 2,210 | | $ | 6,130 | | $ | 4,317 | | $ | 25,899 | |
| | | | | | | | | | | |
Distributions | | (17,384 | ) | (2,900 | ) | (8,048 | ) | (5,668 | ) | (34,000 | ) |
| | | | | | | | | | | |
Net Income | | 14,713 | | 2,453 | | 6,812 | | 4,797 | | 28,775 | |
| | | | | | | | | | | |
BALANCE—December 31, 2011 | | $ | 10,571 | | 1,763 | | 4,894 | | 3,446 | | 20,674 | |
| | | | | | | | | | | |
Distributions | | (13,549 | ) | (2,260 | ) | (6,273 | ) | (4,418 | ) | (26,500 | ) |
| | | | | | | | | | | |
Net Income | | 17,086 | | 2,850 | | 7,909 | | 5,571 | | 33,416 | |
| | | | | | | | | | | |
BALANCE—December 31, 2012 | | 14,108 | | 2,353 | | 6,530 | | 4,599 | | 27,590 | |
| | | | | | | | | | | |
Distributions | | (17,895 | ) | (2,986 | ) | (8,284 | ) | (5,835 | ) | (35,000 | ) |
| | | | | | | | | | | |
Net Income | | 19,248 | | 3,212 | | 8,911 | | 6,275 | | 37,646 | |
| | | | | | | | | | | |
BALANCE—December 31, 2013
(unaudited) | | $ | 15,461 | | $ | 2,579 | | $ | 7,157 | | $ | 5,039 | | $ | 30,236 | |
| | | | | | | | | | | |
See notes to financial statements. | | | | | | | | | | | |
F-50
Table of Contents
Pennsylvania RSA No. 6 (II) Limited Partnership
Statements of Cash Flows - Years Ended December 31, 2013 (unaudited), 2012 and 2011
| | 2013 | | 2012 | | 2011 | |
CASH FLOWS FROM OPERATING ACTIVITIES: | | (unaudited) | | | | | |
Net Income | | $ | 37,646 | | $ | 33,416 | | $ | 28,775 | |
Adjustments to reconcile net income to net cash provided by operating activities: | | | | | | | |
Depreciation and amortization | | 2,500 | | 2,446 | | 2,619 | |
Provision for losses on accounts receivable | | 531 | | 270 | | 722 | |
Changes in certain assets and liabilities: | | | | | | | |
Accounts receivable | | 2,043 | | (6,015 | ) | (1,644 | ) |
Unbilled revenue | | (29 | ) | 201 | | (53 | ) |
Prepaid expenses and other current assets | | - | | 22 | | - | |
Other assets | | (163 | ) | - | | - | |
Accounts payable and accrued liabilities | | (177 | ) | 85 | | 564 | |
Advance billings and customer deposits | | 209 | | 266 | | 263 | |
Long term liabilites | | 216 | | 56 | | 81 | |
Net cash provided by operating activities | | 42,776 | | 30,747 | | 31,327 | |
| | | | | | | |
CASH FLOWS FROM INVESTING ACTIVITIES: | | | | | | | |
Capital expenditures, net | | (3,037 | ) | (2,990 | ) | (2,151 | ) |
Change in due from affiliate, net | | (4,739 | ) | (1,257 | ) | 4,824 | |
Net cash used in investing activities | | (7,776 | ) | (4,247 | ) | 2,673 | |
| | | | | | | |
CASH FLOWS FROM FINANCING ACTIVITIES: | | | | | | | |
Distributions to partners | | (35,000 | ) | (26,500 | ) | (34,000 | ) |
| | | | | | | |
Net cash used in financing activities | | (35,000 | ) | (26,500 | ) | (34,000 | ) |
CHANGE IN CASH | | - | | - | | - | |
| | | | | | | |
CASH—Beginning of year | | - | | - | | - | |
| | | | | | | |
CASH—End of year | | $ | - | | $ | - | | $ | - | |
| | | | | | | |
CASH PAID FOR INTEREST | | $ | - | | $ | - | | $ | - | |
| | | | | | | |
NONCASH TRANSACTIONS FROM INVESTING ACTIVITIES: | | | | | | | |
| | | | | | | |
Accruals for Capital Expenditures | | $ | 102 | | $ | 400 | | $ | 7 | |
See notes to financial statements.
F-51
Pennsylvania RSA No. 6 (II)6(II) Limited Partnership
Statements of Changes in Partners’ Capital – For the Years Ended December 31, 2016, 2015, and 2014
(Dollars in Thousands)
| | | | | | | | | | | | | | | | |
| | General Partner | | Limited Partners | | | | |
| | | | | | | | Consolidated | | | | | | | |
| | | | | | | | Communications | | Venus Cellular | | | | |
| | Cellco | | Cellco | | Enterprise | | Telephone | | Total Partners’ | |
| | Partnership | | Partnership | | Services, Inc. | | Company, Inc. | | Capital | |
| | | | | | | | | | | | | | | | |
BALANCE—January 1st, 2014 | | $ | 15,461 | | $ | 2,579 | | $ | 7,157 | | $ | 5,039 | | $ | 30,236 | |
| | | | | | | | | | | | | | | | |
Distributions | | | (18,918) | | | (3,156) | | | (8,758) | | | (6,168) | | | (37,000) | |
| | | | | | | | | | | | | | | | |
Net Income | | | 18,486 | | | 3,084 | | | 8,558 | | | 6,029 | | | 36,157 | |
| | | | | | | | | | | | | | | | |
BALANCE— December 31, 2014 (Audited) | | | 15,029 | | | 2,507 | | | 6,957 | | | 4,900 | | | 29,393 | |
| | | | | | | | | | | | | | | | |
Distributions | | | (13,958) | | | (2,329) | | | (6,462) | | | (4,551) | | | (27,300) | |
| | | | | | | | | | | | | | | | |
Net Income | | | 17,969 | | | 2,999 | | | 8,320 | | | 5,859 | | | 35,147 | |
| | | | | | | | | | | | | | | | |
BALANCE— December 31, 2015 (Audited) | | | 19,040 | | | 3,177 | | | 8,815 | | | 6,208 | | | 37,240 | |
| | | | | | | | | | | | | | | | |
Distributions | | | (12,399) | | | (2,069) | | | (5,740) | | | (4,042) | | | (24,250) | |
| | | | | | | | | | | | | | | | |
Net Income | | | 15,512 | | | 2,588 | | | 7,180 | | | 5,056 | | | 30,336 | |
| | | | | | | | | | | | | | | | |
BALANCE— December 31, 2016 (Unaudited) | | $ | 22,153 | | $ | 3,696 | | $ | 10,255 | | $ | 7,222 | | $ | 43,326 | |
See notes to financial statements.
Pennsylvania RSA No. 6(II) Limited Partnership
Statements of Cash Flows – For the Years Ended December 31, 2016, 2015, and 2014
(Dollars in Thousands)
| | | | | | | | | | |
| | | | | | | | | | |
| | 2016 | | 2015 | | 2014 | |
| | (Unaudited) | | (Audited) | | (Audited) | |
CASH FLOWS FROM OPERATING ACTIVITIES: | | | | | | | | | | |
Net Income | | $ | 30,336 | | $ | 35,147 | | $ | 36,157 | |
Adjustments to reconcile net income to net cash provided by operating activities: | | | | | | | | | | |
Depreciation and amortization | | | 3,334 | | | 3,223 | | | 2,520 | |
Imputed interest on financing obligation | | | 45 | | | 34 | | | - | |
Provision for losses on accounts receivable | | | 502 | | | 1,638 | | | 739 | |
Changes in certain assets and liabilities: | | | | | | | | | | |
Accounts receivable | | | (4,677) | | | (7,698) | | | (640) | |
Unbilled revenue | | | 73 | | | (70) | | | (42) | |
Prepaid expenses | | | (510) | | | (15) | | | (244) | |
Other assets | | | (208) | | | (4,748) | | | (1,783) | |
Accounts payable and accrued liabilities | | | 604 | | | 303 | | | 589 | |
Advance billings and other | | | (321) | | | (724) | | | 1,264 | |
Deferred rent | | | 46 | | | 404 | | | 12 | |
Net cash provided by operating activities | | | 29,224 | | | 27,494 | | | 38,572 | |
| | | | | | | | | | |
CASH FLOWS FROM INVESTING ACTIVITIES: | | | | | | | | | | |
Capital expenditures | | | (2,791) | | | (6,886) | | | (5,759) | |
Fixed asset transfers out | | | 441 | | | 536 | | | 415 | |
Change in due from affiliate | | | (2,578) | | | 5,720 | | | 3,772 | |
Net cash used in investing activities | | | (4,928) | | | (630) | | | (1,572) | |
| | | | | | | | | | |
CASH FLOWS FROM FINANCING ACTIVITIES: | | | | | | | | | | |
Proceeds from financing obligation, net | | | - | | | 474 | | | - | |
Repayments of financing obligation | | | (46) | | | (38) | | | - | |
Distributions | | | (24,250) | | | (27,300) | | | (37,000) | |
Net cash used in financing activities | | | (24,296) | | | (26,864) | | | (37,000) | |
| | | | | | | | | | |
CHANGE IN CASH | | | - | | | - | | | - | |
| | | | | | | | | | |
CASH—Beginning of year | | | - | | | - | | | - | |
CASH—End of year | | $ | - | | $ | - | | $ | - | |
| | | | | | | | | | |
NONCASH TRANSACTIONS FROM INVESTING ACTIVITIES: | | | | | | | | | | |
Accruals for capital expenditures | | $ | 49 | | $ | 22 | | $ | 379 | |
See notes to financial statements
Pennsylvania RSA No. 6(II) Limited Partnership
Notes to Financial Statements - Years Ended December 31, 2013 (unaudited), 20122016, 2015, and 20112014
1. ORGANIZATION AND MANAGEMENT
| 1.ORGANIZATION AND MANAGEMENT |
Pennsylvania RSA No. 6 (II) Limited Partnership – Pennsylvania RSA No. 6 (II)6(II) Limited Partnership, (the “Partnership”) was formed in 1991. The principal activity of the Partnership is providing cellular service in the Pennsylvania 6 (II) rural service area.Rural Service Area 6-B2. Under the terms of the partnership agreement, the partnership expires on January 1, 2091.
In accordance with the partnership agreement, Cellco Partnership (“Cellco”), doing business as Verizon Wireless, is responsible for managing the operations of the Partnership (see Note 7).
The partners and their respective ownership percentages of the Partnership as of December 31, 2013 (unaudited), 20122016, 2015, and 20112014 are as follows:
| | | |
General Partner: | | | |
Cellco Partnership* (“General Partner”)Partnership | | 51.13 | % |
| | | |
Limited Partners: | | | |
Cellco Partnership*Partnership | | 8.53 | % |
Consolidated Communications Enterprise Services, Inc. ** | | 23.67 | % |
Venus Cellular Telephone Company, Inc. | | 16.67 | % |
*Cellco Partnership (“Cellco”) doing business as Verizon Wireless.
**Consolidated Communications Enterprise Services, Inc. (CCES) is a wholly-owned subsidiary of Consolidated Communications Holdings, Inc.
In accordance with the partnership agreement, Cellco is responsible for managing the operations of the partnership (See Note 5).
| 2. | | SIGNIFICANT ACCOUNTING POLICIES |
2. SIGNIFICANT ACCOUNTING POLICIES
Use of Estimatesestimates – The preparation of financial statements in accordance withare prepared using U.S. generally accepted accounting principles generally accepted in the United States of America(GAAP), which requires management to make estimates and assumptions that affect reported amounts and disclosures. Actual results could differ from those estimates. Estimates are used for, but are not limited to,
Examples of significant estimates include: the accounting for: revenue and expense, allocations, allowance for uncollectibledoubtful accounts, receivable,the recoverability of property, plant and equipment, the recoverability of intangible assets and other long-lived assets, unbilled revenue, depreciation and amortization, useful lives and impairmentrevenues, fair values of assets,financial instruments, accrued expenses and contingencies.
F-52
Table of Contents
Revenue Recognitionrecognition – The Partnership offers products and services to our customers through bundled arrangements. These arrangements involve multiple deliverables which may include products, services, or a combination of products and services.
The Partnership earns revenue primarily by providing access to its network (access revenue) and usage of its network (usage revenue), which includes voice and data revenue. Customers are associated withas well as the Partnership based upon mobile identification number.sale of equipment. In general, access revenue is billed one month in advance and is recognized when earned; the unearned portion is classified in Advance billings in the balance sheet.earned. Usage revenue is generally billed in arrears and recognized when service is rendered and included in unbilled revenue until billed.rendered. Equipment sales revenue associated with the sale of wireless devices and related equipment costs areaccessories is generally recognized when the products are delivered to and accepted by the customer, as thisequipment sales is considered to be a separate earnings process from the sale ofproviding wireless services. Customer activation fees charged to customers are considered additional consideration and are recorded in Equipment and other revenue, generally, at the time of customer acceptance. For agreements involving the resale of third-party services in which the Partnership is considered the primary obligor in the arrangements, the Partnership records revenue is recorded gross at the time of sale. For equipment sales,
Under the Verizon device payment plan program, eligible wireless customers purchase wireless devices under a device payment plan agreement. On select devices, certain marketing promotions have been revocably offered to customers to upgrade to a new device after paying down a certain specified portion of the required device payment plan agreement amount as well as trading in their device in good working order. When a customer enters into a device payment plan agreement with the right to upgrade to a new device, the Partnership currently subsidizes the cost of wireless devices.accounts for this trade-in right as a guarantee obligation. The full amount of this subsidythe trade-in right’s fair value (not an allocated value) is generally contingent onrecognized as a guarantee liability and the arrangement and terms selected byremaining allocable consideration is allocated to the customer. In multiple deliverable arrangements which involvedevice. The value of the guarantee liability effectively results in a reduction to the revenue recognized for the sale of equipmentthe device. The Partnership may offer customers certain promotions where a customer can trade-in his or her owned device in connection with the purchase of a new device. Under these types of promotions, the customer will receive trade-in credits that are applied to the customer’s monthly bill. As a result, the Partnership recognizes a trade-in obligation measured at fair value using weighted-average selling prices obtained in recent resale of devices eligible for trade-in.
In multiple element arrangements that bundle devices and amonthly wireless service, contract, the equipment revenue is recognized upallocated to each unit of accounting using a relative selling price method. At the inception of the arrangement, the amount allocable to the delivered units of accounting is limited to the amount collectedthat is not contingent upon the delivery of the monthly wireless service (the noncontingent amount). The Partnership effectively recognizes revenue on the delivered device at the lesser of the amount allocated based on the relative selling price of the device or the noncontingent amount owed when the wireless device is sold.
Roaming revenue reflects service revenue earned by the Partnership when customers not associated with the Partnership operate in the service area of the Partnership and use the Partnership’s network. The roaming rates with third party carriers associated with those customers are based on agreements with such carriers. The roaming rates charged by the Partnership to Cellco do not necessarily reflect current market rates. The Partnership will continue to re-evaluate the ratesare established by Cellco on a periodic basis (Seeand may not reflect current market rates (see Note 5)7).
Other revenues primarily consist of certain fees billed to customers for surcharges and elected services as well as non-customer related revenues. The Partnership reports taxes imposed by governmental authorities on revenue-producing
transactions between usthe Partnership and ourits customers which is passed through to the customers on a net basis.
Cellular service Other revenues resulting from a cellsitecell sharing agreement, which excludes sharing of site expenses, with Cellco are recognized based upon a rate per minute of use (See(see Note 5)7).
Operating Costs and Expensesexpenses – Operating expenses include expenses incurred directly by the Partnership, as well as an allocation of selling, general and administrative, and operating costs incurred by Cellco or its affiliates on behalf of the Partnership. Employees of Cellco provide services performed on behalf of the Partnership. These employees are not employees of the Partnership, therefore operating expenses include direct and allocated charges of salary and employee benefit costs for the services provided to the Partnership. Cellco believes such allocations, principally based on the Partnership’s percentage of certain revenue streams, total customers, customer gross additions or minutes-of-use, are calculated in accordance with the Partnership Agreementagreement and are a reasonable method of allocating such costs.costs (see Note 7).
Cost of roaming reflects costs incurred by the Partnership when customers associated with the Partnership operate in a service area not associated with the Partnership and use a network not associated with the Partnership. The roaming rates with third party carriers are based on agreements with such carriers. The roaming rates charged to the Partnership by Cellco do not necessarily reflect current market rates. The Partnership will continue to re-evaluate the ratesare established by Cellco on a periodic basis and may not reflect current market rates (see Note 5)7).
Retail Stores– The daily operationsCost of all retail storesequipment is recorded upon sale of the related equipment at Cellco’s cost basis. Inventory is wholly owned by the Partnership are managed by Cellco. All fixed assets, liabilities, incomeCellco and expenses related to these retail stores areis not recorded in the financial statements of the Partnership.
F-53Maintenance and repairs –
Table The cost of Contentsmaintenance and repairs, including the cost of replacing minor items not constituting substantial betterments, is charged principally to Cost of service as these costs are incurred.
Advertising costs –Costs for advertising products and services as well as other promotional and sponsorship costs are charged to Selling, general and administrative expense in the periods in which they are incurred.
Comprehensive Income–income –Comprehensive income is the same as net income as presented in the accompanying statements of operations.income and comprehensive income.
Income Taxestaxes – – The Partnership is nottreated as a taxablepass through entity for federal and state income tax purposes. Any taxable income or loss is apportioned to the partners based on their respective partnership interestspurposes and, is reported by them individually.
Inventory – Inventory is owned by Cellco andtherefore, is not subject to federal, state or local income taxes. Accordingly, no provision has been recorded onfor income taxes in the Partnership’s financial statements. Upon sale,The results of operations, including taxable income, gains, losses, deductions and credits, are allocated to and reflected on the related costincome tax returns of the inventory is transferred torespective partners.
The Partnership files federal and state tax returns. The 2013 through 2016 tax years for the Partnership at Cellco’s cost basis and included in the accompanying statements of operations.
Allowance for Doubtful Accounts – The Partnership maintains allowances for uncollectible accounts receivable for estimated losses resulting from the inability of customersremain subject to make required payments. Estimates are based on the aging of the accounts receivable balances and the historical write-off experience, net of recoveries.
Property, Plant and Equipment – Property, plant and equipment primarily represents costs incurred to construct and expand capacity and network coverage on mobile telephone switching offices and cell sites. The cost of property, plant and equipment is depreciated over its estimated useful life using the straight-line method of depreciation. Leasehold improvements are amortized over the shorter of their estimated useful lives or the term of the related lease. Major improvements to existing plant and equipment that extend the useful lives are capitalized. Routine maintenance and repairs that do not extend the life of the plant and equipment are charged to expense as incurred.
Upon the sale or retirement of property, plant and equipment, the cost and related accumulated depreciation or amortization are eliminated and any related gain or loss is reflected in the statements of operations. All property, plant and equipment purchases are made through an affiliate of Cellco. Transfers of property, plant and equipment between Cellco and affiliates are recorded at net book value and included in due from affiliate until settled.
Network engineering costs incurred during the construction phase of the Partnership’s network and real estate properties under development are capitalized as part of the property, plant and equipment and recorded as construction in progress until the projects are completed and placed into service.
FCC Licenses – The Federal Communications Commission (“FCC”) issues licenses that authorize cellular carriers to provide service in specific cellular geographic service areas. The FCC grants licenses for terms of up to ten years. In 1993 the FCC adopted specific standards to apply to cellular renewals, concluding it will award a license renewal to a cellular licensee that meets certain standards of past performance. Historically, the FCC has granted license renewals routinely and at nominal costs, which are expensed as incurred. All wireless licenses issuedexamination by the FCC that authorize the Partnership to provide cellular services are recorded on the books of Cellco. The current terms of the Partnership’s FCC license expires in October 2020. Cellco and the Partnership believe they will be able to meet all requirements necessary to secure renewal of the Partnership’s cellular license.Internal Revenue Service
Valuationand state tax jurisdiction. Because the application of Assets – Long-lived assets, including property, planttax laws and equipment and intangible assets with finite lives, are reviewed for impairment whenever events or changesregulations to many types of transactions is susceptible to varying interpretations, amounts reported in circumstances indicate that the carrying amount of the asset may notfinancial statements could be recoverable. The carrying amount ofchanged at a long-lived asset is not recoverable if it exceeds the sum of the undiscounted cash flows expected to result from the use and eventual disposition of the asset. The impairment loss would be measured as the amountlater date upon final determination by which the carrying amount of the asset exceeds the fair value of the asset.taxing authorities.
Cellco and the Partnership test their wireless licenses for potential impairment annually, and more frequently if indications of impairment exist. In 2013, Cellco and the Partnership performed a qualitative assessment to determine whether it is more likely than not that the fair value of its wireless licenses was less than the carrying amount. As part of the assessment Cellco and the Partnership considered several qualitative factors including the business enterprise value and other industry and market considerations. Based on our assessment in 2013 (unaudited), Cellco and the Partnership qualitatively concluded that it was more likely than not that the fair value of their wireless licenses significantly exceeded their carrying value and therefore did not result in any impairment. In 2012 and 2011 Cellco and the Partnership evaluated their licenses on an aggregate basis, using a direct income-based value approach. This approach estimates fair value using a discounted cash flow analysis to estimate what a marketplace participant would be willing to pay to purchase the aggregated wireless licenses as of the valuation date. If the fair value of the aggregated wireless licenses is less than the aggregated carrying amount of the wireless licenses, an impairment is recognized.
In addition, Cellco believes that under the Partnership agreement it has the right to allocate, based on a reasonable methodology, any impairment loss recognized by Cellco for all licenses included in Cellco’s national footprint. Cellco does not charge the Partnership for the use of any FCC license recorded on its books (except for the annual cost of $318 (unaudited) related to the spectrum leases). Cellco and the Partnership evaluated their wireless licenses for potential impairment as of December 15, 2013 (unaudited) and December 15, 2012. These evaluations resulted in no impairment of wireless licenses.
Concentrations – The Partnership maintains allowances for uncollectible accounts receivable for estimated losses resulting from the inability of customers to make required payments. Estimates are based on historical net write-off experience. No single customer receivable is large enough to present a significant financial risk to the partnership.
Cellco and the Partnership rely on local and long-distance telephone companies, some of which are related parties (See Note 5), and other companies to provide certain communication services. Although management believes alternative telecommunications facilities could be found in a timely manner, any disruption of these services could potentially have a material adverse impact on the Partnership’s operating results.
F-55
Table of Contents
Although Cellco attempts to maintain multiple vendors for its network assets and inventory, which are important components of its operations, they are currently acquired from only a few sources. Certain of these products are in turn utilized by the Partnership and are important components of the Partnership’s operations. If the suppliers are unable to meet Cellco’s needs as it builds out its network infrastructure and sells service and equipment, delays and increased costs in the expansion of the Partnership’s network infrastructure or losses of potential customers could result, which would adversely affect operating results.
Financial Instruments – The Partnership’s trade receivables and payables are short-term in nature, and accordingly, their carrying value approximates fair value.
Due to/from affiliate – Due to/from affiliate principally represents the Partnership’s cash position with Cellco. Cellco manages, on behalf of the Partnership, all cash, inventory, investing and financing activities of the Partnership. As such, the change in due to/from affiliate is reflected as an investing activity or a financing activity in the statements of cash flows depending on whether it represents a net asset or net liability for the Partnership.
Additionally, cost of equipment, administrative and operating costs incurred by Cellco on behalf of the Partnership, as well as property, plant and equipment transactions with affiliates, are charged to the Partnership through this account. Starting in 2011, interestInterest income on due from affiliate is based on the Applicable Federal Rate which was approximately .2% (unaudited)0.7%, .2%0.5%, and .4%0.3% for the years ended December 31, 2013 (unaudited), 20122016, 2015, and 2011,2014 respectively. Interest expense on due to affiliate is calculated by applying Cellco’s average cost of borrowing from Verizon Communications Inc,Inc., which was approximately 7.4% (unaudited)4.8%, 7.3%4.8%, 6.8%and 5.0% for the years ended December 31, 2013 (unaudited), 2012,2016, 2015, and 2011 respectively.2014 respectively to the outstanding due to/from affiliate balance. Included in Interest income, net interest income is interest income of $18 (unaudited)$41 (Unaudited), $15$29, and $31$27 for the years ended December 31, 2013 (unaudited), 20122016, 2015, and 2011,2014 respectively, related to due to/from affiliate.
Accounts receivable and allowance for doubtful accounts – Accounts receivable are recorded in the financial statements at cost, net of allowance for credit losses, with the exception of device payment plan agreement receivables which are initially recorded at fair value. The Partnership maintains allowances for uncollectible accounts receivable, including device payment plan agreement receivables, for estimated losses resulting from the failure or inability of customers to make required payments. The allowance for uncollectible accounts receivable is based on Cellco’s assessment of the collectability of each Partnership’s specific customer accounts and includes consideration of the credit worthiness and financial condition of those customers. The Partnership records an allowance to reduce the receivables to the amount that is reasonably believed to be collectible. The Partnership also records an allowance for all other receivables based on multiple factors including historical experience with bad debts, the general economic environment, and the aging of such receivables. Similar to traditional service revenue accounting treatment, bad debt expense related to device payment plan agreement receivables is recorded based on an estimate of the percentage of device payment plan agreement receivables that will not be collected. This estimate is based on a number of factors including historical write-off experience, credit quality of the customer base and other factors such as macro-economic conditions. Due to the device payment plan agreement receivables being incorporated in the standard Verizon Wireless bill, the collection and risk strategies continue to follow historical practices. The Partnership monitors the aging of accounts receivable, including device payment plan agreement
receivables, and writes off account balances if collection efforts are unsuccessful and future collection is unlikely.
Property, plant and equipment – Property, plant and equipment is recorded at cost. Property, plant and equipment are generally depreciated on a straight-line basis.
Leasehold improvements are amortized over the shorter of the estimated life of the improvement or the remaining term of the related lease, calculated from the time the asset was placed in service.
When the depreciable assets are retired or otherwise disposed of, the related cost and accumulated depreciation are deducted from the property, plant and equipment accounts and any gains or losses on disposition are recognized in income. Transfers of property, plant and equipment between Cellco and affiliates are recorded at net book value on the date of the transfer with an offsetting entry included in due to/from affiliate.
Interest associated with the construction of network-related assets is capitalized. Capitalized interest is reported as a reduction in interest expense and depreciated as part of the cost of the network-related assets.
In connection with the ongoing review of estimated useful lives of property, plant and equipment during 2016, Cellco determined that the average useful lives of certain leasehold improvements would be increased from 5 to 7 years. This change was immaterial to the Partnership in 2016. While the timing and extent of current deployment plans are subject to ongoing analysis and modification, Cellco and the Partnership believes the current estimates of useful lives are reasonable.
Other assets – Other assets primarily include long term device payment plan agreement receivables, net of allowances of $214 (Unaudited), $317 and $0 at December 31, 2016, 2015 and 2014, respectively.
Impairment – All long-lived assets are reviewed for impairment whenever events or changes in circumstances indicate that the carrying amount of the asset may not be recoverable. If any indications were to become present, the Partnership would test for recoverability by comparing the carrying amount of the asset group to the net undiscounted cash flows expected to be generated from the asset group. If those net undiscounted cash flows do not exceed the carrying amount, the next step would be to determine the fair value of the asset and record an impairment, if any. The Partnership re-evaluates the useful life determinations for these long-lived assets each year to determine whether events and circumstances warrant a revision to their remaining useful lives.
Wireless licenses – Cellco maintains wireless licenses that provide the wireless operations with the exclusive right to utilize designated radio frequency spectrum to provide wireless communications services. While licenses are issued for only a fixed time, generally ten years, such licenses are subject to renewal by the Federal
Communications Commission (FCC). License renewals, which are managed by Cellco, have historically occurred routinely and at nominal cost. Moreover, Cellco management has determined that there are currently no legal, regulatory, contractual, competitive, economic or other factors that limit the useful life of wireless licenses. As a result, wireless licenses are treated as an indefinite-lived intangible asset. The useful life determination for wireless licenses is re-evaluated each year to determine whether events and circumstances continue to support an indefinite useful life.
The Partnership owns wireless licenses in the service area which have no carrying value. The average remaining renewal period of the Partnership’s wireless license portfolio was 3.8 years as of December 31, 2016.
Cellco tests the wireless licenses balance for potential impairment annually or more frequently if impairment indicators are present. In 2016, Cellco performed a qualitative assessment to determine whether it is more likely than not that the fair value of the wireless licenses was less than the carrying amount. As part of the assessment, several qualitative factors were considered including market transactions, the business enterprise value of Cellco, macroeconomic conditions (including changes in interest rates and discount rates), industry and market considerations (including industry revenue and EBITDA (Earnings before interest, taxes, depreciation and amortization) margin projections), the projected financial performance of Cellco, as well as other factors.
In addition, Cellco believes that under the Partnership agreement it has the right to allocate, based on a reasonable methodology, any impairment loss recognized by Cellco for licenses included in Cellco’s national footprint. Cellco evaluated its wireless licenses for potential impairment as of December 15, 2016 and 2015. These evaluations resulted in no impairment of wireless licenses.
Financial instruments – The Partnership’s trade receivables and payables are short-term in nature, and accordingly, their carrying value approximates fair value.
Fair value measurements – Fair value of financial and non-financial assets and liabilities is defined as an exit price, representing the amount that would be received to sell an asset or paid to transfer a liability in an orderly transaction between market participants. The three-tier hierarchy for inputs used in measuring fair value, which prioritizes the inputs used in the methodologies of measuring fair value for assets and liabilities, is as follows:
Level 1 - Quoted prices in active markets for identical assets or liabilities
Level 2 - Observable inputs other than quoted prices in active markets for identical assets and liabilities
Level 3 - No observable pricing inputs in the market
Financial assets and financial liabilities are classified in their entirety based on the lowest level of input that is significant to the fair value measurements. The assessment of the significance of a particular input to the fair value measurements requires judgment, and may affect the valuation of the assets and liabilities being measured and their categorization within the fair value hierarchy.
Distributions - – The Partnership is required to make distributions to its partners based upon the Partnership’s operating results, due to/from affiliate status, and financing needs as determined by the General Partner at the date of the distribution.
Recently Adopted Accounting Standards -Recent accounting standards – During In August 2016, the accounting standard update related to the classification of certain cash receipts and cash payments was issued. This standard update addresses eight specific cash flow issues with the objective of reducing the existing diversity in practice for these issues. Among the updates, this standard update requires cash receipts from payments on a transferor’s beneficial interests in securitized trade receivables to be classified as cash inflows from investing activities. This standard update is effective as of the first quarter of 2013, we adopted2018; however, early adoption is permitted. The Partnership is currently evaluating the accountingimpact that this standard update regarding testingwill have on the financial statements. The Partnership expects the amendment relating to beneficial interests in securitization transactions will have an impact on the presentation of intangible assets for impairment.collections of the deferred purchase price from sales of wireless device payment plan agreement receivables in the statements of cash flows.
In June 2016, the standard update related to the measurement of credit losses on financial instruments was issued. This standard update allows companiesrequires that certain financial assets be measured at amortized cost reflecting an allowance for estimated credit losses expected to occur over the option to perform a qualitative assessment to determine whether itlife of the assets. The estimate of credit losses must be based on all relevant information including historical information, current conditions and reasonable and supportable forecasts that affect the collectability of the amounts. This standard update is more likely than noteffective as of the first quarter of 2020; however early adoption is permitted. The Partnership is currently evaluating the impact that an indefinite-lived intangible asset is impaired. An entity is not required to calculate the fair value of an indefinite-lived intangible asset and perform the quantitative impairment test unless the entity determines that it is more likely than not the asset is impaired. The adoption of this standard did notupdate will have a significant impact on the financial statements.
F-56In February 2016, the accounting standard update related to leases was issued. This standard update intends to increase transparency and improve comparability by requiring entities to recognize assets and liabilities on the balance sheet for all leases, with certain exceptions. In addition, through improved disclosure requirements, the standard update will enable users of financial statements to further understand the amount, timing, and uncertainty of cash flows arising from leases. This standard update is effective as of the first quarter of 2019; however early adoption is permitted. The Partnership’s current operating lease portfolio is primarily comprised of spectrum, network, real estate, and equipment leases. Upon adoption of the standard, the balance sheet is expected to include a right of use asset and liability related to substantially all operating lease arrangements. At Cellco, a cross-functional coordinated implementation team has been established to implement the standard update related to leases. The Partnership is in the process
of assessing the impact to its systems, processes and internal controls to meet the standard update’s reporting and disclosure requirements.
In May 2014, the accounting standard update related to the recognition of revenue from contracts with customers was issued. This standard update along with related subsequently issued updates clarifies the principles for recognizing revenue and develops a common revenue standard for U.S. GAAP. The standard update also amends current guidance for the recognition of costs to obtain and fulfill contracts with customers such that incremental costs of obtaining and direct costs of fulfilling contracts with customers will be deferred and amortized consistent with the transfer of the related good or service. The standard update intends to provide a more robust framework for addressing revenue issues; improve comparability of revenue recognition practices across entities, industries, jurisdictions, and capital markets; and provide more useful information to users of financial statements through improved disclosure requirements. The two permitted transition methods under the new standard are the full retrospective method, in which case the standard would be applied to each prior reporting period presented and the cumulative effect of applying the standard would be recognized at the earliest period shown, or the modified retrospective method, in which case the standard is applied only to the most current period presented and the cumulative effect of applying the standard would be recognized at the date of initial application. In August 2015, an accounting standard update was issued that delays the effective date of this standard update until the first quarter of 2018, at which time the Partnership plans to adopt the standard.
The Partnership is in the process of evaluating the impact of the standard update. The ultimate impact on revenue resulting from the application of the new standard will be subject to assessments that are dependent on many variables, including, but not limited to, the terms of contractual arrangements and the mix of business. Upon adoption, the Partnership expects that the allocation of revenue between equipment and service for wireless fixed-term service plans will result in more revenue allocated to equipment and recognized earlier as compared with current GAAP. The timing of recognition of sales commission expenses is also expected to be impacted, as a substantial portion of these costs (which are currently expensed) will be capitalized and amortized as described above. The available transition methods will continue to be evaluated. The Partnership’s considerations include, but are not limited to, the comparability of financial statements and the comparability within the industry from application of the new standard to contractual arrangements. The Partnership plans to select a transition method by the second half of 2017.
At Cellco, a cross-functional coordinated implementation team has been established to implement the standard update related to the recognition of revenue from contracts with customers. The Partnership has identified and is in the process of implementing changes to its systems, processes and internal controls to meet the standard update’s reporting and disclosure requirements.
Reclassifications– The Partnership reclassified certain prior year amounts to conform to the current year presentation.
Subsequent Eventsevents – Events subsequent to December 31, 20122016 have been evaluated through March 5, 2014,February 28, 2017, the date the financial statements were issued.
3. PROPERTY, PLANT AND EQUIPMENT, NET
| 3. | | WIRELESS DEVICE INSTALLMENT PLANS |
Under the Verizon device payment program, eligible wireless customers purchase wireless devices under a device payment plan agreement. Customers that activate service on devices purchased under the device payment program pay lower service fees as compared to those under fixed-term service plans, and their device payment plan charge is included in their standard wireless monthly bill.
Wireless device payment plan agreement receivables– The following table displays device payment plan agreement receivables, net, that continue to be recognized in the accompanying balance sheets:
| | | | | | |
| | 2016 | | 2015 |
| | (Unaudited) | | (Audited) |
Device payment plan agreement receivables, gross | | $ | 24,528 | | $ | 18,622 |
Unamortized imputed interest | | | (1,017) | | | (791) |
Device payment plan agreement receivables, net of | | | 23,511 | | | 17,831 |
unamortized imputed interest | | | | | | |
Allowance for credit losses | | | (708) | | | (906) |
Device payment plan agreement receivables, net | | $ | 22,803 | | $ | 16,925 |
| | | | | | |
Classified on the balance sheets: | | | | | | |
Accounts receivable, net | | $ | 15,950 | | $ | 10,303 |
Other assets | | | 6,853 | | | 6,622 |
Device payment plan agreement receivables, net | | $ | 22,803 | | $ | 16,925 |
The Partnership may offer customers certain promotions where a customer can trade-in his or her owned device in connection with the purchase of a new device. Under these types of promotions, the customer will receive trade-in credits that are applied to the customer’s monthly bill. As a result, the Partnership recognizes a trade-in obligation measured at fair value using weighted-average selling prices obtained in recent resales of devices eligible for trade-in. Device payment plan agreement receivables, net does not reflect this trade-in obligation. At December 31, 2016 and 2015, the amount of trade-in obligations was not material.
At the time of sale, the Partnership imputes risk adjusted interest on the device payment plan agreement receivables. Imputed interest is recorded as a reduction to the related accounts receivable. Interest income, which is included within Other revenues on the statements of income and comprehensive income, is recognized over the financed payment term.
When originating device payment plan agreements, the Partnership uses internal and external data sources to create a credit risk score to measure the credit quality
of a customer and to determine eligibility for the device payment program. If a customer is either new to the Partnership or has less than 210 days of customer tenure (a new customer), the credit decision process relies more heavily on external data sources. If the customer has 210 days or more of customer tenure (an existing customer), the credit decision process relies on internal data sources. For a small portion of new customer applications, a traditional credit report is not available from one of the national credit reporting agencies because the potential customer does not have sufficient credit history. In those instances, alternate credit data is used for the risk assessment. The experience has been that the payment attributes of longer tenured customers are highly predictive when considering their ability to pay in the future. External data sources include obtaining a credit report from a national consumer credit reporting agency, if available. Internal data and/or credit data obtained from the credit reporting agencies is used to create a custom credit risk score. The custom credit risk score is generated automatically (except with respect to a small number of applications where the information needs manual intervention) from the applicant’s credit data using Verizon’s proprietary custom credit models, which are empirically derived and demonstrably and statistically sound. The credit risk score measures the likelihood that the potential customer will become severely delinquent and be disconnected for non-payment.
Based on the custom credit risk score, each customer is assigned to a credit class, each of which has a specified required down payment percentage and specified credit limits. Device payment plan agreement receivables originated from customers assigned to credit classes requiring no down payment represent the lowest risk. Device payment plan agreement receivables originated from customers assigned to credit classes requiring a down payment represent a higher risk.
Subsequent to origination, the Partnership monitors delinquency and write-off experience as key credit quality indicators for its portfolio of device payment plan agreements and fixed-term service plans. The extent of collection efforts with respect to a particular customer are based on the results of proprietary custom empirically derived internal behavioral scoring models which analyze the customer’s past performance to predict the likelihood of the customer falling further delinquent. These customer scoring models assess a number of variables, including origination characteristics, customer account history and payment patterns. Based on the score derived from these models, accounts are grouped by risk category to determine the collection strategy to be applied to such accounts. The Partnership continuously monitors collection performance results and the credit quality of device payment plan agreement receivables based on a variety of metrics, including aging. The Partnership considers an account to be delinquent and in default status if there are unpaid charges remaining on the account on the day after the bill’s due date.
As of December 31, 2016, the balance and aging of the device payment plan agreement receivables on a gross basis was as follows:
| | | | | | |
| | 2016 | | 2015 |
| | (Unaudited) | | (Audited) |
Unbilled | | $ | 23,043 | | $ | 17,694 |
Billed: | | | | | | |
Current | | | 1,269 | | | 806 |
Past due | | | 216 | | | 122 |
Device payment plan agreement receivables, gross | | $ | 24,528 | | $ | 18,622 |
| | | | | | |
Activity in the allowance for credit losses for the device payment plan agreement receivables was as follows:
| | | | | | |
| | 2016 | | 2015 |
| | (Unaudited) | | (Audited) |
Balance at January 1 | | $ | 906 | | $ | 163 |
Bad debt expenses | | | 203 | | | 945 |
Write-offs | | | (401) | | | (138) |
Other | | | — | | | (64) |
Balance at December 31 | | $ | 708 | | $ | 906 |
Customers entering into device payment plan agreements prior to May 31, 2015, have the right to upgrade their device, subject to certain conditions, including making a stated portion of the required device payment plan agreement payments and trading in their device in good working condition. Generally, customers entering into device payment plan agreements on or after June 1, 2015 are required to repay all amounts due under their device payment agreement before being eligible to upgrade their device. However, on select devices, certain marketing promotions have been revocably offered to customers to upgrade to a new device after paying down a certain specified portion of the device payment plan agreement amount as well as trading in their device in good working order. When a customer enters into a device payment plan agreement with the right to upgrade to a new device or for a device that is subject to an upgrade promotion, the Partnership records a guarantee liability in accordance with the Partnership’s accounting policy. The guarantee liability related to this program, which was $115 (Unaudited) at December 31, 2016 and $408 at December 31, 2015, was included in Advance billings and other on the accompanying balance sheets.
| 4. | | PROPERTY, PLANT AND EQUIPMENT, NET |
Property, plant and equipment consist of the following as of December 31, 2013 (unaudited)2016 and 2012:2015:
| | 2013 | | 2012 | |
| | (unaudited) | | | |
| | | | | |
Buildings and improvements (15-40 years) | | 8,501 | | 7,807 | |
Wireless plant and equipment (3-15 years) | | 22,682 | | 21,421 | |
Furniture, fixtures and equipment (3-10 years) | | 563 | | 509 | |
Leasehold improvements (5 years) | | 1,210 | | 1,138 | |
| | | | | |
| | 32,956 | | 30,875 | |
| | | | | |
Less: accumulated depreciation | | 20,305 | | 18,463 | |
| | | | | |
Property, plant and equipment, net | | $ | 12,651 | | $ | 12,412 | |
| | | | | |
Depreciation expense | | $ | 2,473 | | $ | 2,419 | |
| | | | | | �� | |
| | 2016 | | 2015 | |
| | (Unaudited) | | (Audited) | |
Buildings and improvements (15-45 years) | | $ | 9,883 | | $ | 9,576 | |
Wireless plant and equipment (3-50 years) | | | 29,049 | | | 27,486 | |
Furniture, fixtures and equipment (3-10 years) | | | 482 | | | 479 | |
Leasehold improvements (5-7 years) | | | 2,466 | | | 2,262 | |
| | | 41,880 | | | 39,803 | |
Less: accumulated depreciation | | | (24,312) | | | (21,278) | |
Property, plant and equipment, net | | $ | 17,568 | | $ | 18,525 | |
| | | | | | | |
Capitalized network engineering costs of $201 (unaudited)$164 (Unaudited) and $224$376, were recorded during the years ended December 31, 2013 (unaudited)2016 and 2012,2015, respectively. Construction in progress included in certain classifications shown above, principally consists of wireless plant and equipment, amounted to $1,478 (unaudited)$334 (Unaudited) and $556$1,067, as of December 31, 2013 (unaudited) 2016 and 2012,2015, respectively. Depreciation expense of $3,329 (Unaudited), $3,220, and $2,520 was incurred during the years ended December 31, 2016, 2015 and 2014.
4. CURRENT LIABILITIES
| 5. | | TOWER MONETIZATION TRANSACTION |
During March 2015, Verizon Communications, the parent company of Cellco, entered into an agreement with American Tower Corporation (ATC) giving ATC exclusive rights to lease and operate approximately 11,300 wireless towers owned and operated by Cellco and its subsidiaries for an upfront payment of $5.0 billion (not in thousands). Verizon Communications also sold 162 towers to ATC for an upfront payment of $0.1 billion (not in thousands). Under the terms of the lease agreements, ATC has exclusive rights to lease and operate the towers over an average term of approximately 28 years. As the leases expire, ATC has fixed-price purchase options to acquire these towers based on their anticipated fair market values at the end of the lease terms. The Partnership has subleased capacity on the towers from ATC for a minimum of 10 years at current market rates, with options to renew. The Partnership participated in this arrangement and has leased 2 towers to ATC for an upfront payment of $849. The upfront payment was accounted for as deferred rent and as a financing obligation. The $375 accounted for as deferred rent was included in cash flows provided by operating activities and relates to the portion of the towers for which the right-of-use has passed to ATC. The deferred rent is being recognized on a straight-line basis over the Partnership’s average lease term of 30 years. At December 31, 2015, a financing obligation in the amount of $474 was included in cash flows provided by financing activities, which relates to the portion of the towers that continue to be occupied and used for the Partnership’s network operations. The Partnership makes a sublease payment to ATC for $1.9 per month per site, with annual increases of 2 percent. During 2016 and 2015, the
Partnership made $46 and $38, respectively, of sublease payments to ATC, which is recorded as Repayments of financing obligation.
At December 31, 2016 and 2015, the balance of deferred rent was $352 (Unaudited) and $365, respectively. At December 31, 2016 and 2015, the balance of the financing obligation was $468 (Unaudited) and $469, respectively.
Accounts payable and accrued liabilities consist of the following as of December 31, 2013 (unaudited) 2016 and 2012:2015:
| | 2013 | | 2012 | |
| | (unaudited) | | | |
| | | | | |
Accounts payable | | $ | 3,117 | | $ | 3,578 | |
Accrued liabilities | | 212 | | 226 | |
Accounts payable and accrued libilities | | $ | 3,329 | | $ | 3,804 | |
| | | | | | | |
| | | | | | |
| | 2016 | | 2015 | |
| | (Unaudited) | | (Audited) | |
| | | | | | | |
Accounts payable | | $ | 2,713 | | $ | 1,960 | |
Non-income based taxes and regulatory fees | | | 590 | | | 706 | |
Accrued commissions | | | 1,469 | | | 1,475 | |
Accounts payable and accrued liabilities | | $ | 4,772 | | $ | 4,141 | |
F-57
Table of Contents
Advance billings and customer depositsother consist of the following as of December 31, 2013 (unaudited)2016 and 2012:2015:
| | | | | | | | |
| | 2013 | | 2012 | | | 2016 | | 2015 | |
| | (unaudited) | | | | | (Unaudited) | | (Audited) | |
| | | | | | | | | | | | |
Advance billings | | $ | 3,764 | | $ | 3,565 | | | $ | 3,524 | | $ | 3,664 | |
Customer deposits | | 93 | | 83 | | | | 437 | | | 325 | |
Advance billings and customer deposits | | $ | 3,857 | | $ | 3,648 | | |
Guarantee liability | | | | 115 | | | 408 | |
Advance billings and other | | | $ | 4,076 | | $ | 4,397 | |
5. TRANSACTIONS WITH AFFILIATES AND RELATED PARTIES
| 7. | | TRANSACTIONS WITH AFFILIATES AND RELATED PARTIES |
In addition to fixed asset purchases (see Note 2),and right to use licenses substantially all of service revenues, equipment andrevenues, other revenues, cost of service, cost of equipment, and selling, general and administrative expenses represent transactions processed by affiliates (Cellco and its related parties) on behalf of the Partnership or represent transactions with affiliates. These transactions consist of (1) revenues and expenses that pertain to the Partnership which are processed by Cellco and directly attributed to or directly charged to the Partnership. They also includePartnership; (2) roaming revenue by customers of other Cellco affiliated markets within the Partnership market or Partnership customers’ cost when roaming in other Cellco affiliated markets; (3) certain revenues and expenses that are processed or incurred by Cellco which are allocated to the Partnership based on factors such as the Partnership’s percentage of revenue streams, customers, gross customer additions, or minutes of use.use; (4) certain costs of operating switches which are allocated to the Partnership; and (5) lease agreements with Cellco, whereas the Partnership has the right to use certain spectrum. These transactions do not necessarily represent arm’s length transactions and may not represent all revenues and costs that would be present if the
Partnership operated on a standalone basis. Cellco periodically reviews the methodology and allocation bases for allocating certain revenues, operating costs, selling, general and administrative expenses to the Partnership. Resulting changes, if any, in the allocated amounts have historically not been significant.
Service revenues -– Service revenues include monthly customer billings processed by Cellco on behalf of the Partnership and roaming revenues relating to customers of other affiliated markets that are specifically identified to the Partnership. For the years ended December 31, 2016, 2015, and 2014 roaming revenues were $25,198 (Unaudited), $25,063, and $23,732, respectively. Service revenuerevenues also includesinclude long distance, data, and certain revenue reductions including revenue concessions that are processed by Cellco and allocated to the Partnership based on certain factors deemed appropriate by Cellco.
Equipment and otherrevenues– Equipment revenues - Equipment revenue includesinclude equipment sales processed by Cellco and specifically identified to the Partnership, as well as certain handset and accessory revenues, contra-revenues including equipment concessions, and coupon rebates that are processed by Cellco and allocated to the Partnership based on certain factors deemed appropriate by Cellco.
Other revenues– Other revenues include cell sharing revenue and other fees and surcharges charged to the customer that are specifically identified to the Partnership.
Cost of Service -service– Cost of service includes roaming costs relating to the Partnership’s customers roaming in other affiliated markets cell sharingand switch costs that are specifically identifiedincurred by Cellco and allocated to the Partnership.Partnership based on certain factors deemed appropriate by Cellco. For the years ended December 31, 2016, 2015, and 2014 roaming costs were $39,340 (Unaudited), $36,313, and $32,019, and switch costs were $3,484 (Unaudited), $3,408, and $3,897, respectively. Cost of service also includes cost of telecom, long distance and application content that are incurred by Cellco and allocated to the Partnership based on certain factors deemed appropriate by Cellco. The Partnership has also entered into a lease agreementagreements for the right to use additional spectrum owned by Cellco. See Note 68 for further information regarding this arrangement.
F-58
TableCost of Contentsequipment
–Cost of equipment - Cost of equipment includes theis recorded at Cellco’s cost of inventory specifically identified and transferred to the Partnershipbasis (see Note 2). Cost of equipment also includes certain costs related to handsets, accessories and other costs incurred by Cellco and allocated to the Partnership based on certain factors deemed appropriate by Cellco.
Selling, general and administrative -– Selling, general and administrative expenses include commissions, customer billing, office telecom, customer care, salaries, sales and marketing and advertising expenses that are specifically identified to the Partnership as well as incurred by Cellco and allocated to the Partnership based on certain factors deemed appropriate by Cellco. The Partnership recorded $2,627 (Unaudited), $2,344, and $2,525 in advertising costs for the years ended December 31, 2016, 2015 and 2014, respectively.
6.Property, plant and equipment COMMITMENTS– Property, plant and equipment includes assets purchased by Cellco and directly charged to the Partnership as well as assets transferred between Cellco and the Partnership (see Note 2).
Cellco, on behalf of the Partnership, and the Partnership itself have entered into operating leases for facilities, equipment and spectrumequipment used in its operations. Lease contracts include renewal options that include rent expense adjustments based on the Consumer Price Index as well as annual and end-of-lease term adjustments. Rent expense is recorded on a straight-line basis. The noncancellable lease term used to calculate the amount of the straight-line rent expense is generally determined to be the initial lease term, including any optional renewal terms that are reasonably assured.assured of occurring. Leasehold improvements related to these operating leases are amortized over the shorter of their estimated useful lives or the noncancellable lease term. For the years ended December 31, 2013 (unaudited), 20122016, 2015, and 2011,2014, the Partnership incurred a total of $1,706 (unaudited)$2,249 (Unaudited), $1,604$1,800, and $1,562$1,478 respectively, as rent expense related to these operating leases, which was included in costCost of service and Selling, general and administrative expenses in the accompanying statements of operations.income and comprehensive income. Aggregate future minimum rental commitments under noncancellable operating leases, excluding renewal options that are not reasonably assured of occurring for the years shown are as follows:
Years | | Amount (unaudited) | |
| | | |
2014 | | $ | 1,288 | |
2015 | | 1,242 | |
2016 | | 1,199 | |
2017 | | 1,074 | |
2018 | | 963 | |
2019 and thereafter | | 4,931 | |
| | | |
Total minimum payments | | $ | 10,697 | |
On January 1, 2011, the Partnership entered into a 700 MHz upper band spectrum lease with Cellco. The lease includes an initial term extending through June 13, 2019 and a renewal option through June 13, 2029. The license, held by Cellco, is considered an indefinite-lived intangible as Cellco believes it will be able to meet all requirements necessary to secure renewal of this license. The Partnership accounts for this spectrum lease as an executory contract which is similar to an operating lease.
F-59
Table of Contents
| | | | |
Years | | Amount | |
| | | | |
2017 | | $ | 1,936 | |
2018 | | | 1,861 | |
2019 | | | 1,687 | |
2020 | | | 1,579 | |
2021 | | | 1,471 | |
2022 and thereafter | | | 4,524 | |
| | | | |
Total minimum payments | | $ | 13,058 | |
The Partnership has also entered into certain agreements with Cellco, whereas the Partnership leases certain spectrum from Cellco that overlaps the Pennsylvania Rural Service Area 6-B2. Total rent expense under these spectrum leases amounted to $659 (Unaudited) in 2016, $658 in 2015, and $583 in 2014, which is included in Cost of service in the accompanying statements of income and comprehensive income.
Based on the terms of the spectrum license leasethese leases as of December 31, 2013 (unaudited),2016, future spectrum lease obligations including the renewal period, are expected to be as follows:
| | | | | |
Years | | Amount (unaudited) | | | Amount | |
| | | | | | | |
2014 | | $ | 285 | | |
2015 | | 285 | | |
2016 | | 285 | | |
2017 | | 285 | | | $ | 636 | |
2018 | | 285 | | | | 625 | |
2019 and thereafter | | 2,971 | | |
2019 | | | | 482 | |
2020 | | | | 340 | |
2021 | | | | 340 | |
2022 and thereafter | | | | 3,398 | |
| | | | | | | |
Total minimum payments | | $ | 4,396 | | | $ | 5,821 | |
The General Partner currently expects that the renewal option in the leaseleases will be exercised.exercised.
Cellco and the Partnership are subject to lawsuits and other claims including class actions, product liability, patent infringement, intellectual property, antitrust, partnership disputes, and claims involving relations with resellers and agents. Cellco is also currently defending lawsuits filed against it and other participants in the wireless industry alleging various adverse effects as a result of wireless phone usage. Various consumer class action lawsuits allege that Cellco violated certain state consumer protection laws and other statutes and defrauded customers through misleading billing practices or statements. These matters may involve indemnification obligations by third parties and/or affiliated parties covering all or part of any potential damage awards against Cellco and the Partnership and/or insurance coverage. All of the above matters are subject to many uncertainties, and the outcomes are not currently predictable.
FromThe Partnership may be allocated a portion of the damages that may result upon adjudication of these matters if the claimants prevail in their actions. In none of the currently pending matters is the amount of accrual material to the Partnership. An estimate of the reasonably possible loss or range of loss with respect to these matters as of December 31, 2016 cannot be made at this time due to various factors typical in contested proceedings, including (1) uncertain damage theories and demands; (2) a less than complete factual record; (3) uncertainty concerning legal theories and their resolution by courts or regulators; and (4) the unpredictable nature of the opposing party and its demands. The Partnership continuously monitors these proceedings as they develop and will adjust any accrual or disclosure as needed. It is not expected that the ultimate resolution of any pending regulatory or legal matter in future periods will have a material effect on the financial condition of the Partnership, but it could have a material effect on the results of operations for a given reporting period.
| 10. | | RECONCILIATION OF ALLOWANCE FOR DOUBTFUL ACCOUNTS |
| | | | | | | | | | | | | |
| | Balance at | | Additions | | Write-offs | | Balance at | |
| | Beginning | | Charged to | | Net of | | End | |
| | of the Year | | Operations | | Recoveries | | of the Year | |
| | | | | | | | | | | | | |
Accounts Receivable Allowances: | | | | | | | | | | | | | |
2016 (Unaudited) | | $ | 1,255 | | $ | 502 | | $ | (830) | | $ | 927 | |
2015 (Audited) | | | 498 | | | 1,638 | | | (881) | | | 1,255 | |
2014 (Audited) | | | 225 | | | 739 | | | (466) | | | 498 | |
Report of Independent Certified Public Accountants
The Partners of GTE Mobilnet of Texas RSA #17
Limited Partnership
We have audited the accompanying financial statements of GTE Mobilnet of Texas RSA #17
Limited Partnership, which comprise the balance sheets as of December 31, 2016 and 2015, and the related statements of income and comprehensive income, changes in partners’ capital and cash flows for each of the three years in the period ended December 31, 2016, and the related notes to the financial statements.
Management's Responsibility for the Financial Statements
Management is responsible for the preparation and fair presentation of these financial statements in accordance with U.S. generally accepted accounting principles; this includes the design, implementation, and maintenance of internal control relevant to the preparation and fair presentation of financial statements that are free from material misstatement, whether due to fraud or error.
Auditor's Responsibility
Our responsibility is to express an opinion on these financial statements based on our audits. We conducted our audits in accordance with auditing standards generally accepted in the United States. Those standards require that we plan and perform the audit to obtain reasonable assurance about whether the financial statements are free from material misstatement.
An audit involves performing procedures to obtain audit evidence about the amounts and disclosures in the financial statements. The procedures selected depend on the auditor's judgment, including the assessment of the risks of material misstatement of the financial statements, whether due to fraud or error. In making those risk assessments, the auditor considers internal control relevant to the entity's preparation and fair presentation of the financial statements in order to design audit procedures that are appropriate in the circumstances, but not for the purpose of expressing an opinion on the effectiveness of the entity's internal control. Accordingly, we express no such opinion. An audit also includes evaluating the appropriateness of accounting policies used and the reasonableness of significant accounting estimates made by management, as well as evaluating the overall presentation of the financial statements.
We believe that the audit evidence we have obtained is sufficient and appropriate to provide a basis for our audit opinion.
Opinion
In our opinion, the financial statements referred to above present fairly, in all material respects, the financial position of GTE Mobilnet of Texas RSA #17 at December 31, 2016 and 2015, and the consolidated results of their operations and their cash flows for each of the three years in the period ended December 31, 2016 in conformity with U.S. generally accepted accounting principles.
/s/ Ernst & Young LLP
Orlando, FL
February 28, 2017
GTE Mobilnet of Texas RSA #17 Limited Partnership
Balance Sheets - As of December 31, 2016 and 2015
(Dollars in Thousands)
| | | | | | | |
| | 2016 | | 2015 | |
ASSETS | | | | | | | |
| | | | | | | |
CURRENT ASSETS: | | | | | | | |
Due from affiliate | | $ | 13,086 | | $ | 11,610 | |
Accounts receivable, net of allowance of $1,122 and $691 | | | 9,028 | | | 7,957 | |
Unbilled revenue | | | 2,287 | | | 2,311 | |
Prepaid expenses | | | 425 | | | 444 | |
Total current assets | | | 24,826 | | | 22,322 | |
| | | | | | | |
PROPERTY, PLANT AND EQUIPMENT - NET | | | 48,462 | | | 57,180 | |
| | | | | | | |
WIRELESS LICENSES | | | 441 | | | 441 | |
| | | | | | | |
OTHER ASSETS | | | 2,252 | | | 1,954 | |
TOTAL ASSETS | | $ | 75,981 | | $ | 81,897 | |
| | | | | | | |
LIABILITIES AND PARTNERS’ CAPITAL | | | | | | | |
| | | | | | | |
CURRENT LIABILITIES: | | | | | | | |
Accounts payable and accrued liabilities | | $ | 4,389 | | $ | 3,895 | |
Advance billings and other | | | 1,740 | | | 1,848 | |
Financing obligation | | | 2,412 | | | 2,364 | |
Deferred rent | | | 702 | | | 702 | |
Total current liabilities | | | 9,243 | | | 8,809 | |
| | | | | | | |
LONG TERM LIABILITIES: | | | | | | | |
Financing obligation | | | 21,356 | | | 21,478 | |
Deferred rent | | | 19,857 | | | 20,165 | |
Total long term liabilities | | | 41,213 | | | 41,643 | |
Total liabilities | | | 50,456 | | | 50,452 | |
| | | | | | | |
PARTNERS’ CAPITAL | | | | | | | |
General Partner's interest | | | 5,105 | | | 6,289 | |
Limited Partners' interest | | | 20,420 | | | 25,156 | |
Total partners' capital | | | 25,525 | | | 31,445 | |
| | | | | | | |
TOTAL LIABILITIES AND PARTNERS’ CAPITAL | | $ | 75,981 | | $ | 81,897 | |
See notes to financial statements.
GTE Mobilnet of Texas RSA #17 Limited Partnership
Statements of Income and Comprehensive Income – For the Years Ended December 31, 2016, 2015 and 2014
(Dollars in Thousands)
| | | | | | | | | | |
| | | | | | | | | |
| | 2016 | | 2015 | | 2014 | |
| | | |
OPERATING REVENUE: | | | | | | | | | | |
Service revenues | | $ | 113,816 | | $ | 117,289 | | $ | 113,153 | |
Equipment revenues | | | 7,119 | | | 7,011 | | | 5,796 | |
Other | | | 5,613 | | | 4,900 | | | 3,942 | |
Total operating revenue | | | 126,548 | | | 129,200 | | | 122,891 | |
| | | | | | | | | | |
OPERATING EXPENSES: | | | | | | | | | | |
Cost of service (exclusive of depreciation and amortization) | | | 40,711 | | | 39,702 | | | 36,454 | |
Cost of equipment | | | 10,040 | | | 10,606 | | | 12,892 | |
Depreciation and amortization | | | 10,364 | | | 11,348 | | | 11,874 | |
Selling, general and administrative | | | 20,662 | | | 23,356 | | | 23,655 | |
Total operating expenses | | | 81,777 | | | 85,012 | | | 84,875 | |
| | | | | | | | | | |
OPERATING INCOME | | | 44,771 | | | 44,188 | | | 38,016 | |
| | | | | | | | | | |
OTHER EXPENSE: | | | | | | | | | | |
Interest (expense) income, net | | | (1,391) | | | (914) | | | 36 | |
Other | | | - | | | (392) | | | - | |
Total other interest expense | | | (1,391) | | | (1,306) | | | 36 | |
| | | | | | | | | | |
NET INCOME AND COMPREHENSIVE INCOME | | $ | 43,380 | | $ | 42,882 | | $ | 38,052 | |
| | | | | | | | | | |
Allocation of Net Income: | | | | | | | | | | |
General Partner | | $ | 8,676 | | $ | 8,576 | | $ | 7,611 | |
Limited Partners | | $ | 34,704 | | $ | 34,306 | | $ | 30,441 | |
See notes to financial statements.
GTE Mobilnet of Texas RSA #17 Limited Partnership
Statements of Changes in Partners’ Capital – For the Years Ended December 31, 2016, 2015 and 2014
(Dollars in Thousands)
| | | | | | | | | | | | | | | | | | | | | | |
| | General | | | | | | | | | | | | | | | | | | | |
| | Partner | | Limited Partners | | | | |
| | | | | Eastex | | Consolidated | | | | | | | | | | | |
| | | | | Telcom | | Communications | | Alltel | | | | Verizon | | Total | |
| | San Antonio | | Investments, | | Enterprise | | Communications | | San Antonio | | Wireless | | Partners' | |
| | MTA, L.P. | | LLC | | Services, Inc. | | LLC | | MTA, L.P. | | (VAW) LLC | | Capital | |
| | | | | | | | | | | | | | | | | | | | | | |
BALANCE—January 1, 2014 | | $ | 15,402 | | $ | 15,797 | | $ | 15,797 | | $ | 13,108 | | $ | 9,176 | | $ | 7,731 | | $ | 77,011 | |
| | | | | | | | | | | | | | | | | | | | | | |
Distributions | | | (6,700) | | | (6,872) | | | (6,872) | | | (5,702) | | | (3,991) | | | (3,363) | | | (33,500) | |
| | | | | | | | | | | | | | | | | | | | | | |
Net Income | | | 7,611 | | | 7,806 | | | 7,806 | | | 6,477 | | | 4,533 | | | 3,819 | | | 38,052 | |
| | | | | | | | | | | | | | | | | | | | | | |
BALANCE—December 31, 2014 | | | 16,313 | | | 16,731 | | | 16,731 | | | 13,883 | | | 9,718 | | | 8,187 | | | 81,563 | |
| | | | | | | | | | | | | | | | | | | | | | |
Distributions | | | (18,600) | | | (19,077) | | | (19,077) | | | (15,830) | | | (11,081) | | | (9,335) | | | (93,000) | |
| | | | | | | | | | | | | | | | | | | | | | |
Net Income | | | 8,576 | | | 8,796 | | | 8,796 | | | 7,299 | | | 5,110 | | | 4,305 | | | 42,882 | |
| | | | | | | | | | | | | | | | | | | | | | |
BALANCE—December 31, 2015 | | | 6,289 | | | 6,450 | | | 6,450 | | | 5,352 | | | 3,747 | | | 3,157 | | | 31,445 | |
| | | | | | | | | | | | | | | | | | | | | | |
Distributions | | | (9,860) | | | (10,113) | | | (10,113) | | | (8,391) | | | (5,874) | | | (4,949) | | | (49,300) | |
| | | | | | | | | | | | | | | | | | | | | | |
Net Income | | | 8,676 | | | 8,899 | | | 8,899 | | | 7,384 | | | 5,168 | | | 4,354 | | | 43,380 | |
| | | | | | | | | | | | | | | | | | | | | | |
BALANCE—December 31, 2016 | | $ | 5,105 | | $ | 5,236 | | $ | 5,236 | | $ | 4,345 | | $ | 3,041 | | $ | 2,562 | | $ | 25,525 | |
See notes to financial statements.
GTE Mobilnet of Texas RSA #17 Limited Partnership
Statements of Cash Flows – For the Years Ended December 31, 2016, 2015 and 2014
(Dollars in Thousands)
| | | | | | | | | | |
| | | | | | | |
| | 2016 | | 2015 | | 2014 | |
CASH FLOWS FROM OPERATING ACTIVITIES: | | | | | | | | | | |
Net Income | | $ | 43,380 | | $ | 42,882 | | $ | 38,052 | |
Adjustments to reconcile net income to net cash provided by operating activities: | | | | | | | | | | |
Depreciation and amortization | | | 10,364 | | | 11,348 | | | 11,874 | |
Imputed interest on financing obligation | | | 2,289 | | | 1,704 | | | - | |
Provision for losses on accounts receivable | | | 2,128 | | | 1,546 | | | 1,421 | |
Changes in certain assets and liabilities: | | | | | | | | | | |
Accounts receivable | | | (3,200) | | | (3,337) | | | (2,796) | |
Unbilled revenue | | | 24 | | | (180) | | | (204) | |
Prepaid expenses | | | 19 | | | (313) | | | (118) | |
Other assets | | | (298) | | | (1,327) | | | (605) | |
Accounts payable and accrued liabilities | | | 324 | | | 315 | | | 515 | |
Advance billings and other | | | (108) | | | (230) | | | 498 | |
Deferred rent | | | (308) | | | 19,591 | | | 250 | |
Net cash provided by operating activities | | | 54,614 | | | 71,999 | | | 48,887 | |
| | | | | | | | | | |
CASH FLOWS FROM INVESTING ACTIVITIES: | | | | | | | | | | |
Capital expenditures | | | (1,980) | | | (4,734) | | | (16,813) | |
Fixed asset transfers out | | | 506 | | | 1,341 | | | 4,403 | |
Acquisition of wireless licenses | | | - | | | (441) | | | - | |
Change in due from affiliate | | | (1,476) | | | 2,696 | | | (2,977) | |
Net cash used in investing activities | | | (2,950) | | | (1,138) | | | (15,387) | |
| | | | | | | | | | |
CASH FLOWS FROM FINANCING ACTIVITIES: | | | | | | | | | | |
Proceeds from financing obligation | | | - | | | 24,077 | | | - | |
Repayments of financing obligation | | | (2,364) | | | (1,938) | | | - | |
Distributions | | | (49,300) | | | (93,000) | | | (33,500) | |
Net cash used in financing activities | | | (51,664) | | | (70,861) | | | (33,500) | |
| | | | | | | | | | |
CHANGE IN CASH | | | - | | | - | | | - | |
| | | | | | | | | | |
CASH—Beginning of year | | | - | | | - | | | - | |
CASH—End of year | | $ | - | | $ | - | | $ | - | |
| | | | | | | | | | |
NONCASH TRANSACTIONS FROM INVESTING ACTIVITIES: | | | | | | | | | | |
Accruals for capital expenditures | | $ | 242 | | $ | 71 | | $ | 133 | |
See notes to financial statements.
GTE Mobilnet of Texas RSA #17 Limited Partnership
Notes to Financial Statements - Years Ended December 31, 2016, 2015 and 2014
(Dollars in Thousands)
1.ORGANIZATION AND MANAGEMENT
GTE Mobilnet of Texas RSA #17 Limited Partnership (the “Partnership”) was formed in 1989. The principal activity of the Partnership is providing cellular service in the Texas #17 rural service area.
Cellco Partnership (“Cellco”), doing business as Verizon Wireless, indirectly wholly-owns San Antonio MTA, L.P. and through such ownership, manages the operations of the Partnership (see Note 8).
The partners and their respective ownership percentages of the Partnership as of December 31, 2016, 2015 and 2014 are as follows:
| | | |
General Partner: | | | |
San Antonio MTA, L.P. | | 20.000000 | % |
| | | |
Limited Partners: | | | |
Eastex Telecom Investments, LLC | | 20.512855 | % |
Consolidated Communications Enterprise Services, Inc. | | 20.512855 | % |
Alltel Communications, LLC * | | 17.021300 | % |
San Antonio MTA, L.P. | | 11.914800 | % |
Verizon Wireless (VAW) LLC * | | 10.038190 | % |
*Verizon Wireless (VAW) LLC and Alltel Communications, LLC are wholly-owned and indirectly wholly owned, respectively, subsidiaries of Cellco.
2.SIGNIFICANT ACCOUNTING POLICIES
Use of estimates – The financial statements are prepared using U.S. generally accepted accounting principles (GAAP), which requires management to make estimates and assumptions that affect reported amounts and disclosures. Actual results could differ from those estimates.
Examples of significant estimates include: the allowance for doubtful accounts, the recoverability of property, plant and equipment, the recoverability of intangible assets and other long-lived assets, unbilled revenues, fair values of financial instruments, accrued expenses and contingencies.
Revenue recognition – The Partnership offers products and services to customers through bundled arrangements. These arrangements involve multiple deliverables which may include products, services, or a combination of products and services.
The Partnership earns revenue primarily by providing access to and usage of its network as well as the sale of equipment. In general, access revenue is billed one month in advance and recognized when earned. Usage revenue is generally billed in arrears and recognized when service is rendered. Equipment revenue associated with the sale of wireless devices and accessories is generally recognized when the products are delivered to and accepted by the customer, as equipment sales is considered to be a separate earnings process from providing wireless services. For agreements involving the resale of third-party services in which the Partnership is considered the primary obligor in the arrangements, the revenue is recorded gross at the time Cellcoof sale.
Under the Verizon device payment program, eligible wireless customers purchase wireless devices under a device payment plan agreement. On select devices, certain marketing promotions have been revocably offered to customers to upgrade to a new device after paying down a certain specified portion of the required device payment plan agreement amount as well as trading in their device in good working order. When a customer enters into a device payment plan agreement with the right to upgrade to a new device, the Partnership accounts for this trade-in right as a guarantee obligation. The full amount of the trade-in right’s fair value (not an allocated value) is recognized as a guarantee liability and the remaining allocable consideration is allocated to the device. The value of the guarantee liability effectively results in a reduction to the revenue recognized for the sale of the device. The Partnership may offer customers certain promotions where a customer can trade-in his or her owned device in connection with the purchase commitments,of a new device. Under these types of promotions, the customer will receive trade-in credits that are applied to the customer’s monthly bill. As a result, the Partnership recognizes a trade-in obligation measured at fair value using weighted-average selling prices obtained in recent resales of devices eligible for trade-in.
In multiple element arrangements that bundle devices and monthly wireless service, revenue is allocated to each unit of accounting using a relative selling price method. At the inception of the arrangement, the amount allocable to the delivered units of accounting is limited to the amount that is not contingent upon the delivery of the monthly wireless service (the noncontingent amount). The Partnership effectively recognizes revenue on the delivered device at the lesser of the amount allocated based on the relative selling price of the device or the noncontingent amount owed when the device is sold.
Roaming revenue reflects service revenue earned by the Partnership when customers not associated with the Partnership operate in the service area of the Partnership and use the Partnership’s network. The roaming rates with third party carriers associated with those customers are based on agreements with such carriers. The roaming rates charged by the Partnership to Cellco are established by Cellco on a periodic basis and may not reflect current market rates (see Note 8).
Other revenues primarily consist of certain fees billed to customers for network equipment,surcharges and elected services as well as non-customer related revenues. The Partnership reports taxes imposed by governmental authorities on revenue-producing
transactions between the Partnership and its customers which is passed through to the customers on a net basis.
Operating expenses – Operating expenses include expenses incurred directly by the Partnership, as well as an allocation of selling, general and administrative, and operating costs incurred by Cellco or its affiliates on behalf of the Partnership. Employees of Cellco provide services on behalf of the Partnership. These represent legal obligationsemployees are not employees of Cellco.the Partnership, therefore operating expenses include direct and allocated charges of salary and employee benefit costs for the services provided to the Partnership. Cellco believes such allocations, principally based on the Partnership’s percentage of certain revenue streams, total customers, customer gross additions or minutes-of-use, are calculated in accordance with the Partnership agreement and are a reasonable method of allocating such costs (see Note 8).
Cost of roaming reflects costs incurred by the Partnership when customers associated with the Partnership operate in a service area not associated with the Partnership and use a network not associated with the Partnership. The roaming rates with third party carriers are based on agreements with such carriers. The roaming rates charged to the Partnership by Cellco are established by Cellco on a periodic basis and may not reflect current market rates (see Note 8).
Cost of equipment is recorded upon sale of the related equipment at Cellco’s cost basis. Inventory is wholly owned by Cellco and is not recorded in the financial statements of the Partnership.
7.Maintenance and repairs – CONTINGENCIES The cost of maintenance and repairs, including the cost of replacing minor items not constituting substantial betterments, is charged principally to Cost of service as these costs are incurred.
Advertising costs –Costs for advertising products and services as well as other promotional and sponsorship costs are charged to Selling, general and administrative expense in the periods in which they are incurred.
Comprehensive income –Comprehensive income is the same as net income as presented in the accompanying statements of income and comprehensive income.
Income taxes – The Partnership is treated as a pass through entity for income tax purposes and, therefore, is not subject to federal, state or local income taxes. Accordingly, no provision has been recorded for income taxes in the Partnership’s financial statements. The results of operations, including taxable income, gains, losses, deductions and credits, are allocated to and reflected on the income tax returns of the respective partners.
The Partnership files federal and state tax returns. The 2013 through 2016 tax years for the Partnership remain subject to examination by the Internal Revenue Service and state tax jurisdiction. Because the application of tax laws and regulations to many types of transactions is susceptible to varying interpretations, amounts
reported in the financial statements could be changed at a later date upon final determination by taxing authorities.
Due to/from affiliate – Due to/from affiliate principally represents the Partnership’s cash position with Cellco. Cellco manages, on behalf of the Partnership, all cash, investing and financing activities of the Partnership. As such, the change in due to/from affiliate is reflected as an investing activity or a financing activity in the statements of cash flows depending on whether it represents a net asset or net liability for the Partnership.
Additionally, cost of equipment, administrative and operating costs incurred by Cellco on behalf of the Partnership, as well as property, plant and equipment and wireless license transactions with affiliates, are charged to the Partnership through this account. Interest income on due from affiliate is based on the Applicable Federal Rate which was approximately 0.7%, 0.5% and 0.3% for the years ended December 31, 2016, 2015 and 2014, respectively. Interest expense on due to affiliate is calculated by applying Cellco’s average cost of borrowing from Verizon Communications Inc., which was approximately 4.8%, 4.8% and 5.0% for the years ended December 31, 2016, 2015 and 2014, respectively to the outstanding due to/from affiliate balance. Included in Interest (expense) income, net is interest income of $97, $177 and $25 for the years ended December 31, 2016, 2015 and 2014, respectively, related to due to/from affiliate.
Accounts receivable and allowance for doubtful accounts – Accounts receivable are recorded in the financial statements at cost, net of allowance for credit losses, with the exception of device payment plan agreement receivables which are initially recorded at fair value. The Partnership maintains allowances for uncollectible accounts receivable, including device payment plan receivables, for estimated losses resulting from the failure or inability of customers to make required payments. The allowance for uncollectible accounts receivable is based on Cellco’s assessment of the collectability of specific customer accounts and includes consideration of the credit worthiness and financial condition of those customers. The Partnership records an allowance to reduce the receivables to the amount that is reasonably believed to be collectible. The Partnership also records an allowance for all other receivables based on multiple factors including historical experience with bad debts, the general economic environment and the aging of such receivables. Similar to traditional service revenue accounting treatment, the device payment plan bad debt expense is recorded based on an estimate of the percentage of device payment plan agreement receivables that will not be collected. This estimate is based on a number of factors including historical write-off experience, credit quality of the customer base and other factors such as macro-economic conditions. Due to the device payment plan being incorporated in the standard Verizon Wireless bill, the collection and risk strategies continue to follow historical practices. The Partnership monitors the aging of accounts with device payment plan receivables and writes off account balances if collection efforts are unsuccessful and future collection is unlikely.
Property, plant and equipment – Property, plant and equipment is recorded at cost. Property, plant and equipment are generally depreciated on a straight-line basis.
Leasehold improvements are amortized over the shorter of the estimated life of the improvement or the remaining term of the related lease, calculated from the time the asset was placed in service.
When the depreciable assets are retired or otherwise disposed of, the related cost and accumulated depreciation are deducted from the property, plant and equipment accounts and any gains or losses on disposition are recognized in income. Transfers of property, plant and equipment between Cellco and affiliates are recorded at net book value on the date of the transfer with an offsetting entry included in due to/from affiliate.
Interest associated with the acquisition or construction of network-related assets is capitalized. Capitalized interest is reported as a reduction in interest expense and depreciated as part of the cost of the network-related assets.
In connection with the ongoing review of estimated useful lives of property, plant and equipment during 2016, Cellco determined that the average useful lives of certain leasehold improvements would be increased from 5 to 7 years. This change was immaterial to the Partnership in 2016. While the timing and extent of current deployment plans are subject to ongoing analysis and modification, Cellco and the Partnership believes the current estimates of useful lives are reasonable.
Other assets – Other assets primarily include long term device payment plan agreement receivables, net of allowances of $289 and $93 at December 31, 2016 and 2015, respectively.
Impairment – All long-lived assets are reviewed for impairment whenever events or changes in circumstances indicate that the carrying amount of the asset may not be recoverable. If any indications were to become present, the Partnership would test for recoverability by comparing the carrying amount of the asset group to the net undiscounted cash flows expected to be generated from the asset group. If those net undiscounted cash flows do not exceed the carrying amount, the next step would be to determine the fair value of the asset and record an impairment, if any. The Partnership re-evaluates the useful life determinations for these long-lived assets each year to determine whether events and circumstances warrant a revision to their remaining useful lives.
Wireless licenses –Intangible assets are wireless licenses that provide the Partnership wireless operations with the exclusive right to utilize designated radio frequency spectrum to provide wireless communications services. In addition, Cellco maintains wireless licenses that provide the Partnership’s operations with the exclusive right to utilize designated radio frequency spectrum to provide wireless communications services. While licenses are issued for only a fixed time, generally ten years, such licenses are subject to renewal by the Federal Communications
Commission (FCC). License renewals, which are managed by Cellco, have historically occurred routinely and at nominal cost. Moreover, the Partnership determined that there are currently no legal, regulatory, contractual, competitive, economic or other factors that limit the useful life of wireless licenses. As a result, wireless licenses are treated as an indefinite-lived intangible asset. The useful life determination for wireless licenses is re-evaluated each year to determine whether events and circumstances continue to support an indefinite useful life. The Partnership aggregates wireless licenses into one single unit of accounting, as they are utilized on an integrated basis.
Cellco and the Partnership test the wireless licenses balance for potential impairment annually or more frequently if impairment indicators are present. In 2016 and 2015, the Partnership performed a qualitative assessment to determine whether it is more likely than not that the fair value of wireless licenses was less than the carrying amount. As part of the assessment, several qualitative factors were considered including market transactions, the business enterprise value, macroeconomic conditions (including changes in interest rates and discount rates), industry and market considerations (including industry revenue and EBITDA (Earnings before interest, taxes, depreciation and amortization) margin projections), the projected financial performance, as well as other factors. In 2016, Cellco also performed a qualitative assessment similar to that described for the Partnership. In 2015, Cellco performed a quantitative assessment which consisted of comparing the estimated fair value of its aggregate wireless licenses to the aggregated carrying amount as of the test date.
Interest expense incurred while qualifying activities are performed to ready wireless licenses for their intended use is capitalized as part of wireless licenses (see Note 4). The capitalization period ends when the development is discontinued or substantially complete and the license is ready for its intended use.
In addition, Cellco believes that under the Partnership agreement it has the right to allocate, based on a reasonable methodology, any impairment loss recognized by Cellco for licenses included in Cellco’s national footprint. Cellco and the Partnership evaluated their wireless licenses for potential impairment as of December 15, 2016 and 2015. These evaluations resulted in no impairment of wireless licenses.
Financial instruments – The Partnership’s trade receivables and payables are short-term in nature, and accordingly, their carrying value approximates fair value.
Fair value measurements – Fair value of financial and non-financial assets and liabilities is defined as an exit price, representing the amount that would be received to sell an asset or paid to transfer a liability in an orderly transaction between market participants. The three-tier hierarchy for inputs used in measuring fair value, which prioritizes the inputs used in the methodologies of measuring fair value for assets and liabilities, is as follows:
Level 1 - Quoted prices in active markets for identical assets or liabilities
Level 2 - Observable inputs other than quoted prices in active markets for identical assets and liabilities
Level 3 - No observable pricing inputs in the market
Financial assets and financial liabilities are classified in their entirety based on the lowest level of input that is significant to the fair value measurements. The assessment of the significance of a particular input to the fair value measurements requires judgment, and may affect the valuation of the assets and liabilities being measured and their categorization within the fair value hierarchy.
Distributions – The Partnership is required to make distributions to its partners based upon the Partnership’s operating results, due to/from affiliate status, and financing needs as determined by the General Partner at the date of the distribution.
Recent accounting standards –In August 2016, the accounting standard update related to the classification of certain cash receipts and cash payments was issued. This standard update addresses eight specific cash flow issues with the objective of reducing the existing diversity in practice for these issues. Among the updates, this standard update requires cash receipts from payments on a transferor’s beneficial interests in securitized trade receivables to be classified as cash inflows from investing activities. This standard update is effective as of the first quarter of 2018; however, early adoption is permitted. The Partnership is currently evaluating the impact that this standard update will have on the financial statements.
In June 2016, the standard update related to the measurement of credit losses on financial instruments was issued. This standard update requires that certain financial assets be measured at amortized cost reflecting an allowance for estimated credit losses expected to occur over the life of the assets. The estimate of credit losses must be based on all relevant information including historical information, current conditions and reasonable and supportable forecasts that affect the collectability of the amounts. This standard update is effective as of the first quarter of 2020; however early adoption is permitted. The Partnership is currently evaluating the impact that this standard update will have on the financial statements.
In February 2016, the accounting standard update related to leases was issued. This standard update intends to increase transparency and improve comparability by requiring entities to recognize assets and liabilities on the balance sheet for all leases, with certain exceptions. In addition, through improved disclosure requirements, the standard update will enable users of financial statements to further understand the amount, timing, and uncertainty of cash flows arising from leases. This standard update is effective as of the first quarter of 2019; however early adoption is permitted. The Partnership’s current operating lease portfolio is primarily comprised of spectrum, network, real estate, and equipment leases. Upon adoption of the standard, the balance sheet is expected to include a right of use asset and liability related to substantially all operating lease arrangements. At Cellco, a cross-functional coordinated implementation team has been established to implement the standard update related to leases. The Partnership is in the process
of assessing the impact to its systems, processes and internal controls to meet the standard update’s reporting and disclosure requirements.
In May 2014, the accounting standard update related to the recognition of revenue from contracts with customers was issued. This standard update along with related subsequently issued updates clarifies the principles for recognizing revenue and develops a common revenue standard for U.S. GAAP. The standard update also amends current guidance for the recognition of costs to obtain and fulfill contracts with customers such that incremental costs of obtaining and direct costs of fulfilling contracts with customers will be deferred and amortized consistent with the transfer of the related good or service. The standard update intends to provide a more robust framework for addressing revenue issues; improve comparability of revenue recognition practices across entities, industries, jurisdictions, and capital markets; and provide more useful information to users of financial statements through improved disclosure requirements. The two permitted transition methods under the new standard are the full retrospective method, in which case the standard would be applied to each prior reporting period presented and the cumulative effect of applying the standard would be recognized at the earliest period shown, or the modified retrospective method, in which case the standard is applied only to the most current period presented and the cumulative effect of applying the standard would be recognized at the date of initial application. In August 2015, an accounting standard update was issued that delays the effective date of this standard update until the first quarter of 2018, at which time the Partnership plans to adopt the standard.
The Partnership is in the process of evaluating the impact of the standard update. The ultimate impact on revenue resulting from the application of the new standard will be subject to assessments that are dependent on many variables, including, but not limited to, the terms of contractual arrangements and the mix of business. Upon adoption, the Partnership expects that the allocation of revenue between equipment and service for wireless fixed-term service plans will result in more revenue allocated to equipment and recognized earlier as compared with current GAAP. The timing of recognition of sales commission expenses is also expected to be impacted, as a substantial portion of these costs (which are currently expensed) will be capitalized and amortized as described above. The available transition methods will continue to be evaluated. The Partnership’s considerations include, but are not limited to, the comparability of financial statements and the comparability within the industry from application of the new standard to contractual arrangements. The Partnership plans to select a transition method by the second half of 2017.
At Cellco, a cross-functional coordinated implementation team has been established to implement the standard update related to the recognition of revenue from contracts with customers. The Partnership has identified and is in the process of implementing changes to its systems, processes and internal controls to meet the standard update’s reporting and disclosure requirements.
Reclassifications– The Partnership reclassified certain prior year amounts to conform to the current year presentation.
Subsequent events – Events subsequent to December 31, 2016 have been evaluated through February 28, 2017 the date the financial statements were issued.
3.WIRELESS DEVICE INSTALLMENT PLANS
Under the Verizon device payment program, eligible wireless customers purchase wireless devices under a device payment plan agreement. Customers that activate service on devices purchased under the device payment program pay lower service fees as compared to those under fixed-term service plans, and their device payment plan charge is included in their standard wireless monthly bill.
Wireless device payment plan agreement receivables– The following table displays device payment plan agreement receivables, net, that continue to be recognized in the accompanying balance sheets:
| | | | | | |
| | 2016 | | 2015 |
Device payment plan agreement receivables, gross | | $ | 8,516 | | $ | 5,512 |
Unamortized imputed interest | | | (351) | | | (230) |
Device payment plan agreement receivables, net of | | | 8,165 | | | 5,282 |
unamortized imputed interest | | | | | | |
Allowance for credit losses | | | (939) | | | (254) |
Device payment plan agreement receivables, net | | $ | 7,226 | | $ | 5,028 |
| | | | | | |
Classified on the balance sheets: | | | | | | |
Accounts receivable, net | | $ | 5,011 | | $ | 3,104 |
Other assets | | | 2,215 | | | 1,924 |
Device payment plan agreement receivables, net | | $ | 7,226 | | $ | 5,028 |
The Partnership may offer customers certain promotions where a customer can trade-in his or her owned device in connection with the purchase of a new device. Under these types of promotions, the customer will receive trade-in credits that are applied to the customer’s monthly bill. As a result, the Partnership recognizes a trade-in obligation measured at fair value using weighted-average selling prices obtained in recent resales of devices eligible for trade-in. Device payment plan agreement receivables, net does not reflect this trade-in obligation. At December 31, 2016 and 2015, the amount of trade-in obligations was not significant.
At the time of sale, the Partnership imputes risk adjusted interest on the device payment plan agreement receivables. Imputed interest is recorded as a reduction to the related accounts receivable. Interest income, which is included within Other revenues on the statements of income and comprehensive income, is recognized over the financed payment term.
When originating device payment plan agreements, the Partnership uses internal and external data sources to create a credit risk score to measure the credit quality of a customer and to determine eligibility for the device payment program. If a customer is either new to the Partnership or has less than 210 days of customer tenure (a new customer), the credit decision process relies more heavily on external
data sources. For a small portion of new customer applications, a traditional credit report is not available from one of the national credit reporting agencies because the potential customer does not have sufficient credit history. In those instances, alternate credit data is used for the risk assessment. If the customer has 210 days or more of customer tenure (an existing customer), the credit decision process relies on internal data sources. The experience has been that the payment attributes of longer tenured customers are highly predictive when considering their ability to pay in the future. External data sources include obtaining a credit report from a national consumer credit reporting agency, if available. Internal data and/or credit data obtained from the credit reporting agencies is used to create a custom credit risk score. The custom credit risk score is generated automatically (except with respect to a small number of applications where the information needs manual intervention) from the applicant’s credit data using Verizon’s proprietary custom credit models, which are empirically derived and demonstrably and statistically sound. The credit risk score measures the likelihood that the potential customer will become severely delinquent and be disconnected for non-payment.
Based on the custom credit risk score, each customer is assigned to a credit class, each of which has a specified required down payment percentage and specified credit limits. Device payment plan agreement receivables originated from customers assigned to credit classes requiring no down payment represent the lowest risk. Device payment plan agreement receivables originated from customers assigned to credit classes requiring a down payment represent a higher risk.
Subsequent to origination, the Partnership monitors delinquency and write-off experience as key credit quality indicators for its portfolio of device payment plan agreements and fixed-term service plans. The extent of collection efforts with respect to a particular customer are based on the results of proprietary custom empirically derived internal behavioral scoring models which analyze the customer’s past performance to predict the likelihood of the customer falling further delinquent. These customer scoring models assess a number of variables, including origination characteristics, customer account history and payment patterns. Based on the score derived from these models, accounts are grouped by risk category to determine the collection strategy to be applied to such accounts. The Partnership continuously monitors collection performance results and the credit quality of device payment plan agreement receivables based on a variety of metrics, including aging. The Partnership considers an account to be delinquent and in default status if there are unpaid charges remaining on the account on the day after the bill’s due date.
As of December 31, 2016, the balance and aging of the device payment plan agreement receivables on a gross basis was as follows:
| | | | | | |
| | 2016 | | 2015 |
Unbilled | | $ | 7,912 | | $ | 5,180 |
Billed: | | | | | | |
Current | | | 418 | | | 256 |
Past due | | | 186 | | | 76 |
Device payment plan agreement receivables, gross | | $ | 8,516 | | $ | 5,512 |
Activity in the allowance for credit losses for the device payment plan agreement receivables was as follows:
| | | | | | |
| | 2016 | | 2015 |
Balance at January 1 | | $ | 254 | | $ | 33 |
Bad debt expenses | | | 1,182 | | | 374 |
Write-offs | | | (500) | | | (155) |
Other | | | 3 | | | 2 |
Balance at December 31 | | $ | 939 | | $ | 254 |
Customers entering into device payment plan agreements prior to May 31, 2015, have the right to upgrade their device, subject to certain conditions, including making a stated portion of the required device payment plan agreement payments and trading in their device in good working condition. Generally, customers entering into device payment plan agreements on or after June 1, 2015 are required to repay all amounts due under their device payment agreement before being eligible to upgrade their device. However, on select devices, certain marketing promotions have been revocably offered to customers to upgrade to a new device after paying down a certain specified portion of the device payment plan agreement amount as well as trading in their device in good working order. When a customer enters into a device payment plan agreement with the right to upgrade to a new device or for a device that is subject to an upgrade promotion, the Partnership records a guarantee liability in accordance with the Partnership’s accounting policy. The gross guarantee liability related to this program, which was $54 at December 31, 2016 and $149 at December 31, 2015, was included in Advance billings and other on the accompanying balance sheets.
4.SPECTRUM LICENSE TRANSACTION
On January 29, 2015, the FCC completed an auction of 65 MHz of spectrum, which it identified as the AWS-3 band. Cellco participated in that auction and was the high bidder on the licenses covering the Partnership service area. The licenses were deemed to be right to use assets and were allocated and recorded
by the Partnership as wireless licenses. The cash payment made by the Partnership of $441 is classified within Acquisition of wireless licenses on the statement of cash flows for the year ended December 31, 2015.
The average remaining renewal period of the Partnership’s wireless license portfolio was 5.7 years as of December 31, 2016.
5.PROPERTY, PLANT AND EQUIPMENT, NET
Property, plant and equipment consist of the following as of December 31, 2016 and 2015:
| | | | | | | | |
| | 2016 | | 2015 | | |
Buildings and improvements (15-45 years) | | $ | 27,890 | | $ | 27,956 | | |
Wireless plant and equipment (3-50 years) | | | 96,639 | | | 96,011 | | |
Furniture, fixtures and equipment (3-10 years) | | | 295 | | | 296 | | |
Leasehold improvements (5-7 years) | | | 7,259 | | | 7,146 | | |
| | | 132,083 | | | 131,409 | | |
Less: accumulated depreciation | | | (83,621) | | | (74,229) | | |
Property, plant and equipment, net | | $ | 48,462 | | $ | 57,180 | | |
| | | | | | | | |
Capitalized network engineering costs of $72 and $233, were recorded during the years ended December 31, 2016 and 2015, respectively. Construction in progress included in certain classifications shown above, principally consists of wireless plant and equipment, amounted to $1,004 and $806, as of December 31, 2016 and 2015, respectively. Depreciation expense of $10,363, $11,346, and $11,871 was incurred during the years ended December 31, 2016, 2015 and 2014, respectively.
6.TOWER MONETIZATION TRANSACTIONS
During March 2015, Verizon Communications, the parent company of Cellco, entered into an agreement with American Tower Corporation (ATC) giving ATC exclusive rights to lease and operate approximately 11,300 wireless towers owned and operated by Cellco and its subsidiaries for an upfront payment of $5.0 billion (not in thousands). Verizon Communications also sold 162 towers to ATC for an upfront payment of $0.1 billion (not in thousands). Under the terms of the lease agreements, ATC has exclusive rights to lease and operate the towers over an average term of approximately 28 years. As the leases expire, ATC has fixed-price purchase options to acquire these towers based on their anticipated fair market values at the end of the lease terms. The Partnership has subleased capacity on the towers from ATC for a minimum of 10 years at current market rates, with options to renew. The Partnership participated in this arrangement and has leased 102 towers to ATC for an upfront payment of $43,786. The upfront payment was accounted for as deferred rent and as a financing obligation. The $19,709 accounted for as deferred rent was included in cash flows provided by operating activities and relates to the portion of the towers for which the right-of-use has passed to ATC. The deferred rent is being recognized on a straight-line basis over the Partnership’s average lease term of 29 years. At December 31, 2015, a financing obligation in the amount of $24,077 was included in cash flows provided by financing activities, which relates to the portion of the towers that continue to be occupied and used for the Partnership’s network operations. The Partnership makes a sublease payment to ATC for $1.9 per month per site, with annual increases of 2 percent. During 2016 and 2015, the Partnership made $2,364 and $1,938, respectively, of sublease payments to ATC, which is recorded as Repayments of financing obligation.
At December 31, 2016 and 2015, the balance of deferred rent was $18,483 and $19,184, respectively. At December 31, 2016 and 2015, the balance of the financing obligation was $23,768 and $23,842, respectively.
7.CURRENT LIABILITIES
Accounts payable and accrued liabilities consist of the following as of December 31, 2016 and 2015:
| | | | | | | |
| | 2016 | | 2015 | |
| | | | | | | |
Accounts payable | | $ | 2,295 | | $ | 1,954 | |
Non-income based taxes and regulatory fees | | | 888 | | | 789 | |
Texas margin tax payable | | | 251 | | | 233 | |
Accrued commissions | | | 955 | | | 919 | |
Accounts payable and accrued liabilities | | $ | 4,389 | | $ | 3,895 | |
Advance billings and other consist of the following as of December 31, 2016 and 2015:
| | | | | | | |
| | 2016 | | 2015 | |
| | | | | | | |
Advance billings | | $ | 1,650 | | $ | 1,617 | |
Customer deposits | | | 36 | | | 82 | |
Guarantee liability, net | | | 54 | | | 149 | |
Advance billings and other | | $ | 1,740 | | $ | 1,848 | |
8.TRANSACTIONS WITH AFFILIATES AND RELATED PARTIES
In addition to fixed asset purchases and right to use licenses substantially all of service revenues, equipment revenues, other revenues, cost of service, cost of equipment, and selling, general and administrative expenses represent transactions processed by affiliates (Cellco and its related parties) on behalf of the Partnership or represent transactions with affiliates. These transactions consist of (1) revenues and expenses that pertain to the Partnership which are processed by Cellco and directly attributed to or directly charged to the Partnership; (2) roaming revenue by customers of other Cellco affiliated markets within the Partnership market or Partnership customers’ cost when roaming in other Cellco affiliated markets; (3) certain revenues and expenses that are processed or incurred by Cellco which are allocated to the Partnership based on factors such as the Partnership’s percentage of revenue streams, customers, gross customer additions, or minutes of use; (4) certain costs of operating switches which are allocated to the Partnership; and (5) lease agreements with Cellco, whereas the Partnership has the right to use certain spectrum. These transactions do not necessarily represent arm’s length transactions and may not represent all revenues and costs that would be present if the Partnership operated on a standalone basis. Cellco periodically reviews the methodology and allocation bases for allocating certain revenues, operating costs, selling, general and administrative expenses to the Partnership. Resulting changes, if any, in the allocated amounts have historically not been significant.
Service revenues– Service revenues include monthly customer billings processed by Cellco on behalf of the Partnership and roaming revenues relating to customers of other affiliated markets that are specifically identified to the Partnership. For the years ended December 31, 2016, 2015, and 2014 roaming revenues were $52,832, $53,031, and $47,483, respectively. Service revenues also include long distance, data, and certain revenue reductions including revenue concessions that are processed by Cellco and allocated to the Partnership based on certain factors deemed appropriate by Cellco.
Equipment revenues– Equipment revenues include equipment sales processed by Cellco and specifically identified to the Partnership, as well as certain handset and accessory revenues, contra-revenues including equipment concessions, and coupon rebates that are processed by Cellco and allocated to the Partnership based on certain factors deemed appropriate by Cellco.
Other revenues– Other revenues include other fees and surcharges charged to the customer that are specifically identified to the Partnership.
Cost of service– Cost of service includes roaming costs relating to the Partnership’s customers roaming in other affiliated markets and switch costs that are incurred by Cellco and allocated to the Partnership based on certain factors deemed appropriate by Cellco. For the years ended December 31, 2016, 2015, and 2014 roaming costs were $28,228, $27,273, and $24,116 and switch costs were $1,857, $1,833, and $2,075, respectively. Cost of service also includes cost of telecom, long distance and application content that are incurred by Cellco and allocated to the Partnership based on certain factors deemed appropriate by Cellco. The Partnership has lease agreements for the right to use additional spectrum owned by Cellco. See Note 9 for further information regarding this arrangement.
Cost of equipment– Cost of equipment is recorded at Cellco’s cost basis (see Note 2). Cost of equipment also includes certain costs related to handsets, accessories and other costs incurred by Cellco and allocated to the Partnership based on certain factors deemed appropriate by Cellco.
Selling, general and administrative– Selling, general and administrative expenses include commissions, customer billing, office telecom, customer care, salaries, sales and marketing and advertising expenses that are specifically identified to the Partnership as well as incurred by Cellco and allocated to the Partnership based on certain factors deemed appropriate by Cellco. The Partnership incurred $1,875, $1,715 and $1,966 in advertising costs for the years ended December 31, 2016, 2015 and 2014, respectively.
Property, plant and equipment– Property, plant and equipment includes assets purchased by Cellco and directly charged to the Partnership as well as assets transferred between Cellco and the Partnership (see Note 2).
Wireless licenses– Wireless licenses include the right to use assets that were allocated by Cellco and recorded by the Partnership in exchange for a $441 payment (see Note 4).
9.COMMITMENTS
Cellco, on behalf of the Partnership, and the Partnership itself have entered into operating leases for facilities, and equipment used in its operations. Lease contracts include renewal options that include rent expense adjustments based on the Consumer Price Index as well as annual and end-of-lease term adjustments. Rent expense is recorded on a straight-line basis. The noncancellable lease term used to calculate the amount of the straight-line rent expense is generally determined to be the initial lease term, including any optional renewal terms that are reasonably assured of occurring. Leasehold improvements related to these operating leases are amortized over the shorter of their estimated useful lives or the noncancellable lease term. For the years ended December 31, 2016, 2015 and 2014, the Partnership incurred a total of $3,679, $3,903, and $3,803 respectively, as rent expense related to these operating leases, which was included in Cost of service and in the accompanying statements of income and comprehensive income. Aggregate future minimum rental commitments under noncancellable operating leases, excluding renewal options that are not reasonably assured of occurring for the years shown are as follows:
| | | | |
Years | | Amount | |
2017 | | $ | 3,231 | |
2018 | | | 3,248 | |
2019 | | | 3,231 | |
2020 | | | 2,749 | |
2021 | | | 2,514 | |
2022 and thereafter | | | 9,251 | |
| | | | |
Total minimum payments | | $ | 24,224 | |
The Partnership has also entered into certain agreements with Cellco, whereas the Partnership leases certain spectrum from Cellco that overlaps the Texas #17 rural service area. Total rent expense under these spectrum leases amounted to $817, $817 and $817 in 2016, 2015 and 2014, respectively, which is included in Cost of service in the accompanying statements of income and comprehensive income.
Based on the terms of these leases as of December 31, 2016, future spectrum lease obligations are expected to be as follows:
| | | | |
Years | | Amount | |
2017 | | $ | 817 | |
2018 | | | 817 | |
2019 | | | 644 | |
2020 | | | 471 | |
2021 | | | 471 | |
2022 and thereafter | | | 4,998 | |
| | | | |
Total minimum payments | | $ | 8,218 | |
The General Partner currently expects that the renewal option in the leases will be exercised.
10.CONTINGENCIES
Cellco and the Partnership are subject to lawsuits and other claims including class actions, product liability, patent infringement, intellectual property, antitrust, partnership disputes, and claims involving relations with resellers and agents. Cellco is also currently defending lawsuits filed against it and other participants in the wireless industry alleging various adverse effects as a result of wireless phone usage. Various consumer class action lawsuits allege that Cellco violated certain state consumer protection laws and other statutes and defrauded customers through misleading billing practices or statements. These matters may involve indemnification obligations by third parties and/or affiliated parties covering all or part of any potential damage awards against Cellco and the Partnership and/or insurance coverage. All of the above matters are subject to many uncertainties, and the outcomes are not currently predictable.
The Partnership may be allocated a portion of the damages that may result upon adjudication of these matters if the claimants prevail in their actions. In none of the currently pending matters is the amount of accrual material.material to the Partnership. An estimate of the reasonably possible loss or range of loss in excess of the amounts already accrued to either Cellco or the Partnership with respect to these matters as of December 31, 20132016 cannot be made at this time due to various factors typical in contested proceedings, including (1) uncertain damage theories and demands; (2) a less than complete factual record; (3) uncertainty concerning legal theories and their resolution by courts or regulators; and (4) the unpredictable nature of the opposing party and its demands. WeThe Partnership continuously monitormonitors these proceedings as they develop and will adjust any accrual or disclosure as needed. We doIt is not expectexpected that the ultimate resolution of any pending regulatory or legal matter in future periods will have a material effect on the financial condition of the Partnership, but it could have a material effect on ourthe results of operations for a given reporting period.
8. RECONCILIATION11.RECONCILIATION OF ALLOWANCE FOR DOUBTFUL ACCOUNTS
| | Beginning | | Charged to | | Net of | | End | |
| | of the Year | | Operations | | Recoveries | | of the Year | |
| | | | | | | | | |
Accounts Receivable Allowances: | | | | | | | | | |
| | | | | | | | | |
2013 (unaudited) | | $ | 143 | | $ | 531 | | $ | (449 | ) | $ | 225 | |
2012 | | 366 | | 270 | | (493 | ) | 143 | |
2011 | | 245 | | 722 | | (601 | ) | 366 | |
| | | | | | | | | | | | | |
F-60
| | | | | | | | | | | | | |
| | Balance at | | Additions | | Write-offs | | Balance at | |
| | Beginning | | Charged to | | Net of | | End | |
| | of the Year | | Operations | | Recoveries | | of the Year | |
| | | | | | | | | | | | | |
Accounts Receivable Allowances: | | | | | | | | | | | | | |
2016 | | $ | 784 | | $ | 2,128 | | $ | (1,501) | | $ | 1,411 | |
2015 | | | 666 | | | 1,546 | | | (1,428) | | | 784 | |
2014 | | | 693 | | | 1,421 | | | (1,448) | | | 666 | |