Investment structure In general, our Investment Adviser intends to select investments with financial covenants and terms that reduce leverage over time, thereby enhancing credit quality. These methods include: In addition, limitations on asset sales and capital expenditures should prevent a company from changing the nature of its business or capitalization without our consent. Our investment adviser seeks, where appropriate, to limit the downside potential of our investments by: Valuation process We realizable value of any collateral, the portfolio company’s ability to make payments, the markets in which the portfolio company does business, market yield trend analysis, comparison to publicly traded companies, discounted cash flow and other relevant factors. Our investment in the subordinated notes of Saratoga CLO is carried at fair value, which is based on a discounted cash flow model that utilizes prepayment,re-investment and loss assumptions based on historical experience and projected performance, economic factors, the characteristics of the underlying cash flow, and comparable yields for similar collateralized loan obligation fund subordinated notes or equity, when available. Specifically, we use Intex cash flow models, or an appropriate substitute, to form the basis for Saratoga CLO’s valuation. The Intex cash flow models use a set of assumptions including projected default rates, recovery rates, reinvestment rate and prepayment rates in order to arrive at estimated cash flows. The assumptions are based on available market data and projections provided by third parties as well as management estimates. We use the output from the Intex models (i.e., the estimated cash flows from our investment in Saratoga CLO) to perform a discounted cash We undertake a multi-step valuation process each quarter when valuing investments for which market quotations are not readily available, as described below: In addition, all our investments are subject to the following valuation process: Because such valuations, and particularly valuations of private investments and private companies, are inherently uncertain, they may fluctuate over short periods of time and may be based on estimates. The determination of fair value may differ materially from the values that would have been used if a ready market for these investments existed. Our net asset value could be materially affected if the determinations regarding the fair value of our investments were materially higher or lower than the values that we ultimately realize upon the disposal of such investments. Ongoing relationships with and monitoring of portfolio companies Saratoga Investment Advisors will closely monitor each investment we make and, when appropriate, will conduct a regular dialogue with both the management team and other debtholders and seek specifically tailored financial reporting. In addition, in certain circumstances, senior investment professionals of Saratoga Investment Advisors may take board seats or board observation seats. Distributions Our distributions, if any, will be determined by our board of directors and paid out of assets legally available for distribution. Any such distributions generally will be taxable to our stockholders, including to those stockholders who receive additional shares of our common stock pursuant to our dividend reinvestment plan. Prior to January 2009, we paid quarterly dividends to our stockholders. However, in January 2009, we suspended the practice of paying quarterly dividends to our stockholders and On September 24, 2014, we announced the recommencement of quarterly dividends to our stockholders, and have subsequently made distributions under this new policy. We have adopted a dividend reinvestment plan (“DRIP”) that provides for reinvestment of our dividend distributions on behalf of our stockholders unless a stockholder elects to receive cash. As a result, if our board of directors authorizes, and we declare, a cash dividend, then our stockholders who have not “opted out” of the DRIP by the dividend record date will have their cash dividends automatically reinvested into additional shares of our common stock, rather than receiving the cash dividends. We have the option to satisfy the share requirements of the DRIP through the issuance of new shares of common stock or through open market purchases of common stock by the DRIP plan administrator. In order to maintain our qualification as a RIC, we must for each fiscal year distribute an amount equal to at least 90.0% of our ordinary net taxable income and realized net short-term capital gains in excess of realized net long-term capital losses, if any, reduced by deductible expenses. In addition, we will be subject to federal excise taxes to the extent we do not distribute during the calendar year at least (1) 98.0% of our ordinary income for the calendar year, (2) 98.2% of our capital gains in excess of capital losses for the one year period ending on October 31 of the calendar year and (3) any ordinary income and net capital gains for preceding years that were not distributed during such years and on which we paid no federal income tax. For the We may distribute taxable dividends that are payable in cash or shares of our common stock at the election of each stockholder. Under certain applicable provisions of the Code and the Treasury regulations, distributions payable in cash or in shares of stock at the election of stockholders are treated as taxable dividends. The Internal Revenue Service (“IRS”) has issued private rulings indicating that this rule will apply even where the total amount of cash that may be distributed is limited to no more than 20.0% of the total distribution. Under these rulings, if too many stockholders elect to receive their distributions in cash, each such stockholder would receive a pro rata share of the total cash to be distributed and would receive the remainder of their distribution in shares of stock. If we decide to make any distributions consistent with these rulings that are payable in part in our stock, taxable stockholders receiving such dividends will be required to include the full amount of the dividend (whether received in cash, our stock, or a combination thereof) as ordinary income (or as long-term capital gain to the extent such distribution is properly reported as a capital gain dividend) to the extent of our current and accumulated earnings and profits for United States federal income tax purposes. As a result, a U.S. stockholder may be required to pay tax with respect to such dividends in excess of any cash received. If a U.S. stockholder sells the stock Competition Our primary competitors in providing financing to private middle market companies include public and private investment funds (including private equity funds, mezzanine funds, BDCs and SBICs), commercial and investment banks and commercial financing companies. Additionally, alternative investment vehicles, such as hedge funds, frequently invest in middle-market companies. As a result, competition for investment opportunities at middle-market companies can be intense. However, we continue to believe that there has been an overall reduction in the amount of debt capital available on average since the downturn in the credit markets, which began inmid-2007, and that this has resulted in a somewhat less competitive environment for making new investments. While many middle-market companies were previously able to raise senior debt financing through traditional large financial institutions, we believe this approach to financing is more difficult as implementation of U.S. and international financial reforms, such as Basel 3, limits the capacity of large financial institutions to holdnon-investment grade leveraged loans on their balance sheets. We believe that many of these financial institutions havede-emphasized their service and product offerings to middle-market companies in particular. Many of our competitors are substantially larger and have considerably greater financial and marketing resources than us. For example, some competitors may have access to funding sources that are not available to us. In addition, some of our competitors may have higher risk tolerances or different risk assessments, which may allow them to consider a wider variety of For additional information concerning the competitive risks we face, please see Part Staffing We do not currently have any employees and do not expect to have any employees in the future. Services necessary for our business are provided by individuals who are employees of Saratoga Investment Advisors, pursuant to the terms of the Management Agreement and the administration agreement. For a discussion of the Management Agreement, see “Business—Investment Advisory and Management Agreement” below. We reimburse Saratoga Investment Advisors for our allocable portion of expenses incurred by it in performing its obligations under the administration agreement, including rent and our allocable portion of the cost of our officers and their respective staffs, subject to certain limitations. For a discussion of the administration agreement, see “Business—Administration Agreement” below. Investment Advisory and Management Agreement Saratoga Investment Advisors serves as our investment adviser. Our investment adviser was formed in 2010 as a Delaware limited liability company and became our investment advisor in July 2010. Subject to the overall supervision of our board of directors, Saratoga Investment Advisors manages ourday-to-day operations and provides investment advisory and management services to us. Under the terms of the Management Agreement, Saratoga Investment Advisors: Saratoga Investment Advisors services under the Management Agreement are not exclusive, and it is free to furnish similar services to other entities. Management Fee and Incentive Fee Pursuant to the Management Agreement with Saratoga Investment Advisors, we pay Saratoga Investment Advisors a fee for investment advisory and management services consisting of two components—a base management fee and an incentive fee. The base management fee is paid quarterly in arrears, and equals 1.75% per annum of our gross assets (other than cash or cash equivalents but including assets purchased with borrowed funds) and calculated at the end of each fiscal quarter based on the average value of our gross assets (other than cash or cash equivalents but including assets purchased with borrowed funds) as of the end of such fiscal quarter and the end of the immediate prior fiscal quarter. Base management fees for any partial month or quarter are appropriatelypro-rated. The incentive fee has the following two parts: The first part is calculated and payable quarterly in arrears based on ourpre-incentive fee net investment income for the immediately preceding fiscal quarter.Pre-incentive fee net investment income means interest income, dividend income and any other income (including any other fees such as commitment, origination, structuring, diligence, managerial and consulting fees or other fees that we receive from portfolio companies) accrued during the fiscal quarter, minus our operating expenses for the quarter (including the base management fee, expenses payable under the administration agreement, and any interest expense and dividends paid on any issued and outstanding preferred stock or debt security, but excluding the incentive fee).Pre-incentive fee net investment income includes, in the case of investments with a deferred interest feature (such as market discount, debt instruments with We pay Saratoga Investment Advisors an incentive fee with respect to ourpre-incentive fee net investment income in each fiscal quarter as follows: (A) no incentive fee in any fiscal quarter in which ourpre-incentive fee net investment income does not exceed the hurdle rate; (B) 100.0% of ourpre-incentive fee net investment income with respect to that portion of suchpre-incentive fee net investment income, if any, that exceeds the hurdle rate but is less than or equal to 2.344% in any fiscal quarter The following is a graphical representation of the calculation of the Quarterly Incentive Fee Based on Pre-Incentive Fee Net Investment Income (expressed as a percentage of the value of net assets) Percentage ofPre-Incentive Fee Net Investment Income allocated to income-related portion of incentive fee The second part of the incentive fee, the capital gains fee, is determined and payable in arrears as of the end of each fiscal year (or, upon termination of the Management Agreement), and is calculated at the end of each applicable fiscal year by subtracting (1) the sum of our cumulative aggregate realized capital losses and aggregate unrealized capital depreciation from (2) our cumulative aggregate realized capital gains, in each case calculated from May 31, 2010. If such amount is positive at the end of such year, then the capital gains fee for such year is equal to 20.0% of such amount, less the cumulative aggregate amount of capital gains fees paid in all prior years. If such amount is negative, then there is no capital gains fee for such year. Under the Management Agreement, the capital gains portion of the incentive fee is based on realized gains and realized and unrealized losses from May 31, 2010. Therefore, realized and unrealized losses incurred prior to such time will not be taken into account when calculating the capital gains portion of the incentive fee, and Saratoga Investment Advisors will be entitled to 20.0% of net capital gains that arise after May 31, 2010. In addition, the cost basis for computing our realized gains and losses on investments held by us as of May 31, 2010 equals the fair value of such investments as of such date. Examples of Quarterly Incentive Fee Calculation Example 1: Income Related Portion of Incentive Fee(1): Assumptions Alternative 1 Additional Assumptions Pre-incentive Alternative 2 Additional Assumptions Pre-incentive fee net investment income exceeds hurdle rate, but does not fully satisfy the Incentive Fee = = = = Pre-incentive Incentive fee = Incentive fee = Catch up = = Incentive fee = = = = Example 2: Capital Gains Portion of Incentive Fee: Alternative Assumptions(1) The capital gains portion of the incentive fee, if any, calculated under the cumulative method would be: Alternative 2 Assumptions(1) The capital gains portion of the incentive fee, if any, calculated under the cumulative method would be: The Management Agreement with Saratoga Investment Advisors was approved by our board of directors at anin-person meeting of the directors, including a majority of our independent directors, and was approved by our stockholders at the special meeting of stockholders held on July 30, 2010. On July In approving this Management Agreement, the directors considered, among other things, (i) the nature, extent and quality of the advisory and other services to be provided to us by Saratoga Investment Advisors; (ii) our investment performance and the investment performance of Saratoga Investment Advisors; (iii) the expected costs of the services to be provided by Saratoga Investment Advisors (including management fees, advisory fees and expense ratios) as compared to other companies within the industry, and the profits expected to be realized by Saratoga Investment Advisors; (iv) the limited potential for economies of scale in investment management associated with managing us; and (v) Saratoga Investment Advisors estimated pro forma profitability with respect to managing us. Payment of our expenses The Management Agreement provides that all investment professionals of Saratoga Investment Advisors and its staff, when and to the extent engaged in providing investment advisory services required to be provided by Saratoga Investment Advisors, and the compensation and routine overhead expenses of such personnel allocable to such services, will be provided and paid for by Saratoga Investment Advisors and not by us. We bear all costs and expenses of our operations and transactions, including those relating to: Duration and Termination The Management Agreement will remain in effect continuously, unless terminated under the termination provisions of the agreement. The Management Agreement provides that it may be terminated at any time, without the payment of any penalty, upon 60 days written notice, by the vote of stockholders holding a majority of our outstanding voting securities, or by the vote of our directors or by Saratoga Investment Advisors. The Management Agreement will, unless terminated as described above, continue in effect Indemnification Under the Management Agreement, Saratoga Investment Advisors and certain of its affiliates are not liable to us for any action taken or omitted to be taken by Saratoga Investment Advisors in connection with the performance of any of its duties or obligations under the agreement or otherwise as an investment adviser to us, except to the extent specified in Section 36(b) of the 1940 Act concerning loss resulting from a breach of fiduciary duty (as the same is finally determined by judicial proceedings) with respect to the receipt of compensation for services and except to the extent such action or omission constitutes gross negligence, willful misfeasance, bad faith or reckless disregard of its duties and obligations under the agreement. We also provide indemnification to Saratoga Investment Advisors and certain of its affiliates for damages, liabilities, costs and expenses incurred by them in or by reason of any pending, threatened or completed action, suit, investigation or other proceeding arising out of or otherwise based upon the performance of any of its duties or obligations under the agreement or otherwise as an investment adviser to us. However, we would not provide indemnification against any liability to us or our security holders to which Saratoga Investment Advisors or such affiliates would otherwise be subject by reason of willful misfeasance, bad faith or gross negligence in the performance of any such person’s duties or by reason of the reckless disregard of its duties and obligations under the agreement. Organization of the Investment Adviser Saratoga Investment Advisors is registered as an investment adviser under the Investment Advisers Act of 1940. The principal executive offices of Saratoga Investment Advisors are located at 535 Madison Avenue, New York, New York 10022. Administration Agreement Pursuant to a separate administration agreement, Saratoga Investment Advisors, who also serves as our administrator, furnishes us with office facilities, equipment and clerical, book-keeping and record keeping services. Under the administration agreement, our administrator also performs, or oversees the performance of, our required administrative services, which include, among other things, being responsible for the financial records which we are required to maintain, preparing reports for our stockholders and reports required to be filed with the SEC. In addition, our administrator assists us in determining and publishing our net asset value, oversees the preparation and filing of our tax returns and the printing and dissemination of reports to our stockholders, and generally oversees the payment of our expenses and the performance of administrative and professional services rendered to us by others. Payments under the administration agreement equal an amount based upon our allocable portion of our administrator’s overhead in performing its obligations under the administration agreement, including rent and our allocable portion of the cost of our officers and their respective staffs relating to the performance of services under this agreement (including travel expenses). Our allocable portion is based on the proportion that our total assets bears to the total assets administered or managed by our administrator. Under the administration agreement, our administrator also provides managerial assistance, on our behalf, to those portfolio companies who accept our offer of assistance. The administration agreement may be terminated by either party without penalty upon 60 days written notice to the other party. The amount payable by us under the administration agreement was initially capped at $1.0 million for each annual term of the agreement. On July to $1.5 million, effective November 1, 2016. Indemnification Under the administration agreement, Saratoga Investment Advisors and certain of its affiliates are not liable to us for any action taken or omitted to be taken by Saratoga Investment Advisors in connection with the performance of any of its duties or obligations under the agreement. We also provide indemnification to Saratoga Investment Advisors and certain of its affiliates for damages, liabilities, costs and expenses incurred by them in or by reason of any pending, threatened or completed action, suit, investigation or other proceeding arising out of or otherwise based upon the performance of any of its duties or obligations under the agreement or otherwise as an administrator to us. However, we do not provide indemnification against any liability to us or our security holders to which Saratoga Investment Advisors or such affiliates would otherwise be subject by reason of willful misfeasance, bad faith or gross negligence in the performance of any such person’s duties or by reason of the reckless disregard of its duties and obligations under the agreement. License Agreement We entered into a trademark license agreement with Saratoga Investment Advisors, pursuant to which Saratoga Investment Advisors grants us anon-exclusive, royalty-free license to use the name “Saratoga.” Under this agreement, we have a right to use the “Saratoga” name, for so long as Saratoga Investment Advisors or one of its affiliates remains our investment adviser. Other than with respect to this limited license, we have no legal right to the “Saratoga” name. Saratoga Investment Advisors has the right to terminate the license agreement if it is no longer acting as our investment adviser. In the event the Management Agreement is terminated, we would be required to change our name to eliminate the use of the name “Saratoga.” Business Development Company Regulations We have elected to be treated as a BDC under the 1940 Act. As with other companies regulated by the 1940 Act, a BDC must adhere to certain substantive regulatory requirements. The 1940 Act contains prohibitions and restrictions relating to transactions between BDCs and their affiliates (including any investment advisers orsub-advisers), principal underwriters and affiliates of those affiliates or underwriters, and requires that a majority of the directors be persons other than “interested persons,” as that term is defined in the 1940 Act. In addition, the 1940 Act provides that we may not change the nature of our business so as to cease to be, or to withdraw our election as, a BDC, unless approved by a majority of our outstanding voting securities. A majority of the outstanding voting securities of a company is defined under the 1940 Act as the lesser of: (i) 67.0% or more of such company’s stock present at a meeting if more than 50.0% of the outstanding stock of such company is present and represented by proxy or (ii) more than 50.0% of the outstanding stock of such company. Qualifying assets A BDC must have been organized and have its principal place of business in the United States and must be operated for the purpose of making investments in the types of securities described in (1), (2) or (3) below. Under the 1940 Act, a BDC may not acquire any asset other than assets of the type listed in Section 55(a) of the 1940 Act, which are referred to as qualifying assets, unless, at the time the acquisition is made, qualifying assets represent at least 70.0% of the company’s total assets. The principal categories of qualifying assets relevant to our business are the following: Significant managerial assistance to portfolio companies BDCs generally must offer to make available to the issuer of the securities in which we invest significant managerial assistance, except in circumstances where either (i) the BDC controls such issuer of securities or (ii) the BDC purchases such securities managerial assistance. As a BDC we offer, and must provide upon request, managerial assistance to our portfolio companies. Making available significant managerial assistance means, among other things, any arrangement whereby the BDC, through its directors, officers or employees or those of its investment adviser, offers to provide, and, if accepted, does so provide, significant guidance and counsel concerning the management, operations or business objectives and policies of a portfolio company. This assistance could involve, among other things, monitoring the operations of our portfolio companies, participating in board and management meetings, consulting with and advising officers of portfolio companies and providing other organizational and financial guidance. Pursuant to a separate administration agreement, our investment adviser provides such managerial assistance on our behalf to portfolio companies that request this assistance, recognizing that our involvement with each investment will vary based on factors including the size of the company, the nature of our investment, the company’s overall stage of development and our relative position in the capital structure. We may receive fees for these services. Temporary investments As a BDC, pending investment in other types of “qualifying assets,” as described above, our investments may consist of cash, cash equivalents, U.S. Government securities or high-quality debt securities maturing in one year or less from the time of investment, which we refer to, collectively, as temporary investments, so that 70.0% of our assets are qualifying assets. Typically, we will invest in U.S. Treasury bills or in repurchase agreements, provided that such agreements are fully collateralized by cash or securities issued by the U.S. Government or its agencies. A repurchase agreement involves the purchase by an investor, such as us, of a specified security and the simultaneous agreement by the seller to repurchase it at an agreed-upon future date and at a price which is greater than the purchase price by an amount that reflects an agreed-upon interest rate. There is no percentage restriction on the proportion of our assets that may be invested in such repurchase agreements. However, if more than 25.0% of our total assets constitute repurchase agreements from a single counterparty, we would not meet the asset diversification requirements in order to qualify as a RIC for U.S. federal income tax purposes. Thus, we do not intend to enter into repurchase agreements with a single counterparty in excess of this limit. Our investment adviser will monitor the creditworthiness of the counterparties with which we enter into repurchase agreement transactions. Indebtedness and senior securities As a BDC, we are permitted, under specified conditions, to issue multiple classes of indebtedness and one class of shares of stock, senior to our common stock, if our asset coverage, as defined in the 1940 Act, is at least equal to 200.0% immediately after each such issuance. In addition, while any indebtedness and senior securities remain outstanding, we must generally make provisions to prohibit any distribution to our stockholders or the repurchase of such securities or stock unless we meet the applicable asset coverage ratios at the time of the distribution or repurchase. We may also borrow amounts up to 5.0% of the value of our total assets for temporary or emergency purposes without regard to asset coverage. Common stock We are generally not able to issue and sell our common stock at a price below net asset value per share. We may, however, sell our common stock, warrants, options or rights to acquire our common stock, at a price below the current net asset value of the common stock if our board of directors determines that such sale is in our best interests and that of our stockholders, and our stockholders approve such sale. In any such case, the price at which our securities are to be issued and sold may not be less than a price which, in the determination of our board of directors, closely approximates the market value of such securities (less any distributing commission or discount). We may also make rights offerings to our stockholders at prices per share less than the net asset value per share, subject to applicable requirements of the 1940 Act. Code of ethics As a BDC, we and Saratoga Investment Advisors have each adopted a code of ethics pursuant toRule 17j-1 under the 1940 Act that establishes procedures for personal investments and restricts certain personal securities transactions. Personnel subject to each code may invest in securities for their personal investment accounts, including securities that may be purchased or held by us, so long as such investments are made in accordance with the code’s requirements. Proxy voting policies and procedures SEC registered investment advisers that have the authority to vote (client) proxies (which authority may be implied from a general grant of investment discretion) are required to adopt policies and procedures reasonably designed to ensure that the adviser votes proxies in the best interests of its clients. Registered investment advisers also must maintain certain records on proxy voting. In most cases, we will invest in securities that do not generally entitle us to voting rights in our portfolio companies. When we do have voting rights, we will delegate the exercise of such rights to our investment adviser. Saratoga Investment Advisors has particular proxy voting policies and procedures in place. In determining how to vote, officers of Saratoga Investment Advisors will consult with each other, taking into account our interests and the interests of our investors, as well as any potential conflicts of interest. Saratoga Investment Advisors will consult with legal counsel to identify potential conflicts of interest. Where a potential conflict of interest exists, Saratoga Investment Advisors may, if it so elects, resolve it by following the recommendation of a disinterested third party, by seeking the direction of our independent directors or, in extreme cases, by abstaining from voting. While Saratoga Investment Advisors may retain an outside service to provide voting recommendations and to assist in analyzing votes, it will not delegate its voting authority to any third party. An officer of Saratoga Investment Advisors will keep a written record of how all such proxies are voted. It will retain records of (1) proxy voting policies and procedures, (2) all proxy statements received (or it may rely on proxy statements filed on the SEC’s EDGAR system in lieu thereof), (3) all votes cast, (4) investor requests for voting information, and (5) any specific documents prepared or received in connection with a decision on a proxy vote. If it uses an outside service, Saratoga Investment Advisors may rely on such service to maintain copies of proxy statements and records, so long as such service will provide a copy of such documents promptly upon request. Saratoga Investment Advisors’ proxy voting policies are not exhaustive and are designed to be responsive to the wide range of issues that may be subject to a proxy vote. In general, Saratoga Investment Advisors will vote our proxies in accordance with these guidelines unless: (1) it has determined otherwise due to the specific and unusual facts and circumstances with respect to a particular vote, (2) the subject matter of the vote is not covered by these guidelines, (3) a material conflict of interest is present, or (4) it finds it necessary to vote contrary to its general guidelines to maximize stockholder value or our best interests. In reviewing proxy issues, Saratoga Investment Advisors generally will use the following guidelines: Elections of Directors: In general, Saratoga Investment Advisors will vote in favor of the management-proposed slate of directors. If there is a proxy fight for seats on a portfolio company’s board of directors, or Saratoga Investment Advisors determines that there are other compelling reasons for withholding our vote, it will determine the appropriate vote on the matter. It may withhold votes for directors that fail to act on key issues, such as failure to: (1) implement proposals to declassify a board, (2) implement a majority vote requirement, (3) submit a rights plan to a stockholder vote or (4) act on tender offers where a majority of stockholders have tendered their shares. Finally, Saratoga Investment Advisors may withhold votes for directors ofnon-U.S. issuers where there is insufficient information about the nominees disclosed in the proxy statement. Appointment of Auditors: We believe that a portfolio company remains in the best position to choose its independent auditors and Saratoga Investment Advisors will generally support management’s recommendation in this regard. Changes in Capital Structure: Changes in a portfolio company’s organizational documents may be required by state or federal regulation. In general, Saratoga Investment Advisors will cast our votes in accordance with the management on such proposals. However, Saratoga Investment Advisors will consider carefully any proposal regarding a change in corporate structure that is not required by state or federal regulation. Corporate Restructurings, Mergers and Acquisitions: We believe proxy votes dealing with corporate reorganizations are an extension of the investment decision. Accordingly, Saratoga Investment Advisors will analyze such proposals on acase-by-case basis and vote in accordance with its perception of our interests. Proposals Affecting Stockholder Rights: We will generally vote in favor of proposals that give stockholders a greater voice in the affairs of a portfolio company and oppose any measure that seeks to limit such rights. However, when analyzing such proposals, Saratoga Investment Advisors will balance the financial impact of the proposal against any impairment of stockholder rights as well as of our investment in the portfolio company. Corporate Governance:We recognize the importance of good corporate governance. Accordingly, Saratoga Investment Advisors will generally favor proposals that promote transparency and accountability within a portfolio company. Anti-Takeover Measures: Saratoga Investment Advisors will evaluate, on acase-by-case basis, any proposals regarding anti-takeover measures to determine the likely effect on stockholder value dilution. Share Splits: Saratoga Investment Advisors will generally vote with management on share split matters. Limited Liability of Directors: Saratoga Investment Advisors will generally vote with management on matters that could adversely affect the limited liability of directors. Social and Corporate Responsibility: Saratoga Investment Advisors will review proposals related to social, political and environmental issues to determine whether they may adversely affect stockholder value. It may abstain from voting on such proposals where they do not have a readily determinable financial impact on stockholder value. Privacy principles We are committed to protecting the privacy of our stockholders. The following explains the privacy policies of Saratoga Investment Corp., Saratoga Investment Advisors and their affiliated companies. We will safeguard, according to strict standards of security and confidentiality, all information we receive about our stockholders. The only information we collect from stockholders is the holder’s name, address, number of shares and social security number. This information is used only so that we can send annual reports and other information about us to the stockholder, and send the stockholder proxy statements or other information required by law. We do not share this information with anynon-affiliated third party except as described Compliance with applicable laws As a BDC, we are periodically examined by the SEC for compliance with the 1940 Act. We are required to provide and maintain a bond issued by a reputable fidelity insurance company to protect us against larceny and embezzlement. Furthermore, as a BDC, we are prohibited from protecting any director or officer against any liability to us or our stockholders arising from willful misfeasance, bad faith, gross negligence or reckless disregard of the duties involved in the conduct of such person’s office. We and Saratoga Investment Advisors are each required to adopt and implement written policies and procedures reasonably designed to prevent violation of the federal securities laws, review these policies and procedures annually for their adequacy and the effectiveness of their implementation, and designate a chief compliance officer to be responsible for administering the policies and procedures. Co-investment We may be prohibited under the 1940 Act from knowingly participating in certain transactions with our affiliates without the prior approval of our board of directors who are not interested persons and, in some cases, prior approval by the SEC. Thus, based on current SEC interpretations,co-investment transactions involving a BDC like us and an entity that is advised by Saratoga Investment Advisors or an affiliated adviser generally could not be effected without SEC relief. The staff of the SEC has, however, grantedno-action relief permitting for purchases of a single class of privately-placed securities provided that the adviser negotiates no term other than price and certain other conditions are met. As a result, currently we only expect toco-invest on a concurrent basis with affiliates of Saratoga Investment Advisors when each of us will own the same securities of the issuer and when no term is negotiated other than price. Any such investment would be made, subject to compliance with existing regulatory guidance, applicable regulations and our allocation procedures. We may in the future submit an application for exemptive Small Business Investment Company Regulations On March 28, 2012, our wholly-owned subsidiary, The SBIC license allows our SBIC LP subsidiary to obtain leverage by issuingSBA-guaranteed debentures, subject to the satisfaction of certain customary procedures.SBA-guaranteed debentures arenon-recourse, interest only debentures with interest payable semi-annually and have a ten year maturity. The principal amount ofSBA-guaranteed debentures is not required to be paid prior to maturity but may be prepaid at any time without penalty. The interest rate ofSBA-guaranteed debentures is fixed at the time of issuance at a market-driven spread over U.S. Treasury Notes with10-year maturities. SBICs are designed to stimulate the flow of private equity capital to eligible small businesses. Under SBA regulations, SBICs may make loans to eligible small businesses and invest in the equity securities of small businesses. Under present SBA regulations, eligible small businesses include businesses that have a tangible net worth not exceeding In December 2015, the 2016 omnibus spending bill approved by Congress and signed into law by the President increased the amount ofSBA-guaranteed debentures that affiliated SBIC funds can have outstanding from $225.0 million to $350.0 million, subject to SBA approval. SBA regulations currently limit the amount ofSBA-guaranteed debentures that an SBIC may issue to $150.0 million when it has at least $75.0 million in regulatory capital. Affiliated SBICs are permitted to issue up to a combined maximum amount of On April 2, 2015, the SBA issued a “green light” letter inviting us to continue the application process to obtain a license to form and operate its second SBIC subsidiary. On September 27, 2016, the SBA informed us that as part of their continued review of our application for a second license, and in order to ensure that they were reviewing the most current information available, we would need to update all previously submitted materials and invited us to reapply. As a result of this request, with which we are in the process of complying, the existing “green light” letter that the SBA issued to us has expired. If approved in the future, a second SBIC license would provide us an incremental source of long-term capital by permitting us to issue up to $150.0 million of additionalSBA-guaranteed debentures in addition to the $150.0 million already approved under the first license. As of February 28, Our SBIC LP subsidiary is subject to regulation and oversight by the SBA, including requirements with respect to maintaining certain minimum financial ratios and other covenants. The SBA, as a creditor, will have a superior claim to our SBIC LP subsidiary’s assets over our stockholders in the event we liquidate our SBIC LP subsidiary or the SBA exercises its remedies under theSBA-guaranteed debentures issued by our SBIC LP subsidiary upon an event of default. We received exemptive relief from the SEC to permit us to exclude the debt of our SBIC LP guaranteed by the SBA from the definition of senior securities in the 200.0% asset coverage test under the 1940 Act. This allows us increased flexibility under the 200.0% asset coverage test by permitting us to borrow up to $150.0 million more than we would otherwise be able to absent the receipt of this exemptive Available Information We file with or submit to the SEC annual, quarterly and current periodic reports, proxy statements and other information meeting the informational requirements of the Securities Exchange of 1934, as amended (the “Exchange Act”). You may inspect and copy these reports, proxy statements and other information at the Public Reference Room of the SEC at 100 F Street, N.E., Washington, D.C. 20549. You may obtain information on the operation of the Public Reference Room by calling the SEC at1-800-SEC-0330. Copies of these reports, proxy and information statements and other information may be obtained, after paying a duplicating fee, by electronic request at the followinge-mail address: publicinfo@sec.gov, or by writing the SEC’s Public Reference Section, Washington, D.C. 20549-0102. In addition, the SEC maintains an Internet website that contains reports, proxy and information statements and other information filed electronically by us with the SEC at http://www.sec.gov. Our Internet address is http://www.saratogainvestmentcorp.com. We make available free of charge on our Internet website our Investing in our securities involves a Risks Related to Our Business and Structure Beginning in 2007, global credit and other financial markets began to suffer substantial stress, volatility, illiquidity and disruption. These forces reached extraordinary levels in 2008, resulting in the bankruptcy of, the acquisition of, or government intervention in the affairs of several major domestic and international financial institutions. In particular, the financial services sector was negatively impacted by significant write-offs as the value of the assets held by financial firms declined, impairing their capital positions and abilities to lend and invest. We believe that such value declines were exacerbated by widespread forced liquidations as leveraged holders of financial assets, faced with declining prices, were compelled to sell to meet margin requirements and maintain compliance with applicable capital standards. Such forced liquidations also impaired or eliminated many investors and investment vehicles, leading to a decline in the supply of capital for investment and depressed pricing levels for many assets. These events significantly diminished overall confidence in the debt and equity markets, engendered unprecedented declines in the values of certain assets, and caused extreme economic uncertainty. If market conditions similar to these were to recur, our assets could experience a similar decline in value, among other negative impacts to the company. Since 2009, the global credit and other financial market conditions have improved as stability has increased throughout the international financial system and many public market indices have experienced positive total returns. However, the global macroeconomic environment and recovery from the downturn has been challenging and inconsistent. Instability in the global credit markets, the impact of periodic uncertainty regarding the U.S. federal budget, the instability in the geopolitical environment in many parts of the world, sovereign debt conditions in Europe and other disruptions may continue to put pressure on economic conditions in the U.S. and abroad. As a result of the 2016 U.S. election, the Republican Party currently controls both the executive and legislative branches of government, which increases the likelihood that legislation may be adopted that could significantly affect the regulation of U.S. financial markets. Areas subject to potential change, amendment or repeal include the Dodd-Frank Act and the authority of the Federal Reserve and the Financial Stability Oversight Council. The United States may also potentially withdraw from or renegotiate various trade agreements and take other actions that would change current trade policies of the United States. We cannot predict which, if any, of these actions will be taken or, if taken, their effect on the financial stability of the United States. Such actions could have a significant adverse We may be obligated to pay Saratoga Investment Advisors incentive fees even if we incur a net loss, or there is a decline in the value of our portfolio. Saratoga Investment Advisors is entitled to incentive fees for each fiscal quarter in an amount equal to a percentage of the excess of our investment income for that quarter (before deducting incentive compensation, but net of operating expenses and certain other items) above a threshold return for that quarter. Ourpre-incentive fee net investment income, for incentive compensation purposes, excludes realized and unrealized capital gains or losses that we may incur in the fiscal quarter, even if such capital gains or losses result in a net gain or loss on our Under the terms of the Management Agreement, we may have to pay incentive fees to Saratoga Investment Advisors in connection with the sale of an investment that is sold at a price higher than the fair value of such investment on May 31, 2010, even if we incur a loss on the sale of such investment. Incentive fees on capital gains paid to Saratoga Investment Advisors under the Management Agreement equals 20.0% of our “incentive fee capital gains,” which equals our realized capital gains on a cumulative basis from May 31, 2010 through the end of the fiscal year, if any, computed net of all realized capital losses and unrealized capital depreciation on a cumulative basis, less the aggregate amount of any previously paid capital gain incentive fee. Under the Management Agreement, the capital gains portion of the incentive fee is based on realized gains and realized and unrealized losses from May 31, 2010. Therefore, realized and unrealized losses incurred prior to such time will not be taken into account when calculating the capital gains portion of the incentive fee, and Saratoga Investment Advisors will be entitled to 20.0% of the incentive fee capital gains that arise after May 31, 2010. In addition, the cost basis for computing realized gains and losses on investments held by us as of May 31, 2010 will equal the fair value of such investments as of such date. See ourForm 10-Q for the quarter ended May 31, 2010 that was filed with the SEC on July 15, 2010 for the fair value and other information related to our investments as of such date. As a result, we may be required to pay incentive fees to Saratoga Investment Advisors on the sale of an investment even if we incur a realized loss on such investment, so long as the investment is sold for an amount greater than its fair value as of May 31, 2010. The way in which the base management and incentive fees under the Management Agreement is determined may encourage Saratoga Investment Advisors to take actions that may not be in our best interests. The incentive fee payable by us to our investment adviser may create an incentive for it to make investments on our behalf that are risky or more speculative than would be the case in the absence of such compensation arrangement, which could result in higher investment losses, particularly during cyclical economic downturns. The way in which the incentive fee payable to our investment adviser is determined, which is calculated separately in two components as a percentage of the income (subject to a hurdle rate) and as a percentage of the realized gain on invested capital, may encourage our investment adviser to use leverage to increase the return on our investments or otherwise manipulate our income so as to recognize income in quarters where the hurdle rate is exceeded. Moreover, we pay Saratoga Investment Advisors a base management fee based on our total assets, including any investments made with borrowings, which may create an incentive for it to cause us to incur more leverage than is prudent, or not to repay our outstanding indebtedness when it may be advantageous for us to do so, in order to maximize its compensation. Under certain circumstances, the use of leverage may increase the likelihood of default, which would disfavor the holders of our securities. The incentive fee payable by us to our investment adviser also may create an incentive for our investment adviser to invest on our behalf in instruments that have a deferred interest feature. Under these investments, we would accrue the interest over the life of the investment but would not receive the cash income from the investment until the end of the investment’s term, if at all. Our net investment income used to calculate the income portion of our incentive fee, however, includes accrued interest. Thus, a portion of the incentive fee would be based on income that we have not yet received in cash and may never receive in cash if the portfolio company is unable to satisfy such interest payment obligation to us. Consequently, while we may make incentive fee payments on income accruals that we may not collect in the future and with respect to which we do not have a “claw back” right against our investment adviser per se, the amount of accrued income written off in any period will reduce the income in the period in which suchwrite-off was taken and may thereby reduce such period’s incentive fee payment. In addition, Saratoga Investment Advisors receives a quarterly income incentive fee based, in part, on ourpre-incentive fee net investment income, if any, for the immediately preceding calendar quarter. This income incentive fee is subject to a fixed quarterly hurdle rate before providing an income incentive fee return to Saratoga Investment Advisors. This fixed hurdle rate was determined when then current interest rates were relatively low on a historical basis. Thus, if interest rates rise, it would become easier for our investment income to exceed the hurdle rate and, as a result, more likely that Saratoga Investment Advisors will receive an income incentive fee than if interest rates on our investments remained constant or decreased. extinguishment of debt for financial reporting and tax purposes, such net gain or loss will not be included in ourpre-incentive fee net investment income for purposes of determining the income incentive fee payable to our investment adviser under the Management Agreement. Moreover, our investment adviser receives the incentive fee based, in part, upon net capital gains realized on our investments. Unlike the portion of the incentive fee based on income, there is no performance threshold applicable to the portion of the incentive fee based on net capital gains. As a result, our investment adviser may have a tendency to invest more in investments that are likely to result in capital gains as compared to income producing securities. Such a practice could result in our investing in more speculative securities than would otherwise be the case, which could result in higher investment losses, particularly during economic downturns. Our board of directors will seek to ensure that Saratoga Investment Advisors is acting in our best interests and that any conflict of interest faced by Saratoga Investment Advisors in its capacity as our investment adviser does not negatively impact us. The base management fee we pay to Saratoga Investment Advisors may We pay Saratoga Investment Advisors a quarterly base management fee based on the value of our total assets (including any assets acquired with leverage). Accordingly, Saratoga Investment Advisors has an economic incentive to increase our leverage. Our board of directors monitors the conflicts presented by this compensation structure by approving the amount of leverage that we incur. If our leverage is increased, we will be exposed to increased risk of loss, bear the increase cost of issuing and servicing such senior indebtedness, and will be subject to any additional covenant restrictions imposed on us in an indenture or other instrument or by the applicable lender. We employ leverage, which magnifies the potential for gain or loss on amounts invested and may increase the risk of investing in us. Borrowings, also known as leverage, magnify the potential for gain or loss on amounts invested and, therefore, increase the risks associated with investing in us. We borrow from and issue senior debt securities to banks and other lenders that is secured by a lien on our assets. Holders of these senior securities have fixed dollar claims on our assets that are superior to the claims of Our outstanding indebtedness imposes, and additional debt we may incur in the future will likely impose, financial and operating covenants that restrict our business activities, including limitations that could hinder our ability to finance additional loans and investments or to make the distributions required to maintain our status as a RIC. A failure to add new debt facilities or issue additional debt securities or other evidences of indebtedness in lieu of or in addition to existing indebtedness could have a material adverse effect on our business, financial condition or results of operations. As of February 28, 2017, there was no outstanding balance under the Credit Facility. As of February 28, 2017, we had issued $112.7 millionSBA-guaranteed debentures and $74.5 million in aggregate principal amount of the 2023 Notes. On January 13, 2017, we redeemed the $61.8 million of outstanding 2020 Notes using the proceeds from the issuance of the 2023 Notes, leaving $9.8 million in net proceeds from the 2023 Notes offering. We may incur additional indebtedness in the future, including, but not limited to, borrowings under the Credit Facility or the issuance of additional debt securities in one or more public or private offerings, although there can be no assurance that we will be successful in doing so. Our ability to service our debt depends largely on our financial performance and is subject to prevailing economic conditions and competitive pressures. The amount of leverage that we employ at any particular time will depend on our management’s and our board of directors’ assessment of market and other factors at the time of any proposed borrowing. Saratoga Investment Advisors’ liability is limited under the Management Agreement and we will indemnify Saratoga Investments Advisors against certain liabilities, which may lead it to act in a riskier manner on our behalf than it would when acting for its own account. Saratoga Investment Advisors has not assumed any responsibility to us other than to render the services described in the Management Agreement. Pursuant to the Management Agreement, Saratoga Investment Advisors and its officers and employees are not liable to us for their acts under the Management Agreement absent willful misfeasance, bad faith, gross negligence or reckless disregard in the performance of their duties. We have agreed to indemnify, defend and protect Saratoga Investment Advisors and its officers and employees with respect to all damages, liabilities, costs and expenses resulting from acts of Saratoga Investment Advisors not arising out of willful misfeasance, bad faith, gross negligence or reckless disregard in the performance of their duties under the Management Agreement. These protections may lead Saratoga Investment Advisors to act in a riskier manner when acting on our behalf than it would when acting for its own account. Substantially all of our assets are subject to security interests under our Credit Facility or claims of the SBA with respect toSBA-guaranteed debentures we may issue and if we default on our obligations thereunder, we may suffer adverse consequences, including the foreclosure on our assets. Substantially all of our assets are pledged as collateral under the Credit Facility or are subject to a superior claim over the holders of our common stock or the 2023 Notes by the SBA pursuant to theSBA-guaranteed debentures. If we default on our obligations under the Credit Facility or theSBA-guaranteed debentures, Madison Capital Funding and/or the SBA may have the right to foreclose upon and sell, or otherwise transfer, the collateral subject to their security interests or superior claim. In such event, we may be forced to sell our investments to raise funds to repay our outstanding borrowings in order to avoid foreclosure and these forced sales may be at times and at prices we would not consider advantageous. Moreover, such deleveraging of our company could significantly impair our ability to effectively operate our business in the manner in which we have historically operated. In addition, if Madison Capital Funding exercises its right to sell the assets pledged under the Credit Facility, such sales may be completed at distressed sale prices, thereby diminishing or potentially eliminating the amount of cash available to us after repayment of the amounts outstanding under the Credit Facility. We are exposed to risks associated with changes in interest rates including potential effects on our cost of capital and net investment income. General interest rate fluctuations and changes in credit spreads on floating rate loans may have a substantial negative impact on our investments and investment opportunities and, accordingly, may have a material adverse effect on our rate of return on invested capital. In addition, an increase in interest rates would make it more expensive to use debt to finance our investments. Decreases in credit spreads on debt that pays a floating rate of return would have an impact on the income generation of our floating rate assets. Trading prices for debt that pays a fixed rate of return tend to fall as interest rates rise. Trading prices tend to fluctuate more for fixed rate securities that have longer maturities. Although we have no policy governing the maturities of our investments, under current market conditions we expect that we will invest in a portfolio of debt generally having maturities of up to ten years. This means that we will be subject to greater risk (other things being equal) than an entity investing solely in shorter-term securities. Because we may borrow to fund our investments, a portion of our net investment income may be dependent upon the difference between the interest rate at which we borrow funds and the interest rate at which we invest these funds. A portion of our investments will have fixed interest rates, while a portion of our borrowings will likely have floating interest rates. As a result, a significant change in market interest rates could have a material adverse effect on our net investment income. In periods of rising interest rates, our cost of funds could increase, which would reduce our net investment income. We may hedge against such interest rate fluctuations by using standard hedging instruments such as futures, options and forward contracts, subject to applicable legal requirements, including without limitation, all necessary registrations (or exemptions from registration) with the Commodity Futures Trading Commission. These activities may limit our ability to participate in the benefits of lower interest rates with respect to the hedged borrowings. Adverse developments resulting from changes in interest rates or hedging transactions could have a material adverse effect on our business, financial condition and results of operations. There are significant potential conflicts of interest which could adversely impact our investment returns. Our executive officers and directors, and the members of our investment adviser, serve or may serve as officers, directors or principals of entities that operate in the same or a related line of business as we do or of investment funds managed by our affiliates. Accordingly, they may have obligations to investors in those entities, the fulfillment of which might not be in the best interests of us or our stockholders. For example, Christian L. Oberbeck, our chief executive officer and managing member of our investment adviser, is the managing partner of Saratoga Partners, a middle market private equity investment firm. In addition, the principals of our investment adviser may manage other funds which may from time to time have overlapping investment objectives with those of us and accordingly invest in, whether principally or secondarily, asset classes similar to those targeted by us. If this should occur, the principals of our investment adviser will face conflicts of interest in the allocation of investment opportunities to us and such other funds. Although our investment professionals will endeavor to allocate investment opportunities in a fair and equitable manner, we and our common stockholders could be adversely affected in the event investment opportunities are allocated among us and other investment vehicles managed or sponsored by, or affiliated with, our executive officers, directors and investment adviser, and the members of our investment adviser. Changes in laws or regulations governing our operations, or changes in the interpretation thereof, and any failure by us to comply with laws or regulations governing our operations may adversely affect our business. We are subject to regulation at the local, state and federal levels. These laws and regulations, as well as their interpretation, may be changed from time to time. Any change in these laws or regulations, or their interpretation, or any failure by us to comply with these laws or regulations may adversely affect our business. We are dependent on information systems and systems failures could significantly disrupt our business, which may, in turn, negatively affect the market price of our common stock and our ability to pay dividends. Our business is dependent on our and third parties’ communications and information systems. Any failure or interruption of those systems, including as a result of the termination of an agreement with any third-party service providers, could cause delays or other problems in our activities. Our financial, accounting, data processing, backup or other operating systems and facilities may fail to operate properly or become disabled or damaged as a result of a number of factors including events that are wholly or partially beyond our control and adversely affect our business. There could be: These events, in turn, could have a material adverse effect on our operating results and negatively affect the market price of our common stock and our ability to pay dividends to our stockholders. Cybersecurity risks and cyber incidents may adversely affect our business by causing a disruption to our operations, a compromise or corruption of our confidential information and/or damage to our business relationships, all of which could negatively impact our business, results of operations or financial condition. A cyber incident is considered to be any adverse event that threatens the confidentiality, integrity or availability of our information resources. These incidents may be an intentional attack or an unintentional event and could involve gaining unauthorized access to our information systems for purposes of misappropriating assets, stealing confidential information, corrupting data or causing operational disruption. The result of these incidents may include disrupted operations, misstated or unreliable financial data, liability for stolen information, misappropriation of assets, increased cybersecurity protection and insurance costs, litigation and damage to our business relationships. Any such attack could result in significant losses, reputational damage, litigation, regulatory fines or penalties, or otherwise adversely affect our business, financial condition or results of operations. In addition, we may be required to expend significant additional resources to modify our protective measures and to investigate and remediate vulnerabilities or other exposures arising from operational and security risks. We face risks posed to our information systems, both internal and those provided to us by third-party service providers. We, our Adviser and its affiliates have implemented processes, procedures and internal controls to help mitigate cybersecurity risks and cyber intrusions, but these measures, as well as our increased awareness of the nature and extent of a risk of a cyber-incident, may be ineffective and do not guarantee that a cyber-incident will not occur or that our financial results, operations or confidential information will not be negatively impacted by such an incident. Third parties with which we do business (including those that provide services to us) may also be sources or targets of cybersecurity or other technological risks. We outsource certain functions and these relationships allow for the storage and processing of our information and assets, as well as certain investor, counterparty, employee and borrower information. While we engage in actions to reduce our exposure resulting from outsourcing, ongoing threats may result in unauthorized access, loss, exposure or destruction of data, or other cybersecurity incidents, with increased costs and other consequences, including those described above. Privacy and information security laws and regulation changes, and compliance with those changes, may also result in cost increases due to system changes and the development of new administrative processes. Regulations governing our operation as a BDC will affect our ability to raise additional capital. Our business requires a substantial amount of additional capital. We may acquire additional capital from the issuance of senior securities or other indebtedness or the issuance of additional shares of our common stock. However, we may not be able to raise additional capital in the future on favorable terms or at all. We may issue debt securities or preferred securities, which we refer to collectively as “senior securities,” and we may borrow money from banks or other financial institutions, up to the maximum amount permitted by the 1940 Act. Under the provisions of the 1940 Act, we are permitted, as a BDC, to incur indebtedness or issue senior securities only in amounts such that our asset coverage, as defined in the 1940 Act, equals at least 200.0% after such incurrence or issuance. Our ability to issue different types of securities is also limited. Compliance with these requirements may unfavorably limit our investment opportunities and reduce our ability in comparison to other companies to profit from favorable spreads between the rates at which we can borrow and the rates at which we can lend. As a business development company, therefore, we may need to issue equity more frequently than our privately owned competitors, which may lead to greater stockholder dilution. With respect to certain types of senior securities, we must make provisions to prohibit any dividend distribution to our stockholders or the repurchase of certain of our securities, unless we meet the applicable asset coverage ratios at the time of the dividend distribution or repurchase. If the value of our assets declines, we may be unable to satisfy the asset coverage test. If that happens, we may be required to liquidate a portion of our investments and repay a portion of our indebtedness at a time when such sales may be disadvantageous in order to make dividend distributions or repurchase certain of our securities. We are not generally able to issue and sell our common stock at a price below net asset value per share. We may, however, sell our common stock, or warrants, options or rights to acquire our common stock, at a price below the current net asset value of the common stock if our board of directors determines that such sale is in our best interests and the best interests of our stockholders, and our stockholders approve such sale. In any such case, the price at which our securities are to be issued and sold may not be less than a price which, in the determination of our board of directors, closely approximates the market value of such securities (less any commission or discount). If our common stock trades at a discount to net asset value, this restriction could adversely affect our ability to raise capital. value. Pending legislation may allow us to incur additional leverage. As a future. The agreement governing our Credit Facility contains various covenants that, among other things, limits our discretion in operating our business and provides for certain minimum financial covenants. The agreement governing the Credit Facility contains customary default provisions such as the termination or departure of certain “key persons” of Saratoga Investment Advisors, a material adverse change in our business and the failure to maintain certain minimum loan quality and performance standards. An event of default under the facility would result, among other things, in termination of the availability of further funds under the facility and an accelerated maturity date for all amounts outstanding under the facility, which would likely disrupt our business and, potentially, the portfolio companies whose loans we financed through the facility. This could reduce our revenues and, by delaying any cash payment allowed to us under the facility until the lender has been paid in full, reduce our liquidity and cash flow and impair our ability to grow our business and maintain our status as a RIC. Each loan origination under the facility is subject to the satisfaction of certain conditions. We cannot assure you that we will be able to borrow funds under the facility at any particular time or at all. We will be subject to corporate-level income tax if we fail to qualify as a RIC. We The source of income requirement is satisfied if we derive at least 90.0% of our annual gross income from interest, dividends, payments with respect to certain securities loans, gains from the sale or other disposition of securities or options thereon or foreign currencies, or other income derived with respect to our business of investing in such securities or currencies, and net income from interests in “qualified publicly traded partnerships,” as defined in the Code. The annual distribution requirement is satisfied if we distribute to our stockholders on an annual basis an amount equal to at least 90.0% of our ordinary net taxable income and realized net short-term capital gains in excess of realized net long-term capital losses, if any, reduced by deductible expenses. We are subject to certain asset coverage ratio requirements under the 1940 Act and covenants under our borrowing agreements that could, under certain circumstances, restrict us from making distributions necessary to qualify as a RIC. In such case, if we are unable to obtain cash from other sources, we may fail to qualify as a RIC and, thus, may be subject to corporate-level income tax. The diversification requirements will be satisfied if we diversify our holdings so that at the end of each quarter of the taxable year: (i) at least 50.0% of the value of our assets consists of cash, cash equivalents, U.S. government securities, securities of other regulated investment companies, and other securities if such other securities of any one issuer do not represent more than 5.0% of the value of our assets or more than 10% of the outstanding voting securities of the issuer; and (ii) no more than 25.0% of the value of our assets is invested in the securities, other than U.S. government securities or securities of other regulated investment companies, of one issuer or of two or more issuers that are controlled, as determined under applicable tax rules, by us and that are engaged in the same or similar or related trades or businesses or in certain publicly traded partnerships. Failure to meet these tests may result in our having to (i) dispose of certain investments quickly or (ii) raise additional capital to prevent the loss of our RIC qualification. Because most of our investments will be in private companies, any such dispositions could be made at disadvantageous prices and may result in substantial losses. If we raise additional capital to satisfy the asset diversification requirements, it could take us time to invest such capital. During this period, we will invest the additional capital in temporary investments, such as cash and cash equivalents, which we expect will earn yields substantially lower than the interest income that we anticipate receiving in respect of investments in leveraged loans and mezzanine debt. If we fail to qualify as a RIC for any reason, all of our taxable income will be subject to U.S. federal income tax at regular corporate rates. The resulting corporate taxes could substantially reduce our net assets, the amount of income available for distribution to our common stockholders or payment of our outstanding indebtedness including the 2023 Notes. Such a failure would have a material adverse effect on financial condition. Because we intend to distribute between 90% and 100% of our income to our stockholders in connection with our election to be treated as a RIC, we will continue to need additional capital to finance our growth. If additional funds are unavailable or not available on favorable terms, our ability to grow will be impaired. In order to qualify for the tax benefits available to RICs and to minimize corporate-level taxes, we intend to distribute to our stockholders between 90% and 100% of our annual taxable income, except that we may retain certain net capital gains for investment, and treat such amounts as deemed distributions to our stockholders. If we elect to treat any amounts as deemed distributions, we must pay income taxes at the corporate rate on such deemed distributions on behalf of our stockholders. As a result of these requirements, we will likely need to raise capital from other sources to grow our business. As a BDC, we generally are required to meet a coverage ratio of total assets, less liabilities and indebtedness not represented by senior securities, to total senior securities, which includes all of our borrowings and any outstanding preferred stock, of at least 200%. These requirements limit the amount that we may borrow. Because we will continue to need capital to grow our investment portfolio, these limitations may prevent us from incurring debt and require us to raise additional equity at a time when it may be disadvantageous to do so. While we expect to be able to borrow and to issue additional debt and equity securities, we cannot assure you that debt and equity financing will be available to us on favorable terms, or at all. Also, as a BDC, we generally are not permitted to issue equity securities priced below net asset value without stockholder approval. If additional funds are not available to us, we could be forced to curtail or cease new investment activities, and our net asset value and share price could decline. We may have difficulty paying our required distributions if we recognize income before or without receiving cash in respect of such income. For federal income tax purposes, we may be required to recognize taxable income in circumstances in which we do not receive a corresponding payment in cash. For example, we may on occasion hold debt obligations that are treated under applicable tax rules as having original issue discount (such as debt instruments with PIK or, in certain cases, increasing interest rates or issued with warrants) and we must include in income each year a portion of the original issue discount that accrues over the life of the obligation, regardless of whether cash representing such income is received by us in the same taxable year. We may also have to include in income other amounts that we have not yet received in cash, such as deferred loan origination fees that are paid after origination of the loan or are paid innon-cash compensation such as warrants or stock. In addition, we may be required to accrue for federal income tax purposes amounts attributable to our investment in Saratoga CLO, a collateralized loan obligation fund, that may differ from the distributions paid in respect of our investment in the subordinated notes of such collateralized loan obligation fund because of the factors set forth above or because distributions on the subordinated notes are contractually required to be diverted for reinvestment or to pay down outstanding indebtedness. Because any original issue discount or other amounts accrued will be included in our investment company taxable income for the year of accrual, we may be required to make a distribution to our stockholders in order to satisfy the annual distribution requirement, even though we will not have received any corresponding cash amount. As a result, we may have difficulty meeting the annual distribution requirement necessary to obtain and maintain RIC tax treatment under the Code. We may have to sell some of our investments at times and/or at prices we would not consider advantageous, raise additional debt or equity capital or forgo new investment opportunities for this purpose. If we are not able to obtain cash from other sources, we may fail to qualify for RIC tax treatment and thus become subject to corporate-level income tax. Our ability to enter into transactions with our affiliates is restricted. We operate in a highly competitive market for investment opportunities. A number of entities compete with us to make the types of investments that we make in private middle market companies. We compete with other BDCs, public and private funds (including SBICs), commercial and investment banks, commercial financing companies, insurance companies, high-yield investors, hedge funds, and, to the extent they provide an alternative form of financing, private equity funds. Many of our competitors are substantially larger and have considerably greater financial, technical and marketing resources than us. Some competitors may have a lower cost of funds and access to funding sources that are not available to us. In addition, some of our competitors may have higher risk tolerances or different risk assessments that could allow them to consider a wider variety of investments and establish more relationships than us. Furthermore, many of our competitors are not subject to the regulatory restrictions that the 1940 Act imposes on us as a BDC. As a result of this competition, we may not be able to take advantage of attractive investment opportunities from time to time, and we cannot assure you that we will be able to identify and make investments that meet our investment objective. We do not seek to compete primarily based on the interest rates we offer and we believe that some of our competitors may make loans with interest rates that are comparable to or lower than the rates we offer. We may lose investment opportunities if we do not match our competitors’ pricing, terms and structure. If we match our competitors’ pricing, terms and structure, we may experience decreased net interest income and increased risk of credit loss. As a result of operating in such a competitive environment, we may make investments that are on better terms to our portfolio companies than we originally anticipated, which may impact our return on these investments. Economic recessions or downturns could impair the ability of our portfolio companies to repay loans and harm our operating results. Many of our portfolio companies may be susceptible to economic slowdowns or recessions and may be unable to repay our debt investments during these periods. Therefore, ournon-performing assets are likely to increase and the value of our portfolio is likely to decrease during these periods. Adverse economic conditions also may decrease the value of collateral securing some of our debt investments and the value of our equity investments. Economic slowdowns or recessions could lead to financial losses in our portfolio and a decrease in revenues, net income and assets. Unfavorable economic conditions also could increase our funding costs, limit our access to the capital markets or result in a decision by lenders not to extend credit to us. These events could prevent us from We are anon-diversified investment company within the meaning of the 1940 Act, and therefore we are not limited with respect to the proportion of our assets that may be invested in securities of a single issuer. We are classified as anon-diversified investment company within the meaning of the 1940 Act, which means that we are not limited by the 1940 Act with respect to the proportion of our assets that we may invest in securities of a single issuer. Although we seek to maintain a diversified portfolio in accordance with our business strategies, to the extent that we assume large positions in the securities of a small number of issuers, our net asset value may fluctuate to a greater extent than that of a diversified investment company as a result of changes in the financial condition or the market’s assessment of the issuer. We may also be more susceptible to any single economic or regulatory occurrence than a diversified investment company. Beyond our RIC asset diversification requirements, we do not have fixed guidelines for diversification, and our investments could be concentrated in relatively few portfolio companies. Our financial condition and results of Our ability to achieve our investment objective depends on our ability to acquire suitable investments and monitor and administer those investments, which depends, in turn, on Saratoga Investment Advisors’ ability to identify, invest in and monitor companies that meet our investment criteria. Accomplishing this result on a cost-effective basis is largely a function of Saratoga Investment Advisors’ structuring of the investment process and its ability to provide competent, attentive and efficient service to us. Our executive officers and the officers and employees of Saratoga Investment Advisors have substantial responsibilities in connection with their roles at Saratoga Partners as well as responsibilities under the Management Agreement. They may also be called upon to provide managerial assistance to our portfolio companies. These demands on their time, which will increase as the number of investments grow, may distract them or slow the rate of investment. In order to grow, Saratoga Investment Advisors may need to hire, train, supervise and manage new employees. However, we cannot assure you that any such employees will contribute to the work of Saratoga Investment Advisors. Any failure to manage our future growth effectively could have a material adverse effect on our business and financial condition. We may experience fluctuations in our quarterly and annual results. We could experience fluctuations in our quarterly operating results due to a number of factors, including the interest rate payable on the debt investments we make, the default rate on such investments, the level of our expenses, variations in and the timing of the recognition of realized and unrealized gains or losses, changes in our portfolio composition, the degree to which we encounter competition in our markets and general economic conditions. As a result of these factors, results for any period should not be relied upon as being indicative of performance in future periods. In addition, any of these factors could negatively impact our ability to achieve our investment objectives, which may cause the net asset value of our common stock to decline. Substantially all of our portfolio investments are recorded at fair value as approved in good faith by our board of directors; such valuations are inherently uncertain and may be materially higher or lower than the values that we ultimately realize upon the disposal of such investments. Substantially all of our portfolio is, and we expect will continue to be, comprised of investments that are not publicly traded. The value of investments that are not publicly traded may not be readily determinable. We value these investments quarterly at fair value as approved in good faith by our board of directors. Where appropriate, Saratoga Investment If we make unsecured debt investments, we may lack adequate protection in the event our portfolio companies become distressed or insolvent and will likely experience a lower recovery than more senior debtholders in the event our portfolio companies We make unsecured debt investments in portfolio companies. Unsecured debt investments are unsecured and junior to other indebtedness of the portfolio company. As a consequence, the holder of an unsecured debt investment may lack adequate protection in the event the portfolio company becomes distressed or insolvent and will likely experience a lower recovery than more senior debtholders in the event the portfolio company defaults on its indebtedness. In addition, unsecured debt investments of middle-market companies are often highly illiquid and in adverse market conditions may experience steep declines in valuation even if they are fully performing. If we invest in the securities and other obligations of distressed or bankrupt companies, such investments may be subject to significant risks, including lack of income, extraordinary expenses, uncertainty with respect to satisfaction of debt, lower-than expected investment values or income potentials and resale restrictions. We are authorized to invest in the securities and other obligations of distressed or bankrupt companies. At times, distressed debt obligations may not produce income and may require us to bear certain extraordinary expenses (including legal, accounting, valuation and transaction expenses) in order to protect and recover our investment. Therefore, to the extent we invest in distressed debt, our ability to achieve current income may be diminished which may affect our ability to make distributions on our common stock or make interest and principal payments of the 2023 Notes. We also will be subject to significant uncertainty as to when and in what manner and for what value the distressed debt we invest in will eventually be satisfied (e.g., through a liquidation of the obligor’s assets, an exchange offer or plan of reorganization involving the distressed debt securities or a payment of some amount in satisfaction of the obligation). In addition, even if an exchange offer is made or plan of reorganization is adopted with respect to distressed debt held by us, there can be no assurance that the securities or other assets received by us in connection with such exchange offer or plan of reorganization will not have a lower value or income potential than may have been anticipated when the investment was made. Moreover, any securities received by us upon completion of an exchange offer or plan of reorganization may be restricted as to resale. As a result of our participation in negotiations with respect to any exchange offer or plan of reorganization with respect to an issuer of distressed debt, we may be restricted from disposing of such securities if we are in possession of materialnon-public information relating to the issuer. Second priority liens on collateral securing loans that we make to our portfolio companies may be subject to control by senior creditors with first priority liens. If there is a default, the value of the collateral may not be sufficient to repay in full both the first priority creditors and us. Certain loans that we make to portfolio companies will be secured on a second priority basis by the same collateral securing senior secured debt of such companies. The first priority liens on the collateral will secure the portfolio company’s obligations under any outstanding senior debt and may secure certain other future debt that may be permitted to be incurred by the company under the agreements governing the loans. The holders of obligations secured by the first priority liens on the collateral will generally control the liquidation of and be entitled to receive proceeds from any realization of the collateral to repay their obligations in full before us. In addition, the value of the collateral in the event of liquidation will depend on market and economic conditions, the availability of buyers and other factors. There can be no assurance that the proceeds, if any, from the sale or sales of all of the collateral would be sufficient to satisfy the loan obligations secured by the second priority liens after payment in full of all obligations secured by the first priority liens on the collateral. If such proceeds are not sufficient to repay amounts outstanding under the loan obligations secured by the second priority liens, then we, to the extent not repaid from the proceeds of the sale of the collateral, will only have an unsecured claim against the company’s remaining assets, if any. The rights we may have with respect to the collateral securing the loans we make to our portfolio companies with senior debt outstanding may also be limited pursuant to the terms of one or more intercreditor agreements that we enter into with the holders of senior debt. Under such an intercreditor agreement, at any time that obligations that have the benefit of the first priority liens are outstanding, any of the following actions that may be taken with respect to the collateral will be at the direction of the holders of the obligations secured by the first priority liens: the ability to cause the commencement of enforcement proceedings against the collateral; the ability to control the conduct of such proceedings; the approval of amendments to collateral documents; releases of liens on the collateral; and waivers of past defaults under collateral documents. We may not have the ability to control or direct such actions, even if our rights are adversely affected. The lack of liquidity in our investments may adversely affect our business. We primarily make investments in private companies. A portion of these securities may be subject to legal and other restrictions on resale, transfer, pledge or other disposition or will otherwise be less liquid than publicly traded securities. The illiquidity of our investments may make it difficult for us to sell such investments if the need arises. In addition, if we are required to liquidate all or a portion of our portfolio quickly, we may realize significantly less than the value at which we have previously recorded our investments. In addition, we may face other restrictions on our ability to liquidate an investment in a business entity to the extent that we or our investment adviser has or could be deemed to have materialnon-public information regarding such business entity. The debt securities in which we invest are subject to credit risk and prepayment risk. An issuer of a debt security may be unable to make interest payments and repay principal. We could lose money if the issuer of a debt obligation is, or is perceived to be, unable or unwilling to make timely principal and/or interest payments, or to otherwise honor its obligations. The downgrade of a security by rating agencies may further decrease its value. Certain debt instruments may contain call or redemption provisions which would allow the issuer thereof to prepay principal prior to the debt instrument’s stated maturity. This is known as prepayment risk. Prepayment risk is greater during a falling interest rate environment as issuers can reduce their cost of capital by refinancing higher interest debt instruments with lower interest debt instruments. An issuer may also elect to refinance their debt instruments with lower interest debt instruments if the credit standing of the issuer improves. To the extent debt securities in our portfolio are called or redeemed, we may receive less than we paid for such security and we may be forced to reinvest in lower yielding securities or debt securities of issuers of lower credit quality. Our investment in Saratoga CLO constitutes a leveraged investment in a portfolio of predominantly senior secured first lien term loans and is subject to additional risks and volatility. At February 28, As the manager of the portfolio of Saratoga CLO, we will have some ability to direct the composition of the portfolio, but our discretion is limited by the terms of the debt issued by Saratoga CLO which may limit our ability to make investments that we feel are in the best interests of the subordinated notes, and the availability of suitable investments. The performance of Saratoga CLO’s portfolio is also subject to many of the same risks sets forth in this Annual Report with respect to portfolio investments in leveraged loans. In the event that a bankruptcy court orders the substantive consolidation of us with Saratoga CLO, the creditors of Saratoga CLO, including the holders of $297.1 million aggregate principal amount of debt, as of February 28, 2017 issued by Saratoga CLO, would have claims against the consolidated bankruptcy estate, which would include our assets. We believe that we have observed and will observe certain formalities and operating procedures that are generally recognized requirements for maintaining our separate existence and that our assets and liabilities can be readily identified as distinct from those of Saratoga CLO. However, we cannot assure you that a bankruptcy court would agree in the event that we or Saratoga CLO became a debtor in connection with a bankruptcy proceeding. If a bankruptcy court concludes that substantive consolidation of us with Saratoga CLO is warranted, the creditors of Saratoga CLO, including the holders of $297.1 million aggregate principal amount of debt, as of February 28, 2017 issued by Saratoga CLO, would have claims against the consolidated bankruptcy estate. Substantive consolidation means that our assets are placed in a single bankruptcy estate with those of Saratoga CLO, rather than kept separate, and that the creditors of Saratoga CLO have a claim against that single estate (including our assets), as opposed to retaining their claims against only Saratoga CLO. Our investments in Saratoga CLO are typically broadly syndicated loans that have a different risk profile than would direct investments made by us, including less information available and fewer rights regarding repayment compared to companies we invest in directly as well as complicated accounting and tax implications. Due to our investments in the Saratoga CLO being primarily broadly syndicated loans, there may be less information available to us on those companies as compared to most investments that we make directly. For example, we will typically have fewer rights relating to how such companies manage their cash flow to repay debt, the inclusion of protective covenants, default penalties, lien protection, change of control provisions and board observation rights in deal terms, and our general ability to oversee the company’s operations. Our investment in Saratoga CLO is also subject to the risk of leverage associated with the debt issued by Saratoga CLO and the repayment priority of senior debt holders in Saratoga CLO. The accounting and tax implications of such investments are complicated. In particular, reported earnings from the equity tranche investment of Saratoga CLO are recorded under U.S. generally accepted accounting principles (“U.S. GAAP”) based upon an effective yield calculation. Current taxable earnings on these investments, however, will generally not be determinable until after the end of the fiscal year of Saratoga CLO that ends within the Company’s fiscal year, even though the investment is generating cash flow. In general, the tax treatment of investment in Saratoga CLO may result in higher distributable earnings in the early years and a capital loss at maturity, while for reporting purposes the totality of cash flows are reflected in a constant yield to maturity. The senior loan portfolio of Saratoga CLO is concentrated in a limited number of industries or borrowers, which may subject Saratoga CLO, and in turn us, to a risk of significant loss if there is a downturn in a particular industry in which Saratoga CLO is concentrated. Saratoga CLO has senior loan portfolios that are concentrated in a limited number of industries or borrowers. A downturn in any particular industry or borrower in which Saratoga CLO is heavily invested may subject Saratoga CLO, and in turn us, to a risk of significant loss and could significantly impact the aggregate returns we realize. If an industry in which Saratoga CLO is heavily invested suffers from adverse business or economic conditions, a material portion of our investment in Saratoga CLO could be affected adversely, which, in turn, could adversely affect our financial position and results of operations. For example, as of February 28, 2017, Saratoga CLO’s investments in the business services industry represented approximately 13.9% of the fair value of Saratoga CLO’s portfolio. Companies in the business services industry are subject to general economic downturns and business cycles, and will often suffer reduced revenues and rate pressures during periods of economic uncertainty. In addition, investments in the healthcare & pharmaceuticals industry represented approximately 11.3% of the fair value of Saratoga CLO’s portfolio. Changes in healthcare or other laws and regulations applicable to the businesses of some of the companies in which Saratoga CLO invests may occur that could increase their compliance and other costs of doing business, require significant systems enhancements, or render their products or services less profitable or obsolete, any of which could have a material adverse effect on their results of operations. There has also been an increased political and regulatory focus on healthcare laws in recent years, and new legislation could have a material effect on the business and operations of companies in which Saratoga CLO invests. The application of the risk retention rules to CLOs may have broader effects on the CLO and loan markets in general, potentially resulting in fewer or less desirable investment opportunities for Saratoga CLO. Section 941 of the Dodd-Frank Act added a provision to the Securities Exchange Act of 1934, as amended, requiring the seller, sponsor or securitizer of a securitization vehicle to retain no less than five percent of the credit risk in assets it sells into a securitization and prohibits such securitizer from directly or indirectly hedging or otherwise transferring the retained credit risk. The responsible federal agencies adopted final rules implementing these restrictions on October 22, 2014. These rules will become effective with respect to CLOs two years after publication in the Federal Register. Under the final rules, the asset manager of a CLO would be considered the sponsor of a securitization vehicle and would be required to retain five percent of the credit risk in the CLO, which may be retained horizontally in the equity tranche of the CLO or vertically as a five percent interest in each tranche of the securities issued by the CLO. Although the final rules contain an exemption from such requirements for the asset manager of a CLO if, among other things, the originator or lead arranger of all of the loans acquired by the CLO retain such risk at the asset level and, at origination of such asset, takes a loan tranche of at least 20% of the aggregate principal balance, it is possible that the originators and lead arrangers of loans in this market will not agree to assume this risk or provide such retention at origination of the asset in a manner that would provide meaningful relief from the risk retention requirements for CLO managers. We believe that the U.S. risk retention requirements imposed for CLO managers under Section 941 of the Dodd-Frank Act has created some uncertainty in the market in regard to future CLO issuance. Given that certain CLO managers may require capital provider partners to satisfy this requirement beginning on December 24, 2016, we believe that this may create additional opportunities (and additional risks) for us in the future. Failure by Saratoga CLO to satisfy certain financial covenants may entitle senior debtholders to additional payments, which may harm our operating results by reducing payments we would otherwise be entitled to receive from Saratoga CLO. The failure by Saratoga CLO to satisfy certain financial covenants, specifically those with respect to adequate collateralization and/or interest coverage tests, could lead to a reduction in its payments to us. In the event that Saratoga CLO failed these certain tests, senior debt holders may be entitled to additional payments that would, in turn, reduce the payments we would otherwise be entitled to receive. Separately, we may incur expenses to the extent necessary to seek recovery upon default or to negotiate new terms, which may include the waiver of certain financial covenants, with Saratoga CLO or any other investment we may make. If any of these occur, it could materially and adversely affect our operating results and cash flows. Available information about privately held companies is limited. We invest primarily in privately-held companies. Generally, little public information exists about these companies, and we are required to rely on the ability of our investment adviser’s investment professionals to obtain adequate information to evaluate the potential returns from investing in these companies. These companies and their financial information are not subject to the When we are a debt or minority equity investor in a portfolio company, we may not be in a position to control the entity, and its management may make decisions that could decrease the value of our investment. We make both debt and minority equity investments; therefore, we are subject to the risk that a portfolio company may make business decisions with which we disagree, and the stockholders and management of such company may take risks or otherwise act in ways that do not serve our interests. As a result, a portfolio company may make decisions that could decrease the value of our portfolio holdings. Our portfolio companies may incur debt or issue equity securities that rank equally with, or senior to, our investments in such companies. Our portfolio companies usually will have, or may be permitted to incur, other debt, or issue other equity securities that rank equally with, or senior to, our investments. By their terms, such instruments may provide that the holders are entitled to receive payment of dividends, interest or principal on or before the dates on which we are entitled to receive payments in respect of our investments. These debt instruments will usually prohibit the portfolio companies from paying interest on or repaying our investments in the event and during the continuance of a default under such debt. Also, in the event of insolvency, liquidation, dissolution, reorganization or bankruptcy of a portfolio company, holders of securities ranking senior to our investment in that portfolio company would typically be entitled to receive payment in full before we receive any distribution in respect of our investment. After repaying such holders, the portfolio company may not have any remaining assets to use for repaying its obligation to us. In the case of debtor ranking equally with our investments, we would have to share on an equal basis any distributions with other holders in the event of an insolvency, liquidation, dissolution, reorganization or bankruptcy of the relevant portfolio company. There may be circumstances where our debt investments could be subordinated to claims of other creditors or we could be subject to lender liability claims. If one of our portfolio companies were to go bankrupt, even though we may have structured our interest as senior debt, depending on the facts and circumstances, including the extent to which we actually provided managerial assistance to that portfolio company, a bankruptcy court mightre-characterize our debt holding and subordinate all or a portion of our claim to that of other creditors. In addition, lenders can be subject to lender liability claims for actions taken by them where they become too involved in the borrower’s business or exercise control over the borrower. It is possible that we could become subject to a lender’s liability claim, including as a result of actions taken if we actually render significant managerial assistance. Investments in equity securities involve a substantial degree of risk. We purchase common stock and other equity securities. Although equity securities have historically generated higher average total returns than fixed-income securities over the long-term, equity securities also have experienced significantly more volatility in those returns and in recent years have significantly underperformed relative to fixed-income securities. The equity securities we acquire may fail to appreciate and may decline in value or become worthless and our ability to recover our investment will depend on our portfolio company’s success. Investments in equity securities involve a number of significant risks, including: There are special risks associated with investing in preferred securities, including: Our investments in foreign debt, including that of emerging market issuers, may involve significant risks in addition to the risks inherent in U.S. investments. Although there are limitations on our ability to invest in foreign debt, we may, from time to time, invest in debt of foreign companies, including the debt of emerging market issuers. Investing in foreign companies may expose us to additional risks not typically associated with investing in U.S. companies. These risks include changes in exchange control regulations, political and social instability, expropriation, imposition of foreign taxes, less liquid markets and less available information than is generally the case in the United States, higher transaction costs, less government supervision of exchanges, brokers and issuers, less developed bankruptcy laws, difficulty in enforcing contractual obligations, lack of uniform accounting and auditing standards and greater price volatility. Investments in the debt of emerging market issuers may subject us to additional risks such as inflation, wage and price controls, and the imposition of trade barriers. Furthermore, economic conditions in emerging market countries are, to some extent, influenced by economic and securities market conditions in other emerging market countries. Although economic conditions are different in each country, investors’ reaction to developments in one country can have effects on the debt of issuers in other countries. Although most of our investments will be U.S. dollar-denominated, our investments that are denominated in a foreign currency will be subject to the risk that the value of a particular currency will change in relation to one or more other currencies. Among the factors that may affect currency values are trade balances, the level of short-term interest rates, differences in relative values of similar assets in different currencies, long-term opportunities for investment and capital appreciation, and political developments. We may employ hedging techniques to minimize these risks, but we cannot assure you that we will fully hedge against these risks or that such strategies will be effective. As a result, a change in currency exchange rates may adversely affect our profitability. We may expose ourselves to risks if we engage in hedging transactions. We may utilize instruments such as forward contracts, currency options and interest rate swaps, caps, collars and floors to seek to hedge against fluctuations in the relative values of our portfolio positions from changes in currency exchange rates and market interest rates. Use of these hedging instruments may expose us to counter-party credit risk. Hedging against a decline in the values of our portfolio positions does not eliminate the possibility of fluctuations in the values of such positions or prevent losses if the values of such positions decline. However, such hedging can establish other positions designed to gain from those same developments, thereby offsetting the decline in the value of such portfolio positions. Such hedging transactions may also limit the opportunity for gain if the values of the portfolio positions should increase. Moreover, it may not be possible to hedge against an exchange rate or interest rate fluctuation that is generally anticipated at an acceptable price. The success of our hedging transactions will depend on our ability to correctly predict movements in currencies and interest rates. Therefore, while we may enter into such transactions to seek to reduce currency exchange rate and interest rate risks, unanticipated changes in currency exchange rates or interest rates may result in poorer overall investment performance than if we had not engaged in any such hedging transactions. In addition, the degree of correlation between price movements of the instruments used in a hedging strategy and price movements in the portfolio positions being hedged may vary. Moreover, for a variety of reasons, we may not seek to establish a perfect correlation between such hedging instruments and the portfolio holdings being hedged. Any such imperfect correlation may prevent us from achieving the intended hedge and expose us to risk of loss. In addition, it may not be currencies because the value of those securities is likely to fluctuate as a result of factors not entirely related to currency fluctuations. To the extent we engage in hedging transactions, we also face the risk that counterparties to the derivative instruments we hold may default, which may expose us to unexpected losses from positions where we believed that our risk had been appropriately hedged. Our board of directors may change our investment objective, operating policies and strategies without prior notice or stockholder approval, the effects of which may be adverse. Our board of directors has the authority to modify or waive our current investment objective, operating policies and strategies without prior notice and without stockholder approval. We cannot predict the effect any changes to our current operating policies and strategies would have on our business, financial condition, and value of our common stock. However, the effects might be adverse, which could negatively impact our ability to pay dividends and cause you to lose all or part of your investment. We have limited experience in managing an SBIC and any failure to comply with SBA regulations, resulting from our lack of experience or otherwise, could have an adverse effect on our operations. On March 28, 2012, our wholly-owned subsidiary, Saratoga Investment Corp. SBIC, LP, received a license from the SBA to operate as an SBIC under Section 301(c) of the Small Business Investment Act of 1958 and is regulated by the SBA. The SBA places certain limitations on the financing terms of investments by SBICs in portfolio companies and prohibits SBICs from providing funds for certain purposes or to businesses in a few prohibited industries. Compliance with SBIC requirements may cause our SBIC subsidiary to forego attractive investment opportunities that are not permitted under SBA regulations. Further, SBA regulations require that an SBIC be periodically examined and audited by the SBA to determine its compliance with the relevant SBA regulations. The SBA prohibits, without prior SBA approval, a “change of control” of an SBIC or transfers that would result in any person (or a group of persons acting in concert) owning 10% or more of a class of capital stock of an SBIC. If our SBIC subsidiary fails to comply with applicable SBA regulations, the SBA could, depending on the severity of the violation, limit or prohibit its use of debentures, declare outstanding debentures immediately due and payable, and/or limit it from making new investments. In addition, the SBA can revoke or suspend a license for willful or repeated violation of, or willful or repeated failure to observe, any provision of the Small Business Investment Act of 1958 or any rule or regulation promulgated thereunder. These actions by the SBA would, in turn, negatively affect us because our SBIC subsidiary is our wholly-owned subsidiary. We do not have any prior experience managing an SBIC. Our lack of experience in complying with SBA regulations may hinder our ability to take advantage of our SBIC subsidiary’s access toSBA-guaranteed debentures. Any failure to comply with SBA regulations could have an adverse effect on our operations. Our investments may be risky, and you could lose all or part of your investment. Substantially all of our debt investments hold anon-investment grade rating by one or more rating agencies (whichnon-investment grade debt is commonly referred to as “high yield” and “junk” debt) or, where not rated by any rating agency, would be below investment grade or “junk”, if rated. A below investment grade or “junk” rating means that, in the rating agency’s view, there is an increased risk that the obligor on such debt will be unable to pay interest and repay principal on its debt in full. We also invest in debt that defers or pays PIK interest. To the extent interest payments associated with such debt are deferred, such debt will be subject to greater fluctuations in value based on changes in interest rates, such debt could produce taxable income without a corresponding cash payment to us, and since we generally do not receive any cash prior to maturity of the debt, the investment will be of greater risk. In addition, private middle market companies in which we invest are exposed to a number of significant risks, including: In addition, our executive officers, directors and our investment adviser may, in the ordinary course of business, be named as defendants in litigation arising from our investments in the portfolio companies. Our independent auditors have not assessed our internal control over financial reporting. If our internal control over financial reporting is not effective, it could have a material adverse effect on our stock price and our ability to raise capital. Because we are a Our portfolio may continue to be concentrated in a limited number of industries, which may subject us to a risk of significant loss if there is a downturn in a particular industry in which a number of our investments are concentrated. Our portfolio may continue to be concentrated in a limited number of industries. A downturn in any particular industry in which we are invested could significantly impact the aggregate returns we realize. As of February 28, 2017, our investments in the business services industry represented approximately 55.1% of the fair value of our portfolio and our investments in the healthcare industry represented approximately 13.2% of the fair value of our portfolio. In addition, we may from time to time invest a relatively significant percentage of our portfolio in industries we do not necessarily target. If an industry in which we have significant investments suffers from adverse business or economic conditions, as these industries have to varying degrees, a material portion of our investment portfolio could be affected adversely, which, in turn, could adversely affect our financial position and results of operations. Risks Related to Our Common Stock Investing in our common stock may involve an above average degree of risk. The investments we make in accordance with our investment objective may result in a higher amount of risk than alternative investment options and volatility or loss of principal. Our investments in portfolio companies may be highly speculative and aggressive, and therefore, an investment in our common stock may not be suitable for someone with lower risk tolerance. We may continue to choose to pay dividends in our own stock, in which case you may be required to pay tax in excess of the cash you receive. We have in the past, and may continue to, distribute taxable dividends that are payable to our stockholders in part through the issuance of shares of our common stock. For example, on October 30, 2013, our board of directors declared a dividend of $2.65 per share to shareholders payable in cash or shares of our common stock. Under certain applicable provisions of the Code and the Treasury regulations, distributions payable in cash or in shares of stock at the election of stockholders are treated as taxable dividends. The Furthermore, with respect tonon-U.S. stockholders, we may be required to withhold U.S. tax with respect to such dividends, including in respect of all or a portion of such dividend that is payable in stock. In addition, if a significant number of our stockholders determine to sell shares of our stock in order to pay taxes owed on dividends, it may put downward pressure on the trading price of our stock. On September 24, 2014, we announced the recommencement of quarterly dividends to our stockholders. We have adopted a DRIP that provides for reinvestment of our dividend distributions on behalf of our stockholders unless a stockholder elects to receive cash. As a result, if our board of directors authorizes, and we declare, a cash dividend, then our stockholders who have not “opted out” of the DRIP by the dividend record date will have their cash dividends automatically reinvested into additional shares of our common stock, rather than receiving the cash dividends. We have the option to satisfy the share requirements of the DRIP through the issuance of new shares of common stock or through open market purchases of common stock by the DRIP plan administrator. The market price of our common stock may fluctuate significantly. The market price and liquidity of the market for our common stock may be significantly affected by numerous factors, some of which are beyond our control and may not be directly related to our operating performance. These factors include: Our business and operation could be negatively affected if we become subject to any securities litigation or shareholder activism, which could cause us to incur significant expense, hinder execution of investment strategy and impact our stock price. In the past, following periods of volatility in the market price of a company’s securities, securities class action litigation has often been brought against that company. Shareholder activism, which could take many forms or arise in a variety of situations, has been increasing in the BDC space recently. While we are currently not subject to any securities litigation or shareholder activism, due to the potential volatility of our stock price and for a variety of other reasons, we may in the future become the target of securities litigation or shareholder activism. Securities litigation and shareholder activism, including potential proxy contests, could result in substantial costs and divert management’s and our board of directors’ attention and resources from our business. Additionally, such securities litigation and shareholder activism could give rise to perceived uncertainties as to our future, adversely affect our relationships with service providers and make it more difficult to attract and retain qualified personnel. Also, we may be required to incur significant legal fees and other expenses related to any securities litigation and activist shareholder matters. Further, our stock price could be subject to significant fluctuation or otherwise be adversely affected by the events, risks and uncertainties of any securities litigation and shareholder activism. There is a risk that you may not receive distributions or that our distributions may not grow over time. As a BDC for 1940 Act purposes and a RIC for U.S. federal income tax purposes, we intend to make distributions out of assets legally available for distribution to our stockholders once such distributions are authorized by our board of directors and declared by us. We cannot assure you that we will achieve investment results that will allow us to make a specified level of cash distributions or Provisions of our governing documents and the Maryland General Corporation Law could deter future takeover attempts and have an adverse impact on the price of our common stock. We are governed by our charter and bylaws, which we refer to as our “governing documents.” Our governing documents and the Maryland General Corporation Law contain provisions that may have the effect of delaying, deferring or preventing a future transaction or change in control of us that might involve a premium price for our stockholders or otherwise be in their best interest. Our charter provides for the classification of our board of directors into three classes of directors, serving staggered three-year terms, which may render a change of control of us or removal of our incumbent management more difficult. Furthermore, any and all vacancies on our board of directors will be filled generally only by the affirmative vote of a majority of the remaining directors in office, even if the remaining directors do not constitute a quorum, and any director elected to fill a vacancy will serve for the remainder of the full term until a successor is elected and qualifies. Our board of directors is authorized to create and issue new series of shares, to classify or reclassify any unissued shares of stock into one or more classes or series, including preferred stock and, without stockholder approval, to amend our charter to increase or decrease the number of shares of stock that we have authority to issue, which could have the effect of diluting a stockholder’s ownership interest. Prior to the issuance of shares of stock of each class or series, including any reclassified series, our board of directors is required by our governing documents to set the terms, preferences, conversion or other rights, voting powers, restrictions, limitations as to dividends or other distributions, qualifications and terms or conditions of redemption for each class or series of shares of stock. Our governing documents also provide that our board of directors has the exclusive power to adopt, alter or repeal any provision of our bylaws, and to make new bylaws. The Maryland General Corporation Law also contains certain provisions that may limit the ability of a third party to acquire control of us, such as: In addition, the provisions of the Maryland Business Combination Act will not apply, however, if our board of directors adopts a resolution that any business combination between us and any other person will be exempt from the provisions of the Maryland Business Combination Act. Although our board of directors has adopted such a resolution, there can be no assurance that this resolution will not be altered or repealed in whole or in part at any time. If the resolution is altered or repealed, the provisions of the Maryland Business Combination Act may discourage others from trying to acquire control of us. As permitted by Maryland law, our bylaws contain a provision exempting from the Maryland Control Share Acquisition Act any and all acquisitions by any person of our common stock. Although our bylaws include such a provision, such a provision may also be amended or eliminated by our board of directors at any time in the future, subject to obtaining confirmation from the SEC that it does not object to us being subject to the Maryland Control Share Acquisition Act. Our common stock may trade at a discount to our net asset value per share. Common stock of BDCs, asclosed-end investment companies, frequently trade at a discount to net asset value. Our common stock has traded at a discount to our net asset value since shortly after our initial public offering. The risk that our common stock may continue to trade at a discount to our net asset value is separate and distinct from the risk that our net asset value per share may decline. Stockholders may incur dilution if we sell shares of our common stock in one or more offerings at prices below the then current net asset value per share of our common stock. The 1940 Act prohibits us from selling shares of our common stock at a price below the current net asset value per share of such stock, with certain exceptions. One such exception is prior stockholder approval of issuances below net asset value provided that our board of directors makes certain determinations. value. If we were to sell shares of our common stock below net asset value per share, such sales would result in an immediate dilution to the net asset value per share. This dilution would occur as a result of the sale of shares at a price below the then current net asset value per share of our common stock and a proportionately greater decrease in a stockholder’s interest in our earnings and assets and voting interest in us than the increase in our assets resulting from such issuance. Because the number of shares of common stock that could be so issued and the timing of any issuance is not currently known, the actual dilutive effect cannot be predicted. The issuance of subscription rights, warrants or convertible debt that are exchangeable for our common stock, will cause your economic interest and voting power in us to be diluted as a result of our offering of any such securities. Stockholders who do not fully exercise rights, warrants or convertible debt issued to them in any offering of subscription rights, warrants or convertible debt to purchase our common stock should expect that they will, at the completion of the offering, own a smaller proportional economic interest and have diminished voting power in us than would otherwise be the case if they fully exercised their rights, warrants or convertible debt. We cannot state precisely the amount of any such dilution in share ownership or voting power because we do not know what proportion of the common stock would be purchased as a result of any such offering. In addition, if the subscription price, warrant price or convertible debt price is less than our net asset value per share of common stock at the time of such offering, then our stockholders would experience an immediate dilution of the aggregate net asset value of their shares as a result of the offering. The amount of any such decrease in net asset value is not predictable because it is not known at this time what the subscription price, warrant price, convertible debt price or net asset value per share will be on the expiration date of such offering or what proportion of our common stock will be purchased as a result of any such offering. The risk of dilution is greater if there are multiple rights offerings. However, our board of directors will make a good faith determination that any offering of subscription rights, warrants or convertible debt would result in a net benefit to existing stockholders. Finally, our common stockholders will bear will all costs and expenses incurred by us in connection with any proposed offering of subscription rights, warrants or convertible debt that are exchangeable for our common stock, whether or not such offering is actually completed by us. Risks Related to Our 2023 Notes The 2023 Notes are unsecured and therefore are effectively subordinated to any secured indebtedness we have The 2023 Notes are not secured by any of our assets or any of the assets of our subsidiaries, including our wholly owned subsidiaries. As a result, the 2023 Notes are effectively subordinated to all of our existing and future secured indebtedness (including indebtedness that is initially unsecured to which we subsequently grant security), to the extent of the value of the assets securing such indebtedness. Because the 2023 Notes are not secured by any of our assets, they will be effectively subordinated to any secured indebtedness we The 2023 Notes are structurally subordinated to the indebtedness and other liabilities of our subsidiaries. The 2023 Notes are obligations exclusively of Saratoga Investment Corp., and not of any of our subsidiaries. None of our subsidiaries is a guarantor of the 2023 Notes and the 2023 Notes are not required to be guaranteed by any subsidiary we may acquire or create in the therefore the claims of our creditors, including holders of the 2023 Notes) with respect to the assets of such entities. Even if we are recognized as a creditor of one or more of these entities, our claims would still be effectively subordinated to any security interests in the assets of any such entity and to any indebtedness or other liabilities of any such entity senior to our claims. Consequently, the 2023 Notes are structurally subordinated to all indebtedness and other liabilities of any of our subsidiaries and portfolio companies with respect to which we hold equity investments. In addition, our subsidiaries and these entities may incur substantial indebtedness in the future, all of which would be structurally senior to the 2023 Notes. As of February 28, 2017, there was no outstanding balance under the Credit Facility, and we had the ability to borrow up to $45.0 million under the Credit Facility, subject to certain conditions. As of February 28, 2017, we had $112.7 million inSBA-guaranteed debentures outstanding. The indebtedness under the Credit Facility and toSBA-guaranteed debentures is structurally senior to the 2023 Notes. The indenture under which the 2023 Notes are issued contains limited protection for holders of the 2023 Notes. The indenture under which the 2023 Notes are issued offers limited protection to holders of the 2023 Notes. The terms of the indenture and the 2023 Notes do not restrict our or any of our subsidiaries’ ability to engage in, or otherwise be a party to, a variety of corporate transactions, circumstances or events that could have a material adverse impact on your investment in the 2023 Notes. In particular, the terms of the indenture and the 2023 Notes do not place any restrictions on our or our subsidiaries’ ability to: In addition, the indenture does not require us to offer to purchase the 2023 Notes in connection with a change of control or any other event. Furthermore, the terms of the indenture and the 2023 Notes do not protect holders of the 2023 Notes in the event that we experience changes (including significant adverse changes) in our financial condition, results of operations or credit ratings, if any, as they do not require that we adhere to any financial tests or ratios or specified levels of net worth, revenues, income, cash flow, or liquidity. Our ability to recapitalize, incur additional debt and take a number of other actions that are not limited by the terms of the 2023 Notes may have important consequences for you as a holder of the 2023 Notes, including making it more difficult for us to satisfy our obligations with respect to the 2023 Notes or negatively affecting the trading value of the 2023 Notes. Other debt we issue or incur in the future could contain more protections for its holders than the indenture and the 2023 Notes, including additional covenants and events of default. For example, the indenture under which the 2023 Notes are issued does not contain cross-default provisions that are contained in the Credit Facility. The issuance or incurrence of any such debt with incremental protections could affect the market for and trading levels and prices of the 2023 Notes. An active trading market for the 2023 Notes may not develop or be sustained, which could limit Accordingly, we cannot We may choose to redeem the 2023 Notes when prevailing interest rates are relatively low. On or after May 31, 2016, we may choose to redeem the 2023 Notes from time to time, especially when prevailing If we default on our obligations to pay our other indebtedness, we may not be able to make payments on the 2023 Notes. Any default under the agreements governing our indebtedness, including a default under the Credit Facility or other indebtedness to which we may be a party that is not waived by the required lenders, and the remedies sought by the holders of such indebtedness could make us unable to pay principal, premium, if any, and interest on the 2023 Notes and substantially decrease the market value of the 2023 Notes. If we are unable to generate sufficient cash flow and are otherwise unable to obtain funds necessary to meet required payments of principal, premium, if any, and interest on our indebtedness, or if we otherwise fail to comply with the various covenants, including financial and operating covenants, in the instruments governing our indebtedness, we could be in default under the terms of the agreements governing such indebtedness, including the 2023 Notes. In the event of such default, the holders of such indebtedness could elect to declare all the funds borrowed thereunder to be due and payable, together with accrued and unpaid interest, the lender under the Credit Facility or other debt we may incur in the future could elect to terminate its commitment, cease making further loans and institute foreclosure proceedings against our assets, and we could be forced into bankruptcy or liquidation. In addition, any such default may constitute a default under the 2023 Notes, which could further limit our ability to repay our debt, including the 2023 Notes. If our operating performance declines, we may in the future need to seek to obtain waivers from the lender under the Credit Facility or other debt that we may incur in the future to avoid being in default. If we breach our covenants under the Credit Facility or other debt and seek a waiver, we may not be able to obtain a waiver from the required lenders. If this occurs, we would be in default under the Credit Facility or other debt, the lender could exercise its rights as described above, and we could be forced into bankruptcy or liquidation. If we are unable to repay debt, lenders having secured obligations could proceed against the collateral securing the debt. Because the Credit Facility has, and any future credit facilities will likely have, customary cross-default provisions, if the indebtedness under the 2023 Notes, the Credit Facility or under any future credit facility is accelerated, we may be unable to repay or finance the amounts due. None. We do not own any real estate or other physical properties important to our operations, however, an affiliate of our investment adviser leases office space for our executive offices at 535 Madison Avenue, New York, New York 10022. None. Price range of common stock Our common stock is traded on the New York Stock Exchange under the symbol “SAR.” Prior to July 30, 2010, our common stock traded on the New York Stock Exchange under the symbol “GNV.” The following table sets forth, for the two most recent fiscal years and the current fiscal year, the net asset value (“NAV”) at each period end and the range of high and low sales prices of our common stock as reported on the New York Stock Price Range Fiscal Year ended February 28, 2013 NAV(1) High Low Fiscal Year ended February 29, 2016 First Quarter $ 25.94 $ 18.25 $ 15.15 Second Quarter $ 27.20 $ 17.20 $ 16.50 Third Quarter $ 21.75 $ 19.97 $ 15.17 Fourth Quarter $ 22.98 $ 18.50 $ 15.07 Fiscal Year ended February 28, 2017 First Quarter Second Quarter Third Quarter Fourth Quarter Fiscal Year ending February 28, 2018 First Quarter through May 15, 2017 Fiscal Year ended February 28, 2014 NAV(1) High Low First Quarter $ 23.78 $ 19.08 $ 16.35 Second Quarter $ 23.77 $ 18.70 $ 17.40 Third Quarter $ 20.67 $ 19.55 $ 15.40 Fourth Quarter $ 21.36 $ 16.56 $ 15.25 Fiscal Year ended February 28, 2015 NAV(1) High Low First Quarter through May 23, 2014 * $ 15.91 $ 15.05 Period March 1, 2015 through November 30, 2015 December 1, 2015 through December 31, 2015 January 1, 2016 through January 31, 2016 February 1, 2016 through February 29, 2016 Period March 1, 2016 through March 31, 2016 April 1, 2016 through April 30, 2016 May 1, 2016 through May 31, 2016 June 1, 2016 through June 30, 2016 July 1, 2016 through July 31, 2016 August 1, 2016 through August 31, 2016 September 1, 2016 through September 30, 2016 October 1, 2016 through October 31, 2016 November 1, 2016 through November 30, 2016 December 1, 2016 through December 31, 2016 January 1, 2017 through January 31, 2017 February 1, 2017 through February 28, 2017 Total Holders The last reported price for our common stock on May Dividend Policy The following table summarizes our dividends or distributions declared during fiscal 2009, 2010, 2011, 2012, 2013, 2014, 2015, 2016 and Date Declared Record Date Payment Date Amount May 22, 2008 May 30, 2008 June 13, 2008 $ 3.90 August 19, 2008 August 29, 2008 September 15, 2008 $ 3.90 December 8, 2008 December 18, 2008 December 29, 2008 $ 2.50 Total Dividends Declared for Fiscal 2009 $ 10.30 November 13, 2009 November 25, 2009 December 31, 2009 $ 18.25 (1) Total Dividends Declared for Fiscal 2010 $ 18.25 November 12, 2010 November 19, 2010 December 29, 2010 $ 4.40 (1) Total Dividends Declared for Fiscal 2011 $ 4.40 November 15, 2011 November 25, 2011 December 30, 2011 $ 3.00 (1) Total Dividends Declared for Fiscal 2012 $ 3.00 November 9, 2012 November 20, 2012 December 31, 2012 $ 4.25 (1) Total Dividends Declared for Fiscal 2013 $ 4.25 October 30, 2013 November 13, 2013 December 27, 2013 $ 2.65 (1) Total Dividends Declared for Fiscal 2014 $ 2.65 Total Dividends Declared for Fiscal 2013 October 30, 2013 Total Dividends Declared for Fiscal 2014 September 24, 2014 September 24, 2014 Total Dividends Declared for Fiscal 2015 April 9, 2015 May 14, 2015 July 8, 2015 October 7, 2015 January 12, 2016 Total Dividends Declared for Fiscal 2016 March 31, 2016 July 7, 2016 August 8, 2016 October 5, 2016 January 12, 2017 Total Dividends Declared for Fiscal 2017 February 28, 2017 Total Dividends Declared for Fiscal 2018 Our distributions, if any, will be determined by our board of directors and paid out of assets legally available for distribution. Any such distributions generally will be taxable to our stockholders, including to those stockholders who receive additional shares of our common stock pursuant to our dividend reinvestment plan. Prior to January 2009, we paid quarterly dividends to our stockholders. However, in January 2009, we suspended the practice of paying quarterly dividends to our stockholders and On September 24, 2014, we announced the recommencement of quarterly dividends to our stockholders. We have adopted a dividend reinvestment plan (“DRIP”) that provides for reinvestment of our dividend distributions on behalf of our stockholders unless a stockholder elects to receive cash. As a result, if our board of directors authorizes, and we declare, a cash dividend, then our stockholders who have not “opted out” of the DRIP by the dividend record date will have their cash dividends automatically reinvested into additional shares of our common stock, rather than receiving the cash dividends. We have the option to satisfy the share requirements of the DRIP through the issuance of new shares of common stock or through open market purchases of common stock by the DRIP plan administrator. We are prohibited from making distributions that cause us to fail to maintain the asset coverage ratios stipulated by the 1940 Act, subject to certain exceptions, or that violate our debt covenants. In order to maintain our qualification as a RIC, we must for each fiscal year distribute an amount equal to at least 90.0% of our ordinary net taxable income and realized net short-term capital gains in excess of realized net long-term capital losses, if any, reduced by deductible expenses. In addition, we will be subject to federal excise taxes to the extent we do not distribute during the calendar year at least (1) 98.0% of our ordinary income for the calendar year, (2) 98.2% of our capital gains in excess of capital losses for the one year period ending on October 31 of the calendar year and (3) any ordinary income and net capital gains for preceding years that were not distributed during such years and on which we paid no federal income tax. For the Company made distributions sufficient such that we did not incur any federal excise taxes. We may elect to withhold from distribution a portion of our ordinary income for the Pursuant to a revenue procedure (Revenue Procedure2010-12), or the Revenue Procedure, issued by the Internal Revenue Service, or IRS, the IRS indicated that it would treat distributions from certain publicly traded RICs (including BDCs) that were paid part in cash and part in stock as dividends that would satisfy the RIC’s annual distribution requirements and qualify for the dividends paid deduction for federal income tax purposes. In order to qualify for such treatment, the Revenue Procedure required that at least 10.0% of the total distribution be payable in cash and that each stockholder have a right to elect to receive its entire distribution in cash. If too many stockholders elected to receive cash, each stockholder electing to receive cash must receive a proportionate share of the cash to be distributed (although no stockholder electing to receive cash may receive less than 10.0% of such stockholder’s distribution in cash). This Revenue Procedure applied to distributions declared on or before December 31, 2012 with respect to taxable years ending on or before December 31, 2011. Although this Revenue Procedure is no longer available and did not apply to our distributions for our fiscal year ended February 28, On September 24, 2014, we announced the approval of an open market share repurchase plan that allows it to repurchase up to 200,000 shares of our common stock at prices below our NAV as reported in its then most recently published consolidated financial statements, which was subsequently increased to 400,000 shares of our common stock. On October 5, 2016, our board of directors extended the open market share repurchase plan for another year to October 15, 2017 and increased the number of shares we are permitted to repurchase at prices below our NAV, as reported in its then most recently published consolidated financial statements, to 600,000 shares of our common stock. As of February 28, 2017, we purchased 218,491 shares of common stock, at the average price of $16.87 for approximately $3.7 million pursuant to this repurchase plan. On February 28, 2017, our board of directors declared a dividend of $0.46 per share, which was paid on March 28, 2017, to common stockholders of record as of March 15, 2017. Shareholders had the option to receive payment of the dividend in cash, or receive shares of common stock, pursuant our DRIP. Based on shareholder elections, the dividend consisted of approximately $2.0 million in cash and 29,096 newly issued shares of common stock, or 0.5% of our outstanding common stock prior to the dividend payment. The number of shares of common stock comprising the stock portion was calculated based on a price of $21.38 per share, which equaled the volume weighted average trading price per share of the common stock on March 15, 16, 17, 20, 21, 22, 23, 24, 27 and 28, 2017. On January 12, 2017, our board of directors declared a dividend of $0.45 per share, which was paid on February 9, 2017, to common stockholders of record as of January 31, 2017. Shareholders had the option to receive payment of the dividend in cash, or receive shares of common stock, pursuant our DRIP. Based on shareholder elections, the dividend consisted of approximately $1.6 million in cash and 50,453 newly issued shares of common stock, or 0.9% of our outstanding common stock prior to the dividend payment. The number of shares of common stock comprising the stock portion was calculated based on a price of $20.25 per share, which equaled the volume weighted average trading price per share of the common stock on January 27, 30, 31 and February 1, 2, 3, 6, 7, 8 and 9, 2017. On October 5, 2016, our board of directors declared a dividend of $0.44 per share, which was paid on November 9, 2016, to common stockholders of record as of October 31, 2016. Shareholders had the option to receive payment of the dividend in cash, or receive shares of common stock, pursuant our DRIP. Based on shareholder elections, the dividend consisted of approximately $1.5 million in cash and 58,548 newly issued shares of common stock, or 1.0% of our outstanding common stock prior to the dividend payment. The number of shares of common stock comprising the stock portion was calculated based on a price of $17.12 per share, which equaled the volume weighted average trading price per share of the common stock on October 27, 28, 31 and November 1, 2, 3, 4, 7, 8 and 9, 2016. On August 8, 2016, our board of directors declared a special dividend of $0.20 per share, which was paid on September 5, 2016, to common stockholders of record as of August 24, 2016. Shareholders had the option to receive payment of the dividend in cash, or receive shares of common stock, pursuant our DRIP. Based on shareholder elections, the dividend consisted of approximately $0.7 million in cash and 24,786 newly issued shares of common stock, or 0.4% of our outstanding common stock prior to the dividend payment. The number of shares of common stock comprising the stock portion was calculated based on a price of $17.06 per share, which equaled the volume weighted average trading price per share of the common stock on August 22, 23, 24, 25, 26, 29, 30, 31 and September 1 and 2, 2016. On July 7, 2016, our board of directors declared a dividend of $0.43 per share, which was paid on August 9, 2016, to common stockholders of record as of July 29, 2016. Shareholders had the option to receive payment of the dividend in cash, or receive shares of common stock, pursuant our DRIP. Based on shareholder elections, the dividend consisted of approximately $1.5 million in cash and 58,167 newly issued shares of common stock, or 1.0% of our outstanding common stock prior to the dividend payment. The number of shares of common stock comprising the stock portion was calculated based on a price of $16.32 per share, which equaled the volume weighted average trading price per share of the common stock on July 27, 28, 29 and August 1, 2, 3, 4, 5, 8 and 9, 2016. On March 31, 2016, our board of directors declared a dividend of $0.41 per share payable on April 27, 2016, to common stockholders of record on April 15, 2016. Shareholders had the option to receive payment of the dividend in cash, or receive shares of common stock, pursuant our DRIP. Based on shareholder elections, the dividend consisted of approximately $1.5 million in cash and 56,728 newly issued shares of common stock, or 1.0% of our outstanding common stock prior to the dividend payment. The number of shares of common stock comprising the stock portion was calculated based on a price of $15.43 per share, which equaled the volume weighted average trading price per share of the common stock on April 14, 15, 18, 19, 20, 21, 22, 25, 26 and 27, 2016. On January 12, 2016, our board of directors declared a dividend of $0.40 per share payable on February 29, 2016, to all stockholders of record on February 1, 2016. Shareholders had the option to receive payment of the dividend in cash, or receive shares of common stock, pursuant to our DRIP. Based on shareholder elections, the dividend consisted of approximately $1.4 million in cash and 66,765 newly issued shares of common stock, or 1.2% of our outstanding common stock prior to the dividend payment. The number of shares of common stock comprising the stock portion was calculated based on a price of $13.11 per share, which equaled the volume weighted average trading price per share of the common stock on February 16, 17, 18, 19, 22, 23, 24, 25, 26 and 29, 2016. On October 7, 2015, our board of directors declared a dividend of $0.36 per share payable on November 30, 2015, to common stockholders of record on November 2, 2015. Shareholders had the option to receive payment of the dividend in cash, or receive shares of common stock, pursuant our DRIP. Based on shareholder elections, the dividend consisted of approximately $1.1 million in cash and 61,029 newly issued shares of common stock, or 1.1% of our outstanding common stock prior to the dividend payment. The number of shares of common stock comprising the stock portion was calculated based on a price of $14.53 per share, which equaled the volume weighted average trading price per share of the common stock on November 16, 17, 18, 19, 20, 23, 24, 25, 27 and 30, 2015. On July 8, 2015, our board of directors declared a dividend of $0.33 per share payable on August 31, 2015, to common stockholders of record on August 3, 2015. Shareholders had the option to receive payment of the dividend in cash, or receive shares of common stock, pursuant our DRIP. Based on shareholder elections, the dividend consisted of approximately $1.1 million in cash and 47,861 newly issued shares of common stock, or 0.9% of our outstanding common stock prior to the dividend payment. The number of shares of common stock comprising the stock portion was calculated based on a price of $15.28 per share, which equaled the volume weighted average trading price per share of the common stock on August 18, 19, 20, 21, 24, 25, 26, 27, 28 and 31, 2015. On May 14, 2015, our board of directors declared a special dividend of $1.00 per share payable on June 5, 2015, to common stockholders of record on May 26, 2015. Shareholders had the option to receive payment of the dividend in cash, or receive shares of common stock, pursuant our DRIP. Based on shareholder elections, the dividend consisted of approximately $3.4 million in cash and 126,230 newly issued shares of common stock, or 2.3% of our outstanding common stock prior to the dividend payment. The number of shares of common stock comprising the stock portion was calculated based on a price of $16.47 per share, which equaled the volume weighted average trading price per share of the common stock on May 22, 26, 27, 28, 29 and June 1, 2, 3, 4, and 5, 2015. On April 9, 2015, our board of directors declared a dividend of $0.27 per share payable on May 29, 2015, to common stockholders of record on May 4, 2015. Shareholders had the option to receive payment of the dividend in cash, or receive shares of common stock, pursuant our DRIP. Based on shareholder elections, the dividend consisted of approximately $0.9 million in cash and 33,766 newly issued shares of common stock, or 0.6% of our outstanding common stock prior to the dividend payment. The number of shares of common stock comprising the stock portion was calculated based on a price of $16.78 per share, which equaled the volume weighted average trading price per share of the common stock on May 15, 18, 19, 20, 21, 22, 26, 27, 28 and 29, 2015. On September 24, 2014, our board of directors declared a dividend of $0.22 per share payable on February 27, 2015, to common stockholders of record on February 2, 2015. Shareholders have the option to receive payment of the dividend in cash, or receive shares of common stock, pursuant to our DRIP. Based on shareholder elections, the dividend consisted of approximately $0.8 million in cash and 26,858 newly issued shares of common stock, or 0.5% of our outstanding common stock prior to the dividend payment. The number of shares of common stock comprising the stock portion was calculated based on a price of $14.97 per share, which equaled the volume weighted average trading price per share of the common stock on February 13, 17, 18, 19, 20, 23, 24, 25, 26 and 27, 2015. On September 24, 2014, our board of directors declared a dividend of $0.18 per share payable on November 28, 2014, to common stockholders of record on November 3, 2014. Shareholders had the option to receive payment of the dividend in cash, or receive shares of common stock pursuant to our DRIP. Based on shareholder elections, the dividend consisted of approximately $0.6 million in cash and 22,283 newly issued shares of common stock, or 0.4% of our outstanding common stock prior to the dividend payment. The number of shares of common stock comprising the stock portion was calculated based on a price of $14.37 per share, which equaled the volume weighted average trading price per share of the common stock on November 14, 17, 18, 19, 20, 21, 24, 25, 26 and 28, 2014. On October 30, 2013, our board of directors declared a dividend of $2.65 per share payable on December 27, 2013, to common stockholders of record on November 13, 2013. Shareholders had the option to receive payment of the dividend in cash, shares of common stock, or a combination of cash and shares of common stock, provided that the aggregate cash payable to all shareholders was limited to approximately $2.5 million or $0.53 per share. Based on shareholder elections, the dividend consisted of approximately $2.5 million in cash and 649,500 shares of common stock, or 13.7% of our outstanding common stock prior to the dividend payment. The amount of cash elected to be received was greater than the cash limit of 20.0% of the aggregate dividend amount, thus resulting in the payment of a combination of cash and stock to shareholders who elected to receive cash. The number of shares of common stock comprising the stock portion was calculated based on a price of $15.439 per share, which equaled the volume weighted average trading price per share of the common stock on December 11, 13, and 16, 2013. On November 9, 2012, our board of directors declared a dividend of $4.25 per share payable on December 31, 2012, to common stockholders of record on November 20, 2012. Shareholders had the option to receive payment of the dividend in cash, shares of common stock, or a combination of cash and shares of common stock, provided that the aggregate cash payable to all shareholders was limited to approximately $3.3 million or $0.85 per share. Based on shareholder elections, the dividend consisted of $3.3 million in cash and 853,455 shares of common stock, or 22.0% of our outstanding common stock prior to the dividend payment. The amount of cash elected to be received was greater than the cash limit of 20.0% of the aggregate dividend amount, thus resulting in the payment of a combination of cash and stock to shareholders who elected to receive cash. The number of shares of common stock comprising the stock portion was calculated based on a price of $15.444 per share, which equaled the volume weighted average trading price per share of the common stock on December 14, 17 and 19, 2012. On November 15, 2011, our board of directors declared a dividend of $3.00 per share payable on December 30, 2011, to common stockholders of record on November 25, 2011. Shareholders had the option to receive payment of the dividend in cash, shares of common stock, or a combination of cash and shares of common stock, provided that the aggregate cash payable to all shareholders was limited to $2.0 million or $0.60 per share. Based on shareholder elections, the dividend consisted of $2.0 million in cash and 599,584 shares of common stock, or 18.0% of our outstanding common stock prior to the dividend payment. The amount of cash elected to be received was greater than the cash limit of 20.0% of the aggregate dividend amount, thus resulting in the payment of a combination of cash and stock to shareholders who elected to receive cash. The number of shares of common stock comprising the stock portion was calculated based on a price of $13.12 per share, which equaled the volume weighted average trading price per share of the common stock on December 20, 21 and 22, 2011. On November 12, 2010, we declared a dividend of $4.40 per share which was paid on December 29, 2010. Stockholders had the option to receive payment of the dividend in cash, shares of common stock, or a combination of cash and shares of common stock, provided that the aggregate cash payable to all shareholders was limited to $1.2 million or $0.44 per share. Based on shareholder elections, the dividend consisted of $1.2 million in cash and 596,235 shares of common stock, or 22.0% of our outstanding common stock prior to the dividend payment. The amount of cash elected to be received was greater than the cash limit of 10.0% of the aggregate dividend amount, thus resulting in the payment of a combination of cash and stock to shareholders who elected to receive cash. The number of shares of common stock comprising the stock portion was calculated based on a price of $17.8049 per share, which equaled the volume weighted average trading price per share of the common stock on December 20, 21 and 22, 2010. On November 13, 2009, we declared a dividend of $18.25 per share payable on December 31, 2009. Stockholders had the option to receive payment of the dividend in cash, shares of common stock, or a combination of cash and shares of common stock, provided that the aggregate cash payable to all stockholders was limited to $2.1 million or $0.25 per share. Based on stockholder elections, the dividend consisted of $2.1 million in cash and Performance Graph The following graph compares the return on our common stock with that of the Standard & Poor’s 500 Stock Index and the NASDAQ Financial 100 index, for the period from March 23, 2007, the date our common stock began trading, through February 28, Sales of unregistered securities Not applicable. Issuer purchases of equity securities We 2017. The following selected financial and other data as of and for the years ended February 28, SARATOGA INVESTMENT CORP. SELECTED CONSOLIDATED FINANCIAL DATA (dollar amounts in thousands, except share and per share numbers) Year Ended Year Ended Year Ended Year Ended Year Ended Income Statement Data: Interest and related portfolio income: Interest $ 20,187 $ 14,450 $ 11,262 $ 12,050 $ 13,324 Management fee and other income 2,706 2,557 2,250 2,123 2,293 Total interest and related portfolio income 22,893 17,007 13,512 14,173 15,617 Expenses: Interest and debt financing expenses 6,084 2,540 1,298 2,612 4,096 Base management and incentive management fees(1) 4,018 4,152 2,875 3,514 2,278 Administrator expenses 1,000 1,000 1,000 810 671 Administrative and other 2,670 2,287 2,638 4,882 3,502 Expense reimbursement — — — (2,894 ) (671 ) Total operating expenses after reimbursements 13,772 9,979 7,811 8,924 9,876 Net investment income before income taxes 9,121 7,028 5,701 5,249 5,741 Income tax expenses, including excise tax — — — — (27 ) Net investment income 9,121 7,028 5,701 5,249 5,714 Realized and unrealized gain (loss) on investments and derivatives: Net realized gain (loss) 1,271 431 (12,186 ) (24,684 ) (6,654 ) Net change in unrealized gain (loss) (1,648 ) 7,143 19,760 36,393 (9,523 ) Total net gain (loss) (377 ) 7,574 7,574 11,709 (16,177 ) Net increase (decrease) in net assets resulting from operations $ 8,744 $ 14,602 $ 13,275 $ 16,958 $ (10,463 ) Consolidated Statements of Operations Data: Investment income: Interest Management fee and other income Total investment income Operating Expenses: Interest and debt financing expenses Base management and incentive management fees(1) Administrator expenses Administrative and other Excise tax expense Total operating expenses Loss on extinguishment of debt Net investment income Realized and unrealized gain (loss) on investments and derivatives: Net realized gain from investments and derivatives Net change in unrealized appreciation (depreciation) on investments and derivatives Total net gain (loss) on investments and derivatives Net increase in net assets resulting from operations Per Share: Earnings per common share—basic and diluted(2) Net investment income per share—basic and diluted(2) Net realized and unrealized gain (loss) per share—basic and diluted(2) Dividends declared per common share(3) Dilutive impact of dividends paid in stock on net asset value per share(4) Net asset value per share Consolidated Statements of Assets and Liabilities Data: Investment assets at fair value Total assets(5) Total debt outstanding(5) Total net assets Net asset value per common share Common shares outstanding at end of year Other Data: Investments funded Principal collections related to investment repayments or sales Number of investments at year end Weighted average yield of income producing debtinvestments—Non-control/Non-affiliate Weighted average yield on income producing debt investments—Control Year Ended Year Ended Year Ended Year Ended Year Ended Per Share: Earnings (loss) per common share—basic and diluted(2)(5) $ 1.78 $ 3.55 $ 3.87 $ 6.96 $ (9.86 ) Net investment income per share—basic and diluted(2)(5) $ 1.85 $ 1.71 $ 1.66 $ 2.15 $ 5.38 Net realized and unrealized gain (loss) per share— basic and diluted(2)(5) $ (0.07 ) $ 1.84 $ 2.21 $ 4.81 $ (15.24 ) Dividends declared per common share(3)(5) $ 2.65 $ 4.25 $ 3.00 $ 4.40 $ 18.25 Dilutive impact of dividends paid in stock on net asset value per share(4) $ (0.75 ) $ (1.44 ) $ (2.01 ) $ (9.05 ) $ (21.10 ) Net asset value per share $ 21.36 $ 22.98 $ 25.12 $ 26.26 $ 32.75 Statement of Assets and Liabilities Data: Investment assets at fair value $ 205,845 $ 155,080 $ 95,360 $ 80,025 $ 89,373 Total assets 219,177 174,411 125,491 98,769 96,935 Total debt outstanding 98,300 60,300 20,000 4,500 36,992 Stockholders’ equity 114,924 108,687 97,380 86,071 55,478 Net asset value per common share(5) $ 21.36 $ 22.98 $ 25.12 $ 26.26 $ 32.75 Common shares outstanding at end of year 5,379,616 4,730,116 3,876,661 3,277,077 1,694,010 Other Data: Investments funded $ 121,074 $ 71,596 $ 38,679 $ 9,014 $ — Principal collections related to investment repayments or sales $ 71,607 $ 21,488 $ 33,568 $ 31,975 $ 15,185 Number of investments at year end 60 47 33 37 41 Weighted average yield of income producing debt investments—Non-control/non-affiliate 10.62 % 11.26 % 11.88 % 11.1 % 9.6 % Weighted average yield on income producing debt investments—Control 18.55 % 27.11 % 20.17 % 15.8 % 8.3 % The following discussion should be read in conjunction with our consolidated financial statements and related notes and other financial information appearing elsewhere in this Annual Report onForm 10-K. In addition to historical information, the following discussion and other parts of this Annual Report contain forward-looking information that involves risks and uncertainties. Our actual results could differ materially from those anticipated by such forward-looking information due to the factors discussed under Part The forward-looking statements are based on our beliefs, assumptions and expectations of our future performance, taking into account all information currently available to us. These beliefs, assumptions and expectations can change as a result of many possible events or factors, not all of which are known to us or are within our control. If a change occurs, our business, financial condition, liquidity and results of operations may vary materially from those expressed in our forward-looking statements. The forward-looking statements contained in this Annual Report onForm 10-K involve risks and uncertainties, including statements as to: You should not place undue reliance on these forward-looking statements. The forward-looking statements made in this Annual Report onForm 10-K relate only to events as of the date on which the statements are made. We undertake no obligation to update any forward-looking statement to reflect events or circumstances occurring after the date of this Annual Report onForm 10-K. OVERVIEW We are a Maryland corporation that has elected to be treated as a Corporate History and Recent Developments We commenced operations, at the time known as GSC Investment Corp., on March 23, 2007 and completed an initial public offering of shares of common stock on March 28, 2007. Prior to July 30, 2010, we were externally managed and advised by GSCP (NJ), L.P., an entity affiliated with GSC Group, Inc. In connection with the consummation of a recapitalization transaction on July 30, 2010, as described below we engaged Saratoga Investment Advisors (“SIA”) to replace GSCP (NJ), L.P. as our investment adviser and changed our name to Saratoga Investment Corp. As a result of the event of default under a revolving securitized credit facility with Deutsche Bank we previously had in place, in December 2008 we engaged the investment banking firm of Stifel, Nicolaus & Company to evaluate strategic transaction opportunities and consider alternatives for us. On April 14, 2010, GSC Investment Corp. entered into a stock purchase agreement with Saratoga Investment Advisors and certain of its affiliates and an assignment, assumption and novation agreement with Saratoga Investment Advisors, pursuant to which GSC Investment Corp. assumed certain rights and obligations of Saratoga Investment Advisors under a debt commitment letter Saratoga Investment Advisors received from Madison Capital Funding LLC, which indicated Madison Capital Funding’s willingness to provide GSC Investment Corp. with a $40.0 million senior secured revolving credit facility, subject to the satisfaction of certain terms and conditions. In addition, GSC Investment Corp. and GSCP (NJ), L.P. entered into a termination and release agreement, to be effective as of the closing of the transaction contemplated by the stock purchase agreement, pursuant to which GSCP (NJ), L.P., among other things, agreed to waive any and all accrued and unpaid deferred incentive management fees up to and as of the closing of the transaction contemplated by the stock purchase agreement but continued to be entitled to receive the base management fees earned through the date of the closing of the transaction contemplated by the stock purchase agreement. On July 30, 2010, the transactions contemplated by the stock purchase agreement with Saratoga Investment Advisors and certain of its affiliates were completed, the private sale of 986,842 shares of our common stock for $15.0 million in aggregate purchase price to Saratoga Investment Advisors and certain of its affiliates closed, the Company entered into the Credit Facility, and the Company began doing business as Saratoga Investment Corp. We used the net proceeds from the private sale transaction and a portion of the funds available to us under the Credit Facility to pay the full amount of principal and accrued interest, including default interest, outstanding under our revolving securitized credit facility with Deutsche Bank. The revolving securitized credit facility with Deutsche Bank was terminated in connection with our payment of all amounts outstanding thereunder on July 30, 2010. On August 12, 2010, we effected aone-for-ten reverse stock split of our outstanding common stock. As a result of the reverse stock split, every ten shares of our common stock were converted into one share of our common stock. Any fractional shares received as a result of the reverse stock split were redeemed for cash. The total cash payment in lieu of shares was $230. Immediately after the reverse stock split, we had 2,680,842 shares of our common stock outstanding. In January 2011, we registered for public resale of the On March 28, 2012, our wholly-owned subsidiary, Saratoga Investment Corp. SBIC, LP (“SBIC LP”), received In May 2013, we issued $48.3 million in aggregate principal amount of our 7.50% unsecured notes due 2020 (the “2020 Notes”) for net proceeds of $46.1 million after deducting underwriting commissions of $1.9 million and offering costs of $0.3 million. The proceeds included the underwriters’ full exercise of their overallotment option. Interest on these On May 29, 2015, we entered into a Debt Distribution Agreement with Ladenburg Thalmann & Co. through which we may offer for sale, from time to time, up to $20.0 million in aggregate principal amount of the 2020 Notes through anAt-the-Market (“ATM”) offering. As of February 28, 2017, the Company sold 539,725 bonds with a principal of $13,493,125 at an average price of $25.31 for aggregate net proceeds of $13,385,766 (net of transaction costs). On December 21, 2016, we issued $74.5 million in aggregate principal amount of our 6.75% fixed-rate notes due 2023 (the “2023 Notes”) for net proceeds of $71.7 million after deducting underwriting commissions of approximately $2.3 million and offering costs of approximately $0.5 million. The issuance included the exercise of substantially all of the underwriters’ option to purchase an additional $9.8 million aggregate principal amount of 2023 Notes within 30 days. Interest on the 2023 Notes is paid quarterly in arrears on March 15, June 15, September 15 and December 15, at a rate of 6.75% per year, beginning March 30, 2017. The 2023 Notes mature on December 30, 2023, and commencing December 21, 2019, may be redeemed in whole or in part at any time or from time to time at our option. The net proceeds from the offering were used to repay all of the outstanding indebtedness under the 2020 Notes, which amounts to $61.8 million, and for general corporate purposes in accordance with our investment objective and strategies. The 2023 Notes are listed on the NYSE under the trading symbol “SAB” with a par value of $25.00 per share. On April 2, 2015, the SBA issued a “green light” letter inviting the Company to continue the application process to obtain a license to form and operate its second SBIC subsidiary. On September 27, 2016, the SBA informed us that as part of their continued review of our application for a second license, and in order to ensure that they were reviewing the most current information available, we would need to update all previously submitted materials and invited us to reapply. As a result of this request, with which we are in the process of complying, the existing “green light” letter that the SBA issued to us has expired. If approved in the future, a second SBIC license would provide us an incremental source of long-term capital by permitting us to issue up to $150.0 million of additionalSBA-guaranteed debentures in addition to the $150.0 million already approved under the first license. Critical Accounting Policies Basis of Presentation The preparation of financial statements in accordance with U.S. generally accepted accounting principles (“U.S. GAAP”) requires management to make certain estimates and assumptions affecting amounts reported in the Company’s consolidated financial statements. We have identified investment valuation, revenue recognition and the recognition of capital gains incentive fee expense as our most critical accounting estimates. We continuously evaluate our estimates, including those related to the matters described below. These estimates are based on the information that is currently available to us and on various other assumptions that we believe to be reasonable under the circumstances. Actual results could differ materially from those estimates under different assumptions or conditions. A discussion of our critical accounting policies follows. Investment Valuation The Company accounts for its investments at fair value in accordance with the Financial Accounting Standards Board (“FASB”) Accounting Standards Codification (“ASC”) Topic 820,Fair Value Measurements and Disclosures (“ASC 820”). ASC 820 defines fair value, establishes a framework for measuring fair value, establishes a fair value hierarchy based on the quality of inputs used to measure fair value and enhances disclosure requirements for fair value measurements. ASC 820 requires the Company to assume that its investments are to be sold at the Investments for which market quotations are readily available are fair valued at such market quotations obtained from independent third party pricing services and market makers subject to any decision by our board of directors to approve a fair value determination to reflect significant events affecting the value of these investments. We value investments for which market quotations are not readily available at fair value as approved, in good faith, by our board of directors based on input from Saratoga Investment Advisers, the audit committee of our board of directors and a third party independent valuation firm. Determinations of fair value may involve subjective judgments and estimates. The types of factors that may be considered in determining the fair value of our investments include the nature and realizable value of any collateral, the portfolio company’s ability to make payments, market yield trend analysis, the markets in which the portfolio company does business, comparison to publicly traded companies, discounted cash flow and other relevant factors. We undertake a multi-step valuation process each quarter when valuing investments for which market quotations are not readily available, as described below: In addition, all our investments are subject to the following valuation process: Our investment in Saratoga Investment Corp. CLO2013-1, Ltd. (“Saratoga CLO”) is carried at fair value, which is based on a discounted cash flow model that utilizes prepayment,re-investment and loss assumptions based on historical experience and projected performance, economic factors, the characteristics of the underlying cash flow, and comparable yields for equity interests in collateralized loan obligation funds similar to Saratoga CLO, when available, as determined by SIA and recommended to our board of directors. Specifically, we use Intex cash flow models, or an appropriate substitute, to form the basis for the valuation of our investment in Saratoga CLO. The models use a set of assumptions including projected default rates, recovery rates, reinvestment rate and prepayment rates in order to arrive at estimated valuations. The assumptions are based on available market data and projections provided by third parties as well as management estimates. We use the output from the Intex models (i.e., the estimated cash flows) to perform a discounted cash Revenue Recognition Income Recognition Interest income, adjusted for amortization of premium and accretion of discount, is recorded on an accrual basis to the extent that such amounts are expected to be collected. The Company stops accruing interest on its investments when it is determined that interest is no longer collectible. Discounts and premiums on investments purchased are accreted/amortized over the life of the respective investment using the effective yield method. The amortized cost of investments represents the original cost adjusted for the accretion of discounts and Loans are generally placed onnon-accrual status when there is reasonable doubt that principal or interest will be collected. Accrued interest is generally reserved when a loan is placed onnon-accrual status. Interest payments received onnon-accrual loans may be recognized as a reduction in principal depending upon management’s judgment regarding collectability.Non-accrual loans are restored to accrual status when past due principal and interest is paid and, in management’s judgment, are likely to remain current, although we may make exceptions to this general rule if the loan has sufficient collateral value and is in the process of collection. Interest income on our investment in Saratoga CLO is recorded using the effective interest method in accordance with the provisions of ASC Topic325-40,Investments-Other, Beneficial Interests in Securitized Financial Assets, based on the anticipated yield and the estimated cash flows over the projected life of the investment. Yields are revised when there are changes in actual or estimated cash flows due to changes in prepayments and/orre-investments, credit losses or asset pricing. Changes in estimated yield are recognized as an adjustment to the estimated yield over the remaining life of the investment from the date the estimated yield was changed. The Company holds debt investments in its portfolio that contain apayment-in-kind (“PIK”) interest provision. The PIK interest, which represents contractually deferred interest added to the investment balance that is generally due at maturity, is generally recorded on the accrual basis to the extent such amounts are expected to be collected. We stop accruing PIK interest if we do not expect the issuer to be able to pay all principal and interest when due. Capital Gains Incentive Fee The Company records an expense accrual relating to the capital gains incentive fee payable by the Company to its investment adviser when the unrealized gains on its investments exceed all realized capital losses on its investments given the fact that a capital gains incentive fee would be owed to the investment adviser if the Company were to liquidate its investment portfolio at such time. The actual incentive fee payable to the Company’s investment adviser related to capital gains will be determined and payable in arrears at the end of each fiscal year and will include only realized capital gains for the period. Revenues We generate revenue in the form of interest income and capital gains on the debt investments that we hold and capital gains, if any, on equity interests that we may acquire. We expect our debt investments, whether in the form of leveraged loans or mezzanine debt, to have terms of up to ten years, and to bear interest at either a fixed or floating rate. Interest on debt will be payable generally either quarterly or semi-annually. In some cases, our debt investments may provide for a portion of the interest to be PIK. To the extent interest ispaid-in-kind, it will be payable through the increase of the principal amount of the obligation by the amount of interest due on the then-outstanding aggregate principal amount of such obligation. The principal amount of the debt and any accrued but unpaid interest will generally become due at the maturity date. In addition, we may generate revenue in the form of commitment, origination, structuring or diligence fees, fees for providing managerial assistance or investment management services and possibly consulting fees. Any such fees will be generated in connection with our investments and recognized as earned. We may also invest in preferred equity securities that pay dividends on a current basis. On January 22, 2008, we entered into a collateral management agreement with Saratoga CLO, pursuant to which we act as its collateral manager. The Saratoga CLO was initially refinanced in October 2013 and its reinvestment period The Saratoga CLO remains effectively 100% owned and managed by Saratoga Investment Corp. We recognize interest income on our investment in the subordinated notes of Saratoga CLO using the effective interest method, based on the anticipated yield and the estimated cash flows over the projected life of the investment. Yields are revised when there are changes in actual or estimated cash flows due to changes in prepayments and/orre-investments, credit losses or asset pricing. Changes in estimated yield are recognized as an adjustment to the estimated yield over the remaining life of the investment from the date the estimated yield was changed. Expenses Our primary operating expenses include the payment of investment advisory and management fees, professional fees, directors and officers insurance, fees paid to independent directors and administrator expenses, including our allocable portion of our administrator’s overhead. Our investment advisory and management fees compensate our investment adviser for its work in identifying, evaluating, negotiating, closing and monitoring our investments. We bear all other costs and expenses of our operations and transactions, including those relating to: Pursuant to the investment advisory and management agreement that we had with GSCP (NJ), L.P., our former investment adviser and administrator, we had agreed to pay GSCP (NJ), L.P. as investment adviser a quarterly base management fee of 1.75% of the average value of our total assets (other than cash or cash equivalents but including assets purchased with borrowed funds) at the end of the two most recently completed fiscal quarters and The incentive fee had two parts: We deferred cash payment of any incentive fee otherwise earned by our former investment adviser if, during the then most recent four full fiscal quarters ending on or prior to the date such payment was to be made, the sum of (a) our aggregate distributions to our stockholders and (b) our change in net assets (defined as total assets less liabilities) (before taking into account any incentive fees payable during that period) was less than 7.5% of our net assets at the beginning of such period. These calculations were appropriatelypro-rated for the first three fiscal quarters of operation and adjusted for any share issuances or repurchases during the applicable period. Such incentive fee would become payable on the next date on which such test had been satisfied for the most recent four full fiscal quarters or upon certain terminations of the investment advisory and management agreement. We commenced deferring cash payment of incentive fees during the quarterly period ended August 31, 2007, and continued to defer such payments through the quarterly period ended May 31, 2010. As of July 30, 2010, the date on which GSCP (NJ), L.P. ceased to be our investment adviser and administrator, we owed GSCP (NJ), L.P. $2.9 million in fees for services previously provided to us; of which $0.3 million has been paid by us. GSCP (NJ), L.P. agreed to waive payment by us of the remaining $2.6 million in connection with the consummation of the stock purchase transaction with Saratoga Investment Advisors and certain of its affiliates described elsewhere in this Annual Report. The terms of the investment advisory and management agreement with Saratoga Investment Advisors, our current investment adviser, are substantially similar to the terms of the investment advisory and management agreement we had entered into with GSCP (NJ), L.P., our former investment adviser, except for the following material distinctions in the fee terms: To the extent that any of our leveraged loans are denominated in a currency other than U.S. New Accounting Pronouncements In August 2016, the FASB issued Accounting Standards Update (“ASU”)2016-15, Statement of Cash Flows (Topic 230),Classification of Certain Cash Receipts and Cash Payments (“ASU2016-15”), which is intended to reduce the existing diversity in practice in how certain cash receipts and cash payments are presented and classified in the statement of cash flows. The guidance is effective for annual periods beginning after December 15, 2017, and interim periods therein. Early adoption is permitted. Management is currently evaluating the impact ASU2016-15 will have on the Company’s consolidated financial statements and disclosures. In February 2016, the FASB issued ASU2016-02,Amendments to the Leases (“ASU Topic 842”), which will require for all operating leases the recognition of aright-of-use asset and a lease liability, in the statement of financial position. The lease cost will be allocated over the lease term on a straight-line basis. This guidance is effective for annual and interim periods beginning after December 15, 2018. Management is currently evaluating the impact these changes will have on the Company’s consolidated financial statements and disclosures. In January 2016, the FASB issued ASU2016-01,Financial Instruments—Overall (Subtopic825-10): Recognition and Measurement of Financial Assets and Financial Liabilities (“ASU2016-01”). ASU2016-01 retains many current requirements for the classification and measurement of financial instruments; however, it significantly revises an entity’s accounting related to (1) the classification and measurement of investments in equity securities and (2) the presentation of certain fair value changes for financial liabilities measured at fair value. ASU2016-01 also amends certain disclosure requirements associated with the fair value of financial instruments. This guidance is effective for annual and interim periods beginning after December 15, 2017, and early adoption is not permitted for public business entities. Management is currently evaluating the impact the adoption of this standard has on our consolidated financial statements and disclosures. In May 2014, the FASB issued ASU2014-09,Revenue from Contracts with Customers (Topic 606), which supersedes the revenue recognition requirements in Revenue Recognition (Topic 605). Under the new guidance, an entity should recognize revenue to depict the transfer of promised goods or services to customers in an amount that reflects the consideration to which the entity expects to be entitled in exchange for those goods or services. In May 2016, ASU2016-12 amended ASU2014-09 and deferred the effective period to December 15, 2017. Management is currently evaluating the impact these changes will have on the Company’s consolidated financial statements and disclosures. Portfolio and investment activity Corporate Debt Portfolio Overview At February 28, At February 28, At February 29, ($ in millions) ($ in millions) ($ in millions) Number of investments(1) 59 44 30 Number of portfolio companies(1) 37 28 21 Average investment size(1) $ 3.2 $ 2.9 $ 2.3 Weighted average maturity(1) 4.3yrs 3.7yrs 3.0yrs Number of industries(1) 16 15 15 Average investment per portfolio company(1) $ 5.0 $ 4.6 $ 3.3 Non-performing or delinquent investments(1) $ 0.3 $ 6.7 $ 0.0 Fixed rate debt (% of interest bearing portfolio)(2) $ 70.6(40.1 )% $ 53.4(43.9 )% $ 18.7(29.3 )% Weighted average current coupon(2) 12.5 % 12.6 % 13.0 % Floating rate debt (% of interest bearing portfolio)(2) $ 105.4(59.9 )% $ 68.2(56.1 )% $ 45.1(70.7 )% Weighted average current spread over LIBOR(2) 7.3 % 7.5 % 7.4 % Number of investments(1) Number of portfolio companies(3) Average investment size(1) Weighted average Number of industries(3) Average investment per portfolio company(1) Non-performing or delinquent investments Fixed rate debt (% of interest bearing Weighted average current coupon(2) Floating rate debt (% of interest bearing Weighted average current spread over LIBOR(2)(4) During the fiscal year ended February 28, During the fiscal year ended February During the fiscal year ended February Our portfolio composition at February 28, Portfolio composition At February 28, 2014 At February 28, 2013 At February 29, 2012 Percentage Weighted Percentage Weighted Percentage Weighted Middle market loans 15.7 % 6.2 % — % — % — % — % First lien term loans 39.0 10.7 54.0 10.0 38.0 10.1 Second lien term loans 13.5 11.1 6.2 11.1 9.3 10.3 Senior secured notes 14.6 13.8 15.0 14.8 11.2 16.0 Senior unsecured loans — — — — 6.3 15.0 Unsecured notes 2.7 15.2 3.1 16.4 2.1 19.3 Saratoga CLO subordinated notes 9.5 18.6 16.5 27.1 27.1 20.2 Equity interests 5.0 N/A 5.2 N/A 6.0 N/A Total 100.0 % 11.8 % 100.0 % 14.0 % 100.0 % 13.4 % Syndicated loans First lien term loans Second lien term loans Unsecured notes Structured finance securities Equity interests Total Our investment in the subordinated notes of Saratoga CLO represents a first loss position in a portfolio that, at February 28, Saratoga Investment Advisors normally grades all of our investments using a credit and monitoring rating system (“CMR”). The CMR consists of a single component: a color rating. The color rating is based on several criteria, including financial and operating strength, probability of default, and restructuring risk. The color ratings are characterized as follows: (Green)— The CMR distribution of our investments at February 28, Portfolio CMR distribution At February 28, 2014 At February 28, 2013 Color Investments Percentage Investments Percentage ($ in thousands) Green $ 159,207 77.4 % $ 100,170 64.6 % Yellow 8,466 4.1 8,143 5.3 Red 8,270 4.0 13,229 8.5 N/A(1) 29,902 14.5 33,538 21.6 Total $ 205,845 100.0 % $ 155,080 100.0 % reserve from Targus Holdings, Inc. released, with the only remaining existing reserve related to TM Restaurant Group, L.L.C. The CMR distribution of Saratoga CLO investments at February 28, Portfolio CMR distribution At February 28, 2014 At February 28, 2013 Color Investments Percentage Investments Percentage ($ in thousands) Green $ 284,796 94.8 % $ 318,181 85.0 % Yellow 14,106 4.7 50,677 13.5 Red 1,589 0.5 5,562 1.5 N/A(1) Total $ 300,491 100.0 % $ 374,420 100.0 % Portfolio composition by industry grouping at fair value The following table shows our portfolio composition by industry grouping at fair value at February 28, At February 28, 2014 At February 28, 2013 Investments Percentage Investments Percentage ($ in thousands) Business Services $ 57,330 27.9 % $ 22,155 14.3 % Healthcare Services 23,810 11.6 12,400 8.0 Consumer Services 21,897 10.6 10,654 6.9 Software 21,738 10.5 — — Media Real Estate Structured Finance Securities(1) 19,570 9.5 25,517 16.5 Education Food and Beverage 17,286 8.4 18,199 11.7 Automotive 10,621 5.2 14,805 9.5 Electronics 6,741 3.3 6,721 4.3 Consumer Products Metals 6,645 3.2 6,724 4.3 Consumer Products 6,118 3.0 13,727 8.9 Manufacturing 5,970 2.9 — — Environmental 5,249 2.5 2,992 1.9 Publishing 1,191 0.6 5,631 3.6 Automotive Aftermarket Building Products 901 0.4 267 0.2 Aerospace 344 0.2 3,500 2.3 Homebuilding 344 0.2 315 0.2 Education 90 0.0 292 0.2 Logistics — — 11,181 7.2 Total $ 205,845 100.0 % $ 155,080 100.0 % The following table shows Saratoga CLO’s portfolio composition by industry grouping at fair value at February 28, At February 28, 2014 At February 28, 2013 Investments Percentage Investments Percentage ($ in thousands) Healthcare $ 37,896 12.6 % $ 40,502 10.8 % Business Equipment and Services 28,386 9.4 28,300 7.6 Services: Business Healthcare & Pharmaceuticals Chemicals/Plastics 26,345 8.8 28,817 7.7 Conglomerate 24,285 8.1 29,888 8.0 High Tech Industries Banking, Finance, Insurance & Real Estate Retailers (Except Food and Drugs) Telecommunications Aerospace and Defense Media Industrial Equipment 24,143 8.0 21,864 5.8 Aerospace and Defense 20,465 6.8 20,914 5.6 Retailers (Except Food and Drugs) 15,314 5.1 19,050 5.1 Food Products 12,450 4.1 21,016 5.6 Drugs 11,873 4.0 18,226 4.9 Leisure Goods/Activities/Movies Financial Intermediaries Electronics/Electric 11,861 4.0 26,321 7.0 Automotive 10,279 3.4 10,625 2.8 Leisure Goods/Activities/Movies 8,990 3.0 8,879 2.4 Financial Intermediaries 8,138 2.7 20,199 5.4 Telecommunications 6,627 2.2 10,951 2.9 Capital Equipment Food Services Drugs Utilities 5,830 1.9 9,932 2.6 Food Services 5,612 1.9 5,491 1.5 Publishing Lodging and Casinos Technology Conglomerate Oil & Gas Food Products Beverage, Food & Tobacco Insurance 5,517 1.8 6,648 1.8 Food/Drug Retailers 5,012 1.7 4,329 1.1 Transportation Brokers/Dealers/Investment Houses Hotel, Gaming and Leisure Containers/Glass Products Construction & Building Cable and Satellite Television Nonferrous Metals/Minerals 4,328 1.4 5,187 1.4 Brokers/Dealers/Investment Houses 3,740 1.2 3,311 0.9 Environmental Industries Services: Consumer Broadcast Radio and Television Building and Development 3,246 1.1 2,124 0.6 Publishing 2,913 1.0 5,657 1.5 Containers/Glass Products 2,906 1.0 2,009 0.5 Cable and Satellite Television 2,666 0.9 4,058 1.1 Oil & Gas 2,488 0.8 — — Telecommunications/Cellular 2,460 0.8 3,076 0.8 Broadcast Radio and Television 1,505 0.5 1,010 0.3 Computers & Electronics 1,479 0.5 — — Ecological Services and Equipment 1,241 0.4 753 0.2 Media 1,000 0.3 — — Gaming And Hotels 500 0.2 — — Lodging and Casinos 499 0.2 7,400 2.0 Leasing 497 0.2 — — Beverage and Tobacco — — 3,037 0.8 Home Furnishings — — 2,984 0.8 Steel — — 1,001 0.3 Clothing/Textiles — — 861 0.2 Total $ 300,491 100.0 % $ 374,420 100.0 % Portfolio composition by geographic location at fair value The following table shows our portfolio composition by geographic location at fair value at February 28, At February 28, 2014 At February 28, 2013 Investments Percentage Investments Percentage ($ in thousands) Southeast $ 83,161 40.4 % $ 70,476 45.4 % Midwest Northeast Southwest Other(1) Northwest West 44,470 21.6 26,573 17.1 Midwest 41,453 20.1 18,469 11.9 Other(1) 19,570 9.5 25,517 16.5 Northeast 17,191 8.4 14,045 9.1 International Total $ 205,845 100.0 % $ 155,080 100.0 % Results of operations Operating results for the fiscal years ended February 28, For the Year Ended February 28, February 28, February 29, ($ in thousands) Total investment income $ 22,893 $ 17,007 $ 13,512 Total expenses, net 13,772 9,979 7,811 Net investment income 9,121 7,028 5,701 Net realized gains (losses) 1,271 431 (12,186 ) Net unrealized gains (1,648 ) 7,143 19,760 Net increase in net assets resulting from operations $ 8,744 $ 14,602 $ 13,275 Total investment income Total operating expenses Loss on extinguishment of debt Net investment income Net realized gains from investments Net unrealized appreciation (depreciation) on investments Net increase in net assets resulting from operations Investment income The composition of our investment income for the fiscal years ended February 28, February 28, February 28, February 29, ($ in thousands) Interest from investments $ 20,179 $ 14,444 $ 11,254 Management fees from Saratoga CLO 1,775 2,000 2,012 Interest from cash and cash equivalents and other income 939 563 246 Total $ 22,893 $ 17,007 $ 13,512 Interest from investments Management fee income Interest from cash and cash equivalents and other income Total For the fiscal year ended February 28, February 28, 2017 from $26.9 million for the fiscal year ended February 29, 2016. This reflects an increase of 3.1% in total investments to $292.7 million at February 28, 2017 from $284.0 million at February 29, 2016, partially offset by the weighted average current coupon reducing from 11.5% to 11.4%. For the fiscal year ended February 29, 2016, total investment income increased $2.7 million, or 9.8% compared to the fiscal year ended February 28, 11.5%. For the fiscal years ended February 28, Operating expenses The composition of our operating expenses for the years ended February 28, Operating Expenses February 28, February 28, February 29, ($ in thousands) Interest and credit facility expense $ 6,084 $ 2,540 $ 1,298 Base management fees 3,327 2,107 1,618 Professional fees 1,212 1,191 1,455 Incentive management fees 691 2,045 1,257 Administrator expenses 1,000 1,000 1,000 Insurance expenses 443 516 579 Directors fees 205 207 209 General and administrative and other expenses 810 373 395 Total expenses $ 13,772 $ 9,979 $ 7,811 Interest and debt financing expenses Base management fees Professional fees Incentive management fees Administrator expenses Insurance Directors fees and expenses Excise tax expense General & administrative and other expenses Total operating expenses For the year ended February 28, 28, 2015. For the years ended February 28, rate as well as the notes payable interest rate decreasing from 7.50% to 6.75% following the refinancing of the 2020 Notes. SBA debentures decreased from 62.7% of overall debt as of February 29, 2016 to 60.2% as of February 28, 2017. For the year ended February 28, For the year ended February 28, For the year ended February 28, 2016. The first part of the incentive management fees increased this year from $2.2 million for the year ended February 29, 2016 to $2.8 million for the year ended February 28, 2017, as higher average total assets of 8.7% has led to increased net investment income above the hurdle rate pursuant to the investment advisory and management agreement. In addition, the incentive management fees related to capital gains also increased from a decrease in expense of $0.1 million to an increase in expense of $0.1 million, reflecting the realized and unrealized gains earned this year. For the year ended February 28, 2015. As discussed above, the increase in interest and Net realized gains/ For the fiscal year ended February 28, Fiscal year ended February 28, 2017 Issuer Take 5 Oil Change, L.L.C. Legacy Cabinets, Inc. Legacy Cabinets, Inc. The $6.0 million of realized gain on our investment in Take 5 Oil Change, L.L.C. was due to the completion of a sales transaction with a strategic acquirer. The $3.4 million of realized gains on our investments in Legacy Cabinets, Inc. were due to a period of steadily improving performance, leading up to our sale of shares in Legacy Cabinets, Inc. For the fiscal year ended February 29, 2016, the Company had $68.2 million of sales, repayments, exits or restructurings resulting in $0.2 million of net realized gains. The most significant realized gains and losses during the year ended February Fiscal year ended February Issuer Asset Type Gross Cost Net ($ in thousands) Penton Media, Inc. First Lien Term Loan $ 4,887 $ 4,681 $ 206 Sourcehov, LLC Second Lien Term Loan 3,030 2,659 371 Worldwide Express Operations, LLC Warrants 128 — 128 Issuer Network Communications, Inc. Targus Holdings, Inc. Targus Holdings, Inc. Targus Holdings, Inc. The $3.2 million of realized gain on our investments in Network Communications, Inc. is due to the sale of the company to a third party and reflects the realization value pursuant to that transaction. For the fiscal year ended February 28, Fiscal year ended February 28, Issuer Asset Type Gross Cost Net ($ in thousands) Grant US Holdings LLP Second Lien Term Loan $ 183 $ — $ 183 Energy Alloys LLC Warrants 146 — 146 Issuer Asset Type Gross Cost Net ($ in thousands) Grant US Holdings LLP Second Lien Term Loan $ — $ (6,348 ) $ (6,348 ) Pracs Institute Ltd. Second Lien Term Loan — (4,078 ) (4,078 ) Bankruptcy Management Solutions, Inc. Second Lien Term Loan 223 (2,645 ) (2,422 ) Issuer Community Investors, Inc. HOA Restaurant GP/Finance USS Parent Holding Corp USS Parent Holding Corp Net unrealized appreciation/ For the year ended February 28, Fiscal year ended February 28, 2017 Issuer Take 5 Oil Change, L.L.C. Legacy Cabinets, Inc. Legacy Cabinets, Inc. Elyria Foundry Company, L.L.C. The $5.8 million of change in unrealized depreciation in our investment in Take 5 Oil Change, L.L.C. was driven by the completion of a sales transaction with a strategic acquirer. In realizing this gain as a result of the sale, unrealized appreciation was adjusted to zero, which resulted in a $5.8 million change in unrealized depreciation for the year. The $4.0 million of change in unrealized depreciation in our investments in Legacy Cabinets, Inc. were driven by the completion of a sales transaction. In realizing these gains as a result of the sale, unrealized appreciation was adjusted to zero, which resulted in a $4.0 million change in unrealized depreciation for the year. The $1.6 million of change in unrealized depreciation in our investment in Elyria Foundry Company, L.L.C. was driven by a decline in oil and gas end markets sinceyear-end, negatively impacting the company’s performance. For the year ended February 29, 2016, our investments had net unrealized appreciation of $0.7 million versus net unrealized depreciation of $1.9 million for the year ended February 28, Fiscal year ended February 29, 2016 Issuer Take 5 Oil Change, L.L.C. Targus Holdings, Inc. Elyria Foundry Company, L.L.C. For the year ended February 28, 2015, our investments had net unrealized depreciation of $1.9 million versus net unrealized depreciation of $1.6 million for the year ended February 28, 2014. The most significant cumulative changes in unrealized appreciation and depreciation for the year ended February 28, Fiscal year ended February 28, Issuer Asset Type Cost Fair Total YTD Change �� ($ in thousands) Saratoga CLO Other/ Structured Finance Securities $ 16,556 $ 19,570 $ 3,014 $ (3,558 ) Targus Holdings, Inc. Common Stock 567 730 163 (2,595 ) USS Parent Holding Corp. Voting Common Stock 3,026 5,028 2,002 2,162 Group Dekko, Inc. Second Lien Term Loan 6,902 6,741 (161 ) (56 ) Elyria Foundry Company, LLC Senior Secured Notes 9,037 6,777 (2,260 ) (2,259 ) Issuer Asset Type Cost Fair Total YTD Change ($ in thousands) Saratoga CLO Other/ Structured Finance Securities $ 18,945 $ 25,517 $ 6,572 $ 4,266 Targus Holdings, Inc. Common Stock 567 3,325 2,758 649 USS Parent Holding Corp. Voting Common Stock 3,026 2,866 (160 ) 641 Group Dekko, Inc. Second Lien Term Loan 6,825 6,721 (104 ) 464 Worldwide Express Operations, LLC First Lien Term Loan 6,461 6,504 43 352 Penton Media, Inc. First Lien Term Loan 4,497 4,670 173 798 Issuer Asset Type Cost Fair Total YTD Change ($ in thousands) Saratoga CLO Other/ Structured Finance Securities $ 23,541 $ 25,846 $ 2,305 $ 6,938 Targus Holdings, Inc. Common Stock 567 2,676 2,109 206 USS Parent Holding Corp. Voting Common Stock 3,026 2,225 (801 ) 603 Penton Media, Inc. First Lien Term Loan 4,281 3,655 (626 ) (534 ) Issuer Legacy Cabinets, Inc. Targus Holdings, Inc. Saratoga CLO Changes in net assets resulting from operations For the fiscal years ended February 28, FINANCIAL CONDITION, LIQUIDITY AND CAPITAL RESOURCES We intend to continue to generate cash primarily from cash flows from operations, including interest earned from our investments in debt in middle market companies, interest earned from the temporary investment of cash in U.S. government securities and other high-quality debt investments that mature in one year or less, future borrowings and future offerings of securities. Although we expect to fund the growth of our investment portfolio through the net proceeds from SBA debenture drawdowns and future equity offerings, including our dividend reinvestment plan (“DRIP”), and issuances of senior securities or future borrowings, to the extent permitted by the 1940 Act, we cannot assure you that our plans to raise capital will be successful. In this regard, because our common stock has historically traded at a price below our current net asset value per share and we are limited in our ability to sell our common stock at a price below net asset value per share, we have been and may continue to be limited in our ability to raise equity capital. In addition, we intend to distribute to our stockholders substantially all of our taxable income in order to satisfy the distribution requirement applicable to RICs under Also, as a BDC, we generally are required to meet a coverage ratio of total assets, less liabilities and indebtedness not represented by senior securities, to total senior securities, which include all of our borrowings and any outstanding preferred stock, of at least Consequently, we may not have the funds or the ability to fund new investments, to make additional investments in our portfolio companies, to fund our unfunded commitments to portfolio companies or to repay borrowings. Also, the illiquidity of our portfolio investments may make it difficult for us to sell these investments when desired and, if we are required to sell these investments, we may realize significantly less than their recorded value. Madison revolving credit facility Below is a summary of the terms of the senior secured revolving credit facility we entered into with Madison Capital Funding LLC (the “Credit Facility”) on June 30, 2010. Availability.The Company can draw up to the lesser of (i) $40.0 million (the “Facility Amount”) and (ii) the product of the applicable advance rate (which varies from 50.0% to 75.0% depending on the type of loan asset) and the value, determined in accordance with the Credit Facility (the “Adjusted Borrowing Value”), of certain “eligible” loan assets pledged as security for the loan (the “Borrowing Base”), in each case less (a) the amount of any undrawn funding commitments the Company has under any loan asset and which are not covered by amounts in the Unfunded Exposure Account referred to below (the “Unfunded Exposure Amount”) and (b) outstanding borrowings. Each loan asset held by the Company as of the date on which the Credit Facility was closed was valued as of that date and each loan asset that the Company acquires after such date will be valued at the lowest of its fair value, its face value (excluding accrued interest) and the purchase price paid for such loan asset. Adjustments to the value of a loan asset will be made to reflect, among other things, changes in its fair value, a default by the obligor on the loan asset, insolvency of the obligor, acceleration of the loan asset, and certain modifications to the terms of the loan asset. The Credit Facility contains limitations on the type of loan assets that are “eligible” to be included in the Borrowing Base and as to the concentration level of certain categories of loan assets in the Borrowing Base such as restrictions on geographic and industry concentrations, asset size and quality, payment frequency, status and terms, average life, and collateral interests. In addition, if an asset is to remain an “eligible” loan asset, the Company may not make changes to the payment, amortization, collateral and certain other terms of the loan assets without the consent of the administrative agent that will either result in subordination of the loan asset or be materially adverse to the lenders. Collateral.The Credit Facility is secured by substantially all of the assets of the Company (other than assets held by our SBIC subsidiary) and includes the subordinated notes (“CLO Notes”) issued by Saratoga CLO and the Company’s rights under the CLO Management Agreement (as defined below). Interest Rate and Fees. Under the Credit Facility, funds are borrowed from or through certain lenders at the greater of the prevailing LIBOR rate and 2.00%, plus an applicable margin of 5.50%. At the Company’s option, funds may be borrowed based on an alternative base rate, which in no event will be less than 3.00%, and the applicable margin over such alternative base rate is 4.50%. In addition, the Company pays the lenders a commitment fee of 0.75% per year on the unused amount of the Credit Facility for the duration of the Revolving Period (defined below). Accrued interest and commitment fees are payable monthly. The Company was also obligated to pay certain other fees to the lenders in connection with the closing of the Credit Facility. Revolving Period and Maturity Date. The Company may make and repay borrowings under the Credit Facility for a period of three years following the closing of the Credit Facility (the “Revolving Period”). The Revolving Period may be terminated at an earlier time by the Company or, upon the occurrence of an event of default, by action of the lenders or automatically. All borrowings and other amounts payable under the Credit Facility are due and payable in full five years after the end of the Revolving Period. Collateral Tests. It is a condition precedent to any borrowing under the Credit Facility that the principal amount outstanding under the Credit Facility, after giving effect to the proposed borrowings, not exceed the lesser of the Borrowing Base or the Facility Amount (the “Borrowing Base Test”). In addition to satisfying the Borrowing Base Test, the following tests must also be satisfied (together with Borrowing Base Test, the “Collateral Tests”): The Credit Facility also requires payment of outstanding borrowings or replacement of pledged loan assets upon the Company’s breach of its representation and warranty that pledged loan assets included in the Borrowing Base are “eligible” loan assets. Such payments or replacements must equal the lower of the amount by which the Borrowing Base is overstated as a result of such breach or any deficiency under the Collateral Tests at the time of repayment or replacement. Compliance with the Collateral Tests is also a condition to the discretionary sale of pledged loan assets by the Company. Priority of Payments. During the Revolving Period, the priority of payments provisions of the Credit Facility require, after payment of specified fees and expenses and any necessary funding of the Unfunded Exposure Account, that collections of principal from the loan assets and, to the extent that these are insufficient, collections of interest from the loan assets, be applied on each payment date to payment of outstanding borrowings if the Borrowing Base Test, the Overcollateralization Ratio and the Interest Coverage Ratio would not otherwise be met. Similarly, following termination of the Revolving Period, collections of interest are required to be applied, after payment of certain fees and expenses, to cure any deficiencies in the Borrowing Base Test, the Interest Coverage Ratio and the Overcollateralization Ratio as of the relevant payment date. Reserve Account. The Credit Facility requires the Company to set aside an amount equal to the sum of accrued interest, commitment fees and administrative agent fees due and payable on the next succeeding three payment dates (or corresponding to three payment periods). If for any monthly period during which fees and other payments accrue, the aggregate Adjusted Borrowing Value of “eligible” pledged loan assets which do not pay cash interest at least quarterly exceeds 15.0% of the aggregate Adjusted Borrowing Value of “eligible” pledged loan assets, the Company is required to set aside such interest and fees due and payable on the next succeeding six payment dates. Amounts in the reserve account can be applied solely to the payment of administrative agent fees, commitment fees, accrued and unpaid interest and any breakage costs payable to the lenders. Unfunded Exposure Account. With respect to revolver or delayed draw loan assets, the Company is required to set aside in a designated account (the “Unfunded Exposure Account”) 100.0% of its outstanding and undrawn funding commitments with respect to such loan assets. The Unfunded Exposure Account is funded at the time the Company acquires a revolver or delayed draw loan asset and requests a related borrowing under the Credit Facility. The Unfunded Exposure Account is funded through a combination of proceeds of the requested borrowing and other Company funds, and if for any reason such amounts are insufficient, through application of the priority of payment provisions described above. Operating Expenses. The priority of payments provision of the Credit Facility provides for the payment of certain operating expenses of the Company out of collections on principal and interest during the Revolving Period and out of collections on interest following the termination of the Revolving Period in accordance with the priority established in such provision. The operating expenses payable pursuant to the priority of payment provisions is limited to $350,000 for each monthly payment date or $2.5 million for the immediately preceding period of twelve consecutive monthly payment dates. This ceiling can be increased by the lesser of 5.0% or the percentage increase in the fair market value of all the Company’s assets only on the first monthly payment date to occur after eachone-year anniversary following the closing of the Credit Facility. Upon the occurrence of a Manager Event (described below), the consent of the administrative agent is required in order to pay operating expenses through the priority of payments provision. Events of Default. The Credit Facility contains certain negative covenants, customary representations and warranties and affirmative covenants and events of default. The Credit Facility does not contain grace periods for breach by the Company of certain covenants, including, without limitation, preservation of existence, negative pledge, change of name or jurisdiction and separate legal entity status of the Company covenants and certain other customary covenants. Other events of default under the Credit Facility include, among other things, the following: Conditions to Acquisitions and Pledges of Loan Assets. The Credit Facility imposes certain additional conditions to the acquisition and pledge of additional loan assets. Among other things, the Company may not acquire additional loan assets without the prior written consent of the administrative agent until such time that the administrative agent indicates in writing its satisfaction with Saratoga Investment Advisors’ policies, personnel and processes relating to the loan assets. Fees and Expenses. The Company paid certain fees and reimbursed Madison Capital Funding LLC for the aggregate amount of all documented,out-of-pocket costs and expenses, including the reasonable fees and expenses of lawyers, incurred by Madison Capital Funding LLC in connection with the Credit Facility and the carrying out of any and all acts contemplated thereunder up to and as of the date of closing of the stock purchase transaction with Saratoga Investment Advisors and certain of its affiliates. These amounts totaled $2.0 million. On February 24, 2012, we amended our senior secured revolving credit facility with Madison Capital Funding LLC to, among other things: On September 17, 2014, we entered into a second amendment to the Revolving Facility with Madison Capital Funding LLC to, among other things: As of February 28, Our asset coverage ratio, as defined in the 1940 Act, was 29, 2016. SBA-guaranteed debentures In addition, we, through a wholly-owned subsidiary, sought and obtained a license from the SBA to operate an SBIC. In this regard, on March 28, 2012, our wholly-owned subsidiary, Saratoga Investment Corp. SBIC, LP, received a license from the SBA to operate as an SBIC under Section 301(c) of the Small Business Investment Act of 1958. SBICs are designated to stimulate the flow of private equity capital to eligible small businesses. Under SBA regulations, SBICs may make loans to eligible small businesses and invest in the equity securities of small businesses. The SBIC license allows our SBIC subsidiary to obtain leverage by issuingSBA-guaranteed debentures.SBA-guaranteed debentures arenon-recourse, interest only debentures with interest payable semi-annually and have a ten year maturity. The principal amount ofSBA-guaranteed debentures is not required to be paid prior to maturity but may be prepaid at any time without penalty. The interest rate ofSBA-guaranteed debentures is fixed on a semi-annual basis at a market-driven spread over U.S. Treasury Notes with10-year maturities. SBA regulations currently limit the amount that our SBIC subsidiary may borrow to a maximum of We received exemptive relief from the On April 2, 2015, the SBA issued a “green light” letter inviting the Company to continue our application process to obtain a license to form and operate its second SBIC subsidiary. On September 27, 2016, the SBA informed us that as part of their continued review of our application for a second license, and in order to ensure that they were reviewing the most current information available, we would need to update all previously submitted materials and invited us to reapply. As a result of this request, with which we are in the process of complying, the existing “green light” letter that the SBA issued to us has expired. If approved in the future, a second SBIC license would provide us an incremental source of long-term capital by permitting us to issue up to $150.0 million of additionalSBA-guaranteed debentures in addition to the $150.0 million already approved under the first license. Unsecured notes In May 2013, we issued $48.3 million in aggregate principal amount of our The 2020 Notes were redeemed in full on January 13, 2017 and are no longer listed on the NYSE. On May 29, 2015, we entered into a Debt Distribution Agreement with Ladenburg Thalmann & Co. through which we may offer for sale, from time to time, up to $20.0 million in aggregate principal amount of the 2020 Notes through an ATM offering. As of February 28, 2017, the Company sold 539,725 bonds with a principal of $13,493,125 at an average price of $25.31 for aggregate net proceeds of $13,385,766 (net of transaction costs). On December 21, 2016, we issued $74.5 million in aggregate principal amount of our 2023 Notes for net proceeds of $71.7 million after deducting underwriting commissions of approximately $2.3 million and offering costs of approximately $0.5 million. The issuance included the exercise of substantially all of the underwriters’ option to purchase an additional $9.8 million aggregate principal amount of 2023 Notes within 30 days. Interest on the 2023 Notes is paid quarterly in arrears on March 15, June 15, September 15 and December 15, at a rate of 6.75% per year, beginning March 30, 2017. The 2023 Notes mature on December 30, 2023, and commencing December 21, 2019, may be redeemed in whole or in part at any time or from time to time at our option. The net proceeds from the offering were used to repay all of the outstanding indebtedness under the 2020 Notes on January 13, 2017, which amounts to $61.8 million, and for general corporate purposes in accordance with our investment objective and strategies. The 2020 Notes were redeemed in full on January 13, 2017. The 2023 Notes are listed on the NYSE under the trading symbol “SAB” with a par value of $25.00 per share. In connection with the issuance of the 2023 Notes, we agreed to the following covenants for the period of time during which the notes are outstanding: At February 28, Cash and cash equivalents Cash and cash equivalents, reserve accounts Syndicated loans First lien term loans Second lien term loans Structured finance securities Equity interests Total On February 28, 2017, our board of directors declared a dividend of $0.46 per share, which was paid on March 28, 2017, to common stockholders of record as of March 15, 2017. Shareholders had the option to receive payment of the dividend in cash, or receive shares of common stock, pursuant our DRIP. Based on shareholder elections, the dividend consisted of approximately $2.0 million in cash and 29,096 newly issued shares of common stock, or 0.5% of our outstanding common stock prior to the dividend payment. The number of shares of common stock comprising the stock portion was calculated based on a price of $21.38 per share, which equaled the volume weighted average trading price per share of the common stock on March 15, 16, 17, 20, 21, 22, 23, 24, 27 and 28, 2017. At February 28, At February 28, Fair Value Percent Fair Value Percent ($ in thousands) Cash and cash equivalents $ 3,294 1.6 % $ 149 0.1 % Cash and cash equivalents, securitization accounts 3,293 1.6 12,086 7.2 Middle market loans 32,390 15.2 — — First lien term loans 80,246 37.8 83,792 50.1 Second lien term loans 27,804 13.1 9,571 5.7 Senior secured notes 30,032 14.1 23,305 13.9 Unsecured notes 5,471 2.6 4,874 2.9 Structured finance securities 19,570 9.2 25,517 15.3 Equity Interest 10,332 4.8 8,021 4.8 Total $ 212,432 100.0 % $ 167,315 100.0 % On January 12, 2017, our board of directors declared a dividend of $0.45 per share, which was paid on February 9, 2017, to common stockholders of record as of January 31, 2017. Shareholders had the option to receive payment of the dividend in cash, or receive shares of common stock, pursuant our DRIP. Based on shareholder elections, the dividend consisted of approximately $1.6 million in cash and 50,453 newly issued shares of common stock, or 0.9% of our outstanding common stock prior to the dividend payment. The number of shares of common stock comprising the stock portion was calculated based on a price of $20.25 per share, which equaled the volume weighted average trading price per share of the common stock on January 27, 30, 31 and February 1, 2, 3, 6, 7, 8 and 9, 2017. On October 5, 2016, our board of directors declared a dividend of $0.44 per share, which was paid on November 9, 2016, to common stockholders of record as of October 31, 2016. Shareholders had the option to receive payment of the dividend in cash, or receive shares of common stock, pursuant our DRIP. Based on shareholder elections, the dividend consisted of approximately $1.5 million in cash and 58,548 newly issued shares of common stock, or 1.0% of our outstanding common stock prior to the dividend payment. The number of shares of common stock comprising the stock portion was calculated based on a price of $17.12 per share, which equaled the volume weighted average trading price per share of the common stock on October 27, 28, 31 and November 1, 2, 3, 4, 7, 8 and 9, 2016. On August 8, 2016, our board of directors declared a special dividend of $0.20 per share, which was paid on September 5, 2016, to common stockholders of record as of August 24, 2016. Shareholders had the option to receive payment of the dividend in cash, or receive shares of common stock, pursuant our DRIP. Based on shareholder elections, the dividend consisted of approximately $0.7 million in cash and 24,786 newly issued shares of common stock, or 0.4% of our outstanding common stock prior to the dividend payment. The number of shares of common stock comprising the stock portion was calculated based on a price of $17.06 per share, which equaled the volume weighted average trading price per share of the common stock on August 22, 23, 24, 25, 26, 29, 30, 31 and September 1 and 2, 2016. On July 7, 2016, our board of directors declared a dividend of $0.43 per share, which was paid on August 9, 2016, to common stockholders of record as of July 29, 2016. Shareholders had the option to receive payment of the dividend in cash, or receive shares of common stock, pursuant our DRIP. Based on shareholder elections, the dividend consisted of approximately $1.5 million in cash and 58,167 newly issued shares of common stock, or 1.0% of our outstanding common stock prior to the dividend payment. The number of shares of common stock comprising the stock portion was calculated based on a price of $16.32 per share, which equaled the volume weighted average trading price per share of the common stock on July 27, 28, 29 and August 1, 2, 3, 4, 5, 8 and 9, 2016. On March 31, 2016, our board of directors declared a dividend of $0.41 per share, which was paid on April 27, 2016, to common stockholders of record as of April 15, 2016. Shareholders had the option to receive payment of the dividend in cash, or receive shares of common stock, pursuant our DRIP. Based on shareholder elections, the dividend consisted of approximately $1.5 million in cash and 56,728 newly issued shares of common stock, or 1.0% of our outstanding common stock prior to the dividend payment. The number of shares of common stock comprising the stock portion was calculated based on a price of $15.43 per share, which equaled the volume weighted average trading price per share of the common stock on April 14, 15, 18, 19, 20, 21, 22, 25, 26 and 27, 2016. On January 12, 2016, our board of directors declared a dividend of $0.40 per share, which was paid on February 29, 2016, to common stockholders of record as of February 1, 2016. Shareholders had the option to receive payment of the dividend in cash, or receive shares of common stock, pursuant our DRIP. Based on shareholder elections, the dividend consisted of approximately $1.4 million in cash and 66,765 newly issued shares of common stock, or 1.2% of our outstanding common stock prior to the dividend payment. The number of shares of common stock comprising the stock portion was calculated based on a price of $13.11 per share, which equaled the volume weighted average trading price per share of the common stock on February 16, 17, 18, 19, 22, 23, 24, 25, 26 and 29, 2016. On October 7, 2015, our board of directors declared a dividend of $0.36 per share, which was paid on November 30, 2015, to common stockholders of record as of November 2, 2015. Shareholders had the option to receive payment of the dividend in cash, or receive shares of common stock, pursuant our DRIP. Based on shareholder elections, the dividend consisted of approximately $1.1 million in cash and 61,029 newly issued shares of common stock, or 1.1% of our outstanding common stock prior to the dividend payment. The number of shares of common stock comprising the stock portion was calculated based on a price of $14.53 per share, which equaled the volume weighted average trading price per share of the common stock on November 16, 17, 18, 19, 20, 23, 24, 25, 27 and 30, 2015. On July 8, 2015, our board of directors declared a dividend of $0.33 per share, which was paid on August 31, 2015, to common stockholders of record as of August 3, 2015. Shareholders had the option to receive payment of the dividend in cash, or receive shares of common stock, pursuant our DRIP. Based on shareholder elections, the dividend consisted of approximately $1.1 million in cash and 47,861 newly issued shares of common stock, or 0.9% of our outstanding common stock prior to the dividend payment. The number of shares of common stock comprising the stock portion was calculated based on a price of $15.28 per share, which equaled the volume weighted average trading price per share of the common stock on August 18, 19, 20, 21, 24, 25, 26, 27, 28 and 31, 2015. On May 14, 2015, our board of directors declared a special dividend of $1.00 per share, which was paid on June 5, 2015, to common stockholders of record on as of May 26, 2015. Shareholders had the option to receive payment of the dividend in cash, or receive shares of common stock, pursuant our DRIP. Based on shareholder elections, the dividend consisted of approximately $3.4 million in cash and 126,230 newly issued shares of common stock, or 2.3% of our outstanding common stock prior to the dividend payment. The number of shares of common stock comprising the stock portion was calculated based on a price of $16.47 per share, which equaled the volume weighted average trading price per share of the common stock on May 22, 26, 27, 28, 29 and June 1, 2, 3, 4, and 5, 2015. On April 9, 2015, our board of directors declared a dividend of $0.27 per share, which was paid on May 29, 2015, to common stockholders of record as of May 4, 2015. Shareholders had the option to receive payment of the dividend in cash, or receive shares of common stock, pursuant our DRIP. Based on shareholder elections, the dividend consisted of approximately $0.9 million in cash and 33,766 newly issued shares of common stock, or 0.6% of our outstanding common stock prior to the dividend payment. The number of shares of common stock comprising the stock portion was calculated based on a price of $16.78 per share, which equaled the volume weighted average trading price per share of the common stock on May 15, 18, 19, 20, 21, 22, 26, 27, 28 and 29, 2015. On September 24, 2014, our board of directors declared a dividend of $0.22 per share, which was paid on February 27, 2015. Shareholders have the option to receive payment of the dividend in cash, or receive shares of common stock, pursuant our DRIP. Based on shareholder elections, the dividend consisted of approximately $0.8 million in cash and 26,858 newly issued shares of common stock, or 0.5% of our outstanding common stock prior to the dividend payment. The number of shares of common stock comprising the stock portion was calculated based on a price of $14.97 per share, which equaled the volume weighted average trading price per share of the common stock on February 13, 17, 18, 19, 20, 23, 24, 25, 26 and 27, 2015. Also on September 24, 2014, our board of directors declared a dividend of $0.18 per share, which was paid on November 28, 2014. Shareholders had the option to receive payment of the dividend in cash, or receive shares of common stock pursuant to our DRIP. Based on shareholder elections, the dividend consisted of approximately $0.6 million in cash and 22,283 newly issued shares of common stock, or 0.4% of our outstanding common stock prior to the dividend payment. The number of shares of common stock comprising the stock portion was calculated based on a price of $14.37 per share, which equaled the volume weighted average trading price per share of the common stock on November 14, 17, 18, 19, 20, 21, 24, 25, 26 and 28, 2014. On October 30, 2013, our board of directors declared a dividend of $2.65 per share, This dividend was declared in reliance on certain private letter rulings issued by the IRS concluding that a RIC may treat a distribution of its own stock as fulfilling its RIC distribution requirements if each stockholder may elect to receive his or her entire distribution in either cash or stock of the RIC subject to a limitation on the aggregate amount of cash to be distributed to all stockholders, which limitation must be at least 20.0% of the aggregate declared distribution. Based on shareholder elections, the dividend consisted of approximately $2.5 million in cash and 649,500 shares of common stock, or 13.7% of our outstanding common stock prior to the dividend payment. The amount of cash elected to be received was greater than the cash limit of 20.0% of the aggregate dividend amount, thus resulting in the payment of a combination of cash and stock to shareholders who elected to receive cash. The number of shares of common stock comprising the stock portion was calculated based on a price of $15.439 per share, which equaled the volume weighted average trading price per share of the common stock on December 11, 13, and 16, 2013. On November 9, 2012, our board of directors declared a dividend of $4.25 per share, Based on shareholder elections, the dividend consisted of $3.3 million in cash and 853,455 shares of common stock, or 22.0% of our outstanding common stock prior to the dividend payment. The amount of cash elected to be received was greater than the cash limit of 20.0% of the aggregate dividend amount, thus resulting in the payment of a combination of cash and stock to shareholders who elected to receive cash. The number of shares of common stock comprising the stock portion was calculated based on a price of $15.444 per share, which equaled the volume weighted average trading price per share of the common stock on December 14, 17 and 19, 2012. On November 15, 2011, our board of directors declared a dividend of $3.00 per share, Based on shareholder elections, the dividend consisted of $2.0 million in cash and 599,584 shares of common stock, or 18.0% of our outstanding common stock prior to the dividend payment. The amount of cash elected to be received was greater than the cash limit of 20.0% of the aggregate dividend amount, thus resulting in the payment of a combination of cash and stock to shareholders who elected to receive cash. The number of shares of common stock comprising the stock portion was calculated based on a price of $13.117067 per share, which equaled the volume weighted average trading price per share of the common stock on December 20, 21 and 22, 2011. On November 12, 2010, our board of directors declared a dividend of $4.40 per share to shareholders payable in cash or shares of our common stock, in accordance with the provisions of the IRS Revenue Procedure2010-12, which allows a publicly-traded regulated investment company to satisfy its distribution requirements with a distribution paid partly in common stock provided that at least 10.0% of the distribution is payable in cash. The dividend was paid on December 29, 2010 to common shareholders of record on November 19, 2010. Based on shareholder elections, the dividend consisted of $1.2 million in cash and 596,235 shares of common stock, or 22.0% of our outstanding common stock prior to the dividend payment. The amount of cash elected to be received was greater than the cash limit of 10.0% of the aggregate dividend amount, thus resulting in the payment of a combination of cash and stock to shareholders who elected to receive cash. The number of shares of common stock comprising the stock portion was calculated based on a price of $17.8049 per share, which equaled the volume weighted average trading price per share of the common stock on December 20, 21 and 22, 2010. On November 13, 2009, our board of directors declared a dividend of $18.25 per share, Based on shareholder elections, the dividend consisted of $2.1 million in cash and We cannot provide any assurance that these measures will provide sufficient sources of liquidity to support our operations and growth. Contractual obligations The following table shows our payment obligations for repayment of debt and other contractual obligations at February 28, Payment Due by Period Total Less Than 1 - 3 3 - 5 More Than ($ in thousands) Long-Term Debt Obligations $ 98,300 $ — $ — $ — $ 98,300 Long-Term Debt Obligations Off-balance sheet arrangements The Company’soff-balance sheet arrangements consisted of A summary of the composition of the unfunded commitments as of February 28, 2017 and February 29, 2016 is shown in the table below (dollars in thousands): Avionte Holdings, LLC GreyHeller LLC Identity Automation Systems Total Recent Developments On March 16, 2017, we entered into an equity distribution agreement with Ladenburg Thalmann & Co. Inc., through which we may offer for sale, from time to time, up to $30.0 million of our common stock through an ATM offering. As of May 15, 2017, the Company sold 60,679 shares for gross proceeds of $1.4 million at an average price of $22.49 for aggregate net proceeds of $1.3 million (net of transaction costs). Our business activities contain elements of market risk. We consider our principal market risk to be the fluctuation in interest rates. Managing this risk is essential to our business. Accordingly, we have systems and procedures designed to identify and analyze our risks, to establish appropriate policies and thresholds and to continually monitor this risk and thresholds by means of administrative and information technology systems and other policies and processes. Interest rate risk is defined as the sensitivity of our current and future earnings to interest rate volatility, including relative changes in different interest rates, variability of spread relationships, the difference inre-pricing intervals between our assets and liabilities and the effect that interest rates may have on our cash flows. Changes in the general level of interest rates can affect our net interest income, which is the difference between the interest income earned on interest earning assets and our interest expense incurred in connection with our interest bearing debt and liabilities. Changes in interest rates can also affect, among other things, our ability to acquire leveraged loans, high yield bonds and other debt investments and the value of our investment portfolio. Our investment income is affected by fluctuations in various interest rates, including LIBOR and the prime rate. A large portion of our portfolio is, and we expect will continue to be, comprised of floating rate investments that utilize LIBOR. Our interest expense is affected by fluctuations in which none is floating. We have analyzed the potential impact of changes in interest rates on interest income from income. Although management believes that this measure is indicative of our sensitivity to interest rate changes, it does not adjust for potential changes in credit quality, size and composition of the assets on the ITEM 8. CONSOLIDATED FINANCIAL STATEMENTS AND SUPPLEMENTARY DATA Our consolidated financial statements are annexed to this Annual Report beginning onpage F-1. In addition, the Financial Statements of Saratoga Investment Corp. CLO2013-1, Ltd. are annexed to this Annual Report beginning onpage S-1. ITEM 9. CHANGES IN AND DISAGREEMENTS WITH ACCOUNTANTS ON ACCOUNTING AND FINANCIAL DISCLOSURE None. ITEM 9A. CONTROLS AND PROCEDURES Evaluation of disclosure controls and procedures Management’s annual report on internal control over financial reporting The Company’s management is responsible for establishing and maintaining adequate internal control over financial reporting (as defined Under the supervision and with 2017. Changes in internal controls over financial reporting There have been no changes in the Company’s internal control over financial reporting (as defined inRule 13a-15(f) of Exchange Act) that occurred during our most recently completed fiscal None. PART III ITEM 10. DIRECTORS, EXECUTIVE OFFICERS AND CORPORATE GOVERNANCE Director and Executive Officer Information Directors The following table sets forth the names, ages and positions held by each of our directors, followed by a brief biography of each individual, including the business experience of each individual during the past five years and the specific qualifications that led to the conclusion that each individual should serve as a director. Name Age Position Director Term Interested Directors Christian L. Oberbeck 54 Chairman of the Board and Chief Executive Officer 2010 2015 Michael J. Grisius 50 President and Director 2011 2014 Independent Directors Steven M. Looney 64 Director 2007 2016 Charles S. Whitman III 72 Director 2007 2016 G. Cabell Williams 60 Director 2007 2014 Name Position Interested Directors Christian L. Oberbeck Michael J. Grisius Independent Directors Steven M. Looney Charles S. Whitman III G. Cabell Williams Christian L. Oberbeck—Mr. Oberbeck has over Prior to assuming management responsibility for Saratoga Partners in 2008, Mr. Oberbeck hasco-managed Saratoga Partners since 1995, when he joined Dillon Read and Saratoga Partners from Castle Harlan, Inc., a corporate buyout firm which he had joined at its founding in 1987 and was a Managing Director, leading successful investments in manufacturing and financial services companies. Prior to that, he worked in the Corporate Development Group of Arthur Young and in corporate finance at Blyth Eastman Paine Webber. Mr. Oberbeck has been a director of numerous middle market companies. Mr. Oberbeck graduated from Brown University in 1982 with a BS in Physics and a BA in Mathematics. In 1985, he earned an MBA from Columbia University. Mr. Oberbeck’s qualifications as a director include his extensive experience in the investment and finance industry, as well as his intimate knowledge of the Company’s operations, gained through his service as an executive officer. Michael J. Grisius—Mr. Grisius has over Prior to joining Saratoga Investment Advisors, Mr. Grisius served as Managing Director at Allied Capital Corporation, where he was an investment professional for 16 years. At Allied Capital Corporation, Mr. Grisius held several senior positions includingco-head of Mezzanine Finance and member of its Management Committee and its Investment Committee. In 2008, Mr. Grisius was appointedco-chairman of the Allied Capital Corporation’s Investment Committee. He also had responsibility for structuring and managing Unitranche Fund, LLC. During his tenure at Allied, Mr. Grisius built and led teams that made investments in subordinated debt, control equity and real estate mortgage debt. Mr. Grisius has served on the board of directors of numerous middle market companies. Prior to joining Allied Capital Corp., Mr. Grisius worked in leveraged finance at Chemical Bank from 1989 to 1992 and held senior accountant and consultant positions with KPMG LLP from 1985 to 1988. Mr. Grisius graduated with a BS from Georgetown University in 1985 and earned an MBA from Cornell University’s Johnson Graduate School of Management in 1990. Mr. Grisius’ qualifications as a director include his broad experience in leverage finance, investment management, private equity and financial services. Steven M. Looney—Mr. Looney is a Managing Director of Peale Davies & Co. Inc., a consulting firm with particular expertise in financial process and IT outsourcing, and is a CPA and an attorney. Mr. Looney also serves as a consultant and director to numerous companies in the healthcare, manufacturing and technology services Charles S. Whitman III—Mr. Whitman is senior counsel (retired) at Davis Polk & Wardwell LLP. Mr. Whitman was a partner in Davis Polk’s Corporate Department for 28 years, representing clients in a broad range of corporate finance matters, including shelf registrations, securities compliance for financial institutions, foreign asset privatizations, and mergers and acquisitions. From 1971 to 1973, Mr. Whitman served as Executive Assistant to three successive Chairmen of the SEC. Mr. Whitman graduated from Harvard College and graduated magna cum laude from Harvard Law School with a LL.B. Mr. Whitman also received an LL.M. from Cambridge University in England. Mr. Whitman’s qualifications as director include his 28 years of experience representing clients, including AT&T, Exxon Mobil, General Motors and BP, in securities matters as a partner in Davis Polk’s corporate department. G. Cabell Williams—Mr. Williams has served as the Managing General Partner of Williams and Gallagher, a private equity partnership located in Chevy Chase, Maryland since 2004. Executive Officer Who Is Not The following table sets forth the name, age and position held by our executive officer who is not also a director, followed by a brief biography, including the business experience during the past five years. Name Position Executive Officer Henri J. Steenkamp Henri J. Steenkamp—Mr. Steenkamp, Before joining MF Global, Mr. Steenkamp spent eight years with PricewaterhouseCoopers (“PwC”), including four years in Transaction Services in its New York office, managing a variety of capital-raising transactions on a global basis. His focus was also on the SEC registration and public company filing process, including technical accounting. He spent four years with PwC in South Africa, where he served as an auditor primarily for SEC registrants and assisted South African companies as they went public in the U.S. Mr. Steenkamp is a chartered accountant and holds an honors degree in Finance. Section 16(a) Beneficial Ownership Reporting Compliance Section 16(a) of the Securities Exchange Act of 1934 requires our directors and executive officers, and persons who own 10.0% or more of our voting stock, to file reports of ownership and changes in ownership of our equity securities with the SEC. Directors, executive officers and 10.0% or more holders are required by SEC regulations to furnish us with copies of all Section 16(a) forms they file. Based solely on a review of the copies of those forms furnished to us, or written representations that no such forms were required, we believe that our directors, executive officers and 10.0% or more beneficial owners complied with all Section 16(a) filing requirements during the year ended February 28, Code of Business Conduct and Ethics We have adopted a Code of Business Conduct and Ethics If we make any substantive amendment to, or grant a waiver from, a provision of our Code of Business Conduct and Ethics, we will promptly disclose the nature of the amendment or waiver on our website at Nomination of Directors There have been no material changes to the procedures by which stockholders may recommend nominees to our Audit Committee The current members of the audit committee are Steven M. Looney (Chairman), Charles S. Whitman III and G. Cabell Williams. The ITEM 11. EXECUTIVE COMPENSATION Executive Compensation Currently, none of our executive officers are compensated by us. We currently have no employees, and each of our executive officers is also an employee of Saratoga Investment Advisors. Services necessary for our business are provided by individuals who are employees of Saratoga Investment Advisors, pursuant to the terms of the Management Agreement and an administration agreement. Director Compensation Our independent directors receive an annual fee of $40,000. They also receive $2,500 plus reimbursement of reasonableout-of-pocket expenses incurred in connection with attending each board meeting and receive $1,000 plus reimbursement of reasonableout-of-pocket expenses incurred in connection with attending each committee meeting. In addition, the chairman of the audit committee receives an annual fee of $5,000 and the chairman of each other committee receives an annual fee of $2,000 for their additional services in these capacities. In addition, we have purchased directors’ and officers’ liability insurance on behalf of our directors and officers. Independent directors have the option to receive their directors’ fees in the form of our common stock issued at a price per share equal to the greater of net asset value or the market price at the time of payment. No compensation is paid to directors who are “interested persons.” The following table sets forth information concerning total compensation earned by or paid to each of our directors during the fiscal year ended February 28, Name Fees Earned or Total Interested Director Christian L. Oberbeck(1) — — Michael J. Grisius(1) — — Independent Directors Steven M. Looney $ 69,000 $ 69,000 Charles S. Whitman III $ 66,000 $ 66,000 G. Cabell Williams $ 66,000 $ 66,000 Compensation Committee Interlocks and Insider Participation The current members of the compensation committee are G. Cabell Williams (Chairman), Steven M. Looney and Charles S. Whitman III. All of these members are independent directors. The compensation committee is responsible for overseeing the Company’s compensation policies generally and making recommendations to the During fiscal year ITEM 12. SECURITY OWNERSHIP OF CERTAIN BENEFICIAL OWNERS AND MANAGEMENT AND RELATED STOCKHOLDER MATTERS The following table sets forth, as of May The percentage ownership is based on Name of Beneficial Owners Number of Shares of Percent of Interested Directors Christian L. Oberbeck 1,572,329 (1) 29.2 % Michael J. Grisius 34,710 * Executive Officer Henri J. Steenkamp — — Independent Directors Steven M. Looney 1,547 * Charles S. Whitman III 1,833 * G. Cabell Williams 22,409 * All Directors and Executive Officers as a Group 1,632,828 30.4 % Owners of 5% or more of our common stock Black Diamond Capital Management, L.L.C.(2) 505,935 9.4 % Raging Capital Management, LLC(3) 318,077 5.9 % Thomas V. Inglesby(4) 269,549 5.0 % Elizabeth Oberbeck(3) Thomas V. Inglesby Mr. Oberbeck and Mr. Inglesby are affiliates who make up ITEM 13. CERTAIN RELATIONSHIPS AND RELATED TRANSACTIONS, AND DIRECTOR INDEPENDENCE Transactions with Related Persons We have entered into Review, Approval or Ratification of Transactions with Related Persons The Audit Committee of our Director Independence In accordance with rules of the New York Stock Exchange (the “NYSE”), the In order to evaluate the materiality of any such relationship, the Section 303A.00 provides that a director of a BDC shall be considered to be independent if he or she is not an “interested person” of the Company, as defined in Section 2(a)(19) of the 1940 Act. Section 2(a)(19) of the 1940 Act defines an “interested person” to include, among other things, any person who has, or within the last two years had, a material business or professional relationship with the Company. The ITEM 14. PRINCIPAL Independent Registered Public Accounting Firm For the years ended February 28, Fiscal Year Ended Fiscal Year Ended Audit Fees $ 536,600 $ 437,500 Audit Related Fees — — Tax Fees 40,000 37,000 All Other Fees — — Total Fees $ 576,600 $ 474,500 Audit Fees Audit Related Fees Tax Fees All Other Fees Total Fees Audit Fees. Audit fees include fees for services that normally would be provided by the accountant in connection with statutory and regulatory filings or engagements and that generally only the independent accountant can provide. In addition to fees for the audit of our annual consolidated financial statements, the audit of the effectiveness of our internal control over financial reporting and the review of our quarterly consolidated financial statements in accordance with generally accepted auditing standards, this category contains fees for comfort letters, statutory audits, consents, and assistance with and review of documents filed with the SEC. Audit Related Fees. Audit related fees are assurance related services that traditionally are performed by the independent accountant, such as attest services that are not required by statute or regulation. Tax Fees. Tax fees include services in conjunction with preparation of the Company’s tax return. All Other Fees. Fees for other services would include fees for products and services other than the services reported above. It is the policy of the audit committee topre-approve all audit, review or attest engagements and permissiblenon-audit services to be performed by our independent registered public accounting firm. ITEM 15. EXHIBITS, The following documents are filed or incorporated by reference as part of this Annual Report: 1.Consolidated Financial Statements The following consolidated financial statements of the Company are filed herewith: Report of Independent Registered Public Accounting Firm Consolidated Statements of Assets and Liabilities as of February 28, 2017 and February 29, 2016 Consolidated Statements of Operations for the years ended February 28, 2017, February 29, 2016 and February 28, 2015 Consolidated Schedules of Investments as of February 28, 2017 and February 29, 2016 Consolidated Statements of Changes in Net Assets for the years ended February 28, 2017, February 29, 2016 and February 28, 2015 Consolidated Statements of Cash Flows for the years ended February 28, 2017, February 29, 2016 and February 28, 2015 Notes to Consolidated Financial Statements 2.Financial Statement Schedules Reference is made to the Index to Other Financial Statements onpage S-1. 3.Exhibits required to be filed by Item 601 ofRegulation S-K The following exhibits are filed as part of this report or hereby incorporated by reference to exhibits previously filed with the SEC: EXHIBIT INDEX Exhibit Number Description 3.1(a) Articles of Incorporation of Saratoga Investment Corp. (incorporated by reference to Saratoga Investment Corp.’sForm 10-Q for the quarterly period ended May 31, 2007, FileNo. 001-33376). 3.1(b) Articles of Amendment of Saratoga Investment Corp. (incorporated by reference to Saratoga Investment Corp.’s Current Report onForm 8-K filed August 3, 2010). 3.1(c) Articles of Amendment of Saratoga Investment Corp. (incorporated by reference to Saratoga Investment Corp.’s Current Report onForm 8-K filed August 13, 2010). 3.2 Amended and Restated Bylaws of Saratoga Investment Corp. (incorporated by reference to Saratoga Investment Corp.’s Current Report onForm 8-K filed on March 5, 2008). 4.1 Specimen certificate of Saratoga Investment Corp.’s common stock, par value $0.001 per share. (incorporated by reference to Saratoga Investment Corp.’s Registration Statement onForm N-2, FileNo. 333-169135, filed on September 1, 2010). 4.2 Registration Rights Agreement dated July 30, 2010 between GSC Investment Corp., GSC CDO III L.L.C., and the investors party thereto (incorporated by reference to Saratoga Investment Corp.’s Current Report onForm 8-K filed on August 3, 2010). 4.3 4.4 Form of Indenture by and between the Company and U.S. Bank National Association, as trustee (incorporated by reference to Saratoga Investment Corp.’sPre-Effective Amendment No. 1 to the Registration Statement onForm N-2, FileNo. 333-186323 filed April 30, 2013). 4.5 Form of First Supplemental Indenture between the Company and U.S. Bank National Association (incorporated by reference to Saratoga Investment Corp.’sPre-Effective Amendment No. 1 to the Registration Statement onForm N-2, FileNo. 333-186323 filed April 30, 2013). 4.6 Form of Note Form of Global Note (incorporated by reference to Exhibit 4.7 hereto, and Exhibit A therein). 10.2 Custodian Agreement dated March 21, 2007 between GSC Investment LLC and U.S. Bank National Association (incorporated by reference to Saratoga Investment Corp.’sForm 10-Q for the quarterly period ended May 31, 2007). 10.3 Administration Agreement dated July 30, 2010 between GSC Investment Corp. and Saratoga Investment Advisors, LLC (incorporated by reference to Saratoga Investment Corp.’s Current Report onForm 8-K filed on August 3, 2010). 10.4 Trademark License Agreement dated July 30, 2010 between Saratoga Investment Advisors, LLC and GSC Investment Corp. (incorporated by reference to Saratoga Investment Corp.’s Current Report onForm 8-K filed on August 3, 2010). 10.5 Credit, Security and Management Agreement dated July 30, 2010 by and among GSC Investment Funding LLC, Saratoga Investment Corp., Saratoga Investment Advisors, LLC, Madison Capital Funding LLC and U.S. Bank National Association (incorporated by reference to Saratoga Investment Corp.’s Current Report onForm 8-K filed on August 3, 2010). 10.6 Form of Indemnification Agreement between Saratoga Investment Corp. and each officer and director of Saratoga Investment Corp. (incorporated by reference to Amendment No. 2 to Saratoga Investment Corp.’s Registration Statement onForm N-2 filed on January 12, 2007). Exhibit Number Description 10.7 Amendment No. 1 to Credit, Security and Management Agreement dated February 24, 2012 by and among Saratoga Investment Funding LLC, Saratoga Investment Corp., Saratoga Investment Advisors, LLC, Madison Capital Funding LLC and U.S. Bank National Association (incorporated by reference to Saratoga Investment Corp.’s Current Report onForm 8-K filed on February 29, 2012). 10.8 Indenture, dated as of January 22, 2008, among GSC Investment Corp. CLO 2007, Ltd., GSC Investment Corp. CLO 2007, Inc. and U.S. Bank National Association (incorporated by reference to Amended and Restated Collateral Management Agreement, dated October 17, 2013, by and between Saratoga Investment Corp. and Saratoga Investment Corp. CLO2013-1, Ltd. (incorporated by reference to Saratoga Investment Corp.’s Registration Statement onForm N-2, FileNo. 333-196526, filed on December 5, 2014). 31.1* Chief Executive Officer Certification Pursuant toRule 31.2* Chief Financial Officer Certification Pursuant toRule 32.1* Certification pursuant to 18 U.S.C. Section 1350, as adopted pursuant to Section 906 of the Sarbanes-Oxley Act of 2002. ITEM 16. FORM None. Pursuant to the requirements of Section 13 or 15(d) of the Securities Exchange Act of 1934, the registrant has duly caused this report to be signed on its behalf by the undersigned, thereunto duly authorized. Date: May /s/ CHRISTIAN L. OBERBECK /s/ HENRI J. STEENKAMP KNOW ALL PERSONS BY THESE PRESENT, that each person whose signature appears below hereby constitutes and appoints Christian L. Oberbeck and Henri J. Steenkamp, and each of them (with full power to each of them to act alone), his true and lawfulattorneys-in-fact and agents, with full power of substitution and resubstitution, for him and in his name, place, and stead, in any and all capacities, to sign this report and any and all amendments thereto, and to file the same, with the Securities and Exchange Commission, granting unto saidattorneys-in-fact and agents full power and authority to do and perform each and every act and thing requisite and necessary to be done in and about the premises, as fully to all intents and purposes as he might or could do in person, hereby ratifying and confirming all that saidattorneys-in-fact and agents, or their substitute or substitutes, may lawfully do or cause to be done by virtue hereof. Pursuant to the requirements of the Securities Exchange Act of 1934, this report has been signed below by the following persons on behalf of the registrant and in the capacities and on the dates indicated. Signature Title Date /s/ CHRISTIAN L. OBERBECK Chairman of the Board of Directors, Chief Executive Officer (Principal Executive Officer) May Christian L. Oberbeck /s/ MICHAEL J. GRISIUS Member of the Board of Directors May Michael J. Grisius /s/ HENRI J. STEENKAMP May Henri J. Steenkamp /s/ STEVEN M. LOONEY Member of the Board of Directors May Steven M. Looney /s/ CHARLES S. WHITMAN III Member of the Board of Directors May Charles S. Whitman III /s/ G. CABELL WILLIAMS Member of the Board of Directors May Cabell Williams INDEX TO CONSOLIDATED FINANCIAL STATEMENTS Consolidated Schedules of Investments as of February 28, Report of Independent Registered Public Accounting Firm The Board of Directors and Stockholders of Saratoga Investment Corp. We have audited the accompanying consolidated We conducted our audits in accordance with the standards of the Public Company Accounting Oversight Board (United States). Those standards require that we plan and perform the audit to obtain reasonable assurance about whether the financial statements are free of material misstatement. We were not engaged to perform an audit of the In our opinion, the consolidated financial statements referred to above present fairly, in all material respects, the consolidated financial position of Saratoga Investment Corp. at February 28, /s/ Ernst & Young LLP New York, May Saratoga Investment Corp. Consolidated Statements of Assets and Liabilities As of February 28, 2014 February 28, 2013 ASSETS Investments at fair value Non-control/non-affiliate investments (amortized cost of $185,266,607 and $130,465,086, respectively) $ 186,275,106 $ 129,563,428 Control investments (cost of $16,555,808 and $18,944,966 respectively) 19,569,596 25,516,959 Total investments at fair value (amortized cost of $201,822,415 and $149,410,052 respectively) 205,844,702 155,080,387 Cash and cash equivalents 3,293,898 149,025 Cash and cash equivalents, reserve accounts 3,293,113 12,086,142 Interest receivable, (net of reserve of $150,058 and $53,543, respectively) 2,571,853 2,889,358 Deferred debt financing costs, net 4,008,704 2,090,184 Management fee receivable 150,106 215,853 Other assets 14,461 83,407 Receivable from unsettled trades — 1,817,074 Total assets $ 219,176,837 $ 174,411,430 LIABILITIES Revolving credit facility $ — $ 24,300,000 SBA debentures payable 50,000,000 36,000,000 Notes payable 48,300,000 — Management and incentive fees payable 3,856,962 4,509,322 Accounts payable and accrued expenses 824,568 435,038 Interest and debt fees payable 873,135 257,796 Due to manager 398,154 222,513 Total liabilities $ 104,252,819 $ 65,724,669 Commitments and contingencies (See Note 8) NET ASSETS Common stock, par value $.001, 100,000,000 common shares authorized, 5,379,616 and 4,730,116 common shares issued and outstanding, respectively $ 5,380 $ 4,730 Capital in excess of par value 184,851,154 174,824,076 Distribution in excess of net investment income (29,627,578 ) (24,522,951 ) Accumulated net realized loss from investments and derivatives (44,327,225 ) (47,289,427 ) Net unrealized appreciation on investments and derivatives 4,022,287 5,670,333 Total Net Assets 114,924,018 108,686,761 Total liabilities and Net Assets $ 219,176,837 $ 174,411,430 NET ASSET VALUE PER SHARE $ 21.36 $ 22.98 ASSETS Investments at fair value Non-control/Non-affiliate investments (amortized cost of $251,198,896 and $268,145,090, respectively) Control investments (cost of $49,283,536 and $13,030,751, respectively) Total investments at fair value (amortized cost of $300,482,432 and $281,175,841, respectively) Cash and cash equivalents Cash and cash equivalents, reserve accounts Interest receivable (net of reserve of $157,560 and $728,519, respectively) Management fee receivable Other assets Receivable from unsettled trades Total assets LIABILITIES Revolving credit facility Deferred debt financing costs, revolving credit facility SBA debentures payable Deferred debt financing costs, SBA debentures payable Notes payable Deferred debt financing costs, notes payable Dividend payable Base management and incentive fees payable Accounts payable and accrued expenses Interest and debt fees payable Payable for repurchases of common stock Directors fees payable Due to manager Total liabilities Commitments and contingencies (See Note 8) NET ASSETS Common stock, par value $.001, 100,000,000 common shares authorized, 5,794,600 and 5,672,227 common shares issued and outstanding, respectively Capital in excess of par value Distribution in excess of net investment income Accumulated net realized loss from investments and derivatives Accumulated net unrealized appreciation (depreciation) on investments and derivatives Total net assets Total liabilities and net assets NET ASSET VALUE PER SHARE See accompanying notes to consolidated financial statements. Saratoga Investment Corp. Consolidated Statements of Operations For the year ended For the year ended For the year ended INVESTMENT INCOME Interest from investments Non-control/Non-affiliate investments $ 15,832,083 $ 9,176,156 $ 5,613,705 Payment-in-kind interest income from Non-control/Non-affiliate investments 936,208 1,062,687 1,442,004 Control investments 3,410,868 4,205,509 4,198,007 Total interest income 20,179,159 14,444,352 11,253,716 Interest from cash and cash equivalents 7,932 5,956 7,865 Management fee income 1,775,141 2,000,072 2,011,516 Other income 931,513 556,427 238,579 Total investment income 22,893,745 17,006,807 13,511,676 EXPENSES Interest and debt financing expenses 6,083,891 2,540,413 1,297,985 Base management fees 3,326,879 2,107,378 1,617,496 Professional fees 1,211,836 1,190,587 1,455,380 Administrator expenses 1,000,000 1,000,000 1,000,000 Incentive management fees 691,492 2,044,788 1,257,087 Insurance 442,977 516,121 578,746 Directors fees and expenses 204,607 206,705 208,851 General & administrative 789,208 368,815 389,825 Other expense 21,207 4,434 5,445 Total expenses 13,772,097 9,979,241 7,810,815 NET INVESTMENT INCOME 9,121,648 7,027,566 5,700,861 REALIZED AND UNREALIZED GAIN (LOSS) ON INVESTMENTS: Net realized gain (loss) from investments 1,270,765 561,700 (12,185,997 ) Net realized loss from derivatives — (131,000 ) — Net unrealized appreciation (depreciation) on investments (1,648,046 ) 7,012,726 19,776,469 Net unrealized appreciation (depreciation) on derivatives — 130,925 (16,190 ) Net gain (loss) on investments (377,281 ) 7,574,351 7,574,282 NET INCREASE IN NET ASSETS RESULTING FROM OPERATIONS $ 8,744,367 $ 14,601,917 $ 13,275,143 WEIGHTED AVERAGE - BASIC AND DILUTED EARNINGS PER COMMON SHARE $ 1.78 $ 3.55 $ 3.87 WEIGHTED AVERAGE COMMON STOCK OUTSTANDING - BASIC AND DILUTED 4,920,517 4,110,484 3,434,345 INVESTMENT INCOME Interest from investments Non-control/Non-affiliate investments Payment-in-kind interest income from Non-control/Non-affiliate investments Control investments Total interest income Interest from cash and cash equivalents Management fee income Other income Total investment income OPERATING EXPENSES Interest and debt financing expenses Base management fees Professional fees Administrator expenses Incentive management fees Insurance Directors fees and expenses General & administrative Excise tax expense Other expense Total operating expenses Loss on extinguishment of debt NET INVESTMENT INCOME REALIZED AND UNREALIZED GAIN (LOSS) ON INVESTMENTS: Net realized gain from investments Net unrealized appreciation (depreciation) on investments Net gain on investments NET INCREASE IN NET ASSETS RESULTING FROM OPERATIONS WEIGHTED AVERAGE—BASIC AND DILUTED EARNINGS PER COMMON SHARE WEIGHTED AVERAGE COMMON SHARES OUTSTANDING—BASIC AND DILUTED See accompanying notes to consolidated financial statements. Saratoga Investment Corp. Consolidated Schedule of Investments February 28, 2017 Company Industry Investment Interest Rate Non-control/Non-affiliated investments—190.5% (b) Apex Holdings Software Technologies, LLC Avionte Holdings, LLC (g) BMC Software, Inc. (d) Courion Corporation Emily Street Enterprises, L.L.C. Emily Street Enterprises, L.L.C. (g) Erwin, Inc. GreyHeller LLC GreyHeller LLC (i), (j) GreyHeller LLC (g) Help/Systems Holdings, Inc.(Help/Systems, LLC) Help/Systems Holdings, Inc.(Help/Systems, LLC) Identity Automation Systems Identity Automation Systems (g) Identity Automation Systems Knowland Technology Holdings, L.L.C. Microsystems Company National Waste Partner Vector Controls Holding Co., LLC (d) Vector Controls Holding Co., LLC (d), (g) Targus Holdings, Inc. (d), (g) Targus Holdings, Inc. (d) Targus Holdings, Inc. (d) My Alarm Center, LLC PrePaid Legal Services, Inc. (d) PrePaid Legal Services, Inc. (d) M/C Acquisition Corp., L.L.C. (d), (g) M/C Acquisition Corp., L.L.C. (d) Texas Teachers of Tomorrow, LLC (g), (h) Texas Teachers of Tomorrow, LLC TM Restaurant Group L.L.C. (g) Censis Technologies, Inc. Censis Technologies, Inc. (g), (h) ComForCare Health Care Roscoe Medical, Inc. (d), (g) Roscoe Medical, Inc. Ohio Medical, LLC (g) Ohio Medical, LLC Zest Holdings, LLC (d) HMN Holdco, LLC HMN Holdco, LLC HMN Holdco, LLC (g) HMN Holdco, LLC (g) HMN Holdco, LLC (g) HMN Holdco, LLC (g) Elyria Foundry Company, L.L.C. (d), (g) Elyria Foundry Company, L.L.C. (d) Mercury Network, LLC Real Estate First Lien Term Loan Mercury Network, LLC (g) Sub Total Non-control/Non-affiliated investments Control investments—39.4% (b) Easy Ice, LLC (g) Easy Ice, LLC (d) (f) Saratoga Investment Corp. CLO 2013-1, Ltd. (a), (d), (e), (f) Saratoga Investment Corp. Class F Note (a), (d), (f) Sub Total Control investments TOTAL INVESTMENTS—229.9% (b) Cash and cash equivalents and cash and cash equivalents, reserve accounts—17.4% (b) U.S. Bank Money Market (k) Total cash and cash equivalents and cash and cash equivalents, reserve accounts Company (a) Industry Investment Interest Rate / Maturity Principal/ Cost Fair Value (c) % of Non-control/Non-affiliated investments - 162.1% (b) PATS Aircraft, LLC Aerospace Common Stock 51,813 89,636 89,636 0.1 % PATS Aircraft, LLC Aerospace First Lien Term Loan 8.50% Cash, 10/6/2016 $ 254,598 254,598 254,598 0.2 % Total Aerospace 344,234 344,234 0.3 % National Truck Protection Co., Inc. (d, g) Automotive Common Stock 1,116 1,000,000 1,152,531 1.0 % National Truck Protection Co., Inc. (d) Automotive First Lien Term Loan 15.50% Cash, 9/13/2018 $ 8,250,000 8,250,000 8,250,000 7.2 % Take 5 Oil Change, L.L.C. (d, g) Automotive Common Stock 7,128 712,800 1,217,747 1.1 % Total Automotive 9,962,800 10,620,278 9.3 % Legacy Cabinets Holdings (d, g) Building Products Common Stock Voting A-1 2,535 220,900 552,351 0.5 % Legacy Cabinets Holdings (d, g) Building Products Common Stock Voting B-1 1,600 139,424 348,624 0.3 % Total Building Products 360,324 900,975 0.8 % ARSloane Acquistion, LLC Business Services First Lien Term Loan 7.50% Cash, 10/1/2019 $ 997,500 988,200 1,004,981 0.9 % BMC Software, Inc. (d) Business Services First Lien Term Loan 5.00% Cash, 9/10/2020 $ 6,000,000 5,943,801 6,013,800 5.2 % Dispensing Dynamics International (d) Business Services Senior Secured Note 12.50% Cash, 1/1/2018 $ 7,000,000 6,882,278 7,525,000 6.5 % Easy Ice, LLC (d) Business Services First Lien Term Loan 14.00% (11.00% Cash 3.00% PIK), 3/29/2018 $ 7,507,024 7,387,970 7,507,024 6.5 % Emily Street Enterprises, L.L.C. (d) Business Services Senior Secured Note 12.00% (11.00% Cash/1.00% PIK), 12/28/2017 $ 5,767,983 5,680,703 5,767,983 5.0 % ` ` Emily Street Enterprises, L.L.C. (d, g) Business Services Warrant Membership Interests 49,318 400,000 601,679 0.5 % Help/Systems Holdings, Inc.(Help/Systems, LLC) (d) Business Services First Lien Term Loan 5.50% Cash, 6/28/2019 $ 3,990,000 3,954,385 3,960,075 3.5 % Help/Systems Holdings, Inc.(Help/Systems, LLC) (d) Business Services Second Lien Term Loan 9.50% Cash, 6/28/2020 $ 2,000,000 1,972,758 2,000,000 1.7 % Knowland Technology Holdings, L.L.C. (d) Business Services First Lien Term Loan 11.00% Cash, 11/29/2017 $ 6,200,000 6,107,034 6,200,000 5.4 % Trinet HR Corporation (SOI Holdings, Inc.) (d) Business Services First Lien Term Loan 5.00% Cash, 8/20/2020 $ 4,987,500 4,941,335 5,018,921 4.4 % Trinet HR Corporation (SOI Holdings, Inc.) (d) Business Services Second Lien Term Loan 8.75% Cash, 2/20/2021 $ 2,500,000 2,453,145 2,518,750 2.2 % Vector Controls Holding Co., LLC (d) Business Services First Lien Term Loan, 14.00% (12.00% Cash, 2.00% PIK), 3/6/2018 $ 9,261,074 9,115,415 9,075,853 7.9 % Vector Controls Holding Co., LLC (d, g) Business Services Warrants to Purchase Limited Liability Company Interests 101 — 136,217 0.1 % Total Business Services 55,827,024 57,330,283 49.8 % Targus Group International, Inc. (d) Consumer Products First Lien Term Loan 11.00% Cash, 5/24/2016 $ 3,738,369 3,704,766 3,663,602 3.2 % Targus Holdings, Inc. (d, g) Consumer Products Common Stock 62,413 566,765 730,232 0.6 % Targus Holdings, Inc. (d) Consumer Products Unsecured Note 10.00% PIK, 6/14/2019 $ 2,054,158 2,054,158 1,387,848 1.2 % Targus Holdings, Inc. (d) Consumer Products Unsecured Note 16.00% Cash, 10/26/2018 $ 384,577 379,471 336,505 0.3 % Total Consumer Products 6,705,160 6,118,187 5.3 % Avionte Holdins, LLC Consumer Services Common Stock $ 100,000 100,000 100,000 0.1 % Avionte Holdins, LLC Consumer Services First Lien Term Loan 9.75% Cash, 1/8/2019 $ 3,000,000 2,940,000 3,000,000 2.6 % CFF Acquisition L.L.C. (d) Consumer Services First Lien Term Loan 7.50% Cash, 7/31/2015 $ 1,319,891 1,273,596 1,319,891 1.1 % Expedited Travel L.L.C. (d) Consumer Services First Lien Term Loan 9.00% Cash, 12/28/2017 $ 4,580,000 4,501,104 4,580,000 4.0 % PrePaid Legal Services, Inc. (d) Consumer Services First Lien Term Loan 6.25% Cash, 7/1/2019 $ 4,274,194 4,236,035 4,247,694 3.7 % PrePaid Legal Services, Inc. (d) Consumer Services Second Lien Term Loan 9.75% Cash, 7/1/2020 $ 5,000,000 4,931,888 5,044,000 4.4 % Total Consumer Services 17,982,623 18,291,585 15.9 % M/C Acquisition Corp., L.L.C. (d, g) Education Class A Common Stock 544,761 30,241 — 0.0 % M/C Acquisition Corp., L.L.C. (d) Education First Lien Term Loan 1.00% Cash, 3/13/14 $ 2,512,184 1,358,250 90,128 0.1 % Total Education 1,388,491 90,128 0.1 % Group Dekko, Inc. (d) Electronics Second Lien Term Loan 11.00% (10.00% Cash/1.00% PIK), 5/1/2016 $ 6,901,547 6,901,547 6,741,431 5.9 % Total Electronics 6,901,547 6,741,431 5.9 % Company Easy Ice, LLC Saratoga Investment Corp. CLO 2013-1, Ltd. Saratoga Investment Corp. Class F Note USS Parent Holding Corp. (d, g) Environmental Non Voting Common Stock 765 133,002 220,992 0.2 % USS Parent Holding Corp. (d, g) Environmental Voting Common Stock 17,396 3,025,798 5,027,574 4.4 % Total Environmental 3,158,800 5,248,566 4.6 % DS Waters of America, Inc. (d) Food and Beverage First Lien Term Loan 5.25% Cash, 8/30/2020 $ 2,493,750 2,470,506 2,531,156 2.2 % HOA Restaurant Group, L.L.C. (d) Food and Beverage Senior Secured Note 11.25% Cash, 4/1/2017 $ 4,000,000 3,918,437 4,240,000 3.7 % TB Corp. (d) Food and Beverage First Lien Term Loan 5.75% Cash, 6/19/2018 $ 5,101,971 5,082,013 5,127,481 4.5 % TB Corp. (d) Food and Beverage Unsecured Note 13.50% (12.00% Cash/1.50% PIK), 12/20/2018 $ 2,543,154 2,513,130 2,555,870 2.2 % TM Restaurant Group L.L.C. (d) Food and Beverage First Lien Term Loan 7.75% Cash, 7/16/2017 $ 2,845,690 2,831,271 2,831,462 2.5 % Total Food and Beverage 16,815,357 17,285,969 15.1 % Bristol Hospice, LLC Healthcare Services Senior Secured Note 11.00%(10.00% Cash/1.00% PIK), 11/29/2018 $ 5,509,782 5,405,325 5,509,782 4.8 % Oceans Acquisition, Inc. (d) Healthcare Services First Lien Term A Loan 10.75% Cash, 12/27/2017 $ 6,373,113 6,273,020 6,373,113 5.6 % Oceans Acquisition, Inc. (d) Healthcare Services First Lien Term B Loan 10.75% Cash, 12/27/2017 $ 500,000 490,224 500,000 0.4 % Smile Brands Group Inc. (d) Healthcare Services First Lien Term Loan 7.50% Cash, 8/16/2019 $ 4,488,750 4,406,559 4,488,750 3.9 % Surgical Specialties Corporation (US), Inc. (d) Healthcare Services First Lien Term Loan 7.25% Cash, 8/22/2018 $ 2,437,500 2,415,591 2,449,688 2.1 % Zest Holdings, LLC (d) Healthcare Services First Lien Term Loan 6.50% Cash, 8/16/2020 $ 4,488,750 4,405,073 4,488,750 3.9 % Total Healthcare Services 23,395,792 23,810,083 20.7 % McMillin Companies L.L.C. (d, g) Homebuilding Senior Secured Note 0% Cash, 12/31/2013 $ 550,000 558,434 344,355 0.3 % Total Homebuilding 558,434 344,355 0.3 % Distribution International, Inc. (d) Manufacturing First Lien Term Loan 7.50% Cash, 7/16/2019 $ 5,970,000 5,916,094 5,970,000 5.2 % Total Manufacturing 5,916,094 5,970,000 5.2 % Elyria Foundry Company, L.L.C. (d) Metals Senior Secured Note 17.00% (13.00% Cash/4.00% PIK), 9/14/2014 $ 8,859,614 8,859,614 6,644,711 5.8 % Elyria Foundry Company, L.L.C. (d, g) Metals Warrants to Purchase Limited Liability Company Interests (2008) 7,000 20 — 0.0 % Elyria Foundry Company, L.L.C. (d, g) Metals Warrants to Purchase Limited Liability Company Interests (2013) 18,227 — — 0.0 % Total Metals 8,859,634 6,644,711 5.8 % Network Communications, Inc. (d, g) Publishing Common Stock 380,572 — — 0.0 % Network Communications, Inc. (d) Publishing Unsecured Notes 8.60% PIK, 1/14/2020 $ 2,601,736 2,202,168 1,190,888 1.0 % Total Publishing 2,202,168 1,190,888 1.0 % Community Investors, Inc. (d, g) Software Common Stock 1,282 1,282 1,449 0.0 % Community Investors, Inc. (d) Software First Lien Term Loan 9.75% Cash, 5/9/2018 $ 6,983,333 6,863,915 6,983,333 6.1 % Community Investors, Inc. (d) Software Revolver $ 166,667 — — 0.0 % Community Investors, Inc. (d, g) Software Preferred Stock 135,584 135,584 153,210 0.1 % Pen-Link, Ltd. Software Second Lien Term Loan 12.50% Cash, 5/26/2019 $ 11,500,000 11,280,887 11,500,000 10.0 % Total Software 18,281,668 18,637,992 16.2 % Advanced Air & Heat of Florida, LLC Utilities First Lien Term Loan 10.00% Cash, 1/31/2019 $ 6,705,441 6,606,457 6,705,441 5.8 % Total Utilities 6,606,457 6,705,441 5.8 % Sub Total Non-control/Non-affiliated investments 185,266,607 186,275,106 162.1 % Control investments - 17.0% (b) Saratoga Investment Corp. CLO 2013-1, Ltd. (d, e, f) Structured Finance Securities Other/Structured Finance Securities 15.16%, 10/17/2023 $ 30,000,000 16,555,808 19,569,596 17.0 % Sub Total Control investments 16,555,808 19,569,596 17.0 % TOTAL INVESTMENTS - 179.1% (b) $ 201,822,415 $ 205,844,702 179.1 % Interest Management Net Realized Net Unrealized Company Purchases Redemptions Sales (cost) Income fee income gains/(losses) gains/(losses) Saratoga Investment Corp. CLO 2013-1, Ltd. $ — $ — $ — $ 3,410,868 $ 1,775,141 $ — $ 3,013,788 Consolidated Schedule of Investments February 29, 2016 Company Industry Investment Interest Rate Non-control/Non-affiliated investments—216.6% (b) National Truck Protection Co., Inc. (d), (g) National Truck Protection Co., Inc. (d) Take 5 Oil Change, L.L.C. (d), (g) Legacy Cabinets Holdings (d), (g) Legacy Cabinets Holdings (d), (g) Polar Holding Company, Avionte Holdings, LLC (g) Avionte Holdings, LLC Avionte Holdings, LLC (j), (k) BMC Software, Inc. (d) Courion Corporation Dispensing Dynamics Easy Ice, LLC (d) Emily Street Enterprises, L.L.C. Emily Street Enterprises, L.L.C. (g) Erwin, Inc. Finalsite Holdings, Inc. Help/Systems Holdings, Inc.(Help/Systems, LLC) Help/Systems Holdings, Inc.(Help/Systems, LLC) Identity Automation Systems (g) Identity Automation Systems Identity Automation Systems (j), (k) Knowland Technology Holdings, L.L.C. Vector Controls Holding Co., LLC (d) Business Services First Lien Term Loan, 14.00% (12.00% Cash/2.00% PIK), 3/6/2018 Vector Controls Holding Co., LLC (d), (g) Advanced Air & Heat of Florida, LLC Targus Holdings, Inc. (d), (g) Targus Holdings, Inc. (d) Targus Holdings, Inc. (d) Expedited Travel L.L.C. (g) Expedited Travel L.L.C. My Alarm Center, LLC PrePaid Legal Services, Inc. (d) PrePaid Legal Services, Inc. (d) Prime Security Services, LLC M/C Acquisition Corp., L.L.C. (d), (g) M/C Acquisition Corp., L.L.C. (d) Texas Teachers of Tomorrow, LLC (g), (h) Texas Teachers of Tomorrow, LLC Company (a) Industry Investment Interest Rate / Maturity Principal/ Cost Fair Value (c) % of Non-control/Non-affiliated investments - 119.2% (b) Coast Plating, Inc. (d) Aerospace First Lien Term Loan 11.70% Cash, 9/13/2014 $ 2,550,000 $ 2,550,000 $ 2,550,000 2.3 % Coast Plating, Inc. (d) Aerospace First Lien Term Loan 13.20% Cash, 9/13/2014 $ 950,000 950,000 950,000 0.9 % Total Aerospace 3,500,000 3,500,000 3.2 % National Truck Protection Co., Inc. (d), (h) Automotive Common Stock 589 500,000 591,827 0.5 % National Truck Protection Co., Inc. (d) Automotive First Lien Term Loan 15.50% Cash 8/10/2017 $ 5,500,000 5,500,000 5,500,000 5.1 % Take 5 Oil Change, L.L.C. (d) Automotive First Lien Term Loan 9.00% Cash, 11/28/2016 $ 6,000,000 6,000,000 6,000,000 5.5 % Take 5 Oil Change, L.L.C. (d) Automotive First Lien Term Loan 13.00% Cash, 11/28/2016 $ 2,000,000 1,961,761 2,000,000 1.8 % Take 5 Oil Change, L.L.C. (d), (h) Automotive Common Stock 7,128 712,800 712,800 0.7 % Total Automotive 14,674,561 14,804,627 13.6 % Legacy Cabinets Holdings (d), (h) Building Products Common Stock Voting A-1 2,535 220,900 — 0.0 % Legacy Cabinets Holdings (d), (h) Building Products Common Stock Voting B-1 1,600 139,424 — 0.0 % Legacy Cabinets, Inc. (d) Building Products First Lien Term Loan 7.25% (1.00% Cash/6.25% PIK), 5/3/2014 $ 332,229 332,229 267,378 0.2 % Total Building Products 692,553 267,378 0.2 % Emily Street Enterprises, L.L.C. (d) Business Services Senior Secured Note 14.00% (13.00% Cash/1.00% PIK), 12/28/2017 $ 5,705,384 5,595,317 5,705,384 5.2 % Emily Street Enterprises, L.L.C. (d), (h) Business Services Warrant Membership Interests 49,318 400,000 399,969 0.4 % Dispensing Dynamics International (d) Business Services Senior Secured Note 12.50% Cash, 1/1/2018 $ 7,000,000 6,860,186 7,000,000 6.4 % Knowland Technology Holdings, L.L.C. (d) Business Services First Lien Term Loan 11.00% Cash, 11/29/2017 $ 6,200,000 6,082,248 6,200,000 5.7 % Sourcehov LLC (d) Business Services Second Lien Term Loan 10.50% Cash, 4/29/2018 $ 3,000,000 2,648,298 2,850,000 2.6 % Total Business Services 21,586,049 22,155,353 20.3 % C.H.I. Overhead Doors, Inc. (d) Consumer Products First Lien Term Loan 7.25% Cash, 8/17/2017 $ 4,974,747 4,930,481 5,024,495 4.7 % Targus Group International, Inc. (d) Consumer Products First Lien Term Loan 11.00% Cash, 5/24/2016 $ 3,940,003 3,888,460 3,956,551 3.6 % Targus Holdings, Inc. (d) Consumer Products Unsecured Note 10.00% PIK, 6/14/2019 $ 1,914,341 1,914,341 1,116,252 1.0 % Targus Holdings, Inc. (d) Consumer Products Unsecured Note 16.00% Cash, 10/26/2018 $ 332,500 326,320 305,334 0.3 % Company (a) Industry Investment Interest Rate / Maturity Principal/ Cost Fair Value (c) % of Targus Holdings, Inc. (d), (h) Consumer Products Common Stock 62,413 566,765 3,324,741 3.1 % Total Consumer Products 11,626,367 13,727,373 12.7 % CFF Acquisition L.L.C. (d) Consumer Services First Lien Term Loan 7.50% Cash, 7/31/2015 $ 2,161,391 2,032,060 2,154,475 2.0 % Expedited Travel L.L.C. (d) Consumer Services First Lien Term Loan 12.00% Cash, 12/28/2017 $ 5,500,000 5,380,520 5,500,000 5.0 % PrePaid Legal Services, Inc. (d) Consumer Services First Lien Term Loan 11.00% Cash, 12/31/2016 $ 3,000,000 2,936,860 3,000,000 2.8 % Total Consumer Services 10,349,440 10,654,475 9.8 % M/C Acquisition Corp., L.L.C. (d) Education First Lien Term Loan 1.00% Cash, 12/31/2012 $ 2,740,780 1,586,846 291,893 0.3 % M/C Acquisition Corp., L.L.C. (d), (h) Education Class A Common Stock 544,761 30,242 — 0.0 % Total Education 1,617,088 291,893 0.3 % Group Dekko, Inc. (d) Electronics Second Lien Term Loan 11.00% (10.00% Cash/1.00% PIK), 5/1/2016 $ 6,824,717 6,824,717 6,720,981 6.2 % Total Electronics 6,824,717 6,720,981 6.2 % USS Parent Holding Corp. (d), (h) Environmental Non Voting Common Stock 765 133,002 125,981 0.1 % USS Parent Holding Corp. (d), (h) Environmental Voting Common Stock 17,396 3,025,798 2,866,065 2.7 % Total Environmental 3,158,800 2,992,046 2.8 % DS Waters of America, Inc. (d) Food and Beverage First Lien Term Loan 10.50% Cash, 8/29/2017 $ 3,970,000 3,994,704 4,049,400 3.7 % HOA Restaurant Group, L.L.C. (d) Food and Beverage Senior Secured Note 11.25% Cash, 4/1/2017 $ 4,000,000 3,897,940 3,560,000 3.3 % TB Corp. (d) Food and Beverage First Lien Term Loan 5.81% Cash, 6/19/2018 $ 5,153,506 5,128,662 5,140,622 4.7 % TB Corp. (d) Food and Beverage Unsecured Note 13.50% (12.00% Cash/1.50% PIK), 2/19/2017 $ 2,504,585 2,468,317 2,492,062 2.3 % TM Restaurant Group L.L.C. (d) Food and Beverage First Lien Term Loan 7.75% Cash, 7/17/2017 $ 2,962,500 2,943,045 2,956,871 2.7 % Total Food and Beverage 18,432,668 18,198,955 16.7 % Oceans Acquisition, Inc. (d) Healthcare Services First Lien Term Loan 10.75% Cash, 12/27/2017 $ 7,500,000 7,351,433 7,500,000 6.9 % Maverick Healthcare Group (d) Healthcare Services First Lien Term Loan 10.75% Cash, 12/31/2016 $ 4,900,000 4,835,389 4,900,000 4.5 % Total Healthcare Services 12,186,822 12,400,000 11.4 % McMillin Companies L.L.C. (d), (h) Homebuilding Senior Secured Note 0% Cash, 12/31/2013 $ 550,000 536,764 315,370 0.3 % Total Homebuilding 536,764 315,370 0.3 % Capstone Logistics, L.L.C. (d) Logistics First Lien Term Loan 7.50% Cash, 9/16/2016 $ 899,769 889,798 908,766 0.8 % Capstone Logistics, L.L.C. (d) Logistics First Lien Term Loan 13.50% Cash, 9/16/2016 $ 3,693,369 3,652,443 3,767,236 3.5 % Worldwide Express Operations, L.L.C. (d) Logistics First Lien Term Loan 7.50% Cash, 6/30/2013 $ 6,527,979 6,461,295 6,504,478 6.0 % Company (a) Industry Investment Interest Rate / Maturity Principal/ Cost Fair Value (c) % of Total Logistics 11,003,536 11,180,480 10.3 % Elyria Foundry Company, L.L.C. (d) Metals Senior Secured Note 17.00% (13.00% Cash/4.00% PIK), 3/1/2013 $ 7,728,566 7,728,566 6,723,852 6.2 % Elyria Foundry Company, L.L.C. (d), (h) Metals Warrants to Purchase Limited Liability Company Interests 3,000 — — 0.0 % Total Metals 7,728,566 6,723,852 6.2 % Network Communications, Inc. (d) Publishing Unsecured Note 8.60% PIK, 1/14/2020 $ 2,500,198 2,049,660 960,827 0.9 % Network Communications, Inc. (d), (h) Publishing Common Stock 211,429 — — 0.0 % Penton Media, Inc. (d) Publishing First Lien Term Loan 6.00% (4.00% Cash/2.00% PIK), 8/1/2014 $ 4,839,189 4,497,495 4,669,818 4.3 % Total Publishing 6,547,155 5,630,645 5.2 % Sub Total Non-control/Non-affiliated investments 130,465,086 129,563,428 119.2 % Control investments - 23.5% (b) GSC Partners CDO GP III, LP (g), (h) Financial Services 100% General Partnership Interest — — — 0.0 % GSC Investment Corp. CLO 2007 LTD. (d), (e), (g) Structured Finance Securities Other/Structured Finance Securities 23.06%, 1/21/2020 $ 30,000,000 18,944,966 25,516,959 23.5 % Sub Total Control investments 18,944,966 25,516,959 23.5 % Affiliate investments - 0.0% (b) GSC Partners CDO GP III, LP (f), (h) Financial Services 6.24% Limited Partnership Interest — — — 0.0 % Sub Total Affiliate investments — — 0.0 % TOTAL INVESTMENTS - 142.7% (b) $ 149,410,052 $ 155,080,387 142.7 % TM Restaurant Group L.L.C. Bristol Hospice, LLC Censis Technologies, Inc. Censis Technologies, Inc. (g), (h) Roscoe Medical, Inc. (d), (g) Roscoe Medical, Inc. Ohio Medical, LLC (g) Ohio Medical, LLC Smile Brands Group Inc. (d) Zest Holdings, LLC (d) HMN Holdco, LLC HMN Holdco, LLC HMN Holdco, LLC (g) HMN Holdco, LLC (g) HMN Holdco, LLC (g) HMN Holdco, LLC (g) Elyria Foundry Company, L.L.C. (d), (g) Elyria Foundry Company, L.L.C. (d) Mercury Network, LLC Mercury Network, LLC (g) Sub Total Non-control/Non-affiliated investments Control investments—10.3% (b) Saratoga Investment Corp. CLO 2013-1, Ltd. (a), (d), (e), (f) Sub Total Control investments TOTAL INVESTMENTS—226.9% (b) Cash and cash equivalents and cash and cash equivalents, reserve accounts—5.6% (b) U.S. Bank Money Market (l) Total cash and cash equivalents and cash and cash equivalents, reserve accounts (a) Represents a non-qualifying investment as defined under Section 55(a) of the Investment Company Act of 1940, as amended. Non-qualifying assets represent 5.2% of the Company’s portfolio at fair value. As a BDC, the Company can only invest 30% of its portfolio in non-qualifying assets. Percentages are based on net assets of $125,149,875 as of February 29, 2016. Because there is no readily available market value for these investments, the fair value of these investments is approved in good faith by our board of directors (see Note 3 to the consolidated financial statements). These securities are pledged as collateral under a senior secured revolving credit facility (see Note 7 to the consolidated financial statements). This investment does not have a stated interest rate that is payable thereon. As a result, the 16.14% interest rate in the table above represents the effective interest rate currently earned on the investment cost and is based on the current cash interest and other income generated by the investment. As defined in the Investment Company Company Saratoga Investment Corp. CLO 2013-1, Ltd. Interest Management Net Realized Net Unrealized Company Purchases Redemptions Sales (cost) Income fee income gains/(losses) gains/(losses) GSC Investment Corp. CLO 2007 LTD. $ — $ — $ — $ 4,205,509 $ 2,000,072 $ — $ 6,571,992 GSC Partners CDO GP III, LP $ — $ — $ — $ — $ — $ — $ — Saratoga Investment Corp. Consolidated Statements of Changes in Net Assets For the year ended For the year ended For the year ended INCREASE FROM OPERATIONS: Net investment income $ 9,121,648 $ 7,027,566 $ 5,700,861 Net realized gain (loss) from investments 1,270,765 561,700 (12,185,997 ) Net realized loss from derivatives — (131,000 ) — Net unrealized appreciation (depreciation) on investments (1,648,046 ) 7,012,726 19,776,469 Net unrealized appreciation (depreciation) on derivatives — 130,925 (16,190 ) Net increase in net assets from operations 8,744,367 14,601,917 13,275,143 DECREASE FROM SHAREHOLDER DISTRIBUTIONS: Distributions declared (12,534,807 ) (16,475,809 ) (9,831,231 ) Net decrease in net assets from shareholder distributions (12,534,807 ) (16,475,809 ) (9,831,231 ) CAPITAL SHARE TRANSACTIONS: Stock dividend distribution 10,027,697 13,180,503 7,864,784 Net increase in net assets from capital share transactions 10,027,697 13,180,503 7,864,784 Total increase in net assets 6,237,257 11,306,611 11,308,696 Net assets at beginning of period 108,686,761 97,380,150 86,071,454 Net assets at end of period $ 114,924,018 $ 108,686,761 $ 97,380,150 Net asset value per common share $ 21.36 $ 22.98 $ 25.12 Common shares outstanding at end of period 5,379,616 4,730,116 3,876,661 Distribution in excess of net investment income $ (29,627,578 ) $ (24,522,951 ) $ (13,920,068 ) INCREASE FROM OPERATIONS: Net investment income Net realized gain from investments Net unrealized appreciation (depreciation) on investments Net increase in net assets from operations DECREASE FROM SHAREHOLDER DISTRIBUTIONS: Distributions declared Net decrease in net assets from shareholder distributions CAPITAL SHARE TRANSACTIONS: Stock dividend distribution Repurchases of common stock Offering costs Net increase in net assets from capital share transactions Total increase in net assets Net assets at beginning of period Net assets at end of period Net asset value per common share Common shares outstanding at end of period Distribution in excess of net investment income See accompanying notes to consolidated financial statements. Saratoga Investment Corp. Consolidated Statements of Cash Flows For the year ended For the year ended For the year ended Operating activities NET INCREASE IN NET ASSETS FROM OPERATIONS $ 8,744,367 $ 14,601,917 $ 13,275,143 ADJUSTMENTS TO RECONCILE NET INCREASE IN NET ASSETS FROM OPERATIONS TO NET CASH USED BY OPERATING ACTIVITIES: Paid-in-kind interest income (1,007,494 ) (1,062,687 ) (1,442,004 ) Net accretion of discount on investments (666,849 ) (975,475 ) (1,191,822 ) Amortization of deferred debt financing costs 903,289 482,306 674,724 Net realized (gain) loss from investments (1,270,765 ) (561,700 ) 12,185,997 Net realized loss from derivatives — 131,000 — Net unrealized (appreciation) depreciation on investments 1,648,046 (7,012,726 ) (19,776,469 ) Net unrealized (appreciation) depreciation on derivatives — (130,925 ) 16,190 Proceeds from sale and redemption of investments 71,606,736 21,487,698 33,568,147 Purchase of investments (121,073,990 ) (71,595,649 ) (38,678,936 ) (Increase) decrease in operating assets: Cash and cash equivalents, reserve accounts 8,793,029 13,448,053 (21,164,208 ) Interest receivable 317,505 (1,199,954 ) (23,321 ) Management fee receivable 65,747 11,728 4,172 Other assets 68,946 11,416 (9,657 ) Receivable from unsettled trades 1,817,074 (1,757,563 ) (59,511 ) Increase (decrease) in operating liabilities: Payable for unsettled trades — (4,072,500 ) (827,500 ) Management and incentive fees payable (652,360 ) 1,623,652 681,864 Accounts payable and accrued expenses 389,530 (269,911 ) (80,537 ) Interest and credit facility fees payable 615,339 204,534 (14,530 ) Due to manager 175,641 (171,581 ) 154,094 NET CASH USED BY OPERATING ACTIVITIES (29,526,209 ) (36,808,367 ) (22,708,164 ) Financing activities Borrowings on debt 18,000,000 55,550,000 20,000,000 Paydowns on debt (28,300,000 ) (15,250,000 ) (4,500,000 ) Issuance of notes 48,300,000 — — Debt financing cost (2,821,806 ) (1,373,000 ) (235,446 ) Payments of cash dividends (2,507,112 ) (3,295,306 ) (1,966,447 ) NET CASH PROVIDED BY FINANCING ACTIVITIES 32,671,082 35,631,694 13,298,107 NET INCREASE (DECREASE) IN CASH AND CASH EQUIVALENTS 3,144,873 (1,176,673 ) (9,410,057 ) CASH AND CASH EQUIVALENTS, BEGINNING OF PERIOD 149,025 1,325,698 10,735,755 CASH AND CASH EQUIVALENTS, END OF PERIOD $ 3,293,898 $ 149,025 $ 1,325,698 Supplemental Information: Interest paid during the period $ 4,565,262 $ 1,853,573 $ 637,791 Supplemental non-cash information: Paid-in-kind interest income $ 1,007,494 $ 1,062,687 $ 1,442,004 Net accretion of discount on investments $ 666,849 $ 975,475 $ 1,191,822 Amortization of deferred credit facility financing costs $ 903,289 $ 482,306 $ 674,724 Stock dividend distribution $ 10,027,697 $ 13,180,503 $ 7,864,784 Operating activities NET INCREASE IN NET ASSETS FROM OPERATIONS ADJUSTMENTS TO RECONCILE NET INCREASE IN NET ASSETS FROM OPERATIONS TO NET CASH PROVIDED BY (USED IN) OPERATING ACTIVITIES: Payment-in-kind interest income Net accretion of discount on investments Amortization of deferred debt financing costs Net realized gain from investments Net unrealized (appreciation) depreciation on investments Proceeds from sales and repayments of investments Purchase of investments (Increase) decrease in operating assets: Interest receivable Management fee receivable Other assets Receivable from unsettled trades Increase (decrease) in operating liabilities: Base management and incentive fees payable Accounts payable and accrued expenses Interest and debt fees payable Payable for repurchases of common stock Directors fees payable Due to manager NET CASH PROVIDED BY (USED IN) OPERATING ACTIVITIES Financing activities Borrowings on debt Paydowns on debt Issuance of notes Repayments of notes Payments of deferred debt financing costs Repurchases of common stock Payments of cash dividends NET CASH PROVIDED BY FINANCING ACTIVITIES NET INCREASE (DECREASE) IN CASH AND CASH EQUIVALENTS AND CASH AND CASH EQUIVALENTS, RESERVE ACCOUNTS CASH AND CASH EQUIVALENTS AND CASH AND CASH EQUIVALENTS, RESERVE ACCOUNTS, BEGINNING OF PERIOD CASH AND CASH EQUIVALENTS AND CASH AND CASH EQUIVALENTS, RESERVE ACCOUNTS, END OF PERIOD Supplemental information: Interest paid during the period Cash paid for taxes Supplemental non-cash information: Payment-in-kind interest income Net accretion of discount on investments Amortization of deferred debt financing costs Stock dividend distribution See accompanying notes to consolidated financial statements. SARATOGA INVESTMENT CORP. NOTES TO CONSOLIDATED FINANCIAL STATEMENTS February 28, Note 1. Organization Saratoga Investment Corp. (the “Company”, “we”, “our” and “us”) is a non-diversified closed end management investment company incorporated in Maryland that has elected to be treated and is regulated as a business development company (“BDC”) under the Investment Company Act of 1940 (the “1940 Act”). GSC Investment, LLC (the “LLC”) was organized in May 2006 as a Maryland limited liability company. As of February 28, 2007, the LLC had not yet commenced its operations and investment activities. On March 21, 2007, the Company was incorporated and concurrently therewith the LLC was merged with and into the Company, with the Company as the surviving entity, in accordance with the procedure for such merger in the LLC’s limited liability company agreement and Maryland law. In connection with such merger, each outstanding limited liability company interest of the LLC was converted into a share of common stock of the Company. On July 30, 2010, the Company changed its name from “GSC Investment Corp.” to “Saratoga Investment Corp.” in The Company has established wholly-owned subsidiaries, SIA Avionte, Inc., SIA Easy Ice, LLC, SIA GH, Inc., SIA Mercury, Inc., SIA TT Inc., and SIA Vector Inc., which are structured as Delaware entities, or tax blockers, to hold equity or equity-like investments in portfolio companies organized as limited liability companies, or LLCs (or other forms of pass through entities). Tax blockers are consolidated for accounting purposes, but are not consolidated for income tax purposes and may incur income tax expense as a result of their ownership of portfolio companies. On March 28, 2012, our wholly-owned subsidiary, Saratoga Investment Corp. SBIC, LP (“SBIC LP”), received a Small Business Investment Company (“SBIC”) license from the Small Business Administration (“SBA”). On April 2, 2015, the SBA issued a “green light” letter inviting the Company to continue the application process to obtain a license to form and operate its second SBIC subsidiary. On September 27, 2016, the SBA informed us that as part of their continued review of our application for a second license, and in order to ensure that they were reviewing the most current information available, we would need to update all previously submitted materials and invited us to reapply. As a result of this request, with which we are in the process of complying, the existing “green light” letter that the SBA issued to us has expired. If approved in the future, a second SBIC license would provide us an incremental source of long-term capital by permitting us to issue up to $150.0 million of additional SBA-guaranteed debentures in addition to the $150.0 million already approved under the first license. Note 2. Summary of Significant Accounting Policies Basis of Presentation The accompanying consolidated financial statements have been prepared on the accrual basis of accounting in conformity with U.S. generally accepted accounting principles (“U.S. GAAP”), are stated in U.S. Dollars and include the accounts of the Company and its special purpose financing subsidiary, Saratoga Investment Funding, LLC (previously known as GSC Investment Funding LLC) The Company and SBIC LP are both considered to be investment companies for financial reporting purposes and have applied the guidance in the Financial Accounting Use of Estimates in the Preparation of Financial Statements The preparation of the accompanying consolidated financial statements in conformity with U.S. GAAP requires management to make estimates and assumptions that affect the reported amounts of assets and liabilities, and disclosure of contingent assets and liabilities at the date of the financial statements, and income, gains (losses) and expenses during the period reported. Actual results could differ materially from those estimates. Cash and Cash Equivalents Cash and cash equivalents include short-term, liquid investments in a money market fund. Cash and cash equivalents are carried at cost which approximates fair value. Per section 12(d)(1)(A) of the 1940 Act, the Company may not invest in another registered investment company such as, a money market fund if such investment would cause the Company to exceed any of the following limitations: As of February 28, 2017, the Company did not exceed any of these limitations. Cash and Cash Equivalents, Reserve Accounts Cash and cash equivalents, reserve accounts include amounts held in designated bank accounts in the form of cash and short-term liquid investments in money market funds, representing payments received on secured investments or other reserved amounts associated with In addition, cash and cash equivalents, reserve accounts also include amounts held in designated bank accounts, in the form of cash and short-term liquid investments in money market funds, within our wholly-owned subsidiary, SBIC LP. In November 2016, the FASB issued Accounting Standards Update (“ASU”) 2016-18, Statement of Cash Flows (Topic 230):Restricted Cash (“ASU 2016-18”). ASU 2016-18 requires that the statements of cash flows explain the change during the period in the total of cash, cash equivalents, and amounts generally described as restricted cash or restricted cash equivalents. Therefore, amounts generally described as restricted cash and restricted cash equivalents should be included with cash and cash equivalents when reconciling the beginning-of-period and end-of-period total amounts shown on the statements of cash flows. The new guidance is effective for fiscal years, and interim periods within those fiscal years, beginning after December 15, 2017, and early adoption is permitted and is to be applied on a retrospective basis. The Company has adopted the provisions of ASU 2016-18 as of November 30, 2016. The adoption of the provisions of ASU 2016-18 did not materially impact the Company’s consolidated financial position or results of operations. Prior period amounts were reclassified to conform to the current period presentation. The following table provides a reconciliation of cash and cash equivalents and cash and cash equivalents, reserve accounts reported within the consolidated statements of assets and liabilities that sum to the total of the same such amounts shown in the consolidated statements of cash flows: Cash and cash equivalents Cash and cash equivalents, reserve accounts Total cash and cash equivalents, and cash and cash equivalents, reserve accounts Investment Classification The Company classifies its investments in accordance with the requirements of the 1940 Act. Under the 1940 Act, “Control Investments” are defined as investments in companies in which we own more than 25.0% of the voting securities or maintain greater than 50.0% of the board representation. Under the 1940 Act, “Affiliated Investments” are defined as those non-control investments in companies in which we own between 5.0% and 25.0% of the voting securities. Under the 1940 Act, “Non-affiliated Investments” are defined as investments that are neither Control Investments nor Affiliated Investments. Investment Valuation The Company accounts for its investments at fair value in accordance with the Investments for which market quotations are readily available are fair valued at such market quotations obtained from independent third party pricing services and market makers subject to any decision by our board of directors to approve a fair value determination to reflect significant events affecting the value of these investments. We value investments for which market quotations are not readily available at fair value as approved, in good faith, by our board of directors based on input from our Manager, the audit committee of our board of directors and a third party independent valuation firm. Determinations of fair value may involve subjective judgments and estimates. The types of factors that may be considered in determining the fair value of our investments include the nature and realizable value of any collateral, the portfolio company’s ability to make payments, market yield trend analysis, the markets in which the portfolio company does business, comparison to publicly traded companies, discounted cash flow and other relevant factors. In addition, all our investments are subject to the following valuation process: interests in collateralized loan obligation funds similar to Saratoga CLO, when available, as determined by our Manager and recommended to our board of directors. Specifically, we use Intex cash flow models, or an appropriate substitute, to form the basis for the valuation of our investment in Saratoga CLO. The models use a set of assumptions including projected default rates, recovery rates, reinvestment Because such valuations, and particularly valuations of private investments and private companies, are inherently uncertain, they may fluctuate over short periods of time and may be based on estimates. The determination of fair value may differ materially from the values that would have been used if a ready market for these investments existed. Derivative Financial Instruments Investment Transactions and Income Recognition Purchases and sales of investments and the related realized gains or losses are recorded on a trade-date basis. Interest income, adjusted for amortization of premium and accretion of discount, is recorded on an accrual basis to the extent that such amounts are expected to be collected. The Company stops accruing interest on its investments when it is determined that interest is no longer collectible. Discounts and premiums on investments purchased are accreted/amortized over the life of the respective investment using the effective yield method. The amortized cost of investments represents the original cost adjusted for the accretion of discounts and Loans are generally placed on non-accrual status when there is reasonable doubt that principal or interest will be collected. Accrued interest is generally reserved when a loan is placed on non-accrual status. Interest payments received on non-accrual loans may be recognized as a reduction in principal depending upon management’s judgment regarding collectability. Non-accrual loans are restored to accrual status when past due principal and interest is paid and, in management’s judgment, are likely to remain current, although we may make exceptions to this general rule if the loan has sufficient collateral value and is in the process of collection. Interest income on our investment in Saratoga CLO is recorded using the effective interest method in accordance with the provisions of ASC Topic 325-40, Investments-Other, Beneficial Interests in Securitized Financial Assets, (“ASC 325-40”), based on the anticipated yield and the estimated cash flows over the projected life of the investment. Yields are revised when there are changes in actual or estimated cash flows due to changes in prepayments and/or re-investments, credit losses or asset pricing. Changes in estimated yield are recognized as an adjustment to the estimated yield over the remaining life of the investment from the date the estimated yield was changed. Other Income Payment-in-Kind Interest The Company holds debt investments in its portfolio that contain a payment-in-kind (“PIK”) interest provision. The PIK interest, which represents contractually deferred interest added to the investment balance that is generally due at maturity, is generally recorded on the accrual basis to the extent such amounts are expected to be collected. We stop accruing PIK interest if we do not expect the issuer to be able to pay all principal and interest when due. Deferred Debt Financing Costs Financing costs incurred in connection with our credit facility and notes are deferred and amortized using the straight line method over the life of ASU 2015-03,Interest—Imputation of Interest (Subtopic 835-30): Simplifying the Presentation of Debt Issuance Costs(“ASU 2015-03”) requires that debt issuance costs related to a recognized debt liability be presented in the balance sheet as a direct deduction from the carrying amount of that debt liability, consistent with debt discounts. The Company has adopted the provisions of ASU 2015-03 as of February 28, 2015, by reclassifying deferred debt financing costs from within total assets to within total liabilities as a contra-liability. Prior period amounts were reclassified to conform to the current period presentation. Contingencies In the ordinary course of Therefore, the Company has not accrued any liabilities in connection with such indemnifications. In the ordinary course of business, the Company may directly or indirectly be a defendant or plaintiff in legal actions with respect to bankruptcy, insolvency or other types of proceedings. Such lawsuits may involve claims that could adversely affect the value of certain financial instruments owned by the Company. Income Taxes The Company has filed an election to be treated for tax purposes as a RIC under In order to qualify as a RIC, among other requirements, the Company is required to timely distribute to its stockholders at least 90.0% of its investment company taxable income, as defined by the Code, for each fiscal tax year. The Company will be subject to a nondeductible U.S. federal excise tax of 4.0% on undistributed income if it does not distribute at least 98.0% of its ordinary income in any calendar year and 98.2% of its capital gain net income for each one-year period ending on October 31. Depending on the level of taxable income earned in a tax year, the Company may choose to carry forward taxable income in excess of current year dividend distributions into the next tax year and pay a 4.0% excise tax on such income, as required. To the extent that the Company determines that its estimated current year annual taxable income will be in excess of estimated current year dividend distributions for excise tax purposes, the Company accrues excise tax, if any, on estimated excess taxable income as taxable income is earned. In accordance with certain applicable U.S. Treasury regulations and private letter rulings issued by the Internal Revenue Service (“IRS”), a RIC may treat a distribution of its own stock as fulfilling its RIC distribution requirements if each stockholder may elect to receive his or her entire distribution in either cash or stock of the RIC subject to a limitation on the aggregate amount of cash to be distributed to all stockholders, which limitation must be at least 20.0% of the aggregate declared distribution. If too many stockholders elect to receive cash, each stockholder electing to receive cash will receive a pro rata amount of cash (with the balance of the distribution paid in stock). In no event will any stockholder, electing to receive cash, receive less than 20.0% of his or her entire distribution in cash. If these and certain other requirements are met, for U.S federal income tax purposes, the amount of the dividend paid in stock will be equal to the amount of cash that could have been received instead of stock. ASC 740, Income Taxes, (“ASC 740”), provides guidance for how uncertain tax positions should be recognized, measured, presented and disclosed in the financial statements. ASC 740 requires the evaluation of tax positions taken or expected to be taken in the course of preparing the Company’s tax returns to determine whether the tax positions are “more-likely-than-not” of being sustained by the applicable tax authority. Tax positions deemed to meet a “more-likely-than-not” threshold would be recorded as a tax benefit or expense in the current period. The Company recognizes interest and penalties, if any, related to unrecognized tax benefits as income tax expense Dividends Dividends to common stockholders are recorded on the ex-dividend date. The amount to be paid out as a dividend is determined by the board of directors. Net realized capital gains, if any, are generally distributed at least annually, although we may decide to retain such capital gains for reinvestment. We have adopted a dividend reinvestment plan (“DRIP”) that provides for reinvestment of our dividend distributions on behalf of our stockholders unless a stockholder elects to receive cash. As a result, if our board of directors authorizes, and we declare, a cash dividend, then our stockholders who have not “opted out” of Capital Gains Incentive Fee The Company records an expense accrual on the consolidated statements of operations, relating to the capital gains incentive fee payable on the consolidated statements of assets and liabilities, by the Company to its investment adviser when the net realized and unrealized New Accounting Pronouncements In In February 2016, the FASB issued ASU 2016-02,Amendments to the Leases (“ASU Topic 842”), which will require for all operating leases the recognition of a right-of-use asset and a lease liability, in the statement of financial position. The In January 2016, the FASB issued ASU 2016-01,Financial Instruments — Overall (Subtopic 825-10): Recognition and Measurement of Financial Assets and Financial Liabilities (“ASU 2016-01”). ASU 2016-01 retains many current requirements for the classification and measurement of financial instruments; however, it significantly revises an entity’s accounting related to (1) the classification and measurement of investments in equity securities and (2) the presentation of certain fair value changes for financial liabilities measured at fair value. ASU 2016-01 also amends certain disclosure requirements associated with the fair value of financial instruments. This guidance is effective for annual and interim periods beginning after December 15, 2017, and early adoption is not permitted for public business entities. Management is currently evaluating the impact the adoption of this standard has on the Company’s consolidated financial statements and disclosures. In May 2014, the FASB issued ASU 2014-09, Revenue from Contracts with Customers (Topic 606), which supersedes the revenue recognition requirements in Revenue Recognition (Topic 605). Under the new guidance, an entity should recognize revenue to depict the transfer of promised goods or services to customers in an amount that reflects the consideration to which the entity expects to be entitled in exchange for those goods or services. In May 2016, ASU 2016-12 amended ASU 2014-09 and deferred the effective period to December 15, 2017. Management is currently evaluating the impact these changes will have on the Company’s consolidated financial statements and disclosures. Risk Management In the ordinary course of its business, the Company manages a variety of risks, including market risk and credit risk. Market risk is the risk of potential adverse changes to the value of investments because of changes in market conditions such as interest rate movements and volatility in investment prices. Credit risk is the risk of default or non-performance by portfolio companies, equivalent to the investment’s carrying amount. The Company is also exposed to credit risk related to maintaining all of its cash and cash equivalents, including those in reserve accounts, at a major financial institution and credit risk related to any of its derivative counterparties. The Company has investments in lower rated and comparable quality unrated high yield bonds and bank loans. Investments in high yield investments are accompanied by a greater degree of credit risk. The risk of loss due to default by the issuer is significantly greater for holders of high yield securities, because such investments are generally unsecured and are often subordinated to other creditors of the issuer. Note 3. Investments As noted above, the Company values all investments in accordance with ASC 820. ASC 820 requires enhanced disclosures about assets and liabilities that are measured and reported at fair value. As defined in ASC 820, fair value is the price that would be received to sell an asset or paid to transfer a liability in an orderly transaction between market participants at the measurement date. ASC 820 establishes a hierarchal disclosure framework which prioritizes and ranks the level of market price observability of inputs used in measuring investments at fair value. Market price observability is affected by a number of factors, including the type of investment and the characteristics specific to the investment. Investments with readily available active quoted prices or for which fair value can be measured from actively quoted prices generally will have a higher degree of market price observability and a lesser degree of judgment used in measuring fair value. Based on the observability of the inputs used in the valuation techniques, the Company is required to provide disclosures on fair value measurements according to the fair value hierarchy. The fair value hierarchy ranks the observability of the inputs used to determine fair values. Investments carried at fair value are classified and disclosed in one of the following three categories: In addition to using the above inputs in investment valuations, the Company continues to employ the valuation policy approved by the board of directors that is consistent with ASC 820 and the 1940 Act (see Note 2). Consistent with our The following table presents fair value measurements of investments, by major class, as of February 28, Fair Value Measurements Level 1 Level 2 Level 3 Total Middle market loans $ — $ — $ 32,390 $ 32,390 Syndicated loans First lien term loans — — 80,246 80,246 Second lien term loans — — 27,804 27,804 Senior secured notes — — 30,032 30,032 Unsecured notes — — 5,471 5,471 Structured finance securities — — 19,570 19,570 Equity interest — — 10,332 10,332 Equity interests Total $ — $ — $ 205,845 $ 205,845 The following table presents fair value measurements of investments, by major class, as of February Fair Value Measurements Level 1 Level 2 Level 3 Total First lien term loans $ — $ — $ 83,792 $ 83,792 Second lien term loans — — 9,571 9,571 Senior secured notes — — 23,305 23,305 Unsecured notes — — 4,874 4,874 Structured finance securities — — 25,517 25,517 Equity interest — — 8,021 8,021 Total $ — $ — $ 155,080 $ 155,080 Syndicated loans First lien term loans Second lien term loans Structured finance securities Equity interests Total The following table provides a reconciliation of the beginning and ending balances for investments that use Level 3 inputs for the year ended February 28, Middle First lien Second Senior Unsecured Structured Common Total Balance as of February 28, 2013 $ — $ 83,792 $ 9,571 $ 23,305 $ 4,874 $ 25,517 $ 8,021 $ 155,080 Net unrealized gains (losses) 407 (395 ) 165 41 207 (3,558 ) 1,485 (1,648 ) Purchases and other adjustments to cost 37,048 49,329 20,727 14,414 390 — 841 122,749 Sales and redemptions (5,138 ) (53,162 ) (3,030 ) (7,728 ) — (2,389 ) (160 ) (71,607 ) Net realized gain (loss) from investments 73 682 371 — — — 145 1,271 Balance as of February 28, 2014 $ 32,390 $ 80,246 $ 27,804 $ 30,032 $ 5,471 $ 19,570 $ 10,332 $ 205,845 Balance as of February 29, 2016 Net unrealized appreciation (depreciation) on investments Purchases and other adjustments to cost Sales and repayments Net realized gain from investments Restructures In Restructures Out Balance as of February 28, 2017 Net unrealized appreciation (depreciation) for the year relating to those Level 3 assets that were still held by the Company at the end of the year: Purchases and other adjustments to cost include purchases of new investments at cost, effects of refinancing/restructuring, accretion/amortization of income from discount/premium on debt securities, and PIK. Sales and The following table provides a reconciliation of the beginning and ending balances for investments that use Level 3 inputs for the year ended February First lien Second lien Senior Senior Unsecured Structured Common Total Balance as of February 29, 2012 $ 36,196 $ 8,914 $ 10,706 $ 6,000 $ 2,008 $ 25,846 $ 5,690 $ 95,360 Net unrealized gains (losses) 2,090 657 (403 ) (148 ) (169 ) 4,267 719 7,013 Purchases and other adjustments to cost 52,872 3,005 13,002 107 3,035 — 1,612 73,633 Sales and redemptions (7,564 ) (3,092 ) — (6,090 ) — (4,596 ) (146 ) (21,488 ) Net realized gain (loss) from investments 198 87 — 131 — — 146 562 Balance as of February 28, 2013 $ 83,792 $ 9,571 $ 23,305 $ — $ 4,874 $ 25,517 $ 8,021 $ 155,080 Balance as of February 28, 2015 Net unrealized appreciation (depreciation) on investments Purchases and other adjustments to cost Sales and repayments Net realized gain (loss) from investments Transfers In Transfers Out Balance as of February 29, 2016 Net unrealized appreciation (depreciation) for the year relating to those Level 3 assets that were still held by the Company at the end of the year: Purchases and other adjustments to cost include purchases of new investments at cost, effects of refinancing/restructuring, accretion/amortization of income from discount/premium on debt securities, and PIK. Sales and which they occur. The valuation techniques and significant unobservable inputs used in recurring Level 3 fair value measurements of assets as of February 28, Fair Value Valuation Technique Unobservable Input Range Middle market loans $ 32,390 Market Comparables Third-Party Bid 99.5 – 100.6 First lien term loans 80,246 Market Comparables Market Yield (%) 5.1% - 15.5% EBITDA Multiples (x) 3.0x Third-Party Bid 83.3 – 101.5 Second lien term loans 27,804 Market Comparables Market Yield (%) 9.6% - 12.5% Third-Party Bid 100.0 – 101.8 Senior secured notes 30,032 Market Comparables Market Yield (%) 11.0% - 42.5% EBITDA Multiples (x) 5.0x Third-Party Bid 106.0 – 107.5 Unsecured notes 5,471 Market Comparables Market Yield (%) 12.8% - 20.3% Structured finance securities 19,570 Discounted Cash Flow Discount Rate (%) 9.0% Equity interests 10,332 Market Comparables EBITDA Multiples (x) 6.3x – 12.0x Syndicated loans First lien term loans Second lien term loans Structured finance securities Equity interests The valuation techniques and significant unobservable inputs used in recurring Level 3 fair value measurements of assets as of February Fair Value Valuation Technique Unobservable Input Range First lien term loans $ 83,792 Market Comparables Market Yield (%) 5.8% - 26.9% EBITDA Multiples (x) 3.0x Third-Party Bid 96.5 - 102.0 Second lien term loans 9,571 Market Comparables Market Yield (%) 11.5% Third-Party Bid 90.5 Senior secured notes 23,305 Market Comparables Market Yield (%) 14.0% - 42.5% EBITDA Multiples (x) 5.5x Third-Party Bid 89.0 – 101.0 Unsecured notes 4,874 Market Comparables Market Yield (%) 13.6% - 23.8% Structured finance securities 25,517 Discounted Cash Flow Discount Rate (%) 13.0% Equity interests 8,021 Market Comparables EBITDA Multiples (x) 3.0x – 8.9x Syndicated loans First lien term loans Third-Party Bid (%) Second lien term loans Structured finance securities Equity interests Revenue Multiples (x) For investments utilizing a market comparables valuation technique, a significant increase (decrease) in the market yield, in isolation, would result in a significantly lower (higher) fair value measurement, and a significant increase (decrease) in any of the EBITDA or revenue valuation multiples, in isolation, would result in a significantly higher (lower) fair value measurement. For investments utilizing a discounted cash flow valuation technique, a significant increase (decrease) in the discount rate, in isolation, would result in a significantly lower (higher) fair value measurement. For investments utilizing a market quote in deriving a value, a significant increase (decrease) in the market quote, in isolation, would result in a significantly higher (lower) fair value measurement. The composition of our investments as of February 28, Investments at Amortized Cost Investments at Fair Value Middle Market loans $ 31,983 15.8 % $ 32,390 15.7 % First lien term loans 80,734 40.0 80,246 39.0 Second lien term loans 27,540 13.6 27,804 13.5 Senior secured notes 31,304 15.6 30,032 14.6 Unsecured notes 7,149 3.5 5,471 2.7 Structured finance securities 16,556 8.2 19,570 9.5 Equity interest 6,556 3.3 10,332 5.0 Total $ 201,822 100.0 % $ 205,845 100.0 % Syndicated loans First lien term loans Second lien term loans Structured finance securities Equity interests Total The composition of our investments as of February Investments at Amortized Cost Investments at Fair Value First lien term loans $ 83,886 56.2 % $ 83,792 54.0 % Second lien term loans 9,473 6.3 9,571 6.2 Senior secured notes 24,619 16.5 23,305 15.0 Unsecured notes 6,758 4.5 4,874 3.1 Structured finance securities 18,945 12.7 25,517 16.5 Equity interest 5,729 3.8 8,021 5.2 Total $ 149,410 100.0 % $ 155,080 100.0 % Syndicated loans First lien term loans Second lien term loans Structured finance securities Equity interests Total For loans and debt securities for which market quotations are not available, we determine their fair value based on third party indicative broker quotes, where available, or the assumptions that a hypothetical market participant would use to value the security in a current hypothetical sale using a market yield valuation methodology. In applying the market yield valuation methodology, we determine the fair value based on such factors as market participant assumptions including synthetic credit ratings, estimated remaining life, current market yield and interest rate spreads of similar securities as of the measurement date. If, in our judgment, the market yield methodology is not sufficient or appropriate, we may use additional methodologies such as an asset liquidation or expected recovery model. For equity securities of portfolio companies and partnership interests, we determine the fair value based on the market approach with value then attributed to equity or equity like securities using the enterprise value waterfall valuation methodology. Under the enterprise value waterfall valuation methodology, we determine the enterprise fair value of the portfolio company and then waterfall the enterprise value over the portfolio company’s securities in order of their preference relative to one another. To estimate the enterprise value of the portfolio company, we weigh some or all of the traditional market valuation methods and factors based on the individual circumstances of the portfolio company in order to estimate the enterprise value. The methodologies for performing investments may be based on, among other things: valuations of comparable public companies, recent sales of private and public comparable companies, discounting the forecasted cash flows of the portfolio company, third party valuations of the portfolio company, considering offers from third parties to buy the company, estimating the value to potential strategic buyers and considering the value of recent investments in the equity securities of the portfolio company. For non-performing investments, we may estimate the liquidation or collateral value of the portfolio company’s assets and liabilities. We also take into account historical and anticipated financial results. Our investment in Saratoga Note 4. Investment in Saratoga Investment Corp. CLO 2013-1, Ltd. (“Saratoga CLO”) On January 22, 2008, The Saratoga CLO remains At February 28, At February 29, 2016, the Company determined that the fair value of its investment in the subordinated notes of Saratoga CLO was $12.8 million. The Company determines the fair value of its investment in the subordinated notes of Saratoga CLO based on the present value of the projected future cash flows of the subordinated notes over the life of Saratoga CLO. At February 29, 2016, Saratoga CLO had investments with a principal balance of $302.7 million and a weighted average spread over LIBOR of 4.3%, and had debt with a principal balance of $282.4 million with a weighted average spread over LIBOR of 1.8%. As a result, Saratoga CLO earns a “spread” between the interest income it receives on its investments and the interest expense it pays on its debt and other operating expenses, which is distributed quarterly to the Company as the holder of its subordinated notes. At February The separate audited financial statements of Saratoga CLO as of February 28, Note 5. Income Taxes The Company intends to operate so as to qualify to be taxed as a RIC under Subchapter M of the Code and, as such, will not be subject to federal income tax on the portion of taxable income and gains distributed to stockholders. The Company owns 100.0% of Saratoga CLO, an exempted company incorporated in the Cayman Islands. For financial reporting purposes, the Saratoga CLO is not included as part of the consolidated financial statements. For federal income tax purposes, the Company has requested and received approval from the To qualify as a RIC, the Company is required to meet certain income and asset diversification tests in addition to distributing at least 90.0% of its investment company taxable income, as defined by the Code. Because federal income tax regulations differ from U.S. GAAP, distributions in accordance with tax regulations may differ from net investment income and realized gains recognized for financial reporting purposes. Differences may be permanent or temporary in nature. Permanent differences are reclassified among capital accounts in the financial statements to reflect their tax character. Differences in classification may also result from the treatment of short-term gains as ordinary income for tax purposes. As of February 28, February 28, February 28, Accumulated net investment income/(loss) $ (1,691 ) $ (1,155 ) Accumulated net realized gains (losses) on investments 1,691 1,155 Additional paid-in-capital — — Accumulated net investment income (loss) Accumulated net realized gains on investments Additional paid-in-capital For income tax purposes, distributions paid to shareholders are reported as ordinary income, return of capital, long term capital gains or a combination thereof. The tax character of distributions paid for the years ended February 28, February 28, February 28, Ordinary Income $ 12,535 $ 16,476 Capital gains — — Return of capital — — Total $ 12,535 $ 16,476 Ordinary Income Capital gains Return of capital Total For federal income tax purposes, as of February 28, For federal income tax purposes, as of February At February 28, February 28, February 28, Post October loss deferred $ — $ — Accumulated capital losses (64,101 ) (58,248 ) Other temporary differences (304 ) (1,515 ) Undistributed ordinary income 963 3,927 Unrealized depreciation (41 ) (2,750 ) Total components of accumulated losses $ (63,483 ) $ (58,586 ) Post October loss deferred Accumulated capital losses Other temporary differences Undistributed ordinary income Unrealized depreciation Total components of accumulated losses The Company 2018. At February 28, The Company is subject to a nondeductible U.S. federal excise tax of 4.0% on undistributed income if it does not distribute at least 98% of its ordinary income in any calendar year and 98.2% of its capital gain net income for each one-year period ending on October 31 of such calendar year. Depending on the level of Investment Company Taxable Income (“ICTI”) earned in a tax year, the Company may choose to carry forward ICTI in excess of current year dividend distributions into the next tax year and pay a 4.0% excise tax on such income, as required. To the extent that the Company determines that its estimated current year annual taxable income will be in excess of estimated current year dividend distributions for excise tax purposes, the Company accrues excise tax, if any, on estimated excess taxable income as taxable income is earned. Any such carryover ICTI must be distributed before the end of that next tax year through a dividend declared prior to filing the final tax return related to the year which generated such ICTI. For the calendar year ended December 31, 2016, the Company did not distribute at least 98% of its ordinary income and 98.2% of its capital gains and subsequently paid $44,770 in federal excise taxes. Management has analyzed the Company’s tax positions taken on federal income tax returns for all open years (fiscal years On December 22, 2010, the Regulated Investment Company Modernization Act of 2010 (the “Modernization Act”) was enacted, and the provisions with the Modernization Act are effective for the Company for the year ended February 29, 2012. The Modernization Act is the first major piece of legislation affecting RICs since 1986 and it modernizes several of the federal income and excise tax provisions related to RICs. Some highlights of the enacted provisions are as follows: New capital losses may now be carried forward indefinitely, and retain the character of the original loss. Under pre-enactment law, capital losses could be carried forward for eight years, and carried forward as short-term capital, irrespective of the character of the original loss. The Modernization Act contains simplification provisions, which are aimed at preventing disqualification of a RIC for “inadvertent” failures of the asset diversification and/or qualifying income tests. Additionally, the Modernization Act exempts RICs from the preferential dividend rule, and repealed the 60-day designation requirement for certain types of pay-through income and gains. Finally, the Modernization Act contains several provisions aimed at preserving the character of distributions made by a fiscal year RIC during the portion of its taxable year ending after October 31 or December 31, reducing the circumstances under which a RIC might be required to file amended Forms 1099 to restate previously reported distributions. SIA Avionte, Inc., SIA Easy Ice, LLC, SIA GH Inc., SIA Mercury, Inc., SIA TT, Inc., and SIA Vector, Inc., 100% owned by the Company, are each filing standalone C Corporation tax returns for federal and state purposes. As separately regarded entities for tax purposes, these entities are taxed at normal corporate rates. For tax purposes, any distributions by the entities to the parent company would generally need to be distributed to the Company’s shareholders. Generally, such distributions of the entities’ income to the Company’s shareholders will be considered as qualified dividends for tax purposes. The entities taxable net income will differ from U.S. GAAP net income because of deferred tax temporary differences adjustments. Deferred tax temporary differences may include differences for state taxes and joint venture interests. Note 6. Agreements On July 30, 2010, the Company entered into the Management Agreement with our Manager. The initial term of the Management Agreement The base management fee of 1.75% is calculated based on the average value of our gross assets (other than cash or cash equivalents, but including assets purchased with borrowed funds) at the end of the two most recently completed fiscal quarters. The incentive fee consists of the following two parts: The first, payable quarterly in arrears, equals 20.0% of our pre-incentive fee net investment income, expressed as a rate of return on the value of our net assets at the end of the immediately preceding quarter, that exceeds a 1.875% quarterly to quarter, and accordingly there is no claw back of amounts previously paid if subsequent quarters are below the quarterly hurdle rate, and there is no delay of payment if prior quarters are below the quarterly hurdle rate. The second part of the incentive fee is determined and payable in arrears as of the end of each fiscal year (or upon termination of the Management Agreement) and equals 20.0% of our “incentive fee capital gains,” which equals our realized capital gains on a cumulative basis from May 31, 2010 through the end of the fiscal year, if any, computed net of all realized capital losses and unrealized capital depreciation on a cumulative basis, less the aggregate amount of any previously paid capital gain incentive fee. Importantly, the capital gains portion of the incentive fee is based on realized gains and realized and unrealized losses from May 31, 2010. Therefore, realized and unrealized losses incurred prior to such time will not be taken into account when calculating the capital gains portion of the incentive fee, and our Manager will be entitled to 20.0% of incentive fee capital gains that arise after May 31, 2010. In addition, for the purpose of the “incentive fee capital gains” calculations, the cost basis for computing realized gains and losses on investments held by us as of May 31, 2010 will equal the fair value of such investments as of such date. For the years ended February 28, payable in the accompanying consolidated statements of assets and liabilities. As of February 29, 2016, the base management fees accrual was $1.2 million and the incentive fees accrual was $4.4 million and is included in base management and incentive fees payable in the accompanying consolidated statements of assets and liabilities. On July 30, 2010, the Company entered into a separate administration agreement (the “Administration Agreement”) with our Manager, pursuant to which our Manager, as our administrator, has agreed to furnish us with the facilities and administrative services necessary to conduct our day-to-day operations and provide managerial assistance on our behalf to those portfolio companies to which we are required to provide such assistance. The initial term of the Administration Agreement On October 5, 2016, our board of directors determined to increase the cap on the payment or reimbursement of expenses by the Company under the Administration Agreement, from $1.3 million to $1.5 million, effective November 1, 2016. For the years ended February 28, Note 7. Borrowings Credit Facility As a BDC, we are only allowed to employ leverage to the extent that our asset coverage, as defined in the 1940 Act, equals at least 200.0% after giving effect to such leverage. The amount of leverage that we employ at any time depends on our assessment of the market and other factors at the time of any proposed borrowing. On April 11, 2007, we entered into a $100.0 million revolving securitized credit facility (the “Revolving Facility”). On May 1, 2007, we entered into a $25.7 million term securitized credit facility (the “Term Facility” and, together with the Revolving Facility, the “Facilities”), which was fully drawn at closing. In December 2007, we consolidated the Facilities by using a draw under the Revolving Facility to repay the Term Facility. In response to the market wide decline in financial asset prices, which negatively affected the value of our portfolio, we terminated the revolving period of the Revolving Facility effective January 14, 2009 and commenced a two-year amortization period during which all principal proceeds from the collateral In March 2009, we amended the Revolving Facility to increase the portion of the portfolio that could be invested in “CCC” rated investments in return for an increased interest rate and expedited amortization. As a result of these transactions, we expected to have additional cushion under our borrowing base under the Revolving Facility that would allow us to better manage our capital in times of declining asset prices and market dislocation. On July 30, 2009, we exceeded the permissible borrowing limit under the Revolving Facility for 30 consecutive days, resulting in an event of default under the Revolving Facility. As a result of this event of default, our lender had the right to accelerate repayment of the outstanding indebtedness under the Revolving Facility and to foreclose and liquidate the collateral pledged thereunder. Acceleration of the outstanding indebtedness and/or liquidation of the collateral could have had a material adverse effect on our liquidity, financial condition and operations. On July 30, 2010, we used the net proceeds from (i) the stock purchase transaction and (ii) a portion of the funds available to us under the $45.0 million senior secured revolving credit facility (the “Credit Facility”) with Madison Capital Funding LLC, in each case, On February 24, 2012, we amended our senior secured revolving credit facility with Madison Capital Funding LLC to, among other things: On September 17, 2014, we entered into a second amendment to the Credit Facility with Madison Capital Funding LLC to, among other things: As of February 28, was 6.00%. During the year ended February 29, 2016, the average dollar amount of outstanding borrowings under the Credit Facility was $4.4 million. The Credit Facility contains limitations as to how borrowed funds may be used, such as restrictions on industry concentrations, asset size, weighted average life, currency denomination and collateral interests. The Credit Facility also includes certain requirements relating to portfolio performance, the violation of which could result in the limit of further advances and, in some cases, result in an event of default, allowing the lenders to accelerate repayment of amounts owed thereunder. The Credit Facility has an eight year term, consisting of a three year period (the “Revolving Period”), under which the Company may make and repay borrowings, and a final maturity five years from the end of the Revolving Period. Availability on the Credit Facility will be subject to a borrowing base calculation, based on, among other things, applicable advance rates (which vary from 50.0% to 75.0% of par or fair value depending on the type of loan asset) and the value of certain “eligible” loan assets included as part of the Borrowing Base. Funds may be borrowed at the greater of the prevailing LIBOR rate and 2.00%, plus an applicable margin of 5.50%. At the Company’s option, funds may be borrowed based on an alternative base rate, which in no event will be less than 3.00%, and the applicable margin over such alternative base rate is 4.50%. In addition, the Company will pay the lenders a commitment fee of 0.75% per year on the unused amount of the Credit Facility for the duration of the Revolving Period. Our borrowing base under the Credit Facility was SBA Debentures SBIC LP is able to borrow funds from the SBA against regulatory capital (which approximates equity capital) that is paid in and is subject to customary regulatory requirements including but not limited to an examination by the SBA. As of February 28, SBICs are designed to stimulate the flow of private equity capital to eligible small businesses. Under SBA regulations, SBICs may make loans to eligible small businesses and invest in the equity securities of small businesses. Under present SBA regulations, eligible small businesses include businesses that have a tangible net worth not exceeding SBIC LP is subject to regulation and oversight by the SBA, including requirements with respect to maintaining certain minimum financial ratios and other covenants. Receipt of an SBIC license does not assure that SBIC LP will receive The Company received exemptive relief from the coverage test under the 1940 Act. This allows the Company increased flexibility under the 200.0% asset coverage test by permitting it to borrow up to $150.0 million more than it would otherwise be able to absent the receipt of this exemptive relief. As of February 28, In December 2015, the 2016 omnibus spending bill approved by Congress and signed into law by the President increased the amount of SBA-guaranteed debentures that affiliated SBIC funds can have outstanding from $225.0 million to $350.0 million, subject to SBA approval. SBA regulations currently limit the amount of SBA-guaranteed debentures that an SBIC may issue to $150.0 million when it has at On April 2, 2015, the SBA issued a “green light” letter inviting the Company to continue the application process to obtain a license to form and operate its second SBIC subsidiary. On September 27, 2016, the SBA informed us that as part of their continued review of our application for a second license, and in order to ensure that they were reviewing the most current information available, we would need to update all previously submitted materials and invited us to reapply. As a result of this request, with which we are in the process of complying, the existing “green light” letter that the SBA issued to us has expired. If approved in the future, a second SBIC license would provide us an incremental source of long-term capital by permitting us to issue up to $150.0 million of additional SBA-guaranteed debentures in addition to the $150.0 million already approved under the first license. Notes On May 10, 2013, the Company issued $42.0 million in aggregate principal amount of 7.50% fixed-rate notes due 2020 (the On May 17, 2013, the Company closed an additional $6.3 million in aggregate principal amount of the 2020 Notes, pursuant to the full exercise of the underwriters’ option to purchase additional 2020 Notes. On May 29, 2015, the Company entered into a Debt Distribution Agreement with Ladenburg Thalmann & Co. through which the Company may offer for sale, from time to time, up to $20.0 million in aggregate principal amount of the 2020 Notes through an At-the-Market (“ATM”) offering. As of February 28, 2017, the Company sold 539,725 bonds with a principal of $13,493,125 at an average price of $25.31 for aggregate net proceeds of $13,385,766 (net of transaction costs). On December 21, 2016, the Company issued $74.5 million in aggregate principal amount of our 6.75% fixed-rate notes due 2023 (the “2023 Notes”) for net proceeds of $71.7 million after deducting underwriting commissions of approximately $2.3 million and offering costs of approximately $0.5 million. The issuance included the exercise of substantially all of the underwriters’ option to purchase an additional $9.8 million aggregate principal amount of 2023 Notes within 30 days. Interest on the 2023 Notes is paid quarterly in arrears on March 15, June 15, September 15 and December 15, at a rate of 6.75% per year, beginning March 30, 2017. The 2023 Notes mature on December 30, 2023, and commencing December 21, 2019, may be redeemed in whole or in part at any time or from time to time at our option. The net proceeds from the offering were used to repay all of the outstanding indebtedness under the 2020 Notes, which amounts to $61.8 million, and for general corporate purposes in accordance with our investment objective and strategies. The 2023 Notes are listed on the NYSE under the trading symbol “SAB” with a par value of $25.00 per share. The remaining unamortized deferred debt financing costs of $1.5 million (including underwriting commissions and net of issuance premiums), was recorded within loss on debt extinguishment in the consolidated statements of operations when the related 2020 Notes were extinguished. As of February 28, 2017, $2.8 million of financing costs related to the 2023 Notes have been capitalized and are being amortized over the term of the 2023 Notes. As of February 28, Note 8. Commitments and contingencies Contractual obligations The following table shows our payment obligations for repayment of debt and other contractual obligations at February 28, Payment Due by Period Total Less Than 1 - 3 3 - 5 More Than ($ in thousands) Long-Term Debt Obligations $ 98,300 $ — $ — $ — $ 98,300 Long-Term Debt Obligations Off-balance sheet arrangements The Company’s off-balance sheet arrangements consisted of A summary of the composition of the unfunded commitments as of February 28, 2017 and February 29, 2016 is shown in the table below (dollars in thousands): Avionte Holdings, LLC GreyHeller LLC Identity Automation Systems Total Note 9. Directors Fees The independent directors receive an annual fee of $40,000. They also receive $2,500 plus reimbursement of reasonable out-of-pocket expenses incurred in connection with attending each board meeting and receive $1,000 plus reimbursement of reasonable out-of-pocket expenses incurred in connection with attending each committee meeting. In addition, the chairman of the Audit Committee receives an annual fee of $5,000 and the chairman of each other committee receives an annual fee of $2,000 for their additional services in these capacities. In addition, we have purchased directors’ and officers’ liability insurance on behalf of our directors and officers. Independent directors have the option to receive their directors’ fees in the form of our common stock issued at a price per share equal to the greater of net asset value or the market price at the time of payment. No compensation is paid to directors who are “interested persons” of the Company (as such term is defined in the 1940 Act). For the years ended February 28, Note 10. Stockholders’ Equity On May 16, 2006, GSC Group, Inc. capitalized the LLC, by contributing $1,000 in exchange for 67 shares, constituting all of the issued and outstanding shares of the LLC. On March 20, 2007, the Company issued 95,995.5 and 8,136.2 shares of common stock, priced at $150.00 per share, to GSC Group and certain individual employees of GSC Group, respectively, in exchange for the general partnership interest and a limited partnership interest in GSC Partners CDO III GP, LP, collectively valued at $15.6 million. At this time, the 6.7 shares owned by GSC Group in the LLC were exchanged for 6.7 shares of the Company. On March 28, 2007, the Company completed its IPO of 725,000 shares of common stock, priced at $150.00 per share, before underwriting discounts and commissions. Total proceeds received from the IPO, net of $7.1 million in underwriter’s discount and commissions, and $1.0 million in offering costs, were $100.7 million. On November 13, 2009, we declared a dividend of $18.25 per share payable on December 31, 2009. Shareholders had the option to receive payment of the dividend in cash, shares of common stock, or a combination of cash and shares of common stock, provided that the aggregate cash payable to all shareholders was limited to $2.1 million or $2.50 per share. Based on shareholder elections, the dividend consisted of $2.1 million in cash and 864,872.5 of newly issued shares of common stock. On July 30, 2010, our Manager and its affiliates purchased 986,842 shares of common stock at $15.20 per share. Total proceeds received from this sale were $15.0 million. On August 12, 2010, we effected a one-for-ten reverse stock split of our outstanding common stock. As a result of the reverse stock split, every ten shares of our common stock were converted into one share of our common stock. Any fractional shares received as a result of the reverse stock split were redeemed for cash. The total cash payment in lieu of shares was $230. Immediately after the reverse stock split, we had 2,680,842 shares of our common stock outstanding. On November 12, 2010, we declared a dividend of $4.40 per share payable on December 29, 2010. Shareholders had the option to receive payment of the dividend in cash, shares of common stock, or a combination of cash and shares of common stock, provided that the aggregate cash payable to all shareholders was limited to approximately $1.2 million or $0.44 per share. Based on shareholder elections, the dividend consisted of approximately $1.2 million in cash and 596,235 shares of common stock. On November 15, 2011, we declared a dividend of $3.00 per share payable on December 30, 2011. Shareholders had the option to receive payment of the dividend in cash, shares of common stock, or a combination of cash and shares of common stock, provided that the aggregate cash payable to all shareholders was limited to approximately $2.0 million or $0.60 per share. Based on shareholder elections, the dividend consisted of approximately $2.0 million in cash and 599,584 shares of common stock. On November 9, 2012, the Company declared a dividend of $4.25 per share payable on December 31, 2012. Shareholders had the option to receive payment of the dividend in cash, shares of common stock, or a combination of cash and shares of common stock, provided that the aggregate cash payable to all shareholders was limited to approximately $3.3 million or $0.85 per share. Based on shareholder elections, the dividend consisted of approximately $3.3 million in cash and 853,455 shares of common stock. On October 30, 2013, the Company declared a dividend of $2.65 per share payable on December 27, 2013. Shareholders had the option to receive payment of the dividend in cash, shares of common stock, or a combination of cash and shares of common stock, provided that the aggregate cash payable to all shareholders was limited to approximately $2.5 million or $0.53 per share. Based on shareholder elections, the dividend consisted of approximately $2.5 million in cash and 649,500 shares of common stock. On September 24, 2014, the Company declared a dividend of $0.18 per share payable on November 28, 2014. Shareholders had the option to receive payment of the dividend in cash, or receive shares of common stock pursuant to the Company’s DRIP. Based on shareholder elections, the dividend consisted of approximately $0.6 million in cash and 22,283 newly issued shares of common stock. On September 24, 2014, the Company declared a dividend of $0.22 per share payable on February 27, 2015. Shareholders had the option to receive payment of the dividend in cash, or receive shares of common stock, pursuant our DRIP. Based on shareholder elections, the dividend consisted of approximately $0.8 million in cash and 26,858 newly issued shares of common stock. On April 9, 2015, the Company declared a dividend of $0.27 per share payable on May 29, 2015. Shareholders had the option to receive payment of the dividend in cash, or receive shares of common stock, pursuant our DRIP. Based on shareholder elections, the dividend consisted of approximately $0.9 million in cash and 33,766 newly issued shares of common stock. On May 14, 2015, the Company declared a special dividend of $1.00 per share payable on June 5, 2015. Shareholders had the option to receive payment of the dividend in cash, or receive shares of common stock, pursuant our DRIP. Based on shareholder elections, the dividend consisted of approximately $3.4 million in cash and 126,230 newly issued shares of common stock. On July 8, 2015, the Company declared a dividend of $0.33 per share payable on August 31, 2015. Shareholders had the option to receive payment of the dividend in cash, or receive shares of common stock, pursuant our DRIP. Based on shareholder elections, the dividend consisted of approximately $1.1 million in cash and 47,861 newly issued shares of common stock. On October 7, 2015, the Company declared a dividend of $0.36 per share payable on November 30, 2015. Shareholders had the option to receive payment of the dividend in cash, or receive shares of common stock, pursuant our DRIP. Based on shareholder elections, the dividend consisted of approximately $1.1 million in cash and 61,029 newly issued shares of common stock. On January 12, 2016, the Company declared a dividend of $0.40 per share payable on February 29, 2016. Shareholders had the option to receive payment of the dividend in cash, or receive shares of common stock, pursuant our DRIP. Based on shareholder elections, the dividend consisted of approximately $1.4 million in cash and 66,765 newly issued shares of common stock. On March 31, 2016, the Company declared a dividend of $0.41 per share payable on April 27, 2016. Shareholders had the option to receive payment of the dividend in cash, or receive shares of common stock, pursuant our DRIP. Based on shareholder elections, the dividend consisted of approximately $1.5 million in cash and 56,728 newly issued shares of common stock. On July 7, 2016, the Company declared a dividend of $0.43 per share payable on August 9, 2016. Shareholders had the option to receive payment of the dividend in cash, or receive shares of common stock, pursuant our DRIP. Based on shareholder elections, the dividend consisted of approximately $1.5 million in cash and 58,167 newly issued shares of common stock. On August 8, 2016, the Company declared a special dividend of $0.20 per share payable on September 5, 2016. Shareholders had the option to receive payment of the dividend in cash, or receive shares of common stock, pursuant our DRIP. Based on shareholder elections, the dividend consisted of approximately $0.7 million in cash and 24,786 newly issued shares of common stock. On October 5, 2016, the Company declared a dividend of $0.44 per share payable on November 9, 2016. Shareholders had the option to receive payment of the dividend in cash, or receive shares of common stock, pursuant our DRIP. Based on shareholder elections, the dividend consisted of approximately $1.5 million in cash and 58,548 newly issued shares of common stock. On January 12, 2017, the Company declared a dividend of $0.45 per share payable on February 9, 2017. Shareholders had the option to receive payment of the dividend in cash, or receive shares of common stock, pursuant our DRIP. Based on shareholder elections, the dividend consisted of approximately $1.6 million in cash and 50,453 newly issued shares of common stock. On September 24, 2014, the Company announced the approval of an open market share repurchase plan that allowed it to repurchase up to 200,000 shares of its common stock at prices below its NAV as reported in its then most recently published consolidated financial statements. On October 7, 2015, the Company’s board of directors extended the open market share repurchase plan for another year and increased the number of shares the Company is permitted to repurchase at prices below its NAV, as reported in its then most recently published consolidated financial statements, to 400,000 shares of its common stock. On October 5, 2016, the Company’s board of directors extended the open market share repurchase plan for another year to October 15, 2017 and increased the number of shares the Company is permitted to repurchase at prices below its NAV, as reported in its then most recently published consolidated financial statements, to 600,000 shares of its common stock. As of February 28, 2017, the Company purchased 218,491 shares of common stock, at the average price of $16.87 for approximately $3.7 million pursuant to this repurchase plan. Note 11. Summarized Financial Information of Our Unconsolidated Subsidiary In accordance with SEC Regulation S-X Rules 3-09 and 4-08(g), the Company must determine which of its unconsolidated controlled portfolio companies, if any, are considered “significant subsidiaries.” After performing this analysis, the Company determined that one of its portfolio companies, Easy Ice, LLC (“Easy Ice”) is a significant subsidiary for the year ended February 28, 2017 under at least one of the significance conditions of Rule 4-08(g) of SEC Regulation S-X. Accordingly, audited financial information for the years ended December 31, 2016, 2015 and 2014 have been included as follows (in thousands): Balance Sheet – Easy Ice, LLC Current assets Noncurrent assets Current liabilities Noncurrent liabilities Total deficit Statements of Operations – Easy Ice, LLC Rental income Rental expenses Gross margin Operating expenses Income (loss) from operations Net loss Note 12. Earnings Per Share In accordance with the provisions of FASB ASC 260, The following information sets forth the computation of the weighted average basic and diluted net Basic and diluted February 28, February 28, February 29, Net increase in net assets from operations $ 8,744 $ 14,602 $ 13,275 Net increase in net assets resulting from operations Weighted average common shares outstanding 4,920,517 4,110,484 3,434,345 Earnings per common share-basic and diluted $ 1.78 $ 3.55 $ 3.87 Weighted average earnings per common share Note 13. Dividend Based on shareholder elections, the dividend consisted of approximately $1.6 million in cash and 50,453 newly issued shares of common stock, or 0.9% of our outstanding common stock prior to the dividend payment. The number of shares of common stock comprising the stock portion was calculated based on a price of $20.25 per share, which equaled the volume weighted average trading price per share of the common stock on January 27, 30, 31 and February 1, 2, 3, 6, 7, 8 and 9, 2017. On October 5, 2016, the Company declared a dividend of $0.44 per share, which was paid on November 9, 2016, to common stockholders of record as of October 31, 2016. Shareholders had the option to receive payment of the dividend in cash, or receive shares of common stock, pursuant to our DRIP. Based on shareholder elections, the dividend consisted of approximately $1.5 million in cash and 58,548 newly issued shares of common stock, or 1.0% of our outstanding common stock prior to the dividend payment. The number of shares of common stock comprising the stock portion was calculated based on a price of $17.12 per share, which equaled the volume weighted average trading price per share of the common stock on October 27, 28, 31 and November 1, 2, 3, 4, 7, 8 and 9, 2016. On August 8, 2016, the Company declared a special dividend of $0.20 per share, which was paid on September 5, 2016, to common stockholders of record as of August 24, 2016. Shareholders had the option to receive payment of the dividend in cash, or receive shares of common stock, pursuant to our DRIP. Based on shareholder elections, the dividend consisted of approximately $0.7 million in cash and 24,786 newly issued shares of common stock, or 0.4% of our outstanding common stock prior to the dividend payment. The number of shares of common stock comprising the stock portion was calculated based on a price of $17.06 per share, which equaled the volume weighted average trading price per share of the common stock on August 22, 23, 24, 25, 26, 29, 30, 31 and September 1 and 2, 2016. On July 7, 2016, the Company declared a dividend of $0.43 per share, which was paid on August 9, 2016, to common stockholders of record as of July 29, 2016. Shareholders had the option to receive payment of the dividend in cash, or receive shares of common stock, pursuant to our DRIP. Based on shareholder elections, the dividend consisted of approximately $1.5 million in cash and 58,167 newly issued shares of common stock, or 1.0% of our outstanding common stock prior to the dividend payment. The number of shares of common stock comprising the stock portion was calculated based on a price of $16.32 per share, which equaled the volume weighted average trading price per share of the common stock on July 27, 28, 29 and August 1, 2, 3, 4, 5, 8 and 9, 2016. On March 31, 2016, the Company declared a dividend of $0.41 per share, which was paid on April 27, 2016, to common stockholders of record as of April 15, 2016. Shareholders had the option to receive payment of the dividend in cash, or receive shares of common stock, pursuant to our DRIP. Based on shareholder elections, the dividend consisted of approximately $1.5 million in cash and 56,728 newly issued shares of common stock, or 1.0% of our outstanding common stock prior to the dividend payment. The number of shares of common stock comprising the stock portion was calculated based on a price of $15.43 per share, which equaled the volume weighted average trading price per share of the common stock on April 14, 15, 18, 19, 20, 21, 22, 25, 26 and 27, 2016. On January 12, 2016, the Company declared a dividend of $0.40 per share, which was paid on February 29, 2016, to common stockholders of record on February 1, 2016. Shareholders had the option to receive payment of the dividend in cash, or receive shares of common stock, pursuant to our DRIP. Based on shareholder elections, the dividend consisted of approximately $1.4 million in cash and 66,765 newly issued shares of common stock, or 1.2% of the Company’s outstanding common stock prior to the dividend payment. The number of shares of common stock comprising the stock portion was calculated based on a price of $13.11 per share, which equaled the volume weighted average trading price per share of the common stock on February 16, 17, 18, 19, 22, 23, 24, 25, 26 and 29, 2016. On October 7, 2015, the Company declared a dividend of $0.36 per share, which was paid on November 30, 2015, to common stockholders of record on November 2, 2015. Shareholders had the option to receive payment of the dividend in cash, or receive shares of common stock, pursuant to our DRIP. Based on shareholder elections, the dividend consisted of approximately $1.1 million in cash and 61,029 newly issued shares of common stock, or 1.1% of the Company’s outstanding common stock prior to the dividend payment. The number of shares of common stock comprising the stock portion was calculated based on a price of $14.53 per share, which equaled the volume weighted average trading price per share of the common stock on November 16, 17, 18, 19, 20, 23, 24, 25, 27 and 30, 2015. On July 8, 2015, the Company declared a dividend of $0.33 per share, which was paid on August 31, 2015, to common stockholders of record on August 3, 2015. Shareholders had the option to receive payment of the dividend in cash, or receive shares of common stock, pursuant to our DRIP. Based on shareholder elections, the dividend consisted of approximately $1.1 million in cash and 47,861 newly issued shares of common stock, or 0.9% of the Company’s outstanding common stock prior to the dividend payment. The number of shares of common stock comprising the stock portion was calculated based on a price of $15.28 per share, which equaled the volume weighted average trading price per share of the common stock on August 18, 19, 20, 21, 24, 25, 26, 27, 28 and 31, 2015. On May 14, 2015, the Company declared a special dividend of $1.00 per share, which was paid on June 5, 2015, to common stockholders of record on May 26, 2015. Shareholders had the option to receive payment of the dividend in cash, or receive shares of common stock, pursuant to our DRIP. Based on shareholder elections, the dividend consisted of approximately $3.4 million in cash and 126,230 newly issued shares of common stock, or 2.3% of the Company’s outstanding common stock prior to the dividend payment. The number of shares of common stock comprising the stock portion was calculated based on a price of $16.47 per share, which equaled the volume weighted average trading price per share of the common stock on May 22, 26, 27, 28, 29 and June 1, 2, 3, 4, and 5, 2015. On April 9, 2015, the Company declared a dividend of $0.27 per share, which was paid on May 29, 2015, to common stockholders of record on May 4, 2015. Shareholders had the option to receive payment of the dividend in cash, or receive shares of common stock, pursuant to our DRIP. Based on shareholder elections, the dividend consisted of approximately $0.9 million in cash and 33,766 newly issued shares of common stock, or 0.6% of the Company’s outstanding common stock prior to the dividend payment. The number of shares of common stock comprising the stock portion was calculated based on a price of $16.78 per share, which equaled the volume weighted average trading price per share of the common stock on May 15, 18, 19, 20, 21, 22, 26, 27, 28 and 29, 2015. On September 24, 2014, the Company declared a dividend of $0.22 per share, which was paid on February 27, 2015. Shareholders have the option to receive payment of the dividend in cash, or receive shares of common stock pursuant to the Company’s DRIP. Based on shareholder elections, the dividend consisted of approximately $0.8 million in cash and 26,858 newly issued shares of common stock, or 0.5% of our outstanding common stock prior to the dividend payment. The number of shares of common stock comprising the stock portion was calculated based on a price of $14.97 per share, which equaled the volume weighted average trading price per share of the common stock on February 13, 17, 18, 19, 20, 23, 24, 25, 26 and 27, 2015. On September 24, 2014, the Company declared a dividend of $0.18 per share, which was paid on November 28, 2014. Shareholders had the option to receive payment of the dividend in cash, or receive shares of common stock pursuant to the Company’s DRIP. Based on shareholder elections, the dividend consisted of approximately $0.6 million in cash and 22,283 newly issued shares of common stock, or 0.4% of our outstanding common stock prior to the dividend payment. The number of shares of common stock comprising the stock portion was calculated based on a price of $14.37 per share, which equaled the volume weighted average trading price per share of the common stock on November 14, 17, 18, 19, 20, 21, 24, 25, 26 and 28, 2014. On October 30, 2013, the Company declared a dividend of $2.65 per share, This dividend was declared in reliance on certain private letter rulings issued by the IRS concluding that a RIC may treat a distribution of its own stock as fulfilling its RIC distribution requirements if each stockholder may elect to receive his or her entire distribution in either cash or stock of the RIC subject to a limitation on the aggregate amount of cash to be distributed to all stockholders, which limitation must be at least 20.0% of the aggregate declared distribution. Based on shareholder elections, the dividend consisted of approximately $2.5 million in cash and 649,500 shares of common stock, or 13.7% of our outstanding common stock prior to the dividend payment. The number of shares of common stock comprising the stock portion was calculated based on a price of $15.439 per share, which equaled the volume weighted average trading price per share of the common stock on December 11, 13, and 16, 2013. On November 9, 2012, the Company declared a dividend of $4.25 per share, Based on shareholder elections, the dividend consisted of approximately $3.3 million in cash and 853,455 shares of common stock, or 22.0% of our outstanding common stock prior to the dividend payment. The amount of cash elected to be received was greater than the cash limit of 20.0% of the aggregate dividend amount, thus resulting in the payment of a combination of cash and stock to shareholders who elected to receive cash. The number of shares of common stock comprising the stock portion was calculated based on a price of $15.444 per share, which equaled the volume weighted average trading price per share of the common stock on December 14, 17, and 19, 2012. On November 15, 2011, of cash and shares of common stock, provided that the aggregate cash payable to all shareholders was limited to approximately $2.0 million or $0.60 per share. Based on shareholder elections, the dividend consisted of approximately $2.0 million in cash and 599,584 shares of common stock, or 18.0% of our outstanding common stock prior to the dividend payment. The amount of cash elected to be received was greater than the cash limit of 20.0% of the aggregate dividend amount, thus resulting in the payment of a combination of cash and stock to shareholders who elected to receive cash. The number of shares of common stock comprising the stock portion was calculated based on a price of $13.1171 per share, which equaled the volume weighted average trading price per share of the common stock on December 20, 21 and 22, 2011. On November 12, 2010, Based on shareholder elections, the dividend consisted of approximately $1.2 million in cash and 596,235 shares of common stock, or 22.0% of our outstanding common stock prior to the dividend payment. The amount of cash elected to be received was greater than the cash limit of 10.0% of the aggregate dividend amount, thus resulting in the payment of a combination of cash and stock to shareholders who elected to receive cash. The number of shares of common stock comprising the stock portion was calculated based on a price of $17.8049 per share, which equaled the volume weighted average trading price per share of the common stock on December 20, 21 and 22, 2010. The consolidated financial statements for the period ended November 30, 2010 have been retroactively adjusted to reflect the increase in common stock as a result of the dividend in accordance with the provisions of ASC 505-20-S50 regarding disclosure of a capital structure change after the interim balance sheet but before the release of the financial statements. The following tables summarize dividends declared Date Declared Record Date Payment Date Amount Total October 30, 2013 November 13, 2013 December 27, 2013 $ 2.65 $ 12,535 January 12, 2017 October 5, 2016 August 8, 2016 July 7, 2016 March 31, 2016 Total dividends declared $ 2.65 $ 12,535 Date Declared Record Date Payment Date Amount Total November 9, 2012 November 20, 2012 December 31, 2012 $ 4.25 $ 16,476 January 12, 2016 October 7, 2015 July 8, 2015 May 14, 2015 April 9, 2015 Total dividends declared $ 4.25 $ 16,476 Date Declared Record Date Payment Date Amount Total November 15, 2011 November 25, 2011 December 30, 2011 $ 3.00 $ 9,831 September 24, 2014 September 24, 2014 Total dividends declared $ 3.00 $ 9,831 Date Declared Record Date Payment Date Amount Total November 12, 2010 November 19, 2010 December 29, 2010 $ 4.40 $ 11,796 Total dividends declared $ 4.40 $ 11,796 Date Declared October 30, 2013 Total dividends declared Date Declared November 9, 2012 Total dividends declared Note The following is a schedule of financial highlights for the years ended February 28, Per share data: Net asset value at beginning of period Net investment income(1) Net realized and unrealized gains and losses on investments and derivatives(1) Net increase in net assets from operations Distributions declared from net investment income Total distributions to stockholders Dilution(4) Net asset value at end of period Net assets at end of period Shares outstanding at end of period Per share market value at end of period Total return based on market value(2) Total return based on net asset value(3) Ratio/Supplemental data: Ratio of net investment income to average net assets Ratio of operating expenses to average net assets Ratio of incentive management fees to average net assets Ratio of credit facility related expenses to average net assets Ratio of total expenses to average net assets Portfolio turnover rate(5) Asset coverage ratio per unit(6) Average market value per unit: Credit Facility(7) SBA Debentures(7) 2020 Notes 2023 Notes February 28, February 28, February 29, February 28, February 28, Per share data:(7) Net asset value at beginning of period $ 22.98 $ 25.12 $ 26.26 $ 32.75 $ 82.00 Net investment income(1) 1.85 1.71 1.66 2.15 5.40 Net realized and unrealized gains and losses on investments and derivatives (0.07 ) 1.84 2.21 4.81 (15.30 ) Net increase (decrease) in net assets from operations 1.78 3.55 3.87 6.96 (9.90 ) Distributions declared from net investment income (2.65 ) (4.25 ) (3.00 ) (4.40 ) (18.25 ) Distributions declared from net realized capital gains — — — — — Total distributions to stockholders (2.65 ) (4.25 ) (3.00 ) (4.40 ) (18.25 ) Other(5) (0.75 ) (1.44 ) (2.01 ) (9.05 ) (21.10 ) Net asset value at end of period $ 21.36 $ 22.98 $ 25.12 $ 26.26 $ 32.75 Net assets at end of period $ 114,924,018 $ 108,686,761 $ 97,380,150 $ 86,071,454 $ 55,478,152 Shares outstanding at end of period 5,379,616 4,730,116 3,876,661 3,277,077 1,694,010 Per share market value at end of period(7) $ 15.85 $ 17.02 $ 15.88 $ 21.25 $ 19.20 Total return based on market value(2) 9.11 % 36.67 % 12.82 % 38.25 % 113.10 % Total return based on net asset value(3) 8.92 % 16.65 % 17.51 % 0.16 % (11.92 )% Ratio/Supplemental data:(6) Ratio of net investment income to average, net assets(4)(6) 8.09 % 6.73 % 6.11 % 6.53 % 8.10 % Ratio of operating expenses to average net assets(4) 6.20 % 5.17 % 5.63 % 12.05 % 9.78 % Ratio of incentive management fees to average net assets 0.61 % 1.96 % 1.35 % 2.45 % 0.52 % Ratio of credit facility related expenses to average net assets 5.40 % 2.43 % 1.39 % 3.42 % 6.54 % Ratio of total expenses to average net assets(4) 12.21 % 9.56 % 8.36 % 12.02 % 16.84 % Portfolio turnover rate(8) 37.82 % 17.30 % 36.34 % 10.14 % 14.68 % Note 15. Selected Quarterly Data (Unaudited) ($ in thousands, except per share numbers) Interest and related portfolio income Net investment income Net realized and unrealized gain (loss) Net increase in net assets resulting from operations Net investment income per common share at end of each quarter Net realized and unrealized gain (loss) per common share at end of each quarter Dividends declared per common share Net asset value per common share 2014 ($ in thousands, except per share numbers) Qtr 4 Qtr 3 Qtr 2 Qtr 1 Interest and related portfolio income $ 5,218 $ 4,997 $ 4,792 $ 5,172 Net investment income 1,482 2,898 2,272 2,470 Net realized and unrealized gain (loss) 2,236 (1,630 ) (2,313 ) 1,330 Net increase (decrease) in net assets resulting from operations 3,718 1,268 (41 ) 3,800 Net investment income per common share at end of each quarter $ 0.28 $ 0.60 $ 0.48 $ 0.52 Net realized and unrealized gain (loss) per common share at end of each quarter $ 0.42 $ (0.34 ) $ (0.49 ) $ 0.28 Dividends declared per common share $ — $ 2.65 $ — $ — Net asset value per common share $ 21.36 $ 20.67 $ 23.77 $ 23.78 ($ in thousands, except per share numbers) Interest and related portfolio income Net investment income Net realized and unrealized gain (loss) Net increase in net assets resulting from operations Net investment income per common share at end of each quarter Net realized and unrealized gain (loss) per common share at end of each quarter Dividends declared per common share Net asset value per common share 2013 ($ in thousands, except per share numbers) Qtr 4 Qtr 3 Qtr 2 Qtr 1 Interest and related portfolio income $ 4,306 $ 3,513 $ 3,514 $ 3,111 Net investment income 1,952 2,489 1,314 1,273 Net realized and unrealized gain (loss) 3,843 (1,744 ) 3,557 1,918 Net increase in net assets resulting from operations 5,795 745 4,871 3,191 Net investment income per common share at end of each quarter $ 0.42 $ 0.63 $ 0.34 $ 0.33 Net realized and unrealized gain (loss) per common share at end of each quarter $ 0.81 $ (0.44 ) $ 0.92 $ 0.49 Dividends declared per common share $ — $ 4.25 $ — $ — Net asset value per common share $ 22.98 $ 21.75 $ 27.20 $ 25.94 2012 ($ in thousands, except per share numbers) Qtr 4 Qtr 3 Qtr 2 Qtr 1 Interest and related portfolio income $ 2,946 $ 3,033 $ 2,887 $ 2,387 Net investment income 1,578 824 2,720 578 Net realized and unrealized gain (loss) 1,502 5,389 (4,448 ) 5,131 Net increase (decrease) in net assets resulting from operations 3,080 6,213 (1,728 ) 5,709 Net investment income per common share at end of each quarter $ 0.40 $ 0.25 $ 0.83 $ 0.17 Net realized and unrealized gain (loss) per common share at end of each quarter $ 0.39 $ 1.63 $ (1.36 ) $ 1.57 Dividends declared per common share $ — $ 3.00 $ — $ — Net asset value per common share $ 25.12 $ 24.32 $ 27.48 $ 28.01 Note 16. Subsequent Events On February 28, On March 16, 2017, we entered into an equity distribution agreement with Ladenburg Thalmann & Co. Inc., through which we may offer for sale, from time to time, up to $30.0 million of our common stock through an ATM offering. As of May 15, 2017, the Company sold 60,679 shares for gross proceeds of $1.4 million at an average price of $22.49 for aggregate net proceeds of $1.3 million (net of transaction costs). INDEX TO OTHER FINANCIAL STATEMENTS Saratoga Investment Corp. CLO 2013-1, Ltd. Statements of Assets and Liabilities as of February 28, Schedules of Investments as of February 28, IMPORTANT NOTE In accordance with certain SEC rules, Saratoga Investment Corp. (the “Company”) is providing additional information regarding one of its portfolio companies, Saratoga Investment Corp. CLO 2013-1, Ltd. (“Saratoga CLO”). The Company owns 100% of the subordinated notes of the Saratoga CLO. The additional financial information regarding the Saratoga CLO does not directly impact the Company’s financial position, results of operations or cash flows. Report of Independent Auditors The Collateral Manager, Saratoga Investment Corp. CLO 2013-1, Ltd. We have audited the accompanying financial statements of Saratoga Investment Corp. CLO 2013-1, Ltd. Management’s Responsibility for the Financial Statements Management is responsible for the preparation and fair presentation of these financial statements in conformity with U.S. generally accepted accounting principles; this includes the design, implementation, and maintenance of internal control relevant to the preparation and fair presentation of financial statements that are free of material misstatement, whether due to fraud or error. Auditor’s Responsibility Our responsibility is to express an opinion on these financial statements based on our audits. We conducted our audits in accordance with auditing standards generally accepted in the United States. Those standards require that we plan and perform the audit to obtain reasonable assurance about whether the financial statements are free of material misstatement. An audit involves performing procedures to obtain audit evidence about the amounts and disclosures in the financial statements. The procedures selected depend on the auditor’s judgment, including the assessment of the risks of material misstatement of the financial statements, whether due to fraud or error. In making those risk assessments, the auditor considers internal control relevant to the We believe that the audit evidence we have obtained is sufficient and appropriate to provide a basis for our audit opinion. Opinion In our opinion, the financial statements referred to above present fairly, in all material respects, the financial position of Saratoga Investment Corp. CLO 2013-1, Ltd. at February 28, /s/ Ernst & Young LLP New York, May Saratoga Investment Corp. CLO 2013-1, Ltd. Statements of Assets and Liabilities As of February 28, 2014 February 28, 2013 ASSETS Investments Fair Value Loans (amortized cost of $299,137,566 and $366,099,395, respectively) $ 300,491,077 $ 362,494,006 Fair Value Other/Structured finance securities (amortized cost of $0 and $13,743,946, respectively) — 11,925,973 Total investments at fair value (amortized cost of $299,137,566 and $379,843,341, respectively) 300,491,077 374,419,979 Cash and cash equivalents 8,018,933 28,804,871 Receivable from open trades 1,801,266 5,131,538 Interest receivable 1,450,952 1,584,985 Deferred debt financing costs, net 2,166,633 2,092,787 Other assets 91,336 — Total assets $ 314,020,197 $ 412,034,160 LIABILITIES Interest payable $ 622,476 $ 666,121 Payable from open trades 9,445,000 16,346,250 Accrued base management fee 75,053 43,171 Accrued subordinated management fee 75,053 172,682 Class A notes - GSCIC CLO 2007, Ltd. — 296,000,000 Class B notes - GSCIC CLO 2007, Ltd. — 22,000,000 Discount on class B notes - GSCIC CLO 2007, Ltd. — (417,011 ) Class C notes - GSCIC CLO 2007, Ltd. — 14,000,000 Class D notes - GSCIC CLO 2007, Ltd. — 16,000,000 Discount on class D notes - GSCIC CLO 2007, Ltd. — (441,136 ) Class E notes - GSCIC CLO 2007, Ltd. — 17,960,044 Discount on class E notes - GSCIC CLO 2007, Ltd. — (1,134,778 ) Class X Notes - SIC CLO 2013-1, Ltd. 1,666,666 — Class A-1 Notes - SIC CLO 2013-1, Ltd. 170,000,000 — Discount on Class A-1 Notes - SIC CLO 2013-1, Ltd. (1,671,864 ) — Class A-2 Notes - SIC CLO 2013-1, Ltd. 20,000,000 — Discount on Class A-2 Notes - SIC CLO 2013-1, Ltd. (173,300 ) — Class B Notes - SIC CLO 2013-1, Ltd. 44,800,000 — Discount on Class B Notes - SIC CLO 2013-1, Ltd. (1,125,757 ) — Class C Notes - SIC CLO 2013-1, Ltd. 16,000,000 — Discount on Class C Notes - SIC CLO 2013-1, Ltd. (700,902 ) — Class D Notes - SIC CLO 2013-1, Ltd. 14,000,000 — Discount on Class D Notes - SIC CLO 2013-1, Ltd. (909,825 ) — Class E Notes - SIC CLO 2013-1, Ltd. 13,100,000 — Discount on Class E Notes - SIC CLO 2013-1, Ltd. (1,715,285 ) — Class F Notes - SIC CLO 2013-1, Ltd. 4,500,000 — Discount on Class F Notes - SIC CLO 2013-1, Ltd. (623,880 ) — Subordinated Notes 30,000,000 30,000,000 Total liabilities $ 317,363,435 $ 411,195,343 Commitments and contingencies (See Note 6) NET ASSETS Ordinary equity, par value $1.00, 250 ordinary shares authorized, 250 and 250 issued and outstanding, respectively $ 250 $ 250 Accumulated gain (loss) 838,567 (5,963,092 ) Net income (loss) (4,182,055 ) 6,801,659 Total net assets (3,343,238 ) 838,817 Total liabilities and net assets $ 314,020,197 $ 412,034,160 ASSETS Investments Fair Value Loans (amortized cost of $294,270,284 and $300,112,538, respectively) Fair Value Other/Structured finance securities (amortized cost of $3,531,218 and $3,531,218, respectively) Total investments at fair value (amortized cost of $297,801,502 and $303,643,756, respectively) Cash and cash equivalents Receivable from open trades Interest receivable Other assets Total assets LIABILITIES Interest payable Payable from open trades Accrued base management fee Accrued subordinated management fee Class A-1 Notes—SIC CLO 2013-1, Ltd. Discount on Class A-1 Notes—SIC CLO 2013-1, Ltd. Class A-2 Notes—SIC CLO 2013-1, Ltd. Discount on Class A-2 Notes—SIC CLO 2013-1, Ltd. Class B Notes—SIC CLO 2013-1, Ltd. Discount on Class B Notes—SIC CLO 2013-1, Ltd. Class C Notes—SIC CLO 2013-1, Ltd. Discount on Class C Notes—SIC CLO 2013-1, Ltd. Class D Notes—SIC CLO 2013-1, Ltd. Discount on Class D Notes—SIC CLO 2013-1, Ltd. Class E Notes—SIC CLO 2013-1, Ltd. Discount on Class E Notes—SIC CLO 2013-1, Ltd. Class F Notes—SIC CLO 2013-1, Ltd. Discount on Class F Notes—SIC CLO 2013-1, Ltd. Deferred debt financing costs, SIC CLO 2013-1, Ltd. Notes Subordinated Notes Total liabilities Commitments and contingencies (See Note 6) NET ASSETS Ordinary equity, par value $1.00, 250 ordinary shares authorized, 250 and 250 issued and outstanding, respectively Accumulated loss Net gain (loss) Total net assets Total liabilities and net assets See accompanying notes to financial statements. Saratoga Investment Corp. CLO 2013-1, Ltd. For the year ended For the year ended For the year ended INVESTMENT INCOME Interest from investments $ 15,486,413 $ 19,328,855 $ 20,032,687 Interest from cash and cash equivalents 6,792 16,587 12,165 Other income 945,441 967,991 509,365 Total investment income 16,438,646 20,313,433 20,554,217 EXPENSES Interest expense 11,678,514 15,613,003 14,480,621 Professional fees 433,073 417,086 400,628 Misc. Fee Expense 175,283 133,794 176,768 Base management fee 517,563 400,014 402,303 Subordinated management fee 1,257,578 1,600,057 1,609,213 Trustee expenses 83,221 100,820 100,551 Amortization expense 994,602 1,015,332 1,016,124 Loss on extinguishment of debt 3,442,442 — — Total expenses 18,582,276 19,280,106 18,186,208 NET INVESTMENT INCOME (LOSS) (2,143,630 ) 1,033,327 2,368,009 REALIZED AND UNREALIZED GAIN (LOSS) ON INVESTMENTS: Net realized gain (loss) on investments (8,815,296 ) 2,532,558 (4,547,952 ) Net unrealized appreciation/(depreciation) on investments 6,776,871 3,235,774 (650,241 ) Net gain (loss) on investments (2,038,425 ) 5,768,332 (5,198,193 ) NET INCREASE (DECREASE) IN NET ASSETS RESULTING FROM OPERATIONS $ (4,182,055 ) $ 6,801,659 $ (2,830,184 ) INVESTMENT INCOME Interest from investments Interest from cash and cash equivalents Other income Total investment income EXPENSES Interest expense Professional fees Miscellaneous fee expense Base management fee Subordinated management fee Trustee expenses Amortization expense Loss on extinguishment of debt Total expenses NET INVESTMENT INCOME (LOSS) REALIZED AND UNREALIZED GAIN (LOSS) ON INVESTMENTS: Net realized gain on investments Net unrealized appreciation (depreciation) on investments Net gain (loss) on investments NET INCREASE (DECREASE) IN NET ASSETS RESULTING FROM OPERATIONS See accompanying notes to financial statements. Saratoga Investment Corp. CLO 2013-1 Ltd. February 28, Issuer Name Industry Asset Name Asset Type Current Rate Maturity Date Principal Cost Fair Value Academy, LTD. Retailers (Except Food and Drugs) Initial Term Loan (2012) Loan 4.50 % 8/3/2018 $ 1,960,187 $ 1,948,853 $ 1,969,969 Acosta, Inc. Food Products Term B Loan (2013) Loan 4.25 % 3/2/2018 4,162,740 4,101,035 4,177,310 Aderant North America, Inc. Business Equipment and Services Term Loan (First Lien) Loan 6.25 % 12/20/2018 3,473,750 3,470,186 3,482,434 Aegis Toxicology Sciences Corporation Healthcare Initial Term Loan (First Lien) Loan 5.50 % 2/24/2021 1,000,000 990,000 990,000 Aegis Toxicology Sciences Corporation Healthcare Initial Term Loan (Second Lien) Loan 9.50 % 8/24/2021 500,000 492,500 492,500 Aeroflex Incorporated Aerospace and Defense Tranche B-1 Term Loan Loan 4.50 % 11/9/2019 3,208,854 3,194,690 3,223,550 Akorn, Inc. Healthcare Term Loan B Loan 4.50 % 11/13/2020 500,000 497,500 503,125 Alere Inc. (fka IM US Holdings, LLC) Healthcare Incremental B-1 Term Loan Loan 4.25 % 6/30/2017 1,960,000 1,930,566 1,968,173 Applied Systems, Inc. Business Equipment and Services Term Loan Loan 4.25 % 12/8/2016 500,000 498,750 498,750 Aramark Corporation Food Products LC-2 Facility Loan 3.69 % 7/26/2016 79,187 79,187 79,206 Aramark Corporation Food Products LC-3 Facility Loan 3.69 % 7/26/2016 43,961 43,961 43,971 Aramark Corporation Food Products U.S. Term F Loan Loan 3.25 % 2/24/2021 3,206,537 3,206,537 3,207,307 Ardagh Holdings USA Inc. (Ardagh Packaging Finance S.A.) Containers/Glass Products Dollar Term Loan Loan 4.25 % 12/17/2019 1,000,000 995,109 1,002,500 ARG IH Corporation Food Services Term Loan Loan 5.00 % 11/15/2020 500,000 498,797 502,500 Asurion, LLC (fka Asurion Corporation) Insurance Incremental Tranche B-1 Term Loan Loan 4.50 % 5/24/2019 5,508,783 5,462,695 5,516,660 Auction.Com, LLC Business Equipment and Services Term Loan A-4 Loan 4.66 % 2/28/2017 980,651 979,812 970,845 Autotrader.com, Inc. Automotive Tranche B-1 Term Loan Loan 4.00 % 12/15/2016 3,791,778 3,791,778 3,805,997 Avantor Performance Materials Holdings, Inc. Chemicals/Plastics Term Loan Loan 5.25 % 6/24/2017 4,875,000 4,861,403 4,875,000 AZ Chem US Inc. Chemicals/Plastics Term Loan Loan 5.25 % 12/22/2017 1,355,941 1,329,859 1,362,720 Bass Pro Group, LLC Retailers (Except Food and Drugs) New Term Loan Loan 3.75 % 11/20/2019 498,725 498,126 500,715 Berry Plastics Corporation Chemicals/Plastics Term E Loan Loan 3.75 % 1/6/2021 1,500,000 1,496,250 1,495,500 Big Heart Pet Brands (fka Del Monte Corporation) Food/Drug Retailers Initial Term Loan Loan 3.50 % 3/9/2020 3,000,000 3,022,866 2,999,250 Biomet, Inc. Healthcare Dollar Term B-2 Loan Loan 3.65 % 7/25/2017 1,970,137 1,970,137 1,972,797 BJ’s Wholesale Club, Inc. Food/Drug Retailers New 2013 (November) Replacement Loan (First Lien) Loan 4.50 % 9/26/2019 500,000 497,592 502,750 Bombardier Recreational Products Inc. Leisure Goods/Activities/Movies Term B Loan Loan 4.00 % 1/30/2019 754,286 748,080 756,647 Brickman Group Ltd. LLC, The Brokers/Dealers/Investment Houses Initial Term Loan (First Lien) Loan 4.00 % 12/18/2020 250,000 248,750 250,937 Brock Holdings III, Inc. Industrial Equipment Term Loan (First Lien) Loan 6.75 % 3/16/2017 1,959,839 1,976,826 1,967,188 Burlington Coat Factory Warehouse Corporation Retailers (Except Food and Drugs) Term B-2 Loan Loan 4.25 % 2/23/2017 2,660,377 2,653,889 2,675,675 C.H.I. Overhead Doors, Inc. Building and Development Term Loan (First Lien) Loan 5.50 % 3/18/2019 2,739,013 2,692,934 2,745,861 Camp International Holding Company Aerospace and Defense 2013 Replacement Term Loan (First Lien) Loan 4.75 % 5/31/2019 990,000 990,000 999,900 Capital Automotive L.P. Conglomerate Tranche B-1 Term Loan Facility Loan 4.00 % 4/10/2019 2,137,369 2,141,920 2,142,712 Capstone Logistics, LLC Business Equipment and Services Term Note A Loan 6.50 % 9/16/2016 2,658,626 2,637,550 2,618,899 Capsugel Holdings US, Inc. Drugs Initial Term Loan Loan 3.50 % 8/1/2018 3,145,521 3,138,959 3,141,589 Celanese US Holdings LLC Chemicals/Plastics Dollar Term C-2 Commitment Loan 2.25 % 10/31/2016 2,176,323 2,201,894 2,192,254 Charter Communications Operating, LLC Cable and Satellite Television Term F Loan Loan 3.00 % 12/31/2020 2,682,707 2,672,727 2,666,369 CHS/Community Health Systems, Inc. Healthcare 2017 Term E Loan Loan 3.48 % 1/25/2017 1,108,908 1,082,718 1,113,987 CHS/Community Health Systems, Inc. Healthcare 2021 Term D Loan Loan 4.25 % 1/27/2021 2,955,608 2,862,024 2,980,228 Cinedigm Digital Funding I, LLC Business Equipment and Services Term Loan Loan 3.75 % 2/28/2018 825,121 820,892 825,121 Covanta Energy Corporation Ecological Services and Equipment Term Loan Loan 3.50 % 3/28/2019 491,250 489,468 492,788 CPI International Acquisition, Inc. (f/k/a Catalyst Holdings, Inc.) Electronics/Electric Term B Loan Loan 5.00 % 2/13/2017 4,622,500 4,611,092 4,622,500 Crosby US Acquisition Corp. Industrial Equipment Initial Term Loan (First Lien) Loan 4.00 % 11/23/2020 750,000 749,094 748,312 Crown Castle Operating Company Telecommunications/Cellular Extended Incremental Tranche B-2 Term Loan Loan 3.25 % 1/31/2019 2,460,196 2,441,025 2,460,316 Culligan International Company Conglomerate Dollar Loan (First Lien) Loan 6.25 % 12/19/2017 787,658 738,102 734,491 Culligan International Company Conglomerate Dollar Loan (Second Lien) Loan 9.50 % 6/19/2018 783,162 732,061 657,856 Cumulus Media Holdings Inc. Broadcast Radio and Television Term Loan Loan 4.25 % 12/23/2020 500,000 495,000 502,815 DaVita HealthCare Partners Inc. (fka DaVita Inc.) Healthcare Tranche B Term Loan Loan 4.50 % 10/20/2016 3,909,320 3,909,320 3,927,655 DCS Business Services, Inc. Financial Intermediaries Term B Loan Loan 7.25 % 3/19/2018 3,831,595 3,792,824 3,735,805 DealerTrack Technologies, Inc. Computers & Electronics Term Loan Loan 3.50 % 2/28/2021 500,000 498,750 498,750 Dell International LLC Retailers (Except Food and Drugs) Term B Loan Loan 4.50 % 4/29/2020 1,995,000 1,982,818 1,988,935 Delos Finance S.à r.l. Leasing Loan Loan 3.50 % 2/26/2021 500,000 497,500 497,500 Deluxe Entertainment Services Group Inc. Media Initial Term Loan Loan 6.50 % 2/28/2020 1,000,000 1,000,000 1,000,000 Digitalglobe, Inc. Ecological Services and Equipment Term Loan Loan 3.75 % 1/31/2020 248,125 248,125 247,815 Drew Marine Group Inc. Chemicals/Plastics Term Loan (First Lien) Loan 4.50 % 11/19/2020 500,000 499,397 502,500 Dunkin’ Brands, Inc. Food Services Term B-4 Loan Loan 3.25 % 2/7/2021 3,956,731 3,946,925 3,936,948 DynCorp International Inc. Aerospace and Defense Term Loan Loan 6.25 % 7/7/2016 486,442 482,619 488,573 Education Management LLC Leisure Goods/Activities/Movies Tranche C-2 Term Loan Loan 4.31 % 6/1/2016 3,882,152 3,746,734 3,544,405 EIG Investors Corp. Business Equipment and Services Term Loan Loan 5.00 % 11/9/2019 997,500 992,713 1,003,734 Energy Transfer Equity, L.P. Oil & Gas Loan Loan 3.25 % 12/2/2019 1,000,000 997,599 998,750 Evergreen Acqco 1 LP Retailers (Except Food and Drugs) New Term Loan Loan 5.00 % 7/9/2019 492,516 488,615 493,900 EWT Holdings III Corp. (fka WTG Holdings III Corp.) Industrial Equipment Term Loan (First Lien) Loan 4.75 % 1/15/2021 1,000,000 995,084 1,002,500 Federal-Mogul Corporation Automotive Tranche B Term Loan Loan 2.14 % 12/29/2014 2,220,981 2,187,068 2,202,747 Federal-Mogul Corporation Automotive Tranche C Term Loan Loan 2.14 % 12/28/2015 1,307,032 1,270,847 1,296,301 First Data Corporation Financial Intermediaries 2017 Second New Dollar Term Loan Loan 4.20 % 3/24/2017 2,111,028 2,010,799 2,109,276 First Data Corporation Financial Intermediaries 2018 Dollar Term Loan Loan 4.20 % 3/23/2018 2,290,451 2,231,370 2,292,741 FMG Resources (August 2006) Pty LTD (FMG America Finance, Inc.) Nonferrous Metals/Minerals Loan Loan 4.25 % 6/28/2019 997,500 995,122 1,006,438 Four Seasons Holdings Inc. Lodging & Casinos Term Loan (First Lien) Loan 3.50 % 6/27/2020 498,750 498,750 498,750 Garda World Security Corporation Business Equipment and Services Term B Delayed Draw Loan Loan 4.00 % 11/6/2020 203,194 202,218 203,363 Garda World Security Corporation Business Equipment and Services Term B Loan Loan 4.00 % 11/6/2020 794,306 790,489 794,965 Gardner Denver, Inc. Oil & Gas Initial Dollar Term Loan Loan 4.25 % 7/30/2020 1,496,250 1,485,394 1,489,337 Generac Power Systems, Inc. Industrial Equipment Term Loan B Loan 3.50 % 5/31/2020 868,414 852,908 868,258 General Nutrition Centers, Inc. Retailers (Except Food and Drugs) Amended Tranche B Term Loan Loan 3.25 % 3/4/2019 4,740,112 4,722,664 4,725,892 Global Tel*Link Corporation Business Equipment and Services Term Loan (First Lien) Loan 5.00 % 5/23/2020 1,920,175 1,915,905 1,900,014 Goodyear Tire & Rubber Company, The Chemicals/Plastics Loan (Second Lien) Loan 4.75 % 4/30/2019 4,000,000 3,941,039 4,037,000 Grosvenor Capital Management Holdings, LP Brokers/Dealers/Investment Houses Initial Term Loan Loan 3.75 % 1/4/2021 3,500,000 3,482,803 3,489,080 Harland Clarke Holdings Corp. (fka Clarke American Corp.) Publishing Tranche B-4 Term Loan Loan 6.00 % 8/4/2019 500,000 497,500 500,780 HCA Inc. Healthcare Tranche B-4 Term Loan Loan 2.94 % 5/1/2018 5,720,353 5,390,148 5,713,947 Hertz Corporation, The Automotive Tranche B-1 Term Loan Loan 3.75 % 3/11/2018 2,970,000 3,005,791 2,973,683 Hologic, Inc. Healthcare Refinancing Tranche A Term Loan Loan 2.19 % 8/1/2017 2,312,500 2,307,973 2,313,425 Hunter Defense Technologies, Inc. Aerospace and Defense Term Loan Loan 3.45 % 8/22/2014 3,470,285 3,460,723 3,262,068 Huntsman International LLC Chemicals/Plastics Extended Term B Loan Loan 2.73 % 4/19/2017 3,920,000 3,892,467 3,919,020 Ikaria, Inc. Healthcare Initial Term Loan (First Lien) Loan 5.00 % 2/12/2021 500,000 497,515 502,815 Infor (US), Inc. (fka Lawson Software Inc.) Business Equipment and Services Tranche B-5 Term Loan Loan 3.75 % 6/3/2020 1,776,183 1,758,861 1,772,488 Inventiv Health, Inc. (fka Ventive Health, Inc) Conglomerate Consolidated Term Loan Loan 7.50 % 8/4/2016 492,090 492,090 491,105 J. Crew Group, Inc. Retailers (Except Food and Drugs) Term B-1 Loan Retired 03/05/2014 Loan 4.00 % 3/7/2018 972,500 972,500 972,656 JFB Firth Rixson Inc. Industrial Equipment 2013 Replacement Dollar Term Facility Loan Loan 4.25 % 6/30/2017 2,564,311 2,554,534 2,568,054 Kinetic Concepts, Inc. Healthcare Dollar Term D-1 Loan Loan 4.00 % 5/4/2018 490,057 475,404 492,508 La Quinta Intermediate Holdings L.L.C. Gaming And Hotels Initial Term Loan Loan 4.00 % 2/19/2021 500,000 500,000 500,000 Michaels Stores, Inc. Retailers (Except Food and Drugs) Term B Loan Loan 3.75 % 1/28/2020 496,250 496,250 497,302 Microsemi Corporation Electronics/Electric Incremental Term Loan Loan 3.75 % 2/19/2020 498,750 498,750 499,373 Microsemi Corporation Electronics/Electric Term Loan Loan 3.50 % 2/19/2020 2,393,981 2,389,463 2,398,482 Mitel US Holdings, Inc. Telecommunications Term Loan Loan 5.25 % 1/31/2020 250,000 248,753 252,083 National CineMedia, LLC Leisure Goods/Activities/Movies Term Loan (2013) Loan 2.95 % 11/26/2019 1,086,207 1,054,177 1,082,134 Newsday, LLC Publishing Term Loan Loan 3.69 % 10/12/2016 2,215,385 2,213,416 2,215,385 Novelis, Inc. Conglomerate Initial Term Loan Loan 3.75 % 3/10/2017 4,857,520 4,868,347 4,873,452 NPC International, Inc. Food Services Term Loan (2013) Loan 4.00 % 12/28/2018 490,833 490,833 493,597 NRG Energy, Inc. Utilities Term Loan (2013) Loan 2.75 % 7/1/2018 3,900,525 3,875,534 3,872,168 NuSil Technology LLC. Chemicals/Plastics Term Loan Loan 5.25 % 4/7/2017 809,163 809,163 799,558 OEP Pearl Dutch Acquisition B.V. Chemicals/Plastics Initial BV Term Loan Loan 6.50 % 3/30/2018 142,422 140,466 143,846 On Assignment, Inc. Business Equipment and Services Initial Term B Loan Loan 3.50 % 5/15/2020 1,311,364 1,303,125 1,312,190 Onex Carestream Finance LP Healthcare Term Loan (First Lien 2013) Loan 5.00 % 2/25/2017 4,531,159 4,511,264 4,582,135 OpenLink International, Inc. Computers & Electronics Replacement Term Loan Loan 6.25 % 10/30/2017 980,000 980,000 980,000 P.F. Chang’s China Bistro, Inc. (Wok Acquisition Corp.) Food/Drug Retailers Term Borrowing Loan 5.50 % 6/22/2019 1,496,212 1,488,641 1,509,675 P2 Upstream Acquisition Co. (P2 Upstream Canada BC ULC) Business Equipment and Services Term Loan (First Lien) Loan 5.00 % 10/30/2020 1,000,000 995,186 1,008,750 Patheon Inc. Healthcare Term Loan Loan 4.25 % 3/11/2021 3,000,000 2,992,500 2,990,640 PetCo Animal Supplies, Inc. Retailers (Except Food and Drugs) New Loans Loan 4.00 % 11/24/2017 1,484,694 1,483,250 1,489,103 Pharmaceutical Product Development, Inc. (Jaguar Holdings, LLC) Conglomerate 2013 Term Loan Loan 4.00 % 12/5/2018 1,960,200 1,936,226 1,967,845 Pinnacle Foods Finance LLC Food Products New Term Loan G Loan 3.25 % 4/29/2020 4,962,500 4,951,514 4,942,352 Polymer Group, Inc. Chemicals/Plastics Initial Loan Loan 5.25 % 12/19/2019 500,000 497,500 501,875 Prestige Brands, Inc. Drugs Term B-1 Loan Loan 3.75 % 1/31/2019 435,606 430,195 437,022 Pro Mach, Inc. Industrial Equipment Term Loan Loan 4.50 % 7/6/2017 1,945,655 1,934,699 1,955,383 Progressive Waste Solutions Ltd. Ecological Services and Equipment Term B Loan Loan 3.00 % 10/24/2019 498,741 498,741 500,486 Quintiles Transnational Corp. Conglomerate Term B-3 Loan Loan 3.75 % 6/8/2018 3,681,541 3,646,328 3,685,186 Redtop Acquisitions Limited Electronics/Electric Initial Dollar Term Loan (First Lien) Loan 4.50 % 12/3/2020 500,000 496,369 502,915 Rexnord LLC/RBS Global, Inc. Industrial Equipment Term B Loan Loan 4.00 % 8/21/2020 1,663,476 1,663,476 1,667,035 Reynolds Group Holdings Inc. Industrial Equipment Incremental U.S. Term Loan Loan 4.00 % 12/1/2018 1,980,000 1,980,000 1,993,365 Rocket Software, Inc. Business Equipment and Services Term Loan (First Lien) Loan 5.75 % 2/8/2018 1,960,025 1,934,083 1,960,515 Rovi Solutions Corporation / Rovi Guides, Inc. Electronics/Electric Tranche A-2 Loan Loan 2.45 % 3/29/2017 1,562,552 1,552,098 1,562,552 Rovi Solutions Corporation / Rovi Guides, Inc. Electronics/Electric Tranche B-3 Term Loan Loan 3.50 % 3/29/2019 1,344,450 1,339,560 1,341,088 RPI Finance Trust Drugs Term B-2 Term Loan Loan 3.25 % 5/9/2018 5,308,218 5,283,397 5,339,165 Scitor Corporation Business Equipment and Services Term Loan Loan 5.00 % 2/15/2017 463,977 462,831 460,354 Sensata Technologies B.V./Sensata Technology Finance Company, LLC Industrial Equipment Term Loan Loan 3.25 % 5/12/2019 1,524,730 1,524,730 1,529,106 Sensus USA Inc. (fka Sensus Metering Systems) Utilities Term Loan (First Lien) Loan 5.75 % 5/9/2017 1,945,013 1,939,821 1,957,987 ServiceMaster Company, The Conglomerate Tranche B Term Loan Loan 4.45 % 1/31/2017 2,822,729 2,830,165 2,825,552 SI Organization, Inc., The Aerospace and Defense New Tranche B Term Loan Loan 5.50 % 11/22/2016 3,880,675 3,863,008 3,800,655 Sonneborn, LLC Chemicals/Plastics Initial US Term Loan Loan 6.50 % 3/30/2018 807,059 795,976 815,130 Sophia, L.P. Electronics/Electric Term B Loan Loan 4.50 % 7/19/2018 928,389 917,174 934,191 Southwire Company, LLC (f.k.a Southwire Company) Building and Development Initial Term Loan Loan 3.25 % 2/10/2021 500,000 498,758 499,730 SRA International Inc. Aerospace and Defense Term Loan Loan 6.50 % 7/20/2018 3,268,571 3,184,532 3,276,743 SRAM, LLC Industrial Equipment Term Loan (First Lien) Loan 4.01 % 4/10/2020 3,304,614 3,278,551 3,304,614 SS&C Technologies Holdings Europe S.A.R.L. Business Equipment and Services 2013 Replacement Term B-2 Loan Loan 3.25 % 6/7/2019 64,638 64,070 64,839 SS&C Technologies, Inc., /Sunshine Acquisition II, Inc. Business Equipment and Services 2013 Replacement Term B-1 Loan Loan 3.25 % 6/7/2019 624,838 619,344 626,782 SunCoke Energy, Inc. Nonferrous Metals/Minerals Tranche B Term Loan Loan 4.00 % 7/26/2018 1,367,311 1,359,200 1,367,311 SunGard Data Systems Inc (Solar Capital Corp.) Conglomerate Tranche C Term Loan Loan 3.95 % 2/28/2017 304,311 302,167 305,452 SunGard Data Systems Inc (Solar Capital Corp.) Conglomerate Tranche E Term Loan Loan 4.00 % 3/8/2020 4,221,845 4,096,936 4,238,944 SuperMedia Inc. (fka Idearc Inc.) Publishing Loan Loan 11.60 % 12/30/2016 264,330 257,131 196,762 Syniverse Holdings, Inc. Telecommunications Initial Term Loan Loan 4.00 % 4/23/2019 479,913 476,371 480,911 Taminco Global Chemical Corporation Chemicals/Plastics Initial Tranche B-3 Dollar Term Loan Loan 3.25 % 2/15/2019 1,473,863 1,464,165 1,473,406 Team Health, Inc. Healthcare Tranche B Term Loan Loan 3.75 % 6/29/2018 4,387,500 4,373,856 4,387,500 TECTUM HOLDINGS INC Industrial Equipment Term Loan Loan 6.50 % 12/3/2015 3,800,160 3,788,706 3,762,159 Tomkins, LLC / Tomkins, Inc. (f/k/a Pinafore, LLC / Pinafore, Inc.) Conglomerate Term B-2 Loan Loan 3.75 % 9/29/2016 2,356,680 2,360,795 2,361,982 TransDigm Inc. Aerospace and Defense Tranche C Term Loan Loan 3.75 % 2/28/2020 4,896,514 4,904,843 4,914,876 Tricorbraun Inc. (fka Kranson Industries, Inc.) Containers/Glass Products Term Loan Loan 4.00 % 5/3/2018 1,902,083 1,895,432 1,903,282 Truven Health Analytics Inc. (fka Thomson Reuters (Healthcare) Inc.) Healthcare New Tranche B Term Loan Loan 4.50 % 6/6/2019 492,528 484,755 493,513 U.S. Security Associates Holdings, Inc. Business Equipment and Services Delayed Draw Loan Loan 6.00 % 7/28/2017 160,148 159,235 160,348 U.S. Security Associates Holdings, Inc. Business Equipment and Services Term B Loan Loan 6.00 % 7/28/2017 122,494 122,109 122,648 U.S. Security Associates Holdings, Inc. Business Equipment and Services Term B Loan Loan 6.00 % 7/28/2017 818,172 813,513 819,195 U.S. Silica Company Nonferrous Metals/Minerals Term Loan Loan 4.00 % 7/23/2020 1,950,200 1,941,292 1,954,256 U.S. Xpress Enterprises, Inc. Industrial Equipment Extended Term Loan Loan 9.38 % 11/13/2016 2,805,278 2,766,405 2,777,225 United Surgical Partners International, Inc. Healthcare New Tranche B Term Loan Loan 4.75 % 4/3/2019 2,456,500 2,429,626 2,470,821 Univar Inc. Chemicals/Plastics Term B Loan Loan 5.00 % 6/30/2017 3,884,944 3,884,238 3,859,225 Univision Communications Inc. Telecommunications Replacement First-Lien Term Loan Loan 4.00 % 3/1/2020 2,977,500 2,959,200 2,984,467 UPC Financing Partnership Broadcast Radio and Television Facility AF Loan 4.00 % 1/31/2021 1,000,000 974,618 1,002,500 Valeant Pharmaceuticals International, Inc. Drugs Series D2 Term Loan B Loan 3.75 % 2/13/2019 2,947,688 2,936,432 2,955,528 Verint Systems Inc. Business Equipment and Services Term Loan Loan 4.00 % 9/6/2019 1,900,800 1,892,737 1,904,602 Verint Systems Inc. Business Equipment and Services Tranche B Incremental Term Loan Loan 3.50 % 9/6/2019 1,000,000 997,521 1,000,000 Vertafore, Inc. Business Equipment and Services Term Loan (2013) Loan 4.25 % 10/3/2019 2,899,621 2,899,621 2,909,770 Visant Corporation (fka Jostens) Leisure Goods/Activities/Movies Tranche B Term Loan (2011) Loan 5.25 % 12/22/2016 3,658,446 3,658,446 3,607,008 W.R. Grace & Co.-CONN Chemicals/Plastics Delayed Draw Term Loan Loan 0.00 % 2/3/2021 — (328 ) — W.R. Grace & Co.-CONN Chemicals/Plastics U.S. Term Loan Loan 3.00 % 2/3/2021 368,421 367,502 367,828 Washington Inventory Service Business Equipment and Services U.S. Term Loan (First Lien) Loan 6.75 % 12/20/2018 1,980,000 2,004,187 1,965,150 Wendy’s International, Inc Food Services Term B Loan Loan 3.25 % 5/15/2019 680,470 674,563 679,197 Wesco Aircraft Hardware Corp. Aerospace/Defense Tranche B Term Loan Loan 4.75 % 2/28/2021 500,000 498,750 498,750 West Corporation Telecommunications Term B-10 Loan Loan 3.25 % 6/30/2018 2,926,111 2,976,179 2,909,666 $ 299,137,566 $ 300,491,077 Issuer Name Industry Asset Name Education Management II, LLC Education Management II, LLC New Millennium Holdco, Inc. 24 Hour Holdings III, LLC ABB Con-Cise Optical Group, LLC Acosta Holdco, Inc. Advantage Sales & Marketing, Inc. Aegis Toxicology Science Corporation Agrofresh, Inc. AI MISTRAL T/L (V. GROUP) Akorn, Inc. Albertson’s LLC Alere Inc. (fka IM US Holdings, LLC) Alion Science and Technology Corporation Alliance Healthcare Services, Inc. ALPHA 3 T/L B1 (ATOTECH) Anchor Glass T/L (11/16) APCO Holdings, Inc. Aramark Corporation Aspen Dental Management, Inc. Astoria Energy T/L B Asurion, LLC (fka Asurion Corporation) Asurion, LLC (fka Asurion Corporation) Auction.com, LLC Avantor Performance Materials Holdings, Inc. AVOLON TLB BORROWER 1 LUXEMBOURG S.A.R.L. Bass Pro Group, LLC Belmond Interfin Ltd. BJ’s Wholesale Club, Inc. Blackboard T/L B4 BMC Software BMC Software T/L US Brickman Group Holdings, Inc. BWAY Holding Company Candy Intermediate Holdings, Inc. Capital Automotive L.P. CASA SYSTEMS T/L Catalent Pharma Solutions, Inc Cengage Learning Acquisitions, Inc. CH HOLD (CALIBER COLLISION) T/L Charter Communications Operating, LLC CHS/Community Health Systems, Inc. CHS/Community Health Systems, Inc. CITGO Petroleum Corporation Communications Sales & Leasing, Inc. Concordia Healthcare Corporation Consolidated Aerospace Manufacturing, LLC Consolidated Communications, Inc. CPI Acquisition Inc. CPI International Acquisition, Inc. (f/k/a Catalyst Holdings, Inc.) Crosby US Acquisition Corporation CT Technologies Intermediate Hldgs, Inc Culligan International Company-T/L Cumulus Media Holdings Inc. DAE Aviation (StandardAero) DASEKE T/L (HENNESSY CAPITAL) DCS Business Services, Inc. Delta 2 (Lux) S.a.r.l. DELL INTERNATIONAL 1ST LIEN T/L Deluxe Entertainment Service Group, Inc. Deluxe Entertainment Service Group, Inc. DEX MEDIA, INC. Diebold, Inc. DIGITALGLOBE T/L B (12/16) DJO Finance, LLC DPX Holdings B.V. Drew Marine Group, Inc. DTZ U.S. Borrower, LLC DUKE FINANCE (OM GROUP/VECTRA) T/L Edelman Financial Group, Inc. Education Management II, LLC Education Management II, LLC Emerald Performance Materials, LLC Emerald Performance Materials, LLC Emerald 2 Limited Endo International plc EnergySolutions, LLC Engility Corporation Evergreen Acqco 1 LP EWT Holdings III Corp. (fka WTG Holdings III Corp.) EWT Holdings III Corp. Extreme Reach, Inc. Federal-Mogul Corporation First Data Corporation First Eagle Investment Management Fitness International, LLC FMG Resources (August 2006) Pty LTD (FMG America Finance, Inc.) Garda World Security Corporation Garda World Security Corporation Gardner Denver, Inc. Gates Global LLC General Nutrition Centers, Inc. GLOBALLOGIC HOLDINGS INC TERM LOAN B Global Tel*Link Corporation Goodyear Tire & Rubber Company, The Grosvenor Capital Management Holdings, LP GTCR Valor Companies, Inc. Harland Clarke Holdings Corp. (fka Clarke American Corp.) Headwaters Incorporated Help/Systems Holdings, Inc. Hemisphere Media Holdings, LLC Herbalife T/L B (HLF Financing) Hercules Achievement Holdings, Inc. Hoffmaster Group, Inc. Hostess Brand, LLC Huntsman International LLC Husky Injection Molding Systems Ltd. Hyperion Refinance T/L Imagine! Print Solutions, Inc. Infor US (Lawson) T/L B-6 Informatica Corporation Insight Global ION Media T/L B J. Crew Group, Inc. Jazz Acquisition, Inc J.Jill Group, Inc. Kinetic Concepts, Inc. Koosharem, LLC Kraton Polymers, LLC Lannett Company T/L A Lannett Company, Inc. LEARFIELD COMMUNICATIONS INITIAL T/L (A-L PARENT) Lightstone Generation T/L B Lightstone Generation T/L C Limetree Bay Terminals T/L (01/17) LPL Holdings Mauser Holdings, Inc. McGraw-Hill Global Education Holdings, LLC Michaels Stores, Inc. Micro Holding Corporation Microsemi Corporation Midas Intermediate Holdco II, LLC Milacron T/L B Milk Specialties Company Mister Car Wash T/L MSC Software Corporation MWI Holdings, Inc. National Veterinary Associates, Inc National Vision, Inc. New Media Holdings II T/L (NEW) New Millennium Holdco, Inc. Novetta Solutions Novetta Solutions NPC International, Inc. NVA Holdings (National Veterinary) T/L B2 NVA Holdings, Inc. NXT Capital T/L (11/16) ON Semiconductor Corporation Onex Carestream Finance LP OnexYork Acquisition Co OpenLink International, LLC P.F. Chang’s China Bistro, Inc. (Wok Acquisition Corp.) P2 Upstream Acquisition Co. (P2 Upstream Canada BC ULC) Petsmart, Inc. (Argos Merger Sub, Inc.) PGX Holdings, Inc. Planet Fitness Holdings LLC Polycom Term Loan (9/16) PrePaid Legal Services, Inc. Presidio, Inc. Prestige Brands T/L B4 Prime Security Services (Protection One) Ranpak Holdings, Inc. Ranpak Holdings, Inc. Redtop Acquisitions Limited Regal Cinemas Corporation Research Now Group, Inc Resolute Investment Managers, Inc. Rexnord LLC/RBS Global, Inc. Rexnord LLC/RBS Global, Inc. Reynolds Group Holdings Inc. Rovi Solutions Corporation / Rovi Guides, Inc. Royal Adhesives and Sealants Royal Holdings T/L (02/17) RPI Finance Trust Russell Investment Management T/L B Sable International Finance Ltd SBP Holdings LP Scientific Games International, Inc. SCS Holdings (Sirius Computer) Seadrill Operating LP Shearers Foods LLC Sitel Worldwide SMB Shipping Logistics T/L B (REP WWEX Acquisition) Sonneborn, LLC Sonneborn, LLC Sophia, L.P. SourceHOV LLC SRAM, LLC Steak ‘n Shake Operations, Inc. Survey Sampling International Sybil Finance BV Syniverse Holdings, Inc. TaxACT, Inc. Tectum Holdings, Inc. Tennessee Merger T/L (Team Health) TGI Friday’s, Inc. Townsquare Media, Inc. TPF II Power LLC and TPF II Covert Midco LLC TransDigm, Inc. Travel Leaders Group, LLC Trugreen Limited Partnership Twin River Management Group, Inc. Univar Inc. Univision Communications Inc. Valeant Pharmaceuticals International, Inc. Verint Systems Inc. Vistra Operations Company T/L B (12/16) Vizient Inc. Vouvray US Finance Washington Inventory Service Western Digital Corporation Windstream Services, LLC Xerox Business Services T/L B (Conduent) Zekelman Industries (JMC Steel) T/L (01/17) ZEP, Inc. Zest Holdings 1st Lien T/L (2014 Replacement) Cash and cash equivalents U.S. Bank Money Market (a) Total cash and cash equivalents (a) Included within cash and cash equivalents in Saratoga CLO’s Statements of Assets and Liabilities as of February 28, 2017. Saratoga Investment Corp. CLO 2013-1 Ltd. Schedule of Investments February 29, 2016 Issuer Name Industry Asset Name Education Management II, LLC Education Management II, LLC New Millennium Holdco, Inc. 24 Hour Holdings III, LLC Acosta Holdco, Inc. Aspen Dental Management, Inc. Advantage Sales & Marketing, Inc. Agrofresh, Inc. Aegis Toxicology Science Corporation Akorn, Inc. Albertson’s LLC Alere Inc. (fka IM US Holdings, LLC) Alion Science and Technology Corporation Alliance Healthcare Services, Inc. Alliant Holdings I, LLC Alvogen Pharma US, Inc American Beacon Advisors, Inc. Aramark Corporation Aramark Corporation Aramark Corporation Asurion, LLC (fka Asurion Corporation) Asurion, LLC (fka Asurion Corporation) Auction.com, LLC Avantor Performance Materials Holdings, Inc. Bass Pro Group, LLC Belmond Interfin Ltd. Berry Plastics Corporation BJ’s Wholesale Club, Inc. Blue Coat Systems BMC Software Brickman Group Holdings, Inc. Brock Holdings III, Inc. Burlington Coat Factory Warehouse Corporation BWAY Holding Company Caesars Entertainment Corp. Camp International Holding Company Capital Automotive L.P. Catalent Pharma Solutions, Inc Cengage Learning Acquisitions, Inc. Charter Communications Operating, LLC CHS/Community Health Systems, Inc. CHS/Community Health Systems, Inc. Cinedigm Digital Funding I, LLC CITGO Petroleum Corporation Communications Sales & Leasing, Inc. CommScope, Inc. Consolidated Aerospace Manufacturing, LLC Concordia Healthcare Corp CPI Acquisition Inc. CPI International Acquisition, Inc. (f/k/a Catalyst Holdings, Inc.) Crosby US Acquisition Corp. CT Technologies Intermediate Hldgs, Inc Culligan International Company Culligan International Company Cumulus Media Holdings Inc. DAE Aviation (StandardAero) DCS Business Services, Inc. Dell International LLC Delta 2 (Lux) S.a.r.l. Deluxe Entertainment Service Group, Inc. Diamond Resorts International Diamond Resorts International DJO Finance, LLC DPX Holdings B.V. Drew Marine Group, Inc. DTZ U.S. Borrower, LLC Edelman Financial Group, Inc. Education Management II, LLC Education Management II, LLC Emerald Performance Materials, LLC Emerald Performance Materials, LLC Emerald 2 Limited Endo International plc EnergySolutions, LLC Evergreen Acqco 1 LP EWT Holdings III Corp. (fka WTG Holdings III Corp.) Federal-Mogul Corporation First Data Corporation First Data Corporation First Eagle Investment Management Fitness International, LLC FMG Resources (August 2006) Pty LTD (FMG America Finance, Inc.) Garda World Security Corporation Garda World Security Corporation Gardner Denver, Inc. Gates Global LLC Generac Power Systems, Inc. General Nutrition Centers, Inc. Global Tel*Link Corporation Goodyear Tire & Rubber Company, The Grosvenor Capital Management Holdings, LP GTCR Valor Companies, Inc. Harland Clarke Holdings Corp. (fka Clarke American Corp.) HCA Inc. Headwaters Incorporated Hercules Achievement Holdings, Inc. Hertz Corporation, The Hoffmaster Group, Inc. Hostess Brand, LLC Huntsman International LLC Husky Injection Molding Systems Ltd. Infor (US), Inc. (fka Lawson Software Inc.) Insight Global Informatica Corporation J. Crew Group, Inc. Jazz Acquisition, Inc J.Jill Group, Inc. Kinetic Concepts, Inc. Koosharem, LLC Kraton Polymers, LLC LPL Holdings Mauser Holdings, Inc. Michaels Stores, Inc. Michaels Stores, Inc. Micro Holding Corp. Microsemi Corporation Midas Intermediate Holdco II, LLC MPH Acquisition Holdings, LLC MSC Software Corporation National Veterinary Associates, Inc National Vision, Inc. Neptune Finco (CSC Holdings) New Millennium Holdco Nortek, Inc. NorthStar Asset Management Group Inc. Novelis, Inc. Novetta Solutions Novetta Solutions NPC International, Inc. NRG Energy, Inc. Numericable NuSil Technology LLC. Onex Carestream Finance LP OnexYork Acquisition Co OpenLink International, LLC P.F. Chang’s China Bistro, Inc. (Wok Acquisition Corp.) P2 Upstream Acquisition Co. (P2 Upstream Canada BC ULC) Penn Products Terminal, LLC PetCo Animal Supplies Stores, Inc. PetCo Animal Supplies Stores, Inc. Petsmart, Inc. (Argos Merger Sub, Inc.) PGX Holdings, Inc. Pharmaceutical Product Development, Inc. (Jaguar Holdings, LLC) Phillips-Medisize Corporation Physio-Control International, Inc. Pinnacle Foods Finance LLC Planet Fitness Holdings LLC PrePaid Legal Services, Inc. Presidio, Inc. Prime Security Services (Protection One) Ranpak Holdings, Inc. Ranpak Holdings, Inc. Redtop Acquisitions Limited Regal Cinemas Corporation Research Now Group, Inc Rexnord LLC/RBS Global, Inc. Reynolds Group Holdings Inc. Riverbed Technology, Inc. Rocket Software, Inc. Rovi Solutions Corporation / Rovi Guides, Inc. Royal Adhesives and Sealants Royal Adhesives and Sealants RPI Finance Trust Sable International Finance Ltd Sable International Finance Ltd SBP Holdings LP Scientific Games International, Inc. SCS Holdings (Sirius Computer) Seadrill Operating LP Sensus USA Inc. (fka Sensus Metering Systems) ServiceMaster Company, The Shearers Foods LLC Sitel Worldwide Sonneborn, LLC Sonneborn, LLC Sophia, L.P. SourceHOV LLC SRAM, LLC Staples, Inc. Steak ‘n Shake Operations, Inc. SuperMedia Inc. (fka Idearc Inc.) Survey Sampling International Sybil Finance BV Syniverse Holdings, Inc. TaxACT, Inc. TGI Friday’s, Inc. Townsquare Media, Inc. TPF II Power LLC and TPF II Covert Midco LLC TransDigm, Inc. Travel Leaders Group, LLC Tricorbraun, Inc. (fka Kranson Industries, Inc.) Truven Health Analytics Inc. (fka Thomson Reuters (Healthcare) Inc.) Twin River Management Group, Inc. U.S. Security Associates Holdings, Inc. U.S. Security Associates Holdings, Inc. Univar Inc. Univision Communications Inc. Valeant Pharmaceuticals International, Inc. Verint Systems Inc. Vertafore, Inc. Vizient Inc. Vouvray US Finance Washington Inventory Service West Corporation ZEP Inc. Cash and cash equivalents U.S. Bank Money Market (a) Total cash and cash equivalents (a) Included within cash and cash equivalents in Saratoga CLO’s Statements of Assets and Liabilities as of February Issuer_Name Industry Asset_Name Asset_Type Current Rate Maturity Date Principal / Number of Cost Fair Value Elyria Foundry Company, LLC Industrial Equipment Warrants Equity 0.00 % — $ — $ — Network Communications, Inc. Business Equipment and Services Common Equity 0.00 % 169,143 169,143 659,658 OLD AII, Inc (fka Aleris International Inc.) Conglomerate Common Equity 0.00 % 2,624 224,656 128,576 PATS Aircraft, LLC Aerospace and Defense Common Equity 0.00 % 51,813 282,326 282,329 SuperMedia Inc. (fka Idearc Inc.) Publishing Common Stock Equity 0.00 % 10,821 28,784 5,411 Academy, LTD. Retailers (Except Food and Drugs) Initial Term Loan (2012) Loan 4.75 % 8/3/2018 $ 1,980,037 1,966,002 2,000,927 ACCO Brands Corporation Conglomerate Term B Loan Loan 4.25 % 5/1/2019 $ 351,944 348,847 354,584 Acosta, Inc. Food Products Term D Loan Loan 5.00 % 3/2/2018 $ 4,183,659 4,120,774 4,216,082 Aderant North America, Inc. Business Equipment and Services Term Loan (First Lien) Loan 6.25 % 12/20/2018 $ 3,500,000 3,495,662 3,552,500 Aeroflex Incorporated Aerospace and Defense Tranche B Term Loan Loan 5.75 % 5/9/2018 $ 3,345,517 3,333,081 3,369,204 Alcatel-Lucent USA Inc. Telecommunications/Cellular US Term Loan Loan 0.00 % 1/30/2019 $ 1,075,000 1,069,625 1,087,008 Alere Inc. (fka IM US Holdings, LLC) Healthcare Incremental B-1 Term Loan Loan 4.75 % 6/30/2017 $ 1,980,000 1,941,348 1,999,444 Aptalis Pharma, Inc. (fka Axcan Intermediate Holdings Inc.) Drugs Term B-1 Loan Loan 5.50 % 2/10/2017 $ 1,960,000 1,953,535 1,963,920 Aramark Corporation Food Products LC-2 Facility Loan 3.45 % 7/26/2016 $ 79,187 79,187 79,600 Aramark Corporation Food Products LC-3 Facility Loan 3.45 % 7/26/2016 $ 43,961 43,961 44,190 Aramark Corporation Food Products U.S. Term B Loan (Extending) Loan 3.45 % 7/26/2016 $ 1,204,093 1,204,093 1,210,366 Aramark Corporation Food Products U.S. Term C Loan Loan 3.52 % 7/26/2016 $ 2,545,700 2,545,700 2,558,963 Armstrong World Industries, Inc Building and Development Term Loan B-1 Loan 4.00 % 3/10/2018 $ 2,122,931 2,109,740 2,124,268 Asurion, LLC (fka Asurion Corporation) Insurance Amortizing Term Loan Loan 4.75 % 7/23/2017 $ 968,750 960,226 973,594 Asurion, LLC (fka Asurion Corporation) Insurance Incremental Tranche B-1 Term Loan Loan 4.50 % 5/24/2019 $ 5,659,091 5,602,698 5,674,144 Auction.Com, LLC Business Equipment and Services Term Loan A-4 Loan 4.96 % 8/30/2016 $ 1,018,699 1,017,479 1,013,606 Aurora Diagnostics, LLC Conglomerate Tranche B Term Loan Loan 6.25 % 5/26/2016 $ 3,188,889 3,198,281 3,077,278 Autotrader.com, Inc. Automotive Tranche B-1 Term Loan Loan 4.00 % 12/15/2016 $ 3,830,768 3,830,768 3,853,522 Avantor Performance Materials Holdings, Inc. Chemicals/Plastics Term Loan Loan 5.25 % 6/24/2017 $ 4,925,000 4,907,124 4,925,000 AZ Chem US Inc. Chemicals/Plastics Term Loan Loan 5.25 % 12/22/2017 $ 1,570,579 1,532,447 1,585,170 Biomet, Inc. Healthcare Dollar Term B-1 Loan Loan 4.00 % 7/25/2017 $ 1,990,013 1,990,013 2,003,445 Bombardier Recreational Products Inc. Leisure Goods/Activities/Movies Term B Loan Loan 5.00 % 1/30/2019 $ 1,000,000 990,101 1,007,500 Brock Holdings III, Inc. Industrial Equipment Term Loan (First Lien) Loan 0.00 % 3/16/2017 $ 2,000,000 2,022,500 2,013,340 Burlington Coat Factory Warehouse Corporation Retailers (Except Food and Drugs) Term B-1 Loan Loan 5.50 % 2/23/2017 $ 2,776,843 2,767,803 2,802,306 C.H.I. Overhead Doors, Inc. (CHI) Home Furnishings Term Loan (First Lien) Loan 7.25 % 8/17/2017 $ 2,976,290 2,931,556 2,983,730 Camp International Holding Company Aerospace and Defense Refinanced Term Loan (First Lien) Loan 5.25 % 5/31/2019 $ 997,500 988,136 1,005,400 Capital Automotive L.P. Conglomerate Tranche B Term Loan Loan 5.25 % 3/11/2017 $ 2,811,086 2,817,777 2,823,961 Capstone Logistics, LLC Business Equipment and Services Term Note A Loan 7.50 % 9/16/2016 $ 2,699,305 2,669,394 2,658,816 Capsugel Holdings US, Inc. Drugs Initial Term Loan (New) Loan 4.75 % 8/1/2018 $ 3,605,198 3,595,976 3,641,214 Celanese US Holdings LLC Chemicals/Plastics Dollar Term C Loan (Extended) Loan 3.06 % 10/31/2016 $ 2,198,534 2,219,212 2,208,911 Cenveo Corporation Publishing Term B Facility Loan 7.00 % 12/21/2016 $ 2,437,399 2,421,925 2,444,516 Charter Communications Operating, LLC Cable and Satellite Television Term C Loan Loan 3.46 % 9/6/2016 $ 2,047,547 2,044,048 2,057,785 Charter Communications Operating, LLC Cable and Satellite Television Term D Loan Loan 4.00 % 5/15/2019 $ 1,985,000 1,976,313 2,000,503 CHS/ Community Health Systems, Inc. Healthcare Extended Term Loan Loan 3.79 % 1/25/2017 $ 4,064,516 3,963,653 4,090,935 Cinedigm Digital Funding I, LLC Business Equipment and Services Term Loan Loan 5.75 % 2/28/2018 $ 1,066,260 1,059,429 1,068,925 Contec, LLC Electronics/Electric Second Lien Term Notes Loan 10.00 % 11/2/2016 $ 401,202 2,400,891 2,578,210 Covanta Energy Corporation Ecological Services and Equipment Term Loan Loan 4.00 % 3/28/2019 $ 496,250 494,095 501,833 CPI International Acquisition, Inc. (f/k/a Catalyst Holdings, Inc.) Electronics/Electric Term B Loan Loan 5.00 % 2/13/2017 $ 4,805,833 4,789,964 4,829,862 Crown Castle Operating Company Telecommunications/Cellular Tranche B Term Loan Loan 4.00 % 1/31/2019 $ 1,980,000 1,963,120 1,989,484 Culligan International Company Conglomerate Dollar Loan (First Lien) Loan 6.25 % 12/19/2017 $ 795,675 732,459 729,372 Culligan International Company Conglomerate Dollar Loan (Second Lien) Loan 9.50 % 6/19/2018 $ 783,162 720,189 604,343 DaVita HealthCare Partners Inc. (fka DaVita Inc.) Healthcare Tranche B Term Loan Loan 4.50 % 10/20/2016 $ 3,949,622 3,949,622 3,977,822 DCS Business Services, Inc. Financial Intermediaries Term B Loan Loan 7.25 % 3/19/2018 $ 3,970,010 3,919,904 3,910,460 Del Monte Foods Company Food Products Initial Term Loan Loan 4.00 % 3/8/2018 $ 4,438,139 4,473,061 4,443,687 Delphi Corporation Electronics/Electric Tranche A Term Loan Retired 03/01/2013 Loan 4.25 % 3/31/2016 $ 1,683,357 1,685,403 1,682,650 Digitalglobe, Inc. Ecological Services and Equipment Term Loan Loan 0.00 % 1/31/2020 $ 250,000 250,000 250,783 DS Waters of America, Inc. Beverage and Tobacco Term Loan (First Lien) Loan 10.50 % 8/29/2017 $ 2,977,500 2,928,511 3,037,050 Dunkin’ Brands, Inc. Food Services Term B-3 Loan Loan 0.00 % 2/14/2020 $ 4,000,000 3,990,000 3,990,000 DynCorp International Inc. Aerospace and Defense Term Loan Loan 6.25 % 7/7/2016 $ 574,161 567,732 577,606 Education Management LLC Leisure Goods/Activities/Movies Tranche C-2 Term Loan Loan 4.31 % 6/1/2016 $ 3,925,006 3,727,372 3,263,878 eInstruction Corporation Electronics/Electric Initial Term Loan Loan 0.00 % 7/2/2013 $ 2,997,722 2,931,236 899,317 Electrical Components International, Inc. Electronics/Electric Synthetic Revolving Loan Loan 6.75 % 2/4/2016 $ 117,647 116,611 117,647 Electrical Components International, Inc. Electronics/Electric Term Loan Loan 6.75 % 2/4/2017 $ 1,786,475 1,768,892 1,786,475 Evergreen Acqco 1 LP Retailers (Except Food and Drugs) New Term Loan Loan 5.00 % 7/9/2019 $ 497,503 492,828 501,702 Federal-Mogul Corporation Automotive Tranche B Term Loan Loan 2.14 % 12/29/2014 $ 2,589,036 2,498,894 2,467,351 Federal-Mogul Corporation Automotive Tranche C Term Loan Loan 2.14 % 12/28/2015 $ 1,320,937 1,264,234 1,258,853 First Data Corporation Financial Intermediaries 2017 Dollar Term Loan Loan 5.20 % 3/24/2017 $ 2,111,028 2,027,434 2,111,914 First Data Corporation Financial Intermediaries 2018 Dollar Term Loan Loan 4.20 % 3/23/2018 $ 2,290,451 2,216,829 2,261,591 Freescale Semiconductor, Inc. Electronics/Electric Tranche B-1 Term Loan Retired 03/01/2013 Loan 4.45 % 12/1/2016 $ 2,534,348 2,450,139 2,535,945 FTD Group, Inc. Retailers (Except Food and Drugs) Initial Term Loan Loan 4.75 % 6/11/2018 $ 3,715,723 3,683,533 3,715,723 Generac Power Systems, Inc. Industrial Equipment Term Loan Loan 6.25 % 5/30/2018 $ 906,111 890,154 923,590 General Nutrition Centers, Inc. Retailers (Except Food and Drugs) Amended Tranche B Term Loan Loan 3.75 % 3/2/2018 $ 4,746,591 4,757,841 4,774,548 Global Tel*Link Corporation Business Equipment and Services Replacement Term Loan Loan 6.00 % 12/14/2017 $ 1,964,912 1,960,077 1,967,368 Goodyear Tire & Rubber Company, The Chemicals/Plastics Loan (Second Lien) Loan 4.75 % 4/30/2019 $ 4,000,000 3,929,629 4,015,000 Grifols Inc. Drugs New U.S. Tranche B Term Loan Loan 4.25 % 6/1/2017 $ 3,465,982 3,457,357 3,481,371 Grosvenor Capital Management Holdings, LLLP Brokers/Dealers/Investment Houses Tranche C Term Loan Loan 4.25 % 12/5/2016 $ 3,336,378 3,252,391 3,311,355 Hanger Orthopedic Group, Inc. Healthcare Term C Loan Loan 4.00 % 12/1/2016 $ 3,910,667 3,920,277 3,925,332 HCA Inc. Healthcare Tranche B-3 Term Loan Loan 3.45 % 5/1/2018 $ 5,734,690 5,440,293 5,764,912 Health Management Associates, Inc. Healthcare Term B Loan Loan 4.50 % 11/16/2018 $ 2,970,000 2,945,366 2,993,344 Hertz Corporation, The Automotive Tranche B-1 Term Loan Loan 0.00 % 3/11/2018 $ 3,000,000 3,045,000 3,045,000 HIBU PLC (fka Yell Group PLC) Business Equipment and Services Facility B1 - YB (USA) LLC (11/2009) Loan 3.95 % 7/31/2014 $ 3,030,606 2,983,167 530,356 HMH Holdings (Delaware) Inc. Conglomerate Term Loan (Exit Facility) Loan 7.25 % 5/22/2018 $ 992,500 974,925 997,463 Hologic, Inc. Healthcare Tranche A Term Loan Loan 3.20 % 8/1/2017 $ 2,437,500 2,432,069 2,439,328 Hunter Defense Technologies, Inc. Aerospace and Defense Term Loan Loan 3.54 % 8/22/2014 $ 3,679,939 3,647,610 3,385,544 Huntsman International LLC Chemicals/Plastics Extended Term B Loan Loan 2.75 % 4/19/2017 $ 3,920,000 3,883,690 3,920,000 Infor (US), Inc. (fka Lawson Software Inc.) Business Equipment and Services Tranche B-2 Term Loan Loan 5.25 % 4/5/2018 $ 1,990,013 1,971,642 2,011,166 Inventiv Health, Inc. (fka Ventive Health, Inc) Conglomerate Consolidated Term Loan Loan 7.50 % 8/4/2016 $ 492,090 492,090 484,093 J. Crew Group, Inc. Retailers (Except Food and Drugs) Term B-1 Loan Loan 4.00 % 3/7/2018 $ 982,500 982,500 982,726 JFB Firth Rixson Inc. Industrial Equipment 2013 Replacement Dollar Term Facility Loan Loan 4.25 % 6/30/2017 $ 2,590,213 2,577,375 2,598,838 Kalispel Tribal Economic Authority Lodging and Casinos Term Loan Loan 7.50 % 2/24/2017 $ 3,625,323 3,577,074 3,634,387 Kinetic Concepts, Inc. Healthcare Dollar Term C-1 Loan Loan 5.50 % 5/4/2018 $ 495,000 478,661 501,034 Kronos Worldwide, Inc. Chemicals/Plastics Initial Term Loan Loan 7.00 % 6/13/2018 $ 500,000 500,000 504,065 MetroPCS Wireless, Inc. Telecommunications Tranche B-2 Term Loan Loan 4.07 % 11/3/2016 $ 2,489,192 2,491,685 2,495,938 Michaels Stores, Inc. Retailers (Except Food and Drugs) Term B Loan Loan 3.75 % 1/28/2020 $ 500,000 500,000 501,110 Microsemi Corporation Electronics/Electric Term Loan Loan 3.75 % 2/20/2020 $ 2,688,796 2,682,872 2,697,212 National CineMedia, LLC Leisure Goods/Activities/Movies Term Loan Loan 3.46 % 11/26/2019 $ 1,086,207 1,050,910 1,089,607 Newsday, LLC Publishing Term Loan Loan 3.70 % 10/12/2016 $ 3,000,000 2,996,317 2,992,500 Novelis, Inc. Conglomerate Term B-2 Loan Loan 4.00 % 3/10/2017 $ 987,500 968,539 988,734 Novelis, Inc. Conglomerate Term Loan Loan 4.00 % 3/10/2017 $ 3,920,009 3,946,297 3,924,909 NPC International, Inc. Food Services Term Loan Loan 4.50 % 12/28/2018 $ 490,833 490,833 495,128 NRG Energy, Inc. Utilities Term Loan Loan 3.25 % 7/1/2018 $ 3,940,000 3,910,795 3,958,557 NuSil Technology LLC. Chemicals/Plastics Term Loan Loan 5.00 % 4/7/2017 $ 820,339 820,339 824,695 OEP Pearl Dutch Acquisition B.V. Chemicals/Plastics Initial BV Term Loan Loan 6.50 % 3/30/2018 $ 148,875 146,330 149,992 On Assignment, Inc. Business Equipment and Services Initial Term B Loan Loan 5.00 % 5/15/2019 $ 2,413,048 2,399,166 2,434,114 Onex Carestream Finance LP Healthcare Term Loan Loan 5.00 % 2/25/2017 $ 4,909,816 4,893,453 4,916,739 OpenLink International, Inc. Business Equipment and Services Initial Term Loan Loan 7.75 % 10/30/2017 $ 990,000 974,594 988,763 P.F. Chang’s China Bistro, Inc. (Wok Acquisition Corp.) Food/Drug Retailers Term Borrowing Loan 5.25 % 6/22/2019 $ 997,500 988,412 1,007,475 PATS Aircraft, LLC Aerospace and Defense Term Loan Loan 8.50 % 10/6/2016 $ 357,331 239,023 276,932 Penn National Gaming, Inc. Lodging and Casinos Term A Facility Loan 1.72 % 7/14/2016 $ 2,775,888 2,719,125 2,776,748 Penn National Gaming, Inc. Lodging and Casinos Term B Facility Loan 3.75 % 7/16/2018 $ 985,013 983,123 988,431 PetCo Animal Supplies, Inc. Retailers (Except Food and Drugs) New Loans Loan 4.00 % 11/24/2017 $ 1,496,173 1,494,329 1,501,784 Pharmaceutical Product Development, Inc. (Jaguar Holdings, LLC) Conglomerate 2013 Term Loan Loan 4.25 % 12/5/2018 $ 1,980,000 1,950,704 1,989,583 Physician Oncology Services, LP Healthcare Delayed Draw Term Loan Loan 7.75 % 1/31/2017 $ 51,020 50,682 50,765 Physician Oncology Services, LP Healthcare Effective Date Term Loan Loan 7.75 % 1/31/2017 $ 419,961 417,178 417,861 Pinnacle Foods Finance LLC Food Products Extended Initial Term Loan Loan 3.70 % 10/2/2016 $ 5,726,579 5,491,534 5,761,168 Preferred Proppants, LLC Nonferrous Metals/Minerals Term B Loan Loan 7.50 % 12/15/2016 $ 1,980,000 1,949,170 1,841,400 Prestige Brands, Inc. Drugs Term B-1 Loan Loan 3.76 % 1/31/2019 $ 679,545 669,390 683,507 Pro Mach, Inc. Industrial Equipment Term Loan Loan 5.00 % 7/6/2017 $ 1,956,155 1,941,853 1,961,045 Quintiles Transnational Corp. Conglomerate Term B-2 Loan Loan 4.50 % 6/8/2018 $ 3,681,541 3,653,803 3,716,810 Ranpak Corp. Food/Drug Retailers USD Term Loan (First Lien) Loan 4.75 % 4/20/2017 $ 2,396,012 2,387,700 2,384,032 Rexnord LLC/RBS Global, Inc. Industrial Equipment Term B Loan Refinancing Loan 4.50 % 4/1/2018 $ 1,995,000 1,995,000 2,005,454 Reynolds Group Holdings Inc. Industrial Equipment U.S. Term Loan Loan 4.75 % 9/28/2018 $ 1,995,000 1,995,000 2,017,244 Rocket Software, Inc. Business Equipment and Services Term Loan (First Lien) Loan 5.75 % 2/8/2018 $ 1,980,000 1,947,152 1,986,197 Roundy’s Supermarkets, Inc. Food/Drug Retailers Tranche B Term Loan Loan 5.75 % 2/13/2019 $ 992,500 979,782 937,297 Rovi Solutions Corporation / Rovi Guides, Inc. Electronics/Electric Tranche A-2 Loan Loan 2.46 % 3/29/2017 $ 1,860,226 1,843,739 1,855,576 Rovi Solutions Corporation / Rovi Guides, Inc. Electronics/Electric Tranche B-2 Loan Loan 4.00 % 3/29/2019 $ 1,384,706 1,378,679 1,389,899 Royal Adhesives and Sealants, LLC Chemicals/Plastics Term A Loan Loan 7.25 % 11/29/2015 $ 4,498,210 4,459,450 4,432,399 RPI Finance Trust Drugs 6.75 Year Term Loan(2012) Loan 3.50 % 5/9/2018 $ 5,398,833 5,373,794 5,449,474 Scientific Games International Inc. Electronics/Electric Tranche B-1 Term Loan Loan 3.21 % 6/30/2015 $ 1,977,810 1,965,672 1,985,226 Scitor Corporation Business Equipment and Services Term Loan Loan 5.00 % 2/15/2017 $ 463,977 462,444 460,692 Securus Technologies Holdings, Inc (fka Securus Technologies, Inc.) Telecommunications Tranche 2 Term Loan (First Lien) Loan 6.50 % 5/31/2017 $ 1,985,000 1,967,961 1,975,075 Sensata Technology BV/Sensata Technology Finance Company, LLC Electronics/Electric Term Loan Loan 3.75 % 5/12/2018 $ 2,969,849 2,969,849 2,986,540 Sensus USA Inc. (fka Sensus Metering Systems) Utilities Term Loan (First Lien) Loan 4.75 % 5/9/2017 $ 1,965,000 1,958,111 1,961,070 ServiceMaster Company, The Conglomerate Tranche B Term Loan Loan 4.45 % 1/31/2017 $ 2,851,387 2,861,398 2,857,089 SI Organization, Inc., The Aerospace and Defense New Tranche B Term Loan Loan 4.50 % 11/22/2016 $ 3,920,000 3,895,621 3,906,946 Sonneborn, LLC Chemicals/Plastics Initial US Term Loan Loan 6.50 % 3/30/2018 $ 843,625 829,202 849,952 Sophia, L.P. Electronics/Electric Term B Loan Loan 4.50 % 7/19/2018 $ 969,244 954,866 976,310 SRA International Inc. Aerospace and Defense Term Loan Loan 6.50 % 7/20/2018 $ 3,268,571 3,165,384 3,154,171 SRAM, LLC Industrial Equipment Term Loan (First Lien) Loan 4.77 % 6/7/2018 $ 3,441,181 3,411,986 3,458,386 SS&C Technologies, Inc., /Sunshine Acquisition II, Inc. Business Equipment and Services Funded Term B-1 Loan Loan 5.00 % 6/7/2019 $ 811,071 803,796 817,138 SS&C Technologies, Inc., /Sunshine Acquisition II, Inc. Business Equipment and Services Funded Term B-2 Loan Loan 5.00 % 6/7/2019 $ 83,904 83,151 84,531 SunCoke Energy, Inc. Nonferrous Metals/Minerals Tranche B Term Loan Loan 4.00 % 7/26/2018 $ 1,367,311 1,357,359 1,370,729 SunGard Data Systems Inc (Solar Capital Corp.) Conglomerate Tranche B U.S. Term Loan Loan 3.85 % 2/28/2016 $ 4,253,748 4,184,167 4,260,086 SunGard Data Systems Inc (Solar Capital Corp.) Conglomerate Tranche C Term Loan Loan 3.95 % 2/28/2017 $ 497,687 493,012 500,544 SuperMedia Inc. (fka Idearc Inc.) Publishing Loan Loan 11.00 % 12/31/2015 $ 289,811 281,918 214,875 Syniverse Holdings, Inc. Telecommunications Initial Term Loan Loan 5.00 % 4/23/2019 $ 497,500 493,115 500,609 Taminco Global Chemical Corporation Chemicals/Plastics Tranche B-2 Dollar Term Loan Loan 4.25 % 2/15/2019 $ 1,488,750 1,478,991 1,498,859 Team Health, Inc. Healthcare Tranche B Term Loan Loan 3.75 % 6/29/2018 $ 4,432,500 4,415,534 4,432,500 TECTUM HOLDINGS INC Industrial Equipment Term Loan Loan 7.50 % 12/3/2015 $ 4,000,000 3,981,089 3,980,000 Texas Competitive Electric Holdings Company, LLC (TXU) Utilities 2014 Term Loan (Non-Extending) Loan 3.73 % 10/10/2014 $ 5,580,862 5,527,535 4,012,249 Tomkins, LLC / Tomkins, Inc. (f/k/a Pinafore, LLC / Pinafore, Inc.) Conglomerate Term B-2 Loan Loan 3.75 % 9/29/2016 $ 2,431,854 2,437,744 2,450,093 TransDigm Inc. Aerospace and Defense Tranche C Term Loan Loan 3.75 % 2/28/2020 $ 4,945,974 4,955,789 4,955,587 Tricorbraun Inc. (fka Kranson Industries, Inc.) Containers/Glass Products Term Loan Loan 5.50 % 5/3/2018 $ 1,990,000 1,981,374 2,008,666 Truven Health Analytics Inc. (fka Thomson Reuters (Healthcare) Inc.) Healthcare New Tranche B Term Loan Loan 5.75 % 6/6/2019 $ 497,500 488,158 501,853 Tube City IMS Corporation Steel Term Loan Loan 5.75 % 3/20/2019 $ 992,500 983,864 1,001,184 U.S. Security Associates Holdings, Inc. Business Equipment and Services Delayed Draw Term Loan Loan 6.00 % 7/28/2017 $ 161,778 160,586 162,688 U.S. Security Associates Holdings, Inc. Business Equipment and Services Term Loan B Loan 6.00 % 7/28/2017 $ 123,747 123,243 124,444 U.S. Security Associates Holdings, Inc. Business Equipment and Services Term Loan B Loan 6.00 % 7/28/2017 $ 826,540 820,452 831,193 U.S. Silica Company Nonferrous Metals/Minerals Loan Loan 4.75 % 6/8/2017 $ 1,970,000 1,962,974 1,974,925 U.S. Xpress Enterprises, Inc. Industrial Equipment Extended Term Loan Loan 9.00 % 11/13/2016 $ 2,913,628 2,858,339 2,906,344 United Surgical Partners International, Inc. Healthcare New Tranche B Term Loan Loan 6.00 % 4/3/2019 $ 2,481,281 2,448,808 2,486,715 Univar Inc. Chemicals/Plastics Term B Loan Loan 5.00 % 6/30/2017 $ 3,924,924 3,924,007 3,902,670 Univision Communications Inc. Telecommunications 2013 Converted Extended First-Lien Term Loan Loan 4.75 % 3/1/2020 $ 3,000,000 2,981,257 3,000,870 UPC Financing Partnership Broadcast Radio and Television Facility AF Loan 4.00 % 1/31/2021 $ 1,000,000 970,954 1,010,000 Valeant Pharmaceuticals International, Inc. Drugs Series D-1 Tranche B Term Loan Loan 3.50 % 2/13/2019 $ 2,985,000 2,972,608 3,006,462 Vantiv, LLC (fka Fifth Third Processing Solutions, LLC) Financial Intermediaries Tranche B Term Loan Loan 3.75 % 3/27/2019 $ 1,063,393 1,058,765 1,065,520 Verint Systems Inc. Business Equipment and Services Term Loan 2011 Loan 4.50 % 10/27/2017 $ 1,920,000 1,913,087 1,921,920 Vertafore, Inc. Business Equipment and Services Term Loan (First Lien) Loan 5.25 % 7/29/2016 $ 2,984,781 2,984,781 3,018,360 Visant Corporation (fka Jostens) Leisure Goods/Activities/Movies Tranche B Term Loan (2011) Loan 5.25 % 12/22/2016 $ 3,696,942 3,696,942 3,518,269 Washington Inventory Service Business Equipment and Services U.S. Term Loan (First Lien) Loan 5.75 % 12/20/2018 $ 2,000,000 2,029,513 2,007,500 Weight Watchers International, Inc. Food Products Term D Loan Loan 2.56 % 6/30/2016 $ 2,700,529 2,667,383 2,701,879 Wendy’s International, Inc Food Services Term Loan Loan 4.75 % 5/15/2019 $ 997,500 988,532 1,006,098 West Corporation Telecommunications Term B-8 Loan Loan 4.25 % 6/30/2018 $ 2,971,535 3,023,298 2,978,964 Wolverine World Wide, Inc. Clothing/Textiles Tranche B Term Loan Loan 4.00 % 10/9/2019 $ 854,821 846,633 861,233 Yankee Candle Company, Inc., The Retailers (Except Food and Drugs) Initial Term Loan Loan 5.25 % 4/2/2019 $ 2,256,466 2,236,833 2,268,877 BABSN 2007-1A Financial Intermediaries Floating - 01/2021 - D1 - 05617AAA9 ABS 3.55 % 1/18/2021 $ 1,500,000 1,258,888 1,050,000 GALE 2007-3A Financial Intermediaries Floating - 04/2021 - E - 363205AA3 ABS 3.80 % 4/19/2021 $ 4,000,000 3,386,571 2,800,000 KATO 2006-9A Financial Intermediaries Floating - 01/2019 - B2L - 486010AA9 ABS 3.80 % 1/25/2019 $ 5,000,000 4,339,337 3,500,000 STCLO 2007-6A Financial Intermediaries Floating - 04/2021 - D- 86176YAG7 ABS 3.90 % 4/17/2021 $ 5,000,000 4,054,244 3,500,000 $ 379,843,341 $ 374,419,979 Saratoga Investment Corp. CLO 2013-1, Ltd. Statements of Changes in Net Assets For the year ended For the year ended For the year ended INCREASE FROM OPERATIONS: Net investment income (loss) $ (2,143,630 ) $ 1,033,327 $ 2,368,009 Net realized gain (loss) from investments (8,815,296 ) 2,532,558 (4,547,952 ) Net unrealized appreciation (depreciation) on investments 6,776,871 3,235,774 (650,241 ) Net increase (decrease) in net assets from operations (4,182,055 ) 6,801,659 (2,830,184 ) Total increase (decrease) in net assets (4,182,055 ) 6,801,659 (2,830,184 ) Net assets at beginning of period 838,817 (5,962,842 ) (3,132,658 ) Net assets at end of period $ (3,343,238 ) $ 838,817 $ (5,962,842 ) INCREASE (DECREASE) FROM OPERATIONS: Net investment income (loss) Net realized gain from investments Net unrealized appreciation (depreciation) on investments Net increase (decrease) in net assets from operations Total increase (decrease) in net assets Net assets at beginning of period Net assets at end of period See accompanying notes to financial statements. Saratoga Investment Corp. CLO 2013-1, Ltd. For the year ended For the year ended For the year ended Operating activities NET INCREASE (DECREASE) IN NET ASSETS FROM OPERATIONS $ (4,182,055 ) $ 6,801,659 $ (2,830,184 ) ADJUSTMENTS TO RECONCILE NET INCREASE (DECREASE) IN NET ASSETS FROM OPERATIONS TO NET CASH PROVIDED BY (USED BY) OPERATING ACTIVITIES: Paid-in-kind interest income (10,122 ) — (223,448 ) Net accretion of discount on investments (568,674 ) (1,383,978 ) (2,997,514 ) Amortization of deferred debt financing costs 994,602 1,015,332 1,016,124 Loss on extinguishment of debt 3,442,442 — — Net realized (gain) loss from investments 8,815,296 (2,532,558 ) 4,547,952 Net unrealized (appreciation) depreciation on investments (6,776,871 ) (3,235,774 ) 650,241 Proceeds from sale and redemption of investments 128,190,654 165,363,963 216,319,521 Purchase of investments (55,721,381 ) (151,267,166 ) (208,491,101 ) (Increase) decrease in operating assets: Interest receivable 134,033 (3,547 ) 155,579 Receivable from open trades 3,330,272 4,915,102 (10,046,640 ) Other Assets (91,336 ) — — Increase (decrease) in operating liabilities: Interest Payable (43,645 ) (160,620 ) 125,101 Payable for open trades (6,901,250 ) (8,510,897 ) (293,957 ) Accrued base management fee 31,882 (2,345 ) (835 ) Accrued subordinated management fee (97,629 ) (9,382 ) (3,338 ) NET CASH PROVIDED BY (USED BY) OPERATING ACTIVITIES 70,546,218 10,989,789 (2,072,499 ) Financing activities Borrowings on debt 277,711,620 — — Paydowns on debt (366,793,378 ) — — Deferred debt financing costs (2,250,398 ) — — NET CASH USED BY FINANCING ACTIVITIES (91,332,156 ) — — NET INCREASE (DECREASE) IN CASH AND CASH EQUIVALENTS (20,785,938 ) 10,989,789 (2,072,499 ) CASH AND CASH EQUIVALENTS, BEGINNING OF PERIOD 28,804,871 17,815,082 19,887,581 CASH AND CASH EQUIVALENTS, END OF PERIOD $ 8,018,933 $ 28,804,871 $ 17,815,082 Supplemental Information: Interest paid during the period $ 11,722,159 $ 15,773,621 $ 14,355,520 Supplemental non-cash information: Paid-in-kind interest income $ 10,122 $ — $ 223,448 Net accretion of discount on investments $ 568,674 $ 1,383,978 $ 2,997,514 Amortization of deferred debt financing costs $ 994,602 $ 1,015,332 $ 1,016,124 Operating activities NET INCREASE (DECREASE) IN NET ASSETS FROM OPERATIONS ADJUSTMENTS TO RECONCILE NET INCREASE (DECREASE) IN NET ASSETS FROM OPERATIONS TO NET CASH PROVIDED BY (USED IN) OPERATING ACTIVITIES: Payment-in-kind interest income Net accretion of discount on investments Amortization of deferred debt financing costs Loss on extinguishment of debt Net realized gain from investments Net unrealized (appreciation) depreciation on investments Proceeds from sale and redemption of investments Purchase of investments (Increase) decrease in operating assets: Interest receivable Receivable from open trades Other Assets Increase (decrease) in operating liabilities: Interest Payable Payable for open trades Accrued base management fee Accrued subordinated management fee NET CASH PROVIDED BY (USED IN) OPERATING ACTIVITIES Financing activities Borrowings on debt Paydowns on debt Deferred debt financing costs NET CASH USED IN FINANCING ACTIVITIES NET INCREASE (DECREASE) IN CASH AND CASH EQUIVALENTS CASH AND CASH EQUIVALENTS, BEGINNING OF PERIOD CASH AND CASH EQUIVALENTS, END OF PERIOD Supplemental Information: Interest paid during the period Supplemental non-cash information: Paid-in-kind interest income Net accretion of discount on investments Amortization of deferred debt financing costs See accompanying notes to financial statements. SARATOGA INVESTMENT CORP. CLO 2013-1, LTD. 1. Organization and Purpose Saratoga Investment Corp. CLO 2013-1, Ltd. (the “Issuer”, “we”, “our”, “us”, “CLO” and “Saratoga CLO”), an exempted company with limited liability incorporated under the laws of the Cayman Islands was formed on November 28, 2007 and commenced operations on January 22, 2008. The Issuer was established to acquire or participate in U.S. dollar-denominated corporate debt obligations. On January 22, 2008, the Issuer issued $400.0 million of notes, consisting of Class A Floating Rate Senior Notes, Class B Floating Rate Senior Notes, Class C Deferrable Floating Rate Notes, Class D Deferrable Floating Rate Notes, Class E Deferrable Floating Rate Notes (collectively the “Secured Notes”), and Subordinated Notes. The notes were issued pursuant to an indenture, dated January 22, 2008 (the “Indenture”), with U.S. Bank National Association (the “Trustee”) servicing as the Trustee there under. On October 17, 2013, in a refinancing transaction, the Issuer issued $284.9 million of notes (the “2013-1 CLO Notes”), consisting of Class X Floating Rate Senior Notes, Class A-1 Floating Rate Senior Notes, Class A-2 Floating Rate Senior Notes, Class B Floating Rate Senior Notes, Class C Deferrable Floating Rate Notes, Class D Deferrable Floating Rate Notes, Class E Deferrable Floating Rate Notes, and Class F Deferrable Floating Rate Notes. The 2013-1 CLO Notes were issued pursuant to the Indenture with the same Trustee. Proceeds of the issuance of the 2013-1 CLO Notes were used, along with existing assets held by the Trustee, to redeem all of the Secured Notes issued in 2008. On November 15, 2016, the Issuer completed the second refinancing and the Issuer issued $282.4 million of notes (the “2013-1 Amended CLO Notes”), consisting of Class A-1 Floating Rate Senior Notes, Class A-2 Floating Rate Senior Notes, Class B Floating Rate Senior Notes, Class C Deferrable Floating Rate Notes, Class D Deferrable Floating Rate Notes, Class E Deferrable Floating Rate Notes, and Class F Deferrable Floating Rate Notes. The 2013-1 Amended CLO Notes were issued pursuant to the Indenture with the same Trustee. Proceeds of the issuance of the 2013-1 Amended CLO Notes were used, along with existing assets held by the Trustee, to redeem all of the 2013-1 CLO Notes issued in 2013. As of February 28, Pursuant to an investment management agreement (the “Investment Management Agreement”), Saratoga Investment Corp. (the “Investment Manager”), provides investment management services to the Issuer, and makes day-to-day investment decisions concerning the assets of the Issuer. The Investment Manager also performs certain administrative services on behalf of the Issuer under the Investment Management Agreement. 2. Significant Accounting Policies Basis of Presentation The accompanying financial statements have been prepared in accordance with U.S. generally accepted accounting principles (“U.S. GAAP”) and are stated in U.S. dollars. The following is a summary of the significant accounting policies followed by the Issuer in the preparation of its financial statements. The Issuer is considered to be an investment company for financial reporting purposes and has applied the guidance in accordance with the Financial Accounting Standards Board (“FASB”) Accounting Standards Codification (“ASC”) Topic 946,“Financial Services—Investment Companies.” There has been no change to the Issuer’s status as an investment company during the year ended February 28, 2017. Use of Estimates The preparation of the financial statements in conformity with U.S. GAAP requires the Investment Manager to make estimates and assumptions that affect the reported amounts of assets and liabilities at the date of the financial statements, including the fair value of investments, and the amounts of income and expenses during the reporting period. Actual results could differ from these estimates and such differences could be material. Cash and Cash Equivalents The Issuer defines cash and cash equivalents as highly liquid financial instruments with original maturities of three months or less. Cash and cash equivalents may include investments in money market mutual funds, which are carried at fair value. At February 28, Valuation of Investments The Issuer accounts for its investments at fair value in accordance with the Investments for which market quotations are readily available are fair valued at such market quotations obtained from independent third party pricing services and market makers subject to any decision by the Investment Manager to approve a fair value determination to reflect significant events affecting the value of these investments. The Investment Manager values investments for which market quotations are not readily available at fair value. Determinations of fair value may involve significant judgments and estimates. The types of factors that may be considered in determining the fair value of investments include the nature and realizable value of any collateral, the portfolio company’s ability to make payments, market yield trend analysis, the markets in which the portfolio company does business, comparison to publicly traded companies, discounted cash flow and other relevant factors. Because such valuations, and particularly valuations of private investments and private companies, are inherently uncertain, they may fluctuate over short periods of time and may be based on estimates. The determination of fair value may differ materially from the values that would have been used if a ready market for these investments existed. Our net asset value could be materially affected if the determinations regarding the fair value of our investments were materially higher or lower than the values that are ultimately realized upon the disposal of such investments. Investment Transactions and Income Recognition Purchases and sales of investments and the related realized gains or losses are recorded on a trade-date basis. Interest income, adjusted for amortization of premium and accretion of discount, is recorded on an accrual basis to the extent that such amounts are expected to be collected. The Issuer stops accruing interest on its investments when it is determined that interest is no longer collectible. Discounts and premiums on investments purchased are accreted/amortized over the life of the respective investment using the effective yield method. The amortized cost of investments represents the original cost adjusted for the accretion of discounts and amortizations of premium on investments. Loans are generally placed on non-accrual status when there is reasonable doubt that principal or interest will be collected. Accrued interest is generally reserved when a loan is placed on non-accrual status. Interest payments received on non-accrual loans may be recognized as a reduction in principal depending upon the Investment Manager’s judgment regarding collectability. Non-accrual loans are restored to accrual status when past due principal and interest is paid and, in management’s judgment, are likely to remain current, although we may make exceptions to this general rule if the loan has sufficient collateral value and is in the process of collection. The Issuer holds debt investments in its portfolio that contain a Deferred Debt Financing Costs, net In April 2015, the FASB has issued Accounting Standards Update (“ASU”) No. 2015-03,Interest—Imputation of Interest (Subtopic 835-30): Simplifying the Presentation of Debt Issuance Costs(“ASU 2015-03”). The amendments in this ASU require that debt issuance costs related to a recognized debt liability be presented in the balance sheet as a direct deduction from the carrying amount of that debt liability, consistent with debt discounts. The recognition and measurement guidance for debt issuance costs are not affected by the amendments in this ASU. The guidance is effective for fiscal years, and interim periods within those fiscal years, beginning after December 15, 2015, and early adoption is allowed, and is to be applied on a retrospective basis. Management has adopted the provisions of ASU 2015-03 as of February 28, 2015, by reclassifying deferred debt financing costs from within total assets to within total liabilities as a contra-liability. The adoption of the provisions of ASU 2015-03 did not materially impact the Issuer’s financial position or results of operations. Prior period amounts were reclassified to conform to the current period presentation. Included in deferred debt financing costs of Deferred debt financing costs of November 15, 2016. Management Fees The Issuer is externally managed by the Investment Manager pursuant to the Investment Management Agreement. As compensation for the performance of its obligations under the Investment Management Agreement, the Investment Manager is entitled to receive from the Issuer a base management fee (the “Base Management Fee”), a subordinated management fee (the “Subordinated Management Fee”) and an incentive management fee (the “Incentive Management Fee”). The Base Management Fee is payable in arrears quarterly (subject to availability of funds and to the satisfaction of payment obligations on the debt obligations of the Issuer (the “Priority of Payments”)) and prior to the second refinancing and the issuance of the 2013-1 Amended CLO Notes, was payable in an amount equal to 0.25% per annum of the Expenses The Issuer bears its own organizational and offering expenses, all expenses related to its investment program and expenses incurred in connection with its operations including, but not limited to, external legal, administrative, trustee, accounting, tax and audit expenses, costs related to trading, acquiring, monitoring or disposing of investments of the Issuer, and interest and other borrowing expenses, expenses of preparing and distributing reports, financial statements, and litigation or other extraordinary expenses. The Issuer has retained the Trustee to provide trustee services. Additionally, the Trustee performs loan administration, debt covenant compliance calculations, and monitoring and reporting services. For the years ended February 28, operations. Interest Expense The Issuer has issued rated and unrated notes to finance its operations. Interest on debt is calculated by the Trustee for the Issuer. Interest is accrued and generally paid quarterly. For the years ended February 28, Risk Management In the ordinary course of its business, the Issuer manages a variety of risks, including market risk and credit risk. Market risk is the risk of potential adverse changes to the value of investments because of changes in market conditions such as interest rate movements and volatility in investment prices. Credit risk is the risk of default or non-performance by portfolio companies, equivalent to the investment’s carrying amount. The Issuer is also exposed to credit risk related to maintaining all of its cash and cash equivalents, including those in reserve accounts, at a major financial institution. The Issuer has investments in lower rated and comparable quality unrated high yield bonds and bank loans. Investments in high yield investments are accompanied by a greater degree of credit risk. The risk of loss due to default by the issuer is significantly greater for holders of high yield securities, because such investments are generally unsecured and are often subordinated to other creditors of the issuer. New Accounting Pronouncements In August 2016, the FASB issued ASU 2016-15, Statement of Cash Flows (Topic 230),Classification of Certain Cash Receipts and Cash Payments (“ASU 2016-15”), which is intended to reduce the existing diversity in practice in how certain cash receipts and cash payments are presented and classified in the statement of cash flows. The guidance is effective for annual periods beginning after December 15, 2017, and interim periods therein. Early adoption is permitted. Management is currently evaluating the impact the adoption of this standard has on the Issuer’s financial statements and disclosures. In February 2016, the FASB issued ASU 2016-02,Amendments to the Leases (“ASU Topic 842”), which will require for all operating leases the recognition of a right-of-use asset and a lease liability, in the statement of financial position. The lease cost will be allocated over the lease term on a straight-line basis. This guidance is effective for annual and interim periods beginning after December 15, 2018. Management is currently evaluating the impact the adoption of this standard has on the Issuer’s financial statements and disclosures. In January 2016, the FASB issued ASU 2016-01,Financial Instruments — Overall (Subtopic 825-10): Recognition and Measurement of Financial Assets and Financial Liabilities (“ASU 2016-01”). ASU 2016-01 retains many current requirements for the classification and measurement of financial instruments; however, it significantly revises an entity’s accounting related to (1) the classification and measurement of investments in equity securities and (2) the presentation of certain fair value changes for financial liabilities measured at fair value. ASU 2016-01 also amends certain disclosure requirements associated with the fair value of financial instruments. This guidance is effective for annual and interim periods beginning after December 15, 2017, and early adoption is not permitted for public business entities. Management is currently evaluating the impact the adoption of this standard has on the Issuer’s financial statements and disclosures. In May 2014, the FASB issued ASU 2014-09, Revenue from Contracts with Customers (Topic 606), which supersedes the revenue recognition requirements in Revenue Recognition (Topic 605). Under the new guidance, an entity should recognize revenue to depict the transfer of promised goods or services to customers in an amount that reflects the consideration to which the entity expects to be entitled in exchange for those goods or services. In May 2016, ASU 2016-12 amended ASU 2014-09 and deferred the effective period to December 15, 2017. Management is currently evaluating the impact these changes will have on the Issuer’s financial statements and disclosures. 3. Fair Value Measurements As noted above, the Issuer values all investments in accordance with ASC 820. ASC 820 requires enhanced disclosures about assets and liabilities that are measured and reported at fair value. As defined in ASC 820, fair value is the price that would be received to sell an asset or paid to transfer a liability in an orderly transaction between market participants at the measurement date. ASC 820 establishes a hierarchal disclosure framework which prioritizes and ranks the level of market price observability of inputs used in measuring investments at fair value. Market price observability is affected by a number of factors, including the type of investment and the characteristics specific to the investment. Investments with readily available active quoted prices or for which fair value can be measured from actively quoted prices generally will have a higher degree of market price observability and a lesser degree of judgment used in measuring fair value. Based on the observability of the inputs used in the valuation techniques, the Issuer is required to provide disclosures on fair value measurements according to the fair value hierarchy. The fair value hierarchy ranks the observability of the inputs used to determine fair values. Investments carried at fair value are classified and disclosed in one of the following three categories: consensus pricing information or broker quotes which include a disclaimer that the broker would not be held to such a price in an actual transaction. The non-binding nature of consensus pricing and/or quotes accompanied by disclaimer would result in classification as a Level 3 asset, assuming no additional corroborating evidence. In addition to using the above inputs in investment valuations, the Issuer continues to employ the valuation policy that is consistent with ASC 820 and the 1940 Act. The following table presents fair value measurements of investments, by major class, as of February 28, Fair Value Measurements Level 1 Level 2 Level 3 Total Term loans $ — $ 297,872,178 $ 2,618,899 $ 300,491,077 Structured finance securities — — — — Equity interest — — — — Total $ — $ 297,872,178 $ 2,618,899 $ 300,491,077 Term loans Equity interests Total The following table presents fair value measurements of investments, by major class, as of February Fair Value Measurements Level 1 Level 2 Level 3 Total Term loans $ — $ 358,237,074 $ 4,256,932 $ 362,494,006 Structured finance securities — — 10,850,000 10,850,000 Equity interest 5,410 — 1,070,563 1,075,973 Total $ 5,410 $ 358,237,074 $ 16,177,495 $ 374,419,979 Term loans Equity interests Total Transfers into or out of Level 1, 2 or 3 are recognized at the reporting date. The following table provides a reconciliation of the beginning and ending balances for investments that use Level 3 inputs for the year ended February 28, Term Loans Structured Finance Equity Interest Balance as of February 28, 2013 $ 4,256,932 $ 10,850,000 $ 1,070,563 Net unrealized gains (losses) (45,982 ) 2,189,036 (394,438 ) Purchases and other adjustments to cost 34,872 203,167 — Sales and redemptions (408,133 ) (13,846,450 ) (181,476 ) Net realized gain (loss) from investments 102,394 604,247 (494,649 ) Net transfers in and/or out of Level 3(1) (1,321,184 ) — — Balance as of February 28, 2014 $ 2,618,899 $ — $ — Balance as of February 29, 2016 Net unrealized appreciation (depreciation) Purchases and other adjustments to cost Sales and repayments Net realized gain from investments Transfers in (1) Transfers out (2) Balance as of February 28, 2017 The following table provides a reconciliation of the beginning and ending balances for investments that use Level 3 inputs for the year ended February Term Loans Structured Finance Equity Interest Balance as of February 29, 2012 $ — $ 14,507,600 $ 1,070,563 Net unrealized gains (losses) (102,541 ) (126,657 ) — Purchases and other adjustments to cost 4,018,668 219,455 — Sales and redemptions (74,141 ) (4,000,000 ) — Net realized gain (loss) from investments 26,621 249,602 — Net transfers in and/or out of Level 3(2) 388,325 — — Balance as of February 28, 2013 $ 4,256,932 $ 10,850,000 $ 1,070,563 Balance as of February 28, 2015 Net unrealized depreciation Purchases and other adjustments to cost Sales and repayments Net realized gain from investments Transfers in (1) Balance as of February 29, 2016 Transfers into or out of Level 3 are recognized at the reporting date. Purchases and other adjustments to cost include purchases of new investments at cost, effects of refinancing/restructuring, accretion/amortization of income from discount/premium on debt securities, and PIK. Sales and redemptions represent net proceeds received from investments sold, and principal paydowns received, during the period. The net unrealized Significant unobservable inputs used in the fair value measurement of the Level 3 term loans and equity include market quotations available from multiple dealers. A significant increase (decrease) in the market quote, in isolation, would result in a significantly lower (higher) fair value measurement. The valuation techniques and significant unobservable inputs used in recurring Level 3 fair value measurements of assets as of February 28, Fair Value Valuation Technique Unobservable Input Range Term loans $ 4,256,932 Yield Analysis Market Yield 7.7%-17.0% Structured finance securities $ 10,850,000 Yield Analysis Market Yield 8.9%-10.7% Equity interest $ 1,070,563 Market Comparable EBITDA Multiples 5.5x-8.0x Valuation Technique Unobservable Input Term loans Equity interests Valuation Technique Unobservable Input Term loans Equity interests 4. Financing On January 22, 2008, the Issuer issued $400.0 million of notes, consisting of Class A Floating Rate Senior Notes, Class B Floating Rate Senior Notes, Class C Deferrable Floating Rate Notes, Class D Deferrable Floating Rate Notes, Class E Deferrable Floating Rate Notes (collectively the “Secured Notes”), and Subordinated Notes. The notes were issued pursuant to the Indenture. The Secured Notes are limited recourse obligations of the Issuer. The Subordinated Notes are unsecured, limited recourse debt obligations of the Issuer. On October 17, 2013, the Issuer issued $284.9 million of notes (the “2013-1 CLO Notes”), consisting of Class X Floating Rate Senior Notes, Class A-1 Floating Rate Senior Notes, Class A-2 Floating Rate Senior Notes, Class B Floating Rate Senior Notes, Class C Deferrable Floating Rate Notes, Class D Deferrable Floating Rate Notes, Class E Deferrable Floating Rate Notes, and Class F Deferrable Floating Rate Notes. The 2013-1 CLO Notes were issued pursuant to the Indenture with the same Trustee. Proceeds of the issuance of the 2013-1 CLO Notes were used along with existing assets held by the Trustee to redeem all of the Secured Notes issued in 2008. The Subordinated Notes were not included in the refinancing transaction. On November 15, 2016, the Issuer issued $282.4 million of the 2013-1 Amended CLO Notes, consisting of Class A-1 Floating Rate Senior Notes, Class A-2 Floating Rate Senior Notes, Class B Floating Rate Senior Notes, Class C Deferrable Floating Rate Notes, Class D Deferrable Floating Rate Notes, Class E Deferrable Floating Rate Notes, and Class F Deferrable Floating Rate Notes. The 2013-1 CLO Notes were issued pursuant to the Indenture with the same Trustee. Proceeds of the issuance of the 2013-1 Amended CLO Notes were used along with existing assets held by the Trustee to redeem all of the 2013-1 CLO Notes issued in 2013. The Subordinated Notes were not included in the refinancing transaction. The 2013-1 Amended CLO Notes are limited recourse obligations of the Issuer. The Subordinated Notes are unsecured, limited recourse debt obligations of the Issuer. The relative order of seniority of payment of each class of securities is, as follows: first, Class X Notes, second, Class A-1 Notes, third, Class A-2 Notes, fourth, Class B Notes, fifth, Class C Notes, sixth, Class D Notes, seventh, Class E Notes, eighth, Class F Notes, and ninth, the Subordinated Notes, with (a) each class of securities (other than the Subordinated Notes) in such list being senior to each other class of securities that follows such class of securities in such list and (b) each class of securities (other than the Class X Notes) in such list being subordinate to each other class of securities that precedes such class of securities in such list. The Subordinated Notes are subordinated to the 2013-1 Amended CLO Notes and are entitled to periodic payments from interest proceeds available in accordance with the Priority of Payments. Debt Security Class A-1 Floating Rate Senior Notes Class A-2 Floating Rate Senior Notes Class B Floating Rate Senior Notes Class C Deferrable Floating Rate Notes Class D Deferrable Floating Rate Notes Class E Deferrable Floating Rate Notes Class F Deferrable Floating Rate Notes Subordinated Notes The table below sets forth certain information for each outstanding class of notes issued, pursuant to the Indenture on October 17, 2013, at February Debt Security Interest Rate Maturity Principal Amount Class X Floating Rate Senior Notes LIBOR + 1.05% October 20, 2023 $ 2,500,000 $ 1,666,666 Class A-1 Floating Rate Senior Notes LIBOR + 1.30% October 20, 2023 170,000,000 170,000,000 Class A-2 Floating Rate Senior Notes LIBOR + 1.50% October 20, 2023 20,000,000 20,000,000 Class B Floating Rate Senior Notes LIBOR + 2.00% October 20, 2023 44,800,000 44,800,000 Class C Deferrable Floating Rate Notes LIBOR + 2.90% October 20, 2023 16,000,000 16,000,000 Class D Deferrable Floating Rate Notes LIBOR + 3.50% October 20, 2023 14,000,000 14,000,000 Class E Deferrable Floating Rate Notes LIBOR + 4.50% October 20, 2023 13,100,000 13,100,000 Class F Deferrable Floating Rate Notes LIBOR + 5.75% October 20, 2023 4,500,000 4,500,000 Subordinated Notes N/A October 20, 2023 30,000,000 30,000,000 $ 314,900,000 $ 314,066,666 Debt Security Interest Rate Maturity Principal Amount Class A Floating Rate Senior Notes LIBOR + 0.75% January 21, 2020 $ 296,000,000 $ 296,000,000 Class B Floating Rate Senior Notes LIBOR + 2.50% January 21, 2020 22,000,000 22,000,000 Class C Deferrable Floating Rate Notes LIBOR + 3.75% January 21, 2020 14,000,000 14,000,000 Class D Deferrable Floating Rate Notes LIBOR + 4.70% January 21, 2020 16,000,000 16,000,000 Class E Deferrable Floating Rate Notes LIBOR + 6.45% January 21, 2020 22,000,000 17,960,044 Subordinated Notes N/A January 21, 2020 30,000,000 30,000,000 $ 400,000,000 $ 395,960,044 Debt Security Class A-1 Floating Rate Senior Notes Class A-2 Floating Rate Senior Notes Class B Floating Rate Senior Notes Class C Deferrable Floating Rate Notes Class D Deferrable Floating Rate Notes Class E Deferrable Floating Rate Notes Class F Deferrable Floating Rate Notes Subordinated Notes The following table shows each outstanding class of notes issued, pursuant to the Indenture, at fair value at February 28, Debt Security February 28, 2014 Class X Floating Rate Senior Notes $ 1,664,666 Class A-1 Floating Rate Senior Notes 168,878,000 Class A-2 Floating Rate Senior Notes 20,000,000 Class B Floating Rate Senior Notes 44,679,040 Class C Deferrable Floating Rate Notes 15,944,000 Class D Deferrable Floating Rate Notes 13,766,200 Class E Deferrable Floating Rate Notes 12,481,680 Class F Deferrable Floating Rate Notes 4,398,300 Subordinated Notes 19,569,596 $ 301,381,482 The following table shows each outstanding class of notes issued, pursuant to the Indenture, at fair value at February 29, 2016: Debt Security Class A-1 Floating Rate Senior Notes Class A-2 Floating Rate Senior Notes Class B Floating Rate Senior Notes Class C Deferrable Floating Rate Notes Class D Deferrable Floating Rate Notes Class E Deferrable Floating Rate Notes Class F Deferrable Floating Rate Notes Subordinated Notes These notes are fair valued based on a discounted cash flow model, specifically using Intex cash flow models, to form the basis for the valuation and would be classified as level 3 liabilities within the fair value hierarchy. Debt Security February 28, 2013 Class A Floating Rate Senior Notes $ 292,879,007 Class B Floating Rate Senior Notes 22,900,917 Class C Deferrable Floating Rate Notes 14,592,983 Class D Deferrable Floating Rate Notes 16,414,949 Class E Deferrable Floating Rate Notes 17,999,348 Subordinated Notes 25,516,959 $ 390,304,163 The following table provides the weighted average interest rate for the years ended February 28, Weighted Average Interest Rate Debt Security Interest Rate February 28, 2014 February 28, 2013 February 29, 2012 2013-1 CLO Notes Class X Floating Rate Senior Notes LIBOR + 1.05% 1.29 % N/A N/A Class A-1 Floating Rate Senior Notes LIBOR + 1.30% 1.54 % N/A N/A Class A-2 Floating Rate Senior Notes LIBOR + 1.50% 1.74 % N/A N/A Class B Floating Rate Senior Notes LIBOR + 2.00% 2.24 % N/A N/A Class C Deferrable Floating Rate Notes LIBOR + 2.90% 3.14 % N/A N/A Class D Deferrable Floating Rate Notes LIBOR + 3.50% 3.74 % N/A N/A Class E Deferrable Floating Rate Notes LIBOR + 4.50% 4.74 % N/A N/A Class F Deferrable Floating Rate Notes LIBOR + 5.75% 5.99 % N/A N/A Subordinated Notes N/A N/A N/A N/A Secured Notes Class A Floating Rate Senior Notes LIBOR + 0.75% 1.03 % 1.15 % 1.12 % Class B Floating Rate Senior Notes LIBOR + 2.50% 2.78 % 2.90 % 2.87 % Class C Deferrable Floating Rate Notes LIBOR + 3.75% 4.03 % 4.15 % 4.12 % Class��D Deferrable Floating Rate Notes LIBOR + 4.70% 4.98 % 5.10 % 5.07 % Class E Deferrable Floating Rate Notes LIBOR + 6.45% 6.73 % 6.85 % 6.82 % Debt Security 2013-1 CLO Notes Class X Floating Rate Senior Notes Class A-1 Floating Rate Senior Notes Class A-2 Floating Rate Senior Notes Class B Floating Rate Senior Notes Class C Deferrable Floating Rate Notes Class D Deferrable Floating Rate Notes Class E Deferrable Floating Rate Notes Class F Deferrable Floating Rate Notes Subordinated Notes The Indenture provides that payments on the Subordinated Notes shall rank subordinate in priority of payment to payments due on all classes of 2013-1 CLO Notes and subordinate in priority of payment to the payment of fees and expenses. Distributions on the Subordinated Notes are limited to the assets of the Issuer remaining after payment of all of the liabilities of the Issuer that rank senior in priority of payment to the Subordinated Notes. To the extent that the proceeds from the collateral are not sufficient to make distributions on the Subordinated Notes the Issuer will have no further obligation in respect of the Subordinated Notes. Interest proceeds and, after the 2013-1 CLO Notes have been paid in full, principal proceeds, in each case will be distributed to the holders of the Subordinated Notes in accordance with the Indenture. Distributions, if any, on the Subordinated Notes will be payable quarterly on the 20th day of each January, April, July and October of each calendar year or, if any such day is not a business day, on the next succeeding business day (each, a “Payment Date”), commencing on the first Payment Date, and on January 21, 2020 (or if any such day is not a business day, the next succeeding business day) (the “Stated Redemption Date”) (if not redeemed prior to such date) sequentially in order of seniority. At the Stated Redemption Date, the Subordinated Notes will be redeemed after payment in full of all of the 2013-1 CLO Notes and the payment of all administrative and other fees and expenses. The failure to pay interest proceeds or principal proceeds to the holders of the Subordinated Notes will not be an event of default under the Indenture. In May of 2009, the Issuer defaulted on its Class E overcollateralization ratio of 105.10%, at which point, $4.0 million of interest proceeds were used to repay the Class E Notes through November 2009. Interest on the Class C, Class D, and Class E Notes was deferred and repaid in January of 2010 upon the Issuer’s return to compliance. Distributions to the Subordinated Notes resumed in April of 2010. As of February 28, As of February 29, 2016, the remaining unamortized discount on the Class A-1 Notes, Class A-2 Notes, Class B Notes, Class C Notes, Class D Notes, Class E Notes, and Class F Notes were $1.3 million, $0.1 million, $0.9 million, $0.6 million, $0.7 million, The remaining unamortized deferred debt financing costs, on the 5. Income Tax Under the current laws, the Issuer is not subject to net income taxation in the United States or the Cayman Islands. Accordingly, no provision for income taxes has been made in the accompanying financial statements. Pursuant to ASC Topic 740,Accounting for Uncertainty in Income Taxes, the Issuer adopted the provisions of the FASB relating to accounting for uncertainty in income taxes which clarifies the accounting for income taxes by prescribing the minimum recognition threshold a tax position must meet before being recognized in the financial statements and applies to all open tax years as of the effective date. The Investment Manager has analyzed such tax positions for uncertain tax positions for tax years that may be open as a result of the Issuer’s accounting for uncertainty in income taxes. The Issuer does not have any unrecognized tax benefits or liabilities for the years ended February 28, 6. Commitments and Contingencies In the ordinary course of its business, the Issuer may enter into contracts or agreements that contain indemnifications or warranties. Future events could occur that lead to the execution of these provisions against the Issuer. Based on its history and experience, the Investment Manager feels that the likelihood of such an event is remote. In the ordinary course of business, the Issuer may directly or indirectly be a defendant or plaintiff in legal actions with respect to bankruptcy, insolvency or other types of proceedings. Such lawsuits may involve claims that could adversely affect the value of certain financial instruments owned by the Issuer. As of February 28, The terms of Collateralized Debt Investments may require the Issuer to provide funding for any unfunded portion of a Collateralized Debt Investment at the request of the borrower. At February 28, 7. Related-Party Transactions In the ordinary course of business and as permitted per the terms of the Indenture, the Issuer may acquire or sell investments to or from related parties at the fair value at such time. For the years ended February 28, The Subordinated Notes are wholly owned by the Investment Manager. The Subordinated Notes do not have a stated coupon 8. Shareholders’ Capital Capital contributions and distributions shall be made at such time and in such amounts as determined by the Investment Manager and the Indenture. The majority holder of the Subordinated Notes has various control rights over the CLO, including the ability to call the CLO prior to its legal maturity, replace the Investment Manager under certain circumstances, and refinance any of the outstanding debt tranches. The voting structure of the Subordinated Notes may require either majority or unanimous approval depending upon the issue. The authorized share capital of the Issuer consists of 50,000 ordinary shares, 250 of which are owned by Maples Finance Limited and are held under the terms of a declaration of trust. As of February 28, 9. Financial Highlights The following is a schedule of financial highlights for the years ended February 28, 2017, February 29, 2016, February 28, 2015, February 28, 2014 and February 28, February 28, February 29, Average subordinated notes’ capital balance (1) $ 28,471,910 $ 27,165,497 $ 20,808,673 Ratio and supplemental data: Total Return (2) 4.65 % 73.51 % 41.28 % Net investment income (3) (7.53 )% 3.80 % 11.38 % Total expenses (3) 65.27 % 70.97 % 87.40 % Base management fee (3) 1.82 % 1.47 % 1.93 % Subordinated management fee (3) 4.42 % 5.89 % 7.73 % Average subordinated notes’ capital Ratio and supplemental data: Total Return(2) Net investment income(3) Total expenses(3) Base management fee(3) Subordinated management fee(3) 10. Subsequent Events The Investment Manager has evaluated events or transactions that have occurred since February 28, ·········carryaccount for our investments at fair value in accordance with the Financial Accounting Standards Board (“FASB”) Accounting Standards Codification (“ASC”) Topic 820,Fair Value Measurements and Disclosures (“ASC 820”), as approved in good faith using written policies and procedures adopted by our board of directors. Investments for which market quotations are readily available are recorded in our consolidated financial statements at such market quotations subject to any decision by our board of directors to approve a fair value determination to reflect significant events affecting the value of these investments. We value investments for which market quotations are not readily available at fair value as approved in good faith by our board of directors based on input from Saratoga Investment Advisors, our audit committee and an independent valuation firm engaged by our board of directors that independently values approximately one quarter of these valuations each quarter.directors. Determinations of fair value may involve subjective judgments and estimates. The types of factors that may be considered in determining the fair value of our investments include the nature andflowsflow analysis on expected future cash flows from our investment in Saratoga CLO to determine a valuation for the subordinated notes of Saratoga CLO held by us.·each·anvalues at least one quarterreviews a selection of our investmentsthese preliminary valuations each quarter so that the valuation of each investment for which market quotes are not readily available is independently valuedreviewed by anthe independent valuation firm at least annually.once each fiscal year.·the·our(if(to the extent applicable) and the audit committee.committee of our board of directors.have onlythereafter paid five annual dividend distributions (December 2013, 2012, 2011, 2010 and 2009) to our stockholders since such time, which distributions were made with a combination of cash and the issuance of shares of our common stock as discussed more fully below.20132016 calendar year, we madeour distributions sufficientwere insufficient such that we did not incur anyincurred federal excise taxes.taxes of $44,770. We may elect to withhold from distribution a portion of our ordinary income for the 20142017 calendar year and/or portion of the capital gains in excess of capital losses realized during the one year period ending October 31, 2014,2017, if any, and, if we do so, we would expect to incur federal excise taxes as a result.We maintain an “opt out” dividend reinvestment plan for our common stockholders. As a result, if we declare a dividend, then stockholders’ cash dividends will be automatically reinvested in additional shares of our common stock, unless they specifically “opt out” of the dividend reinvestment plan so as to receive cash dividends.ithe or she receives as a dividend in order to pay this tax, the sales proceeds may be less than the amount included in income with respect to the dividend, depending on the market price of our stock at the time of the sale. Furthermore, with respect tonon-U.S. stockholders, we may be required to withhold U.S. tax with respect to such dividends, including in respect of all or a portion of such dividend that is payable in stock. In addition, if a significant number of our stockholders determine to sell shares of our stock in order to pay taxes owed on dividends, it may put downward pressure on the trading price of our stock.investments.investments and establish more relationships than us. Furthermore, many of our competitors are not subject to the regulatory restrictions that the 1940 Act imposes on us as a BDC. We use the industry information available to the investment professionals of Saratoga Investment Advisors to assess investment risks and determine appropriate pricing for our investments in portfolio companies. In addition, we believe that the investment professionals of our investment adviser enable us to learn about, and compete effectively for, financing opportunities with attractive leveraged companies in the industries in which we seek to invest.I,I. Item 1A,1A. “Risk Factors—We operate in a highly competitive market for investment opportunities.”····payment-in-kindPIK interest, preferred stock with payment-in-kindPIK dividends and zero coupon securities), accrued income that we have not yet received in cash.Pre-incentive fee net investment income does not include any realized capital gains, realized capital losses, or unrealized capital appreciation or depreciation. depreciation or realized gains or losses resulting from the extinguishment of our own debt.Pre-incentive fee net investment income, expressed as a rate of return on the value of our net assets (defined as total assets less liabilities) at the end of the immediately preceding fiscal quarter, is compared to a “hurdle rate” of 1.875% per quarter, (7.5% annualized), subject to a “catch up” provision. The base management fee is calculated prior to giving effect to the payment of any incentive fees.(9.376% annualized) is payable to Saratoga Investment Advisors; and (C) 20.0% of the amount of ourpre-incentive fee net investment income, if any, that exceeds 2.344% in any fiscal quarter (9.376% annualized).quarter. We refer to the amount specified in clause (B) as the “catch-up.“catch-up.” The “catch-up”“catch-up” provision is intended to provide Saratoga Investment Advisors with an incentive fee of 20.0% on all of ourpre-incentive fee net investment income as if a hurdle rate did not apply when ourpre-incentive fee net investment income exceeds 2.344% in any fiscal quarter. Notwithstanding the foregoing, with respect to any period ending on or prior to December 31, 2010, Saratoga Investment Advisors was only entitled to 20.0% of the amount of ourpre-incentive fee net investment income, if any, that exceeded 1.875% in any fiscal quarter (7.5% annualized) without anycatch-up provision. These calculations are appropriatelypro-rated when such calculations are applicable for any period of less than three months.income- relatedincome-related portion of the incentive fee subsequent to any period ending after December 31, 2010: “Pre-Incentive“Pre-Incentive Fee Net Investment Income”

·····Pre-incentive fee net investment income does not exceed hurdle rate, therefore there is no incentive fee.·· “catch-up”“catch-up” provision, therefore the income related portion of the incentive fee is 0.3575%.=(100.0% × (pre-incentive(pre-incentive fee net investment income–1.875%)=100.0%(2.2325%–1.875%) =100.0%(0.3575%) =0.3575% (1) The hypothetical amount ofpre-incentive fee net investment income shown is based on a percentage of total net assets. (2) Represents 7.5% hurdle rate. (3) Represents 1.75% annualized management fee. For the purposes of this example, we have assumed that we have not incurred any indebtedness and that we maintain no cash or cash equivalents. (4) The“catch-up” provision is intended to provide our investment adviser with an incentive fee of 20.0% on allpre-incentive fee net investment income as if a hurdle rate did not apply when our net investment income exceeds 2.344% in any fiscal quarter. Table of ContentsAdditional Assumptions(1)The hypothetical amount of pre-incentive fee net investment income shown is based on a percentage of total net assets.(2)Represents 7.5% annualized hurdle rate.(3)Represents 1.75% annualized management fee. For the purposes of this example, we have assumed that we have not incurred any indebtedness and that we maintain no cash or cash equivalents.(4)The “catch-up” provision is intended to provide our investment adviser with an incentive fee of 20.0% on all pre-incentive fee net investment income as if a hurdle rate did not apply when our net investment income exceeds 2.344% in any fiscal quarter.Alternative 3Additional Assumptions·Investment income (including interest, dividends, fees, etc.) = 3.5%·Pre-incentive fee net investment income exceeds the hurdle rate, and fully satisfies the “catch-up”“catch-up” provision, therefore the income related portion of the incentive fee is 0.5467%.100.0% ×pre-incentive fee net investment income (subject to “catch-up”“catch-up”)(4)100.0% × “catch-up”“catch-up” + (20.0% × (Pre-incentive(Pre-incentive fee net investment income–2.344%))=2.344%–1.875%2.344%–1.875% 0.469% (100.0% × 0.469%) + (20.0% × (2.7325%+(20.0% ×(2.7325%–2.344%))0.469% + (20.0%+(20.0% × 0.3885%)0.469% + 0.0777% 0.5467% 1:1········(1)The examples assume that Investment A and Investment B were acquired by us subsequent to May 31, 2010. If Investment A and B were acquired by us prior to May 31, 2010, then the cost basis for computing our realized gains and losses on such investments would equal the fair value of such investments as of May 31, 2010.(1) The examples assume that Investment A and Investment B were acquired by us subsequent to May 31, 2010. If Investment A and B were acquired by us prior to May 31, 2010, then the cost basis for computing our realized gains and losses on such investments would equal the fair value of such investments as of May 31, 2010. ··········15, 2013,7, 2016, our board of directors approved the renewal of the Management Agreement for an additionalone-year term at anin-person meeting.···Saratoga Investment Advisorsour investment adviser payable to third parties, including agents, consultants or other advisors, in monitoring financial and legal affairs for us and in monitoring our investments and performing due diligence on our prospective portfolio companies;··············until July 30, 2014 and will continue in effect from year to year thereafter so long as it is approved at least annually by (i) the vote of the board of directors, or by the vote of stockholders holding a majority of our outstanding voting securities, and (ii) the vote of a majority of our directors who are not parties to the Management Agreement or “interested persons” (as such term is defined in Section 2(a)(19) of the 1940 Act) of any party to such agreement, in accordance with the requirements of the 1940 Act.15, 2013,8, 2015, our board of directors approved the renewal of the administration agreementAdministration Agreement for an additionalone-year term and determined to maintainincrease the cap on the payment or reimbursement of expenses by usthe Company thereunder, which had not been increased since the inception of the agreement, to $1.0$1.3 million. On July 7, 2016, our board of directors approved the renewal of the Administration Agreement for an additionalone-year term. On October 5, 2016, our board of directors determined to increase the cap on the payment or reimbursement of expenses by the Company under the Administration Agreement, from $1.3 million for the additional one-year term.(1)(1) Securities purchased in transactions not involving any public offering from the issuer of such securities, which issuer (subject to certain limited exceptions) is an eligible portfolio company, or from any person who is, or has been during the preceding 13 months, an affiliated person of an eligible portfolio company, or from any other person, subject to such rules as may be prescribed by the SEC. An eligible portfolio company is defined in the 1940 Act as any issuer which: (a) is organized under the laws of, and has its principal place of business in, the United States; (b) is not an investment company (other than a small business investment company wholly owned by the BDC) or a company that would be an investment company but for certain exclusions under the 1940 Act; and (c) satisfies either of the following: (i) does not have any class of securities listed on a national securities exchange; (ii) has a class of securities listed on a national securities exchange but has an aggregate market value of outstanding voting andnon-voting common equity of less than $250.0 million; (iii) is controlled by a BDC or a group of companies including a BDC and the BDC has an affiliated person who is a director of the eligible portfolio company; (iv) is a small and solvent company having total assets of not more than $4.0 million and capital and surplus of not less than $2.0 million; or (v) meets such other criteria as may established by the SEC. (2) Securities of any eligible portfolio company which we control. (3) Securities purchased in a private transaction from a U.S. issuer that is not an investment company or from an affiliated person of the issuer, or in transactions incident thereto, if the issuer is in bankruptcy and subject to reorganization or if the issuer, immediately prior to the purchase of its securities was unable to meet its obligations as they came due without material assistance other than conventional lending or financing arrangements. (4) Securities of an eligible portfolio company purchased from any person in a private transaction if there is no ready market for such securities and we already own at least 60.0% of the outstanding equity of the eligible portfolio company. (5) Securities received in exchange for or distributed on or with respect to securities described in (1) through (4) above, or pursuant to the exercise of options, warrants or rights relating to such securities. (6) Cash, cash equivalents, U.S. Government securities or high-quality debt securities maturing in one year or less from the time of investment. which issuer (subject to certain limited exceptions) is an eligible portfolio company,in conjunction with one or from any person who is, or has been duringmore other persons acting together and one of the preceding 13 months, an affiliated person of an eligible portfolio company, or from any other person, subject to such rules as may be prescribed by the SEC. An eligible portfolio company is definedpersons in the 1940 Act as any issuer which:(a)is organized under the laws of, and has its principal place of business in, the United States;(b)is not an investment company (other than a small business investment company wholly owned by the BDC) or a company that would be an investment company but for certain exclusions under the 1940 Act; and(c)satisfies either of the following:(i)does not have any class of securities listed on a national securities exchange;(ii)has a class of securities listed on a national securities exchange but has an aggregate market value of outstanding voting and non-voting common equity of less than $250.0 million;(iii)is controlled by a BDC or a group of companies including a BDC and the BDC has an affiliated person who is a director of the eligible portfolio company;(iv)is a small and solvent company having total assets of not more than $4.0 million and capital and surplus of not less than $2.0 million; or(v)meetsmakes available such other criteria as may established by the SEC.(2)Securities of any eligible portfolio company which we control.(3)Securities purchased in a private transaction from a U.S. issuer that is not an investment company or from an affiliated person of the issuer, or in transactions incident thereto, if the issuer is in bankruptcy and subject to reorganization or if the issuer, immediately prior to the purchase of its securities was unable to meet its obligations as they came due without material assistance other than conventional lending or financing arrangements.(4)Securities of an eligible portfolio company purchased from any person in a private transaction if there is no ready market for such securities and we already own at least 60.0% of the outstanding equity of the eligible portfolio company.(5)Securities received in exchange for or distributed on or with respect to securities described in (1) through (4) above, or pursuant to the exercise of options, warrants or rights relating to such securities.(6)Cash, cash equivalents, U.S. Government securities or high-quality debt securities maturing in one year or less from the time of investment.Managerial assistance to portfolio companiesIn addition, a BDC must have been organized and have its principal place of business in the United States and must be operated for the purpose of making investments in the types of securities described in (1), (2) or (3) above under “—Qualifying assets.” However, in order to count portfolio securities as qualifying assets for the purpose of the 70.0% test, the BDC must either control the issuer of the securities or must offer to make available to the issuer of the securities (other than small and solvent companies described above) significant managerial assistance; except that, where the BDC purchases such securities in conjunction with one or more other persons acting together, one of the other persons in the group may make available such managerial assistance. Making available significant managerial assistance means, among other things, any arrangement whereby the BDC, through its directors, officers or employees or those of its investment adviser, offers to provide, and, if accepted, does so provide, significant guidance and counsel concerning the management, operations or business objectives and policies of a portfolio company.below.below:·Authorized Employees of Saratoga Investment Advisors. It is our policy that only authorized employees of Saratoga Investment Advisors who need to know a stockholder’s personal information will have access to it.• Authorized Employees of Saratoga Investment Advisors.It is our policy that only authorized employees of Saratoga Investment Advisors who need to know a stockholder’s personal information will have access to it. ·Service Providers. We may disclose your personal information to companies that provide services on our behalf, such as recordkeeping, processing a stockholder’s trades, and mailing stockholder information. These companies are required to protect our stockholders’ information and use it solely for the purpose for which they received it.• Service Providers.We may disclose your personal information to companies that provide services on our behalf, such as recordkeeping, processing a stockholder’s trades, and mailing stockholder information. These companies are required to protect our stockholders’ information and use it solely for the purpose for which they received it. ·Courts and Government Officials. If required by law, we may disclose a stockholder’s personal information in accordance with a court order or at the request of government regulators. Only that information required by law, subpoena, or court order will be disclosed.• Courts and Government Officials.If required by law, we may disclose a stockholder’s personal information in accordance with a court order or at the request of government regulators. Only that information required by law, subpoena, or court order will be disclosed. applicationrelief to the SEC to permit greater flexibility to negotiate the terms ofco-investments because we believe that it will be advantageous for us toco-invest with affiliates of Saratoga Investment Advisors where such investment is consistent with the investment objective, investment positions, investment policies, investment strategies, investment restrictions, regulatory requirements and other pertinent factors applicable to us. However, there is no assurance that any application for exemptive relief, if made, would be granted by the SEC. Saratoga Investment Corp. SBIC LP, received an SBIC license from the SBA.$18.0$19.5 million and have average annual fully taxed net income not exceeding $6.0$6.5 million for the two most recent fiscal years. In addition, an SBIC must devote 25.0% of its investment activity to “smaller” concerns as defined by the SBA. A smaller concern is one that has a tangible net worth not exceeding $6.0 million and has average annual fully taxed net income not exceeding $2.0 million for the two most recent fiscal years. SBA regulations also provide alternative size standard criteria to determine eligibility, which depend on the industry in which the business is engaged and are based on such factors as the number of employees and gross sales. According to SBA regulations, SBICs may make long-term loans to small businesses, invest in the equity securities of such businesses and provide them with consulting and advisory services.$225.0$350.0 million inSBA-guaranteed debentures when they have at least $112.5$175.0 million in combined regulatory capital.2014,2017, our SBIC LP subsidiary had $32.0$75.0 million in regulatory capital and $50.0$112.7 million ofSBA-guaranteed debentures outstanding. The SBA restricts the ability of SBICs to repurchase their capital stock. SBA regulations also include restrictions on a “change of control” or transfer of an SBIC and require that SBICs invest idle funds in accordance with SBA regulations. In addition, our SBIC LP subsidiary may also be limited in its ability to make distributions to us if it does not have sufficient capital, in accordance with SBA regulations.relief.relief.annual reportAnnual Report onForm 10-K, quarterly reports onForm 10-Q, current reports onForm 8-K, and amendments to those reports as soon as reasonably practicable after we electronically file such material with, or furnish it to, the SEC. Information contained on our website is not incorporated by reference into this Annual Report, and you should not consider that information to be part of this Annual Report.ItemITEM 1A. Risk FactorsRISK FACTORShigh degreenumber of risk.significant risks. In addition to other information contained in this Annual Report on Form10-K, you should consider carefully the following information before making an investment in our securities. The risks set forth below are the principal risks with respect to the Company generally and with respect to business development companies, they may not be the only risks we face. If any ofThis section nonetheless describes the following risks occur, our business and financial condition could be materially and adversely affected.principal risk factors associated with investment in the Company specifically, as well as those factors generally associated with investment in a company with investment objectives, investment policies, capital structure or trading markets similar to the Company’s. If any of the risks occur, our business, financial condition and results of operations could be materially adversely affected. In such case, our net asset value and the trading price of our securities could decline.decline and you may lose all or part of your investment.The current stateMarket volatility and the condition of the economydebt and equity capital markets could negatively impact our financial condition and stock price.effectseffect on our business, financial positioncondition and results of operations.The broader economic fundamentals of the United States economy remain uncertain. Unemployment levels remain elevated and other economic fundamentals remain depressed. In the event that the United States economic performance contracts, it is likely that the financial results of middle market companies, like those in which we invest, could experience deterioration or limited growth, which could ultimately lead to difficulty in meeting their debt service requirements and an increase in defaults. Consequently, we can provide no assurance that the performance of certain of our portfolio companies will not be negatively impacted by economic or other conditions, which could also have a negative impact on our future results.The current worldwide financial market situation, as well as various social and political tensions in the United States and around the world, may continue to contribute to increased market volatility, may have long-term effects on the United States and worldwide financial markets, and may cause further economic uncertainties or deterioration in the United States and worldwide. Since 2010, several European Union (“EU”) countries, including Greece, Ireland, Italy, Spain, and Portugal, have faced budget issues, some of which may have negative long-term effects for the economies of those countries and other EU countries. There is continued concern about national-level support for the Euro and the accompanying coordination of fiscal and wage policy among European Economic and Monetary Union member countries. In addition, the fiscal policy of foreign nations, such as China, may have a severe impact on the worldwide and United States financial markets. Moreover, there are concerns that the recent economic slowdown in China could have a negative impact on markets throughout the world. We do not know how long the financial markets will continue to be affected by these events and cannot predict the effects of these or similar events in the future on the United StatesU.S. economy and securities markets or on our investments. We monitor developments and seek to manage our investments in a manner consistent with achieving our investment objective, but there can be no assurance that we will be successful in doing so.Although we have been able to secure access to additional liquidity, the potential for volatility in the debt and in the equity capital markets provides no assurance that debt or equity capital will be available to us in the future on favorable terms, or at all.statementconsolidated statements of operations for that quarter. Thus, we may be required to pay Saratoga Investment Advisors incentive fees for a fiscal quarter even if there is a decline in the value of our portfolio or we incur a net loss for that quarter.In addition,However, if we repurchase our outstanding debt securities, including our 7.50%6.75% Notes due 20202023 (the “Notes”“2023 Notes”) and such repurchase results in our recording a net gain or loss on thecauseinduce it to increaseinfluence our leverage, which may be contrary to our interest. the holders of our securities, including the holders of our securities. Leverage is generally considered a speculative investment technique. Any increase in our income in excess of interest payable on our outstanding indebtedness would cause our net income to increase more than it would have had we not incurred leverage, while any decrease in our income would cause net income to decline more sharply than it would have had we not incurred leverage. Such a decline could negatively affect our ability to make common stock distributions or scheduled debt payments, including with respect to the 2023 Notes. There can be no assurance that our leveraging strategy will be successful.As of February 28, 2014, there was no balance outstanding under the Credit Facility. As of February 28, 2014, we had issued $50.0 million SBA-guaranteed debentures and $48.3 million of the Notes. We may incur additional indebtedness in the future, including up to an additional $45.0 million under the Credit Facility, although there can be no assurance that we will be successful in doing so. Our ability to service our debt depends largely on our financial performance and is subject to prevailing economic conditions and competitive pressures. The amount of leverage that we employ at any particular time will depend on our management’s and our Board of Directors’ assessment of market and other factors at the time of any proposed borrowing.At our 2013 annual meetingWe do not currently have stockholder approval of stockholders, our stockholders approved a proposal that authorizes us to sell shares of our common stockissuances below the then current net asset value per share of our common stock at an offering price per share that is not less than 85% of the then current net asset value per share in one or more offerings for a period of one year ending on the earlier of September 26, 2014 or the date of our 2014 annual meeting of stockholders. Continued access to this exception will require approval of similar proposals at future stockholder meetings. If our common stock trades at a discount to net asset value, this restriction could adversely affect our ability to raise capital.business development company,BDC, we are generally not permitted to incur indebtedness unless immediately after such borrowing we have an asset coverage for total borrowings of at least 200% (i.e., the amount of debt may not exceed 50% of the value of our assets). We have agreed in the covenant in the indenture governing the 2023 Notes not to violate this section of the 1940 Act, whether or not we continue to be subject to such provision, but giving effect, in either case, to any exemptive relief granted to us by the SEC. Recent legislation, introduced in the U.S. House of Representatives, if passed, would modify this section of the 1940 Act and increase the amount of debt that business development companies may incur by modifying the percentage from 200% to 150%.incur. As a result, we may be able to incur additional indebtedness in the future and therefore your risk of an investment in our securities may increase.seekintend to maintain our qualification as a RIC under the Code, which requires usCode. As a RIC, we do not pay federal income taxes on our income (including realized gains) that is distributed to qualify continuously as a BDC and meetour stockholders, provided that we satisfy certain source of income, distribution and asset diversification requirements.usour results of operations and the holders of our securities.WeBecause we have elected to be treated as a BDC, we are prohibited under the 1940 Act from participating in certain transactions with certain of our affiliates without the prior approval of the members of our independent directors and, in some cases, the SEC. Any person that owns, directly or indirectly, 5.0% or more of our outstanding voting securities is our affiliate for purposes of the 1940 Act and we are generally prohibited from buying or selling any securities (other than our securities) from or to such affiliate, absent the prior approval of our independent directors. The 1940 Act also prohibits certain “joint” transactions with certain of our affiliates, which could include investments in the same portfolio company, without prior approval of our independent directors and, in some cases, the SEC. If a person acquires more than 25.0% of our voting securities, we are prohibited from buying or selling any security (other than any security of which we are the issuer) from or to such person or certain of that person’s affiliates, or entering into prohibited joint transactions with such person, absent the prior approval of the SEC. Similar restrictions limit our ability to transact business with our officers, directors or investment adviser or their affiliates. As a result of these restrictions, we may be prohibited from buying or selling any security (other than any security of which we are the issuer) from or to any portfolio company of a private equity fund managed by our investment adviser without the prior approval of the SEC, which may limit the scope of investment opportunities that would otherwise be available to us.increasing investmentsadding to our investment portfolio, cause us to receive a reduced level of interest income from our portfolio companies and/or reduce the fair market value of our investments. Any of the foregoing events could adversely affect our distributable income and harmhave a material adverse effect on our operating results.operationoperations depend on our ability to manage future investments effectively.AdvisersAdvisors may utilize the services of an independent valuation firm to aid it in determining fair value. The types of factors that may be considered in valuing our investments include the nature and realizable value of any collateral, the portfolio company’s ability to make payments and its earnings, the markets in which the portfolio company does business, market yield trend analysis, comparison to publicly traded companies, discounted cash flow and other relevant factors. Because such valuations, and particularly valuations of private investments and private companies, are inherently uncertain, may fluctuate over short periods of time and may be based on estimates, our determinations of fair value may differ materially from the values that would have been used if a ready market for these investments existed. Our net asset value could be materially affected if the determinations regarding the fair value of our investments were materially higher or lower than the values that we ultimately realize upon the disposal of such investments.defaultsdefault on their indebtedness.Uncertainty relating to the LIBOR calculation process may adversely affect the value of our portfolio of the LIBOR-indexed, floating-rate debt securities.Concerns have been publicized that some of the member banks surveyed by the British Bankers’ Association (“BBA”) in connection with the calculation of LIBOR across a range of maturities and currencies may have been under-reporting or otherwise manipulating the inter-bank lending rate applicable to them in order to profit on their derivatives positions or to avoid an appearance of capital insufficiency or adverse reputational or other consequences that may have resulted from reporting inter-bank lending rates higher than those they actually submitted. A number of BBA member banks have entered into settlements with their regulators and law enforcement agencies with respect to alleged manipulation of LIBOR, and investigations by regulators and governmental authorities in various jurisdictions are ongoing.Actions by the BBA, regulators or law enforcement agencies may result in changes to the manner in which LIBOR is determined. Uncertainty as to the nature of such potential changes may adversely affect the market for LIBOR-based securities, including our portfolio of LIBOR-indexed, floating-rate debt securities. In addition, any further changes or reforms to the determination or supervision of LIBOR may result in a sudden or prolonged increase or decrease in reported LIBOR, which could have an adverse impact on the market for LIBOR-based securities or the value of our portfolio of LIBOR-indexed, floating-rate debt securities.2014,2017, our investment in the subordinated notes of Saratoga CLO, a collateralized loan obligation fund, had a fair value of $19.6$11.0 million and constituted 9.5%3.7% of our portfolio. This investment constitutes a first loss position in a portfolio that, as of February 28, 2014,2017, was composed of $301.3$297.1 million in aggregate principal amount of primarily senior secured first lien term loans and $8.0$13.0 million in uninvested cash. A first loss position means that we will suffer the first economic losses if the value of Saratoga CLO decreases. First loss positions typically carry a higher risk and earn a higher yield. Interest payments generated from this portfolio will be used to pay the administrative expenses of Saratoga CLO and interest on the debt issued by Saratoga CLO before paying a return on the subordinated notes. Principal payments will be similarly applied to pay administrative expenses of Saratoga CLO and for reinvestment or repayment of Saratoga CLO debt before paying a return on, or repayment of, the subordinated notes. In addition, 80.0% of our fixed management fee and 100.0% our incentive management fee for acting as the collateral manager of Saratoga CLO is subordinated to the payment of interest and principal on Saratoga CLO debt. Any losses on the portfolio will accordingly reduce the cash flow available to pay these management fees and provide a return on, or repayment of, our investment. Depending on the amount and timing of such losses, we may experience smaller than expected returns and, potentially, the loss of our entire investment.Sarbanes- OxleySarbanes-Oxley Act of 2002 and other rules that govern public companies. If we are unable to uncover all material information about these companies, we may not make a fully informed investment decision, and we may lose money on our investments.···in some cases, equity securities in which we invest will not pay current dividends, and our ability to realize a return on our investment, as well as to recover our investment, will be dependent on the success of our portfolio companies. Even if the portfolio companies are successful, our ability to realize the value of our investment may be dependent on the occurrence of a liquidity event, such as a public offering or the sale of the portfolio company. It is likely to take a significant amount of time before a liquidity event occurs or we can sell our equity investments. In addition, the equity securities we receive or invest in may be subject to restrictions on resale during periods in which it could be advantageous to sell.····Tablepossible to hedge fully or perfectly against currency fluctuations affecting the value of Contentssecurities denominated innon-U.S.····· “non-accelerated“non-accelerated filer” within the meaning ofRule 12b-2 under the Securities Exchange Act of 1934, our independent auditors are not required to assess our internal control over financial reporting or to provide a report thereon. Although our management determined that our internal control over financial reporting was effective at February 28, 20142017 (the last date that such determination was required to be made by us), there can be no assurance that our independent auditors would agree with our management’s conclusion. Furthermore, if our market capitalization, excluding affiliated stockholders, at August 31 of any fiscal year is greater than $75$75.0 million, then we will be required to obtain independent auditor certification on the adequacy of our internal control over financial reporting for that fiscal year. If our internal control over financial reporting is determined in the future to not be effective, whether by our management or by our independent auditors, there could be an adverse reaction in the financial markets due to a loss of confidence in the reliability of our consolidated financial statements, which could materially adversely affect our stock price and our ability to raise capital necessary to operate our business. In addition, we may be required to incur costs in improving our internal control system and hiring additional personnel.Internal Revenue ServiceIRS has issued private rulings indicating that this rule will apply even where the total amount of cash that may be distributed is limited to no more than 20.0% of the total distribution. Under these rulings, if too many stockholders elect to receive their distributions in cash, each such stockholder would receive a pro rata share of the total cash to be distributed and would receive the remainder of their distribution in shares of stock. If we decide to make any distributions consistent with these rulings that are payable in part in our stock, taxable stockholders receiving such dividends will be required to include the full amount of the dividend (whether received in cash, our stock, or a combination thereof) as ordinary income (or as long-term capital gain to the extent such distribution is properly reported as a capital gain dividend) to the extent of our current and accumulated earnings and profits for United States federal income tax purposes. As a result, a U.S. stockholder may be required to pay tax with respect to such dividends in excess of any cash received. If a U.S. stockholder sells the stock it receives as a dividend in order to pay this tax, the sales proceeds may be less than the amount included in income with respect to the dividend, depending on the market price of our stock at the time of the sale.···loss of RIC qualification;·····andor·year-to-year increases in cash distributions.periodically increase our dividend rate. In addition, due to the asset coverage test that is applicable to us as a BDC, and provisions contained in the agreements governing our borrowings, we may be limited in our ability to make distributions. Further, if we invest a greater amount of assets in equity securities that do not pay current dividends, it could reduce the amount available for distribution.··The Maryland Control Share Acquisition Act, which provides that “control shares” of a Maryland corporation (defined as shares of common stock which, when aggregated with other shares of common stock controlled by the stockholder, entitles the stockholder to exercise one of three increasing ranges of voting power in electing directors) acquired in a “control share acquisition” (defined as the direct or indirect acquisition of ownership or control of “control shares”) have no voting rights except to the extent approved by stockholders by the affirmative vote of at leasttwo-thirds of all the votes entitled to be cast on the matter, excluding all interested shares of common stock.At our 2013 annual meetingWe do not currently have stockholder approval of stockholders, our stockholders approved a proposal that authorizes us to sell shares of our common stockissuances below the then current net asset value per share of our common stock at an offering price per share that is not less than 85% of the then current net asset value per share in one or more offerings for a period of one year ending on the earlier of September 26, 2014 or the date of our 2014 annual meeting of stockholders. Continued access to this exception will require approval of similar proposals at future stockholder meetings.currently incurred or may incur in the future.or they have currently incurred and may incur in the future (or any indebtedness that is initially unsecured to which we subsequently grant security) to the extent of the value of the assets securing such indebtedness, including indebtedness under the Credit Facility.indebtedness. In any liquidation, dissolution, bankruptcy or other similar proceeding, the holders of any of our existing or future secured indebtedness and the secured indebtedness of our subsidiaries may assert rights against the assets pledged to secure that indebtedness in order to receive full payment of their indebtedness before the assets may be used to pay other creditors, including the holders of the 2023 Notes. As of February 28, 2014, there was no outstanding balance under the Credit Facility and we had the ability to borrow up to $45.0 million under the Credit Facility, subject to certain conditions. As of February 28, 2014, we had $50.0 million in SBA-guaranteed debentures outstanding. Theindebtedness under the Credit Facility and to SBA-guaranteed debentures is senior to the Notes to the extent of the value of the assets securing such indebtedness.future.future, including indebtedness under the Credit Facility. Any assets of our subsidiaries are not directly available to satisfy the claims of our creditors, including holders of the 2023 Notes. Except to the extent we are a creditor with recognized claims against our subsidiaries, all claims of creditors of our subsidiaries will have priority over our equity interests in such entities (and·200%200.0% after such borrowings;·pay dividends on, or purchase or redeem or make any payments in respect of, capital stock or other securities ranking junior in right of payment to the Notes, including subordinated indebtedness, in each case other than dividends, purchases, redemptions or payments that would cause a violation of Section 18(a)(1)(B) as modified by Section 61(a)(1) of the 1940 Act or any successor provisions, but giving effect to any exemptive relief granted to us by the SEC or no-action letter granted by the SEC to another BDC (or the Company if it determines to seek such similar no-action or other relief) permitting the BDC to declare any cash dividend or distribution in order to maintain the BDC’s RIC status. These provisions generally prohibit us from declaring any cash dividend or distribution upon any class of our capital stock, or purchasing any such capital stock if our asset coverage, as defined in the 1940 Act, is below 200% at the time of the declaration of the dividend or distribution or the purchase and after deducting the amount of such dividend, distribution or purchase;····· your ability to sell the Notes or the market price of the Notes.2023 Notes or the ability to sell them.TheAlthough the 2023 Notes are listed on the NYSE under the symbol ‘‘SAQ.’’ WeSAB”, we cannot provide any assurances that an active trading market will develop or be maintained for the 2023 Notes or that youthe 2023 Notes will be able to sell your Notes. Ifbe sold. At various times, the 2023 Notes are traded after their initial issuance, they may trade at a discount from their initial offering price depending on prevailing interest rates, the market for similar securities, our credit ratings, if any, general economic conditions, our financial condition, performance and prospects and other factors. The underwriters involved in the offering of the Notes have advised us that they intend to make a market in the Notes, but they are not obligated to do so. The underwriters may discontinue any market-making in the Notes at any time at their sole discretion.assure youprovide any assurance that a liquid trading market will develop for the 2023 Notes, or that youthe 2023 Notes will be able to sell your Notesbe sold at a particular time or that the price you receive when you sell will be favorable.at a favorable price. To the extent an active trading market does not develop, the liquidity and trading price for the 2023 Notes may be harmed. Accordingly, you may be required to bear the financial risk of an investment in the Notes for an indefinite period of time.interestsinterest rates are lower than the rate borne by the 2023 Notes. If prevailing rates are lower at the time of redemption, you would not be able to reinvest the redemption proceeds in a comparable security at an effective interest rate as high as the interest rate on the 2023 Notes being redeemed. Our redemption right also may adversely impact your ability to sell the 2023 Notes as the optional redemption date or period approaches.ItemITEM 1B. Unresolved Staff CommentsUNRESOLVED STAFF COMMENTSItemITEM 2. PropertiesPROPERTIESOn August 31, 2012, a complaint was filed in the United States Bankruptcy Court for the Southern District of New York by GSC Acquisition Holdings, LLC against us to recover, among other things, approximately $2.6 million for the benefit of the estates and the general unsecured creditors of GSC Group, Inc. and its affiliates, including the Company’s former investment adviser, GSCP (NJ), L.P. The complaint alleges that the former investment adviser made a constructively fraudulent transfer of $2.6 million in deferred incentive fees by waiving them in connection with the termination of the Management Agreement with us, and that the termination of the Management Agreement was itself a fraudulent transfer. These transfers, the complaint alleges, were made without receipt of reasonably equivalent value and while the former investment adviser was insolvent. The complaint has not yet been served, and the plaintiff’s motion for authority to prosecute the case on behalf of the estates was taken under advisement by the court on October 1, 2012. We opposed that motion. We believe that the claims in this lawsuit are without merit and, if the plaintiff is authorized to proceed, intend to vigorously defend against this action.Except as discussed above, neitherNeither we nor our wholly-owned subsidiaries, Saratoga Investment Funding LLC and Saratoga Investment Corp. SBIC LP, are currently subject to any material legal proceedings.ItemITEM 4. Mine Safety DisclosuresMINE SAFETY DISCLOSURESPART IIITEM 5. MARKET FOR REGISTRANT’S COMMON EQUITY, RELATED STOCKHOLDER MATTERS AND ISSUER PURCHASES OF EQUITY SECURITIESItem 5. Market for Registrant’s Common Equity, Related Stockholder Matters and Issuer Purchases of Equity SecuritiesExchange, the sales price as a percentage of our net asset value (“NAV”) and the dividends declared by us for each fiscal quarter.Exchange. The net asset value per share and high and low sales prices listed below reflect the 1:10 reverse stock split that occurred on August 12, 2010. NAV(1) High Low $ 22.75 $ 17.95 $ 15.28 $ 22.42 $ 17.68 $ 15.56 $ 22.59 $ 16.65 $ 14.92 $ 22.06 $ 15.93 $ 13.50 NAV(1) High Low $ 22.11 $ 16.84 $ 14.03 $ 22.39 $ 18.15 $ 16.37 $ 22.21 $ 20.24 $ 17.20 $ 21.97 $ 23.30 $ 18.12 NAV(1) High Low $ * $ 23.60 $ 20.54 * Not determinable at the time of filing. (1) NAV per share is determined as of the last day in the relevant quarter and therefore may not reflect the net asset value per share on the date of the high and low closing sales prices. The net asset values shown are based on outstanding shares at the end of each period. TableOn September 24, 2014, we announced the approval of Contentsan open market share repurchase plan that allows it to repurchase up to 200,000 shares of our common stock at prices below its NAV as reported in our then most recently published consolidated financial statements. On October 7, 2015, our board of directors extended the open market share repurchase plan for another year and increased the number of shares we are permitted to repurchase at prices below our NAV, as reported in our then most recently published consolidated financial statements, to 400,000 shares of our common stock. On October 5, 2016, our board of directors extended the open market share repurchase plan for another year to October 15, 2017 and increased the number of shares we are permitted to repurchase at prices below our NAV, as reported in our then most recently published consolidated financial statements, to 600,000 shares of its common stock. As shown in the table below, as of February 28, 2017, we had purchased 218,491 shares of common stock pursuant to this repurchase plan.*Not determinable at the time of filing. Total Number of
Shares (or Units)
Purchased Average
Price per Share
(or Unit) Total Number of Shares
(or Units) Purchased as
Part of Publicly
Announced Plans or
Programs Maximum Number (or
Approximate Dollar Value) of
Shares (or Units) that May Yet
Be Purchased Under the Plans
or Programs 2,500 $ 15.59 2,500 397,500 — $ — 2,500 397,500 4,200 $ 13.86 6,700 393,300 18,717 $ 13.86 25,417 374,583 Total Number of
Shares (or Units)
Purchased Average
Price per Share
(or Unit) Total Number of Shares
(or Units) Purchased as
Part of Publicly
Announced Plans or
Programs Maximum Number (or
Approximate Dollar Value) of
Shares (or Units) that May Yet
Be Purchased Under the Plans
or Programs 16,282 $ 14.57 41,699 358,301 7,858 $ 16.22 49,557 350,443 21,357 $ 16.29 70,914 329,086 8,310 $ 16.50 79,224 320,776 19,212 $ 17.31 98,436 301,564 40,058 $ 17.44 138,494 261,506 40,221 $ 18.04 178,715 221,285 27,076 $ 18.10 205,791 394,209 8,600 $ 18.24 214,391 385,609 4,100 $ 18.57 218,491 381,509 — $ — 218,491 381,509 — $ — 218,491 381,509 218,491 $ 16.87 (1)Net asset value per share is determined as of the last day in the relevant quarter and therefore may not reflect the net asset value per share on the date of the high and low closing sales prices. The net asset values shown are based on outstanding shares at the end of each period.23, 201415, 2017 was $15.45$22.48 per share. As of May 23, 2014,15, 2017, there were 2221 holders of record of our common stock.2013:2017:
per Share Record Date Payment Date Amount
per Share May 30, 2008 June 13, 2008 $ 3.90 August 29, 2008 September 15, 2008 3.90 December 18, 2008 December 29, 2008 $ 2.50 $ 10.30 November 25, 2009 December 31, 2009 $ 18.25 (1) $ 18.25 November 19, 2010 December 29, 2010 $ 4.40 (1) $ 4.40 November 25, 2011 December 30, 2011 $ 3.00 (1) $ 3.00 November 20, 2012 December 31, 2012 $ 4.25 (1) $ 4.25 November 13, 2013 December 27, 2013 $ 2.65 (1) $ 2.65 October 30, 2014 November 28, 2014 $ 0.18 (1) January 29, 2015 February 27, 2015 0.22 (1) $ 0.40 May 4, 2015 May 29, 2015 $ 0.27 (1) May 26, 2015 June 5, 2015 1.00 (1) August 3, 2015 August 31, 2015 0.33 (1) November 2, 2015 November 30, 2015 0.36 (1) February 1, 2016 February 29, 2016 0.40 (1) $ 2.36 April 15, 2016 April 27, 2016 $ 0.41 (1) July 29, 2016 August 9, 2016 0.43 (1) August 24, 2016 September 5, 2016 0.20 (1) October 31, 2016 November 9, 2016 0.44 (1) January 31, 2017 February 9, 2017 0.45 (1) $ 1.93 March 15, 2017 March 28, 2017 $ 0.46 (1) $ 0.46 (1)This dividend was paid by combination of shares of common stock and cash. Please see the discussion immediately following this table for more detail about the composition of this dividend.(1) This dividend was paid by combination of shares of common stock and cash. Please see the discussion immediately following this table for more detail about the composition of this dividend. have madethereafter, paid five annual dividend distributions (in December(December 2013, 2012, 2011, 2010 and 2009) to our stockholders since such time, which distributions were made with a combination of cash and the issuance of shares of our common stock as discussed more fully below.Given the size of our asset base and our growing pipeline of attractive investments, our board of directors believes that using our capital resources to build and diversify our portfolio serves stockholders’ interests best by better positioning us to generate current income and capital appreciation on an increasing scale in future periods. Therefore, our board of directors determined to pay a 20.0% cash and 80.0% stock dividend with respect to a significant portion of our taxable income for our 2014 fiscal year in accordance with certain IRS private letter rulings. For more detailed information about this dividend, please see the discussion below.20132015 calendar year, the20142016 calendar year and/or portion of the capital gains in excess of capital losses realized during the one year period ending October 31, 2014,2016, if any, and, if we do so, we would expect to incur federal excise taxes as a result.We maintain an “opt out” dividend reinvestment plan for our common stockholders. As a result, if we declare a dividend, then stockholders’ cash dividends will be automatically reinvested in additional shares of our common stock, unless they specifically “opt out” of the dividend reinvestment plan so as to receive cash dividends.2014,2017, the revenue procedure was based upon certain applicable provisions of the Code and the Treasury regulations pursuant to which distributions payable in cash or in shares of stock at the election of stockholders are treated as taxable dividends. Consistent with these provisions, the IRS has issued private letter rulings concluding that a RIC may treat a distribution of its own stock as fulfilling its RIC distribution requirements if each stockholder may elect to receive his or her entire distribution in either cash or stock of the RIC subject to a limitation on the aggregate amount of cash to be distributed to all stockholders, which limitation must be at least 20.0% of the aggregate declared distribution.8,648,725864,872.5 shares of common stock, or 104.0% of our outstanding common stock prior to the dividend payment. The amount of cash elected to be received was greater than the cash limit of 13.7% of the aggregate dividend amount, thus resulting in the payment of a combination of cash and stock to stockholders who elected to receive cash. The number of shares of common stock comprising the stock portion was calculated based on a price of $1.5099 per share, which equaled the volume weighted average trading price per share of the common stock on December 24 and 28, 2009.2013.2017. The graph assumes that, on March 23, 2007, a person invested $100 in each of our common stock, the Standard & Poor’s 500 Stock Index and the NASDAQ Financial 100 index. The graph measures total shareholder return, which takes into account both changes in stock price and dividends. It assumes that dividends paid are reinvested in like securities.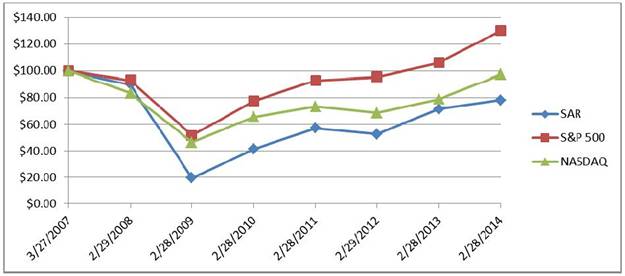
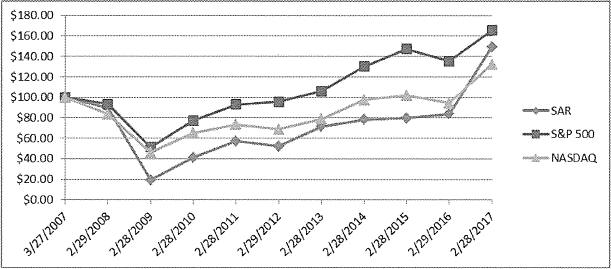
did not purchase anypurchased 193,074 shares of our common stock in the open market during the year ended February 28, 2014.ItemITEM 6. Selected Financial DataSELECTED CONSOLIDATED FINANCIAL DATA2014,2017, February 29, 2016, February 28, 2013, February 29, 2012,2015, February 28, 20112014 and February 28, 20102013 are derived from our consolidated financial statements which have been audited by Ernst & Young LLP, an independent registered public accounting firm, whose report thereon is included within this Annual Report. The data should be read in conjunction with our consolidated financial statements and notes thereto, which are included elsewhere in this Annual Report, and Part II,II. Item 7,7. “Management’s Discussion and Analysis of Financial Condition and Results of Operations”.
February 28,
2014
February 28,
2013
February 29,
2012
February 28,
2011
February 28,
2010 As of and for
the Year Ended
February 28,
2017 As of and for
the Year Ended
February 29,
2016 As of and for
the Year Ended
February 28,
2015 As of and for
the Year Ended
February 28,
2014 As of and for
the Year Ended
February 28,
2013 $ 29,348 $ 26,871 $ 24,684 $ 20,179 $ 14,444 3,809 3,179 2,691 2,714 2,563 33,157 30,050 27,375 22,893 17,007 9,888 8,456 7,375 6,084 2,540 7,846 6,761 6,704 4,266 4,710 1,367 1,175 1,000 1,000 1,000 2,896 2,866 2,328 2,669 2,287 45 114 294 — — 22,042 19,372 17,701 14,019 10,537 1,455 — — — — 9,660 10,678 9,674 8,874 6,470 12,368 226 3,276 1,271 562 (10,641 ) 741 (1,943 ) (1,648 ) 7,012 1,727 967 1,333 (377 ) 7,574 $ 11,387 $ 11,645 $ 11,007 $ 8,497 $ 14,044 As of and for the
Year Ended
February 28,
2017 As of and for the
Year Ended
February 29,
2016 As of and for the
Year Ended
February 28,
2015 As of and for the
Year Ended
February 28,
2014 As of and for the
Year Ended
February 28,
2013 $ 1.98 $ 2.09 $ 2.04 $ 1.73 $ 3.42 $ 1.68 $ 1.91 $ 1.80 $ 1.80 $ 1.57 $ 0.30 $ 0.18 $ 0.24 $ (0.07 ) $ 1.85 $ 1.93 $ 2.36 $ 0.40 $ 2.65 $ 4.25 $ (0.14 ) $ (0.37 ) $ (0.02 ) $ (0.71 ) $ (1.40 ) $ 21.97 $ 22.06 $ 22.70 $ 21.08 $ 22.71 $ 292,661 $ 283,996 $ 240,538 $ 205,845 $ 155,080 318,651 295,047 263,560 215,168 172,321 181,476 160,749 132,117 94,291 58,210 127,295 125,150 122,599 113,428 107,438 $ 21.97 $ 22.06 $ 22.70 $ 21.08 $ 22.71 5,794,600 5,672,227 5,401,899 5,379,616 4,730,116 $ 126,935 $ 109,191 $ 104,872 $ 121,074 $ 71,596 $ 121,159 $ 68,174 $ 73,257 $ 71,607 $ 21,488 53 59 64 60 47 10.71 % 10.82 % 10.63 % 10.62 % 11.26 % 11.64 % 16.40 % 25.22 % 18.55 % 27.11 % (1) See Note 6 to the consolidated financial statements contained elsewhere herein. (2) For the years ended February 28, 2017, February 29, 2016, February 28, 2015, February 28, 2014 and February 28, 2013, amounts are calculated using weighted average common shares outstanding of 5,740,450, 5,582,453, 5,385,049, 4,920,517 and 4,110,484, respectively. (3) Calculated using the shares outstanding at theex-dividend date. (4) Dilutive effect of the issuance of shares of common stock below net asset value per share in connection with the satisfaction of the Company’s annual RIC distribution requirement. See “Price Range of Common Stock and Distributions—Dividend Policy.” (5) As described in Note 2 to the consolidated financial statements and notes thereto, the Company has adopted the provisions ofASU 2015-03 Interest—Imputation of Interest (Subtopic835-30): Simplifying the Presentation of Debt Issuance Costs, as of February 28, 2015. The amendments in this ASU require that debt issuance costs related to a recognized debt liability be presented in the balance sheet as a direct deduction from the carrying amount of that debt liability consistent with debt discounts. The adoption of the provisions of ASU2015-03 did not materially impact the Company’s consolidated financial position or results of operations. Prior period amounts for the years ended February 28, 2014 and February 28, 2013 were reclassified to conform to the current period presentation.
February 28,
2014
February 28,
2013
February 29,
2012
February 28,
2011
February 28,
2010(1)See note 6 in consolidated financial statements contained elsewhere herein.(2)For the years ended February 28, 2014, February 28, 2013, February 29, 2012, February 28, 2011 and February 28, 2010 amounts are calculated using weighted average common shares outstanding of 4,920,517, 4,110,484, 3,434,345, 2,437,577, and 1,061,351, respectively.(3)Calculated using the shares outstanding at ex-dividend date.(4)Dilutive effect of the issuance of shares of common stock below net asset value per share in connection with the satisfaction of the Company’s annual RIC distribution requirement. See “Price Range of Common Stock and Distributions — Dividend Policy.”(5)Earnings per share, dividend per share and net asset value per share figures for February 28, 2010 were updated and do not reflect historical 10-K’s.ItemITEM 7. Management’s Discussion and Analysis of Financial Condition and Results of OperationsMANAGEMENT’S DISCUSSION AND ANALYSIS OF FINANCIAL CONDITION AND RESULTS OF OPERATIONSI,I. Item 1A1A. “Risk Factors” and “Note about Forward-Looking Statements” appearing elsewhere herein.········BDC,business development company (“BDC”), or to operate our SBICsmall business investment company (“SBIC”) subsidiary, and to continue to qualify to be taxed as a RIC;regulated investment company (“RIC”);···business development company (“BDC”)BDC under the Investment Company Act of 1940 (the “1940 Act”). Our investment objective is to generate current income and, to a lesser extent, capital appreciation from our investments. We invest primarily in leveraged loans and mezzanine debt issued by private U.S. middle market companies, which we define as companies having EBITDA of between $5$2 million and $50 million, both through direct lending and through participation in loan syndicates. We may also invest up to 30.0% of the portfolio in opportunistic investments in order to seek to enhance returns to stockholders. Such investments may include investments in distressed debt, which may include securities of companies in bankruptcy, foreign debt, private equity, securities of public companies that are not thinly traded and structured finance vehicles such as collateralized loan obligation funds. Although we have no current intention to do so, to the extent we invest in private equity funds, we will limit our investments in entities that are excluded from the definition of “investment company” under Section 3(c)(1) or
Section 3(c)(7) of the 1940 Act, which includes private equity funds, to no more than 15.0% of its net assets. We have elected and qualified to be treated as a regulated investment company (“RIC”)RIC under Subchapter M of the Internal Revenue Code of 1986, as amended (the “Code”).982,842986,842 shares of our common stock issued to Saratoga Investment Advisors and certain of its affiliates.a Small Business Investment Company (“SBIC”)an SBIC license from the Small Business Administration (“SBA”).notes2020 Notes is paid quarterly in arrears on February 15, May 15, August 15 and November 15, at a rate of 7.50% per year, beginning August 15, 2013. The notes2020 Notes mature on May 31, 2020 and since May 31, 2016, may be redeemed in whole or in part at any time or from time to time at our option on or after May 31, 2016.option. The notes are2020 Notes were listed on the NYSE under the trading symbol “SAQ” with a par value of $25.00 per share. The 2020 Notes were redeemed in full on January 13, 2017.statement of assets and liabilitiesbalance sheet date in the principal market to independent market participants, or in the absence of a principal market, in the most advantageous market, which may be a hypothetical market. Market participants are defined as buyers and sellers in the principal or most advantageous market that are independent, knowledgeable, and willing and able to transact.··approximately one quartera selection of these preliminary valuations each quarter so that the valuation of each investment for which market quotes are not readily available is reviewed by the independent valuation firm at least annually.once each fiscal year.··flowsflow analysis on expected future cash flows to determine a valuation for our investment in Saratoga CLO.amortizationsamortization of premiumpremiums on investments.Paid-in-KindPayment-in-Kind Interestendsended in October 2016. On November 15, 2016, we completed the second refinancing of the Saratoga CLO. The Saratoga CLO refinancing, among other things, extended its reinvestment period to October 2018, and extended its legal maturity date to October 2025. Following the refinancing, the Saratoga CLO portfolio remained at the same size and with a similar capital structure of approximately $300.0 million in aggregate principal amount of predominantly senior secured first lien term loans. In addition to refinancing its liabilities, we also purchased $4.5 million in aggregate principal amount of the Class F notes tranche of the Saratoga CLO at par, with a coupon of LIBOR plus 8.5%.WeFollowing the refinancing, we receive a senior collateralbase management fee of 0.25%0.10% and a subordinate collateralsubordinated management fee of 0.25%0.40% of the outstanding principalfee basis amount at the beginning of Saratoga CLO’s assets,the collection period, paid quarterly to the extent of available proceeds. We are also entitled to an incentive management fee equal to 20.0% of excess cash flow to the extent the Saratoga CLO subordinated notes receive an internal rate of return paid in cash equal to or greater than 12.0%.········transfer agent and custodial fees;·····SECSecurities and Exchange Commission (“SEC”) and the SBA);····administration agreementAdministration Agreement based upon our allocable portion of the administrator’s overhead in performing its obligations under an administration agreement, including rent and the allocable portion of the cost of our officers and their respective staffs (including travel expenses)).appropriately adjusted for any share issuances or repurchases during the applicable fiscal quarter, and an incentive fee.·(7.5% annualized) hurdle rate measured as of the end of each fiscal quarter. Under this provision, in any fiscal quarter, our investment adviser received no incentive fee unless ourpre-incentive fee net investment income exceeded the hurdle rate of 1.875%. Amounts received as a return of capital were not included in calculating this portion of the incentive fee. Since the hurdle rate was based on net assets, a return of less than the hurdle rate on total assets could still have resulted in an incentive fee.··· (7.5% annualized) but is less than or equal to 2.344% in any fiscal quarter is payable to Saratoga Investment Advisors. This will enable Saratoga Investment Advisors to receive 20.0% of all net investment income as such amount approaches 2.344% in any quarter, and Saratoga Investment Advisors will receive 20.0% of any additional net investment income. Under the investment advisory and management agreement with our former investment adviser, GSCP (NJ), L.P. only received 20.0% of the excess net investment income over 1.875%.·dollars,Dollars, we may enter into currency hedging contracts to reduce our exposure to fluctuations in currency exchange rates. We may also enter into interest rate hedging agreements. Such hedging activities, which will be subject to compliance with applicable legal requirements, may include the use of interest rate caps, futures, options and forward contracts. Costs incurred in entering into or settling such contracts will be borne by us.
2014
2013
2012 At February 28,
2017 At February 29,
2016 At February 28,
2015 ($ in millions) ($ in millions) ($ in millions) 52 59 63 28 34 34 $ 5.4 $ 4.6 $ 3.5
maturity(1) 3.8yrs 3.8yrs 3.7yrs 9 11 14 $ 9.7 $ 8.0 $ 6.6 $ 8.4 $ 0.0 $ 0.0
portfolio)(2) $ 44.2(16.9) % $ 97.9(40.0) % $ 82.5(40.6) % 11.4 % 11.5 % 12.0 %
portfolio)(2) $ 217.6(83.1) % $ 146.8(60.0) % $ 120.8(59.4) % 9.3 % 9.1 % 8.7 % (1)(1) Excludes our investment in the subordinated notes of Saratoga CLO. (2) Excludes our investment in the subordinated notes of Saratoga CLO and equity interests. (3) Excludes our investment in the subordinated notes of Saratoga CLO and Class F notes tranche of Saratoga CLO. (4) Calculation uses either1-month or3-month LIBOR, depending on the contractual turns, and after factoring in any existing LIBOR floors. (2)Excludes our investment in the subordinated notes of Saratoga CLO and investments in common stocks.2014,2017, we invested $121.1$126.9 million in new or existing portfolio companies and had $71.6$121.2 million in aggregate amount of exits and repayments resulting in net investments of $49.5$5.7 million for the year.28, 2013,29, 2016, we invested $71.6$109.2 million in new or existing portfolio companies and had $21.5$68.2 million in aggregate amount of exits and repayments resulting in net investments of $50.1$41.0 million for the year.29, 2012,28, 2015, we invested $38.7$104.9 million in new or existing portfolio companies and had $33.6$73.3 million in aggregate amount of exits and repayments resulting in net investments of $5.1$31.6 million for the year.2014,2017, February 29, 2016 and February 28, 2013, and February 29, 20122015 at fair value was as follows:
of Total
Portfolio
Average
Current
Yield
of Total
Portfolio
Average
Current
Yield
of Total
Portfolio
Average
Current
Yield At February 28, 2017 At February 29, 2016 At February 28, 2015 Percentage
of Total
Portfolio Weighted
Average
Current
Yield Percentage
of Total
Portfolio Weighted
Average
Current
Yield Percentage
of Total
Portfolio Weighted
Average
Current
Yield 3.4 % 5.3 % 4.2 % 8.2 % 7.6 % 6.2 % 54.3 10.5 50.9 10.6 60.3 11.0 30.0 11.7 31.1 11.5 14.8 11.2 — — — — 1.8 13.7 5.3 12.7 4.5 16.4 7.1 25.2 7.0 0.4 9.3 N/A 8.4 N/A 100.0 % 10.9 % 100.0 % 11.1 % 100.0 % 11.8 % 2014, February 28, 2013,2017 and February 29, 2012,2016 was composed of $301.3 million, $383.3$297.1 million and $380.2$302.7 million, respectively, in aggregate principal amount of predominantly senior secured first lien term loans. This investment is subject to unique risks. (See “Risk“Part 1. Item 1A. Risk Factors—Our investment in Saratoga CLO 2013-1 LTD. constitutes a leveraged investment in a portfolio of predominantly senior secured first lien term loans and is subject to additional risks and volatility”). We do not consolidate the Saratoga CLO portfolio in our consolidated financial statements. Accordingly, the metrics below do not include the underlying Saratoga CLO portfolio investments. However, at February 28, 2014, $298.92017, $288.5 million or 99.5%98.7% of the Saratoga CLO portfolio investments in terms of market value had a CMR (as defined below) color rating of green or yellow and threeone Saratoga CLO portfolio investments wereinvestment was in default with a fair value of $1.6$1.4 million. At February 28, 2013, $368.929, 2016, $283.3 million or 98.5%99.4% of the Saratoga CLO portfolio investments in terms of market value had a CMR (as defined below) color rating of green or yellow and one Saratoga CLO portfolio investment was in default with a fair value of $1.0 million. At February 28, 2012, $379.5 million or 99.3% of the Saratoga CLO portfolio investments in terms of market value had a CMR color rating of green or yellow and one Saratoga CLO portfolio investment was in default with a fair value of $0.7$0.8 million. For more information relating to Saratoga CLO, see the audited financial statements for Saratoga CLO included elsewhere herein.strongperforming credit; (Yellow)—satisfactoryunderperforming credit; (Red)—payment default risk, in payment default and/or significant restructuring activity.risk of principal recovery.20142017 and February 28, 201329, 2016 was as follows: At February 28, 2017 At February 29, 2016
Score
at
Fair Value
of
Total
Portfolio
at
Fair Value
of
Total
Portfolio Investments
at
Fair Value Percentage
of Total
Portfolio Investments
at
Fair Value Percentage
of Total
Portfolio ($ in thousands) $ 245,678 83.9 % $ 240,623 84.7 % 8,423 2.9 4,058 1.4 7,069 2.4 8 0.0 31,491 10.8 39,307 13.9 $ 292,661 100.0 % $ 283,996 100.0 % (1) Comprised of our investment in the subordinated notes of Saratoga CLO and equity interests. TableThe change in reserve from $0.7 million as of Contents(1)ComprisedFebruary 29, 2016 to $0.2 million as of our investment inFebruary 28, 2017 primarily related to the subordinated notes of Saratoga CLO and equity interests.20142017 and February 28, 201329, 2016 was as follows: At February 28, 2017 At February 29, 2016
Score
at
Fair Value
of
Total
Portfolio
at
Fair Value
of
Total
Portfolio Investments
at
Fair Value Percentage
of Total
Portfolio Investments
at
Fair Value Percentage
of Total
Portfolio ($ in thousands) $ 266,449 91.1 % $ 251,570 88.3 % 22,064 7.6 31,752 11.1 3,925 1.3 1,331 0.5 23 0.0 192 0.1 $ 292,461 100.0 % $ 284,845 100.0 % (1) Comprised of Saratoga CLO’s equity interests. 20142017 and February 28, 2013:29, 2016: At February 28, 2017 At February 29, 2016(2)
at
Fair Value
of
Total
Portfolio
at
Fair Value
of
Total
Portfolio Investments
at
Fair Value Percentage
of Total
Portfolio Investments
at
Fair Value Percentage
of Total
Portfolio ($ in thousands) $ 161,212 55.1 % $ 105,976 37.3 % 38,544 13.2 36,905 13.0 20,748 7.1 43,109 15.2 18,698 6.4 16,574 5.8 16,839 5.7 9,537 3.4 15,450 5.3 12,828 4.5 10,928 3.7 10,694 3.8 8,423 2.9 9,131 3.2 968 0.3 7,642 2.7 851 0.3 10,526 3.7 — — 14,707 5.2 — — 6,367 2.2 $ 292,661 100.0 % $ 283,996 100.0 % (1)Comprised of our investment in the subordinated notes of Saratoga CLO.(1) Comprised of our investment in the subordinated notes and Class F Note of Saratoga CLO. (2) Prior period classifications have been conformed to current period presentation. 20142017 and February 28, 2013:29, 2016:
at
Fair Value
of
Total
Portfolio
at
Fair Value
of
Total
Portfolio At February 28, 2017 At February 29, 2016 Investments
at
Fair Value Percentage
of Total
Portfolio Investments
at
Fair Value Percentage
of Total
Portfolio ($ in thousands) $ 40,675 13.9 % $ 37,308 13.1 % 33,002 11.3 28,339 9.9 21,492 7.4 24,714 8.7 17,851 6.1 9,451 3.3 14,752 5.0 10,175 3.6 14,706 5.0 18,898 6.6 13,704 4.7 11,364 4.0 11,643 4.0 12,580 4.4 11,283 3.9 4,768 1.7 9,853 3.4 11,777 4.1 9,627 3.3 8,009 2.8 9,476 3.2 13,559 4.8 8,036 2.7 9,342 3.3 6,088 2.1 5,470 1.9 6,026 2.1 — — 5,932 2.0 5,944 2.1 5,394 1.8 2,873 1.0 4,944 1.7 6,975 2.4 4,580 1.6 3,029 1.1 4,311 1.5 4,958 1.8 3,935 1.3 7,774 2.7 3,584 1.2 11,770 4.1 3,209 1.1 2,273 0.8 3,147 1.1 5,694 2.0 3,013 1.0 984 0.3 3,001 1.0 4,712 1.7 2,877 1.0 2,737 1.0 2,731 0.9 — — 2,479 0.8 2,618 0.9 2,025 0.7 1,917 0.7 2,008 0.7 4,168 1.5 1,974 0.7 2,869 1.0 1,617 0.6 3,557 1.2 1,312 0.4 1,505 0.5 800 0.3 732 0.3 788 0.3 496 0.2 343 0.1 1,258 0.4 243 0.1 248 0.1 $ 292,461 100.0 % $ 284,845 100.0 % 20142017 and February 28, 2013.29, 2016. The geographic composition is determined by the location of the corporate headquarters of the portfolio company. At February 28, 2017 At February 29, 2016
at
Fair Value
of
Total
Portfolio
at
Fair Value
of
Total
Portfolio Investments
at
Fair Value Percentage
of Total
Portfolio Investments
at
Fair Value Percentage
of Total
Portfolio ($ in thousands) $ 116,186 39.7 % $ 108,661 38.3 % 75,154 25.7 57,553 20.3 38,880 13.3 52,875 18.6 34,060 11.6 25,535 9.0 15,450 5.3 12,828 4.5 7,780 2.6 — — 5,151 1.8 24,544 8.6 — — 2,000 0.7 $ 292,661 100.0 % $ 283,996 100.0 % (1) Comprised of our investment in the subordinated notes and Class F Note of Saratoga CLO. (1)Comprised of our investment in the subordinated notes of Saratoga CLO.2014,2017, February 29, 2016 and February 28, 2013 and February 29, 20122015 are as follows:
2014
2013
2012 For the Year Ended February 28,
2017 February 29,
2016 February 28,
2015 ($ in thousands) $ 33,157 $ 30,050 $ 27,375 22,042 19,372 17,701 1,455 — — 9,660 10,678 9,674 12,368 226 3,276 (10,641 ) 741 (1,943 ) $ 11,387 $ 11,645 $ 11,007 2014,2017, February 29, 2016 and February 28, 2013 and February 29, 20122015 are as follows:
2014
2013
2012 February 28,
2017 February 29,
2016 February 28,
2015 ($ in thousands) $ 29,348 $ 26,871 $ 24,684 1,499 1,495 1,520 2,310 1,684 1,171 $ 33,157 $ 30,050 $ 27,375 2014,2017, total investment income increased $5.9$3.1 million, or 34.6%10.3% compared to the fiscal year ended February 29, 2016. Interest income from investments increased $2.5 million, or 9.2%, to $29.3 million for the year ended2013.2015. Interest income from investments increased $5.7$2.2 million, or 39.7%8.9%, to $20.2$26.9 million for the year ended February 28, 201429, 2016 from $14.4$24.7 million for the fiscal year ended February 28, 2013.2015. This reflects an increase of 32.7%18.1% in total investments to $205.8$284.0 million at February 29, 2016 from $240.5 million at February 28, 2014 from $155.1 million at February 28, 2013, while2015, offset by the weighted average current coupon remained relatively unchanged at 12.5%.For the fiscal year ended February 28, 2013, total investment income increased $3.5 million, or 25.9% comparedreducing from 12.0% to the fiscal year ended February 29, 2012. Interest income from investments increased $3.2 million, or 28.4%, to $14.4 million for the year ended February 28, 2013 from $11.2 million for the fiscal year ended February 29, 2012.For the fiscal year ended February 29, 2012, total investment income decreased $0.6 million, or 4.7% compared to the fiscal year ended February 28, 2011. Interest income from our investment in the subordinated notes of Saratoga CLO increased $0.9 million, or 27.4%, to $4.2 million for the year ended February 29, 2012 from $3.3 million for the fiscal year ended February 28, 2011.2014,2017, February 29, 2016 and February 28, 2013, and February 29, 2012,2015, total PIK income was $0.9$0.7 million, $1.1$1.0 million, and $1.4$1.2 million, respectively.The Saratoga CLO was refinanced in October 2013. As a result, proceeds from principal payments in the loan portfolio of Saratoga CLO must now be used to paydown its outstanding notes. Thus, the management fee income and investment income that we will receive from Saratoga CLO will decline in future periods.2014,2017, February 29, 2016 and February 28, 2013 and February 29, 20122015 are as follows:
2014
2013
2012 February 28,
2017 February 29,
2016 February 28,
2015 ($ in thousands) $ 9,888 $ 8,456 $ 7,375 4,899 4,529 4,157 1,243 1,336 1,302 2,948 2,232 2,548 1,367 1,175 1,000 276 331 337 235 204 210 45 114 294 1,141 995 478 $ 22,042 $ 19,372 $ 17,701 2014,2017, total operating expenses before manager expense waiver and reimbursement increased $3.8$2.7 million, or 38.0%13.8% compared to the fiscal year ended February 28, 2013.29, 2016. For the year ended February 28, 2013,29, 2016, total operating expenses before manager expense waiver and reimbursement increased $2.2$1.7 million, or 27.8%9.4% compared to the fiscal year ended February 29, 2012.20142017 and 2013,February 29, 2016, the increase in interest and credit facility expensedebt financing expenses is primarily attributable to an increase in outstanding debt duringas compared to the yearprior years, with increased levels of outstanding SBA debentures, as well as additional notes being issued. Our SBA debentures increased from the issuance of $48.3$103.7 million notes during the year ended February 28, 2013,to $112.7 million and the increase of our SBA debentures during both years, respectively.2020 Notes were repaid and the 2023 Notes issued, increasing the notes payable from $61.8 million outstanding to $74.5 million outstanding for these same periods. For the year ended February 28, 2014,2017, the weighted average interest rate on our outstanding indebtedness was 5.35%4.76% compared to 6.35%4.92% for the fiscal year ended February 29, 2016 and 4.95% for the fiscal year ended February 28, 2013 and 7.50% for the fiscal year ended February 29, 2012.2015. This decrease was primarily driven by increasedan increase in SBA debentures that havecarry a lower interest rate.2014,2017, base management fees increased $1.2$0.4 million, or 57.9%8.2% compared to the fiscal year ended February 28, 2013.29, 2016. The increase in base management fees results from the 8.7% increase in the average value of our total net assets, less cash and cash equivalents, from $108.7$266.3 million as of February 29, 2016 to $114.9$289.4 million as of February 28, 2013 and 2014, respectively.2017. For the year ended February 28, 2013,29, 2016, base management fees increased $0.5$0.4 million, or 30.3%8.9% compared to the fiscal year ended February 29, 2012.28, 2015. The increase in base management fees results from the 8.0% increase in the average value of our total net assets.assets, less cash and cash equivalents, from $246.5 million as of February 28, 2015 to $266.3 million as of February 29, 2016, respectively.2014,2017, professional fees decreased $0.1 million, or 6.9% compared to the fiscal year ended February 29, 2016. For the year ended February 29, 2016, professional fees increased $0.02$0.03 million, or 1.8%2.7% compared to the fiscal year ended February 28, 2013. 2015.2013, professional2017, incentive management fees decreased $0.3increased $0.7 million, or 18.2%32.0% compared to the fiscal year ended February 29, 2012.28, 2014,29, 2016, incentive management fees decreased $1.4$0.3 million, or 66.2 %12.4% compared to the fiscal year ended February 28, 2013.2015. The decrease in incentive management fees is primarily attributable to the secondfirst part of the incentive fee accrual, withmanagement fees increased in 2016, as higher average total assets of 8.0% has led to increased net investment income above the year ending February 28, 2013 being an accrual of $1.0 million as comparedhurdle rate pursuant to the year ending February 28, 2014 being a reversal of the accrual of $0.3 million. Forinvestment advisory and management agreement. However, for the year ended February 28, 2013,29, 2016, incentive management fees increased $0.8in total were more than offset as the incentive management fees related to capital gains changed from a $0.3 million or 62.7%increase in expense to a $0.05 million decrease in expense compared to the fiscal year ended February 29, 2012. The increase in incentive management fees is primarily attributable to an increase in accrued incentive fees related to net investment income.credit facility expensedebt financing expenses for the years ended February 28, 2014,2017, February 29, 2016 and February 28, 2013 and February 29, 20122015 is primarily attributable to an increase in the amount of outstanding debt as compared to the prior periods.years. For the year ended February 28, 2017, there were no outstanding borrowings under the Credit Facility. For the years ended February 28, 2014,29, 2016 and February 28, 2013 and February 29, 2012,2015, the weighted average interest rate on the outstanding borrowings under the Credit Facility was 7.50%, 7.50%6.00% and 7.50%6.75%, respectively. For the years ended February 28, 20142017, February 29, 2016 and February 28, 2013,2015, the weighted average interest rate on the outstanding borrowings of the SBA debentures was 3.03%3.13%, 3.12% and 1.42%2.93%, respectively. There were no outstanding borrowings for the year ended February 29, 2012.losses(losses) on sales of investments2014,2017, the Company had $71.6$121.2 million of sales, repayments, exits or restructurings resulting in $1.3$12.4 million of net realized gains. The most significant realized gains during the year ended February 28, 2017 were as follows (dollars in thousands): Asset Type Gross
Proceeds Cost Net
Realized
Gain Common Stock $ 6,505 $ 481 $ 6,024 Common Stock Voting A-1 2,320 221 2,099 Common Stock VotingB-1 1,464 139 1,325 28, 201429, 2016 were as follows:follows (dollars in thousands):28, 201429, 2016
Proceeds
Realized
Gain/(Loss) Asset Type Gross
Proceeds Cost Net
Realized
Gain/
(Loss) Common Stock $ 3,206 $ — $ 3,206 Unsecured Note — (2,054 ) (2,054 ) First Lien Term Loan — (1,172 ) (1,172 ) Common Stock — (567 ) (567 ) 2013,2015, the Company had $21.5$73.3 million of sales, repayments, exits or restructurings resulting in $0.6$3.3 million of net realized gains. The most significant realized gains and losses during the year ended February 28, 20132015 were as follows:follows (dollars in thousands):20132015
Proceeds
Realized
Gain/(Loss)For the fiscal year ended February 29, 2012, the Company had $33.6 million of sales, repayments, exits or restructurings resulting in $12.2 million of net realized losses. The most significant realized gains and losses during the year ended February 29, 2012 were as follows:Fiscal year ended February 29, 2012
Proceeds
Realized
Gain/(Loss) Asset Type Gross
Proceeds Cost Net
Realized
Gain Term Loan A Senior Facility $ 6,983 $ 6,886 $ 97 Senior Secured Notes 4,225 3,938 287 Non Voting Common Stock 248 133 115 Voting Common Stock 5,650 3,026 2,624 depreciation(depreciation) on investments2014,2017, our investments had a decrease in net unrealized depreciation of $1.6$10.6 million versus an increase in net unrealized appreciation of $7.0$0.7 million for the year ended February 29, 2016. The most significant cumulative changes in unrealized depreciation for the year ended February 28, 2017, were the following (dollars in thousands): Asset Type Cost Fair
Value Total
Unrealized
Depreciation YTD Change
in Unrealized
Depreciation Common Stock $ — $ — $ — $ (5,755 ) Common Stock Voting A-1 — — — (2,456 ) Common Stock VotingB-1 — — — (1,550 ) Common Stock 9,217 413 (8,804 ) (1,613 ) 2013.2015. The most significant cumulative changes in unrealized appreciation and depreciation for the year ended February 29, 2016, were the following (dollars in thousands): Asset Type Cost Fair
Value Total
Unrealized
Appreciation/
(Depreciation) YTD Change
in Unrealized
Appreciation/
(Depreciation) Common Stock $ 481 $ 6,235 $ 5,754 $ 4,762 Unsecured Notes — — — 2,054 Common Stock 9,217 2,026 (7,191 ) (4,735 ) 2014,2015, were the following:following (dollars in thousands):20142015
Value
Unrealized
Appreciation/
(Depreciation)
in Unrealized
Appreciation/
(Depreciation)For the year ended February 28, 2013, our investments had an increase in net unrealized appreciation of $7.0 million versus an increase in net unrealized appreciation of $19.8 million for the year ended February 29, 2012. The most significant cumulative changes in unrealized appreciation and depreciation for the year ended February 28, 2013, were the following:Fiscal year ended February 28, 2013
Value
Unrealized
Appreciation/
(Depreciation)
in Unrealized
Appreciation/
(Depreciation)For the year ended February 29, 2012, our investments had an increase in net unrealized appreciation of $19.8 million versus an increase in net unrealized appreciation of $36.4 million for the year ended February 28, 2011. The most significant cumulative changes in unrealized appreciation and depreciation for the year ended February 29, 2012, were the following:Fiscal year ended February 29, 2012
Value
Unrealized
Appreciation/
(Depreciation)
in Unrealized
Appreciation/
(Depreciation)The $6.9 million net unrealized appreciation in our investment in the Saratoga CLO subordinated notes was due to higher cash flow projections based on an increase in principal balance and an improvement in the overcollateralization ratios, a decrease in the assumed portfolio default rate (based on better than forecast actual default rates and improved default forecasts) and an improvement in reinvestment assumptions based on current market conditions and projections. In addition, for the year ended February 29, 2012 we had approximately $15.7 million of unrealized appreciation due to the reversal of prior period unrealized depreciation recorded upon the exit of certain investments including approximately $6.1 million related to Energy Alloys, L.L.C., $6.3 million related to Grant U.S. Holdings LLP., $2.3 million related to Bankruptcy Management Solutions and $1.1 million related to Pracs Institute, LTD. Asset Type Cost Fair
Value Total
Unrealized
Appreciation/
(Depreciation) YTD Change
in Unrealized
Appreciation/
(Depreciation) Common—Voting A-1 $ 221 $ 1,493 $ 1,272 $ 941 Common 567 — (567 ) (730 ) Other/Structured Finance
Securities 15,953 17,031 1,078 (1,935 ) 2014,2017, February 29, 2016 and February 28, 2013 and February 29, 20122015, we recorded a net increase in net assets resulting from operations of $8.7$11.4 million, $14.6$11.6 million and $13.3$11.0 million, respectively. Based on 4,920,5175,740,450 weighted average common shares outstanding as of February 28, 2014,2017, our per share net increase in net assets resulting from operations was $1.78$1.98 for the fiscal year ended February 28, 2014.2017. This compares to a per share net increase in net assets resulting from operations of $3.55$2.09 for the fiscal year ended February 28, 201329, 2016 (based on 4,110,4845,582,453 weighted average common shares outstanding as of February 28, 2013)29, 2016), and a per share net increase in net assets resulting from operations of $3.87$2.04 for the fiscal year ended February 29, 201228, 2015 (based on 3,434,3455,385,049 weighted average common shares outstanding as of February 29, 2012)28, 2015). These increases do not reflect the impact of the payment of any dividends. Our stockholders approved a proposal at our annual meeting of stockholders held on September 26, 2013 that authorizes us tosell shares of our common stock at an offering price per share to investors that is not less than 85% of our then current net asset value per share in one or more offerings for a period ending on the earlier of September 26, 2014 or the date of our next annual meeting of stockholders. We would need stockholder approval of a similar proposal to issue shares below net asset value per share at any time after the earlier of September 26, 2014 or our next annual meeting of stockholders. Subchapter M of the Code. In satisfying this distribution requirement, we have in the past relied on IRS issued private letter rulings concluding that a RIC may treat a distribution of its own stock as fulfilling its RIC distribution requirements if each stockholder may elect to receive his or her entire distribution in either cash or stock of the RIC subject to a limitation on the aggregate amount of cash to be distributed to all stockholders, which limitation must be at least 20%20.0% of the aggregate declared distribution. We may rely on these IRS private letter rulings in future periods to satisfy our RIC distribution requirement.200%200.0%. This requirement limits the amount that we may borrow. Our asset coverage ratio, as defined in the 1940 Act, was 337.9%271.0% as of February 28, 20142017 and 547.3%302.5% as of February 28, 2013.29, 2016. To fund growth in our investment portfolio in the future, we anticipate needing to raise additional capital from various sources, including the equity markets and other debt-related markets, which may or may not be available on favorable terms, if at all.• Interest Coverage Ratio.The ratio (expressed as a percentage) of interest collections with respect to pledged loan assets, less certain fees and expenses relating to the Credit Facility, to accrued interest and commitment fees and any breakage costs payable to the lenders under the Credit Facility for the last 6 payment periods must equal at least 175.0%. ·Interest Coverage Ratio. The ratio (expressed as a percentage) of interest collections with respect to pledged loan assets, less certain fees and expenses relating to the Credit Facility, to accrued interest and commitment fees and any breakage costs payable to the lenders under the Credit Facility for the last 6 payment periods must equal at least 175.0%.• Overcollateralization Ratio.The ratio (expressed as a percentage) of the aggregate Adjusted Borrowing Value of “eligible” pledged loan assets plus the fair value of certain ineligible pledged loan assets and the CLO Notes (in each case, subject to certain adjustments) to outstanding borrowings under the Credit Facility plus the Unfunded Exposure Amount must equal at least 200.0%. ·Overcollateralization Ratio. The ratio (expressed as a percentage) of the aggregate Adjusted Borrowing Value of “eligible” pledged loan assets plus the fair value of certain ineligible pledged loan assets and the CLO Notes (in each case, subject to certain adjustments) to outstanding borrowings under the Credit Facility plus the Unfunded Exposure Amount must equal at least 200.0%.·Weighted Average FMV Test. The aggregate adjusted or weighted value of “eligible” pledged loan assets as a percentage of the aggregate outstanding principal balance of “eligible” pledged loan assets must be equal to or greater than 72.0% and 80.0% during the one-year periods prior to the first and second anniversary of the closing date, respectively, and 85.0% at all times thereafter.• Weighted Average FMV Test.The aggregate adjusted or weighted value of “eligible” pledged loan assets as a percentage of the aggregate outstanding principal balance of “eligible” pledged loan assets must be equal to or greater than 72.0% and 80.0% during theone-year periods prior to the first and second anniversary of the closing date, respectively, and 85.0% at all times thereafter. ·····$5,000,000$5.0 million at any time prior to the third anniversary of the closing date;·····credit facilityCredit Facility from $40.0 million to $45.0 million;·Revolving Periodperiod during which we may make and repay borrowings under the Credit Facility from July 30, 2013 to February 24, 2015;2015 (the “Revolving Period”). The Revolving Period may, upon the occurrence of an event of default, by action of the lenders or automatically, be terminated. All borrowings and other amounts payable under the Credit Facility are due and payable five years after the end of the Revolving Period; and·2014,2017, we had no outstanding balanceborrowings under the Credit Facility and $50.0$112.7 millionSBA-guaranteed debentures outstanding (which are discussed below). As of February 29, 2016, we had no outstanding borrowings under the Credit Facility and $103.7 millionSBA-guaranteed debentures outstanding. Our borrowing base under the Credit Facility was $44.6 million at February 28, 2014.2017 and February 29, 2016 was $24.7 million and $21.8 million, respectively.337.9% and 547.3% for the years ended271.0% as of February 28, 20142017 and 302.5% as of February 28, 2013, respectively.$150$150.0 million when it has at least $75$75.0 million in regulatory capital, receives a capital commitment from the SBA and has been through an examination by the SBA subsequent to licensing. As of February 28, 2014,2017, our SBIC subsidiary had $32.0$75.0 million in regulatory capital and $50.0$112.7 millionSBA-guaranteed debentures outstanding.Securities and Exchange CommissionSEC to permit us to exclude the debt of our SBIC subsidiary guaranteed by the SBA from the definition of senior securities in the 200%200.0% asset coverage test under the 1940 Act. This allows us increased flexibility under the 200%200.0% asset coverage test by permitting us to borrow up to $150$150.0 million more than we would otherwise be able to absent the receipt of this exemptive relief.7.50% unsecured notes due 2020 Notes for net proceeds of $46.1 million after deducting underwriting commissions of $1.9 million and offering costs of $0.3 million. The proceeds included the underwriters’ full exercise of their overallotment option. Interest on these notes2020 Notes is paid quarterly in arrears on February 15, May 15, August 15 and November 15, at a rate of 7.50% per year, beginning August 15, 2013. The notes2020 Notes mature on May 31, 2020 and since May 31, 2016, may be redeemed in whole or in part at any time or from time to time at our option on or after May 31, 2016.option. In connection with the issuance of the notes,2020 Notes, we agreed to the following covenants for the period of time during which the 2020 Notes are outstanding:··we will not violate (regardless of whetherto) Section 18(a)(1)(B) as modified by Section 61(a)(1)to the reporting requirements of Sections 13 or 15(d) of the 1940Securities Exchange Act of 1934, or the Exchange Act, to file any successor provisions, but giving effect to (i) any exemptive relief granted to us byperiodic reports with the SEC, and (ii) no-action relief granted by the SECwe agree to another BDC (orfurnish to the Company if it determines to seek such similar no-action or other relief) permitting the BDC to declare any cash dividend or distribution notwithstanding the prohibition contained in Section 18(a)(1)(B) as modified by Section 61(a)(1)holders of the 1940 Act in order to maintain2023 Notes and the BDC’s status as a regulated investment company under Subchapter MTrustee, for the period of time during which the Internal Revenue Code of 1986. Currently these provisions generally prohibit us from declaring any cash dividend or distribution upon any class2023 Notes are outstanding, our audited annual consolidated financial statements, within 90 days of our capital stock, or purchasing anyfiscal year end, and unaudited interim consolidated financial statements, within 45 days of our fiscal quarter end (other than our fourth fiscal quarter). All such capital stock if our asset coverage, as definedfinancial statements will be prepared, in the 1940 Act, is below 200% at the time of the declaration of the dividend or distribution or the purchase and after deducting the amount of such dividend, distribution or purchase.The Notes are listed on the NYSE under the trading symbol “SAQ”all material respects, in accordance with a par value of $25.00 per share.20142017 and February 28, 2013,29, 2016, the fair value of investments, cash and cash equivalents and cash and cash equivalents, securitizationreserve accounts werewas as follows: At February 28, 2017 At February 29, 2016 Fair Value Percentage
of
Total Fair Value Percentage
of
Total ($ in thousands) $ 9,307 3.0 % $ 2,440 0.8 % 12,781 4.1 4,595 1.6 9,823 3.1 11,868 4.1 159,097 50.5 144,643 49.7 87,750 27.9 88,178 30.3 15,450 4.9 12,828 4.4 20,541 6.5 26,479 9.1 $ 314,749 100.0 % $ 291,031 100.0 % TableOn September 24, 2014, we announced the approval of Contentsan open market share repurchase plan that allows it to repurchase up to 200,000 shares of our common stock at prices below our NAV as reported in its then most recently published consolidated financial statements, which was subsequently increased to 400,000 shares of our common stock. On October 5, 2016, our board of directors extended the open market share repurchase plan for another year to October 15, 2017 and increased the number of shares we are permitted to repurchase at prices below our NAV, as reported in its then most recently published consolidated financial statements, to 600,000 shares of our common stock. As of February 28, 2017, we purchased 218,491 shares of common stock, at the average price of $16.87 for approximately $3.7 million pursuant to this repurchase plan.
2014
2013
of
Total
of
Totalpayablewhich was paid on December 27, 2013, to common stockholders of record onas of November 13, 2013. Shareholders had the option to receive payment of the dividend in cash, shares of common stock, or a combination of cash and shares of common stock, provided that the aggregate cash payable to all shareholders was limited to approximately $2.5 million or $0.53 per share.payablewhich was paid on December 31, 2012, to common stockholders of record onas of November 20, 2012. Shareholders had the option to receive payment of the dividend in cash, shares of common stock, or a combination of cash and shares of common stock, provided that the aggregate cash payable to all shareholders was limited to approximately $3.3 million or $0.85 per share.payablewhich was paid on December 30, 2011, to common stockholders of record onas of November 25, 2011. Shareholders had the option to receive payment of the dividend in cash, shares of common stock, or a combination of cash and shares of common stock, provided that the aggregate cash payable to all shareholders was limited to $2.0 million or $0.60 per share.payablewhich was paid on December 31, 2009, to common stockholders of record onas of November 25, 2009. Shareholders had the option to receive payment of the dividend in cash, shares of common stock, or a combination of cash and shares of common stock, provided that the aggregate cash payable to all shareholders was limited to $2.1 million or $0.25 per share.8,648,725864,872.5 shares of common stock, or 104.0% of our outstanding common stock prior to the dividend payment. The amount of cash elected to be received was greater than the cash limit of 13.7% of the aggregate dividend amount, thus resulting in the payment of a combination of cash and stock to shareholders who elected to receive cash. The number of shares of common stock comprising the stock portion was calculated based on a price of $1.5099 per share, which equaled the volume weighted average trading price per share of the common stock on December 24 and 28, 2009.2014:2017:
1 Year
Years
Years
5 Years Payment Due by Period Total Less Than
1 Year 1 - 3
Years 3 - 5
Years More Than
5 Years ($ in thousands) $ 187,111 $ — $ — $ — $ 187,111 $12.2$2.0 million and $0.0$2.0 million of unfunded commitments to provide debt financing to its portfolio companies or to fund limited partnership interests as of February 28, 20142017 and 2013,February 29, 2016, respectively. Such commitments are generally up to the Company’s discretion to approve, or the satisfaction of certain financial and nonfinancial covenants and involve, to varying degrees, elements of credit risk in excess of the amount recognized in the Company’s Consolidated Statementconsolidated statements of Assetsassets and Liabilitiesliabilities and are not reflected in the Company’s Consolidated Statementsconsolidated statements of Assetsassets and Liabilities.liabilities. As of February 28,
2017 February 29,
2016 $ — $ 1,000 2,000 — — 1,000 $ 2,000 $ 2,000 ItemITEM 7A. Quantitative and Qualitative Disclosures about Market RiskQUANTITATIVE AND QUALITATIVE DISCLOSURES ABOUT MARKET RISKLIBOR.LIBOR only on our revolving credit facility. At February 28, 2014,2017, we had $98.3$187.1 million of borrowings outstanding.investments net of interest expense on the Credit Facility.investments. Assuming that our investments as of February 28, 20142017 were to remain constant for a full fiscal year and no actions were taken to alter the existing interest rate terms, a hypothetical change of 1.0% in interest rates would cause a corresponding increase of approximately $0.5$2.2 million to our interest income net of interest expense.statementstatements of assets and liabilities and other business developments that could magnify or diminish our sensitivity to interest rate changes, nor does it account for divergences in LIBOR and the commercial paper rate, which have historically moved in tandem but, in times of unusual credit dislocations, have experienced periods of divergence. Accordingly no assurances can be given that actual results would not materially differ from the potential outcome simulated by this estimate.NoneOur CEOAs of the end of the period covered by this report, we carried out an evaluation, under the supervision and with the participation of our management, including our Chief Executive Officer and our CFO have evaluatedChief Financial Officer, of the effectiveness of the design and operation of our disclosure controls and procedures (as defined inRule 13a-15(e) and15d-15(e) of the Securities Exchange Act of the Exchange Act) as of the end of the period covered by this report.1934). Based uponon that evaluation, our CEOChief Executive Officer and CFOour Chief Financial Officer have concluded that our current disclosure controls and procedures are effective asin facilitating timely decisions regarding required disclosure of any material information relating to us that is required to be disclosed by us in the endreports we file or submit under the Securities Exchange Act of 1934. However, in evaluating the period covered by this report.disclosure controls and procedures, management recognized that any controls and procedures, no matter how well designed and operated, can provide only reasonable assurance of achieving the desired control objectives, and management necessarily was required to apply its judgment in evaluating the cost-benefit relationship of possible controls and procedures.by Rule in Rules13a-15(f) and15d-15(f) of the Exchange Act) and for the assessment of the effectiveness of internal control over financial reporting. The Company’s. Our internal control over financial reporting is a process designed to provide reasonable assurance regarding the reliability of financial reporting and the preparation of our financial statements for external reporting purposes in accordance with U.S. GAAP. Internal control over financial reporting includes those policies and procedures that (i) pertain to the consolidatedmaintenance of records that in reasonable detail accurately and fairly reflect the transactions and dispositions of the assets of the company; (ii) provide reasonable assurance that the transactions are recorded as necessary to permit preparation of financial statements in accordance with U.S. GAAP, and that the receipts and expenditures of the company are being made only in accordance with authorizations of management and directors of the company; and (iii) provide reasonable assurance regarding prevention or timely detection of unauthorized acquisition, use, or disposition of the company’s assets that could have a material effect on the financial statements. Because of its inherent limitations, internal control over financial reporting may not prevent or detect misstatements and even when determinedmisstatements. Projections of any evaluation of effectiveness to be effective, can only provide reasonable assurancefuture periods are subject to the risk that controls may become inadequate because of changes in conditions, or that the degree of compliance with respect to financial statement preparation and presentation. polices or procedures may deteriorate.the participation of management, including the CEOour Chief Executive Officer and CFO,Chief Financial Officer, the Company conducted an evaluation of the effectiveness of the Company’s internal control over financial reporting based on the criteria established in the Internal Control—Integrated Framework (2013) issued by the Committee of Sponsoring Organizations of the Treadway Commission (COSO). Based on the Company’s assessment,evaluation under the framework in Internal Control—Integrated Framework (2013), management believesconcluded that the Company maintained effectiveCompany’s internal control over financial reporting was effective as of February 28, 2014.quarteryear that have materially affected, or are reasonably likely to materially affect, the Company’s internal control over financial reporting.
Since
Expires Age Director
Since Term
Expires 57 Chairman of the Board and Chief Executive Officer 2010 2018 53 President and Director 2011 2017 67 Director 2007 2019 75 Director 2007 2019 63 Director 2007 2017 2629 years of experience in leveraged finance, from distressed debt to private equity, and has been involved in originating, structuring, negotiating, consummating, managing and monitoring investments in these businesses. Mr. Oberbeck is the Managing Partner of Saratoga Partners, a middle market private equity investment firm, and has served on its investment committee since 1995. Mr. Oberbeck is also the Managing Member of Saratoga Investment Advisors, LLC, the Company’s investment adviser, and the Chief Executive Officer of the Company. Mr. Oberbeck also served as our President until February 2014.2326 years of experience in leveraged finance, investment management and financial services. He has originated, structured, negotiated, consummated, managed and monitored numerous successful investments in mezzanine debt, private equity, senior debt, structured products and commercial real estate debt. Mr. Grisius is Chief Investment Officer and a Managing Director of Saratoga Investment Advisors, LLC, the Company’s investment adviser, and was appointed President of the Company in February 2013. Mr. Grisius joined Saratoga Investment Advisors, LLC in July 2011.industries, including WH Industries Inc.industries. Between 2000 and 2005, he served as Senior Vice President and Chief Financial Officer of PCCI, Inc., a private IT staffing and outsourcing firm. Between 1992 and 2000, Mr. Looney worked at WH Industries as Chief Financial and Administrative Officer. Mr. Looney also serves as a director of Excellent Education for Everyone, a nonprofit organization. Mr. Looney graduated summa cum laude from the University of Washington with a B.A. degree in Accounting and received a J.D. from the University of Washington School of Law where he was a member of the law review. Mr. Looney’s qualifications as director include his experience as a Managing Director of Peale Davies & Co. Inc. and as Chief Financial and Administrative Officer of WH Industries, as well as his financial, accounting and legal expertise.MrMr. Williams is also a Senior Manager, Director of Farragut Capital Partners which is a Chevy Chase, Maryland based Mezzanine Fund. Since 2011, Mr. Williams has also served as a partner of Farragut Capital Partners, an investment firm based in Fairfax, VA. In 2004, Mr. Williams concluded a 23 year career at Allied Capital Corporation, a business development company based in Washington, DC, which was acquired by Ares Capital Corporation in 2010. While at Allied, Mr. Williams held a variety of positions, including President, COO and finally Managing Director following Allied’s merger with its affiliates in 1998. From 1991 to 2004, Mr. Williams either led orco-managed the firm’s Private Equity Group. For the nine years prior to 1999, Mr. Williams led Allied’s Mezzanine investment activities. For 15 years, Mr. Williams served on Allied’s Investment Committee where he was responsible for reviewing and approving all of the firm’s investments. Prior to 1991, Mr. Williams ran Allied’s Minority Small Business Investment Company. He also founded Allied Capital Commercial Corporation, a real estate investment vehicle. Mr. Williams has served on the Boardboard of directors of various public and private companies. Mr. Williams attended The Landon School, and graduated from Mercersburg Academy and Rollins College, receiving a B.S. in Business Administration from the latter. Mr. Williams’ qualifications as director include his 28 years of experience managing investment activities at Allied Capital, where he served in a variety of positions, including President, COO and Managing Director.alsoAlso a DirectorAge Age38Interim Chief Financial Officer, Interim Chief Compliance Officer, Interim Treasurer and Interim Secretary3741 years old, had served as the Chief Financial Officer of MF Global Holdings Ltd., a broker in commodities and derivatives, from April 2011. Prior to that, Mr. Steenkamp held the position of Chief Accounting Officer and Global Controller at MF Global for four years. He joined MF Global, then Man Financial, in 2006 as Vice President of External Reporting and Accounting Policy. After MF Global filed for bankruptcy protection in October 2011, he continued to serve as Chief Financial Officer through January 2013.2014.2017, with the following exception. On March 14, 2016, Saratoga Investment Advisors transferred 49,218 shares of our common stock to Michael J. Grisius, our President and a member of the board of directors. Christian L. Oberbeck, our Chief Executive Officer and Chairman of the board of directors, controls Saratoga Investment Advisors. In connection with that transfer, both of Messrs. Oberbeck and Grisius filed a Form 4 on March 17, 2016, one day after the deadline. The untimely filing was inadvertent. that applies to which applies to, among others, our executive officers, including our principal executive officer and principal financial officer, as well as every officer, director and employee of the Company. Requests for copies should be sent in writing to Saratoga Investment Corp., 535 Madison Avenue, New York, New York 10022. The Company’s Code of Business Conduct and Ethics is also available on our website athttp://saratogainvestmentcorp.comwww.saratogainvestmentcorp.com..http://saratogainvestmentcorp.comwww.saratogainvestmentcorp.com..Boardboard of Directorsdirectors implemented since the filing of our Proxy Statement for our 20132016 Annual Meeting of Stockholders.Boardboard of directors has determined that Mr. Looney is an “audit committee financial expert” as defined under Item 407 ofRegulation S-K of the Securities Exchange Act of 1934 and that each of Messrs. Whitman and Williams are “financially literate” as required by NYSE corporate governance standards. All of these members are independent directors.2014:2017:
Paid in Cash Fees Earned or
Paid in Cash Total $ — $ — — — 71,000 71,000 67,000 67,000 68,000 68,000 (1) No compensation was paid to directors who are interested persons of us as defined in the 1940 Act. (1)No compensation was paid to directors who are interested persons of us as defined in the 1940 Act.Boardboard of directors with respect to incentive compensation and equity-based plans of the Company that are subject to Boardboard of directors approval, evaluating executive officer performance and reviewing the Company’s management succession plan, overseeing and setting compensation for the Company’s directors and, as applicable, its executive officers and, as applicable, preparing the report on executive officer compensation that SEC rules require to be included in our annual reportAnnual Report onForm 10-K. Currently, none of our executive officers are compensated by the Company and as such the compensation committee is not required to produce a report on executive officer compensation for inclusion in our annual reportAnnual Report onForm 10-K.2014,2017, none of the Company’s executive officers served on the board of directors (or a compensation committee thereof or other board committee performing equivalent functions) of any entities that had one or more executive officers serve on the compensation committee or on the board of directors. No current or past executive officers or employees of the Company or its affiliates serve on the compensation committee.27, 2014,15, 2017, the beneficial ownership of each current director, the nominees for director, the Company’s executive officers, each person known to us to beneficially own 5.0% or more of the outstanding shares of our common stock, and the executive officers and directors as a group.5,379,6165,884,375 shares of common stock outstanding as of May 27, 2014.15, 2017. Shares of common stock that are subject to warrants or other convertible securities currently exercisable or exercisable within 60 days thereof, are deemed outstanding for the purposes of computing the percentage ownership of the person holding these options or convertible securities, but are not deemed outstanding for computing the percentage ownership of any other person. Beneficial ownership is determined under the rules of the SEC and generally includes voting or investment power with respect to securities. To our knowledge, unless otherwise indicated in the footnotes to this table, the persons and entities named in the table have sole voting and sole investment power with respect to all shares beneficially owned. Unless otherwise indicated by footnote, the address for each listed individual is Saratoga Investment Corp., 535 Madison Avenue, New York, New York 10022.
Common Stock
Beneficially Owned
Class Number of Shares of
Common Stock
Beneficially Owned Percent of
Class 1,710,236 (1) 29.1 % 146,752 2.5 % 5,641 * 2,685 * 2,397 * 40,211 * 1,907,922 32.4 % 642,922 10.9 % 744,183 12.6 % 342,127 5.8 % *Less than 1.0%* Less than 1.0% 34.2%34.9% of the ownership of SAR.(1)Includes 1,217,556 shares of common stock directly held by Mr. Oberbeck, 180,738 shares of common stock held by Saratoga Investment Advisors, which Mr. Oberbeck controls, and 174,035 shares of common stock held by CLO Partners LLC, an entity wholly owned by Mr. Oberbeck per records as of 12/31/2013(1) Includes 623,541 shares of common stock directly held by Mr. Oberbeck, 122,188 shares of common stock held by Saratoga Investment Advisors, which Mr. Oberbeck controls, and 220,324 shares of common stock held by CLO Partners LLC, an entity wholly owned by Mr. Oberbeck and 744,183 shares of common stock directly held by Elizabeth Oberbeck. See footnote 3 below. (2) Based on information included in Amendment No. 6 to Schedule 13G filed by Black Diamond Capital Management, L.L.C. with the SEC on February 2, 2017. The address of Black Diamond Capital Management, L.L.C. is One Sound Shore Drive, Suite 200, Greenwich, CT 06830 (3) Based on information included in Amendment No. 3 to Schedule 13D filed jointly by Christian L. Oberbeck, Elizabeth Oberbeck, Saratoga Investment Advisors and CLO Partners LLC on November 4, 2014. Pursuant to an Agreement Relating to Shares of Common Stock of Saratoga Investment Corp. (the “Transfer Agreement”), Christian L. Oberbeck transferred 744,183 shares of common stock beneficially owned by him to Elizabeth Oberbeck. Elizabeth Oberbeck has full ownership rights with respect to the shares, including without limitation, the right to (A) receive any cash and/or stock dividends and distributions paid on or with respect to the shares and (B) sell the shares in accordance with the provisions of the Transfer Agreement and receive all proceeds therefrom. However, pursuant to the terms of the Transfer Agreement, Christian L. Oberbeck has retained the right to vote the shares, except that Elizabeth Oberbeck has retained the right to vote the shares on all matters submitted to shareholders with respect to any matter that could give rise to dissenters or other rights of an objecting shareholder under Maryland General Corporation Law. The Transfer Agreement also contains a right of first refusal that requires Elizabeth Oberbeck to offer Christian L. Oberbeck the opportunity to purchase any shares of Common Stock owned by her prior to her intended sale of the shares. Any such purchases may be made either directly by Mr. Oberbeck or through entities affiliated with him. (2)Based on information included in Amendment No. 2 to Schedule 13G filed by Black Diamond Capital Management, L.L.C. with the SEC on February 14, 2014.(3)Based on information included in Amendment No. 4 to Schedule 13G filed by Raging Capital Management, LLC with the SEC on February 14, 2014.(4)Based on information included in Schedule 13D filed by Thomas V. Inglesby with the SEC on January 6, 2014ana Management Agreement with Saratoga Investment Advisors, LLC. We have also entered into a license agreement with Saratoga Investment Advisors, LLC, pursuant to which Saratoga Investment Advisors has agreed to grant us anon-exclusive, royalty-free license to use the name “Saratoga.” In addition, pursuant to the terms of the administration agreement, Saratoga Investment Advisors, LLC provides us with the office facilities and administrative services necessary to conduct ourday-to-day operations. Mr. Oberbeck, our chief executive officer, is the primary investor in and controls Saratoga Investment Advisors, LLC.Boardboard is required to review and approve any transactions with related persons (as such term is defined in Item 404 ofRegulation S-K).Boardboard of directors annually determines the independence of each director. No director is considered independent unless the Boardboard of directors has determined that he or she has no material relationship with the Company. The Company monitors the status of its directors and officers through the activities of the Company’s Nominating and Corporate Governance Committee and through a questionnaire to be completed by each director no less frequently than annually, with updates periodically if information provided in the most recent questionnaire has changed.Boardboard of directors uses the definition of director independence set forth in the NYSE Listed Company Manual. Section 303A.00 of the NYSE Listed Company Manual provides that business development companies, or BDCs, such as the Company, are required to comply with all of the provisions of Section 303A applicable to domestic issuers other than Sections 303A.02, the section that defines director independence.Boardboard of directors has determined that each of the directors is independent and has no relationship with the Company, except as a director and stockholder of the Company, with the exception of Messrs. Oberbeck and Grisius who are interested persons of the Company due to their positions as officers of the Company and its investment adviser.ACCOUNTANTACCOUNTING FEES AND SERVICES20142017 and February 28, 2013,29, 2016, the Company incurred the following fees for services provided by Ernst & Young LLP, including expenses:
February 28, 2014
February 28, 2013 Fiscal Year Ended
February 28, 2017 Fiscal Year Ended
February 29, 2016 $ 617,595 $ 642,080 27,000 27,000 70,870 38,870 — — $ 715,465 $ 707,950 AND CONSOLIDATED FINANCIAL STATEMENT SCHEDULESConsolidated Statements of Assets and Liabilities as of February 28, 2014 and February 28, 2013Consolidated Statements of Operations for the years ended February 28, 2014, February 28, 2013, and February 29, 2012Consolidated Schedules of Investments as of February 28, 2014 and February 28, 2013Consolidated Statements of Changes in Net Assets for the years ended February 28, 2014, February 28, 2013, and February 29, 2012Consolidated Statements of Cash Flows for the years ended February 28, 2014, February 28, 2013, and February 29, 2012Notes to Consolidated Financial StatementsScheduleSchedule 12-14—Investments in and advances to affiliatesNumberDescriptionForm of Dividend Reinvestment Plan (incorporated by reference to Amendment No. 2 to the Saratoga Investment Corp.’s Registration StatementCurrent Report on Form N-2, File No. 333-138051,8-K filed on January 12, 2007)September 24, 2014).(Filed as(incorporated by reference to Exhibit 4.5 hereto, and Exhibit A to Firsttherein).4.7 Form of Second Supplemental Indenture referredbetween the Company and U.S. Bank National Association (incorporated by reference to in Exhibit 4.5)Amendment No. 2 to Saratoga Investment Corp.’s Registration Statement onForm N-2, FileNo. 333-214182, filed on December 12, 2016).10.14.9 Form of Articles Supplementary Establishing and Fixing the Rights and Preferences of Preferred Stock (incorporated by reference to Saratoga Investment Corp.’s registration statement on FormN-2Pre-Effective Amendment No. 1, FileNo. 333-196526, filed on December 5, 2014). 10.1 Investment Advisory and Management Agreement dated July 30, 2010 between GSC Investment Corp. and Saratoga Investment Advisors, LLC (incorporated by reference to Saratoga Investment Corp.’s Current Report onForm 8-K filed on August 3, 2010). NumberDescriptionthe registrant’sSaratoga Investment Corp.’s Registration Statement onForm N-2, FileNo. 333-186323, filed on April 30, 2013).12.1StatementIndenture, dated as of Computation of Ratios of Earnings to Fixed ChargesOctober 17, 2013, among Saratoga Investment Corp. CLO2013-1, Ltd., Saratoga Investment Corp. CLO2013-1, Inc. and U.S. Bank National Association (incorporated by reference to the registrant’sSaratoga Investment Corp.’s Registration Statement onForm N-2, FileNo. 333-196526, filed on December 5, 2014).10.10 Amended and Restated Indenture, dated as of November 15, 2016, among Saratoga Investment Corp. CLO2013-1, Ltd., Saratoga Investment Corp. CLO2013-1, Inc. and U.S. Bank National Association. (incorporated by reference to Saratoga Investment Corp.’s Registration Statement on FormN-2, FileNo. 333-186323,333-216344, filed on April 29, 2013)February 28, 2017).21.110.12 Investment Advisory and Management Agreement dated July 30, 2010 between Saratoga Investment Corp. and Saratoga Investment Advisors, LLC (incorporated by reference to Saratoga Investment Corp.’s Registration Statement onForm N-2, FileNo. 333-196526, filed on December 5, 2014). 10.13 Amendment No. 2 to Credit, Security and Management Agreement dated September 17, 2014 by and among Saratoga Investment Funding LLC, Saratoga Investment Corp., Saratoga Investment Advisors, LLC, Madison Capital Funding LLC and U.S. Bank National Association (incorporated by reference to Saratoga Investment Corp.’s Current Report onForm 8-K filed on September 18, 2014). 11 Computation of Per Share Earnings (included in Note 12 to the consolidated financial statements contained in this report). 14 Code of Ethics of the Company adopted under Rule17j-1 (incorporated by reference to Amendment No.7 to Saratoga Investment Corp.’s Registration Statement on FormN-2, FileNo. 333-138051, filed on March 22, 2007). 21.1 List of Subsidiaries and jurisdiction of incorporation/organization: Saratoga Investment Funding LLC—Delaware; Saratoga Investment Corp. SBIC, LP—Delaware; and Saratoga Investment Corp. GP, LLC—Delaware. 13a-1413a-14(a) of the Securities Exchange Act of 1934, as adopted pursuant to Section 302 of the Sarbanes-Oxley Act of 2002.13a-1413a-14(a) of the Securities Act of 1934, as adopted pursuant to Section 302 of the Sarbanes-Oxley Act of 2002.* Filed herewith *10-K Filed herewithSUMMARYSARATOGA INVESTMENT CORP. 27, 2014By: Christian L. Oberbeck Chief Executive Officer By: Henri J. Steenkamp Interim Chief Financial Officer and Interim Chief Compliance OfficerTitle27, 201427, 2014Interim Chief Financial Officer (Principal Accounting Officer and Principal Financial Officer)27, 201427, 201427, 201427, 2014F-2 F-3 F-4 20142017 and February 28, 201329, 2016F-5 F-10F-8 F-11F-9 F-12F-10 statementstatements of assets and liabilities of Saratoga Investment Corp. (the “Company”) as of February 28, 2014 and February 28, 2013,, including the consolidated scheduleschedules of investments, as of February 28, 2017 and February 29, 2016, and the related consolidated statements of operations, changes in net assets, and cash flows for the years ended February 28, 2014,2017, February 29, 2016 and February 28, 2013 and February 29, 2012.2015. These consolidated financial statements are the responsibility of the Company’s management. Our responsibility is to express an opinion on these consolidated financial statements based on our audits.Company’sentity’s internal control over financial reporting. Our audits included consideration of internal control over financial reporting as a basis for designing audit procedures that are appropriate in the circumstances, but not for the purpose of expressing an opinion on the effectiveness of the Company’sentity’s internal control over financial reporting. Accordingly, we express no such opinion. An audit also includes examining, on a test basis, evidence supporting the amounts and disclosures in the financial statements, assessing the accounting principles used and significant estimates made by management, and evaluating the overall financial statement presentation. Our procedures included confirmation of securitiesinvestments owned as of February 28, 2014,2017, by correspondence with the custodian, debt agents and lenders. We believe that our audits provide a reasonable basis for our opinion.20142017 and February 28, 2013,29, 2016, and the consolidated results of itstheir operations, changes in itstheir net assets and itstheir cash flows for the years ended February 28, 2014,2017, February 29, 2016 and February 28, 2013 and February 29, 2012,2015, in conformity with U.S. generally accepted accounting principles.NY
New York27, 201416, 2017 As of February 28,
2017 February 29,
2016 $ 242,531,514 $ 271,168,186 50,129,799 12,827,980 292,661,313 283,996,166 9,306,543 2,440,277 12,781,425 4,594,506 3,294,450 3,195,919 171,106 170,016 183,346 350,368 253,041 300,000 $ 318,651,224 $ 295,047,252 $ — $ — (437,183 ) (515,906 ) 112,660,000 103,660,000 (2,508,280 ) (2,493,303 ) 74,450,500 61,793,125 (2,689,511 ) (1,694,586 ) — 875,599 5,814,692 5,593,956 852,987 855,873 2,764,237 1,552,069 — 20,957 51,500 31,500 397,505 218,093 $ 191,356,447 $ 169,897,377 $ 5,795 $ 5,672 190,483,931 188,714,329 (27,737,348 ) (26,217,902 ) (27,636,482 ) (40,172,549 ) (7,821,119 ) 2,820,325 127,294,777 125,149,875 $ 318,651,224 $ 295,047,252 $ 21.97 $ 22.06
February 28, 2014
February 28, 2013
February 29, 2012 For the year
ended
February 28,
2017 For the year
ended
February 29,
2016 For the year
ended
February 28,
2015 $ 26,413,986 $ 23,165,823 $ 20,790,324 652,847 1,039,398 1,186,657 2,281,397 2,665,648 2,707,230 29,348,230 26,870,869 24,684,211 31,151 5,420 3,801 1,499,001 1,494,779 1,520,205 2,278,770 1,679,602 1,167,144 33,157,152 30,050,670 27,375,361 9,888,127 8,456,467 7,375,022 4,898,657 4,528,589 4,156,955 1,243,400 1,336,214 1,301,713 1,366,667 1,175,000 1,000,000 2,947,543 2,232,188 2,547,773 275,787 330,867 337,335 235,422 204,000 210,761 1,121,594 995,205 478,299 44,770 113,808 293,653 19,780 — — 22,041,747 19,372,338 17,701,511 1,454,595 — — 9,660,810 10,678,332 9,673,850 12,368,115 226,252 3,276,450 (10,641,444 ) 740,974 (1,942,936 ) 1,726,671 967,226 1,333,514 $ 11,387,481 $ 11,645,558 $ 11,007,364 $ 1.98 $ 2.09 $ 2.04 5,740,450 5,582,453 5,385,049 February 28, 2014
/ Maturity Principal/
Number of Shares Cost Fair
Value (c) % of
Net Assets Business Services First Lien Term Loan
(L+8.00%), 9.05% Cash, 9/21/2021 $ 18,000,000 $ 17,857,818 $ 17,843,400 14.0 % Business Services Common Stock 100,000 100,000 251,000 0.2 % Business Services Syndicated Loan
(L+4.00%), 5.05% Cash, 9/10/2020 $ 5,611,666 5,582,551 5,639,163 4.4 % Business Services Second Lien Term Loan
(L+10.00%), 11.05% Cash, 6/1/2021 $ 15,000,000 14,879,353 14,230,500 11.2 % Business Services Senior Secured Note
(L+8.50%), 10.00% Cash, 1/23/2020 $ 3,300,000 3,282,213 3,316,500 2.6 % Business Services Warrant Membership Interests Expires 12/28/2022 49,318 400,000 394,544 0.3 % Business Services Second Lien Term Loan
(L+11.50%), 12.55% (11.50% Cash/1.00% PIK), 8/28/2021 $ 13,111,929 13,000,581 13,111,929 10.2 % Business Services First Lien Term Loan
(L+11.00%), 12.05% Cash, 11/16/2021 $ 7,000,000 6,933,141 6,930,000 5.4 % Business Services Delayed Draw Term Loan B
(L+11.00%), 12.05% Cash, 11/16/2021 $ — — — 0.0 % Business Services Common Stock 850,000 850,000 850,000 0.7 % Business Services First Lien Term Loan
(L+5.25%), 6.30% Cash, 10/8/2021 $ 5,947,481 5,857,960 5,947,481 4.7 % Business Services Second Lien Term Loan
(L+9.50%), 10.55% Cash, 10/8/2022 $ 3,000,000 2,922,606 2,926,800 2.3 % Business Services Convertible Promissory Note
13.50% (6.75% Cash/6.75% PIK), 8/18/2018 611,517 611,517 611,517 0.5 % Business Services Common Stock Class A Units 232,616 232,616 386,143 0.3 % Business Services First Lien Term Loan
(L+9.25%), 10.30% (9.25% Cash/1.75% PIK) 12/18/2020 $ 10,293,791 10,223,741 10,293,791 8.1 % Business Services First Lien Term Loan
(L+8.75%), 9.80% Cash, 7/20/2021 $ 17,777,730 17,692,307 17,777,730 14.0 % Business Services Second Lien Term Loan
(L+10.00%), 11.05% Cash, 7/1/2022 $ 8,000,000 7,927,489 7,964,800 6.3 % Business Services First Lien Term Loan
10.00% Cash, 2/13/2022 $ 9,000,000 8,910,000 8,910,000 7.0 % Business Services First Lien Term Loan,
14.00% (12.00% Cash/2.00% PIK), 3/6/2018 $ 8,819,270 8,778,186 8,819,270 6.9 % Business Services Warrants to Purchase Limited Liability Company Interests, Expires 5/31/2025 343 — 327,200 0.3 % Total Business Services 126,042,079 126,531,768 99.4 % Consumer Products Common Stock 210,456 1,791,242 29,241 0.0 % Consumer Products Second Lien Term Loan A-2
15.00% PIK, 12/31/2019 $ 234,630 234,630 234,630 0.2 % Consumer Products Second Lien Term Loan B
15.00% PIK, 12/31/2019 $ 703,889 703,889 703,889 0.6 % Total Consumer Products 2,729,761 967,760 0.8 % Consumer Services Second Lien Term Loan
(L+11.00%), 12.05% Cash, 7/9/2019 $ 9,375,000 9,359,492 7,061,250 5.6 % Consumer Services First Lien Term Loan
(L+5.25%), 6.50% Cash, 7/1/2019 $ 2,687,143 2,672,435 2,687,143 2.1 % Consumer Services Second Lien Term Loan
(L+9.00%), 10.25% Cash, 7/1/2020 $ 11,000,000 10,966,188 11,000,000 8.6 % Total Consumer Services 22,998,115 20,748,393 16.3 % Education Class A Common Stock 544,761 30,241 — 0.0 % Education First Lien Term Loan
1.0% Cash, 3/31/2018 $ 2,321,073 1,193,790 8,087 0.0 % Education Common Stock 750 750,000 919,680 0.7 % Education Second Lien Term Loan
(L+9.75%), 10.80% Cash, 6/2/2021 $ 10,000,000 9,918,572 10,000,000 7.9 % Total Education 11,892,603 10,927,767 8.6 % Food and Beverage First Lien Term Loan
(L+8.50%), 9.75% Cash, 7/17/2017 $ 9,358,694 9,331,446 8,422,825 6.6 % Total Food and Beverage 9,331,446 8,422,825 6.6 % Healthcare Services First Lien Term Loan B
(L+10.00%), 11.05% Cash, 7/24/2019 $ 11,100,000 10,977,689 10,940,160 8.6 % Healthcare Services Limited Partner Interests 999 999,000 886,772 0.7 % Healthcare Services First Lien Term Loan
(L+8.50%), 9.55% Cash, 1/31/2022 $ 10,500,000 10,398,957 10,395,000 8.2 % Healthcare Services Common Stock 5,081 508,077 680,823 0.5 % Healthcare Services Second Lien Term Loan
11.25% Cash, 9/26/2019 $ 4,200,000 4,155,827 4,179,000 3.3 % Healthcare Services Common Stock 5,000 500,000 288,800 0.2 % Healthcare Services Senior Subordinated Note
12.00%, 7/15/2021 $ 7,300,000 7,238,831 6,989,750 5.5 % Healthcare Services Syndicated Loan
(L+4.75%), 5.80% Cash, 8/17/2020 $ 4,136,911 4,085,888 4,183,658 3.3 % Total Healthcare Services 38,864,269 38,543,963 30.3 % Media First Lien Term Loan
12.00% Cash, 7/8/2021 $ 8,462,482 8,376,876 8,462,482 6.6 % Media Delayed Draw First Lien Term Loan
12.00% Cash, 7/8/2021 $ 4,800,000 4,751,258 4,800,000 3.8 % Media Class A Series, Expires 1/16/2025 4,264 61,647 294,770 0.2 % Media Class A Warrant, Expires 1/16/2025 30,320 438,353 1,706,410 1.3 % Media Warrants to Purchase Limited Liability Company Interests (Common), Expires 5/16/2024 57,872 — 2,961,310 2.3 % Media Warrants to Purchase Limited Liability Company Interests (Preferred), Expires 5/16/2024 8,139 — 473,690 0.4 % Total Media 13,628,134 18,698,662 14.6 % Metals Common Stock 35,000 9,217,564 413,350 0.3 % Metals Second Lien Term Loan
15.00% PIK, 8/10/2022 $ 437,500 437,500 437,500 0.4 % Total Metals 9,655,064 850,850 0.7 %
(L+9.50%), 10.55% Cash, 8/24/2021 $ 15,773,875 15,644,382 15,773,875 12.4 % Real Estate Common Stock 413,043 413,043 1,065,651 0.8 % Total Real Estate 16,057,425 16,839,526 13.2 % 251,198,896 242,531,514 190.5 % Business Services Preferred Equity 5,080,000 8,000,000 8,000,000 6.3 % Business Services First Lien Term Loan
(L+10.25%), 11.02% Cash, 1/15/2020 $ 26,680,000 26,464,162 26,680,000 20.9 % Total Business Services 34,464,162 34,680,000 27.2 % Structured Finance Securities Other/Structured Finance Securities
14.87%, 10/20/2025 $ 30,000,000 10,319,374 10,950,249 8.7 % Structured Finance Securities Other/Structured Finance Securities
(L+8.50%), 9.55%, 10/20/2025 $ 4,500,000 4,500,000 4,499,550 3.5 % Total Structured Finance Securities 14,819,374 15,449,799 12.2 % 49,283,536 50,129,799 39.4 % $ 300,482,432 $ 292,661,313 229.9 % Principal Cost Fair Value % of
Net Assets $ 22,087,968 $ 22,087,968 $ 22,087,968 17.4 % $ 22,087,968 $ 22,087,968 $ 22,087,968 17.4 %
Number of Shares
Net Assets(a) Represents a non-qualifying investment as defined under Section 55(a) of the Investment Company Act of 1940, as amended. Non-qualifying assets represent 5.3% of the Company’s portfolio at fair value. As a BDC, the Company can only invest 30% of its portfolio in non-qualifying assets. (b) Percentages are based on net assets of $127,294,777 as of February 28, 2017. (c) Because there is no readily available market value for these investments, the fair value of these investments is approved in good faith by our board of directors (see Note 3 to the consolidated financial statements). (d) These securities are pledged as collateral under a senior secured revolving credit facility (see Note 7 to the consolidated financial statements). (e) This investment does not have a stated interest rate that is payable thereon. As a result, the 14.87% interest rate in the table above represents the effective interest rate currently earned on the investment cost and is based on the current cash interest and other income generated by the investment. (f) As defined in the Investment Company Act, we “Control” this portfolio company because we own more than 25% of the portfolio company’s outstanding voting securities. Transactions during the period in which the issuer was both an Affiliate and a portfolio company that we Control are as follows: Purchases Redemptions Sales
(Cost) Interest
Income Management
Fee Income Net
Realized
Gains
(Losses) Net
Unrealized
Appreciation
(Depreciation) $ 20,553,200 $ — $ — $ 217,362 $ — $ — $ 283,226 $ — $ — $ — $ 1,941,914 $ 1,499,001 $ — $ 833,646 $ 4,500,000 $ — $ — $ 122,121 $ — $ — $ (450 ) (g) Non-income producing at February 28, 2017. (h) Includes securities issued by an affiliate of the company. (i) The investment has an unfunded commitment as of February 28, 2017 (see Note 8 to the consolidated financial statements). (j) The entire commitment was unfunded at February 28, 2017. As such, no interest is being earned on this investment. (k) Included within cash and cash equivalents and cash and cash equivalents, reserve accounts in the Company’s Consolidated Statements of Assets and Liabilities as of February 28, 2017. (a) All of our equity and debt investments are issued by eligible portfolio companies, as defined in the Investment Company Act of 1940, except Saratoga Investment Corp. CLO 2013-1, Ltd.(b) Percentages are based on net assets of $114,924,018 as of February 28, 2014.(c) Because there is no readily available market value for these investments, the fair value of these investments is approved in good faith by our board of directors. (see Note 3 to the consolidated financial statements).(d) These securities are pledged as collateral under a senior secured revolving credit facility (see Note 6 to the consolidated financial statements).(e) 15.16% represents the modeled effective interest rate that is expected to be earned over the life of the investment.(f) As defined in the Investment Company Act, we “Control” this portfolio company because we own more than 25% of the portfolio company’s outstanding voting securities. Transactions during the period in which the issuer was both an Affiliate and a portfolio company that we Control are as follows:(g) Non-income producing at February 28, 2014.Saratoga Investment Corp.February 28, 2013
/ Maturity Principal/
Number of Shares Cost Fair
Value (c) % of
Net Assets Automotive Aftermarket Common Stock 1,116 $ 1,000,000 $ 1,695,303 1.4 % Automotive Aftermarket First Lien Term Loan 15.50% Cash, 9/13/2018 $ 6,776,770 6,776,770 6,776,770 5.4 % Automotive Aftermarket Common Stock 7,128 480,535 6,235,209 5.0 % Total Automotive Aftermarket 8,257,305 14,707,282 11.8 % Building Products Common Stock Voting A-1 2,535 220,900 2,676,909 2.1 % Building Products Common Stock Voting B-1 1,600 139,424 1,689,568 1.3 %
Ltd. (a), (d), (i) Building Products First Lien Term Loan (L+9.00%), 10.00% Cash, 9/30/2016 $ 2,000,000 2,000,000 2,000,000 1.6 % Total Building Products 2,360,324 6,366,477 5.0 % Business Services Common Stock 100,000 100,000 169,850 0.1 % Business Services First Lien Term Loan (L+8.25%), 9.75% Cash, 1/8/2019 $ 2,406,342 2,376,045 2,382,844 1.9 % Business Services Delayed Draw Term Loan A (L+8.25%), 9.75% Cash, 1/8/2019 $ — — — 0.0 % Business Services Syndicated Loan (L+4.00%), 5.00% Cash, 9/10/2020 $ 5,671,667 5,633,920 4,520,318 3.6 % Business Services Second Lien Term Loan (L+10.00%), 11.00% Cash, 6/1/2021 $ 15,000,000 14,856,720 14,850,000 11.9 %
International (d) Business Services Senior Secured Note 12.50% Cash, 1/1/2018 $ 12,000,000 12,025,101 10,950,000 8.8 % Business Services First Lien Term Loan (L+8.75%), 9.50% Cash, 1/15/2020 $ 14,000,000 13,873,485 13,806,098 11.0 % Business Services Senior Secured Note (L+8.50%), 10.00% Cash, 1/23/2020 $ 8,400,000 8,305,033 8,568,000 6.8 % Business Services Warrant Membership Interests Expires 12/28/2022 49,318 400,000 577,020 0.5 % Business Services Second Lien Term Loan (L+11.50%), 13.50% (11.50% Cash/1.00% PIK), 8/28/2021 $ 13,000,000 12,870,023 12,870,000 10.3 % Business Services Second Lien Term Loan (L+9.00%), 10.25% Cash, 5/21/2020 $ 7,500,000 7,440,729 7,500,000 6.0 % Business Services First Lien Term Loan (L+5.25%), 6.25% Cash, 10/8/2021 $ 5,000,000 4,904,573 4,895,000 3.9 % Business Services Second Lien Term Loan (L+9.50%), 10.50% Cash, 10/8/2022 $ 3,000,000 2,912,784 2,910,000 2.3 % Business Services Common Stock Class A Units 232,616 232,616 427,409 0.3 % Business Services First Lien Term Loan (L+9.25%), 10.25% Cash, 12/18/2020 $ 6,900,000 6,842,573 6,900,000 5.5 % Business Services Delayed Draw Term Loan 10.25% Cash, 12/18/2020 $ — — — 0.0 % Business Services First Lien Term Loan 8.00% Cash, 11/29/2017 $ 5,259,171 5,224,422 5,259,171 4.2 % $ 9,035,515 8,952,442 9,035,515 7.2 % Business Services Warrants to Purchase Limited Liability Company Interests, Expires 5/31/2025 343 — 354,819 0.3 % Total Business Services 106,950,466 105,976,044 84.6 % Consumer Products First Lien Term Loan 9.50% Cash, 7/17/2020 $ 6,800,000 6,733,661 6,800,000 5.4 % Consumer Products Common Stock 210,456 1,791,242 — 0.0 % Consumer Products Second Lien Term Loan A-2 15.00% PIK, 12/31/2019 $ 210,456 210,456 210,456 0.2 % Consumer Products Second Lien Term Loan B 15.00% PIK, 12/31/2019 $ 631,369 631,369 631,369 0.5 % Total Consumer Products 9,366,728 7,641,825 6.1 % Consumer Services Common Stock 1,000,000 1,000,000 1,647,767 1.3 % Consumer Services First Lien Term Loan 10.00% Cash, 10/10/2019 $ 11,475,490 11,401,380 11,647,623 9.3 % Consumer Services Second Lien Term Loan (L+11.00%), 12.00% Cash, 7/9/2019 $ 7,500,000 7,500,000 7,450,500 6.0 % Consumer Services First Lien Term Loan (L+5.25%), 6.50% Cash, 7/1/2019 $ 1,572,921 1,562,787 1,556,248 1.2 % Consumer Services Second Lien Term Loan (L+9.00%), 10.25% Cash, 7/1/2020 $ 10,000,000 9,962,104 9,827,000 7.9 % Consumer Services Second Lien Term Loan (L+8.75%), 9.75% Cash, 7/1/2022 $ 12,000,000 11,829,030 10,980,000 8.8 % Total Consumer Services 43,255,301 43,109,138 34.5 % Education Class A Common Stock 544,761 30,241 — 0.0 % Education First Lien Term Loan 1.00% Cash, 3/31/2016 $ 2,321,073 1,193,790 8,087 0.0 % Education Common Stock 750 750,000 785,475 0.6 % Education Second Lien Term Loan (L+9.75%), 10.75% Cash, 6/2/2021 $ 10,000,000 9,902,816 9,900,000 7.9 % Total Education 11,876,847 10,693,562 8.5 %
Number of Shares
Net
Assets
Number of Shares
Net
Assets
Number of Shares
Net
Assets(a)All of our equity and debt investments are issued by eligible portfolio companies, as defined in the Investment Company Act of 1940, except GSC Investment Corp. CLO 2007 Ltd. and GSC Partners CDO GP III, LP.(b)Percentages are based on net assets of $108,686,761 as of February 28, 2013.(c)Because there is no readily available market value for these investments, the fair value of these investments is approved in good faith by our board of directors. (see Note 3 to the consolidated financial statements).(d)These securities are pledged as collateral under a senior secured revolving credit facility (see Note 6 to the consolidated financial statements).(e)23.06% represents the modeled effective interest rate that is expected to be earned over the life of the investment.(f)As defined in the Investment Company Act, we are an “Affiliate” of this portfolio company because we own 5% or more of the portfolio company’s outstanding voting securities. Transactions during the period in which the issuer was an Affiliate are as follows: Food and Beverage First Lien Term Loan (L+8.50%), 9.75% Cash, 7/16/2017 $ 9,622,319 9,527,041 9,131,048 7.3 % Total Food and Beverage 9,527,041 9,131,048 7.3 % Healthcare Services Senior Secured Note 11.00% (10.00% Cash/1.00% PIK), 11/29/2018 $ 5,404,747 5,339,820 5,404,747 4.3 % Healthcare Services First Lien Term Loan B (L+10.00%), 11.00% Cash, 7/24/2019 $ 11,550,000 11,377,810 11,459,418 9.2 % Healthcare Services Limited Partner Interests 999 999,000 810,642 0.7 % Healthcare Services Common Stock 5,000 500,000 334,000 0.3 % Healthcare Services Second Lien Term Loan 11.25% Cash, 9/26/2019 $ 4,200,000 4,141,519 3,822,000 3.0 % Healthcare Services Common Stock 5,000 500,000 500,000 0.4 % Healthcare Services Senior Subordinated Note 12.00%, 7/15/2021 $ 7,300,000 7,228,452 7,227,000 5.8 % Healthcare Services Syndicated Loan (L+7.75%), 10.50% (9.00% Cash/1.50% PIK), 8/16/2019 $ 4,420,900 4,362,266 3,216,647 2.6 % Healthcare Services Syndicated Loan (L+4.25%), 5.25% Cash, 8/16/2020 $ 4,207,821 4,142,093 4,130,692 3.3 % Total Healthcare Services 38,590,960 36,905,146 29.6 % Media First Lien Term Loan 10.00% Cash, 5/16/2019 $ 8,937,982 8,812,479 8,937,983 7.1 % Media First Lien Term Loan 10.00% Cash, 5/16/2019 $ 1,600,000 1,572,821 1,600,000 1.3 % Media Class A Series, Expires 1/16/2025 4,264 61,647 314,683 0.3 % Media Class A Warrant, Expires 1/16/2025 30,320 438,353 1,889,542 1.5 % Media Warrants to Purchase Limited Liability Company Interests (Common), Expires 5/16/2024 57,872 — 3,309,121 2.6 % Media Warrants to Purchase Limited Liability Company Interests, Expires 5/16/2024 8,139 — 523,012 0.4 % Total Media 10,885,300 16,574,341 13.2 % Metals Common Stock 35,000 9,217,564 2,026,150 1.6 % Metals Revolver 10.00% Cash, 3/31/2017 $ 8,500,000 8,500,000 8,500,000 6.8 % Total Metals 17,717,564 10,526,150 8.4 % Real Estate First Lien Term Loan (L+9.25%), 9.75% Cash, 4/24/2020 $ 9,025,000 8,944,211 9,025,000 7.2 % Real Estate Common Stock 413,043 413,043 512,173 0.4 % Total Real Estate 9,357,254 9,537,173 7.6 % 268,145,090 271,168,186 216.6 % Structured Finance Securities Other/Structured Finance Securities 16.14%, 10/17/2023 $ 30,000,000 13,030,751 12,827,980 10.3 % 13,030,751 12,827,980 10.3 % $ 281,175,841 $ 283,996,166 226.9 % Principal Cost Fair Value % of
Net Assets $ 7,034,783 $ 7,034,783 $ 7,034,783 5.6 % $ 7,034,783 $ 7,034,783 $ 7,034,783 5.6 % (b) (c) (d) (e) (f) InterestManagementNet RealizedNet UnrealizedPurchasesRedemptionsSales (cost)Incomefee incomegains/(losses)gains/(losses)GSC Partners CDO GP III, LP$—$—$—$—$—$—$— Act, we “Control” this portfolio company because we own more than 25% of the portfolio company’s outstanding voting securities. Transactions during the period in which the issuer was both an Affiliate and a portfolio company that we Control are as follows: (g)As defined in the Investment Company Act, we “Control” this portfolio company because we own more than 25% of the portfolio company’s outstanding voting securities. Transactions during the period in which the issuer was both an Affiliate and a portfolio company that we Control are as follows: Purchases Redemptions Sales
(Cost) Interest
Income Management
Fee Income Net
Realized
Gains/
(Losses) Net
Unrealized
Depreciation $ — $ — $ — $ 2,665,648 $ 1,494,779 $ — $ (1,280,916 ) (g) Non-income producing at February 29, 2016. (h) Includes securities issued by an affiliate of the company. (i) Non-U.S. company. The principal place of business for Polar Holding Company, Ltd. is Canada. (j) The investment has an unfunded commitment as of February 29, 2016 (see Note 8 to the consolidated financial statements). (k) The entire commitment was unfunded at February 29, 2016. As such, no interest is being earned on this investment. (l) Included within cash and cash equivalents and cash and cash equivalents, reserve accounts in the Company’s Consolidated Statements of Assets and Liabilities as of February 29, 2016. (h)Non-income producing at February 28, 2013.
February 28, 2014
February 28, 2013
February 29, 2012 For the year
ended
February 28,
2017 For the year
ended
February 29,
2016 For the year
ended
February 28,
2015 $ 9,660,810 $ 10,678,332 $ 9,673,850 12,368,115 226,252 3,276,450 (10,641,444 ) 740,974 (1,942,936 ) 11,387,481 11,645,558 11,007,364 (11,057,075 ) (13,045,149 ) (2,156,740 ) (11,057,075 ) (13,045,149 ) (2,156,740 ) 5,147,335 4,665,447 320,189 (3,332,839 ) (356,792 ) — — (357,931 ) — 1,814,496 3,950,724 320,189 2,144,902 2,551,133 9,170,813 125,149,875 122,598,742 113,427,929 $ 127,294,777 $ 125,149,875 $ 122,598,742 $ 21.97 $ 22.06 $ 22.70 5,794,600 5,672,227 5,401,899 $ (27,737,348 ) $ (26,217,902 ) $ (23,905,603 )
February 28, 2014
February 28, 2013
February 29, 2012 For the year
ended
February 28,
2017 For the year
ended
February 29,
2016 For the year
ended
February 28,
2015 $ 11,387,481 $ 11,645,558 $ 11,007,364 (580,268 ) (966,906 ) (1,204,458 ) (582,186 ) (507,180 ) (540,069 ) 2,487,716 913,773 929,773 (12,368,115 ) (226,252 ) (3,276,450 ) 10,641,444 (740,974 ) 1,942,936 121,158,873 68,174,143 73,257,332 (126,934,895 ) (109,191,262 ) (104,872,326 ) (98,531 ) (726,521 ) 102,455 (1,090 ) 1,897 (21,807 ) 70,488 (128,370 ) (34,930 ) 46,959 (300,000 ) — 220,736 (241,985 ) 482,890 (99,719 ) 73,141 10,621 1,212,168 146,603 532,331 (20,957 ) — — 20,000 — — 179,412 (147,727 ) (32,334 ) 6,739,516 (32,222,062 ) (21,716,672 ) 9,000,000 35,260,000 52,300,000 — (20,200,000 ) (13,700,000 ) 74,450,500 13,493,125 — (61,793,125 ) — — (3,225,528 ) (1,096,556 ) (1,972,618 ) (3,332,839 ) (356,792 ) — (6,785,339 ) (7,906,304 ) (1,434,349 ) 8,313,669 19,193,473 35,193,033 15,053,185 (13,028,589 ) 13,476,361 7,034,783 20,063,372 6,587,011 $ 22,087,968 $ 7,034,783 $ 20,063,372 $ 7,642,838 $ 7,396,091 $ 5,912,862 $ 144,247 $ 293,953 $ 625 $ 580,268 $ 966,906 $ 1,204,458 $ 582,186 $ 507,180 $ 540,069 $ 2,487,716 $ 913,773 $ 929,773 $ 5,147,335 $ 4,665,447 $ 320,189 20142017 and Basis of PresentationWeThe Company commenced operations on March 23, 2007 as GSC Investment Corp. and completed ourthe initial public offering (“IPO”) on March 28, 2007. We haveThe Company has elected to be treated as a regulated investment company (“RIC”) under subchapter M of the Internal Revenue Code (the “Code”). We expectThe Company expects to continue to qualify and to elect to be treated, for tax purposes, as a RIC. OurThe Company’s investment objective is to generate current income and, to a lesser extent, capital appreciation from ourits investments.conjunctionconnection with the transaction described in “Note 14. Recapitalization Transaction” below.consummation of a recapitalization transaction.We areThe Company is externally managed and advised by ourthe investment adviser, Saratoga Investment Advisors, LLC (the “Manager”), pursuant to the Management Agreement.a management agreement (the “Management Agreement”). Prior to July 30, 2010, we werethe Company was managed and advised by GSCP (NJ), L.P.., SBIC LP, SIA Avionte, Inc., SIA Easy Ice, LLC, SIA GH, Inc., SIA Mercury, Inc., SIA TT Inc., and SIA Vector Inc. All intercompany accounts and transactions have been eliminated in consolidation. All references made to the “Company,” “we,” and “us” herein include Saratoga Investment Corp. and its consolidated subsidiary,subsidiaries, except as stated otherwise.Note 2. Summary of SignificantPolicies··assets;assets, except as allowed pursuant to Rule 12d1-1 of Section 12(d)(1) of the 1940 Act which is designed to permit “cash sweep” arrangements rather than investments directly in short-term instruments; or·ourthe Company’s $45.0 million senior secured revolving credit facility with Madison Capital Funding LLC. The Company is required to use these amounts to pay interest expense, reduce borrowings, or pay other amounts in accordance with the terms of the senior secured revolving credit facility. February 28,
2017 February 29,
2016 February 28,
2015 $ 9,306,543 $ 2,440,277 $ 1,888,158 12,781,425 4,594,506 18,175,214 $ 22,087,968 $ 7,034,783 $ 20,063,372 Financial Accounting Standards Board (“FASB”) Accounting Standards Codification (“ASC”)FASB ASC Topic 820,Fair Value Measurements and Disclosures (“ASC 820”). ASC 820 defines fair value, establishes a framework for measuring fair value, establishes a fair value hierarchy based on the quality of inputs used to measure fair value and enhances disclosure requirements for fair value measurements. ASC 820 requires the Company to assume that its investments are to be sold at the statement of assets and liabilitiesbalance sheet date in the principal market to independent market participants, or in the absence of a principal market, in the most advantageous market, which may be a hypothetical market. Market participants are defined as buyers and sellers in the principal or most advantageous market that are independent, knowledgeable, and willing and able to transact.We undertakeThe Company undertakes a multi-step valuation process each quarter when valuing investments for which market quotations are not readily available, as described below:·our ManagerSaratoga Investment Advisors and preliminary valuation conclusions are documented and discussed with theour senior management of our Manager;management; and·approximately one quartera selection of these preliminary valuations each quarter so that the valuation of each investment for which market quotes are not readily available is reviewed by the independent valuation firm at least annually.once each fiscal year.··OurThe Company’s investment in Saratoga Investment Corp. CLO 2013-1, Ltd. (“Saratoga CLO”) is carried at fair value, which is based on a discounted cash flow model that utilizes prepayment, re-investment and loss assumptions based on historical experience and projected performance, economic factors, the characteristics of the underlying cash flow, and comparable yields for equityraterates and prepayment rates in order to arrive at estimated valuations. The assumptions are based on available market data and projections provided by third parties as well as management estimates. We useThe Company uses the output from the Intex models (i.e., the estimated cash flows) to perform a discounted cash flowsflow analysis on expected future cash flows to determine a valuation for our investment in Saratoga CLO.OurThe Company’s net asset value could be materially affected if the determinations regarding the fair value of our investments were materially higher or lower than the values that we ultimately realize upon the disposal of such investments.We accountThe Company accounts for derivative financial instruments in accordance with ASC Topic 815,Derivatives and Hedging (“ASC 815”). ASC 815 requires recognizing all derivative instruments as either assets or liabilities on the consolidated statements of assets and liabilities at fair value. The Company values derivative contracts at the closing fair value provided by the counterparty. Changes in the values of derivative contracts are included in the consolidated statements of operations.amortizationsamortization of premiumpremiums on investments.Paid-in-KindOther income includes dividends received, origination fees, structuring fees and advisory fees, and is recorded in the consolidated statements of operations when earned.theirthe respective facilities.facility and debt securities. Financing costs incurred in connection with our SBA debentures are deferred and amortized using the effective yield method over the life of the debentures. its business, the Company may enter into contracts or agreements that contain indemnifications or warranties. Future events could occur that lead to the execution of these provisions against the Company. Based on its history and experience, management feels that the likelihood of such an event is remote. Subchapter M of the Code and, among other things, intends to make the requisite distributions to its stockholders which will relieve the Company from federal income taxes. Therefore, no provision has been recorded for federal income taxes.inon the consolidated statements of operations. During the fiscal year ended February 28, 2014,2017, the Company did not incur any interest or penalties. Although we file federal and state tax returns, our major tax jurisdiction is federal. The 2011, 20122014, 2015 and 20132016 federal tax years for the Company remain subject to examination by the IRS. As of February 28, 2017 and February 29, 2016, there were no uncertain tax positions. The Company is not aware of any tax positions for which it is reasonably possible that the total amounts of unrecognized tax benefits will change significantly in the next 12 months.ourthe DRIP by the dividend reinvestment planrecord date will have their cash dividends automatically reinvested ininto additional shares of our common stock, rather than receiving the cash dividends. If ourWe have the option to satisfy the share requirements of the DRIP through the issuance of new shares of common stock is trading below net asset value at the timeor through open market purchases of valuation, the plan administrator may receive the dividend or distribution in cash and purchase common stock inby the open market, on the New York Stock Exchange or elsewhere, for the account of each participant in our dividend reinvestment plan.DRIP plan administrator.gainsgain on its investments exceed all net realized and unrealized capital losses on its investments given the fact that a capital gains incentive fee would be owed to the investment adviser if the Company were to liquidate its investment portfolio at such time. The actual incentive fee payable to the Company’s investment adviser related to capital gains will be determined and payable in arrears at the end of each fiscal year and will include only realized capital gains net of realized and unrealized losses for the period.June 2013,August 2016, the FASB issued ASU 2013-08, “Financial Services — Investment Companies2016-15, Statement of Cash Flows (Topic 946): Amendments230),Classification of Certain Cash Receipts and Cash Payments (“ASU 2016-15”), which is intended to reduce the Scope, Measurement,existing diversity in practice in how certain cash receipts and Disclosure Requirements,” which amendscash payments are presented and classified in the criteria that define an investment companystatement of cash flows. The guidance is effective for annual periods beginning after December 15, 2017, and clarifiesinterim periods therein. Early adoption is permitted. Management is currently evaluating the measurement guidance and requires new disclosures for investment companies. Underimpact ASU 2013-08, an entity already regulated under the 1940 Act2016-15 will be automatically deemed an investment company under the new GAAP definition. As such, the Company anticipates no impact from adopting this standardhave on the Company’s consolidated financial results.statements and disclosures.Company is currently assessing the additionaldisclosure requirements. ASU 2013-08lease cost will be allocated over the lease term on a straight-line basis. This guidance is effective for annual and interim and annual reporting periods in fiscal years that beginbeginning after December 15, 2013.2018. Management is currently evaluating the impact these changes will have on the Company’s consolidated financial statements and disclosures.···Company’s valuation policy, we evaluate the source of inputs, including any markets in which our investments are trading, in determining fair value.20142017 (dollars in thousands), according to the fair value hierarchy: Fair Value Measurements Level 1 Level 2 Level 3 Total $ — $ — $ 9,823 $ 9,823 — — 159,097 159,097 — — 87,750 87,750 — — 15,450 15,450 — — 20,541 20,541 $ — $ — $ 292,661 $ 292,661 28, 201329, 2016 (dollars in thousands), according to the fair value hierarchy: Fair Value Measurements Level 1 Level 2 Level 3 Total $ — $ — $ 11,868 $ 11,868 — — 144,643 144,643 — — 88,178 88,178 — — 12,828 12,828 — — 26,479 26,479 $ — $ — $ 283,996 $ 283,996 20142017 (dollars in thousands):
market
loans
term loans
lien
term loans
secured
notes
notes
finance
securities
stock/equities Syndicated
loans First lien
term loans Second
lien
term loans Structured
finance
securities Common
stock/
equities Total $ 11,868 $ 144,643 $ 88,178 $ 12,828 $ 26,479 $ 283,996 2,425 264 (1,597 ) 833 (12,566 ) (10,641 ) 62 93,069 20,996 4,501 9,469 128,097 (4,585 ) (78,805 ) (20,501 ) (2,712 ) (14,556 ) (121,159 ) 53 364 236 — 11,715 12,368 — — 438 — — 438 — (438 ) — — — (438 ) $ 9,823 $ 159,097 $ 87,750 $ 15,450 $ 20,541 $ 292,661 $ 1,279 $ (427 ) $ (2,387 ) $ 833 $ (1,462 ) $ (2,164 ) redemptionsrepayments represent net proceeds received from investments sold, and principal paydowns received, during the period.year.TableTransfers and restructurings, if any, are recognized at the beginning of ContentsThe net changethe year in unrealized gain/(loss) on investments held as ofwhich they occur. During the year ended February 28, 2014 is $(1,767,285) and is included in net unrealized appreciation (depreciation) on investments in the consolidated statements2017, $0.4 million of operations.Elyria Foundry Company, L.L.C. first lien term loan was restructured into a second lien term loan.28, 201329, 2016 (dollars in thousands):
term loans
term loans
secured
notes
unsecured
loans
notes
finance
securities
stock/equities Syndicated
loans First lien
term loans Second
lien
term loans Unsecured
notes Structured
finance
securities Common
stock/
equities Total $ 18,302 $ 145,207 $ 35,603 $ 4,230 $ 17,031 $ 20,165 $ 240,538 (1,914 ) (1,850 ) (1,163 ) 3,136 (1,281 ) 3,813 741 56 35,854 72,422 670 — 1,663 110,665 (4,607 ) (31,280 ) (19,502 ) (5,917 ) (2,922 ) (3,946 ) (68,174 ) 31 (865 ) 187 (2,220 ) — 3,093 226 — — 631 101 — 1,691 2,423 — (2,423 ) — — — — (2,423 ) $ 11,868 $ 144,643 $ 88,178 $ — $ 12,828 $ 26,479 $ 283,996 $ (1,948 ) $ (2,139 ) $ (1,282 ) $ (206 ) $ (1,281 ) $ 4,057 $ (2,799 ) redemptionsrepayments represent net proceeds received from investments sold, and principal paydowns received, during the period.The net changeTransfers and restructurings, if any, are recognized at the beginning of the year in unrealized gain/loss on investments held as of February 28, 2013 is $7,143,012 and is included in net unrealized appreciation (depreciation) on investments in the consolidated statements of operations.20142017 were as follows (dollars in thousands): Fair Value Valuation Technique Unobservable Input Range $ 9,823 Market Comparables Third-Party Bid (%) 100.5% - 101.1% 159,097 Market Comparables Market Yield (%) 6.3% - 39.0% EBITDA Multiples (x) 3.0x - 10.3x Third-Party Bid (%) 100.0% - 100.2% 87,750 Market Comparables Market Yield (%) 10.1% - 26.4% Third-Party Bid (%) 97.6% - 99.9% 15,450 Discounted Cash Flow Discount Rate (%) 8.5% - 13.0% 20,541 Market Comparables EBITDA Multiples (x) 3.7x - 12.0x 28, 201329, 2016 were as follows (dollars in thousands): Fair Value Valuation Technique Unobservable Input Range $ 11,868 Market Comparables Third-Party Bid (%) 72.5% - 98.2% 144,643 Market Comparables Market Yield (%) 6.8% - 15.5% EBITDA Multiples (x) 1.0x Revenue Multiples (x) 91.3% - 98.9% Fair Value Valuation Technique Unobservable Input Range 88,178 Market Comparables Market Yield (%) 0.0% - 15.0% Third-Party Bid (%) 91.5% - 98.6% 12,828 Discounted Cash Flow Discount Rate (%) 20.0% 26,479 Market Comparables EBITDA Multiples (x) 6.8x - 16.4x 2014,2017, at amortized cost and fair value were as follows (dollars in thousands):
Amortized Cost
Percentage of
Total Portfolio
Fair Value
Percentage of
Total Portfolio Investments at
Amortized Cost Amortized Cost
Percentage of
Total Portfolio Investments at
Fair Value Fair Value
Percentage of
Total Portfolio $ 9,669 3.2 % $ 9,823 3.4 % 160,436 53.4 159,097 54.3 90,655 30.2 87,750 30.0 14,819 4.9 15,450 5.3 24,903 8.3 20,541 7.0 $ 300,482 100.0 % $ 292,661 100.0 % 28, 2013,29, 2016, at amortized cost and fair value werewas as follows (dollars in thousands):
Amortized Cost
Percentage of
Total Portfolio
Fair Value
Percentage of
Total Portfolio Investments at
Amortized Cost Amortized Cost
Percentage of
Total Portfolio Investments at
Fair Value Fair Value
Percentage of
Total Portfolio $ 14,138 5.0 % $ 11,868 4.2 % 146,246 52.0 144,643 50.9 89,486 31.9 88,178 31.1 13,031 4.6 12,828 4.5 18,275 6.5 26,479 9.3 $ 281,176 100.0 % $ 283,996 100.0 % Investment Corp. CLO 2013-1, Ltd. (“Saratoga CLO”) is carried at fair value, which is based on a discounted cash flow model that utilizes prepayment, re-investment and loss assumptions based on historical experience and projected performance, economic factors, the characteristics of the underlying cash flow, and comparable yields for equity interests in collateralized loan obligation funds similar to Saratoga CLO, when available, as determined by our Manager and recommended to our board of directors. Specifically, we use Intex cash flow models, or an appropriate substitute, to form the basis for the valuation of our investment in Saratoga CLO. The models use a set of assumptions including projected default rates, recovery rates, reinvestment rate and prepayment rates in order to arrive at estimated valuations. The assumptions are based on available market data and projections provided by third parties as well as management estimates. For the quarter ended November 30, 2013,February 28, 2017, in connection with the refinancing of the Saratoga CLO liabilities, we ran Intex models based on assumptions about the refinanced Saratoga CLO’s structure, including capital structure, cost of liabilities and reinvestment period. We use the output from the Intex models (i.e., the estimated cash flows) to perform a discounted cash flowsflow analysis on expected future cash flows to determine a valuation for our investment in Saratoga CLO at February 28, 2014.2017. The significant inputs for the valuation model include:··25.0%20.0%·375bps360bps / $99.75$99.75.wethe Company invested $30$30.0 million in all of the outstanding subordinated notes of GSC Investment Corp. CLO 2007, Ltd., a collateralized loan obligation fund managed by usthe Company that invests primarily in senior secured loans. Additionally, wethe Company entered into a collateral management agreement with GSC Investment Corp. CLO 2007, Ltd. pursuant to which we act as collateral manager to it. The Saratoga CLO was initially refinanced in October 2013 and its reinvestment period endsended in October 2016. On November 15, 2016, the Company completed the second refinancing of the Saratoga CLO. The Saratoga CLO refinancing, among other things, extended its reinvestment period to October 2018, and extended its legal maturity date to October 2025. Following the refinancing, the Saratoga CLO portfolio remained at the same size and with a similar capital structure of approximately $300.0 million in aggregate principal amount of predominantly senior secured first lien term loans. In addition to refinancing its liabilities, we also purchased $4.5 million in aggregate principal amount of the Class F notes tranche of the Saratoga CLO at par, with a coupon of LIBOR plus 8.5%.100%100.0% owned and managed by Saratoga Investment Corp. We receiveFollowing the refinancing, the Company receives a base management fee of 0.25%0.10% and a subordinated management fee of 0.25%0.40% of the Fee Basis Amountfee basis amount at the beginning of the Collection Period,collection period, paid quarterly to the extent of available proceeds. We areThe Company is also entitled to an incentive management fee equal to 20.0% of excess cash flow to the remaining interest proceeds and principal proceeds, if any, afterextent the Saratoga CLO subordinated notes have realized the incentive management fee targetreceive an internal rate of return ofpaid in cash equal to or greater than 12.0%, in accordance with the Priority of Payments after making the prior distributions on the relevant payment date.. For the years ended February 28, 2014 and 2013,2017, February 29, 2016 and February 29, 2012,28, 2015, we accrued $1.8$1.5 million, $2.0$1.5 million, and $2.0$1.5 million in management fee income, respectively, and $3.4$1.9 million, $4.2$2.7 million, and $4.2$2.7 million in interest income, respectively, from Saratoga CLO. We did not accrue any amounts related to the incentive management fee from Saratoga CLO as the 12.0% hurdle rate has not yet been achieved.2014,2017, the Company determined that the fair value of its investment in the subordinated notes of Saratoga CLO was $19.6$11.0 million. The Company determines the fair value of its investment in the subordinated notes of Saratoga CLO based on the present value of the projected future cash flows of the subordinated notes over the life of Saratoga CLO. At February 28, 2014,2017, Saratoga CLO had investments with a principal balance of $301.3$297.1 million and a weighted average spread over LIBOR of 4.1%, and had debt with a principal balance of $284.1$282.4 million with a weighted average spread over LIBOR of 2.4%. As a result, Saratoga CLO earns a “spread” between the interest income it receives on its investments and the interest expense it pays on its debt and other operating expenses, which is distributed quarterly to the Company as the holder of its subordinated notes. At February 28, 2017, the present value of the projected future cash flows of the subordinated notes, was approximately $11.1 million, using a 13.0% discount rate. Saratoga Investment Corp. invested $32.8 million into the CLO since January 2008, and to date has since received distributions of $49.4 million and management fees of $16.5 million.28, 2014,29, 2016, the total “spread”, or projected future cash flows of the subordinated notes, over the life of Saratoga CLO was $24.9$13.1 million, which had a present value of approximately $20.2$12.8 million, using a 9.0%20.0% discount rate.At February 28, 2013, the Company determined that the fair value of its investment in the subordinated notes of Saratoga CLO was $25.5 million, whereas the net asset value of Saratoga CLO on such date was $30.8 million. The Company does not believe that the net asset value of Saratoga CLO, which is the difference between Saratoga CLO’s assets and liabilities at a given point in time, necessarily equates to the fair value of its investment in the subordinated notes of Saratoga CLO. Specifically, the Company determines the fair value of its investment in the subordinated notes of Saratoga CLO based on the present value of the projected future cash flows of the subordinated notes over the life of Saratoga CLO. At February 28, 2013, Saratoga CLO had investments with a principal balance of $383.3 million and a weighted average spread over LIBOR of 4.3%, and had debt with a principal balance of $366.0 million with a weighted average spread over LIBOR of 1.4%. As a result, Saratoga CLO earns a “spread” between the interest income it receives on its investments and the interest expense it pays on its debt and other operating expenses, which is distributed quarterly to the Company as the holder of its subordinated notes. At February 28, 2013, the total “spread”, or projected future cash flows of the subordinated notes, over the life of Saratoga CLO was $38.7 million, which had a present value of approximately $26.0 million, using a 13.0% discount rate. At February 28, 2013, the fair value of the subordinated notes, which we base upon the present value of the projected cash flows, was $25.5 million, which was less than the net asset value of Saratoga CLO on such date by approximately $5.3 million.20142017 and 2013,February 29, 2016, pursuant to Rule 3-09 of SEC rules Regulation S-X, and for the twelve monthsyears ended February 28, 2014 and 20132017, February 29, 2016 and February 29, 2012,28, 2015, are presented on page S-1.Internal Revenue ServiceIRS to treat the Saratoga CLO as a disregarded entity. As such, for federal income tax purposes and for purposes of meeting the RIC qualification and diversification tests, the results of operations of the Saratoga CLO are included with those of the Company.20142017 and February 28, 2013,29, 2016, the Company reclassified for book purposes amounts arising from permanent book/tax differences primarily related to nondeductible excise tax, meals & entertainment, market discount, and interest income with respect to the Saratoga CLO which is consolidated for tax purposes and the tax character of distributions as follows (dollars in thousands):
2014
2013 February 28,
2017 February 29,
2016 $ (123 ) $ 55 168 59 (45 ) (114 ) 20142017, February 29, 2016 and February 28, 20132015 was as follows (dollars in thousands):
2014
2013 February 28,
2017 February 29,
2016 February 28,
2015 $ 11,057 $ 13,045 $ 2,157 — — — — — — $ 11,057 $ 13,045 $ 2,157 2014,2017, the aggregate net unrealized depreciation for all securities is $0.04$12.4 million. The aggregate cost of securities for federal income tax purposes is $486.8$586.6 million.28, 2013,29, 2016, the aggregate net unrealized depreciation for all securities is $2.7$15.4 million. The aggregate cost of securities for federal income tax purposes is $506.7$571.4 million.20142017 and February 28, 2013,29, 2016, the components of accumulated losses on a tax basis as detailed below differ from the amounts reflected per the Company’s consolidated statements of assets and liabilities by temporary book/tax differences primarily arising from the consolidation of the Saratoga CLO for tax purposes, market discount and original issue discount income, interest income accrual on defaulted bonds, write-off of investments, and amortization of organizational expenditures (dollars in thousands):.
2014
2013 February 28,
2017 February 29,
2016 $ — $ — (46,338 ) (58,929 ) (56 ) (1,941 ) 1,472 8,103 (12,372 ) (15,428 ) $ (57,294 ) $ (68,195 ) hashad incurred capital losses of $19.3 $14.1million and $3.2$13.0 million, respectively, for the years ended February 28, 2011 2010 and 2009.2010. Such capital losses will be available to offset future capital gains if any and if unused, will expire on February 28, 2019 2018 and 2017.2014,2017, the Company had a short termshort-term capital loss of $11.2$10.7 million and a long-term capital loss of $16.3$3.3 million, available to offset future capital gains. Post RIC-modernization act losses are deemed to arise on the first day of the fund’s following fiscal year and there is no expiration for these losses. 2010-2014)2014-2017), and has concluded that no provision for uncertain income tax positions is required in the Company’s consolidated financial statements.and-Relatedand Related Party Transactionsiswas two years, with automatic, one-year renewals at the end of each year, subject to certain approvals by our board of directors and/or ourthe Company’s stockholders. On July 15, 2013,7, 2016, our board of directors approved the renewal of the Management Agreement for an additional one-year term. Pursuant to the Management Agreement, our Manager implements our business strategy on a day-to-day basis and performs certain services for us, subject to oversight by our board of directors. Our Manager is responsible for, among other duties, determining investment criteria, sourcing, analyzing and executing investments transactions, asset sales, financings and performing asset management duties. Under the Management Agreement, we have agreed to pay our Manager a management fee for investment advisory and management services consisting of a base management fee and an incentive fee.quarters, and appropriately adjusted for any share issuances or repurchases during the applicable fiscal quarter.(7.5% annualized) hurdle rate measured as of the end of each fiscal quarter, subject to a“catch-up” “catch-up” provision. Under this provision, in any fiscal quarter, our Manager receives no incentive fee unless our pre-incentive fee net investment income exceeds the hurdle rate of 1.875%. Our Manager will receive 100.0% of pre-incentive fee net investment income, if any, that exceeds the hurdle rate but is less than or equal to 2.344% in any fiscal quarter (9.376% annualized);quarter; and 20.0% of the amount of the our pre-incentive fee net investment income, if any, that exceeds 2.344% in any fiscal quarter. There is no accumulation of amounts on the hurdle rate from quarter (9.376% annualized).2014,2017, February 29, 2016 and February 28, 2013, and February 29, 2012, we2015, the Company incurred $3.3$4.9 million, $2.1$4.5 million and $1.6$4.2 million in base management fees, respectively. For the years ended February 28, 2014,2017, February 29, 2016 and February 28, 2013, and February 29, 2012, we2015, the Company incurred $0.7$2.8 million, $1.0$2.3 million and $0.5$2.2 million in incentive fees related to pre-incentive fee net investment income. For the year ended February 28, 2014, there was a reduction of $0.32017, we accrued $0.1 million in incentive fees related to capital gains. For the yearsyear ended February 28, 2013 and February 29, 2012, we accrued $1.0 million and $0.72016, there was a reduction of $0.05 million in incentive management fees related to capital gains, respectively.gains. For the year ended February 28, 2015, we accrued $0.3 million in incentive fees related to capital gains. The accrual is calculated using both realized and unrealized capital gains for the period. The actual incentive fee related to capital gains will be determined and payable in arrears at the end of the fiscal year and will include only realized capital gains for the period. As of February 28, 2014,2017, the base management fees accrual was $0.9$1.2 million and the incentive fees accrual was $3.0$4.6 million and is included in base management and incentive fees As of February 28, 2013, the base management fees accrual was $0.6 million and incentive fees accrual was $3.9 million and is included in management and incentive fees payable in the accompanying consolidated statements of assets and liabilities.iswas two years, with automatic, one-year renewals at the end of each year subject to certain approvals by our board of directors and/or our stockholders. The amount of expenses payable or reimbursable thereunder by the Company iswas capped at $1.0 million for the initial two year term of the administration agreement.Administration Agreement and subsequent renewals. On July 15, 2013,8, 2015, our board of directors approved the renewal of the Administration Agreement for an additional one-year term and determined to maintainincrease the cap on the payment or reimbursement of expenses by the Company thereunder, which had not been increased since the inception of the agreement, to $1.0 million$1.3 million. On July 7, 2016, our board of directors approved the renewal of the Administration Agreement for thean additional one-year term.2014,2017, February 29, 2016 and February 28, 2013, and February 29, 2012,2015, we recognized $1.0$1.4 million, $1.0$1.2 million and $1.0 million, in administrator expenses, for the periods, respectively, pertaining to bookkeeping, record keeping and other administrative services provided to us in addition to our allocable portion of rent and other overhead related expenses. As of February 28, 2014,2017, $0.4 million of administrator expenses were accrued and included in due to manager in the accompanying consolidated statements of assets and liabilities. As of February 28, 2013,29, 2016, $0.2 million of administrator expenses were accrued and included in due to manager in the accompanying consolidated statements of assets and liabilities. For the years ended February 28, 2014 and 2013,2017, February 29, 2016 and February 29, 2012,28, 2015, the Company neither bought nor sold any investments fair valued at $0.3 million, $0.0 million and $15.6 million, respectively, from the Saratoga CLO and sold no investments to related parties.CLO.waswere used to repay outstanding borrowings. A significant percentage of our total assets had been pledged under the Revolving Facility to secure our obligations thereunder. Under the Revolving Facility, funds were borrowed from or through certain lenders and interest was payable monthly at the greater of the commercial paper rate and our lender’s prime rate plus 4.00% plus a default rate of 2.00% or, if the commercial paper market was unavailable, the greater of the prevailing LIBOR rates and our lender’s prime rate plus 6.00% plus a default rate of 3.00%. described in “Note 14. Recapitalization Transaction” below, to pay the full amount of principal and accrued interest, including default interest, outstanding under the Revolving Facility. As a result, the Revolving Facility was terminated in connection therewith. Substantially all of our total assets, other than those held by SBIC LP, have been pledged under the Credit Facility to secure our obligations thereunder.·credit facilityCredit Facility from $40.0 million to $45.0 million;·credit facilityCredit Facility from July 30, 2013 to February 24, 2015 (the “Revolving Period”). The Revolving Period may, upon the occurrence of an event of default, by action of the lenders or automatically.automatically, be terminated. All borrowings and other amounts payable under the credit facilityCredit Facility are due and payable five years after the end of the Revolving Period; and·2014,2017 and February 29, 2016, there waswere no outstanding balanceborrowings under the Credit Facility and the Company was in compliance with all of the limitations and requirements of the Credit Facility. $2.3Financing costs of $2.7 million of financing costs related to the Credit Facility have been capitalized and are being amortized over the term of the facility. For the years ended February 28, 2014,2017, February 29, 2016 and February 28, 2013 and February 29, 2012,2015, we recorded $1.0$0.4 million, $2.0$0.7 million and $0.6$0.9 million of interest expense, respectively. For the years ended February 28, 2014,2017, February 29, 2016 and February 28, 2013 and February 29, 2012,2015, we recorded $0.4$0.1 million, $0.4$0.1 million and $0.7$0.3 million of amortization of deferred financing costs related to the Credit Facility and Revolving Facility, respectively. During the year ended February 28, 2017, there were no outstanding borrowings under the Credit Facility. The interest ratesrate during the yearsyear endedFebruary 28, 2014, February 28, 2013 and February 29, 20122016 on the outstanding borrowings under the Credit Facility ranged from 7.50% to 7.50%, 7.50% to 7.50%, and 7.50% to 7.50%, respectively.$44.6$24.7 million subject to the Credit Facility cap of $45.0 million at February 28, 2014.2017. For purposes of determining the borrowing base, most assets are assigned the values set forth in our most recent Annual Report on Form 10-K or Quarterly Report on Form 10-Q filed with the SEC.Securities and Exchange Commission (“SEC”). Accordingly, the February 28, 20142017 borrowing base relies upon the valuations set forth in the AnnualQuarterly Report on Form 10-K10-Q for the yearperiod ended February 28, 2013.November 30, 2016, as filed with the SEC on January 11, 2017. The valuations presented in this Annual Report on Form 10-K will not be incorporated into the borrowing base until after this Annual Report on Form 10-K is filed with the SEC.2014,2017, we have funded SBIC LP with $32.0$75.0 million of equity capital, and have $50.0$112.7 million of SBA-guaranteed debentures outstanding. SBA debentures are non-recourse to us, have a 10-year maturity, and may be prepaid at any time without penalty. The interest rate of SBA debentures is fixed at the time of issuance, often referred to as pooling, at a market-driven spread over 10-year U.S. Treasury Notes. SBA current regulations limit the amount that SBIC LP may borrow to a maximum of $150.0 million, which is up to twice its potential regulatory capital.$18.0$19.5 million and have average annual fully taxed net income not exceeding $6.0$6.5 million for the two most recent fiscal years. In addition, an SBIC must devote 25.0% of its investment activity to ‘‘smaller’’ concerns as defined by the SBA. A smaller concern is one that has a tangible net worth not exceeding $6.0 million and has average annual fully taxed net income not exceeding $2.0 million for the two most recent fiscal years. SBA regulations also provide alternative size standard criteria to determine eligibility, which depend on the industry in which the business is engaged and are based on such factors as the number of employees and gross sales. According to SBA regulations, SBICs may make long-term loans to small businesses, invest in the equity securities of such businesses and provide them with consulting and advisory services.SBA guaranteedSBA-guaranteed debenture funding, which is dependent upon SBIC LP continuing to be in compliance with SBA regulations and policies. The SBA, as a creditor, will have a superior claim to SBIC LP’s assets over our stockholders and debtholders in the event we liquidate SBIC LP or the SBA exercises its remedies under the SBA-guaranteed debentures issued by SBIC LP upon an event of default.Securities and Exchange CommissionSEC to permit it to exclude the debt of SBIC LP guaranteed by the SBA from the definition of senior securities in the 200.0% asset20142017 and February 28, 2013,29, 2016, there was $50.0$112.7 million and $36.0$103.7 million outstanding of SBA debentures, respectively. The carrying amount of the amount outstanding of SBA debentures approximates its fair value. $1.7value, which is based on a waterfall analysis showing adequate collateral coverage, $4.1 million, of financing costs related to the SBA debentures, have been capitalized and are being amortized over the term of the commitment and drawdown. For the years ended February 28, 20142017, February 29, 2016 and February 28, 2013,2015, we recorded $1.3$3.4 million, $2.6 million and $0.1$2.0 million of interest expense related to the SBA debentures.debentures, respectively. For the years ended February 28, 20142017, February 29, 2016 and February 28, 2013,2015, we recorded $0.2$0.5 million, $0.4 million and $0.1$0.3 million of amortization of deferred financing costs related to the SBA debentures, respectively. The weighted average interest rate during the years ended February 28, 20142017, February 29, 2016 and February 28, 20132015 on the outstanding borrowings of the SBA debentures was 3.03%3.13%, 3.12% and 1.42%2.93%, respectively. There were no outstandingDuring the years ended February 28, 2017 and February 29, 2016, the average dollar amount of SBA debentures outstanding was $107.6 million and $83.0 million, respectively.February 29, 2012.least $75.0 million in regulatory capital. Affiliated SBICs are permitted to issue up to a combined maximum amount of $350.0 million in SBA-guaranteed debentures when they have at least $175.0 million in combined regulatory capital.“Notes”“2020 Notes”). The 2020 Notes will mature on May 31, 2020, and since May 31, 2016, may be redeemed in whole or in part at any time or from time to time at the Company’s option on or after May 31, 2016.option. Interest will be payable quarterly beginning August 15, 2013.2014,2017, the carrying amount and fair value of the 2023 Notes was $48.3$74.5 million and $48.6$77.1 million, respectively. The fair value of the 2023 Notes, which are publicly traded, is based upon closing market quotes as of the measurement date and would be classified as a levelLevel 1 liability within the fair value hierarchy. As of February 28, 2014, $2.5 million of financing costs related to the Notes have been capitalized and are being amortized over the term of the Notes. For the year ended February 28, 2014,2017, we recorded $2.9$4.0 million of interest expense and $0.3 million of amortization of deferred financing costs related to the 2020 Notes, and $1.0 million of interest expense and $0.1 million of amortization of deferred financing costs related to the 2023 Notes. As of February 29, 2016, the carrying amount and fair value of the 2020 Notes was $61.8 million and $60.2 million, respectively. The fair value of the 2020 Notes, which were publicly traded, is based upon closing market quotes as of the measurement date and would be classified as a Level 1 liability within the fair value hierarchy. As of February 29, 2016, $2.7 million of financing costs related to the 2020 Notes (including underwriting commissions and net of issuance premiums) had been capitalized and were being amortized over the term of the 2020 Notes. For the year ended February 29, 2016, we recorded $4.3 million of interest expense and $0.4 million of amortization of deferred financing costs related to the 2020 Notes. During the years ended February 28, 2017 and February 29, 2016, the average dollar amount of 2020 Notes outstanding was $61.8 million and of $55.9 million, respectively. During the year ended February 28, 2017, the average dollar amount of 2023 Notes outstanding was $74.5 million.2014:2017:
1 Year
Years
Years
5 Years Payment Due by Period Total Less Than
1 Year 1 - 3
Years 3 - 5
Years More Than
5 Years ($ in thousands) $ 187,111 $ — $ — $ — $ 187,111 $12.2$2.0 million and $0.0$2.0 million of unfunded commitments to provide debt financing to its portfolio companies or to fund limited partnership interests as of February 28, 20142017 and 2013,February 29, 2016, respectively. Such commitments are generally up to the Company’s discretion to approve, or the satisfaction of certain financial and nonfinancial covenants and involve, to varying degrees, elements of credit risk in excess of the amount recognized in the Company’s Consolidated Statementconsolidated statements of Assetsassets and Liabilitiesliabilities and are not reflected in the Company’s Consolidated Statementsconsolidated statements of Assetsassets and Liabilities.liabilities. As of February 28,
2017 February 29,
2016 $ — $ 1,000 2,000 — — 1,000 $ 2,000 $ 2,000 2014,2017, February 29, 2016 and February 28, 2013 and February 29, 2012,2015, we accruedincurred $0.2 million, $0.2 million, and $0.2 million for directors’ fees expense,and expenses, respectively. As of February 28, 20142017 and February 28, 2013,29, 2016, $0.05 million and $0.05$0.03 million in directors’ fees expenseand expenses were accrued and unpaid, and included in accounts payable and accrued expenses in the consolidated statements of assets and liabilities.respectively. As of February 28, 2014,2017, we had not issued any common stock to our directors as compensation for their services. See “Note 14. Recapitalization Transaction.” As of December 31, 2016 December 31, 2015 $ 1,058 $ 780 $ 18,245 $ 15,070 $ 3,473 $ 3,482 $ 23,113 $ 18,295 $ (7,283 ) $ (5,927 ) For the years ended December 31,
2016 December 31,
2015 December 31,
2014 $ 14,463 $ 11,984 $ 9,527 $ 8,463 $ 7,238 $ 5,859 $ 6,000 $ 4,746 $ 3,778 $ 5,123 $ 4,235 $ 4,350 $ 877 $ 602 $ (572 ) $ (1,356 ) $ (1,629 ) $ (2,436 ) “Earnings“Earnings per Share”Share” (“ASC 260”), basic earnings per share is computed by dividing earnings available to common shareholders by the weighted average number of shares outstanding during the period. Other potentially dilutive common shares, and the related impact to earnings, are considered when calculating earnings per share on a diluted basis.decreaseincrease in net assets per share from operations for the years ended February 28, 2014,2017, February 29, 2016 and February 28, 2013 and February 29, 20122015 (dollars in thousands except share and per share amounts):
2014
2013
2012 February 28,
2017 February 29,
2016 February 28,
2015 $ 11,387 $ 11,645 $ 11,007 5,740,450 5,582,453 5,385,049 $ 1.98 $ 2.09 $ 2.04 Note 12. DividendOn January 12, 2017, the Company declared a dividend of $0.45 per share, which was paid on February 9, 2017, to common stockholders of record as of January 31, 2017. Shareholders had the option to receive payment of the dividend in cash, or receive shares of common stock, pursuant to our DRIP.payablewhich was paid on December 27, 2013. Shareholders had the option to receive payment of the dividend in cash, shares of common stock, or a combination of cash and shares of common stock, provided that the aggregate cash payable to all shareholders was limited to approximately $2.5 million or $0.53 per share.payablewhich was paid on December 31, 2012. Shareholders had the option to receive payment of the dividend in cash, shares of common stock, or a combination of cash and shares of common stock, provided that the aggregate cash payable to all shareholders was limited to approximately $3.3 million or $0.85 per share.wethe Company declared a dividend of $3.00 per share, payablewhich was paid on December 30, 2011. Shareholders had the option to receive payment of the dividend in cash, shares of common stock, or a combinationwethe Company declared a dividend of $4.40 per share, payablewhich was paid on December 23, 2010. Shareholders had the option to receive payment of the dividend in cash, shares of common stock, or a combination of cash and shares of common stock, provided that the aggregate cash payable to all shareholders was limited to approximately $1.2 million or $0.44 per share.duringfor the years ended February 28, 2014,2017, February 29, 2016, February 28, 2013,2015, February 29, 201228, 2014 and February 28, 20112013 (dollars in thousands except per share amounts):
Per Share*
Amount Record Date Payment Date Amount
Per Share* Total
Amount January 31, 2017 February 9, 2017 $ 0.45 $ 2,585 October 31, 2016 November 9, 2016 0.44 2,509 August 24, 2016 September 5, 2016 0.20 1,151 July 29, 2016 August 9, 2016 0.43 2,466 April 15, 2016 April 27, 2016 0.41 2,346 $ 1.93 $ 11,057
Per Share*
Amount Record Date Payment Date Amount
Per Share* Total
Amount February 1, 2016 February 29, 2016 $ 0.40 $ 2,278 November 2, 2015 November 30, 2015 0.36 2,028 August 3, 2015 August 31, 2015 0.33 1,844 May 26, 2015 June 5, 2015 1.00 5,429 May 4, 2015 May 29, 2015 0.27 1,466 $ 2.36 $ 13,045
Per Share*
Amount Record Date Payment Date Amount
Per Share* Total
Amount October 30, 2014 November 28, 2014 $ 0.18 $ 968 January 29, 2015 February 27, 2015 0.22 1,189 $ 0.40 $ 2,157
Per Share*
Amount Record Date Payment Date Amount
Per Share* Total
Amount November 13, 2013 December 27, 2013 $ 2.65 $ 12,535 $ 2.65 $ 12,535 *Amount per share is calculated based on the number of shares outstanding at the date of declaration. Record Date Payment Date Amount
Per Share* Total
Amount November 20, 2012 December 31, 2012 $ 4.25 $ 16,476 $ 4.25 $ 16,476 * Amount per share is calculated based on the number of shares outstanding at the date of declaration. 13.14. Financial Highlights2014,2017, February 29, 2016, February 28, 2013, February 29, 2012,2015, February 28, 2011,2014 and February 28, 2010:2013: February 28,
2017 February 29,
2016 February 28,
2015 February 28,
2014 February 28,
2013 $ 22.06 $ 22.70 $ 21.08 $ 22.71 $ 24.94 1.68 1.91 1.80 1.80 1.57 0.30 0.18 0.24 (0.07 ) 1.85 1.98 2.09 2.04 1.73 3.42 (1.93 ) (2.36 ) (0.40 ) (2.65 ) (4.25 ) (1.93 ) (2.36 ) (0.40 ) (2.65 ) (4.25 ) (0.14 ) (0.37 ) (0.02 ) (0.71 ) (1.40 ) $ 21.97 $ 22.06 $ 22.70 $ 21.08 $ 22.71 $ 127,294,777 $ 125,149,875 $ 122,598,742 $ 113,427,929 $ 107,437,874 5,794,600 5,672,227 5,401,899 5,379,616 4,730,116 $ 22.74 $ 14.22 $ 15.76 $ 15.85 $ 17.02 80.83 % 4.27 % 1.63 % 9.11 % 36.67 % 12.62 % 11.10 % 10.09 % 8.75 % 16.12 % 7.57 % 8.52 % 8.11 % 7.97 % 6.26 % 7.21 % 6.93 % 6.52 % 6.28 % 5.22 % 2.31 % 1.78 % 2.14 % 0.84 % 2.52 % 7.75 % 6.75 % 6.19 % 5.46 % 2.46 % 18.41 % 15.46 % 14.85 % 12.59 % 10.19 % 43.76 % 26.22 % 31.28 % 37.82 % 17.30 % 2,710 3,025 3,117 3,348 5,421 N/A N/A N/A N/A N/A N/A N/A N/A N/A N/A N/A 25.24 25.46 25.18 N/A 25.89 N/A N/A N/A N/A For 2010, the amount per share has been adjusted to reflect a one-for-ten reverse stock split effectuatedAs described in August 2010.
2014
2013
2012
2011
2010(1)Net investment income per share is calculated using the weighted average shares outstanding during the period. Net investment income excluding expense waiver and reimbursement equals $2.05 and $4.75 per share forprior year financial statements, we identified errors that impacted the years ended February 28, 20112014 and 2010, respectively.February 28, 2013. The corrections for the errors, which we have concluded are immaterial to all prior period consolidated financial statements, are reflected in the selected financial data included in this Form 10-K.(2)Total investment return is calculated assuming a purchase of common shares at the current market value on the first day and a sale at the current market value on the last day of the periods reported. Dividends and distributions, if any, are assumed for purposes of this calculation to be reinvested at prices obtained under the Company’s dividend reinvestment plan. Total investment return does not reflect brokerage commissions. Total investment returns covering less than a full period are not annualized.(1) Per share amounts are calculated using the weighted average shares outstanding during the period. (3)Total investment return is calculated assuming a purchase of common shares at the current net asset value on the first day and a sale at the current net asset value on the last day of the periods reported. Dividends and distributions, if any, are assumed for purposes of this calculation to be reinvested at prices obtained under the Company’s dividend reinvestment plan. Total investment return does not reflect brokerage commissions.(2) Total investment return is calculated assuming a purchase of common shares at the current market value on the first day and a sale at the current market value on the last day of the periods reported. Dividends and distributions, if any, are assumed for purposes of this calculation to be reinvested at prices obtained under the Company’s DRIP. Total investment return does not reflect brokerage commissions. Total investment returns covering less than a full period are not annualized. (3) Total investment return is calculated assuming a purchase of common shares at the current net asset value on the first day and a sale at the current net asset value on the last day of the periods reported. Dividends and distributions, if any, are assumed for purposes of this calculation to be reinvested at prices obtained under the Company’s DRIP. Total investment return does not reflect brokerage commissions. (4)For the year ended February 28, 2011, net of the expense waiver and reimbursement arrangement, the ratio of net investment income, operating expenses, total expenses to average net assets is 6.87%, 11.71%, and 11.68%, respectively. For the year ended February 28, 2010, net of the expense waiver and reimbursement arrangement, the ratio of net investment income, operating expenses, total expenses to average net assets is 9.12%, 8.71% and 15.77%, respectively.(4) Represents the dilutive effect of issuing common stock below net asset value per share during the period in connection with the satisfaction of the Company’s annual RIC distribution requirement. See Note 13, Dividend. (5)Represents the dilutive effect of issuing common stock below net asset value per share during the period in connection with the satisfaction of the Company’s annual RIC distribution requirement. See Note 12, Dividend.(5) Portfolio turnover rate is calculated using the lesser of year-to-date sales or year-to-date purchases over the average of the invested assets at fair value. (6)The ratio for the year ended February 28, 2010 do not include the effect of the waiver of deferred incentive fees which is (3.83)% on a non-annualized basis as this is a one time waiver.(6) Asset coverage ratio per unit is the ratio of the carrying value of our total consolidated assets, less all liabilities and indebtedness not represented by senior securities, to the aggregate amount of senior securities representing indebtedness. Asset coverage ratio per unit is expressed in terms of dollar amounts per $1,000 of indebtedness. Asset coverage ratio per unit does not include unfunded commitments. The inclusion of unfunded commitments in the calculation of the asset coverage ratio per unit would not cause us to be below the required amount of regulatory coverage. (7) The Credit Facility and SBA Debentures are not registered for public trading. (7)February 28, 2010 data has been adjusted to reflect a one-for-ten reverse stock split effectuated in August 2010.(8)Portfolio turnover rate is calculated using the lesser of year-to-date sales or year-to-date purchases over the average of the invested assets at fair value.Note 14. Recapitalization TransactionIn July 2010, we consummated a recapitalization transaction that was necessitated by the fact that we had exceeded permissible borrowing limits under the Revolving Facility in July 2009, which resulted in an event of default under the Revolving Facility. As a result of the event of default under the Revolving Facility, the lender had the right to accelerate repayment of the outstanding indebtedness under the Revolving Facility and to foreclose and liquidate the collateral pledged thereunder. We engaged the investment banking firm of Stifel, Nicolaus & Company to evaluate strategic transaction opportunities and consider alternatives for us in December 2008. On April 14, 2010, we entered into a stock purchase agreement with our Manager and certain of its affiliates and an assignment, assumption and novation agreement with our Manager, pursuant to which we assumed certain rights and obligations of our Manager under a debt commitment letter our Manager received from Madison Capital Funding LLC, indicating Madison Capital Funding’s willingness to provide us with the Credit Facility, subject to the satisfaction of certain terms and conditions. In addition, we and GSCP (NJ), L.P., our then external investment adviser, entered into a termination and release agreement, to be effective as of the closing of the transaction contemplated by the stock purchase agreement, pursuant to which GSCP (NJ), L.P., among other things, agreed to waive any and all accrued and unpaid deferred incentive management fees up to and as of the closing of the transaction contemplated by the stock purchase agreement but continued to be entitled to receive the base management fees earned through the date of the closing of the transaction contemplated by the stock purchase agreement.On July 30, 2010, the transactions contemplated by the stock purchase agreement with our Manager and certain of its affiliates was completed, and included the following actions:·the private sale of shares of our common stock for $15.0 million in aggregate purchase price to our Manager and certain of its affiliates;·the closing of the $40.0 million Credit Facility with Madison Capital Funding;·the execution of a registration rights agreement with the investors in the private sale transaction, pursuant to which we agreed to file a registration statement with the SEC to register for resale the shares of our common stock sold in the private sale transaction;·the execution of a trademark license agreement with our Manager pursuant to which our Manager granted us a non-exclusive, royalty-free license to use the “Saratoga” name, for so long as our Manager or one of its affiliates remains our investment adviser;·replacing GSCP (NJ), L.P. as our investment adviser and administrator with our Manager by executing the Management Agreement, which was approved by our stockholders, and an administration agreement with our Manager;·the resignations of Robert F. Cummings, Jr. and Richard M. Hayden, both of whom are affiliates of GSCP (NJ) L.P., as members of the board of directors and the election of Christian L. Oberbeck and Richard A. Petrocelli, both of whom are affiliates of our Manager, as members of the board of directors;·the resignation of all of our then existing executive officers and the appointment by our board of directors of Mr. Oberbeck as our chief executive officer and Mr. Petrocelli as our chief financial officer, secretary and chief compliance officer; and·our name change from “GSC Investment Corp.” to “Saratoga Investment Corp.”We used the net proceeds from the private sale transaction and a portion of the funds available to us under the Credit Facility to pay the full amount of principal and accrued interest, including default interest, outstanding under Revolving Facility. The Revolving Facility with Deutsche Bank was terminated in connection with our payment of all amounts outstanding thereunder on July 30, 2010. 2017 Qtr 4 Qtr 3 Qtr 2 Qtr 1 $ 8,359 $ 8,442 $ 8,448 $ 7,908 1,099 3,419 2,604 2,539 155 (1,845 ) 2,668 749 1,254 1,574 5,272 3,288 $ 0.19 $ 0.60 $ 0.45 $ 0.44 $ 0.03 $ (0.32 ) $ 0.46 $ 0.13 $ 0.45 $ 0.44 $ 0.63 $ 0.41 $ 21.97 $ 22.21 $ 22.39 $ 22.11 2016 Qtr 4 Qtr 3 Qtr 2 Qtr 1 $ 7,795 $ 6,936 $ 7,758 $ 7,561 3,100 2,150 3,657 1,771 (3,503 ) 1,271 (2,415 ) 5,614 (404 ) 3,421 1,243 7,385 $ 0.54 $ 0.38 $ 0.65 $ 0.33 $ (0.62 ) $ 0.23 $ (0.43 ) $ 1.03 $ 0.40 $ 0.36 $ 0.33 $ 1.27 $ 22.06 $ 22.59 $ 22.42 $ 22.75 2015 Qtr 4 Qtr 3 Qtr 2 Qtr 1 $ 7,451 $ 7,305 $ 6,475 $ 6,144 2,889 2,629 2,093 2,063 (184 ) 756 1,064 (303 ) 2,705 3,385 3,157 1,760 $ 0.50 $ 0.49 $ 0.39 $ 0.38 $ (0.03 ) $ 0.14 $ 0.20 $ (0.06 ) $ 0.22 $ 0.18 $ — $ — $ 22.70 $ 22.45 $ 22.00 $ 21.41 ManagementThe Company has evaluated subsequent events through the datefiling of issuance ofthis Form 10-K and determined that there have been no events that have occurred that would require adjustments to the Company’s consolidated financial statements included herein. There have been no subsequent events that occurred during such period that would require disclosure in this Form 10-K or would be required to be recognizedand disclosures in the consolidated financial statements as of andexcept for the year endedfollowing:2014.2017, the Company declared a dividend of $0.46 per share payable on March 28, 2017, to common stockholders of record on March 15, 2017. Shareholders had the option to receive payment of the dividend in cash, or receive shares of common stock, pursuant the Company’s DRIP. Based on shareholder elections, the dividend consisted of approximately $2.0 million in cash and 29,096 newly issued shares of common stock, or 0.5% of our outstanding common stock prior to the dividend payment. The number of shares of common stock comprising the stock portion was calculated based on a price of $21.38 per share, which equaled 95.0% of the volume weighted average trading price per share of the common stock on March 15, 16, 17, 20, 21, 22, 23, 24, 27 and 28, 2017.S-2 20142017 and 2013February 29, 2016S-3 S-4 20142017 and 2013February 29, 2016S-5 S-7 S-8 S-9 and Directors, (the “Issuer”), which comprise the statements of assets and liabilities, as of February 28, 2014 and February 28, 2013, including the schedules of investments, as of February 28, 2017 and February 29, 2016, and the statements of operations, changes in net assets and cash flows for the years ended February 28, 2014,2017, February 29, 2016 and February 28, 2013 and February 29, 2012,2015, and the related notes to the financial statements.Issuer’sentity’s preparation and fair presentation of the financial statements in order to design audit procedures that are appropriate in the circumstances, but not for the purpose of expressing an opinion on the effectiveness of the Issuer’sentity’s internal control. Accordingly, we express no such opinion. An audit also includes evaluating the appropriateness of accounting policies used and the reasonableness of significant accounting estimates made by management, as well as evaluating the overall presentation of the financial statements.20142017 and February 28, 2013,29, 2016, and the results of its operations, changes in its net assets and its cash flows for the years ended February 28, 2014,2017, February 29, 2016 and February 28, 2013 and February 29, 2012,2015, in conformity with U.S. generally accepted accounting principles.NYNew York27, 201416, 2017 As of February 28,
2017 February 29,
2016 $ 292,437,930 $ 284,652,926 22,718 191,863 292,460,648 284,844,789 13,046,555 2,349,633 1,505,000 2,691,831 1,443,865 1,698,562 6,049 — $ 308,462,117 $ 291,584,815 $ 1,031,457 $ 626,040 9,431,552 7,123,854 34,221 85,008 136,885 85,008 170,000,000 170,000,000 — (1,319,258 ) 20,000,000 20,000,000 — (136,750 ) 44,800,000 44,800,000 — (888,328 ) 16,000,000 16,000,000 (77,383 ) (553,078 ) 14,000,000 14,000,000 (359,249 ) (717,938 ) 13,100,000 13,100,000 — (1,353,521 ) 4,500,000 4,500,000 — (492,300 ) (1,161,590 ) (1,716,554 ) 30,000,000 30,000,000 $ 321,435,893 $ 313,142,183 $ 250 $ 250 (21,557,618 ) (5,803,406 ) 8,583,592 (15,754,212 ) (12,973,776 ) (21,557,368 ) $ 308,462,117 $ 291,584,815
February 28, 2014
February 28, 2013
February 29, 2012 For the year ended
February 28, 2017 For the year ended
February 29, 2016 For the year ended
February 28, 2015 $ 15,443,693 $ 14,372,377 $ 13,091,019 11,216 1,213 1,446 643,457 316,187 188,180 16,098,366 14,689,777 13,280,645 12,574,838 11,696,757 9,635,136 106,564 292,754 219,293 49,279 23,742 34,303 585,575 747,390 760,102 913,426 747,390 760,102 128,083 121,299 123,999 829,475 955,858 953,862 6,143,816 — — 21,331,056 14,585,190 12,486,797 (5,232,690 ) 104,587 793,848 358,169 419,096 620,817 13,458,113 (16,277,895 ) (3,874,583 ) 13,816,282 (15,858,799 ) (3,253,766 ) $ 8,583,592 $ (15,754,212 ) $ (2,459,918 ) 20142017 Asset
Type Spread LIBOR
Floor PIK Current
Rate
(All In) Maturity
Date Principal/
Number of
Shares Cost Fair Value Leisure Goods/Activities/Movies A-1 Preferred Shares Equity 0.00 % 0.00 % 0.00 % 0.00 % 6,692 $ 669,214 $ 6,725 Leisure Goods/Activities/Movies A-2 Preferred Shares Equity 0.00 % 0.00 % 0.00 % 0.00 % 18,975 1,897,538 247 Healthcare & Pharmaceuticals Common Stock Equity 0.00 % 0.00 % 0.00 % 0.00 % 14,813 964,466 15,746 Leisure Goods/Activities/Movies Term Loan Loan 3.75 % 1.00 % 0.00 % 4.75 % 5/28/2021 $ 487,500 484,284 476,127 Healthcare & Pharmaceuticals Term Loan B Loan 5.00 % 1.00 % 0.00 % 6.00 % 6/15/2023 $ 1,995,000 1,975,193 2,009,963 Media Term Loan B1 Loan 3.25 % 1.00 % 0.00 % 4.29 % 9/26/2021 $ 1,940,025 1,929,297 1,893,348 Services: Business Delayed Draw Term Loan Loan 3.25 % 1.00 % 0.00 % 4.25 % 7/25/2021 $ 2,446,206 2,443,710 2,438,574 Healthcare & Pharmaceuticals Term B Loan Loan 4.50 % 1.00 % 0.00 % 5.50 % 2/24/2021 $ 2,463,550 2,337,204 2,412,234 Food Services Term Loan Loan 4.75 % 1.00 % 0.00 % 5.75 % 7/30/2021 $ 1,970,000 1,962,367 1,898,587 Utilities Term Loan Loan 3.00 % 1.00 % 0.00 % 4.00 % 3/11/2024 $ 500,000 500,000 500,940 Healthcare & Pharmaceuticals Term Loan B Loan 4.25 % 1.00 % 0.00 % 5.25 % 4/16/2021 $ 398,056 396,948 403,529 Retailers (Except Food and Drugs) Term Loan B-4 Loan 3.00 % 0.75 % 0.00 % 3.78 % 8/25/2021 $ 2,896,193 2,879,009 2,931,179 Healthcare & Pharmaceuticals Term Loan B Loan 3.25 % 1.00 % 0.00 % 4.25 % 6/20/2022 $ 917,946 916,144 919,479 High Tech Industries Term Loan B (First Lien) Loan 4.50 % 1.00 % 0.00 % 5.50 % 8/19/2021 $ 2,955,000 2,943,621 2,951,306 Healthcare & Pharmaceuticals Term Loan B Loan 3.25 % 1.00 % 0.00 % 4.29 % 6/3/2019 $ 984,570 981,094 977,184 Chemicals/Plastics Term Loan B 1 Loan 3.00 % 1.00 % 0.00 % 4.00 % 1/31/2024 $ 250,000 249,377 252,500 Containers/Glass Products Term Loan Loan 3.25 % 1.00 % 0.00 % 4.25 % 12/7/2023 $ 500,000 497,626 505,780 Automotive Term Loan Loan 6.00 % 1.00 % 0.00 % 7.00 % 1/31/2022 $ 1,933,919 1,887,037 1,885,571 Food Products U.S. Term F Loan Loan 2.50 % 0.75 % 0.00 % 3.50 % 2/24/2021 $ 3,118,358 3,118,358 3,147,327 Healthcare & Pharmaceuticals Term Loan Initial Loan 4.25 % 1.00 % 0.00 % 5.25 % 4/29/2022 $ 1,484,941 1,481,061 1,491,446 Utilities Term Loan Loan 4.00 % 1.00 % 0.00 % 5.00 % 12/24/2021 $ 1,495,307 1,480,354 1,499,045 Insurance Replacement Term Loan B-2 Loan 3.25 % 0.75 % 0.00 % 4.03 % 7/8/2020 $ 531,422 526,976 537,024 Insurance Term Loan B4 (First Lien) Loan 3.25 % 1.00 % 0.00 % 4.25 % 8/4/2022 $ 2,434,375 2,422,950 2,463,661 Banking, Finance, Insurance & Real Estate Term Loan Loan 5.00 % 1.00 % 0.00 % 6.00 % 5/13/2019 $ 2,718,634 2,718,434 2,739,024 Chemicals/Plastics Term Loan Loan 5.00 % 1.00 % 0.00 % 6.00 % 6/21/2022 $ 2,784,429 2,760,689 2,819,234 Capital Equipment Term Loan B-2 Loan 2.75 % 0.75 % 0.00 % 3.50 % 3/20/2022 $ 1,000,000 995,000 1,017,300 Retailers (Except Food and Drugs) Term Loan Loan 3.25 % 0.75 % 0.00 % 4.02 % 6/5/2020 $ 1,473,750 1,471,637 1,411,116 Lodging & Casinos Term Loan Loan 3.00 % 1.00 % 0.00 % 4.00 % 3/19/2021 $ 2,481,122 2,484,502 2,488,888 Food/Drug Retailers New 2013 (November) Replacement Loan (First Lien) Loan 3.75 % 1.00 % 0.00 % 4.75 % 2/2/2024 $ 1,500,000 1,496,335 1,487,385 High Tech Industries Term Loan B4 Loan 5.00 % 1.00 % 0.00 % 6.02 % 6/30/2021 $ 2,992,500 2,969,529 3,008,390 Technology Term Loan Loan 4.00 % 1.00 % 0.00 % 5.00 % 9/10/2020 $ 1,959,596 1,917,256 1,965,729 Technology Term Loan Loan 4.00 % 1.00 % 0.00 % 5.00 % 9/10/2020 $ 676,193 665,400 679,607 Brokers/Dealers/Investment Houses Initial Term Loan (First Lien) Loan 3.00 % 1.00 % 0.00 % 4.00 % 12/18/2020 $ 1,461,186 1,451,382 1,467,952 Leisure Goods/Activities/Movies Term Loan B Loan 3.25 % 0.00 % 0.00 % 4.75 % 8/14/2023 $ 1,189,327 1,179,242 1,189,826 Beverage, Food & Tobacco Term Loan Loan 4.50 % 1.00 % 0.00 % 5.50 % 6/15/2023 $ 497,500 495,317 500,609 Conglomerate Tranche B-1 Term Loan Facility Loan 3.00 % 1.00 % 0.00 % 4.00 % 4/10/2019 $ 1,487,353 1,489,058 1,500,829 Telecommunications Term Loan Loan 4.00 % 1.00 % 0.00 % 5.00 % 12/20/2023 $ 1,500,000 1,485,318 1,500,000 Drugs Initial Term B Loan Loan 2.75 % 1.00 % 0.00 % 3.75 % 5/20/2021 $ 424,821 423,456 429,953 Publishing Term Loan Loan 4.25 % 1.00 % 0.00 % 5.25 % 6/7/2023 $ 1,492,500 1,477,575 1,411,965 Automotive Term Loan Loan 3.00 % 0.00 % 0.00 % 4.00 % 2/1/2024 $ 227,273 226,758 229,545 Cable and Satellite Television Term F Loan Loan 2.00 % 0.00 % 0.00 % 2.79 % 1/3/2021 $ 1,609,533 1,603,525 1,617,130 Healthcare & Pharmaceuticals Term G Loan Loan 2.75 % 1.00 % 0.00 % 3.80 % 12/31/2019 $ 981,177 960,939 972,866 Healthcare & Pharmaceuticals Term H Loan Loan �� 3.00 % 1.00 % 0.00 % 4.05 % 1/27/2021 $ 1,805,352 1,763,950 1,773,940 Oil & Gas Term Loan B Loan 3.50 % 1.00 % 0.00 % 4.50 % 7/29/2021 $ 1,964,874 1,946,245 1,976,172 Telecommunications Term Loan B (First Lien) Loan 3.00 % 1.00 % 0.00 % 4.00 % 10/24/2022 $ 1,970,062 1,958,282 1,980,405 Healthcare & Pharmaceuticals Term Loan B Loan 4.25 % 1.00 % 0.00 % 5.25 % 10/21/2021 $ 1,980,000 1,891,488 1,615,522 Aerospace and Defense Term Loan (First Lien) Loan 3.75 % 1.00 % 0.00 % 4.75 % 8/11/2022 $ 1,418,750 1,412,839 1,365,547 Telecommunications Term Loan B-2 Loan 3.00 % 1.00 % 0.00 % 4.00 % 10/5/2023 $ 500,000 497,500 502,890 Technology Term Loan B (First Lien) Loan 4.50 % 1.00 % 0.00 % 5.83 % 8/17/2022 $ 1,436,782 1,418,783 1,289,511 Electronics/Electric Term B Loan Loan 3.25 % 1.00 % 0.00 % 4.25 % 11/17/2017 $ 2,462,342 2,461,490 2,457,934 Industrial Equipment Initial Term Loan (First Lien) Loan 3.00 % 1.00 % 0.00 % 4.05 % 11/23/2020 $ 727,500 726,911 667,329 Healthcare & Pharmaceuticals Term Loan Loan 4.25 % 1.00 % 0.00 % 5.25 % 12/1/2021 $ 1,470,113 1,458,924 1,389,256 Conglomerate Term Loan Loan 4.00 % 1.00 % 0.00 % 5.00 % 12/13/2023 $ 2,050,000 2,049,738 2,083,313 Broadcast Radio and Television Term Loan Loan 3.25 % 1.00 % 0.00 % 4.25 % 12/23/2020 $ 470,093 467,345 342,580 Aerospace and Defense Term Loan Loan 4.25 % 1.00 % 0.00 % 5.25 % 7/7/2022 $ 1,975,000 1,967,190 1,987,838 Transportation Term Loan Loan 5.50 % 1.00 % 0.00 % 6.50 % 2/27/2024 $ 714,286 707,143 717,857 Financial Intermediaries Term B Loan Loan 7.25 % 1.50 % 0.00 % 8.75 % 3/19/2018 $ 2,101,458 2,096,045 2,101,458 Lodging & Casinos Term Loan B-3 Loan 3.75 % 1.00 % 0.00 % 5.07 % 7/30/2021 $ 1,000,000 996,568 1,002,920 High Tech Industries Term Loan (01/17) Loan 2.50 % 0.75 % 0.00 % 3.25 % 9/7/2023 $ 1,000,000 998,850 1,006,480 Leisure Goods/Activities/Movies Term Loan (Incremental) Loan 6.00 % 1.00 % 0.00 % 7.04 % 2/28/2020 $ 1,000,000 972,672 997,500 Leisure Goods/Activities/Movies Term Loan (First Lien) Loan 5.50 % 1.00 % 0.00 % 6.54 % 2/28/2020 $ 1,868,084 1,869,141 1,864,199 Media Term Loan (07/16) Loan 10.00 % 1.00 % 0.00 % 11.00 % 7/29/2021 $ 43,444 43,444 44,041 High Tech Industries Term Loan B Loan 4.50 % 0.75 % 0.00 % 5.31 % 11/6/2023 $ 398,750 395,190 404,731 Aerospace and Defense Term Loan B Loan 2.75 % 0.75 % 0.00 % 3.53 % 1/15/2024 $ 500,000 498,815 502,030 Healthcare & Pharmaceuticals Term Loan Loan 3.25 % 1.00 % 0.00 % 4.25 % 6/8/2020 $ 492,500 490,933 483,388 Healthcare & Pharmaceuticals Term Loan 2015 Incr Dollar Loan 3.25 % 1.00 % 0.00 % 4.25 % 3/11/2021 $ 2,925,000 2,919,916 2,937,431 Chemicals/Plastics Term Loan (First Lien) Loan 3.25 % 1.00 % 0.00 % 4.25 % 11/19/2020 $ 2,950,591 2,923,591 2,928,461 Construction & Building Term Loan B Add-on Loan 3.25 % 1.00 % 0.00 % 4.30 % 11/4/2021 $ 1,962,557 1,954,741 1,973,703 Banking, Finance, Insurance & Real Estate Term Loan Loan 5.00 % 1.00 % 0.00 % 6.00 % 2/21/2024 $ 1,500,000 1,395,987 1,511,250 Banking, Finance, Insurance & Real Estate Term Loan Loan 5.50 % 1.00 % 0.00 % 6.51 % 12/19/2022 $ 1,485,000 1,459,535 1,487,317 Leisure Goods/Activities/Movies Term Loan A Loan 4.50 % 1.00 % 0.00 % 5.51 % 7/2/2020 $ 501,970 488,778 177,446 Leisure Goods/Activities/Movies Term Loan B (2.00% Cash/6.50% PIK) Loan 1.00 % 1.00 % 6.50 % 8.51 % 7/2/2020 $ 954,307 934,189 77,938 Chemicals/Plastics Term Loan (First Lien) Loan 3.50 % 1.00 % 0.00 % 4.50 % 8/1/2021 $ 480,756 479,151 483,308 Chemicals/Plastics Term Loan (Second Lien) Loan 7.75 % 1.00 % 0.00 % 8.75 % 8/1/2022 $ 500,000 498,153 498,595 Chemicals/Plastics Term Loan B1A Loan 4.00 % 1.00 % 0.00 % 5.00 % 5/14/2021 $ 1,000,000 994,172 950,000 Healthcare & Pharmaceuticals Term Loan B Loan 3.00 % 0.75 % 0.00 % 3.81 % 9/26/2022 $ 990,000 987,999 994,247 Environmental Industries Term Loan B Loan 5.75 % 1.00 % 0.00 % 6.75 % 5/29/2020 $ 795,000 785,654 799,969 Aerospace and Defense Term Loan B-1 Loan 4.25 % 0.70 % 0.00 % 4.03 % 8/12/2020 $ 243,750 242,680 245,503 Retailers (Except Food and Drugs) New Term Loan Loan 3.75 % 1.25 % 0.00 % 5.00 % 7/9/2019 $ 955,106 954,175 846,224 Industrial Equipment Term Loan (First Lien) Loan 3.75 % 1.00 % 0.00 % 4.75 % 1/15/2021 $ 1,947,330 1,943,904 1,954,632 Capital Equipment Term Loan Loan 4.50 % 1.00 % 0.00 % 5.50 % 1/15/2021 $ 992,500 984,248 997,463 Media Term Loan B Loan 6.25 % 1.00 % 0.00 % 7.25 % 2/7/2020 $ 2,887,500 2,860,092 2,905,547 Automotive Tranche C Term Loan Loan 3.75 % 1.00 % 0.00 % 4.75 % 4/15/2021 $ 2,925,000 2,915,873 2,894,434 Financial Intermediaries First Data T/L Ext (2021) Loan 3.00 % 0.70 % 0.00 % 3.78 % 3/24/2021 $ 1,886,914 1,804,119 1,904,010 Banking, Finance, Insurance & Real Estate Term Loan Loan 4.00 % 0.75 % 0.00 % 5.00 % 12/1/2022 $ 1,485,000 1,460,081 1,493,361 Leisure Goods/Activities/Movies Term Loan B Loan 5.00 % 1.00 % 0.00 % 6.00 % 7/1/2020 $ 1,929,311 1,905,661 1,947,793 Nonferrous Metals/Minerals Loan Loan 2.75 % 1.00 % 0.00 % 3.75 % 6/28/2019 $ 801,502 802,865 806,279 Services: Business Term B Delayed Draw Loan Loan 3.00 % 1.00 % 0.00 % 4.00 % 11/6/2020 $ 197,083 196,509 197,822 Services: Business Term B Loan Loan 3.00 % 1.00 % 0.00 % 4.00 % 11/6/2020 $ 770,417 768,226 773,306 High Tech Industries Initial Dollar Term Loan Loan 3.25 % 1.00 % 0.00 % 4.57 % 7/30/2020 $ 2,426,061 2,421,316 2,420,263 Leisure Goods/Activities/Movies Term Loan (First Lien) Loan 3.25 % 1.00 % 0.00 % 4.25 % 7/5/2021 $ 481,656 476,839 481,478 Retailers (Except Food and Drugs) Amended Tranche B Term Loan Loan 2.50 % 0.75 % 0.00 % 3.29 % 3/4/2019 $ 2,121,102 2,117,573 1,765,817 Services: Business Term Loan B Loan 4.50 % 1.00 % 0.00 % 5.50 % 6/20/2022 $ 500,000 495,133 501,250 Services: Business Term Loan (First Lien) Loan 3.75 % 1.25 % 0.00 % 5.00 % 5/26/2020 $ 2,667,633 2,661,035 2,654,962 Chemicals/Plastics Loan (Second Lien) Loan 3.00 % 0.75 % 0.00 % 3.78 % 4/30/2019 $ 1,333,333 1,320,613 1,333,747 Brokers/Dealers/Investment Houses Initial Term Loan Loan 2.75 % 1.00 % 0.00 % 3.75 % 1/4/2021 $ 1,014,560 1,011,573 1,010,755 Services: Business Term Loan B Loan 6.00 % 1.00 % 0.00 % 7.00 % 6/16/2023 $ 1,492,500 1,436,528 1,501,201 Publishing Tranche B-4 Term Loan Loan 5.50 % 1.00 % 0.00 % 6.50 % 2/9/2022 $ 2,176,889 2,117,378 2,190,495 Building & Development Term Loan Loan 3.00 % 1.00 % 0.00 % 4.00 % 3/24/2022 $ 242,058 241,141 242,784 High Tech Industries Term Loan Loan 5.25 % 1.00 % 0.00 % 6.25 % 10/8/2021 $ 1,485,000 1,433,886 1,485,000 Media Term Loan B Loan 3.50 % 0.00 % 0.00 % 4.27 % 2/14/2024 $ 2,500,000 2,512,500 2,493,750 Drugs Term Loan B Loan 5.50 % 0.75 % 0.00 % 6.28 % 2/15/2023 $ 2,000,000 1,985,000 2,001,660 Retailers (Except Food and Drugs) Term Loan B Loan 4.00 % 1.00 % 0.00 % 5.00 % 12/10/2021 $ 246,851 244,820 250,431 Containers/Glass Products Term Loan Loan 4.50 % 1.00 % 0.00 % 5.50 % 11/21/2023 $ 1,000,000 1,003,734 1,013,750 Beverage, Food & Tobacco Term Loan B (First Lien) Loan 3.00 % 1.00 % 0.00 % 4.00 % 8/3/2022 $ 1,490,000 1,486,482 1,507,508 Chemicals/Plastics Term Loan B (First Lien) Loan 3.00 % 0.70 % 0.00 % 3.78 % 4/19/2019 $ 1,518,031 1,510,811 1,525,150 Services: Business Term Loan B Loan 3.25 % 1.00 % 0.00 % 4.25 % 6/30/2021 $ 469,398 467,182 472,158 Banking, Finance, Insurance & Real Estate Term Loan Loan 4.50 % 1.00 % 0.00 % 5.50 % 4/29/2022 $ 1,994,924 1,971,849 1,998,675 Media Term Loan B Loan 6.00 % 1.00 % 0.00 % 7.00 % 3/30/2022 $ 496,250 489,837 499,972 Services: Business Term Loan B-6 Loan 2.75 % 1.00 % 0.00 % 3.75 % 2/1/2022 $ 1,609,802 1,595,316 1,610,945 High Tech Industries Term Loan B Loan 3.50 % 1.00 % 0.00 % 4.50 % 8/5/2022 $ 493,750 492,732 490,664 Services: Business Term Loan Loan 5.00 % 1.00 % 0.00 % 6.00 % 10/29/2021 $ 3,450,126 3,434,977 3,471,690 Media Term Loan B Loan 3.50 % 1.00 % 0.00 % 4.50 % 12/18/2020 $ 500,000 497,615 506,875 Retailers (Except Food and Drugs) Term B-1 Loan Retired 03/05/2014 Loan 3.00 % 1.00 % 0.00 % 4.00 % 3/5/2021 $ 945,756 945,756 540,660 Aerospace and Defense First Lien 6/14 Loan 3.50 % 1.00 % 0.00 % 4.50 % 6/19/2021 $ 487,879 487,106 471,208 Retailers (Except Food and Drugs) Term Loan (First Lien) Loan 5.00 % 1.00 % 0.00 % 6.04 % 5/9/2022 $ 950,648 946,877 935,200 Healthcare & Pharmaceuticals Term Loan F-1 Loan 4.00 % 1.00 % 0.00 % 4.28 % 2/2/2024 $ 2,400,000 2,388,246 2,399,496 Services: Business Term Loan Loan 6.50 % 1.00 % 0.00 % 7.50 % 5/15/2020 $ 2,935,100 2,917,778 2,730,259 Chemicals/Plastics Term Loan (Initial) Loan 5.00 % 1.00 % 0.00 % 5.00 % 1/6/2022 $ 2,500,000 2,286,776 2,533,825 Healthcare & Pharmaceuticals Term Loan A Loan 4.75 % 1.00 % 0.00 % 5.75 % 11/25/2020 $ 1,000,000 970,576 985,000 Healthcare & Pharmaceuticals Term Loan B Loan 5.38 % 1.00 % 0.00 % 6.38 % 11/25/2022 $ 1,900,000 1,842,852 1,885,750 Healthcare & Pharmaceuticals Initial Term Loan (A-L Parent) Loan 3.25 % 1.00 % 0.00 % 4.25 % 12/1/2023 $ 500,000 497,713 505,625 Utilities Term Loan B Loan 5.50 % 1.00 % 0.00 % 6.54 % 1/30/2024 $ 913,043 894,897 925,981 Utilities Term Loan C Loan 5.50 % 1.00 % 0.00 % 6.54 % 1/30/2024 $ 86,957 85,236 88,189 Oil & Gas Term Loan Loan 5.00 % 1.00 % 0.00 % 6.04 % 2/15/2024 $ 500,000 495,000 503,125 Banking, Finance, Insurance & Real Estate Term Loan B (2022) Loan 4.00 % 0.75 % 0.00 % 4.78 % 11/21/2022 $ 1,980,000 1,963,355 2,007,225 Containers/Glass Products Term Loan Loan 3.50 % 1.00 % 0.00 % 4.50 % 7/31/2021 $ 488,750 487,123 488,647 Publishing Term Loan Loan 4.00 % 1.00 % 0.00 % 5.00 % 5/4/2022 $ 995,000 990,840 977,468 Retailers (Except Food and Drugs) Term Loan B1 Loan 2.75 % 1.00 % 0.00 % 3.75 % 1/30/2023 $ 1,679,779 1,674,140 1,674,673 High Tech Industries Term Loan Loan 3.75 % 1.00 % 0.00 % 4.75 % 7/8/2021 $ 982,378 978,629 985,079 Electronics/Electric Term Loan B Loan 2.25 % 0.00 % 0.00 % 3.03 % 1/17/2023 $ 868,445 845,882 874,593 Automotive Term Loan (Initial) Loan 3.50 % 1.00 % 0.00 % 3.75 % 8/18/2021 $ 244,375 243,499 246,005 Capital Equipment Term Loan B Loan 3.00 % 0.00 % 0.00 % 3.78 % 9/28/2023 $ 1,000,000 996,250 1,004,380 Beverage, Food & Tobacco Term Loan Loan 5.00 % 1.00 % 0.00 % 5.00 % 8/16/2023 $ 997,500 987,646 1,004,562 Automotive Term Loan Loan 4.25 % 1.00 % 0.00 % 5.25 % 8/20/2021 $ 831,203 825,179 832,931 Services: Business Term Loan Loan 4.00 % 1.00 % 0.00 % 5.00 % 5/29/2020 $ 1,969,898 1,931,995 1,972,360 Capital Equipment Term Loan (First Lien) Loan 5.50 % 1.00 % 0.00 % 6.50 % 6/29/2020 $ 2,985,000 2,956,823 3,007,388 Healthcare & Pharmaceuticals Term Loan B Loan 3.50 % 1.00 % 0.00 % 4.50 % 8/14/2021 $ 977,543 974,893 982,430 Retailers (Except Food and Drugs) Term Loan (Second Lien) Loan 5.75 % 1.00 % 0.00 % 6.75 % 3/11/2022 $ 250,000 249,793 242,750 Retailers (Except Food and Drugs) Term Loan Loan 6.25 % 1.00 % 0.00 % 7.25 % 6/4/2020 $ 3,168,116 3,154,983 3,140,395 Healthcare & Pharmaceuticals Term Loan Loan 6.50 % 1.00 % 0.00 % 7.50 % 12/21/2020 $ 1,930,106 1,777,976 980,494 Aerospace and Defense Term Loan (200MM) Loan 5.00 % 1.00 % 0.00 % 6.00 % 10/16/2022 $ 1,980,000 1,963,361 1,890,900 Aerospace and Defense Term Loan (2nd Lien) Loan 8.50 % 1.00 % 0.00 % 9.50 % 10/16/2023 $ 1,000,000 991,237 930,000 Food Services Term Loan (2013) Loan 3.75 % 1.00 % 0.00 % 4.75 % 12/28/2018 $ 476,250 476,250 477,241 Services: Consumer Term Loan B2 Loan 3.50 % 1.00 % 0.00 % 4.50 % 8/14/2021 $ 129,601 129,601 130,897 Services: Consumer Term Loan B1 Loan 3.50 % 1.00 % 0.00 % 4.50 % 8/14/2021 $ 157,443 157,108 158,034 Banking, Finance, Insurance & Real Estate Term Loan Loan 4.50 % 1.00 % 0.00 % 5.50 % 11/23/2022 $ 1,000,000 995,240 1,013,750 High Tech Industries Term Loan B Loan 3.25 % 0.70 % 0.00 % 4.03 % 3/31/2023 $ 498,750 491,370 503,204 Healthcare & Pharmaceuticals Term Loan (First Lien 2013) Loan 4.00 % 1.00 % 0.00 % 5.00 % 6/7/2019 $ 3,613,555 3,606,228 3,490,297 Healthcare & Pharmaceuticals Term Loan B Loan 3.75 % 1.00 % 0.00 % 4.75 % 10/1/2021 $ 488,750 486,195 475,554 Services: Business Term B Loan Loan 6.50 % 1.25 % 0.00 % 7.75 % 7/29/2019 $ 2,913,824 2,913,362 2,938,096 Food/Drug Retailers Term Borrowing Loan 3.25 % 1.00 % 0.00 % 4.54 % 6/24/2019 $ 1,417,598 1,413,680 1,389,245 Services: Business Term Loan (First Lien) Loan 4.00 % 1.00 % 0.00 % 5.25 % 10/30/2020 $ 970,000 966,928 933,625 Retailers (Except Food and Drugs) Term Loan B1 Loan 3.00 % 1.00 % 0.00 % 4.00 % 3/11/2022 $ 982,500 977,998 967,183 Financial Intermediaries Term Loan Loan 5.25 % 1.00 % 0.00 % 6.25 % 9/29/2020 $ 2,891,464 2,876,188 2,889,671 Leisure Goods/Activities/Movies Term Loan Loan 3.50 % 0.75 % 0.00 % 4.28 % 3/31/2021 $ 2,392,341 2,385,223 2,407,293 Telecommunications Term Loan Loan 5.25 % 1.00 % 0.00 % 6.25 % 9/27/2023 $ 1,894,167 1,868,863 1,907,426 Services: Business Term Loan B Loan 5.25 % 1.25 % 0.00 % 6.50 % 7/1/2019 $ 3,328,536 3,330,285 3,335,825 Services: Business Term Loan Loan 3.50 % 1.00 % 0.00 % 4.50 % 2/2/2022 $ 2,297,698 2,248,964 2,314,930 Drugs Term Loan B4 Loan 2.75 % 0.75 % 0.00 % 3.53 % 1/26/2024 $ 500,000 498,779 506,040 Services: Business Term Loan Loan 3.25 % 1.00 % 0.00 % 4.25 % 5/2/2022 $ 1,985,025 1,975,632 2,003,645 Services: Business Term Loan Loan 3.25 % 1.00 % 0.00 % 4.25 % 10/1/2021 $ 916,047 913,757 918,337 Services: Business Term Loan (Second Lien) Loan 7.25 % 1.00 % 0.00 % 8.25 % 10/3/2022 $ 500,000 498,149 475,000 Electronics/Electric Initial Dollar Term Loan (First Lien) Loan 3.50 % 1.00 % 0.00 % 4.54 % 12/3/2020 $ 485,019 483,001 486,634 Services: Consumer Term Loan Loan 2.50 % 0.75 % 0.00 % 3.28 % 4/1/2022 $ 495,009 493,772 499,573 Media Term Loan B Loan 4.50 % 1.00 % 0.00 % 5.50 % 3/18/2021 $ 2,037,705 2,029,696 2,002,045 Banking, Finance, Insurance & Real Estate Term Loan Loan 4.25 % 1.00 % 0.00 % 5.25 % 4/30/2022 $ 240,815 239,883 241,518 Industrial Equipment Term B Loan Loan 2.75 % 1.00 % 0.00 % 3.75 % 8/21/2023 $ 732,374 732,374 736,497 Industrial Equipment Term B Loan Loan 2.75 % 1.00 % 0.00 % 3.75 % 8/21/2023 $ 641,402 641,402 645,013 Industrial Equipment Incremental U.S. Term Loan Loan 3.00 % 0.00 % 0.00 % 3.78 % 2/3/2023 $ 1,761,134 1,761,134 1,773,603 Electronics/Electric Tranche B-3 Term Loan Loan 2.50 % 0.75 % 0.00 % 3.29 % 7/2/2021 $ 1,462,500 1,457,765 1,467,984 Chemicals/Plastics Term Loan (Second Lien) Loan 7.50 % 1.00 % 0.00 % 8.50 % 6/19/2023 $ 275,862 274,109 276,552 Chemicals/Plastics Term Loan (Second Lien) Loan 3.25 % 1.00 % 0.00 % 4.25 % 6/17/2022 $ 541,607 539,167 544,992 Financial Intermediaries Term B-4 Term Loan Loan 2.50 % 0.00 % 0.00 % 3.50 % 10/14/2022 $ 2,554,764 2,554,764 2,580,848 Banking, Finance, Insurance & Real Estate Term Loan B Loan 5.75 % 1.00 % 0.00 % 6.75 % 6/1/2023 $ 2,240,000 2,127,043 2,259,600 Telecommunications Term Loan B2 Loan 4.75 % 0.75 % 0.00 % 5.53 % 12/30/2022 $ 1,500,000 1,470,825 1,521,570 Industrial Equipment Term Loan (First Lien) Loan 4.00 % 1.00 % 0.00 % 5.00 % 3/27/2021 $ 972,500 969,442 870,388 Electronics/Electric Term Loan B2 Loan 4.00 % 0.75 % 0.00 % 4.85 % 10/1/2021 $ 769,549 762,102 781,416 High Tech Industries Term Loan (First Lien) Loan 4.25 % 1.00 % 0.00 % 5.25 % 10/31/2022 $ 1,972,528 1,934,960 1,991,030 Oil & Gas Term Loan B Loan 3.00 % 1.00 % 0.00 % 4.00 % 2/21/2021 $ 977,330 922,444 729,635 Food Services Term Loan (First Lien) Loan 3.94 % 1.00 % 0.00 % 4.94 % 6/30/2021 $ 977,500 975,832 979,944 Telecommunications Term Loan Loan 5.50 % 1.00 % 0.00 % 6.56 % 9/18/2021 $ 1,975,000 1,959,274 1,961,432 Transportation Term Loan B Loan 4.50 % 1.00 % 0.00 % 5.53 % 2/2/2024 $ 1,000,000 995,095 1,008,330 Chemicals/Plastics Term Loan (First Lien) Loan 3.75 % 1.00 % 0.00 % 4.75 % 12/10/2020 $ 207,981 207,633 208,501 Chemicals/Plastics Initial US Term Loan Loan 3.75 % 1.00 % 0.00 % 4.75 % 12/10/2020 $ 1,178,561 1,176,588 1,181,508 Electronics/Electric Term Loan (Closing Date) Loan 3.25 % 1.00 % 0.00 % 4.25 % 9/30/2022 $ 1,960,897 1,951,404 1,967,761 Services: Business Term Loan B (First Lien) Loan 6.75 % 1.00 % 0.00 % 7.75 % 10/31/2019 $ 1,837,500 1,804,647 1,808,412 Industrial Equipment Term Loan (First Lien) Loan 3.00 % 1.00 % 0.00 % 4.00 % 4/10/2020 $ 2,725,103 2,719,454 2,718,289 Food Services Term Loan Loan 3.75 % 1.00 % 0.00 % 4.75 % 3/19/2021 $ 923,173 917,444 930,097 Services: Business Term Loan B Loan 5.00 % 1.00 % 0.00 % 6.00 % 12/16/2020 $ 2,721,749 2,707,531 2,721,749 High Tech Industries Term Loan B Loan 4.00 % 1.00 % 0.00 % 5.00 % 9/30/2022 $ 987,500 982,957 1,002,006 Telecommunications Initial Term Loan Loan 3.00 % 1.00 % 0.00 % 4.04 % 4/23/2019 $ 468,977 466,972 427,473 Services: Business Term Loan B Loan 6.00 % 1.00 % 0.00 % 7.00 % 1/3/2023 $ 1,200,000 1,168,727 1,206,000 Transportation Delayed Draw Term Loan (Initial) Loan 4.75 % 1.00 % 0.00 % 5.80 % 8/24/2023 $ 997,500 988,185 1,004,981 Healthcare & Pharmaceuticals Term Loan Loan 2.75 % 1.00 % 0.00 % 3.75 % 2/6/2024 $ 1,000,000 997,518 996,880 Food Services Term Loan B Loan 4.25 % 1.00 % 0.00 % 5.25 % 7/15/2020 $ 1,651,817 1,648,856 1,646,316 Media Term Loan B Loan 3.00 % 1.00 % 0.00 % 4.00 % 4/1/2022 $ 932,522 927,933 937,185 Utilities Term Loan B Loan 4.00 % 1.00 % 0.00 % 5.00 % 10/2/2021 $ 1,413,873 1,364,619 1,426,683 Aerospace and Defense Tranche C Term Loan Loan 3.00 % 0.75 % 0.00 % 3.78 % 2/28/2020 $ 4,233,198 4,238,155 4,249,920 Hotel, Gaming and Leisure Term Loan B Loan 5.25 % 0.00 % 0.00 % 6.03 % 1/25/2024 $ 2,000,000 1,990,095 2,025,000 Services: Business Term Loan B Loan 5.50 % 1.00 % 0.00 % 6.50 % 4/13/2023 $ 497,500 490,931 503,719 Lodging & Casinos Term Loan B Loan 3.50 % 1.00 % 0.00 % 4.50 % 7/10/2020 $ 809,438 810,684 819,556 Chemicals/Plastics Term B Loan Loan 2.75 % 0.00 % 0.00 % 3.61 % 7/1/2022 $ 2,962,500 2,948,361 2,971,565 Telecommunications Replacement First-Lien Term Loan Loan 3.00 % 1.00 % 0.00 % 4.00 % 3/1/2020 $ 2,885,666 2,876,319 2,896,949 Drugs Series D2 Term Loan B Loan 4.25 % 0.75 % 0.00 % 5.03 % 2/13/2019 $ 2,445,056 2,437,788 2,456,890 Services: Business Term Loan Loan 2.75 % 0.75 % 0.00 % 3.53 % 9/6/2019 $ 1,006,278 1,003,396 1,010,554 Utilities Term Loan B Loan 3.25 % 0.75 % 0.00 % 4.02 % 12/13/2023 $ 500,000 498,784 502,970 Healthcare & Pharmaceuticals Term Loan Loan 4.00 % 1.00 % 0.00 % 5.00 % 2/13/2023 $ 879,853 856,884 891,405 Industrial Equipment Term Loan Loan 3.75 % 1.00 % 0.00 % 4.75 % 6/27/2021 $ 487,500 485,889 486,891 Services: Business U.S. Term Loan (First Lien) Loan 0.00 % 0.00 % 5.75 % 5.75 % 12/20/2018 $ 1,735,292 1,743,798 1,418,601 High Tech Industries Term Loan B (USD) Loan 3.75 % 0.75 % 0.00 % 4.53 % 5/1/2023 $ 1,592,000 1,547,312 1,602,396 Telecommunications Term Loan B6 Loan 4.00 % 0.75 % 0.00 % 4.78 % 3/29/2021 $ 999,375 989,489 1,006,121 Services: Business Term Loan Loan 5.50 % 0.75 % 0.00 % 6.28 % 12/7/2023 $ 750,000 737,850 761,955 Nonferrous Metals/Minerals Term Loan Loan 3.75 % 1.00 % 0.00 % 4.75 % 6/14/2021 $ 500,000 501,250 506,040 Chemicals/Plastics Term Loan B Loan 4.00 % 1.00 % 0.00 % 5.00 % 6/27/2022 $ 2,955,000 2,941,390 2,984,550 Healthcare & Pharmaceuticals Term Loan Loan 4.75 % 1.00 % 0.00 % 5.75 % 8/17/2020 $ 1,000,000 995,523 1,012,500 $ 297,801,502 $ 292,460,648 Principal Cost Fair Value $ 13,046,555 $ 13,046,555 $ 13,046,555 $ 13,046,555 $ 13,046,555 $ 13,046,555 Asset
Type Spread LIBOR
Floor PIK Current
Rate
(All In) Maturity
Date Principal/
Number of
Shares Cost Fair Value Leisure Goods/Activities/Movies A-1 Preferred Shares Equity 0.00 % 0.00 % 0.00 % 0.00 % 6,692 $ 669,214 $ 1,673 Leisure Goods/Activities/Movies A-2 Preferred Shares Equity 0.00 % 0.00 % 0.00 % 0.00 % 18,975 1,897,538 95 Healthcare & Pharmaceuticals Common Stock Equity 0.00 % 0.00 % 0.00 % 0.00 % 14,813 964,466 190,095 Leisure Goods/Activities/Movies Term Loan Loan 3.75 % 1.00 % 0.00 % 4.75 % 5/28/2021 $ 492,500 488,586 455,154 Media Term Loan B1 Loan 3.25 % 1.00 % 0.00 % 4.25 % 9/26/2021 $ 1,972,936 1,959,834 1,855,389 Healthcare & Pharmaceuticals Term Loan Initial Loan 4.50 % 1.00 % 0.00 % 5.50 % 4/29/2022 $ 497,500 495,228 495,221 Services: Business Delayed Draw Term Loan Loan 3.25 % 1.00 % 0.00 % 4.25 % 7/25/2021 $ 2,471,231 2,468,039 2,342,826 Food Services Term Loan Loan 4.75 % 1.00 % 0.00 % 5.75 % 7/30/2021 $ 1,990,000 1,980,704 1,935,275 Healthcare & Pharmaceuticals Term B Loan Loan 4.50 % 1.00 % 0.00 % 5.50 % 2/24/2021 $ 985,000 985,000 797,850 Healthcare & Pharmaceuticals Term Loan B Loan 5.00 % 1.00 % 0.00 % 6.00 % 4/16/2021 $ 398,056 396,681 396,066 Retailers (Except Food and Drugs) Term Loan B-4 Loan 4.50 % 1.00 % 0.00 % 5.50 % 8/25/2021 $ 3,384,425 3,367,410 3,302,623 Healthcare & Pharmaceuticals Term Loan B Loan 3.25 % 1.00 % 0.00 % 4.25 % 6/20/2022 $ 927,265 925,091 925,365 High Tech Industries Term Loan B (First Lien) Loan 4.50 % 1.00 % 0.00 % 5.50 % 8/19/2021 $ 2,985,000 2,971,074 2,824,555 Healthcare & Pharmaceuticals Term Loan B Loan 3.25 % 1.00 % 0.00 % 4.25 % 6/3/2019 $ 994,856 990,161 906,981 Banking, Finance, Insurance & Real Estate Term Loan B (First Lien) Loan 3.50 % 1.00 % 0.00 % 4.50 % 8/12/2022 $ 995,000 992,679 960,921 Healthcare & Pharmaceuticals Term Loan Loan 5.00 % 1.00 % 0.00 % 6.00 % 4/4/2022 $ 480,447 478,240 456,425 Financial Intermediaries Term Loan (First Lien) Loan 4.50 % 1.00 % 0.00 % 5.50 % 4/30/2022 $ 248,749 247,612 244,190 Food Products LC-2 Facility Loan 3.50 % 0.62 % 0.00 % 4.12 % 7/26/2016 $ 9,447 9,445 9,305 Food Products LC-3 Facility Loan 3.50 % 0.62 % 0.00 % 4.12 % 7/26/2016 $ 5,244 5,244 5,166 Food Products U.S. Term F Loan Loan 2.50 % 0.75 % 0.00 % 3.25 % 2/24/2021 $ 3,150,423 3,150,423 3,126,133 Insurance Incremental Tranche B-1 Term Loan Loan 3.75 % 1.25 % 0.00 % 5.00 % 5/24/2019 $ 2,596,480 2,573,245 2,441,237 Insurance Term Loan B4 (First Lien) Loan 4.00 % 1.00 % 0.00 % 5.00 % 8/4/2022 $ 2,478,125 2,466,303 2,270,582 Banking, Finance, Insurance & Real Estate Term Loan Loan 5.00 % 1.00 % 0.00 % 6.00 % 5/13/2019 $ 2,522,992 2,522,722 2,491,455 Chemicals/Plastics Term Loan Loan 4.00 % 1.25 % 0.00 % 5.25 % 6/24/2017 $ 2,156,953 2,153,896 2,135,384 Retailers (Except Food and Drugs) Term Loan Loan 3.25 % 0.75 % 0.00 % 4.00 % 6/5/2020 $ 1,488,750 1,485,895 1,397,564 Lodging & Casinos Term Loan Loan 3.00 % 1.00 % 0.00 % 4.00 % 3/19/2021 $ 491,249 489,361 477,127 Chemicals/Plastics Term E Loan Loan 2.75 % 1.00 % 0.00 % 3.75 % 1/6/2021 $ 1,314,499 1,305,069 1,291,903 Food/Drug Retailers New 2013 (November) Replacement Loan (First Lien) Loan 3.50 % 1.00 % 0.00 % 4.50 % 9/26/2019 $ 1,476,196 1,475,409 1,401,161 Technology Term Loan B Loan 3.50 % 1.00 % 0.00 % 4.50 % 5/20/2022 $ 997,500 995,159 945,131 Technology Term Loan Loan 4.00 % 1.00 % 0.00 % 5.00 % 9/10/2020 $ 1,979,798 1,926,080 1,571,821 Brokers/Dealers/Investment Houses Initial Term Loan (First Lien) Loan 3.00 % 1.00 % 0.00 % 4.00 % 12/18/2020 $ 1,476,212 1,464,327 1,426,390 Industrial Equipment Term Loan (First Lien) Loan 4.50 % 1.50 % 0.00 % 6.00 % 3/16/2017 $ 1,917,168 1,924,101 1,802,138 Retailers (Except Food and Drugs) Term B-2 Loan Loan 3.25 % 1.00 % 0.00 % 4.25 % 8/13/2021 $ 1,861,667 1,853,426 1,845,843 Leisure Goods/Activities/Movies Term Loan B Loan 4.50 % 1.00 % 0.00 % 5.50 % 8/14/2020 $ 985,000 976,335 930,826 Lodging & Casinos Term B-7 Loan Loan 8.75 % 1.00 % 3.50 % 13.25 % 3/1/2017 $ 995,000 991,037 814,656 Aerospace and Defense 2013 Replacement Term Loan (First Lien) Loan 3.75 % 1.00 % 0.00 % 4.75 % 5/31/2019 $ 1,940,113 1,940,984 1,806,730 Conglomerate Tranche B-1 Term Loan Facility Loan 3.00 % 1.00 % 0.00 % 4.00 % 4/10/2019 $ 2,051,828 2,055,060 2,044,564 Drugs Initial Term B Loan Loan 3.25 % 1.00 % 0.00 % 4.25 % 5/20/2021 $ 492,501 490,549 487,271 Publishing Term Loan Loan 6.00 % 1.00 % 0.00 % 7.00 % 3/31/2020 $ 2,647,871 2,670,807 2,539,758 Cable and Satellite Television Term F Loan Loan 2.25 % 0.75 % 0.00 % 3.00 % 12/31/2020 $ 2,628,783 2,621,343 2,566,823 Healthcare & Pharmaceuticals Term G Loan Loan 2.75 % 1.00 % 0.00 % 3.75 % 12/31/2019 $ 1,022,569 994,876 974,212 Healthcare & Pharmaceuticals Term H Loan Loan 3.00 % 1.00 % 0.00 % 4.00 % 1/27/2021 $ 1,881,500 1,828,566 1,785,920 Services: Business Term Loan Loan 2.75 % 1.00 % 0.00 % 3.75 % 2/28/2018 $ 298,828 297,362 295,840 Oil & Gas Term Loan B Loan 3.50 % 1.00 % 0.00 % 4.50 % 7/29/2021 $ 1,984,975 1,962,423 1,865,876 Telecommunications Term Loan B (First Lien) Loan 4.00 % 1.00 % 0.00 % 5.00 % 10/24/2022 $ 1,990,000 1,978,594 1,847,596 Telecommunications Term Loan B Loan 3.00 % 0.75 % 0.00 % 3.75 % 12/29/2022 $ 498,750 497,568 494,176 Aerospace and Defense Term Loan (First Lien) Loan 3.75 % 1.00 % 0.00 % 4.75 % 8/11/2022 $ 1,437,500 1,430,556 1,329,688 Healthcare & Pharmaceuticals Term Loan B Loan 4.25 % 1.00 % 0.00 % 5.25 % 10/21/2021 $ 2,000,000 1,894,483 1,920,000 Technology Term Loan B (First Lien) Loan 4.50 % 1.00 % 0.00 % 5.50 % 8/17/2022 $ 1,436,782 1,415,977 1,396,667 Electronics/Electric Term B Loan Loan 3.25 % 1.00 % 0.00 % 4.25 % 11/17/2017 $ 1,564,182 1,564,182 1,501,615 Industrial Equipment Initial Term Loan (First Lien) Loan 3.00 % 1.00 % 0.00 % 4.00 % 11/23/2020 $ 735,000 734,245 536,550 Healthcare & Pharmaceuticals Term Loan Loan 4.25 % 1.00 % 0.00 % 5.25 % 12/1/2021 $ 1,485,038 1,471,665 1,433,061 Conglomerate Dollar Loan (First Lien) Loan 4.75 % 1.50 % 0.00 % 6.25 % 12/19/2017 $ 771,625 742,910 721,469 Conglomerate Dollar Loan (Second Lien) Loan 8.00 % 1.50 % 0.00 % 9.50 % 6/19/2018 $ 783,162 754,065 734,214 Broadcast Radio and Television Term Loan Loan 3.25 % 1.00 % 0.00 % 4.25 % 12/23/2020 $ 470,093 466,690 304,973 Aerospace and Defense Term Loan Loan 4.25 % 1.00 % 0.00 % 5.25 % 7/7/2022 $ 1,995,000 1,985,759 1,970,063 Financial Intermediaries Term B Loan Loan 7.25 % 1.50 % 0.00 % 8.75 % 3/19/2018 $ 2,409,739 2,397,948 2,409,739 Technology Term Loan B2 Loan 3.25 % 0.75 % 0.00 % 4.00 % 4/29/2020 $ 2,904,989 2,892,348 2,889,854 Lodging & Casinos Term Loan B-3 Loan 3.75 % 1.00 % 0.00 % 4.75 % 7/30/2021 $ 1,000,000 995,870 925,000 Leisure Goods/Activities/Movies Term Loan (First Lien) Loan 5.50 % 1.00 % 0.00 % 6.50 % 2/28/2020 $ 1,882,983 1,884,279 1,751,174 Lodging & Casinos Term Loan Loan 4.50 % 1.00 % 0.00 % 5.50 % 5/7/2021 $ 926,971 923,222 897,614 Lodging & Casinos Term Loan (Add-On) Loan 4.50 % 1.00 % 0.00 % 5.50 % 5/7/2021 $ 1,000,000 980,687 968,330 Healthcare & Pharmaceuticals Term Loan Loan 3.25 % 1.00 % 0.00 % 4.25 % 6/8/2020 $ 497,500 495,435 478,222 Healthcare & Pharmaceuticals Term Loan 2015 Incr Dollar Loan 3.25 % 1.00 % 0.00 % 4.25 % 3/11/2021 $ 2,955,000 2,948,456 2,799,863 Chemicals/Plastics Term Loan (First Lien) Loan 3.25 % 1.00 % 0.00 % 4.25 % 11/19/2020 $ 2,472,161 2,445,601 2,299,110 Construction & Building Term Loan B Add-on Loan 3.25 % 1.00 % 0.00 % 4.25 % 11/4/2021 $ 2,985,000 2,970,317 2,869,331 Banking, Finance, Insurance & Real Estate Term Loan Loan 5.50 % 1.00 % 0.00 % 6.50 % 12/19/2022 $ 1,500,000 1,470,617 1,459,695 Leisure Goods/Activities/Movies Term Loan A Loan 4.50 % 1.00 % 0.00 % 5.50 % 7/2/2020 $ 501,970 485,313 160,630 Leisure Goods/Activities/Movies Term Loan B (2.00% Cash/6.50% PIK) Loan 1.00 % 1.00 % 6.50 % 8.50 % 7/2/2020 $ 893,447 867,647 56,582 Chemicals/Plastics Term Loan (First Lien) Loan 3.50 % 1.00 % 0.00 % 4.50 % 8/1/2021 $ 484,659 482,690 473,148 Chemicals/Plastics Term Loan (Second Lien) Loan 6.75 % 1.00 % 0.00 % 7.75 % 8/1/2022 $ 500,000 497,844 468,750 Chemicals/Plastics Term Loan B1A Loan 4.00 % 1.00 % 0.00 % 5.00 % 5/14/2021 $ 1,000,000 991,762 866,670 Healthcare & Pharmaceuticals Term Loan B Loan 3.00 % 0.75 % 0.00 % 3.75 % 9/26/2022 $ 1,000,000 997,602 987,780 Environmental Industries Term Loan B Loan 5.75 % 1.00 % 0.00 % 6.75 % 5/29/2020 $ 937,857 923,660 731,528 Retailers (Except Food and Drugs) New Term Loan Loan 3.75 % 1.25 % 0.00 % 5.00 % 7/9/2019 $ 965,081 963,406 719,951 Industrial Equipment Term Loan (First Lien) Loan 3.75 % 1.00 % 0.00 % 4.75 % 1/15/2021 $ 1,967,406 1,962,950 1,908,383 Automotive Tranche C Term Loan Loan 3.75 % 1.00 % 0.00 % 4.75 % 4/15/2021 $ 2,955,000 2,943,580 2,345,530 Financial Intermediaries First Data Corp T/L (2018 New Dollar) Loan 3.50 % 0.62 % 0.00 % 4.12 % 3/23/2018 $ 2,790,451 2,748,229 2,752,780 Financial Intermediaries First Data T/L Ext (2021) Loan 4.00 % 0.62 % 0.00 % 4.62 % 3/24/2021 $ 2,111,028 2,034,284 2,077,779 Banking, Finance, Insurance & Real Estate Term Loan Loan 4.00 % 0.75 % 0.00 % 4.75 % 12/1/2022 $ 1,500,000 1,470,946 1,412,504 Leisure Goods/Activities/Movies Term Loan B Loan 4.50 % 1.00 % 0.00 % 5.50 % 7/1/2020 $ 1,976,234 1,945,935 1,850,249 Nonferrous Metals/Minerals Loan Loan 3.25 % 1.00 % 0.00 % 4.25 % 6/28/2019 $ 1,962,387 1,962,515 1,504,738 Services: Business Term B Delayed Draw Loan Loan 3.00 % 1.00 % 0.00 % 4.00 % 11/6/2020 $ 199,120 198,391 187,344 Services: Business Term B Loan Loan 3.00 % 1.00 % 0.00 % 4.00 % 11/6/2020 $ 778,380 775,586 732,346 High Tech Industries Initial Dollar Term Loan Loan 3.25 % 1.00 % 0.00 % 4.25 % 7/30/2020 $ 2,451,137 2,445,005 2,016,452 Leisure Goods/Activities/Movies Term Loan (First Lien) Loan 3.25 % 1.00 % 0.00 % 4.25 % 7/5/2021 $ 493,750 488,813 433,883 Industrial Equipment Term Loan B Loan 2.75 % 0.75 % 0.00 % 3.50 % 5/31/2020 $ 693,858 684,537 676,511 Retailers (Except Food and Drugs) Amended Tranche B Term Loan Loan 2.50 % 0.75 % 0.00 % 3.25 % 3/4/2019 $ 4,131,271 4,121,165 4,012,497 Services: Business Term Loan (First Lien) Loan 3.75 % 1.25 % 0.00 % 5.00 % 5/26/2020 $ 2,725,318 2,717,647 2,237,023 Chemicals/Plastics Loan (Second Lien) Loan 3.00 % 0.75 % 0.00 % 3.75 % 4/30/2019 $ 2,000,000 1,974,077 2,005,000 Brokers/Dealers/Investment Houses Initial Term Loan Loan 2.75 % 1.00 % 0.00 % 3.75 % 1/4/2021 $ 1,264,036 1,259,418 1,191,354 Services: Business Term Loan (First Lien) Loan 5.00 % 1.00 % 0.00 % 6.00 % 6/1/2021 $ 1,974,982 1,941,456 1,959,340 Publishing Tranche B-4 Term Loan Loan 5.00 % 1.00 % 0.00 % 6.00 % 8/2/2019 $ 475,000 473,378 421,561 Healthcare & Pharmaceuticals Tranche B-4 Term Loan Loan 2.75 % 0.62 % 0.00 % 3.37 % 5/1/2018 $ 2,119,664 2,053,127 2,116,294 Building & Development Term Loan Loan 3.50 % 1.00 % 0.00 % 4.50 % 3/24/2022 $ 248,750 247,628 248,285 Retailers (Except Food and Drugs) Term Loan B Loan 4.00 % 1.00 % 0.00 % 5.00 % 12/10/2021 $ 249,370 246,940 244,929 Automotive Tranche B-1 Term Loan Loan 2.75 % 1.00 % 0.00 % 3.75 % 3/12/2018 $ 2,910,000 2,933,230 2,879,998 Containers/Glass Products Term Loan Loan 4.25 % 1.00 % 0.00 % 5.25 % 5/8/2020 $ 1,970,000 1,955,325 1,915,825 Beverage, Food & Tobacco Term Loan B (First Lien) Loan 3.50 % 1.00 % 0.00 % 4.50 % 8/3/2022 $ 997,500 995,241 983,784 Chemicals/Plastics Term Loan B (First Lien) Loan 3.00 % 0.62 % 0.00 % 3.62 % 4/19/2019 $ 3,840,541 3,814,577 3,727,245 Services: Business Term Loan B Loan 3.25 % 1.00 % 0.00 % 4.25 % 6/30/2021 $ 491,196 489,277 465,757 Services: Business Tranche B-5 Term Loan Loan 2.75 % 1.00 % 0.00 % 3.75 % 6/3/2020 $ 2,188,296 2,174,333 2,015,049 Services: Business Term Loan Loan 5.00 % 1.00 % 0.00 % 6.00 % 10/29/2021 $ 1,979,592 1,971,967 1,961,439 High Tech Industries Term Loan B Loan 3.50 % 1.00 % 0.00 % 4.50 % 8/5/2022 $ 498,750 497,554 468,411 Retailers (Except Food and Drugs) Term B-1 Loan Retired 03/05/2014 Loan 3.00 % 1.00 % 0.00 % 4.00 % 3/5/2021 $ 955,481 955,481 639,379 Aerospace and Defense First Lien 6/14 Loan 3.50 % 1.00 % 0.00 % 4.50 % 6/19/2021 $ 492,727 491,745 434,832 Retailers (Except Food and Drugs) Term Loan (First Lien) Loan 5.00 % 1.00 % 0.00 % 6.00 % 5/9/2022 $ 995,000 990,362 925,350 Healthcare & Pharmaceuticals Dollar Term D-1 Loan Loan 3.50 % 1.00 % 0.00 % 4.50 % 5/4/2018 $ 2,452,586 2,436,004 2,392,645 Services: Business Term Loan Loan 6.50 % 1.00 % 0.00 % 7.50 % 5/15/2020 $ 2,965,050 2,942,458 2,683,370 Chemicals/Plastics Term Loan (Initial) Loan 5.00 % 1.00 % 0.00 % 6.00 % 1/6/2022 $ 2,500,000 2,252,500 2,250,000 Banking, Finance, Insurance & Real Estate Term Loan B (2022) Loan 4.00 % 0.75 % 0.00 % 4.75 % 11/21/2022 $ 2,000,000 1,980,543 1,900,000 Containers/Glass Products Term Loan Loan 3.50 % 1.00 % 0.00 % 4.50 % 7/31/2021 $ 493,750 491,750 475,234 Retailers (Except Food and Drugs) Term B Loan Loan 2.75 % 1.00 % 0.00 % 3.75 % 1/28/2020 $ 486,250 486,250 479,792 Retailers (Except Food and Drugs) Term Loan B-2 Loan 3.00 % 1.00 % 0.00 % 4.00 % 1/28/2020 $ 1,212,794 1,208,220 1,201,042 High Tech Industries Term Loan Loan 3.75 % 1.00 % 0.00 % 4.75 % 7/8/2021 $ 992,447 987,851 950,268 Electronics/Electric Term Loan B Loan 4.50 % 0.75 % 0.00 % 5.25 % 1/15/2023 $ 2,183,824 2,119,162 2,180,177 Automotive Term Loan (Initial) Loan 3.50 % 1.00 % 0.00 % 4.50 % 8/18/2021 $ 246,875 245,802 244,098 Healthcare & Pharmaceuticals Term Loan Loan 2.75 % 1.00 % 0.00 % 3.75 % 3/31/2021 $ 376,136 375,400 366,500 Services: Business Term Loan Loan 4.00 % 1.00 % 0.00 % 5.00 % 5/29/2020 $ 985,000 977,601 886,500 Healthcare & Pharmaceuticals Term Loan B Loan 3.75 % 1.00 % 0.00 % 4.75 % 8/14/2021 $ 987,526 984,296 959,549 Retailers (Except Food and Drugs) Term Loan (Second Lien) Loan 5.75 % 1.00 % 0.00 % 6.75 % 3/11/2022 $ 250,000 249,729 218,750 Cable and Satellite Television Term Loan Loan 4.00 % 1.00 % 0.00 % 5.00 % 10/7/2022 $ 1,000,000 985,784 989,750 Healthcare & Pharmaceuticals Term Loan Loan 6.50 % 1.00 % 0.00 % 7.50 % 12/21/2020 $ 2,007,042 1,811,375 1,822,655 Electronics/Electric Term Loan B Loan 2.75 % 0.75 % 0.00 % 3.50 % 10/30/2020 $ 985,022 974,747 939,464 Banking, Finance, Insurance & Real Estate Term Loan B Loan 3.88 % 0.75 % 0.00 % 4.63 % 1/30/2023 $ 2,000,000 1,930,000 1,950,000 Conglomerate Term Loan B Loan 3.25 % 0.75 % 0.00 % 4.00 % 6/2/2022 $ 4,771,058 4,749,389 4,440,090 Aerospace and Defense Term Loan (200MM) Loan 5.00 % 1.00 % 0.00 % 6.00 % 10/16/2022 $ 2,000,000 1,980,636 1,940,000 Aerospace and Defense Term Loan (2nd Lien) Loan 8.50 % 1.00 % 0.00 % 9.50 % 9/29/2023 $ 1,000,000 990,269 950,000 Food Services Term Loan (2013) Loan 3.75 % 1.00 % 0.00 % 4.75 % 12/28/2018 $ 481,250 481,250 472,829 Utilities Term Loan (2013) Loan 2.00 % 0.75 % 0.00 % 2.75 % 7/2/2018 $ 3,821,925 3,808,282 3,751,449 Broadcast Radio and Television Term Loan B-5 Loan 3.81 % 0.75 % 0.00 % 4.56 % 7/31/2022 $ 997,500 995,164 953,171 Chemicals/Plastics Term Loan Loan 4.00 % 1.25 % 0.00 % 5.25 % 4/7/2017 $ 789,045 789,045 774,645 Healthcare & Pharmaceuticals Term Loan (First Lien 2013) Loan 4.00 % 1.00 % 0.00 % 5.00 % 6/7/2019 $ 3,832,558 3,821,232 3,244,912 Healthcare & Pharmaceuticals Term Loan B Loan 3.75 % 1.00 % 0.00 % 4.75 % 10/1/2021 $ 493,749 490,644 459,435 Services: Business Term B Loan Loan 5.00 % 1.25 % 0.00 % 6.25 % 10/30/2017 $ 2,944,496 2,943,282 2,811,994 Food/Drug Retailers Term Borrowing Loan 3.25 % 1.00 % 0.00 % 4.25 % 6/24/2019 $ 1,432,750 1,427,110 1,336,039 Services: Business Term Loan (First Lien) Loan 4.00 % 1.00 % 0.00 % 5.00 % 10/30/2020 $ 980,000 976,133 774,200 Chemicals/Plastics Term Loan B Loan 3.75 % 1.00 % 0.00 % 4.75 % 4/13/2022 $ 248,125 246,994 218,350 Retailers (Except Food and Drugs) Term Loan B-1 Loan 4.75 % 1.00 % 0.00 % 5.75 % 1/15/2023 $ 1,000,000 980,217 978,590 Retailers (Except Food and Drugs) Term Loan B-2 Loan 5.00 % 0.62 % 0.00 % 5.62 % 1/15/2023 $ 1,000,000 980,216 978,960 Retailers (Except Food and Drugs) Term Loan B1 Loan 3.25 % 1.00 % 0.00 % 4.25 % 3/11/2022 $ 992,500 987,862 961,176 Financial Intermediaries Term Loan Loan 4.75 % 1.00 % 0.00 % 5.75 % 9/29/2020 $ 954,643 947,123 941,917 Conglomerate Term Loan Loan 3.25 % 1.00 % 0.00 % 4.25 % 8/18/2022 $ 1,920,848 1,911,850 1,872,346 Healthcare & Pharmaceuticals Term Loan Loan 3.75 % 1.00 % 0.00 % 4.75 % 6/16/2021 $ 492,500 490,535 458,025 Healthcare & Pharmaceuticals Term Loan B Loan 4.50 % 1.00 % 0.00 % 5.50 % 6/6/2022 $ 498,750 496,371 498,127 Food Products New Term Loan G Loan 2.25 % 0.75 % 0.00 % 3.00 % 4/29/2020 $ 2,581,332 2,577,286 2,553,737 Leisure Goods/Activities/Movies Term Loan Loan 3.75 % 1.00 % 0.00 % 4.75 % 3/31/2021 $ 2,417,118 2,410,079 2,368,776 Services: Business Term Loan B Loan 5.25 % 1.25 % 0.00 % 6.50 % 7/1/2019 $ 724,167 721,080 716,020 Services: Business Term Loan Loan 4.25 % 1.00 % 0.00 % 5.25 % 2/2/2022 $ 1,902,292 1,846,615 1,816,688 Services: Business Term Loan Loan 4.00 % 1.00 % 0.00 % 5.00 % 7/1/2021 $ 1,995,000 1,985,640 1,924,178 Services: Business Term Loan Loan 3.25 % 1.00 % 0.00 % 4.25 % 10/1/2021 $ 938,354 936,008 886,745 Services: Business Term Loan (Second Lien) Loan 7.25 % 1.00 % 0.00 % 8.25 % 10/3/2022 $ 500,000 497,866 400,000 Electronics/Electric Initial Dollar Term Loan (First Lien) Loan 3.50 % 1.00 % 0.00 % 4.50 % 12/3/2020 $ 490,000 487,461 482,444 Services: Consumer Term Loan Loan 3.00 % 0.75 % 0.00 % 3.75 % 4/1/2022 $ 497,500 496,320 496,256 Media Term Loan B Loan 4.50 % 1.00 % 0.00 % 5.50 % 3/18/2021 $ 2,058,445 2,048,627 1,996,692 Industrial Equipment Term B Loan Loan 3.00 % 1.00 % 0.00 % 4.00 % 8/21/2020 $ 1,630,123 1,631,387 1,557,647 Industrial Equipment Incremental U.S. Term Loan Loan 3.50 % 1.00 % 0.00 % 4.50 % 12/1/2018 $ 1,910,551 1,910,551 1,902,946 Technology Term Loan B Loan 5.00 % 1.00 % 0.00 % 6.00 % 2/25/2022 $ 992,500 988,224 970,873 Services: Business Term Loan (First Lien) Loan 4.50 % 1.25 % 0.00 % 5.75 % 2/8/2018 $ 1,901,835 1,889,759 1,889,150 Electronics/Electric Tranche B-3 Term Loan Loan 3.00 % 0.75 % 0.00 % 3.75 % 7/2/2021 $ 1,477,500 1,471,640 1,422,094 Chemicals/Plastics Term Loan (First Lien) Loan 3.50 % 1.00 % 0.00 % 4.50 % 6/20/2022 $ 497,500 495,187 479,675 Chemicals/Plastics Term Loan (Second Lien) Loan 7.50 % 1.00 % 0.00 % 8.50 % 6/19/2023 $ 500,000 496,388 478,335 Financial Intermediaries Term B-4 Term Loan Loan 2.75 % 0.75 % 0.00 % 3.50 % 11/9/2020 $ 5,155,193 5,155,193 5,132,665 Telecommunications Term Loan B1 Loan 4.75 % 0.75 % 0.00 % 5.50 % 12/2/2022 $ 825,000 808,500 800,770 Telecommunications Term Loan B2 Loan 4.75 % 0.75 % 0.00 % 5.50 % 12/2/2022 $ 675,000 661,500 655,175 Industrial Equipment Term Loan (First Lien) Loan 4.00 % 1.00 % 0.00 % 5.00 % 3/27/2021 $ 982,500 978,645 707,400 Electronics/Electric Term Loan B2 Loan 5.00 % 1.00 % 0.00 % 6.00 % 10/1/2021 $ 990,000 981,872 904,613 High Tech Industries Term Loan (First Lien) Loan 5.00 % 1.00 % 0.00 % 6.00 % 10/30/2022 $ 1,977,528 1,939,305 1,937,978 Oil & Gas Term Loan B Loan 3.00 % 1.00 % 0.00 % 4.00 % 2/21/2021 $ 987,406 919,799 407,305 Utilities Term Loan (First Lien) Loan 3.25 % 1.25 % 0.00 % 4.50 % 5/9/2017 $ 1,905,121 1,902,477 1,826,534 Conglomerate Tranche B Term Loan Loan 3.25 % 1.00 % 0.00 % 4.25 % 7/1/2021 $ 1,975,000 1,959,254 1,956,889 Food Services Term Loan (First Lien) Loan 3.94 % 1.00 % 0.00 % 4.94 % 6/30/2021 $ 987,500 985,421 952,938 Telecommunications Term Loan Loan 5.50 % 1.00 % 0.00 % 6.50 % 9/18/2021 $ 1,995,000 1,976,131 1,931,160 Chemicals/Plastics Term Loan (First Lien) Loan 3.75 % 1.00 % 0.00 % 4.75 % 12/10/2020 $ 222,750 222,282 220,801 Chemicals/Plastics Initial US Term Loan Loan 3.75 % 1.00 % 0.00 % 4.75 % 12/10/2020 $ 1,262,250 1,259,600 1,251,205 Electronics/Electric Term Loan (Closing Date) Loan 3.75 % 1.00 % 0.00 % 4.75 % 9/30/2022 $ 1,995,000 1,985,507 1,911,469 Services: Business Term Loan B (First Lien) Loan 6.75 % 1.00 % 0.00 % 7.75 % 10/31/2019 $ 1,937,500 1,891,680 1,541,281 Industrial Equipment Term Loan (First Lien) Loan 3.00 % 1.00 % 0.00 % 4.00 % 4/10/2020 $ 2,904,577 2,896,630 2,207,479 Retailers (Except Food and Drugs) Term Loan 1/16 Loan 4.00 % 0.75 % 0.00 % 4.75 % 4/23/2021 $ 1,000,000 990,308 992,130 Food Services Term Loan Loan 3.75 % 1.00 % 0.00 % 4.75 % 3/19/2021 $ 965,341 957,952 946,034 Publishing Loan Loan 8.60 % 3.00 % 0.00 % 11.60 % 12/30/2016 $ 222,900 220,105 67,520 Services: Business Term Loan B Loan 5.00 % 1.00 % 0.00 % 6.00 % 12/16/2020 $ 992,500 990,554 970,169 High Tech Industries Term Loan Loan 3.25 % 1.00 % 0.00 % 4.25 % 3/20/2020 $ 1,272,143 1,270,803 1,253,061 Telecommunications Initial Term Loan Loan 3.00 % 1.00 % 0.00 % 4.00 % 4/23/2019 $ 479,913 476,927 311,944 Services: Business Term Loan B Loan 6.00 % 1.00 % 0.00 % 7.00 % 1/3/2023 $ 1,860,000 1,805,035 1,804,200 Food Services Term Loan B Loan 4.25 % 1.00 % 0.00 % 5.25 % 7/15/2020 $ 1,651,816 1,647,936 1,636,669 Media Term Loan B Loan 3.25 % 1.00 % 0.00 % 4.25 % 4/1/2022 $ 932,522 928,333 915,624 Utilities Term Loan B Loan 4.50 % 1.00 % 0.00 % 5.50 % 10/2/2021 $ 1,491,826 1,433,943 1,396,722 Aerospace and Defense Tranche C Term Loan Loan 3.00 % 0.75 % 0.00 % 3.75 % 2/28/2020 $ 4,277,294 4,283,815 4,148,975 Hotel, Gaming and Leisure Term Loan B Loan 6.00 % 1.00 % 0.00 % 7.00 % 12/7/2020 $ 1,946,300 1,939,729 1,917,107 Containers/Glass Products Term Loan Loan 3.00 % 1.00 % 0.00 % 4.00 % 5/3/2018 $ 1,836,625 1,831,636 1,776,935 Healthcare & Pharmaceuticals New Tranche B Term Loan Loan 3.25 % 1.25 % 0.00 % 4.50 % 6/6/2019 $ 482,603 476,598 480,494 Lodging & Casinos Term Loan B Loan 4.25 % 1.00 % 0.00 % 5.25 % 7/10/2020 $ 886,192 887,853 875,673 Services: Business Delayed Draw Loan Loan 5.00 % 1.25 % 0.00 % 6.25 % 7/28/2017 $ 156,888 156,328 155,973 Services: Business Term B Loan Loan 5.00 % 1.25 % 0.00 % 6.25 % 7/28/2017 $ 921,426 918,393 916,054 Chemicals/Plastics Term B Loan Loan 3.25 % 1.00 % 0.00 % 4.25 % 7/1/2022 $ 2,992,500 2,978,573 2,840,810 Telecommunications Replacement First-Lien Term Loan Loan 3.00 % 1.00 % 0.00 % 4.00 % 3/1/2020 $ 2,916,556 2,903,859 2,832,705 Drugs Series D2 Term Loan B Loan 2.75 % 0.75 % 0.00 % 3.50 % 2/13/2019 $ 2,545,588 2,539,315 2,385,700 Services: Business Term Loan Loan 2.75 % 0.75 % 0.00 % 3.50 % 9/6/2019 $ 1,014,058 1,011,203 1,005,692 Services: Business Term Loan (2013) Loan 3.25 % 1.00 % 0.00 % 4.25 % 10/3/2019 $ 2,484,603 2,484,603 2,452,775 Healthcare & Pharmaceuticals Term Loan Loan 5.25 % 1.00 % 0.00 % 6.25 % 2/13/2023 $ 1,000,000 970,144 993,750 Industrial Equipment Term Loan Loan 3.75 % 1.00 % 0.00 % 4.75 % 6/27/2021 $ 492,500 490,508 478,134 Services: Business U.S. Term Loan (First Lien) Loan 4.50 % 1.25 % 0.00 % 5.75 % 12/20/2018 $ 1,736,392 1,749,291 1,475,934 Telecommunications Term B-10 Loan Loan 2.50 % 0.75 % 0.00 % 3.25 % 6/30/2018 $ 2,534,892 2,558,782 2,490,861 Chemicals/Plastics Term Loan B Loan 4.75 % 1.00 % 0.00 % 5.75 % 6/27/2022 $ 2,985,000 2,971,139 2,932,763 $ 303,643,756 $ 284,844,789 Principal Cost Fair Value $ 2,349,633 $ 2,349,633 $ 2,349,633 $ 2,349,633 $ 2,349,633 $ 2,349,633 28, 201329, 2016.
Shares
February 28, 2014
February 28, 2013
February 29, 2012 For the year
ended
February 28,
2017 For the year
ended
February 29,
2016 For the year
ended
February 28,
2015 $ (5,232,690 ) $ 104,587 $ 793,848 358,169 419,096 620,817 13,458,113 (16,277,895 ) (3,874,583 ) 8,583,592 (15,754,212 ) (2,459,918 ) 8,583,592 (15,754,212 ) (2,459,918 ) (21,557,368 ) (5,803,156 ) (3,343,238 ) $ (12,973,776 ) $ (21,557,368 ) $ (5,803,156 )
February 28, 2014
February 28, 2013
February 29, 2012 For the year
ended
February 28,
2017 For the year
ended
February 29,
2016 For the year
ended
February 28,
2015 $ 8,583,592 $ (15,754,212 ) $ (2,459,918 ) (288,557 ) (56,830 ) (167,097 ) (543,181 ) (280,310 ) (454,809 ) 829,475 955,858 953,862 6,143,816 — — (358,169 ) (419,096 ) (620,817 ) (13,458,113 ) 16,277,895 3,874,583 161,551,546 142,862,138 141,358,326 (154,519,385 ) (147,989,317 ) (138,738,379 ) 254,697 (407,925 ) 160,315 1,186,831 (572,144 ) (318,421 ) (6,049 ) — 91,336 405,417 (5,846 ) 9,410 2,307,698 1,909,523 (4,230,669 ) (50,787 ) (949 ) 10,904 51,877 (949 ) 10,904 12,090,708 (3,482,164 ) (520,470 ) 282,320,000 — — (282,457,781 ) — (1,666,666 ) (1,256,005 ) — — (1,393,786 ) — (1,666,666 ) 10,696,922 (3,482,164 ) (2,187,136 ) 2,349,633 5,831,797 8,018,933 $ 13,046,555 $ 2,349,633 $ 5,831,797 $ 12,169,421 $ 11,702,603 $ 9,625,726 $ 288,557 $ 56,830 $ 167,097 $ 543,181 $ 280,310 $ 454,809 $ 829,475 $ 955,858 $ 953,862 2014,2017, Saratoga Investment Corp. owned 100% of the Subordinated Notes of the CLO.SARATOGA INVESTMENT CORP. CLO 2013-1, LTD.NOTES TO FINANCIAL STATEMENTS20142017 and February 28, 2013,29, 2016, cash and cash equivalents amounted to $8.0$13.0 million and $28.8$2.3 million, respectively, and are swept on an overnight basis into a money market deposit account and invested in shares of JP Morgan Liquidity Institutional fund held at the Trustee.Financial Accounting Standards Board (“FASB”) Accounting Standards Codification (“ASC”)FASB ASC Topic 820, Fair Value Measurements and Disclosures (“ASC 820”). ASC 820 defines fair value, establishes a framework for measuring fair value, establishes a fair value hierarchy based on the quality of inputs used to measure fair value and enhances disclosure requirements for fair value measurements. ASC 820 requires the Issuer to assume that its investments are to be sold at the Statementstatement of Assetsassets and Liabilitiesliabilities date in the principal market to independent market participants, or in the absence of a principal market, in the most advantageous market, which may be a hypothetical market. Market participants are defined as buyers and sellers in the principal or most advantageous market that are independent, knowledgeable, and willing and able to transact.SARATOGA INVESTMENT CORP. CLO 2013-1, LTD.NOTES TO FINANCIAL STATEMENTSPaid-in-KindPayment-in-Kind InterestPIKpayment-in-kind (“PIK”) interest provision. The PIK interest, which represents contractually deferred interest added to the investment balance that is generally due at maturity, is generally recorded on the accrual basis to the extent such amounts are expected to be collected. We stop accruing PIK interest if we do not expect the issuer to be able to pay all principal and interest when due.$2.2$1.2 million as of February 28, 20142017 and $1.7 million as of February 29, 2016 are structuring fees of the investment bank, rating agency fees and legal fees associated with the issuance of the 2013-1 CLO Notes on October 17, 2013. Such costs have been capitalized and amortized using an effective yield method, over the life of the related notes.$1.6$1.5 million, incurred in connection with the issuance of the Secured2013-1 CLO Notes, were expensed when the Secured2013-1 CLO Notes were extinguished on October 17, 2013.Deferred debt financing cost of $2.1 million as of February 28, 2013 included structuring fees of the investment bank, rating agency fees and legal fees associated with the associated with the establishment of the Issuer in 2007. Such costs have been capitalized and amortized using an effective yield method, over the life of the facility.SARATOGA INVESTMENT CORP. CLO 2013-1, LTD.NOTES TO FINANCIAL STATEMENTSFee Basis Amountfee basis amount at the beginning of the Collection Period.period. The Subordinated Management Fee is payable in arrears quarterly (subject to availability of funds and to the Priority of Payments) and prior to the second refinancing and the issuance of the 2013-1 Amended CLO Notes, was payable in an amount equal to 0.25% per annum of the Fee Basis Amountfee basis amount at the beginning of the Collection Period. TheSubsequent to the second refinancing and the issuance of the 2013-1 Amended CLO Notes, the Base Management Fee was changed to be payable in an amount equal to 0.10% per annum of the fee basis amount at the beginning of the Collection period, and the Subordinated Management Fees was changed to be payable in an amount equal to 0.40% per annum of the fee basis amount at the beginning of the Collection period. Throughout, the Incentive Management Fee equals 20%20.0% of the remaining interest proceeds and principal proceeds, if any, after the Subordinated Notes have realized the incentive management fee target return of 12.0%, in accordance with the Priority of Payments after making the prior distributions on the relevant payment date. For the years ended February 28, 2014 and 2013,2017, February 29, 2016 and February 29, 2012,28, 2015, no Incentive Management Fee’sFees have been paid.2014 and 2013,2017, February 29, 2016 and February 29, 2012,28, 2015, the Issuer paid $0.1 million, $0.1 million, and $0.1 million, respectively, for trustee services provided and is included in other expenses inon the Statementstatements of Operations.2014 and 2013,2017, February 29, 2016 and February 29, 2012, $5.728, 2015, $4.7 million, $8.8$5.6 million and $7.9$3.7 million of payments to the Subordinated Notes were included in interest expense inon the Statementstatements of Operations,operations, respectively.SARATOGA INVESTMENT CORP. CLO 2013-1, LTD.NOTES TO FINANCIAL STATEMENTS···SARATOGA INVESTMENT CORP. CLO 2013-1, LTD.NOTES TO FINANCIAL STATEMENTS2014,2017, according to the fair value hierarchy: Fair Value Measurements Level 1 Level 2 Level 3 Total $ — $ 241,228,228 $ 51,209,702 $ 292,437,930 — — 22,718 22,718 $ — $ 241,228,228 $ 51,232,420 $ 292,460,648 28, 2013,29, 2016, according to the fair value hierarchy: Fair Value Measurements Level 1 Level 2 Level 3 Total $ — $ 239,255,853 $ 45,397,073 $ 284,652,926 — 190,095 1,768 191,863 $ — $ 239,445,948 $ 45,398,841 $ 284,844,789 2014:2017:
Securities Term Loans Equity Interest Total $ 45,397,073 $ 1,768 $ 45,398,841 2,181,976 (169,145 ) 2,012,831 23,317,031 — 23,317,031 (10,891,325 ) — (10,891,325 ) 95,892 — 95,892 6,387,646 190,095 6,577,741 (15,278,591 ) — (15,278,591 ) $ 51,209,702 $ 22,718 $ 51,232,420 (1)The Issuer’s investment in Tectum Holdings Inc. was transferred into Level 2 during the year ended February, 28, 2014, as the reliability of market quotes became available for this investment and have been subsequently used for valuation purposes.(1) The Issuer’s investment in Level 3 investments were classified as such during the year ended February 28, 2017, as market quotes for these investments are only provided by one trading desk. (2) The Issuer’s investment into Level 2 investments were classified as such during the year ended February 28, 2017, as the number of observable market quotes for these investments increased. SARATOGA INVESTMENT CORP. CLO 2013-1, LTD.NOTES TO FINANCIAL STATEMENTS28, 2013:29, 2016:
Securities Term Loans Equity Interest Total $ — $ — $ — (2,839,083 ) (615,683 ) (3,454,766 ) 19,713,411 — 19,713,411 (10,930,430 ) — (10,930,430 ) 6,887 — 6,887 39,446,288 617,451 40,063,739 $ 45,397,073 $ 1,768 $ 45,398,841 (2)The Issuer’s investment in PATS Aircraft, LLC was transferred into Level 3 during the year ended February, 28, 2013 due to changes in liquidity. These changes impacted the Investment Manager’s ability to obtain observable market information. Accordingly, the determination of fair value for this investment required significant management judgment and estimation, resulting in a Level 3 classification for the year ended February 28, 2013.(1) The Issuer’s investment in Level 3 investments were classified as such during the year ended February 29, 2016, as market quotes for these investments are only provided by one trading desk. lossappreciation on levelLevel 3 investments held as of February 28, 2014 and February 28, 2013,2017 was $0.02$2.1 million, and $1.8 million, respectively, and is included in net unrealized appreciation (depreciation) on investments in the Statementsstatements of Operations.operations. The net unrealized depreciation on Level 3 investments held as of February 29, 2016 was $3.4 million, and is included in net unrealized appreciation (depreciation) on investments in the statements of operations.20132017 were as follows:Fair Value Range 51,209,702 Market Comparables Third-Party Bid 93.00% - 101.63% 22,718 Market Comparables Third-Party Bid 0.01% - 1.06% SignificantThe valuation techniques and significant unobservable inputs used in therecurring Level 3 fair value measurementmeasurements of the Issuer’s term loans and structured finance securities include comparable market yields. For investments utilizing a yield analysis valuation technique, a significant increase (decrease) in the market yield, in isolation, would result in a significantly lower (higher) fair value measurement.assets as of February 29, 2016 were as follows:Fair Value Range 45,397,073 Market Comparables Third-Party Bid 32.00% - 100.00% 1,768 Market Comparables Third-Party Bid 0.01% - 12.83% SARATOGA INVESTMENT CORP. CLO 2013-1, LTD.NOTES TO FINANCIAL STATEMENTSGenerally, a change in the assumption for comparable yields is accompanied by a directionally opposite change in the assumption used for pricing.Significant unobservable inputs used in the fair value measurement of the Issuer’s equity interests include EBITDA multiples. For investments utilizing EBITDA multiples, a significant increase (decrease) in the EBITDA multiple, in isolation, would result in a significant higher (lower) fair value measurement.TableThe table below sets forth certain information for each outstanding class of Contentsnotes issued, pursuant to the Indenture on November 15, 2016, at February 28, 2017:SARATOGA INVESTMENT CORP. CLO 2013-1, LTD.NOTES TO FINANCIAL STATEMENTS Interest Rate Maturity Principal
Amount Amount
Outstanding LIBOR + 1.55% October 20, 2025 $ 170,000,000 $ 170,000,000 LIBOR + 1.75% October 20, 2025 20,000,000 20,000,000 LIBOR + 2.70% October 20, 2025 44,800,000 44,800,000 LIBOR + 3.36% October 20, 2025 16,000,000 16,000,000 LIBOR + 4.70% October 20, 2025 14,000,000 14,000,000 LIBOR + 6.65% October 20, 2025 13,100,000 13,100,000 LIBOR + 8.50% October 20, 2025 4,500,000 4,500,000 N/A October 20, 2025 30,000,000 30,000,000 $ 312,400,000 $ 312,400,000 28, 2014:29, 2016:
Amount
OutstandingThe table below sets forth certain information for each outstanding class of notes issued, pursuant to the Indenture on January 22, 2008, at February 28, 2013:
Amount
Outstanding Interest Rate Maturity Principal
Amount Amount
Outstanding LIBOR + 1.30% October 20, 2023 $ 170,000,000 $ 170,000,000 LIBOR + 1.50% October 20, 2023 20,000,000 20,000,000 LIBOR + 2.00% October 20, 2023 44,800,000 44,800,000 LIBOR + 2.90% October 20, 2023 16,000,000 16,000,000 LIBOR + 3.50% October 20, 2023 14,000,000 14,000,000 LIBOR + 4.50% October 20, 2023 13,100,000 13,100,000 LIBOR + 5.75% October 20, 2023 4,500,000 4,500,000 N/A October 20, 2023 30,000,000 30,000,000 $ 312,400,000 $ 312,400,000 2014:2017: February 28, 2017 $ 171,229,950 20,221,460 45,715,309 16,286,880 14,242,508 13,145,915 4,499,379 10,950,249 $ 296,291,650 February 29, 2016 $ 168,738,419 19,899,837 43,780,120 14,987,621 12,941,289 10,358,170 3,027,150 12,827,980 $ 286,560,586 SARATOGA INVESTMENT CORP. CLO 2013-1, LTD.NOTES TO FINANCIAL STATEMENTSThe following table shows each outstanding class of notes issued, pursuant to the Indenture, at fair value at February 28, 2013:2014,2017, February 29, 2016 and February 28, 2013 and February 29, 2012:2015: Weighted Average Interest Rate Interest Rate February 28,
2017 February 29,
2016 February 28,
2015 LIBOR + 1.05% N/A N/A 1.28 % LIBOR + 1.55% 2.10 % 1.62 % 1.53 % LIBOR + 1.75% 2.30 % 1.82 % 1.73 % LIBOR + 2.70% 2.96 % 2.32 % 2.23 % LIBOR + 3.36% 3.78 % 3.22 % 3.13 % LIBOR + 4.70% 4.64 % 3.82 % 3.73 % LIBOR + 6.65% 5.98 % 4.82 % 4.73 % LIBOR + 8.50% 7.45 % 6.07 % 5.98 % N/A N/A N/A N/A SARATOGA INVESTMENT CORP. CLO 2013-1, LTD.NOTES TO FINANCIAL STATEMENTS2014,2017, the remaining unamortized discount on the Class X, Class A-1 Notes, Class A-2 Notes, Class B Notes, Class C Notes, Class D Notes, Class E Notes, and Class F Notes were $0.0 million, $1.7$0.0 million, $0.2$0.0 million, $1.1$0.1 million, $0.4 million, $0.0 million, and $0.0 million, respectively.$0.9 million, $1.7$1.4 million, and $0.6$0.5 million, respectively.Secured2013-1 CLO Notes, of $1.6$1.5 million, and unamortized discount on the Secured2013-1 CLO Notes of $1.8$4.6 million, were recognized as additional amortization expense when the related notes were extinguished and recorded within loss on extinguishment of debt in the Statementstatements of Operations.operations. As of February 28, 2017, $1.3 million of financing costs related to the 2013-1 Amended CLO Notes have been capitalized and are being amortized over the term of the 2013-1 Amended CLO Notes.(2011 — 2014)(2013—2016). The Issuer identifies its major tax jurisdictions as U.S. Federal, state and foreign jurisdictions where the Issuer makes investments. As of February 28, 20142017 and 2013,February 29, 2016, there was no impact to the financial statementsSARATOGA INVESTMENT CORP. CLO 2013-1, LTD.NOTES TO FINANCIAL STATEMENTS2014 and 2013,2017, February 29, 2016 and February 29, 2012.28, 2015. Also, the Issuer recognizes interest and, if applicable, penalties for any uncertain tax positions, as a component of income tax expense. No interest or penalty expense was recorded by the Issuer for the years ended February 28, 2014 and 2013,2017, February 29, 2016 and February 29, 2012.28, 2015.20142017 and 2013,February 29, 2016, the Issuer is not subject to any material legal proceedings.2014 and 2013,2017, the Issuer had $0.5 million of unfunded commitments. At February 29, 2016, the Issuer had no unfunded commitments.2014 and 2013,2017, February 29, 2016 and February 29, 2012,28, 2015, the Issuer neither bought nonor sold investments from related parties and sold investments fair valued at $0.3 million, $0.0 million and $15.6 million, respectively, to the Investment Manager.parties.rates,rate, but are entitled to residual cash flows from the CLO’s investments after all of the other tranches of debt and certain other fees and expenses are paid. For the years ended February 28, 2014 and 2013,2017, February 29, 2016 and February 29, 2012, $5.728, 2015, $4.7 million, $8.8$5.6 million, and $7.9$3.7 million of payments to the Subordinated Notes were included in interest expense in the Statementstatements of Operations,operations, respectively. In addition to refinancing its liabilities, the Investment Manager also purchased $4.5 million in aggregate principal amount of the Class F notes tranche of the Saratoga CLO at par, with a coupon of LIBOR plus 8.5%.SARATOGA INVESTMENT CORP. CLO 2013-1, LTD.NOTES TO FINANCIAL STATEMENTS20142017 and February 28, 2013,29, 2016, net assets were $(3.3)$(13.0) million and $0.8$(21.6) million, respectively. These amounts include accumulated gainslosses of $0.8$(21.6) million and accumulated losses of $(6.0)$(5.8) million, respectively, which includes cumulative net investment income or loss, cumulative amounts of gains and losses realized from investment transactions, net unrealized appreciation or depreciation of investments, as well as the cumulative effect of accounting mismatches between investments accounted for at fair value and amortized cost or accrual-basis assets and liabilities as discussed in Significant Accounting Policies, above. The Issuer’s investments continue to generate sufficient liquidity to satisfy its obligations on periodic payment dates as well as comply with all performance criteria as of the Statementsstatements of Assetsassets and Liabilitiesliabilities date.2013 and February 29, 2012:28, 2013:
2014
2013
2012 February 28,
2017 February 29,
2016 February 28,
2015 February 28,
2014 February 28,
2013
balance(1) $ 15,113,353 $ 18,382,072 $ 25,077,372 $ 28,471,910 $ 27,165,497 162.55 % (49.59 )% 5.34 % 4.65 % 73.51 % (34.62 )% 0.57 % 3.17 % (7.53 )% 3.80 % 141.14 % 79.34 % 49.79 % 65.27 % 70.97 % 3.87 % 4.07 % 3.03 % 1.82 % 1.47 % 6.04 % 4.07 % 3.03 % 4.42 % 5.89 % (1) Subordinated notes’ capital balance is calculated based on the sum of the subordinated notes outstanding amount and total net assets, net of ordinary equity. (2) Total return is calculated based on a time-weighted rate of return methodology. Quarterly rates of return are compounded to derive the total return reflected above. Total return is calculated for the subordinated notes’ capital taken as a whole and assumes the purchase of the subordinated notes’ capital on the first day of the period and the sale of the last day of the period. (3) Calculated based on the average subordinated notes’ capital balance. (1)Subordinated notes’ capital balance is calculated based on the sum of the subordinated notes outstanding amount and total net assets, net of ordinary equity.(2)Total return is calculated based on a time-weighted rate of return methodology. Quarterly rates of return are compounded to derive the total return reflected above. Total return is calculated for the subordinated notes’ capital taken as a whole and assumes the purchase of the subordinated notes’ capital on the first day of the period and the sale of the last day of the period.(3)Calculated based on the average subordinated notes’ capital balance.SARATOGA INVESTMENT CORP. CLO 2013-1, LTD.NOTES TO FINANCIAL STATEMENTS20142017 through May 27, 2014,16, 2017, the date the financial statements were available for issuance. The Investment Manager has determined that there are no material events that would require the disclosure in the financial statements.