UNITED STATES
SECURITIES AND EXCHANGE COMMISSION
WASHINGTON, D.C. 20549
FORM 10-K
(Mark One)
xANNUAL REPORT PURSUANT TO SECTION 13 OR 15(d) OF THE SECURITIES EXCHANGE ACT OF 1934
| |
☒ | ANNUAL REPORT PURSUANT TO SECTION 13 OR 15(d) OF THE SECURITIES EXCHANGE ACT OF 1934 |
For the fiscal year ended December 31, 20152017
OR
oTRANSITION REPORT PURSUANT TO SECTION 13 OR 15(d) OF THE SECURITIES EXCHANGE ACT OF 1934
| |
☐ | TRANSITION REPORT PURSUANT TO SECTION 13 OR 15(d) OF THE SECURITIES EXCHANGE ACT OF 1934 |
For the transition period from to
Commission file number: 001-34145
Primoris Services Corporation
(Exact name of registrant as specified in its charter)
Delaware
| |
|
Delaware | | 20-4743916 |
(State or other jurisdiction of | | (I.R.S. Employer |
incorporation or organization) | | Identification No.) |
| | |
2100 McKinney Avenue, Suite 1500
Dallas, Texas | |
75201 |
(Address of principal executive offices) | | (Zip Code) |
(214) 740-5600
(Registrant’s telephone number, including area code)
Securities registered pursuant to Section 12(b) of the Act:
| | |
Title of each class |
| Name of exchange on which registered |
Common Stock, $0.0001 par value | | The NASDAQ Stock Market LLC |
Securities registered pursuant to Section 12(g) of the Act: None
Indicate by check mark if the registrant is a well-known seasoned issuer, as defined in Rule 405 of the Securities Act. Yes x☒ No o☐
Indicate by check mark if the registrant is not required to file reports pursuant to Section 13 or Section 15(d) of the Act. Yes o☐ No x☒
Indicate by check mark whether the registrant (1) has filed all reports required to be filed by Section 13 or 15(d) of the Securities Exchange Act of 1934 during the preceding 12 months (or for such shorter period that the registrant was required to file such reports), and (2) has been subject to such filing requirements for the past 90 days. Yes x☒ Noo ☐
Indicate by check mark whether the registrant has submitted electronically and posted on its corporate Web site, if any, every Interactive Data File required to be submitted and posted pursuant to Rule 405 of Regulation S-T (§ 229.405 of this chapter) during the preceding 12 months (or for such shorter period that the registrant was required to submit and post such files). Yes x☒ No o☐
Indicate by check mark if disclosure of delinquent filers pursuant to Item 405 of Regulation S-K is not contained herein, and will not be contained, to the best of registrant’s knowledge, in definitive proxy or information statements incorporated by reference in Part III in this Form 10-K or any amendment to this Form 10-K. o☐
Indicate by check mark whether the registrant is a large accelerated filer, an accelerated filer, a non-accelerated filer, or a smaller reporting company, (as definedor an emerging growth company. See the definitions of “large accelerated filer,” “accelerated filer,” “smaller reporting company,” and “emerging growth company” in Rule 12b-2 of the Exchange Act).Act.
Large accelerated filer x
| | Accelerated filer o
|
| | |
Large accelerated filer ☒ | Accelerated filer ☐ | Non-accelerated filer o☐ | Smaller reporting company ☐ |
| | Smaller Reporting Company o(Do not check if a
smaller reporting company)
| Emerging growth company ☐ |
If an emerging growth company, indicate by check mark if the registrant has elected not to use the extended transition period for complying with any new or revised financial accounting standards provided pursuant to Section 13(a) of the Exchange Act. ☐
Indicate by check mark whether the registrant is a shell company (as defined in Rule 12b-2 of the Exchange Act). Yes o☐ Nox ☒
The aggregate market value of the voting common equity held by non-affiliates of the registrant was approximately $794.7 million$1.02 billion based upon the closing price of such common equity as of June 30, 20152017 (the last business day of the Registrant’s most recently completed second fiscal quarter). On February 29, 2016,26, 2018, there were 51,752,20151,531,339 shares of common stock, par value $0.0001, outstanding. For purposes of this Annual Report on Form 10-K, in addition to those stockholders which fall within the definition of “affiliates” under Rule 405 of the Securities Act of 1933, holders of ten percent or more of the Registrant’s common stock are deemed to be affiliates.
TABLE OF CONTENTS
FORWARD-LOOKING STATEMENTS
FORWARD-LOOKING STATEMENTS
This Annual Report on Form 10-K contains forward-looking statements within the meaning of Section 27A of the Securities Act of 1933, as amended (the “Securities Act”), and Section 21E of the Securities Exchange Act of 1934, as amended (the “Exchange Act”), which are subject to the “safe harbor” created by those sections. Forward-looking statements include information concerning our possible or assumed future results of operations, business strategies, financing plans, competitive position, industry environment, potential growth opportunities, the effects of regulation and the economy, generally. Forward-looking statements include all statements that are not historical facts and usually can be identified by terms such as “anticipates,” “believes,” “could,” “estimates,” “expects,” “intends,” “may,” “plans,” “potential,” “predicts,” “projects,” “should,” “will,” “would” or similar expressions.
Forward-looking statements involve known and unknown risks, uncertainties and other factors which may cause our actual results, performance or achievements to be materially different from any future results, performance or achievements expressed or implied by the forward-looking statements. We discuss many of these risks in detail in “Item 1A. Risk Factors”. You should read this Annual Report on Form 10-K completely and with the understanding that our actual future results may be materially different from what we expect.
Given these uncertainties, you should not place undue reliance on forward-looking statements. Forward-looking statements represent our management’s beliefs and assumptions only as of the date of this Annual Report on Form 10-K. We assume no obligation to update forward-looking statements publicly, or to update the reasons actual results could differ materially from those anticipated in any forward-looking statements, even if new information becomes available.
PART I
ITEM 1. BUSINESS
Business Overview
Primoris Services Corporation (“Primoris”, the “Company”, “we”, “us”, or “our”) is a holding company of various subsidiaries which form one of the larger publicly traded specialty contractors and infrastructure companies in the United States. Serving diverse end-markets, we provide a wide range of construction, fabrication, maintenance, replacement, water and wastewater, and engineering services to major public utilities, petrochemical companies, energy companies, municipalities, state departments of transportation and other customers. We install, replace, repair and rehabilitate natural gas, refined product, water and wastewater pipeline systems; large diameter gas and liquid pipeline facilities; and heavy civil projects, earthwork and site development. We also construct mechanical facilities and other structures, including power plants, petrochemical facilities, refineries, water and wastewater treatment facilities and parking structures. Finally, we provide specialized process and product engineering services.
Historically, we have longstanding relationships with major utility, refining, petrochemical, power and engineering companies. We have completed major underground and industrial projects for a number of large natural gas transmission and petrochemical companies in the western United States, as well as significant projects for our engineering customers. We enter into a large number of contracts each year and the projects can vary in length — from several weeks to as long as 4860 months, or longer for completion onof larger projects. Although we have not been dependent upon any one customer, in any year a small number of customers tend to constitute a substantial portion of our total revenues.
The Company’sOur common stock trades on the NASDAQ Select Global Market under the symbol “PRIM”. Founded as ARB, Inc. (“ARB”) in 1960, we became organized as Primoris in Nevada in 2003, and we became a Delaware public company in July 2008 when we merged with a special purpose acquisition company (a non-operating shell company).
Our service capabilities and geographic footprint have expanded primarily through the following four significant acquisitions over the last sixnine years.
In 2009, we acquired James Construction Group, LLC, a privately-held Florida limited liability company (“JCG”). Headquartered in Baton Rouge, Louisiana, JCG is one of the largest general contractors based in the Gulf Coast states and is engaged in highway, industrial and environmental construction, primarily in Louisiana, Texas, Arkansas, Mississippi and Florida. JCG and its predecessor company have been in business for over 80 years.
In 2010, we acquired Rockford Corporation (“Rockford”). Rockford specializes in construction of large diameter natural gas and liquid pipeline projects and related facilities throughout the United States.
In 2012, we purchased Sprint Pipeline Services, L.P. (“Sprint”), a Texas based company headquartered near Houston, which we renamed as Primoris PipelineEnergy Services (“PPS”PES”) in March 2015. PPS. PES provides a comprehensive range of pipeline construction, maintenance, upgrade, fabrication and specialty services primarily in the southeastern United States.
In November 2012, we purchased Q3 Contracting, Inc., a privately-held Minnesota corporation (“Q3C”). Based in Little Canada, Minnesota (north of St. Paul), Q3C specializes in small diameter pipeline and gas distribution construction, restoration and other services, primarily in the upper Midwest region of the United States.
In addition to these primary acquisitions, we have entered into several agreements to purchase smaller businesses or business assets to start a business as we continue to seek opportunities to expand our skill sets or operating locations. These include The Saxon Group (“Saxon”) and The Silva Group (“Silva”) (merged with JCG), which we acquired in 2012. During 2014 we acquired Vadnais Trenchless Services, Inc. (“Vadnais”) and made three small acquisitions during the third quarter, consisting of the purchase of the net assets of Surber Roustabout, LLC (“Surber”), Ram-Fab, LLC (“Ram-Fab”) and Williams Testing, LLC (“Williams”). In February 2015, we acquired the net assets of Aevenia, Inc. In 2016, we further enhanced our market reach with the purchase of the net assets of Mueller Concrete Construction Company (“Mueller”) and Northern Energy & Power (“Northern”). During 2017, we acquired Florida Gas Contractors (“FGC”), Coastal Field
Services (“Coastal”), and a small acquisition of certain engineering assets. We continue to evaluate potential acquisition candidates, especially those with strong management teams with good reputations.
Reportable Segments
The Company segregates itsThrough the end of the year 2016, we segregated our business into three operatingreportable segments: the West Construction ServicesEnergy segment, (“West segment”), the East Construction Services segment (“East segment”) and the EnergyWest Construction Services segment. In the first quarter 2017, we changed our reportable segments in connection with a realignment of our internal organization and management structure. The segment changes reflect the focus of our chief operating decision maker (“Energy segment”CODM”). on the range of services we provide to our end user markets. Our CODM regularly reviews our operating and financial performance based on these segments.
The Westcurrent reportable segments include the Power, Industrial, and Engineering (“Power”) segment, includes the undergroundPipeline and industrial operationsUnderground (“Pipeline”) segment, the Utilities and constructionDistribution (“Utilities”) segment, and the Civil segment. Segment information for prior periods has been restated to conform to the new segment presentation.
Each of our reportable segments is comprised of similar business units that specialize in services performedunique to the segment. Driving the new end-user focused segments are differences in the economic characteristics of each segment, the nature of the services provided by ARB, ARB Structures, Inc., Rockford, Q3C,each segment; the production processes of each segment; the type or class of customer using the segment’s services; the methods used by the segment to provide the services; and Vadnais. ARBthe regulatory environment of each segment’s customers.
The classification of revenues and ARB Structuresgross profit for segment reporting purposes can at times require judgment on the part of management. Our segments may perform work primarilyservices across industries or perform joint services for customers in California; while, Rockfordmultiple industries. To determine reportable segment gross profit, certain allocations, including allocations of shared and indirect costs, such as facility costs, equipment costs and indirect operating expenses, were made.
The following is a brief description of the reportable segments:
The Power segment operates throughout the United States and Q3C operates in Colorado and the upper Midwest United States. The segment also includes three joint venture operations. The West segment consists of business headquartered primarily in the Western United States.
The East segment includes the JCG Heavy Civil division, JCG Infrastructure and Maintenance division, BW Primoris and Cardinal Contractors, Inc. construction businesses, located primarily in the Southeastern United States and the Gulf Coast region of the United States.
The Energy segment includes the operations of the Primoris Energy Services (“PES”) pipeline and gas facility construction and maintenance operations and the PES Industrial division, whose operations are located primarily in the southeastern United States and in the Gulf Coast region. This segment also includes the Primoris Aevenia,Inc. (“Aevenia”), Surber and Ram-Fab operations and the OnQuest, Inc. and OnQuest Canada, ULC operations, which provide for the design and installation of liquid natural gas (“LNG”) facilities and high-performance furnaces and heaters for the oil refining, petrochemical and power generation industries.
Each of the three segments specializes in a range of services that include designing, building/installing, replacing, repairing/rehabilitatingfull Engineering, Procurment, and providing management services forConstruction (“EPC”) project delivery, turnkey construction, related projects. Our services include:
· Providing installation of underground pipeline, cableretrofits, upgrades, repairs, outages, and conduitsmaintenance for entities in the petroleum, petrochemical, water, and water industries;other industries.
· ProvidingThe Pipeline segment operates throughout the United States and specializes in a range of services, including pipeline construction, pipeline maintenance, services to utilities for installationpipeline facility work, compressor stations, pump stations, metering facilities, and repair of gas distribution lines;
· Providing installation and maintenance of industrial facilitiesother pipeline related services for entities in the petroleum and petrochemical and water industries;
· Providing installation of commercial and industrial cast-in-place structures;
· Providing construction of highways and bridges; and
· Providing industrial and environmental construction.
Trends
We continue to operate in an uncertain business environment with increasing regulatory requirements and a significant decrease in the price of commodities, including oil and gas pricing, during the last 18 months. While by many indicators the United States economy has recovered from the recessionary levels of the past few years, capital expenditure levels by many of our customers have remained at lower levels. Economic and regulatory issues have adversely affected our customers and have affected demand for our services. For some of our customers, the additional uncertainty associated with state and federal budgets adds to the difficulty in predicting the timing or magnitude that industry trends may have on our business, particularly in the near-term.
The direct impact of the reduction in oil and gas prices is found in three of our end markets: upstream, midstream and downstream. The lower commodity prices have reduced to a minimum the capital expenditure budgets of oil and gas producers which have reduced or eliminated most work in the oil and gas shale formations. This has reduced the demand for our upstream pipeline services such as opportunities in oil and gas gathering lines, compressor systems and related infrastructure especially in the shale formations. While the longer term opportunities for midstream customers remain, as the existing pipeline infrastructure appears to be insufficient to meet the potential natural gas demand, in the near term capital expenditure is expected to fall. However, the lower natural gas prices may provide midstream opportunities to build large diameter pipelines for gas utility customers. Finally for downstream refineries, low prices tend to lead to more maintenance and outage work as plants are operated at higher levels; however, the low oil prices may result in delays and deferral for some of the maintenance work.industries.
The gas utility industry continues to outsource an increasing amount of its infrastructure construction, maintenance and inspection services. Large rate regulated utilitiesUtilities segment operates primarily in many states continue to rely more on outside contractors, rather than their own employees, to provide many of the services needed to maintain and expand their utility plants. This trend provides opportunity for our West segment operations.
The U.S. Energy Information Administration has stated that the number of natural gas-fired power plants built will increase significantly over the next two decades. While renewable energy generation continues to increase and become a larger percentage of the overall power generation mix, natural gas facilities, especially the conversion of current facilities to more efficient sources of power, may provide a significant contribution to the revenue and profitability of the West segment and over the next few years also the Energy segment. Regulations limiting the discharge of cooling water into the ocean will require construction of alternative cooling systems and may lead to repowering at current sites over the next few years in California.
As many states institute renewable power standards mandating renewable energy generation as a part of the total power usage, large, utility-scale projects will provide construction opportunities over the next few years. In many locations, the development
and construction of solar and wind facilities may result in a need for traditional plants to meet demand when the renewable resources are not available. In addition, alternative energy sources such as “waste-to-power” facilities provide long-term construction opportunities. The low long-term natural gas pricesCalifornia and the increased emission regulations of the Environmental Protection Agency may result in the construction of gas-fired power plants as an alternative to coal-fired plants. We believe that our gas-fired plant experienceMidwest and industry knowledge will provide opportunities for us.
The continuing long-term low cost of natural gas is leading to industrial opportunities, as chemical plants that use natural gas as a feedstock initiate new projects or expand current facilities. Construction for many of these projects is expected in the Louisiana and Texas Gulf Coast region, which requires significant site preparation work as part of the project. Both our East and Energy segments provide services to many of the companies planning facility additions.
The low price and abundance of natural gas may lead to the development and construction of LNG export facilities, since natural gas prices in many international markets are greater than those in the United States. Future export LNG facilities could also provide opportunity for construction of additional pipelines. In addition, the development of small scale LNG facilities could provide opportunity for both our East and Energy segments.
At the end of 2015, opportunities for our highway construction services improved. The federal government enacted a four-year highway funding program, and the voters in the state of Texas adopted Proposition 7 to increase highway funding. In the United States, highway funding increased in 2015 compared to 2014. Our highway construction operation is focused on the states of Louisiana, Texas and Mississippi. Of these states, Texas continues to increase its highway construction budget, while the other two states have cut back funding in the past several years.
Over the past few years, several areasSoutheast regions of the United States have suffered significant drought-like conditions. In these areas, state and municipal officials are considering using alternative sources for potable water,specializes in a range of services, including using water pipelines to transport water from distant aquifers or building complex water treatment facilities to treat non-potable water. In some areas such as West Texas, state agencies are contemplating significant investment to improve the quantity of water. These investments may provide an opportunity for our East segment services. However, the planning cycle for major waterutility line installation and wastewater projects to address the drought tends to move very slowly,maintenance, gas and opportunities may take several years to come to fruition.electric distribution, streetlight construction, substation work, and fiber optic cable installation.
The Civil segment operates primarily in the Southeastern and Gulf Coast regions of the United States and specializes in highway and bridge construction, airport runway and taxiway construction, demolition, heavy earthwork, soil stabilization, mass excavation, and drainage projects.
Strategy
Our strategy has remained consistent from year to year and continues to emphasize the following key elements:
| · | | Diversification Through Controlled Expansion. ·Diversification Through Controlled Expansion. We continue to emphasize the expansion of our scope of services beyond our current focus by increasing the scope of services offered to current customers and by adding new customers. We will evaluate acquisitions that offer growth opportunities and the ability to leverage our resources as a leading service provider to the oil and gas, power, refining and water industries. Our strategy also considers selective expansion to new geographic regions. |
| · | | Emphasis on Retention of Existing Customers and Recurring Revenue. In order to fully leverage our relationships with our existing customer base, we believe it is important to maintain strong customer relationships and to expand our base of recurring revenue sources and recurring customers. |
·Emphasis on Retention of Existing Customers and Recurring Revenue. In order to fully leverage our relationships with our existing customer base, we believe it is important to maintain strong customer relationships and to expand our base of recurring revenue sources and recurring customers.
| · | | Ownership of Equipment. Many of our services are equipment intensive. The cost of construction equipment, and in some cases the availability of construction equipment, provides a significant barrier to entry into several of our businesses. We believe that our ownership of a large and varied construction fleet and our maintenance facilities enhances our access to reliable equipment at a favorable cost. |
| · | | Stable Work Force. Our business model emphasizes self-performance of a significant portion of our work. In each of our separate segments, we maintain a stable work force of skilled, experienced laborers, many of whom are cross-trained in projects such as pipeline and facility construction, refinery maintenance, and piping systems. |
| · | | Selective Bidding. We selectively bid on projects that we believe offer an opportunity to meet our profitability objectives or that offer the opportunity to enter promising new markets. In addition, we review our bidding opportunities to attempt to minimize concentration of work with any one customer, in any one industry, or in stressed labor markets. We believe that by carefully positioning ourselves in market segments that have meaningful barriers of entry, we can position ourselves so that we compete with other strong, experienced bidders. |
| · | | Maintain a conservative capital structure and strong balance sheet. We have maintained a capital structure that provides access to debt financing as needed while relying on tangible net worth to provide the primary support for our operations. We believe this structure provides our customers, our lenders, and our bonding companies assurance of our financial capabilities. We maintain a revolving credit facility to provide letter of credit capability; however, we have not had any outstanding bank borrowing against this facility while we have been a public company. |
·Ownership of Equipment. Many of our services are equipment intensive. The cost of construction equipment, and in some cases the availability of construction equipment, provides a significant barrier to entry into several of our businesses. We believe that our ownership of a large and varied construction fleet and our maintenance facilities enhances our access to reliable equipment at a favorable cost.
·Stable Work Force. Our business model emphasizes self-performance of a significant portion of our work. In each of our separate segments, we maintain a stable work force of skilled, experienced laborers, many of whom are cross-trained in projects such as pipeline and facility construction, refinery maintenance, and piping systems.
·Selective Bidding. We selectively bid on projects that we believe offer an opportunity to meet our profitability objectives or that offer the opportunity to enter promising new markets. In addition, we review our bidding opportunities to attempt to minimize concentration of work with any one customer, in any one industry, or in stressed labor markets. We believe that by carefully positioning ourselves in market segments that have meaningful barriers of entry, we can position ourselves so that we compete with other strong, experienced bidders.
·Maintain a conservative capital structure and strong balance sheet. We have maintained a capital structure that provides access to debt financing as needed while relying on tangible net worth to provide the primary support for our operations. We believe this structure provides both our customers and banks and bonding companies assurance of our financial
capabilities. We maintain a revolving credit facility to provide letter of credit capability; however, we have not had any outstanding bank borrowing against this facility while we have been a public company.
Backlog
Backlog is discussed in Item 7. “Management’s Discussion and Analysis of Financial Condition and Results of Operations” of this Annual Report on Form 10-K.
Customers
We have longstanding customer relationships with major utility, refining, petrochemical, power and engineering companies. We have completed major underground and industrial projects for a number of large natural gas transmission and petrochemical companies in the western United States, as well as significant projects for our engineering customers. Through JCG, we expanded our customer base to include a significant presence in the Gulf Coast region of the United States; with Q3C, we expanded into the upper Midwest United States; and with Rockford, we are expandingoperate throughout the United States. TheOver time, the various acquisitions have also changed the composition of our customer base with significant increases in state agency projects. We enter into a large number of contracts each year and the projects can vary in length — from several weeks to as long as 4860 months, or longer for completion on larger projects. Although we have not been dependent upon any one customer in any year, a small number of customers tend to constitute a substantial portion of our total revenues.
Our customers have included the Texas Department of Transportation and Louisiana Department of Transportation and Development in the Southern United States as well as many of the leading energy and utility companies in the United States, including, among others, Enterprise Liquids Pipeline, Xcel Energy, Pacific Gas & Electric, Southern California Gas, Sempra Energy, Williams, NRG, Chevron, Calpine, Kinder Morgan, Dominion, and Kinder Morgan.Sasol.
The following customers accounted for more than 5% of our revenues in the periods indicated:
Description of customer’s business | | 2015 | | 2014 | | 2013 | |
Texas DOT | | 9.5 | % | 8.8 | % | 7.2 | % |
Private gas and electric utility | | 9.0 | % | 7.0 | % | 5.4 | % |
Chemical/energy producer | | 9.0 | % | * | | * | |
Pipeline operator | | 8.6 | % | * | | * | |
Gas utility | | 6.6 | % | * | | 7.4 | % |
Public gas and electric utility | | 6.2 | % | 6.9 | % | 7.9 | % |
Petrochemical producer | | * | | 7.9 | % | * | |
Pipeline operator | | * | | 5.8 | % | * | |
Gas utility | | * | | * | | 7.7 | % |
Totals | | 48.9 | % | 36.4 | % | 35.6 | % |
| | | | | | |
Description of customer’s business | | 2017 | | 2016 | | 2015 |
State DOT | | 9.3% | | 9.7% | | 9.5% |
Public gas and electric utility | | 8.9% | | 9.2% | | 6.2% |
Private gas and electric utility | | 8.0% | | 10.1% | | 9.0% |
Chemical/Energy producer | | 6.8% | | 10.4% | | 9.0% |
Pipeline operator | | 5.4% | | * | | * |
Pipeline operator | | * | | 6.2% | | * |
Pipeline operator | | * | | * | | 8.6% |
Gas utility | | * | | * | | 6.6% |
Totals | | 38.4% | | 45.6% | | 48.9% |
(*)Indicates a customer with less than 5% of revenues during such period.
As can be seen from the table, the customers accounting for revenues in excess of 5% each year varies from year to year due to the nature of our business. A large construction project for a customer may result in significant revenues in that one year, with significantly less revenues in subsequent years after project completion.
For the years ended December 31, 2017, 2016 and 2015, 201456.4%, 60.4% and 2013, 59.4%, 53.6% and 50.0%, respectively, of total revenues were generated from theour top ten customers of the Company in each year. In each of the years, a different group of customers comprised the top ten customers by revenue.
Management at each of our business units is responsible for developing and maintaining successful long-term relationships with customers. Our business unit management teams build existing customer relationships to secure additional projects and increase revenue from our current customer base. Business unit managers are also responsible for pursuing growth opportunities with prospective new customers.
We believe that our strategic relationships with customers will result in future opportunities. Some of our strategic relationships are in the form of strategic alliance or long-term maintenance agreements. However, we realize that future opportunities also require cost effective bids, as pricing is a key element for most construction projects.
Ongoing Projects
The following is a summary of significant ongoing construction projects demonstrating our capabilities in different markets at December 31, 2015:2017:
Segment | | Project | | Location | | Approximate
Contract
Amount | | Estimated
Completion
Date | | Remaining
Backlog at
December 31,
2015 | |
| | | | | | (Millions) | | | | (Millions) | |
West | | 500 MW Natural Gas Simple Cycle Power Plant | | Carlsbad, CA | | $ | 212 | | 11/2017 | | $ | 209 | |
West | | 125 Mile Natrual Gas Pipeline | | Central Florida | | $ | 209 | | 09/2017 | | $ | 207 | |
East | | I-49 Parkway | | Broussard, LA | | $ | 58 | | 05/2017 | | $ | 38 | |
East | | Bell IH-35 — LP 363 To Troy | | Troy, TX | | $ | 128 | | 10/2017 | | $ | 73 | |
Energy | | Methane Reformer Construction | | Beaumont, TX | | $ | 27 | | 09/2017 | | $ | 19 | |
East & Energy | | Industrial facility | | Lake Charles, LA | | $ | 290 | | 06/2016 | | $ | 115 | |
| | | | | | | | | | | | | |
| | | | | | | | | | | Remaining | |
| | | | | | Approximate | | Estimated | | Backlog at | |
| | | | | | Contract | | Completion | | December 31, | |
Segment | | Project | | Location | | Amount | | Date | | 2017 | |
| | | | | | (Millions) | | | | (Millions) | |
Pipeline | | 177 Mile Natural Gas Pipeline | | Atlantic Coast | | $ | 678 | | 12/2019 | | $ | 677 | |
Civil | | I-10 Highway | | Breaux Bridge, LA | | $ | 126 | | 11/2019 | | $ | 108 | |
Power | | 500 MW Natural Gas Simple Cycle Power Plant | | Carlsbad, CA | | $ | 299 | | 10/2018 | | $ | 101 | |
Civil | | IH 35 Highway | | Temple, TX | | $ | 281 | | 03/2019 | | $ | 88 | |
Pipeline | | Dual force main & generator replacement | | Marina Del Rey, CA | | $ | 87 | | 07/2018 | | $ | 62 | |
Utilities | | 230KV Transmission Line | | San Diego, CA | | $ | 74 | | 06/2018 | | $ | 15 | |
Competition
We face substantial competition on large construction projects from both regional and national contractors. Competitors on small construction projects range from a few large construction companies to a variety of smaller contractors. We compete with many local and regional firms for construction services and with a number of large firms on select projects. Each business segmentunit faces varied competition depending on the types of projectprojects and services offered.
We compete with different companies in different end markets. LargeFor example, large competitors in our underground markets include Quanta Services, Inc. and MasTec, Inc.; competitors in our industrial end markets include Kiewit Corporation; and competitors in our highway services markets include Sterling Construction Company, and privately-held Boh Brothers and Zachary Construction Company. In each market we may also compete with local, private companies.
We believe that the primary factors influencing competition in our industry are price, reputation for quality, delivery and safety, relevant experience, availability of skilled labor, machinery and equipment, financial strength, knowledge of local markets and conditions, and estimating abilities. We believe that we have the ability to compete favorably in all of these factors.
Geographic Areas — Financial Information
The majority of the Company’sour revenues are derived from customers and projects geographically located in the United States with approximately 1% generated from sources outside the United States. Assets located outside the United States also represent approximately 1% of our total assets of the Company. Our revenue from operations in the United States is related to projects primarily in the geographic United States.assets. Our revenue from operations in Canada is primarily derived from our EnergyPower segment’s office in Calgary, Canada, but relates to specific projects in other countries, such asincluding in the Far East and Australia.
Risks Attendant to Foreign Operations
In 2015 less than2017, approximately 1% of our revenue was attributable to external customers in foreign countries. The current expectation is that a similar portion of revenue will continue to come from international projects for the foreseeable future. Though a small portion of our revenues, international operations are subject to foreign economic and political uncertainties and risks as disclosed more fully in Item 1A “Risk Factors” of this Annual Report. Unexpected and adverse changes in the foreign countries in which we operate could result in project disruptions, increased costs and potential losses. Our business is subject to fluctuations in demand and to changing domestic and international economic and political conditions which are beyond our control.
Contract Provisions and Subcontracting
We typically structure contracts as unit-price, time and material, fixed-price or cost reimbursable plus fixed fee. A substantial portion of our revenue is derived from contracts that are fixed-price or unit-price contracts. Under a fixed-price contract, we undertake to provide labor, equipment and services required by a project for a competitively bid or negotiated fixed priceprice. Under a unit-price contract, we are committed to providing materials or services required by a project at fixed unit price contracts.prices. While the fixed unit priceunit-price contract shifts the risk of estimating the quantity of units required for a particular project to the party retaining us,customer, any increase in our unit cost over the unit price bid, whether due to inflation, inefficiency, faulty estimates or other factors, is borne by us. Under a fixed price contract, we undertake to provide labor, equipment and services required by a project for a competitively bid or negotiated fixed price. TheSignificant materials required under a fixed pricefixed-price or unit-price contract, such as pipe, turbines, boilers and vessels, are oftenusually supplied by the party retaining us.customer.
Under
Our gas distribution services are typically provided pursuant to renewable contracts on a fixed unit price contract, we are committed to providing materials or services required by a project at fixed unit prices. Both cost and quantity risks related to time and material and cost plus fixed fee“unit-cost” basis. Fees on unit-cost contracts are generally shifted tonegotiated and are earned based on units completed. Historically, substantially all of the party retaining us.gas distribution customers have renewed their maintenance contracts. Facilities maintenance services, such as regularly scheduled and emergency repair work, are provided on an ongoing basis at predetermined rates.
Construction contracts are primarily obtained through competitive bidding or through negotiations with long-standing customers. We are typically invited to bid on projects undertaken by recurring customers who maintain pre-qualified contractor lists. Contractors are selected for the pre-approved contractor lists by virtue of their prior performance for such customers, as well as their experience, reputation for quality, safety record, financial strength and bonding capacity.
In evaluating bid opportunities, we consider such factors as the customer, the geographic location of the work, the availability of labor, our competitive advantage or disadvantage relative to other likely contractors, our current and projected workload, the likelihood of additional work, and the project’s cost and profitability estimates. We use
computer-based estimating systems and our estimating staff has significant experience in the construction industry. The project estimates form the basis of a project budget against which performance is tracked through a project cost system;system, thereby enabling management to monitor a project. Project costs are accumulated and monitored regularly against billings and payments to assure proper controlunderstanding of cash flow on the project.
Most contracts provide for termination of the contract for the convenience of the owner. In addition, many contracts are subject to certain completion schedule requirements with damages or liquidated damages in the event schedules are not met. To date, these provisions have not materially adversely affected us.
We act as prime contractor on a majority of the construction projects we undertake. In the construction industry, the prime contractor is normally responsible for the performance of the entire contract, including subcontract work. Thus, we are potentially subject to increased costs and reputational risk associated with the failure of one or more subcontractors to perform as anticipated. While we subcontract specialized activities such as blasting, hazardous waste removal and selected electrical work, we perform most of the work on our projects with our own resources, including labor and equipment.
Our gas distribution services are typically provided pursuant to renewable contracts on a “unit-cost” basis. Fees on unit-cost contracts are negotiated and are earned based on units completed. Historically, substantially all of the gas distribution customers have renewed their maintenance contracts. Facilities maintenance services, such as regularly scheduled and emergency repair work, are provided on an ongoing basis at predetermined rates.
Risk Management, Insurance and Bonding
We maintain general liability and excess liability insurance covering our construction equipment, and workers’ compensation insurance in amounts consistent with industry practices. In the States of California, Texas and Louisiana,certain states, we self-insure our workers’ compensation claims in an amount of up to $250,000 per occurrence, and we maintain insurance covering larger claims. In addition, we maintain umbrella coverage policies. We believe that our insurance programs are adequate.
We maintain a diligent safety and risk management program that has resulted in a favorable loss experience factor. Through our safety director and the employment of a large staff of regional and site specific safety managers, we have been able to effectively assess and control potential losses and liabilities in both the pre-construction and performance phases of our projects. Though we strongly focus on safety in the workplace, we cannot give assurances that we can prevent or reduce all injuries or claims in our workplace.
In connection with our business, we generally are required to provide various types of surety bonds guaranteeing our performance under certain public and private sector contracts. Our ability to obtain surety bonds depends upon our capitalization, working capital, backlog, past performance, management expertise and other factors and the surety company’s current underwriting standards. To date, we have obtained the level of surety bonds necessary for the needs ofto support our business.
Regulation
Our operations are subject to various federal, state, local and international laws and regulations including:
| · | | Licensing, permitting and inspection requirements; |
| · | | Regulations relating to worker safety, including those established by the Occupational Safety and Health Administration; |
| · | | Permitting and inspection requirements applicable to construction projects; and |
| · | | · Licensing, permitting and inspection requirements;
· Regulations relating to worker safety, including those established by the Occupational Safety and Health Administration;
· Permitting and inspection requirements applicable to construction projects; and
·Contractor licensing requirements.
|
We believe that we have all the licenses required to conduct our operations and that we are in substantial compliance with applicable regulatory requirements.
Environmental Matters and Climate Change Impacts
We are subject to numerous federal, state, local and international environmental laws and regulations governing our operations, including the handling, transportation and disposal of non-hazardous and hazardous substances and wastes, as well as emissions and discharges into the environment, including discharges to air, surface water, groundwater and soil. We have a substantial investment in construction equipment that utilizes diesel fuel. Any changes in laws
requiring us to use equipment that runs on alternative fuels could require a significant investment, which could adversely impact our financial performance.
We also are subject to laws and regulations that impose liability and cleanup responsibility for releases of hazardous substances into the environment. Under some of these laws and regulations, liability can be imposed for cleanup of previously owned or operated properties, or properties to which hazardous substances or wastes were sent by current or former operations at our facilities, regardless of whether we directly caused the contamination or violated any law at the time of discharge or disposal. The presence of contamination from such substances or wastes could interfere with ongoing operations or adversely affect our ability to sell, lease or use our properties as collateral for financing.
In addition, we could be held liable for significant penalties and damages under certain environmental laws and regulations and also could be subject to a revocation of our licenses or permits, which could materially and adversely affect our business and results of operations. Our contracts with our customers may also impose liabilities on us regarding environmental issues that arise through the performance of our services. From time to time, we may incur costs and obligations for correcting environmental noncompliance matters and for remediation at or relating to certain of our properties. We believe that we are in substantial compliance with our environmental obligations to date and that any such obligations will not have a material adverse effect on our business or financial performance.
The potential physical impact of climate change on our operations is highly uncertain. Climate change may result in, among other things, changes in rainfall patterns, storm patterns and intensities and temperature levels. As discussed elsewhere in this Annual Report on Form 10-K, including in Item 1A. “Risk Factors”, our operating results are significantly influenced by weather. Therefore, major changes in historical weather patterns could significantly impact our future operating results. For example, if climate change results in significantly more adverse weather conditions in a given period, we could experience reduced productivity, which could negatively impact our revenues and gross margins.
Climate change could also affect our customers and the types of projects that they award. Demand for power projects, underground pipelines or highway projects could be affected by significant changes in weather. Reductions in project awards could adversely affect our operations and financial performance.
Employees
We believe that our employees are ourthe most valuable resource in successfully completing construction work. Our ability to maintain sufficient continuous work for approximately 5,5005,800 hourly employees helps us to instill in our employees loyalty to and understanding of our policies and contributes to our strong production, safety and quality record.
As of December 31, 2015,2017, we employed 1,2091,345 salaried employees and 5,8025,757 hourly employees. The total number of hourly personnel employed is subject to the volume of construction work in progress. During the calendar year 2015, the aggregate number of employees ranged from approximately 5,500 to 7,000.
The following is a summary of employees by function and location as of December 31, 2015:
| | CA | | LA | | TX | | CO | | FL | | MN | | Other
US | | Canada | | Total | |
Salaried | | 324 | | 257 | | 469 | | 17 | | 32 | | 17 | | 63 | | 30 | | 1,209 | |
Hourly | | 1,923 | | 1,441 | | 1,745 | | 123 | | 159 | | 58 | | 353 | | 0 | | 5,802 | |
Total | | 2,247 | | 1,698 | | 2,214 | | 140 | | 191 | | 75 | | 416 | | 30 | | 7,011 | |
Several of our subsidiaries have operations that are unionized through the negotiation and execution of collective bargaining agreements. These collective bargaining agreements have varying terms and are subject to renegotiation upon expiration. We have not experienced recent work stoppages and believe our employee and union relations are good.
Website Access and Other Information
Our website address is www.prim.com. You may obtain free electronic copies of our Annual Reports on Form 10-K, Quarterly Reports on Form 10-Q, Current Reports on Form 8-K, and any amendments to these reports through our website under the “Investors” tab or through the website of the Securities and Exchange Commission (the “SEC”) at www.sec.gov. These reports are available on our website as soon as reasonably practicable after we electronically file them with, or furnish them to, the SEC. In addition, our “Code of Ethics” (including a separate supplement which applies to our CEO, CFO and senior financial executives) and the charters of our Audit Committee, Compensation Committee and Governance and Nominating Committee are posted on our website under the “Investor Relations/Corporate “Investors/Governance” tab. We intend to disclose on our website any amendments or waivers to our Code of Ethics
that are required to be disclosed pursuant to Item 5.05 of Form 8-K. You may obtain copies of these items from our website.
We will make available to any stockholder, without charge, copies of our Annual Report on Form 10-K as filed with the SEC. For copies of this or any other information, stockholders should submit a request in writing to Primoris Services Corporation, Inc., Attn: Corporate Secretary, 2100 McKinney Avenue, Suite 1500, Dallas, TX 75201.
This Annual Report on Form 10-K and our website may contain information provided by other sources that we believe are reliable. However, we cannot assure you that the information obtained from other sources is accurate or complete. No information on our website is incorporated by reference herein and should not be considered part of this Annual Report.
ITEM 1A. RISK FACTORS
Our business is subject to a variety of risks and uncertainties, many of which are described below. However, thebelow (not necessarily in probability of occurrence or order of importance). The following list is not all-inclusive, and there can be no assurance that we have correctly identified and appropriately assessed all factors affecting our business or that the publicly available or other information with respect to these matters is complete and correct. Additional risks and uncertainties not presently known to us or that we currently believe to be immaterial also may have a material adverse effectseffect on our business in the future. This Form 10-K includes projections, assumptions and beliefs that are intended to be “forward looking statements” and should be read in conjunction with the discussion of “Forward Looking Statements” at the beginning of this Annual Report on Form 10-K.
The following risk factors could have a material adverse effect our business, the results of our operations, our cash flow and the price of our shares. These risk factors could prevent us from meeting our goals or expectations.
Risks Related Primarily to Operating our Business
Our financial and operating results may vary significantly from quarter-to-quarter and year-to-year.
Our business is subject to seasonal and annual fluctuations. Some of the quarterly variation is the result of weather, particularly rain, ice and snow, which create difficult operating conditions. Similarly, demand for routine repair and maintenance services for gas utilities is lower during their peak customer needs in the winter. Some of the annual variation is the result of large construction projects which fluctuate based on general economic conditions and customer needs. Annual and quarterly results may also be adversely affected by:
| · | | Changes in our mix of customers, projects, contracts and business; |
| · | | Regional or national and/or general economic conditions and demand for our services; |
| · | | Variations and changes in the margins of projects performed during any particular quarter; |
| · | | Increases in the costs to perform services caused by changing weather conditions; |
| · | | The termination or expiration of existing agreements or contracts; |
| · | | The budgetary spending patterns of customers; |
| · | | Increases in construction costs that we may be unable to pass through to our customers; |
| · | | Cost or schedule overruns on fixed-price contracts; |
| · | | Availability of qualified labor for specific projects; |
| · | | Changes in bonding requirements and bonding availability for existing and new agreements; |
| · | | The need and availability of letters of credit; |
| · | | Costs we incur to support growth, whether organic or through acquisitions; |
| · | | The timing and volume of work under contract; and |
| · | | Losses experienced in our operations. |
· Changes in our mix of customers, projects, contracts and business;
· Regional or national and/or general economic conditions and demand for our services;
· Variations and changes in the margins of projects performed during any particular quarter;
· Increases in the costs to perform services caused by changing weather conditions;
· The termination or expiration of existing agreements or contracts;
· The budgetary spending patterns of customers;
· Increases in construction costs that we may be unable to pass through to our customers;
· Cost or schedule overruns on fixed-price contracts;
· Availability of qualified labor for specific projects;
· Changes in bonding requirements and bonding availability for existing and new agreements;
· The need and availability of letters of credit;
· Costs we incur to support growth whether organic or through acquisitions;
· The timing and volume of work under contract; and
· Losses experienced in our operations.
As a result, our operating results in any particular quarter may not be indicative of the operating results expected for any other quarter or for an entire year.
Demand for our services may decrease during economic recessions or volatile economic cycles, and a reduction in demand in end markets may adversely affect our business.
A substantial portion of our revenues and profits is generated from construction projects, the awarding of which we do not directly control. The engineering and construction industry historically has experienced cyclical fluctuations in financial results due to economic recessions, downturns in business cycles of our customers, material shortages, price increases by subcontractors, interest rate fluctuations and other economic factors beyond our control. When the general level of economic activity deteriorates, our customers may delay or cancel upgrades, expansions, and/or maintenance and repairs to their systems. Many factors, including the financial condition of the industry, could adversely affect our customers and their willingness to fund capital expenditures in the future.
Economic, regulatory and market conditions affecting our specific end markets may adversely impact the demand for our services, resulting in the delay, reduction or cancellation of certain projects and these conditions may continue to adversely affect us in the future.
Much For example, much of the work that we perform in the highway markets involves funding by federal, state and local governments. WhileThis funding is subject to fluctuation based on the federal fundingbudgets and funding in some states appear to be stabilizing or improving, in other locations, funding for these projects could remain at very low levels.operating priorities of the various government agencies.
We are also dependent on the amount of work our customers outsource. In a slower economy, our customers may decide to outsource less infrastructure services reducing demand for our services. In addition, consolidation, competition or capital constraints in the industries we serve may result in reduced spending by our customers.
Industry trends and government regulations could reduce demand for our pipeline construction services.
The demand for our pipeline construction services is dependent on the level of capital project spending by companies in the oil and gas industry. This level of spending is subject to large fluctuations depending primarily on the current and expectations of future prices of oil and natural gas. The price is a function of many factors, including levels of supply and demand, government policies and regulations, oil industry refining capacity and the potential development of alternative fuels. Since the middle of 2014, there has been a significant decrease in oil prices. These lower prices have resulted in the reduction or elimination of activity in the discovery or development of oil and gas reserves as customers curtail their capital spending on underground projects which has resulted in a reduction of demand for our services.
Specific government decisions could affect demand for our construction services. For example, a limitation on the use of “fracking” technology, or creation of significant regulatory issues for the construction of underground pipelines, could significantly reduce our underground work.
Conversely, government regulations may increase the demand for our pipeline services. The anticipation by utilities that coal-fueled power plants may become uneconomical to operate because of potential environmental regulations or low natural gas prices has increased demand for gas pipeline construction for utility customers.
Many of our customers are regulated by federal and state government agencies and the addition of new regulations or changes to existing regulations may adversely impact demand for our services and the profitability of those services.
Many of our energy customers are regulated by the Federal Energy Regulatory Commission, or FERC, and our utility customers are regulated by state public utility commissions. These agencies could change the way in which they interpret current regulations and may impose additional regulations. These changes could have an adverse effect on our customers and the profitability of the services they provide which could reduce demand for our services.
Our business may be materially adversely impacted by regional, national and/or global requirements to significantly limit or reduce greenhouse gas emissions in the future.
Greenhouse gases that result from human activities, including burning of fossil fuels, are the focus of increased scientific and political scrutiny and may be subjected to various legal requirements. International agreements, federal laws, state laws and various regulatory schemes limit or otherwise regulate emissions of greenhouse gases, and additional restrictions are under consideration by different governmental entities. We derive a significant amount of revenues and contract profits from engineering and construction services to clients that own and/or operate a wide range of process plants and own and/or operate electric power generating plants that generate electricity from burning natural
gas or various types of solid fuels. These plants may emit greenhouse gases as part of the process to generate electricity or other products. Compliance with the existing greenhouse gas regulation may prove costly or difficult. It is possible that owners and operators of existing or future process plants and electric generating plants could be subject to new or changed environmental regulations that result in significantly limiting or reducing the amounts of greenhouse gas emissions, increasing the cost of emitting such gases or requiring emissions allowances. The costs of controlling such emissions or obtaining
required emissions allowances could be significant. It also is possible that necessary controls or allowances may not be available. Such regulations could negatively impact client investments in capital projects in our markets, which could negatively impact the market for our products and/or services. This could materially adversely affect our business.
In addition, the establishment of rules limiting greenhouse gas emissions could impact our ability to perform construction services or to perform these services with current levels of profitability. New regulations may require us to acquire different equipment or change processes. The new equipment may not be available, or it may not be purchased or rented in a cost effective manner. Project deferrals, delays or cancellations resulting from the potential regulations could adversely impact our business.
Changes to renewable portfolio standards and decreased demand for renewable energy projects could negatively impact our future results of operations, cash flows and liquidity.
A significant portion of our future business may be focused on providing construction and/or installation services to owners and operators of solar power and other renewable energy facilities. Currently, the development of solar and other renewable energy facilities is highly dependent on tax credits, the existence of renewable portfolio standards and other state incentives. Renewable portfolio standards are state-specific statutory provisions requiring that electric utilities generate a certain amount of electricity from renewable energy sources. These standards have initiated significant growth in the renewable energy industry and a potential demand for renewable energy infrastructure construction services. Since renewable energy is generally more expensive to produce, elimination of, or changes to, existing renewable portfolio standards, tax credits or similar environmental policies may negatively affect future demand for our services.
We may lose business to competitors through the competitive bidding processes.
We are engaged in highly competitive businesses in which most customer contracts are awarded through bidding processes based on price and the acceptance of certain risks. We compete with other general and specialty contractors, both foreignregional and domestic, including large international contractorsnational, and small local contractors. The strong competition in our markets requires maintaining skilled personnel and investing in technology, and it also puts pressure on profit margins. We do not obtain contracts from all of our bids and our inability to win bids at acceptable profit margins would adversely affect our business.
We may be unsuccessful at generating internal growth which may affect our ability to expand our operations or grow our business.
Our ability to generate internal growth may be affected by, among other factors, our ability to:
| · | | Increase the number of projects performed for existing customers; |
| · | | Hire and retain qualified personnel; |
| · | | Successfully bid for new projects; and |
| · | | · Attract new customers;
· Increase the number of projects performed for existing customers;
· Hire and retain qualified personnel;
· Successfully bid for new projects; and
·Adapt the range of services we offer to address our customers’ evolving construction needs.
|
In addition, our customers may reduce the number or size of projects available to us due to their inability to obtain capital. Our customers may also reduce projects in response to economic conditions.
Many of the factors affecting our ability to generate internal growth may be beyond our control, and we cannot be certain that our strategies will be successful or that we will be able to generate cash flow sufficient to fund our
operations and to support internal growth. If we are unsuccessful, we may not be able to achieve internal growth, expand our operations or grow our business.
The timing of new contracts may result in unpredictable fluctuations in our business.
Substantial portions of our revenues are derived from project-based work that is awarded through a competitive bid process. The portion of revenue generated from the competitive bid process for 2015, 20142017, 2016 and 20132015 was approximately 47%52%, 64%45%, and 66%47%, respectively. It is generally very difficult to predict the timing and geographic distribution of the projects that we will be awarded. The selection of, timing of or failure to obtain projects, delays in award of projects, the re-bidding or termination of projects due to budget overruns, cancellations of projects or delays in completion of contracts could result in the under-utilization of our assets and reduce our cash flows. Even if we are awarded contracts, we face additional risks that could affect whether, or when, work will begin. For example, some of our contracts are subject to financing, permitting and other contingencies that may delay or result in termination of projects. We may have difficulty in matching workforce size and equipment location with contract needs. In some cases, we may be required to bear the cost of a ready workforce and equipment that is larger than necessary, resulting in unpredictability in our cash flow, expenses and profitability. If any expected contract award or the related work release is delayed or not received, we could incur
substantial costs without receipt of any corresponding revenues. Moreover, construction projects for which our services are contracted may require significant expenditures by us prior to receipt of relevant payments by a customer and may expose us to potential credit risk if the customer encounters financial difficulties. Finally, the winding down or completion of work on significant projects will reduce our revenue and earnings if these projects have not been replaced in the current period.replaced.
We derive a significant portion of our revenues from a few customers, and the loss of one or more of these customers could have significant effects on our revenues, resulting in adverse effects on our financial condition, results of operations and cash flows.
Our customer base is highly concentrated, with our top ten customers accounting for approximately 56% of our revenue in 2017, 60% of our revenue in 2016 and 59% of our revenue in 2015, 53% of our revenue in 2014 and 50% of our revenue in 2013.2015. However, the customers included in our top ten customer list generally variesvary from year to year. Our revenue is dependent both on performance of larger construction projects and relatively smaller Master Services Agreements (“MSA”) contracts. For the large construction projects, the completion of the project does not necessarily represent the permanent loss of a customer.customer; however, the future revenues generated from work for that customer may fluctuate significantly.
We also generate ongoing revenues from our MSA customers, which are generally comprised of regulated gas utilities. If we were to lose one of these customers, our revenue could significantly decline. Reduced demand for our services by larger construction customers or a loss of a significant MSA customer could have an adverse effect on our business.
Our international operations expose us to legal, political and economic risks in different countries as well as currency exchange rate fluctuations that could harm our business and financial results. We could be adversely affected by our failure to comply with laws applicable to our foreign activities, such as the U.S. Foreign Corrupt Practices Act.
During 2015, 20142017, 2016 and 2013,2015, revenue attributable to our services outside of the United States was 0.9%0.3%, 1.0%0.6% and 0.8%0.9% of our total revenue, respectively. While much of this revenue is derived from the operations of our Canadian subsidiary, OnQuest Canada, ULC, actualconstruction activities have occurred in several far eastern countries and in Australia. There are risks inherent in doing business internationally, including:
| · | | Imposition of governmental controls and changes in laws, regulations, policies, practices, tariffs and taxes; |
| · | | Political and economic instability; |
| · | | Changes in United States and other national government trade policies affecting the market for our services; |
| · | | Potential non-compliance with a wide variety of laws and regulations, including the United States Foreign Corrupt Practices Act (“FCPA”) and similar non-United States laws and regulations; |
| · | | Currency exchange rate fluctuations, devaluations and other conversion restrictions; |
· Imposition
· Political and economic instability;
| · | | Restrictions on repatriating foreign profits back to the United States; and |
| · | | · Changes in United States and other national government trade policies affecting the market for our services;
· Potential non-compliance with a wide variety of laws and regulations, including the United States Foreign Corrupt Practices Act (“FCPA”) and similar non-United States laws and regulations;
· Currency exchange rate fluctuations, devaluations and other conversion restrictions;
· Restrictions on repatriating foreign profits back to the United States; and
·Difficulties in staffing and managing international operations.
|
The FCPA and similar anti-bribery laws in other jurisdictions prohibit U.S.-based companies and their intermediaries from making improper payments to non-U.S. officials for the purpose of obtaining or retaining business. We pursue opportunities in certain parts of the world that experience government corruption, and in certain circumstances, compliance with anti-bribery laws may conflict with local customs and practices. Our internal policies mandate compliance with all applicable anti-bribery laws. We require our partners, subcontractors, agents and others who work for us or on our behalf to comply with the FCPA and other anti-bribery laws. There is no assurance that our policies or procedures will protect us against liability under the FCPA or other laws for actions taken by our agents, employees and intermediaries. If we are found to be liable for FCPA violations (either due to our own acts or our inadvertence, or due to the acts or inadvertence of others), we could suffer from severe criminal or civil penalties or other sanctions, which could have a material adverse effect on our reputation and business. In addition, detecting, investigating and resolving actual or alleged FCPA violations is expensive and could consume significant time and attention of our senior management.
Backlog may not be realized or may not result in revenues or profits.
Backlog is measured and defined differently by companies within our industry. We refer to “backlog” as our estimated revenue on uncompleted contracts, includingless the revenue we have recognized under such contracts, plus the amount of revenue on contracts on which work has not begun, less the revenue we have recognized under such contracts plus an estimated level of MSA revenues for the next four quarters. Backlog is not a comprehensive indicator of future revenues. Most contracts may be terminated by our customers on short notice. Reductions in backlog due to cancellation by a customer, or for other reasons, could significantly reduce the revenue that we actually receive from contracts in backlog. In the event of a project cancellation, we may be reimbursed for certain costs, but we typically have no contractual right to the total revenues reflected in our backlog. Projects may remain in backlog for extended periods of time. While backlog includes estimated MSA revenues, customers are not contractually obligated to purchase an amount of services under the MSA.
Given these factors, our backlog at any point in time may not accurately represent the revenue that we expect to realize during any period, and our backlog as of the end of a fiscal year may not be indicative of the revenue we expect to earn in the following fiscal year. Inability to realize revenue from our backlog could have an adverse effect on our business.
Backlog is an indicator of future revenues; however, recognition of revenues from backlog does not necessarily ensure that the projects will be profitable. Poor project or contract performance could impact profits from contracts included in backlog. For projects for which a loss is expected, future revenues will be recorded with no margin, which may reduce the overall margin percentage for work performed.
Our actual cost may be greater than expected in performing our fixed-price and unit-price contracts, causing us to realize significantly lower profits or losses on our projects.
We currently generate, and expect to continue to generate, a portion of our revenue and profits under fixed-price and unit-price contracts. The approximate portion of revenue generated from fixed-price contracts for the years 2017, 2016 and 2015 2014was 40%, 35% and 2013 was 39%, 23% and 48%, respectively. The approximate portion of revenue generated from unit-price contracts for the years 2017, 2016 and 2015 2014 and 2013 was 43%46%, 32%45%, and 39%43%, respectively. In general, we must estimate the costs of completing a specific project to bid these types of contracts. The actual cost of labor and materials may vary from the costs we originally estimated, and we may not be successful in recouping additional costs from our customers. These variations may cause gross profits for a project to differ from those we originally estimated. Reduced profitability or losses on projects could occur due to changes in a variety of factors such as:
��
| · | | ·Failure to properly estimate costs of engineering, materials, equipment or labor;
|
| · | | Unanticipated technical problems with the structures, materials or services being supplied by us, which may require that we spend our own money to remedy the problem; |
| · | | Project modifications not reimbursed by the client creating unanticipated costs; |
· Unanticipated technical problems with the structures, materials or services being supplied by us, which may require that we spend our own money to remedy the problem;
| · | | Changes in the costs of equipment, materials, labor or subcontractors; |
| · | | Our suppliers or subcontractors failure to perform; |
| · | | Changes in local laws and regulations, and; |
| · | | · Project modifications not reimbursed by the client creating unanticipated costs;
· Changes in the costs of equipment, materials, labor or subcontractors;
· Our suppliers or subcontractors failure to perform;
· Changes in local laws and regulations, and;
·Delays caused by local weather conditions.
|
As projects grow in size and complexity, these factors may combine, and depending on the size of the particular project, variations from the estimated contract costs could have a material adverse effect on our business.
Weather can significantly affect our revenues and profitability.
Our ability to perform work and meet customer schedules can be affected by weather conditions such as snow, ice and rain. Weather may affect our ability to work efficiently and can cause project delays and additional costs. Our ability to negotiate change orders for the impact of weather on a project could impact our profitability. In addition, the impact of weather can cause significant variability in our quarterly revenue and profitability.
We require subcontractors and suppliers to assist us in providing certain services, and we may be unable to retain the necessary subcontractors or obtain supplies to complete certain projects adversely affecting our business.
We use subcontractors to perform portions of our contracts and to manage workflow, particularly for design, engineering, procurement and some foundation work. While we are not dependent on any single subcontractor, general market conditions may limit the availability of subcontractors to perform portions of our contracts causing delays and increases in our costs.
We also use suppliers to provide the materials and some equipment used for projects. However, significant materials and equipment are usually supplied by the customer. If a supplier fails to provide supplies and equipment at a price we estimated, fails to provide supplies and equipment that are not of acceptable quantity or fails to provide supplies when scheduled, we may be required to source the supplies or equipment at a higher price or may be required to delay performance of the project. The additional cost or project delays could negatively impact project profitability.
Failure of a subcontractor or supplier to comply with laws, rules or regulations could negatively affect our reputation and our business.
We may enter into joint ventures which require satisfactory performance by our venture partners of their obligations. The failure of our joint venture partners to perform their joint venture obligations could impose additional financial and performance obligations on us that could result in reduced profits or losses for us with respect to the joint venture.
As is typical in our industry, we may enter into various joint ventures and teaming arrangements where control may be shared with unaffiliated third parties. At times, we also participate in joint ventures where we are not a controlling party. In such instances, we may have limited control over joint venture decisions and actions, including internal controls and financial reporting which may have an impact on our business. If our joint venture partners fail to satisfactorily perform their joint venture obligations, the joint venture may be unable to adequately perform or deliver its contracted services. Under these circumstances, we may be required to make additional investments or provide additional services to ensure the adequate performance and delivery of the contracted services. These additional obligations could result in reduced profits and may impact our reputation in the industry.
We may experience delays and defaults in client payments and we may pay our suppliers and subcontractors before receiving payment from our customers for the related services; we could experience an adverse effect on our financial condition, results of operations and cash flows.
We use subcontractors and material suppliers for portions of certain work, and our customers pay us for those related services. If we pay our suppliers and subcontractors for materials purchased and work performed for customers who fail to pay us, or such customers delay in paying us for the related work or materials, we could experience a material
adverse effect on our business. In addition, if customers fail to pay us for work we perform, we could experience a material adverse effect on our business.
Our inability to recover on claims against project owners or subcontractors for payment or performance could negatively affect our business.
We occasionally present claims or change orders to our clients and subcontractors for additional costs exceeding a contract price or for costs not included in the original contract price. IfChange orders are modifications of an original contract that effectively change certain provisions of the contract. They generally include changes in specifications or design, facilities, equipment, materials, sites and periods for completion of work. Claims are amounts in excess of the agreed contract price (or amounts not included in the original contract price) that we doseek to collect from customers or others for customer-caused changes in contract specifications or design, other customer-related causes of unanticipated additional contract costs on which there is no agreement with customers, or non-customer-caused changes, such as weather delays. These costs may or may not properlybe recovered until the claim is resolved. In some instances, these claims can be the subject of lengthy legal proceedings, and it is difficult to accurately predict when they will be fully resolved. A failure to promptly document the nature of our claims and negotiate a recovery for change orders or are otherwise not successful in negotiatingand claims could have a reasonable settlement, wenegative impact on our cash flows, and an overall ability to recover change orders and claims could incur reduced profitability orhave a lossnegative impact on a project. Claims often occur from owner-caused delays or changes in scope from the original project. Claims may be subject to lengthyour financial condition, results of operations and costly arbitration or litigation and may require a lengthy process to resolve.cash flows.
For some projects we may guarantee a timely completion or provide a performance guarantee which could result in additional costs, such as liquidated damages, to cover our obligations.
In our fixed-price and unit-price contracts we may provide a project completion date, and in some of our projects we commit that the project will achieve specific performance standards. If we do not complete the project as scheduled, or if the project does not meet the contracted performance standards, we may be held responsible for the impact to the client resulting from the delay or the inability to meet the standards. Generally, the impact to the client is in the form of liquidated damages specified in the contract.
A significant portion of our business depends on our ability to provide surety bonds, and we may be unable to compete for or work on certain projects if we are not able to obtain the necessary surety bonds.
Our contracts frequently require that we provide payment and performance bonds to our customers. Under standard terms in the surety market, sureties issue or continue bonds on a project-by-project basis and can decline to issue bonds at any time or require the posting of additional collateral as a condition to issuing or renewing bonds.
Current or future market conditions, as well as changes in our surety providers’ assessments of our operating and financial risk, could cause our surety providers to decline to issue or renew, or to substantially reduce, the availability of bonds for our work and could increase our bonding costs. These actions could be taken on short notice. If our surety providers were to limit or eliminate our access to bonding, our alternatives would include seeking bonding capacity from other sureties, finding more business that does not require bonds and posting other forms of collateral for project performance, such as letters of credit or cash. We may be unable to secure these alternatives in a timely manner, on acceptable terms, or at all. Accordingly, if we were to experience an interruption or reduction in the availability of bonding capacity, we may be unable to compete for or work on certain projects.
Our bonding requirements may limit our ability to incur indebtedness, which would limit our ability to refinance our existing credit facilities or to execute our business plan.
Our ability to obtain surety bonds depends upon various factors including our capitalization, working capital, tangible net worth and amount of our indebtedness. In order to help ensure that we can obtain required bonds, we may be limited in our ability to incur additional indebtedness that may be needed to refinance our existing credit facilities upon maturity and to execute our business plan.
We may be unable to win some new contracts if we cannot provide clients with letters of credit.
For many of our clients surety bonds provide an adequate form of security, but for some clients additional security in the form of a letter of credit may be required. While we have capacity for letters of credit under our credit facility, the amount required by a client may be in excess of our credit limit. Any such amount would be issued at the sole discretion of our lenders. Failure to provide a letter of credit when required by a client may result in our inability to compete for or win a project.
During the ordinary course of our business, we may become subject to material lawsuits or indemnity claims.
We have in the past been, and may in the future be, named as a defendant in lawsuits, claims and other legal proceedings during the ordinary course of our business. These actions may seek, among other things, compensation for alleged personal injury, workers’ compensation, employment discrimination, breach of contract, property damage, punitive damages, and civil penalties or other losses or injunctive or declaratory relief. In addition, we generally indemnify our customers for claims related to the services we provide and actions we take under our contracts with them, and, in some instances, we may be allocated risk through our contract terms for actions by our customers or other third parties. Because our services in certain instances may be integral to the operation and performance of our customers’ infrastructure, we may become subject to lawsuits or claims for any failure of the systems on which we work, even if our services are not the cause of such failures, and we could be subject to civil and criminal liabilities to the extent that our services contributed to any property damage, personal injury or system failure. The outcome of any of these lawsuits, claims or legal proceedings could result in significant costs and diversion of management’s attention to the business. Payments of significant amounts, even if reserved, could adversely affect our reputation and our business.
We are self-insured against potential liabilities.
Although we maintain insurance policies with respect to employer’s liability, general liability, auto and workers compensation claims, those policies are subject to deductibles or self-insured retention amounts of up to $250,000 per occurrence. We are primarily self-insured for all claims that do not exceed the amount of the applicable deductible/self-insured retention. In addition, for our employees not part of a collective bargaining agreement, we provide employee health care benefit plans. Our primary health insurance plan is subject to a deductible of $250,000 per individual claim per year.
Our insurance policies include various coverage requirements, including the requirement to give appropriate notice. If we fail to comply with these requirements, our coverage could be denied.
Losses under our insurance programs are accrued based upon our estimates of the ultimate liability for claims reported and an estimate of claims incurred but not reported. Insurance liabilities are difficult to assess and estimate due to unknown factors, including the severity of an injury, the extent of damage, the determination of our liability in proportion to other parties and the number of incidents not reported. The accruals are based upon known facts and historical trends.
Our business is labor intensive. If we are unable to attract and retain qualified managers and skilled employees, our operating costs may increase.
Our business is labor intensive and our ability to maintain our productivity and profitability may be limited by our ability to employ, train and retain skilled personnel necessary to meet our requirements. We may not be able to maintain an adequately skilled labor force necessary to operate efficiently and to support our growth strategy. We have from time-to-time experienced, and may in the future experience, shortages of certain types of qualified personnel. For example, periodically there are shortages of engineers, project managers, field supervisors, and other skilled workers capable of working on and supervising the construction of underground, heavy civil and industrial facilities, as well as providing engineering services. The supply of experienced engineers, project managers, field supervisors and other skilled workers may not be sufficient to meet current or expected demand. The beginning of new, large-scale infrastructure projects or increased competition for workers currently available to us, could affect our business, even if we are not awarded such projects. Labor shortages or increased labor costs could impair our ability to maintain our
business or grow our revenues. If we are unable to hire employees with the requisite skills, we may also be forced to incur significant training expenses.
Our unionized workforce may commence work stoppages, which could adversely affect our operations.
As of December 31, 2015,2017, approximately 24%52% of our hourly employees, primarily consisting of field laborers, were covered by collective bargaining agreements. Of the 8297 collective bargaining agreements to which we are a party, 5675 expire during 20162018 and require renegotiation. Although the majority of these agreements prohibit strikes and work stoppages, we cannot be certain that strikes or work stoppages will not occur in the future. Strikes or work stoppages would adversely impact our relationships with our customers and could have an adverse effect on our business.
Our ability to complete future acquisitions could be adversely affected because of our union status for a variety of reasons. For instance, in certain geographic areas, our union agreements may be incompatible with the union agreements of a business we want to acquire and some businesses may not want to become affiliated with a union company. In addition, if we acquire a union affiliated company, we may increase our future exposure to withdrawal liabilities for any underfunded pension plans.
The current Federal administration has expressed strong support for legislation and regulation that would create more flexibility and opportunity for labor unions to organize non-union workers. This legislation or regulation could result in a greater percentage of our workforce being subject to collective bargaining agreements.
Withdrawal from multiemployer pension plans associated with our unionized workforce could adversely affect our financial condition and results of operations.
Our collective bargaining agreements generally require that we participate with other companies in multiemployer pension plans. To the extent those plans are underfunded, the Employee Retirement Income Security Act of 1974 (“ERISA”), as amended by the Multiemployer Pension Plan Amendments Act of 1980 (“MEPA”), may subject us to substantial liabilities under those plans if we withdraw from them or they are terminated. In addition, the Pension Protection Act of 2006 added new funding rules for multiemployer plans that are classified as endangered, seriously endangered or critical status. For a plan in critical status, additional required contributions and benefit reductions may apply if a plan is determined to be underfunded, which could adversely affect our financial condition or results of operations. For plans in critical status, we may be required to make additional contributions, generally in the form of surcharges on contributions otherwise required. Participation in those plans with high funding levels could adversely affect our results of operations, financial condition or cash flows if we are not able to adequately mitigate these costs.
The amount of the withdrawal liability legislated by ERISA and MEPA varies for every pension plan to which we contribute. For each plan, our liability is the total unfunded vested benefits of the plan multiplied by a fraction: the numerator of the fraction is the sum of our contributions to the plan for the past ten years and the denominator is the sum of all contributions made by all employers for the past ten years. For some pension plans to which we contribute, the total unfunded vested benefits are in the billions of dollars. If we cannot reduce the liability through exemptions or negotiations, the withdrawal from a plan could have a material adverse impact on our business.
We depend on key personnel and we may not be able to operate and grow our business effectively if we lose the services of any of our key persons or are unable to attract qualified and skilled personnel in the future.
We are dependent upon the efforts of our key personnel, and our ability to retain them and hire other qualified employees. The loss of our executive officers or other key personnel could affect our ability to run our business effectively. Competition for senior management personnel is intense, and we may not be able to retain our personnel. The loss of any key person requires the remaining key personnel to divert immediate and substantial attention to seeking a replacement. In addition, as some of our key persons approach retirement age, we need to provide for smooth transitions. An inability to find a suitable replacement for any departing executive or senior officer on a timely basis could adversely affect our ability to operate and grow our business.
If we fail to integrate acquisitions successfully, we may experience operational challenges and risks which may have an adverse effect on our business.
As part of our growth strategy, we intend to acquire companies that expand, complement or diversify our business. Acquisitions may expose us to operational challenges and risks, including, among others:
| · | | The diversion of management’s attention from the day-to-day operations of the combined company; |
| · | | Managing a significantly larger company than before completion of an acquisition; |
| · | | The assimilation of new employees and the integration of business cultures; |
| · | | Training and facilitating our internal control processes within the acquired organization; |
| · | | Retaining key personnel; |
| · | | The integration of information, accounting, finance, sales, billing, payroll and regulatory compliance systems; |
| · | | Challenges in keeping existing customers and obtaining new customers; |
| · | | Challenges in combining service offerings and sales and marketing activities; |
| · | | The assumption of unknown liabilities of the acquired business for which there are inadequate reserves; |
| · | | The potential impairment of acquired goodwill and intangible assets; and |
| · | | · The diversion of management’s attention from the day-to-day operations of the combined company;
· Managing a significantly larger company than before completion of an acquisition;
· The assimilation of new employees and the integration of business cultures;
· Retaining key personnel;
· The integration of information, accounting, finance, sales, billing, payroll and regulatory compliance systems;
· Challenges in keeping existing customers and obtaining new customers;
· Challenges in combining service offerings and sales and marketing activities;
· The assumption of unknown liabilities of the acquired business for which there are inadequate reserves;
· The potential impairment of acquired goodwill and intangible assets; and
·The inability to enforce covenants not to compete.
|
If we cannot effectively manage the integration process or if any significant business activities are interrupted as a result of the integration process of any acquisition, our business could suffer.
Our business growth could outpace the capabilityWe may incur higher costs to lease, acquire and maintain equipment necessary for our operations.
A significant portion of our internal infrastructure and may prohibit us from expandingcontracts is built with our operationsown construction equipment rather than leased or execute our business plan.
Our internal infrastructure may not be adequate to support our operations as they expand.rented equipment. To the extent that we are unable to buy or build equipment necessary for a project, either due to a lack of available funding or equipment shortages in the marketplace, we may be forced to rent equipment on a short-term basis or to find alternative ways to perform the work without the benefit of equipment ideally suited for the job, which could increase the costs of completing the project. We often bid for work knowing that we
will have to rent equipment on a short-term basis, and we include our assumptions of market equipment rental rates in our bid. If market rates for rental equipment increase between the time of bid submission and project execution, our margins for the project may be reduced. In addition, our equipment requires continuous maintenance, which we generally provide through our own repair facilities. If we are unable to continue to maintain the equipment in our fleet, we may be forced to obtain additional third-party repair services at a higher cost or be unable to bid on contracts.
Our business may be affected by difficult work sites and environments which may adversely affect our ability to procure materials and labor.
We perform our work under a variety of conditions, including, but not limited to, difficult and hard to reach terrain, difficult site conditions and busy urban centers where delivery of materials and availability of labor may be impacted. Performing work under these conditions can slow our progress, potentially causing us to incur contractual liability to our customers. These difficult conditions may also cause us to incur additional, unanticipated costs that we might not be able to pass on to our customers.
We may incur liabilities or suffer negative financial or reputational impacts relating to health and safety matters.
Our operations are subject to extensive laws and regulations relating to the maintenance of safe conditions in the workplace. While we have invested, and will continue to invest, substantial resources in our environmental, health and safety programs, our industry involves a high degree of operational risk and there can be no assurance that we will avoid significant liability exposure. Although we have taken what we believe are appropriate precautions, we have suffered fatalities in the past and may suffer additional fatalities in the future. Serious accidents, including fatalities, may subject us to substantial penalties, civil litigation or criminal prosecution. Claims for damages to persons, including claims for bodily injury or loss of life, could result in substantial costs and liabilities, which could materially and adversely affect our financial condition, results of operations or cash flows. In addition, if our safety record were to
substantially deteriorate over time or we were to suffer substantial penalties or criminal prosecution for violation of health and safety regulations, our customers could cancel our contracts and not award us future business.
We may incur additional healthcare costs arising from federal healthcare reform legislation.
In March 2010, the Patient Protection and Affordable Care Act and the Health Care and Education Reconciliation Act of 2010 were signed into law in the U.S. This legislation expands health care coverage to many uninsured individuals and expands coverage to those already insured. The changes required by this legislation could cause us to incur additional healthcare and other costs for which we may not be reimbursed by our customers. The employee insurance requirements have begun to impact our expenses as the penalties for non-compliance by our employees continually increase. While we anticipate increases in our customer billing rates to reflect the increased expense, there can be no guarantee that we will be able to pass these costs to our customers or that our competition will increase their bids to reflect the increased healthcare costs. For our multi-year highway projects, we may not be able to anticipate further increases in healthcare costs associated with the healthcare reform legislation.
Interruptions in information technology or breaches in data security could adversely impact our operations, our ability to report financial results and our business.
We rely on computer, information and communication technology and related systems to operate our business. As we continue to grow our business, we need to add software and hardware and effectively upgrade our systems and network infrastructure in order to improve the efficiency and protection of our systems and information. OurWhile we do not maintain customer information in our computer systems, our computer and communications systems, and consequently our operations, could be damaged or interrupted by natural disasters, loss of power, telecommunications failures, acts of war, acts of terrorism, computer viruses, physical or electronic break-ins and actions by hackers and cyber-terrorists. Any of these, or similar, events could cause system disruptions, delays and loss of critical information, delays in processing transactions and delays in the reporting of financial information. While we have implemented network security and internal control measures, there can be no assurance that a system or network failure or data security breach would not adversely affect our business.
As a holding company, we are dependent on our subsidiaries for cash distributions to fund debt payments, dividend payments and other liabilities.
We are a holding company with no operations or significant assets other than the stock that we own of our subsidiaries.
We depend on dividends, loans and distributions from these subsidiaries to service our indebtedness, pay dividends, fund share repurchases and satisfy other financial obligations. If contractual limitations or legal regulations were to restrict the ability of our subsidiaries to make cash distributions to us, we may not have sufficient funds to cover our financial obligations.
We may need additional capital in the future for working capital, capital expenditures or acquisitions, and we may not be able to do so on favorable terms, or at all, which would impair our ability to operate our business or achieve our growth objectives.
Our ability to generate cash is essential for the funding of our operations and the servicing of our debt. If existing cash balances together with the borrowing capacity under our credit facilities were not sufficient to make future investments, make acquisitions or provide needed working capital, we may require financing from other sources. Our ability to obtain such additional financing in the future will depend on a number of factors including prevailing capital market conditions; conditions in our industry; and our operating results. These factors may affect our ability to arrange additional financing on terms that are acceptable to us. If additional funds were not available on acceptable terms, we may not be able to make future investments, take advantage of acquisitions or other opportunities or respond to competitive challenges.
Risks Related Primarily to the Financial Accounting of our Business
Our financial results are based upon estimates and assumptions that may differ from actual results.
In preparing our consolidated annual and quarterly financial statements in conformity with generally accepted accounting principles, many estimates and assumptions are used in determining the reported revenues, costs and expenses recognized during the periods presented, and disclosures of contingent assets and liabilities known to exist as of the date of the financial statements. These estimates and assumptions must be made because certain information that is used in the preparation of our financial statements cannot be calculated with a high degree of precision from data available, is dependent on future events, or is not capable of being readily calculated based on generally accepted methodologies. Often times, these estimates are particularly difficult to determine, and we must exercise significant judgment. Estimates may be used in our assessments of the allowance for doubtful accounts, useful lives of property and equipment, fair value assumptions in analyzing goodwill and long-lived asset impairments, self-insured claims liabilities, revenue recognition under percentage-of-completion accounting and provisions for income taxes. Actual results for estimates could differ materially from the estimates and assumptions that we used.
Our use of percentage-of-completion accounting could result in a reduction or elimination of previously reported revenue and profits.
WeFor fixed-price and unit-price contracts, we recognize revenue using the percentage-of-completion method of accounting, using the cost-to-cost method, where revenues are estimated based on the percentage of costs incurred to date to total estimated costs. This method is used because management considers expended costs to be the best available measure of progress on these contracts. The earnings or losses recognized on individual contracts are based on estimates of total contract revenues, total expected costs and costs incurred to date. Contract losses are recognized in full when determined, and contract profit estimates are adjusted based upon ongoing reviews of contract profitability.
Penalties or potential charges are recorded when known or finalized, which generally is during the latter stages of the contract.finalized. In addition, we record adjustments to estimated costs of contracts when we believe the change in the estimate is probable and the amounts can be reasonably estimated. These adjustments could result in both increases and decreases in profit margins. Actual results could differ from estimated amounts and could result in a reduction or elimination of previously recognized earnings. In certain circumstances, it is possible that such adjustments could be significant and could have an adverse effect on our business.
Our reported results of operations and financial condition could be adversely affected as a result of changes in accounting standards.
In May 2014, theThe Financial Accounting Standards Board (“FASB”) finalized revised standardsperiodically issues Accounting Standards Updates (“ASU”) that revise the treatment for revenue recognition which become effectivevarious accounting topics. See Note 2 — “Summary of Significant Accounting Policies - Recently Issued Accounting Pronouncements” of the Notes to Consolidated Financial Statements included in Item 8 of this Form 10-K for the Company beginning in 2018. In February 2016, the FASB issued a revised standard for accountingdiscussion of operating leases, which becomes affective for the Company beginning in 2019.ASUs not yet adopted. These changes and other future changes could result in changes in the way we report our financial results.
Our reported results of operations could be adversely affected as a result of impairments of goodwill, other intangible assets or investments.
When we acquire a business, we record an asset called “goodwill” for the excess amount we pay for the business over the net fair value of the tangible and intangible assets of the business we acquire. At December 31, 2015,2017, our balance sheet included goodwill of $124$153.4 million and intangible assets of $36$44.8 million resulting from previous acquisitions. Fair value is determined using a combination of the discounted cash flow, market multiple and market capitalization valuation approaches. Under current accounting rules, goodwill and other intangible assets that have indefinite useful lives cannot be amortized, but instead must be tested at least annually for impairment, while intangible assets that have finite useful lives are amortized over their useful lives. Any impairment of the goodwill or intangible assets recorded in connection with the various acquisitions, or for any future acquisitions, would negatively impact our results of operations.
In addition, we may enter into various types of investment arrangements, such as an equity interest we hold in a business entity. Our equity method investments are carried at original cost and are included in other assets in our consolidated balance sheetConsolidated Balance Sheet and are adjusted for our proportionate share of the investees’ income, losses and distributions. Equity investments are reviewed for impairment by assessing whether any decline in the fair value of the investment below its carrying value is other than temporary. In making this determination, factors such as the ability to recover the carrying amount of the investment and the inability of the investee to sustain future earnings capacity are evaluated in determining whether an impairment should be recognized.
Compliance with and changes in tax laws could adversely affect our performance.
We are subject to extensive tax liabilities imposed by multiple jurisdictions. The Tax Cuts and Jobs Act (the “Tax Act”) was signed into law on December 22, 2017. This legislation makes significant changes to the U.S. Internal Revenue Code and requires complex computations not previously provided in U.S. tax law. Given the significance of the legislation, the SEC staff issued Staff Accounting Bulletin (“SAB”) 118 which provides guidance on accounting for uncertainties of the effects of the Tax Act. Specifically, SAB 118 allows companies to record provisional estimates of
the impact of the Tax Act during a one year “measurement period” similar to that used when accounting for business combinations.
New tax laws and regulations and changes in existing tax laws and regulations are continuously being enacted or proposed, and could result in a different tax rate on our earnings, which could have a material impact on our earnings and cash flow from operations. In addition, significant judgment is required in determining our provision for income taxes. In the ordinary course of our business, there are many transactions and calculations where the ultimate tax determination is uncertain. We are regularly under audit by tax authorities, and our tax estimates and tax positions could be materially affected by many factors including the final outcome of tax audits and related litigation, the introduction of new tax accounting standards, legislation, regulations and related interpretations, our mix of earnings, the realizability of deferred tax assets and changes in uncertain tax positions. A significant increase in our tax rate could have a material adverse effect on our profitability and liquidity.
We may not be successful in continuing to meet the internal control requirements of the Sarbanes-Oxley Act of 2002.
The Sarbanes-Oxley Act of 2002 has many requirements applicable to us regarding corporate governance and financial reporting, including the requirements for management to report on internal controls over financial reporting and for our independent registered public accounting firm to express an opinion over the operating effectiveness of our internal control over financial reporting. At December 31, 2015,2017, our internal control over financial reporting was effective using the internal control standardsframework issued by the Committee of Sponsoring Organizations (“COSO”) of the Treadway Commission: Internal control—Integrated Framework (1992)(2013). In 2013, an updated set
We have successfully completed the implementation of internal control standards, COSO 2013, was published. In October 2013, the Public Company Accounting Oversight Board issued Staff Audit Practice Alert 11, “Considerations for Audits of Internal Control over Financial Reporting” which addressed topics that should be considered by auditors in performing their audits of internal control. As a result, during 2015, we spent considerable time, effort and expense in making significant improvements in the documentation of the processes and procedures used in our controls over financial reporting. We also spent considerable effort in planning and testing a prudent migration to an integrated financial platform for a major partsystem in the majority of our business. We expectoperations. With the completion of the conversion from the previous system, virtually all of our operations use the same information platform, allowing us to completeestablish more consistent financial and operational controls. While we plan to convert the migrationremaining operations to the new systemsame platform in 2016. We believe2018, there can be no assurance that the effortsconversion will be completed on schedule, which would mean continued use of 2015 will allow usmanual processes and controls, which tend to adoptincrease the standardsrisk of COSO 2013 in 2016. control deficiencies.
Please note that there can be no assurance that our internal control over financial reporting will be effective in future years. Failure to maintain effective internal controls or the identification of material internal control deficiencies in acquisitions already made or made in the future could result in a decrease in the market value of our common stock, the reduced ability to obtain financing, the loss of customers, penalties and additional expenditures to meet the requirements in the future.
Starting in the fourth quarter of 2014, and continuing through the date of this Annual Report on Form 10-K, the Company’sour management, independent outside counsel and the Audit Committee of the Board of Directors have spent time and resourcesbeen reviewing and analyzing various issues relating to the methods used by the Company’sour subsidiaries to recognize revenue and estimate contingencies for ongoing construction projects. The internal review remainsprojects in process,progress. We have implemented a number of changes in the documentation of contingencies and we cannot estimate when the reviewcontrol processes surrounding the recognition of revenue. We will be completed. Since the start of the review, we have made process and procedural changescontinue to focus on making additional improvements that we believewill enhance our controls over revenue recognition.and documentation.
As our internal review is ongoing,We have been cooperating with an inquiry by the staff of the Securities and Exchange Commission, which appears to be focused on certain percentage-of-completion contract revenue recognition practices of the Company during 2013 and 2014. We are continuing to respond to the staff’s inquiries in connection with this matter. At this stage, we cannotare unable to predict when the finalstaff’s inquiry will conclude or the outcome. Depending on the outcome of the review. Until our review efforts are completed, the Company’s management, outside counsel and the Audit Committee of the Board of Directors will continue to devote time and resources to the review. Ainquiry, a government entity or other third party could bring an action and seek injunctions, fines, civil and criminal penalties, or other remedies, or assert other claims or litigation against the Companyus with respect to any issues that might arise in connection with the review. We also may not be able to effectively improve and expand our financial infrastructure, and internal operating and administrative systems and controls, or do so on a timely basis.inquiry. Findings from the our reviewinquiry could result in a loss of investor confidence and decrease in the market value of our common stock, the reduced ability to obtain financing and the loss of customers.
Risks Related to our Common Stock
Our common stock is subject to potential dilution to our stockholders.
As part of our acquisition strategy, we have issued shares of common stock and used shares of common stock as a part of contingent earn-out consideration, which have resulted in dilution to our stockholders. Our Articles of Incorporation permit us to issue up to 9090.0 million shares of common stock of which 51.68approximately 51.4 million were outstanding at December 31, 2015.2017. While NASDAQ rules require that we obtain stockholder approval to issue more than 20% additional shares, stockholder approval is not required below that level. In addition, we can issue shares of preferred stock which could cause further dilution to the stockholder, resulting in reduced net income and cash flow available to common stockholders.
In 2013, our stockholders adopted our 2013 Equity Incentive Plan (“Equity Plan”). The Equity Plan replaced a previous plan. The Equity Plan authorized the Board of Directors to issue equity awards totaling 2,526,275 shares of our common stock. Our current director compensation plan, our management long-term incentive plan and any additional equity awards made will have the effect of diluting our earnings per share and stockholders’ percentage of ownership.
Our Chairman is a significant stockholder, which may make it possible for him to have significant influence over the outcome of matters submitted to our stockholders for approval and his interests may differ from the interests of other stockholders.
As of December 31, 20152017 our Chairman of the Board beneficially owned approximately 20%17% of the outstanding shares of our common stock. He may have significant influence over the outcome of all matters submitted to our stockholders for approval, including the election of our directors and other corporate actions. Such influence could have the effect of discouraging others from attempting to purchase us or take us over and could reduce the market price offered for our common stock.
Delaware law and our charter documents may impede or discourage a takeover or change in control.
As a Delaware corporation, anti-takeover provisions may impose an impediment to the ability of others to acquire control of us, even if a change of control would be of benefit to our stockholders. In addition, certain provisions of our Articles of Incorporation and Bylaws also may impose an impediment or discourage others from a takeover. These provisions include:
| · | | Our Board of Directors is classified; |
| · | | Stockholders may not act by written consent; |
| · | | There are restrictions on the ability of a stockholder to call a special meeting or nominate a director for election; and |
| · | | · Our Board of Directors is classified;
· Stockholders may not act by written consent;
· There are restrictions on the ability of a stockholder to call a special meeting or nominate a director for election; and
·Our Board of Directors can authorize the issuance of preferred shares.
|
These types of provisions may limit the ability of stockholders to obtain a premium for their shares.
ITEM 1B.UNRESOLVED STAFF COMMENTS
None.
ITEM 2.PROPERTIES
Facilities
Our executive offices are located at 2100 McKinney Avenue, Suite 1500, Dallas, Texas 75201. The telephone number of our executive office is (214) 740-5600. The East and Energy segments of our businessWe have regional offices located in Baton Rouge, Louisiana; inLake Forest, Pittsburg, Hayward, Bakersfield, San Dimas and San Diego, California; Houston, Conroe,Belton, Deer Park, and
Beaumont, Texas; Sarasota, Fort Worth and Pasadena, Texas; Suwanee, Georgia and in SarasotaMyers and Fort Lauderdale, Florida. The Energy segment also has business offices located in San Dimas, California and in Calgary, Canada. The West segment has regional offices located in Lake Forest, Pittsburg, San Francisco, Bakersfield and San Diego, California and offices located inFlorida; Little Canada, Minnesota; Hillsboro, Oregon; Denver, Colorado; Montrose, Pennsylvania and Little Canada, Minnesota.Calgary, Canada.
We lease most of the facilities and production yards used in our operations. The leases are generally for 10 to 12-year terms, expiring through 2023.2024. The aggregate lease payments made for our facilities in 20152017 were approximately $6.5$6.1 million. We believe that our facilities are adequate to meet our current and foreseeable requirements for the next several years.
We lease some of our facilitiesPrior to March 2017, we leased three properties in California from Stockdale Investment Group, Inc. (“SIGI”). We believe that these leases were entered into on similar terms as would have been negotiated with an independent third party. Brian Pratt, our largest stockholder and ourOur Chairman of the Board of Directors, holdswho is our largest stockholder, and his family hold a majority interest in SIGI and is the chairman and chief executive officer and a director of SIGI. John M. Perisich,In March 2017, we exercised a right of first refusal and purchased the SIGI properties. The purchase was approved by our Executive Vice President and General Counsel, is secretaryBoard of SIGI.Directors for $12.8 million. We assumed three mortgage notes totaling $4.2 million with the remainder paid in cash.
Property, Plant and Equipment
We ownThe construction industry is capital intensive, and maintain bothwe expect to continue making capital expenditures to meet anticipated needs for our services. In 2017, capital expenditures were approximately $79.8 million. In addition, the companies acquired during the period added $12.4 million to property, plant and equipment. Total construction and transportation equipment. In 2015 we spent approximately $67.1equipment purchases in 2017 were $43.7 million in cash, in 2014 we spent approximately $88.0 million in cash and in 2013 we spent approximately $85.8 million in cash plus an additional $2.6 million through the use of capital leases. We estimate that as of December 31, 2017, our capital equipment includes the following:
· Heavy construction and specialized equipment—3,287 units; and
· Transportation equipment—5,199
| · | | Heavy construction and specialized equipment—5,160 units; and |
| · | | Transportation equipment—4,386 units. |
We believe the ownership of equipment is generally preferable to leasing to ensure the equipment is available as needed. In addition, ownership has historically resulted in lower overall equipment costs. We attempt to obtain projects that will keep our equipment fully utilized in order to increase profit. All equipment is subject to scheduled maintenance to insureensure reliability.
Maintenance facilities exist at most of our regional offices as well as on-site on major jobs to properly service and repair equipment. Major equipment not currently utilized is rented to third parties whenever possible to supplement equipment income.possible.
The following summarizes total property, plant and equipment, net of accumulated depreciation, as of December 31, 2015 and 2014:
| | 2015 | | 2014 | | Useful Life | |
| | (In Thousands) | | (In Thousands) | | | |
Land and buildings | | $ | 56,248 | | $ | 40,604 | | 30 years | |
Leasehold improvements | | 9,650 | | 11,267 | | Lease life | |
Office equipment | | 5,958 | | 3,651 | | 3 - 5 years | |
Construction equipment | | 340,895 | | 308,915 | | 3 - 7 years | |
Transportation equipment | | 93,613 | | 83,845 | | 3 - 18 years | |
| | 506,364 | | 448,282 | | | |
Less: accumulated depreciation and amortization | | (222,819 | ) | (176,851 | ) | | |
Net property, plant and equipment | | $ | 283,545 | | $ | 271,431 | | | |
ITEM 3.LEGAL PROCEEDINGS
Legal Proceedings
On February 7, 2012, the Company was sued in an action entitled North Texas Tollway Authority (“NTTA”), Plaintiff v. James Construction Group, LLC,For information regarding legal proceedings, see Note 13 — “Commitments and KBR, Inc., Defendants, v. Reinforced Earth Company, Third-Party Defendant (the “Lawsuit”). The Company participated in court-ordered mediation for 18 months, and on February 25, 2015 the Lawsuit was settled for an expected cost to the Company of $9 million which was the accrued liability balance at December 31, 2014. As partContingencies” of the settlement, oneNotes to Consolidated Financial Statements included in Item 8 of the defendants paid us $8 million to remove all of their liability. Additionally, a second defendant agreed to provide up to $5.4 million to pay for the total expected remediation cost of approximately $22.4 million. The Company will use the $17 million to pay for a third-party contractor approvedthis Form 10-K, which is incorporated herein by the NTTA. In the event that the total remediation costs exceed the estimated amount, the second defendant would pay 20% of the excess amount and the Company would pay for 80% of the excess amount. The Company believes that the $17 million is the best and most probable estimate for its portion of the remediation cost as of December 31, 2015; however, the Company cannot provide assurance that the final cost will not exceed the amount accrued.reference.
At December 31, 2015, the Company is engaged in dispute resolution to enforce collection for two construction projects completed by the Company in 2014. For one project, a cost reimbursable contract, the Company has recorded a receivable of $32.9 million, and for the other project, the Company has a receivable balance due of $17.9 million. At December 31, 2015, the Company has not recorded revenues in excess of cost for these two projects; however, the Company has specific reserves for both projects of approximately $26 million included in “billings in excess of costs and estimated earnings.” At this time, the Company cannot predict the amount that it will collect nor the timing of any collection. The dispute resolution for the $32.9 million receivable involves mandatory international arbitration for four separate construction projects. As part of the process of exchanging information with the owner, the Company determined in the fourth quarter of 2015 that there were no remaining claims from the owner for two of the smaller projects for which the Company had been paid in full. As a result, the Company recorded approximately $2 million in revenues and margin in the quarter.
The Company is subject to other claims and legal proceedings arising out of its business. The Company provides for costs related to contingencies when a loss from such claims is probable and the amount is reasonably determinable. In determining whether it is possible to provide an estimate of loss, or range of possible loss, the Company reviews and evaluates its litigation and regulatory matters on a quarterly basis in light of potentially relevant factual and legal developments. If we determine an unfavorable outcome is not probable or reasonably estimable, we do not accrue for a potential litigation loss. Management is unable to ascertain the ultimate outcome of other claims and legal proceedings; however, after review and consultation with counsel and taking into consideration relevant insurance coverage and related deductibles/self-insurance retention, management believes that it has meritorious defense to the claims and believes that the reasonably possible outcome of such claims will not, individually or in the aggregate, have a materially adverse effect on the consolidated results of operations, financial condition or cash flows of the Company.
Government Regulations
Our operations are subject to compliance with regulatory requirements of federal, state, and municipal agencies and authorities, including regulations concerning labor relations, affirmative action and the protection of the environment. While
compliance with applicable regulatory requirements has not adversely affected operations in the past, there can be no assurance that these requirements will not change and that compliance with such requirements will not adversely affect operations.
ITEM 4.MINE SAFETY DISCLOSURES
Not applicable.
PART II
ITEM 5.MARKET FOR REGISTRANT’S COMMON EQUITY, RELATED STOCKHOLDER MATTERS AND ISSUER PURCHASES OF EQUITY SECURITIES
Market Information
On July 31,August 6, 2008, our common stock began trading on the NASDAQ Global Market under the symbol “PRIM”. Previously, our common stock traded on the OTC Bulletin Board under the ticker symbol “RPSD”. Prior to their expiration on October 2, 2010, the Company had certain warrants and unit purchase options outstanding that were traded under the NASDAQ Global Market under the symbols “PRIMW” and “PRIMU”, respectively.
We had outstanding 51,676,14051,448,753 shares of common stock and 399365 stockholders of record as of December 31, 2015.2017. These stockholders of record include depositories that hold shares of stock for brokerage firms, which in turn, hold shares of stock for numerous beneficial owners.
The following table shows the range of market prices of our common stock during 20152017 and 2014.2016.
| | Market price per
Share | | | | | | | | |
| | High | | Low | | | Market price per | |
Year ended December 31, 2015 | | | | | | |
| | | Share | |
| | | High | | Low | |
Year Ended December 31, 2017 | | | | | | | | |
First quarter | | $ | 22.98 | | $ | 16.75 | | | $ | 29.19 | | $ | 21.98 | |
Second quarter | | $ | 20.00 | | $ | 17.07 | | | $ | 25.74 | | $ | 21.83 | |
Third quarter | | $ | 19.75 | | $ | 16.26 | | | $ | 30.00 | | $ | 23.73 | |
Fourth quarter | | $ | 23.79 | | $ | 17.17 | | | $ | 29.82 | | $ | 25.45 | |
| | | | | | | | | | | | |
Year ended December 31, 2014 | | | | | | |
Year Ended December 31, 2016 | | | | | | | | |
First quarter | | $ | 33.35 | | $ | 29.26 | | | $ | 25.25 | | $ | 18.10 | |
Second quarter | | $ | 30.88 | | $ | 26.39 | | | $ | 24.86 | | $ | 17.60 | |
Third quarter | | $ | 29.80 | | $ | 23.88 | | | $ | 21.07 | | $ | 16.13 | |
Fourth quarter | | $ | 28.72 | | $ | 19.99 | | | $ | 24.53 | | $ | 18.71 | |
Dividends
The following table shows cash dividends to our common stockholders declared by the Companyus during the two years ended December 31, 2015:2017:
Declaration Date
|
| Payable Date
|
| Record Date
|
| Type
|
|
February 26, 2014
| | April 15, 2014
| | March 31, 2014
| | $
| 0.035 per share
| |
May 2, 2014
| | July 15, 2014
| | June 30, 2014
| | $
| 0.035 per share
| |
August 5, 2014
| | October 15, 2014
| | September 30, 2014
| | $
| 0.040 per share
| |
November 4, 2014
| | January 15, 2015
| | December 31, 2014
| | $
| 0.040 per share
| |
| | | | | | | |
Declaration Date | | Record Date | | Payable Date | | Amount Per Share |
February 24, 201522, 2016 | | March 31, 2016 | | April 15, 2015 | | March 31, 20152016
| | $ | 0.055 |
0.040 per shareMay 2, 2016
| |
May 1, 2015June 30, 2016
| | July 15, 2015 | | June 30, 20152016
| | $ | 0.055 per share | |
August 4, 2015 | | October 15, 20153, 2016
| | September 30, 20152016 | | October 14, 2016 | | $ | 0.055 per share | |
November 3, 2015 | | January 15,2, 2016
| | December 31, 20152016 | | January 16, 2017 | | $ | 0.055 |
0.055 per shareFebruary 21, 2017
| | March 31, 2017 | | April 15, 2017 | | $ | 0.055 |
May 5, 2017 | | June 30, 2017 | | July 14, 2017 | | $ | 0.055 |
August 2, 2017 | | September 29, 2017 | | October 14, 2017 | | $ | 0.055 |
November 2, 2017 | | December 29, 2017 | | January 15, 2018 | | $ | 0.060 |
In addition, onOn February 22, 2015,21, 2018, the Board of Directors declared a $0.055$0.06 per common share dividend with a record date of March 31, 201630, 2018 and a payable date of on or about April 15, 2016.13, 2018. The payment of future dividends is contingent upon our revenues and earnings, capital requirements and general financial condition, of the Company, as well as contractual restrictions and other considerations deemed relevant by the Board of Directors.
Equity Compensation Plan Information
In July 2008, theMay 2013, our shareholders approved and the Companywe adopted the Primoris Services Corporation 2008 Long-term Incentive Equity Plan, which was replaced by the Primoris Services Corporation 2013 Long-term Incentive Equity Plan (“2013 Equity Plan”), as approved by. As part of the shareholderscompensation of the non-employee members of the Board of Directors, we issued 11,784 shares of common stock in February 2017 and adopted by the Company on May 3, 2013.11,448 shares in August 2017. In
In March 2015,February 2017 our management employees purchased 96,82865,429 shares of stock as part of a management incentive compensation program. As part of the quarterly compensation of the non-employee members of the Board of Directors, the Company issued 8,168 shares of common stock in March 2015 and 9,748 shares in August 2015. The issuance of the employee shares and the director shares werewas under the terms of the 2013 Equity Plan.
The following table gives information about our common stock that may be issued upon the exercise of options, warrants and rights under all of our existing equity compensation plans as of December 31, 2015.2017.
| | | | | | | | |
| | | | | | | Number of securities | |
| | | | | | | remaining available | |
| | | Number of securities | | | | for future issuance | |
| | | to be issued upon | | Weighted-average | | under equity | |
| | | exercise of | | exercise price of | | compensation plans | |
| | | outstanding options, | | outstanding options, | | (excluding securities | |
| | | warrants and rights | | warrants and rights | | reflected in column (a)) | |
Plan category | | Number of securities
to be issued upon
exercise of
outstanding options,
warrants and rights
(a) | | Weighted-average
exercise price of
outstanding options,
warrants and rights
(b) | | Number of securities
remaining available
for future issuance
under equity
compensation plans
(excluding securities
reflected in column (a))
(c) | | | (a) | | (b) | | (c) | |
Equity compensation plans approved by security holders | | 148,512 | | 0 | | 2,163,907 | | | 262,162 | | — | | 1,853,494 | |
Equity compensation plans not approved by security holders | | 0 | | 0 | | 0 | | | — | | — | | — | |
Total | | 148,512 | | 0 | | 2,163,907 | | | 262,162 | | — | | 1,853,494 | |
These securities represent shares of common stock available for issuance under our 2013 Equity Plan. The 2013 Equity Plan is discussed in Note 218 of the Notes to our consolidated financial statements for the year ended December 31, 2015Consolidated Financial Statements included in Part II, Item 8 “Financial Statements and Supplementary Data”.of this Form 10-K.
Repurchases of Securities
In February 2014, the Company’s2017, our Board of Directors authorized a $5.0 million share repurchase program under which the Company, from time to time andwe could, depending on market conditions, share price and other factors, could acquire shares of itsour common stock on the open market or in privately negotiated transactions up to an aggregate purchase price of $23 million.transactions. During the period from February 2014March 23, 2017 through September 2014, the CompanyMarch 28, 2017, we purchased and cancelled 100,000216,350 shares of stock for $2.8$5.0 million at an average cost of $28.44$23.10 per share. Thisshare
In August 2016, our Board of Directors authorized a $5.0 million share repurchase program expiredunder which we could, depending on market conditions, share price and other factors, acquire shares of our common stock on the open market or in privately negotiated transactions. During the month of December 31, 2014,2016, we purchased and therecancelled 207,800 shares of stock for $5.0 million at an average cost of $24.02 per share.
There were no share repurchases authorized during 2015.
Sales of Unregistered Securities
The CompanyWe did not issue any unregistered shares of our common stock during 20142017, 2016 or 2015.
Performance Graph
The following Performance Graph and related information shall not be deemed to be filed with the Securities and Exchange Commission,SEC, nor shall such information be incorporated by reference into any future filing under the Securities Act of 1933 or Securities Exchange Act of 1934, each as amended, except to the extent that we specifically incorporate it by reference into such filing.
The following graph compares the cumulative total return to holders of the Company’sour common stock during the five-year period from December 31, 2010,2012, and in each quarter up through December 31, 2015.2017. The return is compared to the cumulative total return during the same period achieved on the Standard & Poor’s 500 Stock Index (the “S&P 500”) and a peer group index selected by our management that includes five public companies within our industry (the “Peer Group”). The Peer Group is composed of MasTec, Inc., Matrix Service Company, Quanta Services, Inc., Sterling Construction Company, Inc. and Willbros Group, Inc. The companies in the Peer Group were selected because they comprise a broad group of publicly held corporations, each of which has some operations similar to ours. When taken as a whole, management believes the Peer Group more closely resembles our total business than any individual company in the group.
The returns are calculated assuming that an investment with a value of $100 was made in the Company’sour common stock and in each stock as of December 31, 2010.2012. All dividends were reinvested in additional shares of common stock, although none of the comparable companies paid dividends during the periods shown. The Peer Group investment is calculated based on a weighted average of the five company share prices. The graph lines merely connect the measuring dates and do not reflect fluctuations between those dates. The stock performance shown on the graph is not intended to be indicative of future stock performance.
COMPARISON OF DECEMBER 31, 20102012 THROUGH DECEMBER 31, 20152017
CUMULATIVE TOTAL RETURN
Among Primoris Services Corporation (“PRIM”), the S&P 500 and the Peer Group

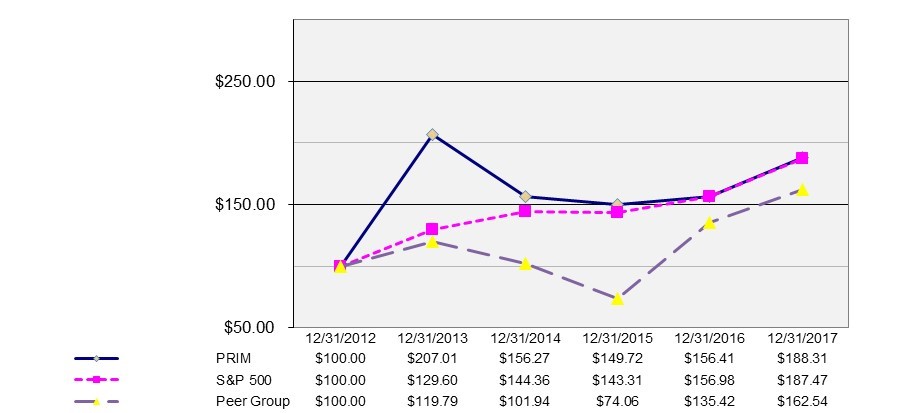
ITEM 6.SELECTED FINANCIAL DATA
The following selected financial data should be read in conjunction with Item 7, “Management’s Discussion and Analysis of Financial Condition and Results of Operations” and our audited financial statements and the accompanying notes included elsewhere in this Annual Report on Form 10-K.
| | Year Ended December 31, | |
| | 2015 | | 2014 | | 2013 | | 2012 | | 2011 | |
| | (In millions except share and per share data) | |
Statement of Operations Data: | | | | | | | | | | | |
Revenues | | $ | 1,929 | | $ | 2,086 | | $ | 1,944 | | $ | 1,542 | | $ | 1,460 | |
Cost of revenues | | 1,709 | | 1,850 | | 1,688 | | 1,349 | | 1,275 | |
Gross profit | | 220 | | 236 | | 256 | | 193 | | 185 | |
Selling, general and administrative expense | | 152 | | 132 | | 131 | | 96 | | 86 | |
Operating income | | 68 | | 104 | | 125 | | 97 | | 99 | |
Other income (expense) | | (7 | ) | (2 | ) | (5 | ) | (4 | ) | (2 | ) |
Income before provision for income taxes | | 61 | | 102 | | 120 | | 93 | | 97 | |
Income tax provision | | (24 | ) | (38 | ) | (45 | ) | (34 | ) | (38 | ) |
Net Income | | $ | 37 | | $ | 64 | | $ | 75 | | $ | 59 | | $ | 59 | |
| | | | | | | | | | | |
Less net income attributable to noncontrolling interests | | — | | (1 | ) | (5 | ) | (2 | ) | — | |
Net income attributable to Primoris | | $ | 37 | | $ | 63 | | $ | 70 | | $ | 57 | | $ | 59 | |
| | | | | | | | | | | |
Dividends per common share | | $ | 0.205 | | $ | 0.15 | | $ | 0.135 | | $ | 0.12 | | $ | 0.11 | |
| | | | | | | | | | | |
Earnings per share attributable to Primoris: | | | | | | | | | | | |
Basic | | $ | 0.71 | | $ | 1.22 | | $ | 1.35 | | $ | 1.10 | | $ | 1.15 | |
Diluted | | $ | 0.71 | | $ | 1.22 | | $ | 1.35 | | $ | 1.10 | | $ | 1.14 | |
| | | | | | | | | | | |
Weighted average common shares outstanding (in thousands): | | | | | | | | | | | |
Basic | | 51,647 | | 51,607 | | 51,540 | | 51,391 | | 50,707 | |
Diluted | | 51,798 | | 51,747 | | 51,610 | | 51,406 | | 51,153 | |
| | As of December 31, | |
| | 2015 | | 2014 | | 2013 | | 2012 | | 2011 | |
Balance Sheet Data: | | | | | | | | | | | |
Cash and cash equivalents | | $ | 161 | | $ | 139 | | $ | 196 | | $ | 158 | | $ | 120 | |
Short term investments | | $ | — | | $ | 31 | | $ | 19 | | $ | 3 | | $ | 23 | |
Accounts receivable, net | | $ | 321 | | $ | 337 | | $ | 305 | | $ | 268 | | $ | 187 | |
Total assets | | $ | 1,132 | | $ | 1,111 | | $ | 1,051 | | $ | 931 | | $ | 728 | |
Total current liabilities | | $ | 416 | | $ | 419 | | $ | 430 | | $ | 421 | | $ | 345 | |
Long-term debt/capital leases, net of current portion | | $ | 233 | | $ | 205 | | $ | 193 | | $ | 132 | | $ | 67 | |
Stockholders’ equity | | $ | 483 | | $ | 454 | | $ | 398 | | $ | 333 | | $ | 275 | |
| | | | | | | | | | | | | | | | |
| | Year Ended December 31, | |
| | 2017 | | 2016 | | 2015 | | 2014 | | 2013 | |
| | (In millions except per share data) | |
Statement of Operations Data: | | | | | | | | | | | | | | | | |
Revenues | | $ | 2,380 | | $ | 1,997 | | $ | 1,929 | | $ | 2,086 | | $ | 1,944 | |
Cost of revenues | | | 2,102 | | | 1,796 | | | 1,709 | | | 1,850 | | | 1,688 | |
Gross profit | | | 278 | | | 201 | | | 220 | | | 236 | | | 256 | |
Selling, general and administrative expense | | | 172 | | | 140 | | | 152 | | | 132 | | | 131 | |
Impairment of goodwill | | | — | | | 3 | | | — | | | — | | | — | |
Operating income | | | 106 | | | 58 | | | 68 | | | 104 | | | 125 | |
Other income (expense) | | | (1) | | | (9) | | | (7) | | | (2) | | | (5) | |
Income before provision for income taxes | | | 105 | | | 49 | | | 61 | | | 102 | | | 120 | |
Income tax provision | | | (28) | | | (21) | | | (24) | | | (38) | | | (45) | |
Net income | | $ | 77 | | $ | 28 | | $ | 37 | | $ | 64 | | $ | 75 | |
| | | | | | | | | | | | | | | | |
Less net income attributable to noncontrolling interests | | | (5) | | | (1) | | | — | | | (1) | | | (5) | |
Net income attributable to Primoris | | $ | 72 | | $ | 27 | | $ | 37 | | $ | 63 | | $ | 70 | |
| | | | | | | | | | | | | | | | |
Dividends per common share | | $ | 0.225 | | $ | 0.220 | | $ | 0.205 | | $ | 0.150 | | $ | 0.135 | |
| | | | | | | | | | | | | | | | |
Earnings per share attributable to Primoris: | | | | | | | | | | | | | | | | |
Basic | | $ | 1.41 | | $ | 0.52 | | $ | 0.71 | | $ | 1.22 | | $ | 1.35 | |
Diluted | | $ | 1.40 | | $ | 0.51 | | $ | 0.71 | | $ | 1.22 | | $ | 1.35 | |
| | | | | | | | | | | | | | | | |
Weighted average common shares outstanding: | | | | | | | | | | | | | | | | |
Basic | | | 51 | | | 52 | | | 52 | | | 52 | | | 52 | |
Diluted | | | 52 | | | 52 | | | 52 | | | 52 | | | 52 | |
| | | | | | | | | | | | | | | | |
| | As of December 31, | |
| | 2017 | | 2016 | | 2015 | | 2014 | | 2013 | |
Balance Sheet Data: | | | | | | | | | | | | | | | | |
Cash and cash equivalents | | $ | 170 | | $ | 136 | | $ | 161 | | $ | 139 | | $ | 196 | |
Short term investments | | | — | | | — | | | — | | | 31 | | | 19 | |
Accounts receivable, net | | | 358 | | | 388 | | | 321 | | | 337 | | | 305 | |
Total assets | | | 1,256 | | | 1,171 | | | 1,132 | | | 1,111 | | | 1,051 | |
Total current liabilities | | | 481 | | | 450 | | | 416 | | | 419 | | | 430 | |
Long-term debt/capital leases, net of current portion | | | 194 | | | 203 | | | 220 | | | 205 | | | 193 | |
Stockholders’ equity | | | 562 | | | 499 | | | 483 | | | 454 | | | 398 | |
ITEM 7.MANAGEMENT’S DISCUSSION AND ANALYSIS OF FINANCIAL CONDITION AND RESULTS OF OPERATIONS
You should read the following discussion of our financial condition and results of operations in conjunction with the financial statements and the notes to those statements included as item 8 in this Annual Report on Form 10-K. This discussion includes forward-looking statements that are based on current expectations and are subject to uncertainties and unknown or changed circumstances. For a further discussion, please see “Forward Looking Statements” at the beginning of this Annual Report on Form 10-K. Our actual results may differ materially from those anticipated in these forward-looking statements as a result of many factors, including those risks inherent with our business as discussed in “Item 1A Risk Factors”.
The following discussion starts with an overview of our business and a discussion of trends, including seasonality, that affect our industry. That is followed by an overview of the critical accounting policies and estimates that we use to prepare our financial statements. Next we discuss our results of operations and liquidity and capital resources, including our off-balance sheet transactions and contractual obligations. We conclude with a discussion of our outlook and backlog.
Introduction
Primoris is a holding company of various subsidiaries, which form one of the larger publicly traded specialty contractors and infrastructure companies in the United States. Serving diverse end-markets, we provide a wide range of construction, fabrication, maintenance, replacement, water and wastewater, and engineering services to major public utilities, petrochemical companies, energy companies, municipalities, state departments of transportation and other customers. We install, replace, repair and rehabilitate natural gas, refined product, water and wastewater pipeline systems; large diameter gas and liquid pipeline facilities; and heavy civil projects, earthwork and site development. We also construct mechanical facilities and other structures, including power plants, petrochemical facilities, refineries, water and wastewater treatment facilities and parking structures. Finally, we provide specialized process and product engineering services.
We have longstanding customer relationships with major utility, refining, petrochemical, power and engineering companies. We have completed major underground and industrial projects for a number of large natural gas transmission and petrochemical
companies in the western United States, as well as significant projects for our engineering customers. We enter into a large number of contracts each year, and the projects can vary in length — from several weeks to as long as 4860 months, or longer for completion on larger projects. Although we have not been dependent upon any one customer in any year, a small number of customers tend to constitute a substantial portion of our total revenues.
We recognize revenues and profitability on our contracts depending onThrough the type of contract. For our fixed price, or lump sum, contracts, we record revenue as the work progresses on a percentage-of-completion basis which means that we recognize revenue based on the percentage of costs incurred to date in proportion to the total estimated costs expected to complete the contract. Fixed price contracts may include retainage provisions under which customers withhold a percentageend of the contract price until the project is complete. Foryear 2016, we segregated our unit price, time and material, and cost-plus contracts, we recognize revenue as units are completed or services are performed. The “Critical Accounting Policies and Estimates” section below provides additional information on our contracts and revenue recognition practices.
The Company segregates its business into three operating segments, which include: The West Construction Servicesreportable segments: the Energy segment, (“West segment”), the East Construction Services segment (“East segment”) and the EnergyWest Construction Services segment. In the first quarter 2017, we changed our reportable segments in connection with a realignment of our internal organization and management structure. The following issegment changes reflect the focus of our chief operating decision maker (“CODM”) on the range of services we provide to our end user markets. Our CODM regularly reviews our operating and financial performance based on these segments.
The current reportable segments include the Power, Industrial, and Engineering segment, the Pipeline and Underground segment, the Utilities and Distribution segment, and the Civil segment. See Note 14 – “Reportable Segments” of the Notes to Consolidated Financial Statements included in Item 8 of this Form 10-K for a brief description of each of ourthe reportable segments and business activities.their operations.
The Westclassification of revenues and gross profit for segment includesreporting purposes can at times require judgment on the undergroundpart of management. Our segments may perform services across industries or perform joint services for customers in
multiple industries. To determine reportable segment gross profit, certain allocations, including allocations of shared and industrial operationsindirect costs, such as facility costs, equipment costs and construction services performed by ARB, Inc. (“ARB”), ARB Structures, Inc., Rockford Corporation (“Rockford”), Q3 Contracting, Inc. (“Q3C”), and Vadnais Trenchless Services, Inc. (“Vadnais”). ARB and ARB Structures perform work primarily in California; while, Rockford operates throughout the United States and Q3C operates in Colorado and the upper Midwest United States. The segment also included three joint venture operations. The West segment consists of business headquartered primarily in the western United States.
The East segment includes the James Construction Group (“JCG”) Heavy Civil division, the JCG Infrastructure and Maintenance division, BW Primoris, LLC and Cardinal Contractors, Inc. construction business, located primarily in the southeastern United States and in the Gulf Coast region of the United States and includes the heavy civil construction and infrastructure and maintenance operations.
The Energy segment businesses are located primarily in the southeastern United States and in the Gulf Coast region of the United States. The segment includes the operations of the Primoris Energy Services (“PES”) pipeline and gas facility construction and maintenance operations, the PES Industrial division, the Surber and Ram-Fab operations and the newly acquired Primoris Aevenia, Inc. (“Aevenia”) operations. Additionally, the segment includes the OnQuest, Inc. (“OnQuest”) and OnQuest Canada, ULC operations for the design and installation of high-performance furnaces and heaters for the oil refining, petrochemical and power generation industries.indirect operating expenses were made.
The following table lists the Company’sour primary operating subsidiariesbusiness units and their operatingreportable segment:
Subsidiary
|
| Operating Segment
|
ARB
| | West
|
ARB Structures, Inc.
| | West
|
Q3C
| | West
|
Rockford
| | West
|
Vadnais
| | West
|
Silva Group (“Silva”)
| | East
|
Cardinal Contractors, Inc.
| | East
|
BW Primoris, LLC (“BWP”)
| | East
|
JCG
| | |
JCG Heavy Civil DivisionBusiness Unit
| | East
|
JCG Infrastructure and Maintenance DivisionReportable Segment
| | EastPrior Reportable Segment
| |
ARB Industrial (a division of ARB, Inc.) | | Power | | West | |
ARB Structures | | Power | | West | |
Primoris Power (formerly PES Saxon division) | | Power | | Energy | |
PESPrimoris Renewable Energy (a division of Primoris AV)
| | Power | | Energy | |
Primoris Industrial DivisionConstructors (formerly JCGPES Industrial Division) | | Power | | Energy | |
Primoris Fabrication (a division of PES) | | Power | | Energy | |
Primoris Mechanical Contractors (a combination of a division of PES and Cardinal Contractors) | | Power | | Energy | |
OnQuest | | Energy
|
OnQuest, Canada, ULCPower
| | Energy | |
Aevenia; acquired February 28, 2015OnQuest Canada
| | Power | | Energy | |
Primoris Design and Construction (“PD&C”); created 2017 | | Power | | NA | |
Rockford Corporation (“Rockford”) | | Pipeline | | West | |
Vadnais Trenchless Services (“Vadnais Trenchless”) | | Pipeline | | West | |
Primoris Field Services (a division of PES Primoris Pipeline) | | Pipeline | | Energy | |
Primoris Pipeline (a division of PES Primoris Pipeline) | | Pipeline | | Energy | |
Primoris Coastal Field Services; created 2017 | | Pipeline | | NA | |
ARB Underground (a division of ARB, Inc.) | | Utilities | | West | |
Q3 Contracting (“Q3C”) | | Utilities | | West | |
Primoris AV | | Utilities | | Energy | |
Primoris Distribution Services ("PDS"); created 2017 | | Utilities | | NA | |
Primoris Heavy Civil (formerly JCG Heavy Civil Division) | | Civil | | East | |
Primoris I&M (formerly JCG Infrastructure & Maintenance Division) | | Civil | | East | |
Primoris Build Own Operate | | Civil | | East | |
PES acquiredWe own a 50% interest in two separate joint ventures, both formed in 2015. The Carlsbad Power Constructors joint venture (“Carlsbad”) is engineering and constructing a gas-fired power generation facility, and the net assets“ARB Inc. & B&M Engineering Co.” joint venture (“Wilmington”) is also engineering and constructing a gas-fired power generation facility. Both projects are located in Southern California. The joint venture operations are included as part of the Power segment. As a result of determining that we are the primary beneficiary of the two companies, The Saxon Groupvariable interest entities (“Saxon”VIEs”), the results of the Carlsbad and Wilmington joint ventures are consolidated in 2012 and Force Specialty Services, Inc. (“FSSI”)our financial statements. Both projects are expected to be completed in 2013. Effective January 1, 2014, Saxon and FSSI were merged into PES along with the Industrial division of JCG. Throughout this Form 10-K, references to FSSI, Saxon and James Industrial are to the divisions of PES for 2015 and 2014, while the references for 2013 are to the entities or divisions.2018.
ARB
We owned 50% of the Blythe Power Constructors joint venture (“Blythe”) created for the installation of a parabolic trough solar field and steam generation system in California, and results of Blythe’sits operations have been included as part of the WestPower segment. The CompanyWe determined that in accordance with FASB Topic 810, it waswe were the primary beneficiary of a variable interest entity (“VIE”) and hashave consolidated the results of Blythe in itsour financial statements. The project has been completed, the project warranty expired in May 2015, and dissolution of the joint venture was completed in the third quarter of 2015.
ARB owns a 50% interest in two separate joint ventures, both formed in 2015: (1) The Carlsbad Power Constructors joint venture (“Carlsbad”) will engineer and construct a gas-fired power generation facility and (2) a joint venture titled “ARB Inc. & B&M Engineering Co.” (“Wilmington”) will also engineer and construct a co-generation facility. Both projects are located in the Southern California area. The joint venture operations are included as part of the West segment. As a result of determining that the Company is the primary beneficiary of the two VIE’s, the results of the Carlsbad and Wilmington joint ventures are consolidated in the Company’s financial statements. The Carlsbad project is expected to be completed in 2017 and the Wilmington project in 2018.
Financial information for the joint ventures is presented in “Note 13— Note 12— “Noncontrolling Interests”.Interests” of the Notes to Consolidated Financial Statements included in Item 8 of this Form 10-K.
In January 2014,We continue to be acquisitive, and the Company created a wholly owned subsidiary, BW Primoris, LLC, a Texas limited liability company (“BWP”). BWP’s goal is to develop water projects, primarily in Texas, that will needfollowing outlines the Company’s construction services. On January 22, 2014, BWP entered into an agreement to purchasevarious acquisitions made over the assets and business of Blaus Wasser, LLC, a Wyoming limited liability company, for approximately $5 million. BWP has entered into an intercompany construction contract with Cardinal Contractors, Inc. to build a small water treatment facility which will be owned by BWP. Beginning in 2016, the facility will generate revenues through a take-or-pay contract with a West Texas municipal entity. All intercompany revenue, cost and profitpast three years. See Note 4— “Business Combinations” of the construction project was eliminated. At December 31, 2015, a totalNotes to Consolidated Financial Statements included in Item 8 of $13.8 million has been capitalized, including the acquisition costs, as property, plant and equipment.
In May 2014, the Company created a wholly owned subsidiary, Vadnais, a California company, which on June 5, 2014, purchased the assets of Vadnais Corporation for $6.4 million. Vadnais Corporation was a general contractor specializing in micro-tunneling in California. The assets purchased were primarily equipment, buildings and land. The purchase included a contingent earnout based on meeting certain operating targets. See “Note 4—Business Combinations” for further information.
During the third quarter 2014, the Company made three small purchases totaling $8.2 million acquiring the net assets of Surber Roustabout, LLC (“Surber”), Ram-Fab, LLC (“Ram-Fab”) and Williams Testing, LLC (“Williams”). Surber and Ram-Fab operate as divisions of PES, and Williams is a division of Cardinal Contractors, Inc. Surber provides general oil and gas related construction activities in Texas; Ram-Fab is a fabricator of custom piping systems located in Arkansas; and Williams provides construction services related to sewer pipeline maintenance, rehabilitation and integrity testing in the Florida market. The Surber and Ram-Fab purchases provided for contingent earnout amounts as discussed in “Note 4— Business Combinations”.this Form 10-K
On February 28, 2015, the Companywe acquired the net assets of Aevenia, Inc. for $22.3 million in cash, and established a new entity,million. Aevenia which operates as part of the Company’s Energy segment. Headquartered in Moorhead, Minnesota, Aevenia is an energy and electrical construction company which specializes in overhead and underground line work, substations, telecom/fiber, and certain other client-specific on-demand call out services. The majority of their work is delivered under unit-price Master Services Agreements (“MSAs”). Aevenia has operations in Minnesota, North Dakota, South Dakota and Iowa. The Company believes there are opportunities for Aevenia to grow sales by performing in-house work for other Primoris subsidiaries and to expand the Company’s offerings to new geographiesincluded in the Midwest United States.Utilities segment.
For some end marketsOn January 29, 2016, we performacquired the same servicesnet assets of Mueller Concrete Construction Company ("Mueller") for $4.1 million, and on November 18, 2016, we acquired the net assets of Northern Energy & Power (“Northern”) for $6.9 million. On June 24, 2016, we purchased property, plant and equipment from Pipe Jacking Unlimited, Inc. (“Pipe Jacking”), consisting of specialty directional drilling and tunneling equipment for $13.4 million. We determined this purchase did not meet the definition of a business as defined under ASC 805. Mueller operations are included in each of our West, Eastthe Utilities segment, Northern operations are included in the Power segment, and Energy segments, while for other end markets, such as poured-in-place parking structures, only one of our segments currently servesPipe Jacking operations are included in the market. The following table shows the approximate percentage of revenues over three years derived from our major end-markets, with prior periods conformed to the current year market breakdown:Pipeline segment.
Market | | Twelve Months Ended
December 2015 | | Twelve Months Ended
December 2014 | | Twelve Months Ended
December 2013 | |
| | | | | | | |
Underground capital projects | | 12 | % | 17 | % | 23 | % |
Utility services | | 34 | % | 28 | % | 29 | % |
Industrial | | 16 | % | 27 | % | 22 | % |
Heavy Civil | | 30 | % | 22 | % | 20 | % |
Engineering | | 4 | % | 3 | % | 2 | % |
Other | | 4 | % | 3 | % | 4 | % |
Total | | 100 | % | 100 | % | 100 | % |
On May 26, 2017, we acquired the net assets of Florida Gas Contractors (“FGC”) for $37.7 million; on May 30, 2017, we acquired certain engineering assets for approximately $2.3 million; and on June 16, 2017, we acquired the net assets of Coastal Field Services (“Coastal”) for $27.5 million. FGC operations are included in the Utilities segment, the engineering assets are included in the Power segment, and Coastal operations are included in the Pipeline segment.
In August 2017, we announced we are investing approximately $22.0 million to build, own, and operate a portfolio of solar projects in a California School District acquired from the developers, Spear Point Energy, LLC, and PFMG Solar, LLC. This investment amount includes the estimated cost of Engineering, Procurement, and Construction (“EPC”) work on the projects, which is projected to be completed in 2018. The solar projects are expected to generate a 25-year recurring revenue stream from the District's signed power purchase agreement. As an investment in a renewable energy project, the solar assets should provide us with investment tax credits valued at over $5.0 million. As of December 31, 2017, our investment for the solar projects was approximately $9.9 million. The $9.9 million investment is our construction in progress on the solar projects and is included in Property and equipment, net on the Consolidated Balance Sheets.
Material trends and uncertainties
We generate our revenue from both large and small construction and engineering projects. The award of these contracts is dependent on many factors, most of which are not within our control. We depend in part on spending by companies in the energy and oil and gas industries, the gas utility industry, as well as municipal water and wastewater customers. Over the past several years, each segment has benefited from demand for more efficient and more environmentally friendly energy and power facilities, local highway and bridge needs and from the activity level in the oil and gas industry; however,industry. However, periodically, each of these industries and the government agencies periodically areis adversely affected by macroeconomic conditions. Economic factors outside of our control may affect the amount and size of contracts we are awarded in any particular period.
We closely monitor our customers to assess the effect that changes in economic, market and regulatory conditions may have on them. We have experienced reduced spending by some of our customers over the last several years, which we attribute to negative economic and market conditions, and we anticipate that these negative conditions may continue to affect demand for our services in the near-term. Major fluctuationsFluctuations in market prices of oil, gas and other fuel sources have affected demand for our services. The recent significant reductionWhile we have seen signs of a recovery in the price of oil, the significant volatility in the price of oil, gas and liquid natural gas that occurred in the past few years has created uncertainty with respect to demand for our oil and gas pipeline and roustabout services both in the near term, with additional uncertainty resulting over the length of time that prices will remain depressed.near-term and for future projects. We believe that our upstream operations, such as the construction of gathering lines within the oil shale formations, will remain at lower levels for an extended period. While there was some stability in the price of oil in 2017, that stability has not resulted in a significant change in the contracting activities of our customers. We believe that over time, the need for pipeline infrastructure for mid-stream and gas utility companies will result in a continuing need for our services, but the impact of the low oil prices may delay midstream pipeline opportunities. The continuing changes in the regulatory environment also affectsaffect the demand for our services, either by increasing our work or delaying projects. For example, the regulatory environment in California may well result in delays for the construction of gas-fired power plants while the regulators continue to search for significant renewable resources, but the renewable resources may also create a demand for our construction services.services such as the need for storage of renewable generated electricity. Finally, we believe that regulated utility customers will continue to invest in our maintenance and replacement services.
Seasonality, cyclicality and variability
Our results of operations are subject to quarterly variations. Some of the variation is the result of weather, particularly rain, ice and snow, which can impact our ability to perform construction services. While the majority of the Company’sour work is in the southern half of the United States, these seasonal impacts can affect revenues and profitability in all of our businesses since gas and other utilities defer routine replacement and repair during their period of peak demand. Any quarter can be affected either negatively or positively by atypical weather patterns in any part of the country. In addition, demand for new projects tends to be lower during the early part of the year due to clients’ internal budget cycles. As a result, the Companywe usually experiencesexperience higher revenues and earnings in the third and fourth quarters of the year as compared to the first two quarters.
The Company isWe are also dependent on large construction projects which tend not to be seasonal, but can fluctuate from year to year based on general economic conditions. Our business may be affected by declines or delays in new projects or by client project schedules. Because of the cyclical nature of our business, the financial results for any period may fluctuate from prior periods, and the Company’sour financial condition and operating results may vary from quarter-to-quarter.quarter to quarter. Results from one quarter may not be indicative of its financial condition or operating results for any other quarter or for an entire year.
Two examples of the variability resulting from the combination of seasonality and awards of large projects are as follows. First, in the fourth quarter of 2014, revenues were less than those of the second and third quarters of 2014, primarily reflecting the completion of a large power plant project in 2013. Second, the impact from abnormally wet, rainy weather conditions in the second quarter of 2015 resulted in an unusual decrease in revenues compared to the previous year’s second quarter.
Critical Accounting Policies and Estimates
General—The preparation of financial statements in conformity with accounting principles generally accepted in the United States requires us to make estimates and assumptions that affect the reported amounts of assets and liabilities and the disclosure of contingent assets and liabilities as of the date of the financial statements and also affect the amounts of revenues and expenses reported for each period. These estimates and assumptions must be made because certain information that is used in the preparation of our financial statements cannot be calculated with a high degree of precision from data available, is dependent on future events, or is not capable of being readily calculated based on generally accepted methodologies. Often, estimates are particularly difficult to determine, and we must exercise significant judgment. Estimates may be used in our assessments of revenue recognition under percentage-of-completion accounting, the allowance for doubtful accounts, useful lives of property and equipment, fair value
assumptions in analyzing goodwill and long-lived asset impairments, self-insured claims liabilities and deferred income taxes. Actual results could differ from those that result from using the estimates under different assumptions or conditions.
An accounting policy is deemed to be critical if it requires an accounting estimate to be based on assumptions about matters that are highly uncertain at the time the estimate is made, and different estimates that reasonably could have been used, or changes in the accounting estimates that are reasonably likely to occur periodically, could materially impact our consolidated financial statements.
The following accounting policies are based on, among other things, judgments and assumptions made by management that include inherent risks and uncertainties. Management’s estimates are based on the relevant information available at the end of each period. We periodically review these accounting policies with the Audit Committee of the Board of Directors.
Revenue recognition
Fixed-price contracts — Historically,We generate revenue under a range of contracting options, including fixed-price, unit-price, time and material, and cost reimbursable plus fee contracts. A substantial portion of our revenue has been generated underis derived from contracts that are fixed-price contracts. For fixed-price contracts, we recognize revenues primarilyor unit-price, using the percentage-of-completion method, which may result in unevenmethod. For time and irregular results. material and cost reimbursable plus fee contracts, revenue is recognized primarily based on contractual terms. Generally, time and material and cost reimbursable contract revenues are recognized on an input basis, based on labor hours incurred and on purchases made.
In the percentage-of-completion method, estimated revenues,contract values, estimated contract valuescost at completion and total costs incurred to date are used to calculate revenues earned. Unforeseen events and circumstances can alter the estimate of the costs and potential profit associated with a particular contract. Total estimated costs, and thus contract revenues and profit,income, can be impacted by changes in productivity, scheduling, the unit cost of labor, subcontracts, materials and equipment. Additionally, external factors such as weather, client needs, client delays in providing permits and approvals,
labor availability, governmental regulation and politics may affect the progress of a project’s completion and thus the timing of revenue recognition.
To the extent that original cost estimates are modified, estimated costs to complete increase, delivery schedules are delayed, or progress under a contract is otherwise impeded, cash flow, revenue recognition and profitability from a particular contract may be adversely affected. As a significant change in one or more of these estimates could affect the profitability of our contracts, we review and update our contract-related estimates regularly. We recognize adjustments in estimated profit on contracts as changes in accounting estimates in the period in which the revisions are identified. Revenue and profit in future periods of contract performance are recognized using the adjusted estimate.
If at any time the estimate of contract profitability indicates an anticipated loss on a contract, the projected loss is recognized in full in the period it is identified and recognized as an “accrued loss provision” which is included in the accrued expenses and other current liabilities amount on the balance sheet. For contract revenue recognized under the percentage-of-completion method, the accrued loss provision is adjusted so that the gross profit for the contract remains zero in future periods. The provision for estimated losses on uncompleted contracts was $10.1 million and $12.8 million at December 31, 2017 and 2016, respectively.
We consider unapproved change orders to be contract variations for which wecustomers have customer approval for a change innot agreed to both scope but for which we do not have an agreed upon price change.and price. Costs associated with unapproved change orders are included in the estimated cost to complete the contracts and are treated as project costs as incurred. We will recognize revenue equal to costs incurred on unapproveda change orders when realization of change order approvalin contract value if we believe it is probable.probable that the contract price will be adjusted and can be reliably estimated. Unapproved change orders involve the use of estimates, and it is reasonably possible that revisions to the estimated costs and recoverable amounts may be required in future reporting periods to reflect changes in estimates or final agreements with customers.
We consider claims to be amounts that we seek, or will seek, to collect from customers or others for customer-caused changes in contract specifications or design, or other customer-related causes of unanticipated additional contract costs on which there is no agreement with customers on both scopecustomers. Claims can also be caused by non-customer-caused changes, such as rain or other weather delays. Costs associated with claims are included in the estimated costs to complete the contracts and price changes.are treated as project costs when incurred. Claims are included in revenue to the calculation of revenue whenextent we have a reasonable legal basis, the related costs have been incurred, realization is probable, and amounts can be reliably determined.estimated. Revenue in excess of contract costs from claims is recognized whenafter an agreement is reached with customers as to the value of the claims, which in some instances may not occur until after completion of work under the contract. Costs associated with
At December 31, 2017, we had unapproved change orders and claims are included in the estimated costs to completeexpected contract value that totaled approximately $67.8 million. These claims were in the contractsprocess of being negotiated in the normal course of business. Approximately $56.7 million of unapproved change orders and are treatedclaims had been recognized as project costs when incurred.
Other contract forms — We also use unit-price, time and material, and cost reimbursable plus fee contracts. For these jobs, revenue is recognized primarily based on contractual terms. For example, time and material contract revenues are generally recognized on an input basis, based on labor hours incurred and on purchases made. Similarly, unit price contracts generally recognize revenue on an output based measurement such as the completion of specific units at a specified unit price.
At any time, if an estimate of total contract cost indicates a loss on a contract, the projected loss is recognized in full at that time. The loss amount is recognized as an “accrued loss provision” and is included in the accrued expenses and other liabilities amount on the balance sheet. For fixed-price contracts, as thecumulative percentage-of-completion method is used to calculate revenues, the accrued loss provision is changed so that the gross profit for the contract remains zero in future periods. The provision for estimated losses on uncompleted contracts was $7.3 million and $2.4 million atbasis through December 31, 2015 and 2014, respectively.
Changes in job performance, job conditions and estimated profitability, including those arising from final contract settlements, may result in revisions to costs and income. These revisions are recognized in the period in which the revisions are identified.2017.
In all forms of contracts, we estimate the collectability of contract amounts at the same time that we estimate project costs. If we anticipate that there may be issues associated with the collectability of the full amount calculated as revenue,revenues, we may reduce the amount recognized as revenue to reflect the uncertainty associated with realization of the eventual cash collection. For example, when a cost reimbursable project exceeds the client’s expected budget amount, the client frequently requiresrequests an adjustment to the final amount. Similarly, some utility clients reserve the right to audit costs for significant periods after performance of the work. In these situations, we may choose to defer recognition of a portion of the revenue up to the time thatuntil the client pays for the services.
The caption “Costs and estimated earnings in excess of billings” in the Consolidated Balance SheetSheets represents unbilled receivables which arise when revenues have been recorded but the amount will not be billed until a later date. Balances represent: (a) unbilled amounts arising from the use of the percentage-of-completion method of accounting which may not be billed under the terms of the contract until a later date or project milestone,milestone; (b) incurred costs to be billed under cost reimbursementreimbursable type contracts, (c)including amounts arising from routine lags in billing,billing; or (d)(c) the revenue associated with unapproved change orders or claims when realization is probable and amounts can be reliably determined.estimated. For those contracts in which billings exceed contract revenues recognized to date, the excess amounts are included in the caption “Billings in excess of costs and estimated earnings”.
In accordance with applicable terms of certain construction contracts, retainage amounts may be withheld by customers until completion and acceptance of the project. Some payments of the retainage may not be received for a significant period after completion of our portion of a project. In some jurisdictions, retainage amounts are deposited into an escrow account.
Valuation of acquired businesses—We use the fair value of the consideration paid and the fair value of the assets acquired and liabilities assumed to account for the purchase price of businesses. The determination of fair value requires estimates and judgments of future cash flow expectations for the assignment of the fair values to the identifiable tangible and intangible assets.
Identifiable Tangible Assets. Significant identifiable tangible assets acquired would include accounts receivable, costs and earnings in excess of billings for projects, inventory and fixed assets (generally consisting of construction equipment) for each acquisition. We determine the fair value of these assets onas of the acquisition date. For current assets and current liabilities of an acquisition, the Companywe will evaluate whether the book value is equivalent to fair value due to their short term nature. We estimate the fair value of fixed assets using a market approach, based on comparable market values for similar equipment of similar condition and age.
Identifiable Intangible Assets. When necessary, we use the assistance of an independent third party valuation specialist to determine the fair value of the intangible assets acquired in the acquisitions.
A liability for contingent consideration based on future earnings is estimated at its fair value at the date of acquisition, with subsequent changes in fair value recorded in earnings as a gain or loss. Fair value is estimated as of the acquisition date using estimated earnout payments based on management’s best estimate.
Accounting principles generally accepted in the United States provide a “measurement period” of up to one year in which to finalize all fair value estimates associated with the acquisition of a business. Most estimates are preliminary until the end of the measurement period. During the measurement period, adjustments to initial valuations and estimates that reflect newly discovered information that existed at the acquisition date are recorded. After the measurement date, any adjustments would be recorded as a current period gain or loss.
Goodwill and Indefinite-Lived intangible Assets—Goodwill and certain intangible assets acquired in a business combination and determined to have indefinite useful lives are not amortized but are assessed for impairment annually and more frequently if triggering events occur. In performing these assessments, management relies on various factors, including operating results, business plans, economic projections, anticipated future cash flows, comparable transactions and other market data. There are inherent uncertainties related to these factors and judgment in applying them to the analysis of goodwill for impairment. Since judgment is involved in performing fair value measurements used in goodwill impairment analyses, there is risk that the carrying values of our goodwill may not be properly stated.
We account for goodwill, including evaluation of any goodwill impairment under ASC Topic 350 “Intangibles — Goodwill and Other”, performed at the reporting unit level for those units with recorded goodwill as of October 1 of each year, unless there are indications requiring a more frequent impairment test.
At December 31, 2015, goodwill
Goodwill has arisen from acquisitions and is recorded at our reporting unitssegments as follows at December 31 (in millions)thousands):
Reporting Unit | | Segment | | December 31,
2015 | |
Rockford | | West | | $ | 32.1 | |
Q3C | | West | | 13.2 | |
JCG (includes Heavy Civil and Infrastructure and Maintenance divisions) | | East | | 42.9 | |
PES (includes PES Industrial, PPS, Saxon & Surber divisions) | | Energy | | 28.4 | |
Aevenia | | Energy | | 5.2 | |
OnQuest Canada, ULC | | Energy | | 2.4 | |
Total Goodwill | | | | $ | 124.2 | |
| | | | | | | |
Reporting Segment | | 2017 | | 2016 | |
Power | | $ | 24,391 | | $ | 24,512 | |
Pipeline | | | 51,521 | | | 42,252 | |
Utilities | | | 37,312 | | | 20,312 | |
Civil | | | 40,150 | | | 40,150 | |
Total Goodwill | | $ | 153,374 | | $ | 127,226 | |
Under ASU 2012-02 - ASC 350, “Intangibles — Goodwill and Other (Topic 350): Testing Indefinite-Lived Intangible Assets for ImpairmentOther”, the Companywe can assess qualitative factors to determine if a quantitative impairment test of intangible assets is necessary. Typically, however, the Company useswe use the two-step impairment test outlined in ASC Topic 350. First, we compare the fair value of a reporting unit with its carrying amount. Fair value for the goodwill impairment test is determined utilizing a discounted cash flow analysis based on our financial plan discounted using our weighted average cost of capital and market indicators of terminal year cash flows. Other valuation methods may be used to corroborate the discounted cash flow method. If the carrying amount of a reporting unit is in excess of its fair value, goodwill is considered potentially impaired and further tests are performed to measure the amount of impairment loss. In the second step of the goodwill impairment test, we compare the implied fair value of reporting unit goodwill with the carrying amount of the reporting unit’s goodwill. If the carrying amount of the reporting unit’s goodwill exceeds the implied fair value of that goodwill, an impairment loss is recognized in an amount equal to the carrying amount of goodwill over its implied fair value. The implied fair value of goodwill is determined in the same manner that the amount of goodwill recognized in a business combination was determined. We allocate the fair value of a reporting unit to all of the assets and liabilities of that unit, including intangible assets, as if the reporting unit had been acquired in a business combination. Any excess of the fair value of a reporting unit over the amounts assigned to its assets and liabilities represents the implied fair value of goodwill.
During the third quarter of 2016, we made a decision to divest the Texas heavy civil business unit, a division of Primoris Heavy Civil within the Civil segment. We engaged a financial advisor to assist in the marketing and sale of the business unit, and planned to continue operating the business unit until completion of a sale. In April 2017, the Board of Directors determined that based on the information available, we would attain the best long-term value by withdrawing from the sales process and continuing to operate the business unit.
Under the provisions of ASC 350, the planned divestiture triggered an analysis of the goodwill amount of Primoris Heavy Civil. The analysis resulted in a pretax, non-cash goodwill impairment charge of approximately $2.7 million in the third quarter of 2016.
In the fourth quarter of 2015, an impairment expense of $0.4 million was recorded relating to the goodwill attributed to Cardinal Contractors, Inc., which is a part of the East Segment, and in December 2013, an impairment expense of $0.8 million was recorded relating to FSSI, a part of the Energy segment, for intangible assets for customer relations.Power segment. There were no other impairments of goodwill for the years ended December 31, 2015, 20142017, 2016 and 2013.2015.
Disruptions to our business, such as end market conditions, protracted economic weakness, unexpected significant declines in operating results of reporting units and the divestiture of a significant component of a reporting unit, may result in our having to perform a goodwill impairment first step valuation analysis for some or all of our reporting units prior to the required annual assessment. These types of events and the resulting analysis could result in goodwill impairment charges in any periods in the future.
Reserve for uninsured risks—Estimates are inherent in the assessment of our exposure to uninsured risks. Significant judgments by us and, where possible, third-party experts are needed in determining probable and/or reasonably estimable amounts that should be recorded or disclosed in the financial statements. Semiannually, we obtain a third-party actuarial valuation for some of our uninsured risks. The results of any changes in accounting estimates are reflected in the financial statements of the period in which we determine we need to record a change.
We self-insure worker’s compensation claims up to $0.25 million per claim. We maintained a self-insurance reserve totaling approximately $26.8$18.5 million at December 31, 20152017 and approximately $22.3$18.8 million at December 31, 2014.2016. Claims administration expenses were charged to current operations as incurred. Our accruals are based on judgment, the probability of losses, and where applicable, the consideration of opinions of internal and/or external legal counsel.counsel and third party consultants. The amount is included in “accruedAccrued expenses and other current liabilities” on our balance sheets.Consolidated Balance Sheets. Actual payments that may be made in the future could materially differ from such reserves.
Income taxes—We account for income taxes under the asset and liability method as set forth in ASC Topic 740, “Income Taxes”“Income Taxes”, which requires the recognition of deferred tax assets and liabilities for the expected future tax consequences of events that have been included in the financial statements. Under this method, deferred tax assets and liabilities are determined based on the temporary differences between the financial statementsreporting bases and tax basisbases of
assets and liabilities using enacted tax rates in effect for the yearyears in which the differences are expected to reverse. The effect of a changechanges in tax rates on net deferred tax assets or liabilities is recognized as an increase or decrease in net income in the period that includes the enactment date.tax change is enacted.
Deferred income tax assets may be reduced by a valuation allowance if, in the judgment of our management, it is more likely than not that all or a portion of a deferred tax asset will not be realized. In making such determination, we consider all available
evidence, including recent financial operations, projected future taxable income, scheduled reversals of deferred tax liabilities, tax planning strategies, and the length of tax asset carryforward periods. The realization of deferred tax assets is primarily dependent upon our ability to generate sufficient future taxable earnings in certain jurisdictions. If we subsequently determine that some or all deferred tax assets that were previously offset by a valuation allowance are realizable, the value of the deferred tax assets would be increased by reducing the valuation allowance, thereby increasing income in the period when that determination is made. During 2017, we determined it is more likely than not that a portion of our deferred tax asset for foreign tax credits will not be realized. Accordingly, a valuation allowance of $0.6 million was made.recorded.
A tax position is recognized as a benefit only if it is more likely than not that the tax position would be sustained based on its technical merits in a tax examination, using the presumption that the tax authority has full knowledge of all relevant facts regarding the position. The amount recognized is the largest amount of tax benefit that is greater than 50% likely of being realized on ultimate settlement with the tax authority. For tax positions not meeting the more likely than not test, no tax benefit is recorded.
Tax Cuts and Jobs Act—On December 22, 2017, the U.S. Government enacted comprehensive tax legislation commonly referred to as the Tax Cuts and Jobs Act (the “Tax Act”). The Tax Act makes broad and complex changes to the U.S. tax code that affect our 2017 results, including the allowance of bonus depreciation that provides for immediate deduction of qualified property placed in service after September 27, 2017. The Tax Act also establishes new tax laws that may affect our 2018 and future results, including but not limited to:
| · | | Reduction of the U.S. federal corporate income tax rate from 35% to 21%; |
| · | | The repeal of the domestic production activities deduction; |
| · | | Further limitations on the deductibility of certain executive compensation; |
| · | | Disallowance of certain entertainment expense deductions; |
| · | | Limitations on the use of foreign tax credits to reduce the U.S. income tax liability; |
| · | | Limitations on interest expense deductibility; |
| · | | Elimination of the corporate alternative minimum tax. |
While the Tax Act also contains complex changes to the tax code for companies operating internationally, we are not materially impacted by the international provisions of the Tax Act.
Given the significant impact of the legislation, the SEC staff issued Staff Accounting Bulletin (“SAB”) 118 which provides guidance on accounting for uncertainties of the effects of the Tax Act. Specifically, SAB 118 allows companies to record provisional estimates of the impact of the Tax Act during a one year “measurement period” similar to that used when accounting for business combinations.
As a result of the Tax Act, we remeasured our deferred tax assets and liabilities using the newly enacted tax rates and recorded a one-time net tax benefit of $9.4 million in the period ended December 31, 2017. This tax benefit is a provisional estimate that could be revised once we finalize our deductions for tax depreciation and executive compensation accruals. We may also revise our estimate based on any additional guidance issued by the U.S. Treasury Department, the U.S. Internal Revenue Service, and other standard-setting bodies.
Long-Lived Assets—Assets held and used by the Company,us, primarily property, plant and equipment, are reviewed for impairment whenever events or changes in business circumstances indicate that the carrying amount of the asset may not be fully recoverable. We perform an undiscounted operation cash flow analysis to determine if an impairment exists. For purposes of recognition and measurement of an impairment for assets held for use, we group assets and liabilities at the lowest level for which cash flows are separately identified. If an impairment is determined to exist, any related
impairment loss is calculated based on fair value. The calculation of the fair value of long-lived assets is based on assumptions concerning the amount and timing of estimated future cash flows and assumed discount rates, reflecting varying degrees of perceived risk. Since judgment is involved in determining the fair value and useful lives of long-lived assets, the future carrying value of our long-lived assets may have differing future fair values.
Multiemployer plans — Various subsidiaries in the West segment are signatories to collective bargaining agreements. These agreements require that the Companywe participate in and contribute to a number of multiemployer benefit plans for itsour union employees at rates determined by the agreements. The trustees for each multiemployer plan determine the eligibility and allocations of contributions and benefit amounts, determine the types of benefits, and administer the plan. To the extent that any plans are underfunded, the Employee Retirement Income Security Act of 1974, as amended by the Multi-Employer Pension Plan Amendments Act of 1980, requires that if the Companywe were to withdraw from an agreement or if a plan is terminated, we may incur a withdrawal obligation. Since the withdrawal liability is based on estimates of our proportional share of the plan’s unfunded vested liability, as calculated by the plan’s actuaries, the potential withdrawal obligation may be significant.
In November 2011, members of the Pipe Line Contractors Association “PLCA”���PLCA” including ARB, Rockford and Q3C (prior to the Company’sour acquisition in 2012), withdrew from the Central States Southeast and Southwest Areas Pension Fund multiemployer pension plan (“Plan”). These withdrawals were made in order to mitigate additional liability in connection with the significantly underfunded Plan. The CompanyWe recorded a withdrawal liability of $7.5 million, which was increased to $7.59$7.6 million after the acquisition of Q3C,Q3C. During the first quarter of 2016, we received a final payment schedule. As a result of payments made and based on information provided bythis schedule, the Plan. The Plan asserted that the PLCA members did not affect a proper withdrawal in 2011, and in May 2014, the Plan asserted that the total liability for the Company was $11.8 million. A legal proceeding commenced, and the United States District Court ruled that the withdrawal of the PLCA members in 2011 was not effective. The PLCA appealed this decision, but as required by the Plan, the Company began making monthly payments which have totaled $1.83 million throughrecorded at December 31, 2015. These payments2017 was $4.7 million. We expect to pay the remaining liability balance during 2018 and have been expensed.
On September 2, 2015, the U.S. Court of Appeals for the 7th Circuit reversed the decision of the District Court and ruled that the withdrawal was effective in 2011 as had been asserted by the PLCA. The Company has received a revised withdrawal liability calculation from the Plan at an amount approximately equal to the company’s accrual amount. The Company and other members of the PLCA are engaged in arbitration to further reduce the amount owed. The Company is making payments while awaiting the results of the arbitration process. The Company has no plans to withdraw from any other agreementslabor agreements.
Litigation and contingencies—Litigation and contingencies are included in our consolidated financial statements based on our assessment of the expected outcome of litigation proceedings or the expected resolution of the contingency. We provide for costs related to contingencies when a loss from such claims is probable and the amount is reasonably determinable.estimable. In determining whether it is possible to provide an estimate of loss, or range of possible loss, we review and evaluate litigation and regulatory matters on a quarterly basis in light of potentially relevant factual and legal developments. If we determine an unfavorable outcome is not probable or reasonably estimable, we do not accrue for a potential litigation loss. Management is unable to ascertain the ultimate outcome of other claims and legal proceedings; however, after review and consultation with counsel and taking into consideration relevant insurance coverage and related deductibles/self-insurance retention, management believes that it has meritorious defense to the claims and believes that the reasonably possible outcome of such claims will not, individually or in the aggregate, have a materially adverse effect on theour consolidated results of operations, financial condition or cash flows of the Company.flows. See Note 1513 — “Commitments and Contingencies” inof the Notes to Consolidated Financial Statements included in Item 8 of this Form 10-K for further information.
Recently Issued Accounting Pronouncements
See Note 2 — “Summary of Significant Accounting Policies - Recently Issued Accounting Pronouncements” of the Notes to Consolidated Financial Statements included in Item 8 of this Form 10-K for a discussion of recently issued accounting pronouncements.
Results of Operations
Revenue,Consolidated Results
Two events had a material impact on our results of operations in 2016. In the third quarter we received a $38.0 million settlement for one of the construction projects that we had identified as part of our “Receivable Collection Actions”, discussed below. Because we had recorded the project with zero gross profit, operating incomethe settlement added $27.5 million to revenues and net income$26.7 million to gross profit. Also in the third quarter, we recorded a charge of $37.3 million primarily related to certain Belton, Texas area projects for the years ended December 31, 2015, 2014Texas Department of Transportation (“TXDOT”), as a result of project delays and 2013 were as follows:productivity issues.
| | 2015 | | 2014 | | 2013 | |
| | (Millions) | | % of
Revenue | | (Millions) | | % of
Revenue | | (Millions) | | % of
Revenue | |
| | | | | | | | | | | | | |
Revenues | | $ | 1,929.4 | | 100.0 | % | $ | 2,086.2 | | 100.0 | % | $ | 1,944.2 | | 100.0 | % |
Gross profit | | 219.9 | | 11.4 | % | 236.0 | | 11.3 | % | 256.0 | | 13.2 | % |
Selling, general and administrative expense | | 152.1 | | 7.9 | % | 132.2 | | 6.3 | % | 130.8 | | 6.8 | % |
Operating income | | 67.8 | | 3.5 | % | 103.8 | | 5.0 | % | 125.2 | | 6.4 | % |
Other income (expense) | | (6.7 | ) | (0.3 | )% | (1.5 | ) | (0.1 | )% | (5.6 | ) | (0.2 | )% |
Income before income taxes | | 61.1 | | 3.2 | % | 102.3 | | 4.9 | % | 119.6 | | 6.2 | % |
Provision for income taxes | | (23.9 | ) | (1.3 | )% | (38.6 | ) | (1.9 | )% | (44.9 | ) | (2.3 | )% |
Net income | | 37.2 | | 1.9 | % | 63.7 | | 3.0 | % | 74.7 | | 3.9 | % |
Net income attributable to noncontrolling interests | | (0.3 | ) | (0.0 | )% | (0.5 | ) | (0.0 | )% | (5.0 | ) | (0.3 | ) |
Net income to Primoris | | $ | 36.9 | | 1.9 | % | $ | 63.2 | | 3.0 | % | $ | 69.7 | | 3.6 | % |
Consolidated Results
Revenues
20152017 and 20142016
Revenues for year ended December 31, 2015 decreased2017 increased by $156.8$383.0 million, or 7.5%19.2%, compared to 2016. All segments reported year over year growth. Progress on three major pipeline jobs ($83.6 million), higher activity with major utility clients in California and the same periodMidwest ($135.6 million) and progress on our joint venture power plant projects in 2014.Southern California and a Mid-Atlantic power plant project ($158.2 million combined) drove higher 2017 revenue. Also contributing to 2017 growth was higher volume on our Belton area (Civil) projects and a Louisiana methanol plant project. The decreaseoverall increase was primarilypartially offset by decreases associated with projects substantially completed in 2017 and revenue recognized from the impact of unusually severe wet weather in the Gulf States during the first half of 2015 and the completion of two large projects in the Energy segment which were not fully replaced in 2015. The historic rainfall in the first halfone-time benefit of the year, especiallysettlement of one of the “Receivable Collection Actions” in 2016. Revenue from 2017 acquisitions and incremental revenue from 2016 acquisitions (where we only owned a business for a portion of the second quarter, caused us to suspend operations on various projects and to incur additional costs to recover from the weather conditions. Revenues were also impacted by the delay in certain capital projects as a result of lower oil prices.year) totaled $53.6 million.
From an end-market perspective, our end-market revenues during the2016 and 2015
Revenues for year ended December 31, 2015 decreased2016 increased by $120.8$67.5 million, for underground capital projects and the industrial end-market revenues decreased by $252.6 million, asor 3.5% compared to the same period in 2014. For the year ended December 31, 2015, revenues increased in our heavy civil end-market by $123.1 million, in our underground utility end-market by $65.9 million, in the engineering end-market by $9.6 million and by $18.0 million in our other end-markets, as compared2015. The increase was primarily due to the year ended December 31, 2014.
2014 and 2013
Revenue in 2014 grew to $2.1 billion, an increase of $142.0$64.1 million or 7.3% from the prior year. The increaseRockford’s pipeline work, $34.5 million for work at a large petrochemical project in revenueLouisiana and $35.4 million from a new collaboration MSA arrangement at the energy segment of $269.8 million, and at the East segment of $59.5 million, wasARB Underground. These increases were partially offset by a declinerevenue reduction of $50.1 million at OnQuest, a reduction of $16.4 million at Saxon, and a reduction of $24.5 million in Heavy Civil projects. Revenues for 2016 also included the West segmentone-time benefit of $187.3 million. In 2014,$27.5 million from the West segment represented 46.2%settlement of total revenue,one of the Energy segment represented 30.3%, and the East segment was 23.5% of total revenue. Revenue from acquisitions made in 2014 and 2013 added $18.9 million to revenue.“Receivable Collection Actions”.
Gross ProfitAs discussed in Note 2 — “Summary of Significant Accounting Policies”, we had unapproved change orders and claims included in contract value that totaled approximately $67.8 million at December 31, 2017. Of this amount, approximately $49.7 million was claims related to the Belton area projects.
2015Gross Profit
2017 and 20142016
For the year ended December 31, 2015,2017, gross profit decreasedincreased by $16.2$77.1 million, or 6.9%38.3%, compared to 2016. All segments reported year over year improvement. Strong revenue growth and the same periodfavorable performance on the two large pipeline projects in 2014, primarily as a resultFlorida drove significant improvement. Also benefiting 2017 were higher volumes for the Power segment and better performance from Civil. The year over year increase was partially offset by $26.7 million of gross profit recognized in 2016 from the settlement of one of the 7.5% decrease in revenues“Receivable Collection Actions”. Gross Profit from 2017 acquisitions and to inefficiencies associated with stopping and starting projects asincremental gross profit from 2016 acquisitions (where we only owned a resultbusiness for a portion of the weather delays in the Gulf States during the first half of 2015.
year) totaled $8.6 million. Gross profit as a percentage of revenuerevenues increased slightly to 11.4%11.7% in 2017 from 11.3% from10.1% in 2016 for the same period in 2014.
2014 and 2013reasons noted above.
Gross2016 and 2015
For the year ended December 31, 2016, gross profit for 2014 decreased by $20.0$18.6 million, or 7.8%,8.4% compared to 2015. The decrease was primarily from 2013. As discussed in the segment results below, the decrease in Heavy Civil projects of $38.2 million, of which $33.4 million was from a decrease at the Belton area projects. Gross profit decreased by $6.1 million at the Louisiana petrochemical project, in spite of an increase in revenue, as the scope of our work has changed to less equipment intensive, lower margin work. Gross profit also decreased at ARB Underground by $6.3 million and $8.6 million at ARB Industrial with these decreases offset by a gross profit was $47.3increase of $15.4 million inat Rockford. Our gross profit benefitted by $26.7 million from the West segment. Gross profit forsettlement of one of the Energy segment increased by $25.9 million and increased by $1.4 million for the East segment. Gross profit from acquisitions made in 2014 and 2013 added $3.0 million to 2014 gross profit.“Receivable Collection Actions”. Gross profit as a percentage of revenues decreased from 13.2%11.4% in 20132015 to 11.3%10.1% in 2014 as a result of2016 for the large decrease in both revenue and gross profit in the West segmentreasons noted above.
Selling, general and administrative expenses
2015 and 2014
Selling, general and administrative expenses (“SG&A”) consist primarily of compensation and benefits to executive, management level and administrative employees, marketing and communications, professional fees, office rent and utilities and acquisition costs.
2017 and 2016
For 2015,2017, SG&A expenses were $152.1$172.1 million, compared to $132.2$140.8 million in 2014,for 2016, an increase of $19.9$31.3 million. Of the increase, $3.9 million was from the 2015 acquisition of Aevenia and $1.6Approximately $12.4 million of the increase in SG&A is related to businesses acquired in 2017 and a full year of expense in 2017 for the Northern acquisition compared to less than two months of expense in 2016. The remaining increase was primarily due to the impact of the 2014 acquisitions of Vadnais, Surber and Ram-Fab. Of the remaining $14.4a $12.6 million increase professional fees increased by $9.1in compensation related expenses, including incentive compensation accruals; and a $1.3 million we recorded a one-time valuation adjustment for the value of a long-term asset of $2.6 million and the remaining $2.7 million increase represented expenses associated with increased compensation and staffing levels. The majority of the increase in professional fees was an increase in legal fees associated with our collection efforts on the disputed receivables discussed later in this Item and the expenses incurred in our ongoing internal review of the methods used by our subsidiaries to recognize revenue and estimate contingencies for ongoing projects as discussed in the risk factor entitled “We may not be successful in continuing to meet the internal control requirements of the Sarbanes Oxley Act of 2002” in Item 1A of this Annual Report on form 10-K. In addition, the increase in professional fees included fees associated with our efforts to improve our documentation of internal controls over financial reporting.costs.
SG&A as a percentage of revenue for the year ended December 31, 20152017 increased slightly to 7.9%7.2% compared to 6.3%7.1% for the year ended December 31, 20142016. Excluding the impact of acquisitions, SG&A as a percentage of revenue for the year ended December 31, 2017, decreased slightly to 6.9% compared to 7.1% for the year ended December 31, 2016.
2016 and 2015
For 2016, SG&A expenses were $140.8 million, compared to $151.7 million for 2015, a decrease of $10.9 million. The decrease was primarily as a result of both increased expensesdecreases in professional fees of $7.4 million due to reduced legal fees and due to completion of the implementation of the integrated financial system. The reduction in SG&A was also the result of a $2.6 million prior year one-time valuation adjustment for the value of a long-term asset. Additionally, SG&A was reduced as a result of a decrease of $1.8 million in revenues in 2015.
2014compensation and 2013staffing levels.
SG&A expenses were $132.2 million in 2014as a percentage of revenue for the year ended December 31, 2016 decreased to 7.1% compared to $130.8 million in 2013. The prior7.9% for the year included one-time expenses of $5.7 million related to impairment costs. Excluding the one-time expenses, SG&A in 2014 increased $7.1 million, or 5.7%, which included an increase of $1.4 millionended December 31, 2015 as a result of the 2014 acquisitions of Vadnais, Surber and Ram-Fab. Remaining increases were due to increases in compensation and benefits, marketing and communicationsdecreased expenses and professional fees.while revenues increased.
SG&A expenses as a percentage of revenue decreased to 6.3% for 2014, from 6.7% for 2013.
Other income and expense
Non-operating income and expense items for the years ended December 31, 2015, 20142017, 2016 and 20132015 were as follows:
| | 2015 | | 2014 | | 2013 | | | | | | | | | | | |
| | (Millions) | | (Millions) | | (Millions) | | | 2017 | | 2016 | | 2015 | |
Other income (expense) | | | | | | | | |
Income (loss) from non-consolidated investments | | $ | — | | $ | 5.3 | | $ | (4.8 | ) | |
| | | (Millions) | | (Millions) | | (Millions) | |
Investment income | | | $ | 5.8 | | $ | — | | $ | — | |
Foreign exchange gain (loss) | | (0.8 | ) | 0.3 | | 0.2 | | | | 0.2 | | | 0.2 | | | (0.8) | |
Other income (expense) | | 1.7 | | (0.8 | ) | 4.8 | | | | 0.5 | | | (0.3) | | | 1.7 | |
Interest income | | 0.1 | | 0.1 | | 0.1 | | | | 0.6 | | | 0.1 | | | 0.1 | |
Interest expense | | (7.7 | ) | (6.4 | ) | (5.9 | ) | | | (8.1) | | | (8.9) | | | (7.7) | |
Total other income (expense) | | $ | (6.7 | ) | $ | (1.5 | ) | $ | (5.6 | ) | | $ | (1.0) | | $ | (8.9) | | $ | (6.7) | |
There was noInvestment income from non-consolidated investments for 2015. For 2014, income from non-consolidated investments was primarily from the sale of our interest of the WesPac Energy non-consolidated joint venture, and for 2013, the loss from non-consolidated investments included an impairment expense and operating loss totalling $5.5 million for the WesPac Energy joint venture, partially offset byyear ended December 31, 2017 is related to a $0.7 million profitgain from a 49% ownedshort-term investment Alvah, Inc.in marketable equity securities.We purchased the securities in the third quarter of 2017 and sold the securities in the fourth quarter of 2017.
Foreign exchange gains and losses reflect currency exchange fluctuations of the United States dollar compared to the Canadian dollar. Many of our contracts in Calgary, Canada are sold based on United States dollars, but a portion of the work is paid for with Canadian dollars creating a currency exchange difference.
Other income for 2017 was $0.5 million compared to other expense of $0.3 million for 2016. The $0.8 million change was primarily due to remeasurement of the year ended December 31, 2015 consistedcontingent consideration related to the FGC performance target contemplated in their purchase agreement. Under ASC 805, we are required to estimate the fair value of contingent consideration based on facts and circumstances that existed as of the acquisition date and remeasure to fair value at each
reporting date until the contingency is resolved. As a result of that remeasurement, we reduced the contingent consideration liability by $0.5 million in the fourth quarter of 2017. Other expense for 2016 was $0.3 million compared to other income of $1.7 million for 2015. The $2.0 million change was primarily ofdue to the net reversal of $1.9 million inof contingent consideration in 2015 as Ram-Fab, Vadnais and Surber missed financial targets contemplated in their respective purchase agreements. Net other expense of $0.8 million for the year ended December 31, 2014 was due to adjustments to the fair value of the contingent consideration liabilities related to the acquisitions of Q3C, Surber and Vadnais. Net other income for 2013 was $4.8 million. The major components include $6.5 million as reductions in the liability for contingent consideration since the PPS, Saxon and FSSI acquisitions did not meet the performance targets outlined in their purchase agreements. The income was partially offset by increases of $2.5 million in the fair value of the liabilities for contingent consideration recorded throughout 2013 for acquisitions, including Q3C.
Interest income is derived from interest earned on excess cash invested primarily in short term U.S. Treasury bills, backed by the federal government, and other investments that may not be backed by the federal government.
Interest expense for the year ended December 31, 2015 was $7.7 million,decreased in 2017 compared to $6.4 million for the same period in 20142016 primarily due to a lower average debt balance. Interest expense increased equipment debt financing and additional borrowing under the Company’s agreement for senior secured notes. The increased interest expense in 20142016 compared to 2013 was2015 primarily due to increases in equipmenta higher average debt financing, and a full year of interest on a $25 million long-term note drawn-down in July 2013.
balance. The weighted average interest rate on total debt outstanding at December 31, 2017, 2016 and 2015 2014was 3.0%, 2.9% and 2013 was 2.9%, 3.0% and 3.3%, respectively.
Provision for income taxes
Our provision for income tax increased $7.3 million to $28.4 million for 2017 compared to 2016. Increased pretax profits in 2017 of $53.0 million drove an increase in income tax of $23.4 million using the 2016 effective tax rate. This increase in income tax was offset by a $9.4 million decrease in income tax from the remeasurement of our U.S. deferred tax liability and a $6.7 million decrease due to a decrease in 2017 effective tax rates. The remeasurement benefit is a provisional estimate under SAB 118 that could be revised once we finalize our deductions for tax depreciation and executive compensation accruals. We may also revise our estimate based on any additional guidance issued by the U.S. Treasury Department, the U.S. Internal Revenue Service, and other standard-setting bodies.
The 2017 effective tax rate on income including noncontrolling interests was 27.0%. The 2017 effective tax rate on income attributable to Primoris (excluding noncontrolling interests) was 28.2%. Three factors contributed to the decrease in the 2017 effective tax rate compared to 2016. First, state effective tax rates decreased due to changes in the mix of profit by state and the implementation of state tax planning. Second, partially nondeductible per diem expenses stayed relatively constant year over year despite the increase in pretax profits. Lastly, the benefit of the domestic production activities deduction increased compared to 2016.
Our provision for income tax decreased $14.7$2.8 million to $23.9$21.1 million for 20152016 compared to 20142015 primarily as a result of the decrease in pretax profits. The effective tax rate on income before provision for income taxes and noncontrolling interests was 39.19% and 37.77% for the years 2015 and 2014, respectively. The effective tax rate excluding income attributable to noncontrolling interests was 39.37% for the year 2015 and 37.96% for 2014. The primary reason for the increase in the effective tax rate was the impact of partially non-deductible per diem expenses, which while decreasing by $5.2 million in 2015, were a greater percentage of pre-tax income.
Our provision for income tax decreased $6.3 million to $38.6 million for 2014 compared to 2013 as a result
Segment Results
Power Segment Results
The following discussion describes the significant factors contributing to the results of our three operating segments. All intersegment revenues and gross profit, which were immaterial, have been eliminated in the following tables.
West Segment
Revenue and gross profit for the WestPower segment for the years ending December 31, 2015, 20142017, 2016 and 20132015 were as follows:
| | 2015 | | 2014 | | 2013 | | | | | | | | | | | | | | | | | |
| | (Millions) | | % of
Revenue | | (Millions) | | % of
Revenue | | (Millions) | | % of
Revenue | | | Year Ended December 31, | |
West Construction Services | | | | | | | | | | | | | | |
| | | 2017 | | 2016 | | 2015 | |
| | | | | | % of | | | | | % of | | | | | % of | |
| | | | | | Segment | | | | | Segment | | | | | Segment | |
| | | (Millions) | | Revenue | | (Millions) | | Revenue | | (Millions) | | Revenue | |
Power Segment | | | | | | | | | | | | | | | | | |
Revenue | | $ | 913.6 | | | | $ | 964.1 | | | | $ | 1,151.4 | | | | | $ | 606.1 | | | | $ | 478.6 | | | | $ | 466.3 | | | |
Gross profit | | $ | 130.3 | | 14.3 | % | $ | 143.5 | | 14.9 | % | $ | 190.7 | | 16.6 | % | | $ | 65.7 | | 10.8% | | $ | 49.8 | | 10.4% | | $ | 53.6 | | 11.5% | |
20152017 and 20142016
West segment revenue for 2015 decreasedRevenue increased by $50.5$127.5 million, or 5.2%26.6%, during 2017 compared to 2014. Revenue declined at2016. The growth is primarily due to progress on our joint venture power plant projects in Southern California ($115.3 million), a power plant construction project in the ARB Industrial division by $105.0 million with $80.2 millionMid-Atlantic region that began late in the third quarter of the decrease the result of completion of2016 ($42.9 million) and a solarmethane plant project in the Mojave DesertTexas that started in 2014.2017. In addition, we benefited from acquisitions completed in November 2016 and May 2017 ($20.3 million). The decreaseoverall increase was partially offset by increases at ARB Structures and Q3C totaling $62.2 million. The ARB Structures revenue increase was driven primarily by work onthe substantial completion of a large parking structurepetrochemical plant in southern California,Louisiana in the second quarter of 2017 ($42.0 million) and the Q3C revenue increase was attributable primarily to additional work performed for its largest customer, a gas and electric utility, totaling $27.6 million.completion of two large parking structures in 2016.
Gross profit for the West segment decreasedincreased by $13.2$15.9 million, or 9.2% for 2015 versus 2014.31.9%, during 2017 compared to 2016. The primary reason was a reduction of gross profit at both ARB Industrial and Rockford totaling $17.4 million, offset by an increase at ARB Underground of $5.1 million. The declines were dueis primarily attributable to the reduction in revenue at ARB Industrialgrowth and the impact of the rainacquired operations ($1.6 million). Gross profit as a percentage of revenues increased to 10.8% in the second quarter on the pipeline operations2017 compared to 10.4% in 2016 primarily as a result of Rockford.an improved revenue mix.
2016 and 2015
Revenue increased by $12.3 million, or 2.6%, during 2016 compared to 2015. The increase realizedis primarily due to a $60.6 million increase at Primoris Industrial Constructors from a large petrochemical project in Louisiana, partially offset by a $50.1 million decrease at OnQuest and OnQuest Canada from the completion of projects in 2015 that were not fully replaced in 2016.
Gross profit decreased by $3.8 million, or 7.1%, during 2016 compared to 2015. The decrease is primarily due to a $8.6 million reduction at ARB Underground was driven largelyIndustrial from a reduction in revenues and a decrease of $6.7 million at OnQuest and OnQuest Canada as a result of reducted volumes. These decreases are partially offset by an $11.6 million increase at Primoris Industiral Constructors from increased MSA work performed for a major public gas and electric utility customer under its Pipeline Safety Enhancement Plan.volume at the large petrochemical project in Louisiana.
Gross profit as a percentage of revenues decreased to 14.3%10.4% in 20152016 compared to 14.9%11.5% in 2014, still consistent with historical ratios. This2015. The decline in margin is largely attributable to Rockford’sthe low margin decrease from 11.6%percentage realized by two joint venture projects in process, which accounted for 5.6% of the Power segment’s revenues in 2016 versus 0.9% in 2015.
Pipeline and Underground Segment
Revenue and gross profit for the Pipeline segment for the years ended December 31, 2017, 2016 and 2015 were as follows:
| | | | | | | | | | | | | | | | |
| | Year Ended December 31, | |
| | 2017 | | 2016 | | 2015 | |
| | | | | % of | | | | | % of | | | | | % of | |
| | | | | Segment | | | | | Segment | | | | | Segment | |
| | (Millions) | | Revenue | | (Millions) | | Revenue | | (Millions) | | Revenue | |
Pipeline Segment | | | | | | | | | | | | | | | | |
Revenue | | $ | 465.6 | | | | $ | 401.9 | | | | $ | 299.4 | | | |
Gross profit | | $ | 92.1 | | 19.8% | | $ | 68.1 | | 16.9% | | $ | 24.7 | | 8.2% | |
As discussed in the section “Receivable Collection Actions”, during the third quarter of 2016, we collected a disputed receivable related to a major pipeline project completed in 2014, to 8.6%which resulted in 2015 reflecting a reduced levelrecognizing revenue of work in the fourth quarterapproximately $27.5 million and gross profit of 2015 andapproximately $26.7 million. The following discussion excludes the impact of this collection, which was a one-time item.
2017 and 2016
Revenue increased by $91.2 million, or 24.4%, during 2017 compared to 2016. The increase is primarily due to two large pipeline jobs in Florida, which began in the rainy weatherthird quarter of 2016 ($31.6 million) and activity on a pipeline project in Pennsylvania that began in 2017 ($52.0 million). In addition, impact of the acquired Coastal operations ($17.9 million) also benefited 2017. The overall increase was partially offset by a reduction in maintenance work ($31.1 million).
Gross profit increased by $50.7 million, or 122.5%, during 2017 compared to 2016. The increase is attributable to the combination of revenue growth and our strong performance on the two pipeline jobs in Florida, where we experienced good weather conditions resulting in no weather delays and high productivity. In addition, the acquisition of Coastal in 2017 contributed gross profit of $3.2 million. Gross profit as a percentage of revenue increased to 19.8% in 2017 compared to 11.1% in 2016. The increase is due to the good weather conditions noted above, which is not common and not to be expected in the future.
2016 and 2015
Revenue increased by $75.0 million, or 25.1%, during 2016 compared to 2015. The increase is primarily due to a $64.1 million increase at Rockford from two large pipeline projects in Florida which started in the third quarter of 2016 and a $6.1 million increase at Primoris Pipeline from several smaller diameter pipeline jobprojects in the Houston, TX area.Texas.
2014 and 2013
West segment revenue in 2014 decreasedGross profit increased by $187.3$16.7 million, or 16.3%67.6%, during 2016 compared to 2013. Revenue declined at2015 primarily due to a $15.4 million increase from the Rockford by $175.6 millionFlorida projects described above. Gross profit as a percentage of revenues increased to 11.1% in 2016 compared to 8.2% in 2015 primarily as a result of the completionincrease in revenues.
Utilities Segment
Revenue and gross profit for the Utilities segment for the years ended December 31, 2017, 2016 and 2015 were as follows:
| | | | | | | | | | | | | | | | |
| | Year Ended December 31, | |
| | 2017 | | 2016 | | 2015 | |
| | | | | % of | | | | | % of | | | | | % of | |
| | | | | Segment | | | | | Segment | | | | | Segment | |
| | (Millions) | | Revenue | | (Millions) | | Revenue | | (Millions) | | Revenue | |
Utilities Segment | | | | | | | | | | | | | | | | |
Revenue | | $ | 806.5 | | | | $ | 637.2 | | | | $ | 587.0 | | | |
Gross profit | | $ | 113.0 | | 14.0% | | $ | 100.1 | | 15.7% | | $ | 96.5 | | 16.4% | |
2017 and 2016
Revenue increased by $169.3 million, or 26.6%, during 2017 compared to 2016. The increase is primarily attributable to higher activity with two major utility customers in 2013California ($67.7 million) and two major utility customers in the Midwest ($32.3 million). In addition, higher revenue from a $102 million decreasecollaboration MSA arrangement for a major utility customer in California ($35.6 million) and the Marcellus shale region. Revenue decreased by $41.8impact of the acquired FGC operations ($15.5 million) also benefited 2017.
Gross profit increased $12.9 million, at the ARB Underground divisionor 12.9%, during 2017 compared to 2016. The increase is primarily due the growth in revenue and the impact of acquired operations. Gross profit as a percentage of revenues decreased to reduced revenue of $23.2 million from traditional MSA customers, a decline of $40.1 million for one-time projects completed14.0% in 2013 partially offset by an increase2017 compared to 15.7% in pipeline integrity work for a large gas utility customer. ARB Industrial division revenues declined by $21.8 million2016 primarily as a result of an $84.3lower gross margins on the collaboration MSA work.
2016 and 2015
Revenue increased by $50.2 million, or 8.6%, during 2016 compared to 2015. The increase is primarily due to a $35.4 million increase at ARB Underground from a new collaboration MSA arrangement as well as a $12.1 million increase at Q3C from increased volume.
Gross profit increased by $3.6 million, or 3.7%, during 2016 compared to 2015 primarily due to increased profitability at Q3C. Gross profit as a percentage of revenues decreased to 15.7% in 2016 compared to 16.4% in 2015. The decrease fromwas primarily the result of lower margins on the collaboration MSA work.
Civil Segment
Revenue and gross profit for the Civil segment for the years ended December 31, 2017, 2016 and 2015 were as follows:
| | | | | | | | | | | | | | | | |
| | Year Ended December 31, | |
| | 2017 | | 2016 | | 2015 | |
| | | | | % of | | | | | % of | | | | | % of | |
| | | | | Segment | | | | | Segment | | | | | Segment | |
| | (Millions) | | Revenue | | (Millions) | | Revenue | | (Millions) | | Revenue | |
Civil Segment | | | | | | | | | | | | | | | | |
Revenue | | $ | 501.8 | | | | $ | 479.2 | | | | $ | 576.7 | | | |
Gross profit | | $ | 7.6 | | 1.5% | | $ | (16.7) | | (3.5%) | | $ | 45.1 | | 7.8% | |
In the third quarter of 2016, we recorded a $37.3 million write-down related to the Belton area projects. The following discussion excludes the impact of the write-down.
2017 and 2016
Revenue increased by $22.6 million, or 4.7%, during 2017 compared to 2016. The increase is primarily due to progress on a methanol plant project in Louisiana that began in 2017 ($31.9 million) and higher volume on the Belton area projects ($23.3 million). The overall increase was partially offset by substantial completion of a major powerlarge petrochemical plant project in 2013. The decrease was partially offset by an increase of $53.2 million for construction of a solar plant projectLousiana in the Mojave Desert in 2014. Finally, revenue at Q3C increased $62.2 million compared to 2013 due primarily to increase in work for a large utility located in the north central United States.first half of 2017.
Gross profit for the West segment decreased by $47.3$13.0 million, or 24.8%.63.1%, during 2017 compared to 2016. The primary reason for the decrease was a reduction of gross profit at ARB of $54.3 million. The declines wereprimarily due to a combination of the close out of a major power planthigher costs on two Arkansas DOT projects and one Louisiana DOT project, the substantial completion of the Blythe joint venture project, the mix of MSA jobs at ARB Underground and the decline in revenue including $4.4 million less equipment cost absorption by the jobs as a result of the lower activity levels in 2014 compared to 2013. Gross profit at Rockford decreased by $5.1 million while gross profit at Q3C increased by $13.5 million, withdespite the revenue at the operating units serving as the primary driver of gross profit changes.increase.
Gross profit as a percentage of revenues decreased to 14.9%1.5% in 20142017 compared to 16.6%4.3% in 2013.2016. The percentage in 2013decrease was higher than our historical percentages, which have ranged from 13% to 16% of revenue as aprimarily the result of the substantial completion in 2013 of a power plant project by the ARB Industrial division. In addition, ARB Industrial recorded revenue of $29.5 million in 2013 and revenue of $82.6 million in 2014 for construction services at a large solar project in the Mojave Desert. Because of uncertainty as to collectability at the end of the cost-reimbursable project, we recorded revenues equal to cost for this project. Excluding the revenue and cost of this project, gross profit as a percentage of revenues would have been 16.3% for 2014 compared to 17.0% for 2013.
East Segmentimpacts noted above.
Revenue and gross profit forat the East segment for the years ended December 31, 2015, 2014 and 2013 were as follows:
| | 2015 | | 2014 | | 2013 | |
| | (Millions) | | % of
Revenue | | (Millions) | | % of
Revenue | | (Millions) | | % of
Revenue | |
East Construction Services | | | | | | | | | | | | | |
Revenue | | $ | 612.2 | | | | $ | 489.9 | | | | $ | 430.4 | | | |
Gross profit | | $ | 42.5 | | 6.9 | % | $ | 25.7 | | 5.3 | % | $ | 24.3 | | 5.6 | % |
2015 and 2014
East segment revenueBelton area projects was $144.5 million for the year ended December 31, 2015 increased by $122.22017, representing 28.9% of total Civil revenue. Revenue for which no margin was recognized was $134.7 million or 25.0% from 2014. The increase was due primarily to JCG’s infrastructure and maintenance division work at a large petrochemical facility project in Louisiana.
East segment gross profit for the year ended December 31, 2017, of which $78.6 million was from the Belton area projects. During 2017, the four Belton area jobs in a loss position contributed $2.4 million gross profit as a result of lower anticipated costs. Two of the Belton area jobs in a loss position were completed during 2017, and the remaining two loss jobs are schedule to be completed in 2018. At December 31, 2017, the accrued loss provision for the four Belton area projects was $5.0 million and estimated remaining revenue for the two open jobs in a loss position was $49.0 million. The remaining Belton area job contributed $0.3 million gross profit during the year ended December 31, 2017. At December 31, 2017, estimated revenue for the job was $88.0 million, with completion scheduled for early 2019.
2016 and 2015 increased
Revenue decreased by $16.8$97.5 million, or 65.1%16.9%, during 2016 compared to 2014. The increase was2015. Revenue at Primoris I&M (“I&M”) decreased by $76.4 million due primarily to the increased revenue for the JCG infrastructure and maintenance divisionlarge petrochemical project in Louisiana. Gross profit decreased at both JCG’s heavy civilLouisiana and decreases in Texas I&M work. Primoris Heavy Civil division and Cardinal Contractors. Gross profit for JCG heavy civil division projectsrevenue decreased by $15.3$24.5 million. Decreases in Louisiana DOT projects of $19.4 million primarily from delays at theand Mississippi DOT projects of $58.9 million were offset by increases in Arkansas DOT projects of $6.7 million, Texas DOT projects in the Belton, TX area,of $8.4 million and Cardinal Contractors gross profits decreased by $4.9 million, primarily from reduced margins for two Texas wastewater projects.
Gross profit as a percentageairport projects of revenues increased to 6.9 % in 2015 compared to 5.3% in 2014 primarily as a result of the increase in revenues.
2014 and 2013
Revenue for the East segment increased by $59.5 million, or 13.8% from 2013. Of the increase, $66.1 million was at JCG’s heavy civil and infrastructure and maintenance divisions due primarily to increases of $42.8 million in Texas DOT revenue and an increase of $40.2 million in Mississippi DOT revenue. The increases were partially offset by a reduction of $19.1 million in Louisiana DOT revenue. Additionally, Cardinal Contractor’s revenue decreased by $8.9 million, reflecting decreased work in the wastewater facility market in Florida.$31.7 million.
Gross profit for the East segment increaseddecreased by $1.4$24.5 million, or 5.9%54.3%, during 2016 compared to 2013. The increased percentage was lower than the revenue growth2015 primarily as a result of reduced gross profit of $1.9 million for JCG heavy civil projects offset by increases of $1.8 million at JCG’s infrastructure and maintenance divisions and $0.6 million for Cardinal Contractor’s projects. Heavy civil experienced a $7.9 million decrease in gross profit due to both the impact of the lower Louisiana DOT revenues and reduced gross profit on Texas DOT work. This decrease was partially offset by gross profit increases of $5.6 million in other heavy civil work, primarily on Mississippi DOT projects.decreased revenue at Primoris I&M.
Gross profit as a percentage of revenues decreased to 5.3 %4.3% in 20142016 compared to 5.6%7.8% in 20132015 primarily as a result of the lower gross profitdecrease in revenues.
Planned Divestiture of Texas and LouisianaHeavy Civil Business Unit
In October 2016, we announced that we planned to divest our Texas heavy civil projects.
Energy Segment
Revenuebusiness unit, which operates as a division of Primoris Heavy Civil. We engaged a financial advisor to assist in the marketing and gross profit forsale of the Energy segment forbusiness unit, and planned to continue to operate the years ended December 31, 2015, 2014 and 2013 were as follows:
| | 2015 | | 2014 | | 2013 | |
| | (Millions) | | % of
Revenue | | (Millions) | | % of
Revenue | | (Millions) | | % of
Revenue | |
Energy Segment | | | | | | | | | | | | | |
Revenue | | $ | 403.6 | | | | $ | 632.2 | | | | $ | 362.4 | | | |
Gross profit | | $ | 47.1 | | 11.7 | % | $ | 66.8 | | 10.6 | % | $ | 40.9 | | 11.3 | % |
2015 and 2014
Revenue for the Energy segment decreased by $228.6 million, or 36.2% from 2014. The PES Industrial division revenue decreased by $116.0 million, primarily due tobusiness unit until completion of a fertilizer plant projectsale. In April 2017, the Board of Directors determined that based on the information available, we would attain the best long-term value by withdrawing from the sales process and continuing operating the business unit. We will aggressively pursue claims for five Texas Department of Transportation projects that resulted in 2014, andsignificant losses recorded in 2016. However, there can be no assurance as to the impactfinal amounts collected. As of December 31, 2017, we had approximately $49.7 million of claims related to the unusually severe rainy weather during the first half of the year, which delayed our ability to start work for a chemical plant projectBelton area projects included in Louisiana. PES’s pipeline division revenue decreased by $113.9 million as a result of completion of a pipeline project in 2014. For the PES Saxon division, revenue decreased by $36.6 million as a result of a 2014 completion of a project in the Houston Ship Channel, partially offset by increases from two projects in Pennsylvania. OnQuest and OnQuest Canada revenue in 2015 increased by $9.6 million as a result of an LNG project in Florida. Revenue for Aevenia, acquired on February 28, 2015, was $23.7 million.contract value.
Gross profit for the Energy segment decreased by $19.8 million, or 29.5% for the year ended December 31, 2015, compared to 2014. The PES industrial division, PES pipeline division and the PES Saxon division gross profit decreased $27.1 million as a result of the reduction in revenue. PES’s Specialty division gross profit increased $3.6 million as a result of the completion of a chilled water project in Texas. Aevenia’s gross profit was $2.4 million.
Gross profit as a percentage of revenues increased to 11.7% in 2015 compared to 10.6% in 2014. The increase was primarily the result of two offsetting factors. The first was due to the effect of zero margin work on a large pipeline project at the PES Pipeline division in 2014 and it’s resulting lower prior year gross profit margin percentage. Offsetting this was reduced 2015 gross profits caused by the heavy rains during the first half of 2015 and decreased labor efficiency rates.
2014 and 2013
Revenue for the Energy segment increased by $269.8 million, or 74.5% from 2013. The PES Industrial division revenue increased by $129.0 million primarily from work activity at petrochemical facilities in south Louisiana. PES’s PPS division revenue increased by $85.5 million as a result of increased revenues from capital projects. PES’s Saxon division revenue increased by $17.1
million and OnQuest and OnQuest Canada revenue in 2014 increased by $21.5 million as a result of additional revenue from construction of a micro LNG facility in 2014.
Gross profit for the Energy segment increased by $25.9 million, or 63.1%, compared to 2013. The PES Industrial division gross profit increased $14.6 million primarily due to the division’s increased revenues. PES’s PPS division gross profit increased $4.1 million due to increased revenues and the Saxon division gross profit increased $3.7 million as a result of increased revenues and improved profit margins compared to 2013. OnQuest and OnQuest Canada profit margins in 2014 increased by $1.5 million due to increased revenues.
Gross profit as a percentage of revenues decreased to 10.6% in 2014 compared to 11.3% in 2013 primarily as a result of the reduced margins at PES’s PPS division. Similar to ARB Industrial, PPS recorded revenues equal to cost for a large pipeline project for which we have concerns about collectability of the full contractual amount. In 2013, PPS recorded revenue of $9.2 million and in 2014, PPS recorded revenue of $121.2 million for the project. Excluding the revenue of this project, gross profit as a percentage of revenues would have been 13.0% for 2014 compared to 11.6% for 2013.
Liquidity and Capital Resources
Cash Needs
Liquidity represents our ability to pay our liabilities when they become due, fund business operations and meet our contractual obligations and execute our business plan. Our primary sources of liquidity are our cash balances at the beginning of each period and our net cash flow. If needed, we have availability under our lines of credit to augment liquidity needs. In order to maintain sufficient liquidity, we evaluate our working capital requirements on a regular basis. We may elect to raise additional capital by issuing common stock, convertible notes, term debt or increasing our credit facility as necessary to fund our operations or to fund the acquisition of new businesses.
Our cash and cash equivalents totaled $161.1$170.4 million at December 31, 20152017 compared to $170.5$135.8 million at December 31, 2014.2016. We anticipate that our cash and investments on hand, existing borrowing capacity under our credit facility and our future cash flows from operations will provide sufficient funds to enable us to meet our operating needs, our planned capital expenditures, and settle our ability to growcommitments and contingencies for at least the next twelve months. In evaluating our liquidity needs, we do not consider cash and cash equivalents held by our consolidated VIEs. These amounts, which totaled $60.3 million and $7.0 million as of December 31, 2017 and December 31, 2016, respectively, are not available for general corporate purposes.
The construction industry is capital intensive, and we expect to continue to make capital expenditures to meet anticipated needs for our services. Historically, we have invested an amount that approximated the sum of depreciation and amortization expenses plus proceeds from equipment sales. In 2015,2017, we spent approximately $79.8 million for capital expenditures, were approximately $67.1 million.which included $9.9 million spent for our investment in the solar projects. In addition, the companies acquired during the period added $12.4 million to property, plant and equipment. For 2015,2017, the amount of depreciation, amortization and equipment sales was approximately $75.1$75.0 million. Capital expenses are expected to total $55$70.0 to $60$75.0 million for 2016.2018.
Cash Flows
Cash flows during the years ended December 31, 2015, 20142017, 2016 and 20132015 are summarized as follows:
| | 2015 | | 2014 | | 2013 | |
| | (Millions) | | (Millions) | | (Millions) | |
Change in cash | | | | | | | |
Net cash provided by operating activities | | $ | 48.4 | | $ | 36.1 | | $ | 77.7 | |
Net cash used in investing activities | | (48.5 | ) | (102.6 | ) | (97.1 | ) |
Net cash provided by financing activities | | 21.8 | | 9.9 | | 57.9 | |
Net change in cash | | $ | 21.7 | | $ | (56.6 | ) | $ | 38.5 | |
| | | | | | | | | | |
| | Year Ended December 31, | |
| | 2017 | | 2016 | | 2015 | |
| | (Millions) | | (Millions) | | (Millions) | |
Change in cash: | | | | | | | | | | |
Net cash provided by operating activities | | $ | 188.9 | | $ | 62.6 | | $ | 48.4 | |
Net cash used in investing activities | | | (131.4) | | | (59.4) | | | (48.5) | |
Net cash (used in) provided by financing activities | | | (22.9) | | | (28.5) | | | 21.8 | |
Net change in cash and cash equivalents | | $ | 34.6 | | $ | (25.3) | | $ | 21.7 | |
Operating Activities
The sourcesources and uses of our cash flow fromassociated with operating activities and the use of a portion of that cash in our operations for the years ended December 31, 2015, 20142017, 2016 and 20132015 were as follows:
| | 2015 | | 2014 | | 2013 | |
| | (Millions) | | (Millions) | | (Millions) | |
Operating Activities | | | | | | | |
Operating income | | $ | 67.8 | | $ | 103.8 | | $ | 125.2 | |
Depreciation and amortization | | 65.2 | | 58.4 | | 49.9 | |
Gain on sale of property and equipment | | (2.1 | ) | (1.9 | ) | (1.4 | ) |
Stock-based compensation expense | | 1.0 | | 0.9 | | 0.3 | |
Distributions received from non-consolidated entities | | — | | — | | 2.8 | |
Other than temporary impairment expense for non-consolidated entities | | — | | — | | 4.0 | |
Goodwill/Intangible asset impairment | | 0.4 | | — | | 0.8 | |
Net deferred taxes | | (7.0 | ) | 9.0 | | (12.6 | ) |
Changes in assets and liabilities | | (46.3 | ) | (88.7 | ) | (45.6 | ) |
Foreign exchange gain (loss) | | (0.8 | ) | 0.3 | | 0.2 | |
Interest income | | 0.1 | | 0.1 | | 0.1 | |
Interest expense | | (7.7 | ) | (6.4 | ) | (5.9 | ) |
Other income (expense) | | 1.7 | | (0.8 | ) | 4.8 | |
Provision for income taxes | | (23.9 | ) | (38.6 | ) | (44.9 | ) |
Net cash provided by operating activities | | $ | 48.4 | | $ | 36.1 | | $ | 77.7 | |
| | | | | | | | | | |
| | | | | | | | | | |
| | | | | | | | | | |
| | 2017 | | 2016 | | 2015 | |
| | (Millions) | | (Millions) | | (Millions) | |
Operating Activities: | | | | | | | | | | |
Net income | | $ | 76.9 | | $ | 27.7 | | $ | 37.2 | |
Depreciation and amortization | | | 66.3 | | | 68.0 | | | 65.2 | |
Net deferred taxes | | | 3.7 | | | 10.9 | | | (7.0) | |
Changes in assets and liabilities | | | 50.4 | | | (43.9) | | | (46.5) | |
Other | | | (8.4) | | | (0.1) | | | (0.5) | |
Net cash provided by operating activities | | $ | 188.9 | | $ | 62.6 | | $ | 48.4 | |
2017 and 2016
Net cash provided by operating activities for 20152017 was $188.9 million , an increase of $48.4 million increased by $12.3$126.3 million compared to 2014. This increase2016. The improvement year over year was caused by the $6.8 million increase in depreciation and amortization, the reduced provision for income taxes of $14.7 million, offset by the decrease in operating income of $36.0 million andprimarily due to the $46.3 million net changesa favorable change in assets and liabilities and significant growth in 2015 compared to the net change of $88.7 million in 2014. income.
The significant components of the $46.3$50.4 million change in assets and liabilities for the year ended December 31, 20152017 are summarized as follows:
| · | | Accounts receivable decreased by $40.5 million from December 31, 2016, reflecting successful collection efforts during 2017. For non-disputed receivables (excluding retainage), our days sales outstanding declined slightly from 47 days at December 31, 2016 to 46 days at December 31, 2017; |
· an increase of $2.1 million in customer retention deposits;
| · | | Billings in excess of costs and estimated earnings increased by $46.0 million compared to December 31, 2016, primarily due to favorable milestone billings on certain lump sum projects; |
| · | | Accounts payable decreased by $30.5 million due primarily to the timing of payments; and |
| · | | Costs and estimated earnings in excess of billings (“CIE”) increased by $20.9 million compared to December 31, 2016. CIE results primarily from either time lags between revenue recognition and contractual billing terms or the billing lag at the end of each month. |
2016 and 2015
·Net cash provided by operating activities for 2016 of $62.6 million increased by $14.2 million compared to 2015. The improvement year over year was primarily due to a decreasereduction in income taxes paid.
The significant components of $19.5the $43.7 million change in accounts receivable, primarily as a result of a decrease of $17.7 million in amounts retained by customers as we have completed major projects. Atassets and liabilities for the year ended December 31, 2015, accounts receivable represented 28.3% of our total assets compared to 30.4% at the end of 2014. In general, we continue to maintain an excellent collection history, and we have certain lien rights that can provide additional security for collections. However,2016 are summarized as outlined in the section “Receivable Collection Actions”, we are in dispute resolution with two customers with a total receivable amount $50.8 million, or 16.0% of our total accounts receivable balance at December 31, 2015;follows:
| · | | ·an increase of $65.8 million in accounts receivable as revenues for the fourth quarter 2016 were stronger than in the same period in 2015, primarily as a result of significant work being performed during the fourth quarter 2016 on two Florida pipeline projects. However, as outlined in the section “Receivable Collection Actions”, we are in dispute resolution with one customer with a total receivable amount $32.9 million, or 8.5% of our total accounts receivable balance at December 31, 2016;
|
| · | | an increase of $22.2 million in costs and estimated earnings in excess of billings. Increases associated with the time lag from when revenues were earned until the customer can be billed were approximately $13.6 |
million related to two large utility customers, and $4.9 million related to public agency heavy civil projects which require inspector approval prior to billing; |
| · | | a decrease in inventory and other current assets of $17.7 million primarily as a result of reduced inventory levels for projects nearing completion; |
| · | | accounts payable increased by $42.9 million, primarily impacted by the timing of vendor payments and the increased activity for the two Florida pipeline projects in the fourth quarter of 2016; and |
| · | | a decrease of $27.5 million in billings in excess of costs and estimated earnings reflecting the timing of work progression and billings. |
· a decrease in inventory and other current assets of $4.9 million primarily as a result of the 2015 utilization of the prior year tax receivable;
· accounts payable decreased by $5.1 million, primarily impacted by the timing of vendor payments;
· a net decrease of $19.6 million in billings in excess of costs and estimated earnings reflecting the timing of work progression and billings;
· a decrease of $6.7 million in contingent earn-out liabilities, from a payment of $5.0 million made in March 2015 and the reduction of the earn-out liability as a result of the Ram-Fab, Vadnais and Surber operations not meeting targets outlined in their purchase agreements; and
· a net increase of $11.7 million in accrued expenses, mainly due to an increase in workers compensation reserves.
During the twelve months of 2015, we paid $18.7 million for income taxes compared to $57.6 million in the same period of the previous year. The reduction in net cash tax payments in 2015 was the result of a decrease in the Company’s current tax provision and the utilization of significant prepayments from 2014.
Investing activities
| | 2015 | | 2014 | | 2013 | |
| | (Millions) | | (Millions) | | (Millions) | |
Capital expenditures — cash | | $ | 67.1 | | $ | 88.0 | | $ | 87.1 | |
Capital expenditures — financed | | — | | — | | 2.6 | |
Total capital expenditures | | $ | 67.1 | | $ | 88.0 | | $ | 89.7 | |
We purchased property and equipment for $67.1$79.8 million, $88.0$58.0 million and $89.7$67.1 million in the years ended December 31, 2015, 20142017, 2016 and 2013,2015, respectively, principally for our construction activities. We believe the ownership of equipment is generally preferable to renting equipment on a project-by-project basis, as ownership helps to ensure the equipment is available for our workloadsprojects when needed. In addition, ownership has historically resulted in lower overall equipment costs.
We periodically sell equipment, typically to update our fleet. We received proceeds from the sale of used equipment of $8.7 million, $9.6 million and $9.9 million $5.8 millionfor 2017, 2016 and $7.9 million for 2015, 2014 and 2013, respectively.
During 2017, we invested $13.6 million in short-term investments. During 2016 and 2015, we did not purchase any short-term investments, while we invested $33.8 million and $23.1 million in 2014 and 2013, respectively, in short-term investments. We sold short-term investments amounting to $19.4 million, $0.0 million and $31.0 million $21.5 millionin 2017, 2016 and $7.4 million in 2015, 2014 and 2013, respectively. Short-term investments consisted primarily of U.S. Treasury bills with various financial institutions.institutions and marketable equity securities.
WeDuring 2017, we used $66.2 million in cash for acquisitions, primarily related to FGC and Coastal. During 2016, we used $11.0 million in cash for the acquisitions of Mueller and Northern, and in 2015, we used $22.3 million in cash for the Aevenia acquisition, $14.6acquisition.
Financing activities
Financing activities used cash of $22.9 million in 2017. Significant transactions impacting cash for the Vadnais and Surber/Ram-Fab/Williams acquisitions in 2014 and $2.3flows from financing activities included:
| · | | $55.0 million in new and refinanced notes secured by our equipment; |
| · | | $62.1 million in repayment of long-term debt and capital leases; |
| · | | Repurchase of common stock of $5.0 million; |
| · | | Dividend payments of $11.3 million to our stockholders; and |
| · | | $1.1 million in proceeds from the issuance of 65,429 shares of common stock purchased by the participants in the Primoris Long-term Retention Plan. |
Financing activities used cash of $28.5 million in 2016. Significant transactions impacting cash for the FSSI acquisition in 2013.flows from financing activities included:
| · | | $45.0 million in new and refinanced notes secured by our equipment; |
| · | | $58.5 million in repayment of long-term debt and capital leases; |
| · | | Repurchase of common stock of $5.0 million; |
| · | | Dividend payments of $11.4 million to our stockholders; and |
| · | | $1.4 million in proceeds from the issuance of 85,907 shares of common stock purchased by the participants in the Primoris Long-term Retention Plan. |
Financing activities
Financing activities provided cash of $21.8 million in 2015. Significant transactions impacting cash flows from financing activities included:
· $50.3 million in new and refinanced notes secured by our equipment and by a mortgage note on two buildings;
· $25.0 million in new debt under the Company’s Note Agreement;
· $43.9 million in repayment of long-term debt and the repayment of $1.3 million in capital leases;
· $0.03 million in payments of accumulated earnings to the Blythe non-controlling interest holder;
· Dividend payments of $9.8 million to our stockholders during the year ended December 31, 2015; and
· $1.6
| · | | $50.3 million in new and refinanced notes secured by our equipment and by a mortgage note on two buildings; |
| · | | $25.0 million in new debt under our Additional Senior Note Agreement; |
| · | | $45.2 million in repayment of long-term debt and capital leases; |
| · | | Dividend payments of $9.8 million to our stockholders; and |
| · | | $1.6 million in proceeds from the issuance of 96,828 shares of common stock purchased by the participants in the Primoris Long-term Retention Plan. |
Debt Activities
Debt ActivitiesRevolving Credit Facility
Revolving Credit Facility
As of December 31, 2015, the Company had a revolvingOn September 29, 2017, we entered into an amended and restated credit facility, as amended on December 12, 2014agreement (the “Credit Agreement”) with The PrivateBank and Trust Company,CIBC Bank USA, as administrative agent (the “Administrative Agent”) and co-lead arranger, The Bank of the West, as co-lead arranger, and IBERIABANK Corporation, Branch Banking and Trust Company, IBERIABANK, Bank of America, and UMBSimmons Bank N.A. (the “Lenders”)., which increased our borrowing capacity from $125.0 million to $200.0 million. The Credit Agreement isconsists of a $125$200.0 million revolving credit facility whereby the Lenders agreeagreed to make loans on a revolving basis from time to time and to issue letters of credit for up to the $125$200.0 million committed amount. The termination date of the Credit Agreement is December 28, 2017.September 29, 2022.
The principal amount of any loans under the Credit Agreement will bear interest at either: (i) LIBOR plus an applicable margin as specified in the Credit Agreement (based on the Company’sour senior debt to EBITDA ratio as that term is defined in the Credit Agreement), or (ii) the Base Rate (which is the greater of (a) the Federal Funds Rate plus 0.5%0.50% or (b) the prime rate as announced by the Administrative Agent). Quarterly non-useNon-use fees, letter of credit fees and administrative agent fees are payable at rates specified in the Credit Agreement.
The principal amount of any loan drawn under the Credit Agreement may be prepaid in whole or in part at any time, with a minimum prepayment of $5 million, at any time, potentially subject to make-whole provisions.$5.0 million.
The Credit Agreement includes customary restrictive covenants for facilities of this type, as discussed below.
Commercial letters of credit outstanding were $12.1$19.5 million at December 31, 2015 and $4.7 million at December 31, 2014.2017. Other than commercial letters of credit, there were no borrowings under this line ofthe Credit Agreement or the previous credit agreement during the twelve months ended DecemberDecmeber 31, 2015,2017, and available borrowing capacity at December 31, 20152017 was $112.9$180.5 million.
Senior Secured Notes and Shelf Agreement
On December 28, 2012, the Companywe entered into a $50$50.0 million Senior Secured Notes purchase (“Senior Notes”) and a $25$25.0 million private shelf agreement (the “Notes Agreement”) by and among the Company,us, The Prudential Investment Management, Inc. and certain Prudential affiliates (the “Noteholders”). On June 3, 2015, the Notes Agreement was amended to provide for the issuance of additional notes of up to $75$75.0 million over the next three year period ending June 3, 2018 (“Additional Senior Notes”).
The Senior Notes amount was funded on December 28, 2012. The Senior Notes are due December 28, 2022 and bear interest at an annual rate of 3.65%, paid quarterly in arrears. Annual principal payments of $7.1 million are required from December 28, 2016 through December 28, 2021 with a final payment due on December 28, 2022. The principal amount may be prepaid, with a minimum prepayment of $5$5.0 million, at any time, subject to make-whole provisions.
On July 25, 2013, the Companywe drew $25$25.0 million available under the Notes Agreement. The notes are due July 25, 2023 and bear interest at an annual rate of 3.85% paid quarterly in arrears. Seven annual principal payments of $3.6 million are required from July 25, 2017 with a final payment due on July 25, 2023.
On November 9, 2015, the Companywe drew $25$25.0 million available under the Additional Senior Notes Agreement. The notes are due November 9, 2025 and bear interest at an annual rate of 4.6% paid quarterly in arrears. Seven annual principal payments of $3.6 million are required from November 9, 2019 with a final payment due on November 9, 2025.
Loans made under both the Credit Agreement and the Notes Agreement are secured by our assets, including, among others, our cash, inventory, goods, equipment (excluding equipment subject to permitted liens), and accounts receivable. All of our domestic subsidiaries have issued joint and several guaranties in favor of the Lenders and Noteholders for all amounts under the Credit Agreement and Notes Agreement.
Both the Credit Agreement and the Notes Agreement contain various restrictive and financial covenants including, among others, minimum tangible net worth, senior debt/EBITDA ratio and debt service coverage requirements and a minimum balance for unencumbered net book value for fixed assets.requirements. In addition, the agreements include restrictions on investments, change of control provisions and provisions in the event the Company disposeswe dispose more than 20% of itsour total assets.
The Company wasWe were in compliance with the covenants for the Credit Agreement and the Notes Agreement at December 31, 2015.2017.
Canadian Credit Facility
The Company hasWe have a demand credit facility for $8.0 million in Canadian dollars with a Canadian bank for purposes of issuing commercial letters of credit in Canada. The credit facility has an annual renewal and provides for the issuance of commercial letters of credit for a term of up to five years. The facility provides for an annual fee of 1% for any issued and outstanding commercial letters of credit. Letters of credit can be denominated in either Canadian or U.S. dollars. At December 31, 2015 and 2014,2017, letters of credit outstanding totaled $2.2 million and $2.6$0.5 million in Canadian dollars, respectively.dollars. At December 31, 2015,2017, the available borrowing capacity was $5.8$7.5 million in Canadian dollars. The credit facility contains a working capital restrictive covenant for our Canadian subsidiary, OnQuest Canada, ULC. At December 31, 2015,2017, OnQuest Canada, ULC was in compliance with the covenant.
Contractual Obligations
As of December 31, 2015,2017, we had $275.3$259.2 million of outstanding long-term debt and capital lease obligations. Thereobligations, and there were no short-term borrowings.
A summary of contractual obligations as of December 31, 2015 were2017 was as follows:
| | Total | | 1 Year | | 2 - 3 Years | | 4 - 5 Years | | After 5 Years | |
| | (In Millions) | |
Long-term debt and capital lease obligations | | $ | 275.3 | | $ | 55.4 | | $ | 97.1 | | $ | 73.1 | | $ | 49.7 | |
Interest on long-term debt (1) | | 30.6 | | 7.5 | | 11.2 | | 6.5 | | 5.4 | |
Equipment operating leases | | 14.2 | | 6.8 | | 5.3 | | 1.8 | | 0.3 | |
Real property leases | | 11.2 | | 3.4 | | 5.8 | | 2.0 | | — | |
Real property leases—related parties | | 7.6 | | 1.5 | | 2.6 | | 1.7 | | 1.8 | |
| | $ | 338.9 | | $ | 74.6 | | $ | 122.0 | | $ | 85.1 | | $ | 57.2 | |
Letters of credit | | $ | 13.7 | | $ | 8.7 | | $ | 5.0 | | $ | — | | — | |
| | | | | | | | | | | | | | | | |
| | Total | | 1 Year | | 2 - 3 Years | | 4 - 5 Years | | After 5 Years | |
| | (In Millions) | |
Long-term debt and capital lease obligations | | $ | 259.2 | | $ | 65.5 | | $ | 113.0 | | $ | 58.1 | | $ | 22.6 | |
Interest on long-term debt (1) | | | 24.4 | | | 7.1 | | | 9.4 | | | 4.4 | | | 3.5 | |
Pension plan withdrawal liability | | | 4.7 | | | 4.7 | | | — | | | — | | | — | |
Equipment operating leases | | | 31.1 | | | 13.6 | | | 14.9 | | | 2.6 | | | — | |
Contingent consideration obligations | | | 0.7 | | | 0.7 | | | — | | | — | | | — | |
Real property leases | | | 13.2 | | | 5.0 | | | 6.4 | | | 1.8 | | | — | |
| | $ | 333.3 | | $ | 96.6 | | $ | 143.7 | | $ | 66.9 | | $ | 26.1 | |
Letters of credit | | $ | 19.8 | | $ | 19.8 | | $ | — | | $ | — | | $ | — | |
(1)The interest amount represents interest payments for our fixed rate debt assuming that principal payments are made as originally scheduled.
The table does not include potential obligations under multi-employer pension plans in which some of our employees participate. Our multi-employer pension plan contribution rates are generally specified in our collective bargaining agreements, and contributions are made to the plans based on employee payrolls. Our obligations for future periods cannot be determined because we cannot predict the number of employees that we will employ at any given time nor the plans in which they may participate.
We may also be required to make additional contributions to multi-employer pension plans if they become underfunded, and these contributions will be determined based on our union payroll. The Pension Protection Act of 2006 added special funding and operational rules for multi-employer plans that are classified as “endangered,” “seriously endangered” or “critical” status. Plans in these classifications must adopt measures to improve their funded status through a funding improvement or rehabilitation plan, which may require additional contributions from employers. The amounts of additional funds that we may be obligated to contribute cannot be reasonably estimated and is not included in the table above.
In November 2011, members of the Pipe Line Contractors Association (“PLCA”), including ARB, Rockford and Q3C (prior to the Company’s acquisition in 2012), withdrew from the Central States Southeast and Southwest Areas Pension Fund multiemployer pension plan (“Plan”). These withdrawals were made in order to mitigate additional liability in connection with the significantly underfunded Plan. The CompanyWe recorded a withdrawal liability of $7.5 million, which was increased to $7.6 million after the acquisition of Q3C,Q3C. During the first quarter of 2016, we received a final payment schedule. As a result of payments made and based on information provided bythis schedule, the Plan. The Plan asserted that the PLCA members did not affect a proper withdrawal in 2011, and in May 2014, the Plan asserted that the total liability for the Company was $11.8 million. A legal proceeding commenced, and a United States District Court ruled that the withdrawal of the PLCA members in 2011 was not effective. The PLCA appealed this decision, but as required by the Plan, the Company began making monthly payments which have totaled $1.8 million throughrecorded at December 31, 2015. These payments2017 was $4.7 million. We expect to pay the remaining liability balance during 2018 and have been expensed.
On September 2, 2015, the U.S. Court of Appeals for the 7th Circuit reversed the decision of the District Court and ruled that the withdrawal was effective in 2011 as had been asserted by the PLCA. The Company has received a revised withdrawal liability calculation from the Plan at an amount approximately equal to the company’s accrual amount. The Company and other members of the PLCA are engaged in arbitration to further reduce the amount owed. The Company is making payments while awaiting the results of the arbitration process. The Company has no plans to withdraw from any other agreements.
We have also excluded from the table any interest and fees associated with letters of credit and commitment fees under our credit facility since these amounts are unknown and variable.
Related Party Transactions
Prior to March 2017, Primoris has entered into leasing transactions withleased three properties in California from Stockdale Investment Group, Inc. (“SIGI”). Brian Pratt, ourOur Chairman of the Board of Directors, andwho is our largest stockholder, holdsand his family hold a majority interest and is the chairman, president and chief executive officer and a director of SIGI. John M. Perisich,In March 2017, we exercised a right of first refusal and purchased the SIGI properties. The purchase was approved by our Executive Vice President and General Counsel, is secretaryBoard of SIGI.
Primoris leases properties from SIGI atDirectors for $12.8 million. We assumed three mortgage notes totaling $4.2 million with the following locations:
1. Bakersfield, California (lease expires October 2022)
2. Pittsburg, California (lease expires April 2023)
3. San Dimas, California (lease expires March 2019)
remainder paid in cash. During the years ended December 31, 2017, 2016 and 2015, 2014 and 2013, the Companywe paid $0.83$0.2 million, $0.86$0.8 million, and $0.91$0.8 million, respectively, in lease payments to SIGI for the use of these properties.
Primoris leases a propertyproperties from Roger Newnham, a former owner and current managerother individuals that were past sellers of our subsidiary, OnQuest Canada, ULC. The property is located in Calgary, Canada. During the years ended December 31, 2015, 2014 and 2013 Primoris paid $0.25 million, $0.29 million and $0.30 million, respectively, in lease payments. The current term of the lease will expire on December 31, 2017.
Primoris leases a property from Lemmie Rockford, one of the Rockford sellers, which commenced November 1, 2011. The property is located in Toledo, Washington. During the years ended December 31, 2015, 2014 and 2013, Primoris paid $0.09 million each year, in lease payments. The lease will expire in January 2017.
Primoris leases a property from Quality RE Partners, owned by three of the Q3C selling shareholders, of whom twoacquisitions or are current employees, including Jay Osborn, an operations president in the West Construction segment.employees. The property is located in Little
Canada, Minnesota. During the years ended December 31, 2015, 2014amounts leased are not material and 2013, the Company paid $0.27 million, $0.26 million and $0.26 million, respectively, in lease payments to Quality RE Partners. The lease expires in October 2022. In addition, in November 2015, Q3C purchased construction equipment at fair value from Quality RE Partners for $0.6 million. Q3C also leased construction equipment from Mr. Osborn during 2015 for $0.04 million and subsequently purchased the equipment at fair value for $0.145 million.
We believe that the amounts that we pay for the leases approximate terms that we could obtain from independent third parties. In addition, related party transactions, any new leases, extensions of lease terms and changes in lease terms or amounts must beeach arrangement was approved in advance by the independent directors of the Board of Directors Audit Committee.Directors.
Off Balance Sheet Transactions
As is common in our industry, we enter into certain off-balance sheet arrangements in the ordinary course of business that result in risks not directly reflected on our balance sheet. We have no off-balance sheet financing arrangement with variable interest entities. The following representrepresents transactions, obligations or relationships that could be considered material off-balance sheet arrangements.
· Letters of credit issued under our lines of credit. At December 31, 2015, we had letters of credit outstanding of $13.7 million, primarily for international projects in our Energy segment, a large domestic pipeline project and for providing security to
| · | | At December 31, 2017, we had letters of credit outstanding of $19.8 million under the terms of our credit agreements. These letters of credit are used by our insurance carriers. These letters of credit are used by some of our carriers to ensure reimbursement for amounts that they are disbursing on our behalf, such as beneficiaries under our self-funded insurance program. In addition, from time to time, certain customers require us to post a letter of credit to ensure payments to our subcontractors or guarantee performance under our contracts. Letters of credit reduce our borrowing availability under our Credit Agreement and Canadian Credit Facility. If these letters of credit were drawn on by the beneficiary, we would be required to reimburse the issuer of the letter of credit, and we may be required to record a charge to earnings for the reimbursement. We do not believe that it is likely that any material claims will be made under a letter of credit. |
| · | | We enter into non-cancellable operating leases for some of our facilities, equipment and vehicles, including leases with related parties. At December 31, 2017, equipment operating leases had a remaining commitment of $31.1 million and facility rental commitments were $13.2 million. Accounting treatment of operating leases will change in accordance with ASU 2016-02 “Leases (Topic 842)”, effective January 1, 2019. |
· We enter into non-cancellable operating leases for some of our facilities, equipment and vehicles, including leases with related parties. At December 31, 2015, equipment operating leases had a remaining commitment of $14.2 million and facility rental commitments were $18.8 million.
| · | | In the ordinary course of our business, we may be required by our customers to post surety bid or completion bonds in connection with services that we provide. At December 31, 2017, we had $705.7 million in outstanding bonds, based on the remaining contract value to be recognized on bonded jobs. We do not believe that it is likely that we would have to fund material claims under our surety arrangements. |
| · | | Certain of our subsidiaries are parties to collective bargaining agreements with unions. In most instances, these agreements require that we contribute to multi-employer pension and health and welfare plans. For many plans, the contributions are determined annually and required future contributions cannot be determined since contribution rates depend on the total number of union employees and actuarial calculations based on the demographics of all participants. The Employee Retirement Income Security Act of 1974 (ERISA), as amended by the Multi-Employer Pension Amendments Act of 1980, subject employers to potential liabilities in the event of an employer’s complete or partial withdrawal of an underfunded multi-employer pension plan. The Pension Protection Act of 2006 added new funding rules that are classified as “endangered”, “seriously endangered”, or “critical” status. As discussed in Note 13 — “Commitments and Contingencies” of the Notes to Consolidated Financial Statements included in Item 8 of this Form 10-K, we have recognized a withdrawal liability for one plan. We currently do not anticipate withdrawal from any other multi-employer pension plans. Withdrawal liabilities or requirements for increased future contributions could negatively impact our results of operations and liquidity. |
| · | | We enter into employment agreements with certain employees which provide for compensation and benefits under certain circumstances and which may contain a change of control clause. We may be obligated to make payments under the terms of these agreements. |
| · | | From time to time, we make other guarantees, such as guaranteeing the obligations of our subsidiaries. |
· Employment agreements which provide for compensation and benefits under certain circumstances and which may contain a change of control clause. We may be obligated to make payments under the terms of these agreements.
· In the ordinary course of our business, we may be required by our customers to post surety bid or completion bonds in connection with services that we provide. At December 31, 2015, we had $1.48 billion in outstanding bonds. We do not believe that it is likely that we would have to fund material claims under our surety arrangements.
· Certain of our subsidiaries are parties to collective bargaining agreements with unions. In most instances, these agreements require that we contribute to multi-employer pension and health and welfare plans. For many plans, the contributions are determined annually and required future contributions cannot be determined since contribution rates depend on the total number of union employees and actuarial calculations based on the demographics of all participants. The Employee Retirement Income Security Act of 1974 (ERISA), as amended by the Multi-Employer Pension Amendments Act of 1980, subject employers to potential liabilities in the event of an employer’s complete or partial withdrawal of an underfunded multi-employer pension plan. The Pension Protection Act of 2006 added new funding rules that are classified as “endangered”, “seriously endangered”, or “critical” status. As discussed in Note 18 — “Multiemployer Plans” of the Notes to Consolidated Financial Statements included in Item 8 of this Form 10-K, we have recognized a withdrawal liability for one plan. We currently do not anticipate withdrawal from any other multi-employer pension plans. Withdrawal liabilities or requirements for increased future contributions could negatively impact our results of operations and liquidity; and
· Other guarantees that we make from time to time, such as guaranteeing the obligations of our subsidiaries.
Receivable Collection Actions
As do all construction contractors, we negotiate payments with our customers from time to time, and we may encounter delays in receiving payments from our customers. However,We have been engaged in 2014,dispute resolution to collect money we encountered unusual situationsbelieve we are owed for two construction projects completed in 2014. Because of uncertainties associated with two contracts. In one instance, ARB Industrial performed work on a solar plant in the Mojave Desert. Based on our concerns about eventual collectability for the cost-reimbursable contract and in spite of many assurances of payment from the owner, we chose to recognize revenue equal to cost. At the endprojects, including uncertainty of the project,amounts that would be collected, we used a zero profit margin approach to recording revenues during the owner chose not to pay the final amounts due totaling $32.9 million. We are currently engaged in
alternative dispute resolution as required by the contract. The owner has bonded around the liens that we filed, and we believe that action will enhance collectability of amounts due at the end of the dispute process.construction period for both projects.
In addition,For the first project, a divisioncost reimbursable contract, we have recorded a receivable of PES constructed$32.9 million with a large capital pipeline for a customer in Texas. During the early stagesreserve of the project, we became concerned that the customer would not pay us for ancillary items as we believe is required by the contract. As a result of our concerns about eventual collectability, we chose to recognize revenue equal to cost. We have initiated legal action and filed liens to collect ourapproximately $17.9 million receivable.
The Company has specific reserves of approximately $26 million for these two projects included in “billings“Billings in excess of costs and estimated earningsearnings.”. While At this time, we believe that in both instances we are owedcannot predict the full amount of the receivable, there can be no guarantee of the final amount that we receive orwill collect nor the timing of aany collection. The dispute resolution for the receivable initially required international arbitration; however, in the first half of 2016, the two matters.owner sought bankruptcy protection in U.S. bankruptcy court. We have initiated litigation against the sureties who have provided lien and stop payment release bonds for the total amount owed. A trial date has been tentatively set for the second quarter of 2018.
For the second project, we had recorded a receivable of $17.9 million. During the third quarter 2016, we settled the dispute with an exchange of general releases and receipt of $38.0 million in cash. We changed our zero estimate of profit and accounted for the settlement as a change in accounting estimate which resulted in recognizing revenues of approximately $27.5 million and gross profit of approximately $26.7 million in the third quarter of 2016.
2018 Outlook
We believe that we have marketour end markets will continue their growth opportunities in 2016 and well into2018. Our backlog at December 31, 2017 even ifwas $2.6 billion. We anticipate potential changes to the price of oil remains at a depressed level for 2016. We do note that the increasinglypreviously stringent regulatory and environmental requirements for many of our client’sclients’ infrastructure improvementsprojects, which may improve the timing and impactcertainty of the reducedprojects. While fluctuating oil priceprices create uncertainty as to the timing of some of our opportunities.opportunities, we are beginning to see preliminary bidding activity for larger gas, oil and derivatives projects. We believe that Primoris has the financial and operational strength to meet theseeither short-term challenges, and wedelays or the impact of significant increases in work. We continue to be optimistic about both short and longer-term opportunities. Specifically, ourOur view of the outlook for our major end markets currently is as follows:
· Construction of petroleum, natural gas, and natural gas liquid pipelines — We expect that at the current oil price, activities in most if not all of the shale basins will be reduced or eliminated significantly
| · | | Construction of petroleum, natural gas, and natural gas liquid pipelines — While we have recently seen signs of a recovery in the price of oil, we expect that activities in most if not all of the shale basins will remain at reduced levels until a higher oil price is sustained, reducing any upstream work such as gathering lines and petroleum transport pipelines for the near future. If production from the shale formations continues to increase in the near future, the current disconnect between production and processing locations would provide opportunities for our Pipeline segment. We expect that the efforts by gas utilities to move shale gas from the Marcellus region to Florida and other Atlantic states could continue to increase in the near future, the current disconnect between production and processing locations provides opportunities for our underground construction operations serving midstream companies, primarily Rockford, ARB Underground and Primoris Pipeline & Maintenance groups. We expect that the efforts by gas utilities to move shale gas from the Marcellus region to Florida and other Atlantic states will continue and will provide significant opportunity for Rockford over the next 2-3 years. |
· Inspection, maintenance and replacement of gas utility infrastructure —We expect that continuing safety enhancements to the gas utility infrastructure will provide continuing opportunities for our ARB Underground operations, especially in California, as well as Q3C in the Midwest. We also expect that ongoing gas utility repair and maintenance opportunities will continue to grow benefiting our Q3C and PES groups.
| · | | Inspection, maintenance and replacement of gas utility infrastructure —We expect that ongoing safety enhancements to the gas utility infrastructure will provide continuing opportunities for our Utilities segment, especially in California, as well as in the Midwest. We also expect that ongoing gas utility repair and maintenance opportunities will continue to grow. |
· Construction of natural gas-fired power plants and heavy industrial plants — We expect continued construction opportunities for both base-load and peak shaving power plants; however, we are aware that concerns expressed in California that power plants are not “acceptable” for environmental reasons may impact the timing of near term construction opportunities. We believe that based on continuing population growth, the intermittency of renewable power resources and the environmental requirements associated with using ocean water for cooling, power plants will be needed in spite of vocal opposition to “non-green” sources. In addition, the current low price of natural gas could result in the conversion of coal-fired power plants and conversion and expansion at chemical plants and industrial facilities in other parts of the United States. These opportunities would benefit our ARB Industrial group and PES Industrial group.
| · | | Construction of natural gas-fired power plants and heavy industrial plants — We expect continued construction opportunities for both base-load and peak shaving power plants; however, we are aware that concerns expressed in California over gas fired power plants as not “acceptable” for environmental reasons may impact the timing of near term construction opportunities. We believe that based on continuing population growth, the intermittency of renewable power resources and the environmental requirements limiting using ocean water for cooling, power plants will be needed in spite of vocal opposition to “non-green” sources. In addition, the current low price of natural gas could result in the conversion of coal-fired power plants and conversion and expansion at chemical plants and industrial facilities in other parts of the United States. These opportunities would benefit our Power segment. |
· Construction of alternative energy facilities, wind farms, solar energy — We anticipate continued construction opportunities as state governments remain committed to renewable power standards, primarily benefitting ARB Industrial and to a lesser degree our PES group.
| · | | Construction of alternative energy facilities, wind farms, solar energy — We anticipate continued construction opportunities as state governments remain committed to renewable power standards, primarily benefitting our Power segment. |
· Transportation infrastructure construction opportunities — We believe that passing of longer term highway funding by the federal government in 2015 and voter approval of a highway funding proposition 7 in Texas will provide increased opportunity for our heavy civil and highway groups especially in Texas. We expect that opportunities in the Louisiana market may improve but will remain at depressed levels except for specific programs. This market primarily impacts the operations of JCG.
| · | | Transportation infrastructure construction opportunities — We believe that passing of longer term highway funding by the federal government in 2015, results of the 2016 federal election, and voter approval of highway funding proposition 7 in Texas will provide increased opportunity for our heavy civil and highway groups especially in Texas. We expect that opportunities in the Louisiana market may improve but will remain at depressed levels except for specific programs. This market primarily impacts the operations of our Civil segment. |
| · | | Liquefied Natural Gas Facilities—We believe the LNG opportunities for rail, barge, and other transportation needs will continue to grow, although such growth may be at a slow pace. This market will primarily impact our Civil and Power segments. We further believe the existing large scale LNG export facilities currently being planned will require services that will benefit our Pipeline segment for field services. |
· Liquefied Natural Gas Facilities—We believe the LNG on-purpose opportunities for rail, barge, and other transportation needs will continue to grow, albeit at a slow pace. This market will primarily impact our OnQuest and PES groups. We further believe the existing large scale LNG export facilities currently being planned will require services that will benefit our PES and JCG groups for field services.
Please note that our 20162018 outlook and 20162018 financial results could be adversely impacted by many factors including those discussed in Item 1A “Risk Factors” in this Annual Report on Form 10-K. This “2016“2018 Outlook” consists
of forward-looking statements and should be read in conjunction with the cautions about forward looking statements found at the beginning of this Annual Report on Form 10-K.
Backlog
For companies in the construction industry, backlog can be an indicator of future revenue streams. Different companies define and calculate backlog in different manners. We define backlog is defined as a combination of: (1) anticipated revenue from the uncompleted portions of existing contracts for which we have known revenue amounts for fixed pricefixed-price and fixed unit priceunit-price contracts (“Fixed Backlog”), and (2) the estimated revenues on MSA’sMSA work for the next four quarters (“MSA Backlog”). We normally do not include time-and-equipment, time-and-materials and cost reimbursable plus fee contracts in the calculation of backlog, whensince their ultimatefinal revenue amount is difficult to estimate in advance. However, we will include these types of contracts in backlog if the customer specifies an anticipated revenue amount.
The two components of backlog, Fixed Backlog and MSA Backlog, are detailed below.
Fixed Backlog
Fixed Backlog by operatingreporting segment and the changes in Fixed Backlog for the periods ending December 31, 2015, 20142017, 2016 and 20132015 were as follows, in millions:(in millions):
Segment | | Beginning Fixed
Backlog at
December 31,
2014 | | Contract
Additions to
Fixed Backlog | | Revenue
Recognized from
Fixed Backlog | | Ending Fixed
Backlog
at December 31,
2015 | | Revenue
Recognized from
Non-Fixed Backlog
Projects | | Total Revenue
for 12 months
ended December 31,
2015 | |
| | | | | | | | | | | | | |
West | | $ | 237.3 | | $ | 751.2 | | $ | 411.4 | | $ | 577.1 | | $ | 502.2 | | $ | 913.6 | |
East | | 1,009.7 | | 342.7 | | 600.1 | | 752.3 | | 12.1 | | 612.2 | |
Energy | | 301.0 | | 232.0 | | 345.2 | | 187.8 | | 58.4 | | 403.6 | |
Total | | $ | 1,548.0 | | $ | 1,325.9 | | $ | 1,356.7 | | $ | 1,517.2 | | $ | 572.7 | | $ | 1,929.4 | |
| | | | | | | | | | | | | | | | | | | |
| | Beginning Fixed | | | | | | | | Ending Fixed | | Revenue | | Total Revenue | |
| | Backlog at | | Contract | | Revenue | | Backlog | | Recognized from | | for 12 Months | |
| | December 31, | | Additions to | | Recognized from | | at December 31, | | Non-Fixed Backlog | | ended December 31, | |
Reportable Segment | | 2016 | | Fixed Backlog | | Fixed Backlog | | 2017 | | Projects | | 2017 | |
Power | | $ | 469.6 | | $ | 464.7 | | $ | 552.1 | | $ | 382.2 | | $ | 54.0 | | $ | 606.1 | |
Pipeline | | | 1,019.4 | | | 194.1 | | | 435.8 | | | 777.7 | | | 29.8 | | | 465.6 | |
Utilities | | | 31.5 | | | 252.4 | | | 225.2 | | | 58.7 | | | 581.3 | | | 806.5 | |
Civil | | | 605.9 | | | 493.0 | | | 492.9 | | | 606.0 | | | 8.9 | | | 501.8 | |
Total | | $ | 2,126.4 | | $ | 1,404.2 | | $ | 1,706.0 | | $ | 1,824.6 | | $ | 674.0 | | $ | 2,380.0 | |
Segment | | Beginning Fixed
Backlog at
December 31,
2013 | | Contract
Additions to
Fixed Backlog | | Revenue
Recognized from
Fixed Backlog | | Ending Fixed
Backlog
at December 31,
2014 | | Revenue
Recognized from
Non-Fixed Backlog
Projects | | Total Revenue
for 12 months
ended December 31,
2014 | |
| | | | | | | | | | | | | |
West | | $ | 224.6 | | $ | 576.7 | | $ | 564.0 | | $ | 237.3 | | $ | 400.1 | | $ | 964.1 | |
East | | 1,017.7 | | 468.8 | | 476.8 | | 1,009.7 | | 13.1 | | 489.9 | |
Energy | | 240.7 | | 594.7 | | 534.4 | | 301.0 | | 97.8 | | 632.2 | |
Total | | $ | 1,483.0 | | $ | 1,640.2 | | $ | 1,575.2 | | $ | 1,548.0 | | $ | 511.0 | | $ | 2,086.2 | |
Segment | | Beginning Fixed
Backlog at
December 31,
2012 | | Contract
Additions to
Fixed Backlog | | Revenue
Recognized from
Fixed Backlog | | Ending Fixed
Backlog
at December 31,
2013 | | Revenue
Recognized from
Non-Fixed Backlog
Projects | | Total Revenue
for 12 months
ended December 31,
2013 | |
| | | | | | | | | | | | | |
West | | $ | 361.3 | | $ | 622.4 | | $ | 759.1 | | $ | 224.6 | | $ | 392.2 | | $ | 1,151.4 | |
East | | 888.8 | | 531.6 | | 402.7 | | 1,017.7 | | 27.7 | | 430.4 | |
Energy | | 96.1 | | 437.3 | | 292.8 | | 240.7 | | 69.6 | | 362.4 | |
Total | | $ | 1,346.2 | | $ | 1,591.3 | | $ | 1,454.6 | | $ | 1,483.0 | | $ | 489.6 | | $ | 1,944.2 | |
| | | | | | | | | | | | | | | | | | | |
| | Beginning Fixed | | | | | | | | Ending Fixed | | Revenue | | Total Revenue | |
| | Backlog at | | Contract | | Revenue | | Backlog | | Recognized from | | for 12 months | |
| | December 31, | | Additions to | | Recognized from | | at December 31, | | Non-Fixed Backlog | | ended December 31, | |
Reportable Segment | | 2015 | | Fixed Backlog | | Fixed Backlog | | 2016 | | Projects | | 2016 | |
Power | | $ | 549.3 | | $ | 345.1 | | $ | 424.8 | | $ | 469.6 | | $ | 53.8 | | $ | 478.6 | |
Pipeline | | | 225.6 | | | 1,161.9 | | | 368.1 | | | 1,019.4 | | | 33.8 | | | 401.9 | |
Utilities | | | 42.8 | | | 140.7 | | | 152.0 | | | 31.5 | | | 485.2 | | | 637.2 | |
Civil | | | 699.5 | | | 370.9 | | | 464.5 | | | 605.9 | | | 14.7 | | | 479.2 | |
Total | | $ | 1,517.2 | | $ | 2,018.6 | | $ | 1,409.4 | | $ | 2,126.4 | | $ | 587.5 | | $ | 1,996.9 | |
| | | | | | | | | | | | | | | | | | | |
| | Beginning Fixed | | | | | | | | Ending Fixed | | Revenue | | Total Revenue | |
| | Backlog at | | Contract | | Revenue | | Backlog | | Recognized from | | for 12 months | |
| | December 31, | | Additions to | | Recognized from | | at December 31, | | Non-Fixed Backlog | | ended December 31, | |
Reportable Segment | | 2014 | | Fixed Backlog | | Fixed Backlog | | 2015 | | Projects | | 2015 | |
Power | | $ | 393.5 | | $ | 569.1 | | $ | 413.3 | | $ | 549.3 | | $ | 53.0 | | $ | 466.3 | |
Pipeline | | | 161.5 | | | 322.1 | | | 258.0 | | | 225.6 | | | 41.4 | | | 299.4 | |
Utilities | | | 10.7 | | | 152.8 | | | 120.7 | | | 42.8 | | | 466.3 | | | 587.0 | |
Civil | | | 982.2 | | | 282.0 | | | 564.7 | | | 699.5 | | | 12.0 | | | 576.7 | |
Total | | $ | 1,547.9 | | $ | 1,326.0 | | $ | 1,356.7 | | $ | 1,517.2 | | $ | 572.7 | | $ | 1,929.4 | |
Revenues recognized from non-Fixed Backlog projects shown above are generated by MSA projects and projects completed under time-and-equipment, time-and-materials and cost-reimbursable-plus-fee contracts.contracts or are revenue from the sale of construction materials, such as rock or asphalt to outside third parties or sales of water services.
At December 31, 2015,2017, our total Fixed Backlog was $1.52$1.82 billion, representing a decrease of $30.8$301.8 million, or 2.0%14.2%, from $1.55$2.13 billion as of December 31, 2014.2016.
MSA Backlog
The following table outlines historical MSA revenues for the twelve months ending December 31, 2017, 2016 and 2015 2014 and 2013 ($ in(in millions):
Year: | | MSA Revenues | |
2013 | | 462.6 | |
2014 | | 502.0 | |
2015 | | 565.1 | |
| | | | |
Year: | | MSA Revenues | |
2017 | | $ | 665.3 | |
2016 | | | 576.2 | |
2015 | | | 565.1 | |
MSA Backlog includes anticipated MSA revenues for the next twelve months. We determined estimatedestimate MSA revenues based on historical trends, anticipated seasonal impacts and estimates of customer demand based on communications withinformation from our customers.
Total Backlog
The following table shows the makeup ofour estimated MSA Backlog at December 31, 2017, 2016 and 2015 by reportable segment (in millions):
| | | | | | | | | |
| | MSA Backlog | | MSA Backlog | | MSA Backlog |
| | at December 31, | | at December 31, | | at December 31, |
Reportable Segment: | | 2017 | | 2016 | | 2015 |
Power | | $ | 40.8 | | $ | 42.3 | | $ | 42.7 |
Pipeline | | | 35.3 | | | 33.2 | | | 56.0 |
Utilities | | | 680.5 | | | 575.0 | | | 468.0 |
Civil | | | 18.2 | | | 21.0 | | | 4.0 |
Total | | $ | 774.8 | | $ | 671.5 | | $ | 570.7 |
Total Backlog
The following table shows total backlog both Fixed(Fixed Backlog andplus MSA Backlog,Backlog), by operatingreportable segment at December 31, 2017, 2016 and 2015 (in millions).:
Segment: | | Fixed Backlog at
December 31,
2015 | | MSA Backlog
at December 31,
2015 | | Total Backlog
at December 31,
2015 | |
| | | | | | | |
West | | $ | 577.1 | | $ | 500.2 | | $ | 1,077.3 | |
East | | 752.3 | | 4.0 | | 756.3 | |
Energy | | 187.8 | | 66.5 | | 254.3 | |
Total | | $ | 1,517.2 | | $ | 570.7 | | $ | 2,087.9 | |
| | | | | | | | | | | |
Reportable Segment: | | | 2017 | | 2016 | | 2015 | |
Power | | | $ | 423.0 | | $ | 511.9 | | $ | 592.0 | |
Pipeline | | | | 813.0 | | | 1,052.6 | | | 281.6 | |
Utilities | | | | 739.2 | | | 606.5 | | | 510.8 | |
Civil | | | | 624.2 | | | 626.9 | | | 703.5 | |
Total | | | $ | 2,599.4 | | $ | 2,797.9 | | $ | 2,087.9 | |
We expect that during 2016,2018, we will recognize as revenue approximately 86%72% of the West segment total backlog at December 31, 2015, approximately 52%2017, comprised of backlog of approximately: 86% of the East segment backlog and approximately 99%Power segment; 53% of the Energy segment backlog.Pipeline segment; 100% of the Utilities segment; and 55% of the Civil segment.
Backlog should not be considered a comprehensive indicator of future revenues, as a percentage of our revenues are derived from projects that are not part of a backlog calculation. The backlog estimates include amounts from estimated MSA revenues, but our customers are not contractually obligated to purchase an amount of services from us under the MSAs. Any of our contracts, MSA, fixed pricefixed-price or fixed unit price,unit-price, may be terminated by our customers on relatively short notice. In the event of a project cancellation, we may be reimbursed for certain costs, but typically we have no contractual right to the total revenues reflected in backlog. Projects may remain in backlog for extended periods of time as a result of customer delays, regulatory requirements or project specific issues. Future revenues from projects completed under time-and-equipment, time-and-materials and cost-reimbursable-plus-fee contracts may not be included in our estimated backlog amount.
Effects of Inflation and Changing Prices
Our operations are affected by increases in prices, whether caused by inflation or other economic factors. We attempt to recover anticipated increases in the cost of labor, equipment, fuel and materials through price escalation provisions in certain major contracts or by considering the estimated effect of such increases when bidding or pricing new work or by entering into back-to-back contracts with suppliers and subcontractors.
ITEM 7A.QUANTITATIVE AND QUALITATIVE DISCLOSURES ABOUT MARKET RISK
In the ordinary course of business, we are exposed to risks related to market conditions. These risks primarily include fluctuations in foreign currency exchange rates, interest rates and commodity prices. We may seek to manage these risks through the use of financial derivative instruments. These instruments may include foreign currency exchange contracts and interest rate swaps.
We do not execute transactions or use financial derivative instruments for trading or speculative purposes. We generally enter into transactions with counter parties that are generally financial institutions in a matter to limit significant exposure with any one party.
At December 31, 2017, we had no derivative financial instruments.
The carrying amounts for cash and cash equivalents, accounts receivable, short term investments, short-term debt, accounts payable and accrued liabilities shown in the consolidated balance sheetsConsolidated Balance Sheets approximate fair value at December 31, 2015 and 2014,2017, due to the generally short maturities of these items. At December 31, 2015, we did not hold any short term investments. At December 31, 2014, we held short term investments which were primarily in four to six month U.S. Treasury bills with various financial institutions that are backed by the federal government. We typically hold our investments to maturity.
At December 31, 2015,2017, all of our long-term debt was subject to fixed interest rates.
At December 31, 2015 and 2014, we had no derivative financial instruments.
ITEM 8.FINANCIAL STATEMENTS AND SUPPLEMENTARY DATA
Our financial statements, supplementary financial data and financial statement schedules are included in a separate section at the end of this Annual Report on Form 10-K. The financial statements, supplementary data and schedules are listed in the index on page F-1 of this Annual Report on Form 10-K and are incorporated herein by reference.
ITEM 9.CHANGES IN AND DISAGREEMENTS WITH ACCOUNTANTS ON ACCOUNTING AND FINANCIAL DISCLOSURE
None.
ITEM 9A. CONTROLS AND PROCEDURES
Evaluation of Disclosure Controls and Procedures
We maintain disclosure controls and procedures that are designed to ensure that information required to be disclosed in our reports under the Exchange Act is recorded, processed, summarized and reported within the time periods specified in the SEC’s rules and forms, and that such information is accumulated and communicated to management, including our Chief Executive Officer (“CEO”) and Chief Financial Officer (“CFO”), as appropriate, to allow for timely decisions regarding required disclosure. In designing and evaluating our disclosure controls and procedures, our management recognizes that any system of controls and procedures, no matter how well designed and operated, can only provide only reasonable assurance of achieving the desired control objectives, as ours are designed to do, and our management necessarily is required to apply its judgment in evaluating the cost-benefit relationship of possible controls and procedures. The Company’sOur disclosure controls and procedures are designed to provide reasonable assurance of achieving their stated objectives.
In connection with the preparation of this Annual Report on Form 10-K, as of December 31, 2015,2017, an evaluation was performed under the supervision and with the participation of our management, including our CEO and CFO, of the effectiveness of the design and operation of our disclosure controls and procedures (as defined in Rule 13a-15(e) and 15d-15(e) under the Exchange Act). Based on that evaluation, as of the end of the period covered by this Annual Report on Form 10-K, our CEO and CFO concluded that our disclosure controls and procedures were effective at the reasonable assurance level to ensure that the information required to be disclosed by us in our reports that we file or submit under the Exchange Act is recorded, processed, summarized and reported within the time periods specified in the SEC’s rules and forms, and to ensure that the information required to be disclosed by us in reports that we file or submit under the Exchange Act is accumulated and communicated to our management, including our CEO and CFO, as appropriate, to allow timely decisions regarding required disclosures.
Management’s Annual Report on Internal Control Over Financial Reporting
Our management is responsible for establishing and maintaining adequate internal control over financial reporting as defined in Rules 13a-15(f) and 15d-15(f) under the Exchange Act. Our internal control over financial reporting is designed to provide reasonable assurance regarding the reliability of financial reporting and the preparation of financial statements for external purposes in accordance with generally accepted accounting principles. Our internal control over financial reporting includes those policies and procedures that:
| (i) | | (i)pertain to the maintenance of records that, in reasonable detail, accurately and fairly reflect the transactions and dispositions of our assets;
|
| (ii) | | (ii)provide reasonable assurance that transactions are recorded as necessary to permit preparation of financial statements in accordance with generally accepted accounting principles, and that our receipts and expenditures are being made only in accordance with authorizations of our management and directors; and
|
| (iii) | | (iii)provide reasonable assurance regarding prevention or timely detection of unauthorized acquisition, use or disposition of our assets that could have a material effect on our financial statements.
|
Because of its inherent limitations, internal control over financial reporting may not prevent or detect misstatements. Also, projections of any evaluation of effectiveness to future periods are subject to the risk that controls may become inadequate because of changes in conditions, or that the degree of compliance with the policies or procedures may deteriorate.
Management assessed
Under the supervision and evaluatedwith the participation of our management, including our CEO and CFO, our management conducted an evaluation of the effectiveness of our internal control over financial reporting as of December 31, 2015. In making2017. Management based this assessment management usedon the criteria set forthframework in “Internal Control–Integrated Framework (2013)” issued by the Committee of Sponsoring Organizations of the Treadway Commission in Internal Control—Integrated Framework (1992).Commission. Based on the results of management’s assessment andthat evaluation, our CEO and CFO believeconcluded that our internal control over financial reporting iswas effective as of December 31, 2015.2017. Management reviewed the results of its assessment with the Audit Committee of our Board of Directors.
As discussed in the Risk Factor titled “We may not be successful in continuing to meet the internal control requirements of the Sarbanes-Oxley Act of 2002.”,the Company expects that it will be able to adopt the standards of COSO 2013 in 2016.
As discussed in Note 4 — “Business Combinations”“Business Combinations” of the Notes to Consolidated Financial Statements included in Item 8 of this Form 10-K, we acquired AeveniaFlorida Gas Contractors on February 28, 2015.May 26, 2017 and Coastal Field Services on June 16, 2017.
We have excluded AeveniaFGC and Coastal from our assessment of the effectiveness of our internal control over financial reporting as of December 31, 2015.2017. The Aeveniacombined Florida Gas Contractors and Coastal Field Services financial statements in aggregate constitute approximately 1.3%2.0% of total assets (excluding approximately $8.6$43.5 million of goodwill and intangible assets, which were integrated into the Company’sour systems and control environment), and approximately 1.2%1.4% of total revenues and approximately (1.7%) of pre-tax income (excluding approximately $0.4 million of amortization of intangible assets, which was integrated into the Company’s systems and control environment) of the consolidated financial statement amounts as of and for the year ended December 31, 2015.2017.
Independent Registered Public Accounting Firm Report
TheMoss Adams LLP, the independent registered public accounting firm that audited our consolidated financial statements containedincluded in this annual reportAnnual Report on Form 10-K, has issued a report on our internal control over financial reporting as of December 31, 2017. The report, which expresses an audit reportunqualified opinion on the effectiveness of our internal control over financial reporting.reporting as of December 31, 2017, is included in “Item 8. Financial Statements and Supplemental Data” under the heading “Report of Independent Registered Public Accounting Firm.”
ITEM 9B.OTHER INFORMATION
None.
PART III
ITEM 10.DIRECTORS, EXECUTIVE OFFICERS AND CORPORATE GOVERNANCE
Directors
Information relating to the officers and directors of our company, other corporate governance matters and other information required under this Item 10 is set forth in our Proxy Statement for our 20162018 Annual Meeting of Stockholders (“Proxy Statement”) which will be filed with the SEC no later than April 9, 2016, and the information is incorporated herein by reference. The following is a listing of certain information regarding our executive officers.
Executive Officers
David King. Mr. King has served as our President and Chief Executive Officer since August 2015 and has served as one of our Directors since May 2015. Mr. King directs strategy, establishes goals and oversees our operation.operations. Prior to that, Mr. King was our Executive Vice President, Chief Operating Officer since March 2014. Prior to joining Primoris, Mr. King spent several years at CB&I, most recently as President of Lummus Engineered Products. From 2010 to 2013 he was President of CB&I Project Engineering & Construction based in The Hague, Netherlands responsible for P&L operations worldwide. From 2009 to 2010 he was Group Vice President for Downstream Operations for CB&I Lummus located in The Woodlands, Texas. Mr. King also managed and helped establish the Global Services Group for CB&I in 2008 to 2009. He has extensive EPF&C industry experience in energy-related projects, LNG, offshore, pipelines, refining, petrochemicals, gas processing, oil sands, synthesis gas and gas-to-liquids. Mr. King received his bachelor’s degree in Mechanical Engineering from Texas Tech University, an MBA from the University of Texas, Tyler, and an Advanced Executive Management Degree from Insead University in Fontainebleau, France. Mr. King is 6365 years old.
Peter J. Moerbeek. Mr. Moerbeek was named as our Executive Vice President, Chief Financial Officer effective February 6, 2009. He has served as one of our Directors since July 2008. Previously, he served as Chief Executive Officer of a private-equity funded company engaged in the acquisition and operation of water and wastewater utilities. As a founder of the company from June 2006 to February 2007, he was involved in raising equity capital for the company. From August 1995 to June 2006, Mr. Moerbeek held several positions with publicly traded Southwest Water Company, including a Director from 2001 to 2006; President and Chief Operating Officer from 2004 to 2006; President of the Services Group from 1997 to 2006; Secretary from 1995 to 2004; and Chief Financial Officer from 1995 to 2002. From 1989 to 2005, Mr. Moerbeek was the Chief Financial and Operations Officer for publicly-traded Pico Products, Inc. Mr. Moerbeek received a B.S. in Electrical Engineering in 1969 and a MBA in 1971 from the University of Washington. Mr. Moerbeek is 6870 years old.
Thomas E. McCormick. Mr. McCormick was named as our Chief Operating Officer, effective April 7, 2016. He has extensive engineering & construction industry experience in projects for many energy-related end markets, including pipelines, refining, petrochemicals, gas processing, LNG, oil sands and industrial gases. Since February 2007, he has held a variety of executive positions with CB&I. Such positions included President for Oil & Gas, Senior Vice President – Gas Processing & Oil Sands, Global Vice President –Downstream Operations, and Vice President Operations. Prior to 2007, Mr. McCormick worked for more than 17 years at BE&K Engineering on a variety of heavy civil projects. Mr. McCormick has a Bachelor of Science degree in Civil Engineering from Florida State University and an Advanced Executive Management Degree from Insead University in Fontainebleau, France. Mr. McCormick is 55 years old.
John M. Perisich. Mr. Perisich has served as our Executive Vice President and General Counsel effective May 3, 2013. He previously served as our Senior Vice President and General Counsel from July 2008. Prior to that, he served as Vice President and General Counsel of Primoris Corporation beginning in February 2006, and priorprevious to that was Vice President and General Counsel of Primoris.Primoris Corporation and its predecessor, ARB, Inc. Mr. Perisich joined ARB in 1995. Prior to joining ARB, Mr. Perisich practiced law at Klein, Wegis, a full service law firm based in Bakersfield, California. He received a B.A. degree from UCLA in 1987, and a J.D. from the University of Santa Clara in 1991. Mr. Perisich is 5153 years old.
ITEM 11.EXECUTIVE11.EXECUTIVE COMPENSATION
Information required under this Item 11 is set forth in our Proxy Statement and is incorporated herein by reference, except for the information set forth under the caption, “Compensation Committee Report” of our Proxy Statement, which specifically is not incorporated herein by reference.
ITEM 12.SECURITY12.SECURITY OWNERSHIP OF CERTAIN BENEFICIAL OWNERS AND MANAGEMENT AND RELATED STOCKHOLDER MATTERS
Information required under this Item 12 is set forth in our Proxy Statement and is incorporated herein by reference.
ITEM 13.CERTAIN RELATIONSHIPS AND RELATED TRANSACTIONS, AND DIRECTOR INDEPENDENCE
The information required under this Item 13 is set forth in our Proxy Statement and is incorporated herein by reference.
ITEM 14.PRINCIPAL ACCOUNTING FEES AND SERVICES
Information regarding principal accounting fees and services and other information required under this Item 14 is set forth in our Proxy Statement and is incorporated herein by reference.
PART IV
ITEM 15. EXHIBITS, FINANCIAL STATEMENT SCHEDULES
(A)We have filed the following documents as part of this Report:
| 1. | | Consolidated Balance Sheets of Primoris Services Corporation and subsidiaries as of December 31, 2017 and 2016 and the related Consolidated Statements of Income, Stockholders’ Equity and Cash Flows for the years ended December 31, 2017, 2016 and 2015. |
| 2. | | Report of Moss Adams LLP, independent registered public accounting firm, related to the consolidated financial statements in part (A)(1) above. |
| 3. | | Notes to the consolidated financial statements in part (A)(1) above. |
| 4. | | List of exhibits required by Item 601 of Regulation S-K. See part (B) below. |
1. Consolidated Balance Sheets of Primoris Services Corporation and subsidiaries as of December 31, 2015 and 2014 and the related Consolidated Statements of Income, Stockholders’ Equity and Cash Flows for the years ended December 31, 2015, 2014 and 2013.
2. Report of Moss Adams LLP, independent registered public accounting firm, related to the consolidated financial statements in part (A)(1) above.
3. Notes to the consolidated financial statements in part (A)(1) above.
4. List of exhibits required by Item 601 of Regulation S-K. See part (B) below.
(B)The following is a complete list of exhibits filed as part of this Report, some of which are incorporated herein by reference from certain other of our reports, registration statements and other filings with the SEC, as referenced below:
Exhibit No.
|
|
|
Exhibit No. | | Description |
| | |
Exhibit 2.1 | | Agreement and Plan of Merger, dated February 19, 2008, by and among Rhapsody Acquisition Corp., Primoris Corporation and certain stockholders of Primoris Corporation (1)(incorporated by reference to Exhibit 10.1 to our Current Report on Form 8-K, as filed with the SEC on February 20, 2008) |
| | |
Exhibit 2.2 | | First Amendment to Agreement and Plan of Merger, dated May 15, 2008, by and among Rhapsody Acquisition Corp., Primoris Corporation and certain stockholders of Primoris Corporation (2)(incorporated by reference to Exhibit 2.2 to our Registration Statement on Form S-4/A (Amendment No. 3) (File No. 333-150343), as filed with the SEC on July 1, 2008) |
| | |
Exhibit 2.3 | | Membership Interest Purchase Agreement, dated July 1, 2010, by and between Primoris Services Corporation, Kealine Holdings LLC and WesPac Energy LLC (3)(incorporated by reference to Exhibit 2.1 to our Current Report on Form 8-K, as filed with the SEC on July 8, 2010) |
| | |
Exhibit 2.4 | | Agreement and Plan of Merger, dated November 8, 2010, by and among Primoris Services Corporation, a Delaware corporation, Primoris Merger Sub, Inc., a Delaware corporation and a wholly-owned subsidiary of Primoris Services Corporation, Rockford Holdings Corporation, a privately-held Delaware corporation, all of the stockholders of Rockford Holdings Corporation and Christopher S. Wallace as representative of the stockholders of Rockford Holdings Corporation (4)(incorporated by reference to Exhibit 2.1 to our Current Report on Form 8-K, as filed with the SEC on November 12, 2010) |
| | |
| | |
Exhibit No. | | Description |
Exhibit 2.5 | | Stock Purchase Agreement, dated November 8, 2012, by and among Primoris Services Corporation, a Delaware corporation, Q3 Contracting Inc., a privately-held Minnesota corporation, all of the shareholders of Q3 Contracting Inc. and Jay P. Osborn as representative of the shareholders of Q3 Contracting Inc. (5)(incorporated by reference to Exhibit 2.1 to our Current Report on Form 8-K, as filed with the SEC on November 15, 2012) |
| | |
Exhibit 3.1 | | Fourth Amended and Restated Certificate of Incorporation of Primoris Services Corporation, dated May 21, 2009 (6)(incorporated by reference to Exhibit 3.1 to our Quarterly Report on Form 10-Q, as filed with the SEC on August 12, 2009) |
| | |
Exhibit 3.2 | | Amended and Restated Bylaws of Primoris Services Corporation (7)(incorporated by reference to Exhibit 3.2 to our Current Report on Form 8-K, as filed with the SEC on August 6, 2008) |
| | |
Exhibit 3.3 | | Certificate of Designations, Powers, Preferences and Rights of the Series A Non-Voting Contingent Convertible Preferred Stock of Primoris Services Corporation, dated December 14, 2009 (8)(incorporated by reference to Exhibit 3.1 to our Current Report on Form 8-K, as filed with the SEC on December 17, 2009) |
| | |
Exhibit 4.1 | | Specimen Common Stock Certificate (9)(incorporated by reference to Exhibit 4.2 to our Registration Statement on Form S-1 (File No. 333-134694), as filed with the SEC on June 2, 2006) |
| | |
Exhibit 10.1 | | 2008 Long-Term Equity Incentive Plan (incorporated by reference to Annex C to our Registration Statement on Form S-4/A (Amendment No. 4) (File No. 333-150343), as filed with the SEC on July 9, 2008) (#)(10) |
| | |
Exhibit 10.2 | | 2013 Equity Incentive Plan (incorporated by reference to Appendix A to our Definitive Proxy Statement on Schedule 14A filed with the SEC on April 9, 2013) (#)(11) |
| | |
Exhibit 10.3 | | LoanAmended and SecurityRestated Credit Agreement, dated October 28, 2009,September 29, 2017, by and betweenamong Primoris Services Corporation and The PrivateBankCIBC Bank USA, Bank of the West, Branch Banking and Trust Company, (12)IBERIABANK, Bank of America, and Simmons Bank. (incorporated by reference to Exhibit 10.1 to our Quarterly Report on Form 10-Q, as filed with the SEC on November 6, 2017)
|
| | |
Exhibit 10.4 | | First Amendment to Loan and SecurityCredit Agreement, dated January 14, 2010,December 28, 2012, by and among Primoris Services Corporation and The PrivateBank and Trust Company, (13)The Bank of the West and IBERIABANK Corporation (incorporated by reference to Exhibit 10.1 to our Current Report on Form 8-K, as filed with the SEC on January 7, 2013)
|
| | |
Exhibit 10.5 | | SecondWaiver and Amendment to Loan and Security Agreement, dated Septemberas of April 30, 2010,2013, by and among Primoris Services Corporation and The PrivateBank and Trust Company (13)and other financial institutions party to the Credit Agreement. (incorporated by reference to Exhibit 10.2 to our Current Report on Form 8-K, as filed with the SEC on December 18, 2014)
|
| | |
| | |
Exhibit No. | | Description |
Exhibit 10.6 | | Master LoanSecond Amendment and SecurityWaiver Agreement, dated Juneas of August 25, 2010,2014, by and between Stellaris, LLCamong Primoris Services Corporation and Banc of America Leasing & Capital, LLC (14)The PrivateBank and Trust Company and other financial institutions party to the Credit Agreement. (incorporated by reference to Exhibit 10.3 to our Current Report on Form 8-K, as filed with the SEC on December 18, 2014)
|
| | |
Exhibit 10.7 | | Master Loan and SecurityThird Amendment to Credit Agreement, dated August 31, 2009,as of December 12, 2014, by and between Stellaris, LLCamong Primoris Services Corporation and Fifth ThirdThe PrivateBank and Trust Company, The Bank (14)of the West, IBERIABANK Corporation, Branch Banking and Trust Company and UMB Bank, N.A. (incorporated by reference to Exhibit 10.1 to our Current Report on Form 8-K, as filed with the SEC on December 18, 2014)
|
| | |
Exhibit 10.8 | | Purchase Trading Plan Agreement, dated September 7, 2010, by and between Primoris Services Corporation
|
Exhibit No.
|
| Description
|
| | |
| | and CJS Securities, Inc. (15)
|
| | |
Exhibit 10.9
| | Loan Agreement, dated December 29, 2010, by and between Stellaris, LLC and RBS Asset Finance, Inc. (16)
|
| | |
Exhibit 10.10
| | Note, dated December 29, 2010, by and between Stellaris, LLC and RBS Asset Finance, Inc. (16)
|
| | |
Exhibit 10.11
| | Collateral Schedule No. 1, dated December 29, 2010, by and between Stellaris, LLC and RBS Asset Finance, Inc. (16)
|
| | |
Exhibit 10.12
| | Guaranty, dated December 29, 2010, by and between Primoris Services Corporation and RBS Asset Finance, Inc. (16)
|
| | |
Exhibit 10.13
| | Third Amendment to Loan and Security Agreement, dated March 3, 2011, by and among Primoris Services Corporation and The PrivateBank and Trust Company (17)
|
| | |
Exhibit 10.14
| | Fourth Amendment to Loan and Security Agreement, dated October 20, 2011, by and among Primoris Services Corporation and The PrivateBank and Trust Company (18)
|
| | |
Exhibit 10.15
| | Credit Agreement, dated September 23, 2011, by and among Primoris Services Corporation and Bank of the West (19)
|
| | |
Exhibit 10.16
| | Fifth Amendment to Loan and Security Agreement, dated November 28, 2011, by and among Primoris Services Corporation and The PrivateBank and Trust Company (19)
|
| | |
Exhibit 10.17
| | Loan and Security Agreement, dated November 30, 2011, by and among Stellaris LLC, James Construction Group LLC and JPMorgan Chase Bank, N.A. (19)
|
| | |
Exhibit 10.18
| | Business Purpose Promissory Note, dated November 30, 2011, by and among Stellaris LLC, James Construction Group LLC and JPMorgan Chase Bank, N.A. (19)
|
| | |
Exhibit 10.19
| | Schedule A-1 Equipment Collateral, dated November 30, 2011, by and between Stellaris LLC, James Construction Group LLC and JPMorgan Chase Bank, N.A. (19)
|
| | |
Exhibit 10.20
| | Amendment No. 3 to the Master Loan and Security Agreement Loan and Security Agreement, dated November 30, 2011, by and among James Construction Group LLC, Stellaris LLC, ARB Inc. and Fifth Third Bank (19)
|
| | |
Exhibit 10.21
| | Promissory Note, dated November 30, 2011, by and among James Construction Group LLC, Stellaris LLC, ARB Inc. and Fifth Third Bank (19)
|
| | |
Exhibit 10.22
| | Master Loan and Security Agreement, dated December 21, 2011, by and among ARB, Inc. and Banc of America Leasing & Capital, LLC (20)
|
| | |
Exhibit 10.23
| | Equipment Security Note, dated December 21, 2011, by and among ARB, Inc., Stellaris LLC, Rockford Corporation and Banc of America Leasing & Capital, LLC (20)
|
| | |
Exhibit 10.24
| | Addendum to Master Loan and Security Agreement, dated December 21, 2011, by and among ARB, Inc., Stellaris LLC, Rockford Corporation and Banc of America Leasing & Capital, LLC (20)
|
| | |
Exhibit 10.25
| | Guaranty, dated December 21, 2011, by and among Primoris Services Corporation and Banc of America Leasing & Capital, LLC (20)
|
| | |
Exhibit 10.26
| | General Indemnity Agreement, dated January 24, 2012, by and among Primoris Services Corporation, ARB, Inc. ARB Structures, Inc., OnQuest, Inc., OnQuest Heaters, Inc. Born Heaters Canada ULC, Cardinal Contractors, Inc., Cardinal Southeast, Inc., Stellaris, LLC, GML Coatings, LLC, James Construction Group, LLC, Juniper Rock Corporation, Rockford Corporation; Alaska Continental Pipeline, Inc., All Day Electric Company, Inc. Primoris Renewables, LLC, Rockford Pipelines Canada, Inc. and Chubb Group of Insurance Companies (21) |
(incorporated by reference to Exhibit No. |
| Description10.51 to our Annual Report on Form 10-K, as filed with the SEC on March 5, 2012)
|
| | |
Exhibit 10.2710.9 | | Fifth Amendment to Loan and Security Agreement, dated April 4, 2012, by and among Primoris Services Corporation and The PrivateBank and Trust Company (22)
|
| | |
Exhibit 10.28
| | Equipment Security Note, dated June 20, 2012, by and among Stellaris, LLC, James Construction Group, LLC and Banc of America Leasing & Capital, LLC (23)
|
| | |
Exhibit 10.29
| | Amendment Number 1 to Master Loan and Security Agreement, dated June 20, 2012, by and among Stellaris, LLC, James Construction Group, LLC and Banc of America Leasing & Capital, LLC (23)
|
| | |
Exhibit 10.30
| | Seventh Amendment to Loan and Security Agreement, dated July 18, 2012, by and among Primoris Services Corporation and The PrivateBank and Trust Company (24)
|
| | |
Exhibit 10.31
| | Eighth Amendment to Loan and Security Agreement, dated October 29, 2012, by and among Primoris Services Corporation and The PrivateBank and Trust Company (25)
|
| | |
Exhibit 10.32
| | Master Loan and Security Agreement, dated November 1, 2012, by and between Stellaris, LLC and Banc of America Leasing & Capital, LLC (26)
|
| | |
Exhibit 10.33
| | Amendment to Master Loan and Security Agreement, dated November 7, 2012, by and among Stellaris, LLC, James Construction Group, LLC, Miller Springs Materials, LLC, Primoris Energy Services Corporation and Banc of America Leasing & Capital, LLC (26)
|
| | |
Exhibit 10.34
| | Equipment Security Note, dated November 1, 2012, by and among Stellaris, LLC, James Construction Group, LLC, Miller Springs Materials, LLC, Primoris Energy Services Corporation and Banc of America Leasing & Capital, LLC (26)
|
| | |
Exhibit 10.35
| | Loan Agreement, dated December 13, 2012, by and between Stellaris, LLC and Q3 Contracting, Inc. and RBS Asset Finance, Inc. (27)
|
| | |
Exhibit 10.36
| | Note, dated December 13, 2012, by and among Stellaris, LLC and Q3 Contracting, Inc. and RBS Asset Finance, Inc. (27)
|
| | |
Exhibit 10.37
| | Guaranty, dated December 13, 2012, by and among Primoris Services Corporation and RBS Asset Finance, Inc. (27)
|
| | |
Exhibit 10.38
| | Credit Agreement, dated December 28, 2012, by and among Primoris Services Corporation and The PrivateBank and Trust Company, The Bank of the West and IBERIABANK Corporation (28)
|
| | |
Exhibit 10.39
| | Note Purchase and Private Shelf Agreement, dated December 28, 2012, by and among Primoris Services Corporation and Prudential Investment Management, Inc. and certain Prudential affiliates (28)(incorporated by reference to Exhibit 10.2 to our Current Report on Form 8-K, as filed with the SEC on January 7, 2013) |
| | |
Exhibit 10.4010.10 | | Promissory Note, dated June 11,2013, by and among Stellaris, LLC and Fifth Third Bank pursuant to the Master Loan and Security Agreement dated August 31, 2009 (30)
|
| | |
Exhibit 10.41
| | Master Loan and Security Agreement, dated June 13, 2013, by and among Stellaris, LLC, James Construction Group, LLC, Rockford Corporation and Wells Fargo Equipment Finance, Inc. and Loan Schedules, dated June 13, 2013 (30)
|
| | |
Exhibit 10.42
| | Confirmation of Acceptance Agreement, dated June 13, 2013, by and among Primoris Services Corporation and Prudential Investment Management, Inc. and certain Prudential affiliates pursuant to the Note Purchase and Private Shelf Agreement, dated December 28, 2012 and five 3.85% Senior Secured Notes, Series B, due July 25, 2023 (30)(incorporated by reference to Exhibit 10.3 to our Quarterly Report on Form 10-Q, as filed with the SEC on August 7, 2013) |
| | |
Exhibit 10.4310.11 | | LoanThird Letter Amendment to Shelf Agreement, dated September 17, 2013,as of June 3, 2015, by and among Stellaris, LLC, James Construction Group LLC and RockfordPrimoris Services Corporation and RBS Asset Finance,Prudential Investment Management, Inc. (31)and each other Holder (as defined in the Shelf Agreement). (incorporated by reference to Exhibit 10.1 to our Current Report on Form 8-K, as filed with the SEC on June 9, 2015)
|
| | |
Exhibit 10.4410.12 | | Loan and Security Agreement, dated September 20, 2013, by and between PNC Equipment Finance, LLC and Stellaris LLC and Q3 Contracting, Inc. (31)
|
Exhibit No.
|
| Description
|
| | |
Exhibit 10.45
| | Contribution Agreement, dated as of September 30, 2013, by and among WesPac Energy LLC, Kealine Holdings LLC, Primoris Services Corporation and WesPac Midstream LLC and Highstar WesPac Main Interco LLC and Highstar WesPac Prism/IV-A Interco LLC (31)(incorporated by reference to Exhibit 10.3 to our Quarterly Report on Form 10-Q, as filed with the SEC on November 5, 2013) |
| | |
Exhibit 10.4610.13 | | Master Loan and Security Agreement, dated December 6, 2013 by and between Stellaris, LLC and Banc of America Leasing & Capital, LLC (32)
|
| | |
Exhibit 10.47
| | Equipment Security Note, dated as of December 6, 2013, by and between Stellaris, LLC, ARB, Inc. James Construction Group, LLC, and Rockford Corporation and Banc of America Leasing & Capital, LLC (32)
|
| | |
Exhibit 10.48
| | Master Security Agreement, dated September 18, 2014, by and among Primoris Services Corporation, Rockford Corporation and Key Equipment Finance, a division of KeyBank National Association. (33)
|
| | |
Exhibit 10.49
| | Promissory Note and Collateral Schedule No. 1, dated September 18, 2014, by and between Primoris Energy Services Corporation, Rockford Corporation and Key Equipment Finance, a division of KeyBank National Association. (33)
|
| | |
Exhibit 10.50
| | Master Loan and Security Agreement, dated September 19, 2014, by and among Fifth Third Bank and Primoris Services Corporation, James Construction Group, LLC and Q3 Contracting, Inc. (33)
|
| | |
Exhibit 10.51
| | Amendment No. 1 to Master Loan and Security Agreement, dated as of September 23, 2014, by and among Fifth Third Bank and Stellaris LLC. (33)
|
| | |
Exhibit 10.52
| | Promissory Note, dated September 19, 2014, by and among Primoris Services Corporation, James Construction Group, LLC, Q3 Contracting, Inc. and Fifth Third Bank. (33)
|
| | |
Exhibit 10.53
| | Third Amendment to Credit Agreement, dated as of December 12, 2014, by and among Primoris Services Corporation and The PrivateBank and Trust Company, The Bank of the West, IBERIABANK Corporation, Branch Banking and Trust Company and UMB Bank, N.A. (34)
|
| | |
Exhibit 10.54
| | Waiver and Amendment Agreement, dated as of April 30, 2014, by and among Primoris Services Corporation and The PrivateBank and Trust Company and other financial institutions party to the Credit Agreement. (34)
|
| | |
Exhibit 10.55
| | Second Amendment and Waiver Agreement, dated as of August 25, 2014, by and among Primoris Services Corporation and The PrivateBank and Trust Company and other financial institutions party to the Credit Agreement. (34)
|
| | |
Exhibit 10.56
| | Agreement for Services, dated August 1, 2015, by and among Primoris Services Corporation and Brian Pratt. (incorporated by reference to Exhibit 10.56 to our Annual Report on Form 10-K, as filed with the SEC on February 29, 2016) (#) (*) |
| | |
| | |
Exhibit 10.57No. | | Description |
Exhibit 10.14 | | Employment Agreement, dated August 1, 2015, by and among Primoris Services Corporation and David L. King. (incorporated by reference to Exhibit 10.57 to our Annual Report on Form 10-K, as filed with the SEC on February 29, 2016) (#) (*) |
| | |
Exhibit 10.5810.15 | | Third Letter Amendment to ShelfEmployment Agreement, dated as of June 3, 2015,April 5, 2016, by and among Primoris Services Corporation and Prudential Investment Management, Inc. and each other Holder (as defined inThomas McCormick. (incorporated by reference to Exhibit 99.2 to our Current Report on Form 8-K, as filed with the Shelf Agreement). (35)SEC on April 8, 2016) (#)
|
| | |
Exhibit 14.1 | | Code of Ethics and Business Conduct (29)(incorporated by reference to Exhibit 14.1 to our Annual Report on Form 10-K, as filed with the SEC on March 11, 2010) |
| | |
Exhibit 21.1 | | Subsidiaries and equity investments of Primoris Services Corporation (*) |
| | |
Exhibit 23.1 | | Consent of Moss Adams LLP (*) |
| | |
Exhibit 31.1 | | Certification of chief executive officer pursuant to Section 302 of the Sarbanes-Oxley Act of 2002 (*) |
| | |
Exhibit 31.2 | | Certification of chief financial officer pursuant to Section 302 of the Sarbanes-Oxley Act of 2002 (*) |
(#)Management contract or compensatory plan, contract or arrangement.
(*)Filed herewith.
(1)
| | Filed as an exhibit to our Current Report on Form 8-K, as filed with the SEC on February 20, 2008, and such exhibit is incorporated herein by reference.
|
(2)
| | Filed as an exhibit to our Registration Statement on Form S-4/A (Amendment No. 3) (File No. 333-150343), as filed with the SEC on July 1, 2008, and such exhibit is incorporated herein by reference.
|
(3)
| | Filed as an exhibit to our Current Report on Form 8-K, as filed with the SEC on July 8, 2010, and such exhibit is incorporated herein by reference.
|
(4)
| | Filed as an exhibit to our Current Report on Form 8-K, as filed with the SEC on November 12, 2010, and such exhibit is incorporated herein by reference.
|
(5)
| | Filed as an exhibit to our Current Report on Form 8-K, as filed with the SEC on November 15, 2012, and such exhibit is incorporated herein by reference.
|
(6)
| | Filed as an exhibit to our Quarterly Report on Form 10-Q, as filed with the SEC on August 12, 2009, and such exhibit is incorporated herein by reference.
|
(7)
| | Filed as an exhibit to our Current Report on Form 8-K, as filed with the SEC on August 6, 2008, and such exhibit is incorporated herein by reference.
|
(8)
| | Filed as exhibit to our Current Report on Form 8-K, as filed with the SEC on December 17, 2009, and such exhibit is incorporated herein by reference.
|
(9)
| | Filed as an exhibit to our Registration Statement on Form S-1 (File No. 333-134694), as filed with the SEC on June 2, 2006, and such exhibit is incorporated herein by reference.
|
(10)
| | Attached as an annex to our Registration Statement on Form S-4/A (Amendment No. 4) (File No. 333-150343), as filed with the SEC on July 9, 2008, and such annex is incorporated herein by reference.
|
(11)
| | Attached as Appendix A to our Definitive Proxy Statement on Schedule 14A filed with the SEC on April 9, 2013, and such Appendix is incorporated herein by reference.
|
(12)
| | Filed as an exhibit to our Current Report on Form 8-K, as filed with the SEC on November 4, 2009, and such exhibit is incorporated herein by reference.
|
(13)
| | Filed as an exhibit to our Current Report on Form 8-K, as filed with the SEC on October 6, 2010, and such exhibit is incorporated herein by reference.
|
(14)
| | Filed as an exhibit to our Current Report on Form 8-K, as filed with the SEC on July 1, 2010, and such exhibit is incorporated herein by reference.
|
(15)
| | Filed as an exhibit to our Current Report on Form 8-K, as filed with the SEC on September 8, 2010, and such exhibit is incorporated herein by reference.
|
(16)
| | Filed as an exhibit to our Current Report on Form 8-K, as filed with the SEC on January 6, 2011, and such exhibit is incorporated herein by reference.
|
(17)
| | Filed as an exhibit to our Annual Report on Form 10-K, as filed with the SEC on March 16, 2011, and such exhibit is incorporated herein by reference.
|
(18)
| | Filed as an exhibit to our Current Report on Form 8-K, as filed with the SEC on October 25, 2011, and such exhibit is incorporated herein by reference.
|
(19)
| | Filed as an exhibit to our Current Report on Form 8-K, as filed with the SEC on December 14, 2011, and such exhibit is incorporated herein by reference.
|
(20)
| | Filed as an exhibit to our Current Report on Form 8-K, as filed with the SEC on December 30, 2011, and such exhibit is incorporated herein by reference.
|
(21)
| | Filed as an exhibit to our Annual Report on Form 10-K, as filed with the SEC on March 5, 2012, and such exhibit is
|
| | incorporated herein by reference.
|
(22)
| | Filed as an exhibit to our Annual Report on Form 10-Q, as filed with the SEC on May 9, 2012, and such exhibit is incorporated herein by reference.
|
(23)
| | Filed as an exhibit to our Current Report on Form 8-K, as filed with the SEC on June 28, 2012, and such exhibit is incorporated herein by reference.
|
(24)
| | Filed as an exhibit to our Current Report on Form 8-K, as filed with the SEC on July 23, 2012, and such exhibit is incorporated herein by reference.
|
(25)
| | Filed as an exhibit to our Current Report on Form 8-K, as filed with the SEC on November 2, 2012, and such exhibit is incorporated herein by reference.
|
(26)
| | Filed as an exhibit to our Current Report on Form 8-K, as filed with the SEC on November 9, 2012, and such exhibit is incorporated herein by reference.
|
(27)
| | Filed as an exhibit to our Current Report on Form 8-K, as filed with the SEC on December 18, 2012, and such exhibit is incorporated herein by reference.
|
(28)
| | Filed as an exhibit to our Current Report on Form 8-K, as filed with the SEC on January 7, 2013, and such exhibit is incorporated herein by reference.
|
(29)
| | Filed as an exhibit to our Annual Report on Form 10-K, as filed with the SEC on March 11, 2010, and such exhibit is incorporated herein by reference.
|
(30)
| | Filed as an exhibit to our Quarterly Report on Form 10-Q, as filed with the SEC on August 7, 2013, and such exhibit is incorporated herein by reference.
|
(31)
| | Filed as an exhibit to our Quarterly Report on Form 10-Q, as filed with the SEC on November 5, 2013, and such exhibit is incorporated herein by reference.
|
(32)
| | Filed as an exhibit to our Annual Report on Form 10-K, as filed with the SEC on March 3, 2014, and such exhibit is incorporated herein by reference.
|
(33)
| | Filed as an exhibit to our Quarterly Report on Form 10-Q, as filed with the SEC on November 7, 2014, and such exhibit is incorporated herein by reference.
|
(34)
| | Filed as an exhibit to our Current Report on Form 8-K, as filed with the SEC on December 18, 2014, and such exhibit is incorporated herein by reference.
|
(35)
| | Filed as an exhibit to our Current Report on Form 8-K, as filed with the SEC on June 9, 2015, and such exhibit is incorporated herein by reference.
|
SIGNATURESSIGNATURES
Pursuant to the requirements of Section 13 or 15(d) of the Securities Exchange Act of 1934, the Registrant has duly caused this Report to be signed on its behalf by the undersigned, thereunto duly authorized.
Primoris Services Corporation (Registrant)
| | | |
BY: | /s/ DAVID L. KING | BY: | /s/ PETER J. MOERBEEK |
| David L. King | | Peter J. Moerbeek |
| President and Chief Executive Officer | | Executive Vice President, Chief Financial Officer |
| (Principal Executive Officer) |
| (Principal Financial and Accounting Officer) |
| | | |
Date: | February 29, 201626, 2018 | | |
Pursuant to the requirements of the Securities Exchange Act of 1934, this Report has been signed by the following persons on behalf of the Registrant and in the capacities indicated and on the date indicated.
| | |
BY: | /s/ BRIAN PRATT | |
| Brian Pratt | |
| Chairman of the Board of Directors | |
| | |
BY: | /s/ DAVID L. KING | |
| David L. King | |
| Director | |
| | |
BY: | /s/ PETER J. MOERBEEK | |
| Peter J. Moerbeek | |
| Director | |
| | |
BY: | /s/ PETER C. BROWN | |
| Peter C. Brown | |
| Director | |
| | |
BY: | /s/ STEPHEN C. COOK | |
| Stephen C. Cook | |
| Director | |
| | |
BY: | /s/ JOHN P. SCHAUERMAN | |
| John P. Schauerman | |
| Director | |
| | |
BY: | /s/ ROBERT A. TINSTMAN | |
| Robert A. Tinstman | |
| Director | |
| | |
BY: | /s/ THOMAS E. TUCKER | |
| Thomas E. Tucker | |
| Director | |
| | |
Date: | February 29, 201626, 2018 | |
PRIMORIS SERVICES CORPORATION
INDEX TO FINANCIAL STATEMENTS
| Page
|
| Page |
Report of Independent Registered Public Accounting Firm | F-2 |
Consolidated Balance Sheets as of December 31, 20152017 and 20142016 | F-3F-4
|
Consolidated Statements of Income for the Years Ended December 31, 2015, 20142017, 2016 and 20132015 | F-4F-5
|
Consolidated Statements of Stockholders’ Equity for the Years Ended December 31, 2015, 20142017, 2016 and 20132015 | F-5F-6
|
Consolidated Statements of Cash Flows for the Years Ended December 31, 2015, 20142017, 2016 and 20132015 | F-6F-7
|
Notes to Consolidated Financial Statements | F-8F-9
|
REPORT OF INDEPENDENT REGISTERED PUBLIC ACCOUNTING FIRM
The Board of Directors and Stockholders
Primoris Services Corporation
Opinions on the Financial Statements and Internal Control over Financial Reporting
We have audited the accompanying consolidated balance sheets of Primoris Services Corporation (the “Company”) as of December 31, 20152017 and 2014, and2016, the related consolidated statements of income, stockholders’ equity, and cash flows for each of the three years in the period ended December 31, 2015.2017, and the related notes (collectively referred to as the “consolidated financial statements”). We also have audited the Company’s internal control over financial reporting as of December 31, 2015,2017, based on criteria established in Internal Control - Integrated Framework (1992)(2013) issued by the Committee of Sponsoring Organizations of the Treadway Commission. As describedCommission (COSO).
In our opinion, the consolidated financial statements referred to above present fairly, in Management’s Annual Report on Internal Control Over Financial Reporting, management excluded fromall material respects, the consolidated financial position of the Company as of December 31, 2017 and 2016, and the consolidated results of its assessment a portionoperations and its cash flows for each of the three years in the period ended December 31, 2017, in conformity with accounting principles generally accepted in the United States of America. Also in our opinion, the Company maintained, in all material respects, effective internal control over financial reporting at Primoris Aevenia, Inc. (“Aevenia”), acquired in February 2015 and whose financial statements constitute approximately 1.3% of total assets (excluding approximately $8.6 million of goodwill and intangible assets, which were integrated into the Company’s systems and control environment), approximately 1.2% of total revenues, and approximately (1.7%) of pre-tax income (excluding approximately $0.4 million of amortization of intangible assets, which were integrated into the Company’s systems and control environment) of the consolidated financial statement amounts as of and for the year ended December 31, 2015. Accordingly, our audit did not include the internal control over financial reporting at Aevenia. 2017, based on criteria established in Internal Control - Integrated Framework (2013) issued by COSO.
Basis for Opinions
The Company’s management is responsible for these consolidated financial statements, for maintaining effective internal control over financial reporting, and for its assessment of the effectiveness of internal control over financial reporting, included in the accompanying Management’s Annual Report on Internal Control Over Financial Reporting appearing under Item 9A. Our responsibility is to express an opinion on thesethe Company’s consolidated financial statements and an opinion on the Company’s internal control over financial reporting based on our audits. We are a public accounting firm registered with the Public Company Accounting Oversight Board (United States) (“PCAOB”) and are required to be independent with respect to the Company in accordance with the U.S. federal securities laws and the applicable rules and regulations of the Securities and Exchange Commission and the PCAOB.
We conducted our audits in accordance with the standards of the Public Company Accounting Oversight Board (United States).PCAOB. Those standards require that we plan and perform the audits to obtain reasonable assurance about whether the consolidated financial statements are free of material misstatement, whether due to error or fraud, and whether effective internal control over financial reporting was maintained in all material respects.
Our audits of the consolidated financial statements included performing procedures to assess the risks of material misstatement of the consolidated financial statements, whether due to error or fraud, and performing procedures to respond to those risks. Such procedures included examining, on a test basis, evidence supportingregarding the amounts and disclosures in the consolidated financial statements, assessingstatements. Our audits also included evaluating the accounting principles used and significant estimates made by management, andas well as evaluating the overall presentation of the consolidated financial statement presentation.statements. Our audit of internal control over financial reporting included obtaining an understanding of internal control over financial reporting, assessing the risk that a material weakness exists, and testing and evaluating the design and operating effectiveness of internal control based on the assessed risk. Our audits also included performing such other procedures as we considered necessary in the circumstances. We believe that our audits provide a reasonable basis for our opinions.
As discussed in Management’s Annual Report on Internal Control Over Financial Reporting, on May 26, 2017 and June 16, 2017, the Company acquired Florida Gas Contractors and Coastal Field Services, respectively. For the purposes of assessing internal control over financial reporting, management excluded Florida Gas Contractors and Coastal Field Services, whose financial statements collectively constitute 2.0% of the Company’s consolidated total assets (excluding $43.5 million of goodwill and intangible assets, which were integrated into the Company’s control environment) and 1.4% of consolidated net revenues, as of and for the year ended December 31, 2017. Accordingly, our audit did not include the internal control over financial reporting of Florida Gas Contractors and Coastal Field Services.
Definition and Limitations of Internal Control Over Financial Reporting
A company’s internal control over financial reporting is a process designed to provide reasonable assurance regarding the reliability of financial reporting and the preparation of financial statements for external purposes in accordance with generally accepted accounting principles. A company’s internal control over financial reporting includes those policies and procedures that (1) pertain to the maintenance of records that, in reasonable detail, accurately and fairly reflect the transactions and dispositions of the assets of the company; (2) provide reasonable assurance that transactions are recorded as necessary to permit preparation of financial statements in accordance with generally accepted accounting principles, and that receipts and expenditures of the company are being made only in accordance with authorizations of management and directors of the company; and (3) provide reasonable assurance regarding prevention or timely detection of unauthorized acquisition, use, or disposition of the company’s assets that could have a material effect on the consolidated financial statements.
Because of its inherent limitations, internal control over financial reporting may not prevent or detect misstatements. Also, projections of any evaluation of effectiveness to future periods are subject to the risk that controls may become inadequate because of changes in conditions, or that the degree of compliance with the policies or procedures may deteriorate.
In our opinion, the consolidated financial statements referred to above present fairly, in all material respects, the consolidated financial position of Primoris Services Corporation as of December 31, 2015 and 2014, and the consolidated results of its operations and its cash flows for each of the three years in the period ended December 31, 2015, in conformity with generally accepted accounting principles in the United States of America. Also in our opinion, Primoris Services Corporation maintained, in all material respects, effective internal control over financial reporting as of December 31, 2015, based on criteria established in Internal Control - Integrated Framework (1992) issued by the Committee of Sponsoring Organizations of the Treadway Commission./s/ Moss Adams LLP
As discussed in Note 2 to the consolidated financial statements, the Company retrospectively changed the manner in which it accounts for the classification of deferred income tax balances in 2015.Los Angeles, California
February 26, 2018
We have served as the Company’s auditor since 2006.
| |
| |
Irvine, California
| |
February 29, 2016
| |
PRIMORIS SERVICES CORPORATION
CONSOLIDATED BALANCE SHEETS
(In Thousands, Except Share Amounts)
| | | | | | | | |
| | December 31, | | | December 31, | |
| | 2015 | | 2014 | | | 2017 | | 2016 | |
ASSETS | | | | | | | | | | | | |
Current assets: | | | | | | | | | | | | |
Cash and cash equivalents | | $ | 161,122 | | $ | 139,465 | | |
Short-term investments | | — | | 30,992 | | |
Customer retention deposits and restricted cash | | 2,598 | | 481 | | |
Cash and cash equivalents ($60,256 and $7,045 related to VIEs. See Note 12) | | | $ | 170,385 | | $ | 135,823 | |
Customer retention deposits | | | | 1,000 | | | 481 | |
Accounts receivable, net | | 320,588 | | 337,382 | | | | 358,175 | | | 388,000 | |
Costs and estimated earnings in excess of billings | | 116,455 | | 68,654 | | | | 160,092 | | | 138,618 | |
Inventory and uninstalled contract materials | | 67,796 | | 58,116 | | | | 40,922 | | | 49,201 | |
Prepaid expenses and other current assets | | 18,265 | | 31,720 | | | | 12,640 | | | 18,985 | |
Total current assets | | 686,824 | | 666,810 | | | | 743,214 | | | 731,108 | |
Property and equipment, net | | 283,545 | | 271,431 | | | | 311,777 | | | 277,346 | |
Deferred tax asset — long-term | | 1,075 | | — | | |
Intangible assets, net | | 36,438 | | 39,581 | | | | 44,800 | | | 32,841 | |
Goodwill | | 124,161 | | 119,410 | | | | 153,374 | | | 127,226 | |
Other long-term assets | | 211 | | 400 | | | | 2,575 | | | 2,046 | |
Total assets | | $ | 1,132,254 | | $ | 1,097,632 | | | $ | 1,255,740 | | $ | 1,170,567 | |
LIABILITIES AND STOCKHOLDERS’ EQUITY | | | | | | | | | | | | |
Current liabilities: | | | | | | | | | | | | |
Accounts payable | | $ | 124,450 | | $ | 128,793 | | | $ | 140,943 | | $ | 168,110 | |
Billings in excess of costs and estimated earnings | | 139,875 | | 158,595 | | | | 159,034 | | | 112,606 | |
Accrued expenses and other current liabilities | | 93,596 | | 83,401 | | | | 111,387 | | | 108,006 | |
Dividends payable | | 2,842 | | 2,062 | | | | 3,087 | | | 2,839 | |
Current portion of capital leases | | 974 | | 1,650 | | | | 132 | | | 188 | |
Current portion of long-term debt | | 54,436 | | 38,909 | | | | 65,464 | | | 58,189 | |
Current portion of contingent earnout liabilities | | — | | 5,901 | | | | 716 | | | — | |
Total current liabilities | | 416,173 | | 419,311 | | | | 480,763 | | | 449,938 | |
Long-term capital leases, net of current portion | | 22 | | 657 | | | | 196 | | | 15 | |
Long-term debt, net of current portion | | 219,853 | | 204,029 | | | | 193,351 | | | 203,150 | |
Deferred tax liabilities — long-term | | — | | 5,929 | | |
Long-term contingent earnout liabilities, net of current portion | | — | | 1,021 | | |
Deferred tax liabilities | | | | 13,571 | | | 9,830 | |
Other long-term liabilities | | 12,741 | | 12,899 | | | | 5,676 | | | 9,064 | |
Total liabilities | | 648,789 | | 643,846 | | | | 693,557 | | | 671,997 | |
Commitments and contingencies | | | | | | |
Commitments and contingencies (See Note 13) | | | | | | | | |
Stockholders’ equity | | | | | | | | | | | | |
Preferred stock—$.0001 par value, 1,000,000 shares authorized, none issued and outstanding at December 31, 2015 and 2014 | | — | | — | | |
Common stock—$.0001 par value; 90,000,000 shares authorized; 51,676,140 and 51,561,396 issued and outstanding at December 31, 2015 and 2014, respectively | | 5 | | 5 | | |
Common stock—$.0001 par value; 90,000,000 shares authorized; 51,448,753 and 51,576,442 issued and outstanding at December 31, 2017 and December 31, 2016 | | | | 5 | | | 5 | |
Additional paid-in capital | | 163,344 | | 160,186 | | | | 160,502 | | | 162,128 | |
Retained earnings | | 319,899 | | 293,628 | | | | 395,961 | | | 335,218 | |
Non-controlling interest | | 217 | | (33 | ) | |
Noncontrolling interest | | | | 5,715 | | | 1,219 | |
Total stockholders’ equity | | 483,465 | | 453,786 | | | | 562,183 | | | 498,570 | |
Total liabilities and stockholders’ equity | | $ | 1,132,254 | | $ | 1,097,632 | | | $ | 1,255,740 | | $ | 1,170,567 | |
See accompanying notes.
F-3
PRIMORIS SERVICES CORPORATION
CONSOLIDATED STATEMENTS OF INCOME
(In Thousands, Except Per Share Amounts)
| | Year Ended December 31, | | | | | | | | | | | |
| | 2015 | | 2014 | | 2013 | | | | | | | | | | | |
Revenues | | $ | 1,929,415 | | $ | 2,086,194 | | $ | 1,944,220 | | |
Cost of revenues | | 1,709,542 | | 1,850,154 | | 1,688,205 | | |
| | | Year Ended December 31, | |
| | | 2017 | | 2016 | | 2015 | |
Revenue | | | $ | 2,379,995 | | $ | 1,996,948 | | $ | 1,929,415 | |
Cost of revenue | | | | 2,101,561 | | | 1,795,641 | | | 1,709,542 | |
Gross profit | | 219,873 | | 236,040 | | 256,015 | | | | 278,434 | | | 201,307 | | | 219,873 | |
Selling, general and administrative expenses | | 152,104 | | 132,248 | | 130,778 | | | | 172,146 | | | 140,842 | | | 151,703 | |
Impairment of goodwill | | | | — | | | 2,716 | | | 401 | |
Operating income | | 67,769 | | 103,792 | | 125,237 | | | | 106,288 | | | 57,749 | | | 67,769 | |
Other income (expense): | | | | | | | | | | | | | | | | | |
Income (loss) from non-consolidated entities | | — | | 5,264 | | (4,836 | ) | |
Investment income | | | | 5,817 | | | — | | | — | |
Foreign exchange gain (loss) | | (763 | ) | 374 | | 153 | | | | 253 | | | 202 | | | (763) | |
Other income (expense) | | 1,723 | | (757 | ) | 4,804 | | |
Other income (expense), net | | | | 484 | | | (315) | | | 1,723 | |
Interest income | | 56 | | 88 | | 110 | | | | 587 | | | 149 | | | 56 | |
Interest expense | | (7,688 | ) | (6,433 | ) | (5,892 | ) | | | (8,146) | | | (8,914) | | | (7,688) | |
Income before provision for income taxes | | 61,097 | | 102,328 | | 119,576 | | | | 105,283 | | | 48,871 | | | 61,097 | |
Provision for income taxes | | (23,946 | ) | (38,646 | ) | (44,896 | ) | | | (28,433) | | | (21,146) | | | (23,946) | |
Net income | | $ | 37,151 | | $ | 63,682 | | $ | 74,680 | | | | 76,850 | | | 27,725 | | | 37,151 | |
| | | | | | | | | | | | | | | | | |
Less net income attributable to noncontrolling interests | | $ | (279 | ) | (526 | ) | (5,020 | ) | | | (4,496) | | | (1,002) | | | (279) | |
| | | | | | | | | | | | | | | | | |
Net income attributable to Primoris | | $ | 36,872 | | $ | 63,156 | | $ | 69,660 | | | $ | 72,354 | | $ | 26,723 | | $ | 36,872 | |
| | | | | | | | | | | | | | | | | |
Dividends per common share | | $ | 0.205 | | $ | 0.150 | | $ | 0.135 | | | $ | 0.225 | | $ | 0.220 | | $ | 0.205 | |
| | | | | | | | | | | | | | | | | |
Earnings per share attributable to Primoris: | | | | | | | | |
Earnings per share: | | | | | | | | | | | |
Basic | | $ | 0.71 | | $ | 1.22 | | $ | 1.35 | | | $ | 1.41 | | $ | 0.52 | | $ | 0.71 | |
Diluted | | $ | 0.71 | | $ | 1.22 | | $ | 1.35 | | | $ | 1.40 | | $ | 0.51 | | $ | 0.71 | |
| | | | | | | | |
Weighted average common shares outstanding: | | | | | | | | | | | | | | | | | |
Basic | | 51,647 | | 51,607 | | 51,540 | | | | 51,481 | | | 51,762 | | | 51,647 | |
Diluted | | 51,798 | | 51,747 | | 51,610 | | | | 51,741 | | | 51,989 | | | 51,798 | |
See accompanying notes.
F-4
PRIMORIS SERVICES CORPORATION
CONSOLIDATED STATEMENTS OF STOCKHOLDERS’ EQUITY
(In Thousands, Except Share Amounts)
| | | | | | Additional | | | | Non | | Total | | | | | | | | | | | | | | | | | | | |
| | Common Stock | | Paid-in | | Retained | | Controlling | | Stockholders’ | | | | | | | | Additional | | | | | Non | | Total | |
| | Shares | | Amount | | Capital | | Earnings | | Interest | | Equity | | | Common Stock | | Paid-in | | Retained | | Controlling | | Stockholders’ | |
Balance, December 31, 2012 | | 51,403,686 | | $ | 5 | | $ | 155,605 | | $ | 175,517 | | $ | 1,511 | | $ | 332,638 | | |
Net income | | — | | — | | — | | 69,660 | | 5,020 | | 74,680 | | |
Issuance of shares to employees and directors | | 153,579 | | — | | 3,062 | | — | | — | | 3,062 | | |
Amortization of Restricted Stock Units | | — | | — | | 366 | | — | | — | | 366 | | |
Issuance of shares as part of Q3C acquisition | | 29,273 | | — | | 463 | | — | | — | | 463 | | |
Cancelled shares for redemption of note receivable | | (15,144 | ) | — | | (300 | ) | — | | — | | (300 | ) | |
Distribution of non-controlling entities | | — | | — | | — | | — | | (5,500 | ) | (5,500 | ) | |
Dividends | | — | | — | | — | | (6,961 | ) | — | | (6,961 | ) | |
Balance, December 31, 2013 | | 51,571,394 | | $ | 5 | | $ | 159,196 | | $ | 238,216 | | $ | 1,031 | | $ | 398,448 | | |
Net income | | — | | — | | — | | 63,156 | | 526 | | 63,682 | | |
Issuance of shares to employees and directors | | 90,002 | | — | | 2,897 | | — | | — | | 2,897 | | |
Amortization of Restricted Stock Units | | — | | — | | 934 | | — | | — | | 934 | | |
Dividend equivalent Units accrued — Restricted Stock Units | | — | | — | | 3 | | (3 | ) | — | | — | | |
Repurchase of stock | | (100,000 | ) | — | | (2,844 | ) | — | | — | | (2,844 | ) | |
Distribution of non-controlling entities | | — | | — | | — | | — | | (1,590 | ) | (1,590 | ) | |
Dividends | | — | | — | | — | | (7,741 | ) | — | | (7,741 | ) | |
| | | Shares | | Amount | | Capital | | Earnings | | Interest | | Equity | |
Balance, December 31, 2014 | | 51,561,396 | | $ | 5 | | $ | 160,186 | | $ | 293,628 | | $ | (33 | ) | $ | 453,786 | | | 51,561,396 | | $ | 5 | | $ | 160,186 | | $ | 293,628 | | $ | (33) | | $ | 453,786 | |
Net income | | — | | — | | — | | 36,872 | | 279 | | 37,151 | | | — | | | — | | | — | | | 36,872 | | | 279 | | | 37,151 | |
Issuance of shares to employees and directors | | 114,744 | | — | | 2,096 | | — | | — | | 2,096 | | | 114,744 | | | — | | | 2,096 | | | — | | | — | | | 2,096 | |
Amortization of Restricted Stock Units | | — | | — | | 1,050 | | — | | — | | 1,050 | | | — | | | — | | | 1,050 | | | — | | | — | | | 1,050 | |
Dividend equivalent Units accrued — Restricted Stock Units | | — | | — | | 12 | | (12 | ) | — | | — | | |
Dividend equivalent Units accrued - Restricted Stock Units | | | — | | | — | | | 12 | | | (12) | | | — | | | — | |
Distribution of non-controlling entities | | — | | — | | — | | — | | (29 | ) | (29 | ) | | — | | | — | | | — | | | — | | | (29) | | | (29) | |
Dividends | | — | | — | | | | (10,589 | ) | — | | (10,589 | ) | | — | | | — | | | — | | | (10,589) | | | — | | | (10,589) | |
Balance, December 31, 2015 | | 51,676,140 | | $ | 5 | | $ | 163,344 | | $ | 319,899 | | $ | 217 | | $ | 483,465 | | | 51,676,140 | | $ | 5 | | $ | 163,344 | | $ | 319,899 | | $ | 217 | | $ | 483,465 | |
Net income | | | — | | | — | | | — | | | 26,723 | | | 1,002 | | | 27,725 | |
Issuance of shares to employees and directors | | | 108,102 | | | — | | | 2,133 | | | — | | | — | | | 2,133 | |
Amortization of Restricted Stock Units | | | — | | | — | | | 1,627 | | | — | | | — | | | 1,627 | |
Dividend equivalent Units accrued - Restricted Stock Units | | | — | | | — | | | 23 | | | (23) | | | — | | | — | |
Repurchase of stock | | | (207,800) | | | — | | | (4,999) | | | — | | | — | | | (4,999) | |
Dividends | | | — | | | — | | | — | | | (11,381) | | | — | | | (11,381) | |
Balance, December 31, 2016 | | | 51,576,442 | | $ | 5 | | $ | 162,128 | | $ | 335,218 | | $ | 1,219 | | $ | 498,570 | |
Net income | | | — | | | — | | | — | | | 72,354 | | | 4,496 | | | 76,850 | |
Issuance of shares to employees and directors | | | 88,661 | | | — | | | 2,210 | | | — | | | — | | | 2,210 | |
Amortization of Restricted Stock Units | | | — | | | — | | | 1,126 | | | — | | | — | | | 1,126 | |
Dividend equivalent Units accrued - Restricted Stock Units | | | — | | | — | | | 37 | | | (37) | | | — | | | — | |
Repurchase of stock | | | (216,350) | | | — | | | (4,999) | | | — | | | — | | | (4,999) | |
Dividends declared | | | — | | | — | | | — | | | (11,574) | | | — | | | (11,574) | |
Balance, December 31, 2017 | | | 51,448,753 | | $ | 5 | | $ | 160,502 | | $ | 395,961 | | $ | 5,715 | | $ | 562,183 | |
See accompanying notes.
F-5
PRIMORIS SERVICES CORPORATION
CONSOLIDATED STATEMENTS OF CASH FLOWS
(In Thousands)
| | | | | | | | | | | |
| | | | |
| | | Year Ended | |
| | Year Ended December 31, | | | December 31, | |
| | 2015 | | 2014 | | 2013 | | | 2017 | | 2016 | | 2015 | |
Cash flows from operating activities: | | | | | | | | | | | | | | | | | |
Net income | | $ | 37,151 | | $ | 63,682 | | $ | 74,680 | | | $ | 76,850 | | $ | 27,725 | | $ | 37,151 | |
Adjustments to reconcile net income to net cash provided by (used in) operating activities: | | | | | | | | |
Adjustments to reconcile net income to net cash provided by operating activities: | | | | | | | | | | | |
Depreciation | | 58,408 | | 50,918 | | 42,421 | | | | 57,614 | | | 61,433 | | | 58,408 | |
Amortization of intangible assets | | 6,793 | | 7,504 | | 7,467 | | | | 8,689 | | | 6,597 | | | 6,793 | |
Goodwill & intangible asset impairment | | 401 | | — | | 808 | | |
Goodwill and intangible asset impairment | | | | 477 | | | 2,716 | | | 401 | |
Stock-based compensation expense | | 1,050 | | 934 | | 367 | | | | 1,126 | | | 1,627 | | | 1,050 | |
Gain on short-term investments | | | | (5,817) | | | — | | | — | |
Gain on sale of property and equipment | | (2,116 | ) | (1,895 | ) | (1,406 | ) | | | (4,434) | | | (4,677) | | | (2,116) | |
(Income) from non-consolidated entities | | — | | (5,264 | ) | (97 | ) | |
Impairment expense for non-consolidated entities | | — | | — | | 4,932 | | |
Other than temporary basis difference for non-consolidated entities | | — | | — | | 3,975 | | |
Distributions received from non-consolidated entities | | — | | — | | 2,821 | | |
Net deferred tax liabilities (assets) | | (7,004 | ) | 8,970 | | (12,582 | ) | | | 3,741 | | | 10,905 | | | (7,004) | |
Other non-cash items | | | | 203 | | | 174 | | | 165 | |
Changes in assets and liabilities: | | | | | | | | | | | | | | | | | |
Customer retention deposits and restricted cash | | (2,117 | ) | 4,823 | | 30,073 | | |
Customer retention deposits | | | | (519) | | | 2,117 | | | (2,117) | |
Accounts receivable | | 19,528 | | (29,659 | ) | (36,860 | ) | | | 40,546 | | | (65,806) | | | 19,528 | |
Costs and estimated earnings in excess of billings | | (47,499 | ) | (11,508 | ) | (15,445 | ) | | | (20,894) | | | (22,163) | | | (47,499) | |
Other current assets | | 4,949 | | (25,767 | ) | (14,774 | ) | | | 16,976 | | | 17,491 | | | 4,784 | |
Other long term assets | | 189 | | 72 | | — | | |
Other long-term assets | | | | 28 | | | (1,792) | | | 189 | |
Accounts payable | | (5,086 | ) | 921 | | (25,131 | ) | | | (30,547) | | | 42,934 | | | (5,086) | |
Billings in excess of costs and estimated earnings | | (19,619 | ) | (14,770 | ) | 14,473 | | | | 45,981 | | | (27,519) | | | (19,619) | |
Contingent earnout liabilities | | (6,722 | ) | (4,145 | ) | (14,900 | ) | | | (484) | | | — | | | (6,722) | |
Accrued expenses and other current liabilities | | 11,729 | | (7,354 | ) | 15,824 | | | | (972) | | | 14,492 | | | 11,729 | |
Other long-term liabilities | | (1,658 | ) | (1,361 | ) | 1,107 | | | | 378 | | | (3,677) | | | (1,658) | |
Net cash provided by operating activities | | 48,377 | | 36,101 | | 77,753 | | | | 188,942 | | | 62,577 | | | 48,377 | |
Cash flows from investing activities: | | | | | | | | | | | | | | | | | |
Purchase of property and equipment | | (67,097 | ) | (87,954 | ) | (87,050 | ) | | | (79,782) | | | (58,027) | | | (67,097) | |
Proceeds from sale of property and equipment | | 9,889 | | 5,814 | | 7,865 | | | | 8,736 | | | 9,603 | | | 9,889 | |
Purchase of short-term investments | | — | | (33,770 | ) | (23,110 | ) | | | (13,588) | | | — | | | — | |
Sale of short-term investments | | 30,992 | | 21,464 | | 7,448 | | | | 19,405 | | | — | | | 30,992 | |
Cash received from the sale of equity method investments | | — | | 6,439 | | — | | |
Cash paid for acquisitions | | (22,302 | ) | (14,596 | ) | (2,273 | ) | | | (66,205) | | | (10,997) | | | (22,302) | |
Net cash used in investing activities | | (48,518 | ) | (102,603 | ) | (97,120 | ) | | | (131,434) | | | (59,421) | | | (48,518) | |
Cash flows from financing activities: | | | | | | | | | | | | | | | | | |
Proceeds from issuance of long-term debt | | 75,278 | | 58,519 | | 107,609 | | | | 55,000 | | | 45,000 | | | 75,278 | |
Repayment of capital leases | | (1,336 | ) | (3,276 | ) | (4,618 | ) | | | (322) | | | (793) | | | (1,336) | |
Repayment of long-term debt | | (43,927 | ) | (35,107 | ) | (35,896 | ) | | | (61,816) | | | (57,719) | | | (43,927) | |
Proceeds from issuance of common stock purchased by management under long-term incentive plan | | 1,621 | | 1,671 | | 1,455 | | |
Payment of debt issuance costs for amended and restated credit agreement | | | | (631) | | | — | | | — | |
Proceeds from issuance of common stock purchased under a long-term incentive plan | | | | 1,148 | | | 1,440 | | | 1,621 | |
Cash distribution to non-controlling interest holder | | (29 | ) | (1,590 | ) | (5,500 | ) | | | — | | | — | | | (29) | |
Repurchase of common stock | | — | | (2,844 | ) | — | | | | (4,999) | | | (4,999) | | | — | |
Dividends paid | | (9,809 | ) | (7,483 | ) | (5,157 | ) | | | (11,326) | | | (11,384) | | | (9,809) | |
Net cash provided by financing activities | | 21,798 | | 9,890 | | 57,893 | | |
| | | | | | | | |
Net cash (used in) provided by financing activities | | | | (22,946) | | | (28,455) | | | 21,798 | |
Net change in cash and cash equivalents | | 21,657 | | (56,612 | ) | 38,526 | | | | 34,562 | | | (25,299) | | | 21,657 | |
Cash and cash equivalents at beginning of year | | 139,465 | | 196,077 | | 157,551 | | |
Cash and cash equivalents at end of the year | | $ | 161,122 | | $ | 139,465 | | $ | 196,077 | | |
Cash and cash equivalents at beginning of the period | | | | 135,823 | | | 161,122 | | | 139,465 | |
Cash and cash equivalents at end of the period | | | $ | 170,385 | | $ | 135,823 | | $ | 161,122 | |
See accompanying notes.
PRIMORIS SERVICES CORPORATION
CONSOLIDATED STATEMENTS OF CASH FLOWS (Continued)
(In Thousands)
SUPPLEMENTAL DISCLOSURES OF CASH FLOW INFORMATION
| | Year Ended December 31, | | | | | | | | | | | |
| | 2015 | | 2014 | | 2013 | | | Year Ended December 31, | |
Cash paid during the year for: | | | | | | | | |
| | | | | | | | | 2017 | | 2016 | | 2015 | |
Cash paid: | | | | | | | | | | | |
Interest | | $ | 7,688 | | $ | 6,432 | | $ | 5,532 | | | $ | 7,965 | | $ | 8,819 | | $ | 7,688 | |
| | | | | | | | | | | | | | | | | |
Income taxes, net of refunds received | | $ | 18,696 | | $ | 57,613 | | $ | 48,126 | | | $ | 25,984 | | $ | 8,624 | | $ | 18,696 | |
SUPPLEMENTAL DISCLOSURE OF NONCASH INVESTING AND FINANCING ACTIVITIES
| | Year Ended December 31, | | | | | | | | | | | |
| | 2015 | | 2014 | | 2013 | | | Year Ended December 31, | |
| | | | | | | | | 2017 | | 2016 | | 2015 | |
Obligations incurred for the acquisition of property and equipment | | $ | 25 | | $ | — | | $ | 2,637 | | |
| | | | | | | | | | | |
Obligations incurred for the acquisition of property | | | $ | 4,163 | | $ | — | | $ | 25 | |
| | | | | | | | | | | | | | | | | |
Dividends declared and not yet paid | | $ | 2,842 | | $ | 2,062 | | $ | 1,805 | | | $ | 3,087 | | $ | 2,839 | | $ | 2,842 | |
See accompanying notes.
F-7
PRIMORIS SERVICES CORPORATION
NOTES TO CONSOLIDATED FINANCIAL STATEMENTS
Dollars in thousands, except share and per share amounts
Note 1—Nature of Business
Organization and operations —Primoris Services Corporation is a holding company of various construction and product engineering subsidiaries. The Company’sOur underground and directional drilling operations install, replace and repair natural gas, petroleum, telecommunications and water pipeline systems, including large diameter pipeline systems. The Company’sOur industrial, civil and engineering operations build and provide maintenance services to industrial facilities including power plants, petrochemical facilities, and other processing plants; construct multi-level parking structures; and engage in the construction of highways, bridges and other environmental construction activities. The Company isWe are incorporated in the State of Delaware, and itsour corporate headquarters are located at 2100 McKinney Avenue, Suite 1500, Dallas, Texas 75201.
Reportable Operating Segments — The Company segregates itsThrough the end of the year 2016, we segregated our business into three operatingreportable segments: the West Construction ServicesEnergy segment, (“West segment”), the East Construction Services segment (“East segment”) and the EnergyWest Construction Services segment. In the first quarter 2017, we changed our reportable segments in connection with a realignment of our internal organization and management structure. The segment changes reflect the focus of our chief operating decision maker (“Energy segment”CODM”). on the range of services we provide to our end user markets. Our CODM regularly reviews our operating and financial performance based on these segments.
The current reportable segments include the Power, Industrial and Engineering (“Power”) segment, the Pipeline and Underground (“Pipeline”) segment, the Utilities and Distribution (“Utilities”) segment and the Civil segment. Segment information for prior periods has been restated to conform to the new segment presentation. See Note 16 — 14 – “Reportable Operating Segments.Segments” for a brief description of the reportable segments and their operations.
The classification of revenues and gross profit for segment reporting purposes can at times require judgment on the part of management. Our segments may perform services across industries or perform joint services for customers in multiple industries. To determine reportable segment gross profit, certain allocations, including allocations of shared and indirect costs, such as facility costs, equipment costs and indirect operating expenses were made.
The following table lists the Company’sour primary operating subsidiariesbusiness units and their operatingreportable segment:
Subsidiary
|
| Operating
| | | |
Business Unit | | Reportable Segment | | Prior Reportable Segment | |
ARB Industrial (a division of ARB, Inc. (“ARB”) | | Power | | West | |
ARB Structures Inc. | | Power | | West | |
Q3 Contracting, Inc. (“Q3C”)Primoris Power (formerly PES Saxon division)
| | WestPower
| | Energy | |
Primoris Renewable Energy (a division of Primoris AV) | | Power | | Energy | |
Primoris Industrial Constructors (formerly PES Industrial Division) | | Power | | Energy | |
Primoris Fabrication (a division of PES) | | Power | | Energy | |
Primoris Mechanical Contractors (a combination of a division of PES and Cardinal Contractors) | | Power | | Energy | |
OnQuest | | Power | | Energy | |
OnQuest Canada | | Power | | Energy | |
Primoris Design and Construction (“PD&C”); created 2017 | | Power | | NA | |
Rockford Corporation (“Rockford”) | | Pipeline | | West | |
Vadnais Trenchless Services Inc. (“Vadnais”Vadnais Trenchless”); acquired in 2014 | | Pipeline | | West | |
Silva GroupPrimoris Field Services (a division of PES Primoris Pipeline)
| | Pipeline | | Energy | |
Primoris Pipeline (a division of PES Primoris Pipeline) | | Pipeline | | Energy | |
Primoris Coastal Field Services; created 2017 | | Pipeline | | NA | |
ARB Underground (a division of ARB, Inc.) | | Utilities | | West | |
Q3 Contracting (“Silva”Q3C”) | | Utilities | | West | |
Primoris AV | | Utilities | | Energy | |
Primoris Distribution Services ("PDS"); created 2017 | | Utilities | | NA | |
Primoris Heavy Civil (formerly JCG Heavy Civil Division) | | Civil | | East | |
Cardinal Contractors, Inc.Primoris I&M (formerly JCG Infrastructure & Maintenance Division)
| | Civil | | East | |
BW Primoris LLC (“BWP”)Build Own Operate
| | Civil | | East |
James Construction Group, LLC (“JCG”):
| | |
JCG Heavy Civil Division
| | East
|
JCG Infrastructure and Maintenance Division
| | East
|
Primoris Energy Services Corporation (“PES”)
| | Energy
|
PES Industrial Division (formerly JCG Industrial Division)
| | Energy
|
OnQuest, Inc.
| | Energy
|
OnQuest, Canada, ULC (Born Heaters Canada, ULC prior to 2013)
| | Energy
|
Primoris Aevenia, Inc. (“Aevenia”); acquired February 28, 2015
| | Energy
|
PES acquired two subsidiaries, The Saxon Group (“Saxon”) in 2012 and Force Specialty Services, Inc. (“FSSI”) in 2013. Effective January 1, 2014, Saxon and FSSI were merged into PES along with the Industrial division of JCG. Throughout this Form 10-K, references to FSSI, Saxon and James Industrial are to the divisions of PES for 2015 and 2014, while the references for the years prior to 2014 are to the entities or divisions.
The CompanyWe owned 50% of the Blythe Power Constructors joint venture (“Blythe”) created for the installation of a parabolic trough solar field and steam generation system in California, and its operations have been included as part of the West Construction ServicesPower segment. The CompanyWe determined that in accordance with FASB Topic 810, the Company waswe were the primary beneficiary of a variable interest entity (“VIE”) and hashave consolidated the results of Blythe in itsour financial statements. The project has been completed, the project warranty expired in May 2015, and dissolution of the joint venture was completed in the third quarter of 2015.
The Company ownsWe own a 50% interest in two separate joint ventures, both formed in 2015. The Carlsbad Power Constructors joint venture (“Carlsbad”) will engineeris engineering and constructconstructing a gas-fired power generation facility, and a joint venture titledthe “ARB Inc. & B&M Engineering Co.” joint venture (“Wilmington”) willis also engineerengineering and constructconstructing a co-generationgas-fired power generation facility. Both projects are located in the Southern California area.California. The joint venture operations are included as part of the WestPower segment. As a result of determining that the Company iswe are the primary beneficiary of the two VIE’s,VIEs, the results of the Carlsbad and Wilmington joint ventures are consolidated in the Company’sour financial statements. The Carlsbad project isBoth projects are expected to be completed in 2017 and the Wilmington project in 2018.
Financial information for the joint ventures is presented in “Note 13— Note 12— “Noncontrolling Interests”Interests”.
F-8
Table of Contents
In January 2014, the Company created a wholly owned subsidiary, BW Primoris, LLC, a Texas limited liability company (“BWP”). BWP’s goal is to develop water projects, primarily in Texas, that will need the Company’s construction services. On January 22, 2014, BWP entered into an agreement to purchase the assets and business of Blaus Wasser, LLC, a Wyoming limited liability company, for approximately $5 million. BWP entered into an intercompany construction contract with Cardinal Contractors, Inc. to build a small water treatment facility which will be owned by BWP. Beginning in 2016, the facility will generate revenues through a take-or-pay contract with a West Texas municipal entity. All intercompany revenue and profit of the construction project was eliminated, and at December 31, 2015, a total of $13.8 million has been capitalized as property, plant and equipment, including the $5 million acquisition cost.
In May 2014, the Company created a wholly owned subsidiary, Vadnais Trenchless Services, Inc., a California company (“Vadnais”), which on June 5, 2014, purchased the assets of Vadnais Corporation for $6.4 million. Vadnais Corporation was a general contractor specializing in micro-tunneling based in California. The assets purchased were primarily equipment, building and land. The purchase included a contingent earnout on meeting certain operating targets. See “Note 4—Business Combinations” for further information.
During the third quarter 2014, the Company made three small purchases totaling $8.2 million acquiring the net assets of Surber Roustabout, LLC (“Surber”), Ram-Fab, LLC (“Ram-Fab”) and Williams Testing, LLC (“Williams”). Surber and Ram-Fab operate as divisions of PES, and Williams is a division of Cardinal Contractors, Inc. Surber provides general oil and gas related construction activities in Texas; Ram-Fab is a fabricator of custom piping systems located in Arkansas; and Williams provides construction services related to sewer pipeline maintenance, rehabilitation and integrity testing in the Florida market. The Surber and Ram-Fab purchases provided for contingent earnout amounts as discussed in “Note 4— Business Combinations”.
On February 28, 2015, the Companywe acquired the net assets of Aevenia, Inc. for $22.3 million. Aevenia operations are included in the Utilities segment.
On January 29, 2016, we acquired the net assets of Mueller Concrete Construction Company (“Mueller”) for $4.1 million in cash, and established a new entity, Primoris Aevenia,on November 18, 2016, we acquired the net assets of Northern Energy & Power (“Northern”) for $6.9 million. On June 24, 2016, we purchased property, plant and equipment from Pipe Jacking Unlimited, Inc. (“Aevenia”Pipe Jacking”), which operatesconsisting of specialty directional drilling and tunneling equipment for $13.4 million. We determined this purchase did not meet the definition of a business as part of the Company’s Energy segment. Headquartered in Moorhead, Minnesota, Aevenia is an energy and electrical construction company. Aevenia specializes in overhead and underground line work, substations, telecom/fiber, and certain other client-specific on-demand call out services. The majority of their work is delivereddefined under unit-price Master Services Agreements (“MSAs”). Aevenia hasASC 805. Mueller operations in Minnesota, North Dakota, South Dakota and Iowa. The Company believes there are opportunities for Aevenia to grow sales by performing in-house work for other Primoris subsidiaries and to expand the Company’s offerings to new geographiesincluded in the Midwest United States.Utilities segment, Northern operations are included in the Power segment, and Pipe Jacking operations are included in the Pipeline segment.
On May 26, 2017, we acquired the net assets of Florida Gas Contractors (“FGC”) for $37.7 million; on May 30, 2017, we acquired certain engineering assets for approximately $2.3 million; and on June 16, 2017, we acquired the net assets of Coastal Field Services (“Coastal”) for $27.5 million. FGC operations are included in the Utilities segment, the engineering assets are included in the Power segment, and Coastal operations are included in the Pipeline segment. See “NoteNote 4— “Business Combinations”Combinations”.
Unless specifically noted otherwise, as used throughout these consolidated financial statements, “Primoris”, “the Company”, “we”, “our”, “us” or “its” refers to the business, operations and financial results of the Company and its wholly-owned subsidiaries.
Seasonality—Primoris’ results of operations are subject to quarterly variations. Most of the variation is the result of weather, particularly rain, ice and snow, which can impact the Company’sour ability to perform construction services. While the majority of the Company’sour work is in the southern half of the United States, these seasonal impacts affect revenues and profitability since gas and other utilities defer routine replacement and repair during their period of peak demand. Any quarter can be affected either negatively or positively by atypical weather patterns in any part of the country. In addition, demand for new projects tends to be lower during the early part of the year due to clients’ internal budget cycles. As a result, the Companywe usually experiences higher revenues and earnings in the third and fourth quarters of the year as compared to the first two quarters, with the fourth quarter revenues and earnings usually less than the third quarter revenues and earnings but higher than the second quarter revenues and earnings.
Variability—In addition to seasonality, the Company iswe are dependent on large construction projects, which tend not to be seasonal, but can fluctuate from year to year based on general economic conditions and client requirements. Our business may be affected by declines or delays in new projects or by client project schedules. Because of the cyclical nature of our business, the financial results for any period may fluctuate from prior periods, and the Company’sour financial condition and operating results may vary from quarter-to-quarter. Results from one quarter may not be indicative of its financial condition or operating results for any other quarter or for an entire year.
Note 2—Summary of Significant Accounting Policies
Basis of presentation—The accompanying consolidated financial statements were prepared in accordance with accounting principles generally accepted in the United States (“GAAP”) and the financial statement rules and regulations of the Securities and Exchange Commission (“SEC”). References for Financial Accounting Standards Board (“FASB”) standards are made to the FASB Accounting Standards Codification (“ASC”).
Certain reclassifications have been made to the prior year Consolidated Balance Sheet to conform classification of deferred tax assets and liabilities to the current year presentation as outlined on “Note 2—Summary of Significant Accounting Policies — Recently Issued Accounting Pronouncements” and had no impact on net income or earnings per share.
F-9
Table of Contents
Principles of consolidation—The accompanying Consolidated Financial Statements include the accounts of the Company, itsPrimoris, our wholly-owned subsidiaries and the noncontrolling interests of the Blythe, Carlsbad and Wilmington joint ventures, which are variable interest entitiesVIEs for which the Company iswe are the primary beneficiary as determined under the provisions of ASC Topic 810-10-45.810. All intercompany balances and transactions have been eliminated in consolidation.
Reclassification—Certain previously reported amounts have been reclassified to conform to the current year presentation.
Use of estimates—The preparation of the Company’sour Consolidated Financial Statements in conformity with GAAP requires management to make estimates and assumptions that affect the reported amounts of assets and liabilities and the disclosure of contingent assets and liabilities as of the date of the consolidated financial statements and the reported amounts of revenues and expenses during the reporting periods. As a construction contractor, the Company uses significantwe use estimates for costs to complete construction projects and the contract value of certain construction projects. These estimates have a direct effect on gross profit as reported in these consolidated financial statements. Actual results could materially differ from the Company’sour estimates.
Operating cycle— In the accompanying consolidated balance sheets,Consolidated Balance Sheets, assets and liabilities relating to long-term construction contracts (e.g. costs and estimated earnings in excess of billings, billings in excess of costs and estimated
earnings) are considered current assets and current liabilities, since they are expected to be realized or liquidated in the normal course of contract completion, although completion may require more than one calendar year.
Consequently, the Company haswe have significant working capital invested in assets that may have a liquidation period extending beyond one year. The Company hasWe have claims receivable and retention due from various customers and others that are currently in dispute, the realization of which is subject to binding arbitration, final negotiation or litigation, all of which may extend beyond one calendar year.
Cash and cash equivalents—The Company considersWe consider all highly liquid investments with an original maturity of three months or less when purchased as cash equivalents.
Short-term investments—The Company classifiesWe classify as short-term investments all securities or other assets acquired which have ready marketability and can be liquidated, if necessary, within the current operating cycle and which have readily determinable fair values. Short-term investments are classified as available for saletrading and are recorded at fair value using the specific identificationfirst-in, first-out method. At December 31, 2015, the Company had no short-term investments. In prior years, the majority of the Company’sOur short-term investments were inare generally short-term dollar-denominated bank deposits, and U.S. Treasury Bills in order to provide government backing of the investments.and marketable equity securities.
Customer retention deposits and restricted cash—Customer In some state jurisdictions, customer retention deposits consist of contract retention payments made by customers into bank escrow cash accounts as required in some state jurisdictions.required. Investments for these amounts are limited to highly graded U.S. and municipal government debt obligations, investment grade commercial paper and CDs, which limits credit risk on these balances. Escrow cash accounts are released to the Companyus by customers as projects are completed in accordance with contract terms.
Inventory and uninstalled contract materials—Inventory consists of expendable construction materials and small tools that will be used in construction projects and is valued at the lower of cost, using first-in, first-out method, or market.net realizable value. Uninstalled contract materials are certain job specific materials not yet installed, primarily for highway construction projects, which are valued using the specific identification method relating the cost incurred to a specific project. In most cases, the Company isWe are able to invoice a state agency for the materials, but in most cases title hasdoes not yet passedpass to the state agency.agency until the materials are installed.
Business combinations—Business combinations are accounted for using the acquisition method of accounting. We use the fair value of the assets acquired and liabilities assumed to account for the purchase price of businesses. The determination of fair value requires estimates and judgments of future cash flow expectations to assign fair values to the identifiable tangible and intangible assets. GAAP provides a “measurement period” of up to one year in which to finalize all fair value estimates associated with the acquisition of a business. Most estimates are preliminary until the end of the measurement period. During the measurement period, any material, newly discovered information that existed at the acquisition date would be reflected as an adjustment to the initial valuations and estimates. After the measurement date, any adjustments would be recorded as a current period income or expense. Changes in deferred tax asset valuation allowances and acquired tax uncertainties after the measurement period are also recognized in current period net income. Expenses incurred in connection with a business combination are expensed as incurred.
Contingent Earnout Liabilities—As part of certain acquisitions, we agreed to pay cash to certain sellers upon meeting specific operating performance targets for specified periods subsequent to the acquisition date. Each quarter, we evaluate the fair value of the estimated contingency and record a non-operating charge for the change in the fair value. Upon meeting the target, we reflect the full liability on the balance sheet and record a charge to “Selling, general and administration expense” for the change in the fair value of the liability from the prior period. See Note 3 — “Fair Value Measurements” for further discussion.
Goodwill and other intangible assets—The Company accountsWe account for goodwill in accordance with ASC Topic 350 “Intangibles — Goodwill and Other”. Under ASC Topic 350, goodwill is not amortized but is subject to an annual impairment test, which we perform as of the first day of the fourth quarter of each year, with more frequent testing if indicators of potential impairment exist. The impairment review is performed at the reporting unit level for those units with recorded goodwill. We can assess qualitative factors to determine if a quantitative impairment test of intangible assets is necessary. Typically, however, we use the two-step impairment test outlined in ASC 350. First, we compare the fair value of a reporting unit with its carrying amount. Fair value for the goodwill impairment test is determined utilizing a discounted cash flow analysis based on our financial plan discounted using our weighted average cost of capital and market indicators of terminal year
cash flows. Other valuation methods may be used to corroborate the discounted cash flow method. If the carrying amount of a reporting unit is in excess of its fair value, goodwill is considered potentially impaired and further tests are performed to measure the amount of impairment loss. In the second step of the goodwill impairment test, we compare the implied fair value of reporting unit goodwill with the carrying amount of the reporting unit’s goodwill. If the carrying amount of the reporting unit’s goodwill exceeds the implied fair value of that goodwill, an impairment loss is recognized in an amount equal to the carrying amount of goodwill over its implied fair value. The implied fair value of goodwill is determined in the same manner that the amount of goodwill recognized in a business combination was determined. We allocate the fair value of a reporting unit to all of the assets and liabilities of that unit, including intangible assets, as if the reporting unit had been acquired in a business combination. Any excess of the fair value of a reporting unit over the amounts assigned to its assets and liabilities represents the implied fair value of goodwill
During the third quarter of 2016, we made a decision to divest our Texas heavy civil business unit, a division of Primoris Heavy Civil within the Civil segment. We engaged a financial advisor to assist in the marketing and sale of the business unit, and planned to continue operating the business unit until completion of a sale. In April 2017, the Board of Directors determined that based on the information available, we would attain the best long-term value by withdrawing from the sales process and continuing to operate the business unit. In accordance with ASC 350, the planned divestiture triggered an analysis of the goodwill at Primoris Heavy Civil, resulting in a pretax, non-cash goodwill impairment charge of approximately $2.7 million in the third quarter of 2016.
In the fourth quarter of 2015, an impairment expense of $401$0.4 million was recorded relating to the goodwill attributed to Cardinal Contractors, Inc., which is a part of the East Segment, and inPower Segment.
F-10
Table of Contents
December 2013, an expense of $808There was recorded relating to an FSSI intangible asset, a part of the Energy Segment, for customer relations reflecting theno impairment of the asset. There were no other impairments of goodwill for the yearsyear ended December 31, 2015, 2014 and 2013.2017.
Income tax—Current income tax expense is the amount of income taxes expected to be paid for the financial results of the current year. A deferred income tax liability or asset is established for the expected future tax consequences resulting from the differences in financial reporting and tax basisbases of assets and liabilities between GAAP and the tax codes. A valuation allowance is provided if it is more likely than not that some or all of the deferred tax assets will not be realized.
The Company provides We provide for uncertain tax positions when such tax positions do not meet the recognition thresholds or measurement standards as set forth in ASC Topic 740. The difference between a tax position taken or expected to be taken on the Company’sour income tax returns and the benefit recognized on our financial statements is referred to as an unrecognized tax benefit. Amounts for uncertain tax positions are adjusted in periods when new information becomes available or when positions are effectively settled. The Company recognizesWe recognize accrued interest and penalties related to uncertain tax positions, if any, as a component of income tax expense.
Staff Accounting Bulletin (“SAB”) 118 provides guidance on accounting for uncertainties of the effects of the Tax Cuts and Jobs Act (the “Tax Act”). Specifically, SAB 118 allows companies to record provisional estimates of the impact of the Tax Act during a one year “measurement period” similar to that used when accounting for business combinations.
As a result of the Tax Act, we remeasured deferred tax assets and liabilities using the newly enacted tax rates and recorded a one-time net tax benefit of $9.4 million in the period ended December 31, 2017. This tax benefit is a provisional estimate that could be revised once we finalize our deductions for tax depreciation and executive compensation accruals. We may also revise our estimate based on any additional guidance issued by the U.S. Treasury Department, the U.S. Internal Revenue Service, and other standard-setting bodies.
Comprehensive income—The Company accountsWe account for comprehensive income in accordance with ASC Topic 220 “Comprehensive Income”, which specifies the computation, presentation and disclosure requirements for comprehensive income (loss). During the reported periods, the Companywe had no material other comprehensive income.
Foreign operations—At December 31, 2015, the Company2017, we had operations in Canada with assets aggregating approximately $14,111,$12.7 million, compared to $11,505$11.8 million at December 31, 2014.2016. The Canadian operations had revenues of $17,763$8.3 million and incomea loss before tax of $252 for the year ending December 31, 2015; revenues of $19,840 and income before tax of $3,183$0.3 million for the year ended December 31, 2014, and2017; revenues of $15,993 $11.2 million
and income before tax of $2,742$0.8 million for the year endingended December 31, 2013.2016, and revenues of $17.8 million and income before tax of $0.3 million for the year ended December 31, 2015.
Functional currencies and foreign currency translation—The Company uses We use the United States dollar as itsour functional currency in Canada for the Canadian operations of OnQuest Canada, as substantially all monetary transactions are made in U.S. dollars, and other significant economic facts and circumstances currently support that position. Since these factors may change, the Companywe periodically assesses itsassess our position with respect to the functional currency of itsour foreign subsidiary. Non-monetary balance sheet items and related revenue, gain, expense and loss accounts are valued using historical rates. All other items are re-measuredremeasured using the current exchange rate in effect at the balance sheet date. Foreign exchange gains of $0.2 million and $0.2 million in 2017 and 2016, respectively, and losses of $763$0.8 million in 2015 gains of $374 in 2014 and gains of $153 in 2013 are included in the “other income or expense” Foreign exchange gain (loss)” line of the Consolidated Statements of Income.
Partnerships and joint ventures — As is normal in the construction industry, the Company iswe are periodically a member of a partnership or a joint venture. These partnerships or joint ventures are used primarily for the execution of single contracts or projects. The Company’sOur ownership can vary from a small noncontrolling ownership to a significant ownership interest. The Company evaluatesWe evaluate each partnership or joint venture to determine whether the entity is considered a variable interest entity (“VIE”)VIE as defined in ASC Topic 810, and if a VIE, whether the Company iswe are the primary beneficiary of the VIE, which would require the Companyus to consolidate the VIE with the Company’sour financial statements. When consolidation occurs, the Company accountswe account for the interests of the other parties as a noncontrolling interest and discloses the net income attributable to noncontrolling interests. See Note 1312 — “Nonconrolling Interests”Noncontrolling Interests" for further informationinformation.
Equity method of accounting— The Company accounts We account for itsour interest in an investment using the equity method of accounting per ASC Topic 323 if the Company iswe are not the primary beneficiary of a VIE or doesdo not have a controlling interest. The investment is recorded at cost and the carrying amount is adjusted periodically to recognize the Company’sour proportionate share of income or loss, additional contributions made and dividends and capital distributions received. The Company recordsWe record the effect of any impairment or an other than temporary decrease in the value of its investment.
In the event a partially owned equity affiliate were to incur a loss and the Company’sour cumulative proportionate share of the loss exceeded the carrying amount of the equity method investment, application of the equity method would be suspended and the Company’sour proportionate share of further losses would not be recognized unless the Companywe committed to provide further financial support to the affiliate. The CompanyWe would resume application of the equity method once the affiliate became profitable and the Company’sour proportionate share of the affiliate’s earnings equals the Company’sour cumulative proportionate share of losses that were not recognized during the period the application of the equity method was suspended.
See Note 8 — “Equity Method Investments” regarding prior-year impairments of investments in partially owned affiliates.
Cash concentration—The Company places itsWe place our cash in short term U.S. Treasury bonds and certificates of deposit (“CDs”). At December 31, 20152017 and 2014, the Company2016, we had cash balances of $161.1$170.4 million and $139.5$135.8 million, respectively. At December 31, 2015,2017, the $161.1$170.4 million of cash balance consisted of $131.2$155.4 million in U.S. Treasury bill funds, backed by the federal government, and the
F-11
Table of Contents
remaining $29.9$15.0 million are held in high credit quality financial institutions in order to mitigate the risk of holding funds not backed by the federal government or in excess of federally backed limits. At December 31, 2014,2016, the $139.5$135.8 million cash balance consisted of $121.5$100.5 million held in U.S. Treasury bill funds and $18.0$35.3 million with high credit quality financial institutions. Cash balances associated with VIEs, which totaled $60.3 million and $7.0 million as of December 31, 2017 and December 31, 2016, respectively, are not available for general corporate purposes.
Collective bargaining agreements—Approximately 24%52% of the Company’sour hourly employees, primarily consisting of field laborers, were covered by collective bargaining agreements in 2015.2017. Upon renegotiation of such agreements, the Companywe could be exposed to increases in hourly costs and work stoppages. Of the 8397 collective bargaining agreements to which the Company iswe are a party to, 5675 will require renegotiation during 2016. The Company has2018. We have not had a significant work stoppage in more than 20 years.
Multiemployer plans — Various subsidiaries in the West segment are signatories to collective bargaining agreements. These agreements require that the Companywe participate in and contribute to a number of multiemployer benefit plans for itsour union employees at rates determined by the agreements. The trustees for each multiemployer plan determine the eligibility and allocations of contributions and benefit amounts, determine the types of benefits and administer the plan. Federal law
requires that if the Companywe were to withdraw from an agreement, itwe would incur a withdrawal obligation. The potential withdrawal obligation may be significant. In accordance with GAAP, any withdrawal liability would be recorded when it is probable that a liability exists and can be reasonably estimated. In November 2011, the Companywe withdrew from the Central States Southeast and Southwest Areas Pension Fund multiemployer pension plan, as discussed in “Note 15Note 13 — “Commitments and Contingencies”Contingencies”. The Company hasWe have no plans to withdraw from any other agreements.
Worker’s compensation insurance—The Company self-insuresWe self-insure worker’s compensation claims to a certain level. The CompanyWe maintained a self-insurance reserve totaling $26,779$18.5 million and $22,270$18.8 million at December 31, 20152017 and 2014,2016, respectively. The amount is included in “Accrued expenses and other current liabilities” on the accompanying Consolidated Balance Sheets. Claims administration expenses are charged to current operations as incurred. Future payments may materially differ from the reserve amounts.
Fair value of financial instruments—The consolidated financial statements include financial instruments for which the fair value may differ from amounts reflected on a historical basis. FinancialOur financial instruments of the Company consist of cash, accounts receivable, short-term investments, accounts payable and certain accrued liabilities. These financial instruments generally approximate fair market value based on their short-term nature. The carrying value of the Company’sour long-term debt approximates fair value based on comparison with current prevailing market rates for loans of similar risks and maturities.
The fair value of financial instruments is measured and disclosure is made in accordance with ASC Topic 820, “Fair“Fair Value Measurements and Disclosures”Disclosures”.
Revenue recognitionrecognition—
Fixed-price contracts — Historically,We generate revenue under a range of contracting options, including fixed-price, unit-price, time and material, and cost reimbursable plus fee contracts. A substantial portion of the Company’sour revenue has been generated underis derived from contracts that are fixed-price contracts. For fixed-price contracts, the Company recognizes revenues primarilyor unit-price, using the percentage-of-completion method, which may result in unevenmethod. For time and irregular results. material and cost reimbursable plus fee contracts, revenue is recognized primarily based on contractual terms. Generally, time and material and cost reimbursable contract revenues are recognized on an input basis, based on labor hours incurred and on purchases made.
In the percentage-of-completion method, estimated contract values, estimated cost at completion and total costs incurred to date are used to calculate revenues earned. Unforeseen events and circumstances can alter the estimate of the costs and potential profit associated with a particular contract. Total estimated costs, and thus contract revenues and income, can be impacted by changes in productivity, scheduling, the unit cost of labor, subcontracts, materials and equipment. Additionally, external factors such as weather, client needs, client delays in providing permits and approvals, labor availability, governmental regulation and politics may affect the progress of a project’s completion and thus the timing of revenue recognition.
To the extent that original cost estimates are modified, estimated costs to complete increase, delivery schedules are delayed, or progress under a contract is otherwise impeded, cash flow, revenue recognition and profitability from a particular contract may be adversely affected. As a significant change in one or more of these estimates could affect the profitability of our contracts, we review and update our contract-related estimates regularly. We recognize adjustments in estimated profit on contracts as changes in accounting estimates in the period in which the revisions are identified. Revenue and profit in future periods of contract performance are recognized using the adjusted estimate.
If at any time the estimate of contract profitability indicates an anticipated loss on a contract, the projected loss is recognized in full in the period it is identified and recognized as an “accrued loss provision” which is included in the accrued expenses and other current liabilities amount on the balance sheet. For contract revenue recognized under the percentage-of-completion method, the accrued loss provision is adjusted so that the gross profit for the contract remains zero in future periods. The Company considersprovision for estimated losses on uncompleted contracts was $10.1 million and $12.8 million at December 31, 2017 and 2016, respectively.
We consider unapproved change orders to be contract variations for which it has customer approval for a change incustomers have not agreed to both scope but for which it does not have an agreed upon price change.and price. Costs associated with unapproved change orders are included in the estimated cost to complete the contracts and are treated as project costs as incurred. The Company recognizes revenue equal to costs incurred on unapprovedWe will recognize a change orders based on an estimated probabilityin contract value if we believe it is probable that the
contract price will be adjusted and can be reliably estimated. Unapproved change orders involve the use of estimates, and it is reasonably possible that revisions to the estimated costs and recoverable amounts may be required in future reporting periods to reflect changes in estimates or final agreements with customers.
The Company considersWe consider claims to be amounts it seeks,we seek, or will seek, to collect from customers or others for customer-caused changes in contract specifications or design, or other customer-related causes of unanticipated additional
F-12
Table of Contents
contract costs on which there is no agreement with customers on both scopecustomers. Claims can also be caused by non-customer-caused changes, such as rain or other weather delays. Costs associated with claims are included in the estimated costs to complete the contracts and price changes.are treated as project costs when incurred. Claims are included in revenue to the calculation of revenues whenextent we have a reasonable legal basis, the related costs have been incurred, realization is probable, and amounts can be reliably determined. Revenues in excess of contract costs incurred on claims are recognized when the amounts have been agreed upon with the customer.estimated. Revenue in excess of contract costs from claims is recognized whenafter an agreement is reached with customers as to the value of the claims, which in some instances may not occur until after completion of work under the contract. Costs associated with
At December 31, 2017, we had unapproved change orders and claims are included in the estimated costs to completeexpected contract value that totaled approximately $67.8 million. These claims were in the contractsprocess of being negotiated in the normal course of business. Approximately $56.7 million of unapproved change orders and are treatedclaims had been recognized as project costs when incurred.
Other contract forms — The Company also uses unit-price, time and material, and cost reimbursable plus fee contracts. For these jobs, revenue is recognized primarily based on contractual terms. For example, time and material contract revenues are generally recognized on an input basis, based on labor hours incurred and on purchases made. Similarly, unit price contracts generally recognize revenue on an output based measurement such as the completion of specific units at a specified unit price.
At any time, if an estimate of total contract cost indicates a loss on a contract, the projected loss is recognized in full at that time. The loss amount is recognized as an “accrued loss provision” and is included in the accrued expenses and other liabilities amount on the balance sheet. For fixed price contracts, as thecumulative percentage-of-completion method is used to calculate revenues, the accrued loss provision is changed so that the gross profit for the contract remains zero in future periods. If we anticipate that there will be a loss for unit price or cost reimbursable contracts, the projected loss is recognized in full at that time.
Changes in job performance, job conditions and estimated profitability, including those arising from final contract settlements, may result in revisions to costs and income. These revisions are recognized in the period in which the revisions are identified.basis through December 31, 2017.
In all forms of contracts, we estimate the Company estimates its collectability of contract amounts at the same time that it estimateswe estimate project costs. If the Company anticipateswe anticipate that there may be issues associated with the collectability of the full amount calculated as revenues, the Companywe may reduce the amount recognized as revenue to reflect the uncertainty associated with realization of the eventual cash collection. For example, when a cost reimbursable project exceeds the client’s expected budget amount, the client frequently requests an adjustment to the final amount. Similarly, some utility clients reserve the right to audit costs for significant periods after performance of the work. In these situations, the Companywe may choose to defer recognition of a portion of the revenue up to the time thatuntil the client pays for the services.
The caption “Costs and estimated earnings in excess of billings” in the Consolidated Balance SheetSheets represents unbilled receivables which arise when revenues have been recorded but the amount will not be billed until a later date. Balances represent: (a) unbilled amounts arising from the use of the percentage-of-completion method of accounting which may not be billed under the terms of the contract until a later date or project milestone,milestone; (b) incurred costs to be billed under cost reimbursementreimbursable type contracts, (c)including amounts arising from routine lags in billing,billing; or (d)(c) the revenue associated with unapproved change orders or claims when realization is probable and amounts can be reliably determined.estimated. For those contracts in which billings exceed contract revenues recognized to date, the excess amounts are included in the caption “Billings in excess of costs and estimated earnings”.
In accordance with applicable terms of certain construction contracts, retainage amounts may be withheld by customers until completion and acceptance of the project. Some payments of the retainage may not be received for a significant period after completion of our portion of a project. In some jurisdictions, retainage amounts are deposited into an escrow account.
Accounts receivable—Accounts receivable and contract receivables are primarily with public and private companies and governmental agencies located in the United States. Credit terms for payment of products and services are extended to customers in the normal course of business and no interest is charged. Contract receivables are generally progress billings on projects, and as a result, are short term in nature. Generally, the Company requireswe require no collateral from itsour customers, but filesfile statutory liens or stop notices on any construction projects when collection problems are anticipated. While a project is underway, we estimate the Company estimates its collectability of contract amounts at the same time that it estimateswe estimate project costs. As discussed in the “Revenue recognition” section above, realization of the eventual cash collection may be recognized as adjustments to the contract revenue and profitability, otherwise, the Company useswe use the allowance method of accounting for losses from uncollectible accounts. Under this method an allowance is provided based upon historical experience and management’s evaluation of outstanding contract receivables at the end of each year. Receivables are written off in the period deemed uncollectible. The allowance for doubtful accounts at December 31, 20152017 and 20142016 was $480$0.5 million and $540,$1.0 million, respectively.
Significant revision in contract estimateestimates — Revenue recognition is based on the percentage-of-completion method for firm fixed-price contracts. Under this method, the costs incurred to date as a percentage of total estimated costs are used to calculate
F-13
Table of Contents
revenue. Total estimated costs, and thus contract revenues and margin, are impacted by many factors, which can cause significant changes in estimates during the life cycle of a project.
For projects that were in process at the end of the prior year, there can be a difference in revenues and profits that would have been recognized in the prior year, had current year estimates of costs to complete been known at the end of the prior year. For example, unusual weather in the first half of 2015 significantly changed the estimated costs to complete for several large highway projects. The changes impacted the percentage of completion calculation and profitability in 2015. If these changes had been known in 2014, the revenue and profitability in 2014 would have been decreased.
During the year ended December 31, 2015, certain contracts had revisions in cost estimates from those projected at December 31, 2014. If the revised estimates had been applied in the prior year, the gross profit earned on these contracts would have resulted in an increase of approximately $1,540 in gross profit in 2014. Similarly, had the revised estimates as of December 31, 2014 been applied in the prior year; the gross profit earned on these contracts would have resulted in an increase of approximately $17,266 in gross profit in 2013. The revised estimates for the year ended December 31, 2013 would have resulted in a gross profit increase of approximately $10,867 in the year 2012.
The following table presents the approximate financial impact of the changes in estimates that would have been reflected in the prior years 2014 and 2013 had the revised estimates been applied to the particular year.year (in thousands):
| | Estimated net impact of change in
estimate for year the year ended | | | | | | | | | | | |
| | 2014 | | 2013 | | | Net impact of change in estimate | |
| | | | | | | for the years ended December 31, | |
| | | 2017 | | 2016 | | 2015 | |
Revised estimates in 2017 that impact 2016 | | | $ | 6,435 | | $ | (6,435) | | $ | — | |
Revised estimates in 2016 that impact 2015 | | | | — | | | 1,685 | | | (1,685) | |
Revised estimates in 2015 that impact 2014 | | $ | 1,540 | | $ | — | | | | — | | | — | | | (1,540) | |
Revised estimates in 2014 that impact 2013 | | (17,266 | ) | 17,266 | | |
Revised estimates in 2013 that impact 2012 | | — | | (10,867 | ) | |
Net impact to gross margin | | $ | (15,726 | ) | $ | 6,399 | | | $ | 6,435 | | $ | (4,750) | | $ | (3,225) | |
EPS impact to year | | $ | (0.19 | ) | $ | 0.08 | | | $ | 0.09 | | $ | (0.05) | | $ | (0.04) | |
During the third quarter 2016, we settled a dispute with a customer on collection of a receivable of $17.9 million, receiving $38.0 million in cash. Prior to settlement, we recorded revenues with zero margin. We recognized the settlement as a change in accounting estimate which resulted in recognizing revenues of approximately $27.5 million and gross profit of approximately $26.7 million in the third quarter of 2016.
In October 2016, we announced that we planned to divest our Texas heavy civil business unit, which operates as a division of Primoris Heavy Civil. We engaged a financial advisor to assist in the marketing and sale of the business unit, and planned to continue operating the business unit until completion of a sale. In April 2017, the Board of Directors determined that based on the information available, we would attain the best long-term value by withdrawing from the sales process and continuing to operate the business unit. As a result of the planned divestiture, we recorded a charge of $37.3 million during the third quarter of 2016. This charge includes a reduction of the expected profitability of certain projects in the Belton, Texas area for the division and a reduction of costs and estimated earnings in excess of billings and an increase to the reserve for anticipated job losses.
The settlement of the disputed project and the charge related to the planned divestiture were not included in the table above.
Customer concentration — The Company operatesWe operate in multiple industry segments encompassing the construction of commercial, industrial and public works infrastructure assets primarily throughout primarily the United States. Typically, the top ten customers in any one calendar year generate revenues in excess of 50% of total revenues; however, the group that comprise the top ten customers varies from year to year. See “Note 17Note 15 — “Customer Concentrations”Concentrations” for further discussion.
Property and equipment—Property and equipment are recorded at cost and are depreciated using the straight-line method over the estimated useful lives of the related assets, usually ranging from three to thirty years. Maintenance and repairs are charged to expense as incurred. Significant renewals and betterments are capitalized. At the time of retirement or other disposition of property and equipment, the cost and accumulated depreciation are removed from the accounts, and any resulting gain or loss is reflected in operations.operating income.
The Company assessesWe assess the recoverability of property and equipment whenever events or changes in business circumstances indicate that the carrying amount of the asset may not be fully recoverable. We perform an undiscounted operation cash flow analysis to determine if impairment exists. The amount of property and equipment impairment, if any, is measured based on fair value and is
charged to operations in the period in which property and equipment impairment is determined by management. As of December 31, 20152017 and 2014, the Company’s2016, our management has not identified any material impairment of its property and equipment.
Taxes collected from customers—TaxesSales and use taxes collected from the Company’sour customers are recorded on a net basis.
Share-based payments and stock-based compensation—In July 2008,May 2013, the shareholders approved and the Companywe adopted the Primoris Services Corporation 2008 Long-term Incentive Equity Plan, which was replaced by the Primoris Services Corporation 2013 Long-term Incentive Equity Plan (“Equity Plan”) after approval of the shareholders and adoption by the Company on May 3, 2013.. Detailed discussion of shares issued under the Equity Plan are included in “Note 20Note 18 — “Deferred“Deferred Compensation Agreements and Stock-Based Compensation”Compensation” and in Note 24—22—“Stockholders’ Equity”. Such share issuances include grants of Restricted Stock Units to executives, issuance of stock to certain senior managers and executives and issuances of stock to non-employee members of the Board of Directors.
Contingent Earnout Liabilities—As part of past acquisitions, the Company agreed to pay cash to the sellers upon meeting certain operating performance targets for specified periods subsequent to the acquisition date. Each quarter, the Company evaluates the fair value of the estimated contingency and records a non-operating charge for the change in the fair value. Upon meeting the
F-14
Table of Contents
target, the Company reflects the full liability on the balance sheet and records a charge to “Selling, general and administration expense” for the change in the fair value of the liability from the prior period. See “Note 14 — “Contingent Earnout Liabilities” for further discussion.
Recently Issued Accounting Pronouncements
In May 2014, the FASB issued ASU No. 2014-09, “Revenue“Revenue from Contracts with Customers (Topic 606)”., with several clarifying updates issued during 2016 and 2017. The new standard is effective for reporting periods beginning after December 15, 2016 and early adoption is not permitted.2017. The comprehensive new standard will supersede existingall current revenue recognition guidancestandards and require revenue to be recognizedguidance. Revenue recognition will occur when promised goods or services are transferred to customers in amounts that reflect the consideration to which the company expects to be entitled to in exchange for those goods or services. AdoptionThe mandatory adoption will require new qualitative and quantitative disclosures about the nature, amount, timing and uncertainty of revenue and cash flows arising from customer contracts, including significant judgments and changes in judgments, information about contract balances and performance obligations, and assets recognized from costs incurred to obtain or fulfill a contract. The guidancestandard permits two implementation approaches, one requiringthe “modified retrospective application of the new standard with restatement of prior years and one requiringmethod”, which requires prospective application of the new standard with disclosureas a cumulative-effect adjustment. We will adopt this new standard using the modified retrospective method, which requires a cumulative-effect adjustment to retained earnings as of the date of adoption, if material. The adoption will only apply to customer contracts that are not substantially complete as of January 1, 2018.
We have substantially completed our evaluation of the impact of adopting the changesstandard on prior years.our financial position, results of operations, cash flows and related disclosures. Based on our evaluation, the cumulative impact of adopting Topic 606 is expected to be immaterial and will not require an adjustment to retained earnings. The FASB recently deferredimpact to our results is not material because Topic 606 generally supports the effective daterecognition of revenue over time under the cost-to-cost method for the Companymajority of our contracts, which is consistent with our current percentage of completion revenue recognition model.
We do not expect the new standard to January 1, 2018. The Companymaterially affect the timing and amount of total revenue that can be recognized over the life of a construction project; however, the revenue recognized on a quarterly basis during the construction period may change. We believe that Topic 606 is currently evaluating the potential impact of adoption and the implementation approachlikely to be used.more impactful to certain of our lump sum projects as a result of the following required changes from our current practices:
| · | | Performance obligations – Topic 606 requires a review of contracts and contract modifications to determine whether there are multiple performance obligations. Each separate performance obligation must be accounted for as a distinct project, which could impact the timing of revenue recognition. In connection with our evaluation, we discovered limited cases of multiple performance obligations which had minimal impact on revenue recognized to date. |
| · | | Variable consideration – In accordance with Topic 606, revenue recognition must account for variable consideration, including potential liquidated damages and customer discounts. We generally assess the impact of liquidated damages as an estimated cost of the project. The adoption of the new standard may affect the timing of the recognition of revenue for both liquidated damages and discounts. |
We do not expect Topic 606 to have a material impact on our Consolidated Balance Sheets, though we expect certain reclassifications among financial statement accounts to align with the new standard. We also expect significant expanded disclosures relating to revenue recognized during each period.
In February 2015,2016, the FASB issued ASU 2015-02 “Consolidation (Topic 810): Amendment to the Consolidation Analysis” which amends existing consolidation guidance, including amending the guidance related to determining whether an entity is a variable interest entity. The update is effective for interim and annual periods beginning after December 15, 2015, although early adoption is permitted. The guidance may be applied using a modified retrospective approach whereby the entity records a cumulative effect of adoption at the beginning of the fiscal year of initial application. A reporting entity may also apply the amendments on a full retrospective basis. The Company is currently evaluating the potential impact of this authoritative guidance on our consolidated financial statements.
In August 2014, the FASB issued ASU 2014-15 “ Presentation of Financial Statements — Going Concern (Subtopic 205-40)” to address the diversity in practice in determining when there is substantial doubt about an entity’s ability to continue as a going concern and when and how an entity must disclose certain relevant conditions and events. This update requires an entity to evaluate whether there are conditions or events, considered in the aggregate, that raise substantial doubt about the entity’s ability to continue as a going concern for a period of one year after the date that the financial statements are issued (or available to be issued). If such conditions or events exist, an entity should disclose that there is substantial doubt about the entity’s ability to continue as a going concern for a period of one year after the date that the financial statements are issued (or available to be issued), along with the principal conditions or events that raise substantial doubt, management’s evaluation of the significance of those conditions or events in relation to the entity’s ability to meet its obligations and management’s plans that are intended to mitigate those conditions or events. The guidance is effective for annual and interim periods ending after December 15, 2016. This guidance will impact the disclosure and presentation of how we report any substantial doubt about our ability to continue as a going concern, if such substantial doubt were to exist. The Company will adopt this guidance effective January 1, 2017.
During November 2015, the FASB issued ASU 2015-17 “Balance Sheet Classification of Deferred Taxes”, which simplifies the presentation of deferred income taxes. This ASU requires that deferred tax assets and liabilities be classified as non-current in a statement of financial position. The ASU provides for early adoption on both a prospective or retrospective basis. The ASU eliminates the need to analyze temporary differences to determine if deferred taxes should be reported as current or noncurrent. Past practice did not typically align with the time period in which deferred taxes were expected to be recovered or settled. For this reason, we early adopted ASU 2015-17 effective December 31, 2015 resulting in the classification of all deferred tax assets and liabilities as a net non-current deferred tax asset of $1,075 in our Consolidated Balance Sheet as of December 31, 2015. The ASU was adopted on a retrospective basis and accordingly, the presentation of net deferred taxes as of December 31, 2014 was conformed to the current year presentation, resulting in a net non-current deferred tax liability of $5,929, in order to provide improved comparability of deferred taxes between years.
On February 25, 2016, The FASB issued ASU 2016-02 “Leases (Topic 842)”. The ASU will require recognition of operating leases with lease terms of more than twelve months on the balance sheet as both assets for the rights and liabilities for the obligations created by the leases. The ASU will require disclosures that provide qualitative and quantitative information for the lease assets and liabilities recorded in the financial statements. The Company will evaluate the potential impact of the ASU on our consolidated financial statements. The guidancestandard is effective for fiscal years beginning after December 15, 2018. We have already revised our credit agreements to address the impact of ASU 2016-02 and are currently evaluating other impacts of adopting the standard on our financial position, results of operations, cash flows, and related disclosures. See Note 13 — “Commitments and Contingencies” for more information about the timing and amount of future operating lease payments, which we believe is indicative of the materiality of adoption of the ASU to our financial statements.
In March 2016, the FASB issued ASU 2016-09 “Compensation — Stock Compensation (Topic 718) — Improvements to Employee Share-Based Payment Accounting”. The ASU modifies the accounting for excess tax benefits and tax deficiencies associated with share-based payments by requiring that excess tax benefits or deficiencies be included in the income statement rather than in equity. Additionally, the tax benefits for dividends on share-based payment awards will also be reflected in the income statement. As a result of these modifications, the ASU requires that the tax-related cash flows resulting from share-based payments will be shown on the cash flow statement as operating activities rather than as financing activities. We adopted the ASU as of January 1, 2017, and it did not have a material impact on our consolidated financial statements.
In January 2017, the FASB issued ASU 2017-01, "Business Combinations (Topic 805): Clarifying the Definition of a Business" which changes the definition of a business to assist entities with evaluating when a set of transferred assets and activities is a business. ASU 2017-01 requires an entity to evaluate if substantially all of the fair value of the gross assets acquired is concentrated in a single identifiable asset or a group of similar identifiable assets; if so, the set of transferred assets and activities is not a business. ASU 2017-01 is effective for interim and annual reporting periods beginning after December 15, 2017. We do not expect the adoption of ASU 2017-01 to have any impact on our financial position, results of operations or cash flows.
In January 2017, the Financial Accounting Standards Board ("FASB") issued ASU 2017-04, "Simplifying the Test for Goodwill Impairment". ASU 2017-04 removes the second step of the goodwill impairment test, which requires a hypothetical purchase price allocation. A goodwill impairment will now be the amount by which a reporting unit's carrying value exceeds its fair value, not to exceed the carrying amount of goodwill. ASU 2017-04 is effective for interim and annual reporting periods beginning after December 15, 2019 and will be applied prospectively. We do not expect the adoption of ASU 2017-04 to have an impact on our financial position, results of operations or cash flows.
In May 2017, the FASB issued ASU 2017-09, “Compensation — Stock Compensation (Topic 718) — Scope of Modification Accounting”. The ASU amends the scope of modification accounting for share-based payment arrangements. The amendments in the ASU provide guidance on types of changes to the terms or conditions of share-based payment awards that would be required to apply modification accounting under ASC 718, “Compensation — Stock Compensation”. The ASU is effective for interim and annual reporting periods beginning after December 15, 2017 with early adoption permitted. We do not expect the adoption of ASU 2017-09 to have an impact on our financial position, results of operations or cash flows
Other new pronouncements issued but not effective until after December 31, 2017 are not expected to have a material impact on our consolidated results of operations, financial position or cash flows.
Note 3—Fair Value Measurements
ASC Topic 820, “Fair Value Measurements and Disclosures” defines fair value, establishes a framework for measuring fair value in GAAP and requires certain disclosures about fair value measurements. ASC Topic 820 addresses fair value GAAP for financial assets and financial liabilities that are re-measuredremeasured and reported at fair value at each reporting period and for non-financial assets and liabilities that are re-measuredremeasured and reported at fair value on a non-recurring basis.
In general, fair values determined by Level 1 inputs use quoted prices (unadjusted) in active markets for identical assets or liabilities. Fair values determined by Level 2 inputs use data points that are observable such as quoted
prices, interest rates and yield
F-15
Table of Contents
curves. Fair values determined by Level 3 inputs are “unobservable data points” for the asset or liability and include situations where there is little, if any, market activity for the asset or liability.
The following table presents, for each of the fair value hierarchy levels identified under ASC Topic 820, the Company’sour financial assets and certain liabilities that are required to be measured at fair value at December 31, 20152017 and 2014:2016 (in thousands):
| | | | Fair Value Measurements at Reporting Date | |
| | Amount
Recorded
on Balance
Sheet | | Quoted Prices
in Active Markets
for Identical Assets
(Level 1) | | Significant
Other
Observable
Inputs
(Level 2) | | Significant
Unobservable
Inputs
(Level 3) | |
Assets as of December 31, 2015: | | | | | | | | | |
Cash and cash equivalents | | $ | 161,122 | | $ | 161,122 | | — | | — | |
Liabilities as of December 31, 2015: None | | | | | | | | | |
| | | | | | | | | |
Assets as of December 31, 2014: | | | | | | | | | |
Cash and cash equivalents | | $ | 139,465 | | $ | 139,465 | | — | | — | |
Short-term investments | | $ | 30,992 | | $ | 30,992 | | — | | — | |
Liabilities as of December 31, 2014: | | | | | | | | | |
Contingent consideration | | $ | 6,922 | | — | | — | | $ | 6,922 | |
| | | | | | | | | | | | |
Short-term investments consist primarily of U.S. Treasury bills with various financial institutions that are backed by the federal government. There were no short-term investments at December 31, 2015.
| | | | | | | | | | | | | |
| | | | | Fair Value Measurements at Reporting Date | |
| | | | | | | | Significant | | | | |
| | Amount | | Quoted Prices | | Other | | Significant | |
| | Recorded | | in Active Markets | | Observable | | Unobservable | |
| | on Balance | | for Identical Assets | | Inputs | | Inputs | |
| | Sheet | | (Level 1) | | (Level 2) | | (Level 3) | |
Assets as of December 31, 2017: | | | | | | | | | | | | | |
Cash and cash equivalents | | $ | 170,385 | | $ | 170,385 | | $ | — | | $ | — | |
Liabilities as of December 31, 2017: | | | | | | | | | | | | | |
Contingent consideration | | $ | 716 | | $ | — | | $ | — | | $ | 716 | |
| | | | | | | | | | | | | |
Assets as of December 31, 2016: | | | | | | | | | | | | | |
Cash and cash equivalents | | $ | 135,823 | | $ | 135,823 | | $ | — | | $ | — | |
Liabilities as of December 31, 2016: | | | | | | | | | | | | | |
None | | | | | | | | | | | | | |
Other financial instruments of the Company not listed in the table consist of accounts receivable, accounts payable and certain accrued liabilities. These financial instruments generally approximate fair value based on their short-term nature. The carrying value of the Company’sour long-term debt approximates fair value based on comparison with current prevailing market rates for loans of similar risks and maturities.
The following table provides changes to the Company’sour contingent consideration liability Level 3 fair value measurements during the years ended December 31, 20152017 and 2014:2016 (in thousands):
| | Significant Unobservable Inputs
(Level 3) | |
| | 2015 | | 2014 | |
Contingent Consideration Liability | | | | | |
Beginning balance | | $ | 6,922 | | $ | 9,233 | |
Additions to contingent consideration liability: | | | | | |
Vadnais acquisition | | — | | 679 | |
Surber and Ram-Fab acquisitions | | — | | 1,154 | |
Change in fair value of contingent consideration liability during year | | 125 | | 856 | |
Reductions in the contingent consideration liability: | | | | | |
Payment to Q3C sellers for meeting performance targets — 2014 & 2015 | | (5,000 | ) | (5,000 | ) |
Reduction due to earn-outs not acheived — Surber, Vadnais and Ram Fab | | (2,047 | ) | — | |
Ending balance | | $ | — | | $ | 6,922 | |
| | | | | | | |
| | Significant Unobservable Inputs | |
| | (Level 3) | |
Contingent Consideration Liability | | 2017 | | 2016 | |
Beginning balance, January 1, | | $ | — | | $ | — | |
Florida Gas Contractors acquisition | | | 1,200 | | | — | |
Change in fair value of contingent consideration liability during year | | | (484) | | | — | |
Ending balance, December 31, | | $ | 716 | | $ | — | |
On a quarterly basis, the Company assesseswe assess the estimated fair value of the contractual obligation to pay the contingent consideration and any changes in estimated fair value are recorded as a non-operating charge in the Company’s statementour Statement of income.Income. Fluctuations in the fair value of contingent consideration are impacted by two unobservable inputs, management’s estimate of the probability (which has ranged from 33% to 100%) of the acquired company meeting the contractual operating performance target and the estimated discount rate (a rate that approximates the Company’sour cost of capital). Significant changes in either of those inputs in isolation would result in a different fair value measurement. Generally, a change in the assumption of the probability of meeting the performance target is accompanied by a directionally similar change in the fair value of contingent consideration liability, whereas a change in assumption used of the estimated discount rate is accompanied by a directionally opposite change in the fair value of contingent consideration liability.
Upon meeting the target, the Company reflectswe reflect the full liability on the balance sheet and recordsrecord a charge to “Selling, general and administration expense” for the change in the fair value of the liability from the prior period. See “Note 14 — “Contingent Earnout Liabilities” for further discussion.
F-16
Table of Contents
Note 4—Business Combinations
2015 Acquisitions
On February 28, 2015, the Company acquired the net assets of Aevenia, Inc. for $22.3 million in cash, and established a new entity, Primoris Aevenia, Inc. (“Aevenia”), which operates as part of the Company’s Energy segment. The acquisition provides electrical construction expertise for the Company and provides a greater presence and convenient access to the central plans area of the United States.
The purchase was accounted for using theMay 2017 acquisition method of accounting.Florida Gas Contractors included an earnout of $1.5 million payable in May 2018, contingent upon meeting certain performance targets. The assets were purchased for their estimated fair value and included current assets, current liabilities, plant and equipment, intangible assets and goodwill.
Since the acquisition date through December 31, 2015, Aevenia contributed revenues of $23,695 and gross margin of $2,378. Costs related to the Aevenia acquisition in the amount of $151 were expensed in 2015.
2014 Acquisitions
In May 2014, the Company created a wholly-owned subsidiary, Vadnais Trenchless Services, Inc., a California corporation (“Vadnais”) and on June 5, 2014, the Company purchased certain assets from Vadnais Corporation, a general contractor specializing in micro-tunneling based in California. The assets were purchased for their estimated fair value of $6,355the contingent consideration on the acquisition date was $1.2 million. Under ASC 805, we are required to estimate the fair value of contingent consideration based on facts and circumstances that existed as of the acquisition date and remeasure to fair value at each reporting date until the contingency is resolved. As a result of that remeasurement, we reduced the fair value of the contingent
consideration in cashthe fourth quarter of 2017 related to the FGC performance target contemplated in their purchase agreement, and included equipment, building and land.decreased the liability by $0.5 million with a corresponding increase in non-operating income.
We paid $5.0 million to the sellers of Q3C in March 2015 based on achievement of their operating performance targets each year, as outlined in the purchase agreement.
Note 4—Business Combinations
2017 Acquisitions
On May 26, 2017, we acquired certain assets of Florida Gas Contractors, a utility contractor specializing in underground natural gas infrastructure, for approximately $33.0 million in cash. In addition, upon meeting certain operating targets, the sellers could receive a contingent earnout amount of $900up to $1.5 million over a two-year period.one-year period ending May 26, 2018, based as of the achievement of certain operating targets. The estimated fair value of the potential contingent consideration on the acquisition date was $679.$1.2 million. FGC operates in the Utilities segment and expands our presence in the Florida and Southeast markets. The purchase was accounted for using the acquisition method of accounting. See Note 14 — “Contingent Consideration”.
During the thirdfourth quarter 2014,of 2017, we finalized the Company made three small acquisitions totaling $8,244 acquiring the net assetsestimate of Surber, Ram-Fab, and Williams (the “Third Quarter 2014 Acquisitions”). Surber and Ram-Fab operate as divisions of PES in the Energy segment, and Williams is a division of Cardinal Contractors, Inc. in the East segment. Surber provides general oil and gas related construction activities in Texas; Ram-Fab is a fabricator of custom piping systems located in Arkansas; and Williams provides construction services related to sewer pipeline maintenance, rehabilitation and integrity testing in the Florida market. The Surber purchase provided for a contingent earnout amount of up to $1,800 over a 3-year period, based on meeting certain operating targets, which had an estimated fair value of $955the acquired assets of FGC, which included $4.8 million of fixed assets; $3.3 million of working capital; $9.1 million of intangible assets; and $17.0 million of goodwill. In connection with the FGC acquisition, we also paid $3.5 million to acquire certain land and buildings. Intangible assets primarily consist of customer relationships. Goodwill associated with the FGC acquisition principally consists of expected benefits from providing expertise for our construction efforts in the underground utility business as well as the expansion of our geographic presence. Goodwill also includes the value of the assembled workforce that FGC provides to us. Based on the acquisition date. The Ram-Fab purchase includedcurrent tax treatment, goodwill will be deductible for income tax purposes over a $200 contingent earnout based on estimated earnings of a six-month operating project, which had an estimated fair value of $200 onfifteen-year period. From the acquisition date. Alldate through December 31, 2017, FGC contributed revenues of the purchases were$15.5 million and gross margin of $3.8 million.
On May 30, 2017, we acquired certain engineering assets for approximately $2.3 million in cash which further enhances our ability to provide quality service for engineering and design projects. The purchase was accounted for using the acquisition method of accounting. See Note 14 — “Contingent Consideration”.
FromThe allocation of the total purchase price consisted of $0.2 million of fixed assets and $2.1 million of intangible assets. Intangible assets primarily consist of customer relationships. The operations of this acquisition dateswere fully integrated into our operations and no separate financial results were maintained. Therefore, it is impracticable for us to report the Vadnais acquisition and the Third Quarter 2014 Acquisitions through December 31, 2014, their first partial year, they contributedamounts of revenues of $9,300 and gross lossprofit included in the Consolidated Statements of $45. Acquisition costs related to these 2014 acquisitions of $355 were expensed in 2014.Income.
On June 16, 2017, we acquired certain assets and liabilities of Coastal Field Services for approximately $27.5 million in cash. Coastal provides pipeline construction and maintenance, pipe and vessel coating and insulation, and integrity support services for companies in the oil and gas industry. Coastal operates in the Pipeline segment and increases our market share in the Gulf Coast energy market. The purchase was accounted for using the acquisition method of accounting. The preliminary allocation of the total purchase price consisted of $4.0 million of fixed assets; $4.6 million of working capital; $9.9 million of intangible assets; $9.3 million of goodwill; and $0.3 million of long-term capital leases. We continue to assess the final cutoff data and expect to finalize the estimate of fair value of the acquired assets acquiredof Coastal during 2018. Intangible assets primarily consist of customer relationships and tradename. Goodwill associated with the liabilities assumedCoastal acquisition principally consists of expected benefits from providing expertise for the 2015 and 2014 acquisitions is detailedour expansion of services in the section below “Schedulepipeline construction and maintenance business. Goodwill also includes the value of Assets Acquiredthe assembled workforce that Coastal provides to us. Based on the current tax treatment, goodwill will be deductible for income tax purposes over a fifteen-year period. From the acquisition date through December 31, 2017, Coastal contributed revenues of $17.9 million and Liabilities Assumed for 2015 and 2014 Acquisitions”.gross margin of $3.2 million.
2016 Acquisitions
On January 29, 2016, we acquired certain assets and liabilities of Mueller Concrete Construction Company for $4.1 million. The purchase was accounted for using the acquisition method of accounting. During the second quarter of 2016, we finalized the estimate of fair value of the acquired assets of Mueller, which included $2.0 million of fixed assets, $2.0 million of goodwill and $0.1 million of inventory. Mueller operates within the Utilities segment. Goodwill
largely consists of expected benefits from providing foundation expertise for our construction efforts in underground line work, substations and telecom/fiber. Goodwill also includes the value of the assembled workforce that Mueller provides to our business. Based on the current tax treatment, goodwill will be deductible for income tax purposes over a fifteen-year period. The operations of Mueller were fully integrated into our operations and no separate financial results were maintained. Therefore, it is impracticable for us to report the amounts of revenues and gross profit included in the Consolidated Statements of Income.
On June 24, 2016, we purchased property, plant and equipment from Pipe Jacking Unlimited, Inc., consisting of specialty directional drilling and tunneling equipment for $13.4 million in cash. We determined this purchase did not meet the definition of a business as defined under ASC 805. The estimated fair value of the equipment was equal to the purchase price. We believe the purchase of the equipment will aid in our pipeline construction projects and enhance the work provided to our utility clients. Pipe Jacking operations are included in the Pipeline segment.
On November 18, 2016, we acquired certain assets and liabilities of Northern Energy & Power for $6.9 million. Northern operates in the Power segment and serves the renewable energy sector with a specific focus on solar photovoltaic installations in the United States. The purchase was accounted for using the acquisition method of accounting. During the second quarter of 2017, we finalized our estimated fair value of the acquired assets of Northern, which resulted in a $0.1 million reduction in goodwill compared to amounts previously recorded. The allocation of the total purchase price included $3.0 million of intangible assets, $3.7 million of goodwill and $0.1 million of fixed assets. Intangible assets consist of customer relationships. Goodwill is derived from the expected benefits of services in the renewable energy sector with a specific focus on Solar Photovoltaic installations in the United States. Goodwill also includes the value of the assembled workforce that Northern provides to our business. Based on the current tax treatment, goodwill will be deductible for income tax purposes over a fifteen-year period. For the year ended December 31, 2017, Northern contributed revenues of $19.1 million and gross profit of $1.1 million. From the acquisition date through December 31, 2016, Northern contributed revenues of $2.0 million and gross margin of $0.6 million.
2015 Acquisitions
On February 28, 2015, we acquired the net assets of Aevenia, Inc. (“Aevenia”) for $22.3 million in cash, which operates as part of our Utilities segment. The acquisition provides electrical construction expertise and provides a greater presence and convenient access to the central plains area of the United States. The purchase was accounted for using the acquisition method of accounting. The allocation of the total purchase price consisted of $11.2 million of fixed assets; $2.1 million of working capital; $3.8 million of intangible assets; and $5.2 million of goodwill. Goodwill largely consists of expected benefits from providing electrical construction expertise for us and the greater presence and convenient access to the central plains area of the United States. Goodwill also includes the value of the assembled workforce that Aevenia provides to our business. For the year ended December 31, 2017, Aevenia contributed revenues of $24.5 million and gross profit of $1.4 million. For the year ended December 31, 2016, Aevenia contributed revenues of $26.4 million and gross profit of $1.0 million. From the acquisition date through December 31, 2015, Aevenia contributed revenues of $23.7 million and gross margin of $2.4 million.
Summary of Cash Paid for Acquisitions for the years ended December 31, 2015 and 2014
The following table summarizes the cash paid for acquisitions under ASC 805 for the years ended December 31, 2017, 2016, and 2015 (in thousands):
| | | | | | | | | | |
| | Year ended December 31, | |
| | 2017 | | 2016 | | 2015 | |
Coastal — purchased June 16, 2017 | | $ | 27,519 | | $ | — | | $ | — | |
Engineering — purchased May 30, 2017 | | | 2,315 | | | — | | | — | |
Florida Gas — purchased May 26, 2017 | | | 36,492 | | | — | | | — | |
Northern — purchased November 18, 2016 | | | (121) | * | | 6,889 | | | — | |
Mueller — purchased January 29, 2016 | | | | | | 4,108 | | | — | |
Aevenia — purchased February 28, 2015 | | | — | | | — | | | 22,302 | |
Cash paid | | $ | 66,205 | | $ | 10,997 | | $ | 22,302 | |
* In the second quarter of 2017, we finalized the estimated fair value of the Northern acquisition, which resulted in receipt of $0.1 million in cash and 2014.a reduction in goodwill.
| | Year ended December 31, | |
| | 2015 | | 2014 | |
| | | | | |
Aevenia — purchased February 28, 2015 | | 22,302 | | — | |
Vadnais — purchased June 5, 2014 | | — | | 6,355 | |
Surber — purchased July 28, 2014 | | — | | 3,642 | |
Ram-Fab — purchased August 29, 2014 | | — | | 3,569 | |
Williams — purchased September 19, 2014 | | — | | 1,030 | |
Cash paid | | $ | 22,302 | | $ | 14,596 | |
| | | | | | | |
Schedule of Assets Acquired and Liabilities Assumed for 2015 and 2014 Acquisitions
The following table summarizes the fair value of the assets acquired and the liabilities assumed at the acquisition date:date (in thousands):
| | | | | | | | | |
| Year ended December 31, | |
| 2017 | | 2016 | | 2015 | |
| Acquisitions | | Acquisitions | | Acquisitions | |
Accounts receivable | $ | 10,721 | | $ | 1,606 | | $ | 2,734 | |
Costs and estimated earnings in excess of billings | | 580 | | | — | | | — | |
Inventory and other assets | | 2,352 | | | 64 | | | 1,476 | |
Property, plant and equipment | | 12,402 | | | 2,133 | | | 11,173 | |
Intangible assets | | 21,125 | | | 3,000 | | | 3,850 | |
Goodwill | | 26,269 | | | 5,781 | | | 5,152 | |
Accounts payable | | (3,380) | | | (726) | | | (743) | |
Billings in excess of costs and estimated earnings | | (447) | | | — | | | — | |
Accrued expenses | | (2,096) | | | (861) | | | (1,340) | |
Total | $ | 67,526 | | $ | 10,997 | | $ | 22,302 | |
F-17
Table of Contents
| | Year ended December 31, | |
| | 2015
Acquisition | | 2014
Acquisitions | |
| | | | | |
Cash | | — | | 3 | |
Accounts receivable | | 2,734 | | 2,768 | |
Inventory and other assets | | 1,154 | | 711 | |
Prepaid expenses | | 322 | | 57 | |
Property, plant and equipment | | 11,173 | | 11,802 | |
Other assets | | — | | 4 | |
Intangible assets | | 3,850 | | 1,779 | |
Goodwill | | 5,152 | | 784 | |
Accounts payable | | (743 | ) | (570 | ) |
Accrued expenses | | (1,340 | ) | (905 | ) |
Total | | $ | 22,302 | | $ | 16,433 | |
| | | | | | | |
Identifiable Tangible Assets. For each of the acquisitions, significant identifiable tangible assets acquired include accounts receivable, inventory and fixed assets, consisting primarily of construction equipment. The CompanyWe determined that the recorded value of accounts receivable and inventory reflect fair value of those assets. The CompanyWe estimated the fair value of fixed assets on the effective dates of the acquisitions using a market approach, based on comparable market values for similar equipment of similar condition and age.
Identifiable Intangible Assets. The Company estimated and used We generally use the assistance of an independent third party valuation specialist to determineestimate the fair value of the intangible assets acquired for the acquisitions. The fair value measurements of the intangible assets were based primarily on significant unobservable inputs and thus represent a Level 3 measurement as defined in Note 3 — “Fair Value Measurements”. Based on the Company’sour assessment, the acquired intangible asset categories, fair value and average amortization periods, generally on a straight-line basis, and fair values are as follows:follows (in thousands):
| | | | | | | | | | | | | |
| | Amortization
Period | | 2015
Fair Value | | 2014
Fair Value | | | Amortization | | 2017 | | 2016 | | 2015 | |
| | | | | | | | | Period | | Fair Value | | Fair Value | | Fair Value | |
Tradename | | 3 to 10 years | | $ | — | | $ | 650 | | | 1 to 3 years | | $ | 2,150 | | $ | — | | $ | — | |
Non-compete agreements | | 2 to 5 years | | 1,350 | | 250 | | | 2 to 5 years | | | 550 | | | — | | | 1,350 | |
Customer relationships | | 5 to 10 years | | 2,500 | | 879 | | | 5 to 10 years | | | 18,150 | | | 3,000 | | | 2,500 | |
Other | | | 3 years | | | 275 | | | — | | | — | |
Total | | | | $ | 3,850 | | $ | 1,779 | | | | | $ | 21,125 | | $ | 3,000 | | $ | 3,850 | |
The fair value of the tradename was determined based on the “relief from royalty” method. A royalty rate was selected based on consideration of several factors, including external research of third party trade name licensing agreements and their royalty rate levels, and management estimates. The useful life was estimated at ten years for the Third Quarter 2014 Acquisitions based on management’s expectation for continuing value of the tradename in the future.
The fair value for the non-compete agreements was valued based on a discounted “income approach” model, including estimated financial results with and without the non-compete agreements in place. The agreements were analyzed based on the potential impact of competition that certain individuals could have on the financial results, assuming the agreements were not in place. An estimate of the probability of competition was applied and the results were compared to a similar model assuming the agreements were in place.
The customer relationships were valued utilizing the “excess earnings method” of the income approach. The estimated discounted cash flows associated with existing customers and projects were based on historical and market participant data. Such discounted cash flows were net of fair market returns on the various tangible and intangible assets that are necessary to realize the potential cash flows.
Goodwill. Goodwill for Aevenia largely consists of expected benefits from providing electrical construction expertise for the Company and the greater presence and convenient access to the central plains area of the United States. Goodwill attributable to Surber consists largely for the expected benefits from the geographic expansion into the growing Midland/Permian Basin area of Texas and to the expansion of offerings for the Energy segment to include more pipeline and station work and a greater presence and convenient access to south Texas, the Houston ship channel and Louisiana. Goodwill also includes the value of the assembled workforce of the various acquired businesses.
Based on the current tax treatment of the acquisitions, the goodwill and other intangible assets associated with them are deductible for income tax purposes over a fifteen-year period.
Supplemental Unaudited Pro Forma Information
In accordance with ASC 805, theThe following pro forma information for the twelve months ended December 31, 20152017 and 20142016 presents theour results of operations of the Company as if the Aevenia acquisition, the Vadnais acquisition2017 acquisitions of FGC and Coastal and the Third Quarter 2014 Acquisitions2016 acquisitions of Mueller and Northern had all occurred at the beginning of 2014.2016. The supplemental pro forma information has been adjusted to include:
| · | | the pro forma impact of amortization of intangible assets and depreciation of property, plant and equipment, based on the purchase price allocations; and |
· the pro forma impact of amortization of intangible assets and depreciation of property, plant and equipment, based on the fair values assigned to the purchased assets;
· the pro forma impact of the expense associated with the amortization of the discount for the fair value of the contingent consideration (related to the Third Quarter 2014 Acquisitions) for potential earnout liabilities that may be achieved during the years 2015 through 2017; and
· the pro forma tax effect of both the income before income taxes and the pro forma adjustments, calculated using a tax rate of 39.0% for the years ended 2015 and 2014.
| · | | the pro forma tax effect of both the income before income taxes and the pro forma adjustments, calculated using a tax rate of 28.2% and 44.2% for the years ended December 31, 2017 and 2016, respectively. |
The pro forma results are presented for illustrative purposes only and are not necessarily indicative of, or intended to represent, the results that would have been achieved had the various acquisitions been completed on January 1, 2014.2016. For example, the pro forma results do not reflect any operating efficiencies and associated cost savings that the Companywe might have achieved with respect to the acquisitions.acquisitions (in thousands):
| | | | | | | |
| | Year Ended December 31, | |
| | 2017 | | 2016 | |
| | (unaudited) | | (unaudited) | |
Revenues | | $ | 2,406,062 | | $ | 2,092,872 | |
Income before provision for income taxes | | $ | 107,055 | | $ | 57,280 | |
Net income attributable to Primoris | | $ | 73,626 | | $ | 31,415 | |
| | | | | | | |
Weighted average common shares outstanding: | | | | | | | |
Basic | | | 51,481 | | | 51,762 | |
Diluted | | | 51,741 | | | 51,989 | |
| | | | | | | |
Earnings per share: | | | | | | | |
Basic | | $ | 1.43 | | $ | 0.61 | |
Diluted | | $ | 1.42 | | $ | 0.60 | |
| | 2015 | | 2014 | |
| | (unaudited) | | (unaudited) | |
Revenues | | $ | 1,932,413 | | $ | 2,154,440 | |
Income before provision for income taxes | | $ | 59,309 | | $ | 104,745 | |
Net income attributable to Primoris | | $ | 35,781 | | $ | 64,631 | |
| | | | | |
Weighted average common shares outstanding: | | | | | |
Basic | | 51,647 | | 51,607 | |
Diluted | | 51,798 | | 51,747 | |
| | | | | |
Earnings per share attributable to Primoris: | | | | | |
Basic | | $ | 0.69 | | $ | 1.25 | |
Diluted | | $ | 0.69 | | $ | 1.25 | |
Note 5—Accounts Receivable
The following is a summary of accounts receivable at December 31:31 (in thousands):
| | 2015 | | 2014 | | | | | | | |
Contracts receivable, net of allowance for doubtful accounts of $480 and $540 for 2015 and 2014, respectively | | $ | 288,300 | | $ | 287,806 | | |
| | | 2017 | | 2016 | |
Contracts receivable, net of allowance for doubtful accounts of $480 at December 31, 2017 and $1,030 at December 31, 2016, respectively | | | $ | 286,113 | | $ | 340,871 | |
Retention receivable | | 31,396 | | 49,104 | | | | 66,586 | | | 46,394 | |
| | 319,696 | | 336,910 | | | | 352,699 | | 387,265 | |
Other accounts receivable | | 892 | | 472 | | | | 5,476 | | | 735 | |
| | $ | 320,588 | | $ | 337,382 | | | $ | 358,175 | | $ | 388,000 | |
Note 6—Costs and Estimated Earnings on Uncompleted Contracts
Costs and estimated earnings on uncompleted contracts consist of the following at December 31:31 (in thousands):
| | | | | | | |
| | 2015 | | 2014 | | | 2017 | | 2016 |
Costs incurred on uncompleted contracts | | $ | 5,413,224 | | $ | 5,194,769 | | | $ | 6,040,678 | | $ | 5,391,124 |
Gross profit recognized | | 625,280 | | 613,510 | | | | 519,173 | | | 456,871 |
| | 6,038,504 | | 5,808,279 | | | | 6,559,851 | | | 5,847,995 |
Less: billings to date | | (6,061,924 | ) | (5,898,220 | ) | | | (6,558,793) | | | (5,821,983) |
| | $ | (23,420 | ) | $ | (89,941 | ) | | $ | 1,058 | | $ | 26,012 |
F-19
This amount is included under the following captions in the accompanying consolidated balance sheetsConsolidated Balance Sheets at December 31 under the following captions:(in thousands):
| | | | | | |
| | 2017 | | 2016 |
Costs and estimated earnings in excess of billings | | $ | 160,092 | | $ | 138,618 |
Billings in excess of cost and estimated earnings | | | (159,034) | | | (112,606) |
| | $ | 1,058 | | $ | 26,012 |
| | 2015 | | 2014 | |
Costs and estimated earnings in excess of billings | | $ | 116,455 | | $ | 68,654 | |
Billings in excess of cost and estimated earnings | | (139,875 | ) | (158,595 | ) |
| | $ | (23,420 | ) | $ | (89,941 | ) |
Note 7—Property and Equipment
The following is a summary of property and equipment at December 31:31 (in thousands):
| | | | | | | | | | |
| | 2015 | | 2014 | | Useful Life | | | 2017 | | 2016 | | Useful Life | |
Land and buildings | | $ | 54,827 | | $ | 40,604 | | 30 years | | | $ | 82,755 | | $ | 56,878 | | Buildings 30 Years | |
Leasehold improvements | | 11,071 | | 11,267 | | Lease life | | | | 12,601 | | | 12,147 | | Lease Life | |
Office equipment | | 5,958 | | 3,651 | | 3 - 5 years | | | | 8,888 | | | 8,083 | | 3 - 5 Years | |
Construction equipment | | 340,895 | | 308,915 | | 3 - 7 years | | | | 392,454 | | | 368,241 | | 3 - 7 Years | |
Transportation equipment | | 93,613 | | 83,845 | | 3 - 18 years | | | | 101,855 | | | 98,113 | | 3 - 18 Years | |
Construction in progress | | | | 16,336 | | | 2,321 | | | |
| | 506,364 | | 448,282 | | | | | | 614,889 | | | 545,783 | | | |
Less: accumulated depreciation and amortization | | (222,819 | ) | (176,851 | ) | | | | | (303,112) | | | (268,437) | | | |
Net property and equipment | | $ | 283,545 | | $ | 271,431 | | | | |
Property and equipment, net | | | $ | 311,777 | | $ | 277,346 | | | |
Note 8—Equity Method Investments
WesPac Energy LLC and WesPac Midstream LLC
On July 1, 2010, the Company acquired a 50% membership interest in WesPac Energy LLC (“WesPac”), a Nevada limited liability company, from Kealine Holdings, LLC (“Kealine”), a Nevada limited liability company, with Kealine retaining a remaining 50% membership interest. WesPac developed pipeline
Note 8—Goodwill and terminal projects, primarily for the oil and gas industry.
On September 30, 2013, WesPac, Kealine and the Company entered into an agreement (the “Midstream Agreement”) with Highstar Capital IV, LP (“Highstar”), to form a new entity, WesPac Midstream LLC, a Delaware limited liability company (“Midstream”), with WesPac contributing project assets to Midstream and Highstar investing $6,082 in cash.Intangible Assets
The Company accountedchange in goodwill by segment for 2017 and 2016 was as follows (in thousands):
| | | | | | | | | | | | | | | | |
| | Power | | Pipeline | | Utilities | | Civil | | Total | |
Balance at January 1, 2016 | | $ | 20,731 | | $ | 42,252 | | $ | 18,312 | | $ | 42,866 | | $ | 124,161 | |
Goodwill acquired during the year | | | 3,781 | | | — | | | 2,000 | | | — | | | 5,781 | |
Goodwill impairment | | | — | | | — | | | — | | | (2,716) | | | (2,716) | |
Balance at December 31, 2016 | | $ | 24,512 | | $ | 42,252 | | $ | 20,312 | | $ | 40,150 | | $ | 127,226 | |
Goodwill acquired during the year | | | — | | | 9,269 | | | 17,000 | | | — | | | 26,269 | |
Purchase price allocation adjustments | | | (121) | | | — | | | — | | | — | | | (121) | |
Balance at December 31, 2017 | | $ | 24,391 | | $ | 51,521 | | $ | 37,312 | | $ | 40,150 | | $ | 153,374 | |
During the investment usingthird quarter of 2016, we made a decision to divest our Texas heavy civil business unit, a division of Primoris Heavy Civil within the equity methodCivil segment. We engaged a financial advisor to assist in the marketing and sale of accountingthe business unit, and planned to continue operating the business unit until completion of a sale. In April 2017, the Board of Directors determined that based on the information available, we would attain the best long-term value by withdrawing from the sales process and continuing to operate the business unit. We will aggressively pursue claims for five Texas Department of Transportation projects that resulted in significant losses recorded its proportionate sharein 2016. However, there can be no assurance as to the final amounts collected. In accordance with ASC 350, the planned divestiture triggered an analysis of operating expenses. Duringthe goodwill at Primoris Heavy Civil, resulting in a pretax, non-cash goodwill impairment charge of approximately $2.7 million in the third quarter of 2016.
In the fourth quarter of 2013,2015, an impairment expense of $0.4 million was recorded relating to the Company determined thatgoodwill attributed to Cardinal Contractors, Inc., which is part of the investment was impaired and recorded a non-cash impairment charge and wrote-off the total value of its equity investment of $4,932.Power Segment.
In 2014, the Company entered into negotiations with the membersThere was no impairment of Midstream, and in August 2014, the Company entered into a redemption agreement for the sale of all of the Company’s ownership in both WesPac and Midstream for a total of $5,250 in cash, which was recorded as income from non-consolidated entities.
St.—Bernard Levee Partners
The Company purchased a 30% interest in St.—Bernard Levee Partners (“Bernard”) in 2009 for $300 and accounted for this investment using the equity method. Bernard engaged in construction activities in Louisiana, and all work was completed in January 2013. The Company’s share of Bernard distributionsgoodwill for the year ended December 31, 2013 was $145.2017.
Alvah, Inc.
As part of its acquisition of Q3C in November 2012, the Company acquired a 49% membership interest in Alvah, Inc., a California corporation (“Alvah”). Alvah was engaged in electrical contracting activities, primarily in Northern California.
On February 5, 2014, the majority owner of Alvah, in accordance with the original investment agreement, elected to purchase the Company’s minority interest effective January 1, 2014 for a cash payment of $1,189.
F-20
Note 9—Goodwill and Intangible Assets
Goodwill was recorded at our reporting units at December 31 as follows:
Reporting Unit | | Segment | | 2015 | | 2014 | |
Rockford | | West | | $ | 32,079 | | $ | 32,079 | |
Q3C | | West | | 13,160 | | 13,160 | |
JCG (includes JCG Heavy Civil and Infrastructure and Maintenance divisions) | | East | | 42,866 | | 42,866 | |
Cardinal Contractors, Inc. | | East | | — | | 401 | |
PES (includes PPS, PES Industrial, FSSI, Saxon and Surber divisions) | | Energy | | 28,463 | | 28,463 | |
OnQuest Canada, ULC | | Energy | | 2,441 | | 2,441 | |
Aevenia | | Energy | | 5,152 | | — | |
| | | | | | | | | |
Total Goodwill | | | | $ | 124,161 | | $ | 119,410 | |
The table below summarizes the intangible asset categories, amounts and the average amortization periods, which are generally on a straight-line basis, at December 31:31 (in thousands):
| | | | | | | | | | | | | | | | |
| | Amortization | | | | Amount | | | | | December 31, 2017 | | December 31, 2016 | |
| | Period | | | | 2015 | | 2014 | | | Weighted Average Life | | Gross Carrying Amount | | Accumulated Amortization | | Gross Carrying Amount | | Accumulated Amortization | |
Tradename | | 3 to 10 years | | | | $ | 15,019 | | $ | 18,194 | | | 9 years | | $ | 32,175 | | $ | (22,238) | | $ | 30,485 | | $ | (18,733) | |
Customer relationships | | | 10 years | | | 49,900 | | | (16,338) | | | 33,579 | | | (13,439) | |
Non-compete agreements | | 2 to 5 years | | | | 1,424 | | 1,074 | | | 5 years | | | 1,900 | | | (820) | | | 2,250 | | | (1,301) | |
Customer relationships | | 5 to 15 years | | | | 19,995 | | 20,313 | | |
Other | | | 3 years | | | 275 | | | (54) | | | — | | | — | |
| | | | Total | | $ | 36,438 | | $ | 39,581 | | | | | $ | 84,250 | | $ | (39,450) | | $ | 66,314 | | $ | (33,473) | |
Amortization expense of intangible assets was $6,793, $7,504$8.7 million, $6.6 million and $7,467$6.8 million for the years ended December 31, 2017, 2016 and 2015, 2014 and 2013, respectively. In the second quarter of 2017, we recorded a $0.5 million impairment charge related to our tradename intangible assets. Estimated future amortization expense for intangible assets as of December 31, 20152017 is as follows:follows (in thousands):
For the Years Ending
December 31, | | Estimated
Intangible
Amortization
Expense | |
2016 | | $ | 6,460 | |
2017 | | 6,183 | |
2018 | | 5,719 | |
2019 | | 5,510 | |
2020 | | 3,112 | |
Thereafter | | 9,454 | |
| | $ | 36,438 | |
| | | | |
| | Estimated | |
| | Intangible | |
For the Years Ending | | Amortization | |
December 31, | | Expense | |
2018 | | $ | 9,541 | |
2019 | | | 9,193 | |
2020 | | | 6,442 | |
2021 | | | 5,203 | |
2022 | | | 4,048 | |
Thereafter | | | 10,373 | |
| | $ | 44,800 | |
Note 10—9—Accounts Payable and Accrued Liabilities
At December 31, 20152017 and 2014,2016, accounts payable included retention amounts of approximately $8,375$13.5 million and $9,285,$10.6 million, respectively. These amounts due to subcontractors have been retained pending contract completion and customer acceptance of jobs.
The following is a summary of accrued expenses and other current liabilities at December 31:31 (in thousands):
| | | | | | | |
| | 2015 | | 2014 | | | 2017 | | 2016 |
Payroll and related employee benefits | | $ | 33,358 | | $ | 37,261 | | | $ | 45,708 | | $ | 43,768 |
Insurance, including self-insurance reserves | | 44,695 | | 34,377 | | | | 47,256 | | | 42,546 |
Reserve for estimated losses on uncompleted contracts | | 7,261 | | 2,363 | | | | 10,067 | | | 12,801 |
Corporate income taxes and other taxes | | 2,447 | | 3,775 | | | | 2,843 | | | 3,368 |
Accrued administrative cost | | 1,415 | | 1,059 | | |
Other | | 4,420 | | 4,566 | | | | 5,513 | | | 5,523 |
| | $ | 93,596 | | $ | 83,401 | | | $ | 111,387 | | $ | 108,006 |
F-21
Table of Contents
Note 11—10—Capital Leases
The Company leasesWe lease vehicles and certain equipment under capital leases. The economic substance of the leases is as a financing transaction for acquisition of the vehicles and equipment, and accordingly, the leases are recorded as assets and liabilities. Included in depreciation expense is amortizationdepreciation of vehicles and equipment held under capital leases, amortized over their useful lives on a straight-line basis.
At December 31, 2015,2017, total assets under capital leases were $4,874,$3.1 million, accumulated depreciation was $4,103$1.9 million, and the net book value was $771.$1.2 million. For 2014,2016, total assets under capital leases were $5,528,$2.5 million, accumulated depreciation was $3,506$2.3 million, and the net book value of assets was $2,022.$0.2 million.
The following is a schedule by year of the future minimum lease payments required under capital leases together with their present value as of December 31:31 (in thousands):
2016 | | $ | 990 | | |
2017 | | 7 | | |
| | | | |
2018 | | 6 | | | $ | 134 |
2019 | | 6 | | | | 98 |
2020 | | 5 | | | | 90 |
2021 | | | | 11 |
2022 | | | | — |
Total minimum lease payments | | $ | 1,014 | | | $ | 333 |
Amounts representing interest | | (18 | ) | | | (5) |
Net present value of minimum lease payments | | 996 | | | | 328 |
Less: current portion of capital lease obligations | | (974 | ) | | | (132) |
Long-term capital lease obligations | | $ | 22 | | | $ | 196 |
Note 12—Credit Arrangements
Note 11—Credit facilitiesArrangements
Long-term debt and long-term debtcredit facilities consist of the following at December 31:31 (in thousands):
| | 2015 | | 2014 | |
| | | | | |
Commercial equipment notes payable to various commercial equipment finance companies and banks with interest rates that range from 1.78% to 3.51% per annum. Monthly principal and interest payments are due in the amount of $2,521 per month until the maturity dates, which range from November 30, 2016 to December 13, 2020. The notes are secured by certain construction equipment of the Company | | $ | 83,711 | | $ | 112,420 | |
| | | | | |
Commercial equipment notes payable to various commercial equipment finance companies and banks with interest rates that range from 1.94% to 2.75% per annum. Monthly principal and interest payments are due in the amount of $999 per month until the maturity dates, which range from March 31, 2019 to September 24, 2021. The notes are secured by certain construction equipment assets of the Company | | 44,587 | | 55,518 | |
| | | | | |
Commercial equipment notes payable to various commercial equipment finance companies and banks with interest rates that range from 2.01% to 2.19% per annum. Monthly principal and interest payments are due in the amount of $735 per month until the maturity dates, which range from March 5, 2020 to September 24, 2020. The notes are secured by certain construction equipment assets of the Company | | 38,041 | | — | |
| | | | | |
Two secured mortgage notes payable to a bank, with an interest rate of 4.3% per annum. Monthly principal and interest payments of $60 per month began January 1, 2016 and continue until the maturity date of January 1, 2031. The notes are secured by two buildings | | 7,950 | | — | |
| | | | | |
Senior Secured Notes payable to an insurance finance company, with interest rates that range from 3.65% to 4.60% per annum, with quarterly interest payments. Principal repayment for the $50,000 loan starts on December 28, 2016, for the $25,000 loan on July 15, 2017 and for the second $25,000 loan on November 9, 2019, and continue until their maturity dates, which range from December 28, 2022 to November 9, 2025. The notes are secured by the assets of the Company | | 100,000 | | 75,000 | |
| | | | | |
| | 274,289 | | 242,938 | |
Less: current portion | | (54,436 | ) | (38,909 | ) |
Long-term debt, net of current portion | | $ | 219,853 | | $ | 204,029 | |
F-22Commercial Notes Payable and Mortgage Notes Payable
| | | | | | | |
| | 2017 | | 2016 | |
Commercial equipment notes | | $ | 165,532 | | $ | 161,148 | |
Mortgage notes | | | 11,242 | | | 7,564 | |
Revolving credit facility | | | — | | | — | |
Senior secured notes | | | 82,143 | | | 92,858 | |
Total debt | | | 258,917 | | | 261,570 | |
Unamortized debt issuance costs | | | (102) | | | (231) | |
Total debt, net | | $ | 258,815 | | $ | 261,339 | |
Less: current portion | | | (65,464) | | | (58,189) | |
Long-term debt, net of current portion | | $ | 193,351 | | $ | 203,150 | |
| | | | | | | |
Table of Contents
Scheduled maturities of long-term debt are as follows:follows (in thousands):
| | | | |
| | Year Ending | |
| | December 31, | |
2018 | | $ | 65,464 | |
2019 | | | 62,014 | |
2020 | | | 50,755 | |
2021 | | | 33,939 | |
2022 | | | 24,144 | |
Thereafter | | | 22,601 | |
| | $ | 258,917 | |
Commercial Notes Payable and Mortgage Notes Payable
| | Year Ending
December 31, | |
2016 | | $ | 54,436 | |
2017 | | 49,862 | |
2018 | | 47,246 | |
2019 | | 46,493 | |
2020 | | 26,635 | |
Thereafter | | 49,617 | |
| | $ | 274,289 | |
From time to time, we enter into commercial equipment notes payable with various equipment finance companies and banks. At December 31, 2017, interest rates ranged from 1.78% to 3.51% per annum and maturity dates range from June 15, 2018 to December 15, 2022. The notes are secured by certain construction equipment.
We also entered into two secured mortgage notes payable to a bank in December 2015 totaling $8.0 million, with interest rates of 4.3% per annum and maturity dates of January 1, 2031. The mortgage notes are secured by two buildings.
During 2017, we acquired three properties from a related party and assumed mortgage notes secured by the properties totaling $4.2 million, with interest rates of 5.0% per annum and maturity dates of October 1, 2038.
Revolving Credit Facility
As of December 31, 2015, the Company had a revolvingOn September 29, 2017, we entered into an amended and restated credit facility, as amended on December 12, 2014agreement (the “Credit Agreement”) with The PrivateBank and Trust Company,CIBC Bank USA, as administrative agent (the “Administrative Agent”) and co-lead arranger, The Bank of the West, as co-lead arranger, and IBERIABANK Corporation, Branch Banking and Trust Company, IBERIABANK, Bank of America, and UMBSimmons Bank N.A. (the “Lenders”)., which increased our borrowing capacity from $125.0 million to $200.0 million. The Credit Agreement isconsists of a $125$200.0 million revolving credit facility whereby the Lenders agreeagreed to make loans on a revolving basis from time to time and to issue letters of credit for up to the $125$200.0 million committed amount. The termination date of the Credit Agreement is December 28, 2017.September 29, 2022. We capitalized $0.6 million of debt issuance costs during the third quarter of 2017 that is being amortized as interest expense over the life of the Credit Agreement.
The principal amount of any loans under the Credit Agreement will bear interest at either: (i) LIBOR plus an applicable margin as specified in the Credit Agreement (based on the Company’sour senior debt to EBITDA ratio as that term is defined in the Credit Agreement), or (ii) the Base Rate (which is the greater of (a) the Federal Funds Rate plus 0.5%0.50% or (b) the prime rate as announced by the Administrative Agent). Quarterly non-useNon-use fees, letter of credit fees and administrative agent fees are payable at rates specified in the Credit Agreement.
The principal amount of any loan drawn under the Credit Agreement may be prepaid in whole or in part at any time, with a minimum prepayment of $5 million, at any time, potentially subject to make-whole provisions.$5.0 million.
The Credit Agreement includes customary restrictive covenants for facilities of this type, as discussed below.
Commercial letters of credit outstanding were $12,105$19.5 million at December 31, 2015 and $4,659 at December 31, 2014.2017. Other than commercial letters of credit, there were no borrowings under this line ofthe Credit Agreement or the previous credit agreement during the twelve months ended December 31, 2015,2017, and available borrowing capacity at December 31, 20152017 was $112,895.$180.5 million.
Senior Secured Notes and Shelf Agreement
On December 28, 2012, the Companywe entered into a $50$50.0 million Senior Secured Notes purchase (“Senior Notes”) and a $25$25.0 million private shelf agreement (the “Notes Agreement”) by and among the Company,us, The Prudential Investment Management, Inc. and certain Prudential affiliates (the “Noteholders”). On June 3, 2015, the Notes Agreement was amended to provide for the issuance of additional notes of up to $75$75.0 million over the next three year period ending June 3, 2018 (“Additional Senior Notes”).
The Senior Notes amount was funded on December 28, 2012. The Senior Notes are due December 28, 2022 and bear interest at an annual rate of 3.65%, paid quarterly in arrears. Annual principal payments of $7.1 million are required from December 28, 2016 through December 28, 2021 with a final payment due on December 28, 2022. The principal amount may be prepaid, with a minimum prepayment of $5$5.0 million, at any time, subject to make-whole provisions.
On July 25, 2013, the Companywe drew $25$25.0 million available under the Notes Agreement. The notes are due July 25, 2023 and bear interest at an annual rate of 3.85% paid quarterly in arrears. Seven annual principal payments of $3.6 million are required from July 25, 2017 with a final payment due on July 25, 2023.
On November 9, 2015, the Companywe drew $25$25.0 million available under the Additional Senior Notes Agreement. The notes are due November 9, 2025 and bear interest at an annual rate of 4.6% paid quarterly in arrears. Seven annual principal payments of $3.6 million are required from November 9, 2019 with a final payment due on November 9, 2025.
F-23
Loans made under both the Credit Agreement and the Notes Agreement are secured by our assets, including, among others, our cash, inventory, goods, equipment (excluding equipment subject to permitted liens), and accounts receivable. All of our domestic subsidiaries have issued joint and several guaranties in favor of the Lenders and Noteholders for all amounts under the Credit Agreement and Notes Agreement.
Both the Credit Agreement and the Notes Agreement contain various restrictive and financial covenants including, among others, minimum tangible net worth, senior debt/EBITDA ratio and debt service coverage requirements and a minimum balance for unencumbered net book value for fixed assets.requirements. In addition, the agreements include restrictions on investments, change of control provisions and provisions in the event the Company disposeswe dispose more than 20% of itsour total assets.
The Company wasWe were in compliance with the covenants for the Credit Agreement and Notes Agreement at December 31, 2015.2017.
Canadian Credit Facility
The Company hasWe have a demand credit facility for $8,000$8.0 million in Canadian dollars with a Canadian bank for purposes of issuing commercial letters of credit in Canada. The credit facility has an annual renewal and provides for the issuance of commercial letters of credit for a term of up to five years. The facility provides for an annual fee of 1%1.0% for any issued and outstanding commercial letters of credit. Letters of credit can be denominated in either Canadian or U.S. dollars. At December 31, 2015 and 2014,2017, letters of credit outstanding totaled $2,179 and $2,563$0.5 million in Canadian dollars, respectively .dollars. At December 31, 2015,2017, the available borrowing capacity was $6,426$7.5 million in Canadian dollars. The credit facility contains a working capital restrictive covenant for our Canadian subsidiary, OnQuest Canada, ULC. At December 31, 2015,2017, OnQuest Canada, ULC was in compliance with the covenant. On October 8, 2015, the facility was renewed with substantially the same terms and conditions.
Note 1312 — Noncontrolling Interests
The Company isWe are currently involvedparticipating in severaltwo joint ventures, each of which operates in the Power segment. Both joint ventures have been determined to be a variable interest entity (“VIE”)VIE and the Company waswe were determined to be the primary beneficiary in each as a result of itsour significant influence over the joint venture operations.
Each joint venture is a partnership, and consequently, no tax effect was recognized for the income. The net assets of the joint ventures are restricted for use by the specific project and are not available for our general operations of the Company.operations.
The Blythe joint venture operating activities are included in the Company’s consolidated statements of income as follows for the years ended December 31:
| | 2015 | | 2014 | |
| | | | | |
Revenues | | $ | 119 | | $ | 1,169 | |
Net income attributable to noncontrolling interests | | 59 | | 526 | |
| | | | | | | |
The project has been completed and Blythe made a final distribution of $29 to the non-controlling interest and $29 to the Company during the year ended December 31, 2015. Blythe made distributions of $1,590 to the non-controlling interests and $1,590 to the Company during the year ended December 31, 2014. There were no capital contributions made during the years ended December 31, 2015 and 2014. The carrying value of the assets and liabilities associated with the operations of the Blythe joint venture were included in the Company’s consolidated balance sheets and were immaterial at December 31, 2015 and 2014.
The Carlsbad joint venture operating activities began in 2015 and are included in the Company’s consolidated statementsour Consolidated Statements of incomeIncome as follows for the years ended December 31:31 (in thousands):
| | 2015 | | 2014 | | | | | | | | | | |
| | | | | | | 2017 | | 2016 | | 2015 |
Revenues | | $ | 2,887 | | $ | — | | | $ | 110,669 | | $ | 7,254 | | $ | 2,887 |
Net income attributable to noncontrolling interests | | 172 | | — | | | | 1,780 | | | 325 | | | 172 |
|
The Carlsbad joint venture made no distributions to the partners and the Companywe made no capital contributions to the Carlsbad joint venture during the yearyears ending December 31, 2015.2017 and 2016. The project is expected to be completed in 2017.2018.
The carrying value of the assets and liabilities associated with the operations of the Carlsbad joint venture are included in the Company’s consolidated balance sheetsour Consolidated Balance Sheets at December 31 as follows:follows (in thousands):
F-24
| | | | | | | |
| | 2017 | | 2016 | |
Cash | | $ | 44,308 | | $ | 4,630 | |
Accounts receivable | | $ | 15,343 | | $ | — | |
Costs and estimated earnings in excess of billings | | $ | — | | $ | 124 | |
Billings in excess of costs and estimated earnings | | $ | 42,743 | | $ | 3,426 | |
Accounts payable | | $ | 12,352 | | $ | 286 | |
Due to Primoris | | $ | — | | $ | 46 | |
Table of Contents
| | 2015 | | 2014 | |
| | | | | |
Cash | | $ | 1,952 | | $ | — | |
Accounts receivable | | 955 | | — | |
Current liabilities | | 2,562 | | — | |
| | | | | | | |
The Wilmington joint venture operating activities began in 2015 and are included in the Company’s consolidated statementsour Consolidated Statements of incomeIncome as follows for the years ended December 31:31 (in thousands):
| | 2015 | | 2014 | | | | | | | | | | | |
| | | | | | | 2017 | | 2016 | | 2015 | |
Revenues | | $ | 1,364 | | $ | — | | | $ | 31,638 | | $ | 19,781 | | $ | 1,364 | |
Net income attributable to noncontrolling interests | | 48 | | — | | | | 2,716 | | | 677 | | | 48 | |
|
The Wilmington joint venture made no distributions to the partners and the Companywe made no capital contributions to the Wilmington joint venture during the yearyears ending December 31, 2015.2017 and 2016. The project is expected to be completed in 2018.
The carrying value of the assets and liabilities associated with the operations of the Wilmington joint venture are included in the Company’s consolidated balance sheetsour Consolidated Balance Sheets at December 31 as follows:follows (in thousands):
| | 2015 | | 2014 | | | | | | | | |
| | | | | | | 2017 | | 2016 | |
Cash | | $ | 2,339 | | $ | — | | | $ | 15,948 | | $ | 2,415 | |
Accounts receivable | | 2,003 | | — | | | $ | 598 | | $ | 4,242 | |
Current liabilities | | 4,247 | | — | | |
| Billings in excess of costs and estimated earnings | | | $ | 1,480 | | $ | 2,572 | |
Accounts payable | | | $ | 759 | | $ | 602 | |
Due to Primoris | | | $ | 7,428 | | $ | 2,035 | |
Note 14 — Contingent Earnout Liabilities
In both March 2014We participated in the Blythe joint venture created for the installation of a parabolic trough solar field and Marchsteam generation system in California, which was also determined to be a VIE and we were determined to be the primary beneficiary as a result of our significant influence over the joint venture operations. The Blythe joint venture project was completed; the project warranty expired in May 2015 and dissolution of the Company paid $5,000joint venture was completed in the third quarter 2015. Revenues and net income attributable to the sellers of Q3C based on achievement of their operating performance targets each year, as outlinedjoint venture were immaterial in the purchase agreement.2015.
The June 2014 acquisition of Vadnais Company included an earnout of $900, with $450 payable in September 2015 and $450 payable in September 2016, contingent upon meeting a certain performance targetsfollowing table summarizes the total balance sheet amounts for each of the two periods. The estimated fair valuejoint ventures, which are included in our Consolidated Balance Sheets( in thousands):
| | | | | | | |
| | Joint Venture | | Consolidated | |
At December 31, 2017 | | Amounts | | Amounts | |
Cash | | $ | 60,256 | | $ | 170,385 | |
Accounts receivable | | $ | 15,941 | | $ | 358,175 | |
Accounts payable | | $ | 13,111 | | $ | 140,943 | |
Billings in excess of costs and estimated earnings | | $ | 44,223 | | $ | 159,034 | |
| | | | | | | |
At December 31, 2016 | | | | | | | |
Cash | | $ | 7,045 | | $ | 135,823 | |
Accounts receivable | | $ | 4,242 | | $ | 388,000 | |
Costs and estimated earnings in excess of billings | | $ | 124 | | $ | 138,618 | |
Accounts payable | | $ | 888 | | $ | 168,110 | |
Billings in excess of costs and estimated earnings | | $ | 5,998 | | $ | 112,606 | |
The purchase of the Third Quarter 2014 Acquisitions provided a contingent earnout amount for Surber of up to $1.4 million that could be earned during the period 2014 through 2016. The estimated fair value for the contingent earnout was $1.0 million on the acquisition date. In the fourth quarter 2015, the Company determined that none of the targets for the Surber operations were likely to be achieved,
Note 13—Commitments and the remaining balance of $1,083 was credited to non-operating revenue.Contingencies
As part of the Third Quarter 2014 Acquisition, a contingent earnout amount for Ram-Fab of $0.2 million could be earned based on estimated earnings of a six-month operating project. Because the operating results for the Ram-Fab project were not met during the acquisition measurement period, the contingent earnout liability was reduced in June 2015 and the value of intangible assets of the acquisition was reduced by the same amount.
Note 15—Commitments and Contingencies
Leases—The Company leasesWe lease certain property and equipment under non-cancelable operating leases, which expire at various dates through 2023.2024. The leases require the Companyus to pay all taxes, insurance, maintenance, and utilities and are classified as operating leases in accordance with ASC Topic 840 “Leases”.
The future minimum lease payments required under non-cancelable operating leases are as follows:
F-25follows (in thousands):
| | | | | | | | | | |
| | | | | | | | | | |
| | | | | | | | | | |
For the Years Ending | | Real | | | | | Total | |
December 31, | | Property | | Equipment | | Commitments | |
2018 | | $ | 5,027 | | $ | 13,581 | | $ | 18,608 | |
2019 | | | 3,900 | | | 9,314 | | | 13,214 | |
2020 | | | 2,464 | | | 5,563 | | | 8,027 | |
2021 | | | 1,428 | | | 2,667 | | | 4,095 | |
2022 | | | 331 | | | 11 | | | 342 | |
Thereafter | | | — | | | — | | | — | |
| | $ | 13,150 | | $ | 31,136 | | $ | 44,286 | |
Table of Contents
For the Years Ending
December 31, | | Real
Property | | Real
Property
(Related
Party) | | Equipment | | Total
Commitments | |
2016 | | $ | 3,415 | | $ | 1,477 | | $ | 6,827 | | $ | 11,719 | |
2017 | | 3,078 | | 1,486 | | 3,066 | | 7,630 | |
2018 | | 2,668 | | 1,156 | | 2,240 | | 6,064 | |
2019 | | 1,404 | | 882 | | 1,093 | | 3,379 | |
2020 | | 616 | | 795 | | 656 | | 2,067 | |
Thereafter | | — | | 1,848 | | 333 | | 2,181 | |
| | $ | 11,181 | | $ | 7,644 | | $ | 14,215 | | $ | 33,040 | |
Leases identified above as related party leases represent property with entities related through common ownership by stockholders, officers, and directors of the Company.
Total lease expense during the years ended December 31, 2017, 2016 and 2015 2014was $25.5 million, $22.5 and 2013 was $21,815, $14,325 and $14,533, respectively, including amounts paid to related parties of $1,445, $1,505 and $1,556,$21.8 million, respectively.
Withdrawal liability for multiemployer pension plan— In November 2011, members of the Pipe Line Contractors Association “PLCA” including ARB, Rockford and Q3C (prior to the Company’sour acquisition in 2012), withdrew from the Central States Southeast and Southwest Areas Pension Fund multiemployer pension plan (“Plan”). These withdrawals were made in order to mitigate additional liability in connection with the significantly underfunded Plan. The CompanyWe recorded a withdrawal liability of $7,500,$7.5 million, which was increased to $7,585$7.6 million after the acquisition of Q3C,Q3C. During the first quarter of 2016, we received a final payment schedule. As a result of payments made and based on information provided bythis schedule, the Plan. The Plan asserted that the PLCA members did not affect a proper withdrawal in 2011, and in May 2014, the Plan asserted that the total liability for the Company was $11,819. A legal proceeding commenced, and a United States District Court ruled that the withdrawal of the PLCA members in 2011 was not effective. The PLCA appealed this decision, but as required by the Plan, the Company began making monthly payments which have totaled $1,834 throughrecorded at December 31, 2015. The payments2017 and 2016 was $4.7 million and $5.7 million, respectively. We expect to pay the remaining liability balance during 2018, and have been expensed.
On September 2, 2015, the U.S. Court of Appeals for the 7th Circuit reversed the decision of the District Court and ruled that the withdrawal was effective in 2011 as had been asserted by the PLCA. The Company has received a revised withdrawal liability calculation from the Plan at an amount approximately equal to the company’s accrual amount. The Company and other members of the PLCA are engaged in arbitration to further reduce the amount owed. The Company is making payments while awaiting the results of the arbitration process. The Company has no plans to withdraw from any other labor agreements.
Letters of creditNTTA settlement—As of December 31, 2015 and 2014, the Company had total letters of credit outstanding of approximately $13,679 and $6,864, respectively. The outstanding amounts include the U.S. dollar equivalents for letters of credit issued in Canadian dollars.
Litigation—On February 7, 2012, the Company waswe were sued in an action entitled North Texas Tollway Authority (“NTTA”), Plaintiff v. James Construction Group, LLC, and KBR, Inc., Defendants, v. Reinforced Earth Company, Third-Party Defendant (the “Lawsuit”). The Company participated in court-ordered mediation for 18 months, and onOn February 25, 2015 the Lawsuit was settled, and we recorded a liability for an expected cost to the Company of $9 million which was the accrued liability balance at December 31, 2014. As part of the settlement, one of the defendants paid us $8 million to remove all of their liability. Additionally, a$17.0 million. A second defendant agreed to provide up to $5.4 million to pay for the total expected remediation cost of approximately $22.4 million. The CompanyWe will use the $17 millionour settlement obligation to pay for a third-party contractor approved by the NTTA. In the event that the total remediation costs exceed the estimated amount,$22.4 million, the second defendant would pay 20% of the excess amount and the Companywe would pay for 80% of the excess amount. The Company believes that the $17 million is the best and most probable estimate for its portion of the remediation cost asDuring 2017, we increased our liability by $1.9 million. As of December 31, 2015. However, the Company cannot provide assurance that the final cost will not exceed the amount accrued.
2017, we have spent $3.7 million for remediation. At December 31, 2015, the Company is2017, our remaining accrual balance was $15.2 million.
Litigation—We have been engaged in dispute resolution to enforce collectioncollect money we believe we are owed for twoone construction projectsproject completed by the Company in 2014. Because of uncertainties associated with the project, including uncertainty of the amounts that would be collected, we used a zero profit margin approach to recording revenues during the construction period for the project.
For onethe project, a cost reimbursable contract, the Company haswe have recorded a receivable of $32.9 million and for the other project, the Company haswith a receivable balance due of $17.9 million. At December 31, 2015, the Company has not recorded revenues in excess of cost for these two projects; however, the Company has specific reserves for both projectsreserve of approximately $26$17.9 million included in “billings“Billings in excess of costs and estimated earnings.earnings.” At this time, the Companywe cannot predict the amount that itwe will collect nor the timing of any collection. The dispute resolution for the $32.9 million receivable involves mandatoryinitially required international arbitration for four separate construction projects. As partarbitration; however, in the first half of the process of exchanging information with2016, the owner sought bankruptcy protection in U.S. bankruptcy court. We have initiated litigation against the Company determinedsureties who have provided lien and stop payment release bonds for the total amount owed. A trial date has been tentatively set for the second quarter of 2018.
We had been engaged in dispute resolution to collect money we believed was owed to us for another construction project completed in 2014. During the third quarter 2016, we settled the dispute with an exchange of general releases and receipt of $38.0 million in cash. We changed our zero estimate of profit and accounted for the settlement as a change in accounting estimate which resulted in recognizing revenues of approximately $27.5 million and gross profit of approximately $26.7 million in the fourththird quarter of 2015 that there were no remaining claims from the owner for two of the smaller projects for which the Company had been paid in full. As a result, the Company recorded approximately $2 million in revenues and margin in the quarter.2016.
The Company isWe are subject to other claims and legal proceedings arising out of itsour business. The Company providesWe provide for costs related to contingencies when a loss from such claims is probable and the amount is reasonably determinable.estimable. In determining whether it is possible to provide an estimate of loss, or range of possible loss, the Company reviewswe review and evaluates itsevaluate our litigation and regulatory matters on a quarterly basis in light of potentially relevant factual and legal developments. If we determine an unfavorable outcome is not probable or reasonably estimable, we do not accrue for a potential litigation loss.
Management is unable to ascertain the ultimate
F-26
Table of Contents
outcome of other claims and legal proceedings; however, after review and consultation with counsel and taking into consideration relevant insurance coverage and related deductibles/self-insurance retention, management believes that it has meritorious defense to the claims and believes that the reasonably possible outcome of such claims will not, individually or in the aggregate, have a materially adverse effect on theour consolidated results of operations, financial condition or cash flowsflow.
SEC Inquiry—We have been cooperating with an inquiry by the staff of the Company.Securities and Exchange Commission which appears to be focused on certain percentage-of-completion contract revenue recognition practices of the Company during the time period 2013 and 2014. We are continuing to respond to the staff’s inquiries in connection with this matter. At this stage, we are unable to predict when the staff’s inquiry will conclude or the outcome.
Bonding—As of December 31, 2015, 20142017 and 2013, the Company2016, we had bid and completion bonds issued and outstanding totaling approximately $1,483,877, $1,518,018$705.7 million and $1,458,744,$680.0 million, respectively.
Contingent Consideration — Earnouts related to acquisitions are discussed in Note 14 — “Contingent Earnout Liabilities” .14—Reportable Segments
Note 16—Reportable Operating Segments
The Company segregates itsThrough the end of the year 2016, we segregated our business into three operatingreportable segments: the West Construction ServicesEnergy segment, (“West segment”), the East Construction Services segment (“East segment”) and the EnergyWest Construction Services segment. In the first quarter 2017, we changed our reportable segments in connection with a realignment of our internal organization and management structure. The segment (“Energy segment”).changes reflect the focus of our CODM on the range of services we provide to our end user markets. Our CODM regularly reviews our operating and financial performance based on these segments.
The Westcurrent reportable segments include the Power segment, includes the undergroundPipeline segment, the Utilities segment, and industrial operations and constructionthe Civil segment. Segment information for prior periods has been restated to conform to the new segment presentation.
Each of our reportable segments is comprised of similar business units that specialize in services performed by ARB, ARB Structures, Inc., Rockford, Q3C, and Vadnais, acquiredunique to the segment. Driving the new end-user focused segments are differences in June 2014. Mostthe economic characteristics of each segment, the nature of the entitiesservices provided by each segment; the production processes of each segment; the type or class of customer using the segment’s services; the methods used by the segment to provide the services; and the regulatory environment of each segment’s customers.
The classification of revenues and gross profit for segment reporting purposes can at times require judgment on the part of management. Our segments may perform work primarilyservices across industries or perform joint services for customers in California; however, Rockfordmultiple industries. To determine reportable segment gross profit, certain allocations, including allocations of shared and indirect costs, such as facility costs, equipment costs and indirect operating expenses were made.
The following is a brief description of the reportable segments:
The Power segment operates throughout the United States and Q3C operatesspecializes in Coloradoa range of services that include full EPC project delivery, turnkey construction, retrofits, upgrades, repairs, outages, and maintenance for entities in the upper Midwest United States. The Blythe, Carlsbadpetroleum, petrochemical, water, and Wilmington joint ventures are also included as partother industries.
The EastPipeline segment includesoperates throughout the JCG Heavy Civil division,United States and specializes in a range of services, including pipeline construction, pipeline maintenance, pipeline facility work, compressor stations, pump stations, metering facilities, and other pipeline related services for entities in the JCG Infrastructurepetroleum and Maintenance division, BW Primorispetrochemical industries.
The Utilities segment operates primarily in California, the Midwest, and the Cardinal Contractors, Inc.Southeast regions of the United States and specializes in a range of services, including utility line installation and maintenance, gas and electric distribution, streetlight construction, business, locatedsubstation work, and fiber optic cable installation.
The Civil segment operates primarily in the southeasternSoutheastern and Gulf Coast regions of the United States and specializes in the Gulf Coast region of the United States.
The Energy segment includes the operations of the PES pipelinehighway and gas facilitybridge construction, airport runway and maintenance operationstaxiway construction, demolition, heavy earthwork, soil stabilization, mass excavation, and the PES Industrial division, whose operations are located primarily in the southeastern United States and in the Gulf Coast region. The segment also includes the Aevenia, Surber and Ram-Fab operations as well as the OnQuest, Inc. and OnQuest Canada, ULC operations, which provide for the design and installation of LNG facilities and high-performance furnaces and heaters for the oil refining, petrochemical and power generation industries.drainage projects.
All intersegment revenues and gross profit, which were immaterial, have been eliminated in the following tables.
Segment Revenues
Revenue by segment for the years ended December 31, 2015, 20142017, 2016 and 20132015 was as follows:follows (in thousands):
| | Year Ended December 31, | |
| | 2015 | | 2014 | | 2013 | |
Business Segment | | Revenue | | % of
Revenue | | Revenue | | % of
Revenue | | Revenue | | % of
Revenue | |
West | | $ | 913,626 | | 47.4 | % | $ | 964,093 | | 46.2 | % | $ | 1,151,433 | | 59.2 | % |
East | | 612,174 | | 31.7 | % | 489,926 | | 23.5 | % | 430,438 | | 22.1 | % |
Energy | | 403,615 | | 20.9 | % | 632,175 | | 30.3 | % | 362,349 | | 18.7 | % |
Total | | $ | 1,929,415 | | 100.0 | % | $ | 2,086,194 | | 100.0 | % | $ | 1,944,220 | | 100.0 | % |
| | | | | | | | | | | | | | | | |
| | 2017 | | 2016 | | 2015 | |
| | | | | % of | | | | | % of | | | | | % of | |
| | | | | Total | | | | | Total | | | | | Total | |
Segment | | Revenue | | Revenue | | Revenue | | Revenue | | Revenue | | Revenue | |
Power | | $ | 606,125 | | 25.5% | | $ | 478,653 | | 24.0% | | $ | 466,292 | | 24.2% | |
Pipeline | | | 465,570 | | 19.5% | | | 401,931 | | 20.1% | | | 299,365 | | 15.5% | |
Utilities | | | 806,523 | | 33.9% | | | 637,212 | | 31.9% | | | 587,047 | | 30.4% | |
Civil | | | 501,777 | | 21.1% | | | 479,152 | | 24.0% | | | 576,711 | | 29.9% | |
Total | | $ | 2,379,995 | | 100.0% | | $ | 1,996,948 | | 100.0% | | $ | 1,929,415 | | 100.0% | |
Segment Gross Profit
Gross profit by segment for the years ended December 31, 2015, 20142017, 2016 and 20132015 was as follows:follows (in thousands):
| | Year Ended December 31, | |
| | 2015 | | 2014 | | 2013 | |
Business Segment | | Gross Profit | | % of
Segment
Revenue | | Gross Profit | | % of
Segment
Revenue | | Gross Profit | | % of
Segment
Revenue | |
West | | $ | 130,255 | | 14.3 | % | $ | 143,468 | | 14.9 | % | $ | 190,747 | | 16.6 | % |
East | | 42,523 | | 6.9 | % | 25,749 | | 5.3 | % | 24,309 | | 5.6 | % |
Energy | | 47,095 | | 11.7 | % | 66,823 | | 10.6 | % | 40,959 | | 11.3 | % |
Total | | $ | 219,873 | | 11.4 | % | $ | 236,040 | | 11.3 | % | $ | 256,015 | | 13.2 | % |
| | | | | | | | | | | | | | | | |
| | 2017 | | 2016 | | 2015 | |
| | | | | % of | | | | | % of | | | | | % of | |
| | | | | Segment | | | | | Segment | | | | | | |
Segment | | Gross Profit | | Revenue | | Gross Profit | | Revenue | | Gross Profit | | Revenue | |
Power | | $ | 65,675 | | 10.8% | | $ | 49,807 | | 10.4% | | $ | 53,620 | | 11.5% | |
Pipeline | | | 92,087 | | 19.8% | | | 68,100 | | 16.9% | | | 24,685 | | 8.2% | |
Utilities | | | 113,037 | | 14.0% | | | 100,071 | | 15.7% | | | 96,450 | | 16.4% | |
Civil | | | 7,635 | | 1.5% | | | (16,671) | | (3.5%) | | | 45,118 | | 7.8% | |
Total | | $ | 278,434 | | 11.7% | | $ | 201,307 | | 10.1% | | $ | 219,873 | | 11.4% | |
F-27
Table of Contents
Segment Goodwill
The amount of goodwill recorded by segment at December 31, 2015 and 2014 was as follows:
Segment | | 2015 | | 2014 | |
West | | $ | 45,239 | | $ | 45,239 | |
East | | 42,866 | | 43,267 | |
Energy | | 36,056 | | 30,904 | |
Total | | $ | 124,161 | | $ | 119,410 | |
As part of the Company’s annual review of goodwill impairment, an impairment expense of $401 was recorded in December 2015 for the goodwill attributed to Cardinal Contractors, Inc.
Geographic Region — Revenues and Total Assets
The majority of the Company’sour revenues are derived from customers in the United States and less thanwith approximately 1% is generated from sources outside of the United States. At December 31, 20152017 and 2016, approximately 1% of total assets were located outside of the United States.
Note 17—15—Customer Concentrations
The Company operatesWe operate in multiple industry segments encompassing the construction of commercial, industrial, and public works infrastructure assets primarily throughout primarily the United States. Typically, the top ten customers in any one calendar year generate revenues in excess of 50% of total revenues and consist of a different group of customers in each year.
During the years ended December 31, 2017, 2016 and 2015, 2014we generated 38.4%, 45.6% and 2013, the Company generated 48.9%, 36.4% and 35.6%, of itsour revenues, respectively, from the following customers:customers (in thousands):
Description of
Customer’s | | 2015 | | 2014 | | 2013 | | |
Business | | Amount | | Percentage | | Amount | | Percentage | | Amount | | Percentage | | |
Texas DOT | | $ | 183,847 | | 9.5 | % | $ | 183,221 | | 8.8 | % | $ | 140,458 | | 7.2 | % | |
| | | | | | | | | | | | | | | | | | | |
| | | | | 2017 | | 2016 | | 2015 | |
Description of Customer's Business | | | Segment | | Amount | | Percentage | | Amount | | Percentage | | Amount | | Percentage | |
State DOT | | | Civil | | $ | 222,142 | | 9.3% | | $ | 193,049 | | 9.7% | | $ | 183,847 | | 9.5% | |
Public gas and electric utility | | | Utilities | | | 210,747 | | 8.9% | | | 184,002 | | 9.2% | | | 120,507 | | 6.2% | |
Private gas and electric utility | | | Utilities | | | 190,659 | | 8.0% | | | 201,443 | | 10.1% | | | 173,232 | | 9.0% | |
Chemical/Energy producer | | 173,931 | | 9.0 | % | * | | * | | * | | * | | | Power/Civil | | | 160,995 | | 6.8% | | | 208,458 | | 10.4% | | | 173,931 | | 9.0% | |
Private gas and electric utility | | 173,232 | | 9.0 | % | 145,677 | | 7.0 | % | 104,828 | | 5.4 | % | |
Pipeline operator | | 165,578 | | 8.6 | % | * | | * | | * | | * | | | Pipeline | | | 128,182 | | 5.4% | | | * | | * | | | * | | * | |
Gas utility | | 127,128 | | 6.6 | % | * | | * | | 143,171 | | 7.4 | % | |
Public gas and electric utility | | 120,507 | | 6.2 | % | 144,567 | | 6.9 | % | 153,908 | | 7.9 | % | |
Petrochemical producer | | * | | * | | 164,634 | | 7.9 | % | * | | * | | |
Pipeline operator | | | Pipeline | | | * | | * | | | 123,055 | | 6.2% | | | * | | * | |
Pipeline operator | | * | | * | | 121,220 | | 5.8 | % | * | | * | | | Pipeline | | | * | | * | | | * | | * | | | 165,578 | | 8.6% | |
Gas utility | | * | | * | | * | | * | | 149,794 | | 7.7 | % | | Utilities | | | * | | * | | | * | | * | | | 127,128 | | 6.6% | |
| | $ | 944,223 | | 48.9 | % | $ | 759,319 | | 36.4 | % | $ | 692,159 | | 35.6 | % | | | | $ | 912,725 | | 38.4% | | $ | 910,007 | | 45.6% | | $ | 944,223 | | 48.9% | |
(*)Indicates a customer with less than 5% of revenues during such period.
For the years ended December 31, 2017, 2016 and 2015, 2014approximately 56.4%, 60.4% and 2013, approximately 59.4%, 53.6% and 50.0%, respectively, of total revenues were generated from theour top ten customers of the Company in that year. In each of the years, a different group of customers comprised the top ten customers by revenue.
At December 31, 2015,2017, approximately 15.7%4.3% of the Company’sour accounts receivable were due from one customer, and that customer provided 9.0%8.9% of the Company’sour revenues for the year ended December 31, 2015.2017. At December 31, 2014,2016, approximately 10.0%20.8% of the Company’sour accounts receivable were due from one customer, and that customer provided 4.0%6.2% of the Company’sour revenues for the year ended December 31, 2014.2016.
Note 1816 — Multiemployer Plans
Union Plans—Various subsidiaries in the West segment are signatories to collective bargaining agreements. These agreements require that the Companywe participate in and contribute to a number of multiemployer benefit plans for itsour union employees at rates determined by the agreements. The trustees for each multiemployer plan determine the eligibility and allocations of contributions and benefit amounts, determine the types of benefits and administer the plan.
The CompanyWe contributed $34,296, $38,107$46.9 million, $34.2 million, and $42,919,$34.3 million, to multiemployer pension plans for the years ended December 31, 2015, 20142017, 2016 and 2013,2015, respectively. These costs were charged to the related construction contracts in process. Contributions during 2015 and 2014 decreased2017 increased from the prior years as a result of a decreasean increase in the number of man-hours worked by our union labor.
F-28
Table of Contents
For the Company, theThe financial risks of participating in multiemployer plans are different from single-employer plans in the following respects:
| · | | ·Assets contributed to the multiemployer plan by one employer may be used to provide benefits to employees of other participating employers.
|
| · | | If a participating employer stops contributing to the plan, the unfunded obligations of the plan may be borne by the remaining participating employers. |
| · | | If a participating employer chooses to stop participating in the plan, a withdrawal liability may be created based on the unfunded vested benefits for all employees in the plan. |
· If a participating employer stops contributing to the plan, the unfunded obligations of the plan may be borne by the remaining participating employers.
· If a participating employer chooses to stop participating in the plan, a withdrawal liability may be created based on the unfunded vested benefits for all employees in the plan.
Under U.S. legislation regarding multiemployer pension plans, an employer is required to pay an amount that represents its proportionate share of a plan’s unfunded vested benefits in the event of withdrawal from a plan or upon plan termination. The Company participates
We participate in a number of multiemployer pension plans, and itsour potential withdrawal obligation may be significant. Any withdrawal liability would be recorded when it is probable that a liability exists and can be reasonably estimated, in accordance with GAAP. As discussed in Note 15—13—“Commitments and Contingencies,” in 2011 the Companywe withdrew from the Central States Southeast and Southwest Areas Pension Fund multiemployer pension plan. The Company hasWe have no plans to withdraw from any other labor agreements.
During the last three years, the Companywe made annual contributions to 8278 pension plans. None of the pension plans that we contributed to in 2017 and 2016 listed us in the plan’s Form 5500 as providing more than 5% of the plan’s total contributions. Two of the pension plans that the Companywe contributed to in 2015 listed the Companyus in the plan’s Form 5500 as providing more than 5% of the plan’s total contributions. The contribution to those plans for the twelve months ending December 31, 2015 were $2,180 for one plan was $2.2 million and $457$0.5 million for the second plan. One of the pension plans that the Company contributed to in 2014 listed the Company in the plan’s Form 5500 as providing more than 5% of the plan’s total contributions. The contribution to that plan was $5,659 for the twelve months ending December 31, 2014. Two pension plans listed the Company on their Form 5500 as providing more than 5% of the plan’s total 2013 contributions. The contributions for the two plans amounted to $1,427 for the twelve months ending December 31, 2013.
Our participation in significant plans for the yearyears ended December 31, 20152017, 2016 and 20142015 is outlined in the table below. The “EIN/Pension Plan Number” column provides the Employer Identification Number (“EIN”) and the three digit plan number. The “Zone Status” is based on the latest information that we received from the plan and is certified by the plan’s actuary. Among other factors, plans in the red zone are generally less than 65 percent funded, plans in the yellow zone are less than 80 percent funded, and plans in the green zone are at least 80 percent funded. The “FIP/RP Status Pending/Implemented” column indicates plans for which a financial improvement plan (“FIP”) or a rehabilitation plan (“RP”) is either pending or has been implemented. The “Surcharge Imposed” column includes plans in a red zone status that require a payment of a surcharge in excess orof regular contributions. The next column lists the expiration date of the Company’sour collective bargaining agreement related to the plan. The table follows:
| | | | | | | | | | | | | | | | | | | | | | | |
| | | | | | | | | | | | | Collective | | | | | | | | | | |
| | | | | | | | | FIP/RP | | | | Bargaining | | | | | | | | | | |
| | | EIN / | | Pension Protection Act | | Status | | | | Agreement | | | | | | | | | | |
| | EIN /
Pension Plan | | Pension Protection Act Zone
Status | | FIP/RP
Status
Pending / | | Surcharge | | Collective
Bargaining
Agreement
Expiration | | Contributions of the Company | | | Pension Plan | | Zone Status | | Pending / | | Surcharge | | Expiration | | Contributions of the Company | |
Pension Fund Name | | Number | | 2015 | | 2014 | | Implemented | | Imposed | | Date | | 2015 | | 2014 | | 2013 | | | Number | | 2017 | | 2016 | | Implemented | | Imposed | | Date | | 2017 | | 2016 | | 2015 | |
| | | | | | | | | | | | | | | | | | | | | | | | | | | | | | | | | | | | | | | | | |
Central Pension Fund of the International Union of Operating Engineers and Participating Employers | | 36-6052390/001 | | Green as of
February 1, 2014 | | Green as of
February 1, 2013 | | No | | No | | 6/04/2017 | | $ | 5,659 | | $ | 6,204 | | $ | 7,286 | | | 36-6052390/001 | | Green as of February 1, 2016 | | Green as of February 1, 2015 | | No | | No | | 5/31/2020 | | $ | 7,562 | | $ | 5,373 | | $ | 5,659 | |
| | | | | | | | | | | | | | | | | | | | | | | | | | | | | | | | | | | | | | | | | |
Pipeline Industry Benefit Fund | | | 73-6146433/001 | | Green as of January 1, 2016 | | Green as of January 1, 2015 | | No | | No | | 5/31/2020 | | | 6,050 | | | 2,740 | | | 3,783 | |
| | | | | | | | | | | | | | | | | | | | | | | |
Laborers International Union of North America National (Industrial) Pension Fund | | 52-6074345/001 | | Red as of
January 1, 2014 | | Red as of
January 1, 2013 | | Yes | | No | | 6/04/2017 | | 3,287 | | 3,382 | | 5,025 | | | 52-6074345/001 | | Red as of January 1, 2016 | | Red as of January 1, 2015 | | No | | No | | 5/31/2020 | | | 4,658 | | | 2,415 | | | 3,287 | |
| | | | | | | | | | | | | | | | | | | | | | | | | | | | | | | | | | | | | | | | | |
Southern California Pipetrades Trust Funds | | 51-6108443/001 | | Green as of
January 1, 2014 | | Green as of
January 1, 2013 | | No | | No | | 7/30/2016 | | 2,180 | | 5,239 | | 6,179 | | | 51-6108443/001 | | Green as of January 1, 2016 | | Green as of January 1, 2015 | | No | | No | | 9/30/2022 | | | 3,219 | | | 2,614 | | | 2,180 | |
| | | | | | | | | | | | | | | | | | | | | | | | | | | | | | | | | | | | | | | | | |
Pipeline Industry Benefit Fund | | 73-6146433/001 | | Green as of
January 1, 2014 | | Green as of
January 1, 2013 | | No | | No | | 6/04/2017 | | 3,783 | | 2,686 | | 4,605 | | |
| | | | | | | | | | | | | | | | | | | | |
Laborers Pension Trust Fund for Northern California | | 94-6277608/001 | | Yellow as of
June 1, 2014 | | Yellow as of
June 1, 2013 | | Yes | | No | | 6/30/2019 | | 3,150 | | 3,116 | | 3,869 | | | 94-6277608/001 | | Yellow as of June 1, 2016 | | Yellow as of June 1, 2015 | | No | | No | | 6/30/2019 | | | 2,945 | | | 3,598 | | | 3,150 | |
| | | | | | | | | | | | | | | | | | | | | | | | | | | | | | | | | | | | | | | | | |
Construction Laborers Pension Trust for Southern California | | 43-6159056/001 | | Green as of
January 1, 2014 | | Green as of
January 1, 2013 | | No | | No | | 6/30/2018 | | 3,067 | | 2,444 | | 2,951 | | |
National Pension Fund | | | 52-6152779 | | Yellow as of July 1 2017 | | Yellow as of July 1 2016 | | No | | No | | 9/30/2022 | | | 2,548 | | | 2,161 | | | 2,106 | |
| | | | | | | | | | | | | | | | | | | | | | | |
Operating Engineer Trust Funds | | | 95-6032478/001 | | Yellow as of July 1, 2016 | | Yellow as of July 1, 2016 | | No | | No | | 6/30/2019 | | | 2,448 | | | 1,643 | | | 1,401 | |
| | | | | | | | Contributions to significant plans | | $ | 21,126 | | $ | 23,071 | | $ | 29,915 | | | | | | | | | Contributions to significant plans | | | 29,430 | | | 20,544 | | | 21,566 | |
| | | | | | | | Contributions to other multiemployer plans | | 13,170 | | 15,036 | | 13,004 | | | | | | | | | Contributions to other multiemployer plans | | | 17,505 | | | 13,639 | | | 12,730 | |
| | | | | | | | | | | | | | | | | | | | | | | | | | | | | | | | | | | | | | | | | |
| | | | | | | | Total contributions made | | $ | 34,296 | | $ | 38,107 | | $ | 42,919 | | | | | | | | | Total contributions made | | $ | 46,935 | | $ | 34,183 | | $ | 34,296 | |
Note 17—Company Retirement Plans
F-29
Table of Contents
Note 19—Company Retirement Plans
401(k) Plan—The Company providesWe provide a 401(k) plan for itsour employees not covered by collective bargaining agreements. Under the plan, employees are allowed to contribute up to 100% of their compensation, within the Internal Revenue Service (“IRS”) prescribed annual limit. The Company makesWe make employer match contributions of 100% of the first 3% and 50% of the next 2% of employee contributions, which vest immediately. The CompanyWe may, at the discretion of itsour Board of Directors, make an additional profit share contribution to the 401(k) plan. No such contributions were made during 20132015 through 2015. The Company’s contribution2017. Our contributions to the plan for the years ended December 31, 2017, 2016 and 2015 2014were $4.1 million, $3.9 million, and 2013 were $3,702, $3,111 and $2,771,$3.7 million, respectively. Employees of the various acquisitions made by the Company from 2012 through 2015 became eligible for the Company’s 401(k) plan.
OnQuest Canada, ULC RRSP-DPSP Plan—The Company providesWe provide a RRSP-DPSP plan (Registered Retirement Saving Plan—Deferred Profit Sharing Plan) for itsour employees of OnQuest Canada, ULC. There are two components to the plan. The RRSP portion is contributed to by the employee, while the Companyour portion is paid to the DPSP. Under this plan, the Company makeswe make employer match contributions of 100% of the first 3% and 50% of the next 2% of employee contributions. VestingEmployees vest in the DPSP portion isafter one year of employment. The Company’sOur contribution to the DPSP during each of the years ended December 31, 2017, 2016 and 2015 2014 and 2013 was $55, $69 and $70, respectively.$0.1 million.
The Company hasWe have no other post-retirement benefits.
Note 20—18—Deferred Compensation Agreements and Stock-Based Compensation
Primoris Long-Term Retention Plan (“LTR Plan”)— The CompanyWe adopted a long-term retention plan for certain senior managers and executives. The voluntary plan provides for the deferral of one half of the participant’s annual earned bonus for one year. ExceptGenerally, except in the case of death, disability or involuntary separation from service, the deferred compensation is vested to the participant only if actively employed by the Companyus on the payment date of bonus amounts the following year. The amount of compensation deferred under this plan is calculated each year. Total deferred compensation liability under this plan as of December 31, 20152017 and 20142016 was $5,220$5.7 million and $4,779,$4.5 million, respectively.
Participants in the long term retention plan may elect to purchase Companyour common stock at a discounted price. For bonuses earned in 20152017 and 2014,2016, the participants could use up to one sixth of their bonus amount to purchase shares of stock, whosestock. The purchase price was calculated as 75% of the average market closing price for the month of December 20152017 and 2014,January 2017, respectively. The 25% discount is treated as compensation to the participant.
JCG Stakeholder Incentive Plan — In December 2015 and 2014, JCG maintained a deferred compensation plan for some senior management employees. The plan provided for annual vesting over a five-year period. Once vested and upon a triggering event, such as termination, death or disability, the deferred benefit amount plus interest is paid in equal monthly installments over three years. The amount of compensation deferred under the plan is calculated each year. In 2014, the terms of the plan were changed, and the participants were given the option of payment of accrued amounts over a three year period or payments made as part of the LTR plan with 50% of the accrued amount added to the LTR payments made in 2015 and the remainder added to LTR payments to be made in 2016. Total deferred compensation liability under this plan at December 31, 2015 and 2014 was $278 and $599, respectively.
Stock-based compensation — In July 2008,May 2013, the shareholders approved and the Companywe adopted the Primoris Services Corporation 2008 Long-term Incentive Equity Plan, which was replaced by the Primoris Services Corporation 2013 Long-term Incentive Equity Plan (“Equity Plan”), after approval by the shareholders and adoption by the Company on May 3, 2013.
On May 3, 2013, the. Our Board of Directors has granted 100,000259,065 Restricted Stock Units (“Units”) to an executiveexecutives under the Equity Plan. Commencing annually on May 10, 2014The grants were documented in RSU Award Agreements which provide for a vesting schedule and ending April 30, 2017, the Units vest in four equal installments subject torequire continuing employment of the executive. At December 31, 2015, a total of 50,000The Units were vested. On March 24, 2014, the Board of Directors granted 48,512 Units to another executive under the Equity Plan. At December 31, 2015, a total of 24,256 Units were vested. The remaining 24,256 Units will vest on March 23, 2017 subject to continuing employment of the executive. Vesting of both grants is alsoare subject to earlier acceleration, termination, cancellation or forfeiture as provided in the underlying Primoris Restricted Stock Unit agreement (“RSU Award Agreement”). Each Unit representsAgreement. The table below presents the right to receive one shareUnits activity for 2017:
| | | | | | |
Nonvested RSUs | | Units | | Weighted Average Grant Date Fair Value per Unit | |
Balance at December 31, 2016 | | 149,809 | | $ | 24.70 | |
Granted | | 10,000 | | | 22.90 | |
Vested | | (74,394) | | | 25.53 | |
Balance at December 31, 2017 | | 85,415 | | | 23.76 | |
During 2016, 100,553 Units were granted with a weighted-average grant-date fair value per unit of the Company’s common stock when vested.$23.87. There were no Units granted during 2015. The total fair value of Units that vested during 2017, 2016 and 2015 was $1.7 million, $0.6 million and $0.9 million, respectively
At December 31, 2017, a total of 173,650 Units were vested. The vesting schedule for the remaining Units follows:
| | |
| | Number of Units |
For the Years Ending December 31, | | to Vest |
2018 | | 28,471 |
2019 | | 51,552 |
2020 | | 5,392 |
| | 85,415 |
Under guidance of ASC Topic 718 “Compensation — Stock Compensation”, stock-based compensation cost is measured at the date of grant, based on the calculated fair value of the stock-based award, and is recognized as expense over the employee’s requisite service period (generally the vesting period of the award).
F-30
Table of Contents
The fair value of the Units was based on the closing market price of our common stock on the day prior to the date of the grant. Stock compensation expense for the Units is being amortized using the straight-line method over the service period. For the twelve months ended December 31, 2017, 2016, and 2015, the Companywe recognized $1,050$1.1 million, $1.6 million, and $1.1 million respectively, in compensation expense. At December 31, 2015,2017, approximately $1.3$1.2 million of unrecognized compensation expense remains for the Units, which will be recognized over the next 1.3 years through April 30, 2017.a weighted average period of 1.6 years.
Vested Units accrue “Dividend Equivalents” (as defined in the Equity Plan) which will be accrued as additional Units. At December 31, 2015,2017, a total of 7223,097 Dividend Equivalent Units were accrued.
Note 21—19—Related Party Transactions
Primoris has entered into leasing transactions withPrior to March 2017, we leased three properties in California from Stockdale Investment Group, Inc. (“SIGI”). Brian Pratt, ourOur Chairman of the Board of Directors, andwho is our largest stockholder, holdsand his family hold a majority interest and is the chairman, president and chief executive officer and a director of SIGI. John M. Perisich,In March 2017, we exercised a right of first refusal and purchased the SIGI properties. The purchase was approved by our Executive Vice President and General Counsel, is secretaryBoard of SIGI.
Primoris leases properties from SIGI atDirectors for $12.8 million. We assumed three mortgage notes totaling $4.2 million with the following locations:
1. Bakersfield, California (lease expires October 2022)
2. Pittsburg, California (lease expires April 2023)
3. San Dimas, California (lease expires March 2019)
remainder paid in cash. During the years ended December 31, 2017, 2016 and 2015, 2014we paid $0.2 million, $0.8 million, and 2013, the Company paid $831, $862 and $907,$0.8 million, respectively, in lease payments to SIGI for the use of these properties.
Primoris leases a propertyWe lease properties from Roger Newnham, a former ownerother individuals that are current employees. The amounts leased are not material and current managereach arrangement was approved by the Board of our subsidiary, OnQuest Canada, ULC. The property is located in Calgary, Canada. During the years ended December 31, 2015, 2014 and 2013 Primoris paid $254, $289 and $295, respectively, in lease payments. The current term of the lease is through December 31, 2017.Directors.
Primoris leases a property from Lemmie Rockford, one of the Rockford sellers, which commenced November 1, 2011. The property is located in Toledo, Washington. During the years ended December 31, 2015, 2014 and 2013, Primoris paid $90, $90 and $90, respectively, in lease payments. The lease will expire in January 2017.
Primoris leases a property from Quality RE Partners, owned by three of the Q3C selling shareholders, of whom two are current employees, including Jay Osborn, an operations president in the West Construction segment. The property is located in Little Canada, Minnesota. During the years ended December 31, 2015, 2014 and 2013, the Company paid $270, $264 and $264, respectively, in lease payments to Quality RE Partners. The lease expires in October 2022. In addition, in November 2015, Q3C purchased construction equipment at fair value from Quality RE Partners for $589. Q3C also leased construction equipment from Mr. Osborn during 2015 for $36 and subsequently purchased the equipment at fair value for $145.
As discussed in Note 8— “Equity Method Investments”, the Company owns several non-consolidated investments and has recognized revenues on work performed by the Company for those joint ventures.
Note 22—20—Income Taxes
The components of the provision for income taxes are as follows:follows (in thousands):
| | | | | | | | | | | |
| | 2015 | | 2014 | | 2013 | | | 2017 | | 2016 | | 2015 | |
Current provision (benefit) | | | | | | | | | | | | | | | | | |
Federal | | $ | 26,948 | | $ | 28,203 | | $ | 41,323 | | | $ | 21,509 | | $ | 4,726 | | $ | 26,948 | |
State | | 3,640 | | 5,398 | | 10,051 | | | | 3,371 | | | 5,423 | | | 3,640 | |
Foreign | | 362 | | 1,074 | | 772 | | | | (188) | | | 92 | | | 362 | |
| | $ | 30,950 | | $ | 34,675 | | $ | 52,146 | | |
| | | | | | | | | | 24,692 | | | 10,241 | | | 30,950 | |
Deferred provision (benefit) | | | | | | | | | | | | | | | | | |
Federal | | (7,099 | ) | 3,586 | | (6,099 | ) | | | 1,958 | | | 11,560 | | | (7,099) | |
State | | 155 | | 457 | | (874 | ) | | | 1,219 | | | (727) | | | 155 | |
Foreign | | (60 | ) | (72 | ) | 67 | | | | (36) | | | 72 | | | (60) | |
| | (7,004 | ) | 3,971 | | (6,906 | ) | | | 3,141 | | | 10,905 | | | (7,004) | |
Change in valuation allowance | | — | | — | | (344 | ) | | | 600 | | | — | | | — | |
Total | | $ | 23,946 | | $ | 38,646 | | $ | 44,896 | | | $ | 28,433 | | $ | 21,146 | | $ | 23,946 | |
F-31
A reconciliation of income tax expense compared to the amount of income tax expense that would result by applying the U.S. statutory federal statutory income tax rate related to pre-taxpretax income to the effective tax rate for the periods indicated is as follows:
| | | | | | | | |
| | 2015 | | 2014 | | 2013 | | | 2017 | | 2016 | | 2015 | |
U.S. federal statutory income tax rate | | 35.00 | % | 35.00 | % | 35.00 | % | | 35.0 % | | 35.0 % | | 35.0 % | |
State taxes, net of federal income tax impact | | 4.20 | % | 4.66 | % | 4.72 | % | | 2.9 % | | 6.4 % | | 4.2 % | |
Foreign tax credit | | (0.50 | )% | (0.98 | )% | (0.73 | )% | | 0.0 % | | (0.4)% | | (0.5)% | |
Canadian income tax | | 0.50 | % | 0.98 | % | 0.73 | % | |
Canadian income tax (benefit) provision | | | (0.2)% | | 0.4 % | | 0.5 % | |
Domestic production activities deduction | | (3.91 | )% | (3.07 | )% | (3.67 | )% | | (2.3)% | | (1.1)% | | (3.9)% | |
Nondeductible meals & entertainment | | 5.09 | % | 3.38 | % | 2.58 | % | | 2.8 % | | 5.4 % | | 5.1 % | |
Other items | | (1.01 | )% | (2.01 | )% | 0.56 | % | | (0.7)% | | (1.5)% | | (1.0)% | |
Effective tax rate on income before provision for income taxes excluding income attributable to noncontrolling interests | | 39.37 | % | 37.96 | % | 39.19 | % | |
Effective tax rate excluding the impact of the Tax Act and income attributable to noncontrolling interests | | | 37.5 % | | 44.2 % | | 39.4 % | |
Deferred tax liability remeasurement benefit from the Tax Act | | | (9.3)% | | 0.0 % | | 0.0 % | |
Effective tax rate excluding income attributable to noncontrolling interests | | | 28.2 % | | 44.2 % | | 39.4 % | |
Impact of income from noncontrolling interests on effective tax rate | | (0.18 | )% | (0.19 | )% | (1.65 | ) | | (1.2)% | | (0.9)% | | (0.2)% | |
Effective tax rate on income before provision for income taxes and noncontrolling interests | | 39.19 | % | 37.77 | % | 37.54 | % | |
Effective tax rate | | | 27.0 % | | 43.3 % | | 39.2 % | |
Deferred income taxes are recognized for temporary differences between the financial reporting basisbases and tax bases of the assets and liabilities and their respective tax basis and operating losses, capital losses and tax credit carry-forwards based on enacted tax rates expected to be in effect when such amounts are realized or settled. However, deferred tax assets are recognized only to the extent that it is more likely than not that they will be realized based upon consideration of available evidence, including future reversals of existing taxable temporary differences, future projected taxable income, the length of the tax asset carryforward periods, and tax planning strategies. See Note 2 — “Summary of Significant Accounting Policies” regarding the change in the presentation of deferred income taxes on the Consolidated Balance Sheet as of December 31, 2015.
During 2009, the Company recognized a capital loss related to the sale of its equity interest in ARB Arendal. A valuation allowance of $344 was provided against the Company’s deferred taxSAB 118 provides guidance on accounting for its capital loss carryforward as the Company believed that it was more likely than not that this capital loss would not be realized. However, in the 2012 tax year, the Company generated sufficient capital gain to utilize the capital loss carryforward, resulting in the utilizationuncertainties of the deferred tax asset and removaleffects of the related valuation allowance. No valuation allowance has been providedTax Act. Specifically, SAB 118 allows companies to record provisional estimates of the Company’simpact of the Tax Act during a one year “measurement period” similar to that used when accounting for business combinations.
As a result of the Tax Act, we remeasured deferred tax assets asand liabilities using the Company believes itnewly enacted tax rates and recorded a one-time net tax benefit of $9.4 million in the period ended December 31, 2017. This tax benefit is more likely than nota provisional estimate that these deferredcould be revised once we finalize our deductions for tax assets will be realized.depreciation and executive compensation accruals. We may also revise our estimate based on any additional guidance issued by the U.S. Treasury Department, the U.S. Internal Revenue Service, and other standard-setting bodies.
The tax effect of temporary differences that give rise to deferred income taxes for the yearyears ended December 31, 20152017 and 20142016 are as follows:follows (in thousands):
| | | | | | | | |
| | 2015 | | 2014 | | | 2017 | | 2016 | |
Deferred tax assets: | | | | | | | | | | | | |
Accrued compensation | | | $ | 3,323 | | $ | 5,804 | |
Accrued workers compensation | | $ | 10,058 | | $ | 6,460 | | | | 6,197 | | | 9,855 | |
Insurance reserves | | 5,489 | | 3,698 | | |
Other accrued liabilities | | 7,043 | | 5,665 | | |
Capital loss carryforward | | 1,800 | | 1,139 | | | | — | | | 1,077 | |
Foreign tax credit | | 1,293 | | 575 | | | | 1,456 | | | 1,349 | |
Accrued Compensation | | 9,673 | | 10,718 | | |
Insurance reserves | | | | 2,544 | | | 3,248 | |
Loss reserves | | | | 2,215 | | | 4,841 | |
Pension liability | | | | — | | | 1,979 | |
State income taxes | | | | 2,233 | | | 2,011 | |
Other | | | | 202 | | | 288 | |
Total deferred tax assets | | 35,356 | | 28,255 | | | | 18,170 | | | 30,452 | |
Deferred tax liabilities | | | | | | | | | | | | |
Depreciation and amortization | | (33,304 | ) | (33,657 | ) | | | (30,555) | | | (38,327) | |
Prepaid expenses and other | | (977 | ) | (527 | ) | | | (586) | | | (1,955) | |
Total deferred tax liabilities | | (34,281 | ) | (34,184 | ) | | | (31,141) | | | (40,282) | |
Net deferred tax assets (liabilities) | | $ | 1,075 | | $ | (5,929 | ) | |
| | | | | | | | |
Valuation allowance | | | | (600) | | | — | |
| | | | | | | | |
Net deferred tax liabilities | | | $ | (13,571) | | $ | (9,830) | |
InAs of December 31, 2017, the third quartertax effects of 2014, the Internal Revenue Service concluded an examinationstate net operating loss carryforwards were $0.8 million, state tax credit carryforwards were $1.1 million, and foreign tax credit carryforwards were $1.5 million. These carryforwards will begin to expire in 2021, 2025, and 2019, respectively. We determined it is more likely than not that a portion of our federal incomedeferred tax returns for 2011 and 2012 which didasset related to foreign tax credits will be not havebe realized; a material impact on our financial statements. The Company’s federal income tax returns are no longer subject to examination for tax years before 2013. The statutesvaluation allowance of limitation of state and foreign jurisdictions vary generally between 3 to 5 years. Accordingly, the tax years 2010 through 2014 generally remain open to examination by the other taxing jurisdictions in which the Company operates.
F-32
Table of Contents$0.6 million was recorded.
A reconciliation of the beginning and ending amounts and aggregate changes in the balancegross balances of unrecognized tax benefits for each period is as follows:follows (in thousands):
| | 2015 | | 2014 | | 2013 | | | | | | | | | | | |
| | | | | | | | | 2017 | | 2016 | | 2015 | |
Beginning balance | | $ | 456 | | $ | 5,382 | | $ | 72 | | | $ | — | | $ | — | | $ | 456 | |
Increases in balances for tax positions taken during the current year | | — | | — | | 1,340 | | | | 592 | | | — | | | — | |
Increases in balances for tax positions taken during prior years | | — | | — | | 3,993 | | | | — | | | — | | | — | |
Settlements and effective settlements with tax authorities | | (456 | ) | (4,878 | ) | — | | | | — | | | — | | | (456) | |
Lapse of statute of limitations | | — | | (48 | ) | (23 | ) | | | — | | | — | | | — | |
Total | | $ | — | | $ | 456 | | $ | 5,382 | | | $ | 592 | | $ | — | | $ | — | |
The Company settled all unrecognized tax benefits with the tax authorities in the third quarter of 2015.
The Company recognizesWe recognize accrued interest and penalties related to uncertain tax positions in income tax expense, which were not material for the three years presented were not material.presented.
We believe it is reasonably possible that decreases between $0 and $0.1 million of unrecognized tax benefits could occur in the next twelve months due to the expiration of statutes of limitation.
Our federal income tax returns are generally no longer subject to examination for tax years before 2014. The statutes of limitation of state and foreign jurisdictions generally vary between 3 to 5 years. Accordingly, the tax years 2012 through 2016 remain open to examination by the other taxing jurisdictions in which we operate.
Note 23—21—Dividends and Earnings Per Share
We have paid or declared cash dividends during 2016 and 2017 as follows:
| | | | | | | |
Declaration Date | | Record Date | | Payable Date | | Amount Per Share |
February 22, 2016 | | March 31, 2016 | | April 15, 2016 | | $ | 0.055 |
May 2, 2016 | | June 30, 2016 | | July 15, 2016 | | $ | 0.055 |
August 3, 2016 | | September 30, 2016 | | October 14, 2016 | | $ | 0.055 |
November 2, 2016 | | December 31, 2016 | | January 16, 2017 | | $ | 0.055 |
February 21, 2017 | | March 31, 2017 | | April 15, 2017 | | $ | 0.055 |
May 5, 2017 | | June 30, 2017 | | July 14, 2017 | | $ | 0.055 |
August 2, 2017 | | September 29, 2017 | | October 14, 2017 | | $ | 0.055 |
November 2, 2017 | | December 29, 2017 | | January 15, 2018 | | $ | 0.060 |
The payment of future dividends is contingent upon our revenues and earnings, capital requirements and our general financial condition, as well as contractual restrictions and other considerations deemed relevant by the Board of Directors.
The table below presents the computation of basic and diluted earnings per share for the years ended December 31, 2017, 2016 and 2015 2014 and 2013 follows:follows (in thousands, except per share amounts):
| | | | | | | | | | |
| | 2015 | | 2014 | | 2013 | | | 2017 | | 2016 | | 2015 |
Numerator: | | | | | | | | | | | | | | | | |
Net income | | $ | 37,151 | | $ | 63,682 | | $ | 74,680 | | |
Net income attributable to noncontrolling interests | | (279 | ) | (526 | ) | (5,020 | ) | |
Net income attributable to Primoris | | $ | 36,872 | | $ | 63,156 | | $ | 69,660 | | | $ | 72,354 | | $ | 26,723 | | $ | 36,872 |
| | | | | | | | | | | | | | | | |
Denominator (shares in thousands): | | | | | | | | |
Denominator: | | | | | | | | | | |
Weighted average shares for computation of basic earnings per share | | 51,647 | | 51,607 | | 51,540 | | | | 51,481 | | | 51,762 | | | 51,647 |
Dilutive effect of shares issued to independent directors | | 2 | | 2 | | 3 | | | | 3 | | | 3 | | | 2 |
Dilutive effect of unvested restricted stock units (1) | | 149 | | 138 | | 66 | | |
Dilutive effect of shares issued to Q3C sellers (2) | | — | | — | | 1 | | |
Dilutive effect of restricted stock units (1) | | | | 257 | | | 224 | | | 149 |
Weighted average shares for computation of diluted earnings per share | | 51,798 | | 51,747 | | 51,610 | | | | 51,741 | | | 51,989 | | | 51,798 |
| | | | | | | | | | | | | | | | |
Earnings per share attributable to Primoris: | | | | | | | | | | | | | | | | |
Basic | | $ | 0.71 | | $ | 1.22 | | $ | 1.35 | | | $ | 1.41 | | $ | 0.52 | | $ | 0.71 |
Diluted | | $ | 0.71 | | $ | 1.22 | | $ | 1.35 | | | $ | 1.40 | | $ | 0.51 | | $ | 0.71 |
| (1) | | Represents the effect of the grant of 259,065 shares of Restricted Stock Units and 3,097 vested Dividend Equivalent Units. |
(1) Represents the effect of the grant of 100,000 shares of Restricted Stock Units on May 3, 2013 and 48,512 Units on March 24, 2014.Note 22—Stockholders’ Equity
(2) Represents the effect of the 29,273 unregistered shares of common stock issued in February 2013 as part of the purchase consideration for the Q3C acquisition in 2012.Common Stock
Note 24—Stockholders’ Equity
Common Stock
The Company isWe are authorized to issue 90,000,000 shares of $0.0001 par value common stock, of which 51,676,14051,448,753 and 51,561,39651,576,442 shares were issued and outstanding as of December 31, 20152017 and 2014,2016, respectively. As of December 31, 2015,2017, there were 399365 holders of record of our common stock.
The CompanyWe issued 65,429 shares of common stock in 2017, 85,907 shares of common stock in 2016, and 96,828 shares of common stock in 2015 and 77,455 shares of common stock in 2014 under the Company’sour LTR Plan. The shares were purchased by the participants ofin the LTR Plan with paymentpayments made to the Companyus of $1,621$1.1 million in 20152017, $1.4 million in 2016, and $1,671$1.6 million in 2014. The Company’s2015. Our LTR Plan for managers and executives allows participants to use a portion of their
F-33
Table of Contents
annual bonus amount to purchase Companyour common stock at a discount from the market price. The shares purchased in February 2017 were for bonus amounts earned in 2016, and the number of shares was calculated at 75% of the average closing price of January 2017. The shares purchased in March 2016 were for bonus amounts earned in 2015, and the number of shares was calculated at 75% of the
average closing price of December 2015. The shares purchased in March 2015 were for bonus amounts earned in 2014, and the number of shares was calculated at 75% of the average market price of December 2014. The shares purchased have a six month trading restriction.
The CompanyWe issued shares of common stock under the Equity Plan to the non-employee members of the Board of Directors as part of the Company’sour quarterly compensation provided to the Directors. Shares issued were as follows:
· 9,748 shares in August 2015,
· 8,168 shares in March 2015,
· 6,172 shares in August 2014,
· 6,375 shares in February 2014,
· 9,110 shares in August 2013, and
· 12,480 shares in March 2013,
| · | | 11,448 shares in August 2017, |
| · | | 11,784 shares in February 2017, |
| · | | 11,745 shares in August 2016, |
| · | | 10,450 shares in February 2016, |
| · | | 9,748 shares in August 2015, and |
| · | | 8,168 shares in March 2015, |
The shares were fully vested upon issuance and have a one-year trading restriction.
As part of the acquisition of Q3C, the Company issued 29,273 unregistered shares of stock on January 7, 2013 based on the average December 2012 closing prices, or $14.69 per share for a total value of $430.
As discussed in Note 20—18—“Deferred Compensation Agreements and Stock-Based Compensation”,” the Board of Directors has granted a total of 148,512259,065 shares of Units under the Equity Plan.
At December 31, 2015,2017, there were 2,163,9071,853,494 shares of common stock reserved to provide for the grant and exercise of all future stock option grants, SARS, Units and grants of restricted shares under the Equity Plan. Other than the Units discussed above, there were no stock options, SARS or restricted shares of stock issued or outstanding at December 31, 2015.2017.
The Company was provided 15,144 shares of Primoris common stock in exchange for the payment of a $300 note receivable associated with the February 2010 sale of the Company’s Ecuador business. The note was fully reserved in 2010. The shares, valued at $19.81 per share, were cancelled by the Company and the Company recorded the transaction as non-operating income in March 2013.Share Repurchase Plan
In February 2014,2017, our Board of Directors authorized a $5.0 million share repurchase program under which we could, depending on market conditions, share price and other factors, acquire shares of our common stock on the Company’sopen market or in privately negotiated transactions. During the month of March 2017, we purchased and cancelled 216,350 shares of stock for $5.0 million at an average cost of $23.10 per share.
In August 2016, our Board of Directors authorized a share repurchase program under which the Company,we, from time to time and depending on market conditions, share price and other factors, could acquire shares of itsour common stock on the open market or in privately negotiated transactions up to an aggregate purchase price of $23$5.0 million. During the period from February 2014 through September 2014, the Companymonth of December 2016, we purchased and cancelled 100,000207,800 shares of stock for $2.8$5.0 million at an average cost of $28.44$24.02 per share. This share repurchase program expired on December 31, 2014.
Preferred StockThere were no share repurchases authorized in 2015.
The Company isPreferred Stock
We are authorized to issue 1,000,000 shares of $0.0001 par value preferred stock. No shares of Preferred Stock were outstanding at December 31, 2015 or 2014.2017, 2016, and 2015.
Warrants
At December 31, 20152017, 2016, and 2014,2015 there were no warrants outstanding.
Note 25—23—Selected Quarterly Financial Information (Unaudited)
Selected unaudited quarterly consolidated financial information is presented in the following tables:tables (in thousands, except per share amounts):
| | Year Ended December 31, 2015 | | | | | | | | | | | | | | |
(In thousands, except per share data) | | 1st
Quarter | | 2nd
Quarter | | 3rd
Quarter | | 4th
Quarter | | |
| | | Year Ended December 31, 2017 | |
| | | 1st | | 2nd | | 3rd | | 4th | |
| | | Quarter | | Quarter | | Quarter | | Quarter | |
Revenues | | $ | 392,780 | | $ | 483,545 | | $ | 555,945 | | $ | 497,145 | | | $ | 561,502 | | $ | 631,165 | | $ | 608,311 | | $ | 579,017 | |
Gross profit | | 38,005 | | 46,496 | | 71,647 | | 63,725 | | | | 55,053 | | | 84,483 | | | 70,421 | | | 68,477 | |
Net income | | 1,672 | | 3,692 | | 19,079 | | 12,708 | | | | 8,512 | | | 22,396 | | | 22,134 | | | 23,808 | |
Net income attributable to Primoris | | 1,672 | | 3,638 | | 19,007 | | 12,555 | | | | 7,691 | | | 21,545 | | | 20,597 | | | 22,521 | |
| | | | | | | | | | | | | | | | | | | | | | |
Earnings per share: | | | | | | | | | | | | | | | | | | | | | | |
Basic earnings per share | | $ | 0.03 | | $ | 0.07 | | $ | 0.37 | | $ | 0.24 | | | $ | 0.15 | | $ | 0.42 | | $ | 0.40 | | $ | 0.44 | |
Diluted earnings per share | | $ | 0.03 | | $ | 0.07 | | $ | 0.37 | | $ | 0.24 | | | $ | 0.15 | | $ | 0.42 | �� | $ | 0.40 | | $ | 0.44 | |
| | | | | | | | | | | | | | | | | | | | | | |
Weighted average shares outstanding (in thousands) | | | | | | | | | | |
Weighted average shares outstanding | | | | | | | | | | | | | | |
Basic | | 51,572 | | 51,666 | | 51,672 | | 51,676 | | | | 51,594 | | | 51,437 | | | 51,441 | | | 51,449 | |
Diluted | | 51,726 | | 51,815 | | 51,824 | | 51,825 | | | | 51,851 | | | 51,688 | | | 51,707 | | | 51,711 | |
F-34
| | | | | | | | | | | | | |
| | Year Ended December 31, 2016 | |
| | 1st | | 2nd | | 3rd | | 4th | |
| | Quarter | | Quarter | | Quarter | | Quarter | |
Revenues | | $ | 430,446 | | $ | 456,811 | | $ | 507,828 | | $ | 601,863 | |
Gross profit | | | 39,277 | | | 43,285 | | | 50,129 | | | 68,616 | |
Impairment of goodwill | | | — | | | — | | | 2,716 | | | — | |
Net income | | | 2,916 | | | 5,287 | | | 4,756 | | | 14,766 | |
Net income attributable to Primoris | | | 2,693 | | | 5,056 | | | 4,504 | | | 14,470 | |
| | | | | | | | | | | | | |
Earnings per share: | | | | | | | | | | | | | |
Basic earnings per share | | $ | 0.05 | | $ | 0.10 | | $ | 0.09 | | $ | 0.28 | |
Diluted earnings per share | | $ | 0.05 | | $ | 0.10 | | $ | 0.09 | | $ | 0.28 | |
| | | | | | | | | | | | | |
Weighted average shares outstanding | | | | | | | | | | | | | |
Basic | | | 51,725 | | | 51,772 | | | 51,780 | | | 51,771 | |
Diluted | | | 51,881 | | | 52,022 | | | 52,034 | | | 52,021 | |
Table of Contents
| | Year Ended December 31, 2014 | |
(In thousands, except per share data) | | 1st
Quarter | | 2nd
Quarter | | 3rd
Quarter | | 4th
Quarter | |
Revenues | | $ | 470,074 | | $ | 515,291 | | $ | 613,237 | | $ | 487,592 | |
Gross profit | | 49,757 | | 61,194 | | 75,473 | | 49,616 | |
Net income | | 11,265 | | 16,003 | | 27,390 | | 9,024 | |
Net income attributable to Primoris | | 10,833 | | 16,003 | | 27,390 | | 8,930 | |
| | | | | | | | | |
Earnings per share: | | | | | | | | | |
Basic earnings per share | | $ | 0.21 | | $ | 0.31 | | $ | 0.53 | | $ | 0.17 | |
Diluted earnings per share | | $ | 0.21 | | $ | 0.31 | | $ | 0.53 | | $ | 0.17 | |
| | | | | | | | | |
Weighted average shares outstanding (in thousands) | | | | | | | | | |
Basic | | 51,610 | | 51,655 | | 51,606 | | 51,561 | |
Diluted | | 51,714 | | 51,804 | | 51,759 | | 51,710 | |
| | Year Ended December 31, 2013 | |
(In thousands, except per share data) | | 1st
Quarter | | 2nd
Quarter | | 3rd
Quarter | | 4th
Quarter | |
Revenues | | $ | 409,995 | | $ | 445,013 | | $ | 551,333 | | $ | 537,879 | |
Gross profit | | 46,096 | | 59,537 | | 75,465 | | 74,917 | |
Net income | | 10,040 | | 15,893 | | 23,193 | | 25,554 | |
Net income attributable to Primoris | | 9,770 | | 15,564 | | 21,845 | | 22,481 | |
| | | | | | | | | |
Earnings per share: | | | | | | | | | |
Basic earnings per share | | $ | 0.19 | | $ | 0.30 | | $ | 0.42 | | $ | 0.44 | |
Diluted earnings per share | | $ | 0.19 | | $ | 0.30 | | $ | 0.42 | | $ | 0.44 | |
| | | | | | | | | |
Weighted average shares outstanding (in thousands) | | | | | | | | | |
Basic | | 51,456 | | 51,562 | | 51,568 | | 51,571 | |
Diluted | | 51,467 | | 51,626 | | 51,671 | | 51,671 | |
Note 26—24—Subsequent Event
On February 22, 2016,21, 2018, the Board of Directors declared a cash dividend of $0.055$0.06 per common share for stockholders of record as of March 31, 2016,30, 2018, payable on or about April 15, 2016.13, 2018.
F-35
Exhibit No.
|
| Description
|
| | |
Exhibit 2.1
| | Agreement and Plan of Merger, dated February 19, 2008, by and among Rhapsody Acquisition Corp., Primoris Corporation and certain stockholders of Primoris Corporation (1)
|
| | |
Exhibit 2.2
| | First Amendment to Agreement and Plan of Merger, dated May 15, 2008, by and among Rhapsody Acquisition Corp., Primoris Corporation and certain stockholders of Primoris Corporation (2)
|
| | |
Exhibit 2.3
| | Membership Interest Purchase Agreement, dated July 1, 2010, by and between Primoris Services Corporation, Kealine Holdings LLC and WesPac Energy LLC (3)
|
| | |
Exhibit 2.4
| | Agreement and Plan of Merger, dated November 8, 2010, by and among Primoris Services Corporation, a Delaware corporation, Primoris Merger Sub, Inc., a Delaware corporation and a wholly-owned subsidiary of Primoris Services Corporation, Rockford Holdings Corporation, a privately-held Delaware corporation, all of the stockholders of Rockford Holdings Corporation and Christopher S. Wallace as representative of the stockholders of Rockford Holdings Corporation (4)
|
| | |
Exhibit 2.5
| | Stock Purchase Agreement, dated November 8, 2012, by and among Primoris Services Corporation, a Delaware corporation, Q3 Contracting Inc., a privately-held Minnesota corporation, all of the shareholders of Q3 Contracting Inc. and Jay P. Osborn as representative of the shareholders of Q3 Contracting Inc. (5)
|
| | |
Exhibit 3.1
| | Fourth Amended and Restated Certificate of Incorporation of Primoris Services Corporation, dated May 21, 2009 (6)
|
| | |
Exhibit 3.2
| | Amended and Restated Bylaws of Primoris Services Corporation (7)
|
| | |
Exhibit 3.3
| | Certificate of Designations, Powers, Preferences and Rights of the Series A Non-Voting Contingent Convertible Preferred Stock of Primoris Services Corporation, dated December 14, 2009 (8)
|
| | |
Exhibit 4.1
| | Specimen Common Stock Certificate (9)
|
| | |
Exhibit 10.1
| | 2008 Long-Term Equity Incentive Plan (#)(10)
|
| | |
Exhibit 10.2
| | 2013 Equity Incentive Plan (#)(11)
|
| | |
Exhibit 10.3
| | Loan and Security Agreement, dated October 28, 2009, by and between Primoris Services Corporation and The PrivateBank and Trust Company (12)
|
| | |
Exhibit 10.4
| | First Amendment to Loan and Security Agreement, dated January 14, 2010, by and among Primoris Services Corporation and The PrivateBank and Trust Company (13)
|
| | |
Exhibit 10.5
| | Second Amendment to Loan and Security Agreement, dated September 30, 2010, by and among Primoris Services Corporation and The PrivateBank and Trust Company (13)
|
| | |
Exhibit 10.6
| | Master Loan and Security Agreement, dated June 25, 2010, by and between Stellaris, LLC and Banc of America Leasing & Capital, LLC (14)
|
| | |
Exhibit 10.7
| | Master Loan and Security Agreement, dated August 31, 2009, by and between Stellaris, LLC and Fifth Third Bank (14)
|
| | |
Exhibit 10.8
| | Purchase Trading Plan Agreement, dated September 7, 2010, by and between Primoris Services Corporation and CJS Securities, Inc. (15)
|
Exhibit No.
| | Description
|
| |
|
Exhibit 10.9
| | Loan Agreement, dated December 29, 2010, by and between Stellaris, LLC and RBS Asset Finance, Inc. (16)
|
| | |
Exhibit 10.10
| | Note, dated December 29, 2010, by and between Stellaris, LLC and RBS Asset Finance, Inc. (16)
|
| | |
Exhibit 10.11
| | Collateral Schedule No. 1, dated December 29, 2010, by and between Stellaris, LLC and RBS Asset Finance, Inc. (16)
|
| | |
Exhibit 10.12
| | Guaranty, dated December 29, 2010, by and between Primoris Services Corporation and RBS Asset Finance, Inc. (16)
|
| | |
Exhibit 10.13
| | Third Amendment to Loan and Security Agreement, dated March 3, 2011, by and among Primoris Services Corporation and The PrivateBank and Trust Company (17)
|
| | |
Exhibit 10.14
| | Fourth Amendment to Loan and Security Agreement, dated October 20, 2011, by and among Primoris Services Corporation and The PrivateBank and Trust Company (18)
|
| | |
Exhibit 10.15
| | Credit Agreement, dated September 23, 2011, by and among Primoris Services Corporation and Bank of the West (19)
|
| | |
Exhibit 10.16
| | Fifth Amendment to Loan and Security Agreement, dated November 28, 2011, by and among Primoris Services Corporation and The PrivateBank and Trust Company (19)
|
| | |
Exhibit 10.17
| | Loan and Security Agreement, dated November 30, 2011, by and among Stellaris LLC, James Construction Group LLC and JPMorgan Chase Bank, N.A. (19)
|
| | |
Exhibit 10.18
| | Business Purpose Promissory Note, dated November 30, 2011, by and among Stellaris LLC, James Construction Group LLC and JPMorgan Chase Bank, N.A. (19)
|
| | |
Exhibit 10.19
| | Schedule A-1 Equipment Collateral, dated November 30, 2011, by and between Stellaris LLC, James Construction Group LLC and JPMorgan Chase Bank, N.A. (19)
|
| | |
Exhibit 10.20
| | Amendment No. 3 to the Master Loan and Security Agreement Loan and Security Agreement, dated November 30, 2011, by and among James Construction Group LLC, Stellaris LLC, ARB Inc. and Fifth Third Bank (19)
|
| | |
Exhibit 10.21
| | Promissory Note, dated November 30, 2011, by and among James Construction Group LLC, Stellaris LLC, ARB Inc. and Fifth Third Bank (19)
|
| | |
Exhibit 10.22
| | Master Loan and Security Agreement, dated December 21, 2011, by and among ARB, Inc. and Banc of America Leasing & Capital, LLC (20)
|
| | |
Exhibit 10.23
| | Equipment Security Note, dated December 21, 2011, by and among ARB, Inc., Stellaris LLC, Rockford Corporation and Banc of America Leasing & Capital, LLC (20)
|
| | |
Exhibit 10.24
| | Addendum to Master Loan and Security Agreement, dated December 21, 2011, by and among ARB, Inc., Stellaris LLC, Rockford Corporation and Banc of America Leasing & Capital, LLC (20)
|
| | |
Exhibit 10.25
| | Guaranty, dated December 21, 2011, by and among Primoris Services Corporation and Banc of America Leasing & Capital, LLC (20)
|
| | |
Exhibit 10.26
| | General Indemnity Agreement, dated January 24, 2012, by and among Primoris Services Corporation, ARB, Inc. ARB Structures, Inc., OnQuest, Inc., OnQuest Heaters, Inc. Born Heaters Canada ULC, Cardinal Contractors, Inc., Cardinal Southeast, Inc., Stellaris, LLC, GML Coatings, LLC, James Construction Group, LLC, Juniper Rock Corporation, Rockford Corporation; Alaska Continental Pipeline, Inc., All Day Electric Company, Inc. Primoris Renewables, LLC, Rockford Pipelines Canada, Inc. and Chubb Group of Insurance Companies (21)
|
Exhibit No.
| | Description
|
Exhibit 10.27
| | Fifth Amendment to Loan and Security Agreement, dated April 4, 2012, by and among Primoris Services Corporation and The PrivateBank and Trust Company (22)
|
| | |
Exhibit 10.28
| | Equipment Security Note, dated June 20, 2012, by and among Stellaris, LLC, James Construction Group, LLC and Banc of America Leasing & Capital, LLC (23)
|
| | |
Exhibit 10.29
| | Amendment Number 1 to Master Loan and Security Agreement, dated June 20, 2012, by and among Stellaris, LLC, James Construction Group, LLC and Banc of America Leasing & Capital, LLC (23)
|
| | |
Exhibit 10.30
| | Seventh Amendment to Loan and Security Agreement, dated July 18, 2012, by and among Primoris Services Corporation and The PrivateBank and Trust Company (24)
|
| | |
Exhibit 10.31
| | Eighth Amendment to Loan and Security Agreement, dated October 29, 2012, by and among Primoris Services Corporation and The PrivateBank and Trust Company (25)
|
| | |
Exhibit 10.32
| | Master Loan and Security Agreement, dated November 1, 2012, by and between Stellaris, LLC and Banc of America Leasing & Capital, LLC (26)
|
| | |
Exhibit 10.33
| | Amendment to Master Loan and Security Agreement, dated November 7, 2012, by and among Stellaris, LLC, James Construction Group, LLC, Miller Springs Materials, LLC, Primoris Energy Services Corporation and Banc of America Leasing & Capital, LLC (26)
|
| | |
Exhibit 10.34
| | Equipment Security Note, dated November 1, 2012, by and among Stellaris, LLC, James Construction Group, LLC, Miller Springs Materials, LLC, Primoris Energy Services Corporation and Banc of America Leasing & Capital, LLC (26)
|
| | |
Exhibit 10.35
| | Loan Agreement, dated December 13, 2012, by and between Stellaris, LLC and Q3 Contracting, Inc. and RBS Asset Finance, Inc. (27)
|
| | |
Exhibit 10.36
| | Note, dated December 13, 2012, by and among Stellaris, LLC and Q3 Contracting, Inc. and RBS Asset Finance, Inc. (27)
|
| | |
Exhibit 10.37
| | Guaranty, dated December 13, 2012, by and among Primoris Services Corporation and RBS Asset Finance, Inc. (27)
|
| | |
Exhibit 10.38
| | Credit Agreement, dated December 28, 2012, by and among Primoris Services Corporation and The PrivateBank and Trust Company, The Bank of the West and IBERIABANK Corporation (28)
|
| | |
Exhibit 10.39
| | Note Purchase and Private Shelf Agreement, dated December 28, 2012, by and among Primoris Services Corporation and Prudential Investment Management, Inc. and certain Prudential affiliates (28)
|
| | |
Exhibit 10.40
| | Promissory Note, dated June 11,2013, by and among Stellaris, LLC and Fifth Third Bank pursuant to the Master Loan and Security Agreement dated August 31, 2009 (30)
|
| | |
Exhibit 10.41
| | Master Loan and Security Agreement, dated June 13, 2013, by and among Stellaris, LLC, James Construction Group, LLC, Rockford Corporation and Wells Fargo Equipment Finance, Inc. and Loan Schedules, dated June 13, 2013 (30)
|
| | |
Exhibit 10.42
| | Confirmation of Acceptance Agreement, dated June 13, 2013, by and among Primoris Services Corporation and Prudential Investment Management, Inc. and certain Prudential affiliates pursuant to the Note Purchase and Private Shelf Agreement, dated December 28, 2012 and five 3.85% Senior Secured Notes, Series B, due July 25, 2023 (30)
|
| | |
Exhibit 10.43
| | Loan Agreement, dated September 17, 2013, by and among Stellaris, LLC, James Construction Group LLC and Rockford Corporation and RBS Asset Finance, Inc. (31)
|
| | |
Exhibit 10.44
| | Loan and Security Agreement, dated September 20, 2013, by and between PNC Equipment Finance, LLC and Stellaris LLC and Q3 Contracting, Inc. (31)
|
Exhibit No.
| | Description
|
| | |
Exhibit 10.45
| | Contribution Agreement, dated as of September 30, 2013, by and among WesPac Energy LLC, Kealine Holdings LLC, Primoris Services Corporation and WesPac Midstream LLC and Highstar WesPac Main Interco LLC and Highstar WesPac Prism/IV-A Interco LLC (31)
|
| | |
Exhibit 10.46
| | Master Loan and Security Agreement, dated December 6, 2013 by and between Stellaris, LLC and Banc of America Leasing & Capital, LLC (32)
|
| | |
Exhibit 10.47
| | Equipment Security Note, dated as of December 6, 2013, by and between Stellaris, LLC, ARB, Inc. James Construction Group, LLC, and Rockford Corporation and Banc of America Leasing & Capital, LLC (32)
|
| | |
Exhibit 10.48
| | Master Security Agreement, dated September 18, 2014, by and among Primoris Services Corporation, Rockford Corporation and Key Equipment Finance, a division of KeyBank National Association. (33)
|
| | |
Exhibit 10.49
| | Promissory Note and Collateral Schedule No. 1, dated September 18, 2014, by and between Primoris Energy Services Corporation, Rockford Corporation and Key Equipment Finance, a division of KeyBank National Association. (33)
|
| | |
Exhibit 10.50
| | Master Loan and Security Agreement, dated September 19, 2014, by and among Fifth Third Bank and Primoris Services Corporation, James Construction Group, LLC and Q3 Contracting, Inc. (33)
|
| | |
Exhibit 10.51
| | Amendment No. 1 to Master Loan and Security Agreement, dated as of September 23, 2014, by and among Fifth Third Bank and Stellaris LLC. (33)
|
| | |
Exhibit 10.52
| | Promissory Note, dated September 19, 2014, by and among Primoris Services Corporation, James Construction Group, LLC, Q3 Contracting, Inc. and Fifth Third Bank. (33)
|
| | |
Exhibit 10.53
| | Third Amendment to Credit Agreement, dated as of December 12, 2014, by and among Primoris Services Corporation and The PrivateBank and Trust Company, The Bank of the West, IBERIABANK Corporation, Branch Banking and Trust Company and UMB Bank, N.A. (34)
|
| | |
Exhibit 10.54
| | Waiver and Amendment Agreement, dated as of April 30, 2014, by and among Primoris Services Corporation and The PrivateBank and Trust Company and other financial institutions party to the Credit Agreement. (34)
|
| | |
Exhibit 10.55
| | Second Amendment and Waiver Agreement, dated as of August 25, 2014, by and among Primoris Services Corporation and The PrivateBank and Trust Company and other financial institutions party to the Credit Agreement. (34)
|
| | |
Exhibit 10.56
| | Agreement for Services, dated August 1, 2015, by and among Primoris Services Corporation and Brian Pratt. (#) (*)
|
| | |
Exhibit 10.57
| | Employment Agreement, dated August 1, 2015, by and among Primoris Services Corporation and David L. King. (#) (*)
|
| | |
Exhibit 10.58
| | Third Letter Amendment to Shelf Agreement, dated as of June 3, 2015, by and among Primoris Services Corporation and Prudential Investment Management, Inc. and each other Holder (as defined in the Shelf Agreement). (35)
|
| | |
Exhibit 14.1
| | Code of Ethics and Business Conduct (29)
|
| | |
Exhibit 21.1
| | Subsidiaries and equity investments of Primoris Services Corporation (*)
|
| | |
Exhibit 23.1
| | Consent of Moss Adams LLP (*)
|
| | |
Exhibit 31.1
| | Certification of chief executive officer pursuant to Section 302 of the Sarbanes-Oxley Act of 2002 (*)
|
| | |
Exhibit 31.2
| | Certification of chief financial officer pursuant to Section 302 of the Sarbanes-Oxley Act of 2002 (*)
|
Exhibit No.
| | Description
|
Exhibit 32.1
| | Certification of chief executive officer pursuant to Section 906 of the Sarbanes-Oxley Act of 2002 (*)
|
| | |
Exhibit 32.2
| | Certification of chief financial officer pursuant to Section 906 of the Sarbanes-Oxley Act of 2002 (*)
|
| | |
Exhibit 101 INS
| | XBRL Instance Document (*)
|
Exhibit 101 SCH
| | XBRL Taxonomy Extension Schema Document (*)
|
Exhibit 101 CAL
| | XBRL Taxonomy Extension Calculation Linkbase Document (*)
|
Exhibit 101 LAB
| | XBRL Taxonomy Extension Label Linkbase Document (*)
|
Exhibit 101 PRE
| | XBRL Taxonomy Extension Presentation Linkbase Document (*)
|
Exhibit 101 DEF
| | XBRL Taxonomy Extension Definition Linkbase Document (*)
|
(#) Management contract or compensatory plan, contract or arrangement.
(*) Filed herewith.
(1)
| | Filed as an exhibit to our Current Report on Form 8-K, as filed with the SEC on February 20, 2008, and such exhibit is incorporated herein by reference.
|
(2)
| | Filed as an exhibit to our Registration Statement on Form S-4/A (Amendment No. 3) (File No. 333-150343), as filed with the SEC on July 1, 2008, and such exhibit is incorporated herein by reference.
|
(3)
| | Filed as an exhibit to our Current Report on Form 8-K, as filed with the SEC on July 8, 2010, and such exhibit is incorporated herein by reference.
|
(4)
| | Filed as an exhibit to our Current Report on Form 8-K, as filed with the SEC on November 12, 2010, and such exhibit is incorporated herein by reference.
|
(5)
| | Filed as an exhibit to our Current Report on Form 8-K, as filed with the SEC on November 15, 2012, and such exhibit is incorporated herein by reference.
|
(6)
| | Filed as an exhibit to our Quarterly Report on Form 10-Q, as filed with the SEC on August 12, 2009, and such exhibit is incorporated herein by reference.
|
(7)
| | Filed as an exhibit to our Current Report on Form 8-K, as filed with the SEC on August 6, 2008, and such exhibit is incorporated herein by reference.
|
(8)
| | Filed as exhibit to our Current Report on Form 8-K, as filed with the SEC on December 17, 2009, and such exhibit is incorporated herein by reference.
|
(9)
| | Filed as an exhibit to our Registration Statement on Form S-1 (File No. 333-134694), as filed with the SEC on June 2, 2006, and such exhibit is incorporated herein by reference.
|
(10)
| | Attached as an annex to our Registration Statement on Form S-4/A (Amendment No. 4) (File No. 333-150343), as filed with the SEC on July 9, 2008, and such annex is incorporated herein by reference.
|
(11)
| | Attached as Appendix A to our Definitive Proxy Statement on Schedule 14A filed with the SEC on April 9, 2013, and such Appendix is incorporated herein by reference.
|
(12)
| | Filed as an exhibit to our Current Report on Form 8-K, as filed with the SEC on November 4, 2009, and such exhibit is incorporated herein by reference.
|
(13)
| | Filed as an exhibit to our Current Report on Form 8-K, as filed with the SEC on October 6, 2010, and such exhibit is incorporated herein by reference.
|
(14)
| | Filed as an exhibit to our Current Report on Form 8-K, as filed with the SEC on July 1, 2010, and such exhibit is incorporated herein by reference.
|
(15)
| | Filed as an exhibit to our Current Report on Form 8-K, as filed with the SEC on September 8, 2010, and such exhibit is incorporated herein by reference.
|
(16)
| | Filed as an exhibit to our Current Report on Form 8-K, as filed with the SEC on January 6, 2011, and such exhibit is incorporated herein by reference.
|
(17)
| | Filed as an exhibit to our Annual Report on Form 10-K, as filed with the SEC on March 16, 2011, and such exhibit is incorporated herein by reference.
|
(18)
| | Filed as an exhibit to our Current Report on Form 8-K, as filed with the SEC on October 25, 2011, and such exhibit is incorporated herein by reference.
|
(19)
| | Filed as an exhibit to our Current Report on Form 8-K, as filed with the SEC on December 14, 2011, and such exhibit is incorporated herein by reference.
|
(20)
| | Filed as an exhibit to our Current Report on Form 8-K, as filed with the SEC on December 30, 2011, and such exhibit is incorporated herein by reference.
|
(21)
| | Filed as an exhibit to our Annual Report on Form 10-K, as filed with the SEC on March 5, 2012, and such exhibit is incorporated herein by reference.
|
(22)
| | Filed as an exhibit to our Annual Report on Form 10-Q, as filed with the SEC on May 9, 2012, and such exhibit is incorporated herein by reference.
|
(23)
| | Filed as an exhibit to our Current Report on Form 8-K, as filed with the SEC on June 28, 2012, and such exhibit is incorporated herein by reference.
|
(24)
| | Filed as an exhibit to our Current Report on Form 8-K, as filed with the SEC on July 23, 2012, and such exhibit is incorporated herein by reference.
|
(25)
| | Filed as an exhibit to our Current Report on Form 8-K, as filed with the SEC on November 2, 2012, and such exhibit is incorporated herein by reference.
|
(26)
| | Filed as an exhibit to our Current Report on Form 8-K, as filed with the SEC on November 9, 2012, and such exhibit is incorporated herein by reference.
|
(27)
| | Filed as an exhibit to our Current Report on Form 8-K, as filed with the SEC on December 18, 2012, and such exhibit is incorporated herein by reference.
|
(28)
| | Filed as an exhibit to our Current Report on Form 8-K, as filed with the SEC on January 7, 2013, and such exhibit is incorporated herein by reference.
|
(29)
| | Filed as an exhibit to our Annual Report on Form 10-K, as filed with the SEC on March 11, 2010, and such exhibit is incorporated herein by reference.
|
(30)
| | Filed as an exhibit to our Quarterly Report on Form 10-Q, as filed with the SEC on August 7, 2013, and such exhibit is incorporated herein by reference.
|
(31)
| | Filed as an exhibit to our Quarterly Report on Form 10-Q, as filed with the SEC on November 5, 2013, and such exhibit is incorporated herein by reference.
|
(32)
| | Filed as an exhibit to our Annual Report on Form 10-K, as filed with the SEC on March 3, 2014, and such exhibit is incorporated herein by reference.
|
(33)
| | Filed as an exhibit to our Quarterly Report on Form 10-Q, as filed with the SEC on November 7, 2014, and such exhibit is incorporated herein by reference.
|
(34)
| | Filed as an exhibit to our Current Report on Form 8-K, as filed with the SEC on December 18, 2014, and such exhibit is incorporated herein by reference.
|
(35)
| | Filed as an exhibit to our Current Report on Form 8-K, as filed with the SEC on June 9, 2015, and such exhibit is incorporated herein by reference.
|
65