| ( X ) | ANNUAL REPORT PURSUANT TO SECTION 13 OR 15(d) OF THE SECURITIES EXCHANGE ACT OF 1934 | |
For the fiscal year ended December 31, 20152017
oTRANSITION REPORT PURSUANT TO SECTION 13 OR 15(d) OF THE SECURITIES EXCHANGE ACT OF 1934
| ( ) | TRANSITION REPORT PURSUANT TO SECTION 13 OR 15(d) OF THE SECURITIES EXCHANGE ACT OF 1934 | |

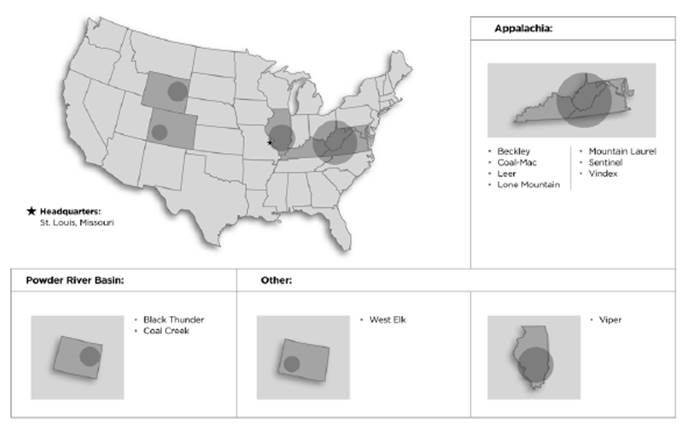
Name of Each Exchange on Which Registered Common Stock, $.01 par value We are one of the world’s largest coal producers. For the year ended December 31, We incorporate by reference the information about the geographical breakdown of our coal sales for the respective periods covered within this Form 10-K contained in Note 24 to the Consolidated Financial Statements. 2017 based on preliminary data. Actual Estimated Forecast Annual Sector 2010 2015 2016 2020 2040 2013 - 2040 (Tons, in millions) Electric power 975 747 746 694 677 (0.9 )% Other industrial 49 40 41 46 49 0.5 % Coke plants 21 19 17 21 18 (0.7 )% Residential/commercial 3 3 2 2 2 0.5 % *Total U.S. coal consumption 1,049 809 807 770 746 0.2 % Western bituminous coal has certain quality characteristics, especially its high heat content and low sulfur, that make this a desirable coal for domestic and international power producers. of the Consolidated Financial Statements. Captive Contract Mining Tons Sold(2)(3) Total Cost of Assigned Mining Complex Mines(1) Mines(1) Equipment Railroad 2013 2014 2015 2015 Reserves (Million tons) ($ millions) (Million tons) Powder River Basin: Black Thunder S — D, S UP/BN 100.7 101.2 99.5 $ 1,212.5 1,163.9 Coal Creek S — D, S UP/BN 8.5 9.4 7.8 146.6 153.7 Other: West Elk U — LW, CM UP 6.1 6.5 5.1 417.9 53.5 Viper U — CM — 2.2 2.2 2.1 99.8 37.2 Appalachia: Coal-Mac S — L, E NS/CSX 3.1 2.8 2.4 205.4 24.6 Lone Mountain U(3) — CM NS/CSX 2.0 1.9 1.6 256.2 10.2 Mountain Laurel U — L, LW, CM CSX 2.9 2.6 2.3 4.1 — Beckley U — CM CSX 1.1 1.0 0.9 — — Vindex S — L, E CSX 0.6 0.5 0.6 — — Sycamore No. 2 — U CM — 0.4 0.5 0.2 — — Sentinel U — CM CSX 1.0 1.1 0.9 — — Leer U — CM, LW CSX 0 2.7 2.9 463.2 40.1 Totals 128.6 132.4 126.3 $ 2,805.7 1,483.2 D = Dragline UP = Union Pacific Railroad U = Underground mine L = Loader/truck CSX = CSX Transportation S = Shovel/truck BN = Burlington E = Excavator/truck NS = Norfolk Southern Railroad LW = Longwall CM = Continuous miner HW = Highwall miner 2017. (In thousands) Europe $ 170,314 Asia 96,523 Central and South America 55,323 North America 40,315 Brokered Sales 32,848 Total $ 395,323 certain time period, the unaffected party may have the option to terminate the purchase or sale in whole or in part. Some contracts stipulate that this tonnage can be made up by mutual agreement or at the discretion of the buyer. Agreements between our customers and the railroads servicing our mines may also contain force majeure provisions. 2017. truck. third parties. leases and other miscellaneous obligations. Compliance with these laws has substantially increased the cost of coal mining for domestic coal producers. published the final revisions to the stream buffer zone rule in the Federal Register. The revisions However, on February 2, 2017, Congress voted to repeal the stream protection rule under the Congressional Review Act. President Trump signed the bill repealing the rule on February 16, 2017. decrease in the number of companies willing to issue surety bonds. Under the Black Lung Benefits Revenue Act of 1977 and the Black Lung Benefits Reform Act of 1977, each coal mine operator must secure payment of federal black lung benefits to claimants who are current and former employees and to a trust fund for the payment of benefits and medical expenses to claimants who last worked in the coal industry prior to July 1, 1973. The trust fund is funded by an excise tax on production of up to $1.10 per ton for coal mined in underground operations and up to $0.55 per ton for coal mined in surface operations. These amounts may not exceed 4.4% of the gross sales price. This excise tax does not apply to coal shipped outside the United States. In emitted by do so in a separate future action. dioxide and nitrous oxide, which could lead to non-attainment of PM2.5 and ozone NAAQS in downwind states (interstate transport), pursuant to a cap and trade program similar to the system now in effect for acid deposition control. In July 2008, in State of North Carolina v. EPA and consolidated cases, the future course of the Rule is unclear. plans by December 17, 2007, and the EPA issued a Finding of Failure to Submit plans on January 15, 2009 (74 Fed. Reg. 2392). The EPA had taken no enforcement action against states to finalize implementation plans and was slowly dealing with the state Regional Haze SIPs that were submitted, which resulted in the National Parks Conservation Association commencing litigation in the D.C. Circuit However, on January 18, 2018, EPA announced that it was revisiting the 2017 Regional Haze Rule revisions, and announced an intent to commence a new rulemaking. This proceeding may slow or even roll back certain Regional Haze requirements. nationally. extent the United States ultimately participates in these reductions (whether via the Paris Agreement or otherwise). created uncertainty over Clean Water Act jurisdiction and permitting requirements that could variously increase or decrease the cost and time we expend on Clean Water Act compliance. or sulfate could result in large treatment expenses for mine operators. of the Registrant Mr. Cochran has served as our Senior Vice President-Operations since August 2012. From May 2011 to August 2012, Mr. Cochran served as Group President of our western operations, which included Thunder Basin Coal Company, the Arch Western Bituminous Group, Arch of Wyoming and the Otter Creek development, and served as President and General Manager of Thunder Basin Coal Company from 2005 to April 2011. Prior to joining Arch Coal in 2005, Mr. Cochran spent 20 years with TXU Corporation. Mr. Cochran currently serves on the John T. Drexler Mr. Drexler has served as our Senior Vice President and Chief Financial Officer since John W. Eaves Mr. Eaves Robert G. Jones Mr. Jones has served as our Senior Vice President-Law, General Counsel and Secretary since 2008. Mr. Jones served as Vice President-Law, General Counsel and Secretary from 2000 to 2008. Allen R. Kelley Mr. Kelley was appointed Vice President-Human Resources in March 2014. From 2008 to March 2014, Mr. Kelley served as our Vice President-Enterprise Risk Management. From 2005 to 2008, Mr. Kelley served as our Director of Internal Audit. Prior to 2005, Mr. Kelley held various finance and accounting positions within the corporate and operations functions of Arch Coal, Inc. Paul A. Lang Mr. Lang was elected our President and Chief Operating Officer in April 2015. He has served as our Executive Vice President and Chief Operating Officer since April 2012 and as our Executive Vice President-Operations from August 2011 to April 2012. Mr. Lang served as Senior Vice President-Operations from 2006 through August 2011, as President of Western Operations from 2005 through 2006 and President and General Manager of Thunder Basin Coal Company from 1998 to 2005. Mr. Lang is a director of Deck S. Slone Mr. Slone has served as our Senior Vice President-Strategy and Public Policy since June 2012. Mr. Slone served as our Vice President-Government, Investor and Public Affairs from 2008 to June 2012. Mr. Slone served as our Vice President-Investor Relations and Public Affairs from 2001 to 2008. Mr. Slone is John A. Ziegler, Jr. Mr. Ziegler was appointed Chief Commercial Officer in March 2014. Mr. Ziegler served as our Vice President-Human Resources from April 2012 to March 2014. From October 2011 to April 2012, Mr. Ziegler served as our Senior Director-Compensation and Benefits. From 2005 to October 2011 Mr. Ziegler served as Vice President-Contract Administration, President of Sales, then finally Senior Vice President, Sales and Marketing and Marketing Administration. Mr. Ziegler joined Arch Coal in 2002 as Director-Internal Audit. Prior to joining Arch Coal, Mr. Ziegler held various finance and accounting positions with bioMerieux and Ernst & Young. Recoverable reserves designated for mining by a specific operation. Coal Btu A measure of the energy required to raise the temperature of one pound of water one degree of Fahrenheit. Coking coal Coal which, when burned, emits 1.2 pounds or less of sulfur dioxide per million Btus, requiring no blending or other sulfur dioxide reduction technologies in order to comply with the requirements of the Clean Air Act. Continuous miner A machine used in underground mining to cut coal from the seam and load it onto conveyors or into shuttle cars in a continuous operation. Dragline A large machine used in surface mining to remove the overburden, or layers of earth and rock, covering a coal seam. The dragline has a large bucket, suspended by cables from the end of a long boom, which is able to scoop up large amounts of overburden as it is dragged across the excavation area and redeposit the overburden in another area. Hard coal Coal of gross calorific value greater than 5700 kcal/kg on an ashfree but moist basis and further disaggregated into anthracite, coking coal and other bituminous coal. Lignite Coal One of two major underground coal mining methods, generally employing two rotating drums pulled mechanically back and forth across a long face of coal. Coal which, when burned, emits 1.6 pounds or less of sulfur dioxide per million Btus. Metallurgical coal A facility used for crushing, sizing and washing coal to remove impurities and to prepare it for use by a particular customer. Probable reserves Reserves for which quantity and grade and/or quality are computed from information similar to that used for proven reserves, but the sites for inspection, sampling and measurement are farther apart or are otherwise less adequately spaced. Proven reserves Reserves for which (a) quantity is computed from dimensions revealed in outcrops, trenches, workings or drill holes; grade and/or quality are computed from the results of detailed sampling and (b) the sites for inspection, sampling and measurement are spaced so closely and the geologic character is so well defined that size, shape, depth and mineral content of reserves are well established. The restoration of land and environmental values to a mining site after the coal is extracted. The process commonly includes “recontouring” or shaping the land to its approximate original appearance, restoring topsoil and planting native grass and ground covers. Recoverable reserves The amount of proven and probable reserves that can actually be recovered from the reserve base taking into account all mining and preparation losses involved in producing a saleable product using existing methods and under current law. Reserves That part of a mineral deposit which could be economically and legally extracted or produced at the time of the reserve determination. One of two major underground coal mining methods, utilizing continuous miners creating a network of “rooms” within a coal seam, leaving behind “pillars” of coal used to support the roof of a mine. Unassigned reserves Recoverable reserves that have not yet been designated for mining by a specific operation. fresh start accounting effective October 1, 2016. renewable energy sources to generate a certain percentage of power. There have been numerous proposals to establish a similar uniform, national standard although none of these proposals have been enacted to date. Possible advances in technologies and incentives, such as tax credits, to enhance the economics of renewable energy sources could make these sources more competitive with coal. Any reduction in the amount of coal consumed by electric power generators could reduce the price of coal that we mine and sell, thereby reducing our revenues and materially and adversely affecting our business and results of operations. areas and properties, and revenues and expenditures associated with our mining operations, may vary materially from estimates. Any inaccuracy in our estimates related to our reserves could result in decreased profitability from lower than expected revenues and/or higher than expected costs. pressures and uncertainties that may affect their ability to pay, including trade barriers, exchange controls and local economic and political conditions. from us. If any of those customers, particularly any of our three largest customers, was to significantly reduce the quantities of coal it purchases from us, or if we are unable to sell coal to those customers on terms as favorable to us, it may have an adverse impact on the results of our business. flow. operations. the market for our products. be a greenhouse gas, is a by-product of burning coal. Global climate issues, including with respect to greenhouse gases such as carbon dioxide and manner that may restrict our ability to efficiently and economically conduct our mining activities, any of which would materially reduce our production, cash flow and profitability. Liability under these laws is generally strict. Accordingly, we may incur liability without regard to fault or to the legality of the conduct giving rise to the conditions. attributes existing at the end of 2016. 2017: Total As Assigned Sulfur Content (lbs. Received Mining Method Past Reserve Recoverable per million Btus) Btus per Reserve Control Under- Estimates Reserves Proven Probable <1.2 1.2-2.5 >2.5 lb. (1) Leased Owned Surface ground 2013 2014 Wyoming 1,318 1,304 14 1,257 61 — 8,852 1,318 1,318 — 1,526 1,423 Montana — — — — — — — — — — — — — Colorado 53 50 3 53 — — 11,533 53 — — 53 84 65 Central App. 35 34 1 23 12 — 12,479 35 — 25 10 169 139 Northern App. 40 35 5 — 40 — 13,074 2 38 — 40 58 74 Illinois 37 22 15 — — 37 10,728 30 7 — 37 21 33 Total 1,483 1,445 38 1,333 113 37 9,195 1,438 45 1,343 140 1,858 1,734 Total Unassigned Sulfur Content Mining Method Recoverable (lbs. per million Btus) As Received Reserve Control Under- Reserves Proven Probable <1.2 1.2-2.5 >2.5 Btus per lb.(1) Leased Owned Surface ground Wyoming 480 397 83 428 52 — 9,653 370 110 305 175 Montana — — — — — — — — — — — Colorado 33 25 8 33 — — 11,220 33 — — 33 Central App. 59 50 9 20 26 13 12,522 11 48 41 18 Northern App. 144 70 74 — 142 2 12,961 1 143 — 144 Illinois 298 197 101 — — 298 11,137 65 233 4 294 Total 1,014 739 275 481 220 313 10,777 480 534 350 664 (1) $0.4 billion. is subject to publication and public comment. The BLM may consult with other governmental agencies during this process, including state and federal agencies, surface management agencies, Native American tribes or bands, the U.S. Department of Justice or others as needed. The public comment period for an analysis or impact statement typically occurs over a contained in Item 1A. “Risk Factors” for more information. subsidiaries prepare to mine such reserves. If defects in title or boundaries of undeveloped reserves are discovered in the future, control of and the right to mine such reserves could be adversely affected. You should see “A defect in title or the loss of a leasehold interest in certain property or surface rights could limit our ability to mine our coal reserves or result in significant unanticipated costs” contained in Item 1A, “Risk Factors” for more information. other capital priorities. 2015 March 31 June 30 September 30 December 31 Dividends per common share $ — $ — $ — $ — High 16.80 11.10 9.31 4.66 Low 8.20 3.40 1.05 0.84 2014 March 31 June 30 September 30 December 31 Dividends per common share $ 0.10 $ — $ — $ — High 48.20 51.80 36.70 28.60 Low 38.81 32.30 20.80 15.00 S&P Midcap 400 index and a customized peer group of three companies: Cloud Peak Energy Inc., Cnx Resources Corp and Westmoreland Coal Company. The graph assumes that the value of the investment in our common stock, the S&P Midcap 400 index, and in the peer group (including reinvestment of dividends) was $100 on October 5, 2016 and tracks it through December 31, 2017. Year Ended December 31 (In thousands, except per share data) 2015 2014 2013 2012 2011 (1) (3) (4) (5) Statement of Operations Data: Revenues $ 2,573,260 $ 2,937,119 $ 3,014,357 $ 3,768,126 $ 3,883,039 Mine closure and asset impairment costs 2,628,303 24,113 220,879 539,182 7,316 Goodwill impairment — — 265,423 330,680 — Acquisition and transition costs — — — — 47,360 Income (loss) from operations (2,865,063 ) (149,531 ) (663,141 ) (757,012 ) 343,061 Interest expense (397,979 ) (390,946 ) (381,267 ) (317,615 ) (230,186 ) Non-operating expenses (27,910 ) — (42,921 ) (23,668 ) (51,448 ) Income (loss) from continuing operations (2,913,142 ) (558,353 ) (745,228 ) (738,915 ) 89,015 Diluted earnings (loss) from continuing operations per common share $ (136.86 ) $ (26.31 ) $ (35.15 ) $ (34.97 ) $ 4.60 Net income (loss) attributable to Arch Coal (2,913,142 ) (558,353 ) (641,832 ) (683,955 ) 141,683 Basic earnings (loss) per common share $ (136.86 ) $ (26.31 ) $ (30.26 ) $ (32.36 ) $ 7.45 Diluted earnings (loss) per common share $ (136.86 ) $ (26.31 ) $ (30.26 ) $ (32.36 ) $ 7.42 Balance Sheet Data: Total assets $ 5,106,738 $ 8,429,723 $ 8,990,193 $ 10,006,777 $ 10,213,959 Working capital (4,361,009 ) 1,023,357 1,293,849 1,337,035 162,106 Current maturities of debt (2) 5,107,210 36,885 33,493 32,896 280,851 Long-term debt, less current maturities 30,953 5,123,485 5,118,002 5,085,879 3,762,297 Other long-term obligations 755,283 695,881 717,174 825,080 864,667 Noncurrent deferred income tax liability — 422,809 413,546 664,182 976,753 Arch Coal stockholders’ equity (1,244,289 ) 1,668,154 2,253,249 2,854,567 3,578,040 Common Stock Data: Dividends per share $ — $ 0.10 $ 1.20 $ 2.00 $ 4.30 Shares outstanding at year-end 21,446 21,227 21,228 21,225 21,167 Cash Flow Data: Cash provided by operating activities (44,367 ) (33,582 ) 55,742 332,804 642,242 Depreciation, depletion and amortization, including amortization of acquired sales contracts, net 370,534 405,561 438,247 500,319 444,518 Capital expenditures 119,024 147,286 296,984 395,225 540,936 Acquisitions of businesses, net of cash acquired — — — — 2,894,339 Net proceeds from the issuance of long term debt — (4,519 ) 623,511 1,942,685 1,906,306 Net proceeds from the sale of common stock — — — — 1,267,933 Payments to retire debt, including redemption premium — — 628,660 452,934 605,178 Net increase (decrease) in borrowings under lines of credit and commercial paper program — — — (481,300 ) 424,396 Dividend payments — 2,123 25,475 42,440 80,748 Operating Data: Tons sold 127,632 134,360 139,607 140,820 156,897 Tons produced 126,820 132,614 136,613 135,934 151,829 Tons purchased from third parties 1,287 1,182 2,925 4,327 5,557 Company on or prior to October 1, 2016. Bankruptcy Code companies. Year Ended December 31, 2015 2014 2013 Powder River Basin Tons sold (in thousands) 108,481 111,156 111,653 Coal sales per ton sold $ 13.15 $ 12.86 $ 12.44 Cost per ton sold $ 12.36 $ 12.58 $ 12.18 Operating margin per ton sold $ 0.79 $ 0.28 $ 0.26 Adjusted EBITDA (in thousands) $ 258,300 $ 197,920 $ 206,910 Appalachia Tons sold (in thousands) 11,926 14,484 14,224 Coal sales per ton sold $ 62.47 $ 68.77 $ 73.07 Cost per ton sold $ 69.19 $ 77.59 $ 81.27 Operating loss per ton sold $ (6.72 ) $ (8.82 ) $ (8.20 ) Adjusted EBITDA (in thousands) $ 82,837 $ 109,053 $ 88,883 Other Tons sold (in thousands) 7,225 8,720 8,422 Coal sales per ton sold $ 30.99 $ 30.78 $ 32.63 Cost per ton sold $ 27.83 $ 25.44 $ 26.95 Operating margin per ton sold $ 3.16 $ 5.34 $ 5.68 Adjusted EBITDA (in thousands) $ 17,044 $ 58,325 $ 91,642 period from October 2 through December 31, 2016. in the period. Year Ended December 31, 2015 revenues. Year Ended December 31, 2015 2014 Increase (Decrease) (In thousands) Coal sales $ 2,573,260 $ 2,935,181 $ (361,921 ) Tons sold 127,632 134,360 (6,728 ) Year Ended December 31, (Increase) Decrease 2015 2014 in Net Loss (In thousands) Cost of sales (exclusive of items shown separately below) $ 2,206,433 $ 2,566,193 $ 359,760 Depreciation, depletion and amortization 379,345 418,748 39,403 Amortization of acquired sales contracts, net (8,811 ) (13,187 ) (4,376 ) Change in fair value of coal derivatives and coal trading activities, net (1,583 ) (3,686 ) (2,103 ) Asset impairment and mine closure costs 2,628,303 24,113 (2,604,190 ) Losses from disposed operations resulting from Patriot Coal bankruptcy 116,343 — (116,343 ) Selling, general and administrative expenses 98,783 114,223 15,440 Other operating expense (income), net 19,510 (19,754 ) (39,264 ) Total costs, expenses and other $ 5,438,323 $ 3,086,650 $ (2,351,673 ) Powder River Basin. year ended December 31, 2015 total selling, general and administrative expenses consist primarily of compensation costs of $56.5 million, and professional services and usage and maintenance agreements of $25.8 million. miscellaneous revenues including royalties and net gains on asset sales of $22.2 million and net income from equity investments of $7.9 million. (Increase) Decrease Year Ended December 31, in Net Loss 2015 2014 $ (In thousands) Net loss resulting from early retirement of debt and debt restructuring $ (27,910 ) $ — $ (27,910 ) Consolidated Financial Statements, “ Year Ended December 31, Decrease 2015 2014 in Net Loss (In thousands) Provision for (benefit from) income taxes $ (373,380 ) $ 25,634 $ 399,014 2015. Year Ended December 31, 2014 2013 Increase (Decrease) (In thousands) Coal sales $ 2,935,181 $ 3,000,476 $ (65,295 ) Tons sold 134,360 134,300 60 Year Ended December 31, (Increase) Decrease 2014 2013 in Net Loss (In thousands) Cost of sales (exclusive of items shown separately below) $ 2,566,193 $ 2,663,136 $ 96,943 Depreciation, depletion and amortization 418,748 426,442 7,694 Amortization of acquired sales contracts, net (13,187 ) (9,457 ) 3,730 Change in fair value of coal derivatives and coal trading activities, net (3,686 ) 7,845 11,531 Asset impairment and mine closure costs 24,113 220,879 196,766 Goodwill impairment — 265,423 265,423 Selling, general and administrative expenses 114,223 133,448 19,225 Other operating income, net (19,754 ) (30,218 ) (10,464 ) Total costs, expenses and other $ 3,086,650 $ 3,677,498 $ 590,848 Decrease Year Ended December 31, in Net Loss 2014 2013 $ (In thousands) Net loss resulting from early retirement of debt and debt restructuring $ — $ (42,921 ) $ 42,921 Year Ended December 31, Increase 2014 2013 in Net Loss (In thousands) Provision for (benefit from) income taxes $ 25,634 $ (335,498 ) $ (361,132 ) Year Ended December 31, Increase 2014 2013 in Net Loss (In thousands) Income from discontinued operations, net of tax $ — $ 103,396 $ 103,396 logistics contracts. Year Ended December 31, 2015 2014 2013 Reported segment coal sales revenues $ 2,395,258 $ 2,693,898 $ 2,702,865 Coal risk management derivative settlements classified in “other income” (3,231 ) (5,958 ) (32,535 ) Transportation costs 181,233 247,241 330,146 Coal sales 2,573,260 2,935,181 3,000,476 Other revenues — 1,938 13,881 Revenues in the consolidated statements of operations $ 2,573,260 $ 2,937,119 $ 3,014,357 Year Ended December 31, 2015 2014 2013 Reported segment cost of coal sales $ 2,368,100 $ 2,743,182 $ 2,743,766 Diesel fuel risk management derivative settlements classified in “other income” (8,162 ) (6,789 ) (14,939 ) Transportation costs 181,233 247,241 330,146 Depreciation, depletion and amortization in reported segment cost of tons sold presented on separate line on statement of operations (373,299 ) (414,379 ) (418,736 ) Other (other operating segments, operating overhead, etc.) 38,561 (3,062 ) 22,899 Cost of sales in the consolidated statements of operations $ 2,206,433 $ 2,566,193 $ 2,663,136 Year Ended December 31, 2015 2014 2013 Reported Adjusted EBITDA from coal operations $ 358,181 $ 365,299 $ 387,435 EBITDA from discontinued operations — — 173,776 Corporate and other (108,064 ) (85,156 ) (135,289 ) Adjusted EBITDA 250,117 280,143 425,922 Income tax benefit (provision) 373,380 (25,634 ) 335,498 Interest expense, net (393,549 ) (383,188 ) (374,664 ) Depreciation, depletion and amortization (379,345 ) (418,748 ) (426,442 ) Amortization of acquired sales contracts, net 8,811 13,187 9,457 Asset impairment and mine closure costs (2,628,303 ) (24,113 ) (220,879 ) Losses from disposed operations resulting from Patriot Coal bankruptcy (116,343 ) — — Goodwill impairment — — (265,423 ) Other nonoperating expenses (27,910 ) — (42,921 ) Settlement of UMWA legal claims — — (12,000 ) Interest, depreciation, depletion and amortization classified as discontinued operations — — (70,380 ) Net loss $ (2,913,142 ) $ (558,353 ) $ (641,832 ) business; and other strategic opportunities. funds withdrawable from brokerage accounts. Year Ended December 31, 2015 2014 2013 (In thousands) Cash provided by (used in): Operating activities $ (44,367 ) $ (33,582 ) $ 55,742 Investing activities (180,341 ) (111,434 ) 125,445 Financing activities (58,742 ) (31,852 ) (54,710 ) Payments Due by Period 2016 2017-2018 2019-2020 after 2020 Total (Dollars in thousands) Long-term debt, including related interest $ 375,176 $ 2,508,000 $ 2,491,350 $ 1,033,547 $ 6,408,073 Operating leases 20,857 23,689 5,599 9,807 59,952 Coal lease rights 68,947 27,088 24,291 103,771 224,097 Coal purchase obligations — — — — — Unconditional purchase obligations 94,552 35,954 22,917 11,076 164,499 Total contractual obligations $ 559,532 $ 2,594,731 $ 2,544,157 $ 1,158,201 $ 6,856,621 Workers’ Reclamation Lease Compensation Obligations Obligations Obligations Other Total (Dollars in thousands) Self bonding $ 485,546 $ — $ — $ — $ 485,546 Surety bonds 155,291 49,372 19,534 6,659 230,856 Letters of credit 11,166 — 117,568 6,790 135,524 2017: retirement obligations are initially recorded at fair value, or the amount at which the obligations could be settled in a current transaction between willing parties. This involves determining the present value of estimated future cash flows on a mine-by-mine basis based upon current permit requirements and various estimates and assumptions, including estimates of disturbed acreage, reclamation costs and assumptions regarding equipment productivity. We estimate disturbed acreage based on approved mining plans and related engineering data. Since we plan to use internal resources to perform the majority of our reclamation activities, our estimate of reclamation costs involves estimating third-party profit margins, which we base on our historical experience with contractors that perform certain types of reclamation activities. We base productivity assumptions on historical experience with the equipment that we expect to utilize in the reclamation activities. In order to determine fair value, we discount our estimates of cash flows to their present value. We base our discount rate on the rates of treasury bonds with maturities similar to expected mine lives, adjusted for our credit standing. the plan participants. for themselves and their dependents. The salaried employee postretirement benefit plans are contributory, with retiree contributions adjusted periodically, and contain other cost-sharing features such as deductibles and coinsurance. 2016 2017 Tons $ per ton Tons $ per ton (in millions) (in millions) Powder River Basin Committed, Priced 69.8 $ 13.34 37.8 $ 13.84 Committed, Unpriced 4.8 9.0 Appalachia Committed, Priced Thermal 3.7 $ 54.36 2.1 $ 45.35 Committed, Unpriced Thermal — — Committed, Priced Metallurgical 1.9 $ 71.57 1.4 $ 77.03 Committed, Unpriced Metallurgical 0.7 0.7 Other Bituminous Committed, Priced 4.0 $ 32.15 3.3 $ 33.33 Committed, Unpriced — — 2018. Consolidated Financial Statements for additional information on the interest rate swaps. Fee Service 2015 2014 Audit(1) $ 2,327,680 $ 1,989,282 Audit-Related(2) 48,636 0 Tax(3) 6,500 14,500 All Other — 0 Restated Certificate of Incorporation of Arch Coal, Inc. 10.19 (incorporated Coal Lease Agreement dated as of March 31, 1992, among Allegheny Land Company, as lessee, and UAC and Phoenix Coal Corporation, as lessors, and related guarantee (incorporated herein by reference to the Current Report on Form 8-K filed by Ashland Coal, Inc. on April 6, 1992). Federal Coal Lease dated as of January 24, 1996 between the U.S. Department of the Interior and the Thunder Basin Coal Company (incorporated herein by reference to Exhibit 10.20 to Federal Coal Lease Readjustment dated as of November 1, 1967 between the U.S. Department of the Interior and the Thunder Basin Coal Company (incorporated herein by reference to Exhibit 10.21 to Federal Coal Lease effective as of May 1, 1995 between the U.S. Department of the Interior and Mountain Coal Company (incorporated herein by reference to Exhibit 10.22 to Federal Coal Lease dated as of January 1, 1999 between the Department of the Interior and Ark Land Company (incorporated herein by reference to Exhibit 10.23 to 10.26* 10.27* 10.30* Form of Performance Unit Contract (incorporated herein by reference to Exhibit 10.2 to 23.1 23.2 24.1 31.1 31.2 32.1 32.2 101 Interactive Data File (Form 10-K for the year ended December 31, a capital structure having carrying amounts not comparable with prior periods (Predecessor) as described in Notes 1 and 3. COSO criteria. The We are a public accounting firm registered with the PCAOB and are required to be independent with respect to the Company in accordance with the U.S. federal securities laws and the applicable rules and regulations of the Securities and Exchange Commission and the PCAOB. Year Ended December 31, 2015 2014 2013 Revenues $ 2,573,260 $ 2,937,119 $ 3,014,357 Costs, expenses and other operating Cost of sales (exclusive of items shown separately below) 2,206,433 2,566,193 2,663,136 Depreciation, depletion and amortization 379,345 418,748 426,442 Amortization of acquired sales contracts, net (8,811 ) (13,187 ) (9,457 ) Change in fair value of coal derivatives and coal trading activities, net (1,583 ) (3,686 ) 7,845 Asset impairment and mine closure costs 2,628,303 24,113 220,879 Goodwill impairment — — 265,423 Losses from disposed operations resulting from Patriot Coal bankruptcy 116,343 — — Selling, general and administrative expenses 98,783 114,223 133,448 Other operating expense (income), net 19,510 (19,754 ) (30,218 ) 5,438,323 3,086,650 3,677,498 Loss from operations (2,865,063 ) (149,531 ) (663,141 ) Interest expense, net Interest expense (397,979 ) (390,946 ) (381,267 ) Interest and investment income 4,430 7,758 6,603 (393,549 ) (383,188 ) (374,664 ) Nonoperating expense Net loss resulting from early retirement of debt and debt restructuring (27,910 ) — (42,921 ) Loss from continuing operations before income taxes (3,286,522 ) (532,719 ) (1,080,726 ) Provision for (benefit from) income taxes (373,380 ) 25,634 (335,498 ) Loss from continuing operations (2,913,142 ) (558,353 ) (745,228 ) Income from discontinued operations, including gain on sale - net of tax — — 103,396 Net loss (2,913,142 ) (558,353 ) (641,832 ) Losses per common share Basic and diluted LPS- Loss from continuing operations $ (136.86 ) $ (26.31 ) $ (35.15 ) Basic and diluted LPS - Net loss $ (136.86 ) $ (26.31 ) $ (30.26 ) Basic and diluted weighted average shares outstanding 21,285 21,222 21,210 Dividends declared per common share $ — $ 0.10 $ 1.20 Year Ended December 31, 2015 2014 2013 Net loss $ (2,913,142 ) $ (558,353 ) $ (641,832 ) Derivative instruments Comprehensive income (loss) before tax (3,477 ) 3,102 (2,626 ) Income tax benefit (provision) 1,252 (1,117 ) 947 (2,225 ) 1,985 (1,679 ) Pension, postretirement and other post-employment benefits Comprehensive income (loss) before tax (5,592 ) (44,143 ) 77,201 Income tax benefit (provision) 2,011 15,891 (27,803 ) (3,581 ) (28,252 ) 49,398 Available-for-sale securities Comprehensive income (loss) before tax 1,185 (12,788 ) 10,190 Income tax benefit (provision) (435 ) 4,604 (3,710 ) 750 (8,184 ) 6,480 Total other comprehensive income (loss) (5,056 ) (34,451 ) 54,199 Total comprehensive loss $ (2,918,198 ) $ (592,804 ) $ (587,633 ) December 31, 2015 2014 Assets Current assets Cash and cash equivalents $ 450,781 $ 734,231 Short term investments 200,192 248,954 Restricted cash 97,542 5,678 Trade accounts receivable (net of allowance for doubtful accounts of $7.8 million and $0.2 million, respectively) 117,405 211,506 Other receivables 18,362 20,511 Inventories 196,720 190,253 Prepaid royalties 10,022 11,118 Deferred income taxes — 52,728 Coal derivative assets 8,035 13,257 Other current assets 104,723 54,515 Total current assets 1,203,782 1,542,751 Property, plant and equipment Coal lands and mineral rights 3,713,639 6,040,656 Plant and equipment 2,359,674 2,935,381 Deferred mine development 553,286 891,649 6,626,599 9,867,686 Less accumulated depreciation, depletion and amortization (3,007,570 ) (3,414,228 ) Property, plant and equipment, net 3,619,029 6,453,458 Other assets Prepaid royalties 23,671 66,806 Equity investments 201,877 235,842 Other noncurrent assets 58,379 130,866 Total other assets 283,927 433,514 Total assets $ 5,106,738 $ 8,429,723 Liabilities and Stockholders’ Equity (Deficit) Current liabilities Accounts payable $ 128,131 $ 180,113 Accrued expenses and other current liabilities 329,450 302,396 Current maturities of debt 5,107,210 36,885 Total current liabilities 5,564,791 519,394 Long-term debt 30,953 5,123,485 Asset retirement obligations 396,659 398,896 Accrued pension benefits 27,373 16,260 Accrued postretirement benefits other than pension 99,810 32,668 Accrued workers’ compensation 112,270 94,291 Deferred income taxes — 422,809 Other noncurrent liabilities 119,171 153,766 Total liabilities 6,351,027 6,761,569 Stockholders’ equity (deficit) Common stock, $0.01 par value, authorized 26,000 shares, issued 21,446 and 21,379 shares at December 31, 2015 and 2014, respectively 2,145 2,141 Paid-in capital 3,054,211 3,048,460 Treasury stock, at cost (53,863 ) (53,863 ) Accumulated deficit (4,244,967 ) (1,331,825 ) Accumulated other comprehensive income (1,815 ) 3,241 Total stockholders’ equity (deficit) (1,244,289 ) 1,668,154 Total liabilities and stockholders’ equity (deficit) $ 5,106,738 $ 8,429,723 Year Ended December 31, 2015 2014 2013 Operating activities Net loss $ (2,913,142 ) $ (558,353 ) $ (641,832 ) Adjustments to reconcile net loss to cash provided by operating activities: Depreciation, depletion and amortization 379,345 418,748 447,704 Amortization of acquired sales contracts, net (8,811 ) (13,187 ) (9,457 ) Prepaid royalties expensed 8,109 9,698 13,706 Deferred income taxes (367,210 ) 25,152 (263,099 ) Employee stock-based compensation expense 5,760 9,847 11,790 Gains on disposals and divestitures (2,270 ) (27,512 ) (120,321 ) Asset impairment and noncash mine closure costs 2,613,345 16,868 220,879 Goodwill impairment — — 265,423 Losses from disposed operations resulting from Patriot Coal bankruptcy 116,343 — — Amortization relating to financing activities 25,241 17,363 24,789 Net loss resulting from early retirement of debt and debt restructuring 27,910 — 42,921 Changes in: Receivables 98,212 (8,991 ) 62,881 Inventories (6,534 ) 41,548 44,635 Coal derivative assets and liabilities 973 5,449 3,606 Accounts payable, accrued expenses and other current liabilities (15,532 ) 41,680 (78,126 ) Asset retirement obligations 16,640 18,288 17,432 Pension, postretirement and other postemployment benefits 4,800 (25,347 ) 7,284 Other (27,546 ) (4,833 ) 5,527 Cash provided by (used in) operating activities (44,367 ) (33,582 ) 55,742 Investing activities Capital expenditures (119,024 ) (147,286 ) (296,984 ) Minimum royalty payments (5,871 ) (7,317 ) (14,947 ) Proceeds from sale-leaseback transactions — — 34,919 Proceeds from disposals and divestitures 2,191 62,358 433,453 Purchases of short term investments (246,735 ) (211,929 ) (213,726 ) Proceeds from sales of short term investments 290,205 205,611 194,537 Proceeds from sale of investments in equity investments and securities 2,259 9,464 — Investments in and advances to affiliates, net (11,502 ) (16,657 ) (15,260 ) Withdrawals (deposits) of restricted cash (91,864 ) (5,678 ) 3,453 Cash provided by (used in) investing activities (180,341 ) (111,434 ) 125,445 Financing activities Proceeds from term loan — — 294,000 Proceeds from issuance of senior notes — — 350,000 Payments to retire debt — (300 ) (628,660 ) Payments on term loan (19,500 ) (19,500 ) (17,250 ) Net payments on other debt (11,332 ) (5,395 ) (6,836 ) Debt financing costs — (4,519 ) (20,489 ) Dividends paid — (2,123 ) (25,475 ) Expenses related to debt restructuring (27,910 ) — — Other — (15 ) — Cash used in financing activities (58,742 ) (31,852 ) (54,710 ) Increase (decrease) in cash and cash equivalents (283,450 ) (176,868 ) 126,477 Cash and cash equivalents, beginning of period 734,231 911,099 784,622 Cash and cash equivalents, end of period $ 450,781 $ 734,231 $ 911,099 SUPPLEMENTAL CASH FLOW INFORMATION Cash paid during the year for interest $ 283,337 $ 361,727 $ 380,389 Cash refunded during the year for income taxes, net $ 4,138 $ 4,896 $ 18,741 Accumulated Treasury Other Common Paid-In Stock, at Accumulated Comprehensive Stock Capital Cost Deficit Income (Loss) Total (In thousands, except per share data) BALANCE AT JANUARY 1, 2013 $ 2,141 $ 3,026,823 $ (53,848 ) $ (104,042 ) $ (16,507 ) $ 2,854,567 Total comprehensive (loss) — — — (641,832 ) 54,199 (587,633 ) Dividends on common shares ($1.20 per share) — — — (25,475 ) — (25,475 ) Issuance of 39 shares of common stock under the stock incentive plan — restricted stock and restricted stock units, net of forfeitures 0 0 — — — — Employee stock-based compensation expense — 11,790 — — — 11,790 BALANCE AT DECEMBER 31, 2013 2,141 3,038,613 (53,848 ) (771,349 ) 37,692 2,253,249 Total comprehensive income (loss) — — — (558,353 ) (34,451 ) (592,804 ) Dividends on common shares ($0.10 per share) — — — (2,123 ) — (2,123 ) Treasury shares purchased 0 0 (15 ) — — (15 ) Employee stock-based compensation expense — 9,847 — — — 9,847 BALANCE AT DECEMBER 31, 2014 2,141 3,048,460 (53,863 ) (1,331,825 ) 3,241 1,668,154 Total comprehensive income (loss) — — — (2,913,142 ) (5,056 ) (2,918,198 ) Issuance of 64 shares of common stock under the stock incentive plan-restricted stock and restricted stock units, net of forfeitures 4 (9 ) (5 ) Employee stock-based compensation expense — 5,760 — — — 5,760 BALANCE AT DECEMBER 31, 2015 $ 2,145 $ 3,054,211 $ (53,863 ) $ (4,244,967 ) $ (1,815 ) $ (1,244,289 ) ” Deferred Mine Development Coal sales revenue related to incidental production during the development phase will be recorded as coal sales revenue with an offset to cost of coal sales based on the estimated cost per ton sold for the mine when the asset is in place for its intended use. payments. amortization of deferred financing fees related to outstanding debt, see Note 14 to the Consolidated Financial Statements, “Debt and Financing Arrangements.” recorded in other comprehensive income or loss. Amounts in other comprehensive income or loss are reclassified to earnings when the hedged transaction affects earnings and are classified in a manner consistent with the transaction being hedged. The Company formally documents the relationships between hedging instruments and the respective hedged items, as well as its risk management objectives for hedge transactions. periods disclosed within. Not Yet Effective statements. first quarter of 2018. the valuation, the fair value would be considered Level 3 in the fair value hierarchy. Year Ended 2013 Total Revenues $ 219,002 Income from discontinued operations before income taxes $ 32,167 Gain on sale 120,321 Less: income tax expense 49,092 Income from discontinued operations, including gain on sale - net of tax $ 103,396 Basic earnings per common share from discontinued operations $ 4.87 Diluted earnings per common share from discontinued operations $ 4.87 October 1, 2016; contractual interest during this time was Pension, Postretirement Accumulated and Other Post- Other Derivative Employment Available-for- Comprehensive Instruments Benefits Sale Securities Income (Loss) (In thousands) Balance at January 1, 2014 $ 565 $ 31,112 $ 6,015 $ 37,692 Unrealized gains 3,677 (22,516 ) (5,727 ) (24,566 ) Amounts reclassified from accumulated other comprehensive income (loss) (1,692 ) (5,736 ) (2,457 ) (9,885 ) Balance at December 31, 2014 2,550 2,860 (2,169 ) 3,241 Unrealized gains (losses) 3,903 (8,723 ) (3,333 ) (8,153 ) Amounts reclassified from accumulated other comprehensive income (loss) (6,128 ) 5,142 4,083 3,097 Balance at December 31, 2015 $ 325 $ (721 ) $ (1,419 ) $ (1,815 ) Details about accumulated Reclassifications Line Item in the 2015 2014 (in thousands) Derivative instruments $ 9,575 $ 2,643 Revenues (3,447 ) (951 ) Provision for (benefit from) income taxes $ 6,128 $ 1,692 Net of tax Pension, postretirement and other post-employment benefits Amortization of prior service credits $ 8,335 (1) $ 11,760 Amortization of net actuarial gains (losses) (16,369 )(1) (2,797 ) (8,034 ) 8,963 Total before tax 2,892 (3,227 ) Provision for (benefit from) income taxes $ (5,142 ) $ 5,736 Net of tax Available-for-sale securities $ (6,391 )(2) $ 3,838 Interest and investment income 2,308 (1,381 ) Provision for (benefit from) income taxes $ (4,083 ) $ 2,457 Net of tax Year Ended December 31, Description 2015 2014 2013 (In thousands) Coal lands and mineral rights $ 2,210,488 $ — $ 79,094 Plant and equipment 199,107 1,512 36,296 Deferred development 159,474 — 13,451 Prepaid royalties 41,990 15,356 1,104 Equity investments 21,325 — 28,947 Notes receivable — — 49,203 Inventories 66 — 12,765 Other (4,147 ) 7,245 19 Total $ 2,628,303 $ 24,113 $ 220,879 Operations: $74.1 million recorded in the first quarter related to the impairment of coal reserves and surface land in Kentucky that are being leased to a mining company that idled its mining operations; $3.4 million recorded in the first quarter related to the impairment on the portion of an advance royalty balance on a reserve base mined at the Company’s Mountain Laurel operation that will not be recouped; $2.9 million recorded in the first quarter related to an other-than-temporary-impairment charge on an available-for-sale security; a $38.0 million impairment recorded in the second quarter related to the Company’s equity investment in a brownfield bulk commodity terminal on the Columbia River in Longview, Washington as the Company relinquished its ownership rights in exchange for future throughput rights; $7.2 million of severance expense related to headcount reductions during the first half of the year; a $3.6 million curtailment charge related to the Company’s pension, postretirement health and black lung actuarial liabilities due to headcount reductions in the first half of the year. (In thousands) Balance at January 1, 2013 $ 265,423 Impairment (265,423 ) Balance at December 31, 2013 $ — 7. Losses from disposed operations resulting from Patriot Coal bankruptcy Court for the Eastern District of Virginia. Subsequently, on October 28, 2015, Patriot’s Plan of Reorganization was approved, including an authorization to reject their collective bargaining agreements and modify certain union-related retiree benefits. As a result of the Plan of Reorganization, the Company became statutorily responsible for retiree medical benefits pursuant to Section 9711 of the Coal Industry Retiree Health Benefit Act of 1992 for certain retirees of Magnum who retired prior to October 1, 1994. In addition, the Company 8. Inventories December 31, 2015 2014 (In thousands) Coal $ 85,043 $ 71,901 Repair parts and supplies 111,677 118,352 $ 196,720 $ 190,253 2016. December 31, 2015 Balance Sheet Gross Gross Classification Unrealized Unrealized Fair Short-Term Other Cost Basis Gains Losses Value Investments Assets (In thousands) Available-for-sale: U.S. government and agency securities $ 10,007 $ — $ (12 ) $ 9,995 $ 9,995 Corporate notes and bonds 190,496 — (299 ) 190,197 190,197 — Equity securities 3,938 668 (2,888 ) 1,718 — 1,718 Total Investments $ 204,441 $ 668 $ (3,199 ) $ 201,910 $ 200,192 $ 1,718 December 31, 2014 Balance Sheet Gross Gross Classification Unrealized Unrealized Fair Short-Term Other Cost Basis Gains Losses Value Investments Assets (In thousands) Available-for-sale: Corporate notes and bonds $ 253,590 $ — $ (4,636 ) $ 248,954 $ 248,954 $ — Equity securities 3,910 4,125 (2,890 ) 5,145 — 5,145 Total Investments $ 257,500 $ 4,125 $ (7,526 ) $ 254,099 $ 248,954 $ 5,145 The debt securities outstanding at December 31, Investee Knight DTA Millennium Tongue DKRW Tenaska Other Total Balance at January 1, 2013 $ 149,063 $ 15,462 $ 32,214 $ 14,697 $ 15,515 $ 15,264 $ — $ 242,215 Advances to (distributions from) affiliates, net (13,536 ) 3,644 6,476 4,004 — — 200 788 Equity in comprehensive income (loss) 17,279 (4,969 ) (2,796 ) (282 ) (1,832 ) — — 7,400 Impairment of equity investment — — — — (13,683 ) (15,264 ) — (28,947 ) Balance at December 31, 2013 152,806 14,137 35,894 18,419 — — 200 221,456 Advances to (distributions from) affiliates, net (12,603 ) 3,774 6,742 2,541 — — 3,600 4,054 Equity in comprehensive income (loss) 18,274 (4,173 ) (2,413 ) (220 ) — — (1,136 ) 10,332 Balance at December 31, 2014 158,477 13,738 40,223 20,740 — — 2,664 235,842 Advances to (distributions from) affiliates, net (29,862 ) 3,207 7,052 913 — — 330 (18,360 ) Equity in comprehensive income (loss) 22,977 (3,706 ) (9,686 ) (328 ) — — (1,278 ) 7,979 Impairment of equity investment — — — (21,325 ) — — — (21,325 ) Sale of equity investment — — — — — — (2,259 ) $ (2,259 ) Balance at December 31, 2015 $ 151,592 $ 13,239 $ 37,589 $ — $ — $ — $ (543 ) $ 201,877 Company recorded an impairment charge of $21.3 million representing the entire value of the Company’s investment in the project; the impairment charge is included on the line “Asset impairment and mine closure costs.” December 31, 2015 December 31, 2014 Assets Liabilities Net Total Assets Liabilities Net Total (In thousands) (In thousands) Acquired fair value $ 131,299 $ 166,697 $ 131,299 $ 166,697 Accumulated amortization (130,839 ) (151,354 ) (130,363 ) (134,988 ) Total $ 460 $ 15,343 $ (14,883 ) $ 936 $ 31,709 $ (30,773 ) Balance Sheet classification: Other current $ 460 $ 3,852 $ 462 $ 12,453 Other noncurrent $ — $ 11,491 $ 474 $ 19,256 $1.84. or purchases of coal or to the risk of changes in the fair value of a fixed price physical sales contract. Certain derivative contracts may be designated as hedges of these risks. (Tons in thousands) 2016 2017 Total Coal sales 480 — 480 Coal purchases 255 — 255 2018. December 31, 2015 December 31, 2014 Fair Value of Derivatives Asset Liability Asset Liability (In thousands) Derivative Derivative Derivative Derivative Derivatives Designated as Hedging Instruments Coal $ 4 $ (20 ) $ 6,535 $ (2,492 ) Derivatives Not Designated as Hedging Instruments Heating oil — diesel purchases 1,017 — 300 — Coal held for trading purposes, exchange traded swaps and futures 110,653 (104,814 ) 96,898 (93,272 ) Coal — risk management 3,912 (1,947 ) 8,510 (3,688 ) Natural gas 494 (247 ) — — Total 116,076 (107,008 ) 105,708 (96,960 ) Total derivatives 116,080 (107,028 ) 112,243 (99,452 ) Effect of counterparty netting (107,028 ) 107,028 (98,686 ) 98,686 Net derivatives as classified in the balance sheets $ 9,052 $ — $ 9,052 $ 13,557 $ (766 ) $ 12,791 December 31, 2015 2014 Net derivatives as reflected on the balance sheets Heating oil Other current assets $ 1,017 $ 300 Coal Coal derivative assets 8,035 13,257 Accrued expenses and other current liabilities — (766 ) $ 9,052 $ 12,791 The Company had a current asset for the right to reclaim cash collateral of Gain (Loss) Recognized in Other Gains (Losses) Reclassified from Other 2015 2014 2013 2015 2014 2013 Coal sales(1) $ 12,816 $ 10,842 (338 ) $ 18,635 $ 5,336 $ 3,664 Coal purchases(2) (6,718 ) (5,097 ) 526 (9,060 ) (2,693 ) (683 ) $ 6,098 $ 5,745 $ 188 $ 9,575 $ 2,643 $ 2,981 noted periods, respective periods. Gain (Loss) Recognized 2015 2014 2013 Coal — unrealized(3) $ (3,883 ) $ 430 $ (12,700 ) Coal — realized(4) $ 3,236 $ 5,956 $ 32,534 Heating oil — diesel purchases(4) $ (8,294 ) $ (7,848 ) $ (9,791 ) Heating oil — fuel surcharges(4) $ — $ (405 ) $ (947 ) Natural gas $ 878 $ — $ — Foreign currency $ (887 ) $ — $ — 13. Accrued Expenses and Other Current Liabilities December 31, 2015 2014 (In thousands) Payroll and employee benefits $ 58,423 $ 73,362 Taxes other than income taxes 104,755 114,598 Interest 119,785 30,384 Acquired sales contracts 3,852 12,453 Workers’ compensation 16,875 16,714 Asset retirement obligations 13,795 19,222 Other 11,965 35,663 $ 329,450 $ 302,396 December 31, 2015 2014 (In thousands) Term loan due 2018 ($1.9 billion and $1.93 billion face value, respectively) $ 1,875,429 $ 1,890,846 7.00% senior notes due 2019 at par 1,000,000 1,000,000 8.00% senior secured notes due 2019 at par 350,000 350,000 9.875% senior notes ($375.0 million face value) due 2019 365,600 363,493 7.25% senior notes due 2020 at par 500,000 500,000 7.25% senior notes due 2021 at par 1,000,000 1,000,000 Other 47,134 56,031 5,138,163 5,160,370 Less current maturities of debt 5,107,210 36,885 Long-term debt $ 30,953 $ 5,123,485 Debt Maturities Year 2016 $ 35,674 2017 30,484 2018 1,858,567 2019 1,731,317 2020 501,642 Thereafter 1,000,574 $ 5,158,258 Additionally, the Company incurred $24.2 million of legal fees and financial advisory fees associated with debt restructuring activities during 2015. During the year ended December 31, 2015 the Company wrote off $3.7 million of deferred financing costs related to the termination of the revolver facility. Year Ended December 31 2015 2014 2013 (In thousands) Current: Federal $ — $ — $ — State 3 25 (647 ) Total current 3 25 (647 ) Deferred: Federal (329,393 ) 18,535 (318,956 ) State (43,990 ) 7,074 (15,895 ) Total deferred (373,383 ) 25,609 (334,851 ) $ (373,380 ) $ 25,634 $ (335,498 ) Year Ended December 31 2015 2014 2013 (In thousands) Income tax provision (benefit) at statutory rate $ (1,150,283 ) $ (186,452 ) $ (378,463 ) Percentage depletion allowance (19,035 ) (12,692 ) (15,796 ) Goodwill — — 70,301 State taxes, net of effect of federal taxes (76,445 ) (3,903 ) (25,265 ) Change in valuation allowance 865,146 226,929 8,659 Other, net 7,237 1,752 5,066 $ (373,380 ) $ 25,634 $ (335,498 ) December 31, 2015 2014 (In thousands) Deferred tax assets: Net operating loss carryforwards $ 1,086,332 $ 871,848 Alternative minimum tax credit carryforwards 120,994 127,169 Reclamation and mine closure 121,276 114,430 Goodwill 38,671 50,072 Workers’ compensation 42,835 38,924 Share based compensation 22,612 30,283 Acquired sales contracts 17,466 26,833 Retiree benefit plans 16,996 22,913 Contract obligations — 15,693 Advance royalties 18,751 — Losses from disposed operations resulting from Patriot Coal bankruptcy 39,287 — Other, primarily accrued liabilities 45,303 64,503 Gross deferred tax assets 1,570,523 1,362,668 Valuation allowance (1,135,399 ) (270,251 ) Total deferred tax assets 435,124 1,092,417 Deferred tax liabilities: Plant and equipment 389,169 1,354,396 Deferred development 41,047 95,129 Investment in tax partnerships — 7,377 Other 4,706 5,533 Total deferred tax liabilities 434,922 1,462,435 Net deferred (asset) liability (202 ) 370,018 The future annual usage of NOLs and AMT credit will be limited under IRC section 382. (In thousands) Balance at January 1, 2013 $ 31,150 Additions based on tax positions related to the current year 1,199 Additions for tax positions of prior years 688 Reductions as a result of lapses in the statute of limitations (1,248 ) Balance at December 31, 2013 31,789 Additions based on tax positions related to the current year 2,920 Balance at December 31, 2014 34,709 Additions for tax positions of the current year 4,168 Balance at December 31, 2015 $ 38,877 ponds and water treatment. Year Ended December 31, 2015 2014 (In thousands) Balance at January 1 (including current portion) $ 418,118 $ 427,653 Accretion expense 33,680 32,909 Obligations of divested operations (334 ) (30,684 ) Adjustments to the liability from changes in estimates (28,570 ) 627 Liabilities settled (12,440 ) (12,387 ) Balance at December 31 $ 410,454 $ 418,118 Current portion included in accrued expenses (13,795 ) (19,222 ) Noncurrent liability $ 396,659 $ 398,896 2016. Fair Value at December 31, 2015 Total Level 1 Level 2 Level 3 (In thousands) Assets: Investments in marketable securities $ 201,910 $ 11,713 $ 190,197 $ — Derivatives 9,052 5,597 1,023 2,432 Total assets $ 210,962 $ 17,310 $ 191,220 $ 2,432 Liabilities: Derivatives $ — $ — $ — $ — Fair Value at December 31, 2014 Total Level 1 Level 2 Level 3 (In thousands) Assets: Investments in marketable securities $ 254,099 $ 5,145 $ 248,954 $ — Derivatives 13,557 9,026 1,491 3,040 Total assets $ 267,656 $ 14,171 $ 250,445 $ 3,040 Liabilities: Derivatives $ 766 $ — $ 766 $ — Year Ended December 31, 2015 2014 (In thousands) Balance, beginning of period $ 3,040 $ 4,946 Realized and unrealized losses recognized in earnings, net (8,602 ) (6,572 ) Included in other comprehensive income (1,341 ) — Purchases 13,541 5,288 Issuances (4,046 ) (622 ) Settlements (160 ) — Ending balance $ 2,432 $ 3,040 Net unrealized 2017. shares remains fixed. Weighted Average Aggregate Average Common Exercise Intrinsic Remaining Shares Price Value Life (In thousands) (years) Options outstanding at January 1 682 $ 198.41 Canceled (17 ) $ 151.72 Expired (10 ) $ 300.62 Options outstanding at December 31 655 $ 198.15 $ — 4.6 Options exercisable at December 31 488 $ 213.00 — 4.4 Unvested options at December 31 167 Year Ended 2013 Weighted average grant-date fair value per share of options granted $ 23.70 Assumptions (weighted average): Risk-free interest rate 0.65 % Expected dividend yield 2.30 % Expected volatility 66.7 % Expected life (in years) 4.5 Restricted Stock Restricted Stock Units Weighted Weighted Common Grant-Date Common Grant-Date Shares Fair Value Shares Fair Value (In thousands) (In thousands) Outstanding at January 1 2 $ 134.42 307 $ 60.53 Granted — — 169 12.84 Vested (2 ) 134.42 (66 ) 104.90 Canceled — — (21 ) 35.81 Outstanding at December 31 — — 389 33.69 2016. As of December 31, 2017, there was $32.4 million of unrecognized share-based compensation expense which is expected to be recognized over a weighted-average period of approximately three years. The table below reconciles changes in the occupational disease liability for the respective period. Year Ended December 31, 2015 2014 2013 (In thousands) Total occupational disease $ 15,199 $ 4,432 $ 6,137 Traumatic injury claims and assessments 16,781 19,924 21,089 Total workers’ compensation expense $ 31,980 $ 24,356 $ 27,226 assumptions used to determine the projected occupational disease obligation: December 31, 2015 2014 (In thousands) Occupational disease costs $ 90,836 $ 72,749 Traumatic and other workers’ compensation claims 38,309 38,256 Total obligations 129,145 111,005 Less amount included in accrued expenses 16,875 16,714 Noncurrent obligations $ 112,270 $ 94,291 balance and excess plans were amended to freeze new service credits for any new or active employee. Other Postretirement Pension Benefits Benefits 2015 2014 2015 2014 (In thousands) CHANGE IN BENEFIT OBLIGATIONS Benefit obligations at January 1 $ 353,736 $ 355,468 $ 36,098 $ 42,531 Service cost 9 21,478 866 1,649 Interest cost 14,604 17,070 1,904 1,841 Re-entry of former Magnum employees — — 85,843 — Plan amendments — (23 ) — — Curtailments — (25,787 ) — — Benefits paid (61,955 ) (53,974 ) (3,646 ) (3,431 ) Other-primarily actuarial loss (gain) (5,102 ) 39,504 (17,605 ) (6,492 ) Benefit obligations at December 31 $ 301,292 $ 353,736 $ 103,460 $ 36,098 CHANGE IN PLAN ASSETS Value of plan assets at January 1 $ 336,709 $ 347,952 $ — $ — Actual return on plan assets (1,679 ) 36,130 — — Employer contributions 424 6,601 3,646 3,431 Benefits paid (61,955 ) (53,974 ) (3,646 ) (3,431 ) Value of plan assets at December 31 $ 273,499 $ 336,709 $ — $ — Accrued benefit cost $ (27,793 ) $ (17,027 ) $ (103,460 ) $ (36,098 ) ITEMS NOT YET RECOGNIZED AS A COMPONENT OF NET PERIODIC BENEFIT COST Prior service credit (cost) $ — $ — $ 26,944 $ 21,972 Accumulated gain (loss) (16,769 ) (11,332 ) 11,313 9,125 $ (16,769 ) $ (11,332 ) $ 38,257 $ 31,097 BALANCE SHEET AMOUNTS Current liability $ (420 ) $ (767 ) $ (3,650 ) $ (3,430 ) Noncurrent liability $ (27,373 ) $ (16,260 ) $ (99,810 ) $ (32,668 ) $ (27,793 ) $ (17,027 ) $ (103,460 ) $ (36,098 ) Pension Benefits Other Postretirement Benefits Year Ended December 31, Year Ended December 31, 2015 2014 2013 2015 2014 2013 (In thousands) Service cost $ 9 $ 21,478 $ 27,065 $ 866 $ 1,649 $ 2,027 Interest cost 14,604 17,070 16,207 1,904 1,841 1,739 Curtailments — (25,368 ) 47 — — (5,444 ) Settlements 2,656 646 — — — — Expected return on plan assets (20,367 ) (23,756 ) (23,761 ) — — — Amortization of prior service credits — (257 ) (204 ) (8,335 ) (10,003 ) (10,621 ) Amortization of other actuarial losses 8,850 3,128 14,616 (2,109 ) (761 ) (252 ) Net benefit cost (credit) $ 5,752 $ (7,059 ) $ 33,970 $ (7,674 ) $ (7,274 ) $ (12,551 ) the remaining service attribution periods of the employees using the corridor method. Pension Benefits Other Postretirement Benefits 2015 2014 2015 2014 Discount rate 4.59 % 4.15 % 4.57 % 3.91 % Rate of compensation increase N/A N/A N/A N/A periods. Pension Benefits Other Postretirement Benefits 2015 2014 2013 2015 2014 2013 Discount rate 4.15% 5.08/ 4.23/ 4.14% 4.13/ 5.05% 3.91% 4.58% 3.64/ 4.58% Rate of compensation increase N/A N/A 3.39% N/A N/A N/A N/A Expected return on plan assets 7.00% 7.75% 7.75% N/A N/A N/A N/A periods. Total Level 1 Level 2 Level 3 2015 2014 2015 2014 2015 2014 2015 2014 (In thousands) Equity Securities:(A) U.S. small-cap $ 11,640 $ 16,512 $ 11,640 $ 16,512 $ — $ — $ — $ — U.S. mid-cap 28,524 46,481 10,979 17,301 17,545 29,180 — — U.S. large-cap 67,244 89,008 33,249 43,181 33,995 45,827 — — Non-U.S. 18,785 25,905 — — 18,785 25,905 — — Fixed income securities: — — — — — — — — U.S. government securities(B) 18,844 13,708 18,183 12,988 661 720 — — Non-U.S. government securities(C) 766 1,599 — — 766 1,599 — — U.S. government asset and mortgage backed securities(D) 1,056 830 — — 1,056 830 — — Corporate fixed income(E) 39,939 22,702 — — 39,939 22,702 — — State and local government securities(F) 5,725 8,005 — — 5,725 8,005 — — Other fixed income(G) 57,209 83,735 — — 57,209 83,735 — — Short-term investments(H) 3,898 6,818 — — 3,898 6,818 — — Other investments(I) 19,869 21,406 — — 1,234 3,336 18,635 18,070 Total $ 273,499 $ 336,709 $ 74,051 $ 89,982 $ 180,813 $ 228,657 $ 18,635 $ 18,070 (B) U.S. government securities includes agency and treasury debt. These investments are valued using dealer quotes in an active market. Other Pension Postretirement Benefits Benefits (In thousands) 2016 $ 19,164 $ 8,356 2017 20,320 8,341 2018 21,833 8,344 2019 21,341 8,281 2020 21,461 8,245 Next 5 years 106,953 38,178 $ 211,072 $ 79,745 computations: Operating Leases Royalties (In thousands) 2016 $ 20,857 $ 8,947 2017 17,277 13,991 2018 6,412 13,097 2019 3,448 12,295 2020 2,151 11,996 Thereafter 9,807 103,771 $ 59,952 $ 164,097 2016. 2015. 2015. Year Ended December 31, 2015 2014 2013 (In thousands) Europe $ 170,314 $ 277,565 $ 371,363 Asia 96,523 156,057 160,404 North America 40,315 78,445 80,322 Central and South America 55,323 20,496 55,493 Brokered Sales 32,848 79,354 154,442 Total $ 395,323 $ 611,917 $ 822,024 27. Segment Information Kentucky and Virginia. For further information on the divestiture, please see Note 5 to the Consolidated Financial Statements, “Divestitures.” PRB APP All Other Corporate, Consolidated Year Ended December 31, 2015 Revenues $ 1,448,440 $ 834,606 $ 290,214 $ — $ 2,573,260 Adjusted EBITDA 258,300 82,837 17,044 (108,064 ) 250,117 Depreciation, depletion and amortization 176,257 156,273 40,768 6,047 379,345 Amortization of acquired sales contracts, net (4,158 ) (4,653 ) — — (8,811 ) Total assets 1,648,916 843,583 310,949 2,303,290 5,106,738 Capital expenditures 22,535 20,599 11,135 64,755 119,024 Year Ended December 31, 2014 Revenues $ 1,490,377 $ 1,108,358 $ 338,384 $ — $ 2,937,119 Adjusted EBITDA 198,074 110,693 56,612 (85,236 ) 280,143 Depreciation, depletion and amortization 168,522 205,732 40,125 4,369 418,748 Amortization of acquired sales contracts, net (3,961 ) (9,433 ) 207 — (13,187 ) Total assets 1,772,230 3,379,834 339,809 2,937,850 8,429,723 Capital expenditures 44,305 23,638 12,993 66,350 147,286 Year Ended December 31, 2013 Revenues $ 1,482,812 $ 1,145,801 $ 385,744 $ — $ 3,014,357 Adjusted EBITDA 206,910 88,883 94,948 (138,595 ) 252,146 Depreciation, depletion and amortization 171,324 202,952 45,741 6,425 426,442 Amortization of acquired sales contracts, net (3,656 ) (10,364 ) 4,563 — (9,457 ) Total assets 1,841,835 3,971,764 402,922 2,773,672 8,990,193 Capital expenditures 9,784 167,759 23,122 96,319 296,984 Year Ended December 31, 2015 2014 2013 Adjusted EBITDA $ 250,117 $ 280,143 $ 252,146 Depreciation, depletion and amortization (379,345 ) (418,748 ) (426,442 ) Amortization of acquired sales contracts, net 8,811 13,187 9,457 Asset impairment costs (2,628,303 ) (24,113 ) (220,879 ) Goodwill impairment — — (265,423 ) Losses from disposed operations resulting from Patriot Coal bankruptcy (116,343 ) — — Settlement of UMWA legal claims — — (12,000 ) Interest expense, net (393,549 ) (383,188 ) (374,664 ) Nonoperating expense (27,910 ) — (42,921 ) Loss from continuing operations before income taxes $ (3,286,522 ) $ (532,719 ) $ (1,080,726 ) March 31 June 30 September 30 December 31 (a) (a) (a) (a) (In thousands, except per share data) Year Ended December 31, 2015 Revenues $ 677,005 $ 644,462 $ 688,544 563,249 Gross profit (loss) $ 14,256 $ (16,507 ) $ 47,275 (44,964 ) Asset impairment and mine closure costs $ — $ 19,146 $ 2,120,292 488,865 Loss from operations $ (19,712 ) $ (69,546 ) $ (2,236,772 ) $ (539,033 ) Net loss $ (113,195 ) $ (168,103 ) $ (1,999,476 ) $ (632,368 ) Diluted loss per common share $ (5.32 ) $ (7.93 ) $ (93.91 ) $ (29.70 ) March 31 June 30 September 30 December 31 (a) (a) (b) (a) (b) (a) (b) (In thousands, except per share data) Year Ended December 31, 2014 Revenues $ 735,971 $ 713,776 $ 742,180 $ 745,192 Gross profit (loss) $ (49,842 ) $ (6,350 ) $ (5,851 ) $ 32,264 Asset impairment and mine closure costs $ — $ 1,512 $ 5,060 $ 17,541 Loss from operations $ (73,123 ) $ (35,805 ) $ (35,300 ) $ (5,303 ) Net loss $ (124,140 ) $ (96,860 ) $ (97,218 ) $ (240,135 ) Diluted loss per common share $ (5.85 ) $ (4.57 ) $ (4.58 ) $ (11.31 ) Fresh Start Accounting Parent/Issuer Guarantor Non- Eliminations Consolidated (In thousands) Revenues $ — $ 2,573,260 $ — $ — $ 2,573,260 Costs, expenses and other Cost of sales (exclusive of items shown separately below) 22,378 2,186,804 — (2,749 ) 2,206,433 Depreciation, depletion and amortization 3,775 375,568 2 — 379,345 Amortization of acquired sales contracts, net — (8,811 ) — — (8,811 ) Change in fair value of coal derivatives and coal trading activities, net — (1,583 ) — — (1,583 ) Asset impairment and mine closure costs 15,437 2,612,866 — — 2,628,303 Losses from disposed operations resulting from Patriot Coal bankruptcy 116,343 — — — 116,343 Selling, general and administrative expenses 69,384 25,737 5,725 (2,063 ) 98,783 Other operating expense (income), net 5,869 13,021 (4,192 ) 4,812 19,510 233,186 5,203,602 1,535 — 5,438,323 Loss from investment in subsidiaries (2,574,565 ) — — 2,574,565 — Loss from operations (2,807,751 ) (2,630,342 ) (1,535 ) 2,574,565 (2,865,063 ) Interest expense, net Interest expense (478,432 ) (26,284 ) (4,916 ) 111,653 (397,979 ) Interest and investment income 27,510 82,881 5,692 (111,653 ) 4,430 (450,922 ) 56,597 776 — (393,549 ) Net loss resulting from early retirement of debt and debt restructuring (27,910 ) — — — (27,910 ) Loss from continuing operations before income taxes (3,286,583 ) (2,573,745 ) (759 ) 2,574,565 (3,286,522 ) Provision for (benefit from) income taxes (373,441 ) — 61 — (373,380 ) Net loss (2,913,142 ) (2,573,745 ) (820 ) 2,574,565 (2,913,142 ) Total comprehensive loss $ (2,918,198 ) $ (2,579,601 ) $ (820 ) $ 2,580,421 $ (2,918,198 ) Parent/Issuer Guarantor Non- Eliminations Consolidated (In thousands) Revenues $ — $ 2,937,119 $ — $ — $ 2,937,119 Costs, expenses and other Cost of sales (exclusive of items shown separately below) 3,016 2,566,572 — (3,395 ) 2,566,193 Depreciation, depletion and amortization 5,154 413,559 35 — 418,748 Amortization of acquired sales contracts, net — (13,187 ) — — (13,187 ) Change in fair value of coal derivatives and coal trading activities, net — (3,686 ) — — (3,686 ) Asset impairment and mine closure costs 3,642 20,471 — — 24,113 Selling, general and administrative expenses 79,902 29,739 6,626 (2,044 ) 114,223 Other operating income, net (4,480 ) (15,726 ) (4,987 ) 5,439 (19,754 ) 87,234 2,997,742 1,674 — 3,086,650 Loss from investment in subsidiaries (13,085 ) — — 13,085 — Loss from operations (100,319 ) (60,623 ) (1,674 ) 13,085 (149,531 ) Interest expense, net Interest expense (463,823 ) (26,137 ) (4,259 ) 103,273 (390,946 ) Interest and investment income 31,389 74,511 5,131 (103,273 ) 7,758 (432,434 ) 48,374 872 — (383,188 ) Loss from continuing operations before income taxes (532,753 ) (12,249 ) (802 ) 13,085 (532,719 ) Provision for (benefit from) income taxes 25,600 — 34 — 25,634 Net loss (558,353 ) (12,249 ) (836 ) 13,085 (558,353 ) Total comprehensive loss $ (592,804 ) $ (34,439 ) $ (836 ) $ 35,275 $ (592,804 ) Parent/Issuer Guarantor Non- Eliminations Consolidated (In thousands) Revenues $ — $ 3,014,357 $ — $ — $ 3,014,357 Costs, expenses and other — Cost of sales (exclusive of items shown separately below) 9,117 2,657,583 — (3,564 ) 2,663,136 Depreciation, depletion and amortization 5,949 420,458 35 — 426,442 Amortization of acquired sales contracts, net — (9,457 ) — — (9,457 ) Change in fair value of coal derivatives and coal trading activities, net — 7,845 — — 7,845 Asset impairment and mine closure costs 78,150 142,729 — — 220,879 Goodwill impairment — 265,423 — — 265,423 Selling, general and administrative expenses 88,820 39,825 7,038 (2,235 ) 133,448 Other operating income, net 4,209 (34,856 ) (5,370 ) 5,799 (30,218 ) 186,245 3,489,550 1,703 — 3,677,498 Loss from investment in subsidiaries (328,889 ) — — 328,889 — Income (loss) from operations (515,134 ) (475,193 ) (1,703 ) 328,889 (663,141 ) Interest expense, net Interest expense (449,614 ) (24,747 ) (4,214 ) 97,308 (381,267 ) Interest and investment income 30,285 68,248 5,378 (97,308 ) 6,603 (419,329 ) 43,501 1,164 — (374,664 ) Other non-operating expense Net loss resulting from early retirement of debt (42,921 ) — — — (42,921 ) Loss from continuing operations before income taxes (977,384 ) (431,692 ) (539 ) 328,889 (1,080,726 ) Provision for (benefit from) income taxes (335,552 ) — 54 — (335,498 ) Loss from continuing operations (641,832 ) (431,692 ) (593 ) 328,889 (745,228 ) Income from discontinued operations, net of tax — 103,396 — — 103,396 Net Loss (641,832 ) (328,296 ) (593 ) 328,889 (641,832 ) Total comprehensive income (loss) $ (587,633 ) $ (304,278 ) $ (593 ) $ 304,871 $ (587,633 ) Parent/Issuer Guarantor Non- Eliminations Consolidated (In thousands) Assets Cash and cash equivalents $ 337,646 $ 100,428 $ 12,707 $ — $ 450,781 Short term investments 200,192 — — — 200,192 Restricted cash — — 97,542 — 97,542 Receivables 12,463 3,153 124,581 (4,430 ) 135,767 Inventories — 196,720 — — 196,720 Other 83,017 38,794 969 — 122,780 Total current assets 633,318 339,095 235,799 (4,430 ) 1,203,782 Property, plant and equipment, net 7,747 3,610,869 — 413 3,619,029 Investment in subsidiaries 4,887,905 — — (4,887,905 ) — Intercompany receivables — 2,253,312 — (2,253,312 ) — Note receivable from Arch Western 675,000 — — (675,000 ) — Other 39,302 243,806 819 — 283,927 Total assets $ 6,243,272 $ 6,447,082 $ 236,618 $ (7,820,234 ) $ 5,106,738 Liabilities and Stockholders’ Equity (Deficit) Accounts payable $ 8,495 $ 119,633 $ 3 $ — $ 128,131 Accrued expenses and other current liabilities 162,268 170,575 1,037 (4,430 ) 329,450 Current maturities of debt 5,096,460 10,750 — — 5,107,210 Total current liabilities 5,267,223 300,958 1,040 (4,430 ) 5,564,791 Long-term debt — 30,953 — — 30,953 Intercompany payables 2,043,308 — 210,005 (2,253,313 ) — Note payable to Arch Coal — 675,000 — (675,000 ) — Asset retirement obligations 1,005 395,654 — — 396,659 Accrued pension benefits 12,390 14,983 — — 27,373 Accrued postretirement benefits other than pension 79,826 19,984 — — 99,810 Accrued workers’ compensation 24,247 88,023 — — 112,270 Deferred income taxes — — — — — Other noncurrent liabilities 59,976 58,847 348 — 119,171 Total liabilities 7,487,975 1,584,402 211,393 (2,932,743 ) 6,351,027 Stockholders’ equity (deficit) (1,244,703 ) 4,862,680 25,225 (4,887,491 ) (1,244,289 ) Total liabilities and stockholders’ equity (deficit) $ 6,243,272 $ 6,447,082 $ 236,618 $ (7,820,234 ) $ 5,106,738 Parent/Issuer Guarantor Non- Eliminations Consolidated (In thousands) Assets Cash and cash equivalents $ 572,185 $ 150,358 $ 11,688 $ — $ 734,231 Short term investments 248,954 — — — 248,954 Restricted cash — — 5,678 — 5,678 Receivables 9,656 15,933 211,043 (4,615 ) 232,017 Inventories — 190,253 — — 190,253 Other 89,211 41,455 952 — 131,618 Total current assets 920,006 397,999 229,361 (4,615 ) 1,542,751 Property, plant and equipment, net 10,470 6,442,623 2 363 6,453,458 Investment in subsidiaries 7,464,221 — — (7,464,221 ) — Intercompany receivables 2,021,110 — (2,021,110 ) — Note receivable from Arch Western 675,000 — — (675,000 ) — Other 131,884 300,058 1,572 — 433,514 Total assets $ 9,201,581 $ 9,161,790 $ 230,935 $ (10,164,583 ) $ 8,429,723 Liabilities and Stockholders’ Equity Accounts payable $ 23,394 $ 156,664 $ 55 $ — $ 180,113 Accrued expenses and other current liabilities 85,899 220,017 1,095 (4,615 ) 302,396 Current maturities of debt 27,625 9,260 — — 36,885 Total current liabilities 136,918 385,941 1,150 (4,615 ) 519,394 Long-term debt 5,084,839 38,646 — 5,123,485 Intercompany payables 1,817,755 — 203,355 (2,021,110 ) — Note payable to Arch Coal — 675,000 — (675,000 ) — Asset retirement obligations 981 397,915 — — 398,896 Accrued pension benefits 5,967 10,293 — — 16,260 Accrued postretirement benefits other than pension 4,430 28,238 — — 32,668 Accrued workers’ compensation 9,172 85,119 — — 94,291 Deferred income taxes 422,809 — — — 422,809 Other noncurrent liabilities 50,919 102,461 386 — 153,766 Total liabilities 7,533,790 1,723,613 204,891 (2,700,725 ) 6,761,569 Stockholders’ equity 1,667,791 7,438,177 26,044 (7,463,858 ) 1,668,154 Total liabilities and stockholders’ equity $ 9,201,581 $ 9,161,790 $ 230,935 $ (10,164,583 ) $ 8,429,723 Parent/Issuer Guarantor Non- Eliminations Consolidated (In thousands) Cash provided by (used in) operating activities $ (445,136 ) $ 314,535 $ 86,234 $ — $ (44,367 ) Investing Activities Capital expenditures (1,108 ) (117,916 ) — — (119,024 ) Additions to prepaid royalties — (5,871 ) — — (5,871 ) Proceeds from disposals and divestitures — 2,191 — — 2,191 Purchases of short term investments (246,735 ) — — — (246,735 ) Proceeds from sales of short term investments 290,205 — — — 290,205 Proceeds from sales of equity investments and securities — 2,259 — — 2,259 Withdrawals (deposits) of restricted cash — — (91,864 ) — (91,864 ) Investments in and advances to affiliates (913 ) (10,589 ) — — (11,502 ) Cash provided by (used in) investing activities 41,449 (129,926 ) (91,864 ) — (180,341 ) Financing Activities Payments on term loan (19,500 ) — — — (19,500 ) Net payments on other debt (2,692 ) (8,640 ) — — (11,332 ) Expenses related to debt restructuring (27,910 ) — — — (27,910 ) Transactions with affiliates, net 219,250 (225,899 ) 6,649 — — Cash provided by (used in) financing activities 169,148 (234,539 ) 6,649 — (58,742 ) Increase (decrease) in cash and cash equivalents (234,539 ) (49,930 ) 1,019 — (283,450 ) Cash and cash equivalents, beginning of period 572,185 150,358 11,688 — 734,231 Cash and cash equivalents, end of period $ 337,646 $ 100,428 $ 12,707 $ — $ 450,781 Parent/Issuer Guarantor Non- Eliminations Consolidated (In thousands) Cash provided by (used in) operating activities $ (324,688 ) $ 305,048 $ (13,942 ) $ — $ (33,582 ) Investing Activities Capital expenditures (2,700 ) (144,586 ) — — (147,286 ) Additions to prepaid royalties — (7,317 ) — — (7,317 ) Proceeds from disposals and divestitures 57,625 4,733 — — 62,358 Purchases of short term investments (211,929 ) — — — (211,929 ) Proceeds from sales of short term investments 205,611 — — — 205,611 Proceeds from sales of investments in equity securities 9,464 — — — 9,464 Withdrawals (deposits) of restricted cash — — (5,678 ) — (5,678 ) Investments in and advances to affiliates (2,541 ) (14,116 ) — — (16,657 ) Cash provided by (used in) investing activities 55,530 (161,286 ) (5,678 ) — (111,434 ) Financing Activities Payments on term loan (19,500 ) — — — (19,500 ) Net payments on other debt (1,258 ) (4,437 ) — — (5,695 ) Debt financing costs (2,219 ) — (2,300 ) — (4,519 ) Dividends paid (2,123 ) — — — (2,123 ) Other (15 ) — — — (15 ) Transactions with affiliates, net 67,125 (89,385 ) 22,260 — — Cash provided by (used in) financing activities 42,010 (93,822 ) 19,960 — (31,852 ) Increase (decrease) in cash and cash equivalents (227,148 ) 49,940 340 — (176,868 ) Cash and cash equivalents, beginning of period 799,333 100,418 11,348 — 911,099 Cash and cash equivalents, end of period $ 572,185 $ 150,358 $ 11,688 $ — $ 734,231 Parent/Issuer Guarantor Non- Eliminations Consolidated (In thousands) Cash provided by (used in) operating activities $ (632,060 ) $ 637,193 $ 50,609 $ — $ 55,742 Investing Activities Capital expenditures (3,320 ) (293,664 ) — — (296,984 ) Proceeds from disposals and divestitures — 433,453 — — 433,453 Proceeds from sales-leaseback transaction — 34,919 — — 34,919 Investments in and advances to affiliates (5,451 ) (10,321 ) — 512 (15,260 ) Purchases of short term investments (213,726 ) — — — (213,726 ) Proceeds from sales of short term investments 194,537 — — — 194,537 Additions to prepaid royalties — (14,947 ) — — (14,947 ) Change in restricted cash 3,453 — — — 3,453 Cash provided by (used in) investing activities (24,507 ) 149,440 — 512 125,445 Financing Activities Contributions from parent — 512 — (512 ) — Proceeds from term loan and senior notes 644,000 — — — 644,000 Payments to retire debt (628,660 ) — — — (628,660 ) Payments on term loan (17,250 ) — — — (17,250 ) Net payments on other debt (6,324 ) (512 ) — — (6,836 ) Debt financing costs (19,864 ) — (625 ) — (20,489 ) Dividends paid (25,475 ) — — — (25,475 ) Transactions with affiliates, net 838,160 (786,683 ) (51,477 ) — — Cash provided by (used in) financing activities 784,587 (786,683 ) (52,102 ) (512 ) (54,710 ) Increase in cash and cash equivalents 128,020 (50 ) (1,493 ) — 126,477 Cash and cash equivalents, beginning of period 671,313 100,468 12,841 — 784,622 Cash and cash equivalents, end of period $ 799,333 $ 100,418 $ 11,348 $ — $ 911,099 Additions (Reductions) Balance at Charged to Charged to Balance at Beginning of Costs and Other End of Year Expenses Accounts Deductions (a) Year (In thousands) Year ended December 31, 2015 Reserves deducted from asset accounts: Accounts receivable and other receivables $ 159 $ 7,683 $ — $ — $ 7,842 Current assets — supplies and inventory 6,625 431 — (b) 1,065 5,991 Deferred income taxes 270,251 865,148 — — 1,135,399 Year ended December 31, 2014 Reserves deducted from asset accounts: Accounts receivable and other receivables $ 775 $ — $ — $ 616 $ 159 Current assets — supplies and inventory 8,446 580 (76 )(b) 2,325 6,625 Deferred income taxes 43,322 226,929 — — 270,251 Year ended December 31, 2013 Reserves deducted from asset accounts: Accounts receivable and other receivables $ 1,043 $ 346 $ — $ 614 $ 775 Current assets — supplies and inventory 12,589 503 (2,274 ) 2,372 $ 8,446 Deferred income taxes 34,663 8,659 — — $ 43,322 
Title of Each Class OTC Pinko¨o¨ No xo¨o¨oxor a smaller reporting company, or an emerging growth company. See the definitions of “large accelerated filer,” “accelerated filer”filer,” “smaller reporting company,” and “smaller reporting“emerging growth company” in Rule 12b-2 of the Exchange Act.oxx¨o¨o¨o¨ No x20152017 was approximately $72.4 million.$1.7 billion.12, 201616, 2018 there were 21,446,23320,986,812 shares of the registrant’s common stock outstanding.
DOCUMENTS INCORPORATED BY REFERENCEPagePage 5375152575960616280818181818282828282843 3631 of this report. Unless the context otherwise requires, all references in this report to “Arch,” “we,” “us,” or “our” are to Arch Coal, Inc. and its subsidiaries.FORWARD-FORWARD‑LOOKING INFORMATIONforward-lookingforward‑looking statements, within the meaning of Section 27A of the Securities Act of 1933, as amended, and Section 21E of the Securities Exchange Act of 1934, as amended, such as our expected future business and financial performance, and are intended to come within the safe harbor protections provided by those sections. The words “anticipates,” “believes,” “could,” “estimates,” “expects,” “intends,” “may,” “plans,” “predicts,” “projects,” “seeks,” “should,” “will” or other comparable words and phrases identify forward-lookingforward‑looking statements, which speak only as of the date of this report. Forward-lookingForward‑looking statements by their nature address matters that are, to different degrees, uncertain. Actual results may vary significantly from those anticipated due to many factors, including:·ability to continue as a going concern;· our ability to successfully complete a reorganization underrecent emergence from Chapter 11 and emerge from bankruptcy;· potential adverse effects of the Chapter 11 Cases (as defined below) on our liquidity and results of operations;· our ability to obtain timely Bankruptcy Court approval with respect to motions filed in the Chapter 11 Cases;· objections to the Company’s plan of reorganization that could protract the Chapter 11 Cases;· employee attrition and our ability to retain senior management and key personnel due to the distractions and uncertainties, including our ability to provide adequate compensation and benefits during the Chapter 11 Cases;·bankruptcy protection;················DIP CreditTerm Loan Agreement, our Securitization Facility, andInventory-Based Revolving Credit Facility, other financing arrangements;·arrangements or any subsequent financing or credit facilities;··4 ·····forward-lookingforward‑looking statements in this report, as well as all other written and oral forward-lookingforward‑looking statements attributable to us or persons acting on our behalf, are expressly qualified in their entirety by the cautionary statements contained in this section and elsewhere in this report. These factors are not necessarily all of the important factors that could affect us. These risks and uncertainties, as well as other risks of which we are not aware or which we currently do not believe to be material, may cause our actual future results to be materially different than those expressed in our forward-lookingforward‑looking statements. These forward-lookingforward‑looking statements speak only as of the date on which such statements were made, and we do not undertake to update our forward-lookingforward‑looking statements, whether as a result of new information, future events or otherwise, except as may be required by the federal securities laws.5 Introduction2015,2017, we sold approximately 12898 million tons of coal, including approximately 1.41.5 million tons of coal we purchased from third parties. We sell substantially all of our coal to power plants, steel mills and industrial facilities. At December 31, 2015,2017, we operated or contracted out the operation of, 169 active mines located in each of the major coal-producing regions of the United States. The locations of our mines and access to export facilities enable us to ship coal worldwide.low-sulfurlow‑sulfur coal in the eastern United States.412-million-ton412‑million‑ton federal reserve tract adjacent to the Black Thunder mine.719-million-ton719‑million‑ton federal reserve tract adjacent to the Black Thunder mine.low-cost, low-sulfurlow‑cost, low‑sulfur coal reserves, and integrated it into the Black Thunder mine.FilingArch’sits wholly owned domestic subsidiaries (the “Filing Subsidiaries” and, together with Arch, the “Debtors”) filed voluntary petitions for reorganization (collectively, the “Bankruptcy Petitions”) under Chapter 11 of Title 11 of the U.S. Code (the “Bankruptcy Code”) in the United States Bankruptcy Court for the Eastern District of Missouri (the “Court”). The Debtor’s Chapter 11 Cases (collectively, the “Chapter 11 Cases”) are beingwere jointly administered under the caption In re Arch Coal, Inc., et al. Case No. 16-40120 (lead case). EachDuring the bankruptcy proceedings, each Debtor will continue to operateoperated its business as a “debtor in possession” under the jurisdiction of the Court and in accordance with the applicable provisions of the Bankruptcy Code and the orders of the Court.The filingPetitions constituted an eventCode dated as of default that accelerated Arch’s obligations underSeptember 11, 2016 (the “Plan”), which order was amended on September 15, 2016, Docket No. 1334.6 documents governing eachPlan became effective on such date (the “Effective Date”).Arch’s 7.00% senior notes due 2019, 9.875% senior notes due 2019, 8.00% senior secured second lien notes due 2019, 7.25% senior notes due 2020, 7.25% senior notes due 2021 (together, the “senior notes”)assets and senior secured first lien term loan due 2018 (the “Existing Credit Agreement”) (collectivelyliabilities in conformity with the senior notes,guidance for the “Debt Instruments”),acquisition method of accounting for business combinations. In addition to fresh start accounting, our consolidated financial statements reflect all impacts of the transactions contemplated by the Plan. Under the provisions of fresh start accounting, a new entity has been created for financial reporting purposes. We selected an accounting convenience date of October 1, 2016 for purposes of applying fresh start accounting as further describedthe activity between the convenience date and the Effective Date does not result in Note 14, “Debta material difference in the results. References to “Successor” in the financial statements and Financing Arrangements”accompanying footnotes are in reference to reporting dates on or after October 2, 2016; references to “Predecessor” in the financial statements and accompanying footnotes are in reference to reporting dates through October 1, 2016 which includes the impact of the Plan provisions and the application of fresh start accounting. As such, our financial statements for the Successor will not be comparable in many respects to its financial statements for periods prior to the adoption of fresh start accounting and prior to the accounting for the effects of the Plan.in thewithin this Form 10-K. Immediately after filing the Bankruptcy Petitions, Arch began notifying all known current or potential creditors of the Debtors of the bankruptcy filings.Additionally, on the Petition Date, the New York Stock Exchange (the “NYSE”) determined that Arch was no longer suitable for listing pursuant to Section 8.02.01D of the NYSE continued listing standards, and trading in the Company’s common stock was suspended on January 11, 2016. We expect that the existing common stock of the Company will be extinguished upon the Company’s emergence from Chapter 11 and existing equity holders will not receive consideration in respect of their equity interests.On the Petition Date, the Debtors filed a number of motions with the Court generally designed to stabilize their operations and facilitate the Debtors’ transition into Chapter 11. Certain of these motions sought authority from the Court for the Debtors to make payments upon, or otherwise honor, certain pre-petition obligations (e.g., obligations related to certain employee wages, salaries and benefits and certain vendors and other providers essential to the Debtors’ businesses). The Court has entered orders approving the relief sought in these motions.Pursuant to Section 362 of the Bankruptcy Code, the filing of the Bankruptcy Petitions automatically stayed most actions against the Debtors, including actions to collect indebtedness incurred prior to the Petition Date or to exercise control over the Debtors’ property. Subject to certain exceptions under the Bankruptcy Code, the filing of the Debtors’ Chapter 11 Cases also automatically stayed the continuation of most legal proceedings, including certain of the third party litigation matters described under “Legal Proceedings,” or the filing of other actions against or on behalf of the Debtors or their property to recover on, collect or secure a claim arising prior to the Petition Date or to exercise control over property of the Debtors’ bankruptcy estates, unless and until the Court modifies or lifts the automatic stay as to any such claim. Notwithstanding the general application of the automatic stay described above, governmental authorities may determine to continue actions brought under their police and regulatory powers.As required by the Bankruptcy Code, the U.S. Trustee for the Eastern District of Missouri appointed an official committee of unsecured creditors (the “Creditors’ Committee”) on January 25, 2016. The Creditors’ Committee represents all unsecured creditors of the Debtors and has a right to be heard on all matters that come before the Court.As a result of extremely challenging current market conditions, Arch believes it will require a significant restructuring of its balance sheet in order to continue as a going concern in the long term. The Company’s ability to continue as a going concern is dependent upon, among other things, its ability to become profitable and maintain profitability and its ability to successfully implement its Chapter 11 plan strategy. As a result of the Bankruptcy Petitions, the realization of the Debtors’ assets and the satisfaction of liabilities are subject to significant uncertainty. While operating as a debtor-in-possession pursuant to the Bankruptcy Code, the Company may sell or otherwise dispose of or liquidate assets or settle liabilities, subject to the approval of the Court or as otherwise permitted in the ordinary course of business for amounts other than those reflected in the accompanying consolidated financial statements. Further, a Chapter 11 plan is likely to materially change the amounts and classifications of assets and liabilities reported in the Company’s Consolidated Financial Statements.Restructuring Support AgreementIn connection with the filing of the Bankruptcy Petitions, Arch entered into a Restructuring Support Agreement, dated as of January 10, 2016 (the “Restructuring Support Agreement”), among the Debtors and holders of over 50% of Arch’s first lien term loans under Arch’s Existing Credit Agreement (the “Supporting First Lien Creditors”), providing that the Supporting First Lien Creditors will support a restructuring of the Debtors, subject to the following terms and conditions contemplated therein, among others:· existing common stock of Arch would likely be extinguished upon the Company’s emergence from Chapter 11, and existing equity holders would likely not receive consideration in respect of their equity interests;· claims against the Debtors arising under the DIP Facility (as defined below) would be paid in full in cash or receive such other treatment as may be consented to by the holders of such claims;· claims against the Debtors of holders of first lien term loans would be exchanged for (a) a combination of cash and $326.5 million (principal amount) of new first lien debt that would be issued by the reorganized Company and (b) 100% of the common stock of the reorganized Company outstanding on the effective date of the plan, subject to dilution on account of a proposed new management incentive plan and the distribution to unsecured creditors of any new common stock and warrants (as described below);· first lien term loan deficiency claims (subject to certain exceptions) as well as second lien notes, unsecured notes and general unsecured claims against the Debtors would be exchanged for either (1) common stock in the reorganized Company and warrants or (2) the value of the unencumbered assets of the Company, if any, after giving effect to certain other payments and claims;· either the Company’s existing accounts receivable securitization facility would be reinstated or a new letter of credit facility would be entered into by the Company, in either case on terms acceptable to Supporting First Lien Creditors holding more than 66 2/3% of the aggregate amount of the first lien term loans held by Supporting First Lien Creditors; and· the board of directors of the reorganized Company would consist of seven directors, at least one of whom would be independent, including the Company’s Chief Executive Officer and six directors selected by certain of the Company’s first-lien term lenders in consultation with the Company’s Chief Executive Officer.The Restructuring Support Agreement, if utilized as the basis for a plan of reorganization, is expected to reduce Arch’s long-term debt by more than $4.5 billion.We entered into an amendment to the Restructuring Support Agreement on February 25, 2016 (the “RSA Amendment”), which provides for the waiver of the termination event that would have occurred on February 25, 2016 as a result of the Debtors not having obtained Court approval of the assumption of the Restructuring Support Agreement within 45 days of the Petition Date. The Debtors had previously agreed, with the consent of the Majority Consenting Lenders under the Restructuring Support Agreement, to adjourn the Court hearing on the Restructuring Support Agreement at the request of the official committee of unsecured creditors appointed in the Debtors’ Chapter 11 cases. Pursuant to the RSA Amendment, unless otherwise agreed by the Majority Consenting Lenders, the Debtors are required to obtain Court approval of the assumption of the Restructuring Support Agreement on or before the date that is 90 days from the Petition Date.The RSA Amendment also provides for a waiver of any termination event that otherwise would occur as a result of the dismissal of the Chapter 11 case of one of our subsidiaries following the sale of such subsidiary and a 45-day extension of the date after which the Debtors and the Majority Consenting Lenders may modify the proposed distributions to holders of unsecured claims if holders of more than $1.6125 billion of unsecured claims against the Debtors have not executed a restructuring support agreement substantially in the form of the Restructuring Support Agreement.Securitization AgreementOn January 13, 2016, Arch and its securitization financing providers (the “Securitization Financing Providers”) agreed that, subject to certain amendments (the “Amendments”), they will continue the $200 million trade accounts receivable securitization facility provided to Arch Receivable Company, LLC, a non-debtor special-purpose entity that is a wholly owned subsidiary of the Company (“Arch Receivable”) (the “Securitization Facility”). See Item 7, “Management’s Discussion and Analysis—Liquidity and Capital Resources—Securitization Agreement” for more information.Debtor-In-Possession FinancingOn January 21, 2016, the Superpriority Secured Debtor-in-Possession Credit Agreement, as amended by the Waiver and Consent and Amendment No. 1, dated as of March 4, 2016, (the “DIP Credit Agreement”) was entered into by and among the Company, as borrower, certain of the Debtors, as guarantors (the “Guarantors” and, together with the Company, the “Loan Parties”), the lenders from time to time party thereto (the “DIP Lenders”) and Wilmington Trust, National Association, as administrative agent and collateral agent for the DIP Lenders (in such capacities, the “DIP Agent”).The DIP Credit Agreement, which has been approved by the Court on a final basis, provides for a super-priority senior secured debtor-in-possession credit facility (the “DIP Facility”) consisting of term loans (collectively, the “DIP Term Loan”) in the aggregate principal amount of up to $275 million that may be funded in not more than two draws not later than six months after the effective date of the DIP Facility (such six month period, the “Availability Period”). Any portion of the DIP Term Loan commitment that has not been funded on or prior to the end of the Availability Period will be permanently cancelled. TheDIP Facility includes a $75 million carve-out from the first priority lien granted in favor of the DIP Agent for the benefit of the DIP Lenders on all encumbered and unencumbered assets of the Loan Parties for super-priority claims relating to certain of the Debtors’ bonding obligations. See Item 7, “Management’s Discussion and Analysis—Liquidity and Capital Resources—Debtor-In-Possession Financing” for more information.steamthermal coal or metallurgical coal. Heat value, sulfur, ash, moisture content, and volatility, in the case of metallurgical coal, are important variables in the marketing and transportation of coal. These characteristics help producers determine the best end use of a particular type of coal. The following is a description of these general coal characteristics:Coal-fueledCoal‑fueled power plants can comply with sulfur dioxide emission regulations by burning coal with low sulfur content, blending coals with various sulfur contents, purchasing emission allowances on the open market and/or using sulfur-dioxidesulfur dioxide emission reduction technology.as-soldas‑sold basis, can range from approximately 2% to over 30% of the coal’s weight.7 truck. conveyor belt.reached 7.7exceeds 7.0 billion tonnesmetric tons in 2014,2017 according to the International Energy Agency (IEA). Total hard coal production decreased 0.5% to an estimated 6.9 billion tonnes in 2014 from 2013 levels, while global production of lignite coal declined roughly 3% to 810 million tonnes. Also according to IEA estimates, China remainedis the largest producer of coal in the world, producing over 3.5 billion tonnesmetric tons in 2014.2017 according to the Chinese Bureau of Statistics. The United States and India follow China with total coal production of over900 650 million tonnes and 600 million tonnes, respectively,metric tons each in 2014. Preliminary data for 2015 suggests further erosion in global coal demand, but the relative ranking of producer countries remained the same.Cross-border trade of coal was close to 1.4 billion tonnes in 2014, according to the IEA. Despite a drop in coal imports, China remained the largest importer of globally traded coal in 2014, taking over 305 million tonnes. India and Japan followed China with total coal imports of over 239 million tonnes and 187 million tonnes, respectively. Imports in OECD Europe were slightly higher in 2014 at an estimated 280 million tonnes.IEAmajority of our coal is sold at the mine where title and risk of loss transfer to the customer as coal is loaded into the railcar or truck. Customers are responsible for transportation - typically using third party carriers. There are some agreements where we retain responsibility for the coal during delivery to the customer site or intermediate terminal. Our international coal usually changes title and risk of loss as coal is loaded on an ocean vessel. We or our agent contracts for transportation services to the ocean loading port. On rare occasion, we might retain title to the coal to the ocean delivery port.that these key supply regions combined made up 86%we produced close to 10% of total global cross-border coal trade in 2014.Global Coal Supply and Demand. The supply and demand fundamentals in global coal markets were further challenged in 2015. In China, a slowing economy along with new environmental restrictions and protectionist policies aiming to support the domestic coal industry resulted in a significant decline in coal imports in 2015 according to preliminary reports. China continues to add coal-based power generation capacity at a robust pace, but slower economic growth and/or additional regulations could continue to pressure demand in the near to intermediate term. Preliminary reports indicated that imports of metallurgical and thermal coal into China decreased by 11 and 43 million tonnes in 2015, respectively. The decline was primarily caused by weak industrial production and protectionist measures favoring domestic supply. Conversely, India is estimated to have sustained strong demand for both thermal andU.S. metallurgical coal in 2015 due2017. Our metallurgical coal was sold to solid economic growth6 domestic customers and associated electric powershipped to 18 international destinations in 2017.infrastructure projects. Europe’s weak economic growth combined with increased competition from other fuels and renewables resulted in further declines in importinternational coal demand there. Additionally, economic uncertaintiesproducers, traders or brokers as well as the low-cost external supplyproducers of steel have pressured Europe’s domestic steel producers which has translated into lower demand for metallurgical coal.The IEA publishes a World Energy Outlook (“WEO”) in which it reports on multiple scenarios. For example, the “New Policies Scenario” incorporates policiesother energy sources including natural gas, renewables and measures affecting energy markets that have already been adopted,nuclear, as well as other relevant commitmentsnon-coal based forms of steel production. We compete with other coal producers and plans that have been announcedtraders/brokers using price, coal quality, transportation, optionality, customer administration, reputation and reliability.countries, including national pledges to reduce emissions and plans to phase out fossil fuel subsidies, even ifmany uncontrollable factors. For power generation, the measures to implement these commitments have yet to be identified or announced. The “Current Policies Scenario” contemplates no changes in policies from the mid-pointprice of the year of publication, assuming that governments do not implement any commitments that have yet to be finalized by legislation and will not introduce any new policies affecting coal usage. Finally, the “450 Scenario” assumes implementation of a set of government policies consistent with a goal of limiting long-term increases in the average global temperature to two degrees Celsius, a limit determined by various governments and non-governmental organizations and recognized by nations of the world in the 2010 United Nations Climate Change Conference.The IEA makes projections about world coal demand based on various future scenarios for energy development. The scenarios usedis affected by the IEA asrelative supply and demand of competitive coal, transportation, availability and price of other non-coal forms of power production (particularly, natural gas), regulatory limits on using coal, taxes, the bases for these projections varyweather and economic conditions. For metallurgical coal, the price of coal is affected by timethe supply, demand and publication. Further details are available toprice of competitive coal, transportation, the public directly from the IEA, including through the IEA’s website: http://www.iea.org/publications/scenariosandprojections/. Information contained on or accessible through the IEA’s website is not incorporated by reference into this Annual Report on Form 10-K.The IEA estimates in its WEO 2015, Current Policies Scenario, that worldwide primary energy demand will grow 45%, whereas the New Policies Scenario projects 32% growth, between 2013 and 2040. Demand for coal during this time period is projected to rise 43% and 12% under the Current Policies Scenario and the New Policies Scenario, respectively.The IEA expects coal to retain its prominent presence as a fuel for the power sector worldwide under the Current Policies Scenario. Coal’s shareprice of the power generation mix was 41% in 2013. By 2040, the IEA’s Current Policies Scenario estimates that coal’s fuel share of global power generation will be 38% as it continues to have the largest share of worldwide electric power production. Under the New Policies and 450 scenarios, coal’s fuel share of global power generation is projected to be 30% and 12%, respectively.Most coal consumption growth is expected to occur in Asia, with China and India as the largest consumers going forward. In the metallurgical markets, we expect somewhat modest growth in near-term steel, demand based on slowerfor steel, as well as regulations, taxes, and economic growth. Moreover, we expect continued supply rationalization for global metallurgical coal.The IEA also projects that global natural gas-fueled electricity generation will grow from 22% share in 2013conditions.24% under the Current Policies scenario. IEA’s New Policies Scenario shows gas share growing only slightly to 23% share by 2040. However, under the 450 Scenario, natural gas share declines to 16% by 2040. The 450 Scenario assumes the generation share from renewable sources will grown more than fivefold from 6% in 2013 to 32% by 2040. Electricity generation from nuclear power is expected to fall from 11% to 9% under the Current Policies Scenario, while growing to 11% or 18% under the New Policiesmeeting customer needs, coordinating transportation, providing accounting services and 450 scenarios, respectively.As noted above, projected coal usage is highest under the Current Policies Scenario. Future energy use consistent with the 450 Scenario would likely yield results materially lower than the projections noted above under the Current Policies Scenario or the New Policies Scenario.U.S. Coal Consumption. In the United States, coal is used primarily by power plants to generate electricity, by steel companies to produce coke for use in blast furnaces, and by a variety of industrial users to heat and power foundries, cement plants, paper mills, chemical plants and other manufacturing or processing facilities. Although final data are not yet available, coal consumption in the United States is estimated to be approximately 809 million tons in 2015, according to the Energy Information Administration’s (EIA) Short Term Energy Outlook. Coal consumption decreased in 2015 by 12%, or around 108 million tons.According to the EIA, coal accounted for approximately 33% of U.S. electricity generation in 2015. This is 5 percentage points lower than the same period in 2014 and represents the lowest share for coal fueled power generation in at least 60 years. This decline in domestic coal consumption was caused by a convergence of factors including record high natural gas production along with the lowest natural gas prices since 1999, coal unit retirements following the implementation of the Mercury and Air Toxics Standards regulations and growing power generation from wind and solar.The following chart shows the breakdown of U.S. electricity generation by energy source for 2014 and 2015 according to the EIA:
Source: EIA Electric Power Monthly (February 2016).Historically, coal has been considerably less expensive than natural gas or oil. However, the growth of hydraulic fracturing (fracking) combined with less-than-projected electric power demand has resulted in oversupply. Natural gas inventories at the end of 2015 were 3.6 trillion cubic feet, which was 535 Bcf (17%) above the end of 2014 and 15% above the five-year average.While demand for natural gas is expected to increase in the coming years from new industrial users and exports, the current oversupply has suppressed natural gas prices to levels where coal is less competitive. As drilling for new natural gas has dropped to at least a 28-year low, EIA expects natural gas prices to increase in the coming years which we expect to improve coal’s relative competitiveness.While coal’s prospects with regard to natural gas should improve, the effects of new regulations on the use of coal, particularly regarding carbon dioxide emissions and climate change impacts, are evolving. EIA’s Annual Energy Outlook forecast does not reflect the impact of carbon regulations such as the Clean Power Plan on domestic coal consumption for power generation. However, EIA has published an analysis on the effects the Clean Power Plan would have on domestic coal consumption. EIA believes that even though the regulation targets coal use in power generation, coal will maintain a critical role for power generation in the U.S.Although the proposed Clean Power Plan rule results in less coal-fired electricity generation, several factors contribute to projected increases in coal generation from 2024 through 2040. Demand for electricity increases, and a combination of rising natural gas prices and increased renewable capacity translates to increased utilization at existing coal plants, even after significant amounts of coal capacity are retired. Also, in the Base Policy case, the standards set by the Clean Power Plan are assumed to remain constant after 2030. - EIA “Today in Energy,” June 10, 2015Even though the validity of the Clean Power Plan is being tested by the courts, we included EIA’s analysis of the originally proposed rule as a proxy for either the Clean Power Plan or other carbon regulations. We expect EIA will incorporate their analysis of the effects of the Clean Power Plan, which has been promulgated in 2015, in their upcoming release of the Annual Energy Outlook in April 2016. The 2020 and 2040 values are from EIA’s analysis for the proposed Clean Power Plan published on May 22, 2015:
GrowthSource: EIA “Analysis of the Impacts of the Clean Power Plan” (May 22, 2015)EIA Short Term Energy Outlook (February 2016)EIA Monthly Energy Review (February 2016)* Columns may not total due to rounding.secondtop three largest coal producerproducers in the world, exceeded only by China.China and roughly equivalent to India based on preliminary data. According to the EIA, there are over 200250 billion short tons of recoverable coal in the United States. The U.S. Department of Energy estimates that current domestic recoverable coal reserves could supply enough electricity to satisfy domestic demand for over 150300 years.8 MSHA,Mine Safety and Health Administration (MSHA), U.S. coal production declinedincreased by an estimated 10945 million tons in 2015,2017, to 891773 million tons.declinedincreased from an estimated 542404 million short tons in 20142016 to 494432 million short tons in 2015.2017. The Powder River Basin is located in northeastern Wyoming and southeastern Montana and is the largest producing region in the United States. Coal from this region is sub-bituminous coal with low sulfur content ranging from 0.2% to 0.9% and heating values ranging from 8,0008,300 to 9,500 Btu. The price of Powder River Basin coal is generally less than that of coal produced in other regions because Powder River Basin coal exists in greater abundance andhas a lower heat content, however it is easier to mine and,produced from thick seams using surface recovery methods thus, has a lower cost of production. The Western Bituminous region includes Colorado, Utah and southern Wyoming. Coal from this region typically has low sulfur content ranging from 0.4% to 0.8% and heating values ranging from 10,000 to 12,200 Btu. further divided into north, central and southern regions. According to the EIA, coal produced in the Appalachian region fellincreased from 268180 million short tons in 20142016 to 228196 million short tons in 2015.2017. Appalachian coal is located near the prolific eastern shale-gas producing regions. Central AppalachiaAppalachian thermal coal is further disadvantaged for power generation because of the depletion of economically attractive reserves, permitting issues and increasing costs of production. However, virtually all U.S. metallurgical coal is produced in Appalachia and the relative scarcity and high-quality of this coal allows for a pricing premium over thermal coal. Appalachia, while still a major producer of thermal coal, is undergoing a shift towards heavier reliance on metallurgical coal production for both domestic and international use. This is especially the case in Central Appalachia includes eastern Kentucky, Tennessee, Virginia and southern West Virginia. Coal mined from this region generally has a high heat value ranging from 11,400 to 13,200 Btu and a sulfur content ranging from 0.2% to 2.0%. Appalachia.fellincreased from 189144 million short tons in 20142016 to approximately 169145 million short tons in 2015.2017. Coal from the Illinois Basin generally has a heat value ranging from 10,100 to 12,600 Btu and has a sulfur content ranging from 1.0% to 4.3%. Despite its high sulfur content, coal from the Illinois Basin can generally be used by electric power generation facilities that have installed emissions control devices, such as scrubbers.U.S. Coal Exports and Imports. Coal exports declined approximately 20 million tons to 77 million tons in 2015. The decline was primarily caused by growing global coal supply along with slowing demand growth which displaced some of the volume originating in the United States. Additionally, unfavorable foreign currency exchange disadvantaged some United States coal in certain markets. The seaborne market is cyclical, but in their New Policies Scenario the IEA projects seaborne coal trade to grow to 1.1 billion tonnes by 2020, an increase of 59 million tons from 2015 levels.Historically, coal imported from abroad has represented a relatively small share of total domestic coal consumption, and this remained the case in 2015. Imports reached close to 36 million tons in 2007, but have fallen since then. According to the EIA, coal imports were 11.3 million tons in 2015. The decline is mostly attributable to more competitive pricing for domestic coal. The majority of the coal imported into the United States originates from Colombia.“—Our“Our Mining Operations-General.” The majority of the coal we produce comes from surface mining operations.earth-movingearth‑moving equipment, such as draglines, power shovels, excavators and loaders. Once exposed, we drill, fracture and systematically remove the coal using haul trucks or conveyors to transport the coal to a preparation plant or to a loadout facility. We reclaim disturbed areas as part of our normal mining activities. After final coal removal, we use draglines, power shovels, excavators or loaders to backfill the remaining pits with the overburden removed at the beginning of the process. Once we have replaced the overburden and topsoil, we reestablish vegetation and plant life into the natural habitat and make other improvements that have local community and environmental benefits.9 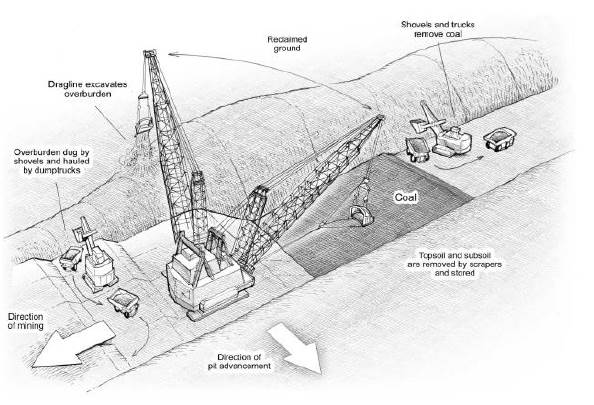

10 room-and-pillarroom‑and‑pillar mining.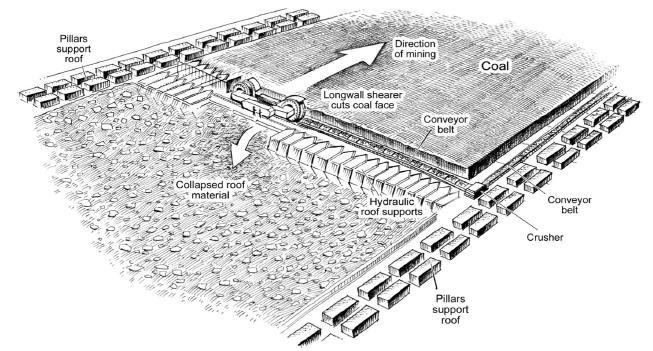
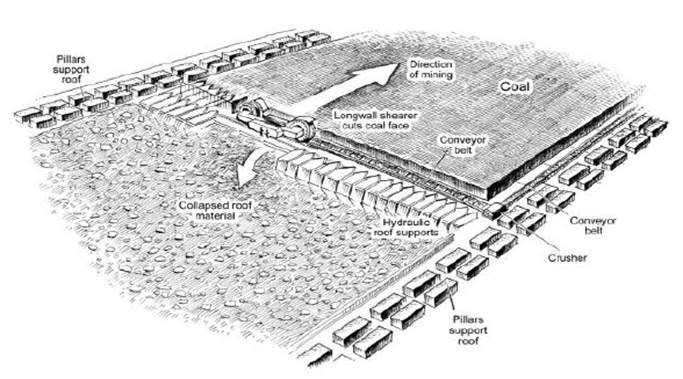
Room-and-Room‑and‑Pillar Mining. Room-and-pillar Room‑and‑pillar mining is effective for small blocks of thin coal seams. In room-and-pillarroom‑and‑pillar mining, a network of rooms is cut into the coal seam, leaving a series of pillars of coal to support the roof of the mine. Continuous miners are used to cut the coal and shuttle cars are used to transport the coal to a conveyor belt for further transportation to the surface. The pillars generated as part of this mining method can constitute up to 40% of the total coal in a seam. Higher seam recovery rates can be achieved if retreat mining is used. In retreat mining, coal is mined from the pillars as workers retreat. As retreat mining occurs, the roof is allowed to collapse in a controlled fashion.11 room-and-pillarroom‑and‑pillar mining techniques: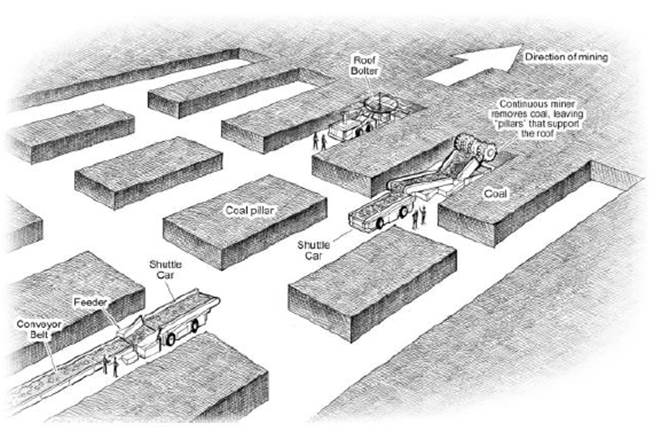

The majorityAll of our mining operations in the Appalachia region use a coal preparation plant located near the mine or connected to the mine by a conveyor. These coal preparation plants allow us to treat the coal we extract from those mines to ensure a consistent quality and to enhance its suitability for particular end-users.end‑users. In addition, depending on coal quality and customer requirements, we may blend coal mined from different locations, including coal produced by third parties, in order to achieve a more suitable product.pre-determinedpre‑determined specific gravity. Since coal is lighter than its impurities, it floats, and we can separate it from rock and shale. We treat intermediate sized particles with dense medium cyclones, in which a liquid is spun at high speeds to separate coal from rock. Fine coal is treated in spirals, in which the differences in density between coal and rock allow them, when suspended in water, to be separated. Ultra fine coal is recovered in column flotation cells utilizing the differences in surface chemistry between coal and rock. By injecting stable air bubbles through a suspension of ultra fine coal and rock, the coal particles adhere to the bubbles and rise to the surface of the column where they are removed. To minimize the moisture content in coal, we process most coal sizes through centrifuges. A centrifuge spins coal very quickly, causing water accompanying the coal to separate.“—Our“Our Mining Operations” below..12 2015,2017, we operated or contracted out the operation of, 139 active mines in the United States. OurThe Company’s reportable business segments are based on two distinct lines of business, metallurgical coal and thermal coal, and may include a number of mine complexes. The Company manages its coal sales by market, not by individual mining complex. Geology, coal transportation routes to customers, and regulatory environments also have a significant impact on our marketing and operations management. Our mining operations are evaluated based on Adjusted EBITDAR, per-ton cash operating costs (defined as including all mining costs except depreciation, depletion, amortization, accretion on asset retirements obligations, and pass-through transportation expenses), and on other non-financial measures, such as safety and environmental performance. Adjusted EBITDAR is defined as net income attributable to the major coal producing basinsCompany before the effect of net interest expense, income taxes, depreciation, depletion and amortization, the amortization of sales contracts, the accretion on asset retirement obligations, and reorganization items, net. Adjusted EBITDAR may also be adjusted for items that may not reflect the trend of future results by excluding transactions that are not indicative of our core operating performance. We use Adjusted EBITDAR to measure the operating performance of our segments and allocate resources to our segments. Adjusted EBITDAR is not a measure of financial performance in which we operate. Ouraccordance with generally accepted accounting principles, and items excluded from Adjusted EBITDAR are significant in understanding and assessing our financial condition. Therefore, Adjusted EBITDAR should not be considered in isolation, nor as an alternative to net income, income from operations, cash flows from operations or as a measure of our profitability, liquidity or performance under generally accepted accounting principles. Furthermore, analogous measures are used by industry analysts to evaluate the Company’s operating performance. Investors should be aware that our presentation of Adjusted EBITDAR may not be comparable to similarly titled measures used by other companies. The Company’s reportable segments are the Powder River Basin (PRB) segment withcontaining the Company’s primary thermal operations in Wyoming; and the AppalachiaMetallurgical (MET) segment, withcontaining the Company’s metallurgical operations in West Virginia Kentucky, Maryland and Virginia. We also sell coal fromthe Other Thermal segment containing the Company’s supplementary thermal operations in Colorado, Illinois, and Illinois. Geology, coal transportation routes to consumers, regulatory environments and coal quality can vary from segment to segment. We incorporate by reference the Coal Mac thermal operation in West Virginia. For additional information about the operating results of each of our segments for the yearsyear ended December 31, 2017, the periods October 2 through December 31, 2016, January 1 through October 1, 2016 and the year ended December 31, 2015, 2014, and 2013 contained insee Note 27 beginning on page F-52.ocean-goingocean‑going vessels from terminal facilities. We currently own or lease under long-termlong‑term arrangements a substantial portionall of the equipment utilized in our mining operations. We employ sophisticated preventative maintenance and rebuild programs and upgrade our equipment to ensure that it is productive, well-maintainedwell‑maintained and cost-competitive.The following map shows the locationscost‑competitive.13 2015,2017, including the total sales associated with these complexes for the yearsyear ended December 31, 2013, 2014,2017, the periods October 2 through December 31, 2016, January 1 through October 1, 2016 and the year ended December 31, 2015 and the total reserves associated with these complexes at December 31, 2015.2017. The amount disclosed below for the total cost of property, plant and equipment of each mining complex does not include the costs of the coal reserves that we have assigned to an individual complex.
Property,
Plant and
Equipment at
December 31, Predecessor Successor Mining Complex Captive Mines Mining Equipment Railroad 2015 Jan1-Oct1, 2016 Oct2-Dec31, 2016 2017 Total Cost of Property, Plant and Equipment at December 31, 2017 Total Assigned Recoverable Reserves (Million tons) ($ millions) (Million tons) Powder River Basin: Black Thunder S D, S UP/BN 99.5 49.0 18.9 70.5 $ 266.7 896.4 Coal Creek S D, S UP/BN 7.8 5.5 2.7 9.0 43.5 128.4 Metallurgical: Mountain Laurel U LW, CM CSX 2.0 1.2 0.4 1.5 25.2 21.1 Beckley U CM CSX 0.9 0.7 0.3 1.0 38.7 25.4 Sentinel U CM CSX 0.9 0.8 0.3 1.5 37.5 4.7 Leer U LW, CM CSX 2.9 3.1 1.0 3.2 217.0 30.8 Other Thermal: West Elk U LW, CM UP 5.1 2.4 1.6 4.9 38.6 53.1 Viper U CM — 2.1 1.3 0.3 1.7 25.0 34.6 Coal‑Mac S L, E NS/CSX 2.4 1.5 0.5 2.4 30.8 22.7 Totals 123.6 65.5 26.0 95.7 $ 723.0 1,217.2 S = Surface mine Northern-SantaNorthern‑Santa Fe Railway(1) Tons of coal we purchased from third parties that were not processed through our loadout facilities are not included in the amounts shown in the table above. 14 (1) Amounts in parentheses indicate the numbercaptive and contract mines, if more than one, at the mining complex as of December 31, 2015. Captive mines are mines that we own and operate on land owned or leased by us. Contract mines are mines that other operators mine for us under contracts on land owned or leased by us.(2) Tons of coal we purchased from third parties that were not processed through our loadout facilities are not included in the amounts shown in the table above.(3) 2013 tons sold numbers do not include tons of coal sold from the following mining complexes that were sold in the 2013 calendar year: Dugout Canyon, Skyline and Sufco. We sold 5.3 million tons of coal from these mining complexes in 2013. 2013 and 2014 tons sold numbers do not include tons of coal sold from the Hazard mining complex, which was sold in 2014, or tons of coal sold from the Cumberland River mining complex, which was idledin 2014. We sold 2.7 million and 0.8 million tons of coal from these two mining complexes in 2013 and 2014, respectively.steamthermal coal from the Upper Wyodak and Main Wyodak seams.1.2 billion896.4 million tons of proven and probable reserves at December 31, 2015.2017. The air quality permit for the Black Thunder mine allows for the mining of coal at a rate of 190 million tons per year. Several large tracts of coal adjacent to the Black Thunder mining complex have been nominated for lease, and other potential large areas of unleased coal remain available for nomination by us or other mining operations. The U.S. Department of Interior Bureau of Land Management, which we refer to as the BLM, will determine if the tracts will be leased and, if so, the final boundaries of, and the coal tonnage for, these tracts.15,000-ton15,000‑ton train in less than two hours.steamthermal coal from the Wyodak-R1Wyodak‑R1 and Wyodak-R3Wyodak‑R3 seams.153.7128.4 million tons of proven and probable reserves at December 31, 2015.2017. The air quality permit for the Coal Creek mine allows for the mining of coal at a rate of 50 million tons per year.areasarea and a loadout facility. We ship all of the coal raw to our customers via the Burlington Northern Santa Fe and Union Pacific railroads. We do not process the coal mined at this complex. The loadout facility can load a 15,000-ton15,000‑ton train in less than three hours.AppalachiaMountain Laurel.Coal-Mac. Coal-Mac Mountain Laurel is an underground mining complex located on approximately 38,200 acres in Logan County and Boone County, West Virginia. Underground mining operations at the Mountain Laurel mining complex extract High-vol B metallurgical coal from the Cedar Grove and Alma seams. The Mountain Laurel mining complex has approximately 21.1 million tons of proven and probable reserves at December 31, 2017.15 Coal-MacCoal‑Mac mining complex extract steamthermal coal primarily from the Coalburg and Stockton seams.Coal-MacCoal‑Mac mining complex had approximately 24.622.7 million tons of proven and probable reserves at December 31, 2015.10,000-ton10,000‑ton train in less than four hours. We ship coal trucked to the Holden 22 loadout facility directly to our customers via the CSX railroad. We wash all of the coal transported to the Holden 22 loadout facility at an adjacent 600-ton-per-hour600‑ton‑per‑hour preparation plant. The Holden 22 loadout facility can load a 10,000-ton10,000‑ton train in about four hours.Lone Mountain. Lone Mountain is an underground mining complex located on approximately 54,000 acres in Harlan County, Kentucky and Lee County, Virginia. The Lone Mountain mining complex extracts steam and metallurgical coal from the Kellioka, Darby and Owl seams.We control a significant portion of the coal reserves through private leases. The Lone Mountain mining complex had approximately 10.2 million tons of proven and probable reserves at December 31, 2015.The complex currently consists of three underground mines operating a total of six continuous miner sections. We process coal through a 1,200-ton-per-hour preparation plant. We then ship the coal to our customers via the Norfolk Southern or CSX railroad.Mountain Laurel. Mountain Laurel is an underground and surface mining complex located on approximately 38,200 acres in Logan County and Boone County, West Virginia. Underground mining operations at the Mountain Laurel mining complex extract steam and metallurgical coal from the Cedar Grove and Alma seams. Surface mining operations at the Mountain Laurel mining complex extract coal from a number of different splits of the Five Block, Stockton and Coalburg seams.The complex currently consists of one underground mine operating a longwall and one continuous miner sections, a preparation plant and a loadout facility. We process most of the coal through a 2,100-ton-per-hour preparation plant before shipping the coal to our customers via the CSX railroad. The loadout facility can load a 15,000-ton train in less than four hours.Beckley. The Beckley mining complex is located on approximately 15,400 acres in Raleigh County, West Virginia. Beckley is extracting high quality, low-volatile metallurgical coal in the Pocahontas No. 3 seam.Coal is belted from the mine to a 600-ton-per-hour preparation plant before shipping the coal via the CSX railroad. The loadout facility can load a 10,000-ton train in less than four hours.Vindex. The Vindex mining complex consists of a surface mine located on approximately 40,300 acres in Maryland and West Virginia. Mining operations extract coal from the Upper Freeport, Middle Kittanning, Pittsburgh, Little Pittsburgh and Redstone seams. Coal is sold on a raw basis and trucked directly to the customer. This operation had been idled effective March 1, 2016 and is currently in reclamation.Sentinel. The Sentinel mining complex consists of one underground mine, a preparation plant and a loadout facility located on approximately 25,600 acres in Barbour County, West Virginia. Mining operations currently extract coal from the Clarion coal seam. Coal from the Sentinel mining complex is processed through the preparation plant and shipped by CSX rail to customers.Leer. The Leer Complex, located in Taylor County, West Virginia, includes approximately 40.1 million tons of coal reserves as of December 31, 2015 and has both steam and metallurgical quality coal in the Lower Kittanning seam, and is part of approximately 79,400 acres that is considered our Tygart Valley area. Substantially all of the reserves at Leer are owned rather than leased from third parties.The Leer Complex is designed to have 3.5 million tons of capacity per year of high quality coal that is well suited to both the high volatile metallurgical and utility markets. All the production is processed through a 1,400 ton-per-hour preparation plant and loaded on the CSX railroad. A 15,000-ton train can be loaded in less than four hours. Without the addition of more coal reserves, the current reserves could sustain the longwall mine at current production levels until about 2029 and support continuous miner production until 2035.OtherWest Elk. West Elk is an underground mining complex located on approximately 17,800 acres in Gunnison County, Colorado. The West Elk mining complex extracts steam coal from the E seam.We control a significant portion of the coal reserves through federal and state leases. The West Elk mining complex had approximately 53.5 million tons of proven and probable reserves at December 31, 2015.The West Elk complex currently consists of a longwall, continuous miner sections and a loadout facility. We ship most of the coal raw to our customers via the Union Pacific railroad. The loadout facility can load an 11,000-ton train in less than three hours.Viper. The Viper mining complex consists of one underground coal mine and a preparation plant located on approximately 46,500 acres in central Illinois near the city of Springfield. Mining operations extract steam coal from the Illinois No. 5 seam, also referred to as the Springfield seam. All coal is processed through an 800 ton-per-hour preparation plant and shipped to customers by on-highway trucks.We control a significant portion of the coal reserves through private leases. As of December 31, 2015, we had approximately 37.2 million tons of proven and probable reserves.carbonheat and lower ash content generally result in higher prices, and higher sulfur and higher ash content generally result in lower prices within a given geographic region.certainone of our Appalachian mines. This is the case because of the higher capital costs, including costs for construction of extensive ventilation systems, and higher per unit labor costs due to lower productivity associated with underground mining.smaller groups of sales personnelrepresentatives in our Singapore and London offices. In addition to selling coal produced infrom our mining complexes, from time to time we purchase and sell coal mined by others, some of which we blend with coal produced from our mines. We focus on meeting the needs and specifications of our customers rather than just selling our coal production.steamthermal and metallurgical coal to steel producers, domestic and foreign utilities, steel producerspower generators, and other industrial facilities. For the year ended December 31, 2015,2017, we derived approximately 18%17% of our total coal revenues from sales to our three largest customers, U.S.United States Steel Corporation, ArcelorMittal and Southern Company and Tennessee Valley Authority - and approximately 39%41% of our total coal revenues from sales to our 10 largest customers.16 2015,2017, we sold coal to domestic customers located in 3635 different states. The locations of our mines enable us to ship coal to most of the major coal-fueled power plants in the United States.20152017 we also exported coal to Europe, Asia, North America (outside the United States), Central and South America.America and Africa. Exports to foreign countries were $0.4$0.8 billion $0.6, $0.5 billion and $0.8$0.4 billion for the years ended December 31, 2015, 20142017, 2016 and 2013,2015, respectively. As of December 31, 20152017 and 2014,2016, trade receivables related to metallurgical-qualitymetallurgical‑quality coal sales totaled $32.8$99.4 million and $76.0$88.0 million, respectively, or 28%58% and 48% of total trade receivables.receivables, respectively. We do not have foreign currency exposure for our international sales as all sales are denominated and settled in U.S. dollars.2015,2017, were as follows:(In thousands) Europe $ 388,926 Asia 264,503 North America 88,145 Central and South America 30,982 Africa 14,901 Brokered Sales 6,137 Total $ 793,594 2015,2017, we sold approximately 68%66% of our coal under long-term supply arrangements. The majority of our supply contracts include a fixed price for the term of the agreement or a pre-determined escalation in price for each year. Some of our long-term supply agreements may include a variable pricing system. While most of our sales contracts are for terms of one to five years, some are as short as one month and other contracts have terms exceeding five years. At December 31, 2015,2017, the average volume-weightedvolume‑weighted remaining term of our long-term contracts was approximately 2.122.3 years, with remaining terms ranging from one to P5Yfour years. At December 31, 2015,2017, remaining tons under long-term supply agreements, including those subject to price re-opener or extension provisions, were approximately 144108 million tons.long-termlong‑term arrangements through a “request-for-proposal”“request‑for‑proposal” process. The terms of our coal sales agreements result from competitive bidding and negotiations with customers. Consequently, the terms of these contracts vary by customer, including base price adjustment features, price re-openerre‑opener terms, coal quality requirements, quantity parameters, permitted sources of supply, future regulatory changes, extension options, force majeure, termination, damages and assignment provisions. Our long-termlong‑term supply contracts typically contain provisions to adjust the base price due to new statutes, ordinances or regulations. We typically sell our metallurgical coal to non-North American customers based on various indices or agreements to mutually negotiate the price. These agreements generally are for one year and can reset pricing with each shipment. Additionally, some of our contracts contain provisions that allow for the recovery of costs affected by modifications or changes in the interpretations or application of any applicable statute by local, state or federal government authorities. These provisions only apply to the base price of coal contained in these supply contracts. In some circumstances, a significant adjustment in base price can lead to termination of the contract.re-openerre‑opener provisions that may allow a party to commence a renegotiation of the contract price at a pre-determinedpre‑determined time. Price re-openerre‑opener provisions may automatically set a new price based on prevailing market price or, in some instances, require us to negotiate a new price, sometimes within a specified range of prices. In a limited number of agreements, if the parties do not agree on a new price, either party has an option to terminatesuspend the contract.agreement for the pricing period not agreed to. In addition, certain of our contracts contain clauses that may allow customers to terminate the contract in the event of certain changes in environmental laws and regulations that impact their operations.17 third-partythird‑party mines, as long as the replacement coal meets quality specifications and will be sold at the same equivalent delivered cost.non-coalnon‑coal materials being included with our coal while on our property.coal-relatedcoal‑related commodities and contracts for those commodities in order to manage and hedge volumes and/or prices associated with our coal sales or purchase commitments, reduce our exposure to the volatility of market prices or augment the value of our portfolio of traditional assets. These strategies may include physical coal contracts, as well as a variety of forward, futures or options contracts, swap agreements or other financial instruments.2015. vessels or trucks, or a combination of these means of transportation. We generally sell coal used for domestic consumption free on board (f.o.b.) at the mine or nearest loading facility. Our domestic customers normally bear the costs of transporting coal by rail, barge or vessel.long-termlong‑term shipping contracts with rail, trucking or barge companies to assure stable delivery costs. Transportation can be a large component of a purchaser’s total cost. Although the purchaser pays the freight, transportation costs still are important to coal mining companies because the purchaser may choose a supplier largely based on cost of transportation. Transportation costs borne by the customer vary greatly based on each customer’s proximity to the mine and our proximity to the loadout facilities. Trucks and overland conveyors haul coal over shorter distances, while barges, Great Lake carriers and ocean vessels move coal to export markets and domestic markets requiring shipment over the Great Lakes and several river systems.Northern-SantaNorthern‑Santa Fe railroad and the Union Pacific railroad.railroad; and our Coal Mac mine is served by both the CSX and Norfolk Souther railroads.. We generally transport coal produced at our Appalachian mining complexes via the CSX railroad or the Norfolk Southern railroad. Besides rail deliveries, some customers in the eastern United States rely on a river barge system.18 thean export terminal, and we are usually responsible for the cost of transporting coal to the export terminals. In some cases we may enter into long-term throughput agreements with export terminals that contain minimum throughput obligations. In the event we do not meet those minimum thresholds, we may be obligated to pay liquidated damage amounts to such terminals. We transport our coal to Atlantic coast terminals, Pacific cost terminals or terminals along the Gulf of Mexico for transportation to international customers. Our international customers are generally responsible for paying the cost of ocean freight. We may also sell coal to international customers delivered to an unloading facility at the destination country.22%35% interest in Dominion Terminal Associates, a partnership that operates a ground storage-to-vesselstorage‑to‑vessel coal transloading facility in Newport News, Virginia. The facility has a rated throughput capacity of 20 million tons of coal per year and ground storage capacity of approximately 1.7 million tons. The facility primarily serves international customers, as well as domestic coal users located along the Atlantic coast of the United States.We also own From time-to-time, we may lease a 38% interest in Millennium Bulk Terminals-Longview, LLC (MBT), the ownerportion of a bulk commodity terminal on the Columbia River near Longview, Washington. MBT is currently workingour port capacity to obtain the required approvals and necessary permits to complete upgrades to enable coal shipments through the brownfield terminal.Alpha Natural Resources, Inc.Blackhawk Mining LLC, Blackjewel LLC, Contura Energy, Coronado Coal LLC, Corsa Coal Corp., Cloud Peak Energy, CONSOL Energy Inc. and Peabody Energy Corp. and Ramaco Resources. Some of these coal producers are larger than we are and have greater financial resources and larger reserve bases than we do. We also compete directly with a number of smaller producers in each of the geographic regions in which we operate, as well as companies that produce coal from one or more foreign countries, such as Australia, Colombia, Indonesia and South Africa.petroleum-basedpetroleum‑based fuels, explosives, tires, steel and other raw materials as well as spare parts and other consumables used in the mining process. We use third-partythird‑party suppliers for a significant portion of our equipment rebuilds and repairs, drilling services and construction. We use sole source suppliers for certain parts of our business such as explosives and fuel, and preferred suppliers for other parts of our business such as dragline and shovel parts and related services. We believe adequate substitute suppliers are available. For more information about our suppliers, you should see Item 1A, “Risk Factors-Increases in the costs of mining and other industrial supplies, including steel-basedsteel‑based supplies, diesel fuel and rubber tires, or the inability to obtain a sufficient quantity of those supplies, could negatively affect our operating costs or disrupt or delay our production.”While it is not possible to accurately quantify the expendituresExpenditures we incur to maintain compliance with all applicable federal and state laws those costs have been and are expected to continue to be significant. Federal and state mining laws and regulations require us to obtain surety bonds to guarantee performance or payment of certain long-termlong‑term obligations, including mine closure and reclamation costs, federal and state workers’ compensation benefits, coal19 re-examinere‑examine and reinterpret the regulations finalized eleven months earlier. On February 20, 2014, the federal court vacated the 2008 rule. On December 22, 2014, OSMreinstatereinstated the previous version of the rule, but dodid not announce a new interpretation of the rule regarding the ability to construct excess spoil fills. We cannot predict howOn December 19, 2016, OSM finalized the regulations will be applied or how they may affect coal production, though there are reports that any reinterpretation of the prior“Stream Protection Rule,” a re-written version of the stream buffer zone rule which would have required coal operators to restrict mining within 100 feet of waterways. The rule would behave also required states to restrict theimpose additional information gathering and monitoring at and around coal mining sties and would have mandated new financial assurance and reclamation requirements. This rule could have restricted coal producers’ ability to construct mining related structures in streams. Such an interpretationdevelop new mines, or could curtailhave required coal producers to modify existing operations, curtailing surface miningmine operations in and near streams-especiallystreams, especially in central Appalachia.20 pre-miningpre‑mining environmental conditions of the permit area. This work is typically conducted by third-partythird‑party consultants with specialized expertise and includes surveys and/or assessments of the following: cultural and historical resources; geology; soils; vegetation; aquatic organisms; wildlife; potential for threatened, endangered or other special status species; surface and ground water hydrology; climatology; riverine and riparian habitat; and wetlands. The geologic data and information derived from the other surveys and/or assessments are used to develop the mining and reclamation plans presented in the permit application. The mining and reclamation plans address the provisions and performance standards of the state’s equivalent SMCRA regulatory program, and are also used to support applications for other authorizations and/or permits required to conduct coal mining activities. Also included in the permit application is information used for documenting surface and mineral ownership, variance requests, access roads, bonding information, mining methods, mining phases, other agreements that may relate to coal, other minerals, oil and gas rights, water rights, permitted areas, and ownership and control information required to determine compliance with OSM’s Applicant Violator System, including the mining and compliance history of officers, directors and principal owners of the entity.2015,2017, we recorded $32.7$24.6 million of expense related to these reclamation fees.long-termlong‑term obligations including mine closure or reclamation costs, federal and state workers’ compensation costs, coal leases and other miscellaneous obligations. Although surety bonds are usually noncancelable during their term, many of these bonds are renewable on an annual basis. Please see “Failure to obtain or renew surety bonds on acceptable terms could affect our ability to secure reclamation and coal lease obligations and, therefore, our ability to mine or lease coal, and a loss or reduction in our ability to self-bond could have a material adverse effect on our business and results of operations,” contained under the heading Risk Factors—Risks related to Our Operations for a discussion of certain risks associated with our surety bonds.become more unfavorable tohardened for mine operators. These changes in the terms of the bonds have been accompanied at times by aIn order to address some of these uncertainties, we use self-bonding to secure performance of certain obligations in Wyoming. As of December 31, 2015,2017, we have self-bonded an aggregate of approximately $485.5 million, posted an aggregate of approximately $188.0$531.7 million in surety bonds for reclamation purposes and secured $49.2$10.0 million in letters of credit and cash for reclamation bonding obligations. In addition, we had approximately $212.0$161.6 million of surety bonds, cash and letters of credit outstanding at December 31, 20152017 to secure workers’ compensation, coal lease and other obligations. In reaction to recent mine accidents, federal and state legislatures and regulatory authorities have increased scrutiny21 · development of new emergency response plans that address post-accident communications, tracking of miners, breathable air, lifelines, training and communication with local emergency response personnel;· establishment of additional requirements for mine rescue teams;· notification of federal authorities in the event of certain events;· increased penalties for violations of the applicable federal laws and regulations; and· requirement that standards be implemented regarding the manner in which closed areas of underground mines are sealed.In 2008, the U.S. House of Representatives approved additional federal legislation which would have required new regulations on a variety of mine safety issues such as underground refuges, mine ventilation and communication systems. Although the U.S. Senate failed to pass that legislation, it is possible that similar legislation may be proposed in the future. Various states, including West Virginia, have also enacted laws to address many of the same subjects. The costs of implementing these safety and health regulations at the federal and state level have been, and will continue to be, substantial. In addition to the cost of implementation, there are increased penalties for violations which may also be substantial. Expanded enforcement has resulted in a proliferation of litigation regarding citations and orders issued as a result of the regulations.2015,2017, we recorded $66.1$48.7 million of expense related to this excise tax.coal-fueledcoal‑fueled power plants and industrial boilers, which are the largest end-usersend‑users of our coal. Continued tightening of the already stringent regulation of emissions is likely, such as the Mercury and Air Toxics Standard (MATS), finalized in 2011 and discussed in more detail below. In addition, the U.S. Environmental Protection Agency, which we refer to as the EPA, has issued regulations on additional emissions, such as greenhouse gases (GHG)(GHG’s), from new, modified, reconstructed and existing electric generating units, including coal-fired plants. Other GHG regulations apply to industrial boilers (see discussion of Climate Change, below). These regulations could eventually reduce the demand for coal.·Acid Rain. Title IV of the Clean Air Act, promulgated in 1990, imposed a two-phasetwo‑phase reduction of sulfur dioxide emissions by electric utilities. Phase II became effective in 2000 and applies to all coal-fueledcoal‑fueled power plants with a capacity of more than 25-megawatts.25‑megawatts. Generally, the affected power plants have sought to comply with these requirements by switching to lower sulfur fuels, installing pollution control devices, reducing electricity generating levels or purchasing or trading sulfur dioxide emissions allowances. Although we cannot accurately predict the future effect of this Clean Air Act provision on our operations, we believe that implementation of Phase II has been factored into the pricing of the coal market.·Particulate Matter. The Clean Air Act requires the EPA to set national ambient air quality standards, which we refer to as NAAQS, for certain pollutants associated with the combustion of coal, including sulfur dioxide, particulate matter, nitrogen oxides and ozone. Areas that are not in compliance with these standards, referred to as non-attainmentnon‑attainment areas, must take steps to reduce emissions levels. For example, NAAQS currently exist for particulate matter measuring 10 micrometers in diameter or smaller (PM10) and for fine particulate matter measuring 2.5 micrometers in diameter or smaller (PM2.5), and the EPA revised the PM2.5 NAAQS on December 14, 2012, making it more stringent. The states were required to make recommendations on nonattainment designations for the new NAAQS in late 2013. The EPA issued final designations for most areas of the country in 2012 and made some revisions in 2015. Individual states must now identify the sources of emissions and develop emission reduction plans. These plans may be state-specificstate‑specific or regional in scope. Under the Clean Air Act, individual states have up to 12 years from the date of designation to secure emissions reductions from sources contributing to the problem. Future regulation and enforcement of the new PM2.5 standard, as well as future revisions of PM standards, will affect many power plants, especially coal-fueledcoal‑fueled power plants, and all plants in non-attainmentnon‑attainment areas.·Ozone. On October 26, 2015, the EPA published a final rule revising the existing primary and secondary NAAQS for ozone, reducing them to 70ppb on an 8-hour average. On November 17, 2016, the EPA has yet to make attainment designations for statesissued a proposed implementation rule on this new standard, but significantnon-attainment area classification an state implementation plans (SIPS). Significant additional emission control expenditures will likely be required at certain coal-fueledcoal‑fueled power plants to meet the new stricter NAAQS. Nitrogen oxides, which are a byproduct of coal combustion, are classified as an ozone precursor. As a result, emissions control requirements for new and expanded coal-fueledcoal‑fueled power plants and industrial boilers will continue to become more demanding in the years ahead. A suit challenging the EPA’s 2015 Ozone NAAQS, Murray Energy Corp. v. EPA, is currently pending in the United States Court of Appeals for the District of Columbia, which we refer to as the D.C. Circuit. However, on April 11, 2017, the D.C. Circuit granted the EPA’s motion, which cites President Trump’s March 28, 2017 Energy Independence Executive Order, to indefinitely delay any decision on the challenges. The new standardEPA did not meet the October 1, 2017 deadline for designating non-attainment areas but, on November 6, 2017, issued final designations for areas in the United States representing approximately 85% of the U.S. counties that would take effect sixty days after the notice is subject22 pending judicial challenge.·NOx SIP Call. The Nitrogen Oxides State Implementation Plan (NOx SIP) Call program was established by the EPA in October 1998 to reduce the transport of ozone on prevailing winds from the Midwest and South to states in the Northeast, which said that they could not meet federal air quality standards because of migrating pollution. The program was designed to reduce nitrous oxide emissions by one million tons per year in 22 eastern states and the District of Columbia. Phase II reductions were required by May 2007. As a result of the program, many power plants were required to install additional emission control measures, such as selective catalytic reduction devices. Installation of additional emission control measures has made it more costly to operate coal-fueledcoal‑fueled power plants, which could make coal a less attractive fuel.·Interstate Transport. The EPA finalized the Clean Air Interstate Rule, which we refer to as CAIR, in March 2005. CAIR called for power plants in 28 Eastern states and the District of Columbia to reduce emission levels of sulfurU.S. Court of Appeals for the District of ColumbiaD.C. Circuit disagreed with the EPA’s reading of the Clean Air Act and vacated CAIR in its entirety. In December 2008, the U.S. Court of Appeals for the District of ColumbiaD.C. Circuit revised its remedy and remanded the rule to the EPA. The EPA proposed a revised transport rule on August 2, 2010 (75 Fed. Reg. 45209) to address attainment of the 1997 ozone NAAQS and the 2006 PM2.5 NAAQS. The rule was finalized as the Cross State Air Pollution Rule (CSAPR) on July 6, 2011, with compliance required for SO2 reductions beginning January 1, 2012 and compliance with NOx reductions required by May 1, 2012. Numerous appeals of the rule were filed and, on August 21, 2012, the Federal Court of Appeals for the District of ColumbiaD.C. Circuit vacated the rule, leaving the EPA to continue implementation of the CAIR. Controls required under the CAIR, especially in conjunction with other rules may have affected the market for coal inasmuch as multiple existing coal fired units were being retired rather than having required controls installed.District of ColumbiaD.C. Circuit decision, remanding the case back to the District of ColumbiaD.C. Circuit. The EPA then requested that the court lift the CSAPR stay and toll the CSAPR compliance deadlines by three years. On October 23, 2014, the District of ColumbiaD.C. Circuit granted the EPA’s request, and that court later dismissed all pending challenges to the rule on July 28, 2015 but it remanded some state budgets to EPA for further consideration. CSAPR Phase 1 implementation began in 2015, with Phase 2 beginning in 2017. CSAPR generally requires greater reductions thatthan under CAIR. As a result, some coal-firedcoal‑fired power plants will be required to install costly pollution controls or shut down which may adversely affect the demand for coal. Finally, in November 2015,October 2016, the EPA proposedissued an update to the CSAPR to address interstate transport of air pollution under the more recent 2008 ozone NAAQS and the state budgets remanded by the D.C. Circuit. EPA received public comment onConsolidated judicial challenges to the rule in January 2016 and will issue a final ruleare now pending, but on August 10, 2017, the D.C. Circuit suspended briefing in the near future. Itlitigation after industry petitioners challenging the rule requested to delay proceedings so EPA can determine whether to reconsider the revised CSAPR. If the rule is upheld, it is likely the final ruleCSAPR update will increase the pressure to install controls or shut down units, which may further adversely affect the demand for coal.·Mercury. In February 2008, the U.S. Court of Appeals for the District of ColumbiaD.C. Circuit vacated the EPA’s Clean Air Mercury Rule (CAMR), which was promulgated to reduce mercury emissions from coal-fired power plants and remanded it to the EPA for reconsideration. In response, the EPA announced an Electric Generating Unit (EGU) Mercury and Air Toxics Standard (MATS) on December 16, 2011. The MATS was finalized April 16, 2012, and required compliance for most plants by 2015. In addition, before the court decision vacating the CAMR, some states had either adopted the CAMR or adopted state-specificstate‑specific rules to regulate mercury emissions from power plants that are more stringent than the CAMR. MATS compliance, coupled with state mercury and air toxics laws and other factors have required many plants to install costly controls, re-fire with natural gas or to retire, which may adversely affect the demand for coal.proposing to re-issue the final rule in April 2016 based on a finding that those costs still justified regulation, and successfully secured an order from the D.C. Circuit to keep the rule in effect while it completed its rulemaking. Petitionerspetitioners unsuccessfully sought a stay of the rule in the Supreme Court in February 2016. In April 2016, the EPA issued a MATS 2016 Supplemental Finding, a final finding that it is appropriate and necessary to set standards for emissions of air toxics from coal- and oil-fired power plants. That finding is now being challenged in court. Therefore, the rule23 which will likely hear challengesdenied petitioners’ motion to EPA’s re-issuancetemporarily halt the pending litigation to allow the new administration to evaluate whether it can resolve any issues raised in the case. However, in April 2017, the EPA requested a delay in the D.C. Circuit proceedings while EPA is reviewing the determinations of the rule based on its new cost considerations.prior administration. Hence, while MATS will likely continue to impact coal-fueled generation as discussed above for at least the near term, and possibly well into the future.·Regional Haze. The EPA has initiated a regional haze program designed to protect and improve visibility at and around national parks, national wilderness areas and international parks, particularly those located in the southwest and southeast United States. Under the Regional Haze Rule, affected states were required to submit regional haze SIPs by December 17, 2007, that, among other things, were to identify facilities that would have to reduce emissions and comply with stricter emission limitations. The vast majority of states failed to submit theirCourt of Appeals on August 3, 2012, against the EPA for failure to enforce the rule (National Parks Conservation Act v. EPA, D.C. Cir). Industry groups, including the Utility Air Regulatory Group have intervened (Utility Air Regulatory Group v. EPA. D.C. Cir 12-12‑1342, 8/6/2012).ReginaRegional Haze Program as it moves toward the next planning period. period, which could be delayed until 2021.coal-fueledcoal‑fueled power plants whose operations may impair visibility at and around federally protected areas. This program may also require certain existing coal-fueledcoal‑fueled power plants to install additional control measures designed to limit haze-causinghaze‑causing emissions, such as sulfur dioxide, nitrogen oxides, volatile organic chemicals and particulate matter. These limitations could affect the future market for coal.·New Source Review. A number of pending regulatory changes and court actions are affecting the scope of the EPA’s new source review program, which under certain circumstances requires existing coal-fueledcoal‑fueled power plants to install the more stringent air emissions control equipment required of new plants. The new source review program is continually revised and such revisions may impact demand for coal nationally, but we are unable to predict the magnitude of the impact.warning,warming, continue to attract significant public and scientific attention. For example, the Fourth and Fifth Assessment Reports of the Intergovernmental Panel on Climate Change have expressed concern about the impacts of human activity, especially from fossil fuel combustion, on global climate issues. As a result of the public and scientific attention, several governmental bodies increasingly are focusing on global climate issues and, more specifically, levels of emissions of carbon dioxide from coal combustion by power plants. Future regulation of greenhouse gas emissions in the United States could occur pursuant to future U.S. treaty obligations, statutory or regulatory changes and the federal, state or local level or otherwise.fromof greenhouse gases. For example, in December 2015, representatives of 195 nations reached a landmark climate accord that will, for the first time, commit participating countries to lowering greenhouse gas emissions. Further, the United States and a number of international development banks, such as the World Bank, the European Investment Bank and European Bank for Reconstruction and Development, have announced that they will no longer provide financing for the development of new coal-fueled power plants, subject to very narrow exceptions.24 within 15 yearsby 2030 relative to 2005 levels through reduction of emissions from coal-burning power plants and increased use of renewable energy and energy conservation methods. Under the Clean Power Plan, states are free to reduce emissions by various means and must submit emissions reduction plans to the EPA by September 2016 or, with an approved extension, September 2018. If a state has not submitted a plan by then, the Clean Power Plan authorizes the EPA to impose its own plan on that state. In order to determine a state’s goal, the EPA has divided the country into three regions based on connected regional electricity grids. States are to implement their plans by focusing on (i) increasing the generation efficiency of existing fossil fuel plants, (ii) substituting lower carbon dioxide emitting natural gas generation for coal-powered generation and (iii) substituting generation from new zero carbon dioxide emitting renewable sources for fossil fuel powered generation. States are permitted to use regionally available low carbon generation sources when substituting for in-state coal generation and coordinate with other states to develop multi-state plans. Following the adoption, 27 states sued the EPA, claiming that the EPA overstepped its legal authority in adopting the Clean Power Plan. In February 2016, the U.S. Supreme Court ordered the EPA to halt enforcement of the Clean Power Plan until a lower court rules on the lawsuit and until the Supreme Court determines whether or not to hear the case. If the Supreme Court does decideIn October 2017, EPA commenced rulemaking proceedings to hear the case, then the stay would remain in effect until the Supreme Court rules. Ifrescind the Clean Power Plan, ultimately is upheldand in its current form, it is projectedDecember 2017, EPA published an Advanced Notice of Proposed Rulemaking announcing an intent to significantly curtailcommence a new rulemaking to replace the construction ofClean Power Plan with an alternative framework for regulating carbon dioxide.coal-firedmodified, and reconstructed power plants under the Clean Air Act. One of the primary issues in these lawsuits is the EPA’s establishment of standards of performance based on technologies including carbon capture and sequestration, which we refer to as CCS. New coal plants cannot meet the new standards unless they implement CCS, which reportedly is not yet commercially available or technically feasible. In conjunction with EPA’s proposal to rescind the Clean Power Plan, EPA also requested a stay of the NSPS litigation. The D.C. Circuit granted the request, and the litigation has been held in abeyance since then.materiallymaterial adverse impact on us. These effects could be more adverse to the demand for coal nationally.25 ·Water Discharge. Section 402 of the Clean Water Act creates a process for establishing effluent limitations for discharges to streams that are protective of water quality standards through the National Pollutant Discharge Elimination System, which we refer to as the NPDES, or an equally stringent program delegated to a state regulatory agency. Regular monitoring, reporting and compliance with performance standards are preconditions for the issuance and renewal of NPDES permits that govern discharges into waters of the United States, especially on selenium, sulfate and specific conductance. Discharges that exceed the limits specified under NPDES permits can lead to the imposition of penalties, and persistent non-compliancenon‑compliance could lead to significant penalties, compliance costs and delays in coal production. In addition, the imposition of future restrictions on the discharge of certain pollutants into waters of the United States could increase the difficulty of obtaining and complying with NPDES permits, which could impose additional time and cost burdens on our operations. You should see Item 3, “Legal Proceedings,” for more information about certain regulatory actions pertaining to our operations.TMDL-relatedTMDL‑related allocations for our coal mines could require more costly water treatment and could adversely affect our coal production.26 anti-degradationanti‑degradation policies to ensure that non-impairednon‑impaired water bodies continue to meet water quality standards. The issuance and renewal of permits for the discharge of pollutants to waters that have been designated as “high quality” are subject to anti-degradationanti‑degradation review that may increase the costs, time and difficulty associated with obtaining and complying with NPDES permits.In 2012, theThe federal district court for the Southern District of West Virginia granted summary judgment to citizenshas ruled in one suchfavor of the citizen suit groups in multiple suits alleging violations of the water quality standard for selenium. In 2014,selenium and in two suits alleging violations of water quality standards due to discharge of conductivity (one of which was upheld on appeal by the same court foundUnited States Court of Appeals for the Fourth Circuit in another such suit thatJanuary 2017). Additional rulings requiring operators to reduce their discharges of selenium, conductivity from two West Virginia mines were causing violations of West Virginia’s narrative water quality standards. Both cases were resolved prior to any appeal and it is difficult to predict whether such suits will continue to be successful.·Dredge and Fill Permits. Many mining activities, such as the development of refuse impoundments, fresh water impoundments, refuse fills, valley fills, and other similar structures, may result in impacts to waters of the United States, including wetlands, streams and, in certain instances, man-mademan‑made conveyances that have a hydrologic connection to such streams or wetlands. Under the Clean Water Act, coal companies are required to obtain a Section 404 permit from the Army Corps of Engineers, which we refer to as the Corps, prior to conducting such mining activities. The Corps is authorized to issue general “nationwide” permits for specific categories of activities that are similar in nature and that are determined to have minimal adverse effects on the environment. Permits issued pursuant to Nationwide Permit 21, which we refer to as NWP 21, generally authorize the disposal of dredged and fill material from surface coal mining activities into waters of the United States, subject to certain restrictions. Since March 2007, permits under NWP 21 were reissued for a five-yearfive‑year period with new provisions intended to strengthen environmental protections. There must be appropriate mitigation in accordance with nationwide general permit conditions rather than less restricted state-requiredstate‑required mitigation requirements, and permit holders must receive explicit authorization from the Corps before proceeding with proposed mining activities.The use of nationwide permits to authorize stream impacts from mining activities has been the subject of significant litigation. Refer to Item 3, “Legal Proceedings,” for more information about certain litigation pertaining to our permits.Currently,. Many mining wastes are excluded from the regulatory definition of hazardous wastes, and coal mining operations covered by SMCRA permits are by statute exempted from RCRA permitting. RCRA also allows the EPA to require corrective action at sites where there is a release of hazardous substances. In addition, each state has its own laws regarding the proper management and disposal of waste material. In June 2010, the EPA released a proposed rule to regulate the disposal of certain coal mine wastes, suchcombustion residuals, which we refer to as overburden and coal cleaning wastes, are exempted from hazardous waste management. In addition, Subtitle CCCR. The proposed rule set forth two very different options for regulating CCR under RCRA. The first option called for regulation of RCRA exempted fossil fuel combustion wastes from hazardous waste regulation until the EPA completedCCR as a report to Congress and made a determination on whether the wastes should be regulated as hazardous. In its 1993 regulatory determination, the EPA addressed some high volume-low toxicity coal combustion products generated at electric utility and independent power producing facilities, such as coal ash, and left the exemption in place. In May 2000, the EPA concluded that coal combustion products do not warrant regulation as hazardous waste under Subtitle C, which creates a comprehensive program of federally enforceable requirements for waste management and disposal. The second option utilized Subtitle D, which would give the EPA authority to set performance standards for waste management facilities and27 again retainednot the hazardous waste exemptionprovisions (Subtitle C) which became effective on October 19, 2015. The final rule establishes national minimum criteria for these wastes. The EPA also determined that national non-hazardous waste regulations under RCRA Subtitle D are needed for coal combustion products disposed inexisting and new CCR landfills, surface impoundments and landfillslateral expansions, and usedalso establishes structural integrity criteria for new and existing surface impoundments (including establishing requirements for owners and operators to conduct periodic structural integrity-related assessments). The criteria include location restrictions, design and operating criteria, groundwater monitoring and corrective action, closure requirements and post-closure care and recordkeeping, notification and internet posting requirements. While classification of CCR as mine-fill. In March of 2007 the Office of Surface Mining and the EPA proposed regulations regarding the management of coal combustion products. The EPA concluded that beneficial uses of these wastes, other than for mine-filling, pose no significant risk and no additional national regulations are needed. As long as this exemption remains in effect, it is not anticipated that regulation of coal combustion waste will have any material effect on the amount of coal used by electricity generators. A final rule has not been promulgated. Most statea hazardous waste laws also exempt coal combustion products,would have led to more stringent restrictions and instead treat it as either a solid waste or a special waste. Anyhigher costs, associated with handling or disposal of hazardous wastes wouldthis regulation may still increase our customers’customers' operating costs and potentially reduce their ability to purchase coal. In addition, contamination caused by the past disposal of CCR, including coal ash, cancould lead to material liability.citizen suit enforcement against our customers under RCRA or other federal or state laws and potentially reduce the demand for coal. In another development regarding coal combustion wastes, the EPA conducted an assessment of impoundments and other units that manage residuals from coal combustion and that contain free liquids following a massive coal ash spill in Tennessee in 2008, the EPA contractors conducted site assessments at many impoundments and is requiring appropriate remedial action at any facility that is found to have a unit posing a risk for potential failure. The EPA is posting utility responses to the assessment on its web site as the responses are received. After industry groups filed a suit in the D.C. Circuit, challenging the 2015 rule, EPA Administrator Pruitt issued a letter on September 13, 2017 indicating the agency’s decision to reconsider the rule in response to industry petitions. On September 27, 2017, oral arguments in the litigation were rescheduled for November 20, 2017. The court also ordered EPA file a status report by November 15, 2017 specifying which provisions of the final rule are or are likely to be subject to reconsideration and estimated timeline for reconsideration. The court also ordered the parties to file supplemental briefs addressing the relevance to and the implications for the Water Infrastructure Improvements for the Nation Act, Pub. L. No. 114-322. Future regulations resulting from the EPA coal combustion refuse assessments may impact the ability of the Company’s utility customers to continue to use coal in their power plants.pre-blastpre‑blast surveys and blast monitoring. In addition, the storage of explosives is subject to strict regulatory requirements established by four different federal regulatory agencies. For example, pursuant to a rule issued by the Department of Homeland Security in 2007, facilities in possession of chemicals of interest, including ammonium nitrate at certain threshold levels, must complete a screening review in order to help determine whether there is a high level of security risk such that a security vulnerability assessment and site security plan will be required.28 Right-to-KnowRight‑to‑Know Act.2015,2017, we employed approximately 4,6553,790 full and part-timepart‑time employees. We believe that our relations with all employees are good.29 29, 201623, 2018 and their positions and offices during the last five years:NameAgePositionName Age Position Kenneth D. Cochran 57 55boardsboard of Millennium Bulk Terminals-Longview, LLC, Knight Hawk Holdings, LLC, and Tongue River Holding Company.48 462008 and as our principal accounting officer since January 2016.2008. Mr. Drexler served as our Vice President-Finance and Accounting from 2006 to 2008. From 2005 to 2006, Mr. Drexler served as our Director of Planning and Forecasting. Prior to 2005, Mr. Drexler held several other positions within our finance and accounting department.60 58was electedhas served as our Chief Executive Officer since 2012. Mr. Eaves served as our Chairman of the Board in Aprilfrom 2015 to 2016 and currently serves as our Chairman and Chief Executive Officer. Mr. Eaves served as our President and Chief Operating Officer from 2006 until he was elected as our Chief Executive Officer in Aprilto 2012. From 2002 to 2006, Mr. Eaves served as our Executive Vice President and Chief Operating Officer. Mr. Eaves currently serves on the boards of COALOGIX,the National Association of Manufacturers, the National Mining Association the Business Roundtable, the American Coalition for Clean Coal Electricity and the Business Council.CF Industries Holdings, Inc. Mr. Eaves was previously a director of Advanced Emissions Solutions, Inc. and former chairman of the National Coal Council.61 5957 5557 55Arch Coal, Inc., Advanced Emissions Solutions, Inc. and Knight Hawk Holdings, LLC. Mr. Lang also servesserved on the development board of the Mining Department of the Missouri University of Science & Technology, and is the former chairman of the University of Wyoming’s School of Energy Resources Council.54 52a directorthe Vice Chair of Millennium Bulk Terminals-Longview and DKRW Advanced Fuels. In addition, Mr. Slone serves asthe National Coal Council, the immediate past co-chair of the CoalCarbon Utilization Research Council, as National Coal Council Policy Committee chair and as a memberthe Chair of the steering committee of the Consortium for Clean Coal Utilization at Washington University in St. Louis.51 4930 1-800-SEC-03301‑800‑SEC‑0330 for further information on the public reference room.994-2700994‑2700 or by mail at Arch Coal, Inc., One CityPlace Drive, Suite 300, St. Louis, Missouri, 63141 Attention: Senior Vice President-Strategy and Public Policy. The information on our website is not part of this Annual Report on Form 10-K.31 Assigned reserves BrownBituminous coalof gross calorificused primarily to generate electricity and to make coke for the steel industry with a heat value of less than 5700 kilocaloriesranging between 10,500 and 15,500 Btus per kilogramme (kcal/kg), which includes lignite and sub-bituminous coal where lignite has a gross calorific value of less than 4165 kcal/kg and sub-bituminous coal has a gross calorific value between 4165 kcal/kg and 5700 kcal/kg.Coal used to produce coke, the primary source of carbon used in steelmaking. Compliance coal Coal with the lowest carbon content and a heat value ranging between 4,000 and 8,300 Btus per pound. Longwall mining Low-sulfurLow‑sulfur coalCoal used in steel production either as coking coal or pulverized coal injection (PCI). Preparation plant ReclamationCoal that is introduced directly into the blast furnace as a source of energy and carbon in the steelmaking process. Reclamation Room-and-pillarSubbituminous coalCoal used primarily to generate electricity with a heat value ranging between 8,300 and 13,000 Btus per pound. Room‑and‑pillar mining 32 Our Chapter 11 CasesAs a resultEmergence from Bankruptcy Protectionfiling of the Bankruptcy Petitions, we are subject to the risks and uncertainties associated with bankruptcy proceedings, and operating under Chapter 11 may restrict our ability to pursue strategic and operational initiatives.For the duration of the Chapter 11 Cases (In re Arch Coal, Inc., et al.), our operations and our ability to execute our business strategy will be subject to the risks and uncertainties associated with bankruptcy. These risks include:· our ability to obtain Court approval with respect to motions filed in the Chapter 11 Cases from time to time;· our ability to comply with and operate under any cash management orders entered by the Court from time to time;· our ability to comply with our Restructuring Support Agreement and DIP Credit Agreement terms and conditions;· our ability to confirm and consummate a Chapter 11 plan of reorganization;· our ability to fund and execute our business plan; and· our ability to continue as a going concern.These risks and uncertainties could affect our business and operations in various ways. For example, negative events or publicity associated with the Chapter 11 Cases could adversely affect our relationships with our suppliers, customers and employees. In particular, critical vendors may determine not to do business with us due to our Chapter 11 filing and we may not be successful in securing alternative sources. Also, transactions outside the ordinary course of business are subject to the prior approval of the Court, which may limit our ability to respond timely to certain events or take advantage of opportunities. Because of the risks and uncertainties associated with the Chapter 11 Cases, we cannot predict or quantify the ultimate impact that events occurring during the Chapter 11 reorganization process may have on our business, financial condition and results of operations, and there is no certainty as to our ability to continue as a going concern.Under Chapter 11, transactions outside the ordinary course of business are subject to the prior approval of the Court, which may limit our ability to respond in a timely manner to certain events or take advantage of certain opportunities. Additionally, the terms of the DIP Credit Agreement require us to comply with certain financial maintenance covenants, including (i) maximum capital expenditures and (ii) minimum unrestricted cash and cash equivalents. The DIP Credit Agreement also contains customary affirmative and negative covenants for debtor-in-possession financings, which include restrictions on (i) indebtedness, (ii) liens and guaranties, (iii) liquidations, mergers, consolidations, acquisitions, (iv) disposition of assets or subsidiaries, (v) affiliate transactions, (vi) creation or ownership of certain subsidiaries, partnerships and joint ventures, (vii) continuation of or change in business, (viii) restricted payments, (ix) sanctions and anti-corruption matters, (x) no restriction in agreements on dividends or certain loans, (xi) loans and investments, (xii) transactions with respect to Bonding Subsidiaries and (xiii) hedging transactions. In addition, the DIP Credit Agreement contains milestones relating to the Chapter 11 Cases. Our ability to comply with these provisions may be affected by events beyond our control and our failure to comply could result in an event of default under the DIP Credit Agreement.Trading in our securities during the pendency of the Chapter 11 Cases is highly speculative and poses substantial risks. We expect that the existing common stock of the Company will be extinguished and existing equity holders will not receive consideration in respect of their equity interests.On the Petition Date, the NYSE determined that the Company’s stock (NYSE: ACI) was no longer suitable for listing pursuant to Section 8.02.01D of the NYSE continued listing standards and trading in the Company’s common stock was suspended on January 11, 2016. We expect that the existing common stock of the Company will be extinguished upon theCompany’s emergence from Chapter 11 and existing equity holders will not receive consideration in respect of their equity interests. Following delisting from the NYSE, Arch common stock has been traded over the counter in the Pink Sheets, but this may not always be the case. The delisting by the NYSE could result in significantly lower trading volumes and reduced liquidity for investors seeking to buy or sell shares of our common stock.Arch’s Restructuring Support Agreement provides that, upon the Company’s emergence from Chapter 11, Arch’s existing stock will be cancelled and the senior lenders will receive the substantial majority of the new stock in the reorganized Arch. If a plan of reorganization is approved in the Chapter 11 Cases, it is likely that our existing common stock will be extinguished, and existing equity holders will likely not receive consideration in respect of their existing equity interests.The pursuit of the Chapter 11 Cases has consumed and will continue to consume a substantial portion of the time and attention of our management, which may have an adverse effect on our business and results of operations, and we may face increased levels of employee attrition.While the Chapter 11 Cases continue, our management will be required to spend a significant amount of time and effort focusing on the cases. This diversion of attention may materially adversely affect the conduct of our business, and, as a result, onPlan, our financial condition and results of operations particularly iffrom and after the Chapter 11 CasesEffective Date are protracted.During the pendency of the Chapter 11 Cases, our employees will face considerable distraction and uncertainty and we may experience increased levels of employee attrition. A loss of key personnel or material erosion of employee morale could have a materially adverse effect on our ability to meet customer expectations, thereby adversely affecting our business and results of operations. The failure to retain or attract members of our management team and other key personnel could impair our ability to execute our strategy and implement operational initiatives, thereby having a material adverse effect on our financial condition and results of operations.If we are not able to obtain confirmation of a Chapter 11 plan of reorganization, or if current financing is insufficient or exit financing is not available, we could be required to seek a sale of the Company or certain of its material assets pursuant to Section 363 of the Bankruptcy Code or liquidate under Chapter 7 of the Bankruptcy Code.In order to successfully emerge from Chapter 11 bankruptcy protection, we must obtain confirmation of a Chapter 11 plan of reorganization by the Court. If confirmation by the Court does not occur, we could be forced to sell the Company or certain of its material assets pursuant to Section 363 of the Bankruptcy Code or liquidate under Chapter 7 of the Bankruptcy Code.There can be no assurance that our current cash position and amounts of cash from future operations will be sufficient to fund operations. In the event that we do not have sufficient cash to meet our liquidity requirements, and our current financing is insufficient or exit financing is not available, we may be required to seek additional financing. There can be no assurance that such additional financing would be available, or, if available, would be available on acceptable terms. Failure to secure any necessary exit financing or additional financing would have a material adverse effect on our operations and ability to continue as a going concern.Our post-bankruptcy capital structure has yet to be determined, and any changes to our capital structure may have a material adverse effect on existing debt and security holders.Our capital structure will be set pursuant to a plan of reorganization that requires Court approval. Any reorganization of our capital structure may include exchanges of new debt or equity securities for our existing debt and equity securities, and such new debt or equity securities may be issued at different interest rates, payment schedules and maturities than our existing creditors. The success of a reorganization through any such exchanges or modifications will depend on approval by the Court and the willingness of existing debt and security holders to agree to the exchange or modification, and there can be no guarantee of success. If such exchanges or modifications are successful, holders of our debt may find their holdings no longer have any value or are materially reduced in value, or they may be converted to equity and be diluted or may be modified orreplaced by debt with a principal amount that is less than the outstanding principal amount, longer maturities and reduced interest rates. There can be no assurance that any new debt or equity securities will maintain their value at the time of issuance.Any plan of reorganization that we may implement will be based in large part upon assumptions and analyses developed by us. If these assumptions and analyses prove to be incorrect, or adverse market conditions persist or worsen, our plan may be unsuccessful in its execution.Any plan of reorganization that we may implement will affect both our capital structure and the ownership, structure and operation of our businesses and will reflect assumptions and analyses based on our experience and perception of historical trends, current conditions and expected future developments, as well as other factors that we consider appropriate under the circumstances. Whether actual future results and developments will be consistent with our expectations and assumptions depends on a number of factors, including but not limited to (i) our ability to substantially change our capital structure; (ii) our ability to obtain adequate liquidity and financing sources; (iii) our ability to maintain customers’ confidence in our viability as a continuing entity and to attract and retain sufficient business from them; (iv) our ability to retain key employees, and (v) the overall strength and stability of general economic conditions of the financial and coal industries, both in the U.S. and in global markets. The failure of any of these factors could materially adversely affect the successful reorganization of our businesses.In addition, any plan of reorganization will rely upon financial projections, including with respect to revenues, EBITDA, capital expenditures, debt service and cash flow. Financial forecasts are necessarily speculative, and it is likely that one or more of the assumptions and estimates that are the basis of these financial forecasts will not be accurate. In our case, the forecasts will be even more speculative than normal, because they may involve fundamental changes in the nature of our capital structure. Accordingly, we expect that our actual financial condition and results of operations will differ, perhaps materially, from what we have anticipated. Consequently, there can be no assurance that the results or developments contemplated by any plan of reorganization we may implement will occur or, even if they do occur, that they will have the anticipated effects on us and our subsidiaries or our businesses or operations. The failure of any such results or developments to materialize as anticipated could materially adversely affect the successful execution of any plan of reorganization.As a result of the Chapter 11 Cases, realization of assets and liquidation of liabilities are subject to uncertainty, and our historical financial information will not be indicative of our future financial performance.Our capital structure will likely be significantly altered under any plan of reorganization ultimately confirmed by the Court. Under fresh-start reporting rules that may apply to us upon the effective date of a plan of reorganization, our assets and liabilities would be adjusted to fair values and our accumulated deficit would be restated to zero. Accordingly, if fresh-start reporting rules apply, our financial condition and results of operations following our emergence from Chapter 11 would not be comparable to the financial condition andor results of operations reflected in our historical financial statements. Further,As a planresult of reorganization could materially change the amounts and classifications reported in our consolidated historical financial statements, which do not give effect to any adjustments to the carrying value of assets or amounts of liabilities that might be necessary as a consequence of confirmation of a plan of reorganization.While operatingrestructuring under the protectionChapter 11 of the Bankruptcy Code, andour financial statements are subject to Court approval or otherwise as permitted infresh start accounting provisions of generally accepted accounting principles (“GAAP”). In the normal courseapplication of business,fresh start accounting, we may sell or otherwise disposeallocated our reorganization value to the fair value of assets and liquidate or settle liabilities for amounts other than those reflected in our consolidated financial statements. In connectionconformity with the Chapter 11 Casesguidance for the acquisition method of accounting for business combinations. Adjustments to the carrying amounts were material and the development of a plan of reorganization, it is also possible that additional restructuring and related charges may be identified and recorded in future periods. Such sales, disposals, liquidations, settlements or charges could be material to our consolidated financial position andwill affect prospective results of operations as balance sheet items are settled, depreciated, amortized or impaired. This will make it difficult for stockholders to assess our performance in any given period.We may be unablerelation to comply with restrictions imposed by our DIP Credit Agreement, our Securitization Facility and other financing arrangements.The agreements governing our outstanding financing arrangements impose a number of restrictionsprior periods. Our Annual Report on us. For example,Form 10-K for the terms of our credit facilities, leases and other financing arrangements contain financial and other covenants that create limitations on our ability to borrowfiscal year ending December 31, 2016 reflects the full amount under our credit facilities, effect acquisitions or dispositions andincur additional debt and require us to maintain minimum levels of liquidity and various financial ratios and comply with various other financial covenants. Specifically, the termsconsummation of the DIP Credit Agreement require us to comply with certain financial maintenance covenants, including (i) maximum capital expendituresPlan and (ii) minimum unrestricted cash and cash equivalents. The DIP Credit Agreement also contains customary affirmative and negative covenants for debtor-in-possession financings, which include restrictions on (i) indebtedness, (ii) liens and guaranties, (iii) liquidations, mergers, consolidations, acquisitions, (iv) dispositionthe adoption of assets or subsidiaries, (v) affiliate transactions, (vi) creation or ownership of certain subsidiaries, partnerships and joint ventures, (vii) continuation of or change in business, (viii) restricted payments, (ix) sanctions and anti-corruption matters, (x) no restriction in agreements on dividends or certain loans, (xi) loans and investments, (xii) transactions with respect to Bonding Subsidiaries and (xiii) hedging transactions. In addition, the DIP Credit Agreement contains milestones relating to the Chapter 11 Cases. Our ability to comply with these provisions may be affected by events beyond our control and our failure to comply could result in an event of default under the DIP Credit Agreement, the Securitization Facility or our other financing arrangements.are currently experiencinghave experienced an historic level of depression. If coal prices remain depressed, or if there is a further decline in prices, it could materially and adversely affect our profitability and the value of our coal reserves.········· and·allowances.Dueallowances; anda number of factors outside our control, including decelerating demand for coal used in electricity (duealternative energy sources, those intended to low naturalconvert coal-to-liquids or gas prices and regulations), an oversupplied marketthose aimed at capturing, using and increased competition particularly from non-U.S. suppliers taking advantage of a strong dollar, we have experienced a sustained and significant downturn in coal pricing over the last several years. The global metallurgical coal market remains challenged and has shown no meaningful improvement over thelast several years. We are also experiencing higher than normal uncommitted volumes due to prolonged, depressed market conditions. Pricing may be adversely affected or we may need to reduce production as a result of our uncommitted volume levels. If coal prices remain depressed, or if there is a further declinestoring carbon dioxide.it could materially and adversely affect us by decreasing our profitability, cash flows, liquidity and the value of our coal reserves.33 overat times during the past several years and we expect that the price for our coal will continue to be depressed, as the demand for, and price of, coal remainshas been subject to pressure for a variety of reasons, including reductions in domestic and international demand for metallurgical and thermal coal. These conditions, among other factors, have led to our filing of the Bankruptcy Petitions. security prices, severely limited liquidity and credit availability, and resulted in declining valuations of assets. If there are downturns in economic conditions, our customers’ and our businesses, financial conditions or results of operations could be adversely affected. During unfavorableFurthermore, because we typically seek to enter into long-term arrangements for the sale of a substantial portion of our coal, the average sales price we receive for our coal may lag behind any general economic conditions werecovery. We are focused on cost control and capital discipline, but there can be no assurance that these actions, or any other actions that we may take, will be sufficient to offset any adverse effect these conditions may have on our business, financial condition or results of operations.ChinaAsia have at times, and could further,in the future, materially reduce coal prices and therefore materially reduce our revenues and profitability. Potential changes to international trade agreements, trade concessions or other political and economic arrangements may benefit coal producers operating in countries other than the United States. We may not be able to compete on the basis of price or other factors with companies that in the future benefit from favorable foreign trade policies or other arrangements. In addition, our ability to ship our coal to international customers depends on port capacity, which is limited. Increased competition within the coal industry for international sales could result in us not being able to obtain throughput capacity at port facilities, or the rates for such throughput capacity to increase to a point where it is not economically feasible to export our coal.34 changedecrease in the coal consumption of electric power generators could result in less demand and lower prices for coal, which could materially and adversely affect our revenues and results of operations.95%93% of our coal sales by volume during 2015.2017. The majority of these sales were to electric power generators. The amount of coal consumed for electric power generation is affected primarily by the overall demand for electricity, the availability, quality and price of competing fuels (particularly, natural gas) for power generation and governmental regulations. regulations which may dictate an alternate source of fuel regardless of economics. Overall economic activity and the associated demands for power by industrial users can have significant effects on overall electricity demand and can be caused by a number of factors. An economic slowdown can significantly slow the growth of electricity demand and could result in reduced demand for coal. For example, declines in the rate of international economic growth in countries such as China, India or other developing countries could further negatively impact the demand for U.S. coal and result in a continuing oversupply of coal in the marketplace. Weather patterns can also greatly affect electricity demand. Extreme temperatures, both hot and cold, cause increased power usage and, therefore, increase generating requirements from all sources. Mild temperatures, on the other hand, result in lower electrical demand, which allow generators to choose the source of power generation when deciding which generation source to dispatch.········complex,complexes, which accounted for approximately 78%75% of the coal volume we sold and 57% of the revenue we generated in 2015,2017, our coal mining operations may be disrupted and we could experience a delay or halt of production or shipments or our operating costs could increase significantly. In addition, if our insurance coverage is limited or excludes certain of these conditions or events, then we may not be able to recover any of the losses we may incur as a result of such conditions or events, some of which may be substantial.35 The global metallurgical coal market remains challenged and has shown no meaningful improvement over the last several quarters, due to, among other things, reduced steel production. A further decline in or prices remaining depressed in the metallurgical market relative to the steam market could cause us, as well as our competitors, to shift coal from the metallurgical market to the steam market, thereby reducing our revenues and profitability and increasing the availability of coal to customers in the steam market.(including under our DIP Credit Agreement), competition from other coal producers, the lack of suitable acquisition or lease-by-application, or LBA, opportunities or the inability to acquire coal properties or LBAs on commercially reasonable terms,terms. Increased opposition from non-governmental organizations and restrictions on making acquisitions as a result of our Chapter 11 Cases.other third parties may also lengthen, delay or adversely impact the LBA process. If we are unable to acquire replacement reserves, our future production may decrease significantly and our operating results may be negatively affected. In addition, we may not be able to mine future reserves as profitably as we do at our current operations.On 15, 2016, the federal government orderedimposed a moratorium on new leases for coal mined from federal lands as part of a review of the government’s management of federally-owned coal. TheIn March 2017, the U.S. Secretary of Interior signed Secretarial Order 3348 lifting that moratorium and halting the Federal Coal Program Programmatic Environmental Impact Statement that was in process at the time. Litigation is currently pending in the United States District Court for the District of Montana challenging the lifting of the moratorium as a violation of the National Environmental Policy Act, the Mineral Leasing Act and the Federal Land Policy and Management Act. Although the Bureau of Land Management is now working to process coal lease applications and modifications expeditiously in accordance with regulations and guidance that existed before Secretarial Order 3338, which imposed the moratorium on new coal leases, any delay in the LBA process, including any delay caused by the now-lifted moratorium could prevent us from obtaining replacement reserves when we require them. Also, the outcome of the government’s review is uncertain and could have a material and adverse impact on our business in any number of ways including by limiting our ability to mine reserves under ongoing or future applications, by increasing the costs or timeframe associated with obtaining leases under the LBA program, by making it uneconomical for us to participate in the programs or by preventing us from obtaining replacement reserves if the LBA program were to be terminated.·36 ······and a loss or reduction in our ability to self-bondwhich could have a material adverse effect on our business and results of operations. We use self-bonding to secure performance of certain obligations in Wyoming. Self-bonding allows us to mine without posting any other third party financial assurance such as a surety bond or letter of credit. As of December 31, 2015, we have self-bonded an aggregate of approximately $485.5 million. The Land Quality Division of the Wyoming Department of Environmental Quality periodically re-evaluates the amount of the bond, so this amount is subject to change.On February 29, 2016, the Bankruptcy Court approved a stipulation between certain of our operating subsidiaries and the State of Wyoming, pursuant to which those subsidiaries granted Wyoming a $75 million superpriority claim to support the self-bonded obligations and agreed to substitute approximately $17 million of the self-bonds with financial assurance in the form of third-party collateral support. In exchange, Wyoming agreed to a stay of any proceedings related to the subsidiaries’ self-bonded status and that, so long as the stipulation is effective, Wyoming will not seek additional collateral in respect of the self-bonds, take certain other adverse actions with respect to the subsidiaries’ mining permits or licenses in Wyoming or seek to enforce the subsidiaries’ obligations to make payments in respect of the self-bonds. The stipulation is effective until the earlier of May 1, 2017 and the date upon which a plan of reorganization in the Chapter 11 Cases is approved and becomes effective, subject to certain early termination events.Our self-bonding obligations may increase as our bankruptcy process continues, and, upon our emergence from bankruptcy or otherwise, we may not continue to qualify to self-bond or self-bonding programs may be terminated. Alternative forms of financial assurance such as surety bonds and letters of credit may not be available to us. To the extent we are unable to maintain our current level of self-bonding, due to legislative or regulatory changes or changes in our financial condition, our costs would increase and it could have a material adverse effect on our financial condition and results of operations, as well as cast substantial doubt on our ability to continue as a going concern.Disruptions in the quantities of coal produced by our contract mine operators or purchased from other third parties could temporarily impair our ability to fill customer orders or increase our operating costs.We use independent contractors to mine coal at certain of our mining complexes, including select operations in our Appalachian segment. In addition, we purchase coal from third parties that we sell to our customers. Operational difficulties at contractor-operated mines or mines operated by third parties from whom we purchase coal, changes in demand for contract miners from other coal producers and other factors beyond our control could affect the availability, pricing, and quality of coal produced for or purchased by us. Disruptions in the quantities of coal produced for or purchased by us could impair our ability to fill our customer orders or require us to purchase coal from other sources in order to satisfy those orders. If we are unable to fill a customer order or if we are required to purchase coal from other sources in order to satisfy a customer order, we could lose existing customers and our operating costs could increase. long-term coal supply agreements we have with our customers. Changes in purchasing patterns in the coal industry could make it difficult for us to extend our existing long-term coal supply agreements or to enter into new agreements in the future.long-term coal supply agreements or enter into agreements to purchase fewer tons of coal or on different terms or prices than in the past. In addition,37 long-term coal supply agreements. Also, the availability and price of competing fuels, such as natural gas, could influence the volume of coal a customer is willing to purchase under contract. long-term coal supply agreements typically contain force majeure provisions allowing the parties to temporarily suspend performance during specified events beyond their control. Most of our long-term coal supply agreements also contain provisions requiring us to deliver coal that satisfies certain quality specifications, such as heat value, sulfur content, ash content, hardness and ash fusion temperature. These provisions in our long-term coal supply agreements could result in negative economic consequences to us, including price adjustments, purchasing replacement coal in a higher-priced open market, the rejection of deliveries or, in the extreme, contract termination. Our profitability may be negatively affected if we are unable to seek protection during adverse economic conditions or if we incur financial or other economic penalties as a result of these provisions of our long-termcoal supply agreements. For more information about our long-term coal supply agreements, you should see the section entitled “Long-Term Coal Supply Arrangements” under Item 1.38 2015,2017, we derived approximately 18%17% of our total coal revenues from sales to our three largest customers and approximately 39%41% of our total coal revenues from sales to our ten largest customers. We are currently discussing the extension of coal sales agreements with some of these customers. However, we may be unsuccessful in obtaining coal supply agreements with those customers, and some or all of these customers could discontinue purchasing coalrecently openedsales offices in China, Singapore and the United Kingdom. The international expansion of our operations increases our exposure to country and currency risks. In addition, our international offices are selling our coal to new customers and customers in new countries, whose business practices and reputations are not as well known to us. We are also challenged by political risks by expanding internationally, including the potential for expropriation of assets and limits on the repatriation of earnings. In the event that we are unable to effectively manage these new risks, our results of operations, financial position or cash flow could be adversely affected by these activities.flows.39 end-usersend‑users of our coal. A series of more stringent requirements relating to particulate matter, ozone, haze, mercury, sulfur dioxide, nitrogen oxide and other air pollutants are expected to be proposed or become effectiveis in coming years. Thethe process of being developed and implemented. For instance, the Clean Power Plan, under review by U.S. courts,if implemented in its current form, would severely limit emissions of carbon dioxide which would adversely affect our ability to sell coal. However, in April 2017, the EPA announced that it was initiating a review of the Clean Power Plan consistent with President Trump’s Executive Order 13783, and, in October 2017, the EPA published a proposed rule to formally repeal the Clean Power Plan. In addition,December 2015, the United States and 195 other countries reached an agreement (the “Paris Agreement” during the 21st Conference of the Parties to the United Nations Framework Convention on Climate Change, a long-term, international framework convention designed to address climate change over the next several decades. In June 2017, President Trump announced that the United States plans to withdraw from the Paris Agreement and to seek negotiations either to reenter the Paris Agreement on different terms or to establish a new framework agreement. The earliest permitted exit date under the Paris Agreement is four years from when the agreement took effect in November 2016, or November 2020. Whether the United States will adhere to the Paris Agreement’s exit process is, and the terms on which the United States may reenter the Paris Agreement or a separately negotiated agreement are, uncertain at this time. However, any efforts to control and/or reduce greenhouse gas emissions by the United States or other countries that have also pledged “Nationally Determined Contributions,” or concerted conservation efforts that result in reduced electricity consumption, could causeadversely impact coal prices, our ability to sell coal and, salesin turn, our financial position and results of our coal to materially decline.is in the process of being developed,continues to evolve and develop and many new regulatory initiatives remain subject to review by federal or state agencies or the courts. Stringent air emissions limitations are either in place or are likely to be imposed in the short to medium term, and these limitations will likely require significant emissions control expenditures for many coal-fueledcoal‑fueled power plants. As a result, these power plants may switch to other fuels that generate fewer of these emissions, or may install more effective pollution control equipment that reduces the need for low sulfur coal, or may cease operations, possibly reducing future demand for coal and a reduced need to construct new coal-fueledcoal‑fueled power plants. Any switching of fuel sources away from coal, closure of existing coal-firedcoal‑fired plants, or reduced construction of new plants could have a material adverse effect on40 us.regulation or other scrutinygovernmental regulations and unfavorable lending and investment policies by financial institutions and insurance companies associated with concerns about environmental impacts of topics relatedcoal combustion, including perceived impacts on the global climate.coal combustion.topics relatedthe relationship that greenhouse gases may have with perceived climate change, continue to attract significant public and scientific attention. For example, the Fourth and Fifth Assessment Reports of the Intergovernmental Panel on Climate Change have expressed concern about the impacts of human activity, especially from fossil fuel combustion, on global climate issues. As a result of the public and scientific attention, several governmental bodies increasingly are focusing on climate issues and, more specifically, levels of emissions of carbon dioxide from coal combustion by power plants. The Clean Power Plan would severely limit emissions of carbon dioxide, possibly reducing future demand for coal. However, in April 2017 the EPA announced that it was initiating a review of the Clean Power Plan consistent with President Trump’s Executive Order 13783, and in October 2017 published a proposed rule to formally repeal the Clean Power Plan. Additionally, a number of governments pledged to control and reduce greenhouse gas emissions such asunder the Paris Agreement, which may impact demand for coal resources despite the United States’ June 2017 announcement that it intends to withdraw its commitment.fossil fuel combustion, continuegreenhouse gas emissions in the United States could occur pursuant to attract increasing public scrutiny. Legislativefuture U.S. treaty obligations, statutory or regulatory efforts atchanges and the international, federal, state or local level to controlor otherwise. Enactment of laws or passage of regulations regarding greenhouse emissions from the combustion of coal mayby the U.S., some of its states or other countries, or other actions to limit emissions could result in electricity generators increasingly usingswitching from coal to other fuel sources other than coal or closures of coal-fueled power plants. plant closures. You should see Item 1, “Environmental and Other Regulatory Matters-Climate Change” for more information about governmental regulations relating to greenhouse gas emissions.and other financing sources and insurance companies have taken actions to limit available financing and insurance coverage for the development of new coal-fueled power plants and coal miners and utilities that derive a majority of their revenue from thermal coal, which also may adversely impact the future global demand for coal. Further, there have been recent efforts by members of the general financial and investment communities, such as investment advisors, sovereign wealth funds, public pension funds, universities and other groups, to divest themselves and to promote the divestment of securities issued by companies involved in the fossil fuel extraction market, such as coal producers. Those entities also have been pressuring lenders to limit financing available to such companies. These efforts may adversely affect the market for our securities and our ability to access capital and financial markets in the future.flow; however, we often are not able to reasonably quantify such impacts.flow. In general, however, it is likely that any future laws, regulations or other policies aimed at reducing greenhouse gas emissions will negatively impact demand for our coal.non-governmentalnon‑governmental organizations, anti-mininganti‑mining groups and individuals, have certain statutory rights to comment upon and submit objections to requested permits and environmental impact statements prepared in connection with applicable41 re-openre‑open the mine. In the event that these agencies order the closing of our mines, our coal sales contracts generally permit us to issue force majeure notices which suspend our obligations to deliver coal under these contracts. However, our customers may challenge our issuances of force majeure notices. If these challenges are successful, we may have to purchase coal from third-partythird‑party sources, if it is available, to fulfill these obligations, incur capital expenditures to re-openre‑open the mines and/or negotiate settlements with the customers, which may include price reductions, the reduction of commitments or the extension of time for delivery or terminate customers’ contracts. Any of these actions could have a material adverse effect on our business and results of operations.···completed;·completed and required surety bonds or other instruments to secure those reclamation and restoration obligations;·····plant-lifeplant‑life and wildlife, including endangered or threatened species;····time-consumingtime‑consuming and may delay commencement or continuation of exploration or production operations. We cannot assure you that we have been or will be at all times in compliance with the applicable laws and regulations. Failure to comply with these laws and regulations may result in the assessment of administrative, civil and criminal penalties, the imposition of cleanup and site restoration costs and liens, the issuance of injunctions to limit or cease operations, the suspension or revocation of permits and other enforcement measures that could have the effect of limiting production from our operations. We may incur material costs and liabilities resulting from claims for damages to property or injury to persons arising from our operations. If we are pursued for sanctions, costs and liabilities in respect of these matters, our mining operations and, as a result, our profitability could be materially and adversely affected.42 third-partythird‑party profit, as required. The third-partythird‑party profit is an estimate of the approximate markup that would be charged by contractors for work performed on our behalf. The resulting estimated reclamation and mine closure obligations could change significantly if actual amounts change significantly from our assumptions, which could have a material adverse effect on our results of operations and financial condition.OurUnder certain federal and state environmental laws, our liability for such claimsconditions may be joint and several with other owners or owners/operators, so that we may be held responsible for more than our share of the contamination or other damages, or even for the entire share.intervention, which may have a favorable impact on our permits. The matter is pending beforeintervention. On May 22, 2017, the U.S.United States District Court for the Southern District of West Virginia ongranted the remaining subsidiary’s motion to dismiss plaintiffs’ Seventh Supplemental and Amended Complaint after the D.C. Circuit Court of Appeals affirmed the EPA’s final determination rescinding Mingo Logan’s motion for summary judgment. If the matter isLogan Coal Company’s 404 authorization regarding Pigeonroost Branch and Oldhouse Branch. The D.C. Circuit Court of Appeals decision finally resolved ultimately in a manner that is adverselawsuit filed by Mingo Logan against EPA challenging EPA’s authority to the interestsrescind a 404 permit authorization.43 our operatingContentssubsidiaries, such subsidiaries’ operating results may be adversely impacted. For more information regarding this litigation matter you should see the section entitled “Legal Proceedings—Permit Litigation Matters” under Item 3.self-bonding programs; federal lease by application programs; costs associated with providing healthcare benefits to employees; health and safety standards; accounting standards; taxation requirements; and competition laws.For example, in April 2010, Furthermore, pursuant to a February 2017 executive order and the proposed rule published on July 27, 2017, the EPA issued comprehensive guidance regardingwill review and revise the water quality standardsdefinition of “waters of the United States,” which may include re-codifying the definition that EPA believes should apply to certain new and renewedcurrently governs administration of the Clean Water Act permit applications for Appalachian surface coal miningAct. Adoption of more stringent application of existing regulations may materially increase our costs and adversely affect our operations. Under the EPA’s guidance, applicants seekingobtain state and federal Clean Water Act permits for surface coal mining in Appalachia must perform an evaluation to determine if a reasonable potential exists that the proposed mining would cause a violation of water quality standards. According to the EPA Administrator, the water quality standards set forth in the EPA’s guidanceIncome Taxesbe difficult for most surface mining operations to meet. Additionally, the EPA’s guidance contains requirements for the avoidance and minimization of environmental and mining impacts, consideration of the full range of potential impacts on the environment, human health and local communities, including low-income or minority populations, and provision of meaningful opportunities for public participation in the permit process. The EPA’s guidance is subject to several pending legal challenges related to its legal effect and sufficiency including consolidated challenges pending in the United States Court of Appeals for the District of Columbia led by the National Mining Association. We may be required to meet these requirements in the future in order to obtain and maintain permits that are important to our Appalachian operations. We cannot give any assurance that we will be able to meet these or any other new standards.In response to the April 2010 explosion at Massey Energy Company’s Upper Big Branch Mine and the ensuing tragedy, we expect that safety matters pertaining to underground coal mining operations will continue to be the topic of new legislation and regulation, as well as the subject of heightened enforcement efforts. For example, federal and West Virginia state authorities have announced special inspections of coal mines to evaluate several safety concerns, including the accumulation of coal dust and the proper ventilation of gases such as methane. In addition, both federal and West Virginia state authorities have announced that they are considering changes to mine safety rules and regulations which could potentially result in additional or enhanced required safety equipment, more frequent mine inspections, stricter and more thorough enforcement practices and enhanced reporting requirements. Any new environmental, health and safety requirements may increase the costs associated with obtaining or maintaining permits necessary to perform our mining operations or otherwise may prevent, delay or reduce our planned production, any of which couldmaterially adversely affect our financial condition, results of operations and cash flows.Further, mining companies are entitled adeduction for percentage depletion, which may allow for depletion deductions in excess(“AMT”) credits has been limited by the “ownership change” under Section 382 of the basis in Internal Revenue Code (the “Code”) that occurred on our emergence from bankruptcy (“the mineral reserves.Emergence Ownership Change”). The deductionlimitation resulting from the Ownership Change is currently being reviewed bysubstantial and applies to all NOLs and AMT tax credits existing at the federal government for repeal. If repealed,time of the inability to take a tax deduction for percentage depletion couldOwnership Change. The limitation resulting from the Emergence Ownership Change may have a materialsignificant impact on our financial condition, resultsability to offset future taxable income with carryforward net operating losses. NOLs and AMT credits generated after the Emergence Ownership Change are generally not subject to the limitations.operations, cash flowsthe discharge of debt in the Chapter 11 Cases, we and futureour subsidiaries were required to reduce the amount of our NOLs and AMT credits and other tax payments.44 General2015,2017, we owned or controlled, primarily through long-termlong‑term leases, approximately 28,54128,292 acres of coal land in Ohio, 21,8321,060 acres of coal land in Maryland, 46,55610,108 acres of coal land in Virginia, 380,471359,160 acres of coal land in West Virginia, 106,05998,488 acres of coal land in Wyoming, 273,299267,857 acres of coal land in Illinois, 129,04334,446 acres of coal land in Kentucky, 10,0009,840 acres of coal land in Montana, 21,802 acres of coal land in New Mexico, 426358 acres of coal land in Pennsylvania, and 18,44320,165 acres of coal land in Colorado. In addition, we also owned or controlled through long-termlong‑term leases smaller parcels of property in Alabama, Indiana, Washington, Arkansas, California, Utah and Texas. We lease approximately 86,32181,436 acres of our coal land from the federal government and approximately 23,34922,385 acres of our coal land from various state governments. Certain of our preparation plants or loadout facilities are located on properties held under leases which expire at varying dates over the next 30 years. Most of the leases contain options to renew. Our remaining preparation plants and loadout facilities are located on property owned by us or for which we have a special use permit.2.52.1. billion tons of proven and probable recoverable reserves at December 31, 2015.2017. Our coal reserve estimates at December 31, 20152017 were prepared by our engineers and geologists and reviewed by Weir International, Inc., a mining and geological consultant. Our coal reserve estimates are based on data obtained from our drilling activities and other available geologic data. Our coal reserve estimates are periodically updated to reflect past coal production and other geologic and mining data. Acquisitions or sales of coal properties will also change these estimates. Changes in mining methods or the utilization of new technologies may increase or decrease the recovery basis for a coal seam.45 2015:(1) As received Btus per lb. includes the weight of moisture in the coal on an as sold basis. Total Assigned Recoverable Reserves As Received Btus per lb. (1) Sulfur Content (lbs. per million Btus) Mining Method Past Reserve Estimates Reserve Control Under- Proven Probable <1.2 1.2-2.5 >2.5 Leased Owned Surface ground 2015 2016 Wyoming 1,025 1,019 6 963 62 — 8,832 1,025 1,025 — 1,318 1,115 Colorado 53 47 6 53 — — 11,476 53 — — 53 53 56 Central App. 69 59 10 25 44 — 13,076 62 7 22 47 35 70 Northern App. 35 32 3 — 35 — 13,018 5 30 — 35 40 48 Illinois 35 20 15 — — 35 10,737 30 5 — 35 37 38 Total 1,217 1,177 40 1,041 141 35 9,365 1,175 42 1,047 170 1,483 1,327 (1) As received Btus per lb. includes the weight of moisture in the coal on an as sold basis. (1) As received Btus per lb. includes the weight of moisture in the coal on an as sold basis.The following table reconciles 2015 and 2014 coal proven and probable reserves: Total Unassigned Recoverable Reserves Sulfur Content Mining Method (lbs. per million Btus) As Received Reserve Control Under‑ Proven Probable <1.2 1.2-2.5 >2.5 Leased Owned Surface ground Wyoming 290 244 46 242 48 — 8,446 290 — 290 — Colorado 28 22 6 28 — — 11,339 28 — — 28 Central App. 51 44 7 14 24 13 12,482 2 49 33 18 Northern App. 198 115 83 — 195 3 13,009 9 189 — 198 Illinois 285 189 96 — — 285 11,162 59 226 3 282 Total 852 614 238 284 267 301 10,753 388 464 326 526 Tons(As received Btus per lb. includes the weight of moisture in millions)December 31, 20145,064Depletion (1)(127)Revisions and additions, net (2)(1,709)Mining rights relinquished(731)December 31, 20152,497the coal on an as sold basis. (1) Reserves mined and sold in 2015.(2) Revisions and additions, net are due to reclassification of reserves that no longer meet the definition of compliant “reserves” per SEC Industry Guide 7 which defines a “reserve” as that part of a mineral deposit which could be economically and legally extracted or produced at the time of the reserve determination. The tonnage reclassified from reserves continues to be controlled by the company, is mineable with existing technologies, and could factor into the Company’s mining plans in the future.73%66% consist of compliance coal, or coal which emits 1.2 pounds or less of sulfur dioxide per million Btus upon combustion, while an additional approximately 5%8% could be sold as low-sulfur coal. The balance is classified as high-sulfur coal. Most of our reserves are suitable for the domestic steam coal markets. A substantial portion of the low-sulfur and compliance coal reserves at a number of our Appalachian mining complexes may also be used as metallurgical coal.20152017 was $2.5$0.4 billion, consisting of $33.7$4.7 million of prepaid royalties and a net book value of coal lands and mineral rights of $2.4 billion.46 lease-by-applicationlease‑by‑application (LBA) process. Under this process, before a mining company can obtain new coal reserves, the coal tract must be nominated for lease, and the company must win the lease through a competitive bidding process. The LBA process can last anywhere from five to ten years or more from the time the coal tract is nominated to the time a final bid is accepted by the BLM. After the LBA is awarded, the company then conducts the necessary testing to determine what amount can be classified as reserves.land-useland‑use plans for that particular tract of land and that the application would provide for maximum coal recovery. The application is further reviewed by a regional coal team at a public meeting. Based on a review of the available information and public comment, the regional coal team will make a recommendation to the BLM whether to continue, modify or reject the application.BLM-directedBLM‑directed environmental analysis or an environmental impact statement to be completed. This analysis or impact statement60-day60‑day period.30-day30‑day antitrust review of the lease. If the successful bidder was not the initial applicant, the BLM will refund the initial applicant certain fees it paid in connection with the application process, for example the fees associated with the environmental analysis or environmental impact statement, and the winning bidder will bear those costs. Coal won through the LBA process and subject to federal leases are administered by the U.S. Department of Interior under the Federal Coal Leasing Amendment Act of 1976. In addition, we occasionally add small coal tracts adjacent to our existing LBAs through an agreed upon lease modification with the BLM. Once the BLM has issued a lease, the company must also complete the permitting process before it can mine the coal. You should seePlease refer to the section entitled “Environmental and Other Regulatory Matters” under Item 1.10-year10‑year periods and for so long thereafter as coal is produced in commercial quantities. These leases require diligent development within the first ten years of the lease award with a required coal extraction of 1.0% of the total coal under the lease by the end of that 10-year10‑year period. At the end of the 10-year10‑year development period, the lessee is required to maintain continuous operations, as defined in the applicable leasing regulations. In certain cases a lessee may combine contiguous leases into a logical mining unit, which we refer to as an LMU. This allows the production of coal from any of the leases within the LMU to be used to meet the continuous operation requirements for the entire LMU. Some of our mines are also subject to coal leases with applicable state regulatory agencies and have different terms and conditions that we must adhere to in a similar way to our federal leases. Under these federal and state leases, if the leased coal is not diligently developed during the initial 10-year10‑year development period or if certain other terms of the leases are not complied with, including the requirement to produce a minimum quantity of coal or pay a minimum production royalty, if applicable, the BLM or the applicable state regulatory agency can terminate the lease prior to the expiration of its term.47 The review could takeIn March 2017, the formU.S. Secretary of a programmatic environmental impact statement, which allows a broader lookInterior signed Secretarial Order 3348 lifting that moratorium and halting the Federal Coal Program Programmatic Environmental Impact Statement that was in process at all aspects of federal coal leasing across regions and can incorporate environmental and health impacts as well as financial ones. The last review on this scale occurredthe time. Litigation is currently pending in the 1980’s.United States District Court for the District of Montana challenging the lifting of the moratorium as a violation of the National Environmental Policy Act, the Mineral Leasing Act and the Federal Land Policy and Management Act. Although the Bureau of Land Management is now working to process coal lease applications and modifications expeditiously in accordance with regulations and guidance that existed before Secretarial Order 3338, which imposed the moratorium on new coal leases, any delay in the LBA process, including any delay caused by the now-lifted moratorium could prevent us from obtaining replacement reserves when we require them. Also, the outcome of the government’s review is uncertain and could have a material and adverse impact on our business in any number of ways including by limiting our ability to mine reserves under ongoing or future applications, by increasing the costs or timeframe associated with obtaining leases under the LBA program, by making it uneconomical for us to participate in the programs or by preventing us from obtaining replacement reserves if the LBA program were to be terminated. Please see “Our inability to acquire additional coal reserves or our inability to develop coal reserves in an economically feasible manner may adversely affect our business,” under Risks Related to Our Operations.2015,2017, approximately 23%24% of our coal reserves were held in fee, with the balance controlled by leases, most of which do not expire until the exhaustion of mineable and merchantable coal. Under current mining plans, substantially all reported leased reserves will be mined out within the period of existing leases or within the time period of assured lease renewals. Royalties are paid to lessors either as a fixed price per ton or as a percentage of the gross sales price of the mined coal. The majority of the significant leases are on a percentage royalty basis. In some cases, a payment is required, payable either at the time of execution of the lease or in annual installments. In most cases, the prepaid royalty amount is applied to reduce future production royalties.65,88657,773 acres of property to other coal operators in 2015.2017. We received royalty income of $4.1 million during 2017 from the mining of approximately 1.2 million tons, $1.1 million during the period October 2 through December 31, 2016 from the mining of approximately 0.4 million tons, $1.7 million during the period January 1 through October 1, 2016 from the mining of approximately 0.6 million tons, and $6.3 million in 2015 from the mining of approximately 2.1 million tons, $9.6 million in 2014 from the mining of approximately 2.6 million tons and $9.5 million in 2013 from the mining of approximately 2.8 million tons on those properties. We have included reserves at properties leased by us to other coal operators in the reserve figures set forth in this report.Permit Litigation MattersSurface mines at our Mingo Logan and Coal-Mac mining operations were identified in an existing lawsuit brought by the Ohio Valley Environmental Coalition (OVEC) in the U.S. District Court for the Southern District of West Virginia as having been granted Clean Water Act § 404 permits by the Army Corps of Engineers (Corps), allegedly in violation of the Clean Water Act and the National Environmental Policy Act. The lawsuit, brought by OVEC in September 2005, originally was filed against the Corps for permits it had issued to four subsidiaries of a company unrelated to us or our operating subsidiaries. The suit claimed that the Corps had issued permits to the subsidiaries of the unrelated company that did not comply with the National Environmental Policy Act and violated the Clean Water Act.The court ruled on the claims associated with those four permits in orders of March 23 and June 13, 2007. In the first of those orders, the court rescinded the four permits, finding that the Corps had inadequately assessed the likely impact of valley fills on headwater streams and had relied on inadequate or unproven mitigation to offset those impacts. In the second order, the court entered a declaratory judgment that discharges of sediment from the valley fills into sediment control ponds constructed in-stream to control that sediment must themselves be permitted under a different provision of the Clean Water Act, § 402, and meet the effluent limits imposed on discharges from these ponds. Both of the district court rulings were appealed to the U.S. Court of Appeals for the Fourth Circuit.Before the court entered its first order, the plaintiffs were permitted to amend their complaint to challenge the Coal-Mac and Mingo Logan permits. Plaintiffs sought preliminary injunctions against both operations, but later reached agreements with our operating subsidiaries that have allowed mining to progress in limited areas while the district court’s rulings were on appeal. The claims against Coal-Mac were thereafter dismissed.In February 2009, the Fourth Circuit reversed the district court. The Fourth Circuit held that the Corps’ jurisdiction under Section 404 of the Clean Water Act is limited to the narrow issue of the filling of jurisdictional waters. The court also held that the Corps’ findings of no significant impact under the National Environmental Policy Act and no significant degradation under the Clean Water Act are entitled to deference. Such findings entitle the Corps to avoid preparing an environmental impact statement, the absence of which was one issue on appeal. These holdings also validated the type of mitigation projects proposed by our operations to minimize impacts and comply with the relevant statutes. Finally, the Fourth Circuit found that stream segments, together with the sediment ponds to which they connect, are unitary “waste treatment systems,” not “waters of the United States,” and that the Corps had not exceeded its authority in permitting them.OVEC sought rehearing before the entire appellate court, which was denied in May 2009, and the decision was given legal effect in June 2009. An appeal to the U.S. Supreme Court was then filed in August 2009. On August 3, 2010 OVEC withdrew its appeal.Mingo Logan filed a motion for summary judgment with the district court in July 2009, asking that judgment be entered in its favor because no outstanding legal issues remained for decision as a result of the Fourth Circuit’s February 2009 decision. By a series of motions, the United States obtained extensions and stays of the obligation to respond to the motion in the wake of its letters to the Corps dated September 3 and October 16, 2009 (discussed below). By order dated April 22, 2010, the district court stayed the case as to Mingo Logan for the shorter of either six months or the completion of the U.S. Environmental Protection Agency’s (EPA) proposed action to deny Mingo Logan the right to use its Corps’ permit (as discussed below).On October 15, 2010, the United States moved to extend the existing stay for an additional 120 days (until February 22, 2011) while the EPA Administrator reviewed the “Recommended Determination” issued by the EPA Region 3. By Memorandum Opinion and Order dated November 2, 2010, the court granted the United States’ motion. On January 13, 2011, the EPA issued its “Final Determination” to withdraw the specification of two of the three watersheds as a disposal site for dredged or fill material approved under the current Section 404 permit. The court was notified of the Final Determination and by order dated March 21, 2011 stayed further proceedings in the case until further order of the court, in light of the challenge to the EPA’s “Final Determination” then pending in federal court in Washington, D.C. In a Memorandum and Opinion and separate Order, each dated March 23, 2012, the federal court granted Mingo Logan’s motion for summary judgment, vacated EPA’s Final Determination and found valid and in full force Mingo Logan’s Section 404 permit. As described more fully below, the EPA appealed that order to the United States Court of Appeals for the D.C. Circuit and by Opinion of the Court dated April 23, 2013, the court reversed the lower court’s order and remanded the matter to the district court for further proceedings.On April 5, 2012, Mingo Logan moved to lift the stay referenced above. On June 5, 2012, the court entered an order lifting the stay and allowing the case to proceed on Mingo Logan’s Motion for Summary Judgment. Shortly thereafter, OVEC filed a motion for leave to file a seventh amended and supplemental complaint seeking to update existing counts and raising two new claims (one, to enforce EPA’s “Final Determination” and, the other, that the Corps’ refusal to prepare a Supplemental Environmental Impact Statement violates the APA and NEPA). By Memorandum, Opinion and Order dated July 25, 2012, the court granted OVEC’s motion and directed the Clerk to file OVEC’s Seventh Amended and Supplemental Complaint. Mingo Logan filed its Motion for Summary Judgment on August 31, 2012, along with its Answer to the Seventh Amended and Supplemental Complaint and the matter remains pending before the court.As a result of the Bankruptcy Petitions, much of the pending litigation against the Debtors is stayed. Subject to certain exceptions and approval by the Court, during the Chapter 11 process, no party can take further actions to recover pre-petition claims against the Debtors.EPA Actions Related to Water Discharges from the Spruce PermitBy letter of September 3, 2009, the EPA asked the Corps of Engineers to suspend, revoke or modify the existing permit it issued in January 2007 to Mingo Logan under Section 404 of the Clean Water Act, claiming that “new information and circumstances have arisen which justify reconsideration of the permit.” By letter of September 30, 2009, the Corps of Engineers advised the EPA that it would not reconsider its decision to issue the permit. By letter of October 16, 2009, the EPA advised the Corps that it has “reason to believe” that the Mingo Logan mine will have “unacceptable adverse impacts to fish and wildlife resources” and that it intends to issue a public notice of a proposed determination to restrict or prohibit discharges of fill material that already are approved by the Corps’ permit. By federal register publication dated April 2, 2010, the EPA issued its “Proposed Determination to Prohibit, Restrict or Deny the Specification, or the Use for Specification of an Area as a Disposal Site: Spruce No. 1 Surface Mine, Logan County, WV” pursuant to Section 404(c) of the Clean Water Act, the EPA accepted written comments on its proposed action (sometimes known as a “veto proceeding”), through June 4, 2010 and conducted a public hearing, as well, on May 18, 2010. We submitted comments on the action during this period. On September 24, 2010, the EPA Region 3 issued a “Recommended Determination” to the EPA Administrator recommending that the EPA prohibit the placement of fill material in two of the three watersheds for which filling is approved under the current Section 404 permit. Mingo Logan, along with the Corps, West Virginia DEP and the mineral owner, engaged in a consultation with the EPA as required by the regulations, to discuss “corrective action” to address the “unacceptable adverse effects” identified. On January 13, 2011, the EPA issued its “Final Determination” pursuant to Section 404(c) of the Clean Water Act to withdraw the specification of two of the three watersheds approved in the current Section 404 permit as a disposal site for dredged or fill material. By separate action, Mingo Logan sued the EPA on April 2, 2010 in federal court in Washington, D.C. seeking a ruling that the EPA has no authority under the Clean Water Act to veto a previously issued permit (Mingo Logan Coal Company, Inc. v. USEPA, No. 1:10-cv-00541(D.D.C.)). The EPA moved to dismiss that action, and we responded to that motion.Pursuant to a scheduling order for summary disposition of the case, motions and cross-motions for summary judgment by both parties were filed. On November 30, 2011, the court heard arguments from the parties limited only to the thresholdissue of whether the EPA had the authority under Section 404(c) of the Clean Water Act to withdraw the specification of the disposal site after the Corps had already issued a permit under Section 404(a). The court deferred consideration of the remaining issue (i.e. whether the EPA’s “Final Determination” is otherwise lawful) until after consideration of the threshold issue. On March 23, 2012, the court entered an Order and a Memorandum Opinion granting Mingo Logan’s motion for summary judgment, denying the EPA’s cross-motion for summary judgment, vacating the Final Determination and ordering that Mingo Logan’s Section 404 permit remains valid and in full force.On May 11, 2012, the EPA filed a notice of appeal to the United States Court of Appeals for the District of Columbia Circuit. The court heard oral arguments on March 14, 2013. By opinion of the court filed on April 23, 2013, the court reversed the district court on the threshold issue and remanded the matter to the district court to address the merits of our APA challenge to the Final Determination. On June 6, 2013, Mingo Logan filed a Petition for Rehearing En Banc and by Order filed July 25, 2013, the court denied the petition.On November 13, 2013, Mingo Logan filed a Petition for Writ of Certiorari with the Supreme Court of the United States seeking review of the D.C. Circuit’s decision. On March 24, 2014, the Supreme Court denied Mingo Logan’s Petition for Writ of Certiorari and remanded the matter to the federal district court for the District of Columbia for further consideration on the merits of the Final Determination. On September 30, 2014, the court entered an opinion and order denying Mingo Logan’s motion for summary judgment and granting the government’s motion for summary judgment. The court upheld the Final Determination finding that EPA’s decision to withdraw the specifications for filling in Oldhouse Branch and Pigeonroost Branch under Mingo Logan’s Section 404 permit was not arbitrary and capricious. On November 11, 2014, Mingo Logan filed a notice of appeal to the United States Court of Appeals for the District of Columbia Circuit. The matter is fully briefed and oral argument is scheduled for April 11, 2016.UMWA 1974 Pension Plan et al. v Peabody Energy and ArchOn July 16, 2015, the UMWA 1974 Pension Trust (“Plan”) and its Trustees filed a Complaint for Declaratory Judgment against Peabody Energy Corporation, Peabody Holding Company, LLC and Arch, in the U.S. District Court in Washington D.C., seeking an order from the court requiring the defendants to submit to arbitration to determine their responsibility for pension withdrawal liability (triggered by Patriot Coal Corporation’s (“Patriot”) recent bankruptcy filing) for Plan participants of Patriot who formerly worked for Peabody and Arch subsidiaries. In the alternative, the complaint asks the court to declare that Peabody and Arch are liable for Patriot’s withdrawal liability. With respect to Arch, plaintiffs allege that Arch engaged in actions to avoid and evade pension fund withdrawal liability when it sold subsidiaries that were signatory to UMWA agreements, to Magnum Coal Company (“Magnum”) in 2005, allegedly in violation of ERISA law. Patriot subsequently purchased Magnum in 2008. On October 29, 2015, plaintiffs filed an amended complaint to reflect that Patriot formally rejected its obligations to contribute to the Plan, triggering a withdrawal. The amended complaint further alleged that Arch owes $299.8 million in withdrawal liability. On October 29, 2015, the UMWA Funds issued a letter to Arch demanding payment of this withdrawal liability amount. We believe there is no basis in the law to support any claim that Arch is responsible for Patriot’s withdrawal liability and we plan to vigorously defend this complaint. Arch notified the District Court and the parties to the litigation of its bankruptcy filing and the automatic stay and, on January 21, 2016, the plaintiffs agreed that the automatic stay in the Chapter 11 Case applies to Arch and its affiliates that have filed bankruptcy petitions.2015.2017.48 Market for Registrant’s Common Equity and Related Stockholder MattersOn January 11, 2016,(NYSE) determined that Arch was no longer suitable(“NYSE”) under the symbol “ARCH” and has been trading since October 5, 2016 upon our emergence from bankruptcy. No prior established public trading market existed for listing pursuant to Section 8.02.01D of the NYSE continued listing standards, and trading of the Company’sthis newly issued common stock was suspended. Our stock is now traded under the ticker symbol “ACIIQ” on the OTC Pink marketplace, operatedprior to this date. Based upon information provided by OTC Markets Group Inc. Prior to January 11, 2016,our transfer agent, as of February 16, 2018, we had four stockholders of record.was traded on the NYSE under the symbol “ACI.” On February 12, 2016,are entitled to receive dividends when they are declared by our common stock closed at $0.47 on the OTC Pink. On that date, there were approximately 5,400 holdersBoard of record of our common stock.On August 4, 2015, the Company effected a 1-for-10 reverse stock split of its common stock. Each stockholder’s percentage ownership and proportional voting power remain unchanged as a result of the reverse stock split. All applicable share data, per share amounts and related information enclosed have been adjusted retroactively to give effect to the 1-for-10 reverse stock split.In 2014, weDirectors. We paid an annual dividenddividends on our common stock totaling $2.1$24.4 million in 2017. There is no assurance as to the amount or $0.10 per share. In 2015 we did not pay an annual dividend. We are prohibited from payingpayment of dividends on our common stock during Chapter 11.We expect thatin the existing common stock of the Companyfextinguished uponsubject to ongoing Board review and authorization will be based on a number of factors, including business and market conditions, the Company’s emergence from Chapter 11,future financial performance and existing equity holders will likely not receive consideration in respect of their equity interests.saleclosing prices offor our common stock as reported on the NYSE for eachthe periods presented: High Low Dividends per common share Year Ended December 31, 2017 First quarter $ 79.27 $ 63.24 $ — Second quarter 77.59 60.13 0.35 Third quarter 81.09 67.39 0.35 Fourth quarter 94.57 68.95 0.35 Year Ended December 31, 2016 First quarter $ — $ — $ — Second quarter — — — Third quarter — — — Fourth quarter (from October 5, 2016) 86.47 59.05 — 49 quarterly periods indicated.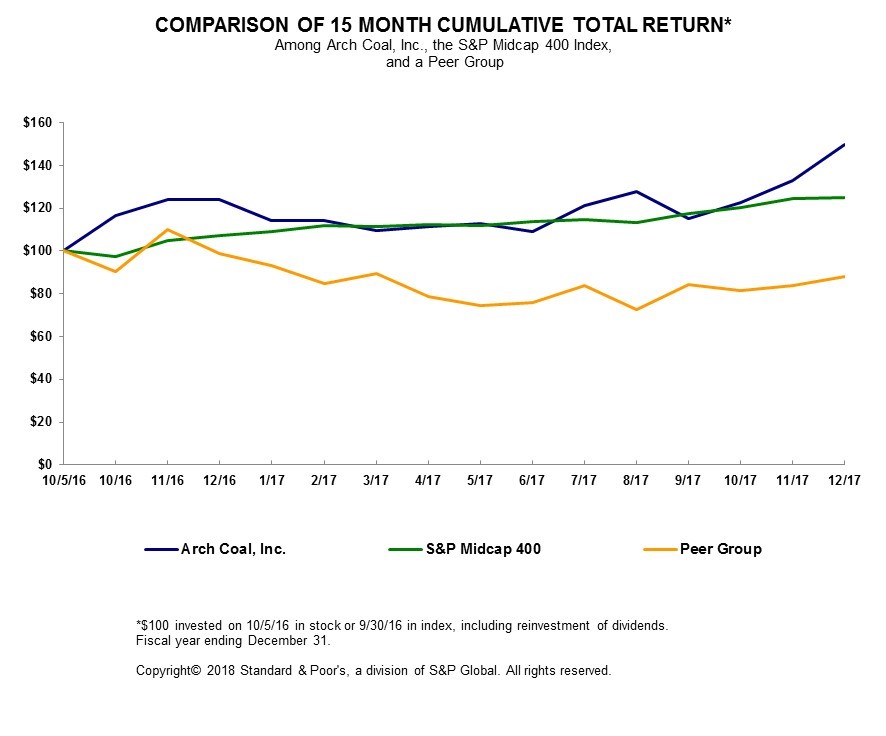
10/5/2016 10/16 11/16 12/16 1/17 2/17 3/17 4/17 Arch Coal, Inc. 100.00 116.48 123.86 123.89 114.27 114.06 109.43 111.49 S&P Midcap 400 100.00 97.32 105.12 107.42 109.22 112.08 111.65 112.58 Peer Group 100.00 90.38 110.03 99.01 93.25 84.56 89.55 78.93 5/17 6/17 7/17 8/17 9/17 10/17 11/17 12/17 Arch Coal, Inc. 112.88 108.94 121.33 127.97 114.94 122.44 132.87 149.93 S&P Midcap 400 112.03 113.85 114.85 113.09 117.52 120.18 124.59 124.87 Peer Group 74.35 75.91 83.97 72.58 84.44 81.29 83.65 87.92 50 In September 2006, our boarddirectorsDirectors of Arch Coal, Inc. authorized a new share repurchase program for the purchase of up to 1,400,000$300 million of its common stock. In October 2017, the Company’s Board of Directors approved an incremental $200 million increase to the share repurchase program bringing the total authorization to $500 million. Below is a table showing the share repurchase activity in 2017:2017: Total Number of Shares Purchased Average Price Paid per Share Total Number of Shares Purchased as Part of Publicly Announced Program Approximate Dollar Value of Shares that May Yet Be Purchased Under the Plan (in thousands) 1st quarter — $ — — $ — 2nd quarter 710,701 $ 71.82 710,701 448,957 3rd quarter 2,208,133 $ 75.49 2,208,133 282,272 4th quarter 1,058,381 $ 79.73 1,058,381 197,892 Total shares repurchased 3,977,215 $ 75.96 3,977,215 ourits common stock. We did not purchase anyThe actual number and value of the shares to be purchased will depend on the performance of our commonthe Company’s stock under this programprice and other market conditions.51 Successor Predecessor (In thousands, except per share data) Year Ended December 31, 2017 October 2 through December 31, 2016 January 1 through October 1, 2016 Year Ended December 31, 2015 Year Ended December 31, 2014 Year Ended December 31, 2013 Statement of Operations Data: (1) (1) (2) (3) Revenues $ 2,324,623 $ 575,688 $ 1,398,709 $ 2,573,260 $ 2,937,119 $ 3,014,357 Asset impairment and mine closure costs — — 129,267 2,628,303 24,113 220,879 Goodwill impairment — — — — — 265,423 Income (loss) from operations 232,396 46,118 (257,138 ) (2,865,063 ) (149,531 ) (663,141 ) Interest expense (26,905 ) (11,241 ) (135,888 ) (397,979 ) (390,946 ) (381,267 ) Non-operating expenses (4,945 ) (759 ) 1,627,828 (27,910 ) — (42,921 ) Income (loss) from continuing operations 238,450 33,449 1,242,081 (2,913,142 ) (558,353 ) (745,228 ) Net income (loss) attributable to Arch Coal 238,450 33,449 1,242,081 (2,913,142 ) (558,353 ) (641,832 ) Basic earnings (loss) per common share $ 10.05 $ 1.34 $ 58.33 $ (136.86 ) $ (26.31 ) $ (30.26 ) Diluted earnings (loss) per common share $ 9.84 $ 1.31 $ 58.28 $ (136.86 ) $ (26.31 ) $ (30.26 ) Balance Sheet Data: Total assets $ 1,979,632 $ 2,136,597 $ 2,123,829 $ 5,041,881 $ 8,346,362 $ 8,896,571 Working capital 496,913 566,391 522,465 (4,361,009 ) 1,023,357 1,293,849 Current maturities of debt 15,783 11,038 6,662 5,042,353 12,191 14,419 Long-term debt, less current maturities 310,134 351,841 353,272 30,953 5,064,818 5,043,454 Other long-term obligations 669,552 725,948 786,015 755,283 695,881 717,174 Noncurrent deferred income tax liability — — — — 422,809 413,546 Arch Coal stockholders’ equity 665,865 746,577 687,483 (1,244,289 ) 1,668,154 2,253,249 Cash Flow Data: Cash provided by (used in) operating activities 396,473 84,192 (228,218 ) (44,367 ) (33,582 ) 55,742 Depreciation, depletion and amortization, including amortization of sales contracts, net 176,449 33,400 190,853 370,534 405,561 438,247 Capital expenditures 59,205 15,214 82,434 119,024 147,286 296,984 Net proceeds from the issuance of long term debt 298,500 — — — (4,519 ) 623,511 Payments to retire debt, including redemption premium 325,684 — — — — 628,660 Purchases of treasury stock 301,512 Dividend payments 24,369 — — — 2,123 25,475 Operating Data: Tons sold 98,218 26,812 67,128 127,632 134,360 139,607 Tons produced 96,686 26,619 66,658 126,820 132,614 136,613 Tons purchased from third parties 1,532 193 481 1,287 1,182 2,925 52 Our 2016 results were impacted by the filing of bankruptcy, subsequent emergence and the application of fresh start accounting. See Note 3 to the Consolidated Financial Statements, “Emergence from Bankruptcy and Fresh Start Accounting” for additional information. Our results in 2015 were impacted by further weakening of both the thermal and metallurgical coal markets. We incurred $2.6 billion of mine closure and asset impairment charges during the year; for additional information see Note 6 to the Consolidated Financial Statements, “Impairment Charges and Mine Closure Costs.” As part of a strategy to divest non-core thermal coal assets, on August 16, 2013, we sold Canyon Fuel Company, LLC (“Canyon Fuel”) to Bowie Resources, LLC for $423 million. Canyon Fuel operated the Sufco and Skyline longwall mining complexes and the Dugout Canyon continuous miner operation in Utah. We recognized a gain on the sale of Canyon Fuel, net of tax, of $77.0 million during the third quarter of 2013. fiscal year ended December 31, 2015. As of2017; the period October 2 through December 31, 2016, the period from January 1 through October 1, 2016, and the years ended December 31, 2015, we have purchased 307,420 shares of2014 and 2013 was derived from, and is qualified by, reference to our common stock under this program sinceConsolidated Financial Statements, including the board of directors authorized the program. We are prohibited from purchasing shares under this program during Chapter 11.ITEM 6. SELECTED FINANCIAL DATA.(1) Our resultsnotes thereto, contained elsewhere herein. The selected financial information should be read in 2015 were impacted by further weakening of both the thermal and metallurgical coal markets. We incurred $2.6 billion of mine closure and asset impairment charges during the year; for additional information see Note 5 toconjunction with the Consolidated Financial Statements “Impairment Charges and Mine Closure Costs.related notes and Item 7, “Management’s Discussion and Analysis of Financial Condition and Results of Operations.”(2) The filingBankruptcy Petitions constituted an eventapplication of default that accelerated our obligations underfresh start accounting as of the documents governing each of our 7.00% senior notes due 2019, 9.875% senior notes due 2019, 8.00% senior secured second lien notes due 2019, 7.25% senior notes due 2020, 7.25% senior notes due 2021 and senior secured first lien term loan due 2018.(3) As part of a strategyPlan Effective Date, the financial statements on or prior to divest non-core thermal coal assets, on August 16, 2013, we sold Canyon Fuel Company, LLC (“Canyon Fuel”)October 1, 2016 are not comparable with the financial statements after October 1, 2016. References to Bowie Resources, LLC for $423 million. Canyon Fuel operated the Sufco and Skyline longwall mining complexes and the Dugout Canyon continuous miner operation in Utah. We recognized a gain on the sale of Canyon Fuel, net of tax, of $77.0 million during the third quarter of 2013. See Note 3“Successor” refer to the Consolidated Financial Statements, “Divestitures,” for further information.(4) Our results in 2012 were impacted by challenging market conditions. In response to these conditions, we idled 10 mines in Appalachia and curtailed production at other thermal mines. We incurred $523.6 million of closure and impairment costs relatingCompany after October 1, 2016, after giving effect to the closures, and recognized goodwill impairment charges $330.7 million. In addition, we refinanced our debt, increasing our average borrowing levelapplication of fresh start accounting; references to build cash and highly liquid investments on the balance sheet as well as to decrease near-term maturities of debt.(5) �� On June 15, 2011, we completed our acquisition of ICG, a leading coal producer, adding 12 mining complexes in Appalachia, one complex in the Illinois Basin and one mine under development in Appalachia, along with other coal reserves not currently in development. To finance the acquisition, we sold 48.7 million shares of our common stock and issued $2.0 billion in aggregate principal amount of senior unsecured notes. We directly expensed costs related“Predecessor” refer to the financing and acquisition of $104.2 million. 2015 were impacted by further weakening of both the metallurgical and international thermal and metallurgical coal markets. Themarkets, while the domestic thermal market was depressed bylargely stable. Metallurgical coal markets remained volatile throughout 2017 with several notable spikes in prompt international pricing. Despite the volatility, prompt international pricing at all times in 2017 remained at levels that supported significant cash margins for our low cost metallurgical operations. We believe the volatility seen in 2017 is an indication of a global market that is in fairly tight balance. Years of global underinvestment in the industry and a return of more robust economic growth have led to a supply and demand balance that is sensitive to any significant supply disruption. Throughout the prompt pricing volatility of 2017 our realized net back prices remained fairly stable. This stability was due to having committed and priced significant volumes prior to the beginning of the year, and timing of specific index based pricing mechanisms and pricing negotiations. Future volatility in prompt international pricing will likely have a greater impact on realized net back pricing as we have elected to sell less of our planned 2018 production volumes on a full year fixed price basis.and the implementation of new environmental regulations. Abundant supply depressed naturalhigher. Natural gas pricing at the levels encountered in 2017 allowed some thermal coals, particularly Powder River Basin coals, to levels that made it increasingly economical to dispatchcompete economically for electric generation relative to thermal coal. Implementationin many regions of the MATS regulation resulted incountry. Throughout the closureyear, international thermal markets supported west coast export shipments from certain of some older coal-based generating facilities, further depressing domestic thermal coal demand. Pricingour operations. Additionally, pricing in international thermal coal markets was uneconomicstrengthened in the second half of the year increasing the opportunity for certain of our operations throughout 2015.Metallurgicalto economically ship coal markets continued to weaken due to oversupply. International metallurgical markets have been impacted byinto both the economic slowdown in ChinaAtlantic and elsewhere. Furthermore, producers in the U.S. have been pressured by the strengtheningPacific thermal coal markets.dollar compared to other producing countries’ currencies. Many foreign producers benefited significantly from this strengthening as much of their cost structure is tied to their local currencies, but their revenue is largely generated in United States dollars. Additionally, domestic demand for metallurgical coal softened in 2015 as blast furnace utilization has dropped, largely due to declining demand for steel in the oil and gas industry.Despite lower volumes, we reduced cash costs per ton in our Powder River Basin and Appalachian regions compared to 2014. In Appalachia we shifted production to lower cost operations, particularly the Leer Mine, and in the Powder River Basin we benefited from lower diesel fuel pricing. Both regions benefited from a strong focus on cost control. We continue cost control efforts throughout the business, and further reduced our capital outlays from 2014 levels.“Bankruptcy “Bankruptcy Petitions”) under Chapter 11 of Title 11 of the U.S. Code (the “Bankruptcy Code”) in the United States Bankruptcy Court for the Eastern District of Missouri (the “Court”). The Debtor’sDebtors’ Chapter 11 Cases (collectively, the “Chapter 11 Cases”) are beingwere jointly administered under the caption In re Arch Coal, Inc., et al. Case No. 16-40120 (lead case). EachDuring the Chapter 11 Cases, each Debtor will continue to operateoperated its53 The filingBankruptcy Petitions constituted an eventPlan provisions and the application of default that accelerated Arch’s obligations underfresh start accounting.Debt Instruments, all asyear ended December 31, 2017 and the period from October 2 through December 31, 2016: Successor Year Ended December 31, 2017 October 2 through December 31, 2016 (In thousands) Coal sales $ 2,324,623 $ 575,688 Tons sold 98,218 26,812 describedinformation about regional results. Successor Year Ended December 31, 2017 October 2 through December 31, 2016 (In thousands) Cost of sales (exclusive of items shown separately below) $ 1,843,093 $ 470,644 Depreciation, depletion and amortization 122,464 32,604 Accretion on asset retirement obligations 30,209 7,634 Amortization of sales contracts, net 53,985 796 Change in fair value of coal derivatives and coal trading activities, net 7,222 396 Selling, general and administrative expenses 149,314 86,821 22,836 Gain on sale of Lone Mountain Processing, Inc. (21,297 ) — Other operating (income) expense, net (30,270 ) (5,340 ) Total costs, expenses and other $ 2,092,227 $ 529,570 54 26, “Subsequent Events”,3 to the Consolidated Financial Statements, included“Emergence from Bankruptcy and Fresh Start Accounting.” Form 10-K. PursuantPowder River Basin. Successor Year Ended December 31, 2017 October 2 through December 31, 2016 (In thousands) Net loss resulting from early retirement of debt and debt restructuring $ (2,547 ) $ — Reorganization income (loss), net $ (2,398 ) $ (759 ) Total nonoperating expense $ (4,945 ) $ (759 ) Code,and Fresh Start Accounting”, and Note 14, “Debt and Financing Arrangements.”55 filingyear ended December 31, 2017 and the period from October 2 through December 31, 2016: Successor Year Ended December 31, 2017 October 2 through December 31, 2016 (In thousands) Provision for (benefit from) income taxes $ (35,255 ) $ 1,156 Bankruptcy Petitions automatically stayed most actions againstcorporate alternative minimum tax regime effective for tax years beginning after December 31, 2017, implementation of a process whereby corporations with unused alternative minimum tax credits will be refunded during 2018-2022, the Debtors, including most actionstransition of U.S. international taxation from a worldwide tax system to collect indebtedness incurred priora territorial system, a one-time transition tax on the mandatory deemed repatriation of cumulative foreign earnings as of December 31, 2017, further limitation on the deductibility of certain executive compensation, allowance for immediate capital expensing of certain qualified property, and limitations on the amount of interest expense deductible beginning in 2018. We have provided our best estimate of the impact of the Act in our year-end income tax provision in accordance with our understanding of the Act and guidance available as of the date of this filing and as a result have recorded $35.7 million as an additional income tax benefit in the fourth quarter of 2017, the period in which the legislation was enacted. A $35.7 million benefit was recorded from the release of a valuation allowance offsetting alternative minimum tax credits that have become refundable by the Act, as well as carryback claims filed in the fourth quarter related to specified liability losses that resulted in claims for refund of previously paid alternative minimum taxes. See further discussion in Note 15, to the Petition DateConsolidated Financial Statements “Taxes.”56 exercise control overevaluate the Debtors’ property.Additionally, on the Petition Date, the New York Stock Exchange (the “NYSE”) determinedCompany’s operating performance. Investors should be aware that our common stock was no longer suitable for listing pursuantpresentation of Adjusted EBITDAR may not be comparable to Section 8.02.01D of the NYSE continued listing standards and trading in our common stock was suspended on January 11, 2016. We expect that the existing common stock of the Company will be extinguished upon the Company’s emergence from Chapter 11 and existing equity holders will not receive consideration in respect of their equity interests.We expect that our financial results will be significantly impactedsimilarly titled measures used by the filing of the Bankruptcy Petitions. For example, the Debtors’ pre-petition unsecured obligations are subject to compromise and may be settled under a plan of reorganization for lesser amounts than the original claims. These liabilities remain subject to future adjustments arising from negotiated settlements, actions of the Court, rejection of executory contracts and unexpired leases, the determination as to the value of collateral securing the claims, proofs of claim, or other events. Additionally, under Section 502(b)(2) of the Bankruptcy Code, we are no longer required to pay interest on our senior unsecured notes and our senior secured notes accruing on or after the Petition Date. Subject to certain exceptions under the Bankruptcy Code, the filing of the Debtors’ Chapter 11 Cases pursuant to Section 362(a) of the Bankruptcy Code also automatically stayed the continuation of most legal proceedings, including the third party litigation matters described under Item 3, “Legal Proceedings—Permit Litigation Matters,” or the filing of other actions against or on behalf of the Debtors or their property to recover on, collect or secure a claim arising prior to the Petition Date or to exercise control over property of the Debtors’ bankruptcy estates, unless and until the Court modifies or lifts the automatic stay as to any such claim. The determination of how liabilities will ultimately be treated cannot be made until the Court approves a plan of reorganization. Accordingly, the ultimate amount or treatment of such liabilities is not determinable at this time.Operational Performanceyearsyear ended December 31, 2015, 20142017 and 2013. The “other” category includes the results of our other bituminous thermal operations, our West Elk mining complex in Colorado and our Viper mining complex in Illinois. Successor Year Ended December 31, 2017 October 2 through December 31, 2016 Powder River Basin Tons sold (in thousands) 80,604 21,824 Coal sales per ton sold $ 12.49 $ 12.41 Cash cost per ton sold $ 10.53 $ 9.88 Cash margin per ton sold $ 1.96 $ 2.53 Adjusted EBITDAR (in thousands) $ 158,882 $ 55,765 Metallurgical Tons sold (in thousands) 8,192 2,442 Coal sales per ton sold $ 90.17 $ 65.61 Cash cost per ton sold $ 60.76 $ 52.98 Cash margin per ton sold $ 29.41 $ 12.63 Adjusted EBITDAR (in thousands) $ 243,616 $ 30,819 Other Thermal Tons sold (in thousands) 9,205 2,510 Coal sales per ton sold $ 34.85 $ 34.01 Cash cost per ton sold $ 24.20 $ 21.79 Cash margin per ton sold $ 10.65 $ 12.22 Adjusted EBITDAR (in thousands) $ 102,006 $ 31,159 EBITDAEBITDAR for the year ended December 31, 2017 reflects relatively stable natural gas prices throughout the year at levels that allowed Powder River Basin coal to be competitive for electric generation in many regions of the country. Our tons sold volume fluctuated throughout the year with seasonal increases and decreases in heating and cooling demand. Customers in general are shifting to shorter term purchase contracts, and more actively managing delivery volumes to match their seasonal demand fluctuations. Our cash cost per ton sold was impacted by these volume fluctuations and increased 31%diesel pricing. We are actively managing our operations to enhance our flexibility to respond to these volume fluctuations efficiently. Our focus remains on cost control efforts in 2015 when comparedthis dynamic market. We expect future demand for Powder River Basin coal will be largely dependent on natural gas pricing and seasonal demand factors.57 2014 dueslightly declining natural gas production. Cost control efforts included adjusting operations to increasedalign with current market volume expectations.and decreased cost per ton sold,was partially offset by lower shipment volume. Pricing improved asthe related increase in royalties and operating taxes. During the third quarter of the year, we experienced adverse geologic conditions at both the Leer and Mountain Laurel longwall operations, limiting production volume at that time. Conditions at those operations returned to a significant portion of 2015 shipments were priced following the harsh 2013-2014 winter season when the market was stronger. Cost benefited from lower diesel fuel pricing and ongoing cost control efforts. Shipment volume was favorable year over year through the first three quarters of 2015, but fell off significantlymore normal state later in the fourth quarter of 2015, reducing full year shipment volume below 2014 levels. Natural gas pricing fell to historically low levels as the 2015 winter season began mildly, and the competing fuel began to dispatch for electrical generation ahead of Power River Basin coal in some areas. This decrease in coal burn has led to increasing generator stockpiles, further depressing demand.Adjusted EBITDA decreased in 2014 when compared to 2013 due to a slight decrease in shipment volume and higher cost per ton sold, partially offset by increased coal sales per ton sold. Pricing improved as low-priced export volume decreased and domestic markets firmed in 2014. Maintenance costs increased in anticipation of increased shipment volume; however, railroad performance issues negatively impacted Powder River Basin shipmentyear. Sales volumes for much of 2014.Appalachia —Adjusted EBITDA decreased 24% in 2015 when compared to 2014 due primarily to the gain on sale of operating and idled thermal coal mines in Kentucky in 2014 ($20.6 million). See Note 3, “Divestitures,” to the Consolidated Financial Statements for further discussion. 2015 adjusted EBITDA waswere also negatively impacted at year end by reduced volumelogistics and reducedweather issues that pushed some scheduled shipments out of the year. Our metallurgical segment sold 6.4 million tons of coking coal sales per ton sold, partially offset by decreased cost per ton sold. Volume was negatively impacted by the asset sales previously mentioned and further deterioration in both the1.8 million tons of associated thermal and metallurgical markets. We were able to partially offsetPCI coal in the effects of the negative volume and pricing through productivity gains and continuing to shift volume to lower cost operations.year ended December 31, 2017. Longwall operations accounted for 41%approximately 57% of our shipment volume in 2015 versus 31%the year.2014.Adjusted EBITDA increasedinternational pricing for metallurgical coal. Supply shortages driven by a Chinese mandate to restrict its domestic supply, supply rationalization in 2014 when comparedNorth America, years of global underinvestment in the industry, and some specific international supply disruptions, particularly in Australia, resulted in a significant increase in international prompt metallurgical coal prices. Our ability to 2013take advantage of the rapid increase in prompt international pricing was muted due to having significant volumes for the gain on saleperiod committed and priced prior to the rapid increase. Our metallurgical segment sold 1.9 million tons of operatingmetallurgical coal and idled0.5 million tons of associated thermal coal mines in Kentucky ($20.6 million). See Note 3, “Divestitures,”the period from October 2 through December 31, 2016. Longwall operations accounted for approximately 55% of our shipment volume in the period. Late in the period prompt international metallurgical pricing began to retreat as loosening of Chinese supply restrictions and easing of supply disruptions began to mitigate the supply shortage.Consolidated Financial StatementsPacific international thermal markets. Later in the year Atlantic international thermal coal prices rose to levels that made export opportunities economic for further discussion. The gains were partially offset byour Coal Mac operation.impact of an increaseperiod from October 2 through December 31, 2016 benefited from the increased natural gas pricing discussed in per ton operating losses, caused by lower pricing for both metallurgical and thermal coal. The startup of the longwall at the Leer mining complex, the idling and divesting of higher-cost production, and lower sales-sensitive costs contributed to lower per-ton costs, which largely offset the impact of lower sales pricing.Other — Adjusted EBITDA decreased in 2015 and 2014 when compared with the respective prior year due to reduced benefit from coal risk management settlements,Powder River Basin segment discussion above, and increased liquidated damages on logistics contracts. 2015 was also negatively impacted byinternational thermal prices. These benefits were primarily recognized at our West Elk operation where domestic opportunities increased and export opportunities became economic. Partially offsetting those positive trends were operating issues at our Viper operation’s largest customer that significantly reduced sales volume related to low-priced natural gas, and further deterioration of overseas markets.Items impacting comparability of resultsWe recorded tangible asset impairment - Predecessormine closure charges of approximately $2,628.3 million, $24.1 million, and $220.9 million during 2015, 2014 and 2013, respectively.We recorded goodwill impairment charges of $265.4 million during 2013.As part of a strategy to divest non-core thermal coal assets, on August 16, 2013, we sold Canyon Fuel Company, LLC (“Canyon Fuel”) to Bowie Resources, LLC for $422.7 million. Canyon Fuel operated the Sufco and Skyline longwall mining complexes and the Dugout Canyon continuous miner operation in Utah. We recognized a gain on the sale of Canyon Fuel, net of tax, of $77.0 million. The results of Canyon Fuel, including the gain on sale, are presented as discontinued operations. See Note 3 to the Consolidated Financial Statements, “Divestitures,” for further information. Compared to Year Ended December 31, 2014consistinclude sales to customers of coal produced at our operations and coal purchased from third parties. Transportation costs are included in cost of coal sales and revenues fromamounts billed by us to our ADDCAR subsidiary prior to its dispositioncustomers for transportation are included in the first quarter of 2014.duringfor the period from January 1 through October 1, 2016 and the year ended December 31, 2015. Predecessor January 1 through October 1, 2016 Year Ended December 31, 2015 (In thousands) Coal sales $ 1,398,709 $ 2,573,260 Tons sold 67,128 127,632 58 compares it with the information17% Other. Tons sold for the year ended December 31, 2014:Coal sales decreased in the year ended December 31, 2015 from the year ended December 31, 2014 on a consolidated basis, primarily due to lower tons sold and pricing in our Appalachianby segment resulting inwere approximately a $274 million reduction in coal sales revenue. Volume reductions accounted for approximately 64% of the decrease and lower prices approximately 36% of the decrease. Lower85% Powder River Basin, 7% Metallurgical, and Other tons sold reduced coal sales approximately $34 million and $42 million, respectively.8% Other. See discussion in “Operational Performance” abovebelow for further information about regional results.20152015. Predecessor January 1 through October 1, 2016 Year Ended December 31, 2015 (In thousands) Cost of sales (exclusive of items shown separately below) $ 1,264,464 $ 2,172,753 Depreciation, depletion and amortization 191,581 379,345 Accretion on asset retirement obligations 24,321 33,680 Amortization of sales contracts, net (728 ) (8,811 ) Change in fair value of coal derivatives and coal trading activities, net 2,856 (1,583 ) Asset impairment and mine closure costs 129,267 2,628,303 Losses from disposed operations resulting from Patriot Coal bankruptcy 149,314 — 116,343 Selling, general and administrative expenses 59,343 98,783 Other operating (income) expense, net (15,257 ) 19,510 Total costs, expenses and other $ 1,655,847 $ 5,438,323 compares it with the informationsupplies (approximately 34%), operating taxes and royalties (approximately 21%), and transportation costs (approximately 10%). Our cost of sales for the year ended December 31, 2014:Cost2015 consisted primarily of sales.labor related costs (approximately 28%), repairs and supplies (approximately 36%), operating taxes and royalties (approximately 23%), and transportation costs (approximately 9%). See discussion in “Operational Performance” below for information about segment cost results.costdepreciation, depletion and amortization costs for the period from January 1 through October 1, 2016 consist of sales decreased indepreciation of plant and equipment (approximately 55%), depletion of reserves (approximately 34%), and amortization of development costs (approximately 11%). Our depreciation, depletion and amortization costs for the year ended December 31, 2015 from the year ended December 31, 2014, due to lower transportation costs on lower export sales volumes (a decreaseconsist of approximately $66 million)depreciation of plant and equipment (approximately 50%), lower diesel fueldepletion of reserves (approximately 38%), and amortization of development costs (approximately $88 million), improved productivity at12%).Leer longwall operation (approximately $28 million), savings associated with one soldasset retirement obligation for the period from January 1 through October 1, 2016, and two idled Appalachian complexes (approximately $77 million), lower sales sensitive costs (approximately $30 million), and other savings associated with cost-control efforts across all regions. See discussion in “Operational Performance” above66% of the accretion on our asset retirement obligation for information about regional cost results.Depreciation, depletion and amortization. When compared with the year ended December 31, 2014, depreciation, depletion and amortization costs decreased in the year ended December 31, 2015 duewas attributable to our large surface operations in the effect of lower production and sales volume, continued low capital spending levels, and the effect of the significant asset impairments at the end of the third quarter of 2015.Continued During the period from January 1 through October 1, 2016 we received notification of intent to idle operations by a third party to whom we leased certain Appalachian reserves. As a result of the idling and weakness in the thermal coal market, we determined that the value of these reserves was impaired. Also during this period we relinquished our interest in Millennium Bulk Terminal while retaining future throughput rights. As a result of the sale, our remaining equity investment in Millennium was impaired. assets. Our testing indicated impairment of several active and undeveloped properties. Impairment costs in the year ended December 31, 2015 include a significant portion of our assets at three current operating complexes, and a significant portion of our undeveloped coal reserves value. In59 third quarterperiod from January 1 through October 1, 2016 consist primarily of 2014, we idled a metallurgical coal mining complex in Appalachia, where we had previously idled two contract mining operations. See Note 5, “Impairment Chargescompensation costs of $38.5 million, and Mine Closure Costs,” toprofessional services and usage and maintenance agreements of $12.0 million. For the Consolidated Financial Statements for further discussion.relating toresulting from the Patriot Coal bankruptcy. In the year ended December 31, 2015 we recorded liabilities related to reclamation and employee obligations that we inherited as a result of the Patriot Coal bankruptcy. See further information regarding the losses related to the Patriot Coal bankruptcy in Note 7, “Losses“Losses from disposed operations resulting from Patriot Coal bankruptcy”bankruptcy,” to the Consolidated Financial Statements.Selling, general and administrative expenses. Total selling, general and administrative expenses decreased when compared with the year ended December 31, 2014, primarily due to decreased compensation costs of $13.8 million. (income), net. When compared withOther operating (income) expense, net for the year ended December 31, 2014, otherperiod from January 1 through October 1, 2016 consists primarily of miscellaneous revenues including royalties and net gains on asset sales of $18.1 million and net income from equity investments of $5.3 million, partially offset by miscellaneous expenses primarily related to our land company of $8.1 million. Other operating (income) expense, (income), net decreased duringfor the year ended December 31, 2015 as a resultconsists primarily of increased costsliquidated damages on logistics contracts of $16.4$52.9 million and miscellaneous expenses primarily related to shortfalls under throughput arrangements, and lower net gains from salesour land company of assets of $37.1 million. These were$20.7 million partially offset by a $24 million gain onfrom a contract settlement, in 2015. Predecessor January 1 through October 1, 2016 Year Ended December 31, 2015 (In thousands) Net loss resulting from early retirement of debt and debt restructuring $ (2,213 ) $ (27,910 ) Reorganization income (loss), net 1,630,041 — Total non-operating (expense) benefit $ 1,627,828 $ (27,910 ) and compares it with the information for the year ended December 31, 2014:Amounts reported as nonoperating consist of expenses resulting from financing activities, other than interest costs. In 2015, we incurred $24.2 million of legal and financial advisory fees associated withrelated to our various debt restructuring efforts. Additionally, inactivities. For further information on our successful reorganization, please see Note 3 to the fourth quarter of 2015 we terminated our revolving credit agreement resulting in the write-off of $3.7 million of deferred financing costs.Provision for (benefit from)Emergence from Bankruptcy and Fresh Start Accounting.”year ended December 31, 2015period from January 1 through October 1, 2016 and compares it with the information for the year ended December 31, 2014: Predecessor January 1 through October 1, 2016 Year Ended December 31, 2015 (In thousands) Benefit from income taxes $ (4,626 ) $ (373,380 ) compared to the income tax provision in the year ended December 31, 2014 was largely due to the approximately $2.6 billion increase in asset impairment losses recorded in the current year2015, partially offset by the increase of a valuation allowance relating to both federal and state net operating loss carryforwards. See further discussion in Note 15 “Taxes,” to the Consolidated Financial Statements, “Taxes,”.60 further discussion.Year Ended December 31, 2014 Compareditems that may not reflect the trend of future results by excluding transactions that are not indicative of our core operating performance. Adjusted EBITDAR is not a measure of financial performance in accordance with generally accepted accounting principles, and items excluded from Adjusted EBITDAR are significant in understanding and assessing our financial condition. Therefore, Adjusted EBITDAR should not be considered in isolation, nor as an alternative to Year Ended December 31, 2013Revenues. Our revenues consistnet income, income from operations, cash flows from operations or as a measure of coal sales and revenues from our ADDCAR subsidiary priorprofitability, liquidity or performance under generally accepted accounting principles. Furthermore, analogous measures are used by industry analysts to its disposition inevaluate the first quarterCompany’s operating performance. Investors should be aware that our presentation of 2014.Coal sales. Adjusted EBITDAR may not be comparable to similarly titled measures used by other companies.compares information aboutshows operating results of continuing coal sales duringoperations for the Predecessor periods January 1 through October 1, 2016 and the year ended December 31, 2014 with2015. Predecessor January 1 through October 1, 2016 Year Ended December 31, 2015 Powder River Basin Tons sold (in thousands) 54,911 108,481 Coal sales per ton sold $ 13.01 $ 13.15 Cash cost per ton sold $ 10.95 $ 10.54 Cash margin per ton sold $ 2.06 $ 2.61 Adjusted EBITDAR (in thousands) $ 113,185 $ 281,039 Metallurgical Tons sold (in thousands) 6,692 8,352 Coal sales per ton sold $ 53.15 $ 66.62 Cash cost per ton sold $ 51.40 $ 58.36 Cash margin per ton sold $ 1.75 $ 8.26 Adjusted EBITDAR (in thousands) $ 11,851 $ 70,450 Other Thermal Tons sold (in thousands) 5,181 9,764 Coal sales per ton sold $ 36.16 $ 37.32 Cash cost per ton sold $ 30.28 $ 28.01 Cash margin per ton sold $ 5.88 $ 9.31 Adjusted EBITDAR (in thousands) $ 31,448 $ 42,734 information“Reconciliation of Non-GAAP measures” below for explanation and reconciliation of these amounts to the nearest GAAP figures. Other companies may calculate these per ton amounts differently, and our calculation may not be comparable to other similarly titled measures. 2013:Coal sales decreased2015 benefited from pricing a significant portion of 2015 tons sold following the harsh 2013-2014 winter season when the market was strong. Cost benefited from lower diesel fuel pricing and cost control efforts. Natural gas pricing fell to historically low levels due to mild winter weather in late 2015, and the competing fuel began to dispatch for electrical generation ahead of Power River Basin coal in some areas. This decrease in coal burn led to increasing generator stockpiles, further depressing demand.61 year ended December 31, 2014period from January 1 through October 1, 2016. During the year ended December 31, 2013 on a consolidated basis, primarily dueperiod we continued shifting volume to our lower cost Leer operation. Longwall operations accounted for approximately 65% of our shipment volume in the impact of lower average per-ton pricing (a decrease of approximately $66 million). Average pricing decreased slightly from $22.34 to $21.85 per ton, primarily due to declines in export shipments, as fluctuations in regional pricing offset each other. See discussion in “Operational Performance” above for further information about regional results.Costs, expenses and other.period. The following table compares costs, expenses and other components of operating income2014 with2015 was negatively impacted by declining metallurgical coal prices. Years of global oversupply from anemic economic growth and international overproduction, particularly from Australia, continued pressuring prices downward. During the informationyear we shifted volume to lower cost operations, particularly the Leer operation. Longwall operations accounted for 59% of our shipment volume in 2015.2013:Cost of sales. Our cost of sales decreased in the year ended December 31, 2014 from the year ended December 31, 2013, due to a decrease in transportation costs (approximately $83 million) and the sale of the ADDCAR subsidiary ($11.9 million). See discussion in “Operational Performance” above for information about regional cost results.Depreciation, depletion and amortization. When compared with the year ended December 31, 2013, depreciation, depletion and amortization costs decreased in the year ended December 31, 2014 due to lower overall production and capital spending levels.Asset impairment and mine closure costs. In the face of weak coal markets, management has chosen to concentrate metallurgical coal production2015 was negatively impacted by declining tons sold at our lowest-costWest Elk and highest-margin operations. In the third quarter of 2014, we idled an additional metallurgical coal mining complex in Appalachia, where we had previously idled two contract mining operations. In the third quarter of 2013, in response to market conditions, we recorded impairment chargesCoal Mac operations related to a Kentucky coal operationlow natural gas pricing and our highwall mining equipment subsidiary. In addition, we recorded an other-than-temporary impairment of investments in equity method investees and related loans receivable. See further discussion in the Consolidated Financial Statements in Note 5, “Impairment Charges and Mine Closure Costs” and Note 10, “ Equity Method Investments and Membership Interests in Joint Ventures.”Goodwill impairment. The remaining $265.4 million of goodwill from the ICG acquisition was impaired in the fourth quarter of 2013, as a result of weakness in the metallurgical coal markets. See further discussion in ‘‘Critical Accounting Policies’’ below.Selling, general and administrative expenses. Total selling, general and administrative expenses decreased when compared with the year ended December 31, 2013, due to decreases in legal and professional fees ($6.5 million), lowerliquidated damages costs related to our pension plans ($8.5 million), and decreases in discretionary spending.Other operating expense (income), net. When compared with the year ended December 31, 2013, other operating income, net decreased during the year ended December 31, 2014, primarily as a result of costs of $36.5 million in the year ended December 31, 2014 related to export shortfalls under throughput arrangements (an increase of $24.8 million from the year ended December 31, 2013), and a decrease in realized gains of $26.6 million on derivatives used to manage coal price risk. These were offset by an increase in gains on asset disposals of $22.9 million, primarily from the divestitures of mining operations in the Appalachia region and our ADDCAR subsidiary, and a decrease in contract settlement losses of $10.9 million.Non-operating expense. The following table summarizes non-operating expense for the year ended December 31, 2014 and compares it with the information for the year ended December 31, 2013:Amounts reported as nonoperating consist of expenses resulting from financing activities, other than interest costs. In the fourth quarter of 2013, we retired our 8.75% senior notes due in 2016 and reduced the capacity of our revolving credit facility, in conjunction with a refinancing discussed in the “Liquidity and Capital Resources” section. As a result, we paid a tender premium and wrote off unamortized discount and fees.Provision for (benefit from) Income taxes. The following table summarizes our benefit from income taxes for the year ended December 31, 2014 and compares it with the information for the year ended December 31, 2013:The income tax provision in the year ended December 31, 2014 compared to an effective rate of 31% on our pretax loss in the year ended December 31, 2013 was the result of the establishment of a valuation allowance totaling approximately $227 million relating to 2014 federal and state net operating loss carryforwards. See further discussion in Note 15, “Taxes,” to the Consolidated Financial Statements for further discussion.Income from discontinued operations, net of tax. The results of our Canyon Fuel subsidiary prior to its divestiture, including the gain on divestiture, are segregated from continuing operations. See further information in Note 3, “Divestitures”, to the Consolidated Financial Statements.areis calculated as the segment’ssegment coal sales revenues divided by segment tons sold. The segments’Segment coal sales per ton soldrevenues are adjusted for transportation costs, and may be adjusted for other items that, due to generally accepted accounting principles, are classified in “other income” on the statement of operations, but relate to price protection on the sale of coal. Segment coal sales per ton sold is not a measure of financial performance in accordance with generally accepted accounting principles. We believe segment coal sales per ton sold provides useful information to investors as it better reflects our revenue for the quality of coal sold and our operating results by including all income from coal sales. The adjustments made to arrive at these measures are significant in understanding and assessing our financial condition. Therefore, segment coal sales revenues should not be considered in isolation, nor as an alternative to coal sales revenues under generally accepted accounting principles. Successor Year Ended December 31, 2017 Powder River Basin Metallurgical Other Thermal Idle and Other Consolidated (In thousands) GAAP Revenues in the consolidated statements of operations $ 1,024,197 $ 887,839 $ 396,504 $ 16,083 $ 2,324,623 Less: Adjustments to reconcile to Non-GAAP Segment coal sales revenue Coal risk management derivative settlements classified in "other income" — — 200 — 200 Coal sales revenues from idled or otherwise disposed operations not included in segments — — — 15,061 15,061 Transportation costs 17,437 149,212 75,491 1,022 243,162 Non-GAAP Segment coal sales revenues $ 1,006,760 $ 738,627 $ 320,813 $ — $ 2,066,200 Tons sold 80,604 8,192 9,205 Coal sales per ton sold $ 12.49 $ 90.17 $ 34.85 62 Successor October 2 through December 31, 2016 Powder River Basin Metallurgical Other Thermal Idle and Other Consolidated (In thousands) GAAP Revenues in the consolidated statements of operations $ 275,703 $ 200,377 $ 97,382 $ 2,226 $ 575,688 Less: Adjustments to reconcile to Non-GAAP Segment coal sales revenue Coal risk management derivative settlements classified in "other income" — — (112 ) — (112 ) Coal sales revenues from idled or otherwise disposed operations not included in segments — — — 2,181 2,181 Transportation costs 4,826 40,170 12,130 45 57,171 Non-GAAP Segment coal sales revenues $ 270,877 $ 160,207 $ 85,364 $ — $ 516,448 Tons sold 21,824 2,442 2,510 Coal sales per ton sold $ 12.41 $ 65.61 $ 34.01 Predecessor January 1 through October 1, 2016 Powder River Basin Metallurgical Other Thermal Idle and Other Consolidated (In thousands) GAAP Revenues in the consolidated statements of operations $ 726,747 $ 437,069 $ 213,052 $ 21,841 $ 1,398,709 Less: Adjustments to reconcile to Non-GAAP Segment coal sales revenue Coal risk management derivative settlements classified in "other income" — — 448 — 448 Coal sales revenues from idled or otherwise disposed operations not included in segments — — — 19,368 19,368 Transportation costs 12,559 81,390 25,252 2,473 121,674 Non-GAAP Segment coal sales revenues $ 714,188 $ 355,679 $ 187,352 $ — $ 1,257,219 Tons sold 54,911 6,692 5,181 Coal sales per ton sold $ 13.01 $ 53.15 $ 36.16 Predecessor Year Ended December 31, 2015 Powder River Basin Metallurgical Other Thermal Idle and Other Consolidated (In thousands) GAAP Revenues in the consolidated statements of operations $ 1,448,440 $ 637,941 $ 428,809 $ 58,070 $ 2,573,260 Less: Adjustments to reconcile to Non-GAAP Segment coal sales revenue Coal risk management derivative settlements classified in "other income" — — (3,231 ) — (3,231 ) Coal sales revenues from idled or otherwise disposed operations not included in segments — — — 48,126 48,126 Transportation costs 22,137 81,554 67,598 9,944 181,233 Non-GAAP Segment coal sales revenues $ 1,426,303 $ 556,387 $ 364,442 $ — $ 2,347,132 Tons sold 108,481 8,352 9,764 Coal sales per ton sold $ 13.15 $ 66.62 $ 37.32 63 costscash cost per ton sold areis calculated as the segment’ssegment cash cost of coal sales divided by segment tons sold. The segments’Segment cash cost of tons sold arecoal sales is adjusted for transportation costs, and may be adjusted for other items that, due to generally accepted accounting principles, are classified in “other income” on the statement of operations, but relate directly to the costs incurred to produce coal. Segment cash cost of tonsper ton sold is not a measure of financial performance in accordance with generally accepted accounting principles. We believe segment cash cost of tonsper ton sold better reflects our controllable costs and our operating results by including all costs incurred to produce coal. The adjustments made to arrive at these measures are significant in understanding and assessing our financial condition. Therefore, segment cash cost of tons soldcoal sales should not be considered in isolation, nor as an alternative to cost of sales under generally accepted accounting principles. Successor Year Ended December 31, 2017 Powder River Basin Metallurgical Other Thermal Idle and Other Consolidated (In thousands) GAAP Cost of sales in the consolidated statements of operations $ 863,836 $ 646,911 $ 298,229 $ 34,118 $ 1,843,093 Less: Adjustments to reconcile to Non-GAAP Segment cash cost of coal sales Diesel fuel risk management derivative settlements classified in "other income" (2,645 ) — — — (2,645 ) Transportation costs 17,437 149,212 75,491 1,022 243,162 Cost of coal sales from idled or otherwise disposed operations not included in segments — — — 28,065 28,065 Other (operating overhead, certain actuarial, etc.) — — — 5,031 5,031 Non-GAAP Segment cash cost of coal sales 849,044 497,699 222,738 — 1,569,480 Tons sold 80,604 8,192 9,205 Cash Cost Per Ton Sold $ 10.53 $ 60.76 $ 24.20 Successor October 2 through December 31, 2016 Powder River Basin Metallurgical Other Thermal Idle and Other Consolidated (In thousands) GAAP Cost of sales in the consolidated statements of operations $ 220,714 $ 169,532 $ 66,811 $ 13,586 $ 470,644 Less: Adjustments to reconcile to Non-GAAP Segment cash cost of coal sales Diesel fuel risk management derivative settlements classified in "other income" 363 — — — 363 Transportation costs 4,825 40,171 12,130 45 57,171 Cost of coal sales from idled or otherwise disposed operations not included in segments — — — 5,853 5,853 Fresh start coal inventory fair value adjustment — — — 7,345 7,345 Other (operating overhead, certain actuarial, etc.) — — — 344 344 Non-GAAP Segment cash cost of coal sales $ 215,526 $ 129,361 $ 54,681 $ — $ 399,568 Tons sold 21,824 2,442 2,510 Cash Cost Per Ton Sold $ 9.88 $ 52.98 $ 21.79 64 Predecessor January 1 through October 1, 2016 Powder River Basin Metallurgical Other Thermal Idle and Other Consolidated (In thousands) GAAP Cost of sales in the consolidated statements of operations $ 610,734 $ 425,345 $ 181,872 $ 46,513 $ 1,264,464 Less: Adjustments to reconcile to Non-GAAP Segment cash cost of coal sales Diesel fuel risk management derivative settlements classified in "other income" (3,361 ) — (276 ) (59 ) (3,696 ) Transportation costs 12,560 81,389 25,253 2,472 121,674 Cost of coal sales from idled or otherwise disposed operations not included in segments — — — 42,513 42,513 Other (operating overhead, certain actuarial, etc.) — — — 1,587 1,587 Non-GAAP Segment cash cost of coal sales $ 601,535 $ 343,956 $ 156,895 $ — $ 1,102,386 Tons sold 54,911 6,692 5,181 Cash Cost Per Ton Sold $ 10.95 $ 51.40 $ 30.28 Predecessor Year Ended December 31, 2015 Powder River Basin Metallurgical Other Thermal Idle and Other Consolidated (In thousands) GAAP Cost of sales in the consolidated statements of operations $ 1,157,258 $ 568,971 $ 340,738 $ 105,785 $ 2,172,753 Less: Adjustments to reconcile to Non-GAAP Segment cash cost of coal sales Diesel fuel risk management derivative settlements classified in "other income" (7,750 ) — (332 ) (80 ) (8,162 ) Transportation costs 22,137 81,553 67,598 9,945 181,233 Cost of coal sales from idled or otherwise disposed operations not included in segments — — — 79,290 79,290 Other (operating overhead, certain actuarial, etc.) — — — 16,630 16,630 Non-GAAP Segment cash cost of coal sales $ 1,142,871 $ 487,418 $ 273,472 $ — $ 1,903,762 Tons sold 108,481 8,352 9,764 Cash Cost Per Ton Sold $ 10.54 $ 58.36 $ 28.01 65 EBITDAEBITDAR to Net IncomeEBITDA.EBITDAR for each of our reportable segments. Adjusted EBITDAEBITDAR is defined as net income attributable to the Company before the effect of net interest expense, income taxes, depreciation, depletion and amortization, and the amortization of acquired sales contracts.contracts, the accretion on asset retirement obligations, and reorganization items, net. Adjusted EBITDAEBITDAR may also be adjusted for items that may not reflect the trend of future results.results by excluding transactions that are not indicative of our core operating performance. We believe thatuse Adjusted EBITDA presentsEBITDAR to measure the operating performance of our segments and allocate resources to our segments. Adjusted EBITDAR is not a usefulmeasure of financial performance in accordance with generally accepted accounting principles, and items excluded from Adjusted EBITDAR are significant in understanding and assessing our financial condition. Therefore, Adjusted EBITDAR should not be considered in isolation, nor as an alternative to net income, income from operations, cash flows from operations or as a measure of our ability to service existing debt and incur additional debt based on ongoing operations.profitability, liquidity or performance under generally accepted accounting principles. Investors should be aware that our presentation of Adjusted EBITDAEBITDAR may not be comparable to similarly titled measures used by other companies. The table below shows how we calculate Adjusted EBITDA.Corporate and otherEBITDAR. Successor Predecessor Year Ended December 31, 2017 October 2 through December 31, 2016 January 1 through October 1, 2016 Year Ended December 31, 2015 (In thousands) Net income (loss) $ 238,450 $ 33,449 $ 1,242,081 $ (2,913,142 ) Income tax benefit (provision) (35,255 ) 1,156 (4,626 ) (373,380 ) Interest expense, net 24,256 10,754 133,235 393,549 Depreciation, depletion and amortization 122,464 32,604 191,581 379,345 Accretion on asset retirement obligations 30,209 7,634 24,321 33,680 Amortization of sales contracts, net 53,985 796 (728 ) (8,811 ) Asset impairment and mine closure costs — — 129,267 2,628,303 Losses from disposed operations resulting from Patriot Coal bankruptcy — — — 116,343 Gain on sale of Lone Mountain Processing, Inc. (21,297 ) — — — Net loss resulting from early retirement of debt and debt restructuring 2,547 — 2,213 27,910 Reorganization items, net 2,398 759 (1,630,041 ) — Fresh start coal inventory fair value adjustment — 7,345 — — Adjusted EBITDAR 417,757 94,497 87,303 283,797 EBITDAR from idled or otherwise disposed operations 9,113 2,795 14,514 23,605 Selling, general and administrative expenses 86,821 22,836 59,343 98,783 Other (9,187 ) (2,385 ) (4,676 ) (11,962 ) Segment Adjusted EBITDAR from coal operations $ 504,504 $ 117,743 $ 156,484 $ 394,223 selling, general and administrative expenses, income from our equity investments, certain actuarial adjustments, and certain changes in the fair value of coal derivatives and coal trading activities. Corporate66 other adjusted EBITDA decreased $22.9Capital Resourcesinof our common stock. On October 26, 2017 our Board of Directors authorized an additional $200 million for our share repurchase program, bringing the total authorization to $500 million. During the year ended December 31, 2015 when compared2017, we repurchased 3,977,215 shares of our stock for approximately $301.5 million. The timing of any future share purchases, and the ultimate number of shares to be purchased, will depend on a number of factors, including business and market conditions, our future financial performance, and other capital priorities. The shares will be acquired in the open market or through private transactions in accordance with Securities and Exchange Commission requirements.2014 due to the unfavorable year over year net change in pension settlement and curtailment costs2017, we paid three quarterly cash dividends of $23.8 million, further unfavorable year over year net change of $14.7 million in other various actuarial liabilities, and fully reserving$0.35 per share, totaling approximately $24.4 million. On February 13, 2018 we announced an uncollectable customer receivable of $7.8 million. These impacts were partially offset by a $24 million gain on the settlement of a customer contract.Corporate and other adjusted EBITDA decreased $50.1 millionincreased in the year ended December 31, 2014 when comparedquarterly dividend to $0.40 per share. The next dividend is scheduled to be paid on March 15, 2018 to stockholders of record at the year ended December 31, 2013 dueclose of business on March 5, 2018.favorable year over year net changepast year. In the future, we will continue to evaluate our capital allocation initiatives in pension settlement and curtailment costs of $21.4 million, further favorable year over year net change of $7.4 million in other various actuarial liabilities, an $11.5 million favorable year over year change in the fair value of certain coal derivatives and coal trading activities, and a $5.0 million settlement with Patriot Coal in the year ended December 31, 2013.Liquidity and Capital ResourcesThe filinglight of the Bankruptcy Petitions constituted an eventcurrent state of default that accelerated our obligations under our Debt Instruments, all as further described in Note 26, “Subsequent Events”, to the Consolidated Financial Statements included in the Form 10-K. Pursuant to the Bankruptcy Code, the filing of the Bankruptcy Petitions automatically stayed most actions against the Debtors, including most actions to collect indebtedness incurred prior to the Petition Date or to exercise control over the Debtors’ property. Accordingly, although the filing of the Bankruptcy Petitions triggered defaults under Debt Instruments, creditors are stayed from taking action as a result of these defaults. Additionally, under Section 502(b)(2) of the Bankruptcy Code, the Company is no longer required to pay interest on its senior unsecured notes and senior secured notes accruing on or after the Petition Date. However, the Debtors will be required to pay interest on amounts borrowed under the Superpriority Secured Debtor-in-Possession Credit Agreement as amended by the Waiver and Consent and Amendment No. 1, dated as of March 4, 2016, (the “DIP Credit Agreement”).On December 31, 2015, we had $651.0 million of cash and liquid securities on hand. Based on our current internal financial forecasts, we believe that our cash on hand, cash generated from the results of our operations and funds available under our DIP Credit Agreement will be sufficient to fund anticipated cash requirements until a plan of reorganization is confirmed for minimum operating and capital expenditures and for working capital purposes. However, given the current level of volatility in the market and the unpredictability of certain costs that could potentially arise in our operations, our liquidity needs could be significantly higher than we currently anticipate. In particular, weak coal market industry conditions, depressedmetallurgical coal prices, reduced steel production and reduced global steel demand may continue to impact our results of operations and our available liquidity.Securitization AgreementWe are party to an accounts receivable securitization program under which eligible trade receivables are sold, without recourse, to a multi-seller, asset-backed commercial paper conduit. The entity through which these receivables are sold, Arch Receivable Company, LLC, is consolidated into our financial statements but is a non-debtor special purpose vehicle. As of December 31, 2015 we could borrow and request letters of credit to be issued under the facility, and were required to pay facility fees, program fees and letter of credit fees (based on amounts of outstanding letters of credit) and certain other fees (based on amounts withdrawn and unreimbursed letters of credit). The total aggregate letters of credit that can be issued are limited by eligible accounts receivable, as defined under the terms of the securitization agreement. The securitization agreement expires on December 8, 2017.At December 31, 2015, we had letters of credit outstanding under our securitization program totaling $179 million. We had no borrowing capacity under the facility asoutlook for coal markets; the amount of outstanding lettersour planned production that has been committed and priced; the capital needs of credit exceeded the borrowing base. Letters of credit can be issued up to the $200 million facility maximum, but amounts above the borrowing base must be backed by cash collateral. Cash collateral supporting outstanding letters of credit at December 31, 2015 was $97.5 million.January 13, 2016,March 7, 2017, we agreed with our securitization financing providers that, subject to certain amendments (the “Amendments”), they will continue the $200 million trade accounts receivable securitization facility provided to Arch Receivable Company, LLC. Pursuant to the Amendments, which have been approved by the Court on a final basis, we are no longer eligible to borrow amounts under the facility but are allowed to continue to issue letters of credit thereunder. Continuing this facility prevents the need to use either existing cash liquidity or higher cost Debtor-In-Possession financing to support our letters of credit.Debtor-In-Possession FinancingOn January 21, 2016, the Superpriority Secured Debtor-in-Possession Credit Agreement as amended by the Waiver and Consent and Amendment No. 1, dated as of March 4, 2016, (the “DIP Credit Agreement”) was entered into bya senior secured term loan credit agreement in an aggregate principal amount of $300 million (the “New Term Loan Debt Facility”) with Credit Suisse AG, Cayman Islands Branch, as administrative agent and among us, as borrower, certain ofcollateral agent (in such capacities, the Debtors, as guarantors (the “Guarantors”“Agent”), and together with us, the “Loan Parties”), the lendersother financial institutions from time to time party thereto (the “DIP Lenders”) and Wilmington Trust, National Association, as administrative agent and collateral agent for the DIP Lenders (in such capacities, the “DIP Agent”).The DIP Credit Agreement which has been approved by the Court on a final basis provides for a super-priority senior secured debtor-in-possession credit facility (the “DIP Facility”) consisting of term loans (collectively, the “DIP“Lenders”). The New Term Loan”) in the aggregate principal amount of up to $275 million that may be funded in not more than two draws not later than six months after the effective dateLoan Debt Facility was issued at 99.50% of the DIP Facility (such six month period, the “Availability Period”). Any portion of the DIPface amount and will mature on March 7, 2024. Proceeds from The New Term Loan commitment that has not been funded on or priorDebt Facility were used to repay all outstanding obligations under our previously existing term loan credit agreement, dated as of October 5, 2016.end ofNew Term Loan Debt Facility. The Amendment reduces the Availability Period will be permanently cancelled.The maturity date of the DIP Facility is the earliest of (i) January 31, 2017, (ii) the date of the substantial consummation of a plan of reorganization that is confirmed pursuant to an order of the Court, (iii) the consummation of the sale of all or substantially all of the assets of the Loan Parties pursuant to Section 363 of the Bankruptcy Code and (iv) the date the obligations under the DIP Facility are accelerated pursuant to the terms of the DIP Credit Agreement. Borrowings under the DIP Facility bear interest at an interest rate per annum equalon the term loan facility to, at our option, either (i) the Company’s option (i) LIBORLondon interbank offered rate (“LIBOR”) plus 9.00%an applicable margin of 3.25%, subject to a 1.00% LIBOR floor, or (ii) thea base rate plus 8.00%an applicable margin of 2.25%.ObligationsDIP Credit Agreement will be guaranteed on a super-priority senior secured basis by all of our existing and future wholly-owned domestic subsidiaries, and all newly created or acquired wholly-owned domestic subsidiaries, subject to customary limited exceptions.The lenders under the DIP Credit Agreement will have a first priority lien on all encumbered and unencumbered assets of theNew Term Loan PartiesDebt Facility (the “DIP Lien”“Term Loans”), subject to a $75 million carve-out for super-priority claims relating to the Debtors’ bonding obligations, a customary professional fees carve-out and certain exceptions.The Loan Parties are subject to certain financial maintenance covenantsquarterly principal amortization payments in an amount equal to $750,000. For further information regarding the New Term Loan Debt Facility see Note 14 to the Consolidated Financial Statements “Debt and Financing Arrangements”.67 DIP Credit Agreement, including, without limitation, (i) maximum capital expendituresterm loan. The interest rate swaps qualify for cash flow hedge accounting treatment and (ii) minimum liquidity (defined as unrestricted cash and cash equivalentssuch, the change in the fair value of the Company and its domestic subsidiaries (other than any securitization subsidiaryinterest rate swaps are recorded on our Consolidated Balance Sheet as an asset or bonding subsidiary), plus withdrawable funds from brokerage accountsliability with the effective portion of the Companygains or losses reported as a component of accumulated other comprehensive income and its domestic subsidiaries (other than any securitization subsidiary or bonding subsidiary) plus any unused commitments thatthe ineffective portion reported in earnings. As interest payments are availablemade on the term loan, amounts in accumulated other comprehensive income will be reclassified into earnings through interest expense to be drawn byreflect a net interest on the Company pursuantterm loan equal to the termseffective yield of the DIP Credit Agreement)fixed rate of (A) $300 millionthe swap plus 3.25% which is the spread on the LIBOR term loan as amended. In the event that an interest rate swap is terminated prior to maturity, gains or losses in accumulated other comprehensive income will remain deferred and reclassified into earnings in the entryperiods which the hedged forecasted transaction affects earnings. For further information regarding the interest rate swaps see Note 14 to the Consolidated Financial Statements “Debt and Financing Arrangements”.final orderrevised schedule of fees payable to the administrator and the providers of the Court approvingExtended Securitization Facility. For further information regarding the DIP facility (the “Final Order”), which was entered on February 25, 2016 and (B) $500 million following the entry of the Final Order, in each case tested on a monthly basis. The DIP Credit Agreement contains customary affirmative and negative covenants and representations for debtor-in-possession financings. In addition to customary events of default for debtor-in-possession financings, the DIP Credit Agreement contains milestones relatingExtended Securitization Facility see Note 14 to the Chapter 11 CasesConsolidated Financial Statements “Debt and any failure to complyFinancing Arrangements”.milestones constitutes an eventcapacities, the “Agent”), as lender and swingline lender (in such capacities, the “Lender”) and as letter of default.The DIPcredit issuer. Availability under the New Inventory Facility is subject to certain usuala borrowing base consisting of (i) 85% of the net orderly liquidation value of eligible coal inventory, (ii) the lesser of (x) 85% of the net orderly liquidation value of eligible parts and customary prepayment events, includingsupplies inventory and (y) 35% of the amount determined pursuant to clause (i), and (iii) 100% of net cash proceedsour Eligible Cash (defined in the New Inventory Facility), subject to reduction for reserves imposed by Regions.debt issuances (otherthe third anniversary of the Inventory Facility Closing Date, (ii) the date, if any, that is 364 days following the first day that Liquidity (defined in the New Inventory Facility and consistent with the definition in the Extended Securitization Facility (as defined below)) is less than debt permitted to be incurred$250 million for a period of 60 consecutive days and (iii) the date, if any, that is 60 days following the maturity, termination or repayment in full of the Extended Securitization Facility.terms ofNew Inventory Facility bear interest at a per annum rate equal to, at our option, either the DIP Credit Agreement), (ii) non-ordinary course asset salesbase rate or dispositions in excess of $50 million in the aggregate (with no individual asset sale or disposition in excess of $7.5 million) and (iii) any casualty event in excess of $50 million in the aggregate, subject to customary reinvestment rights,London interbank offered rate plus, in each case, a margin ranging from 2.25% to be applied2.50% (in the case of LIBOR loans) and 1.25% to prepay1.50% (in the DIP Term Loan. Atcase of base rate loans) determined using a hearing held on February 23, 2016Liquidity-based grid. Letters of credit under the New Inventory Facility are subject to a fee in an amount equal to the Chapter 11 Cases,applicable margin for LIBOR loans, plus customary fronting and issuance fees. For further information regarding the Court approvedNew Inventory Facility see Note 14 to the DIP Facility on a final basis, overrulingConsolidated Financial Statements “Debt and Financing Arrangements”.objections of the Creditors’ Committeeremainder provided by availability under our credit facilities, and certain other parties who asserted, among other things, that the DIP Financing was unnecessary and argued that the Debtors should enter into an alternate debtor-in-possession financing facility proposed by certain members of the Creditors’ Committee. Successor Predecessor Year Ended December 31, 2017 October 2 through December 31, 2016 January 1 through October 1, 2016 Year Ended December 31, 2015 (In thousands) Cash provided by (used in): Operating activities $ 396,473 $ 84,192 $ (228,218 ) $ (44,367 ) Investing activities (59,802 ) 17,984 15,134 (180,341 ) Financing activities (368,656 ) 2,709 (37,210 ) (58,742 ) 68 used in operating activities increased in the year ended December 31, 2015 compared to the year ended December 31, 2014. Furthermore, cashFlow - Successor2013 became2017 resulted from strong international coking coal markets, stable Powder River Basin thermal markets, and improving international thermal coal market conditions. Our operating cost performance provided significant cash margins in these market conditions, particularly in the metallurgical segment as discussed in the Operational Performance section above. In addition, low cash interest expense contributed to the cash provided by operating activities.2014. This trend is primarily due to continued deterioration2015 resulted from deteriorating market conditions and high cash interest expenses.coal markets. WePredecessor securitization facility diminished over the period. These benefits were partially offset some of the impact of this continued deterioration through cost control efforts and concentrating activity at our most efficient operations, and we benefited from lower input costs, particularly diesel fuel. In addition we deferred payment of semi-annual interest on certain unsecured obligationsby capital expenditures that were dueeffectively managed to minimal levels, but did include the final of five annual $60 million lease by application bonus bid payments for reserves acquired in December 2015 (See Note 13 to the Consolidated Financial Statements, “Accrued Expenses and Other Current Liabilities” for further discussion).WePowder River Basin. $180.3 million of cash in investing activities duringin the year ended December 31, 2015 comparedresulted from deposits of restricted cash as collateral requirements under the Predecessor securitization facility increased over the 2015 period, capital expenditures including the fourth of five annual $60 million lease by application bonus bid payments for reserves acquired in the Powder River Basin, partially offset by net proceeds from the sale of short term investments.using $111.4 million of cashpre-filing debt restructuring costs.2014, and generating $125.4 million of cash in the year ended December 31, 2013. We received $422.7 million2015 resulted from the divestiture of the Canyon Fuel operations in 2013 compared to $46.7 million from divestitures in 2014, and $0.7 million in 2015. Capital expenditures decreased approximately $28 million and $149 million during 2015 and 2014, respectively, when compared to the previous year due to the startup of the Leer mining complex longwall in the first quarter of 2014 and ongoing cash management efforts. In 2013 we focused our spending on expanding our metallurgical coal production capacity, primarily the Leer Mine development for approximately $119 million,net of proceeds from the sale and leaseback of longwall shields. We purchased and sold short term investments that provided $43.5 million in 2015, used $6.3 million in 2014, and used $19.2 million in 2013. Restricted cash increased $91.9 million from 2014 to 2015 primarily due to increased collateral requirementsexpenses related to outstanding letters of credit.Cash used in financing activities was approximately $150.6 million, $37.5 million and $54.7 million in 2015, 2014 and 2013, respectively. In 2015 we incurred $24.2 million of legal and financial advisory fees associated with ourpre-filing debt restructuring efforts. In 2013, we borrowed an additional $300.0 million face amountcosts, principal payments on theour pre-filing term loan, and issued $350.0 million 8.00% senior notes due in 2019 to retire 8.75% senior unsecured notes due 2016 for $628.7 million. See further information about our outstanding debt balances in Note 14, “Debt and Financing Arrangements” to the Consolidated Financial Statements. We decreased the dividend rate from $0.03 per quarter to $0.01 per annum in the first quarterpayments on other debt.69 (1) Earnings consist of income from continuing operations before income taxes and are adjusted to include only distributed income from affiliates accounted for on the equity method and fixed charges (excluding capitalized interest). Fixed charges consist of interest incurred on indebtedness, the portion of operating lease rentals deemed representative of the interest factor and the amortization of debt expense.(2) Total losses for the ratio calculation were $2,853.0 million and total fixed charges were $407.1 million for the year ended December 31, 2015. Total losses for the ratio calculation were $120.9 million and total fixed charges were $404.5 million for the year ended December 31, 2014. Total losses for the ratio calculation were $638.3 million and total fixed charges were $450.7 million for the year ended December 31, 2013.The above table reflects contractual maturities, although $5.1 billion of debt is classified as current due to the default caused by the Company’s bankruptcy filing.The Chapter 11 Cases could materially modify and reduce our obligations. Pursuant to Section 362 of the Bankruptcy Code, the filing of the Bankruptcy Petitions automatically stayed most actions against us, including actions to collect indebtedness incurred prior to the Petition date or to exercise control over our property. Subject to certain exceptions under theBankruptcy Code, the filing of our Chapter 11 Cases also automatically stayed the continuation of most legal proceedings, including third party litigation matters described under Item 3, “Legal Proceedings,” or the filing of other actions against or on behalf of us or our property to recover on, collect or secure a claim arising prior to the Petition Date or to exercise control over property of our bankruptcy estates, unless and until the Court modifies or lifts the automatic stay as to any such claim. Payments Due by Period 2018 2019-2020 2021-2022 after 2022 Total (Dollars in thousands) Long-term debt, including related interest $ 32,287 $ 52,224 $ 40,023 $ 299,854 $ 424,388 Operating leases 5,936 6,914 4,010 8,292 25,152 Coal lease rights 3,582 12,879 14,219 34,371 65,051 Coal purchase obligations 11,207 — — — 11,207 Unconditional purchase obligations 85,947 — — — 85,947 Total contractual obligations $ 138,959 $ 72,017 $ 58,252 $ 342,517 $ 611,745 20152017 for the remaining term of outstanding borrowings.$410.5$328.7 million for asset retirement obligations that arise from SMCRA and similar state statutes, which require that mine property be restored in accordance with specified standards and an approved reclamation plan. Asset retirement obligations are recorded at fair value when incurred and accretion expense is recognized through the expected date of settlement. Determining the fair value of asset retirement obligations involves a number of estimates, as discussed in the section entitled “Critical Accounting Policies” below, including the timing of payments to satisfy the obligations. The timing of payments to satisfy asset retirement obligations is based on numerous factors, including mine closure dates. Please see the notes to our Consolidated Financial Statements for more information about our asset retirement obligations.$0.5$0.4 million to our pension plans in 2016,2018, which is impacted by the Moving Ahead for Progress in the 21st Century Act (MAP-21) enacted July 6, 2012. MAP-21 does not reduce our obligations under the plan, but redistributes the timing of required payments by providing near term funding relief for sponsors under the Pension Protection Act.notesNotes to our Consolidated Financial Statements for more information about the amounts we have recorded for workers’ compensation and pension and postretirement benefit obligations.The table above excludes future contingent payments70 corporate guarantees (e.g., self bonds) and letters of credit and cash to secure our financial obligations for reclamation, workers’ compensation, coal lease obligations and other obligations as follows as of December 31, 2015:In addition, we have agreed to continue to provide surety bonds for certain Magnum obligations, primarily reclamation. The surety bonding amounts are mandated by the state and are not directly related to the estimated cost to reclaim the properties. At December 31, 2015, we had $33.7 million of surety bonds and have posted $30.2 million in letters of credit related to Magnum properties. Workers’ Reclamation Lease Compensation Obligations Obligations Obligations Other Total (Dollars in thousands) Surety bonds $ 531,735 $ 31,244 $ 17,334 $ 6,029 $ 586,342 Letters of credit 7,428 — 94,499 1,354 103,281 Cash on deposit with others 2,596 — 11,132 — 13,728 consolidated financial statements.Consolidated Financial Statements. We believe that of these significant accounting policies, the following may involve a higher degree of judgment or complexity:prices.prices and interest rate risk on long-term debt. Additionally, we may hold certain coal derivative instruments for trading purposes. Derivative financial instruments are recognized in the balance sheet at fair value. Certain coal contracts may meet the definition of a derivative instrument, but because they provide for the physical purchase or sale of coal in quantities expected to be used or sold by us over a reasonable period in the normal course of business, they are not recognized on the balance sheet.71 a forecasted purchase or sale.the underlying item being hedged. Changes in the fair value of the derivative instrument used as a hedge instrument in a cash flow hedge are recorded in other comprehensive income. Amounts in other comprehensive income are reclassified to earnings when the hedged transaction affects earnings and are classified in a manner consistent with the transaction being hedged.5,6, “Impairment Charges and Mine Closure Costs” into the Consolidated Financial Statements.2015,2017, our balance sheet reflected asset retirement obligation liabilities of $410.5$328.7 million, including amounts classified as a current liability. As of December 31, 2015,2017, we estimate the aggregate undiscounted cost of final mine closures to be approximately $921$780.4 million.72 ageyears of service and compensation. The actuarially-determined funded status of the defined benefit plans is reflected in the balance sheet.StatementsStatements. Changes in these assumptions can result in different pension expense and liability amounts, and actual experience can differ from the assumptions.·60%39% equity and 40%61% fixed income securities. Investments are rebalanced on a periodic basis to approximate these targeted guidelines. The long-term rate of return assumptions are less than the plan’s actual life-to-date returns. Any difference between the actual experience and the assumed experience is recorded in other comprehensive income and amortized into earnings in the future. The impact of lowering the expected long-term rate of return on plan assets 0.5% for 20152017 would have been an increase in expense of approximately $1.5$1.3 million.·In estimating thatThe determination of the discount rate rates of return on high-quality fixed-income debt instruments are required. We utilize a bond portfoliowas updated from our actuary’s proprietary Yield Curve model, that includes bonds that are rated “AA” or higher with maturities that matchunder which the expected benefit payments underof the plan.plan are matched against a series of spot rates from a market basket of high quality fixed income securities. The impact of lowering the discount rate 0.5% for 20152017 would have been an increasedecrease in expense of approximately $2.8$0.9 million. a five-year period, which represents the average amountremaining life expectancy of time before participants vest in their benefits.20152017 .regardregards to future taxable income, we have relied solely on the expected reversal of taxable temporary differences to support the future realization of our deferred tax assets. We perform a detailed scheduling process of our net taxable temporary differences.At December 31, 2014, all deductible temporary differences were expected to be realized as there were sufficient deferred tax liabilities within the same jurisdiction and73 The totalNet deferred tax assets of $1,135 million were completely offset by a valuation allowance.74 75 2016 and 20172018 are as follows: 2018 Tons $ per ton Metallurgical (in millions) Committed, Priced Coking 1.7 $ 103.96 Committed, Unpriced Coking 2.6 Committed, Priced Thermal 0.5 $ 30.43 Committed, Unpriced Thermal — Powder River Basin Committed, Priced 62.1 $ 11.95 Committed, Unpriced 2.3 Other Thermal Committed, Priced 7.7 $ 36.88 Committed, Unpriced — 2015.2017. The estimated future realization of the value of the trading portfolio is $5.8$1.2 million of gainslosses in 2016.2015,2017, VaR for our coal trading positions that are recorded at fair value through earnings ranged from under $0.1 million$0 to $0.9$1.0 million. The linear mean of each daily VaR was $0.4$0.2 million. The final VaR at December 31, 20152017 was under $0.1 million.76 20152017 VaR for our risk management positions that are recorded at fair value through earnings ranged from $0.1 million$0 to $0.5$1.1 million. The linear mean of each daily VaR was $0.2$0.3 million. The final VaR at December 31, 20152017 was $0.1$0.8 million.5042 to 5846 million gallons of diesel fuel for use in our operations during 2016.2018. We may enter into forward physical purchase contracts, as well as purchased heating oil options, to reduce volatility in the price of diesel fuel for our operations. At December 31, 2015,2017, we had purchased heating oil call options for approximately 5626 million gallons for the purpose of protecting against substantial increases in pricerelatingprice relating to 20152018 diesel purchases. These positions reduce our risk of cash flow fluctuations related to these surchargesfuel purchases but the positions are not accounted for as hedges. A $0.25 per gallon decrease in the price of heating oil would not result in an increase in our expense related to the heating oil derivatives. We also at times have purchased heating oil call options to manage the price risk associated with fuel surcharges on barge and rail shipments, which cover increases in diesel fuel prices. At December 31, 2015,2017, we had no positions outstanding for this purpose.2015,2017, of our $5.1 billion$334.3 million principal amount of debt outstanding, approximately $1.9 billion$297.8 million of outstanding borrowings have interest rates that fluctuate based on changes in the market rates. An increase in the interest rates related to these borrowings of 25 basis points would not result in an annualized increase in interest expense based on interest rates in effect at December 31, 2015,2017, because we have fixed the LIBOR portion of the interest rate on our term loan has a minimumusing interest rate that exceedsswaps. See Note 14, “Debt and Financing Arrangements” to the current market rates.2015.2017. Based on that evaluation, our management, including our chief executive officer and chief financial officer, concluded that the disclosure controls and procedures were effective as of such date. There were no changes in our internal control over financial reporting during the fiscal quarter to which this report relates that have materially affected, or are reasonably likely to materially affect, our internal control over financial reporting.on pages F-3 and F-4, respectively,within the Financial Statement section of this Annual Report on Form 10-K.77 ITEM 10. DIRECTORS, EXECUTIVE OFFICERS AND CORPORATE GOVERNANCE. Officers”Officers of the Registrant”, the information required under this item is incorporated herein by reference to “Director Qualifications, Diversity and Biographies,” “Section 16(a) Beneficial Ownership Reporting Compliance,” “Corporate Governance Guidelines and Code of Business Conduct,” “Nomination Process for Election of Directors” and “Board Meetings and Committees” in an amendmentour Proxy Statement for the 2018 Annual Meeting of Stockholders, which is expected to this Annual Report on Form 10-K, which will be filed with the SEC within 120 days after the close of our Company’s 2015 fiscal year.ITEM 11.EXECUTIVE COMPENSATION.ITEM 11. EXECUTIVE COMPENSATION. an amendmentour Proxy Statement for the 2018 Annual Meeting of Stockholders, which is expected to this Annual Report on Form 10-K, which will be filed with the SEC within 120 days after the close of our Company’s 2015 fiscal year.ITEM 12.SECURITY OWNERSHIP OF CERTAIN BENEFICIAL OWNERS AND MANAGEMENT AND RELATED STOCKHOLDER MATTERS.ITEM 12. SECURITY OWNERSHIP OF CERTAIN BENEFICIAL OWNERS AND MANAGEMENT AND RELATED STOCKHOLDER MATTERS. an amendmentour Proxy Statement for the 2018 Annual Meeting of Stockholders, which is expected to this Annual Report on Form 10-K, which will be filed with the SEC within 120 days after the close of our Company’s 2015 fiscal year.Items 404 and 407(a)reference to “Director Independence” in our Proxy Statement for the 2018 Annual Meeting of Regulation S-KStockholders, which is included under the caption “Directors and Corporate Governance Practices” in an amendmentexpected to this Annual Report on Form 10-K, which will be filed with the SEC within 120 days after the close of our Company’s 2015 fiscal year.following table sets forth the fees accrued or paidinformation required under this item is incorporated herein by reference to Ernst & Young LLP, the Company’s independent registered public accounting firm,“Fees Paid to Auditors” in our Proxy Statement for the years ended December 31, 2015 and December 31, 2014:(1) Audit fees include fees for professional services rendered by Ernst & Young LLP for2018 Annual Meeting of Stockholders, which is expected to be filed with the auditsSEC within 120 days after the close of our annual consolidated financial statements and report on internal control over financial reporting, the review procedures on the consolidated financial statements included in our Forms 10-Q, as well as the statutory auditsfiscal year.78 public accounting firm are prohibited by the SEC’s rules on auditor independence and whether the independent registered public accounting firm is best positioned to provide the most effective and efficient service. The Audit Committee is mindful of the relationship between fees for audit and non-audit services in deciding whether to pre-approve such services. The Audit Committee has delegated to the chairman of the Audit Committee pre-approval authority between committee meetings, and the chairman must report any pre-approval decisions to the committee at the next regularly scheduled committee meeting. All non-audit services performed by Ernst & Young LLP in 2015 and 2014 were pre-approved in accordance with the procedures established by the Audit Committee.ITEM 15. EXHIBITS AND FINANCIAL STATEMENT SCHEDULES. SchedulePageSchedule Page Valuation and Qualifying Accounts F-63beginning on page 87the following page.ITEM 16. FORM 10-K SUMMARY. 79 this report.ContentsSignaturesPursuant to the requirements of Section 13 or 15(d) of the Securities Exchange Act of 1934, the registrant has duly caused this reportsigned on its behalf by the undersigned, thereunto duly authorized.included in 10-KArch Coal, Inc.Description 2.1 /s/ John W. Eaves2.2 John W. Eaves3.1 ChairmanMarch 15, 2016SignaturesCapacityDate/s/ John W. EavesJohn W. EavesChairman and Chief Executive Officer,March 15, 2016(Principal Executive Officer)/s/ John T. DrexlerJohn T. DrexlerSenior Vice President and Chief FinancialMarch 15, 2016Officer (Principal Financial Officer)(Principal Accounting Officer)*David D. FreudenthalDirectorMarch 15, 2016*Patricia F. GodleyDirectorMarch 15, 2016*Paul T. HanrahanDirectorMarch 15, 2016*Douglas H. HuntDirectorMarch 15, 2016*J. Thomas JonesDirectorMarch 15, 2016*Paul A. LangDirectorMarch 15, 2016*George C. Morris IIIDirectorMarch 15, 2016*Theodore D. SandsDirectorMarch 15, 2016*Wesley M. TaylorDirectorMarch 15, 2016*Peter I. WoldDirectorMarch 15, 2016*By/s/ Robert G. JonesRobert G. Jones,Attorney-in-FactExhibit IndexExhibitDescription3.1 herein by reference to Exhibit 3.1 of Arch Coal’s registration statement on Form 8-A filed on October 4, 2016).3.2 4.1 4.2 4.3 10.1 10.2 10.3 3.24.1Indenture,4.2First Supplemental Indenture, dated as of August 9, 2010, by4.34.4Third Supplemental Indenture, dated as10.7 of June 24, 2011, by and among Arch Coal, Inc., the subsidiary guarantors named therein and U.S. Bank National Association, as trustee (incorporated herein by reference to Exhibit 4.13 to the registrant’s Annual Report on Form 10-K for the year ended December 31, 2011).4.5Fourth Supplemental Indenture, dated as of October 7, 2011, by and among Arch Coal, Inc., the subsidiary guarantors named therein and U.S. Bank National Association, as trustee (incorporated herein by reference to Exhibit 4.14 to the registrant’s Annual Report on Form 10-K for the year ended December 31, 2011).4.6Fifth Supplemental Indenture, dated as of July 2, 2012, by and among Arch Coal, Inc., the subsidiary guarantors named therein and U.S. Bank National Association, as trustee (incorporated herein by reference to Exhibit 4.2 to the registrant’s Quarterly Report on Form 10-Q for the period ended June 30, 2012).4.7Sixth Supplemental Indenture, dated as of July 31, 2012, by and among Arch Coal, Inc., the subsidiary guarantors named therein and U.S. Bank National Association, as trustee (incorporated herein by reference to Exhibit 4.5 to the registrant’s Quarterly Report on Form 10-Q for the period ended June 30, 2012).4.8Seventh Supplemental Indenture, dated as of July 26, 2013, by and among Arch Coal, Inc., the subsidiary guarantors named therein and U.S. Bank National Association, as trustee (incorporated herein by reference to Exhibit 4.2 to the registrant’s Quarterly Report on Form 10-Q for the period ended June 30, 2013).4.9Eighth Supplemental Indenture, dated December 2, 2013, by and among Arch Coal, Inc. the subsidiary guarantors named therein and U.S. Bank National Association, as trustee (incorporated herein by reference to Exhibit 4.21 to the registrant’s Annual Report on Form 10-K for the period ended December 31, 2013).4.10Indenture, dated as of June 14, 2011, by and among Arch Coal, Inc., the subsidiary guarantors named therein and UMB Bank National Association, as trustee (incorporated herein by reference to Exhibit 4.1 to the registrant’sCoal’s Current Report on Form 8-K filed on June 14, 2011)October 31, 2017).4.11First Supplemental Indenture,4.1210.10 10.11 4.1380 Third Supplemental Indenture, dated as of July 2, 2012, by and among10.12 4.14Fourth Supplemental Indenture, dated as of July 31, 2012, by and among4.15Fifth Supplemental Indenture, dated as10.1 of July 26, 2013, by and among Arch Coal, Inc., the subsidiary guarantors named therein and UMB Bank National Association, as trustee (incorporated herein by reference to Exhibit 4.3 to the registrant’s Quarterly Report on Form 10-Q for the period ended June 30, 2013).4.16Sixth Supplemental Indenture, dated as of December 2, 2013, by and among Arch Coal, Inc., the subsidiary guarantors named therein and UMB Bank National Association (incorporated herein by reference to Exhibit 4.28 to the registrant’s Annual Report on Form 10-K for the year ended December 31, 2013).4.17Indenture, dated as of November 21, 2012, among Arch Coal, Inc., the subsidiary guarantors named therein and UMB Bank National Association, as trustee (incorporated herein by reference to Exhibit 4.1 to the registrant’sCoal’s Current Report on Form 8-K filed on November 26, 2012).4.18First Supplemental Indenture, dated as of July 26, 2013, by and among Arch Coal, Inc., the subsidiary guarantors named therein and UMB Bank National Association, as trustee (incorporated herein by reference to Exhibit 4.4 to the registrant’s Quarterly Report on Form 10-Q for the period ended June 30, 2013).4.19Second Supplemental Indenture, dated as of December 2, 2013, by and among Arch Coal, Inc., the subsidiary guarantors named therein and UMB Bank National Association, as trustee (incorporated herein by reference to Exhibit 4.31 to the registrant’s Annual Report on Form 10-K for the year ended December 31, 2013).4.2Indenture, dated as of December 17, 2013, by and among Arch Coal, Inc., the subsidiary guarantors named therein and UMB Bank National Association, as trustee and collateral agent (incorporated herein by reference to Exhibit 4.1 to the registrant’s Current Report on Form 8-K filed on December 17, 2013).10.1Amended and Restated Credit Agreement, dated as of June 14, 2011, by and among the Company, the lenders party thereto, PNC Bank, National Association, as administrative agent and Bank of America, N.A., The Royal Bank of Scotland PLC and Citibank, N.A., as co-documentation agents (incorporated herein by reference to Exhibit 10.1 to the Current Report on Form 8-K filed by the registrant on June 17, 2011).10.2Incremental Amendment, dated as of November 21, 2012, by and among Arch Coal, Inc., as Borrower, the guarantors party thereto, the incremental term loan lenders party thereto, Bank of America, N.A., as Term Loan Administrative Agent, and Merrill Lynch, Pierce, Fenner & Smith Incorporated, PNC Capital Markets LLC, Morgan Stanley Senior Funding, Inc., Citigroup Global Markets Inc., Credit Suisse Securities (USA) LLC, BBVA Securities Inc., RBS Securities Inc. and Union Bank, N.A., as Lead Arrangers, as Lead Arrangers (incorporated herein by reference to Exhibit 10.1 to the registrant’s Current Report on Form 8-K filed on November 26, 2012).10.3First Amendment to Amended and Restated Credit Agreement, dated as of May 16, 2012, by and among Arch Coal, Inc., as Borrower, the guarantors party thereto, the lenders party thereto, and PNC Bank, National Association, as Revolver Administrative Agent (incorporated herein by reference to Exhibit 10.1 to the registrant’s Current Report on Form 8-K filed on May 17, 2012).10.4Second Amendment to Amended and Restated Credit Agreement, dated as of November 21, 2012, by and among Arch Coal, Inc., as Borrower, the guarantors party thereto, the lenders party thereto, Bank of America, N.A., as Term Loan Administrative Agent, and PNC Bank, National Association, as Revolver Administrative Agent (incorporated herein by reference to Exhibit 10.2 to the registrant’s Current Report on Form 8-K filed on November 26, 2012).10.5Third Amendment to Amended and Restated Credit Agreement, dated as of November 21, 2012, by and among Arch Coal, Inc., as Borrower, the guarantors party thereto, the revolver lenders party thereto and PNC Bank, National Association, as Revolver Administrative Agent (incorporated herein by reference to Exhibit 10.3 to the registrant’s Current Report on Form 8-K filed on November 26, 2012).10.6Amendment Number Four to Amended and Restated Credit Agreement, dated as of December 17, 2013, by and among Arch Coal, Inc., as Borrower, the guarantors party thereto, the lenders party thereto, Bank of America, N.A., as term loan administrative agent, and PNC Bank, National Association, as Revolver Administrative Agent (incorporated herein by reference to Exhibit 10.1 to the registrant’s Current Report on Form 8-K filed on December 17, 2013).10.7*Form of Employment Agreement for Executive Officers of Arch Coal, Inc. (incorporated herein by reference to Exhibit 10.4 to the registrant’s Annual Report on Form 10-K for the year ended December 31, 2011).10.810.9Federal Coal Lease dated as of June 24, 1993 between the U.S. Department of the Interior and Southern Utah Fuel Company (incorporated herein by reference to Exhibit 10.17 to the registrant’s Annual Report on Form 10-K for the year ended December 31, 1998).10.10Federal Coal Lease between the U.S. Department of the Interior and Utah Fuel Company (incorporated herein by reference to Exhibit 10.18 to the registrant’s Annual Report on Form 10-K for the year ended December 31, 1998).10.11Federal Coal Lease dated as of July 19, 1997 between the U.S. Department of the Interior and Canyon Fuel Company, LLC (incorporated herein by reference to Exhibit 10.19 to the registrant’s Annual Report on Form 10-K for the year ended December 31, 1998).10.12the registrant’sArch Coal’s Annual Report on Form 10-K for the year ended December 31, 1998).10.13the registrant’sArch Coal’s Annual Report on Form 10-K for the year ended December 31, 1998).10.14the registrant’sArch Coal’s Annual Report on Form 10-K for the year ended December 31, 1998).10.15the registrant’sArch Coal’s Annual Report on Form 10-K for the year ended December 31, 1998).10.16Federal Coal Lease dated as of October 1, 1999 between the U.S. Department of the Interior and Canyon Fuel Company, LLC (incorporated herein by reference to Exhibit 10 to the registrant’s Quarterly Report on Form 10-Q for the quarter ended September 30, 1999).10.1710.1810.1910.20*10.21*10.22*10.23*Arch Coal, Inc. Omnibus Incentive Plan (incorporated herein by reference to Exhibit 10.1 to the registrant’s Quarterly Report on Form 10-Q filed on May 8, 2013).10.24*Arch Mineral Corporation 1996 ERISA Forfeiture Plan (incorporated herein by reference to Exhibit 10.20 to the Registration Statement on Form S-4 (Registration No. 333-28149) filed by the registrant on May 30, 1997).10.25*10.28* 10.28*10.29*Form of 2008 Restricted Stock Unit Contract for Messrs. Leer and Eaves (incorporated herein by reference to Exhibit 10.3 to the registrant’sArch Coal’s Current Report on Form 8-K8-k filed on February 27, 2008)November 30, 2016).Form of 2008 Non-Qualified Stock Option Agreement for Messrs. Leer and Eaves (incorporated herein by reference to Exhibit 10.4 to the registrant’s Current Report on Form 8-K filed on February 27, 2008).10.31*Form of Non-Qualified Stock Option Agreement (for stock options granted on or after February 21, 2008) (incorporated herein by reference to Exhibit 10.5 to the registrant’s Current Report on Form 8-K filed on February 27, 2008).10.32*Form of Non-Qualified Stock Option Agreement (incorporated herein by reference to Exhibit 10.3 to the registrant’s Quarterly Report on Form 10-Q for the period ended March 31, 2013).10.33*the registrant’sArch Coal’s Quarterly Report on Form 10-Q for the period ended March 31, 2013).10.34*Form of 2011 Non-Qualified Stock Option Agreement (incorporated herein by reference to Exhibit 10.1 to the registrant’s Quarterly Report on Form 10-Q for the period ended March 31, 2012).10.35*Form of 2011 Restricted Stock Unit Contract (incorporated herein by reference to Exhibit 10.2 to the registrant’s Quarterly Report on Form 10-Q for the period ended March 31, 2012).10.36*Form of 2011 Restricted Stock Unit Contract for Non-Employee Directors (incorporated herein by reference to Exhibit 10.3 to the registrant’s Quarterly Report on Form 10-Q for the period ended March 31, 2012).10.37*Form of 2011 Performance Unit Contract (incorporated herein by reference to Exhibit 10.4 to the registrant’s Quarterly Report on Form 10-Q for the period ended March 31, 2012).10.38*Form of Restricted Stock Unit Contract (incorporated herein by reference to Exhibit 10.4 to the registrant’s Quarterly Report on Form 10-Q for the period ended March 31, 2013).10.39*Form of Restricted Stock Unit Contract for Non-Employee Directors (incorporated herein by reference to Exhibit 10.5 to the registrant’s Quarterly Report on Form 10-Q for the period ended March 31, 2013).10.40*10.41*Form of Performance Shares Contract10.42Amended and Restated Receivables Purchase Agreement, dated as of February 24, 2010, among Arch Receivable Company, LLC, Arch Coal Sales Company, Inc., Market Street Funding LLC, as issuer, the financial institutions from time to time party thereto, as LC Participants, and PNC Bank, National Association, as Administrator on behalf of the Purchasers and as LC Bank (incorporated herein by reference to Exhibit 10.2 to the registrant’s Quarterly Report on Form 10-Q for the period ended March 31, 2010).10.43First Amendment to Amended and Restated Receivables Purchase Agreement, dated January 31, 2011, among Arch Receivable Company, LLC, Arch Coal Sales Company, Inc. and the other parties thereto (incorporated by reference to Exhibit 10.41 to the registrant’s Annual Report on Form 10-K for the period ended December 31, 2010).10.44Second Amendment to Amended and Restated Receivables Purchase Agreement dated June 15, 2011 (incorporated by reference to Exhibit 10.5 to the registrant’s Quarterly Report on Form 10-Q for the period ended June 30, 2011).10.45Third Amendment to Amended and Restated Receivables Purchase Agreement dated November 21, 2011, among Arch Receivable Company, LLC, Arch Coal Sales Company, Inc. and the other parties thereto (incorporated herein by reference to Exhibit 10.38 to the registrant’s Annual Report on Form 10-K for the year ended December 31, 2011).10.46Fourth Amendment to Amended and Restated Receivables Purchase Agreement dated December 13, 2011, among Arch Receivable Company, LLC, Arch Coal Sales Company, Inc. and the other parties thereto (incorporated herein by reference to Exhibit 10.39 to the registrant’s Annual Report on Form 10-K for the year ended December 31, 2011).10.47Fifth Amendment to Amended and Restated Receivables Purchase Agreement dated December 11, 2012, among Arch Receivable Company, LLC, Arch Coal Sales Company, Inc. and the other parties thereto (incorporated herein by reference to Exhibit 10.45 to the registrant’s Annual Report on Form 10-K for the period ended December 31, 2012).10.48Sixth Amendment to Amended and Restated Receivables Purchase Agreement dated October 4, 2013, among Arch Receivable Company, LLC, Arch Coal Sales Company, Inc., and the other parties thereto (incorporated herein by reference to Exhibit 10.51 to the registrant’s Annual Report on Form 10-K for the year ended December 31, 2013).10.49Seventh Amendment to Amended and Restated Receiveables Purchase Agreement dated December 10, 2013, among Arch Receivable Company, LLC, Arch Coal Sales Company, Inc., and the other parties thereto (incorporated herein by reference to Exhibit 10.52 to the registrant’s Annual Report on Form 10-K for the year ended December 31, 2013).10.50Eighth Amendment to Amended and Restated Receivables Purchase Agreement dated October 28, 2014, among Arch Receivables Company, LLC, Arch Coal Sales Company, Inc., and the other parties thereto (incorporated by reference to Exhibit 10.54 to the registrant’s Annual Report on Form 10-K for the year ended December 31, 2014).10.51Ninth Amendment to Amended and Restated Receivables Purchase Agreement, dated December 29, 2014, among Arch Receivables Company, LLC, Arch Coal Sales Company, Inc., and the other parties thereto (incorporated herein by reference to Exhibit 10.55 to the registrant’s Annual Report on Form 10-K for the year ended December 31, 2014).10.52Second Supplemental Indenture dated as of July 16, 2015 among Arch Coal, Inc., the guarantors party thereto and U.S. Bank National Association, as trustee (incorporated herein by reference to Exhibit 4.1 to the registrant’sCoal’s Current Report on Form 8-K filed on July 17, 2015)September 19, 2017).10.5381 Superpriority Senior Secured Debtor in Possession Credit10.33 10.54Second AmendedMonarch Alternative Solutions Master Fund Ltd, Monarch Capital Master Partners III LP, MCP Holdings Master LP and Restated Receivables Purchase Agreement, dated as of January 13, 2016, among Arch Receivable Company, LLC, Arch Coal Sales Company, Inc. and the other parties thereto.10.55Restructuring Support Agreement, dated as of January 10, 2016, by and among the Debtors (as defined therein) and the Consenting Lenders (as defined therein)Monarch Debt Recovery Master Fund Ltd. (incorporated herein by reference to Exhibit 10.1 to the registrant’sof Arch Coal’s Current Report on Form 8-K filed on JanuaryDecember 11, 2016)2017).10.56Waiver and Consent and Amendment No. 1, dated as of March 4, 2016, to the Superpriority Senior Debtor-in-Possession Credit Agreement, by and among Arch Coal, Inc., subsidiaries of Arch Coal, Inc. from time to time party thereto as guarantors, the lenders from time to time party thereto and the Agent (as defined therein).10.57First Amendment to Restructuring Support Agreement dated as of February 25, 2016 by and among the Debtors (as defined therein) and the Consenting Lenders (as defined therein).12.1Computation of ratio of earnings to combined fixed charges and preference dividends.21.19520152017 filed in XBRL). The financial information contained in the XBRL-related documents is “unaudited”''unaudited" and “unreviewed.”arrangements.or arrangement.82 Arch Coal, Inc. /s/ John W. Eaves February 23, 2018 83 Signatures Capacity Date /s/ John W. Eaves John W. Eaves Chief Executive Officer, Director (Principal Executive Officer) February 23, 2018 /s/ John T. Drexler John T. Drexler Senior Vice President and Chief Financial Officer (Principal Financial Officer) February 23, 2018 /s/ John W. Lorson John W. Lorson Vice President and Chief Accounting Officer (Principal Accounting Officer) February 23, 2018 * James N. Chapman Chairman February 23, 2018 * Patrick J. Bartels, Jr. Director February 23, 2018 * Sherman K. Edmiston III Director February 23, 2018 * Patrick A. Kriegshauser Director February 23, 2018 * Richard A. Navarre Director February 23, 2018 * Scott D. Vogel Director February 23, 2018 84 *By /s/ Robert G. Jones 85 F-2F-4Consolidated Statements of Operations forOperations:F-5Consolidated Statements of Comprehensive Income (Loss) for(loss):F-6F-7Consolidated Statements of Cash Flows forFlows:F-8Consolidated Statements of Stockholders’ Equity for(Deficit):F-9F-10F-63F-F- 1 and Shareholders of Arch Coal, Inc.20152017 and 2014,2016 (Successor), and the related consolidated statements of operations, comprehensive income (loss), stockholders’ equity (deficit) and cash flows for each of the three years in the periodyear ended December 31, 2015. Our audits also included2017 (Successor), the period from October 2, 2016 through December 31, 2016 (Successor), the period from January 1, 2016 through October 1, 2016 (Predecessor), and the year ended December 31, 2015 (Predecessor) and the related notes and financial statement schedule listed in the Index at Item 15. These15 (collectively referred to as the “financial statements”). In our opinion, the financial statements and schedule arepresent fairly, in all material respects, the responsibilityconsolidated financial position of the Company’s management. Our responsibility isCompany at December 31, 2017 and 2016 (Successor), and the consolidated results of its operations and its cash flows for the year ended December 31, 2017 (Successor), the period from October 2, 2016 through December 31, 2016 (Successor), the period from January 1, 2016 through October 1, 2016 (Predecessor), and the year ended December 31, 2015 (Predecessor), in conformity with U.S. generally accepted accounting principles.express an opinion on thesethe consolidated financial statements, on September 13, 2016, the Bankruptcy Court entered an order confirming the Plan of Reorganization, which became effective on October 5, 2016. Accordingly, the accompanying consolidated financial statements have been prepared in conformity with Accounting Standards Codification 852-10, Reorganizations, for the Successor Company as a new entity with assets, liabilities and schedule based on our audits.conducted our auditsalso have audited, in accordance with the standards of the Public Company Accounting Oversight Board (United States). (PCAOB), the Company's internal control over financial reporting as of December 31, 2017, based on criteria established in Internal Control-Integrated Framework issued by the Committee of Sponsoring Organizations of the Treadway Commission (2013 framework), and our report dated February 23, 2018, expressed an unqualified opinion thereon.misstatement. An audit includesmisstatement, whether due to error or fraud. Our audits included performing procedures to assess the risks of material misstatement of the financial statements, whether due to error or fraud, and performing procedures that respond to those risks. Such procedures included examining, on a test basis, evidence supportingregarding the amounts and disclosures in the financial statements. An auditOur audits also includes assessingincluded evaluating the accounting principles used and significant estimates made by management, as well as evaluating the overall presentation of the financial statement presentation.statements. We believe that our audits provide a reasonable basis for our opinion.In our opinion,financial statements referred to above present fairly, in all material respects,Company’s auditor since 1997.F- 2 consolidated financial positionStockholders and the Board of Directors of Arch Coal, Inc.atinternal control over financial reporting as of December 31, 2015 and 2014, and2017, based on criteria established in Internal Control- Integrated Framework issued by the consolidated resultsCommittee of their operations and their cash flows for eachSponsoring Organizations of the three years in the period ended December 31, 2015, in conformity with U.S. generally accepted accounting principles. Also, inTreadway Commission (2013 framework) (the COSO criteria). In our opinion, the related financial statement schedule, when considered in relation to the basic financial statements taken as a whole, presents fairlyArch Coal, Inc. (and subsidiaries) (the Company) maintained, in all material respects, effective internal control over financial reporting as of December 31, 2017, based on the information set forth therein.The accompanying consolidated financial statements have been prepared assuming that the Company will continue as a going concern. As discussed in Note 1, to the consolidated financial statements, the Company has recurring losses from operations and has a net capital deficiency that raise substantial doubt about its ability to continue as a going concern. Management’s plans in regard to these matters are also described in Note 1. The consolidated financial statements do not include any adjustments that might result from the outcome of this uncertainty.’s internal control over financial reporting and subsidiaries (the Company) as of December 31, 2017 and 2016 (Successor), and the related consolidated statements of operations, comprehensive income (loss), stockholders’ equity (deficit) and cash flows for the year ended December 31, 2017 (Successor), the period from October 2, 2016 through December 31, 2016 (Successor), the period from January 1, 2016 through October 1, 2016 (Predecessor), and the year ended December 31, 2015 based on criteria established(Predecessor) and the related notes and financial statement schedule listed in Internal Control-Integrated Framework issued by the Committee of Sponsoring OrganizationsIndex at Item 15 of the Treadway Commission (2013 framework)Company, and our report dated March 15, 2016February 23, 2018 expressed an unqualified opinion thereon./s/ Ernst & Young LLPSt. Louis, MissouriMarch 15, 2016Report of Independent Registered Public Accounting FirmBoard of Directors and Shareholders of Arch Coal, Inc.We have audited Arch Coal, Inc. and subsidiaries’ (the Company’s) internal control over financial reporting as of December 31, 2015, based on criteria established in Internal Control-Integrated Framework issued by the Committee of Sponsoring Organizations of the Treadway Commission (2013 framework) (the COSO criteria). Arch Coal, Inc. and subsidiaries’Company’s management is responsible for maintaining effective internal control over financial reporting and for its assessment of the effectiveness of internal control over financial reporting included in the accompanying Management’s Report on Internal Control over Financial Reporting. Our responsibility is to express an opinion on the Company’s internal control over financial reporting based on our audit.Public Company Accounting Oversight Board (United States).PCAOB. Those standards require that we plan and perform the audit to obtain reasonable assurance about whether effective internal control over financial reporting was maintained in all material respects.In our opinion, Arch Coal, Inc. and subsidiaries maintained, in all material respects, effective internal control over financial reporting as of December 31, 2015, based on the COSO criteria.We also have audited, in accordance with the standards of the Public Company Accounting Oversight Board (United States), the consolidated balance sheets of Arch Coal, Inc. and subsidiaries as of December 31, 2015 and 2014, and the related consolidated statements of operations, comprehensive income (loss), stockholders’ equity, and cash flows for each of the three years in the period ended December 31, 2015, and our report dated March 15, 2016, expressed an unqualified opinion thereon that included an explanatory paragraph regarding Arch Coal, Inc.’s ability to continue as a going concern.March 15, 2016F-F- 3 20152017 based on the criteria set forth in Internal Control-Integrated Framework (2013) issued by the Committee of Sponsoring Organizations of the Treadway Commission. Based on its evaluation, management concluded that the Company’s internal control over financial reporting is effective as of December 31, 2015.2017.2015.F-2017.F- 4 Arch Coal, Inc. and SubsidiariesConsolidated Statements of Operations(in thousands, except per share data) Successor Predecessor Year Ended December 31, 2017 October 2 through December 31, 2016 January 1 through October 1, 2016 Year Ended December 31, 2015 Revenues $ 2,324,623 $ 575,688 $ 1,398,709 $ 2,573,260 Costs, expenses and other operating Cost of sales (exclusive of items shown separately below) 1,843,093 470,644 1,264,464 2,172,753 Depreciation, depletion and amortization 122,464 32,604 191,581 379,345 Accretion on asset retirement obligations 30,209 7,634 24,321 33,680 Amortization of sales contracts, net 53,985 796 (728 ) (8,811 ) Change in fair value of coal derivatives and coal trading activities, net 7,222 396 2,856 (1,583 ) Asset impairment and mine closure costs — — 129,267 2,628,303 Losses from disposed operations resulting from Patriot Coal bankruptcy — — — 116,343 Selling, general and administrative expenses 86,821 22,836 59,343 98,783 Gain on sale of Lone Mountain Processing, Inc. (21,297 ) — — — Other operating (income) expense, net (30,270 ) (5,340 ) (15,257 ) 19,510 2,092,227 529,570 1,655,847 5,438,323 Income (loss) from operations 232,396 46,118 (257,138 ) (2,865,063 ) Interest expense, net Interest expense (26,905 ) (11,241 ) (135,888 ) (397,979 ) Interest and investment income 2,649 487 2,653 4,430 (24,256 ) (10,754 ) (133,235 ) (393,549 ) Income (loss) before nonoperating expenses 208,140 35,364 (390,373 ) (3,258,612 ) Nonoperating income (expense) Net loss resulting from early retirement of debt and debt restructuring (2,547 ) — (2,213 ) (27,910 ) Reorganization income (loss), net (2,398 ) (759 ) 1,630,041 — (4,945 ) (759 ) 1,627,828 (27,910 ) Income (loss) before income taxes 203,195 34,605 1,237,455 (3,286,522 ) Provision for (benefit from) income taxes (35,255 ) 1,156 (4,626 ) (373,380 ) Net income (loss) 238,450 33,449 1,242,081 (2,913,142 ) Earnings (loss) per common share Basic earnings (loss) per common share $ 10.05 $ 1.34 $ 58.33 $ (136.86 ) Diluted earnings (loss) per common share $ 9.84 $ 1.31 $ 58.28 $ (136.86 ) Weighted average shares outstanding Basic weighted average shares outstanding 23,725 25,002 21,293 21,285 Diluted weighted average shares outstanding 24,240 25,469 21,313 21,285 F-F- 5 Successor Predecessor Year Ended December 31, 2017 October 2 through December 31, 2016 January 1 through October 1, 2016 Year Ended December 31, 2015 Net income (loss) $ 238,450 $ 33,449 $ 1,242,081 $ (2,913,142 ) Derivative instruments Comprehensive income (loss) before tax 647 — (532 ) (3,477 ) Income tax benefit (provision) — — 80 1,252 647 — (452 ) (2,225 ) Pension, postretirement and other post-employment benefits Comprehensive income (loss) before tax (4,347 ) 24,067 (1,848 ) (5,592 ) Income tax benefit (provision) — — 483 2,011 (4,347 ) 24,067 (1,365 ) (3,581 ) Available-for-sale securities Comprehensive income (loss) before tax (387 ) 387 2,968 1,185 Income tax benefit (provision) — — (1,042 ) (435 ) (387 ) 387 1,926 750 Total other comprehensive income (loss) (4,087 ) 24,454 109 (5,056 ) Total comprehensive income (loss) $ 234,363 $ 57,903 $ 1,242,190 $ (2,918,198 ) F-F- 6 December 31, 2017 December 31, 2016 Assets Current assets Cash and cash equivalents $ 273,387 $ 305,372 Short term investments 155,846 88,072 Restricted cash — 71,050 Trade accounts receivable 172,604 184,483 Other receivables 29,771 19,877 Inventories 128,960 113,462 Other current assets 70,426 96,306 Total current assets 830,994 878,622 Property, plant and equipment Coal lands and mineral rights 390,920 387,591 Plant and equipment 445,407 418,182 Deferred mine development 267,063 280,323 1,103,390 1,086,096 Less accumulated depreciation, depletion and amortization (147,442 ) (32,493 ) Property, plant and equipment, net 955,948 1,053,603 Other assets Prepaid royalties 4,280 — Deferred income taxes 22,520 — Equity investments 106,107 96,074 Other noncurrent assets 59,783 108,298 Total other assets 192,690 204,372 Total assets $ 1,979,632 $ 2,136,597 Liabilities and Stockholders' Equity Current liabilities Accounts payable $ 134,137 $ 95,953 Accrued expenses and other current liabilities 184,161 205,240 Current maturities of debt 15,783 11,038 Total current liabilities 334,081 312,231 Long-term debt 310,134 351,841 Asset retirement obligations 308,855 337,227 Accrued pension benefits 14,036 38,884 Accrued postretirement benefits other than pension 102,369 101,445 Accrued workers’ compensation 184,835 184,568 Other noncurrent liabilities 59,457 63,824 Total liabilities 1,313,767 1,390,020 Stockholders' equity 250 250 Paid-in capital 700,125 688,424 Treasury stock, 3,977 shares at December 31, 2017, at cost (302,109 ) — Retained earnings 247,232 33,449 Accumulated other comprehensive income (loss) 20,367 24,454 Total stockholders’ equity 665,865 746,577 Total liabilities and stockholders’ equity $ 1,979,632 $ 2,136,597 F-F- 7 Successor Predecessor Year Ended December 31, 2017 October 2 through December 31, 2016 January 1 through October 1, 2016 Year Ended December 31, 2015 Operating activities Net income (loss) $ 238,450 $ 33,449 $ 1,242,081 $ (2,913,142 ) Adjustments to reconcile net income (loss) to cash provided by (used in) operating activities: Depreciation, depletion and amortization 122,464 32,604 191,581 379,345 Accretion on asset retirement obligations 30,209 7,634 24,321 33,680 Amortization of sales contracts, net 53,985 796 (728 ) (8,811 ) Prepaid royalties expensed 2,905 2,587 4,791 8,109 Deferred income taxes (21,965 ) 3 (419 ) (367,210 ) Employee stock-based compensation expense 10,437 1,032 2,096 5,760 Gains on disposals and divestitures (24,327 ) (485 ) (6,628 ) (2,270 ) Asset impairment and noncash mine closure costs — — 119,194 2,613,345 Losses from disposed operations resulting from Patriot Coal bankruptcy — — — 116,343 Amortization relating to financing activities 3,736 467 12,800 25,241 Net loss resulting from early retirement of debt and debt restructuring 2,547 — 2,213 27,910 Non-cash bankruptcy reorganization items — — (1,775,910 ) — Changes in: Receivables 8,370 (22,196 ) (42,786 ) 98,212 Inventories (19,626 ) 24,870 34,440 (6,534 ) Coal derivative assets and liabilities 6,040 1,662 5,678 973 Accounts payable, accrued expenses and other current liabilities 17,173 34,129 15,316 (15,532 ) Asset retirement obligations (20,584 ) (4,535 ) (12,041 ) (17,040 ) Pension, postretirement and other postemployment benefits (15,253 ) (5,625 ) (15,692 ) 4,800 Other 1,912 (22,200 ) (28,525 ) (27,546 ) Cash provided by (used in) operating activities 396,473 84,192 (228,218 ) (44,367 ) Investing activities Capital expenditures (59,205 ) (15,214 ) (82,434 ) (119,024 ) Minimum royalty payments (5,296 ) (63 ) (305 ) (5,871 ) Proceeds from disposals and divestitures 12,920 572 (2,921 ) 2,191 Purchases of short term investments (258,948 ) — (98,750 ) (246,735 ) Proceeds from sales of short term investments 190,064 23,000 185,859 290,205 Proceeds from sale of investments in equity investments and securities — — 1,147 2,259 Investments in and advances to affiliates, net (10,173 ) (823 ) (3,441 ) (11,502 ) Withdrawals (deposits) of restricted cash 70,836 10,512 15,979 (91,864 ) Cash provided by (used in) investing activities (59,802 ) 17,984 15,134 (180,341 ) Financing activities Proceeds from issuance of term loan due 2024 298,500 — — — Payments to extinguish term loan due 2021 (325,684 ) — — — Payments on term loan (2,250 ) (816 ) — (19,500 ) Net receipts (payments) on other debt (694 ) 3,374 (11,986 ) (11,332 ) Debt financing costs (10,149 ) — (23,011 ) — Dividends paid (24,369 ) — — — Purchases of treasury stock (301,512 ) — — — Expenses related to debt restructuring (2,360 ) — (2,213 ) (27,910 ) Other (138 ) 151 — — Cash provided by (used in) financing activities (368,656 ) 2,709 (37,210 ) (58,742 ) Increase (decrease) in cash and cash equivalents (31,985 ) 104,885 (250,294 ) (283,450 ) Cash and cash equivalents, beginning of period 305,372 200,487 450,781 734,231 Cash and cash equivalents, end of period $ 273,387 $ 305,372 $ 200,487 $ 450,781 SUPPLEMENTAL CASH FLOW INFORMATION Cash paid during the period for interest $ 34,691 $ 39,620 $ 79,979 $ 283,337 Cash refunded during the period for income taxes, net $ 7,958 $ 287 $ 49 $ 4,138 F-F- 8 20152017F- Treasury Retained Earnings Accumulated Other Common Paid-In Stock, at (Accumulated Comprehensive Stock Capital Cost Deficit) Income (Loss) Total (In thousands, except per share data) Predecessor Company BALANCE AT JANUARY 1, 2015 $ 2,141 $ 3,048,460 $ (53,863 ) $ (1,331,825 ) $ 3,241 $ 1,668,154 Total comprehensive loss — — — (2,913,142 ) (5,056 ) (2,918,198 ) Issuance of 64 shares of common stock under the stock incentive plan-restricted stock and restricted stock units, net of forfeitures 4 (9 ) — — — (5 ) Employee stock-based compensation expense — 5,760 — — — 5,760 BALANCE AT DECEMBER 31, 2015 $ 2,145 $ 3,054,211 $ (53,863 ) $ (4,244,967 ) $ (1,815 ) $ (1,244,289 ) Total comprehensive income — — — 1,242,081 109 1,242,190 Employee stock-based compensation expense — 2,099 — — — 2,099 Elimination of predecessor equity (2,145 ) (3,056,310 ) 53,863 3,002,886 1,706 — BALANCE AT OCTOBER 1, 2016 $ — $ — $ — $ — $ — $ — Successor Company Issuance of successor equity 250 687,233 — — — 687,483 Employee stock-based compensation — 1,032 — — — 1,032 Warrants exercised — 159 — — — 159 Total comprehensive income — — — 33,449 24,454 57,903 BALANCE AT DECEMBER 31, 2016 $ 250 $ 688,424 $ — $ 33,449 $ 24,454 $ 746,577 Dividends on common shares ($0.35/share) $ — $ — $ — $ (24,667 ) $ — $ (24,667 ) Employee stock-based compensation — 10,437 — — — 10,437 Issuance of 17,233 shares of common stock under long-term incentive plans — 1,244 — — — 1,244 Warrants exercised — 20 — — — 20 Purchase of 3,977,215 shares of common stock under share repurchase program — — (302,109 ) — — (302,109 ) Total comprehensive income (loss) — — — 238,450 (4,087 ) 234,363 BALANCE AT DECEMBER 31, 2017 $ 250 $ 700,125 $ (302,109 ) $ 247,232 $ 20,367 $ 665,865 F- 9 Kentucky, Maryland, Virginia, Illinois, Wyoming and Colorado. All subsidiaries are wholly-owned. Intercompany transactions and accounts have been eliminated in consolidation.Filing Under of the United StatesFiling and Emergence from Bankruptcy Codeare beingwere jointly administered under the caption In re Arch Coal, Inc., et al. Case No. 16-40120 (lead case). EachDuring the bankruptcy proceedings, each Debtor will continue to operateoperated its business as a “debtor in possession” under the jurisdiction of the Court and in accordance with the applicable provisions of the Bankruptcy Code and the orders of the Court.The filing of the Bankruptcy Petitions constituted an event of default that accelerated Arch’s obligations under the documents governing each of Arch’s 7.00% senior notes due 2019, 9.875% senior notes due 2019, 8.00% senior secured second lien notes due 2019, 7.25% senior notes due 2020, 7.25% senior notes due 2021 (together, the “senior notes”) and senior secured first lien term loan due 2018 (the “Existing Credit Agreement”) (collectively with the senior notes, the “Debt Instruments”), all as further described in Note 14, “Debt and Financing Arrangements” the Consolidated Financial Statements included in the Form 10-K. Immediately after filing the Bankruptcy Petitions, Arch began notifying all known current or potential creditorsthe Company applied the Financial Accounting Standards Board (“FASB”) Accounting Standards Codification (“ASC”) 852, “Reorganizations”, in preparing its consolidated financial statements. ASC 852 requires that financial statements distinguish transactions and events that are directly associated with the reorganization from the ongoing operations of the Debtors ofbusiness. Accordingly, certain revenues, expenses, realized gains and losses and provisions for losses that are realized or incurred in the bankruptcy filings.Additionally,proceedings have been recorded in a reorganization line item on the Petition Date,Consolidated Statement of Operations. In addition, the New York Stock Exchange (the “NYSE”) determinedpre-petition obligations that may be impacted by the Company’s stock was no longer suitable for listing pursuantbankruptcy reorganization process were classified on the balance sheet as liabilities subject to Section 8.02.01D ofcompromise.NYSE continued listing standards and trading in the Company’s common stock was suspended on January 11, 2016. We expect that the existing common stock of the Company will be extinguished upon the Company’s emergence from Chapter 11 and existing equity holders will not receive consideration in respect of their equity interests.On the Petition Date, the Debtors filed a number of motions with theBankruptcy Court generally designed to stabilize their operations and facilitateentered an order, Docket No. 1324, confirming the Debtors’ transition intoFourth Amended Joint Plan of Reorganization under Chapter 11. Certain of these motions sought authority from the Court for the Debtors to make payments upon, or otherwise honor, certain pre-petition obligations (e.g., obligations related to certain employee wages, salaries and benefits and certain vendors and other providers essential to the Debtors’ businesses). The Court has entered orders approving the relief sought in these motions.Pursuant to Section 36211 of the Bankruptcy Code dated as of September 11, 2016 (the “Plan”), which order was amended on September 15, 2016, Docket No. 1334.filing ofclosing conditions contemplated by the Bankruptcy Petitions automatically stayed most actions againstPlan, which became effective on that date (the “Effective Date”).Debtors, including actionsPlan Effective Date, the Company applied fresh start accounting which required the Company to collect indebtedness incurred priorallocate its reorganization value to the Petition Date or to exercise control over the Debtors’ property. Subject to certain exceptions under the Bankruptcy Code, the filing of the Debtors’ Chapter 11 Cases also automatically stayed the continuation of most legal proceedings, including the third party litigation matters described under “Legal Proceedings,” or the filing of other actions against or on behalf of the Debtors or their property to recover on, collect or secure a claim arising prior to the Petition Date or to exercise control over property of the Debtors’ bankruptcy estates, unless and until the Court modifies or lifts the automatic stay as to any such claim. Notwithstanding the general application of the automatic stay described above, governmental authorities may determine to continue actions brought under their police and regulatory powers.As required by the Bankruptcy Code, the U.S. Trustee for the Eastern District of Missouri appointed an official committee of unsecured creditors (the “Creditors’ Committee”) on January 25, 2016. The Creditors’ Committee represents all unsecured creditors of the Debtors and has a right to be heard on all matters that come before the Court.As a result of extremely challenging current market conditions, the Company believes it will require a significant restructuring of its balance sheet in order to continue as a going concern in the long term. The Company’s ability to continue as a going concern is dependent upon, among other things, improvement in current market conditions, its ability to become profitable and maintain profitability and its ability to successfully implement its Chapter 11 plan strategy. As a result of the Bankruptcy Petitions, the realization of the Debtors’ assets and the satisfaction of liabilities are subject to significant uncertainty. While operating as a debtor-in-possession pursuant to the Bankruptcy Code, the Company may sell or otherwise dispose of or liquidate assets or settle liabilities, subject to the approval of the Court or as otherwise permitted in the ordinary course of business for amounts other than those reflected in the accompanying consolidated financial statements. Further, a Chapter 11 plan is likely to materially change the amounts and classificationsfair value of assets and liabilities reportedin conformity with the guidance for the acquisition method of accounting for business combinations. In addition to fresh start accounting, the Company’s consolidated financial statements reflect all impacts of the transactions contemplated by the Plan. Under the provisions of fresh start accounting, a new entity has been created for financial reporting purposes. The Company selected an accounting convenience date of October 1, 2016 for purposes of applying fresh start accounting as the activity between the convenience date and the Effective Date does not result in a material difference in the Company’s Consolidated Financial Statements.On August 4, 2015,results. References to “Successor” in the Company effected a 1-for-10 reverse stock split of its common stock. Each stockholder’s percentage ownershipfinancial statements and proportional voting power remain unchanged as a resultaccompanying footnotes are in reference to reporting dates on or after October 2, 2016; references to “Predecessor” in the financial statements and accompanying footnotes are in reference to reporting dates through October 1, 2016 which includes the impact of the reverse stock split. All applicable share data, per share amountsPlan provisions and related informationthe application of fresh start accounting. As such, the Company’s financial statements for the Successor will not be comparable in the Consolidated Financial Statements and notes thereto have been adjusted retroactivelymany respects to give effectits financial statements for periods prior to the 1-for-10 reverse stock split.The Company completedadoption of fresh start accounting and prior to the saleaccounting for the effects of Canyon Fuel Company, LLC (Canyon Fuel) on August 16, 2013. The resultsthe Plan.F- 10 Accounting PronouncementsThere are no accounting pronouncements whose adoption had, or is expected to have, a material impact on the Company’s consolidated financial statements.Ventures”Ventures.Acquired “Acquired to the Consolidated Financial Statements, “Sales Contracts”Contracts” for further information related to the Company’s acquired sales contracts.F- 11 arewere recorded at fair value at emergence during fresh start accounting; subsequent purchases of property, plant and equipment have been recorded at cost. Interest costs incurred during the construction period for major asset additions are capitalized. WeThe Company did not capitalize any interest costs during the years ended December 31, 20152017 and 20142016, respectively. Expenditures that extend the useful lives of existing plant and equipment or increase the productivity of the asset are capitalized. The cost of maintenance and repairs that do not extend the useful life or increase the productivity of the asset is expensed as incurred.57 to 3218 years. The useful lives of buildings and leasehold improvements generally range from 101 to 3021 years.$2.4 billion$361.2 million and $4.7 billion$381.0 million at December 31, 20152017 and 2014,2016, respectively. Payments to acquire royalty lease agreements and lease bonus payments are capitalized as a cost of the underlying mineral reserves and depleted over the life of proven and probable reserves. Coal lease rights are depleted using the units-of-production method, and the rights are assumed to have no residual value.Futurepayments total $60.0 million in 2016.amortization.5,6 to the Consolidated Financial Statements, “Impairment Charges and Mine Closure Costs.”GoodwillIn a business combination, goodwill represents the excess of the purchase price over the fair value assigned to the net tangible and identifiable intangible assets acquired. The Company tests goodwill for impairment annually as of the beginning of the fourth quarter, or when circumstances indicate a possible impairment may exist. If the results of the testing indicate that the carrying amount of a reporting unit exceeds the fair value of the reporting unit, the fair value of goodwill must be calculated. An impairment loss generally would be recognized when the carrying amount of goodwill exceeds the implied fair value of goodwill, determined by subtracting the fair value of the other assets and liabilities associated with the reporting unit from the total fair value of the reporting unit. The fair value of a reporting unit is determined using a discounted cash flow (“DCF”) technique. A number of significant assumptions and estimates are involved in the application of the DCF analysis to forecast operating cash flows, including the discount rate, projections of production volumes, quality and costs to produce; projections of sales volumes by market (e.g., thermal versus metallurgical); and projections of market prices. See additional discussion in Note 6, “Goodwill.”$66.3 million and $89.1 $5.3 million at December 31, 2015 and 2014, respectively. Amounts2017, with $2.3 million classified as current were $65.6 million and $25.5 millioncurrent; the unamortized balance of deferred financing costs shown as an asset at December 31, 2015 and 2014, respectively. Current2016 was $5.2 million with $1.9 million classified as current. The current amounts are recorded inclassified within “Other current assets” and the noncurrent amounts are recorded in “Otherclassified withinF- 12 assets” inassets.” For information on the accompanying consolidatedunamortized balance sheets.10)10, “Equity Method Investments and Membership Interests in Joint Ventures”); non-material gains and losses from divestitures and dispositions of assets (Note 3);assets; and realized gains and losses on derivatives that do not qualify for hedge accounting and are not held for trading purposes (Note 12)12, “Derivatives”).prices.prices and interest rate risk on long-term debt. Additionally, the Company may hold certain coal derivative instruments for trading purposes. Derivative financial instruments are recognized in the balance sheet at fair value. Certain coal contracts may meet the definition of a derivative instrument, but because they provide for the physical purchase or sale of coal in quantities expected to be used or sold by the Company over a reasonable period in the normal course of business, they are not recognized on the balance sheet.a forecasted purchase or sale.the underlying item being hedged. Changes in the fair value of the derivative instrument used as a hedge instrument in a cash flow hedge areF- 13 years ended December 31, 2015, 2014 and 2013.“Taxes”“Taxes” for further disclosures about income taxes.areis determined on an actuarial basis and accrued over the employee’s period of active service.Black-Scholes option pricing model.Monte Carlo simulation. Compensation cost for an award with performance conditions is accrued if it is probable that the conditions will be met. The Company accounts for forfeitures as they occur. See further discussion in Note 19, “Stock-Based“Stock-Based Compensation and Other Incentive Plans.Plans.”F- 14 Financial Accounting Standards Board (FASB)FASB issued Accounting Standards Update (ASU)ASU No. 2014-09, Revenue“Revenue from Contracts with Customers.” ASU 2014-09 is a comprehensive revenue recognition standard that will supersede nearly all existing revenue recognition guidance under current U.S. GAAP and replace it with a principle based approach for determining revenue recognition. ASU 2014-09 will requirerequires that companies recognize revenue based on the value of transferred goods or services as they occur in the contract. The ASU also will requirerequires additional disclosure about the nature, amount, timing and uncertainty of revenue and cash flows arising from customer contracts, including significant judgments and changes in judgments and assets recognized from costs incurred to obtain or fulfill a contract. ASU 2014-09 is effective for interim and annual periods beginning after December 15, 2017. EarlyThe Company’s primary source of revenue is from the sale of coal through both short-term and long-term contracts with utilities, industrial customers and steel producers whereby revenue is currently recognized when risk of loss has passed to the customer. During the fourth quarter of 2017, the Company finalized its assessment related to the new standard by analyzing certain contracts representative of the majority of the Company’s coal sales and determined that the timing of revenue recognition related to the Company’s coal sales will remain consistent between the new standard and the current standard. The Company also reviewed other sources of revenue, and concluded the current basis of accounting for these items is in accordance with the new standard. The Company has concluded its adoption, using the modified retrospective method, will not have a material impact on its consolidated financial statements and there will be no cumulative adjustment to retained earnings. The Company also reviewed the disclosure requirements under the new standard and is permitted onlycompiling information needed for the expanded disclosures required during the first quarter of 2018.annual reporting periodsits balance sheet. The standard also requires a lessee to recognize a single lease cost, calculated so that the cost of the lease is allocated over the term of the lease, on a generally straight line basis. The ASU is effective for public companies for fiscal years beginning after December 15, 2016,2018, including interim periods therein. Entities will be able to transition to the standard either retrospectively or as a cumulative-effect adjustment as of the date of adoption.within those fiscal years; early adoption is permitted. The Company has both operating and capital leases. We expect the adoption of this standard to result in the recognition of right-of-use assets and lease liabilities not currently recorded on the Company’s financial statements. The Company is currently in the process of evaluatingaccumulating all contractual lease arrangements in order to determine the impact of ASU 2014-09 on the Company’sits financial statements and disclosures.2014,2016, the FASB issued ASU 2014-15, “PresentationNo. 2016-15, “Classification of Financial Statements-Going Concern (Subtopic 205-40): DisclosureCertain Cash Receipts and Cash Payments.” The amendment requires the classification of Uncertainties About an Entity’s Ability To Continue as a Going Concern.” ASU 2014-15 is intended to define management’s responsibility to evaluate whether there is substantial doubt about an organization’s ability to continue as a going concerncertain cash receipts and to provide related footnote disclosures. The update provides guidance to an organization’s management, with principles and definitions that are intendedcash payments in the statement of cash flows to reduce diversity in the timing and content of disclosures that are commonly provided by organizations today in the financial statement footnotes.practice. The amendments arenew guidance will be effective for the Company’s fiscal year and interim periods within those years beginning after November 1, 2017. EarlyDecember 15, 2017 and the interim periods therein, with early adoption permitted. The amendments in the classification should be applied retrospectively to all periods presented, unless deemed impracticable, in which case, the prospective application is permitted. The Company isplans to adopt the guidance in this standard during the first quarter of 2018.processtotal of evaluatingcash, cash equivalents, and amounts generally described as restricted cash or restricted cash equivalents. Therefore, amounts generally described as restricted cash and restricted cash equivalents should be included with cash and cash equivalents when reconciling the impactbeginning period and end of ASU 2014-15period total amounts shown on the Company’s financial statements and disclosures.In April 2015, the Financial Accounting Standards Board (“FASB”) issued the Accounting Standards Update No. 2015-03 (“statement of cash flows. ASU 2015-03”), Simplifying the Presentation of Debt Issuance Costs. ASU 2015-03 requires debt issuance costs related to recognized debt liability to be presented in the balance sheet as a direct deduction from the carrying amount of the liability, consistent with debt discounts. Amendments in the update are2016-18 is effective retrospectively for fiscal years and interim periods within those years beginning after December 15, 2015, with2018, including interim periods within those fiscal years; early adoption is permitted. Upon adoption of thisThe Company plans to adopt the guidance the current financial statement classification of debt issuance costs will change from total assets to long-term debt on our Consolidated Balance Sheets.In August 2015, the FASB issued ASU 2015-15, “Interest - Imputation of Interest (Subtopic 835-30) - Presentation and Subsequent Measurement of Debt Issuance Costs Associated with Line-of-Credit Arrangements”. On April 7, 2015, the FASB issued ASU 2015-03, Interest-Imputation of Interest (Subtopic 835-30): Simplifying the Presentation of Debt Issuance Costs, which requires entities to present debt issuance costs related to a recognized debt liability as a direct deduction from the carrying amount of that debt liability. Given the absence of authoritative guidance within ASU 2015-03 for debt issuance costs related to line-of-credit arrangements, the SEC staff stated that they would not object to an entity deferring and presenting debt issuance costs as an asset and subsequently amortizing the deferred debt issuance costs ratably over the term of the line-of-credit arrangement, regardless of whether there are any outstanding borrowings on the line-of-credit arrangement. ASU 2015-15 adds these SEC comments to the “S” section of the Codification. The adoption ofin this standard is not expected to have a material impact onduring the Company’s consolidated financial statements.F- 15 May 2015,March 2017, the FASB issued ASU No. 2015-07 “Fair Value Measurement (Topic 820), Disclosures for Investments2017-07, “Improving the Presentation of Net Periodic Pension Cost and Net Periodic Postretirement Benefit Cost.” Under the new guidance, employers will present the service cost component of the net periodic benefit cost in Certain Entities That Calculate Net Asset Value per Share (or its Equivalent)”. This ASU eliminates the requirement to categorize withinsame income statement line item(s) as other employee compensation costs arising from services rendered during the fair value hierarchy investments who fair values are measured at net asset value (NAV) usingperiod. Employers will present the practical expedient in ASC 820. Instead entitiesother components separately from the line item(s) that includes the service cost and outside of any subtotal of operating income, if one is presented. Employers will have to disclose the fair valuesline(s) used to present the other components of such investments so that financial statement users can reconcile amounts reportednet periodic benefit cost, if the components are not presented separately in the fair value hierarchy table toincome statement. Additionally, only the amounts reportedservice cost component will be eligible for capitalization in the balance sheet.assets. ASU 2015-072017-07 is effective for public business entities in fiscal years beginning after 15 December 2015 and interim periods within those years. Early adoption is permitted and guidance will be applied retrospectively. The Company is currently evaluating the impact the adoption of ASU 2015-07 on the Company’s financial statements and disclosures.In July 2015, the FASB issued Accounting Standards Update 2015-11, Simplifying the Measurement of Inventory, which requires that inventory within the scope of ASU 2015-11 be measured at the lower of cost and net realizable value. Inventory measured using last-in, first-out (LIFO) and the retail inventory method are not impacted by the new guidance. ASU 2015-11 applies to all other inventory, which includes inventory that is measured using first-in, first-out (FIFO) or average cost. An entity should measure inventory within the scope of ASU 2015-11 at the lower of cost and net realizable value. Net realizable value is the estimated selling prices in the ordinary course of business, less reasonably predictable costs of completion, disposal, and transportation. ASU 2015-11 is effective for public business entities in fiscal years, and interim periods within those years beginning after December 15, 2016. Early2017, including interim periods within those fiscal year; early adoption is permitted. The Company plans to adopt the guidance in this standard during the first quarter of 2018.currently evaluatingeffective for fiscal years beginning after December 15, 2018, including interim periods within those fiscal years; early adoption is permitted. The Company anticipates early adopting the standard in the first quarter of 2018, although we do not expect a significant impact to the Company’s financial results.F- 16 adoptionPlan provisions and the application of ASU 2015-11 onfresh start accounting. As such, the Company’s financial statements for the Successor will not be comparable in many respects to its financial statements for periods prior to the adoption of fresh start accounting and disclosures.On November 20, 2015,prior to the Financial Accounting Standards Boardaccounting for the effects of the Plan.FASB”First Lien Credit Facility”) will receive their pro rata distribution of (i) total cash payments equal to the greater of (A) $144.8 million less the amount of the adequate protection payments and (B) $30 million; (ii) $326.5 million in principal amount of New First Lien Debt Facility; and (iii) 94% of the common stock of Reorganized Arch Coal (the “New Common Stock”), subject to dilution on account of (a) any Class A Common Stock (as defined below) issued upon exercise of the warrants (the “New Warrants”) issued ASU No. 2015-17, Balance Sheet Classificationpursuant to the Plan to purchase up to 12% of Deferred Taxes, requiring all deferred tax assetsthe fully diluted Class A Common Stock as of the Effective Date and liabilities,exercisable at any time for a period of 7 years from the Effective Date at a strike price calculated based on a total equity capitalization of $1.425 billion ($57 per share) and any related valuation allowance,(b) the issuance of New CommonF- 17 be classified as noncurrent10% of the New Common Stock, on a fully diluted basis, pursuant to a management incentive plan (the “Management Incentive Plan”).balance sheet. The classification change for all deferred taxes as noncurrent simplifies entities’ processes as it eliminates the need to separately identify the net current and net noncurrent deferred tax assetNew Warrants or liability in each jurisdiction and allocate valuation allowances. The Company is in the process(B) such holder’s pro rata share of evaluating the impact of ASU 2015-07 on the Company’s financial statements and disclosures.3. DivestituresDuring 2014, the Company entered into agreements to sell various non-core operations, including operating and idled thermal coal complexes in Kentucky and the Company’s highwall manufacturing subsidiary. The Company received $46.7$25 million in cash and recognized(iii) 6% of the New Common Stock (subject to dilution on account of any exercise of the New Warrants and pursuant to the Management Incentive Plan).net pre-tax gainclaims oversight committee up to $200,000.$17.8 million from these divestitures, reflectedaction that they have, had, or may have that are based on sections 502(d), 544, 545, 547, 548, 549, 550, 551, 553(b) and 724(a) of the Bankruptcy Code and analogous non-bankruptcy law for all purposes against (i) prepetition trade creditors and (ii) officers, directors, employees or representatives of the Debtors or the Reorganized Debtors and all agents and representatives of all of the foregoing. However, the Reorganized Debtors will retain the right to assert any said claims as defenses or counterclaims in “other operating expense (income), net” inany cause of action brought by any creditor.Consolidated Statement of Operations.As part of a strategy to divest non-core thermal coal assets,Effective Date, the Company entered into a warrant agreement (the “Warrant Agreement”) with American Stock Transfer & Trust Company, LLC as warrant agent and, pursuant to the terms of the Plan, issued warrants (“Warrants”) to purchase up to an aggregate of 1,914,856 shares of Class A Common Stock, par value $0.01 per share, of Arch Coal (the “Class A Common Stock”) to holders of claims arising under the Cancelled Notes (as defined below). Each Warrant expires on October 5, 2023, and is initially exercisable for one share of Class A Common Stock at an initial exercise price of $57.00 per share. The Warrants are exercisable by a holder paying the exercise price in cash or on a cashless basis, at the election of the holder. The Warrants contain anti-dilution adjustments for stock splits, reverse stock splits, stock dividends, dividends and distributions of cash, other securities or other property, spin-offs and tender and exchange offers by Arch Coal or its subsidiaries to purchase Class A Common Stock at above-market prices.F- 18 27, 201310, 2016, Amendment No. 5, dated as of June 23, 2016, Amendment No. 6, dated as of July 20, 2016, and Amendment No. 7, dated as of SeptemberF- 19 sell Canyon Fuel,time party there and Wilmington Trust, National Association, in its capacity as administrative agent and as collateral agent (in such capacities, the “DIP Agent”).Bowie Resources, LLC. Canyon Fuel operated two longwallthe secured lenders and to certain holders of general unsecured claims under the Plan on the Effective Date. In addition, on the Effective Date, Arch Coal issued Warrants to purchase up to an aggregate of 1,914,856 shares of Class A Common Stock. Arch Coal relied, based on the confirmation order it received from the Bankruptcy Court, on Section 1145(a)(1) of the U.S. Bankruptcy Code to exempt from the registration requirements of the Securities Act of 1933, as amended (i) the offer and sale of Common Stock to the secured lenders and to the general unsecured creditors, (ii) the offer and sale of the Warrants to the holders of claims arising under the Cancelled Notes and (iii) the offer and sale of the Class A Common Stock issuable upon exercise of the Warrants. Section 1145(a)(1) of the Bankruptcy Code exempts the offer and sale of securities under a plan ofcomplexescompanies with primary operations in the United States. Under this methodology, certain financial multiples and ratios that measure financial performance and value are calculated for each selected company and then applied to the Company’s financials to imply an enterprise value for the Company.continuous miner operationforward-looking enterprise valuation methodology that estimates the value of an assets or business by calculating the present value of expected future cash flows by that asset or business. The basis of the DCF analysis was the Company’s prepared projections which included a variety of estimates and assumptions, such as pricing and demand for coal. The Company’s pricing was based on its view of the market taking into account third party forward pricing curves adjusted for the quality of products sold by the Company. While the Company considers such estimates and assumptions reasonable, they are inherently subject to significant business, economic and competitive uncertainties, many of which are beyond the Company’s control and, therefore, may not be realized. Changes in Utah.these estimates and assumptions may have a significant effect on the determination of the Company’s enterprise value. The saleassumptions used in the calculations for the DCF analysis included projected revenue, cost and cash flows for the years ending December 31, 2016 through each respective mine life and represented the Company’s best estimates at the time the analysis was prepared. The DCF analysis was completed on August 16, 2013, for $422.7 million in cash, including adjustmentsusing discount rates at a range of estimated weighted average costs of capital ranging from 13.25% to 15.25% . The DCF analysis involves complex considerations and judgments concerning appropriate discount rates. Due to the purchase priceunobservable inputs to finalize working capital.F- 20 table summarizesbalance sheet illustrates the impacts of the implementation of the Plan and the application of fresh start accounting, which results in the opening balance sheet of the Successor company.F- 21 As of October 1, 2016 (In thousands) Predecessor (a) Effect of Plan (b) Fresh Start Adjustments (c) Successor Assets Current assets Cash and cash equivalents $ 400,205 $ (199,718 ) (d) $ — $ 200,487 Short term investments 111,451 — — 111,451 Restricted cash 81,563 — — 81,563 Trade accounts receivable 165,522 — — 165,522 Other receivables 17,227 — 779 (j) 18,006 Inventories 159,410 — (21,078 ) (k) 138,332 Prepaid royalties 4,805 — — 4,805 Deferred income taxes — — — — Coal derivative assets 2,180 — — 2,180 Other current assets 36,960 6,367 53,851 (l) 97,178 Total current assets 979,323 (193,351 ) 33,552 819,524 Property, plant and equipment, net 3,434,941 — (2,363,829 ) (m) 1,071,112 Other assets Prepaid royalties 20,997 — (20,997 ) (n) — Equity investments 164,232 — (61,606 ) (o) 102,626 Other noncurrent assets 58,569 34,495 (e) 37,503 (p) 130,567 Total other assets 243,798 34,495 (45,100 ) 233,193 Total assets $ 4,658,062 $ (158,856 ) $ (2,375,377 ) $ 2,123,829 Liabilities and Stockholders’ Equity (Deficit) Liabilities not subject to compromise Accounts payable $ 74,595 $ — $ (250 ) (q) $ 74,345 Accrued expenses and other current liabilities 225,739 (36,331 ) (f) 26,644 (r) 216,052 Current maturities of debt 3,397 3,265 (g) — 6,662 Total current liabilities 303,731 (33,066 ) 26,394 297,059 Long-term debt 30,037 323,235 (g) — 353,272 Asset retirement obligations 394,699 — (60,570 ) (s) 334,129 Accrued pension benefits 23,716 — 24,565 (t) 48,281 Accrued other postretirement benefits 87,123 — 24,836 (t) 111,959 Accrued workers’ compensation 119,828 — 74,520 (u) 194,348 Deferred income taxes — — — — Other noncurrent liabilities 96,410 — 888 (v) 97,298 Total liabilities not subject to compromise 1,055,544 290,169 90,633 1,436,346 Liabilities subject to compromise 5,278,612 (5,278,612 ) (h) — — Total liabilities 6,334,156 (4,988,443 ) 90,633 1,436,346 Stockholders’ equity (deficit) Common stock, predecessor 2,145 (2,145 ) (i) — — Common stock, successor — 250 (b) — 250 Paid-in capital, predecessor 3,056,307 (3,056,307 ) (i) — — Paid-in capital, successor — 687,233 (b) — 687,233 Treasury stock, at cost (53,863 ) 53,863 (i) — — Accumulated earnings (deficit) (4,678,977 ) 7,146,693 (i) (2,467,716 ) — Accumulated other comprehensive income (loss) (1,706 ) — 1,706 — Total stockholders’ equity (deficit) (1,676,094 ) 4,829,587 (2,466,010 ) 687,483 Total liabilities and stockholders’ equity (deficit) $ 4,658,062 $ (158,856 ) $ (2,375,377 ) $ 2,123,829 F- 22 (a) Represents the Predecessor consolidated balance sheet as of October 1, 2016. (b) Represents amounts recorded for the implementation of the Plan on the Effective Date. This includes the settlement of liabilities subject to compromise through a combination of cash payments, the issuance of new common stock and warrants and the issuance of new debt. The following is the calculation of the total pre-tax gain on the settlement of the liabilities subject to compromise: In thousands Liabilities subject to compromise $ 5,278,612 Less amounts issued to settle claims: Common stock (at par) Successor (250 ) Warrants Successor (14,822 ) Paid-in capital Successor (672,411 ) Issuance of Term Loan Successor (326,500 ) Cash payment to settle claims and professional fees (122,525 ) Total pre-tax gain on plan effects $ 4,142,104 (c) Represents the fresh start accounting adjustments required to record the assets and liabilities of the Company at fair value. (d) The following table reflects the use of cash at emergence: In thousands Payment to secured lenders $ 43,496 Payments to unsecured creditors 42,399 Final adequate protection payment 36,331 Collateral requirements 31,665 Professional fees 31,630 Other 14,197 Total cash outflow at emergence $ 199,718 (e) Represents amounts paid for required collateral deposits. (f) Represents the final adequate protection payments made to the secured lenders. (g) Represents the fair value of the $326.5 million new term loan of which $3.3 million is shown within current maturities of debt. (h) Liabilities subject to compromise include unsecured or under-secured liabilities incurred prior to the Chapter 11 filing; and consists of the following: Previously Reported Balance Sheet Line In thousands Debt $ 5,026,806 Accrued expenses and other current liabilities 136,295 Accounts payable 106,297 Other noncurrent liabilities 9,214 Total liabilities subject to compromise $ 5,278,612 F- 23 (i) Reflects the impacts of the reorganization adjustments: In thousands Total pre-tax gain on settlement of claims $ 4,142,104 Cancellation of predecessor common stock 2,145 Cancellation of predecessor paid-in capital 3,056,307 Cancellation of predecessor treasury stock (53,863 ) Net impact on accumulated earnings (deficit) $ 7,146,693 (j) Represents adjustments to record other receivables at fair value which includes an $0.8 million short-term receivable related to insurance coverage for self-insured workers’ compensation obligations. (k) Represents the following fair value adjustments: a $7.3 million increase related to coal inventory which was fair valued at estimated selling prices less the sum of selling costs, shipping costs and a reasonable profit allowance for the selling effort offset by a $28.4 million reduction in critical spare parts inventory. During fresh start accounting, the Company changed its accounting policy with respect to critical spare parts with long lead times; previously these items were valued within inventory, but prospectively, these items will be capitalized within property, plant and equipment when purchased and depreciated over the life of the related equipment. (l) Represents the short-term portion of above market coal sales contracts of $71.1 million offset by $11.3 million in reductions related to prepaid balances. The fair value of sales contracts was estimated using a discounted cash flow model and will be amortized into earnings as the coal is shipped throughout the term of the associated contracts. (m) Represents a $2.4 billion reduction in property, plant and equipment to estimated fair value as discussed below: Predecessor Fresh Start Adjustments Successor (in thousands) Net Coal Properties $ 2,358,779 $ (1,971,314 ) $ 387,465 Net Plant & Equipment 812,888 (405,259 ) 407,629 Net Deferred Charges 263,274 12,744 276,018 $ 3,434,941 $ (2,363,829 ) $ 1,071,112 F- 24 (n) Represents a fair value adjustment to a long-term prepaid royalty balance that the Company has concluded should not be assigned value based on market conditions and after considering economic obsolescence. (o) Represents a fair value adjustment to the Company’s equity investments in Knight Hawk Holdings, LLC, a coal producer in the Illinois Basin; and Dominion Terminal Associates which operates a ground storage-to-vessel coal trans-loading facility in Newport News, Virginia. Equity investments were fair valued in a manner similar to the Company’s wholly-owned subsidiaries using a discounted cash flow model and comparable company approach. The discount rate selected was 14% and due to the unobservable nature of the inputs, the fair values are considered Level 3 in the fair value hierarchy. (p) Represents the long-term portion of above market coal sales contracts of $26.0 million and $18.6 million related to a long-term insurance receivable related to insurance coverage for self-insured workers’ compensation obligations partially offset by $13.2 million in reductions related to prepaid balances. The fair value of sales contracts was estimated using a discounted cash flow model and will be amortized into earnings as the coal is shipped throughout the term of the associated contracts. (q) Represents a fair value adjustment to miscellaneous accounts payable. (r) Represents fair value adjustments for the following: a $27.8 million increase related to the short-term portion of below market sales contracts offset by fair value adjustments to establish the current portion of pension, postretirement and workers’ compensation liabilities. The fair value of sales contracts was estimated using a discounted cash flow model and will be amortized into earnings as the coal is shipped throughout the term of the associated contracts. (s) Represents the fair value adjustment related to the Company’s asset retirement obligations which was calculated using discounted cash flow models based on current mine plans using the guidance provided within Accounting Standard Codification 410-20, “Asset Retirement Obligations.” The discount rates ranged from 7.06% to 9.08%. (t) Pension and postretirement benefits were fair valued based on plan assets and employee benefit obligations at October 1, 2016. The benefit obligations were computed using the applicable October 1, 2016 discount rates. In conjunction with fresh start accounting, the Company updated its mortality rate table assumptions and corridor assumption. (u) Represents fair value adjustments for workers’ compensation benefits, including occupational disease benefits, that were actuarially determined using the guidance provided within Accounting Standard Codification 712, “Non-retirement Post-employment Benefits.” Upon emergence, the Company’s accounting policy is to actuarially calculate this liability. Prior to emergence, the Company had accounted for its liability based on outstanding reserves calculated per third party administrators. (v) Represents the following fair value adjustments: $3.9 million increase related to the long-term portion of below market sales contracts partially offset by $3.1 million reduction in miscellaneous noncurrent liabilities. The fair value of sales contracts was estimated using a discounted cash flow model and will be amortized into earnings as the coal is shipped throughout the term of the associated contracts. F- 25 Successor Predecessor Year Ended December 31, 2017 October 2 through December 31, 2016 January 1 through October 1, 2016 Year Ended December 31, 2015 (In thousands) Gain on settlement of claims (per above) $ — $ — $ 4,142,104 $ — Fresh start adjustments, net (per above) — — (2,466,010 ) — Professional fees (2,398 ) (759 ) (46,053 ) — $ (2,398 ) $ (759 ) $ 1,630,041 $ — operationsrecording interest expense on unsecured debt that was classified as a liability subject to compromise. Actual interest expense recorded on the Predecessor debt subsequent to the Petition Date was $135.9 million for the period January 1 through the date of disposition:
December 31,F-$300.9 million17.F- 26 Pension, Postretirement Accumulated and Other Post- Other Derivative Employment Available-for- Comprehensive Instruments Benefits Sale Securities Income (Loss) (In thousands) Predecessor Company January 1, 2016 $ 325 $ (721 ) $ (1,419 ) $ (1,815 ) Unrealized gains (losses) (138 ) — 701 563 Amounts reclassified from accumulated other comprehensive income (loss) (316 ) (1,363 ) 1,225 (454 ) Fresh start accounting adjustment 129 2,084 (507 ) 1,706 October 1, 2016 — — — — Successor Company Unrealized gains (losses) — 24,067 387 24,454 Amounts reclassified from accumulated other comprehensive income (loss) — — — — December 31, 2016 $ — $ 24,067 $ 387 $ 24,454 Unrealized gains (losses) 497 (3,589 ) — (3,092 ) Amounts reclassified from accumulated other comprehensive income (loss) 150 (758 ) (387 ) (995 ) December 31, 2017 $ 647 $ 19,720 $ — $ 20,367 F- 27 years ended December 31, 2015 and 2014, respectively:
other comprehensive income components
Consolidated Statement of Operations Successor Predecessor Year Ended December 31, 2017 October 2 through December 31, 2016 January 1 through October 1, 2016 (in thousands) Derivative instruments Coal hedges $ — $ — $ 397 Revenues Interest rate hedges (150 ) — Interest expense — — (81 ) Provision for (benefit from) income taxes $ (150 ) $ — $ 316 Net of tax Pension, postretirement and other post-employment benefits $ — $ — $ 7,854 — — (6,010 ) Curtailments (773 ) — — Settlements 1,531 — — 758 — 1,844 Total before tax — — (481 ) Provision for (benefit from) income taxes $ 758 $ — $ 1,363 Net of tax $ 387 $ — $ (2,263 ) Interest and investment income — — 1,038 Provision for (benefit from) income taxes $ 387 $ — $ (1,225 ) Net of tax F- 28 (1) Production-related benefits and workers’ compensation costs are included in costs to produce coal.(2) The gains and losses on sales of available-for-sale-securities are determined on a specific identification basis.F-18 Successor Predecessor Description Year Ended December 31, 2017 October 2 through December 31, 2016 January 1 through October 1, 2016 Year Ended December 31, 2015 (In thousands) Coal lands and mineral rights $ — $ — $ 74,144 $ 2,210,488 Plant and equipment — — — 199,107 Deferred development — — — 159,474 Prepaid royalties — — 3,406 41,990 Equity investments — — 40,920 21,325 Inventories — — — 66 Other — — 10,797 (4,147 ) Total $ — $ — $ 129,267 $ 2,628,303 consolidated statementsConsolidated Statements of operations:representrepresented indicators of impairment with respect to certain of its long-lived assets or assets groups. Using current pricing expectations which reflectreflected marketplace participant assumptions, life of mine cash flows were used to determine if the undiscounted cash flows exceedexceeded the current asset values for certain operating complexes in the Company’s Appalachia segment. For multiple operating complexes, the undiscounted cash flows did not exceed the carrying value of the long-lived assets. Discounted cash flows were utilized to reduce the carrying value of those assets to fair value. The discount rate used reflectsreflected the then current financial difficulties present in the commodities sector in general and coal mining specifically; the perceived risk of financing coal mining in light of industry defaults; and the lack of an active market for buying or selling coal mining assets. Additionally, the Company determined that the then current market conditions representrepresented an indicator of impairment for certain undeveloped coal properties that were acquired in times of significantlyF- 29 CurrentThe then current prices and the significant capital outlay that would behave been required to develop these reserves indicateindicated that the carrying value iswas not recoverable. As a result the Company recorded a $2.6 billion asset impairment charge in the last two quarters of 2015 of which $2.1 billion was recorded during the third quarter and the remaining $0.5 billion was recorded in the fourth quarter. Of the total charge. $2.2 billion was recorded to the Company’s Appalachia segment, with the remaining $0.4 billion recorded to the Company’s Other operating segment. There is no fair value remaining related to the impaired assets.relatesrelated to the portion of an advance royalty balance on a reserve base mined at the Company’s Mountain Laurel, Spruce and Briar Branch operations that willwas determined would not be recouped based on latest estimates of sales volume and pricing through the March 2017 recoupment period. Additionally, the companyCompany recorded a $5.6 million impairment charge related to the closure of a higher-cost mining complex serving the metallurgical coal markets.2014 Impairment ChargesDuring the Company’s annual budgeting process for 2015 (performed in the fall of 2014), a review of forecasted revenues indicated that the remaining balance of advance royalty payments made on a reserve base supplying the Company’s Mountain Laurel, Spruce Mine and Briar Branch operations would not be recoupable against future royalties payments. UnderF-19the lease, any unrecouped advance payment balance at March 31, 2017 will be forfeited by the Company. Based on estimates of sales volumes and pricing through the end of the recoupment period, an impairment charge was recorded during the fourth quarter of 2014 for $15.4 million of the remaining $48.0 million balance that would not be recouped.In response to weak metallurgical coal markets the Company idled a higher-cost mining complex in the third quarter of 2014 in order to concentrate on metallurgical coal production from its lowest-cost and highest-margin operations. Closure charges of $5.1 million were recognized during the third quarter of 2014 relating to the idling.2013 Impairment ChargesAs a result of the weak thermal coal markets in Appalachia, the Company assessed in the third quarter of 2013 whether the carrying values of certain assets were recoverable through future cash flows. The Company determined that the carrying amounts of certain assets associated with the Hazard mining complex in Kentucky and the Company’s ADDCAR subsidiary, which manufactures and sells its patented highwall mining system, could not be recovered through future cash flows expected to be generated from use of the assets and their ultimate disposal.The assets’ fair values were determined based on projections of cash flows to be generated from use of the assets and their ultimate disposal including estimates relating to market demand, coal prices, production costs and mine plans, and recovery value of the assets. An impairment charge of $142.8 million was recognized to adjust the carrying value of the assets to their fair value of $71.3 million.During 2013, the Company also recognized other-than-temporary impairment charges related to equity method investments. See further discussion in Note 10, “Equity Method Investments and Membership Interests in Joint Ventures.”Due to the unobservable inputs within the modeling used to determine fair market value within the Company’s asset impairment process, the fair value would be considered level 3 within the fair value hierarchy.6. GoodwillChanges in the carrying value of goodwill for the three years ended December 31, 2015 are as follows:The Company performed its annual impairment testing as of October 1, 2013 on its two remaining Appalachia reporting units with goodwill balances, the Leer mining complex and an undeveloped property adjacent to it. The fair value of these two reporting units are sensitive to the volatility in the demand for and pricing of metallurgical coal, and continuing weakness in the metallurgical coal markets resulted in a reassessment of key marketing and operating assumptions during the Company’s annual budgeting process. As a result, the book values of the reporting units exceeded their fair values after the first step of the goodwill impairment tests. It was also determined that the goodwill had no fair value, and the Company recognized an impairment loss for the remaining reporting units totaling $265.4 million.hashad provided surety bonds to Patriot related to permits that were sold to an affiliate of Virginia Conservation Legacy Fund, Inc. (“VCLF”). Should VCLF not perform required reclamation, the Company would incur losses under the bonds and related indemnity agreements. The Company recognized $116.3 million in losses in 2015 related to the previously disposed operations as a result of the Patriot Coal bankruptcy. An original charge$149.3 million was recorded in the third quarter of 2015 based on our best estimate at the time. This was subsequently reduced by $33.0 million in the fourth quarter due to revised census data and changes in underlying assumptionsreclamation surety bonds related to the retiree medical benefits.F-21former Magnum properties placed by Arch in exchange for a collateral release of $20 million held by the bonding company to VCLF. December 31, 2017 December 31, 2016 (In thousands) Coal $ 54,692 $ 37,268 Repair parts and supplies 74,268 76,194 $ 128,960 $ 113,462 $6.0$0.3 million at December 31, 2017 and $0.0 million at December 31, 2015 and $6.6 million at December 31, 2014.F- 30 December 31, 2017 Balance Sheet Gross Gross Classification Unrealized Unrealized Fair Short-Term Other Cost Basis Gains Losses Value Investments Assets (In thousands) Available-for-sale: U.S. government and agency securities $ 64,151 $ 22 $ (73 ) $ 64,100 $ 64,100 $ — Corporate notes and bonds 92,038 — (292 ) 91,746 91,746 — Total Investments $ 156,189 $ 22 $ (365 ) $ 155,846 $ 155,846 $ — December 31, 2016 Balance Sheet Gross Gross Classification Unrealized Unrealized Fair Short-Term Other Cost Basis Gains Losses Value Investments Assets (In thousands) Available-for-sale: Corporate notes and bonds $ 88,161 $ — $ (89 ) $ 88,072 $ 88,072 $ — Equity securities 1,749 388 — 2,137 — 2,137 Total Investments $ 89,910 $ 388 $ (89 ) $ 90,209 $ 88,072 $ 2,137 $184.6$132.0 million and $163.0$47.6 million at December 31, 20152017 and 2014,2016, respectively. The aggregate fair value of investments with unrealized losses that have been owned for over a year was $15.8$0.0 million and $86.1$40.4 million at December 31, 20152017 and 2014,2016, respectively.20152017 have maturity dates ranging from the first quarter of 2016 20182017.2019. The Company classifies its investments as current based on the nature of the investments and their availability to provide cash for use in current operations, if needed.F- 31 Certain of the Company’s investments are in development stage companies whose success depends on factors including the receipt of permits and other regulatory environmental issues, the ability of the investee companies to raise additional funds in financial markets that can be volatile and other key business factors, any of which may impact the Company’s ability to recover its investment.
Hawk
River(In thousands) Knight Hawk DTA Millennium Tongue River Other Total Predecessor Company January 1, 2015 $ 158,477 $ 13,738 $ 40,223 $ 20,740 $ 2,664 $ 235,842 Advances to (distributions from) affiliates, net (29,862 ) 3,207 7,052 913 330 (18,360 ) Equity in comprehensive income (loss) 22,977 (3,706 ) (9,686 ) (328 ) (1,278 ) 7,979 Impairment of equity investment — — — (21,325 ) — (21,325 ) Sale of equity investment — — — — (2,259 ) (2,259 ) December 31, 2015 151,592 13,239 37,589 — (543 ) 201,877 Advances to (distributions from) affiliates, net (8,374 ) 1,474 1,966 — — (4,934 ) Equity in comprehensive income (loss) 9,033 (2,095 ) (1,530 ) — (94 ) 5,314 Impairment of equity investment — — (38,025 ) — — (38,025 ) Fresh start accounting adjustment (58,251 ) (4,018 ) — — 662 (61,607 ) October 1, 2016 94,000 8,600 — — 25 102,625 Successor Company Advances to (distributions from) affiliates, net (9,076 ) 822 — — — (8,254 ) Equity in comprehensive income (loss) 2,569 (841 ) — — (25 ) 1,703 December 31, 2016 $ 87,493 $ 8,581 $ — $ — $ — $ 96,074 Investments in affiliates — 7,158 — — — 7,158 Advances to (distributions from) affiliates, net (8,736 ) 3,014 — — — (5,722 ) Equity in comprehensive income (loss) 11,409 (2,812 ) — — — 8,597 December 31, 2017 $ 90,166 $ 15,941 $ — $ — $ — $ 106,107 of 21.875% in Dominion Terminal Associates (“DTA”), which is accounted for under the equity method. In March 2017, the Company paid $7.2 million through an auction process held by one of the existing owners, increasing its ownership in DTA from 21.875% to 35%. DTA operates a ground storage-to-vessel coal transloading facility in Newport News, Virginia for use by the partners. Under the terms of a throughput and handling agreement with DTA, each partner is charged its share of cash operating and debt-service costs in exchange for the right to use the facility’s loading capacity and is required to make periodic cash advances to DTA to fund such costs.holdspreviously held a 38% ownership interest in Millennium Bulk Terminals-Longview, LLC (“Millennium”), the owner of a brownfield bulk commodity terminal on the Columbia River near Longview, Washington. Additional future purchase consideration is due upon the completion of certain project milestones. Millennium continues to work on obtaining the required approvals and necessary permits to complete dredging and other upgrades to ship coal, alumina and cementitious material from the terminal. During the second quarter of 2016, the Company recorded an impairment charge of $38.0 million representing the entire value of its equity investment as the Company relinquished its ownership rights in exchange for future throughput rights through the facility when completed.will control 38% of the terminal’s throughput and storage capacity, in order to facilitate export shipments of coal off the west coast of the United States.The Company holdspreviously held a 35% membership interest in the Tongue River Holding Company, LLC (“Tongue River”) joint venture. Tongue River willwas formed to develop and construct a railway line near Miles City, Montana and the Company’s Otter Creek reserves.reserves formerly controlled by the Company. The Company hashad the right, upon the receipt of permits and approval for construction or under other prescribed circumstances, to require the other investors to purchase all of the Company’s units in the venture at an amount equal to the capital contributions made by the Company at that time, less any distributions received. During the third quarter of 2015, theF- 32 holds a 24% equity interest in DKRW Advanced Fuels LLC (“DKRW”), who had entered into an Engineering, Procurement and Construction Agreement with a Chinese company to construct and commission the Medicine Bow coal-to-liquids facility. However, as the project didis not progress to the next stage of development, the Company recorded an other-than-temporary impairment charge of $57.7 million in the third quarter of 2013, representing the Company’s equity investment of $13.7 million and an outstanding $44.0 million loan receivable balance. The impairment charges are included on the line “Asset impairment and mine closure costs” in the consolidated statement of operations.During the second quarter of 2013, Tenaska Trailblazer Partners, LLC (“Tenaska”) announced that it was discontinuing its development plans for the Trailblazer Energy Center in Texas. As a result, the Company recorded a $20.5 million impairment charge, which consisted of its 35% equity investment of $15.3 million and a $5.2 million receivable balance related to advances for development work. The impairment charges are included on the line “Asset impairment and mine closure costs” in the consolidated statement of operations.The Company may be required to make any future contingent payments of up to $58.5 million related to development financing for certainany of its equity investees. The Company’s obligation to make these payments, as well as the timing of any payments required, is contingent upon the achievement of project development milestones. Acquired Sales Contracts acquired sales contracts reflected in the consolidated balance sheets are as follows: December 31, 2017 December 31, 2016 Assets Liabilities Net Total Assets Liabilities Net Total (In thousands) (In thousands) Original fair value $ 97,196 $ 31,742 $ 97,196 $ 31,742 Accumulated amortization (84,760 ) (29,979 ) (25,625 ) (24,829 ) Total $ 12,436 $ 1,763 $ 10,673 $ 71,571 $ 6,913 $ 64,658 Balance Sheet classification: Other current $ 12,432 $ 934 $ 59,702 $ 5,114 Other noncurrent $ 4 $ 829 $ 11,869 $ 1,799 amortizationthe majority of acquiredthe remaining net book value of sales contracts to be amortized in 2018 based upon expected shipmentsshipments.next five years, to be income of approximately $3.3 million in 2016, $3.7 million in 2017, $3.7 million in 2018, $3.7 million in 2019 and $0.3 million in 2020.12. DerivativesConsolidated Financial Statements.5042 to 5846 million gallons of diesel fuel for use in its operations during 2016.2018. To protect the Company’s cash flows from increases in the price of diesel fuel for its operations, the Company may useuses forward physical diesel purchase contracts and purchase out-of-the-moneypurchased heating oil call options to protect against substantial increases in pricing.options. At December 31, 2015,2017, the Company had heating oil call options for approximately 5626.2 million gallons at an average strike price of $1.98.2015,2017, the Company held derivatives for risk management purposes that are expected to settle in the following years:(Tons in thousands) 2018 2019 Total Coal sales 1,706 159 1,865 Coal purchases 747 — 747 F- 33 gainslosses of $5.8$1.2 million in the trading portfolio are expected to be realized in 2016. December 31, 2017 December 31, 2016 Fair Value of Derivatives Asset Liability Asset Liability (In thousands) Derivative Derivative Derivative Derivative Derivatives Designated as Hedging Instruments Coal $ 942 $ (2,146 ) $ — $ (15 ) Derivatives Not Designated as Hedging Instruments Heating oil -- diesel purchases 5,354 — 4,646 — Coal held for trading purposes, exchange traded swaps and futures 44,088 (45,221 ) 68,948 (68,740 ) Coal -- risk management 5,139 (9,892 ) 475 (580 ) Natural gas 27 — 86 (13 ) Total 54,608 (55,113 ) 74,155 (69,333 ) Total derivatives 55,550 (57,259 ) 74,155 (69,348 ) Effect of counterparty netting (50,042 ) 50,042 (69,247 ) 69,247 Net derivatives as classified in the balance sheets $ 5,508 $ (7,217 ) $ (1,709 ) $ 4,908 $ (101 ) $ 4,807 December 31, 2017 December 31, 2016 Net derivatives as reflected on the balance sheets Heating oil Other current assets $ 5,354 $ 4,646 Coal Other current assets 154 262 Accrued expenses and other current liabilities (7,217 ) (101 ) $ (1,709 ) $ 4,807 Table of Contents$1.7$16.2 million and a current liability for the obligation to return cash collateral of $2.4$2.8 million at December 31, 20152017 and 2014,2016, respectively. These amounts are not included with the derivatives presented in the table above and are included in “other current assets” and “other current liabilities”, respectively, in the accompanying consolidated balance sheets.F- 34 year ended December 31,
Comprehensive Income (Effective Portion)
Comprehensive Income into Income
(Effective Portion) Gain (Loss) Recognized in Other Comprehensive Income (Effective Portion) Successor Predecessor Year Ended December 31, 2017 October 2 through December 31, 2016 January 1 through October 1, 2016 Year Ended December 31, 2015 Coal sales $ (2,127 ) $ — $ (672 ) 12,816 Coal purchases 942 — 536 (6,718 ) $ (1,185 ) $ — $ (136 ) $ 6,098 Gains (Losses) Reclassified from Other Comprehensive Income into Income
(Effective Portion) Successor Predecessor Year Ended December 31, 2017 October 2 through December 31, 2016 January 1 through October 1, 2016 Year Ended December 31, 2015 Coal sales $ — $ — $ 1,634 $ 18,635 Coal purchases — — (1,237 ) (9,060 ) $ — $ — $ 397 $ 9,575 years ended December 31, 2015, 2014 and 2013.year ended December 31, Gain (Loss) Recognized Successor Predecessor Year Ended December 31, 2017 October 2 through December 31, 2016 January 1 through October 1, 2016 Year Ended December 31, 2015 Coal — unrealized $ (4,648 ) $ (408 ) $ (1,662 ) $ (3,883 ) Coal — realized $ — $ 116 $ (476 ) $ 3,236 Heating oil — diesel purchases $ (1,057 ) $ 827 $ 826 $ (8,294 ) Natural gas $ (774 ) $ (91 ) $ (463 ) $ 878 Foreign currency $ — $ (9 ) $ (451 ) $ (867 ) F- 35 $3.2 million, and $4.9 million during the yearsyear ended December 31, 2015, 2014 and 2013, respectively, related to its trading portfolio, which are included in the caption “Change in fair value of coal derivatives and coal trading activities, net” in the accompanying consolidated statements of operations, and are not included in the previous tables reflecting the effects of derivatives on measures of financial performance.2015, losses2017, amounts on derivative contracts designated as hedge instruments in cash flow hedges expected to be reclassified from other comprehensive income into earnings during the next twelve months are immaterial.F-losses of $1.2 million.27The increase in the accrued interest balance is due to December 31, 2017 December 31, 2016 (In thousands) Payroll and employee benefits $ 53,149 $ 58,468 Taxes other than income taxes 77,017 92,733 Interest 246 8,032 Sales contracts 934 5,114 Workers’ compensation 18,782 15,184 Asset retirement obligations 19,840 19,515 Other 14,193 6,194 $ 184,161 $ 205,240 F- 36 December 31, 2017 December 31, 2016 (In thousands) Term loan due 2024 ($297.8 million face value) $ 296,435 $ — Term loan due 2021 ($325.7 million face value) $ — $ 325,684 Other 36,514 37,195 Debt issuance costs (7,032 ) — 325,917 362,879 Less current maturities of debt 15,783 11,038 Long-term debt $ 310,134 $ 351,841 exercisingentered into a new senior secured term loan credit agreement in an aggregate principal amount of $300 million (the “New Term Loan Debt Facility”) with Credit Suisse AG, Cayman Islands Branch, as administrative agent and collateral agent (in such capacities, the 30-day grace period under its indenture agreements with holders of its 9.875% Senior Notes due 2019, the 7.00% Senior Notes due 2019“Agent”), and the 7.25% Senior Notes due 2021other financial institutions from time to time party thereto (collectively, the “Lenders”). The New Term Loan Debt Facility was issued at 99.50% of the face amount and will mature on December 15, 2015. This extended the time periodMarch 7, 2024.hadentered into the First Amendment (the “Amendment”) to makeits Credit Agreement, dated as of March 7, 2017, among Arch Coal as borrower, the approximately $90lenders from time to time party thereto, and Credit Suisse AG, Cayman Islands Branch, as administrative agent and collateral agent.interest payment due December 15, 2015 without triggeringterm loan facility to, at the option of Arch Coal, either (i) the London interbank offered rate (“LIBOR”) plus an eventapplicable margin of default3.25%, subject to a 1.00% LIBOR floor, or (ii) a base rate plus an applicable margin of 2.25%. The Amendment also resets the 1.00% call premium to apply to repricing events that occur on or prior to March 26, 2018.indentures. Subsequently, on January 11, 2016New Term Loan Debt Facility bear interest at a per annum rate equal to, at the Company’s option, either (i) a London interbank offered rate plus an applicable margin of 4%, subject to a 1% LIBOR floor (the “Petition Date”“LIBOR Rate”), or (ii) a base rate plus an applicable margin of 3%. The term loans provided under the CompanyNew Term Loan Debt Facility (the “Term Loans”) are subject to quarterly principal amortization payments in an amount equal to $750,000.substantially all of itsfuture wholly owned domestic subsidiaries filed voluntary petitions for reorganization under Chapter 11 of Title 11 of the U.S. Code inCompany (collectively, the United States Bankruptcy Court for“Subsidiary Guarantors” and, together with Arch Coal, the Eastern District of Missouri. See additional details in Note 26, “Subsequent Events.”14. Debt“Loan Parties”), subject to customary exceptions, and Financing ArrangementsAcceleration of Debt Obligations; Automatic StayThe filingis secured by first priority security interests on substantially all assets of the Bankruptcy Petitions constituted an event of default that accelerated the Company’s obligations under the documents governing each of its 7.00% senior notes due 2019, 9.875% senior notes due 2019, 8.00% senior secured second lien notes due 2019, 7.25% senior notes due 2020, 7.25% senior notes due 2021 (together, the “senior notes”) and senior secured first lien term loan due 2018. Immediately after filing the Bankruptcy Petitions, the Company began notifying all known current or potential creditorsLoan Parties, including 100% of the Debtorsvoting equity interests of directly owned domestic subsidiaries and 65% of the bankruptcy filings.Pursuantvoting equity interests of directly owned foreign subsidiaries, subject to Section 362customary exceptions.Bankruptcy Code, the filingapplicable interest periods therefor shall be made with reimbursement for any funding losses and redeployment costs of the Bankruptcy Petitions automatically stayed most actions against the Debtors, including actions to collect indebtedness incurred prior to the Petition Date or to exercise control over the Debtors’ property. SubjectLenders resulting therefrom.exceptions under the Bankruptcy Code, the filingusual and customary mandatory prepayment events, including 100% of the Debtors’ Chapter 11 Cases also automatically stayed the continuationnet cash proceeds of most legal proceedings, including the third party litigation matters described underItem 3, “Legal Proceedings,” or the filing of other actions against or on behalf of the Debtors or their property(i) debt issuances (other than debt permitted to recover on, collect or secure a claim arising prior to the Petition Date or to exercise control over property of the Debtors’ bankruptcy estates, unless and until the Court modifies or lifts the automatic stay as to any such claim. Notwithstanding the general application of the automatic stay described above, governmental authorities may determine to continue actions brought under their police and regulatory powersCredit FacilitiesAs of September 30, 2015, availability under the Company’s revolver was subject to limits on secured debt in its senior note indentures. At September 30, 2015, the limit under the most restrictive indenture did not provide meaningful availability under the revolver and, as a result, on November 6, 2015 the Company delivered an irrevocable 5 day notice to the administrative agent to voluntarily terminate all commitments thereunder, which terminated on November 11, 2015. The Company had no borrowings outstanding under the revolving credit facility at September 30, 2015 and had not been using it as a source of liquidity in the recent past.The Company is also party to an accounts receivable securitization program under which eligible trade receivables are sold, without recourse, to a multi-seller, asset-backed commercial paper conduit. The entity through which these receivables are sold is consolidated into the Company’s financial statements. The Company may borrow and draw letters of credit against the facility, and pays facility fees, program fees and letter of credit fees (based on amounts of outstanding letters of credit). The total aggregate borrowings and letters of credit are limited by eligible accounts receivable, as definedbe incurred under the terms of the New Term Loan Debt Facility) and (ii) non-ordinary course asset sales or dispositions, subject to customary thresholds, exceptions and reinvestment rights.F- 37 agreement. in an aggregate principal amount of $40 million (the “New Inventory Facility”) with Regions Bank (“Regions”) as administrative agent and collateral agent (in such capacities, the “Agent”), as lender and swingline lender (in such capacities, the “ Lender ”) and as letter of credit issuer. Availability under the New Inventory Facility is subject to a borrowing base consisting of (i) 85% of the net orderly liquidation value of eligible coal inventory, (ii) the lesser of (x) 85% of the net orderly liquidation value of eligible parts and supplies inventory and (y) 35% of the amount determined pursuant to clause (i), and (iii) 100% of Arch Coal’s Eligible Cash (defined in the New Inventory Facility), subject to reduction for reserves imposed by Regions.F- 38 credit agreement expirescommitments under the New Inventory Facility will terminate on December 8, 2017.At December 31, 2015, the Company had no available borrowing capacity under its linesdate that is the earliest to occur of credit.Term LoanOn May 16, 2012,(i) the Company borrowed $1.4 billion underthird anniversary of the Inventory Facility Closing Date, (ii) the date, if any, that is 364 days following the first day that Liquidity (defined in the New Inventory Facility and consistent with the definition in the Extended Securitization Facility (as defined below)) is less than $250 million for a secured termperiod of 60 consecutive days and (iii) the date, if any, that is 60 days following the maturity, termination or repayment in full of the Extended Securitization Facility. facility, issued at a 1% discount. The proceeds from the term loan were used to retire all outstanding borrowings under the revolvingNew Inventory Facility bear interest at a per annum rate equal to, at the option of the Company, either at the base rate or the London interbank offered rate plus, in each case, a margin ranging from 2.25% to 2.50% (in the case of LIBOR loans) and 1.25% to 1.50% (in the case of base rate loans) determined using a Liquidity-based grid. Letters of credit under the New Inventory Facility are subject to a fee in an amount equal to the applicable margin for LIBOR loans, plus customary fronting and issuance fees.outstanding $450.0 million principal amount of 6.75% Senior Notes due 2013 issued by Arch Western Finance, LLC, the Company’s indirect subsidiary. On November 21, 2012, the Company borrowed an incremental $250.0 millionineffective portion reported in earnings. As interest payments are made on the term loan, facility atamounts in accumulated other comprehensive income will be reclassified into earnings through interest expense to reflect a 1% discount atnet interest on the same rate asterm loan equal to the initial borrowing. On December 17, 2013 the credit facility amendment increased the maximum amount of term loans allowed under the facility, and the Company borrowed an incremental $300.0 million aggregate principal amount at 98%effective yield of the face amount.Thefixed rate of the swap plus 3.25% which is the spread on the revised LIBOR term loan contains no financial maintenance covenants,loan. In the event that an interest rate swap is prepayable,terminated prior to maturity, gains or losses in accumulated other comprehensive income will remain deferred and reclassified into earnings in the periods which the hedged forecasted transaction affects earnings.F- 39 secured by substantially alla summary of the Company’s assets. Quarterly principal paymentsoutstanding interest rate swap agreements designated as hedges as of $3.5 million began in September 2012, increased to $4.125 million per quarter as a resultNotional Amount (in millions) Effective Date Fixed Rate Receive Rate Expiration Date $250.0 June 30, 2017 1.372% 1-month LIBOR June 29, 2018 $250.0 June 29, 2018 1.662% 1-month LIBOR June 28, 2019 $200.0 June 28, 2019 1.952% 1-month LIBOR June 30, 2020 $150.0 June 30, 2020 2.182% 1-month LIBOR June 30, 2021 incremental borrowing in November, 2012, and increased further to $4.875interest rate swaps at December 31, 2017 is an asset of $1.8 million which is recorded within Other noncurrent assets with the offset to accumulated other comprehensive income on the Company’s Consolidated Balance Sheet. The Company realized $0.1 million of losses during the year ended December 17, 2013 borrowing. A balloon payment of $1.8 billion is due in May, 2018. Interest is payable at a rate that is equal31, 2017 related to a basesettlements of the greater of a LIBOR-basedinterest rate and 1.25%, plus 500 basis points.2019 9.875% NotesOn November 21, 2012, the Company issued $375.0 million aggregate principal amount of 9.875% senior unsecured notes due 2019 (the “2019 9.875% Notes”) at an issue price of 95.934% of the face amount. Interest is payableswaps which was recorded to interest expense on the 2019 9.875% Notes annually on June 15 and December 15.Company’s Consolidated Statement of Operations. The Company may redeem some or all ofinterest rate swaps are classified as level 2 within the notes at prices that are reflected as a percentage of the principal amount, as follows: 104.938% commencing December 15, 2016; 102.469% commencing December 15, 2017; and 100% on or after December 15, 2018.The unsecured senior notes are guaranteed by substantially all of the Company’s subsidiaries, except for Arch Receivable Company, LLC, which is the conduit for the accounts receivable securitization program, and the Company’s subsidiaries outside the U.S.2019 Secured NotesOn December 17, 2013, the Company issued $350.0 million aggregate principal amount of 8.00% senior secured second lien notes due 2019 (the “2019 Secured Notes”) at par. The 2019 Secured Notes are secured by the same assets that secure indebtedness under the senior secured term loan, but on a second priority basis, subject to certain exceptions and permitted liens. Interest is payable on the 2019 Secured Notes on January 15 and July 15 of each year. The Company may redeem some or all of the notes at prices that are reflected as a percentage of the principal amount, as follows: 104.0% commencing January 15, 2016, 102.0% commencing January 15, 2017, and 100% on or after January 15, 2018.2020 NotesThe Company has outstanding $500.0 million in aggregate principal amount of 7.25% senior unsecured notes due in 2020 (“2020 Notes”) at par. Interest is payable on the 2020 Notes on April 1 and October 1 of each year. The Company may redeem some or all of the 2020 Notes during the respective 12 month periods at prices that are reflected as a percentage of the principal amount, as follows: 103.625% commencing October 1, 2015; 102.417% commencing October 1, 2016; 101.208% commencing October 1, 2017; and 100% on or after October 1, 2018.2019 7% Notes and 2021 NotesThe Company has outstanding $1.0 billion of 7.00% unsecured senior notes due 2019 (“2019 7% Notes”) and $1.0 billion of 7.25% unsecured senior notes due 2021 (“2021 Notes”). Interest is payable on the 2019 7% Notes and 2021 Notes on June 15 and December 15 of each year. The Company may redeem some or all of the 2019 7% Notes at prices that are reflected as a percentage of the principal amount, as follows: 103.5% commencing June 15, 2015; 101.75% commencing June 15, 2016; and 100% on or after June 15, 2017. The Company may redeem some or all of the 2021 Notes at prices that are reflected as a percentage of the principal amount, as follows: 103.625% commencing June 15, 2016; 102.417% commencing June 15, 2017; 101.208% commencing June 15, 2018 and 100% on or after June 15, 2019. In each case, accrued and unpaid interest at the redemption date is due upon redemption.Other Debt RetirementsOn December 17, 2013, the Company retired the outstanding $600 million in aggregate principal amount of 8.75% senior unsecured notes due 2016 (“2016 Notes”) for $628.7 million with the proceeds from the incremental term loan and the 2019 Secured Notes. The Company recorded a $41.0 million loss related to this transaction which is reflected in the line “Net loss resulting from early retirement of debt and debt restructuring” in the Consolidated Statements of Operations.20152017 are as follows, although $5.1 billion is classified as current due to the default caused by the Company’s bankruptcy filing.Debt CovenantsTerms of the Company’s credit facilities and leases contain covenants that limit the ability of the Company to, among other things, acquire, dispose, merge or consolidate assets; incur additional debt; pay dividends and make distributions or repurchase stock; make investments; create liens; issue and sell capital stock of subsidiaries; enter into restrictions affecting the ability of restricted subsidiaries to make distributions, loans or advances to the Company; engage in transactions with affiliates and enter into sale and leaseback transactions. Failure by the Company to comply with such covenants could result in an event of default, which, if not cured or waived, could have a material adverse effect on the Company.Year (In thousands) 2018 $ 16,809 2019 11,119 2020 11,442 2021 8,853 2022 3,130 Thereafter 282,911 $ 334,264 did not incur any financing costs in 2015 and paid financing costs of $4.5$10.1 million during the year ended December 31, 2017; zero during the period October 2 through December 31, 2016; $23.0 million during the period January 1 through October 1, 2016; and $20.5 millionzero during the year ended December 31, 2015, respectively, in conjunction with its financing activities.yearsperiod ended December 31, 20142017 and 2013,January 1 through October 1, 2016, respectively.Additionally, the company incurred $24.2 million of legal fees and financial advisory fees associated with debt restructuring activities in 2015. All amounts have been reflected in the line, “Net loss resulting from early retirement and refinancing of debt” in the Consolidated Statement of Operations.F- 40 20152017 remain open to examination for U.S. federal income tax matters and 19982002 through 20152017 remain open to examination for various state income tax matters. Successor Predecessor Year Ended December 31, 2017 October 2 through December 31, 2016 January 1 through October 1, 2016 Year Ended December 31, 2015 (In thousands) Current: Federal $ 835 $ — $ — $ — State 31 (252 ) 7 3 Total current 866 (252 ) 7 3 Deferred: Federal (36,162 ) 1,352 (4,720 ) (329,393 ) State 41 56 87 (43,990 ) Total deferred (36,121 ) 1,408 (4,633 ) (373,383 ) $ (35,255 ) $ 1,156 $ (4,626 ) $ (373,380 ) F- 41 In 2015, 2014 and 2013, compensatory stock options and other equity based compensation awards were exercised resulting in a tax expense of $6.7 million, $1.6 million and $1.5 million, respectively. The tax benefit will be recorded in paid-in capital at such point in time when a cash tax benefit is recognized. Successor Predecessor Year Ended December 31, 2017 October 2 through December 31, 2016 January 1 through October 1, 2016 Year Ended December 31, 2015 (In thousands) Income tax provision (benefit) at statutory rate $ 71,118 $ 12,112 $ 433,109 $ (1,150,283 ) Percentage depletion allowance (31,255 ) (4,292 ) (3,681 ) (19,035 ) State taxes, net of effect of federal taxes 7,002 633 (46,122 ) (76,445 ) Reversal of cancellation of indebtedness income — — (1,493,162 ) — Worthless stock deduction — — (80,077 ) — Change in valuation allowance (410,983 ) (7,655 ) 1,185,326 865,146 Impact of Tax Cuts and Jobs Act of 2017 332,345 — — — Other, net (3,482 ) 358 (19 ) 7,237 $ (35,255 ) $ 1,156 $ (4,626 ) $ (373,380 ) December 31, 2017 December 31, 2016 (In thousands) Deferred tax assets: Tax loss carryforwards $ 271,405 $ 376,293 Tax credit carryforwards 29,736 22,798 Investment in tax partnerships & corporations 308,653 604,914 Other 28,321 39,251 Gross deferred tax assets 638,115 1,043,256 Valuation allowance (610,571 ) (1,021,553 ) Total deferred tax assets 27,544 21,703 Deferred tax liabilities: Plant and equipment 3,674 7,332 Other 1,351 14,258 Total deferred tax liabilities 5,025 21,590 Net deferred tax asset 22,519 113 F- 42 $3.0 billion$980.2 million at December 31, 20152017 that will expire between 2022 and 2035.2037. The Company has an alternative minimum tax credit carryforward of $121.0$23.9 million at December 31, 2015,2017, which has no expiration date and can be used to offset future regular tax in excess of the alternative minimum tax.recorded increaseshas consolidated its mining operations and land management into a partnership structure to match its legal form with the Company’s streamlined operations during 2016. As such, deferred taxes related to those operations are now reported based upon the book and tax outside basis difference in its valuation allowance against its deferred tax assetsthe partnership interests as provided in ASC 740-30-25-7, which results in a different basis of $865.1 million, $226.9 million and $8.7 millionpresentation than used in 2015 2014 and 2013, respectively. In 2015 and 2014,under the Company determined that it would not realize the all of the benefit fromCompany’s prior legal structure.projections of reversing timing differencesthe rates at which they are expected to reverse in the future. Adjustments in 2013 relatefuture was $330.9 million of income tax expense, with an offsetting valuation allowance adjustment. Finalization of the remeasurement of deferred taxes will occur upon finalization of 2017 taxable income and attribute carryback claims.certain state andthe mandatory deemed repatriation of foreign earnings was $1.5 million based on cumulative foreign earnings of $4.2 million. The deemed repatriation tax is completely offset with net operating loss benefits.carryforwards, with an offsetting valuation allowance adjustment and will not result in a cash tax liability. Finalization of 2017 earnings and profits calculations and receipt of further guidance in the form of Notices or Regulations may change the provisional calculation.
Elimination of the corporate AMT regime: Existing AMT credits as of December 31, 2017 will be refunded over the next four years. The refund may be subject to a sequestration reduction rate of approximately 6.6%. The Company has provisionally determined that it will receive a refund of existing AMT credits of approximately $22.4 million after an estimated sequestration reduction of $1.5 million. The valuation allowance previously recorded against these credits has been released and a tax benefit of $22.4 million was recorded. The Company’s accounting policy regarding the balance sheet presentation of the AMT credits is to record the balance as a deferred tax asset until a return is filed claiming a refund of a portion of the credit, at which time the amount will be presented as a tax receivable.F- 43 (In thousands) Balance at January 1, 2015 $ 34,709 Additions based on tax positions related to the current year 4,168 Balance at December 31, 2015 38,877 Additions based on tax positions related to the current year 2,979 Additions for tax positions of prior years 2,709 Reductions as a result of lapses in the statute of limitations (37,110 ) Balance at December 31, 2016 7,455 Additions for tax positions of prior years — Additions for tax positions related to the current year 3,928 Reductions as a result of bankruptcy — Balance at December 31, 2017 $ 11,383 20152017 would affect the effective tax rate.$1.7$0.6 million and $1.5$0.5 million at December 31, 20152017 and 2014,2016, respectively. In the next 12 months, no$3.3 million gross unrecognized tax benefits are expected to be reduced due to the expiration of the statute of limitations.F- 44 and reclaiming refuse areas and slurry ponds. Successor Predecessor Year Ended December 31, 2017 October 2 through December 31, 2016 January 1 through October 1, 2016 (In thousands) Balance at beginning of period (including current portion) $ 356,742 $ 354,326 $ 410,454 Accretion expense 30,209 7,634 24,321 Obligations of divested operations (12,569 ) — (14,702 ) Adjustments to the liability from changes in estimates (23,215 ) — 3,003 Liabilities settled (22,472 ) (5,218 ) (11,087 ) Fresh start accounting adjustment — — (57,663 ) Balance at period end $ 328,695 $ 356,742 $ 354,326 Current portion included in accrued expenses (19,840 ) (19,515 ) (17,290 ) Noncurrent liability $ 308,855 $ 337,227 $ 337,036 2015,2017, the Company had $155.3$531.7 million in surety bonds outstanding $485.5 million in self-bonding, and $11.2$7.4 million in letters of credit to secure reclamation bonding obligations.F-34 Additionally, the Company has posted $2.6 million in cash as collateral related to reclamation surety bonds; this amount is recorded within “Noncurrent assets” on the Consolidated Balance Sheet.F- 45 and coal commodity contracts and interest rate swaps with fair values derived from quoted prices in over-the-counter markets or from prices received from direct broker quotes.20152017 and 2014. Fair Value at December 31, 2017 Total Level 1 Level 2 Level 3 (In thousands) Assets: Investments in marketable securities $ 155,846 $ 64,100 $ 91,746 $ — Derivatives 7,339 — 1,985 5,354 Total assets $ 163,185 $ 64,100 $ 93,731 $ 5,354 Liabilities: Derivatives $ 7,217 $ 7,263 $ 26 $ (72 ) Fair Value at December 31, 2016 Total Level 1 Level 2 Level 3 (In thousands) Assets: Investments in marketable securities $ 90,209 $ 2,137 $ 88,072 $ — Derivatives 4,908 262 — 4,646 Total assets $ 95,117 $ 2,399 $ 88,072 $ 4,646 Liabilities: Derivatives $ 101 $ (8 ) $ — $ 109 F- 46 Successor Predecessor Year Ended December 31, 2017 October 2 through December 31, 2016 January 1 through October 1, 2016 (In thousands) Balance, beginning of period $ 4,537 $ 3,842 $ 2,432 Realized and unrealized (gains) losses recognized in earnings, net (2,305 ) 926 (1,686 ) Included in other comprehensive income — — — Purchases 4,910 1,225 5,021 Issuances (535 ) (34 ) (488 ) Settlements (1,181 ) (1,422 ) (1,437 ) Ending balance $ 5,426 $ 4,537 $ 3,842 Table of Contentslossesgains of $2.7$2.3 million were recognized during the year ended December 31, 20152017 related to level 3 financial instruments held on December 31, 2015.20152017 and 2014,2016, the carrying amounts of cash and cash equivalents approximate their fair value.20152017 and 2014,2016, the fair value of the Company’s debt, including amounts classified as current, was $937.1$336.1 million and $2.7 billion,$362.9 million, respectively. Fair values are based upon observed prices in an active market, when available, or from valuation models using market information, which fall into Level 2 in the fair value hierarchy.Stock2017: Dividends per share Amount (in thousands) 1st quarter $ — $ — 2nd quarter 0.35 8,563 3rd quarter 0.35 8,200 4th quarter 0.35 7,606 Total cash dividends declared and paid $ 1.05 $ 24,369 F- 47 PlanThe Company’sProgramallows for the purchase of up to 1,400,000$300 million of its common stock. In October 2017, the Company’s Board of Directors approved an incremental $200 million increase to the share repurchase program bringing the total authorization to $500 million. Below is a table showing the share repurchase activity in 2017:2017: Number of Shares Average Repurchase Price per Share Amount (in thousands) 1st quarter — $ — $ — 2nd quarter 710,701 $ 71.82 51,043 3rd quarter 2,208,133 $ 75.49 166,685 4th quarter 1,058,381 $ 79.73 84,381 Total shares repurchased 3,977,215 $ 75.96 $ 302,109 common stock. Atstock price and other market conditions.2015, 1,092,5802017.of common stock were available for repurchase under the plan. There is no expiration date on the program. Any future repurchases under the plan willcan be made at management’s discretion and will depend on market conditions and other factors.Reverse Stock SplitOn August 4, 2015,settled in unregistered shares, the Company effected a 1-for-10 reversehas adequate authorized shares to settle the outstanding warrants and each warrant is fixed in terms of settlement to one share of Company stock splitsubject only to remote contingency adjustment factors designed to assure the relative value in terms of our common stock. Each stockholder’s percentage ownership and proportional voting power remain unchanged as a result of the reverse stock split. All applicable share data, per share amounts and related information in the Consolidated Financial Statements and notes thereto have been adjusted retroactively to give effect to the 1-for-10 reverse stock split.Stock2016 Omnibus Incentive Plan (the “Incentive Plan”), 3.13.0 million shares of the Company’s common stock were reserved for awards to officers and other selected key management employees of the Company. The Incentive Plan provides the Board of Directors with the flexibility to grant stock options, stock appreciation rights, restricted stock awards, restricted stock units, performance stock or units, merit awards, phantom stock awards and rights to acquire stock through purchase under a stock purchase program (“Awards”). Awards the Board of Directors elects to pay out in cash do not impact the shares authorized in the Incentive Plan. Shares available for award under the plan were 1.02.4 million at December 31, 2015.Stock OptionsStock options are granted at a strike price equal to the closing market price of the Company’s common stock on the date of grant and are generally subject to vesting provisions of at least one year from the date of grant. Information regarding stock option activity under the Incentive Plan follows for the year ended December 31, 2015:The remaining unvested options have a weighted average grant date fair value of $35.47 per share.The total grant-date fair value of options vested during the years ended December 31, 2015, 2014 and 2013 was $3.8 million, $8.7 million and $8.9 million, respectively. The options provide for the continuation of vesting for retirement-eligible recipients that meet certain criteria. The expense for these options is recognized through the date that the employee first becomes eligible to retire and is no longer required to provide service to earn part or all of the award. Compensation expense related to stock options for the years ended December 31, 2015, 2014 and 2013 was $1.4 million, $3.2 million and $6.7 million, respectively. Unrecognized compensation cost related to the unvested stock options of $0.2 million at December 31, 2015 will be recognized in 2016.The majority of the cost relating to the stock-based compensation plans is included in “Selling, general and administrative expenses” in the accompanying consolidated statements of operations.Weighted average assumptions used in the Black-Scholes option pricing model for granted options follow:
December 31,Expected volatilities are based on historical stock price movement and implied volatility from traded options on the Company’s stock. The expected life of options is determined based on historical exercise activity.Restricted Stock and Restricted Stock Unit Awardsthree years.the award’s stated vesting period. Compensation expense is based on the fair value on the grant date and is recorded ratably over the vesting period.period utilizing the straight-line recognition method. The employee receives cash compensation equal to the amount of dividends that would have been paid on the underlying shares.and restricted stock unitunits activity and weighted average grant-date fair value followsfollows:F- 48 Time Based Awards Performance Based Awards Restricted Stock Units Weighted Average Grant-Date Fair Value Restricted Stock Units Weighted Average Grant-Date Fair Value (Shares in thousands) Outstanding at January 1, 2017 159 $ 78.60 225 $ 67.34 Granted 92 81.91 86 101.38 Forfeited/Canceled (2 ) 78.60 — — Vested (9 ) 78.60 — — Unvested outstanding at December 31, 2017 240 $ 79.87 311 $ 76.75 2015:
Average
AverageThe Company’s recognized expense related to restricted stock2017 and restricted stock units was $5.9 million, $5.6 million, and $5.0$1.0 million for the years endedperiod October 2, 2016 through December 31, 2015, 2014 and 2013, respectively$7.9 million, $10.1 million and $9.1expense of $0.7 million for the yearsyear ended December 31, 2015, 20142017, $1.6 million for the period October 2 through December 31, 2016, $7.2 million for the period January 1 through October 1, 2016 and 2013,$7.9 million for the year ended December 31, 2015, respectively. The expense is included primarily in “Selling, general and administrative expenses” in the accompanying consolidated statements of operations.$17.8$8.7 million and $21.1$13.9 million as of December 31, 20152017 and 2014,2016, respectively.F- 49 Deferred20. Workers’ Compensation PlanExpensemaintains a deferred compensation plan that allowsis liable under the Federal Mine Safety and Health Act of 1969, as subsequently amended, to provide for pneumoconiosis (occupational disease) benefits to eligible employees, to defer receipt of compensation until the dates elected by the participant. Participants in the plan may defer up to 85% of their base salariesformer employees and up to 100% of their annual incentive awards. The plan also allows participants to defer receipt of up to 100% of the shares under any restricted stock unit or performance-contingent stock awards. The amounts deferred are invested in accounts that mirror the gains and losses of a number of different investment funds, including a hypothetical investment in shares of the Company’s common stock. Participants are always vested in their deferrals to the plan and any related earnings.dependents. The Company has establishedcurrently provides for federal claims principally through a grantor trust to fundself-insurance program. The Company is also liable under various state workers’ compensation statutes for occupational disease benefits. The occupational disease benefit obligation represents the obligations under the plan. The trust has purchased corporate-owned life insurance to offset these obligations. The net cash surrender values of the policies of $14.3 million and $37.6 million at December 31, 2015 and 2014, respectively, are included in “Other noncurrent assets” in the accompanying consolidated balance sheets. The participants have an unsecured contractual commitment by the Company to pay the amounts due under the plan. Any assets placed in trust by the Company to fund future obligations of the plan are subject to the claims of creditors in the event of insolvency or bankruptcy, and participants are general creditors of the company as to their deferred compensation in the plans.Under the plan, the Company credits each participant’s account with the number of units equal to the number of shares or units that the participant could purchase or receive with the amount of compensation deferred, based upon the fair marketpresent value of the underlying investment on that date. The amountof the employee will receive fromactuarially computed present and future liabilities for such benefits over the plan will beemployees’ applicable years of service. Successor Predecessor Year Ended December 31, 2017 October 2 through December 31, 2016 January 1 through October 1, 2016 Year Ended December 31, 2015 (In thousands) Self-insured occupational disease benefits: Service cost $ 6,320 $ 1,583 $ 3,465 $ 4,282 Interest cost 4,651 1,126 3,184 3,944 Net amortization — — 4,325 6,973 Total occupational disease $ 10,971 $ 2,709 $ 10,974 $ 15,199 Traumatic injury claims and assessments 3,208 3,162 6,628 16,781 Total workers’ compensation expense $ 14,179 $ 5,871 $ 17,602 $ 31,980 Successor Predecessor (In thousands) Year Ended December 31, 2017 October 2 through December 31, 2016 January 1 through October 1, 2016 Beginning of period $ 111,159 $ 119,710 $ 90,836 Service cost 6,320 1,583 3,465 Interest cost 4,651 1,126 3,184 Curtailments (5,433 ) — 4,156 Actuarial (gain) loss 12,242 (9,675 ) — Benefit and administrative payments (6,513 ) (1,585 ) (3,728 ) Fresh start accounting adjustment — — 21,797 $ 122,426 $ 111,159 $ 119,710 F- 50 units credited to each participant’s account, valued on the basis of the fair market value of an equivalent number of shares or units of the underlying investment on that date. The liability under the plan was $19.5 million and $35.1 million at December 31, 2015 and 2014.The Company’s net income related to the deferred compensation plan for the years ended December 31, 2015, 2014 and 2013 was $0.9 million, $1.6 million and $2.6 million, respectively, most of which is included in “Selling, general and administrative expenses” in the accompanying consolidated statements of operations.20. Workers’ Compensation Expensedetailsprovides the components of workers’ compensation expense: Successor Predecessor Year Ended December 31, 2017 October 2 through December 31, 2016 January 1 through October 1, 2016 (Percentages) Occupational Disease Benefit Discount rate 3.66 4.31 3.80 Cost escalation rate N/A N/A N/A Year Ended December 31, 2017 Year Ended December 31, 2016 (In thousands) Occupational disease costs $ 122,426 $ 111,159 Traumatic and other workers’ compensation claims 81,191 88,593 Total obligations 203,617 199,752 Less amount included in accrued expenses 18,782 15,184 Noncurrent obligations $ 184,835 $ 184,568 2015,2017, the Company had $148.2$123.0 million in surety bonds and letters of credit outstanding to secure workers’ compensation obligations.2121. . Employee Benefit Planssalaried employee postretirement benefit plans are contributory, with retiree contributions adjusted annually,Company offers a subsidy to eligible retirees based on age and years of service at retirement and contain other cost-sharing features such as deductibles and coinsurance. The Company’s current funding policy is to fund the cost of all postretirement benefits as they are paid.The idling of the Cumberland River mining operations in Appalachia in the third quarter of 2014 reduced the estimated years of future service for the CRCC Scotia Employee Association Pension Plan. These two events triggered curtailment accounting, resulting in an immediate recognitionF- 51 Pension Benefits Other Postretirement Benefits Successor Predecessor Successor Predecessor Year Ended December 31, 2017 October 2 through December 31, 2016 January 1 through October 1, 2016 Year Ended December 31, 2017 October 2 through December 31, 2016 January 1 through October 1, 2016 (In thousands) CHANGE IN BENEFIT OBLIGATIONS Benefit obligations at beginning of period $ 313,629 $ 341,427 $ 301,292 $ 111,867 $ 120,311 $ 103,460 Service cost — — — 671 180 393 Interest cost 11,169 2,768 9,338 4,150 978 3,223 Divestitures (see Note 5 to the Consolidated Financial Statements) (29,097 ) — — — — — Settlements (1,532 ) (135 ) — — — — Curtailments — — 454 (520 ) — 714 Benefits paid (38,197 ) (11,009 ) (8,699 ) (8,152 ) (1,962 ) (8,273 ) Other-primarily actuarial (gain) loss 14,126 (19,422 ) — 2,503 (7,640 ) — Fresh start accounting adjustments — — 39,042 — — $ 20,794 Benefit obligations at end of period $ 270,098 $ 313,629 $ 341,427 $ 110,519 $ 111,867 $ 120,311 CHANGE IN PLAN ASSETS Value of plan assets at beginning of period $ 274,225 $ 292,726 $ 273,499 $ — $ — $ — Actual return on plan assets 39,689 (7,899 ) 27,811 — — Employer contributions 429 407 115 8,152 1,962 8,273 Benefits paid (38,197 ) (11,009 ) (8,699 ) (8,152 ) (1,962 ) (8,273 ) Divestitures $ (20,504 ) $ — $ — $ — $ — $ — Value of plan assets at end of period $ 255,642 $ 274,225 $ 292,726 $ — $ — $ — Accrued benefit cost $ (14,456 ) $ (39,404 ) $ (48,701 ) $ (110,519 ) $ (111,867 ) $ (120,311 ) ITEMS NOT YET RECOGNIZED AS A COMPONENT OF NET PERIODIC BENEFIT COST Prior service credit (cost) $ — $ — $ — $ — $ — $ — Accumulated gain 16,178 6,751 — 5,137 7,640 — $ 16,178 $ 6,751 $ — $ 5,137 $ 7,640 $ — BALANCE SHEET AMOUNTS Current liability $ (420 ) $ (520 ) $ (420 ) $ (8,150 ) $ (10,422 ) $ (8,352 ) Noncurrent liability (14,036 ) (38,884 ) (48,281 ) (102,369 ) (101,445 ) (111,959 ) $ (14,456 ) $ (39,404 ) $ (48,701 ) $ (110,519 ) $ (111,867 ) $ (120,311 ) $301.3$270.1 million and $353.7$313.6 million at December 31, 20152017 and 2014,2016, respectively.Netloss of $3.0 milliongains (losses) during fresh start accounting, it is anticipated there will be amortized from accumulated other comprehensive incomeno amortization recorded into net periodic benefit cost in 2016.during 2018.gain of $10.7 million and $2.3 million, respectively,gains (losses) during fresh start accounting, it is anticipated there will be amortized from accumulated other comprehensive incomeno amortization recorded into net periodic benefit cost in 2016.during 2018.F- 52 Pension Benefits Other Postretirement Benefits Successor Predecessor Successor Predecessor Year Ended December 31, 2017 October 2 through December 31, 2016 January 1 through October 1, 2016 Year Ended December 31, 2015 Year Ended December 31, 2017 October 2 through December 31, 2016 January 1 through October 1, 2016 Year Ended December 31, 2015 (In thousands) Service cost $ — $ — $ — $ 9 $ 671 $ 180 $ 393 $ 866 Interest cost 11,169 2,768 9,338 14,604 4,150 978 3,223 1,904 Curtailments — — 454 — (520 ) — (970 ) — Settlements (1,532 ) (135 ) — 2,656 — — — — Expected return on plan assets (16,498 ) (4,770 ) (13,623 ) (20,367 ) — — — — Amortization of prior service credits — — — — — — (7,854 ) (8,335 ) Amortization of other actuarial losses (gains) — — 3,973 8,850 — — (849 ) (2,109 ) Net benefit cost (credit) $ (6,861 ) $ (2,137 ) $ 142 $ 5,752 $ 4,301 $ 1,158 $ (6,057 ) $ (7,674 ) a five-year period.at December 31 offor the respective years. Successor Predecessor Year Ended December 31, 2017 October 2 through December 31, 2016 January 1 through October 1, 2016 (Percentages) Pension Benefits Discount rate 3.49/3.27 3.95 3.39 Rate of compensation increase N/A N/A N/A Other Postretirement Benefits Discount rate 3.49 3.93 3.37 Rate of compensation increase N/A N/A N/A F- 53 years ended December 31. Successor Predecessor Year Ended December 31, 2017 October 2 through December 31, 2016 January 1 through October 1, 2016 Year Ended December 31, 2015 (Percentages) Pension Benefits Discount rate 3.77 3.39/3.95 4.59/3.80 4.15/4.61/4.41/4.60 Rate of compensation increase N/A N/A N/A N/A Expected return on plan assets 6.20 6.85 6.85 7.00 Other Postretirement Benefits Discount rate 3.85 3.37 4.57/3.80 3.91 Rate of compensation increase N/A N/A N/A N/A Expected return on plan assets N/A N/A N/A N/A 20142017, 2016 and 20132015 were reevaluated during the year for settlements and the curtailments as described previously.curtailments. The obligations are remeasured at an updated discount rate that impacts the benefit cost recognized subsequent to the remeasurement.“Pension “Pension Committee”). The risk assessment provides a link between a pension plan’s risk capacity, management’s willingness to accept investment risk and the asset allocation process, which ultimately leads to the return generated by the invested assets.20162018 is 7.1%6.2% and is expected to reach an ultimate trend rate of 4.5% by 2028.2038. A one-percentage-point increase in the health care cost trend rate would increase the postretirement benefit obligation at December 31, 20152017 by $9.4$11.6 million and the net periodic postretirement benefit cost for the year ended December 31, 20152017 by $0.1$0.4 million.60%39% equity and 40%61% fixed income securities. The Pension Committee reviews the actual asset allocation in light of these targets on a periodic basis and rebalances among investments as necessary. The Pension Committee evaluates the performance of investment managers as compared to the performance of specified benchmarks and peers and monitors the investment managers to ensure adherence to their stated investment style and to the plan’s investment guidelines.F- 54 20152017 and 2014,2016, respectively, are categorized below according to the fair value hierarchy as defined in Note 17, “Fair Value Measurements”: Total Level 1 Level 2 Level 3 2017 2016 2017 2016 2017 2016 2017 2016 (In thousands) U.S. small-cap $ 5,064 $ 13,520 $ 5,064 $ 13,520 $ — $ — $ — $ — U.S. mid-cap 22,640 29,687 6,017 9,422 16,623 20,265 — — U.S. large-cap 43,232 70,226 21,416 34,107 21,816 36,119 — — Non-U.S. 10,115 18,937 — — 10,115 18,937 — — Fixed income securities: — 66,922 26,519 60,286 19,973 6,636 6,546 — — 4,050 1,567 — — 4,050 1,567 — — 2,440 1,074 — — 2,440 1,074 — — 54,679 58,191 — — 54,679 58,191 — — 3,829 6,406 — — 3,829 6,406 — — 27,057 26,151 — — 8,457 6,910 18,600 19,241 Total $ 240,028 $ 252,278 $ 92,783 $ 77,022 $ 128,645 $ 156,015 $ 18,600 $ 19,241 16,646 35,519 8,573 8,598 (9,605 ) (22,170 ) $ 255,642 $ 274,225 F- 55 includesinclude cash, forward contracts, derivative instruments, credit default swaps, interest rate swaps and mutual funds. Investments in interest rate swaps are valued utilizing a market approach that includes various valuation techniques and sources such as value generation models, broker quotes in active and non-active markets, benchmark yields and securities, reported trades, issuer trades and/or other applicable data. Forward contracts and derivative instruments are valued at their exchange listed price or broker quote in an active market. The mutual funds are valued at the net asset value per share multiplied by the number of shares held as of the measurement date and are traded on listed exchanges.During 2013, the plan invested $16.0 million in Level 3 investments. Subsequent changes in fair value are the result of unrealized gains on the investment.$0.5$0.4 million to the pension plans in 2016,2018, which is impacted by theMoving Ahead for Progress in the 21st Century Act (MAP-21). MAP-21 does not reduce the Company’s obligations under the plan, but redistributes the timing of required payments by providing near term funding relief for sponsors under the Pension Protection Act. Other Pension Postretirement Benefits Benefits (In thousands) 2018 $ 17,614 $ 12,381 2019 17,834 12,549 2020 18,174 12,990 2021 18,635 13,239 2022 19,235 13,423 Next 5 years 83,071 62,854 $ 174,563 $ 127,436 $20.5 million, $22.9 million and $25.1$18.0 million for the yearsyear ended December 31, 2015, 20142017; $3.5 million for the period October 2 through December 31, 2016; $13.8 million for the period January 1 through October 1, 2016; and 2013, respectively.22. Loss Per Common Share$20.5 millionThe effect of options, restricted stock and restricted stock units that were excluded from the calculation of diluted weighted average shares outstanding because the exercise price or grant price of the securities exceeded the average market price of the Company’s common stock were: 1.0 million shares of common stock for the year ended December 31, 2015, and 0.8 million sharesrespectively.stock for each ofshares outstanding during the years ending December 31, 2014 and December 31, 2013. Theperiod. Diluted net income per share is computed using the weighted average share impactsnumber of options, restricted stockcommon shares and the effect of potentially dilutive securities outstanding during the period. Potentially dilutive securities may consist of warrants, restricted stock units that were excluded fromor other contingently issuable shares. The dilutive effect of outstanding warrants, restricted stock units and other contingently issuable shares is reflected in diluted earnings per share by application of the calculationtreasury stock method.weighted average shares due to the Company’s incurring a net loss for the three years ending December 31, 2015, 2014 and 2013 were not significant. Successor Predecessor Year Ended December 31, 2017 October 2 through December 31, 2016 January 1 through October 1, 2016 Year Ended December 31, 2015 (In Thousands) Weighted average shares outstanding: Basic weighted average shares outstanding 23,725 25,002 21,293 21,285 Effect of dilutive securities 515 467 20 — Diluted weighted average shares outstanding 24,240 25,469 21,313 21,285 F- 56 2323. . Leases20152017 are as follows:Obligations Operating Leases Royalties (In thousands) 2018 $ 5,936 $ 3,582 2019 4,655 5,926 2020 2,260 6,953 2021 1,985 7,216 2022 2,024 7,003 Thereafter 8,292 34,371 $ 25,152 $ 65,051 the future minimum payments under capital leases for equipment totaling $40.0 million and $46.0. million at December 31, 20152017 and 2014, respectively, are included in other long term debt obligations in Note 14, “Debt and Financing Arrangements”.2015, $42.1 million in 2014 and $42.1 million in 2013.2015, $242.5 million in 2014 and $261.1 million in 2013.2015,2017, certain of the Company’s lease obligations were secured by outstanding surety bonds totaling $49.4$31.2 million.F-4520152017 and 2014,2016, accounts receivable from electric utilities of $83.8$72.9 million and $134.7$96.0 million, respectively, represented 72%42% and 64%52% of total trade receivables at each date. As of December 31, 20152017 and 2014,2016, accounts receivable from sales of metallurgical-quality coal of $32.8$99.4 million and $76.0$88.0 million, respectively, represented 28%58% and 36%48% of total trade receivables at each date.F- 57 Successor Predecessor Year Ended December 31, 2017 October 2 through December 31, 2016 January 1 through October 1, 2016 Year Ended December 31, 2015 (In thousands) Europe $ 388,926 $ 61,408 $ 113,888 $ 170,314 Asia 264,503 55,634 68,536 96,523 North America 88,145 43,831 56,594 40,315 Central and South America 30,982 13,224 41,861 55,323 Africa 14,901 — — — Brokered Sales 6,137 — — 32,848 Total $ 793,594 $ 174,097 $ 280,879 $ 395,323 customer.customer based on their requirements. The Company sold approximately 127.698.2 million tons of coal in 2015.2017. Approximately 68%66% of this tonnage (representing approximately 55% of the Company’s revenues) was sold under long-term contracts (contracts having a term of greater than one year). Long-term contracts range in remaining life from one to fivefour years. uses independent contractors to mine coal at certain mining complexes. The Company also purchases coal from third parties that it sells to customers. Factors beyond the Company’s control could affect the availability of coal produced for or purchased by the Company. Disruptions in the quantities of coal produced for or purchased by the Company could impair its ability to fill customer orders or require it to purchase coal from other sources at prevailing market prices in order to satisfy those orders.Allegheny Energy Supply (“Allegheny”), the sole customer of coal produced at the Company’s subsidiary Wolf Run Mining Company’s (“Wolf Run”) Sycamore No. 2 mine, filed a lawsuit against Wolf Run, Hunter Ridge Holdings, Inc. (“Hunter Ridge”), and ICG in state court in Allegheny County, Pennsylvania on December 28, 2006, and amended its complaint on April 23, 2007. Allegheny claimed that Wolf Run breached a coal supply contract when it declared force majeure under the contract upon idling the Sycamore No. 2 mine in the third quarter of 2006, and that Wolf Run continued to breach the contract by failing to ship in volumes referenced in the contract. The Sycamore No. 2 mine was idled after encountering adverse geologic conditions and abandoned gas wells that were previously unidentified and unmapped.After extensive searching for gas wells and rehabilitation of the mine, it was re-opened in 2007, but with notice to Allegheny that it would necessarily operate at reduced volumes in order to safely and effectively avoid the many gas wells within the reserve. The amended complaint also alleged that the production stoppages constitute a breach of the guarantee agreement by Hunter Ridge and breach of certain representations made upon entering into the contract in early 2005. Allegheny voluntarily dropped the breach of representation claims later. Allegheny claimed that it would incur costs in excess of $100 million to purchase replacement coal over the life of the contract. ICG, Wolf Run and Hunter Ridge answered the amended complaint on August 13, 2007, disputing all of the remaining claims.On November 3, 2008, ICG, Wolf Run and Hunter Ridge filed an amended answer and counterclaim against the plaintiffs seeking to void the coal supply agreement due to, among other things, fraudulent inducement and conspiracy. On September 23, 2009, Allegheny filed a second amended complaint alleging several alternative theories of liability in its effort to extend contractual liability to ICG, which was not a party to the original contract and did not exist at the time Wolf Run and Allegheny entered into the contract. No new substantive claims were asserted. ICG answered the second amended complaint on October 13, 2009, denying all of the new claims. The Company’s counterclaim was dismissed on motion for summary judgment entered on May 11, 2010. Allegheny’s claims against ICG were also dismissed by summary judgment, but the claims against Wolf Run and Hunter Ridge were not. The court conducted a non-jury trial of this matter beginning on January 10, 2011 and concluding on February 1, 2011.At the trial, Allegheny presented its evidence for breach of contract and claimed that it is entitled to past and future damages in the aggregate of between $228 million and $377 million. Wolf Run and Hunter Ridge presented their defense of the claims, including evidence with respect to the existence of force majeure conditions and excuse under the contract and applicable law. Wolf Run and Hunter Ridge presented evidence that Allegheny’s damages calculations were significantly inflated because it did not seek to determine damages as of the time of the breach and in some instances artificially assumed future nondelivery or did not take into account the apparent requirement to supply coal in the future. On May 2, 2011, the trial court entered a Memorandum and Verdict determining that Wolf Run had breached the coal supply contract and that the performance shortfall was not excused by force majeure. The trial court awarded total damages and interest in the amount of $104.1 million, which consisted of $13.8 million for past damages, and $90.3 million for future damages. ICG and Allegheny filed post-verdict motions in the trial court and on August 23, 2011, the court denied the parties’ motions. The court entered a final judgment on August 25, 2011, in the amount of $104.1 million, which included pre-judgment interest.The parties appealed the lower court’s decision to the Superior Court of Pennsylvania. On August 13, 2012, the Superior Court of Pennsylvania affirmed the award of past damages, but ruled that the lower court should have calculated future damages as of the date of breach, and remanded the matter back to the lower court with instructions to recalculate that portion of the award. On November 19, 2012, Allegheny filed a Petition for Allowance of Appeal with the Supreme Court of Pennsylvania and Wolf Run and Hunter Ridge filed an Answer. On July 2, 2013, the Supreme Court of Pennsylvania denied the Petition of Allowance. As this action finalized the past damage award, Wolf Run paid $15.6 million for the past damage amount, including interest, to Allegheny in July 2013. The court held a hearing on this matter on November 5, 2014 and on February 16, 2015 awarded Allegheny $7.5 million plus interest for the future damages. On April 6, 2015, the parties entered into a settlement agreement pursuant to which Wolf Run agreed to pay $15 million and both parties agreed to release and discharge the other party from any further contractual liability. As a result, the Company accrued an additional $2.8 million during the first quarter of 2015 to bring the total amount accrued up to the settlement amount which was paid during April 2015. The expense associated with the accrual is reflected in the line item “Cost of sales”.In addition, the Company is a party to numerous claims and lawsuits with respect to various matters. As of December 31, 20152017 and 2014,2016, the Company had accrued $2.8$0.2 million and $22.3$2.2 million, respectively, for all legal matters, including $2.8$0.2 million and $10.1$2.2 million, respectively, classified as current. The ultimate resolution of any such legal matter could result in outcomes which may be materially different from amounts the Company has accrued for such matters.$94.6 million in 2016, $25.4 million in 2017, $10.6$97.2 million in 2018, $11.3 million in 2019, $11.6 million in 2020 and $11.1 millionis immaterial thereafter. During the years ended December 31, 2015, 2014 and 2013, the Company fulfilled its commitments under agreements containing unconditional obligations. The Company recognized expense relating to transportation capacity agreements of $52.9 million, $36.5 million, and $12.0$1.6 million during the yearsperiod January 1 through October 1, 2016; and $52.9 million during the year ended December 31, 2015, 2014 and 2013, respectively.F- 58 Filing Under Chapter 11 of the United States Bankruptcy CodeJanuary 11, 2016 (the “Petition Date”), the Company and substantially all of its wholly owned domestic subsidiaries (the “Filing Subsidiaries” and, together with the Company, the “Debtors”) filed voluntary petitions for reorganization (collectively, the “Bankruptcy Petitions”) under Chapter 11 of Title 11 of the U.S. Code (the “Bankruptcy Code”) in the United States Bankruptcy Court for the Eastern District of Missouri (the “Court”). The Debtor’s Chapter 11 Cases (collectively, the “Chapter 11 Cases”) are being jointly administered under the caption In re Arch Coal, Inc., et al. Case No. 16-40120 (lead case). Each Debtor will continue to operate its business as a “debtor in possession” under the jurisdiction of the Court and in accordance with the applicable provisions of the Bankruptcy Code and the orders of the Court.The filing of the Bankruptcy Petitions constituted an event of default that acceleratedFebruary 13, 2018, the Company’s obligations under the documents governing eachboard of its 7.00% senior notes due 2019, 9.875% senior notes due 2019, 8.00% senior secured second lien notes due 2019, 7.25% senior notes due 2020, 7.25% senior notes due 2021 (together, the “senior notes”) and senior secured first lien term loan due 2018 (the “Existing Credit Agreement”) (collectively with the senior notes, the “Debt Instruments”), all as further described in Note 14, “Debt and Financing Arrangements.” Immediately after filing the Bankruptcy Petitions, the Company began notifying all known current or potential creditors of the Debtors of the bankruptcy filings.Additionally, on the Petition Date, the New York Stock Exchange (the “NYSE”) determined that the Company’s common stock was no longer suitable for listing pursuant to Section 8.02.01D of the NYSE continued listing standards and tradingdirectors announced an increase in the Company’s quarterly dividend to $0.40 per common stock was suspended on January 11, 2016. We expect that the existingshare from $0.35 per common stockshare. The next quarterly cash dividend payment of the Company will be extinguished upon the Company’s emergence from Chapter 11 and existing equity holders will not receive consideration in respect of their equity interests.On the Petition Date, the Debtors filed a number of motions with the Court generally designed to stabilize their operations and facilitate the Debtors’ transition into Chapter 11. Certain of these motions sought authority from the Court for the Debtors to make payments upon, or otherwise honor, certain pre-petition obligations (e.g., obligations related to certain employee wages, salaries and benefits and certain vendors and other providers essential to the Debtors’ businesses). The Court has entered orders approving the relief sought in these motions.Pursuant to Section 362 of the Bankruptcy Code, the filing of the Bankruptcy Petitions automatically stayed most actions against the Debtors, including actions to collect indebtedness incurred prior to the Petition Date or to exercise control over the Debtors’ property. Subject to certain exceptions under the Bankruptcy Code, the filing of the Debtors’ Chapter 11 Cases also automatically stayed the continuation of most legal proceedings, including the third party litigation matters described under Item 3, “Legal Proceedings,” or the filing of other actions against or on behalf of the Debtors or their property to recover on, collect or secure a claim arising prior to the Petition Date or to exercise control over property of the Debtors’ bankruptcy estates, unless and until the Court modifies or lifts the automatic stay as to any such claim. Notwithstanding the generalapplication of the automatic stay described above, governmental authorities may determine to continue actions brought under their police and regulatory powers.As required by the Bankruptcy Code, the U.S. Trustee for the Eastern District of Missouri appointed an official committee of unsecured creditors (the “Creditors’ Committee”) on January 25, 2016. The Creditors’ Committee represents all unsecured creditors of the Debtors and has a right$0.40 per common share is scheduled to be heardpaid on all matters that come before the Court.Restructuring Support AgreementIn connection with the filingMarch 15, 2018 to stockholders of the Bankruptcy Petitions, the Company entered into a Restructuring Support Agreement, dated as of January 10, 2016 (the “Restructuring Support Agreement”), among the Debtors and holders of over 50% of the Company’s first lien term loans under the Existing Credit Agreement (the “Supporting First Lien Creditors”), providing that the Supporting First Lien Creditors will support a restructuring of the Debtors, subject to the following terms and conditions contemplated therein, among others:· existing common stock of the Company would likely be extinguished upon the Company’s emergence from Chapter 11, and existing equity holders would likely not receive consideration in respect of their equity interests;· claims against the Debtors arising under the DIP Facility (as defined below) would be paid in full in cash or receive such other treatment as may be consented to by the holders of such claims;· claims against the Debtors of holders of first lien term loans would be exchanged for (a) a combination of cash and $326.5 million (principal amount) of new first lien debt that would be issued by the reorganized Company and (b) 100% of the common stock of the reorganized Company outstanding on the effective date of the plan, subject to dilution on account of a proposed new management incentive plan and the distribution to unsecured creditors of any new common stock and warrants (as described below);· first lien term loan deficiency claims (subject to certain exceptions) as well as second lien notes, unsecured notes and general unsecured claims against the Debtors would be exchanged for either (1) common stock in the reorganized Company and warrants or (2) the value of the unencumbered assets of the Company, if any, after giving effect to certain other payments and claims;· either the Company’s existing accounts receivable securitization facility would be reinstated or a new letter of credit facility would be entered into by the Company, in either case on terms acceptable to Supporting First Lien Creditors holding more than 66 2/3% of the aggregate amount of the first lien term loans held by Supporting First Lien Creditors; and· the board of directors of the reorganized Company would consist of seven directors, at least one of whom would be independent, including the Company’s Chief Executive Officers and six directors selected by certain of the Company’s first-lien term lenders in consultation with the Company’s Chief Executive Officer.The Restructuring Support Agreement, if utilized as the basis for a plan of reorganization, is expected to reduce the Company’s long-term debt by more than $4.5 billion.We entered into an amendment to the Restructuring Support Agreement on February 25, 2016 (the “RSA Amendment”), which provides for the waiver of the termination event that would have occurred on February 25, 2016 as a result of the Debtors not having obtained Court approval of the assumption of the Restructuring Support Agreement within 45 days of the Petition Date. The Debtors had previously agreed, with the consent of the Majority Consenting Lenders under the Restructuring Support Agreement, to adjourn the Court hearing on the Restructuring Support Agreementrecord at the requestclose of the official committee of unsecured creditors appointed in the Debtors’ Chapter 11 cases. Pursuant to the RSA Amendment, unless otherwise agreed by the Majority Consenting Lenders, the Debtors are required to obtain Court approval of the assumption of the Restructuring Support Agreementbusiness on or before the date that is 90 days from the Petition Date.The RSA Amendment also provides for a waiver of any termination event that otherwise would occur as a result of the dismissal of the Chapter 11 case of one of our subsidiaries following the sale of such subsidiary and a 45-day extension of the date after which the Debtors and the Majority Consenting Lenders may modify the proposed distributions to holders of unsecured claims if holders of more than $1.6125 billion of unsecured claims against the Debtors have not executed a restructuring support agreement substantially in the form of the Restructuring Support Agreement.Securitization AgreementOn January 13, 2016, the Company agreed with its securitization financing providers (the “Securitization Financing Providers”) that, subject to certain amendments (the “Amendments”), they will continue the $200 million trade accounts receivable securitization facility provided to Arch Receivable Company, LLC, a non-debtor special-purpose entity that is a wholly owned subsidiary of the Company (“Arch Receivable”) (the “Securitization Facility”).F-49March 5, 2018.Pursuant to the Amendments, which have been approved by the Court on a final basis, the Debtors agreed to a revised schedule of fees payable to the administrator and the Securitization Financing Providers. The cost of an advance backstopping a letter of credit issued under the Securitization Facility is determined by two factors: (a) a program fee of 2.65% per year and payable on each settlement date to each Securitization Financing Provider deemed to have made such an advance and (b) the “discount,” which is calculated based on each Securitization Financing Provider’s costs, including its cost of the issuance and placement of short term promissory notes to fund such an advance.In connection with the Securitization Facility, Arch Receivable has granted to the administrator (for the benefit of the securitization purchasers) a first priority security interest in all of its assets, including all outstanding accounts receivable generated by the Debtors from the sale of coal and sold through the Securitization Facility (including collections, proceeds and certain other interests related thereto) (the “Receivables”) and all proceeds thereof.The agreements governing the Securitization Facility provide for the grant of analogous security interests by certain Debtors that generate Receivables from the sale of coal (such Debtors, the “Originators”). The agreements expressly state that the transfers of Receivables from the Originators to Arch and from Arch to Arch Receivable are intended to be true sales of the Receivables. However, if, against the intent of the parties (and notwithstanding entry of an order by the Court which provides that the transfers of the Receivables constitute true sales), any such transfer is recharacterized as a loan or extension of credit, each Originator has granted a first priority prepetition security interest in the Receivables and certain related collateral, pursuant to the agreements governing the Securitization Facility, for the ultimate benefit of the administrator and the Securitization Financing Providers (the “Liens”). The Debtors have agreed, in connection with the Amendments, to effectively extend such Liens to cover Receivables generated on or after the Petition Date.The Originators do not guarantee the collection of Receivables that have been transferred to Arch Receivable. However, the Originators are obligated to reimburse Arch Receivable for inaccuracy of certain representations and warranties, dilution items with respect to Receivables and certain other limited indemnities (such obligations, the “Repayment Amounts”). Under the agreements governing the Securitization Facility, Arch Receivable is entitled to apply Repayment Amounts to amounts owed under the Securitization Facility.Further, the Company has executed a performance guarantee through which it has promised to fulfill, or cause Arch Receivable, the designated servicer and each Originator to fulfill, each of their obligations under the agreements governing the Securitization Facility. In addition, as contemplated by the Amendments, the Originators have also executed a performance guarantee promising to fulfill obligations of all Originators under the agreements.In addition, in connection with the Amendments, the Debtors have granted superpriority claims against the Debtors and in favor of Arch Receivable, the administrator and the Securitization Financing Providers in respect of certain of the Debtors’ obligations under the agreements governing the Securitization Facility, including the Repayment Amounts and certain other limited indemnification and other obligations of the Debtors under the agreements.Debtor-In-Possession FinancingOn January 21, 2016, the Superpriority Secured Debtor-in-Possession Credit Agreement as amended by the waiver and consent and Amendment No. 1, dated as of March 4, 2016, (the “DIP Credit Agreement”) was entered into by and among the Company, as borrower, certain of the Debtors, as guarantors (the “Guarantors” and, together with the Company, the “Loan Parties”), the lenders from time to time party thereto (the “DIP Lenders”) and Wilmington Trust, National Association, as administrative agent and collateral agent for the DIP Lenders (in such capacities, the “DIP Agent”).The DIP Credit Agreement, which has been approved by the Court on a final basis, provides for a super-priority senior secured debtor-in-possession credit facility (the “DIP Facility”) consisting of term loans (collectively, the “DIP Term Loan”) in the aggregate principal amount of up to $275 million that may be funded in not more than two draws not later than six months after the effective date of the DIP Facility (such six month period, the “Availability Period”). Any portion of the DIP Term Loan commitment that has not been funded on or prior to the end of the Availability Period will be permanently cancelled.The maturity date of the DIP Facility is the earliest of (i) January 31, 2017, (ii) the date of the substantial consummation of a plan of reorganization that is confirmed pursuant to an order of the Court, (iii) the consummation of the sale of all or substantially all of the assets of the Loan Parties pursuant to Section 363 of the Bankruptcy Code and (iv) the date the obligations under the DIP Facility are accelerated pursuant to the terms of the DIP Credit Agreement. Borrowings under the DIP Facility bear interest at an interest rate per annum equal to, at the Company’s option (i) LIBOR plus 9.00%, subject to a 1.00% LIBOR floor or (ii) the base rate plus 8.00%.Obligations under the DIP Credit Agreement will be guaranteed on a super-priority senior secured basis by all existing and future wholly-owned domestic subsidiaries of Arch, and all newly created or acquired wholly-owned domestic subsidiaries of Arch, subject to customary limited exceptions.The lenders under the DIP Credit Agreement will have a first priority lien on all encumbered and unencumbered assets of the Loan Parties (the “DIP Lien”), subject to a $75 million carve-out for super-priority claims relating to the Debtors’ bonding obligations, a customary professional fees carve-out and certain exceptions.The Loan Parties are subject to certain financial maintenance covenants under the DIP Credit Agreement, including, without limitation, (i) maximum capital expenditures and (ii) minimum liquidity (defined as unrestricted cash and cash equivalents of the Company and its domestic subsidiaries (other than any securitization subsidiary or bonding subsidiary), plus withdrawable funds from brokerage accounts of the Company and its domestic subsidiaries (other than any securitization subsidiary or bonding subsidiary) plus any unused commitments that are available to be drawn by the Company pursuant to the terms of the DIP Credit Agreement) of (A) $300 million prior to the entry of the Final Order and (B) $500 million following the entry of the Final Order, in each case tested on a monthly basis. The DIP Credit Agreement contains customary affirmative and negative covenants and representations for debtor-in-possession financings. In addition to customary events of default for debtor-in-possession financings, the DIP Credit Agreement contains milestones relating to the Chapter 11 Cases and any failure to comply with such milestones constitutes an event of default.The DIP Facility is subject to certain usual and customary prepayment events, including 100% of net cash proceeds of (i) debt issuances (other than debt permitted to be incurred under the terms of the DIP Credit Agreement), (ii) non-ordinary course asset sales or dispositions in excess of $50 million in the aggregate (with no individual asset sale or disposition in excess of $7.5 million) and (iii) any casualty event in excess of $50 million in the aggregate, subject to customary reinvestment rights, in each case to be applied to prepay the DIP Term Loan. At a hearing held on February 23, 2016 in the Chapter 11 Cases, the Court approved the DIP Financing on a final basis, overruling the objections of the Creditors’ Committee and certain other parties who asserted, among other things, that the DIP Financing was unnecessary and argued that the Debtors should enter into an alternate debtor-in-possession financing facility proposed by certain members of the Creditors’ Committee.Other Non-Bankruptcy ItemsOn February 1, 2016, a mining company that Arch Coal, Inc. leases coal reserves to in Kentucky announced plans to idle its mining operations related to those reserves. At December 31, 2015, the Company had a net book value of $66.8 million on the approximate 22.0 million tons of reserves. As a result, the company will record an impairment charge representing the remaining net book value of the reserves in the first quarter of 2016.the majortwo distinct lines of business, metallurgical coal producing basins in which the Company operatesand thermal coal, and may include a number of mine complexes. The Company manages its coal sales by coal basin,market, not by individual mining complex. Geology, coal transportation routes to customers, and regulatory environments also have a significant impact on the Company’s marketing and coal quality or type are characteristic to a basin, and, accordingly, market and contract pricing have developed by coal basin.operations management. Mining operations are evaluated based on theirAdjusted EBITDAR, per-ton cash operating costs (defined as including all mining costs but excludingexcept depreciation, depletion, amortization, accretion on asset retirement obligations, and pass-through transportation expenses), as well asand on other non-financial measures, such as safety and environmental performance. Adjusted EBITDAR is not a measure of financial performance in accordance with generally accepted accounting principles, and items excluded from Adjusted EBITDAR are significant in understanding and assessing our financial condition. Therefore, Adjusted EBITDAR should not be considered in isolation, nor as an alternative to net income, income from operations, cash flows from operations or as a measure of our profitability, liquidity or performance under generally accepted accounting principles. The Company uses Adjusted EBITDAR to measure the operating performance of its segments and allocate resources to the segments. Furthermore, analogous measures are used by industry analysts and investors to evaluate the Company’s operating performance. Investors should be aware that the Company’s presentation of Adjusted EBITDAR may not be comparable to similarly titled measures used by other companies. The Company reports its results of operations primarily through the following reportable segments are thesegments: Powder River Basin (PRB) segment withcontaining the Company’s primary thermal operations in Wyoming; and the Appalachia (APP)Metallurgical (MET) segment, withcontaining the Company’s metallurgical operations in West Virginia, Kentucky, Maryland and Virginia. “All Other” includesVirginia, and the Other Thermal segment containing the Company’s coal miningsupplementary thermal operations in Colorado, and Illinois, and West Virginia. Periods presented in this note have been recast for comparability.ADDCAR subsidiary (which was sold duringCompany closed on its’ definitive agreement to sell Lone Mountain Processing LLC, an operating mine complex within the first quarterCompany’s metallurgical coal segment. Through this transaction the Company divested all active operations in the states of 2014).yearsyear ended December 31, 2015, 20142017, the Successor period October 2 through December 31, 2016 and 2013the Predecessor periods January 1 through October 1, 2016 and the year ended December 31, 2015 are presented below. The Company measures its segments based on “adjusted earnings before interest, taxes, depreciation, depletion, amortization, accretion on asset retirements obligations, and amortizationreorganization items, net (Adjusted EBITDA)EBITDAR).” The Company’s management believes that Adjusted EBITDA presents a useful measure of our ability to service existing debt and incur additional debt based on ongoing operations. Adjusted EBITDAEBITDAR does not reflect mine closure or impairment costs, since those are not reflected in the operating income reviewed by management. See Note 5,6, “Impairment Charges and Mine Closure Costs” for discussion of these costs. The Corporate, Other and Eliminations grouping includes these charges, as well as the change in fair value of coal derivatives and coal trading activities, net; corporate overhead; land management activities; other support functions; and the elimination of intercompany transactions.The asset amounts below represent an allocation of assets consistent with the basis used for the Company’s incentive compensation plans. The amounts in Corporate, Other and Eliminations represent primarily corporate assets (cash, receivables, investments, plant, property and equipment) as well as unassigned coal reserves, above-market acquired sales contracts and other unassigned assets.F- 59
Other and
Eliminations(In thousands) PRB MET Other Thermal Consolidated Successor Year Ended December 31, 2017 Revenues $ 1,024,197 $ 887,839 $ 396,504 $ 16,083 $2,324,623 Adjusted EBITDAR 158,882 243,616 102,006 (86,747 ) 417,757 Depreciation, depletion and amortization 36,349 70,896 13,588 1,631 122,464 Accretion on asset retirement obligation 20,160 2,000 2,161 5,888 30,209 Total Assets 390,665 548,476 134,397 906,094 1,979,632 Capital expenditures 6,212 32,678 11,901 8,414 59,205 Successor Period October 2 through December 31, 2016 Revenues $ 275,703 $ 200,377 $ 97,382 $ 2,226 $575,688 Adjusted EBITDAR 55,765 30,819 31,159 (23,246 ) 94,497 Depreciation, depletion and amortization 9,949 18,287 3,911 457 32,604 Accretion on asset retirement obligation 5,049 528 540 1,517 7,634 Total assets 446,775 576,793 129,602 983,427 2,136,597 Capital expenditures 934 13,329 684 267 15,214 Predecessor Period January 1 through October 1, 2016 Revenues $ 726,747 $ 437,069 $ 213,052 $ 21,841 $1,398,709 Adjusted EBITDAR 113,185 11,851 31,448 (69,181 ) 87,303 Depreciation, depletion and amortization 100,151 55,311 32,310 3,809 191,581 Accretion on asset retirement obligation 16,940 1,765 1,988 3,628 24,321 Total assets 456,711 619,154 131,173 916,791 2,123,829 Capital expenditures 612 17,296 3,895 60,631 82,434 Predecessor Year Ended December 31, 2015 Revenues $ 1,448,440 $ 637,941 $ 428,809 $ 58,070 $ 2,573,260 Adjusted EBITDAR 281,039 70,450 42,734 (110,426 ) 283,797 Depreciation, depletion and amortization 176,257 133,463 47,786 21,839 379,345 Accretion on asset retirement obligation 22,156 2,267 2,658 6,599 33,680 Total assets 1,648,916 772,439 366,610 2,253,916 5,041,881 Capital expenditures 21,228 24,787 11,277 61,732 119,024 F- 60 lossesAdjusted EBITDAR to consolidated lossincome (loss) from continuing operations before income taxes follows:F-53 Successor Predecessor (In thousands) Year Ended December 31, 2017 October 2 through December 31, 2016 January 1 through October 1, 2016 Year Ended December 31, 2015 Income (loss) before income taxes $ 203,195 $ 34,605 $ 1,237,455 $ (3,286,522 ) Interest expense, net 24,256 10,754 133,235 393,549 Depreciation, depletion and amortization 122,464 32,604 191,581 379,345 Accretion on asset retirement obligations 30,209 7,634 24,321 33,680 Amortization of sales contracts, net 53,985 796 (728 ) (8,811 ) Asset impairment and mine closure costs — — 129,267 2,628,303 Losses from disposed operations resulting from Patriot Coal bankruptcy — — — 116,343 Gain on sale of Lone Mountain Processing, Inc. (21,297 ) — — — Net loss resulting from early retirement of debt and debt restructuring 2,547 — 2,213 27,910 Reorganization items, net 2,398 759 (1,630,041 ) — Fresh start coal inventory fair value adjustment — 7,345 — — Adjusted EBITDAR $ 417,757 $ 94,497 $ 87,303 $ 283,797 F- 61 Year Ended December 31, 2017 March 31 June 30 September 30 December 31 (In thousands, except per share data) Revenues $ 600,975 $ 549,866 $ 613,538 560,244 Gross profit $ 85,747 $ 62,577 $ 65,100 62,937 Income from operations $ 66,264 $ 42,692 $ 72,489 $ 50,951 Reorganization items, net $ (2,828 ) $ (21 ) $ (43 ) $ 494 Net income $ 51,668 $ 37,160 $ 68,351 $ 81,271 Diluted income per common share $ 2.03 $ 1.48 $ 2.83 $ 3.64 Predecessor Successor Year Ended December 31, 2016 March 31 June 30 September 30 October 1 October 2 through December 31, 2016 (a) (b) (a) (b) (b) (b) (In thousands, except per share data) Revenues $ 428,106 $ 420,298 $ 550,305 $ — $ 575,688 Gross profit (loss) $ (53,325 ) $ (56,469 ) $ 31,042 $ — $ 64,458 Asset impairment and mine closure costs $ 85,520 $ 43,701 $ 46 $ — $ — Income (loss) from operations $ (158,412 ) $ (110,521 ) $ 11,795 $ — $ 46,118 Reorganization items, net $ (3,875 ) $ (21,271 ) $ (20,904 ) $ 1,676,091 $ (759 ) Net income (loss) $ (206,702 ) $ (175,887 ) $ (51,421 ) $ 1,676,091 $ 33,449 Diluted income (loss) per common share $ (9.71 ) $ (8.26 ) $ (2.41 ) $ 78.66 $ 1.31 and other operations,royalties, investments in equity method subsidiaries and prepaid mining royaltiesseverance expense in 2015 and 2014.2016. See further discussion in Note 5,6, “Impairment Charges and Mine Closure Costs “ and Note 10, “Equity Method Investments and Membership Interests in Joint Ventures.Ventures.”determined that it would not realize the benefitfiled for bankruptcy on January 11, 2016 and subsequently emerged on October 5, 2016. See further discussion in Note 3, “Emergence from federalBankruptcy and state net operating losses it generated in 2014, based on projections of future taxable income, and as a result, recorded a valuation allowance against net operating losses of $23.8. million, $18.3 million, $15.8 million and $807.2 million in the second, third and fourth quarters of 2014, respectively.29. Supplemental Consolidating Financial Information.”Pursuant to the indentures governing Arch Coal, Inc.’s senior notes, certain wholly-owned subsidiaries of the Company have fully and unconditionally guaranteed the senior notes on a joint and several basis. The following tables present consolidating financial information for (i) the Company, (ii) the issuer of the senior notes, (iii) the guarantors under the senior notes, and (iv) the entities which are not guarantors under the senior notes (Arch Receivable Company, LLC and the Company’s subsidiaries outside the United States):F-54F- 62 Condensed Consolidating Statements of Operations and Comprehensive IncomeYear Ended December 31, 2015
Subsidiaries
Guarantor
SubsidiariesCondensed Consolidating Statements of Operations and Comprehensive IncomeYear Ended December 31, 2014
Subsidiaries
Guarantor
SubsidiariesCondensed Consolidating Statements of Operations and Comprehensive IncomeYear Ended December 31, 2013
Subsidiaries
Guarantor
SubsidiariesCondensed Consolidating Balance SheetsDecember 31, 2015
Subsidiaries
Guarantor
SubsidiariesCondensed Consolidating Balance SheetsDecember 31, 2014
Subsidiaries
Guarantor
SubsidiariesCondensed Consolidating Statements of Cash FlowsYear Ended December 31, 2015
Subsidiaries
Guarantor
SubsidiariesCondensed Consolidating Statements of Cash FlowsYear Ended December 31, 2014
Subsidiaries
Guarantor
SubsidiariesCondensed Consolidating Statements of Cash FlowsYear Ended December 31, 2013
Subsidiaries
Guarantor
Subsidiaries Additions (Reductions) Balance at Charged to Charged to Balance at Beginning of Costs and Other End of Year Expenses Accounts Year (In thousands) Year Ended December 31, 2017 Reserves deducted from asset accounts: Accounts receivable and other receivables $ — $ — Current assets — supplies and inventory — 365 (17 ) 87 261 Deferred income taxes 1,021,553 (410,982 ) 610,571 Successor October 2 through December 31, 2016 Reserves deducted from asset accounts: Accounts receivable and other receivables $ — $ — $ — $ — $ — Current assets — supplies and inventory — — — — — Deferred income taxes 1,033,982 (12,429 ) — — 1,021,553 Predecessor January 1 through October 1, 2016 Reserves deducted from asset accounts: Accounts receivable and other receivables $ 7,842 $ — $ — $ 7,842 $ — Current assets — supplies and inventory 5,991 844 (5,060 ) 1,775 — Deferred income taxes 1,135,399 (101,417 ) — 1,033,982 Year ended December 31, 2015 Reserves deducted from asset accounts: Accounts receivable and other receivables $ 159 $ 7,683 $ — $ — $ 7,842 Current assets — supplies and inventory 6,625 431 — 1,065 5,991 Deferred income taxes 270,251 865,148 — — 1,135,399
(c) Fresh start accounting adjustmentF- 63